Cloquet, MN Map & Demographics
Cloquet Map
Cloquet Overview
$34,514
PER CAPITA INCOME
$76,995
AVG FAMILY INCOME
$59,647
AVG HOUSEHOLD INCOME
29.4%
WAGE / INCOME GAP [ % ]
70.6¢/ $1
WAGE / INCOME GAP [ $ ]
$9,302
FAMILY INCOME DEFICIT
0.43
INEQUALITY / GINI INDEX
12,559
TOTAL POPULATION
5,879
MALE POPULATION
6,680
FEMALE POPULATION
88.01
MALES / 100 FEMALES
113.62
FEMALES / 100 MALES
35.5
MEDIAN AGE
3.0
AVG FAMILY SIZE
2.4
AVG HOUSEHOLD SIZE
6,420
LABOR FORCE [ PEOPLE ]
65.7%
PERCENT IN LABOR FORCE
4.9%
UNEMPLOYMENT RATE
Cloquet Zip Codes
Cloquet Area Codes
Income in Cloquet
Income Overview in Cloquet
Per Capita Income in Cloquet is $34,514, while median incomes of families and households are $76,995 and $59,647 respectively.
| Characteristic | Number | Measure |
| Per Capita Income | 12,559 | $34,514 |
| Median Family Income | 3,073 | $76,995 |
| Mean Family Income | 3,073 | $94,281 |
| Median Household Income | 5,170 | $59,647 |
| Mean Household Income | 5,170 | $80,159 |
| Income Deficit | 3,073 | $9,302 |
| Wage / Income Gap (%) | 12,559 | 29.39% |
| Wage / Income Gap ($) | 12,559 | 70.61¢ per $1 |
| Gini / Inequality Index | 12,559 | 0.43 |
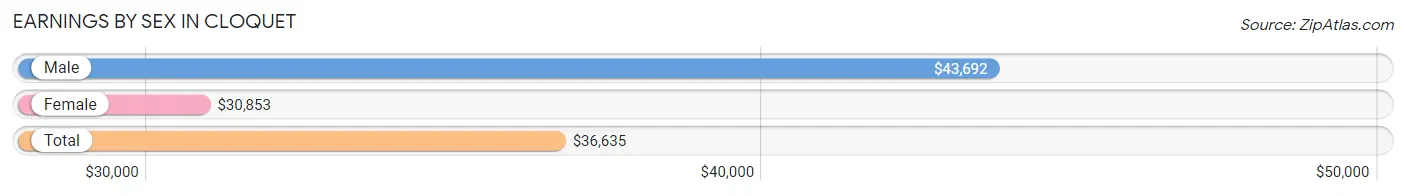
Earnings by Sex in Cloquet
Average Earnings in Cloquet are $36,635, $43,692 for men and $30,853 for women, a difference of 29.4%.
| Sex | Number | Average Earnings |
| Male | 3,238 (47.9%) | $43,692 |
| Female | 3,522 (52.1%) | $30,853 |
| Total | 6,760 (100.0%) | $36,635 |
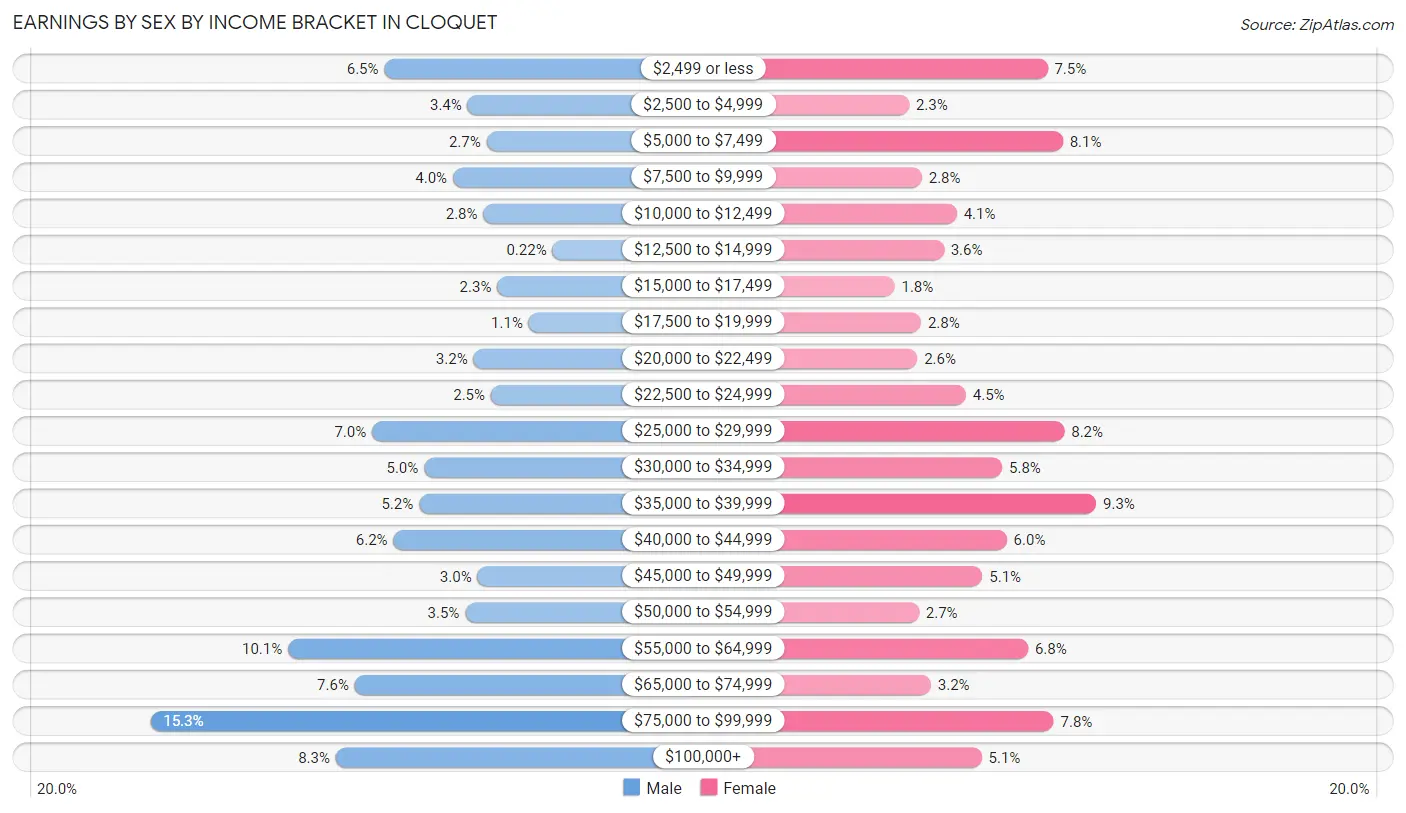
Earnings by Sex by Income Bracket in Cloquet
The most common earnings brackets in Cloquet are $75,000 to $99,999 for men (495 | 15.3%) and $35,000 to $39,999 for women (329 | 9.3%).
| Income | Male | Female |
| $2,499 or less | 211 (6.5%) | 265 (7.5%) |
| $2,500 to $4,999 | 110 (3.4%) | 82 (2.3%) |
| $5,000 to $7,499 | 87 (2.7%) | 285 (8.1%) |
| $7,500 to $9,999 | 128 (4.0%) | 99 (2.8%) |
| $10,000 to $12,499 | 91 (2.8%) | 145 (4.1%) |
| $12,500 to $14,999 | 7 (0.2%) | 128 (3.6%) |
| $15,000 to $17,499 | 74 (2.3%) | 63 (1.8%) |
| $17,500 to $19,999 | 36 (1.1%) | 98 (2.8%) |
| $20,000 to $22,499 | 103 (3.2%) | 93 (2.6%) |
| $22,500 to $24,999 | 82 (2.5%) | 157 (4.5%) |
| $25,000 to $29,999 | 226 (7.0%) | 287 (8.2%) |
| $30,000 to $34,999 | 163 (5.0%) | 205 (5.8%) |
| $35,000 to $39,999 | 169 (5.2%) | 329 (9.3%) |
| $40,000 to $44,999 | 200 (6.2%) | 211 (6.0%) |
| $45,000 to $49,999 | 98 (3.0%) | 179 (5.1%) |
| $50,000 to $54,999 | 113 (3.5%) | 95 (2.7%) |
| $55,000 to $64,999 | 328 (10.1%) | 239 (6.8%) |
| $65,000 to $74,999 | 247 (7.6%) | 111 (3.2%) |
| $75,000 to $99,999 | 495 (15.3%) | 273 (7.7%) |
| $100,000+ | 270 (8.3%) | 178 (5.1%) |
| Total | 3,238 (100.0%) | 3,522 (100.0%) |
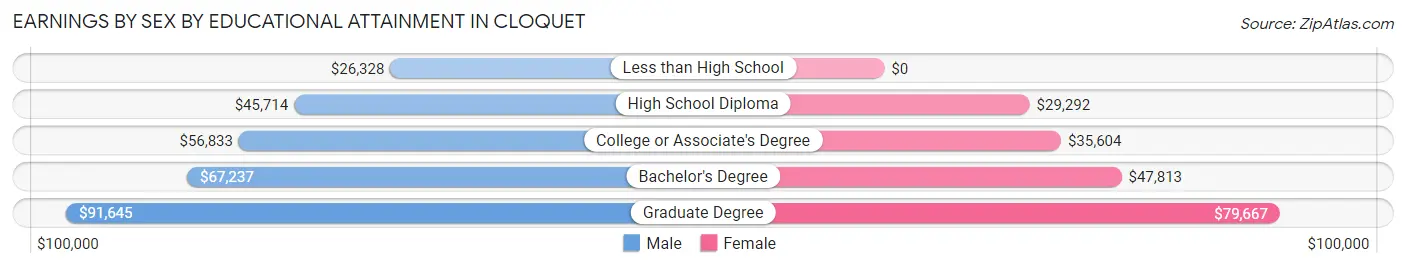
Earnings by Sex by Educational Attainment in Cloquet
Average earnings in Cloquet are $56,552 for men and $37,657 for women, a difference of 33.4%. Men with an educational attainment of graduate degree enjoy the highest average annual earnings of $91,645, while those with less than high school education earn the least with $26,328. Women with an educational attainment of graduate degree earn the most with the average annual earnings of $79,667, while those with high school diploma education have the smallest earnings of $29,292.
| Educational Attainment | Male Income | Female Income |
| Less than High School | $26,328 | $0 |
| High School Diploma | $45,714 | $29,292 |
| College or Associate's Degree | $56,833 | $35,604 |
| Bachelor's Degree | $67,237 | $47,813 |
| Graduate Degree | $91,645 | $79,667 |
| Total | $56,552 | $37,657 |
Family Income in Cloquet
Family Income Brackets in Cloquet
According to the Cloquet family income data, there are 608 families falling into the $100,000 to $149,999 income range, which is the most common income bracket and makes up 19.8% of all families. Conversely, the less than $10,000 income bracket is the least frequent group with only 117 families (3.8%) belonging to this category.
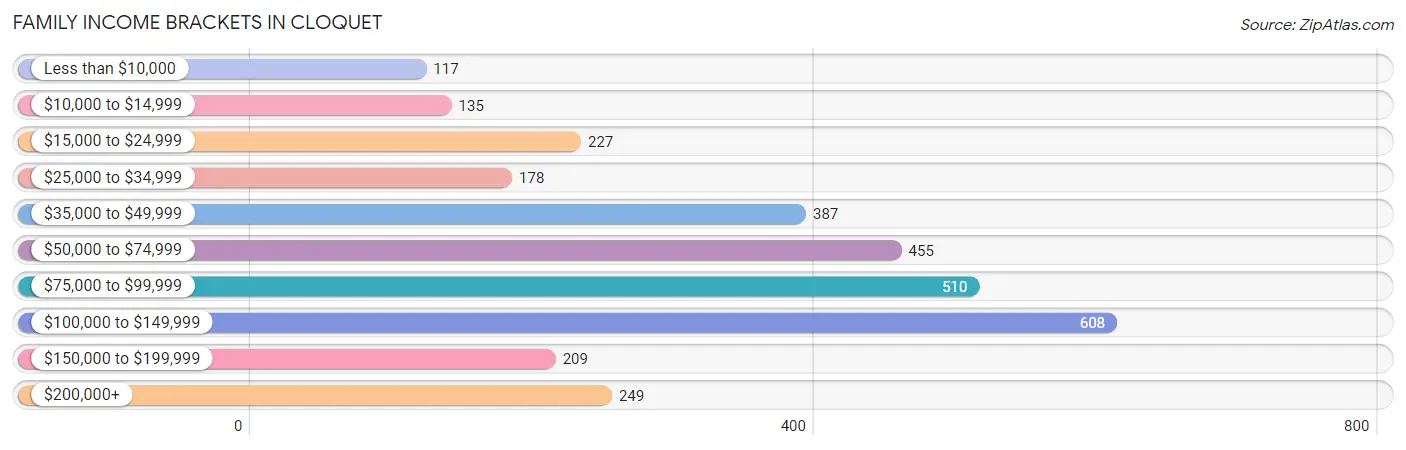
| Income Bracket | # Families | % Families |
| Less than $10,000 | 117 | 3.8% |
| $10,000 to $14,999 | 135 | 4.4% |
| $15,000 to $24,999 | 227 | 7.4% |
| $25,000 to $34,999 | 178 | 5.8% |
| $35,000 to $49,999 | 387 | 12.6% |
| $50,000 to $74,999 | 455 | 14.8% |
| $75,000 to $99,999 | 510 | 16.6% |
| $100,000 to $149,999 | 608 | 19.8% |
| $150,000 to $199,999 | 209 | 6.8% |
| $200,000+ | 249 | 8.1% |
Family Income by Famaliy Size in Cloquet
5-person families (210 | 6.8%) account for the highest median family income in Cloquet with $104,706 per family, while 2-person families (1,334 | 43.4%) have the highest median income of $31,136 per family member.
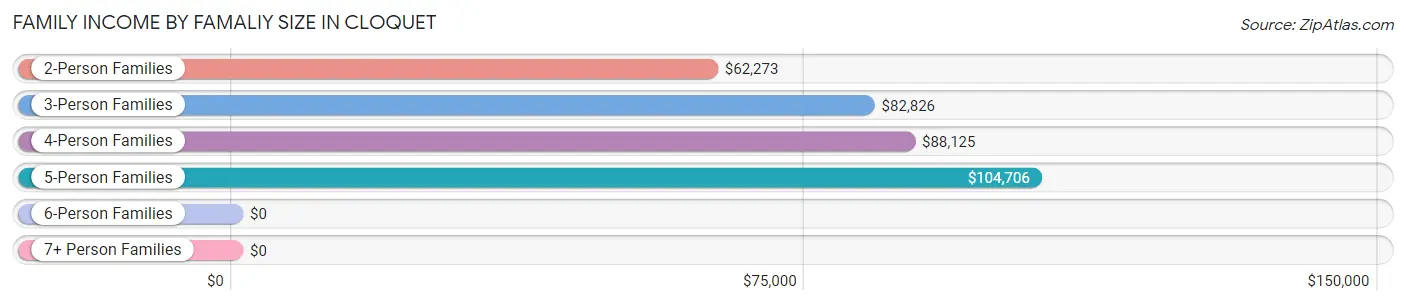
| Income Bracket | # Families | Median Income |
| 2-Person Families | 1,334 (43.4%) | $62,273 |
| 3-Person Families | 828 (26.9%) | $82,826 |
| 4-Person Families | 640 (20.8%) | $88,125 |
| 5-Person Families | 210 (6.8%) | $104,706 |
| 6-Person Families | 22 (0.7%) | $0 |
| 7+ Person Families | 39 (1.3%) | $0 |
| Total | 3,073 (100.0%) | $76,995 |
Family Income by Number of Earners in Cloquet
The median family income in Cloquet is $76,995, with families comprising 3+ earners (387) having the highest median family income of $117,404, while families with 1 earner (915) have the lowest median family income of $37,292, accounting for 12.6% and 29.8% of families, respectively.
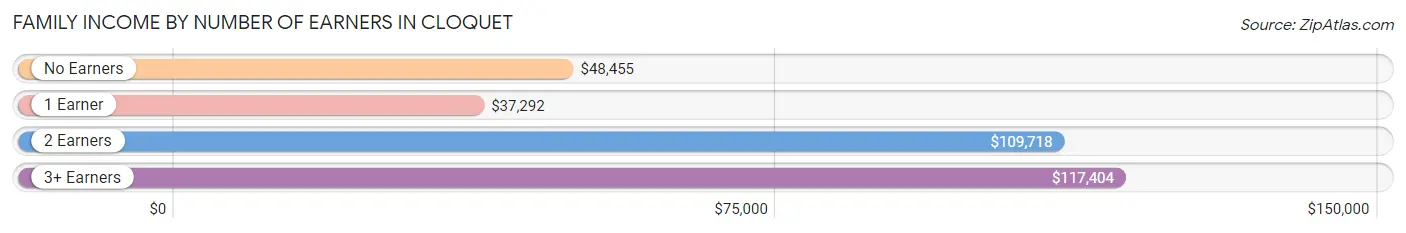
| Number of Earners | # Families | Median Income |
| No Earners | 512 (16.7%) | $48,455 |
| 1 Earner | 915 (29.8%) | $37,292 |
| 2 Earners | 1,259 (41.0%) | $109,718 |
| 3+ Earners | 387 (12.6%) | $117,404 |
| Total | 3,073 (100.0%) | $76,995 |
Household Income in Cloquet
Household Income Brackets in Cloquet
With 1,070 households falling in the category, the $50,000 to $74,999 income range is the most frequent in Cloquet, accounting for 20.7% of all households. In contrast, only 155 households (3.0%) fall into the less than $10,000 income bracket, making it the least populous group.
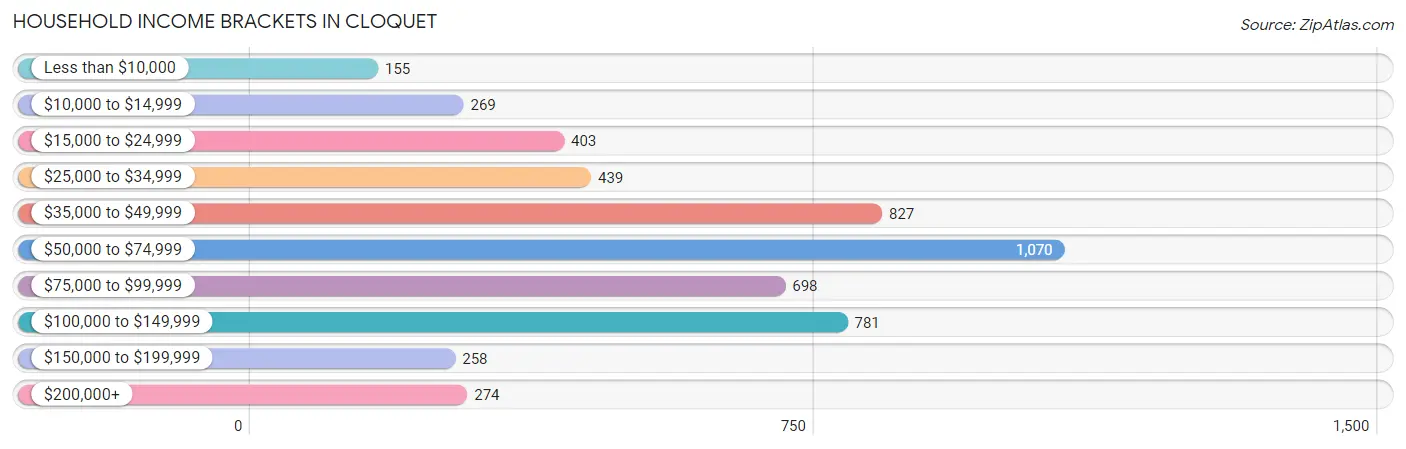
| Income Bracket | # Households | % Households |
| Less than $10,000 | 155 | 3.0% |
| $10,000 to $14,999 | 269 | 5.2% |
| $15,000 to $24,999 | 403 | 7.8% |
| $25,000 to $34,999 | 439 | 8.5% |
| $35,000 to $49,999 | 827 | 16.0% |
| $50,000 to $74,999 | 1,070 | 20.7% |
| $75,000 to $99,999 | 698 | 13.5% |
| $100,000 to $149,999 | 781 | 15.1% |
| $150,000 to $199,999 | 258 | 5.0% |
| $200,000+ | 274 | 5.3% |
Household Income by Householder Age in Cloquet
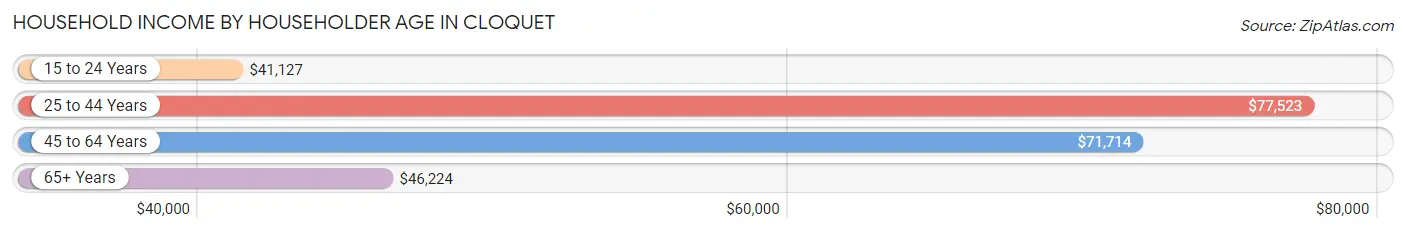
The median household income in Cloquet is $59,647, with the highest median household income of $77,523 found in the 25 to 44 years age bracket for the primary householder. A total of 1,649 households (31.9%) fall into this category. Meanwhile, the 15 to 24 years age bracket for the primary householder has the lowest median household income of $41,127, with 354 households (6.9%) in this group.
| Income Bracket | # Households | Median Income |
| 15 to 24 Years | 354 (6.9%) | $41,127 |
| 25 to 44 Years | 1,649 (31.9%) | $77,523 |
| 45 to 64 Years | 1,806 (34.9%) | $71,714 |
| 65+ Years | 1,361 (26.3%) | $46,224 |
| Total | 5,170 (100.0%) | $59,647 |
Poverty in Cloquet
Income Below Poverty by Sex and Age in Cloquet
With 15.2% poverty level for males and 17.6% for females among the residents of Cloquet, 15 year old males and 12 to 14 year old females are the most vulnerable to poverty, with 40 males (85.1%) and 130 females (47.1%) in their respective age groups living below the poverty level.
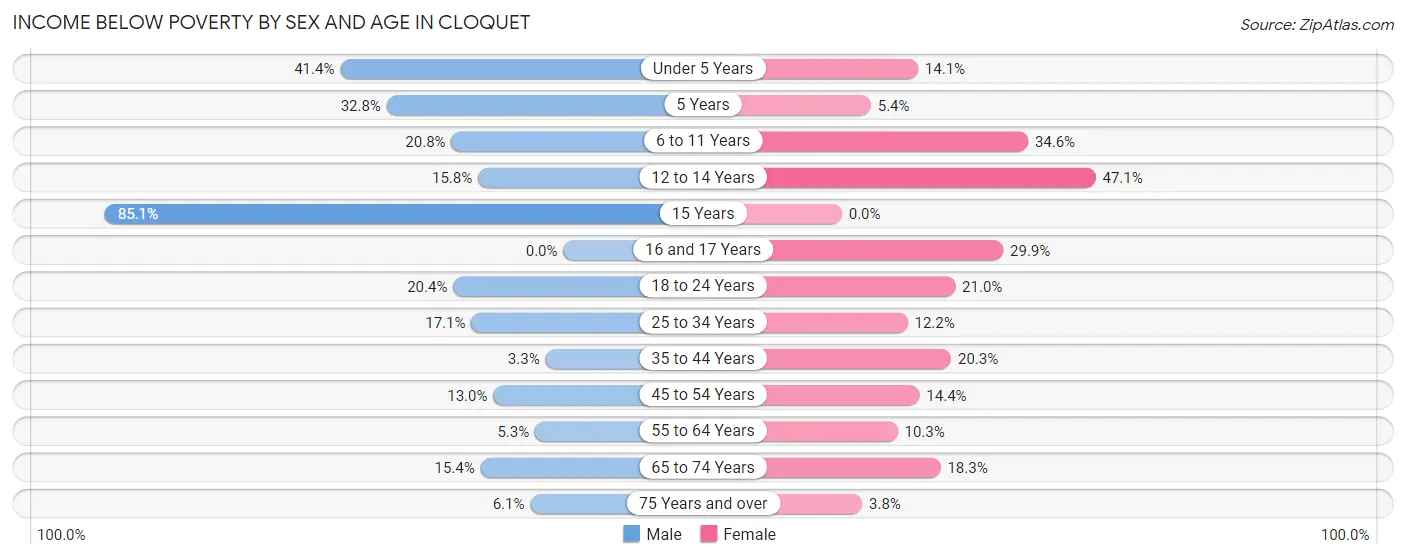
| Age Bracket | Male | Female |
| Under 5 Years | 135 (41.4%) | 51 (14.1%) |
| 5 Years | 40 (32.8%) | 5 (5.4%) |
| 6 to 11 Years | 117 (20.8%) | 209 (34.5%) |
| 12 to 14 Years | 35 (15.8%) | 130 (47.1%) |
| 15 Years | 40 (85.1%) | 0 (0.0%) |
| 16 and 17 Years | 0 (0.0%) | 50 (29.9%) |
| 18 to 24 Years | 138 (20.4%) | 130 (21.0%) |
| 25 to 34 Years | 144 (17.1%) | 97 (12.2%) |
| 35 to 44 Years | 24 (3.3%) | 172 (20.3%) |
| 45 to 54 Years | 87 (13.0%) | 101 (14.4%) |
| 55 to 64 Years | 33 (5.3%) | 78 (10.3%) |
| 65 to 74 Years | 61 (15.4%) | 107 (18.3%) |
| 75 Years and over | 25 (6.1%) | 22 (3.8%) |
| Total | 879 (15.2%) | 1,152 (17.6%) |
Income Above Poverty by Sex and Age in Cloquet
According to the poverty statistics in Cloquet, males aged 16 and 17 years and females aged 15 years are the age groups that are most secure financially, with 100.0% of males and 100.0% of females in these age groups living above the poverty line.
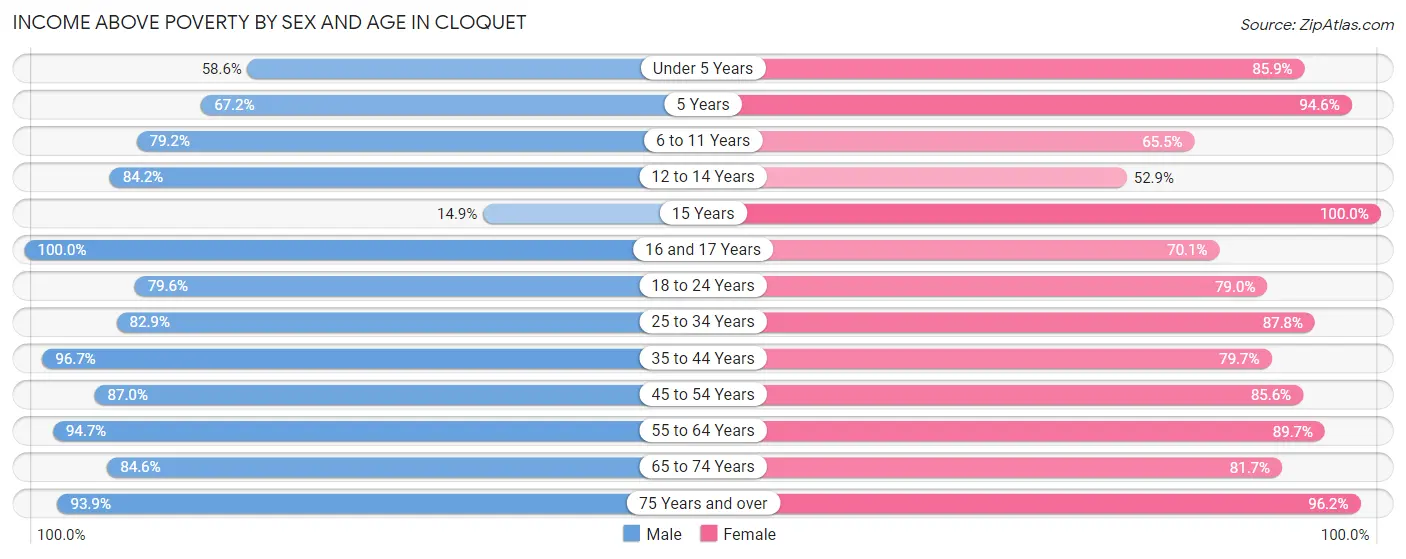
| Age Bracket | Male | Female |
| Under 5 Years | 191 (58.6%) | 310 (85.9%) |
| 5 Years | 82 (67.2%) | 88 (94.6%) |
| 6 to 11 Years | 446 (79.2%) | 396 (65.4%) |
| 12 to 14 Years | 186 (84.2%) | 146 (52.9%) |
| 15 Years | 7 (14.9%) | 158 (100.0%) |
| 16 and 17 Years | 159 (100.0%) | 117 (70.1%) |
| 18 to 24 Years | 537 (79.6%) | 488 (79.0%) |
| 25 to 34 Years | 699 (82.9%) | 698 (87.8%) |
| 35 to 44 Years | 700 (96.7%) | 676 (79.7%) |
| 45 to 54 Years | 582 (87.0%) | 600 (85.6%) |
| 55 to 64 Years | 594 (94.7%) | 676 (89.7%) |
| 65 to 74 Years | 336 (84.6%) | 477 (81.7%) |
| 75 Years and over | 383 (93.9%) | 562 (96.2%) |
| Total | 4,902 (84.8%) | 5,392 (82.4%) |
Income Below Poverty Among Married-Couple Families in Cloquet
The poverty statistics for married-couple families in Cloquet show that 1.5% or 28 of the total 1,825 families live below the poverty line. Families with no children have the highest poverty rate of 2.6%, comprising of 28 families. On the other hand, families with 1 or 2 children have the lowest poverty rate of 0.0%, which includes 0 families.
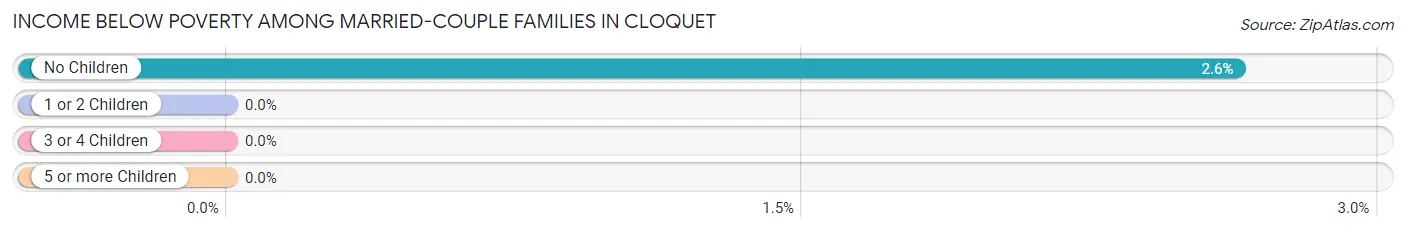
| Children | Above Poverty | Below Poverty |
| No Children | 1,035 (97.4%) | 28 (2.6%) |
| 1 or 2 Children | 653 (100.0%) | 0 (0.0%) |
| 3 or 4 Children | 91 (100.0%) | 0 (0.0%) |
| 5 or more Children | 18 (100.0%) | 0 (0.0%) |
| Total | 1,797 (98.5%) | 28 (1.5%) |
Income Below Poverty Among Single-Parent Households in Cloquet
According to the poverty data in Cloquet, 22.6% or 95 single-father households and 38.1% or 315 single-mother households are living below the poverty line. Among single-father households, those with 1 or 2 children have the highest poverty rate, with 85 households (34.8%) experiencing poverty. Likewise, among single-mother households, those with 3 or 4 children have the highest poverty rate, with 67 households (54.5%) falling below the poverty line.
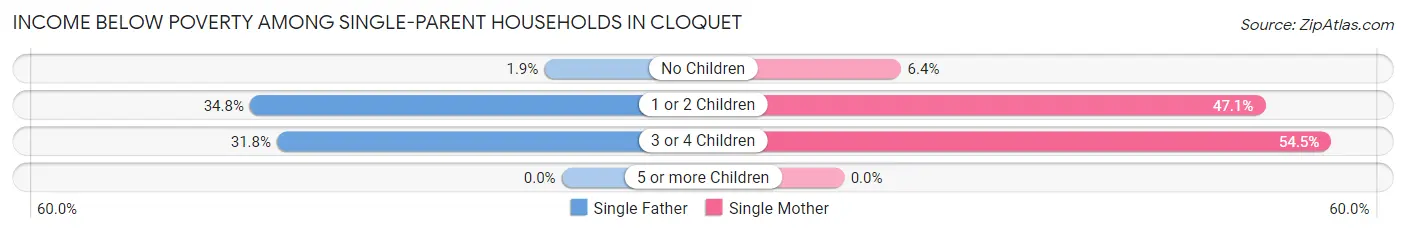
| Children | Single Father | Single Mother |
| No Children | 3 (1.9%) | 13 (6.4%) |
| 1 or 2 Children | 85 (34.8%) | 235 (47.1%) |
| 3 or 4 Children | 7 (31.8%) | 67 (54.5%) |
| 5 or more Children | 0 (0.0%) | 0 (0.0%) |
| Total | 95 (22.6%) | 315 (38.1%) |
Income Below Poverty Among Married-Couple vs Single-Parent Households in Cloquet
The poverty data for Cloquet shows that 28 of the married-couple family households (1.5%) and 410 of the single-parent households (32.9%) are living below the poverty level. Within the married-couple family households, those with no children have the highest poverty rate, with 28 households (2.6%) falling below the poverty line. Among the single-parent households, those with 3 or 4 children have the highest poverty rate, with 74 household (51.0%) living below poverty.
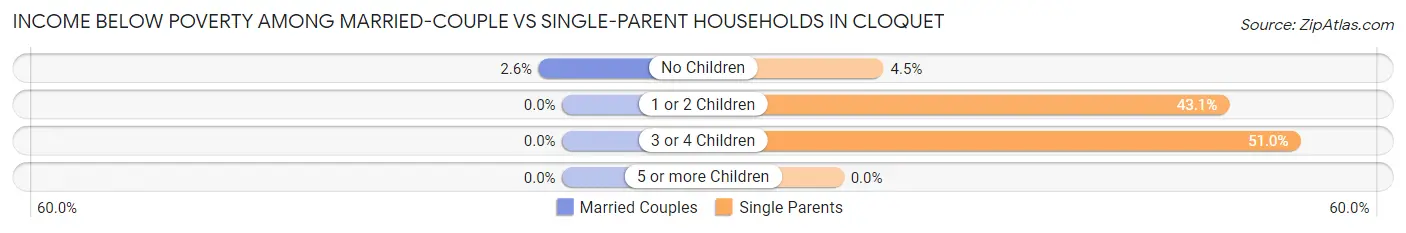
| Children | Married-Couple Families | Single-Parent Households |
| No Children | 28 (2.6%) | 16 (4.5%) |
| 1 or 2 Children | 0 (0.0%) | 320 (43.1%) |
| 3 or 4 Children | 0 (0.0%) | 74 (51.0%) |
| 5 or more Children | 0 (0.0%) | 0 (0.0%) |
| Total | 28 (1.5%) | 410 (32.9%) |
Race in Cloquet
The most populous races in Cloquet are White / Caucasian (10,798 | 86.0%), Native / Alaskan (848 | 6.8%), and Two or more Races (654 | 5.2%).
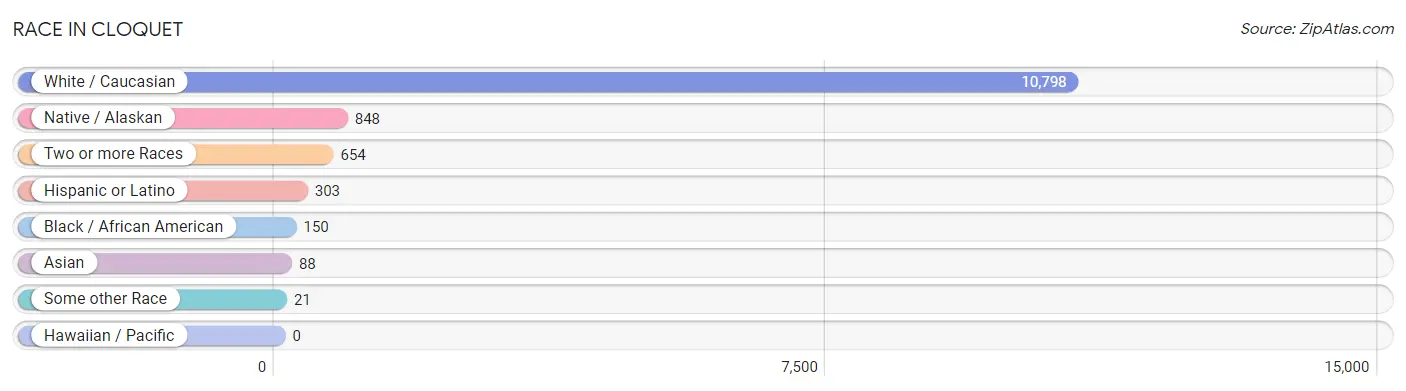
| Race | # Population | % Population |
| Asian | 88 | 0.7% |
| Black / African American | 150 | 1.2% |
| Hawaiian / Pacific | 0 | 0.0% |
| Hispanic or Latino | 303 | 2.4% |
| Native / Alaskan | 848 | 6.8% |
| White / Caucasian | 10,798 | 86.0% |
| Two or more Races | 654 | 5.2% |
| Some other Race | 21 | 0.2% |
| Total | 12,559 | 100.0% |
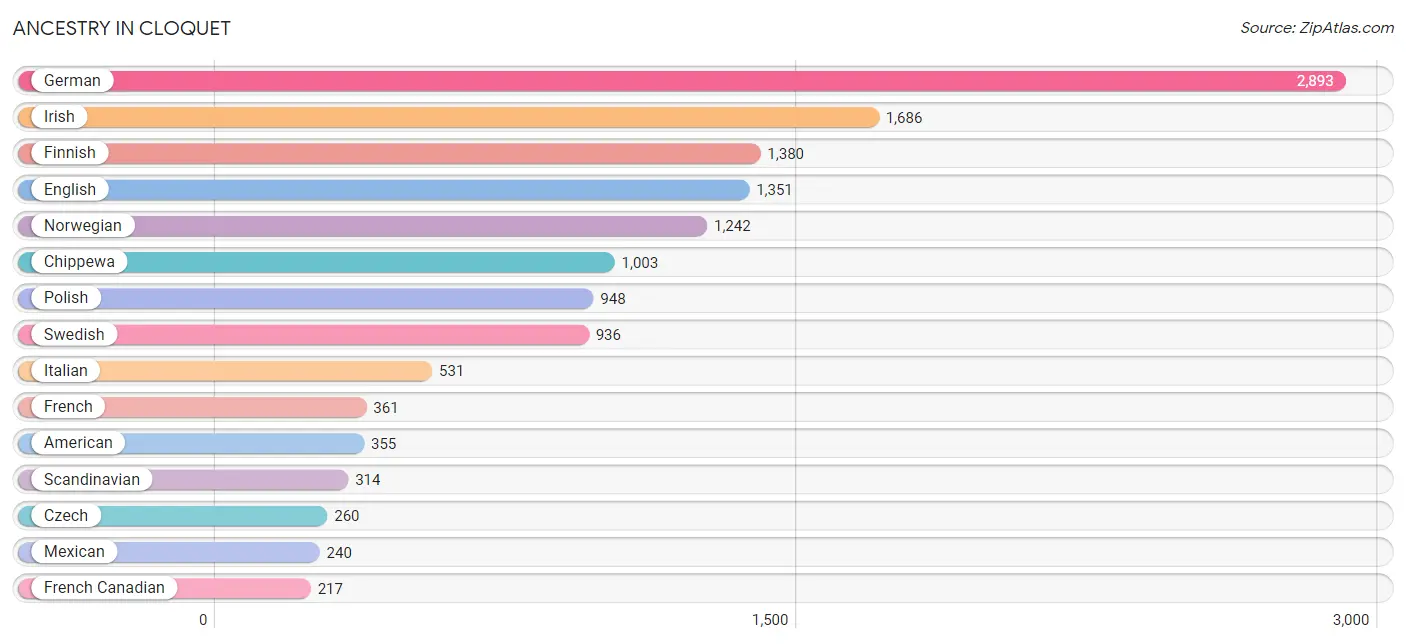
Ancestry in Cloquet
The most populous ancestries reported in Cloquet are German (2,893 | 23.0%), Irish (1,686 | 13.4%), Finnish (1,380 | 11.0%), English (1,351 | 10.8%), and Norwegian (1,242 | 9.9%), together accounting for 68.1% of all Cloquet residents.
| Ancestry | # Population | % Population |
| American | 355 | 2.8% |
| Arab | 57 | 0.4% |
| Austrian | 23 | 0.2% |
| Blackfeet | 6 | 0.1% |
| British | 106 | 0.8% |
| British West Indian | 70 | 0.6% |
| Burmese | 5 | 0.0% |
| Central American | 12 | 0.1% |
| Cherokee | 12 | 0.1% |
| Chippewa | 1,003 | 8.0% |
| Croatian | 33 | 0.3% |
| Cuban | 1 | 0.0% |
| Czech | 260 | 2.1% |
| Danish | 42 | 0.3% |
| Dutch | 157 | 1.3% |
| English | 1,351 | 10.8% |
| Ethiopian | 4 | 0.0% |
| European | 109 | 0.9% |
| Finnish | 1,380 | 11.0% |
| French | 361 | 2.9% |
| French American Indian | 16 | 0.1% |
| French Canadian | 217 | 1.7% |
| German | 2,893 | 23.0% |
| Greek | 22 | 0.2% |
| Hungarian | 23 | 0.2% |
| Indian (Asian) | 49 | 0.4% |
| Irish | 1,686 | 13.4% |
| Israeli | 10 | 0.1% |
| Italian | 531 | 4.2% |
| Korean | 87 | 0.7% |
| Liberian | 13 | 0.1% |
| Mexican | 240 | 1.9% |
| Mexican American Indian | 6 | 0.1% |
| Norwegian | 1,242 | 9.9% |
| Ottawa | 5 | 0.0% |
| Polish | 948 | 7.5% |
| Portuguese | 5 | 0.0% |
| Puerto Rican | 11 | 0.1% |
| Romanian | 22 | 0.2% |
| Russian | 61 | 0.5% |
| Salvadoran | 12 | 0.1% |
| Scandinavian | 314 | 2.5% |
| Scotch-Irish | 34 | 0.3% |
| Scottish | 35 | 0.3% |
| Serbian | 22 | 0.2% |
| Sioux | 74 | 0.6% |
| Slovak | 8 | 0.1% |
| Slovene | 33 | 0.3% |
| Spaniard | 23 | 0.2% |
| Sri Lankan | 4 | 0.0% |
| Subsaharan African | 17 | 0.1% |
| Swedish | 936 | 7.4% |
| Swiss | 9 | 0.1% |
| Syrian | 46 | 0.4% |
| Thai | 29 | 0.2% |
| Ukrainian | 7 | 0.1% |
| Welsh | 32 | 0.3% |
| Yugoslavian | 20 | 0.2% | View All 58 Rows |
Immigrants in Cloquet
The most numerous immigrant groups reported in Cloquet came from Asia (56 | 0.4%), Canada (31 | 0.3%), India (29 | 0.2%), South Central Asia (29 | 0.2%), and China (22 | 0.2%), together accounting for 1.3% of all Cloquet residents.

| Immigration Origin | # Population | % Population |
| Africa | 21 | 0.2% |
| Asia | 56 | 0.4% |
| Brazil | 4 | 0.0% |
| Canada | 31 | 0.3% |
| China | 22 | 0.2% |
| Eastern Africa | 13 | 0.1% |
| Eastern Asia | 22 | 0.2% |
| Eastern Europe | 15 | 0.1% |
| Ethiopia | 4 | 0.0% |
| Europe | 18 | 0.1% |
| Germany | 3 | 0.0% |
| Hong Kong | 22 | 0.2% |
| India | 29 | 0.2% |
| Latin America | 4 | 0.0% |
| Liberia | 8 | 0.1% |
| Poland | 15 | 0.1% |
| South America | 4 | 0.0% |
| South Central Asia | 29 | 0.2% |
| South Eastern Asia | 5 | 0.0% |
| Thailand | 5 | 0.0% |
| Western Africa | 8 | 0.1% |
| Western Europe | 3 | 0.0% | View All 22 Rows |
Sex and Age in Cloquet
Sex and Age in Cloquet
The most populous age groups in Cloquet are 20 to 24 Years (520 | 8.8%) for men and 10 to 14 Years (533 | 8.0%) for women.
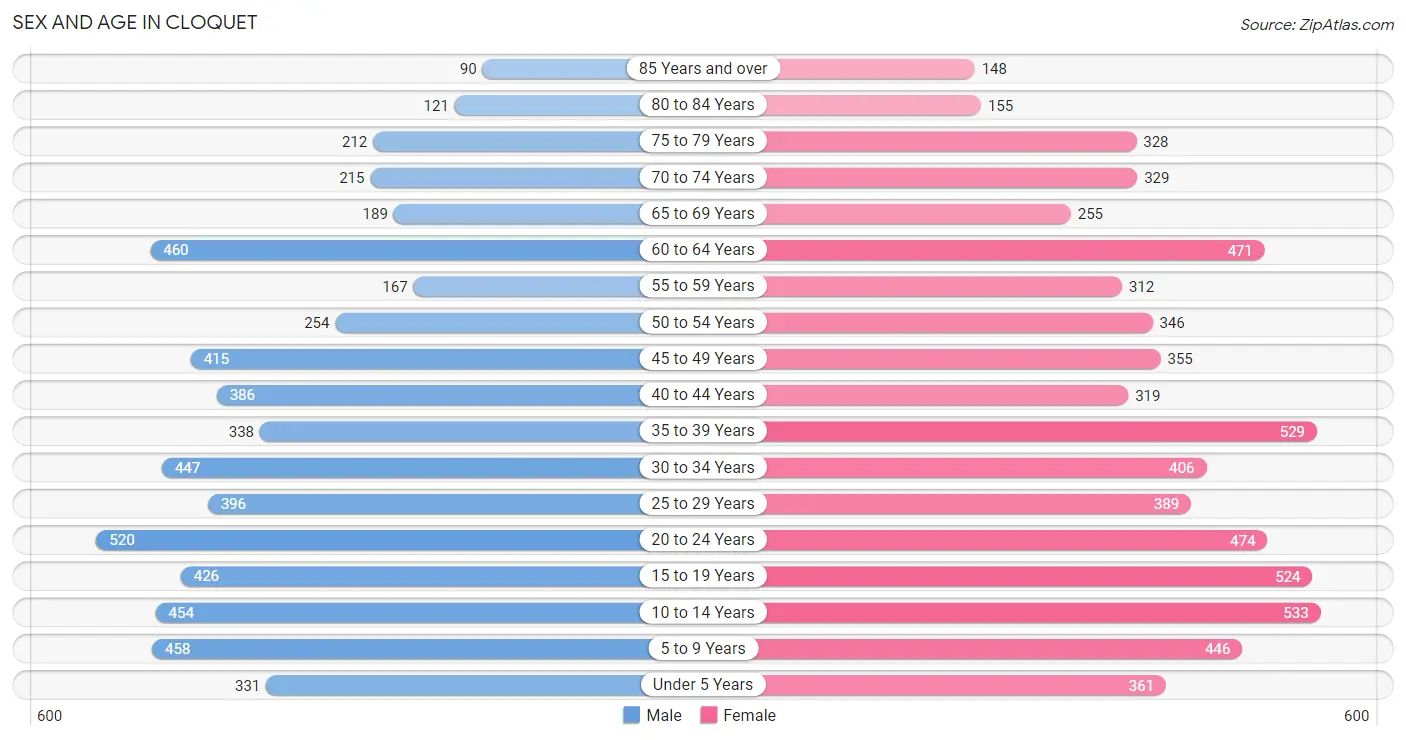
| Age Bracket | Male | Female |
| Under 5 Years | 331 (5.6%) | 361 (5.4%) |
| 5 to 9 Years | 458 (7.8%) | 446 (6.7%) |
| 10 to 14 Years | 454 (7.7%) | 533 (8.0%) |
| 15 to 19 Years | 426 (7.2%) | 524 (7.8%) |
| 20 to 24 Years | 520 (8.8%) | 474 (7.1%) |
| 25 to 29 Years | 396 (6.7%) | 389 (5.8%) |
| 30 to 34 Years | 447 (7.6%) | 406 (6.1%) |
| 35 to 39 Years | 338 (5.8%) | 529 (7.9%) |
| 40 to 44 Years | 386 (6.6%) | 319 (4.8%) |
| 45 to 49 Years | 415 (7.1%) | 355 (5.3%) |
| 50 to 54 Years | 254 (4.3%) | 346 (5.2%) |
| 55 to 59 Years | 167 (2.8%) | 312 (4.7%) |
| 60 to 64 Years | 460 (7.8%) | 471 (7.0%) |
| 65 to 69 Years | 189 (3.2%) | 255 (3.8%) |
| 70 to 74 Years | 215 (3.7%) | 329 (4.9%) |
| 75 to 79 Years | 212 (3.6%) | 328 (4.9%) |
| 80 to 84 Years | 121 (2.1%) | 155 (2.3%) |
| 85 Years and over | 90 (1.5%) | 148 (2.2%) |
| Total | 5,879 (100.0%) | 6,680 (100.0%) |
Families and Households in Cloquet
Median Family Size in Cloquet
The median family size in Cloquet is 3.01 persons per family, with married-couple families (1,825 | 59.4%) accounting for the largest median family size of 3.13 persons per family. On the other hand, single male/father families (421 | 13.7%) represent the smallest median family size with 2.52 persons per family.
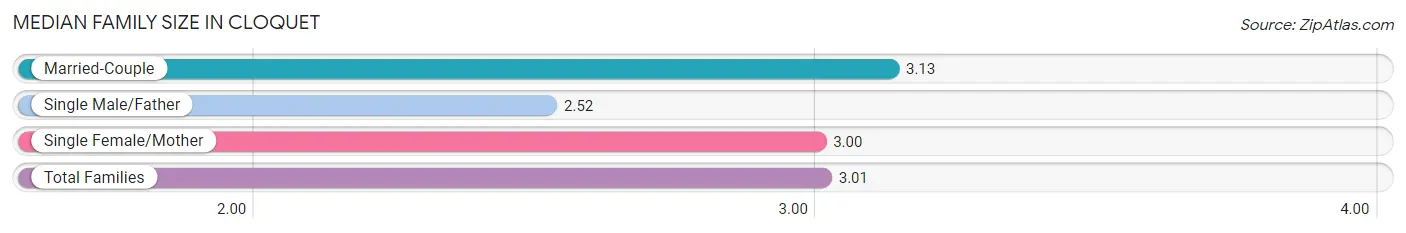
| Family Type | # Families | Family Size |
| Married-Couple | 1,825 (59.4%) | 3.13 |
| Single Male/Father | 421 (13.7%) | 2.52 |
| Single Female/Mother | 827 (26.9%) | 3.00 |
| Total Families | 3,073 (100.0%) | 3.01 |
Median Household Size in Cloquet
The median household size in Cloquet is 2.37 persons per household, with single female/mother households (827 | 16.0%) accounting for the largest median household size of 3.25 persons per household. non-family households (2,097 | 40.6%) represent the smallest median household size with 1.27 persons per household.
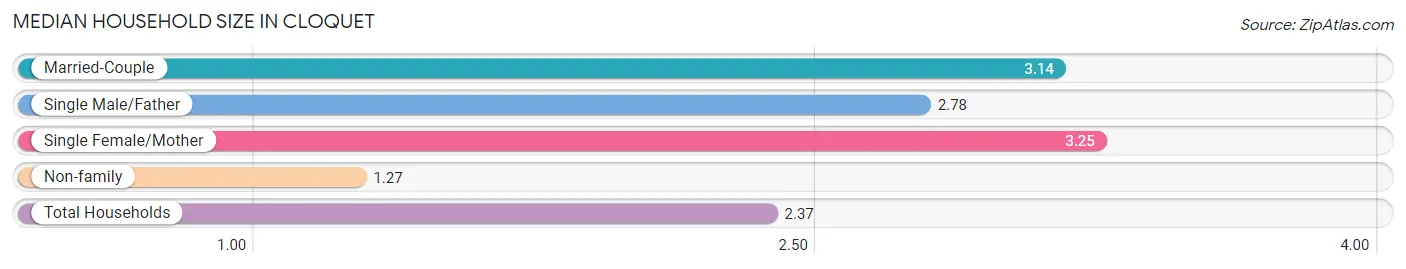
| Household Type | # Households | Household Size |
| Married-Couple | 1,825 (35.3%) | 3.14 |
| Single Male/Father | 421 (8.1%) | 2.78 |
| Single Female/Mother | 827 (16.0%) | 3.25 |
| Non-family | 2,097 (40.6%) | 1.27 |
| Total Households | 5,170 (100.0%) | 2.37 |
Household Size by Marriage Status in Cloquet
Out of a total of 5,170 households in Cloquet, 3,073 (59.4%) are family households, while 2,097 (40.6%) are nonfamily households. The most numerous type of family households are 2-person households, comprising 1,194, and the most common type of nonfamily households are 1-person households, comprising 1,607.
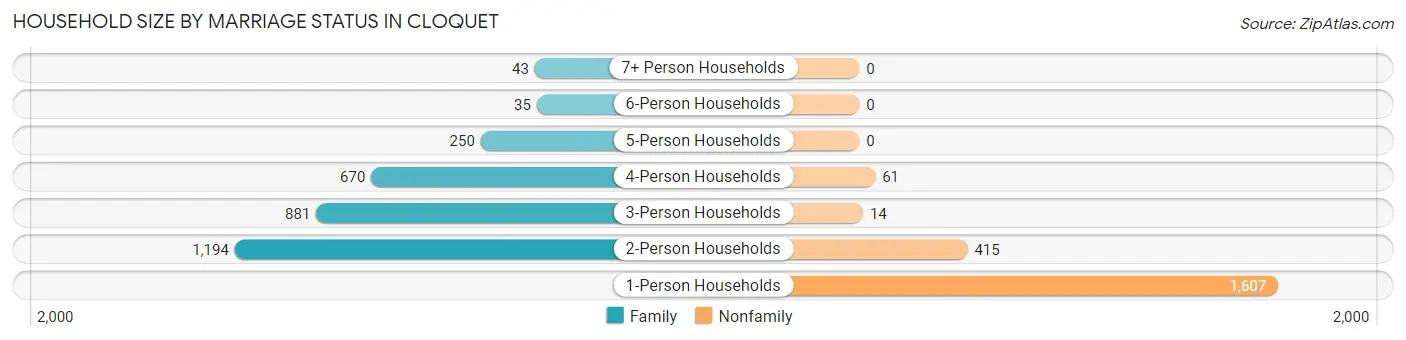
| Household Size | Family Households | Nonfamily Households |
| 1-Person Households | - | 1,607 (31.1%) |
| 2-Person Households | 1,194 (23.1%) | 415 (8.0%) |
| 3-Person Households | 881 (17.0%) | 14 (0.3%) |
| 4-Person Households | 670 (13.0%) | 61 (1.2%) |
| 5-Person Households | 250 (4.8%) | 0 (0.0%) |
| 6-Person Households | 35 (0.7%) | 0 (0.0%) |
| 7+ Person Households | 43 (0.8%) | 0 (0.0%) |
| Total | 3,073 (59.4%) | 2,097 (40.6%) |
Female Fertility in Cloquet
Fertility by Age in Cloquet
Average fertility rate in Cloquet is 41.0 births per 1,000 women. Women in the age bracket of 20 to 34 years have the highest fertility rate with 94.0 births per 1,000 women. Women in the age bracket of 20 to 34 years acount for 94.4% of all women with births.
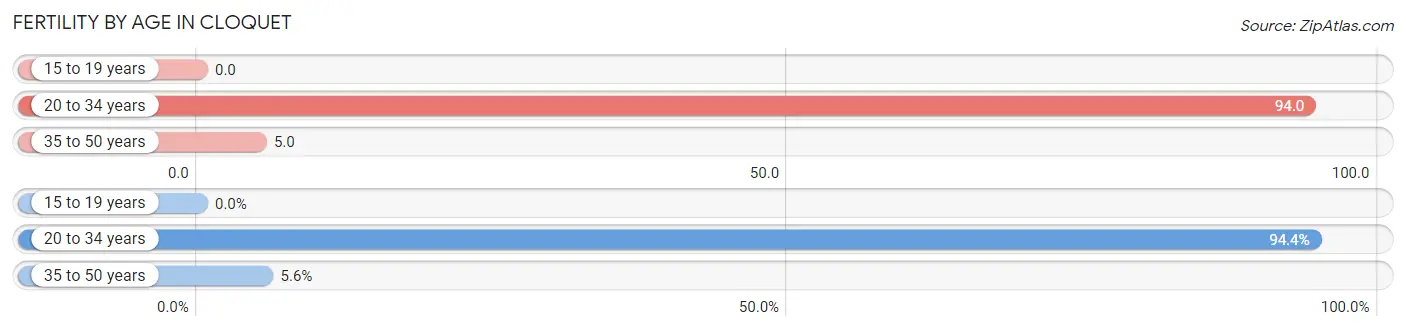
| Age Bracket | Women with Births | Births / 1,000 Women |
| 15 to 19 years | 0 (0.0%) | 0.0 |
| 20 to 34 years | 119 (94.4%) | 94.0 |
| 35 to 50 years | 7 (5.6%) | 5.0 |
| Total | 126 (100.0%) | 41.0 |
Fertility by Age by Marriage Status in Cloquet
45.2% of women with births (126) in Cloquet are married. The highest percentage of unmarried women with births falls into 20 to 34 years age bracket with 58.0% of them unmarried at the time of birth, while the lowest percentage of unmarried women with births belong to 35 to 50 years age bracket with 0.0% of them unmarried.
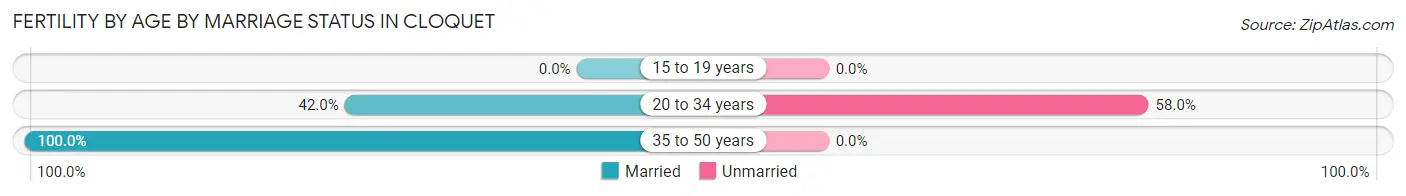
| Age Bracket | Married | Unmarried |
| 15 to 19 years | 0 (0.0%) | 0 (0.0%) |
| 20 to 34 years | 50 (42.0%) | 69 (58.0%) |
| 35 to 50 years | 7 (100.0%) | 0 (0.0%) |
| Total | 57 (45.2%) | 69 (54.8%) |
Fertility by Education in Cloquet
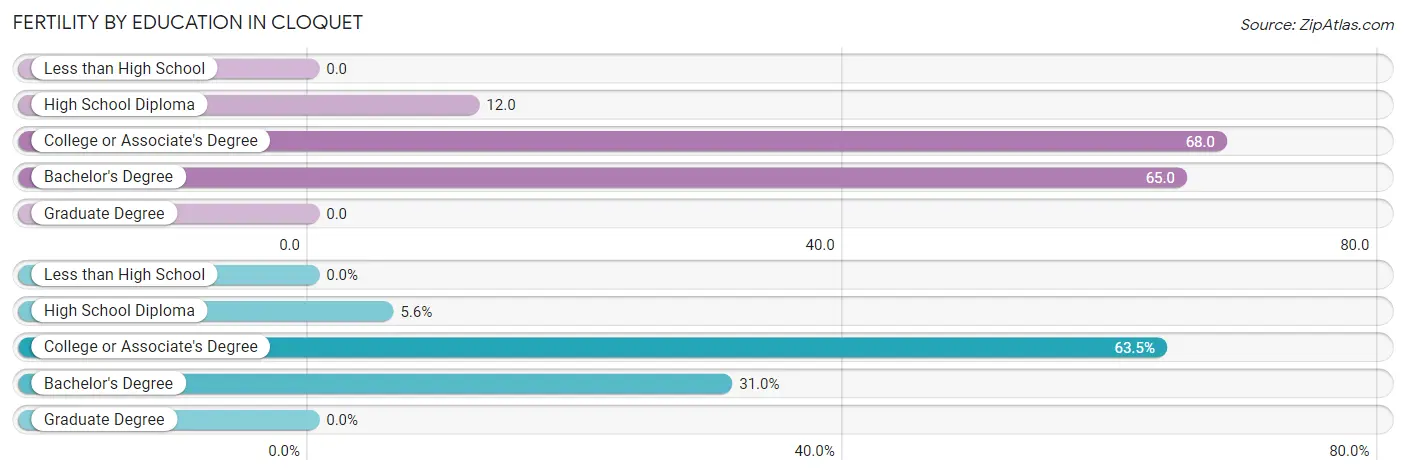
| Educational Attainment | Women with Births | Births / 1,000 Women |
| Less than High School | 0 (0.0%) | 0.0 |
| High School Diploma | 7 (5.6%) | 12.0 |
| College or Associate's Degree | 80 (63.5%) | 68.0 |
| Bachelor's Degree | 39 (30.9%) | 65.0 |
| Graduate Degree | 0 (0.0%) | 0.0 |
| Total | 126 (100.0%) | 41.0 |
Fertility by Education by Marriage Status in Cloquet
54.8% of women with births in Cloquet are unmarried. Women with the educational attainment of bachelor's degree are most likely to be married with 64.1% of them married at childbirth, while women with the educational attainment of high school diploma are least likely to be married with 100.0% of them unmarried at childbirth.
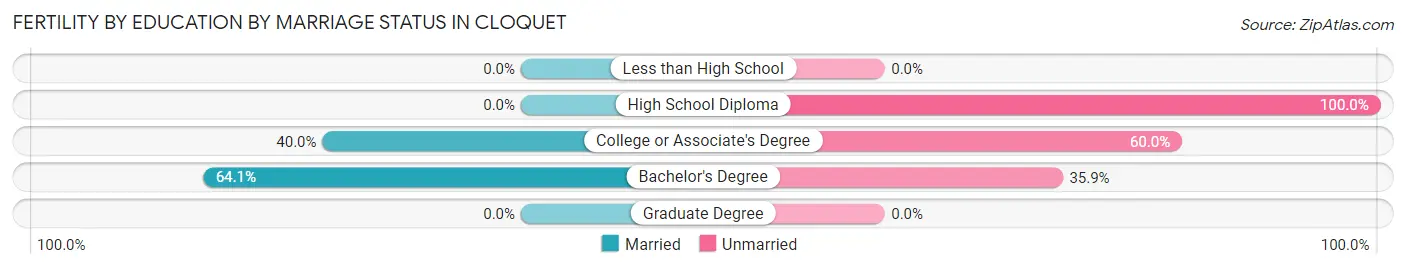
| Educational Attainment | Married | Unmarried |
| Less than High School | 0 (0.0%) | 0 (0.0%) |
| High School Diploma | 0 (0.0%) | 7 (100.0%) |
| College or Associate's Degree | 32 (40.0%) | 48 (60.0%) |
| Bachelor's Degree | 25 (64.1%) | 14 (35.9%) |
| Graduate Degree | 0 (0.0%) | 0 (0.0%) |
| Total | 57 (45.2%) | 69 (54.8%) |
Employment Characteristics in Cloquet
Employment by Class of Employer in Cloquet
Among the 5,989 employed individuals in Cloquet, private company employees (3,788 | 63.2%), not-for-profit organizations (756 | 12.6%), and local government employees (473 | 7.9%) make up the most common classes of employment.
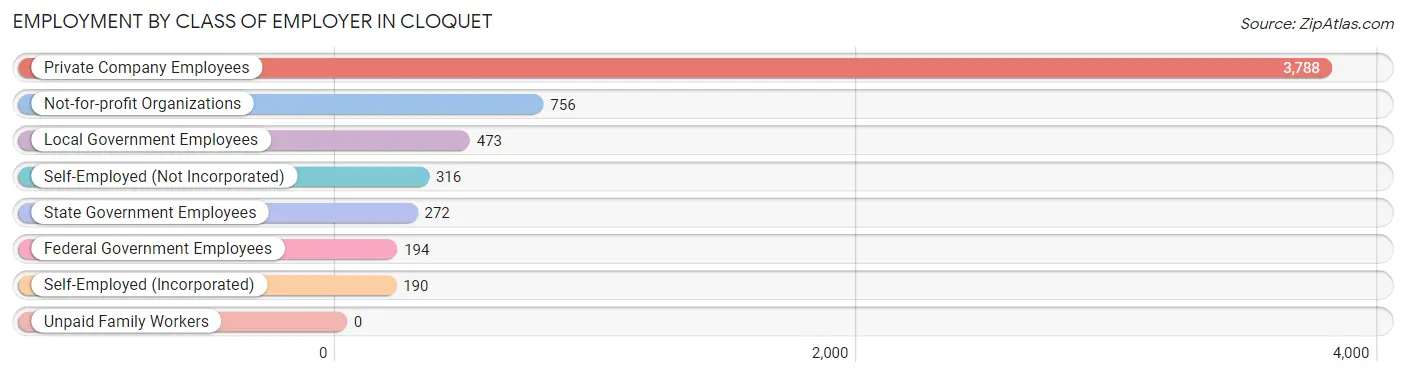
| Employer Class | # Employees | % Employees |
| Private Company Employees | 3,788 | 63.2% |
| Self-Employed (Incorporated) | 190 | 3.2% |
| Self-Employed (Not Incorporated) | 316 | 5.3% |
| Not-for-profit Organizations | 756 | 12.6% |
| Local Government Employees | 473 | 7.9% |
| State Government Employees | 272 | 4.5% |
| Federal Government Employees | 194 | 3.2% |
| Unpaid Family Workers | 0 | 0.0% |
| Total | 5,989 | 100.0% |
Employment Status by Age in Cloquet
According to the labor force statistics for Cloquet, out of the total population over 16 years of age (9,771), 65.7% or 6,420 individuals are in the labor force, with 4.9% or 315 of them unemployed. The age group with the highest labor force participation rate is 30 to 34 years, with 94.1% or 803 individuals in the labor force. Within the labor force, the 30 to 34 years age range has the highest percentage of unemployed individuals, with 9.2% or 74 of them being unemployed.
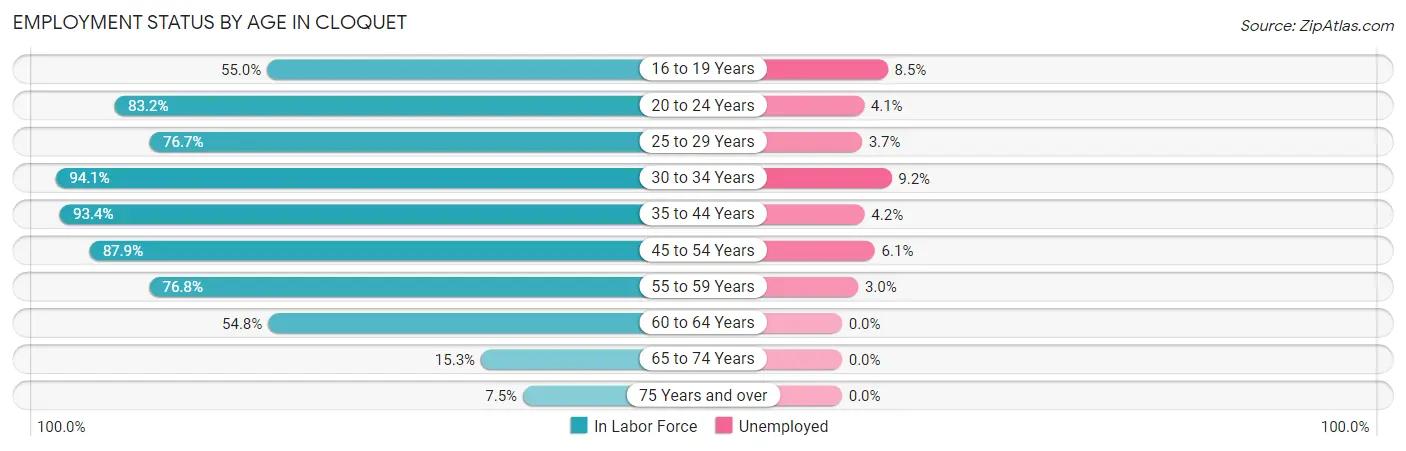
| Age Bracket | In Labor Force | Unemployed |
| 16 to 19 Years | 410 (55.0%) | 35 (8.5%) |
| 20 to 24 Years | 827 (83.2%) | 34 (4.1%) |
| 25 to 29 Years | 602 (76.7%) | 22 (3.7%) |
| 30 to 34 Years | 803 (94.1%) | 74 (9.2%) |
| 35 to 44 Years | 1,468 (93.4%) | 62 (4.2%) |
| 45 to 54 Years | 1,204 (87.9%) | 73 (6.1%) |
| 55 to 59 Years | 368 (76.8%) | 11 (3.0%) |
| 60 to 64 Years | 510 (54.8%) | 0 (0.0%) |
| 65 to 74 Years | 151 (15.3%) | 0 (0.0%) |
| 75 Years and over | 79 (7.5%) | 0 (0.0%) |
| Total | 6,420 (65.7%) | 315 (4.9%) |
Employment Status by Educational Attainment in Cloquet
According to labor force statistics for Cloquet, 82.7% of individuals (4,954) out of the total population between 25 and 64 years of age (5,990) are in the labor force, with 4.9% or 243 of them being unemployed. The group with the highest labor force participation rate are those with the educational attainment of bachelor's degree or higher, with 86.5% or 1,363 individuals in the labor force. Within the labor force, individuals with high school diploma education have the highest percentage of unemployment, with 8.3% or 102 of them being unemployed.
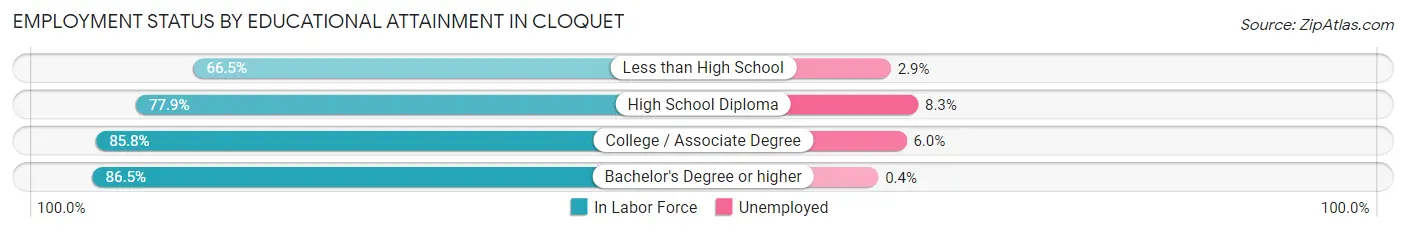
| Educational Attainment | In Labor Force | Unemployed |
| Less than High School | 242 (66.5%) | 11 (2.9%) |
| High School Diploma | 1,232 (77.9%) | 131 (8.3%) |
| College / Associate Degree | 2,118 (85.8%) | 148 (6.0%) |
| Bachelor's Degree or higher | 1,363 (86.5%) | 6 (0.4%) |
| Total | 4,954 (82.7%) | 294 (4.9%) |
Employment Occupations by Sex in Cloquet
Management, Business, Science and Arts Occupations
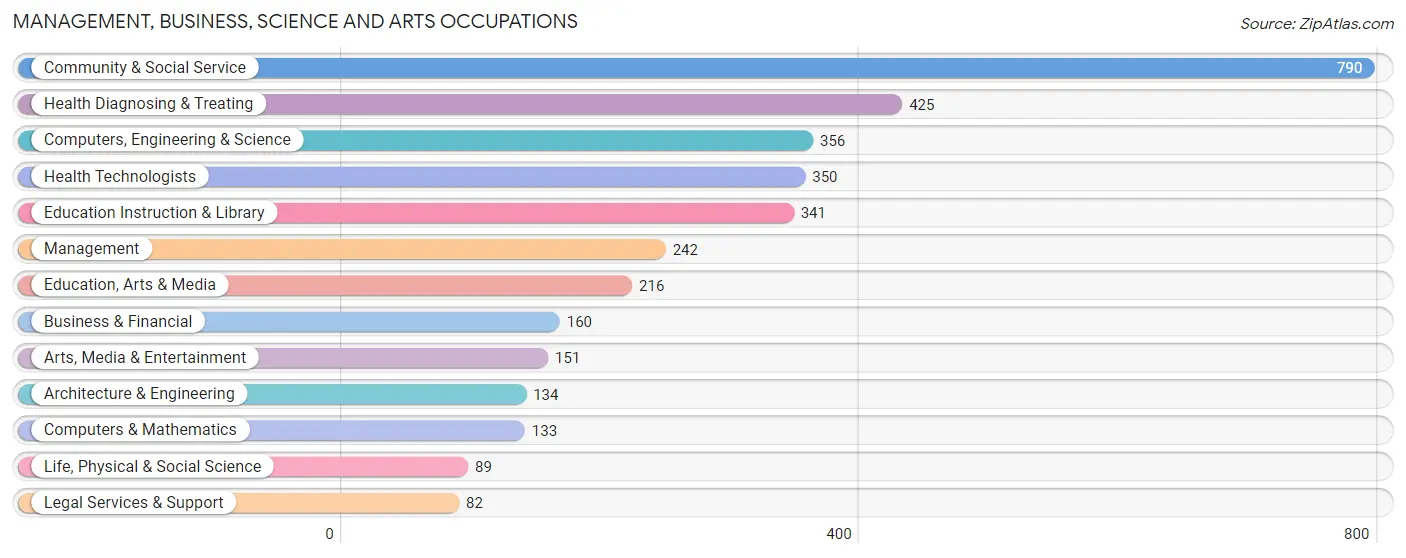
The most common Management, Business, Science and Arts occupations in Cloquet are Community & Social Service (790 | 13.0%), Health Diagnosing & Treating (425 | 7.0%), Computers, Engineering & Science (356 | 5.8%), Health Technologists (350 | 5.8%), and Education Instruction & Library (341 | 5.6%).
Management, Business, Science and Arts Occupations by Sex
Within the Management, Business, Science and Arts occupations in Cloquet, the most male-oriented occupations are Architecture & Engineering (87.3%), Computers, Engineering & Science (67.4%), and Life, Physical & Social Science (57.3%), while the most female-oriented occupations are Education, Arts & Media (89.3%), Legal Services & Support (84.2%), and Health Technologists (83.4%).
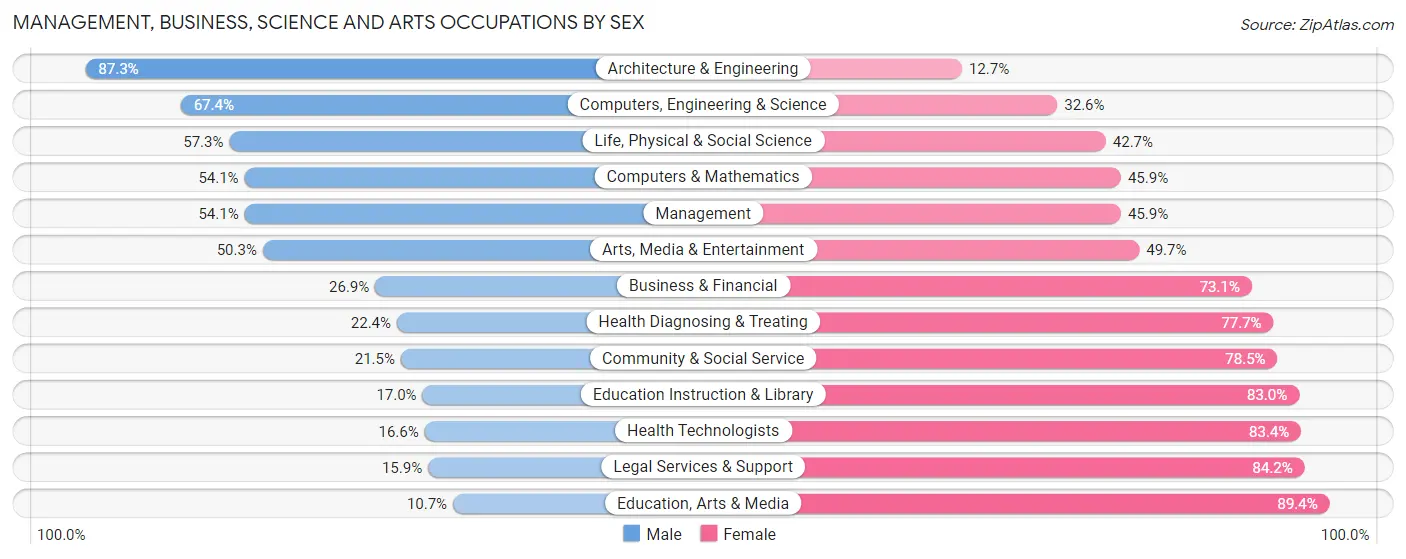
| Occupation | Male | Female |
| Management | 131 (54.1%) | 111 (45.9%) |
| Business & Financial | 43 (26.9%) | 117 (73.1%) |
| Computers, Engineering & Science | 240 (67.4%) | 116 (32.6%) |
| Computers & Mathematics | 72 (54.1%) | 61 (45.9%) |
| Architecture & Engineering | 117 (87.3%) | 17 (12.7%) |
| Life, Physical & Social Science | 51 (57.3%) | 38 (42.7%) |
| Community & Social Service | 170 (21.5%) | 620 (78.5%) |
| Education, Arts & Media | 23 (10.6%) | 193 (89.3%) |
| Legal Services & Support | 13 (15.9%) | 69 (84.2%) |
| Education Instruction & Library | 58 (17.0%) | 283 (83.0%) |
| Arts, Media & Entertainment | 76 (50.3%) | 75 (49.7%) |
| Health Diagnosing & Treating | 95 (22.4%) | 330 (77.6%) |
| Health Technologists | 58 (16.6%) | 292 (83.4%) |
| Total (Category) | 679 (34.4%) | 1,294 (65.6%) |
| Total (Overall) | 2,866 (47.0%) | 3,225 (52.9%) |
Services Occupations
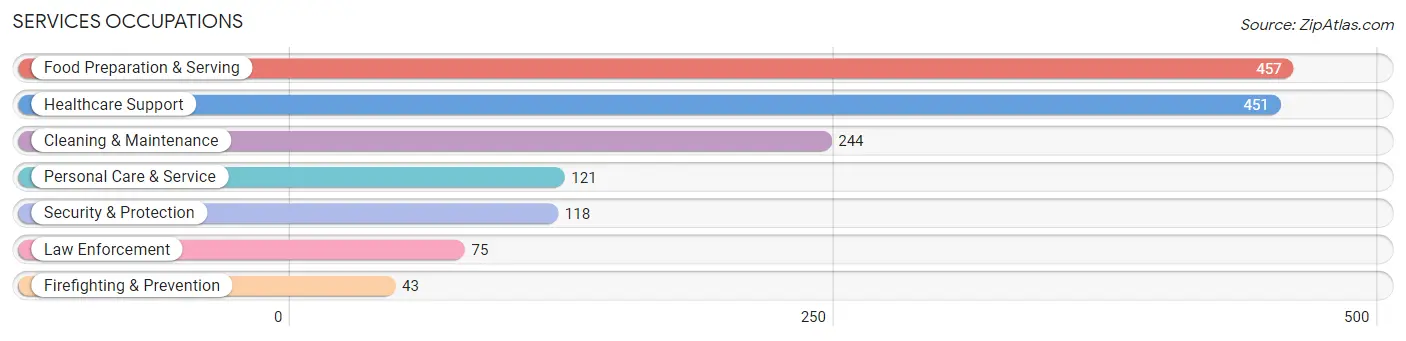
The most common Services occupations in Cloquet are Food Preparation & Serving (457 | 7.5%), Healthcare Support (451 | 7.4%), Cleaning & Maintenance (244 | 4.0%), Personal Care & Service (121 | 2.0%), and Security & Protection (118 | 1.9%).
Services Occupations by Sex
Within the Services occupations in Cloquet, the most male-oriented occupations are Law Enforcement (96.0%), Security & Protection (89.0%), and Firefighting & Prevention (76.7%), while the most female-oriented occupations are Healthcare Support (93.3%), Personal Care & Service (76.9%), and Cleaning & Maintenance (37.3%).
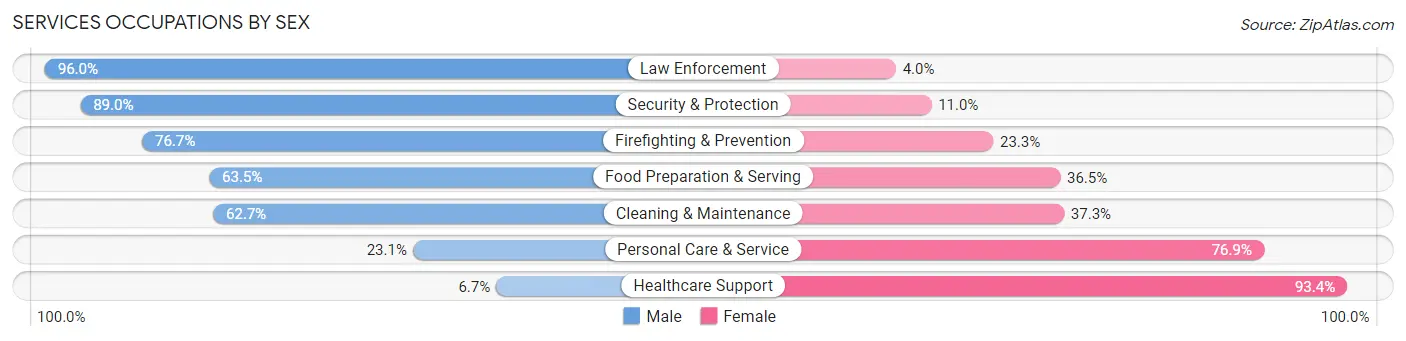
| Occupation | Male | Female |
| Healthcare Support | 30 (6.7%) | 421 (93.3%) |
| Security & Protection | 105 (89.0%) | 13 (11.0%) |
| Firefighting & Prevention | 33 (76.7%) | 10 (23.3%) |
| Law Enforcement | 72 (96.0%) | 3 (4.0%) |
| Food Preparation & Serving | 290 (63.5%) | 167 (36.5%) |
| Cleaning & Maintenance | 153 (62.7%) | 91 (37.3%) |
| Personal Care & Service | 28 (23.1%) | 93 (76.9%) |
| Total (Category) | 606 (43.6%) | 785 (56.4%) |
| Total (Overall) | 2,866 (47.0%) | 3,225 (52.9%) |
Sales and Office Occupations
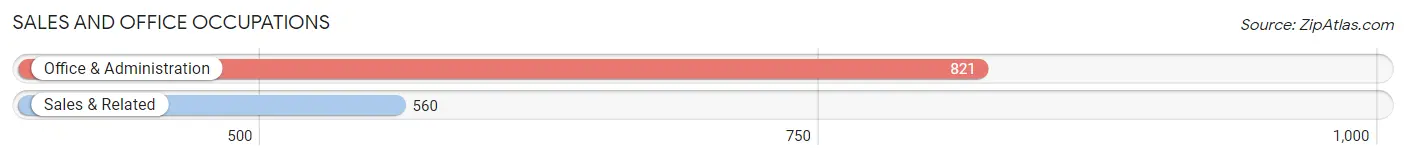
The most common Sales and Office occupations in Cloquet are Office & Administration (821 | 13.5%), and Sales & Related (560 | 9.2%).
Sales and Office Occupations by Sex
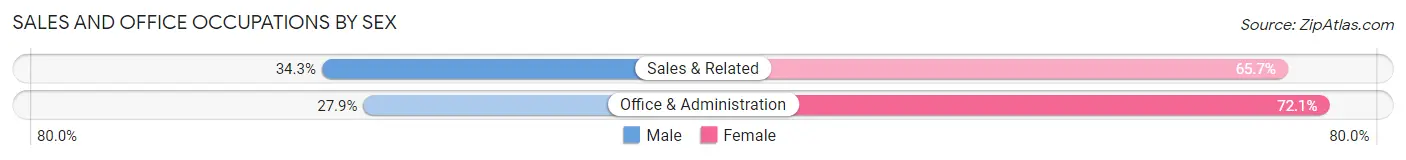
| Occupation | Male | Female |
| Sales & Related | 192 (34.3%) | 368 (65.7%) |
| Office & Administration | 229 (27.9%) | 592 (72.1%) |
| Total (Category) | 421 (30.5%) | 960 (69.5%) |
| Total (Overall) | 2,866 (47.0%) | 3,225 (52.9%) |
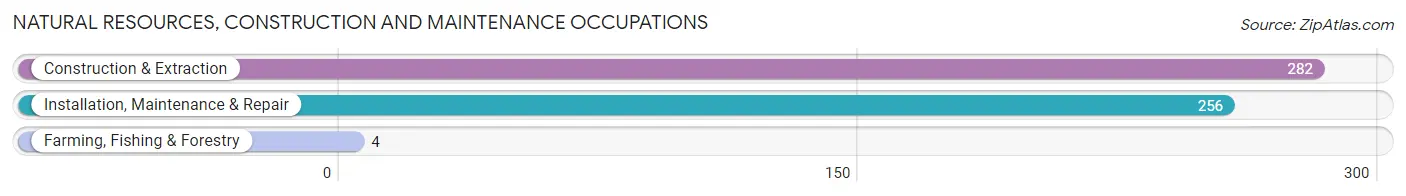
Natural Resources, Construction and Maintenance Occupations
The most common Natural Resources, Construction and Maintenance occupations in Cloquet are Construction & Extraction (282 | 4.6%), Installation, Maintenance & Repair (256 | 4.2%), and Farming, Fishing & Forestry (4 | 0.1%).
Natural Resources, Construction and Maintenance Occupations by Sex
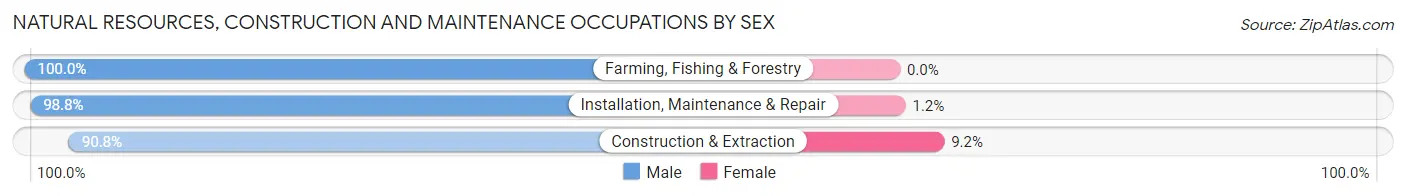
| Occupation | Male | Female |
| Farming, Fishing & Forestry | 4 (100.0%) | 0 (0.0%) |
| Construction & Extraction | 256 (90.8%) | 26 (9.2%) |
| Installation, Maintenance & Repair | 253 (98.8%) | 3 (1.2%) |
| Total (Category) | 513 (94.7%) | 29 (5.3%) |
| Total (Overall) | 2,866 (47.0%) | 3,225 (52.9%) |
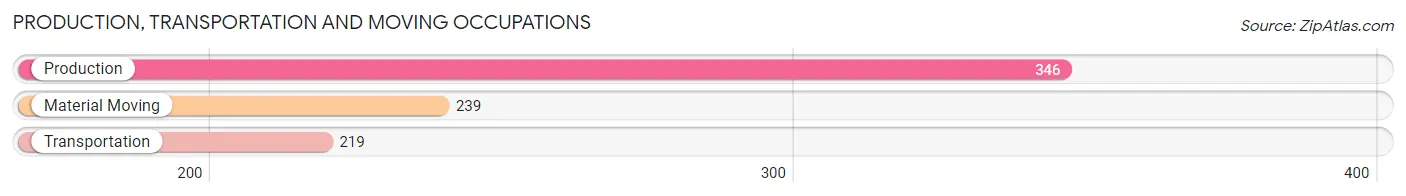
Production, Transportation and Moving Occupations
The most common Production, Transportation and Moving occupations in Cloquet are Production (346 | 5.7%), Material Moving (239 | 3.9%), and Transportation (219 | 3.6%).
Production, Transportation and Moving Occupations by Sex
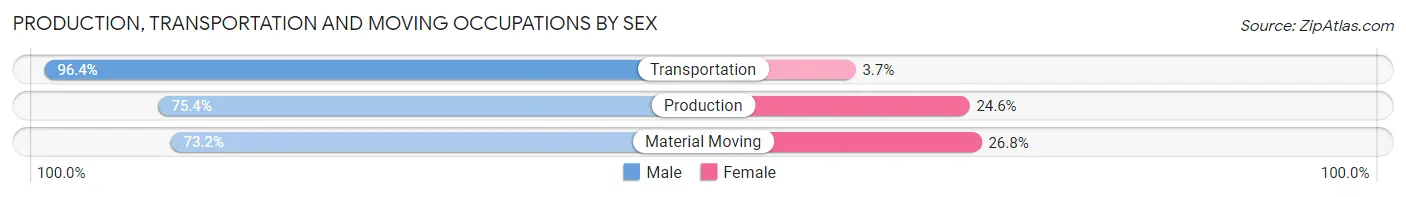
| Occupation | Male | Female |
| Production | 261 (75.4%) | 85 (24.6%) |
| Transportation | 211 (96.4%) | 8 (3.6%) |
| Material Moving | 175 (73.2%) | 64 (26.8%) |
| Total (Category) | 647 (80.5%) | 157 (19.5%) |
| Total (Overall) | 2,866 (47.0%) | 3,225 (52.9%) |
Employment Industries by Sex in Cloquet
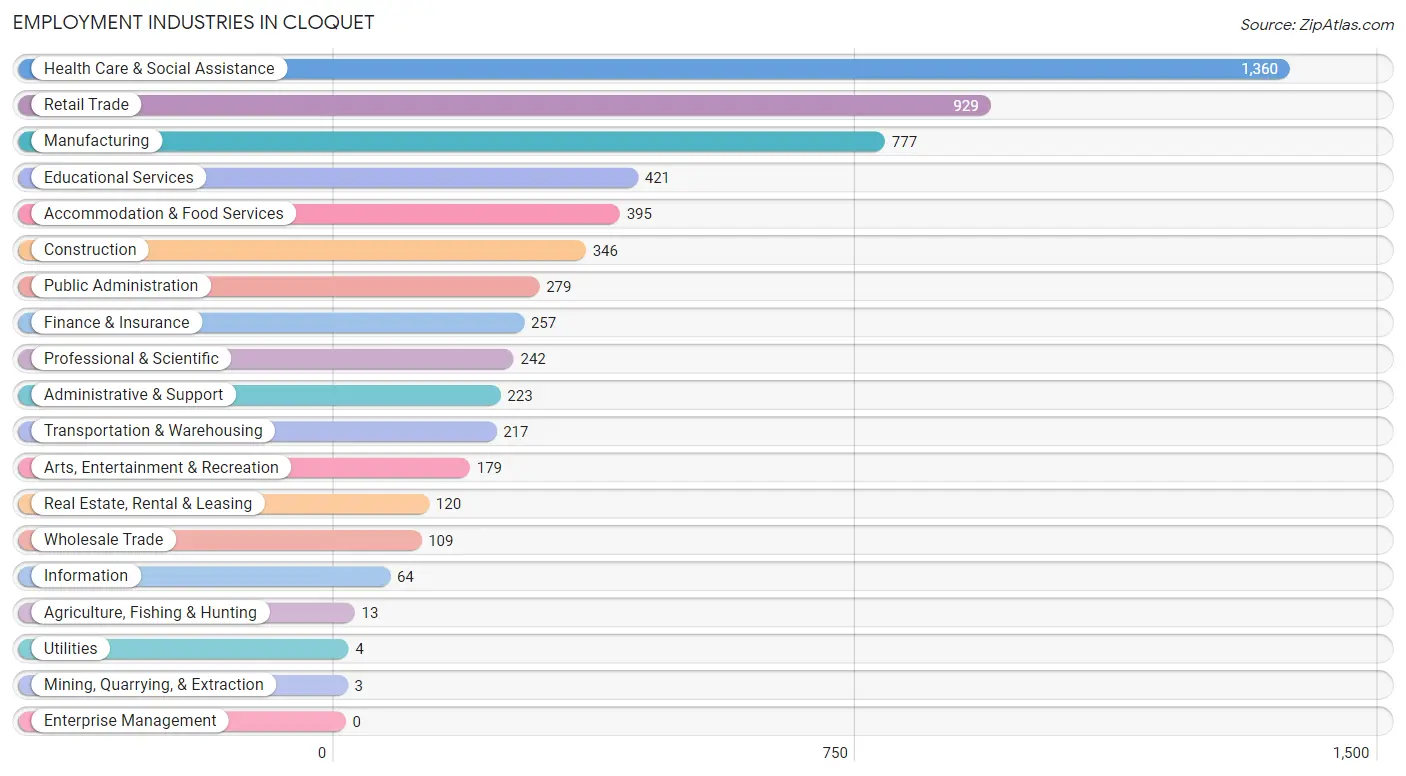
Employment Industries in Cloquet
The major employment industries in Cloquet include Health Care & Social Assistance (1,360 | 22.3%), Retail Trade (929 | 15.2%), Manufacturing (777 | 12.8%), Educational Services (421 | 6.9%), and Accommodation & Food Services (395 | 6.5%).
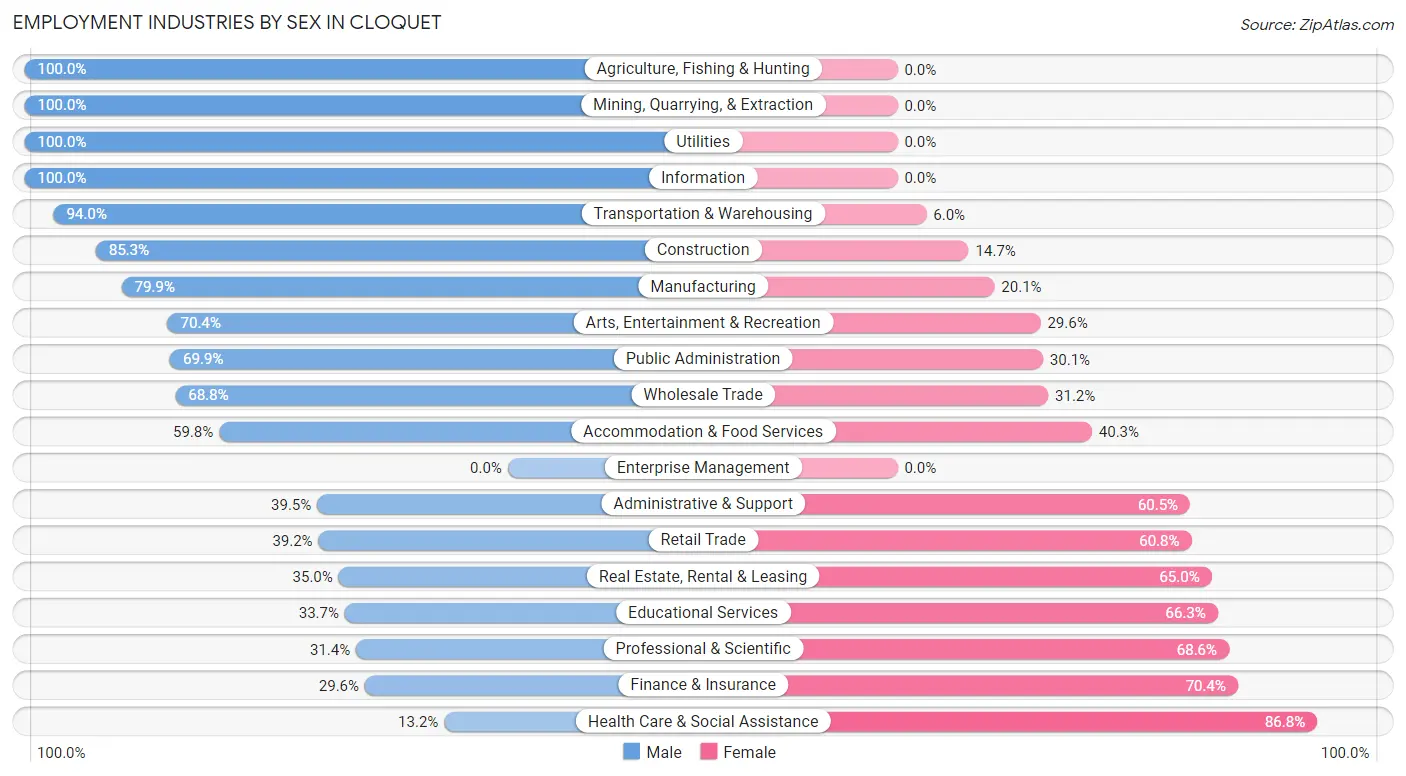
Employment Industries by Sex in Cloquet
The Cloquet industries that see more men than women are Agriculture, Fishing & Hunting (100.0%), Mining, Quarrying, & Extraction (100.0%), and Utilities (100.0%), whereas the industries that tend to have a higher number of women are Health Care & Social Assistance (86.8%), Finance & Insurance (70.4%), and Professional & Scientific (68.6%).
| Industry | Male | Female |
| Agriculture, Fishing & Hunting | 13 (100.0%) | 0 (0.0%) |
| Mining, Quarrying, & Extraction | 3 (100.0%) | 0 (0.0%) |
| Construction | 295 (85.3%) | 51 (14.7%) |
| Manufacturing | 621 (79.9%) | 156 (20.1%) |
| Wholesale Trade | 75 (68.8%) | 34 (31.2%) |
| Retail Trade | 364 (39.2%) | 565 (60.8%) |
| Transportation & Warehousing | 204 (94.0%) | 13 (6.0%) |
| Utilities | 4 (100.0%) | 0 (0.0%) |
| Information | 64 (100.0%) | 0 (0.0%) |
| Finance & Insurance | 76 (29.6%) | 181 (70.4%) |
| Real Estate, Rental & Leasing | 42 (35.0%) | 78 (65.0%) |
| Professional & Scientific | 76 (31.4%) | 166 (68.6%) |
| Enterprise Management | 0 (0.0%) | 0 (0.0%) |
| Administrative & Support | 88 (39.5%) | 135 (60.5%) |
| Educational Services | 142 (33.7%) | 279 (66.3%) |
| Health Care & Social Assistance | 179 (13.2%) | 1,181 (86.8%) |
| Arts, Entertainment & Recreation | 126 (70.4%) | 53 (29.6%) |
| Accommodation & Food Services | 236 (59.8%) | 159 (40.3%) |
| Public Administration | 195 (69.9%) | 84 (30.1%) |
| Total | 2,866 (47.0%) | 3,225 (52.9%) |
Education in Cloquet
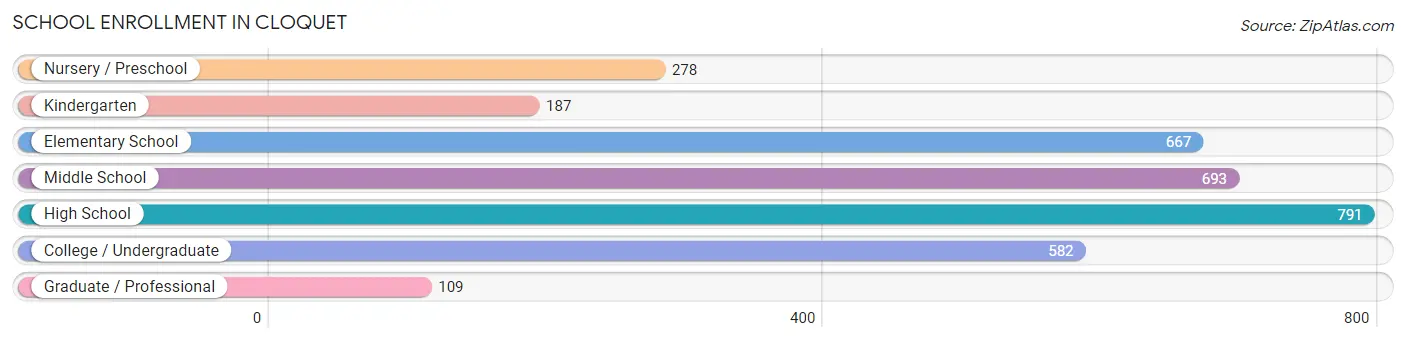
School Enrollment in Cloquet
The most common levels of schooling among the 3,307 students in Cloquet are high school (791 | 23.9%), middle school (693 | 21.0%), and elementary school (667 | 20.2%).
| School Level | # Students | % Students |
| Nursery / Preschool | 278 | 8.4% |
| Kindergarten | 187 | 5.7% |
| Elementary School | 667 | 20.2% |
| Middle School | 693 | 21.0% |
| High School | 791 | 23.9% |
| College / Undergraduate | 582 | 17.6% |
| Graduate / Professional | 109 | 3.3% |
| Total | 3,307 | 100.0% |
School Enrollment by Age by Funding Source in Cloquet
Out of a total of 3,307 students who are enrolled in schools in Cloquet, 317 (9.6%) attend a private institution, while the remaining 2,990 (90.4%) are enrolled in public schools. The age group of 35 years and over has the highest likelihood of being enrolled in private schools, with 116 (53.9% in the age bracket) enrolled. Conversely, the age group of 15 to 17 year olds has the lowest likelihood of being enrolled in a private school, with 511 (98.7% in the age bracket) attending a public institution.
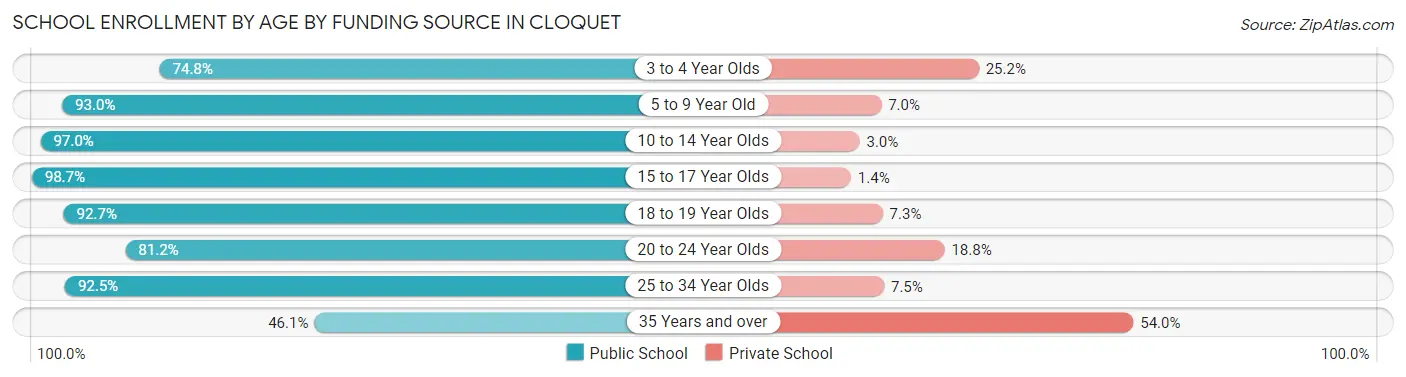
| Age Bracket | Public School | Private School |
| 3 to 4 Year Olds | 119 (74.8%) | 40 (25.2%) |
| 5 to 9 Year Old | 745 (93.0%) | 56 (7.0%) |
| 10 to 14 Year Olds | 952 (97.0%) | 29 (3.0%) |
| 15 to 17 Year Olds | 511 (98.7%) | 7 (1.3%) |
| 18 to 19 Year Olds | 281 (92.7%) | 22 (7.3%) |
| 20 to 24 Year Olds | 160 (81.2%) | 37 (18.8%) |
| 25 to 34 Year Olds | 123 (92.5%) | 10 (7.5%) |
| 35 Years and over | 99 (46.1%) | 116 (53.9%) |
| Total | 2,990 (90.4%) | 317 (9.6%) |
Educational Attainment by Field of Study in Cloquet
Business (368 | 16.8%), education (363 | 16.6%), science & technology (261 | 11.9%), social sciences (231 | 10.5%), and arts & humanities (226 | 10.3%) are the most common fields of study among 2,191 individuals in Cloquet who have obtained a bachelor's degree or higher.
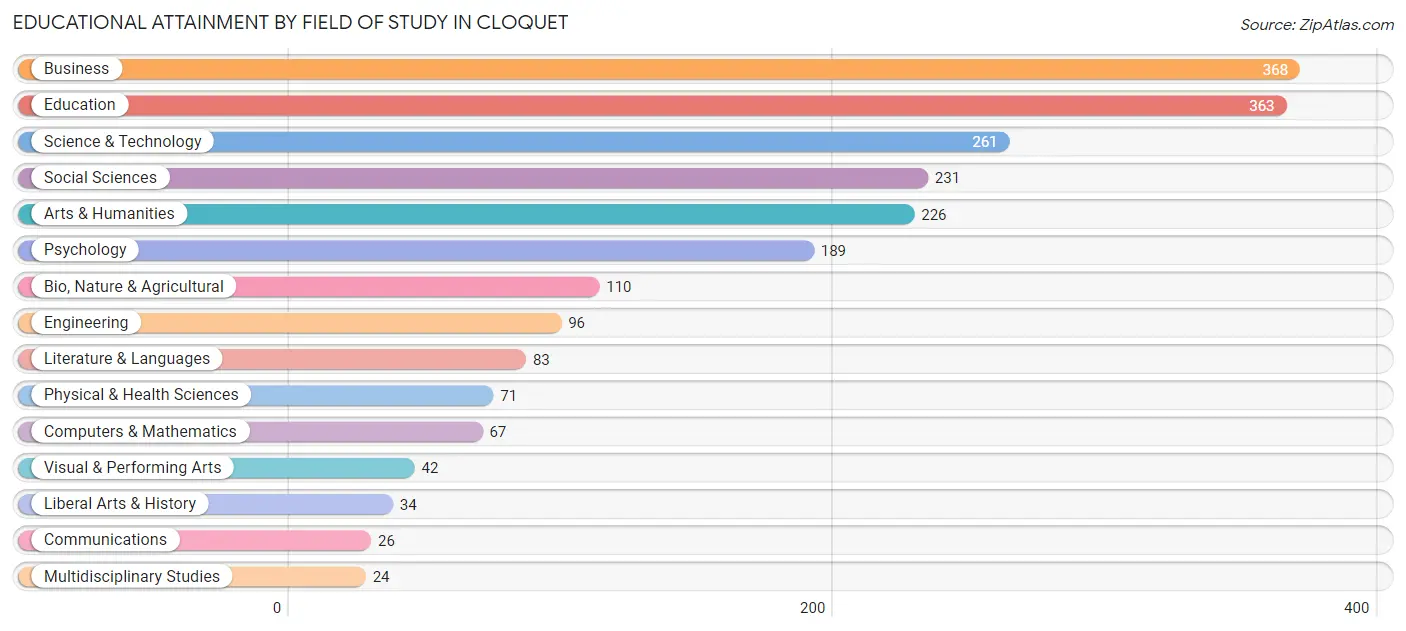
| Field of Study | # Graduates | % Graduates |
| Computers & Mathematics | 67 | 3.1% |
| Bio, Nature & Agricultural | 110 | 5.0% |
| Physical & Health Sciences | 71 | 3.2% |
| Psychology | 189 | 8.6% |
| Social Sciences | 231 | 10.5% |
| Engineering | 96 | 4.4% |
| Multidisciplinary Studies | 24 | 1.1% |
| Science & Technology | 261 | 11.9% |
| Business | 368 | 16.8% |
| Education | 363 | 16.6% |
| Literature & Languages | 83 | 3.8% |
| Liberal Arts & History | 34 | 1.5% |
| Visual & Performing Arts | 42 | 1.9% |
| Communications | 26 | 1.2% |
| Arts & Humanities | 226 | 10.3% |
| Total | 2,191 | 100.0% |
Transportation & Commute in Cloquet
Vehicle Availability by Sex in Cloquet
The most prevalent vehicle ownership categories in Cloquet are males with 2 vehicles (1,341, accounting for 47.7%) and females with 2 vehicles (1,332, making up 43.3%).
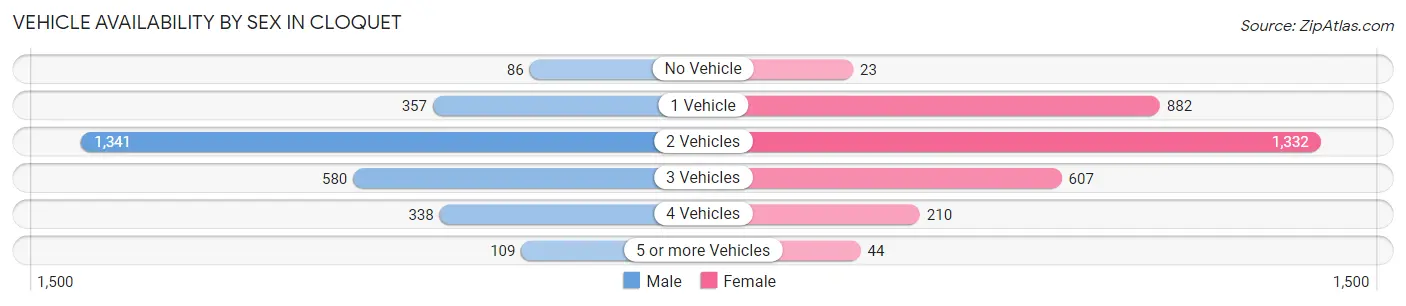
| Vehicles Available | Male | Female |
| No Vehicle | 86 (3.1%) | 23 (0.7%) |
| 1 Vehicle | 357 (12.7%) | 882 (28.5%) |
| 2 Vehicles | 1,341 (47.7%) | 1,332 (43.0%) |
| 3 Vehicles | 580 (20.6%) | 607 (19.6%) |
| 4 Vehicles | 338 (12.0%) | 210 (6.8%) |
| 5 or more Vehicles | 109 (3.9%) | 44 (1.4%) |
| Total | 2,811 (100.0%) | 3,098 (100.0%) |
Commute Time in Cloquet
The most frequently occuring commute durations in Cloquet are 5 to 9 minutes (1,671 commuters, 29.7%), 30 to 34 minutes (949 commuters, 16.9%), and 10 to 14 minutes (822 commuters, 14.6%).
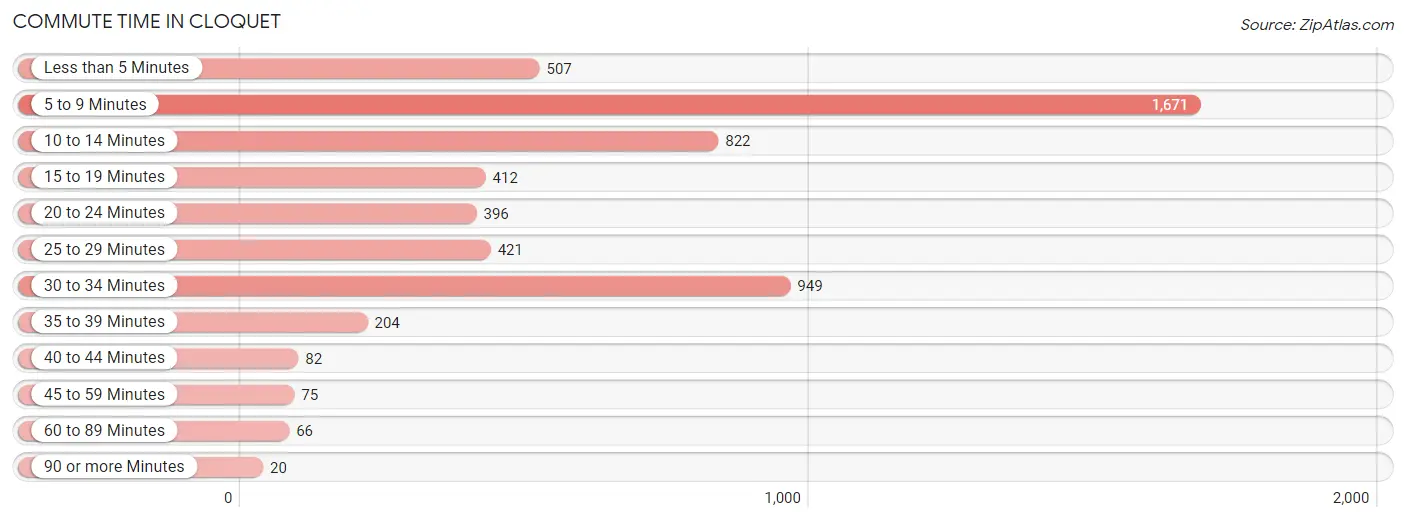
| Commute Time | # Commuters | % Commuters |
| Less than 5 Minutes | 507 | 9.0% |
| 5 to 9 Minutes | 1,671 | 29.7% |
| 10 to 14 Minutes | 822 | 14.6% |
| 15 to 19 Minutes | 412 | 7.3% |
| 20 to 24 Minutes | 396 | 7.0% |
| 25 to 29 Minutes | 421 | 7.5% |
| 30 to 34 Minutes | 949 | 16.9% |
| 35 to 39 Minutes | 204 | 3.6% |
| 40 to 44 Minutes | 82 | 1.5% |
| 45 to 59 Minutes | 75 | 1.3% |
| 60 to 89 Minutes | 66 | 1.2% |
| 90 or more Minutes | 20 | 0.4% |
Commute Time by Sex in Cloquet
The most common commute times in Cloquet are 5 to 9 minutes (895 commuters, 32.3%) for males and 5 to 9 minutes (776 commuters, 27.2%) for females.
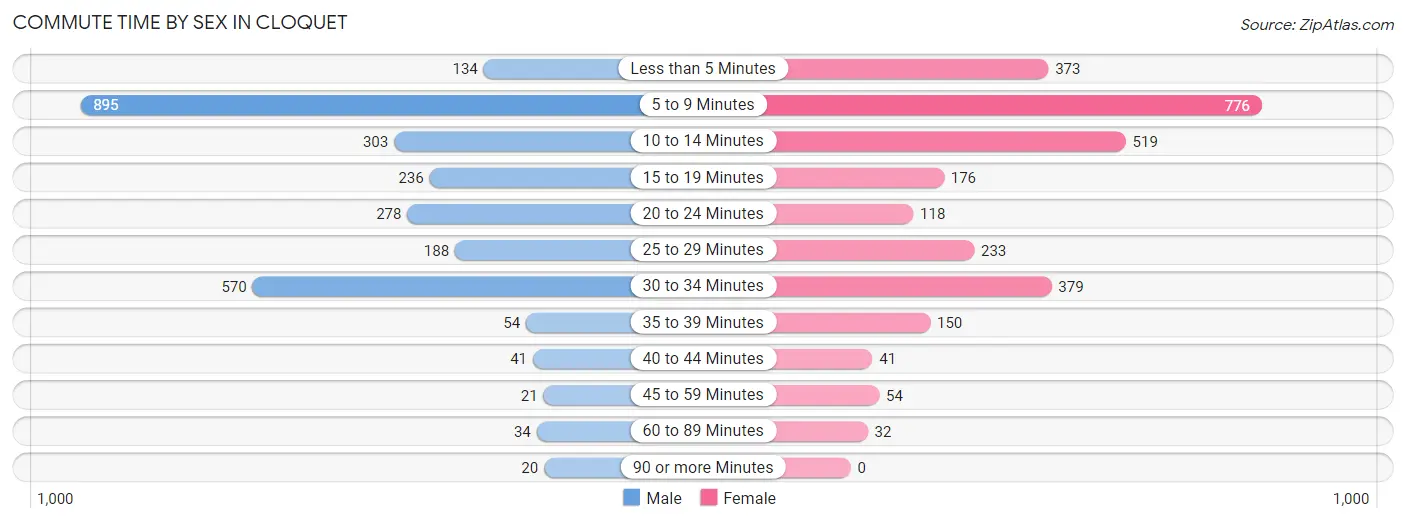
| Commute Time | Male | Female |
| Less than 5 Minutes | 134 (4.8%) | 373 (13.1%) |
| 5 to 9 Minutes | 895 (32.3%) | 776 (27.2%) |
| 10 to 14 Minutes | 303 (10.9%) | 519 (18.2%) |
| 15 to 19 Minutes | 236 (8.5%) | 176 (6.2%) |
| 20 to 24 Minutes | 278 (10.0%) | 118 (4.1%) |
| 25 to 29 Minutes | 188 (6.8%) | 233 (8.2%) |
| 30 to 34 Minutes | 570 (20.5%) | 379 (13.3%) |
| 35 to 39 Minutes | 54 (1.9%) | 150 (5.3%) |
| 40 to 44 Minutes | 41 (1.5%) | 41 (1.4%) |
| 45 to 59 Minutes | 21 (0.8%) | 54 (1.9%) |
| 60 to 89 Minutes | 34 (1.2%) | 32 (1.1%) |
| 90 or more Minutes | 20 (0.7%) | 0 (0.0%) |
Time of Departure to Work by Sex in Cloquet
The most frequent times of departure to work in Cloquet are 6:00 AM to 6:29 AM (428, 15.4%) for males and 7:30 AM to 7:59 AM (439, 15.4%) for females.
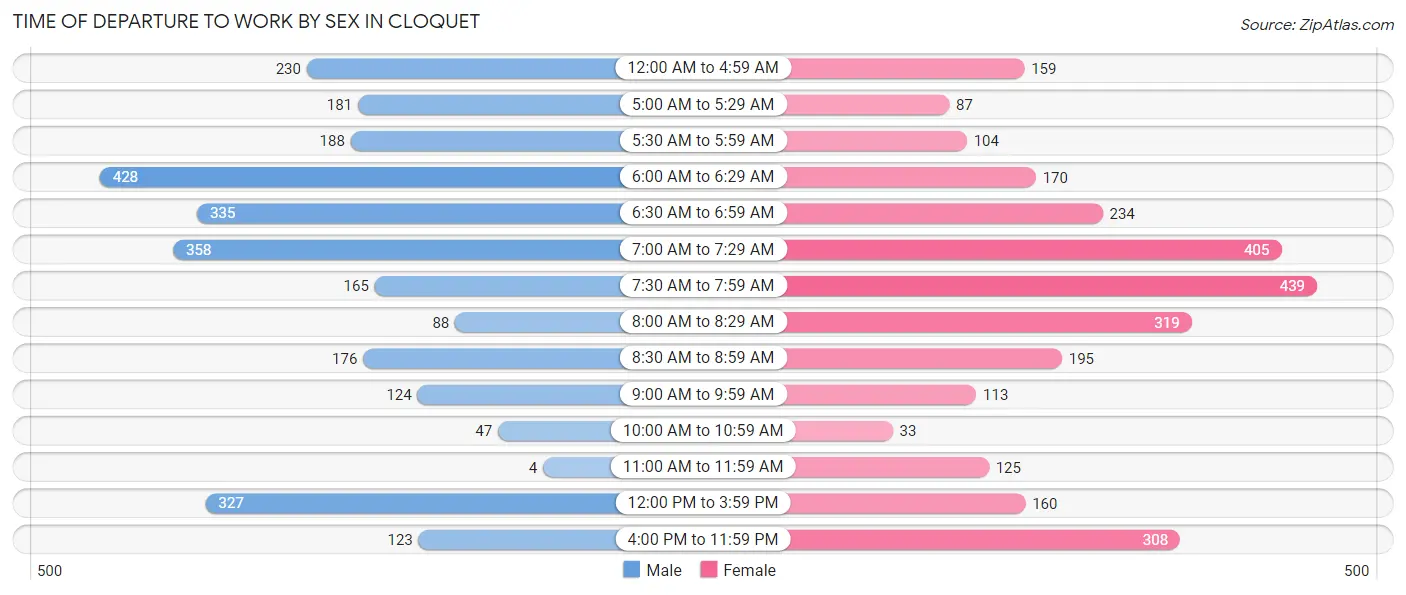
| Time of Departure | Male | Female |
| 12:00 AM to 4:59 AM | 230 (8.3%) | 159 (5.6%) |
| 5:00 AM to 5:29 AM | 181 (6.5%) | 87 (3.0%) |
| 5:30 AM to 5:59 AM | 188 (6.8%) | 104 (3.6%) |
| 6:00 AM to 6:29 AM | 428 (15.4%) | 170 (6.0%) |
| 6:30 AM to 6:59 AM | 335 (12.1%) | 234 (8.2%) |
| 7:00 AM to 7:29 AM | 358 (12.9%) | 405 (14.2%) |
| 7:30 AM to 7:59 AM | 165 (5.9%) | 439 (15.4%) |
| 8:00 AM to 8:29 AM | 88 (3.2%) | 319 (11.2%) |
| 8:30 AM to 8:59 AM | 176 (6.3%) | 195 (6.8%) |
| 9:00 AM to 9:59 AM | 124 (4.5%) | 113 (4.0%) |
| 10:00 AM to 10:59 AM | 47 (1.7%) | 33 (1.2%) |
| 11:00 AM to 11:59 AM | 4 (0.1%) | 125 (4.4%) |
| 12:00 PM to 3:59 PM | 327 (11.8%) | 160 (5.6%) |
| 4:00 PM to 11:59 PM | 123 (4.4%) | 308 (10.8%) |
| Total | 2,774 (100.0%) | 2,851 (100.0%) |
Housing Occupancy in Cloquet
Occupancy by Ownership in Cloquet
Of the total 5,170 dwellings in Cloquet, owner-occupied units account for 3,454 (66.8%), while renter-occupied units make up 1,716 (33.2%).
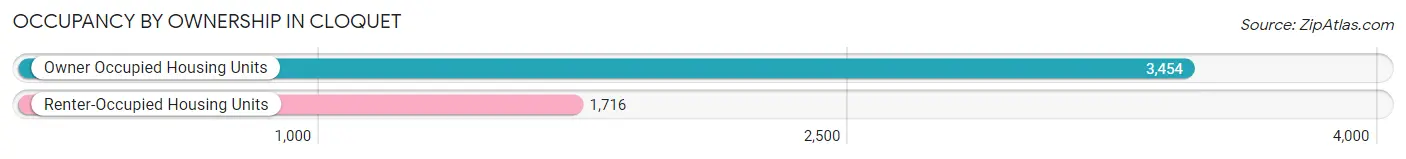
| Occupancy | # Housing Units | % Housing Units |
| Owner Occupied Housing Units | 3,454 | 66.8% |
| Renter-Occupied Housing Units | 1,716 | 33.2% |
| Total Occupied Housing Units | 5,170 | 100.0% |
Occupancy by Household Size in Cloquet
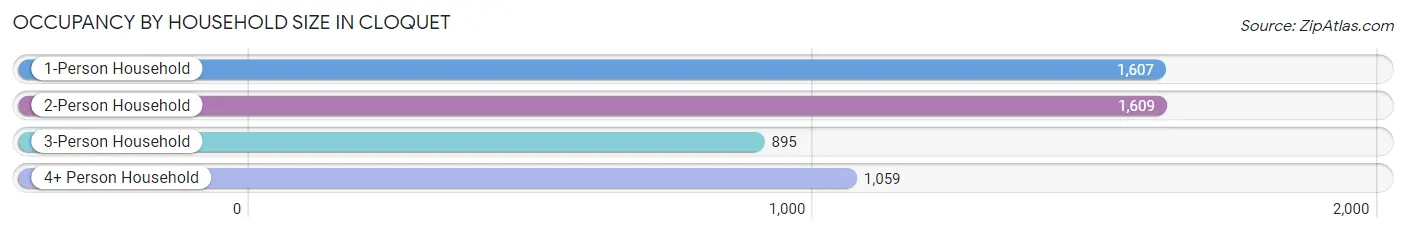
| Household Size | # Housing Units | % Housing Units |
| 1-Person Household | 1,607 | 31.1% |
| 2-Person Household | 1,609 | 31.1% |
| 3-Person Household | 895 | 17.3% |
| 4+ Person Household | 1,059 | 20.5% |
| Total Housing Units | 5,170 | 100.0% |
Occupancy by Ownership by Household Size in Cloquet
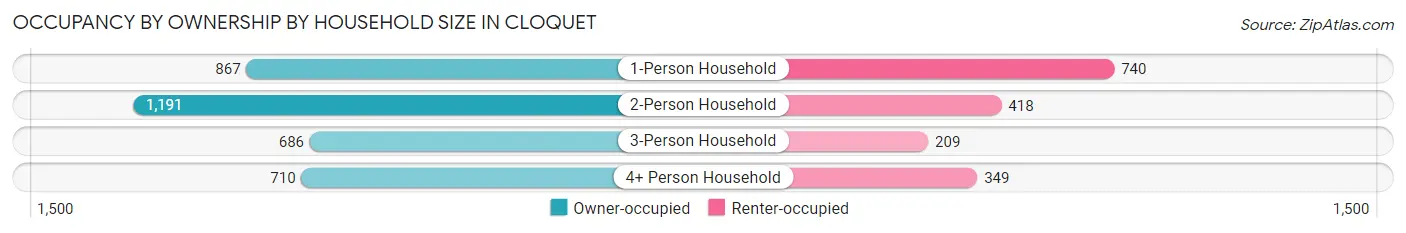
| Household Size | Owner-occupied | Renter-occupied |
| 1-Person Household | 867 (53.9%) | 740 (46.1%) |
| 2-Person Household | 1,191 (74.0%) | 418 (26.0%) |
| 3-Person Household | 686 (76.6%) | 209 (23.4%) |
| 4+ Person Household | 710 (67.0%) | 349 (33.0%) |
| Total Housing Units | 3,454 (66.8%) | 1,716 (33.2%) |
Occupancy by Educational Attainment in Cloquet
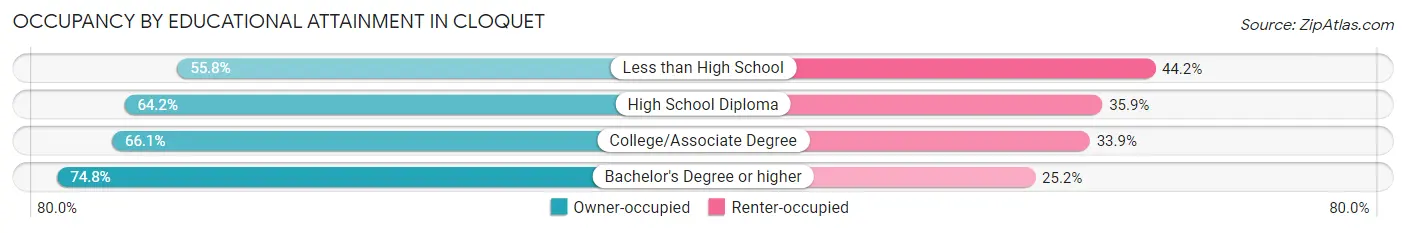
| Household Size | Owner-occupied | Renter-occupied |
| Less than High School | 232 (55.8%) | 184 (44.2%) |
| High School Diploma | 850 (64.1%) | 475 (35.8%) |
| College/Associate Degree | 1,470 (66.1%) | 753 (33.9%) |
| Bachelor's Degree or higher | 902 (74.8%) | 304 (25.2%) |
Occupancy by Age of Householder in Cloquet
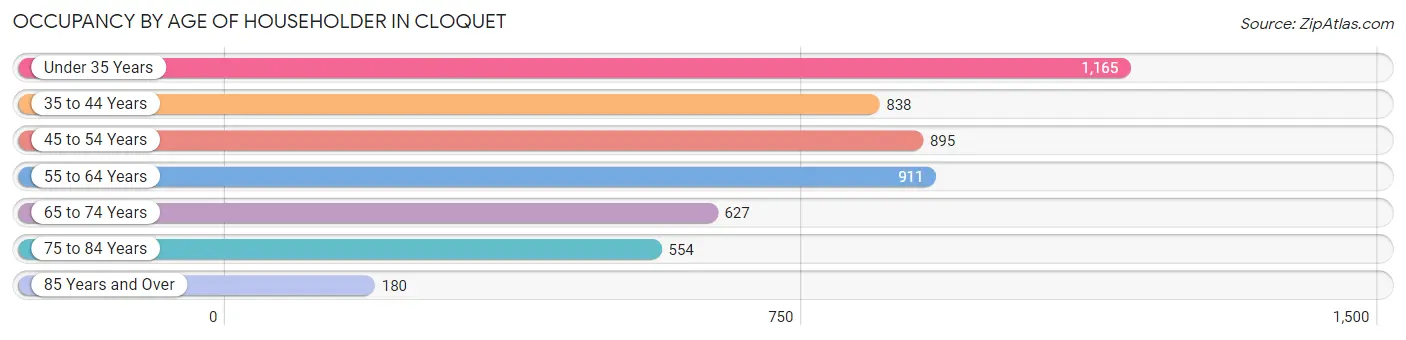
| Age Bracket | # Households | % Households |
| Under 35 Years | 1,165 | 22.5% |
| 35 to 44 Years | 838 | 16.2% |
| 45 to 54 Years | 895 | 17.3% |
| 55 to 64 Years | 911 | 17.6% |
| 65 to 74 Years | 627 | 12.1% |
| 75 to 84 Years | 554 | 10.7% |
| 85 Years and Over | 180 | 3.5% |
| Total | 5,170 | 100.0% |
Housing Finances in Cloquet
Median Income by Occupancy in Cloquet
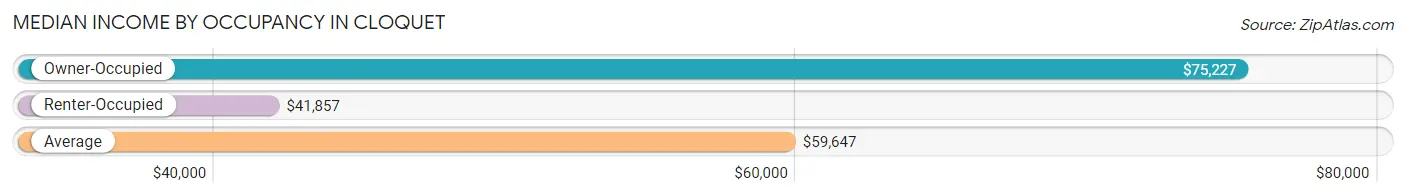
| Occupancy Type | # Households | Median Income |
| Owner-Occupied | 3,454 (66.8%) | $75,227 |
| Renter-Occupied | 1,716 (33.2%) | $41,857 |
| Average | 5,170 (100.0%) | $59,647 |
Occupancy by Householder Income Bracket in Cloquet
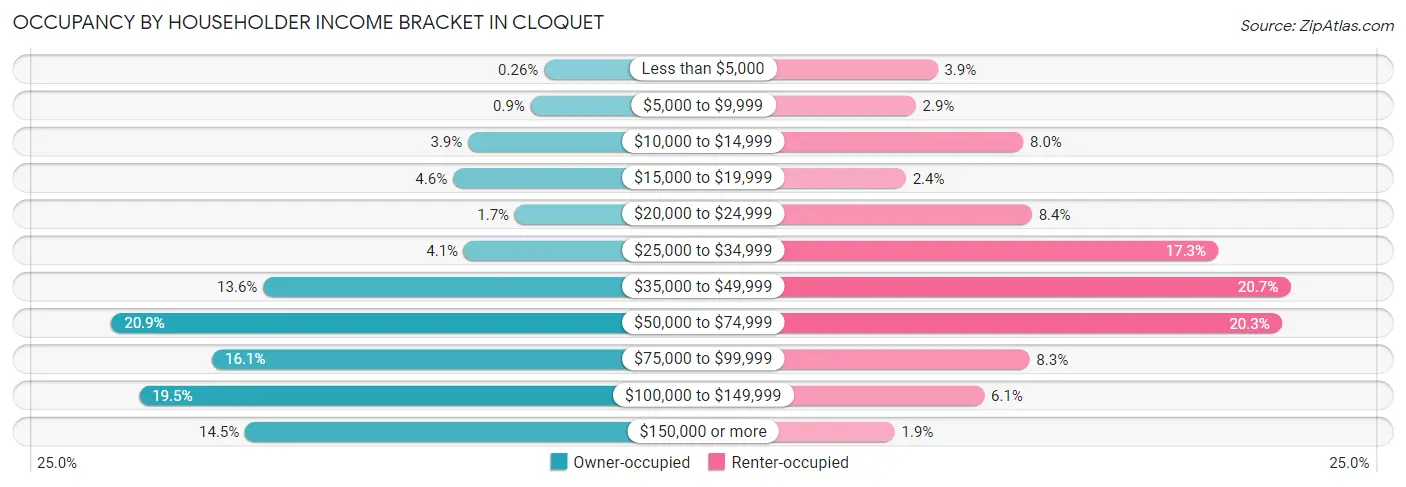
| Income Bracket | Owner-occupied | Renter-occupied |
| Less than $5,000 | 9 (0.3%) | 67 (3.9%) |
| $5,000 to $9,999 | 31 (0.9%) | 49 (2.9%) |
| $10,000 to $14,999 | 134 (3.9%) | 137 (8.0%) |
| $15,000 to $19,999 | 159 (4.6%) | 41 (2.4%) |
| $20,000 to $24,999 | 57 (1.7%) | 144 (8.4%) |
| $25,000 to $34,999 | 141 (4.1%) | 296 (17.2%) |
| $35,000 to $49,999 | 471 (13.6%) | 355 (20.7%) |
| $50,000 to $74,999 | 721 (20.9%) | 348 (20.3%) |
| $75,000 to $99,999 | 555 (16.1%) | 142 (8.3%) |
| $100,000 to $149,999 | 675 (19.5%) | 105 (6.1%) |
| $150,000 or more | 501 (14.5%) | 32 (1.9%) |
| Total | 3,454 (100.0%) | 1,716 (100.0%) |
Monthly Housing Cost Tiers in Cloquet
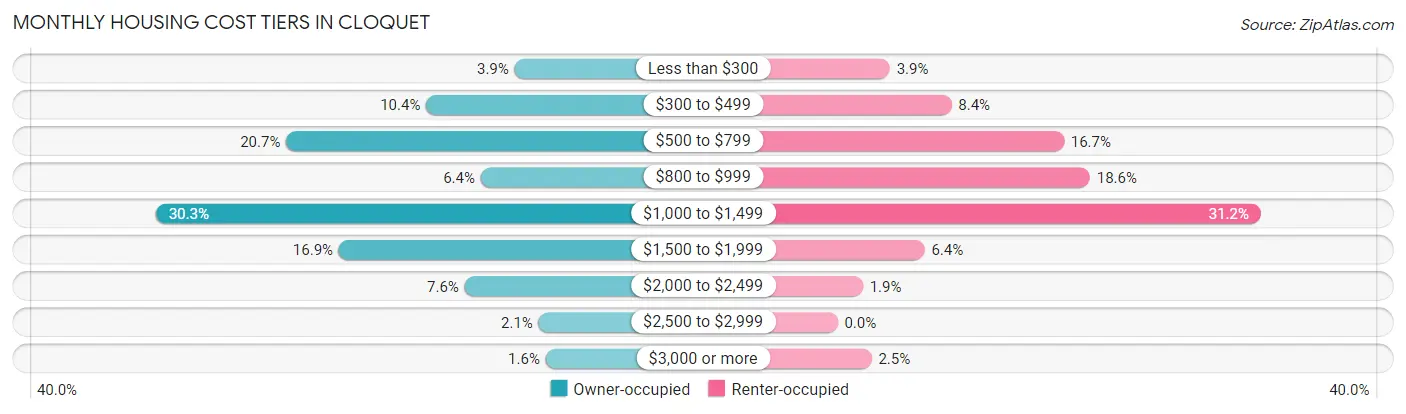
| Monthly Cost | Owner-occupied | Renter-occupied |
| Less than $300 | 135 (3.9%) | 66 (3.8%) |
| $300 to $499 | 360 (10.4%) | 144 (8.4%) |
| $500 to $799 | 716 (20.7%) | 286 (16.7%) |
| $800 to $999 | 221 (6.4%) | 319 (18.6%) |
| $1,000 to $1,499 | 1,048 (30.3%) | 535 (31.2%) |
| $1,500 to $1,999 | 582 (16.9%) | 110 (6.4%) |
| $2,000 to $2,499 | 262 (7.6%) | 32 (1.9%) |
| $2,500 to $2,999 | 74 (2.1%) | 0 (0.0%) |
| $3,000 or more | 56 (1.6%) | 43 (2.5%) |
| Total | 3,454 (100.0%) | 1,716 (100.0%) |
Physical Housing Characteristics in Cloquet
Housing Structures in Cloquet
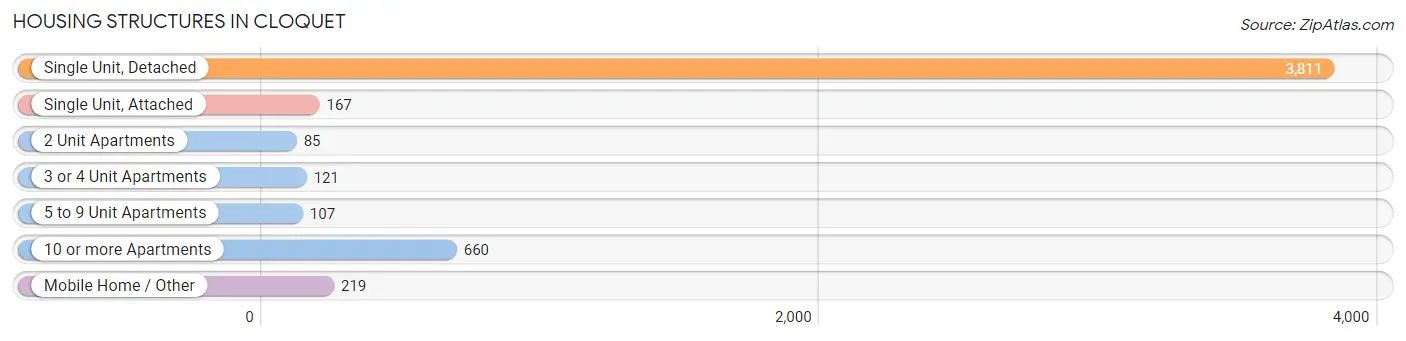
| Structure Type | # Housing Units | % Housing Units |
| Single Unit, Detached | 3,811 | 73.7% |
| Single Unit, Attached | 167 | 3.2% |
| 2 Unit Apartments | 85 | 1.6% |
| 3 or 4 Unit Apartments | 121 | 2.3% |
| 5 to 9 Unit Apartments | 107 | 2.1% |
| 10 or more Apartments | 660 | 12.8% |
| Mobile Home / Other | 219 | 4.2% |
| Total | 5,170 | 100.0% |
Housing Structures by Occupancy in Cloquet
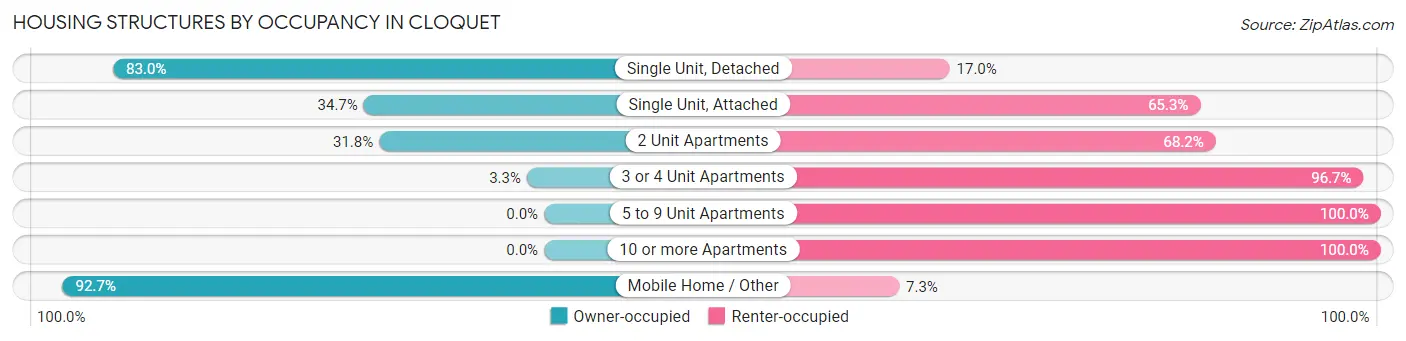
| Structure Type | Owner-occupied | Renter-occupied |
| Single Unit, Detached | 3,162 (83.0%) | 649 (17.0%) |
| Single Unit, Attached | 58 (34.7%) | 109 (65.3%) |
| 2 Unit Apartments | 27 (31.8%) | 58 (68.2%) |
| 3 or 4 Unit Apartments | 4 (3.3%) | 117 (96.7%) |
| 5 to 9 Unit Apartments | 0 (0.0%) | 107 (100.0%) |
| 10 or more Apartments | 0 (0.0%) | 660 (100.0%) |
| Mobile Home / Other | 203 (92.7%) | 16 (7.3%) |
| Total | 3,454 (66.8%) | 1,716 (33.2%) |
Housing Structures by Number of Rooms in Cloquet
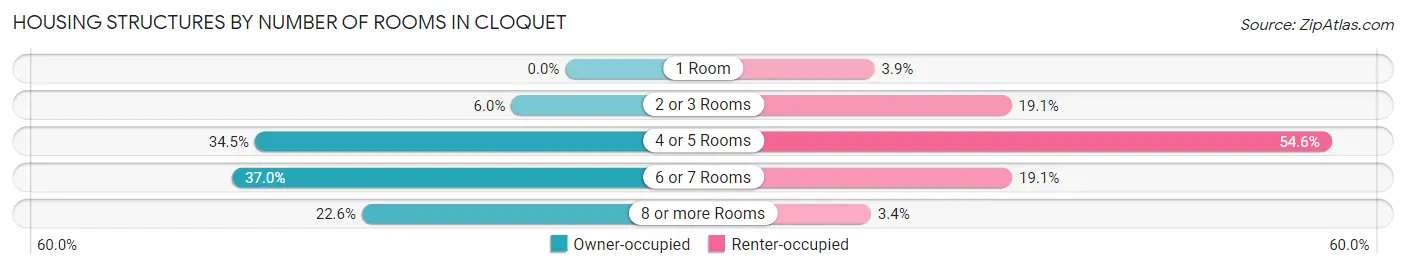
| Number of Rooms | Owner-occupied | Renter-occupied |
| 1 Room | 0 (0.0%) | 66 (3.8%) |
| 2 or 3 Rooms | 207 (6.0%) | 327 (19.1%) |
| 4 or 5 Rooms | 1,190 (34.4%) | 936 (54.5%) |
| 6 or 7 Rooms | 1,277 (37.0%) | 328 (19.1%) |
| 8 or more Rooms | 780 (22.6%) | 59 (3.4%) |
| Total | 3,454 (100.0%) | 1,716 (100.0%) |
Housing Structure by Heating Type in Cloquet
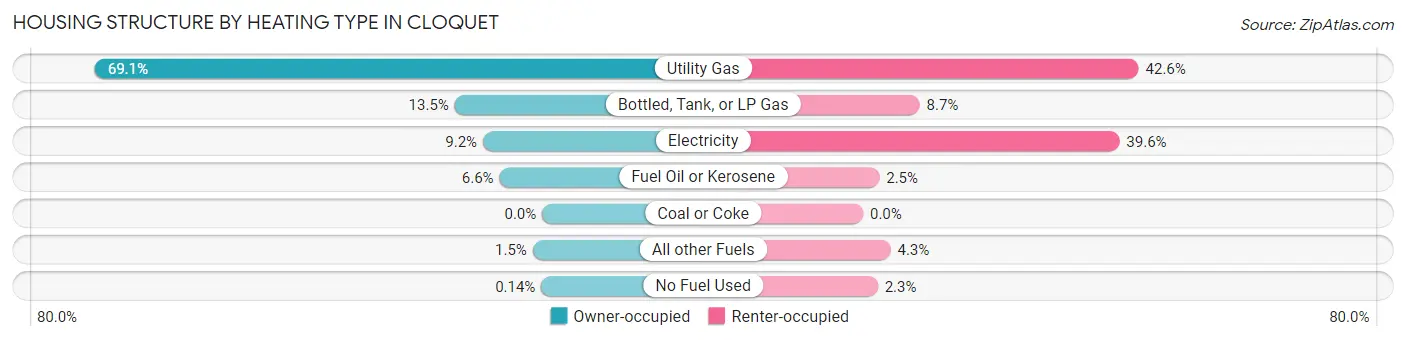
| Heating Type | Owner-occupied | Renter-occupied |
| Utility Gas | 2,388 (69.1%) | 731 (42.6%) |
| Bottled, Tank, or LP Gas | 467 (13.5%) | 150 (8.7%) |
| Electricity | 316 (9.1%) | 680 (39.6%) |
| Fuel Oil or Kerosene | 228 (6.6%) | 43 (2.5%) |
| Coal or Coke | 0 (0.0%) | 0 (0.0%) |
| All other Fuels | 50 (1.5%) | 73 (4.3%) |
| No Fuel Used | 5 (0.1%) | 39 (2.3%) |
| Total | 3,454 (100.0%) | 1,716 (100.0%) |
Household Vehicle Usage in Cloquet
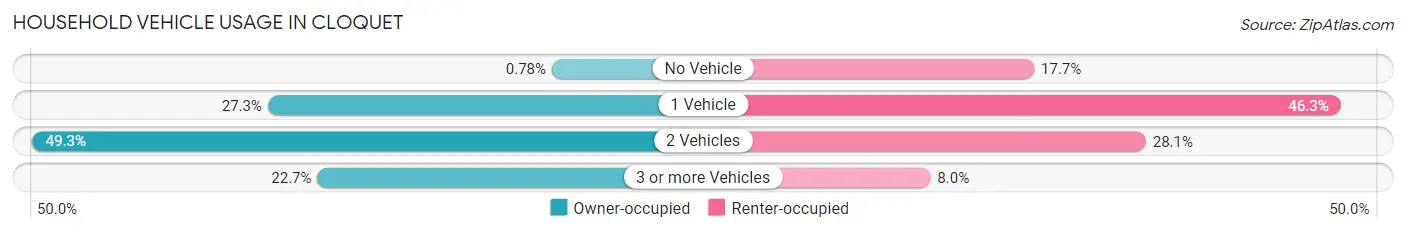
| Vehicles per Household | Owner-occupied | Renter-occupied |
| No Vehicle | 27 (0.8%) | 303 (17.7%) |
| 1 Vehicle | 943 (27.3%) | 794 (46.3%) |
| 2 Vehicles | 1,701 (49.2%) | 482 (28.1%) |
| 3 or more Vehicles | 783 (22.7%) | 137 (8.0%) |
| Total | 3,454 (100.0%) | 1,716 (100.0%) |
Real Estate & Mortgages in Cloquet
Real Estate and Mortgage Overview in Cloquet
| Characteristic | Without Mortgage | With Mortgage |
| Housing Units | 1,285 | 2,169 |
| Median Property Value | $169,800 | $190,600 |
| Median Household Income | $58,154 | $400 |
| Monthly Housing Costs | $578 | $51 |
| Real Estate Taxes | $2,453 | $57 |
Property Value by Mortgage Status in Cloquet
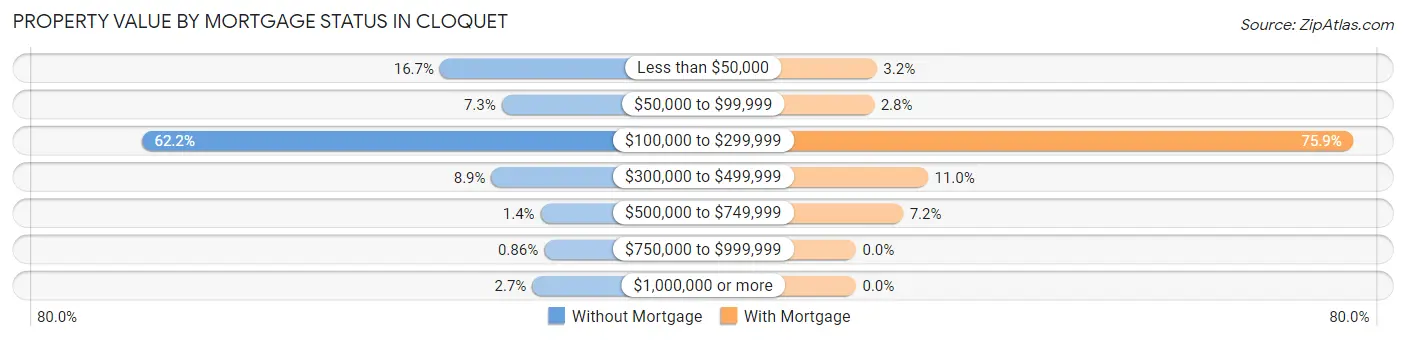
| Property Value | Without Mortgage | With Mortgage |
| Less than $50,000 | 215 (16.7%) | 69 (3.2%) |
| $50,000 to $99,999 | 94 (7.3%) | 60 (2.8%) |
| $100,000 to $299,999 | 799 (62.2%) | 1,646 (75.9%) |
| $300,000 to $499,999 | 114 (8.9%) | 238 (11.0%) |
| $500,000 to $749,999 | 18 (1.4%) | 156 (7.2%) |
| $750,000 to $999,999 | 11 (0.9%) | 0 (0.0%) |
| $1,000,000 or more | 34 (2.6%) | 0 (0.0%) |
| Total | 1,285 (100.0%) | 2,169 (100.0%) |
Household Income by Mortgage Status in Cloquet
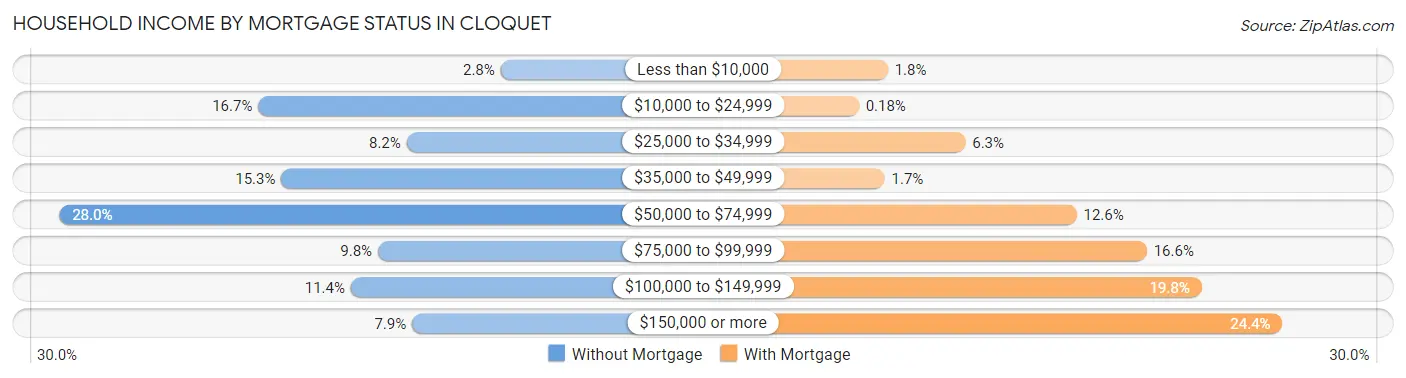
| Household Income | Without Mortgage | With Mortgage |
| Less than $10,000 | 36 (2.8%) | 40 (1.8%) |
| $10,000 to $24,999 | 214 (16.7%) | 4 (0.2%) |
| $25,000 to $34,999 | 105 (8.2%) | 136 (6.3%) |
| $35,000 to $49,999 | 197 (15.3%) | 36 (1.7%) |
| $50,000 to $74,999 | 360 (28.0%) | 274 (12.6%) |
| $75,000 to $99,999 | 126 (9.8%) | 361 (16.6%) |
| $100,000 to $149,999 | 146 (11.4%) | 429 (19.8%) |
| $150,000 or more | 101 (7.9%) | 529 (24.4%) |
| Total | 1,285 (100.0%) | 2,169 (100.0%) |
Property Value to Household Income Ratio in Cloquet
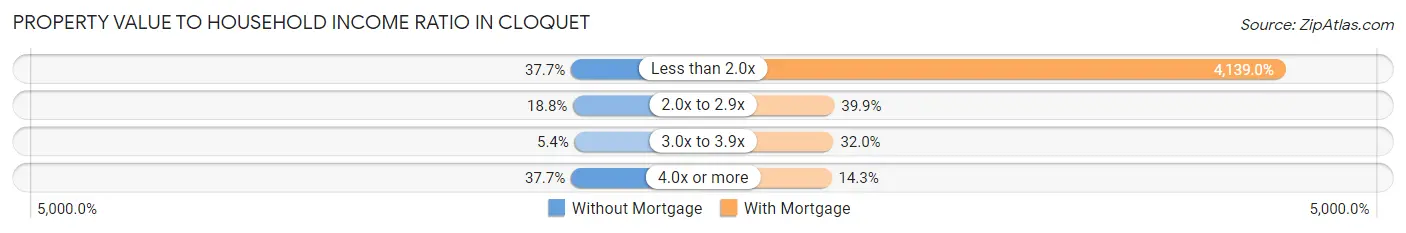
| Value-to-Income Ratio | Without Mortgage | With Mortgage |
| Less than 2.0x | 484 (37.7%) | 89,775 (4,139.0%) |
| 2.0x to 2.9x | 242 (18.8%) | 865 (39.9%) |
| 3.0x to 3.9x | 69 (5.4%) | 695 (32.0%) |
| 4.0x or more | 485 (37.7%) | 310 (14.3%) |
| Total | 1,285 (100.0%) | 2,169 (100.0%) |
Real Estate Taxes by Mortgage Status in Cloquet
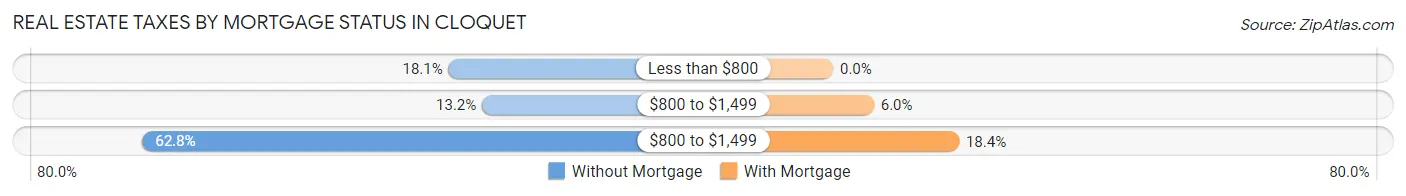
| Property Taxes | Without Mortgage | With Mortgage |
| Less than $800 | 232 (18.0%) | 0 (0.0%) |
| $800 to $1,499 | 169 (13.2%) | 129 (5.9%) |
| $800 to $1,499 | 807 (62.8%) | 399 (18.4%) |
| Total | 1,285 (100.0%) | 2,169 (100.0%) |
Health & Disability in Cloquet
Health Insurance Coverage by Age in Cloquet
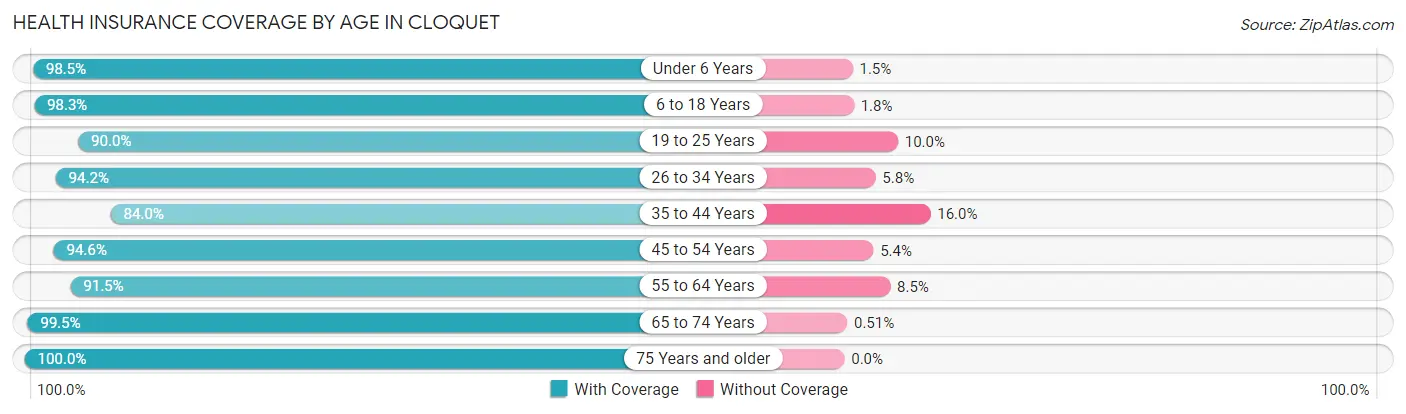
| Age Bracket | With Coverage | Without Coverage |
| Under 6 Years | 893 (98.5%) | 14 (1.5%) |
| 6 to 18 Years | 2,414 (98.3%) | 43 (1.8%) |
| 19 to 25 Years | 1,182 (90.0%) | 131 (10.0%) |
| 26 to 34 Years | 1,398 (94.2%) | 86 (5.8%) |
| 35 to 44 Years | 1,303 (84.0%) | 249 (16.0%) |
| 45 to 54 Years | 1,296 (94.6%) | 74 (5.4%) |
| 55 to 64 Years | 1,263 (91.5%) | 118 (8.5%) |
| 65 to 74 Years | 976 (99.5%) | 5 (0.5%) |
| 75 Years and older | 992 (100.0%) | 0 (0.0%) |
| Total | 11,717 (94.2%) | 720 (5.8%) |
Health Insurance Coverage by Citizenship Status in Cloquet
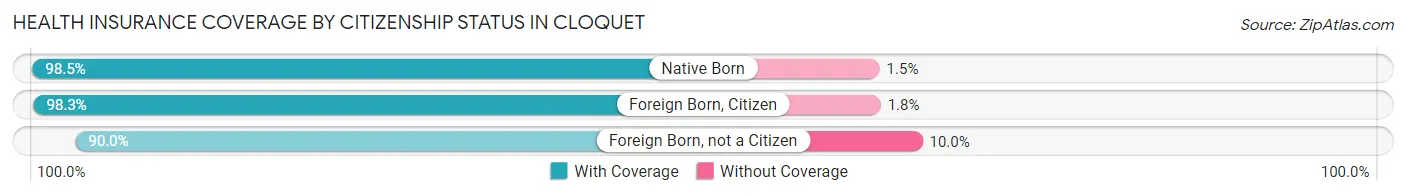
| Citizenship Status | With Coverage | Without Coverage |
| Native Born | 893 (98.5%) | 14 (1.5%) |
| Foreign Born, Citizen | 2,414 (98.3%) | 43 (1.8%) |
| Foreign Born, not a Citizen | 1,182 (90.0%) | 131 (10.0%) |
Health Insurance Coverage by Household Income in Cloquet
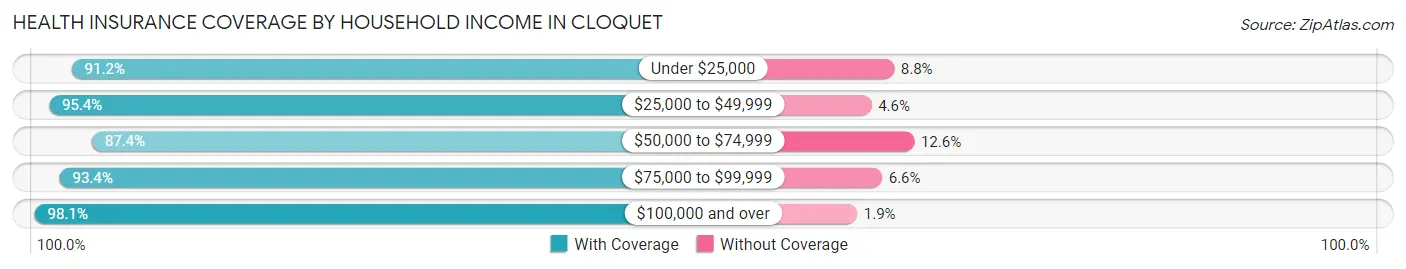
| Household Income | With Coverage | Without Coverage |
| Under $25,000 | 1,375 (91.2%) | 133 (8.8%) |
| $25,000 to $49,999 | 2,422 (95.4%) | 116 (4.6%) |
| $50,000 to $74,999 | 1,735 (87.4%) | 250 (12.6%) |
| $75,000 to $99,999 | 1,836 (93.4%) | 129 (6.6%) |
| $100,000 and over | 4,156 (98.1%) | 80 (1.9%) |
Public vs Private Health Insurance Coverage by Age in Cloquet
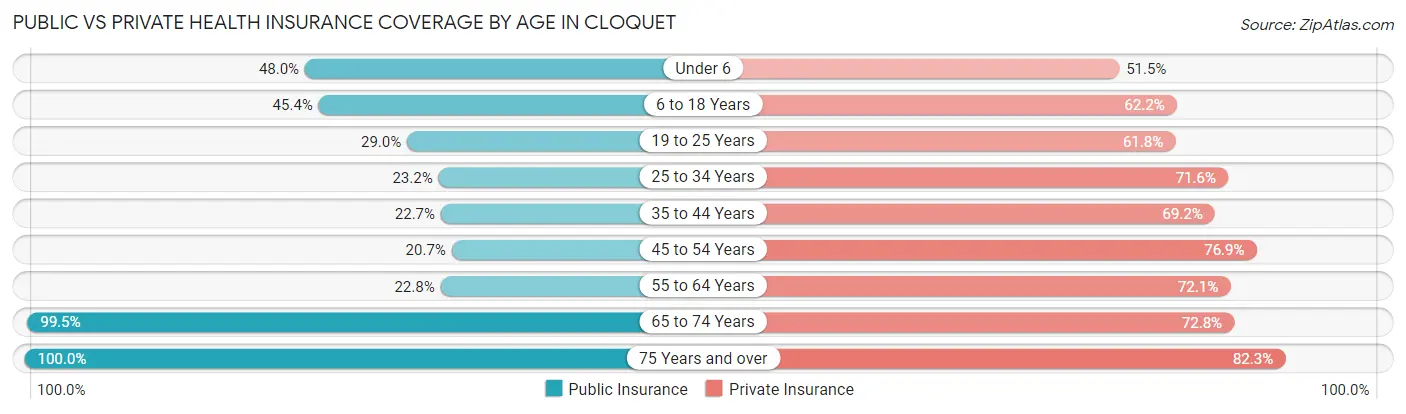
| Age Bracket | Public Insurance | Private Insurance |
| Under 6 | 435 (48.0%) | 467 (51.5%) |
| 6 to 18 Years | 1,116 (45.4%) | 1,527 (62.2%) |
| 19 to 25 Years | 381 (29.0%) | 812 (61.8%) |
| 25 to 34 Years | 344 (23.2%) | 1,063 (71.6%) |
| 35 to 44 Years | 353 (22.7%) | 1,074 (69.2%) |
| 45 to 54 Years | 284 (20.7%) | 1,054 (76.9%) |
| 55 to 64 Years | 315 (22.8%) | 995 (72.1%) |
| 65 to 74 Years | 976 (99.5%) | 714 (72.8%) |
| 75 Years and over | 992 (100.0%) | 816 (82.3%) |
| Total | 5,196 (41.8%) | 8,522 (68.5%) |
Disability Status by Sex by Age in Cloquet
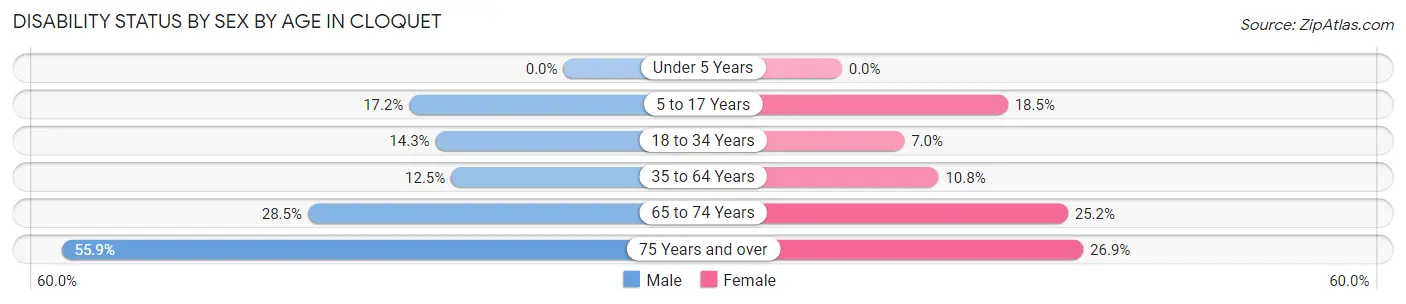
| Age Bracket | Male | Female |
| Under 5 Years | 0 (0.0%) | 0 (0.0%) |
| 5 to 17 Years | 192 (17.2%) | 241 (18.5%) |
| 18 to 34 Years | 225 (14.2%) | 102 (7.0%) |
| 35 to 64 Years | 250 (12.5%) | 248 (10.8%) |
| 65 to 74 Years | 113 (28.5%) | 147 (25.2%) |
| 75 Years and over | 228 (55.9%) | 157 (26.9%) |
Disability Class by Sex by Age in Cloquet
Disability Class: Hearing Difficulty
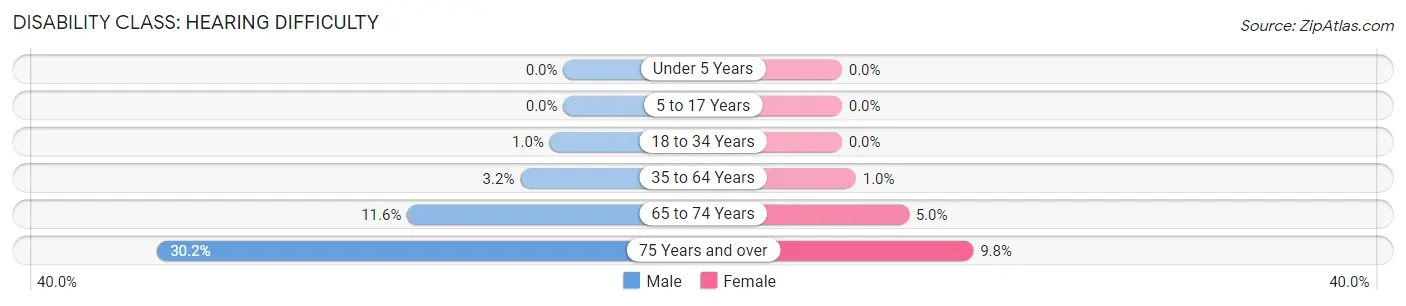
| Age Bracket | Male | Female |
| Under 5 Years | 0 (0.0%) | 0 (0.0%) |
| 5 to 17 Years | 0 (0.0%) | 0 (0.0%) |
| 18 to 34 Years | 16 (1.0%) | 0 (0.0%) |
| 35 to 64 Years | 64 (3.2%) | 24 (1.0%) |
| 65 to 74 Years | 46 (11.6%) | 29 (5.0%) |
| 75 Years and over | 123 (30.1%) | 57 (9.8%) |
Disability Class: Vision Difficulty
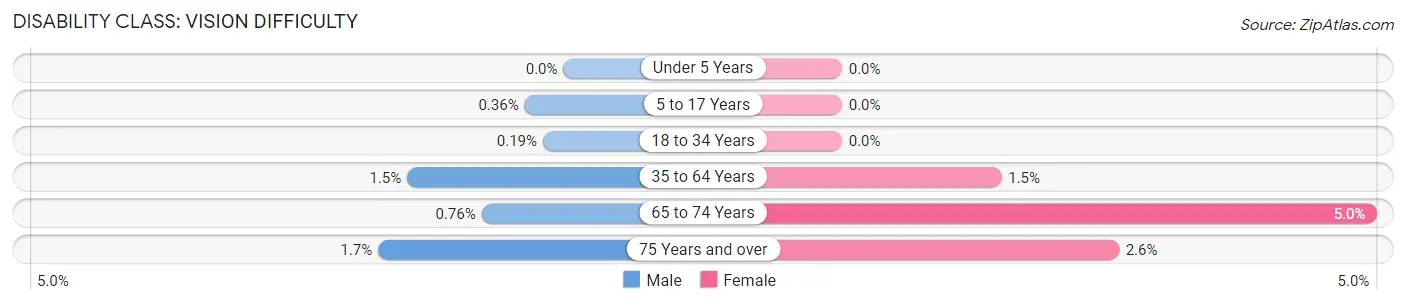
| Age Bracket | Male | Female |
| Under 5 Years | 0 (0.0%) | 0 (0.0%) |
| 5 to 17 Years | 4 (0.4%) | 0 (0.0%) |
| 18 to 34 Years | 3 (0.2%) | 0 (0.0%) |
| 35 to 64 Years | 29 (1.5%) | 34 (1.5%) |
| 65 to 74 Years | 3 (0.8%) | 29 (5.0%) |
| 75 Years and over | 7 (1.7%) | 15 (2.6%) |
Disability Class: Cognitive Difficulty
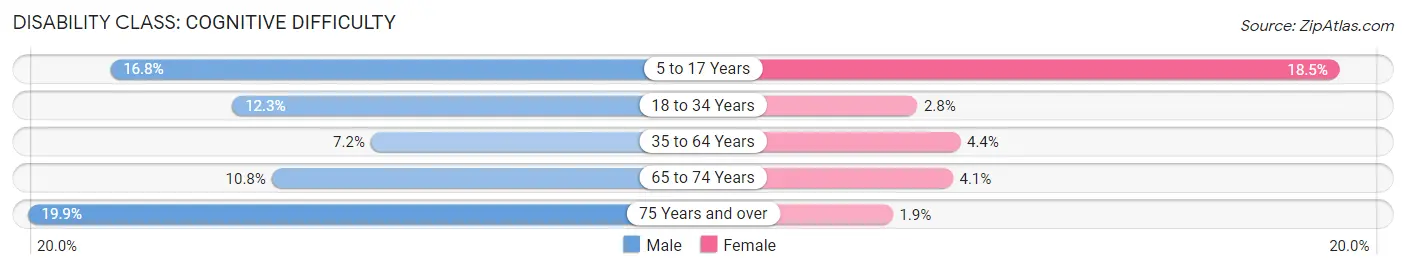
| Age Bracket | Male | Female |
| 5 to 17 Years | 188 (16.8%) | 241 (18.5%) |
| 18 to 34 Years | 194 (12.3%) | 41 (2.8%) |
| 35 to 64 Years | 143 (7.1%) | 101 (4.4%) |
| 65 to 74 Years | 43 (10.8%) | 24 (4.1%) |
| 75 Years and over | 81 (19.9%) | 11 (1.9%) |
Disability Class: Ambulatory Difficulty
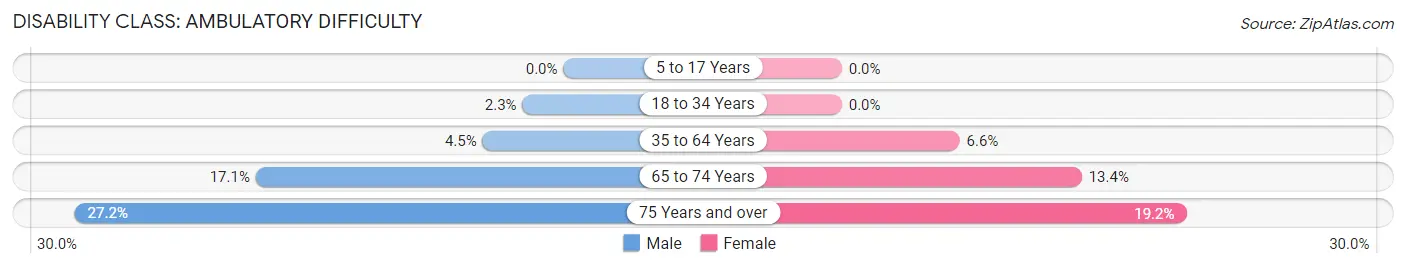
| Age Bracket | Male | Female |
| 5 to 17 Years | 0 (0.0%) | 0 (0.0%) |
| 18 to 34 Years | 36 (2.3%) | 0 (0.0%) |
| 35 to 64 Years | 90 (4.5%) | 151 (6.6%) |
| 65 to 74 Years | 68 (17.1%) | 78 (13.4%) |
| 75 Years and over | 111 (27.2%) | 112 (19.2%) |
Disability Class: Self-Care Difficulty
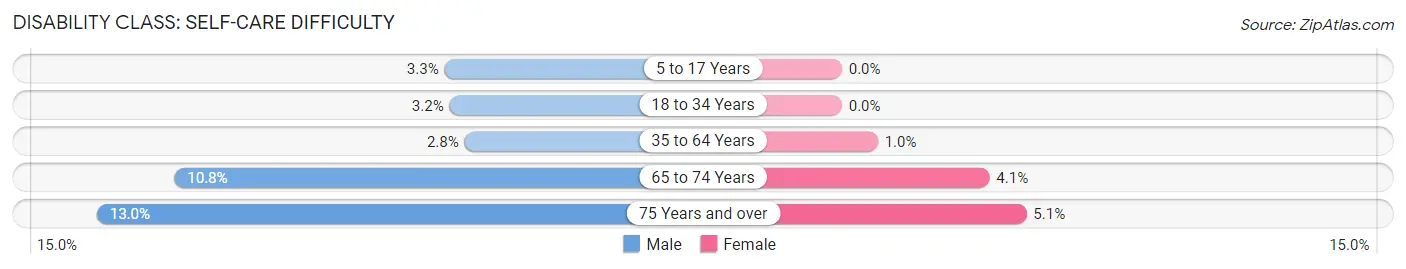
| Age Bracket | Male | Female |
| 5 to 17 Years | 37 (3.3%) | 0 (0.0%) |
| 18 to 34 Years | 50 (3.2%) | 0 (0.0%) |
| 35 to 64 Years | 55 (2.8%) | 23 (1.0%) |
| 65 to 74 Years | 43 (10.8%) | 24 (4.1%) |
| 75 Years and over | 53 (13.0%) | 30 (5.1%) |
Technology Access in Cloquet
Computing Device Access in Cloquet
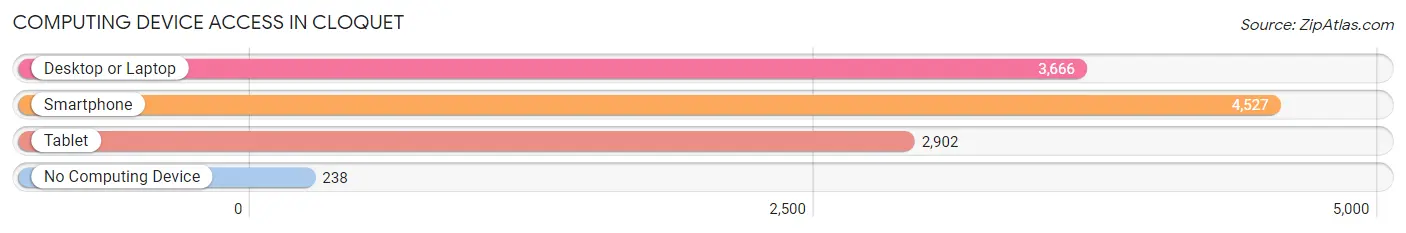
| Device Type | # Households | % Households |
| Desktop or Laptop | 3,666 | 70.9% |
| Smartphone | 4,527 | 87.6% |
| Tablet | 2,902 | 56.1% |
| No Computing Device | 238 | 4.6% |
| Total | 5,170 | 100.0% |
Internet Access in Cloquet
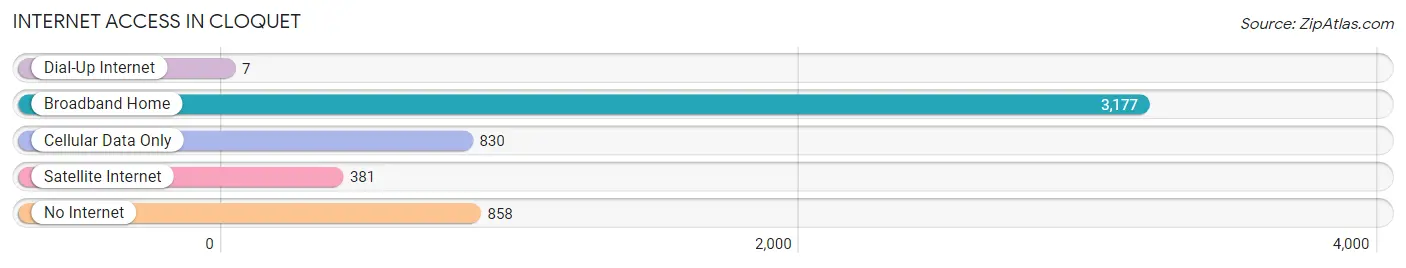
| Internet Type | # Households | % Households |
| Dial-Up Internet | 7 | 0.1% |
| Broadband Home | 3,177 | 61.5% |
| Cellular Data Only | 830 | 16.1% |
| Satellite Internet | 381 | 7.4% |
| No Internet | 858 | 16.6% |
| Total | 5,170 | 100.0% |
Cloquet Summary
Cloquet, Minnesota is a city located in Carlton County, in the northeastern part of the state. It is situated on the banks of the St. Louis River, and is part of the Twin Ports metropolitan area, which includes Duluth, Minnesota and Superior, Wisconsin. The city has a population of 8,717, according to the 2010 census, and is the county seat of Carlton County.
History
Cloquet was first settled in 1856 by French-Canadian fur traders, who named the area after the French word for “closed”, referring to the area’s dense forests. The city was incorporated in 1876, and was named after the French explorer Pierre-Charles Le Sueur, who explored the area in the late 17th century.
In the late 19th century, the city became a major lumbering center, with several sawmills and lumber companies operating in the area. The city was also home to a large paper mill, which was built in 1887 and operated until the early 2000s.
Geography
Cloquet is located in the northeastern part of Minnesota, in Carlton County. It is situated on the banks of the St. Louis River, and is part of the Twin Ports metropolitan area, which includes Duluth, Minnesota and Superior, Wisconsin. The city has a total area of 8.3 square miles, of which 8.2 square miles is land and 0.1 square miles is water.
The city is located in a transition zone between the northern boreal forest and the southern hardwood forest. The area is characterized by rolling hills, with the highest point in the city being the summit of the St. Louis River Valley, at an elevation of 1,092 feet.
Economy
Cloquet’s economy is largely based on the lumber and paper industries. The city is home to several sawmills and lumber companies, as well as a paper mill. The city is also home to several manufacturing companies, including a plastics manufacturer and a food processing plant.
The city is also home to several retail stores, restaurants, and other businesses. The city is served by the Cloquet Municipal Airport, which offers general aviation services.
Demographics
According to the 2010 census, Cloquet has a population of 8,717. The racial makeup of the city is 87.3% White, 5.2% Native American, 2.2% African American, 0.7% Asian, 0.2% Pacific Islander, and 4.6% from other races. The median household income is $37,945, and the median family income is $45,945. The per capita income is $20,845.
The city has a large Native American population, with the Fond du Lac Band of Lake Superior Chippewa having a reservation in the city. The city also has a large Finnish-American population, with many of the city’s residents having Finnish ancestry.
Conclusion
Cloquet, Minnesota is a city located in Carlton County, in the northeastern part of the state. It is situated on the banks of the St. Louis River, and is part of the Twin Ports metropolitan area, which includes Duluth, Minnesota and Superior, Wisconsin. The city has a population of 8,717, according to the 2010 census, and is the county seat of Carlton County. The city’s economy is largely based on the lumber and paper industries, and it is also home to several manufacturing companies, retail stores, restaurants, and other businesses. The city has a large Native American population, with the Fond du Lac Band of Lake Superior Chippewa having a reservation in the city, and a large Finnish-American population.
Common Questions
What is Per Capita Income in Cloquet?
Per Capita income in Cloquet is $34,514.
What is the Median Family Income in Cloquet?
Median Family Income in Cloquet is $76,995.
What is the Median Household income in Cloquet?
Median Household Income in Cloquet is $59,647.
What is Income or Wage Gap in Cloquet?
Income or Wage Gap in Cloquet is 29.4%.
Women in Cloquet earn 70.6 cents for every dollar earned by a man.
What is Family Income Deficit in Cloquet?
Family Income Deficit in Cloquet is $9,302.
Families that are below poverty line in Cloquet earn $9,302 less on average than the poverty threshold level.
What is Inequality or Gini Index in Cloquet?
Inequality or Gini Index in Cloquet is 0.43.
What is the Total Population of Cloquet?
Total Population of Cloquet is 12,559.
What is the Total Male Population of Cloquet?
Total Male Population of Cloquet is 5,879.
What is the Total Female Population of Cloquet?
Total Female Population of Cloquet is 6,680.
What is the Ratio of Males per 100 Females in Cloquet?
There are 88.01 Males per 100 Females in Cloquet.
What is the Ratio of Females per 100 Males in Cloquet?
There are 113.62 Females per 100 Males in Cloquet.
What is the Median Population Age in Cloquet?
Median Population Age in Cloquet is 35.5 Years.
What is the Average Family Size in Cloquet
Average Family Size in Cloquet is 3.0 People.
What is the Average Household Size in Cloquet
Average Household Size in Cloquet is 2.4 People.
How Large is the Labor Force in Cloquet?
There are 6,420 People in the Labor Forcein in Cloquet.
What is the Percentage of People in the Labor Force in Cloquet?
65.7% of People are in the Labor Force in Cloquet.
What is the Unemployment Rate in Cloquet?
Unemployment Rate in Cloquet is 4.9%.