Minnetonka, MN Map & Demographics
Minnetonka Map
Minnetonka Overview
$69,529
PER CAPITA INCOME
$151,779
AVG FAMILY INCOME
$114,867
AVG HOUSEHOLD INCOME
34.3%
WAGE / INCOME GAP [ % ]
65.7¢/ $1
WAGE / INCOME GAP [ $ ]
$7,232
FAMILY INCOME DEFICIT
0.46
INEQUALITY / GINI INDEX
53,529
TOTAL POPULATION
26,558
MALE POPULATION
26,971
FEMALE POPULATION
98.47
MALES / 100 FEMALES
101.56
FEMALES / 100 MALES
42.5
MEDIAN AGE
2.9
AVG FAMILY SIZE
2.3
AVG HOUSEHOLD SIZE
30,467
LABOR FORCE [ PEOPLE ]
69.9%
PERCENT IN LABOR FORCE
2.5%
UNEMPLOYMENT RATE
Minnetonka Zip Codes
Income in Minnetonka
Income Overview in Minnetonka
Per Capita Income in Minnetonka is $69,529, while median incomes of families and households are $151,779 and $114,867 respectively.
| Characteristic | Number | Measure |
| Per Capita Income | 53,529 | $69,529 |
| Median Family Income | 14,325 | $151,779 |
| Mean Family Income | 14,325 | $193,984 |
| Median Household Income | 23,402 | $114,867 |
| Mean Household Income | 23,402 | $155,963 |
| Income Deficit | 14,325 | $7,232 |
| Wage / Income Gap (%) | 53,529 | 34.34% |
| Wage / Income Gap ($) | 53,529 | 65.66¢ per $1 |
| Gini / Inequality Index | 53,529 | 0.46 |
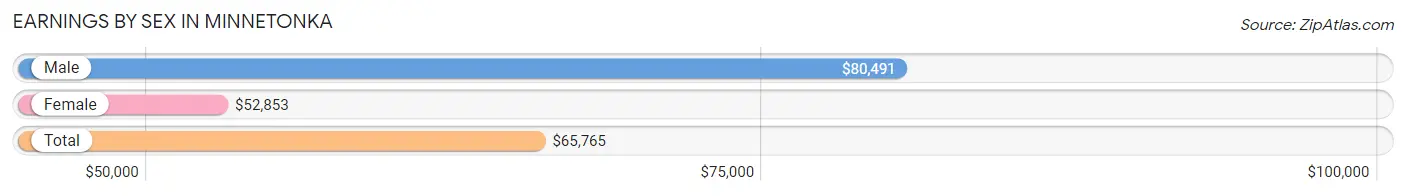
Earnings by Sex in Minnetonka
Average Earnings in Minnetonka are $65,765, $80,491 for men and $52,853 for women, a difference of 34.3%.
| Sex | Number | Average Earnings |
| Male | 16,891 (52.2%) | $80,491 |
| Female | 15,435 (47.7%) | $52,853 |
| Total | 32,326 (100.0%) | $65,765 |
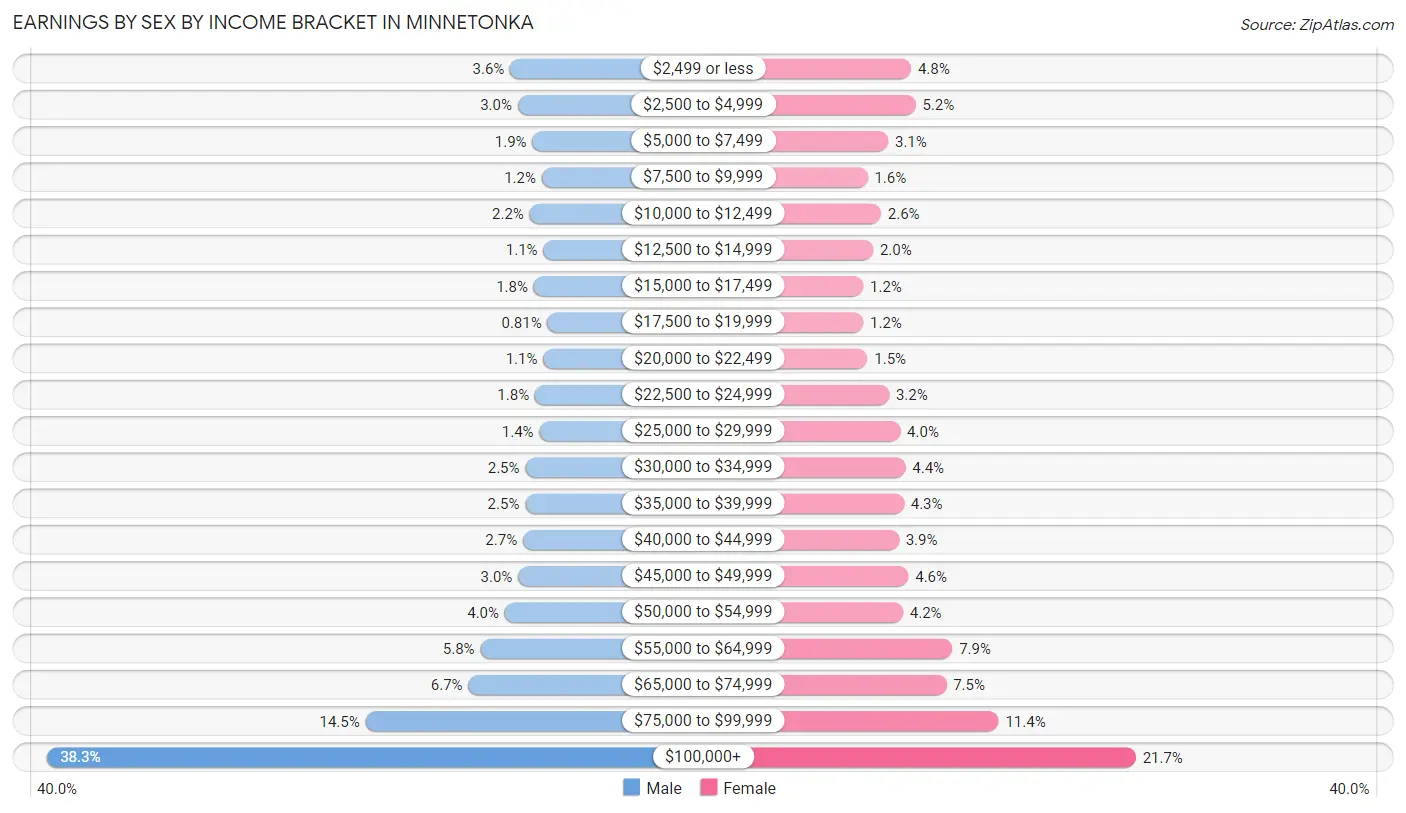
Earnings by Sex by Income Bracket in Minnetonka
The most common earnings brackets in Minnetonka are $100,000+ for men (6,470 | 38.3%) and $100,000+ for women (3,341 | 21.6%).
| Income | Male | Female |
| $2,499 or less | 609 (3.6%) | 743 (4.8%) |
| $2,500 to $4,999 | 514 (3.0%) | 795 (5.1%) |
| $5,000 to $7,499 | 327 (1.9%) | 477 (3.1%) |
| $7,500 to $9,999 | 209 (1.2%) | 240 (1.5%) |
| $10,000 to $12,499 | 363 (2.1%) | 394 (2.5%) |
| $12,500 to $14,999 | 190 (1.1%) | 303 (2.0%) |
| $15,000 to $17,499 | 311 (1.8%) | 188 (1.2%) |
| $17,500 to $19,999 | 137 (0.8%) | 189 (1.2%) |
| $20,000 to $22,499 | 191 (1.1%) | 238 (1.5%) |
| $22,500 to $24,999 | 296 (1.8%) | 488 (3.2%) |
| $25,000 to $29,999 | 240 (1.4%) | 618 (4.0%) |
| $30,000 to $34,999 | 418 (2.5%) | 678 (4.4%) |
| $35,000 to $39,999 | 419 (2.5%) | 659 (4.3%) |
| $40,000 to $44,999 | 448 (2.6%) | 600 (3.9%) |
| $45,000 to $49,999 | 508 (3.0%) | 711 (4.6%) |
| $50,000 to $54,999 | 677 (4.0%) | 649 (4.2%) |
| $55,000 to $64,999 | 986 (5.8%) | 1,219 (7.9%) |
| $65,000 to $74,999 | 1,138 (6.7%) | 1,150 (7.4%) |
| $75,000 to $99,999 | 2,440 (14.4%) | 1,755 (11.4%) |
| $100,000+ | 6,470 (38.3%) | 3,341 (21.6%) |
| Total | 16,891 (100.0%) | 15,435 (100.0%) |
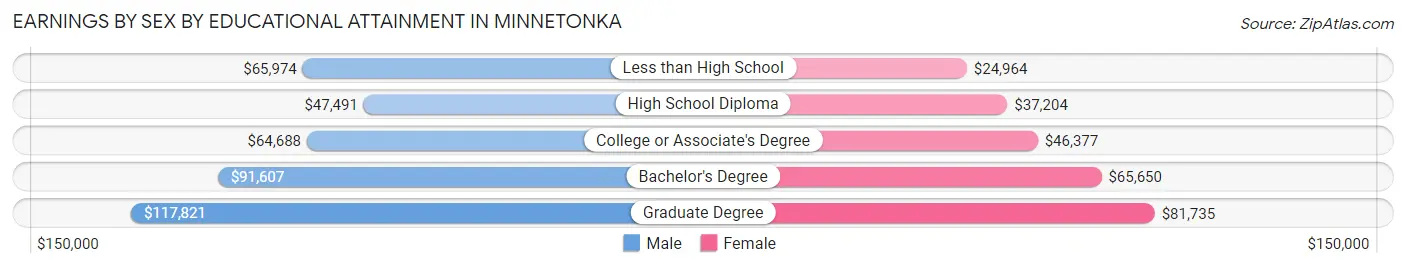
Earnings by Sex by Educational Attainment in Minnetonka
Average earnings in Minnetonka are $88,207 for men and $57,386 for women, a difference of 34.9%. Men with an educational attainment of graduate degree enjoy the highest average annual earnings of $117,821, while those with high school diploma education earn the least with $47,491. Women with an educational attainment of graduate degree earn the most with the average annual earnings of $81,735, while those with less than high school education have the smallest earnings of $24,964.
| Educational Attainment | Male Income | Female Income |
| Less than High School | $65,974 | $24,964 |
| High School Diploma | $47,491 | $37,204 |
| College or Associate's Degree | $64,688 | $46,377 |
| Bachelor's Degree | $91,607 | $65,650 |
| Graduate Degree | $117,821 | $81,735 |
| Total | $88,207 | $57,386 |
Family Income in Minnetonka
Family Income Brackets in Minnetonka
According to the Minnetonka family income data, there are 4,641 families falling into the $200,000+ income range, which is the most common income bracket and makes up 32.4% of all families. Conversely, the less than $10,000 income bracket is the least frequent group with only 72 families (0.5%) belonging to this category.
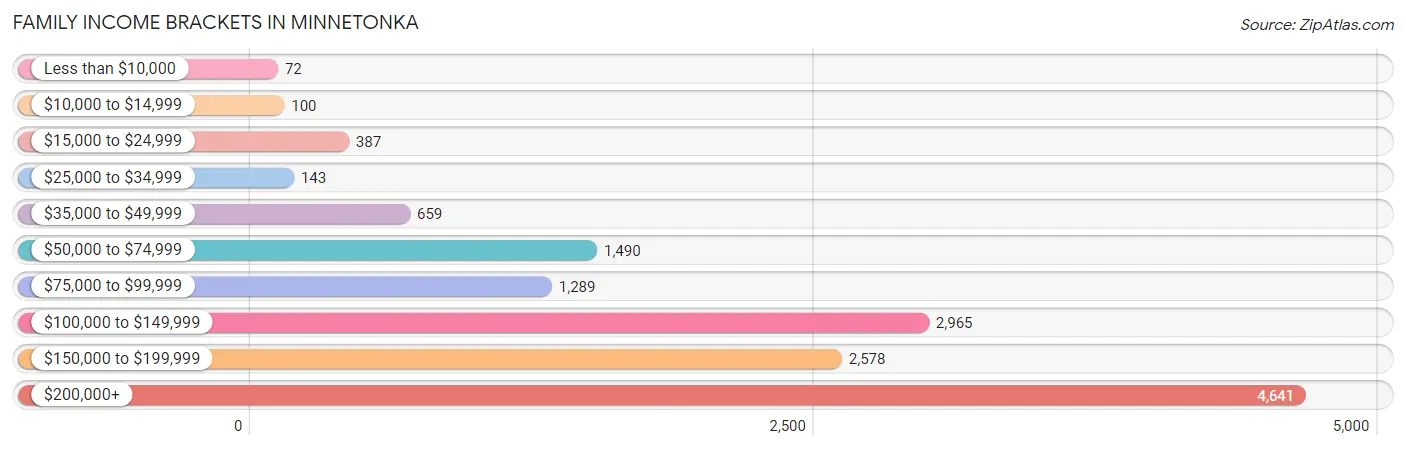
| Income Bracket | # Families | % Families |
| Less than $10,000 | 72 | 0.5% |
| $10,000 to $14,999 | 100 | 0.7% |
| $15,000 to $24,999 | 387 | 2.7% |
| $25,000 to $34,999 | 143 | 1.0% |
| $35,000 to $49,999 | 659 | 4.6% |
| $50,000 to $74,999 | 1,490 | 10.4% |
| $75,000 to $99,999 | 1,289 | 9.0% |
| $100,000 to $149,999 | 2,965 | 20.7% |
| $150,000 to $199,999 | 2,578 | 18.0% |
| $200,000+ | 4,641 | 32.4% |
Family Income by Famaliy Size in Minnetonka
7+ person families (43 | 0.3%) account for the highest median family income in Minnetonka with $250,001 per family, while 2-person families (7,562 | 52.8%) have the highest median income of $60,730 per family member.
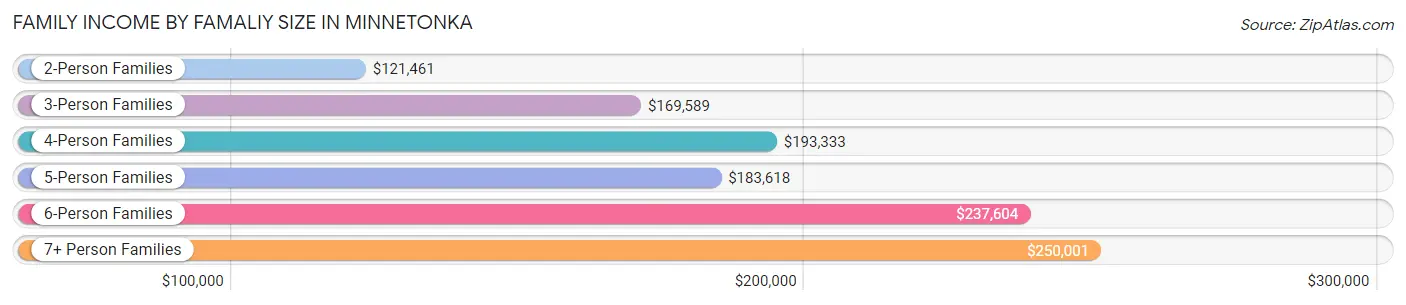
| Income Bracket | # Families | Median Income |
| 2-Person Families | 7,562 (52.8%) | $121,461 |
| 3-Person Families | 2,626 (18.3%) | $169,589 |
| 4-Person Families | 3,008 (21.0%) | $193,333 |
| 5-Person Families | 885 (6.2%) | $183,618 |
| 6-Person Families | 201 (1.4%) | $237,604 |
| 7+ Person Families | 43 (0.3%) | $250,001 |
| Total | 14,325 (100.0%) | $151,779 |
Family Income by Number of Earners in Minnetonka
The median family income in Minnetonka is $151,779, with families comprising 3+ earners (1,506) having the highest median family income of $216,667, while families with no earners (1,667) have the lowest median family income of $90,580, accounting for 10.5% and 11.6% of families, respectively.
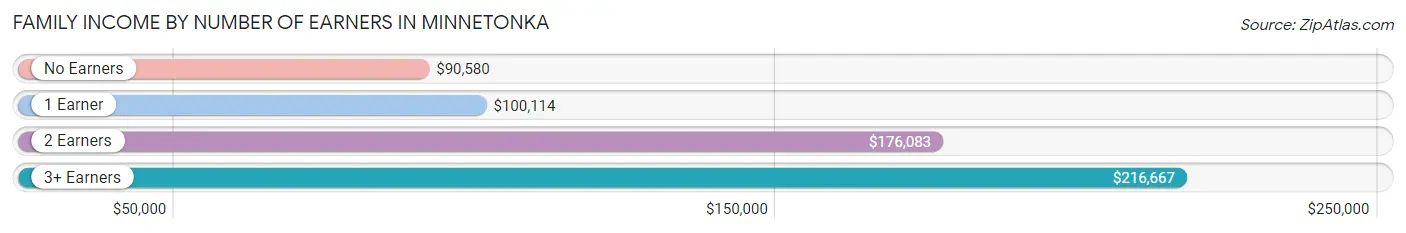
| Number of Earners | # Families | Median Income |
| No Earners | 1,667 (11.6%) | $90,580 |
| 1 Earner | 3,720 (26.0%) | $100,114 |
| 2 Earners | 7,432 (51.9%) | $176,083 |
| 3+ Earners | 1,506 (10.5%) | $216,667 |
| Total | 14,325 (100.0%) | $151,779 |
Household Income in Minnetonka
Household Income Brackets in Minnetonka
With 5,359 households falling in the category, the $200,000+ income range is the most frequent in Minnetonka, accounting for 22.9% of all households. In contrast, only 398 households (1.7%) fall into the $10,000 to $14,999 income bracket, making it the least populous group.
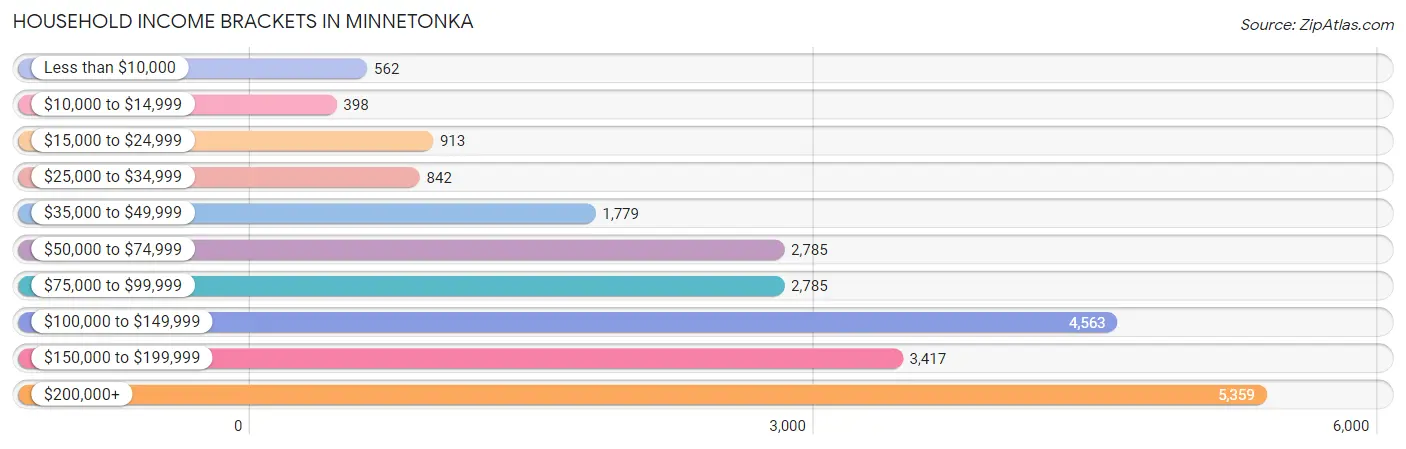
| Income Bracket | # Households | % Households |
| Less than $10,000 | 562 | 2.4% |
| $10,000 to $14,999 | 398 | 1.7% |
| $15,000 to $24,999 | 913 | 3.9% |
| $25,000 to $34,999 | 842 | 3.6% |
| $35,000 to $49,999 | 1,779 | 7.6% |
| $50,000 to $74,999 | 2,785 | 11.9% |
| $75,000 to $99,999 | 2,785 | 11.9% |
| $100,000 to $149,999 | 4,563 | 19.5% |
| $150,000 to $199,999 | 3,417 | 14.6% |
| $200,000+ | 5,359 | 22.9% |
Household Income by Householder Age in Minnetonka
The median household income in Minnetonka is $114,867, with the highest median household income of $143,602 found in the 25 to 44 years age bracket for the primary householder. A total of 7,312 households (31.2%) fall into this category. Meanwhile, the 15 to 24 years age bracket for the primary householder has the lowest median household income of $42,424, with 446 households (1.9%) in this group.
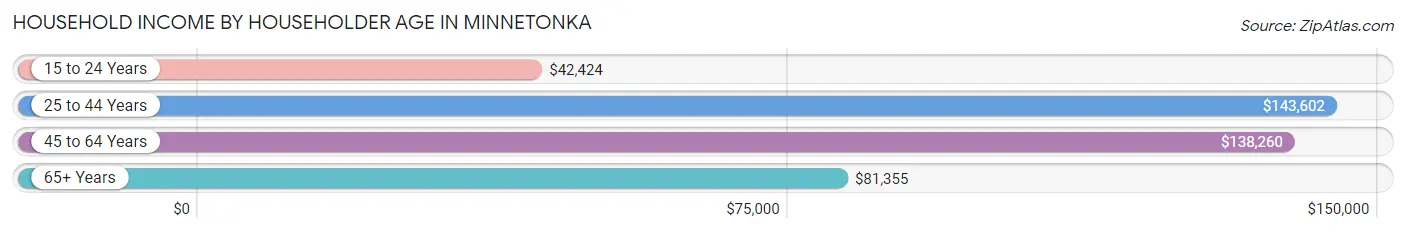
| Income Bracket | # Households | Median Income |
| 15 to 24 Years | 446 (1.9%) | $42,424 |
| 25 to 44 Years | 7,312 (31.2%) | $143,602 |
| 45 to 64 Years | 7,869 (33.6%) | $138,260 |
| 65+ Years | 7,775 (33.2%) | $81,355 |
| Total | 23,402 (100.0%) | $114,867 |
Poverty in Minnetonka
Income Below Poverty by Sex and Age in Minnetonka
With 3.5% poverty level for males and 5.6% for females among the residents of Minnetonka, 55 to 64 year old males and 18 to 24 year old females are the most vulnerable to poverty, with 299 males (8.1%) and 300 females (23.0%) in their respective age groups living below the poverty level.
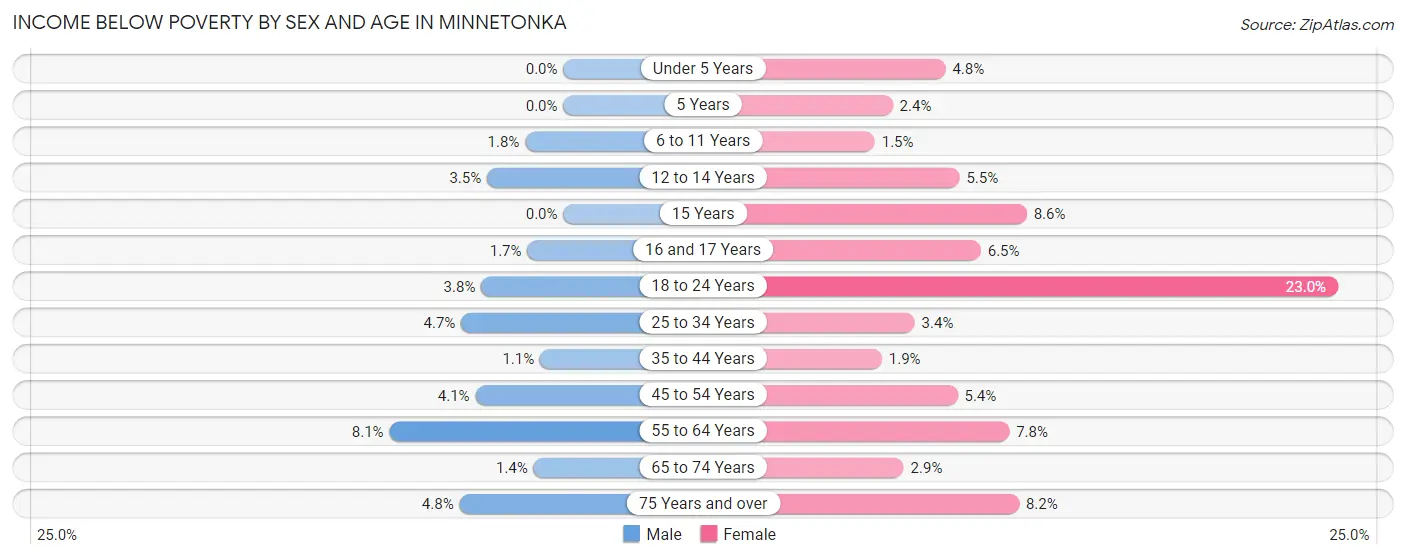
| Age Bracket | Male | Female |
| Under 5 Years | 0 (0.0%) | 72 (4.8%) |
| 5 Years | 0 (0.0%) | 9 (2.4%) |
| 6 to 11 Years | 42 (1.8%) | 21 (1.5%) |
| 12 to 14 Years | 32 (3.5%) | 49 (5.5%) |
| 15 Years | 0 (0.0%) | 29 (8.6%) |
| 16 and 17 Years | 9 (1.7%) | 42 (6.5%) |
| 18 to 24 Years | 48 (3.8%) | 300 (23.0%) |
| 25 to 34 Years | 188 (4.7%) | 121 (3.4%) |
| 35 to 44 Years | 36 (1.1%) | 68 (1.9%) |
| 45 to 54 Years | 123 (4.1%) | 173 (5.4%) |
| 55 to 64 Years | 299 (8.1%) | 300 (7.8%) |
| 65 to 74 Years | 46 (1.4%) | 100 (2.9%) |
| 75 Years and over | 88 (4.8%) | 218 (8.2%) |
| Total | 911 (3.5%) | 1,502 (5.6%) |
Income Above Poverty by Sex and Age in Minnetonka
According to the poverty statistics in Minnetonka, males aged under 5 years and females aged 6 to 11 years are the age groups that are most secure financially, with 100.0% of males and 98.5% of females in these age groups living above the poverty line.
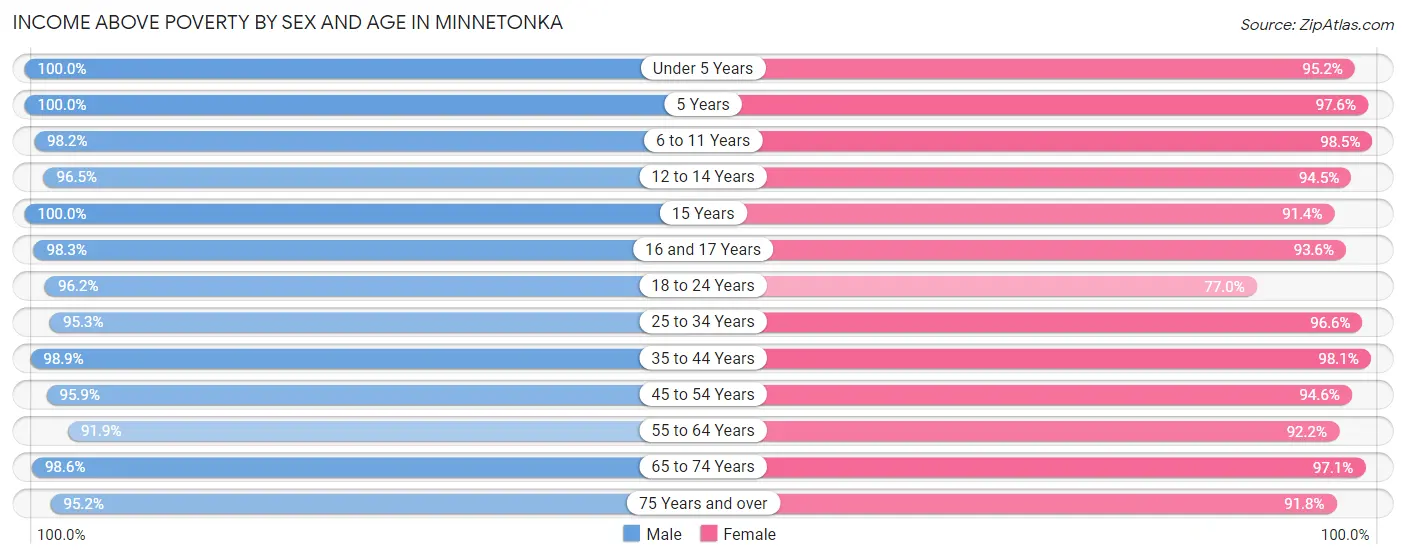
| Age Bracket | Male | Female |
| Under 5 Years | 1,641 (100.0%) | 1,424 (95.2%) |
| 5 Years | 205 (100.0%) | 372 (97.6%) |
| 6 to 11 Years | 2,334 (98.2%) | 1,348 (98.5%) |
| 12 to 14 Years | 872 (96.5%) | 849 (94.5%) |
| 15 Years | 249 (100.0%) | 309 (91.4%) |
| 16 and 17 Years | 531 (98.3%) | 609 (93.5%) |
| 18 to 24 Years | 1,212 (96.2%) | 1,003 (77.0%) |
| 25 to 34 Years | 3,780 (95.3%) | 3,459 (96.6%) |
| 35 to 44 Years | 3,293 (98.9%) | 3,580 (98.1%) |
| 45 to 54 Years | 2,891 (95.9%) | 3,050 (94.6%) |
| 55 to 64 Years | 3,408 (91.9%) | 3,560 (92.2%) |
| 65 to 74 Years | 3,279 (98.6%) | 3,387 (97.1%) |
| 75 Years and over | 1,738 (95.2%) | 2,435 (91.8%) |
| Total | 25,433 (96.5%) | 25,385 (94.4%) |
Income Below Poverty Among Married-Couple Families in Minnetonka
The poverty statistics for married-couple families in Minnetonka show that 1.2% or 145 of the total 11,753 families live below the poverty line. Families with 1 or 2 children have the highest poverty rate of 1.5%, comprising of 60 families. On the other hand, families with no children have the lowest poverty rate of 1.1%, which includes 75 families.
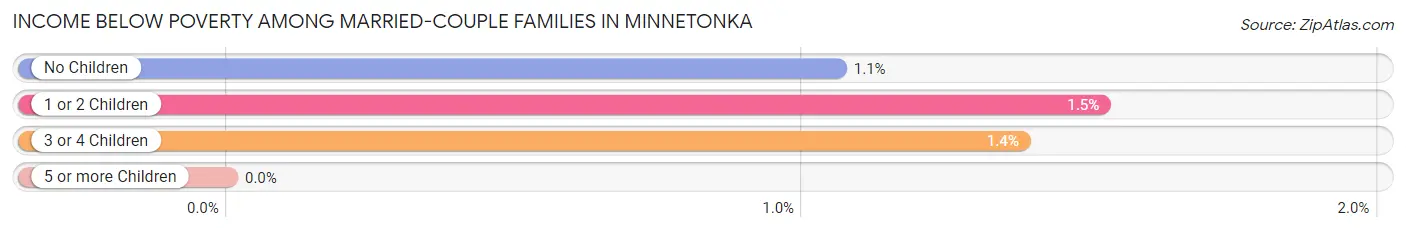
| Children | Above Poverty | Below Poverty |
| No Children | 6,997 (98.9%) | 75 (1.1%) |
| 1 or 2 Children | 3,896 (98.5%) | 60 (1.5%) |
| 3 or 4 Children | 715 (98.6%) | 10 (1.4%) |
| 5 or more Children | 0 (0.0%) | 0 (0.0%) |
| Total | 11,608 (98.8%) | 145 (1.2%) |
Income Below Poverty Among Single-Parent Households in Minnetonka
According to the poverty data in Minnetonka, 11.0% or 95 single-father households and 7.4% or 127 single-mother households are living below the poverty line. Among single-father households, those with no children have the highest poverty rate, with 70 households (21.2%) experiencing poverty. Likewise, among single-mother households, those with 3 or 4 children have the highest poverty rate, with 18 households (14.3%) falling below the poverty line.
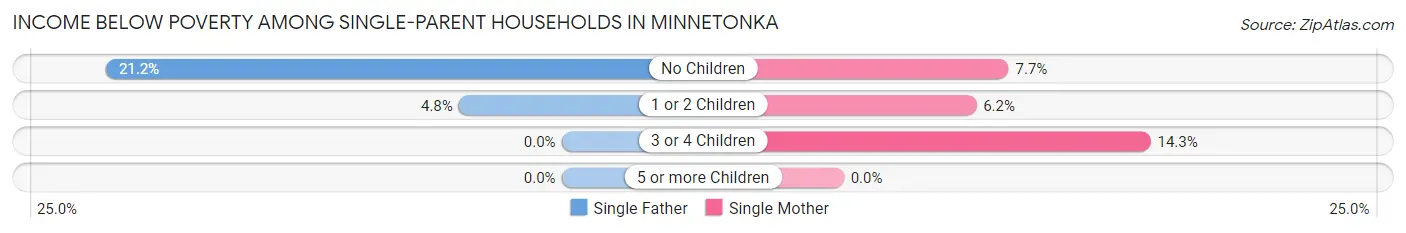
| Children | Single Father | Single Mother |
| No Children | 70 (21.2%) | 58 (7.7%) |
| 1 or 2 Children | 25 (4.8%) | 51 (6.2%) |
| 3 or 4 Children | 0 (0.0%) | 18 (14.3%) |
| 5 or more Children | 0 (0.0%) | 0 (0.0%) |
| Total | 95 (11.0%) | 127 (7.4%) |
Income Below Poverty Among Married-Couple vs Single-Parent Households in Minnetonka
The poverty data for Minnetonka shows that 145 of the married-couple family households (1.2%) and 222 of the single-parent households (8.6%) are living below the poverty level. Within the married-couple family households, those with 1 or 2 children have the highest poverty rate, with 60 households (1.5%) falling below the poverty line. Among the single-parent households, those with 3 or 4 children have the highest poverty rate, with 18 household (13.5%) living below poverty.
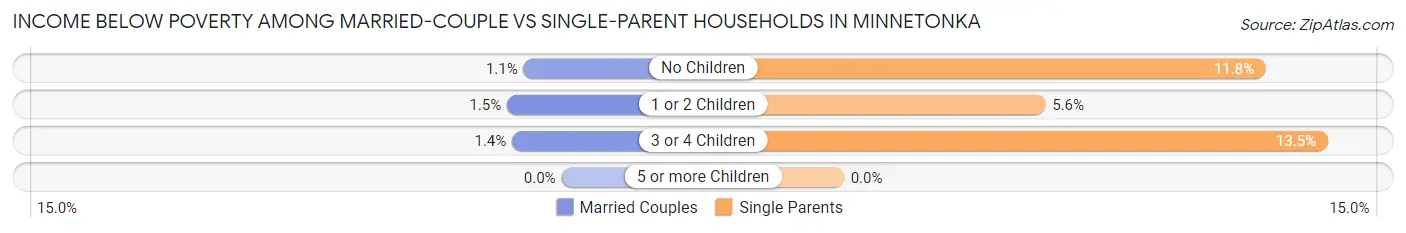
| Children | Married-Couple Families | Single-Parent Households |
| No Children | 75 (1.1%) | 128 (11.8%) |
| 1 or 2 Children | 60 (1.5%) | 76 (5.6%) |
| 3 or 4 Children | 10 (1.4%) | 18 (13.5%) |
| 5 or more Children | 0 (0.0%) | 0 (0.0%) |
| Total | 145 (1.2%) | 222 (8.6%) |
Race in Minnetonka
The most populous races in Minnetonka are White / Caucasian (44,630 | 83.4%), Asian (3,469 | 6.5%), and Two or more Races (2,913 | 5.4%).
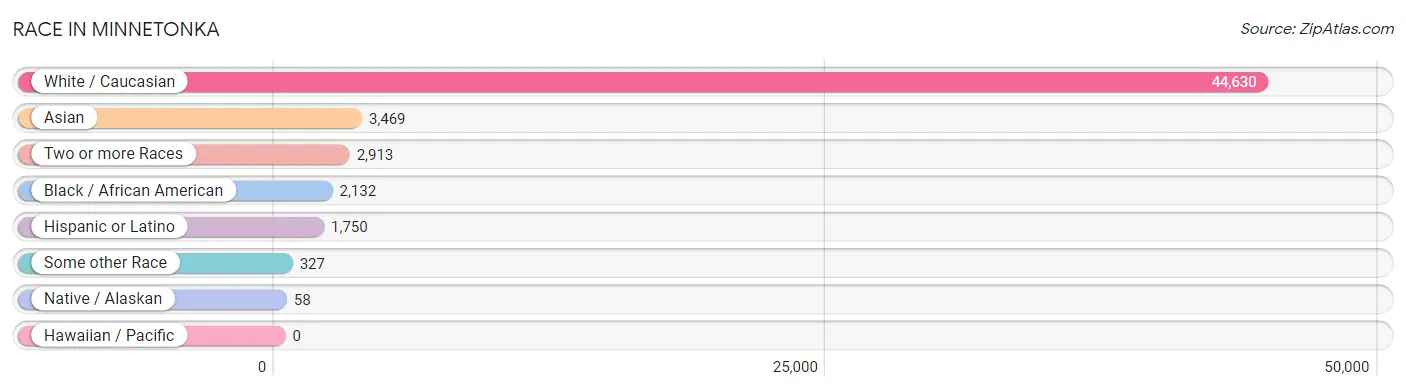
| Race | # Population | % Population |
| Asian | 3,469 | 6.5% |
| Black / African American | 2,132 | 4.0% |
| Hawaiian / Pacific | 0 | 0.0% |
| Hispanic or Latino | 1,750 | 3.3% |
| Native / Alaskan | 58 | 0.1% |
| White / Caucasian | 44,630 | 83.4% |
| Two or more Races | 2,913 | 5.4% |
| Some other Race | 327 | 0.6% |
| Total | 53,529 | 100.0% |
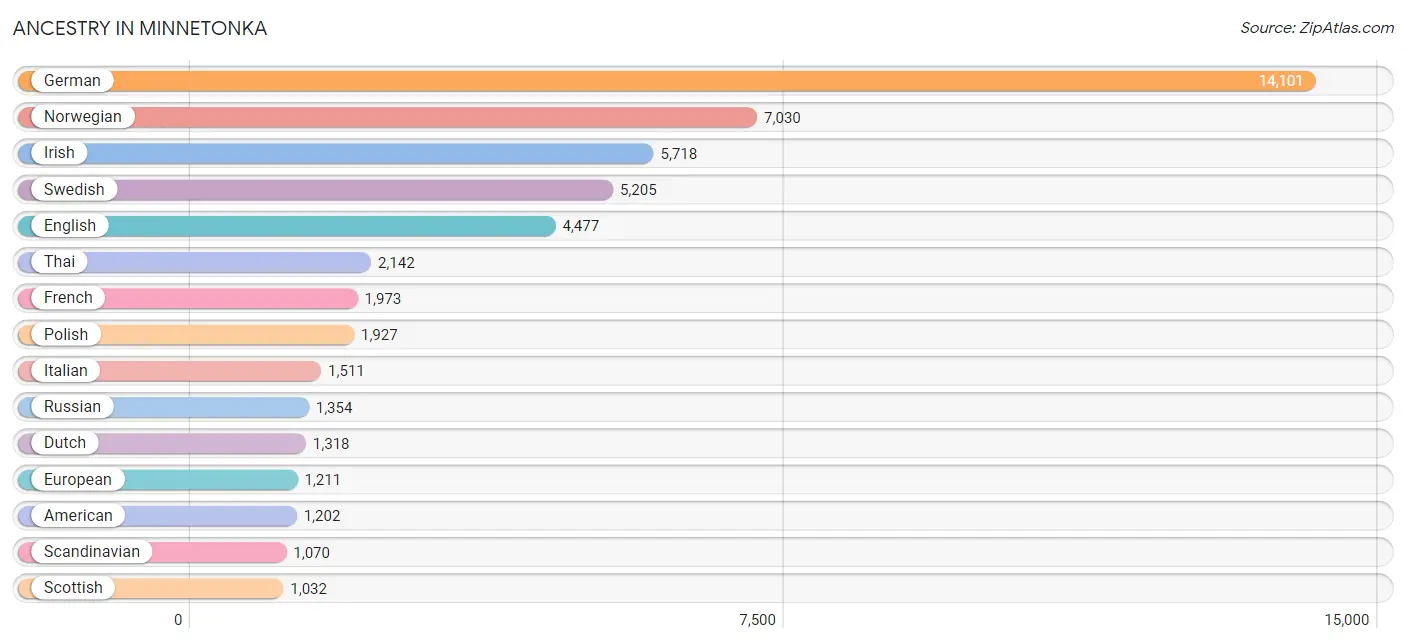
Ancestry in Minnetonka
The most populous ancestries reported in Minnetonka are German (14,101 | 26.3%), Norwegian (7,030 | 13.1%), Irish (5,718 | 10.7%), Swedish (5,205 | 9.7%), and English (4,477 | 8.4%), together accounting for 68.2% of all Minnetonka residents.
| Ancestry | # Population | % Population |
| African | 237 | 0.4% |
| Albanian | 6 | 0.0% |
| American | 1,202 | 2.2% |
| Arab | 227 | 0.4% |
| Argentinean | 72 | 0.1% |
| Armenian | 12 | 0.0% |
| Australian | 45 | 0.1% |
| Austrian | 167 | 0.3% |
| Bangladeshi | 95 | 0.2% |
| Basque | 7 | 0.0% |
| Belgian | 84 | 0.2% |
| Bhutanese | 196 | 0.4% |
| Brazilian | 22 | 0.0% |
| British | 184 | 0.3% |
| Bulgarian | 120 | 0.2% |
| Burmese | 385 | 0.7% |
| Canadian | 164 | 0.3% |
| Celtic | 19 | 0.0% |
| Central American | 172 | 0.3% |
| Central American Indian | 111 | 0.2% |
| Cherokee | 72 | 0.1% |
| Chilean | 46 | 0.1% |
| Chippewa | 79 | 0.2% |
| Choctaw | 2 | 0.0% |
| Colombian | 191 | 0.4% |
| Costa Rican | 9 | 0.0% |
| Croatian | 94 | 0.2% |
| Cuban | 42 | 0.1% |
| Czech | 620 | 1.2% |
| Czechoslovakian | 275 | 0.5% |
| Danish | 868 | 1.6% |
| Dominican | 35 | 0.1% |
| Dutch | 1,318 | 2.5% |
| Eastern European | 682 | 1.3% |
| Ecuadorian | 53 | 0.1% |
| English | 4,477 | 8.4% |
| Estonian | 33 | 0.1% |
| Ethiopian | 17 | 0.0% |
| European | 1,211 | 2.3% |
| Filipino | 11 | 0.0% |
| Finnish | 620 | 1.2% |
| French | 1,973 | 3.7% |
| French American Indian | 15 | 0.0% |
| French Canadian | 387 | 0.7% |
| German | 14,101 | 26.3% |
| German Russian | 72 | 0.1% |
| Greek | 129 | 0.2% |
| Guatemalan | 143 | 0.3% |
| Guyanese | 13 | 0.0% |
| Honduran | 16 | 0.0% |
| Hungarian | 85 | 0.2% |
| Icelander | 9 | 0.0% |
| Indian (Asian) | 899 | 1.7% |
| Iranian | 33 | 0.1% |
| Irish | 5,718 | 10.7% |
| Iroquois | 9 | 0.0% |
| Israeli | 31 | 0.1% |
| Italian | 1,511 | 2.8% |
| Jamaican | 192 | 0.4% |
| Japanese | 66 | 0.1% |
| Kenyan | 88 | 0.2% |
| Korean | 193 | 0.4% |
| Latvian | 17 | 0.0% |
| Lebanese | 120 | 0.2% |
| Liberian | 84 | 0.2% |
| Lithuanian | 184 | 0.3% |
| Luxembourger | 49 | 0.1% |
| Mexican | 538 | 1.0% |
| Moroccan | 18 | 0.0% |
| New Zealander | 12 | 0.0% |
| Nigerian | 53 | 0.1% |
| Northern European | 242 | 0.4% |
| Norwegian | 7,030 | 13.1% |
| Pakistani | 30 | 0.1% |
| Palestinian | 10 | 0.0% |
| Peruvian | 116 | 0.2% |
| Polish | 1,927 | 3.6% |
| Portuguese | 29 | 0.1% |
| Puerto Rican | 140 | 0.3% |
| Romanian | 105 | 0.2% |
| Russian | 1,354 | 2.5% |
| Salvadoran | 4 | 0.0% |
| Scandinavian | 1,070 | 2.0% |
| Scotch-Irish | 408 | 0.8% |
| Scottish | 1,032 | 1.9% |
| Serbian | 55 | 0.1% |
| Sioux | 53 | 0.1% |
| Slovak | 104 | 0.2% |
| Slovene | 76 | 0.1% |
| Somali | 56 | 0.1% |
| South American | 499 | 0.9% |
| Spaniard | 289 | 0.5% |
| Spanish | 34 | 0.1% |
| Sri Lankan | 292 | 0.5% |
| Subsaharan African | 545 | 1.0% |
| Swedish | 5,205 | 9.7% |
| Swiss | 178 | 0.3% |
| Thai | 2,142 | 4.0% |
| Trinidadian and Tobagonian | 14 | 0.0% |
| Turkish | 52 | 0.1% |
| Ukrainian | 265 | 0.5% |
| Venezuelan | 21 | 0.0% |
| Welsh | 271 | 0.5% |
| Yugoslavian | 27 | 0.1% | View All 104 Rows |
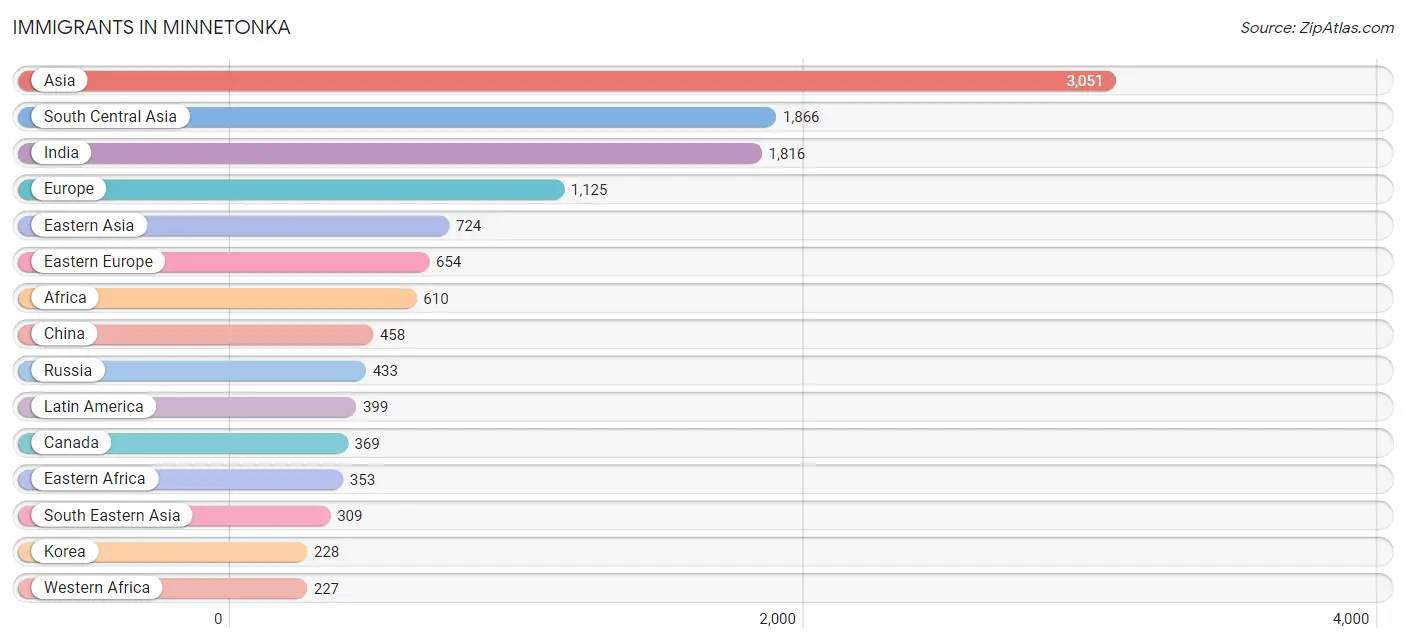
Immigrants in Minnetonka
The most numerous immigrant groups reported in Minnetonka came from Asia (3,051 | 5.7%), South Central Asia (1,866 | 3.5%), India (1,816 | 3.4%), Europe (1,125 | 2.1%), and Eastern Asia (724 | 1.3%), together accounting for 16.0% of all Minnetonka residents.
| Immigration Origin | # Population | % Population |
| Africa | 610 | 1.1% |
| Argentina | 47 | 0.1% |
| Asia | 3,051 | 5.7% |
| Australia | 25 | 0.1% |
| Belarus | 13 | 0.0% |
| Brazil | 22 | 0.0% |
| Bulgaria | 42 | 0.1% |
| Cambodia | 66 | 0.1% |
| Canada | 369 | 0.7% |
| Caribbean | 35 | 0.1% |
| Central America | 139 | 0.3% |
| China | 458 | 0.9% |
| Colombia | 55 | 0.1% |
| Costa Rica | 9 | 0.0% |
| Dominican Republic | 13 | 0.0% |
| Eastern Africa | 353 | 0.7% |
| Eastern Asia | 724 | 1.3% |
| Eastern Europe | 654 | 1.2% |
| Ecuador | 16 | 0.0% |
| El Salvador | 4 | 0.0% |
| England | 32 | 0.1% |
| Ethiopia | 22 | 0.0% |
| Europe | 1,125 | 2.1% |
| France | 37 | 0.1% |
| Germany | 134 | 0.3% |
| Greece | 21 | 0.0% |
| Guatemala | 31 | 0.1% |
| Honduras | 11 | 0.0% |
| Hong Kong | 8 | 0.0% |
| India | 1,816 | 3.4% |
| Iran | 10 | 0.0% |
| Iraq | 24 | 0.0% |
| Ireland | 27 | 0.1% |
| Israel | 61 | 0.1% |
| Italy | 14 | 0.0% |
| Jamaica | 22 | 0.0% |
| Japan | 38 | 0.1% |
| Kenya | 82 | 0.2% |
| Korea | 228 | 0.4% |
| Laos | 9 | 0.0% |
| Latin America | 399 | 0.7% |
| Liberia | 93 | 0.2% |
| Malaysia | 7 | 0.0% |
| Mexico | 64 | 0.1% |
| Moldova | 26 | 0.1% |
| Morocco | 12 | 0.0% |
| Netherlands | 36 | 0.1% |
| Nigeria | 71 | 0.1% |
| Northern Africa | 27 | 0.1% |
| Northern Europe | 142 | 0.3% |
| Norway | 29 | 0.1% |
| Oceania | 25 | 0.1% |
| Pakistan | 12 | 0.0% |
| Panama | 20 | 0.0% |
| Peru | 35 | 0.1% |
| Philippines | 53 | 0.1% |
| Poland | 19 | 0.0% |
| Portugal | 10 | 0.0% |
| Romania | 16 | 0.0% |
| Russia | 433 | 0.8% |
| Serbia | 35 | 0.1% |
| Somalia | 128 | 0.2% |
| South America | 225 | 0.4% |
| South Central Asia | 1,866 | 3.5% |
| South Eastern Asia | 309 | 0.6% |
| Southern Europe | 110 | 0.2% |
| Spain | 65 | 0.1% |
| Sri Lanka | 28 | 0.1% |
| Sweden | 16 | 0.0% |
| Switzerland | 12 | 0.0% |
| Taiwan | 38 | 0.1% |
| Thailand | 23 | 0.0% |
| Turkey | 52 | 0.1% |
| Uganda | 103 | 0.2% |
| Ukraine | 70 | 0.1% |
| Venezuela | 50 | 0.1% |
| Vietnam | 151 | 0.3% |
| Western Africa | 227 | 0.4% |
| Western Asia | 152 | 0.3% |
| Western Europe | 219 | 0.4% | View All 80 Rows |
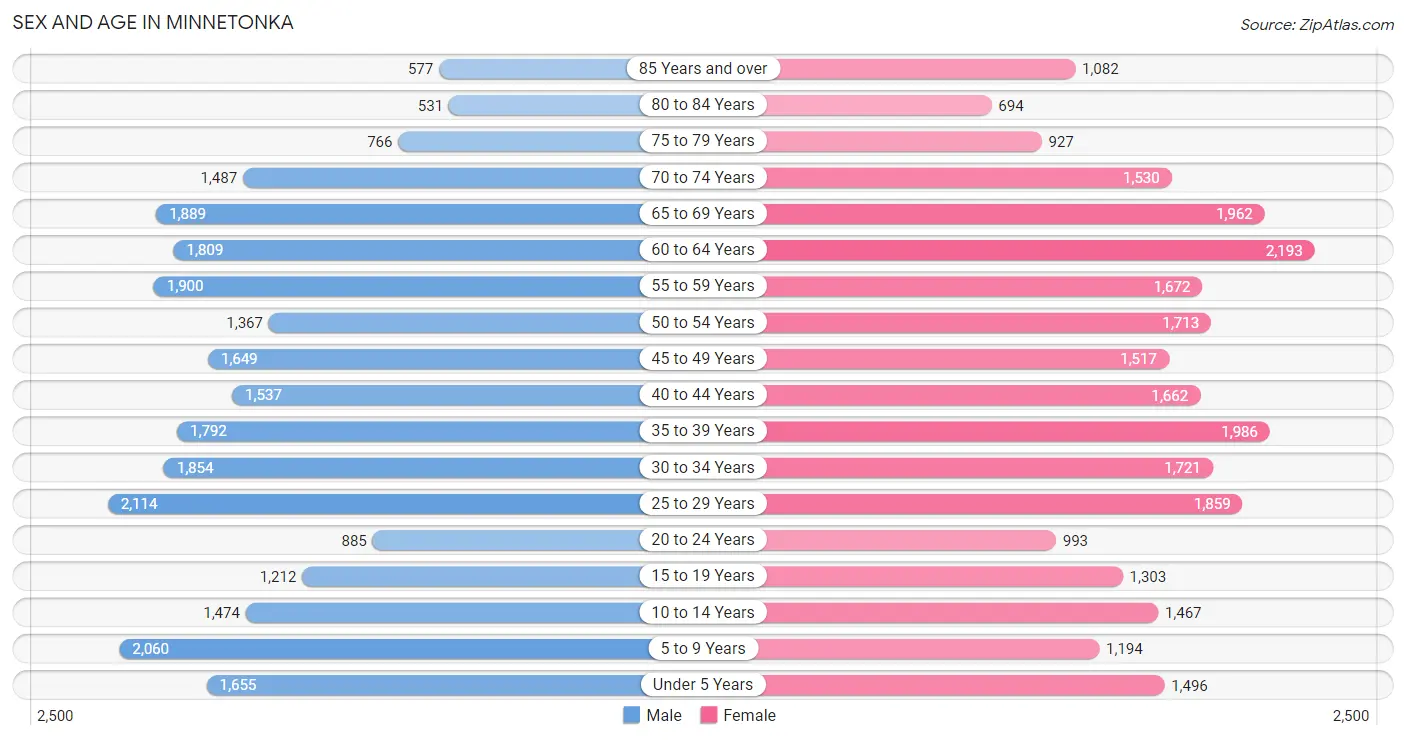
Sex and Age in Minnetonka
Sex and Age in Minnetonka
The most populous age groups in Minnetonka are 25 to 29 Years (2,114 | 8.0%) for men and 60 to 64 Years (2,193 | 8.1%) for women.
| Age Bracket | Male | Female |
| Under 5 Years | 1,655 (6.2%) | 1,496 (5.6%) |
| 5 to 9 Years | 2,060 (7.8%) | 1,194 (4.4%) |
| 10 to 14 Years | 1,474 (5.6%) | 1,467 (5.4%) |
| 15 to 19 Years | 1,212 (4.6%) | 1,303 (4.8%) |
| 20 to 24 Years | 885 (3.3%) | 993 (3.7%) |
| 25 to 29 Years | 2,114 (8.0%) | 1,859 (6.9%) |
| 30 to 34 Years | 1,854 (7.0%) | 1,721 (6.4%) |
| 35 to 39 Years | 1,792 (6.8%) | 1,986 (7.4%) |
| 40 to 44 Years | 1,537 (5.8%) | 1,662 (6.2%) |
| 45 to 49 Years | 1,649 (6.2%) | 1,517 (5.6%) |
| 50 to 54 Years | 1,367 (5.1%) | 1,713 (6.4%) |
| 55 to 59 Years | 1,900 (7.1%) | 1,672 (6.2%) |
| 60 to 64 Years | 1,809 (6.8%) | 2,193 (8.1%) |
| 65 to 69 Years | 1,889 (7.1%) | 1,962 (7.3%) |
| 70 to 74 Years | 1,487 (5.6%) | 1,530 (5.7%) |
| 75 to 79 Years | 766 (2.9%) | 927 (3.4%) |
| 80 to 84 Years | 531 (2.0%) | 694 (2.6%) |
| 85 Years and over | 577 (2.2%) | 1,082 (4.0%) |
| Total | 26,558 (100.0%) | 26,971 (100.0%) |
Families and Households in Minnetonka
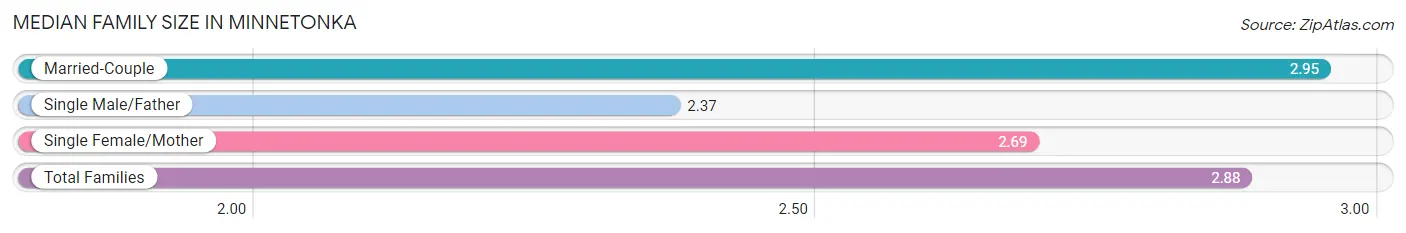
Median Family Size in Minnetonka
The median family size in Minnetonka is 2.88 persons per family, with married-couple families (11,753 | 82.1%) accounting for the largest median family size of 2.95 persons per family. On the other hand, single male/father families (864 | 6.0%) represent the smallest median family size with 2.37 persons per family.
| Family Type | # Families | Family Size |
| Married-Couple | 11,753 (82.1%) | 2.95 |
| Single Male/Father | 864 (6.0%) | 2.37 |
| Single Female/Mother | 1,708 (11.9%) | 2.69 |
| Total Families | 14,325 (100.0%) | 2.88 |
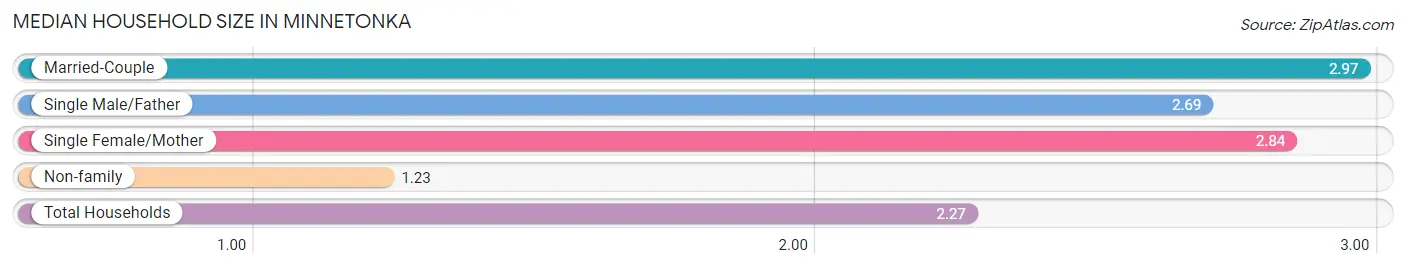
Median Household Size in Minnetonka
The median household size in Minnetonka is 2.27 persons per household, with married-couple households (11,753 | 50.2%) accounting for the largest median household size of 2.97 persons per household. non-family households (9,077 | 38.8%) represent the smallest median household size with 1.23 persons per household.
| Household Type | # Households | Household Size |
| Married-Couple | 11,753 (50.2%) | 2.97 |
| Single Male/Father | 864 (3.7%) | 2.69 |
| Single Female/Mother | 1,708 (7.3%) | 2.84 |
| Non-family | 9,077 (38.8%) | 1.23 |
| Total Households | 23,402 (100.0%) | 2.27 |
Household Size by Marriage Status in Minnetonka
Out of a total of 23,402 households in Minnetonka, 14,325 (61.2%) are family households, while 9,077 (38.8%) are nonfamily households. The most numerous type of family households are 2-person households, comprising 7,078, and the most common type of nonfamily households are 1-person households, comprising 7,326.
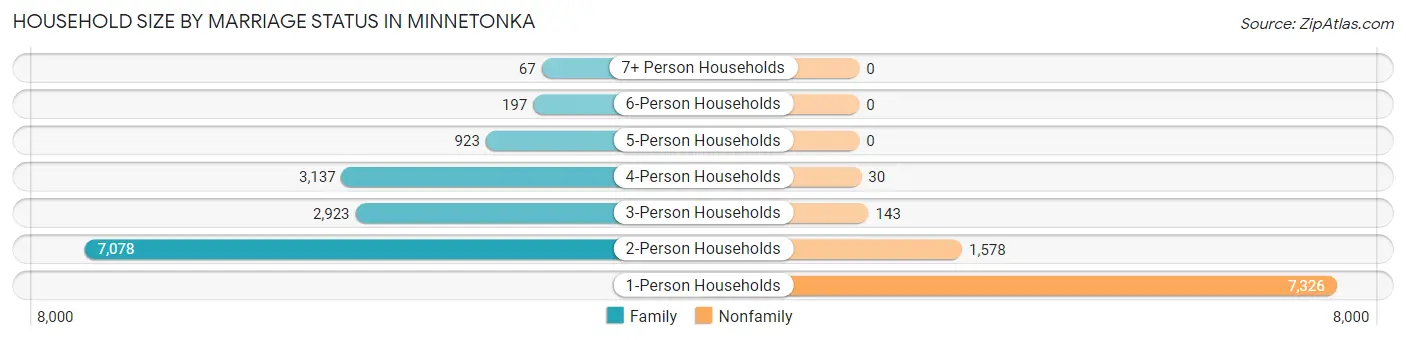
| Household Size | Family Households | Nonfamily Households |
| 1-Person Households | - | 7,326 (31.3%) |
| 2-Person Households | 7,078 (30.2%) | 1,578 (6.7%) |
| 3-Person Households | 2,923 (12.5%) | 143 (0.6%) |
| 4-Person Households | 3,137 (13.4%) | 30 (0.1%) |
| 5-Person Households | 923 (3.9%) | 0 (0.0%) |
| 6-Person Households | 197 (0.8%) | 0 (0.0%) |
| 7+ Person Households | 67 (0.3%) | 0 (0.0%) |
| Total | 14,325 (61.2%) | 9,077 (38.8%) |
Female Fertility in Minnetonka
Fertility by Age in Minnetonka
Average fertility rate in Minnetonka is 56.0 births per 1,000 women. Women in the age bracket of 20 to 34 years have the highest fertility rate with 85.0 births per 1,000 women. Women in the age bracket of 20 to 34 years acount for 62.0% of all women with births.
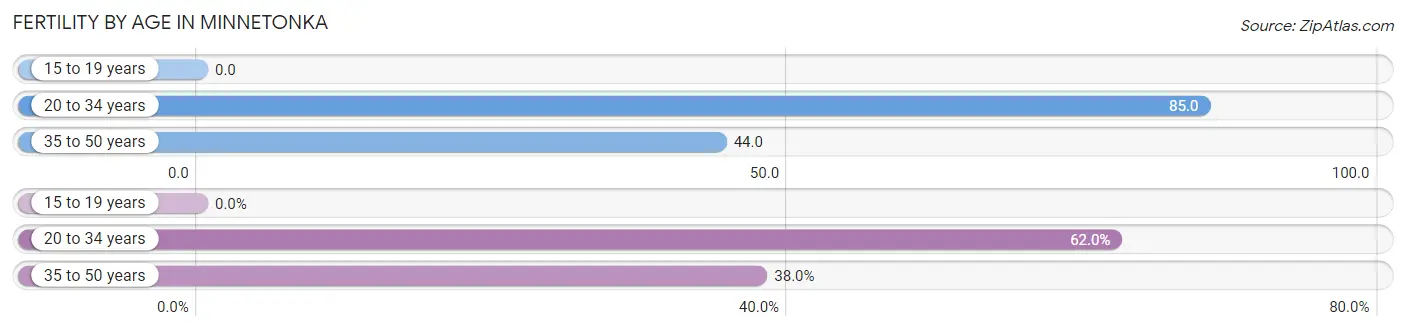
| Age Bracket | Women with Births | Births / 1,000 Women |
| 15 to 19 years | 0 (0.0%) | 0.0 |
| 20 to 34 years | 389 (62.0%) | 85.0 |
| 35 to 50 years | 238 (38.0%) | 44.0 |
| Total | 627 (100.0%) | 56.0 |
Fertility by Age by Marriage Status in Minnetonka
88.2% of women with births (627) in Minnetonka are married. The highest percentage of unmarried women with births falls into 20 to 34 years age bracket with 19.0% of them unmarried at the time of birth, while the lowest percentage of unmarried women with births belong to 35 to 50 years age bracket with 0.0% of them unmarried.
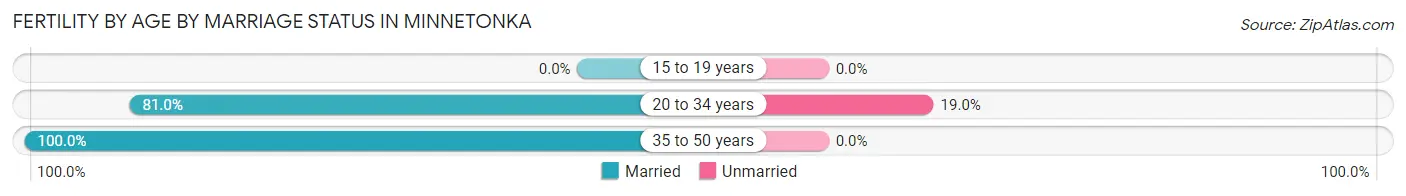
| Age Bracket | Married | Unmarried |
| 15 to 19 years | 0 (0.0%) | 0 (0.0%) |
| 20 to 34 years | 315 (81.0%) | 74 (19.0%) |
| 35 to 50 years | 238 (100.0%) | 0 (0.0%) |
| Total | 553 (88.2%) | 74 (11.8%) |
Fertility by Education in Minnetonka
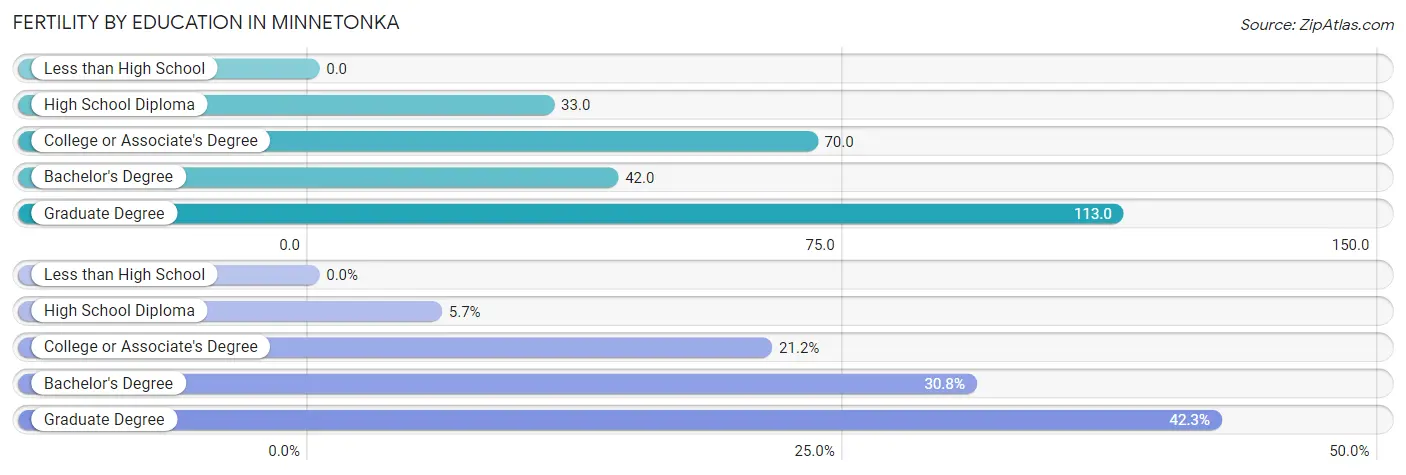
| Educational Attainment | Women with Births | Births / 1,000 Women |
| Less than High School | 0 (0.0%) | 0.0 |
| High School Diploma | 36 (5.7%) | 33.0 |
| College or Associate's Degree | 133 (21.2%) | 70.0 |
| Bachelor's Degree | 193 (30.8%) | 42.0 |
| Graduate Degree | 265 (42.3%) | 113.0 |
| Total | 627 (100.0%) | 56.0 |
Fertility by Education by Marriage Status in Minnetonka
11.8% of women with births in Minnetonka are unmarried. Women with the educational attainment of graduate degree are most likely to be married with 100.0% of them married at childbirth, while women with the educational attainment of high school diploma are least likely to be married with 77.8% of them unmarried at childbirth.
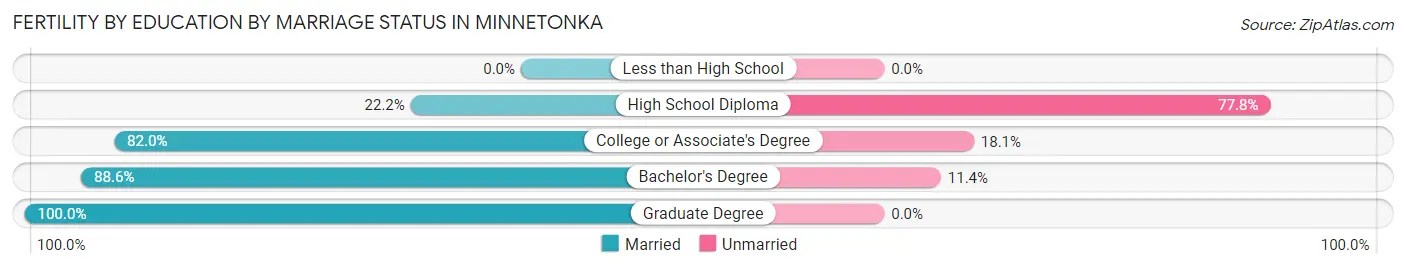
| Educational Attainment | Married | Unmarried |
| Less than High School | 0 (0.0%) | 0 (0.0%) |
| High School Diploma | 8 (22.2%) | 28 (77.8%) |
| College or Associate's Degree | 109 (82.0%) | 24 (18.0%) |
| Bachelor's Degree | 171 (88.6%) | 22 (11.4%) |
| Graduate Degree | 265 (100.0%) | 0 (0.0%) |
| Total | 553 (88.2%) | 74 (11.8%) |
Employment Characteristics in Minnetonka
Employment by Class of Employer in Minnetonka
Among the 29,349 employed individuals in Minnetonka, private company employees (20,287 | 69.1%), not-for-profit organizations (2,689 | 9.2%), and self-employed (incorporated) (1,871 | 6.4%) make up the most common classes of employment.
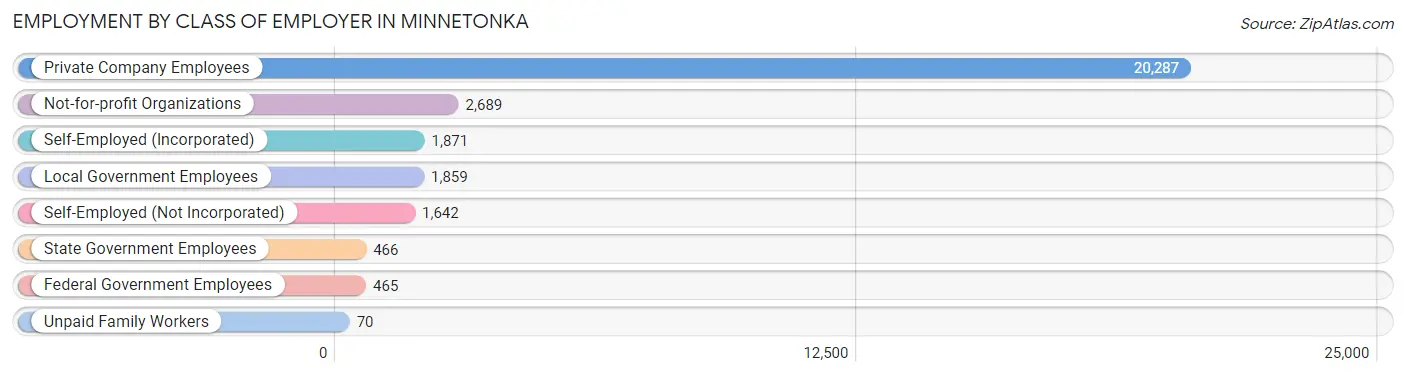
| Employer Class | # Employees | % Employees |
| Private Company Employees | 20,287 | 69.1% |
| Self-Employed (Incorporated) | 1,871 | 6.4% |
| Self-Employed (Not Incorporated) | 1,642 | 5.6% |
| Not-for-profit Organizations | 2,689 | 9.2% |
| Local Government Employees | 1,859 | 6.3% |
| State Government Employees | 466 | 1.6% |
| Federal Government Employees | 465 | 1.6% |
| Unpaid Family Workers | 70 | 0.2% |
| Total | 29,349 | 100.0% |
Employment Status by Age in Minnetonka
According to the labor force statistics for Minnetonka, out of the total population over 16 years of age (43,586), 69.9% or 30,467 individuals are in the labor force, with 2.5% or 762 of them unemployed. The age group with the highest labor force participation rate is 35 to 44 years, with 93.5% or 6,523 individuals in the labor force. Within the labor force, the 30 to 34 years age range has the highest percentage of unemployed individuals, with 5.3% or 173 of them being unemployed.
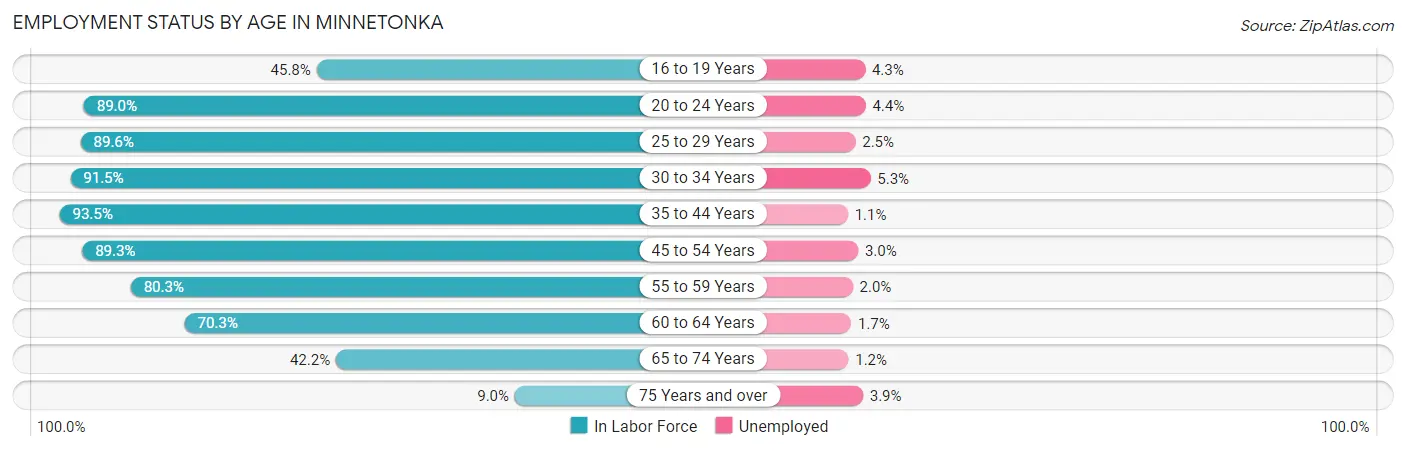
| Age Bracket | In Labor Force | Unemployed |
| 16 to 19 Years | 878 (45.8%) | 38 (4.3%) |
| 20 to 24 Years | 1,671 (89.0%) | 74 (4.4%) |
| 25 to 29 Years | 3,560 (89.6%) | 89 (2.5%) |
| 30 to 34 Years | 3,271 (91.5%) | 173 (5.3%) |
| 35 to 44 Years | 6,523 (93.5%) | 72 (1.1%) |
| 45 to 54 Years | 5,578 (89.3%) | 167 (3.0%) |
| 55 to 59 Years | 2,868 (80.3%) | 57 (2.0%) |
| 60 to 64 Years | 2,813 (70.3%) | 48 (1.7%) |
| 65 to 74 Years | 2,898 (42.2%) | 35 (1.2%) |
| 75 Years and over | 412 (9.0%) | 16 (3.9%) |
| Total | 30,467 (69.9%) | 762 (2.5%) |
Employment Status by Educational Attainment in Minnetonka
According to labor force statistics for Minnetonka, 86.8% of individuals (24,603) out of the total population between 25 and 64 years of age (28,345) are in the labor force, with 2.5% or 615 of them being unemployed. The group with the highest labor force participation rate are those with the educational attainment of bachelor's degree or higher, with 89.4% or 16,718 individuals in the labor force. Within the labor force, individuals with less than high school education have the highest percentage of unemployment, with 8.5% or 43 of them being unemployed.
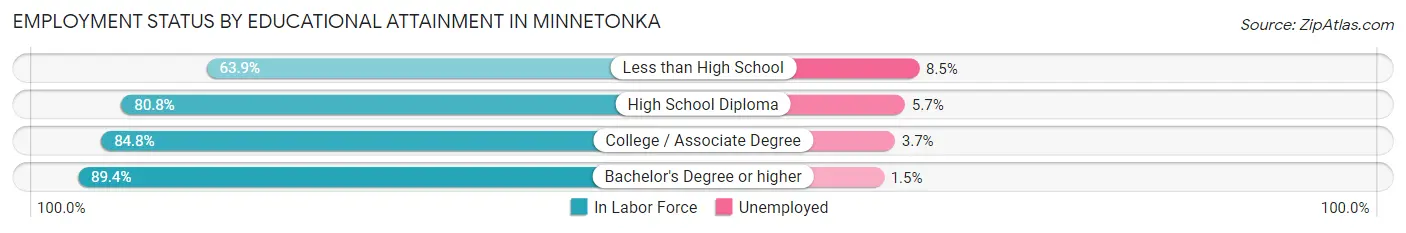
| Educational Attainment | In Labor Force | Unemployed |
| Less than High School | 507 (63.9%) | 67 (8.5%) |
| High School Diploma | 2,360 (80.8%) | 166 (5.7%) |
| College / Associate Degree | 5,029 (84.8%) | 219 (3.7%) |
| Bachelor's Degree or higher | 16,718 (89.4%) | 280 (1.5%) |
| Total | 24,603 (86.8%) | 709 (2.5%) |
Employment Occupations by Sex in Minnetonka
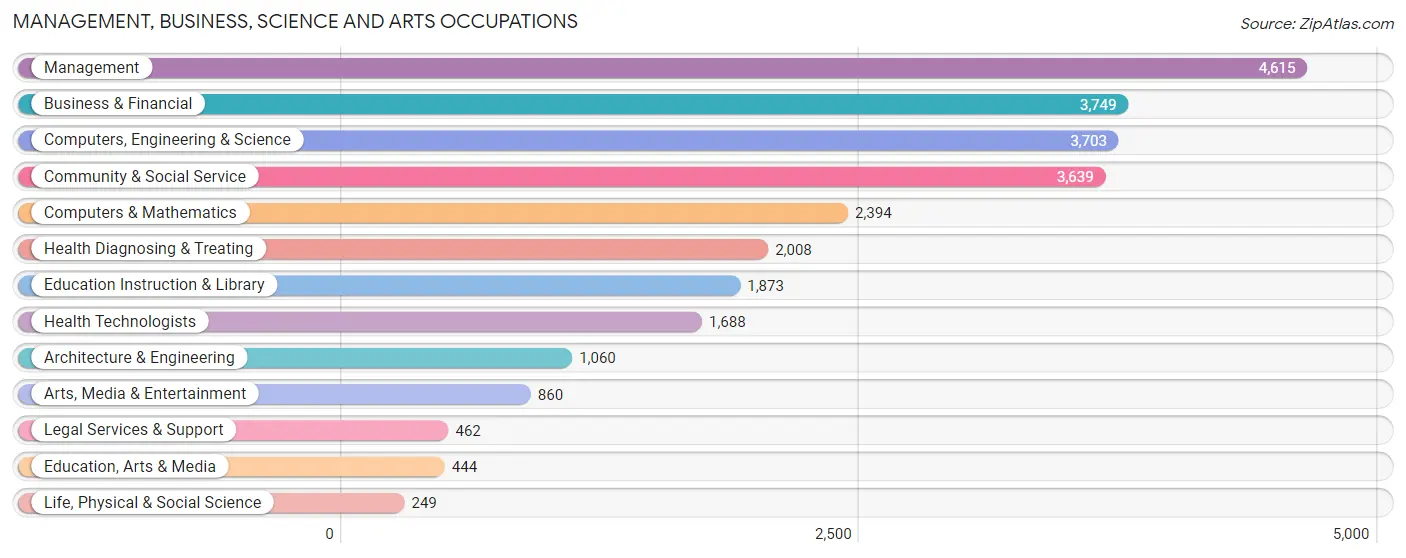
Management, Business, Science and Arts Occupations
The most common Management, Business, Science and Arts occupations in Minnetonka are Management (4,615 | 15.5%), Business & Financial (3,749 | 12.6%), Computers, Engineering & Science (3,703 | 12.5%), Community & Social Service (3,639 | 12.2%), and Computers & Mathematics (2,394 | 8.1%).
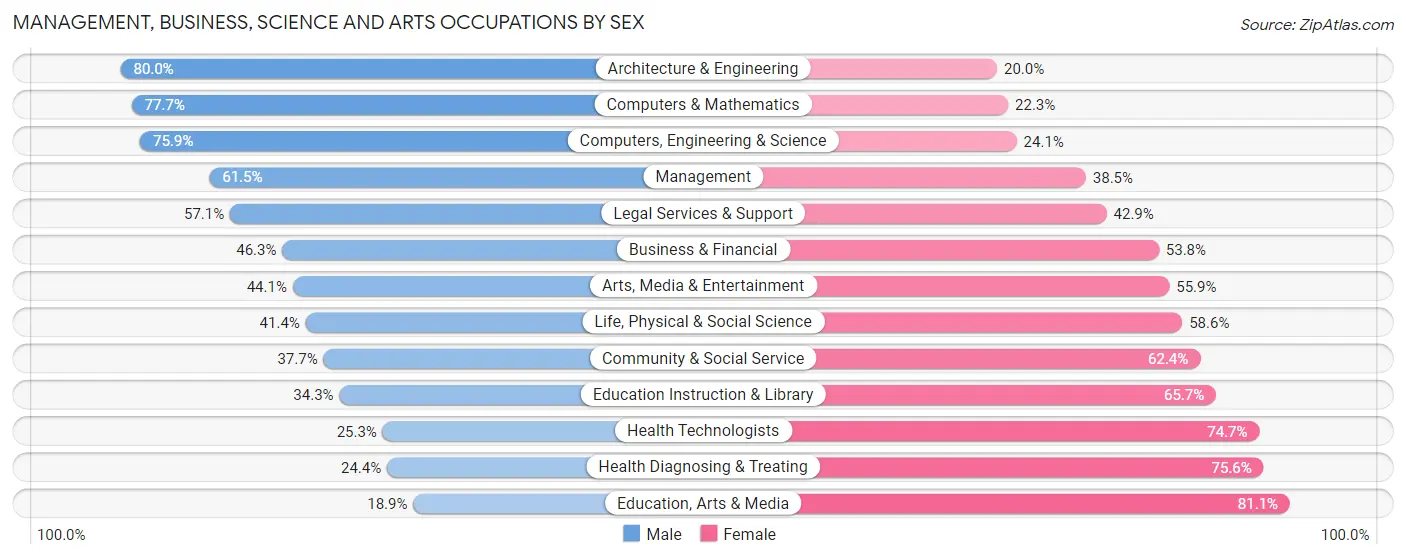
Management, Business, Science and Arts Occupations by Sex
Within the Management, Business, Science and Arts occupations in Minnetonka, the most male-oriented occupations are Architecture & Engineering (80.0%), Computers & Mathematics (77.7%), and Computers, Engineering & Science (75.9%), while the most female-oriented occupations are Education, Arts & Media (81.1%), Health Diagnosing & Treating (75.6%), and Health Technologists (74.7%).
| Occupation | Male | Female |
| Management | 2,837 (61.5%) | 1,778 (38.5%) |
| Business & Financial | 1,734 (46.3%) | 2,015 (53.7%) |
| Computers, Engineering & Science | 2,811 (75.9%) | 892 (24.1%) |
| Computers & Mathematics | 1,860 (77.7%) | 534 (22.3%) |
| Architecture & Engineering | 848 (80.0%) | 212 (20.0%) |
| Life, Physical & Social Science | 103 (41.4%) | 146 (58.6%) |
| Community & Social Service | 1,370 (37.7%) | 2,269 (62.4%) |
| Education, Arts & Media | 84 (18.9%) | 360 (81.1%) |
| Legal Services & Support | 264 (57.1%) | 198 (42.9%) |
| Education Instruction & Library | 643 (34.3%) | 1,230 (65.7%) |
| Arts, Media & Entertainment | 379 (44.1%) | 481 (55.9%) |
| Health Diagnosing & Treating | 490 (24.4%) | 1,518 (75.6%) |
| Health Technologists | 427 (25.3%) | 1,261 (74.7%) |
| Total (Category) | 9,242 (52.2%) | 8,472 (47.8%) |
| Total (Overall) | 15,745 (53.0%) | 13,958 (47.0%) |
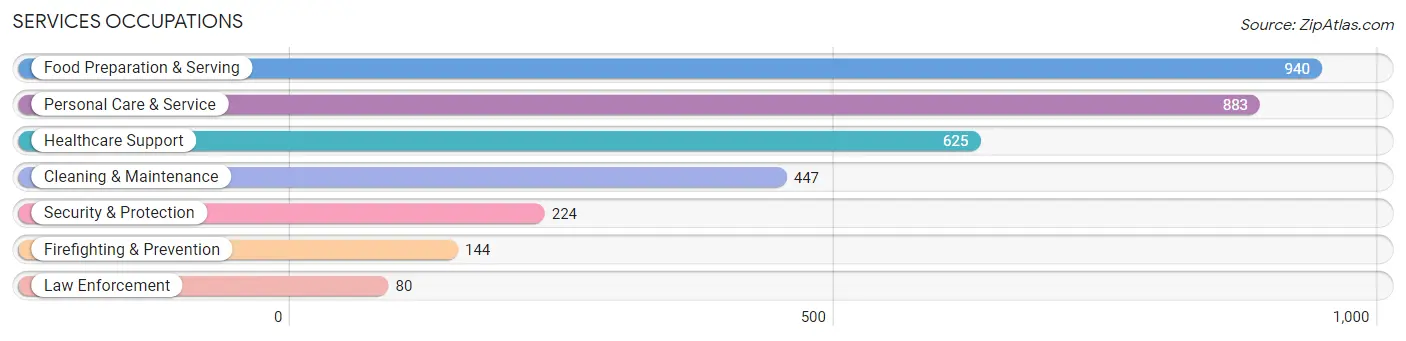
Services Occupations
The most common Services occupations in Minnetonka are Food Preparation & Serving (940 | 3.2%), Personal Care & Service (883 | 3.0%), Healthcare Support (625 | 2.1%), Cleaning & Maintenance (447 | 1.5%), and Security & Protection (224 | 0.7%).
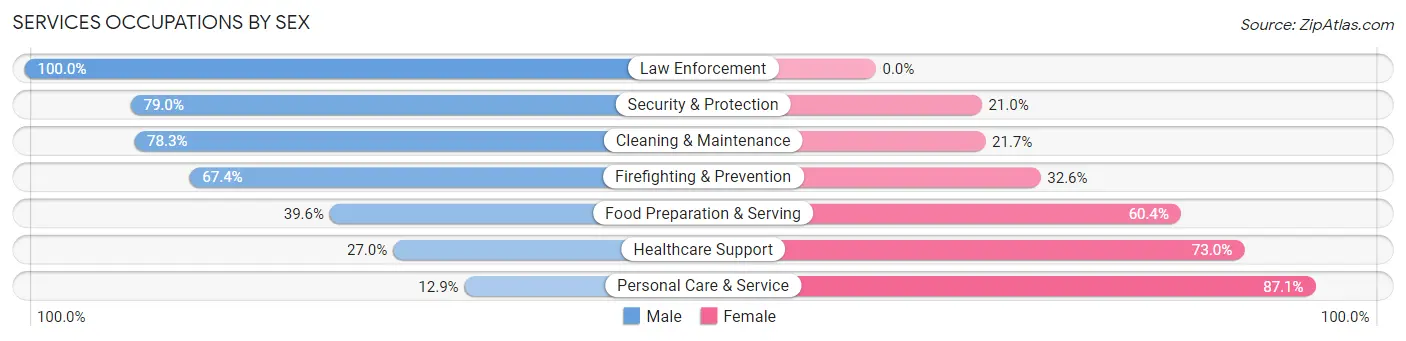
Services Occupations by Sex
Within the Services occupations in Minnetonka, the most male-oriented occupations are Law Enforcement (100.0%), Security & Protection (79.0%), and Cleaning & Maintenance (78.3%), while the most female-oriented occupations are Personal Care & Service (87.1%), Healthcare Support (73.0%), and Food Preparation & Serving (60.4%).
| Occupation | Male | Female |
| Healthcare Support | 169 (27.0%) | 456 (73.0%) |
| Security & Protection | 177 (79.0%) | 47 (21.0%) |
| Firefighting & Prevention | 97 (67.4%) | 47 (32.6%) |
| Law Enforcement | 80 (100.0%) | 0 (0.0%) |
| Food Preparation & Serving | 372 (39.6%) | 568 (60.4%) |
| Cleaning & Maintenance | 350 (78.3%) | 97 (21.7%) |
| Personal Care & Service | 114 (12.9%) | 769 (87.1%) |
| Total (Category) | 1,182 (37.9%) | 1,937 (62.1%) |
| Total (Overall) | 15,745 (53.0%) | 13,958 (47.0%) |
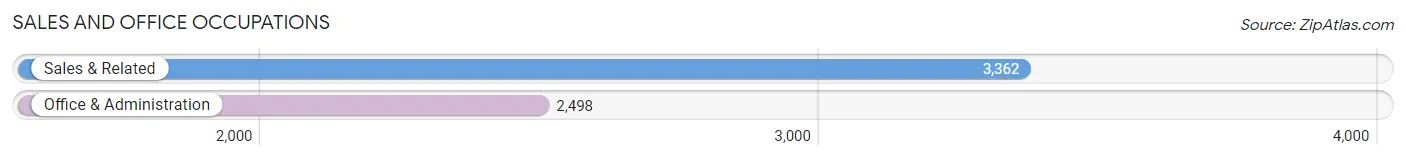
Sales and Office Occupations
The most common Sales and Office occupations in Minnetonka are Sales & Related (3,362 | 11.3%), and Office & Administration (2,498 | 8.4%).
Sales and Office Occupations by Sex
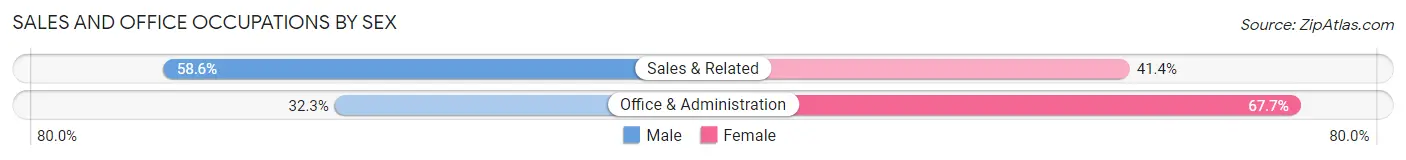
| Occupation | Male | Female |
| Sales & Related | 1,969 (58.6%) | 1,393 (41.4%) |
| Office & Administration | 807 (32.3%) | 1,691 (67.7%) |
| Total (Category) | 2,776 (47.4%) | 3,084 (52.6%) |
| Total (Overall) | 15,745 (53.0%) | 13,958 (47.0%) |
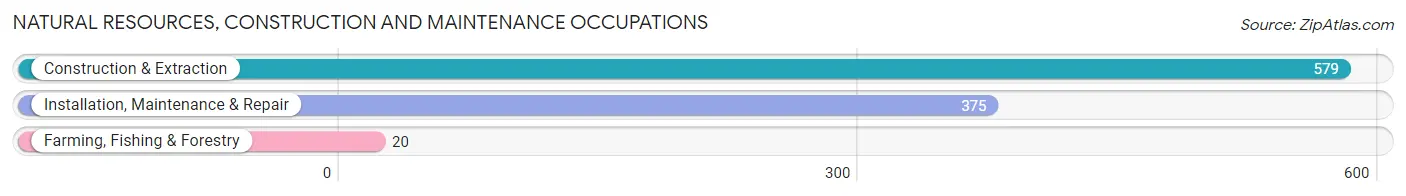
Natural Resources, Construction and Maintenance Occupations
The most common Natural Resources, Construction and Maintenance occupations in Minnetonka are Construction & Extraction (579 | 1.9%), Installation, Maintenance & Repair (375 | 1.3%), and Farming, Fishing & Forestry (20 | 0.1%).
Natural Resources, Construction and Maintenance Occupations by Sex
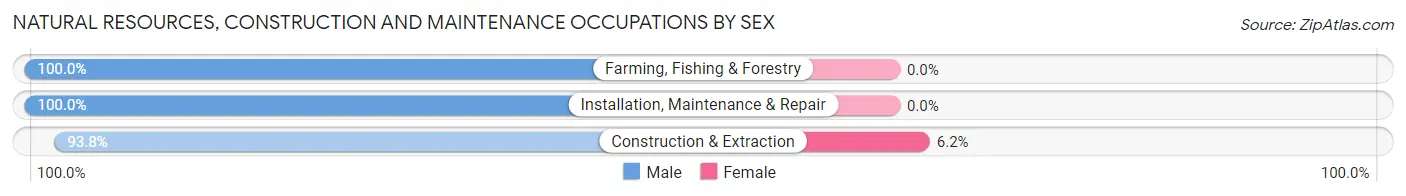
| Occupation | Male | Female |
| Farming, Fishing & Forestry | 20 (100.0%) | 0 (0.0%) |
| Construction & Extraction | 543 (93.8%) | 36 (6.2%) |
| Installation, Maintenance & Repair | 375 (100.0%) | 0 (0.0%) |
| Total (Category) | 938 (96.3%) | 36 (3.7%) |
| Total (Overall) | 15,745 (53.0%) | 13,958 (47.0%) |
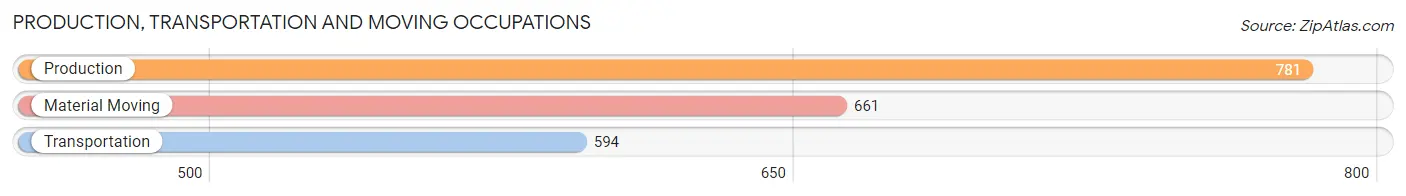
Production, Transportation and Moving Occupations
The most common Production, Transportation and Moving occupations in Minnetonka are Production (781 | 2.6%), Material Moving (661 | 2.2%), and Transportation (594 | 2.0%).
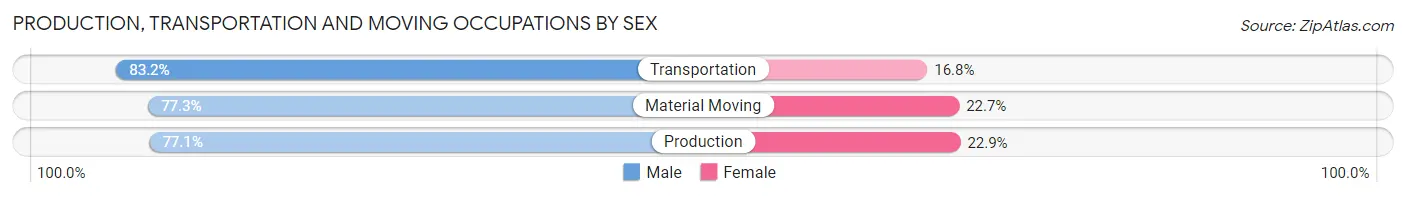
Production, Transportation and Moving Occupations by Sex
| Occupation | Male | Female |
| Production | 602 (77.1%) | 179 (22.9%) |
| Transportation | 494 (83.2%) | 100 (16.8%) |
| Material Moving | 511 (77.3%) | 150 (22.7%) |
| Total (Category) | 1,607 (78.9%) | 429 (21.1%) |
| Total (Overall) | 15,745 (53.0%) | 13,958 (47.0%) |
Employment Industries by Sex in Minnetonka
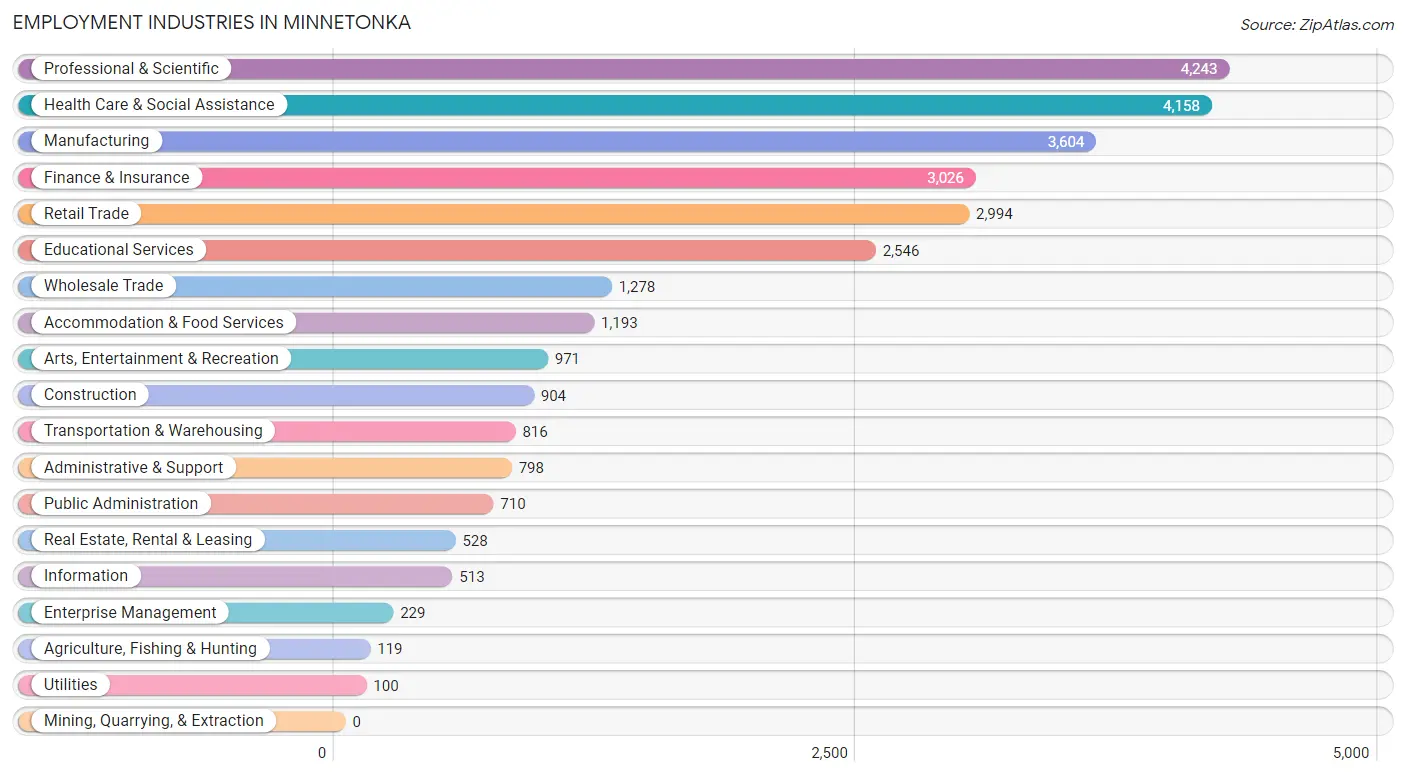
Employment Industries in Minnetonka
The major employment industries in Minnetonka include Professional & Scientific (4,243 | 14.3%), Health Care & Social Assistance (4,158 | 14.0%), Manufacturing (3,604 | 12.1%), Finance & Insurance (3,026 | 10.2%), and Retail Trade (2,994 | 10.1%).
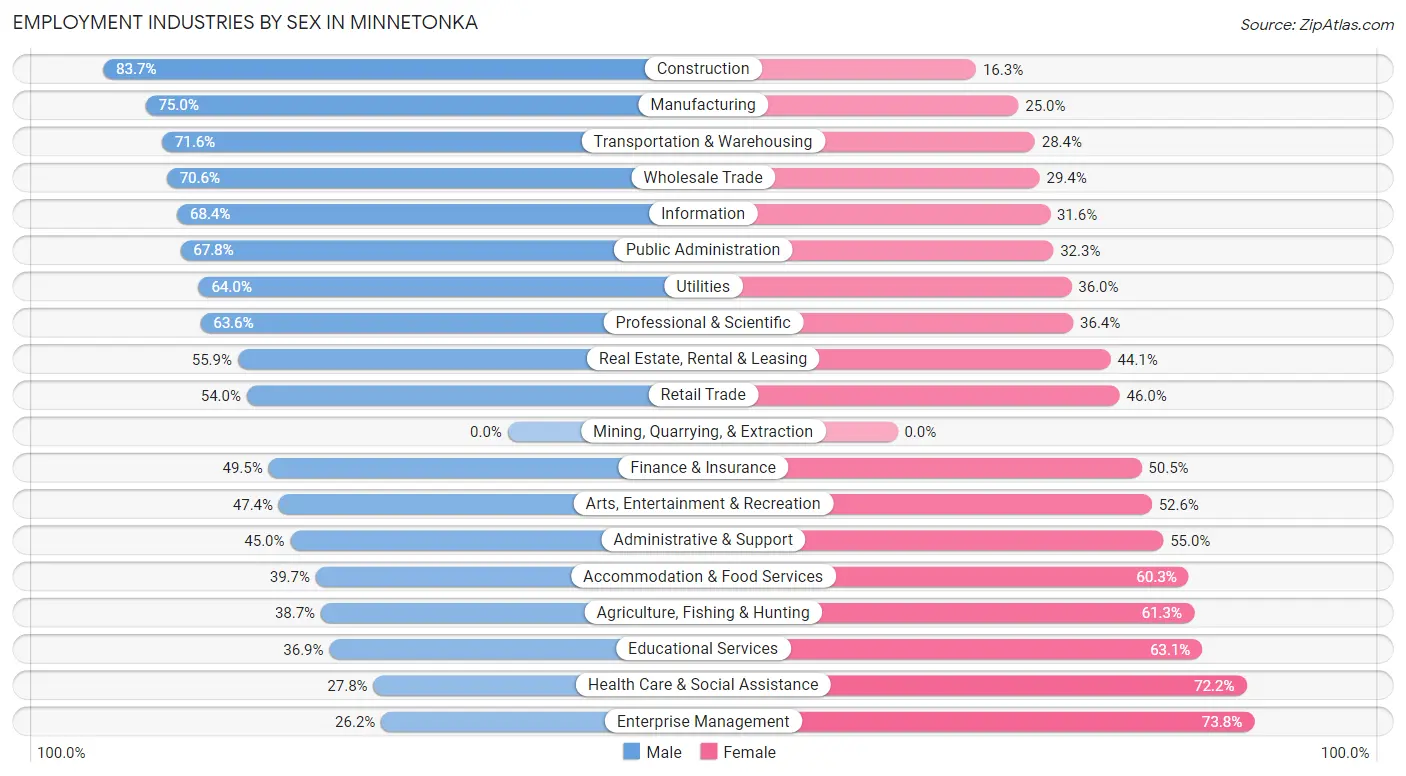
Employment Industries by Sex in Minnetonka
The Minnetonka industries that see more men than women are Construction (83.7%), Manufacturing (75.0%), and Transportation & Warehousing (71.6%), whereas the industries that tend to have a higher number of women are Enterprise Management (73.8%), Health Care & Social Assistance (72.2%), and Educational Services (63.1%).
| Industry | Male | Female |
| Agriculture, Fishing & Hunting | 46 (38.7%) | 73 (61.3%) |
| Mining, Quarrying, & Extraction | 0 (0.0%) | 0 (0.0%) |
| Construction | 757 (83.7%) | 147 (16.3%) |
| Manufacturing | 2,702 (75.0%) | 902 (25.0%) |
| Wholesale Trade | 902 (70.6%) | 376 (29.4%) |
| Retail Trade | 1,617 (54.0%) | 1,377 (46.0%) |
| Transportation & Warehousing | 584 (71.6%) | 232 (28.4%) |
| Utilities | 64 (64.0%) | 36 (36.0%) |
| Information | 351 (68.4%) | 162 (31.6%) |
| Finance & Insurance | 1,498 (49.5%) | 1,528 (50.5%) |
| Real Estate, Rental & Leasing | 295 (55.9%) | 233 (44.1%) |
| Professional & Scientific | 2,700 (63.6%) | 1,543 (36.4%) |
| Enterprise Management | 60 (26.2%) | 169 (73.8%) |
| Administrative & Support | 359 (45.0%) | 439 (55.0%) |
| Educational Services | 940 (36.9%) | 1,606 (63.1%) |
| Health Care & Social Assistance | 1,156 (27.8%) | 3,002 (72.2%) |
| Arts, Entertainment & Recreation | 460 (47.4%) | 511 (52.6%) |
| Accommodation & Food Services | 474 (39.7%) | 719 (60.3%) |
| Public Administration | 481 (67.7%) | 229 (32.3%) |
| Total | 15,745 (53.0%) | 13,958 (47.0%) |
Education in Minnetonka
School Enrollment in Minnetonka
The most common levels of schooling among the 11,306 students in Minnetonka are elementary school (2,664 | 23.6%), high school (2,460 | 21.8%), and middle school (2,197 | 19.4%).
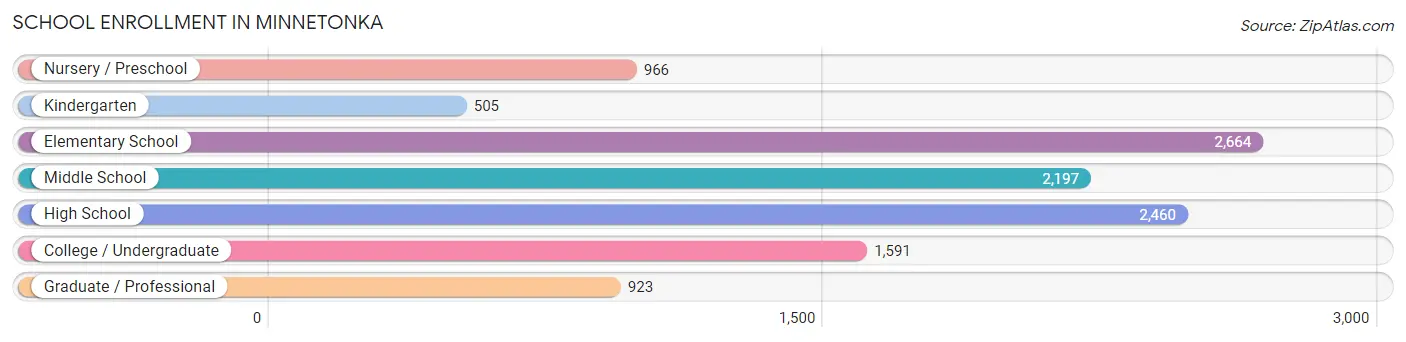
| School Level | # Students | % Students |
| Nursery / Preschool | 966 | 8.5% |
| Kindergarten | 505 | 4.5% |
| Elementary School | 2,664 | 23.6% |
| Middle School | 2,197 | 19.4% |
| High School | 2,460 | 21.8% |
| College / Undergraduate | 1,591 | 14.1% |
| Graduate / Professional | 923 | 8.2% |
| Total | 11,306 | 100.0% |
School Enrollment by Age by Funding Source in Minnetonka
Out of a total of 11,306 students who are enrolled in schools in Minnetonka, 1,990 (17.6%) attend a private institution, while the remaining 9,316 (82.4%) are enrolled in public schools. The age group of 3 to 4 year olds has the highest likelihood of being enrolled in private schools, with 382 (56.3% in the age bracket) enrolled. Conversely, the age group of 10 to 14 year olds has the lowest likelihood of being enrolled in a private school, with 2,713 (93.4% in the age bracket) attending a public institution.
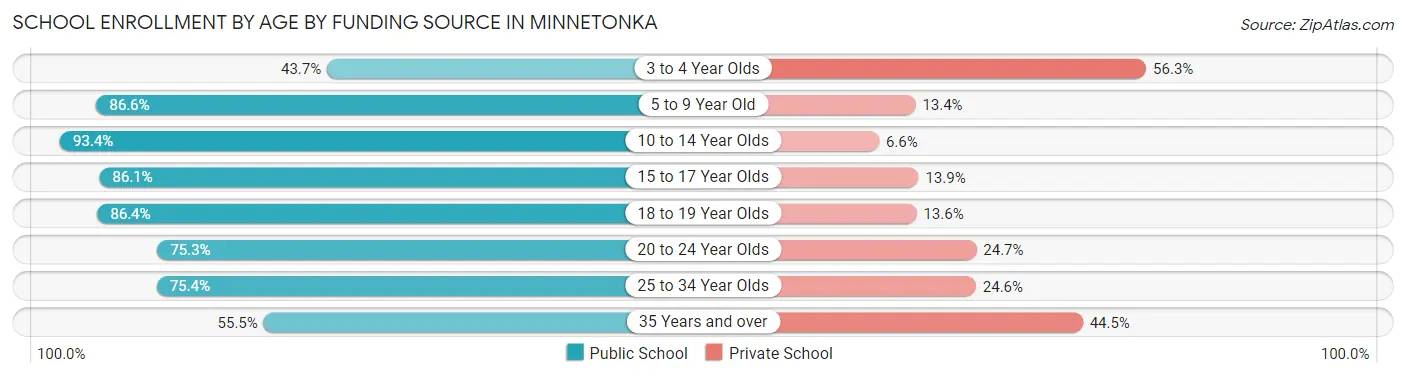
| Age Bracket | Public School | Private School |
| 3 to 4 Year Olds | 296 (43.7%) | 382 (56.3%) |
| 5 to 9 Year Old | 2,703 (86.6%) | 417 (13.4%) |
| 10 to 14 Year Olds | 2,713 (93.4%) | 191 (6.6%) |
| 15 to 17 Year Olds | 1,508 (86.1%) | 244 (13.9%) |
| 18 to 19 Year Olds | 510 (86.4%) | 80 (13.6%) |
| 20 to 24 Year Olds | 518 (75.3%) | 170 (24.7%) |
| 25 to 34 Year Olds | 753 (75.4%) | 246 (24.6%) |
| 35 Years and over | 319 (55.5%) | 256 (44.5%) |
| Total | 9,316 (82.4%) | 1,990 (17.6%) |
Educational Attainment by Field of Study in Minnetonka
Business (5,985 | 21.3%), education (2,713 | 9.7%), social sciences (2,680 | 9.6%), engineering (2,354 | 8.4%), and science & technology (1,988 | 7.1%) are the most common fields of study among 28,058 individuals in Minnetonka who have obtained a bachelor's degree or higher.
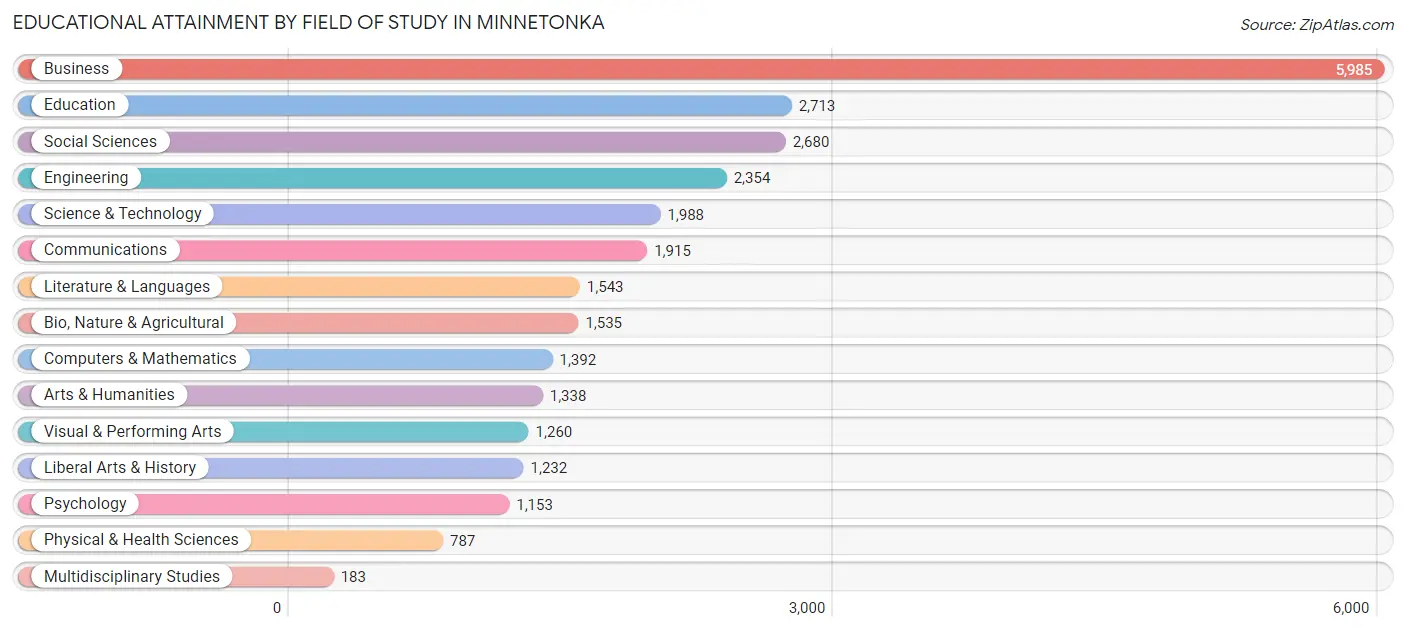
| Field of Study | # Graduates | % Graduates |
| Computers & Mathematics | 1,392 | 5.0% |
| Bio, Nature & Agricultural | 1,535 | 5.5% |
| Physical & Health Sciences | 787 | 2.8% |
| Psychology | 1,153 | 4.1% |
| Social Sciences | 2,680 | 9.6% |
| Engineering | 2,354 | 8.4% |
| Multidisciplinary Studies | 183 | 0.6% |
| Science & Technology | 1,988 | 7.1% |
| Business | 5,985 | 21.3% |
| Education | 2,713 | 9.7% |
| Literature & Languages | 1,543 | 5.5% |
| Liberal Arts & History | 1,232 | 4.4% |
| Visual & Performing Arts | 1,260 | 4.5% |
| Communications | 1,915 | 6.8% |
| Arts & Humanities | 1,338 | 4.8% |
| Total | 28,058 | 100.0% |
Transportation & Commute in Minnetonka
Vehicle Availability by Sex in Minnetonka
The most prevalent vehicle ownership categories in Minnetonka are males with 2 vehicles (8,835, accounting for 56.6%) and females with 2 vehicles (7,215, making up 64.4%).
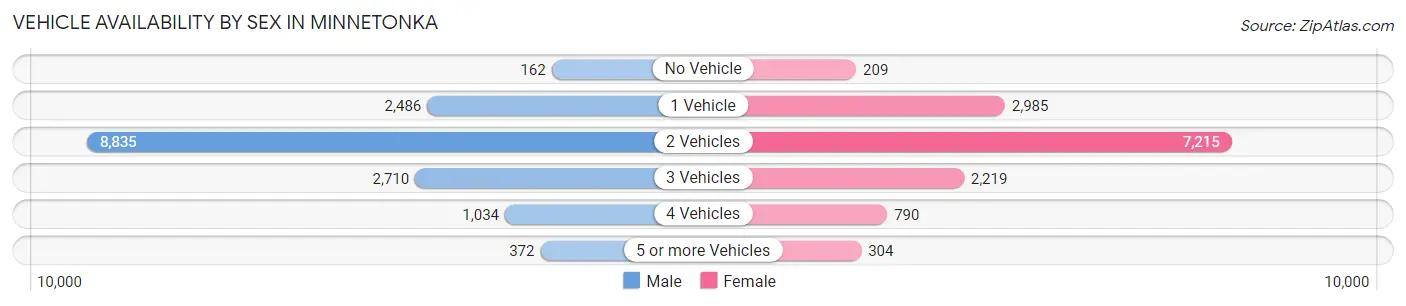
| Vehicles Available | Male | Female |
| No Vehicle | 162 (1.0%) | 209 (1.5%) |
| 1 Vehicle | 2,486 (15.9%) | 2,985 (21.7%) |
| 2 Vehicles | 8,835 (56.6%) | 7,215 (52.6%) |
| 3 Vehicles | 2,710 (17.4%) | 2,219 (16.2%) |
| 4 Vehicles | 1,034 (6.6%) | 790 (5.8%) |
| 5 or more Vehicles | 372 (2.4%) | 304 (2.2%) |
| Total | 15,599 (100.0%) | 13,722 (100.0%) |
Commute Time in Minnetonka
The most frequently occuring commute durations in Minnetonka are 20 to 24 minutes (5,085 commuters, 22.4%), 10 to 14 minutes (4,200 commuters, 18.5%), and 15 to 19 minutes (4,148 commuters, 18.3%).
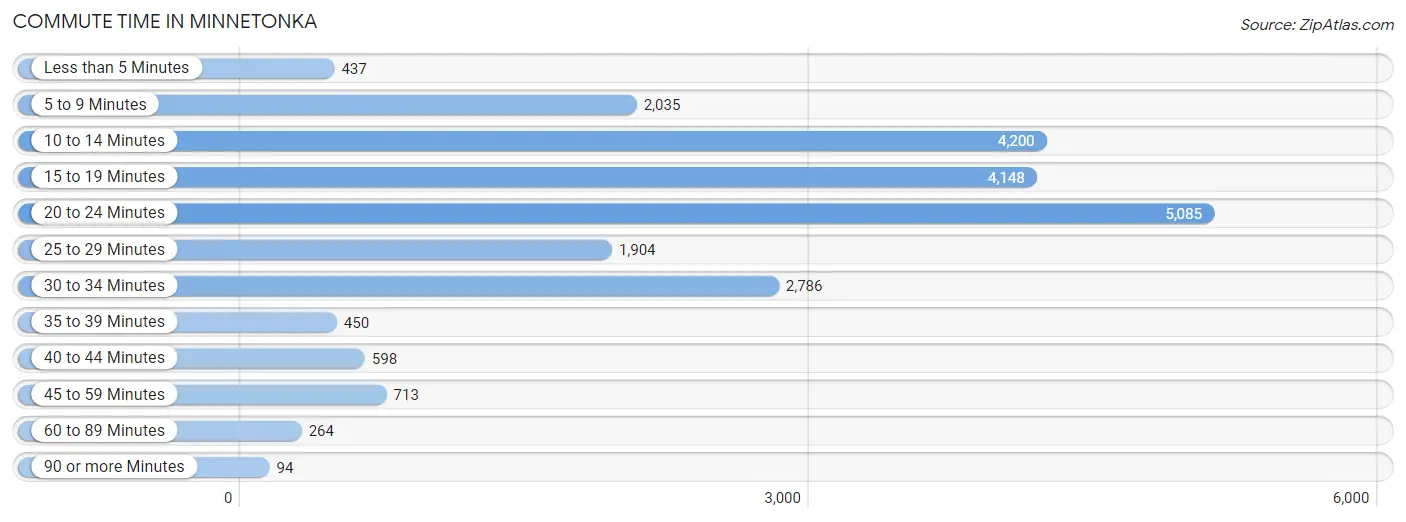
| Commute Time | # Commuters | % Commuters |
| Less than 5 Minutes | 437 | 1.9% |
| 5 to 9 Minutes | 2,035 | 9.0% |
| 10 to 14 Minutes | 4,200 | 18.5% |
| 15 to 19 Minutes | 4,148 | 18.3% |
| 20 to 24 Minutes | 5,085 | 22.4% |
| 25 to 29 Minutes | 1,904 | 8.4% |
| 30 to 34 Minutes | 2,786 | 12.3% |
| 35 to 39 Minutes | 450 | 2.0% |
| 40 to 44 Minutes | 598 | 2.6% |
| 45 to 59 Minutes | 713 | 3.1% |
| 60 to 89 Minutes | 264 | 1.2% |
| 90 or more Minutes | 94 | 0.4% |
Commute Time by Sex in Minnetonka
The most common commute times in Minnetonka are 20 to 24 minutes (2,866 commuters, 23.7%) for males and 20 to 24 minutes (2,219 commuters, 20.9%) for females.
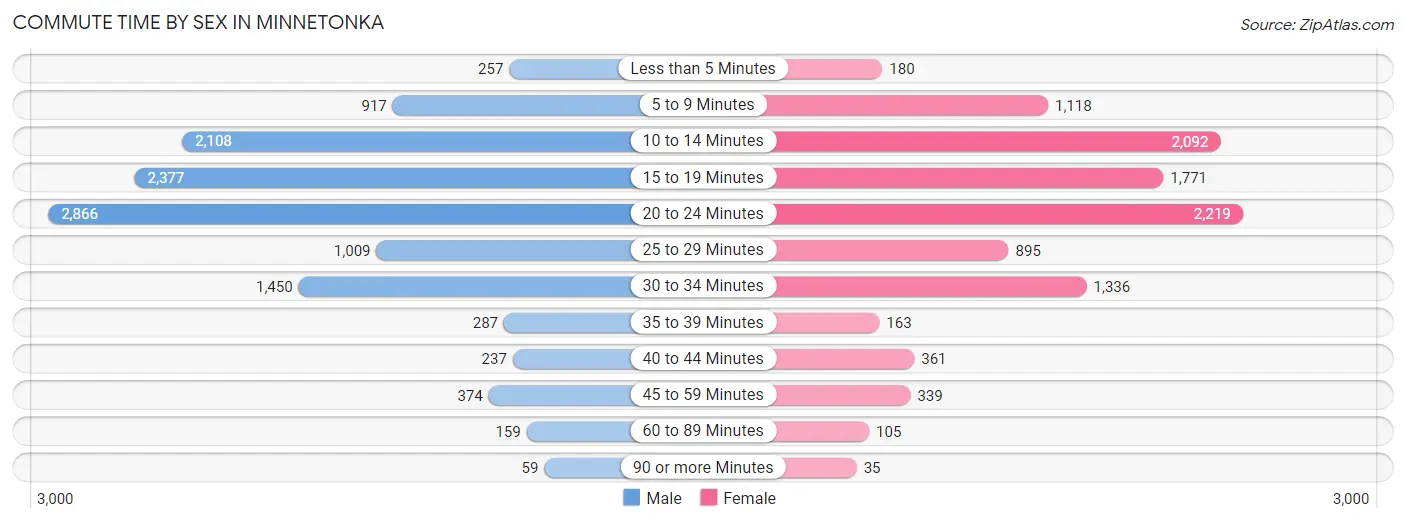
| Commute Time | Male | Female |
| Less than 5 Minutes | 257 (2.1%) | 180 (1.7%) |
| 5 to 9 Minutes | 917 (7.6%) | 1,118 (10.5%) |
| 10 to 14 Minutes | 2,108 (17.4%) | 2,092 (19.7%) |
| 15 to 19 Minutes | 2,377 (19.6%) | 1,771 (16.7%) |
| 20 to 24 Minutes | 2,866 (23.7%) | 2,219 (20.9%) |
| 25 to 29 Minutes | 1,009 (8.3%) | 895 (8.4%) |
| 30 to 34 Minutes | 1,450 (12.0%) | 1,336 (12.6%) |
| 35 to 39 Minutes | 287 (2.4%) | 163 (1.5%) |
| 40 to 44 Minutes | 237 (2.0%) | 361 (3.4%) |
| 45 to 59 Minutes | 374 (3.1%) | 339 (3.2%) |
| 60 to 89 Minutes | 159 (1.3%) | 105 (1.0%) |
| 90 or more Minutes | 59 (0.5%) | 35 (0.3%) |
Time of Departure to Work by Sex in Minnetonka
The most frequent times of departure to work in Minnetonka are 8:00 AM to 8:29 AM (2,179, 18.0%) for males and 8:00 AM to 8:29 AM (1,755, 16.5%) for females.
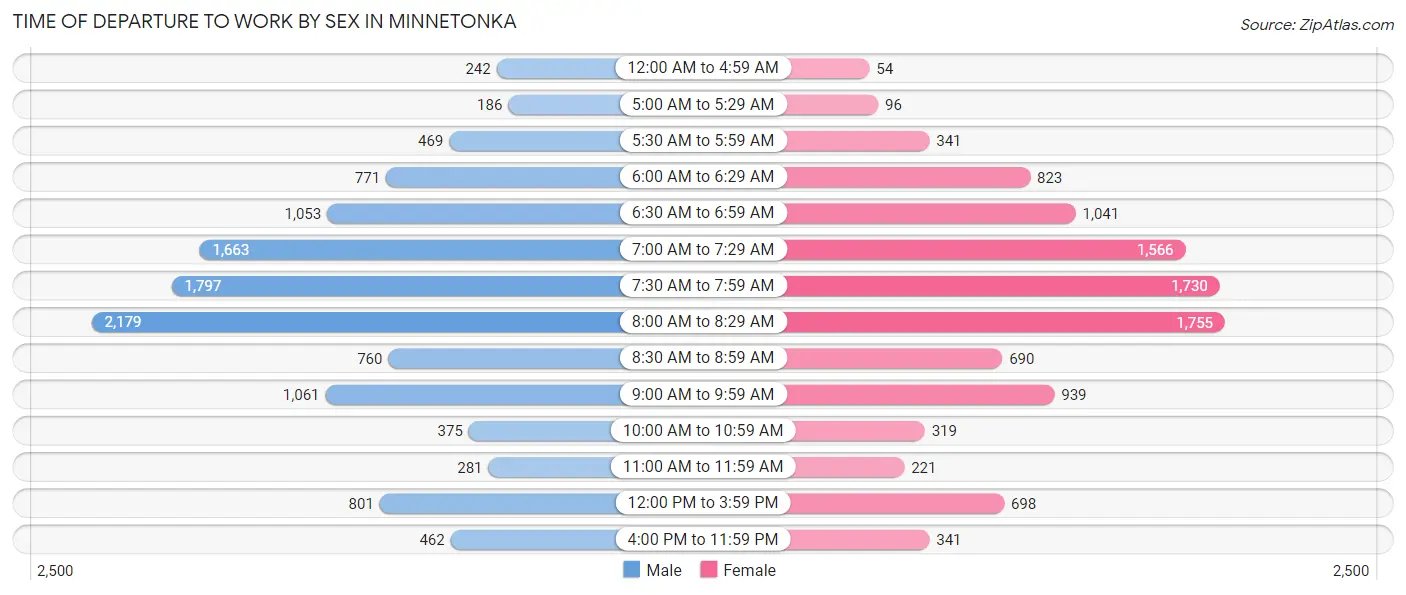
| Time of Departure | Male | Female |
| 12:00 AM to 4:59 AM | 242 (2.0%) | 54 (0.5%) |
| 5:00 AM to 5:29 AM | 186 (1.5%) | 96 (0.9%) |
| 5:30 AM to 5:59 AM | 469 (3.9%) | 341 (3.2%) |
| 6:00 AM to 6:29 AM | 771 (6.4%) | 823 (7.7%) |
| 6:30 AM to 6:59 AM | 1,053 (8.7%) | 1,041 (9.8%) |
| 7:00 AM to 7:29 AM | 1,663 (13.7%) | 1,566 (14.7%) |
| 7:30 AM to 7:59 AM | 1,797 (14.8%) | 1,730 (16.3%) |
| 8:00 AM to 8:29 AM | 2,179 (18.0%) | 1,755 (16.5%) |
| 8:30 AM to 8:59 AM | 760 (6.3%) | 690 (6.5%) |
| 9:00 AM to 9:59 AM | 1,061 (8.8%) | 939 (8.8%) |
| 10:00 AM to 10:59 AM | 375 (3.1%) | 319 (3.0%) |
| 11:00 AM to 11:59 AM | 281 (2.3%) | 221 (2.1%) |
| 12:00 PM to 3:59 PM | 801 (6.6%) | 698 (6.6%) |
| 4:00 PM to 11:59 PM | 462 (3.8%) | 341 (3.2%) |
| Total | 12,100 (100.0%) | 10,614 (100.0%) |
Housing Occupancy in Minnetonka
Occupancy by Ownership in Minnetonka
Of the total 23,402 dwellings in Minnetonka, owner-occupied units account for 16,905 (72.2%), while renter-occupied units make up 6,497 (27.8%).
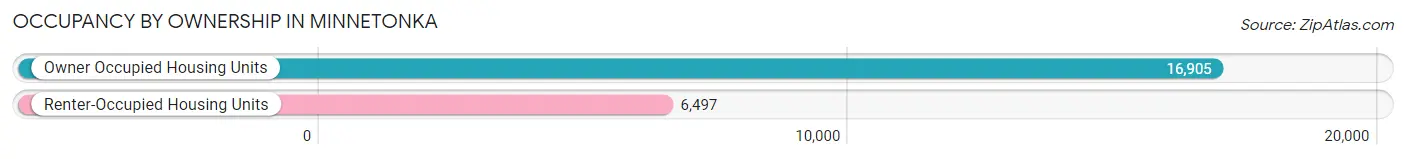
| Occupancy | # Housing Units | % Housing Units |
| Owner Occupied Housing Units | 16,905 | 72.2% |
| Renter-Occupied Housing Units | 6,497 | 27.8% |
| Total Occupied Housing Units | 23,402 | 100.0% |
Occupancy by Household Size in Minnetonka
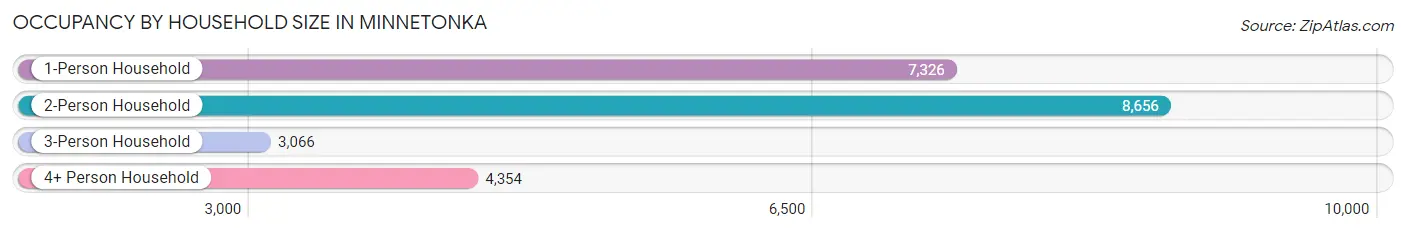
| Household Size | # Housing Units | % Housing Units |
| 1-Person Household | 7,326 | 31.3% |
| 2-Person Household | 8,656 | 37.0% |
| 3-Person Household | 3,066 | 13.1% |
| 4+ Person Household | 4,354 | 18.6% |
| Total Housing Units | 23,402 | 100.0% |
Occupancy by Ownership by Household Size in Minnetonka
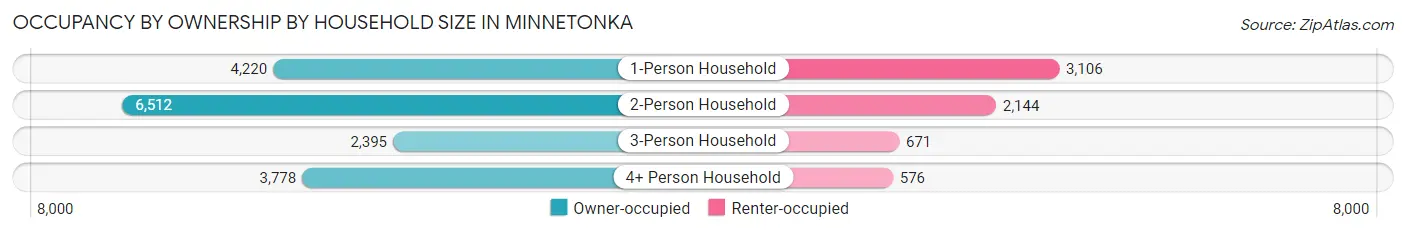
| Household Size | Owner-occupied | Renter-occupied |
| 1-Person Household | 4,220 (57.6%) | 3,106 (42.4%) |
| 2-Person Household | 6,512 (75.2%) | 2,144 (24.8%) |
| 3-Person Household | 2,395 (78.1%) | 671 (21.9%) |
| 4+ Person Household | 3,778 (86.8%) | 576 (13.2%) |
| Total Housing Units | 16,905 (72.2%) | 6,497 (27.8%) |
Occupancy by Educational Attainment in Minnetonka
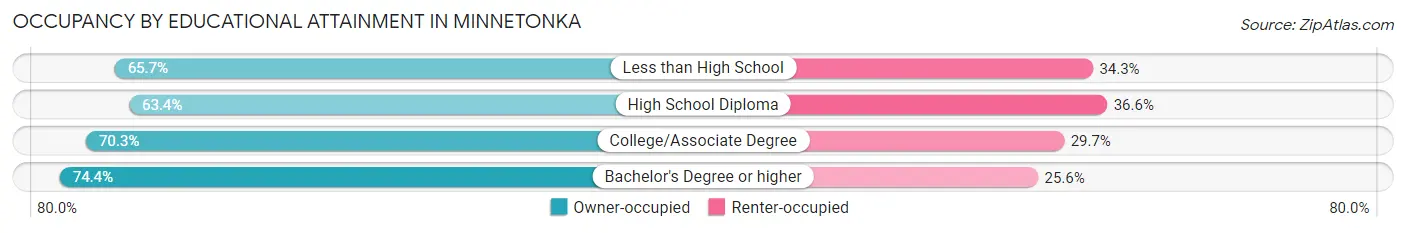
| Household Size | Owner-occupied | Renter-occupied |
| Less than High School | 249 (65.7%) | 130 (34.3%) |
| High School Diploma | 1,438 (63.4%) | 829 (36.6%) |
| College/Associate Degree | 3,828 (70.3%) | 1,620 (29.7%) |
| Bachelor's Degree or higher | 11,390 (74.4%) | 3,918 (25.6%) |
Occupancy by Age of Householder in Minnetonka
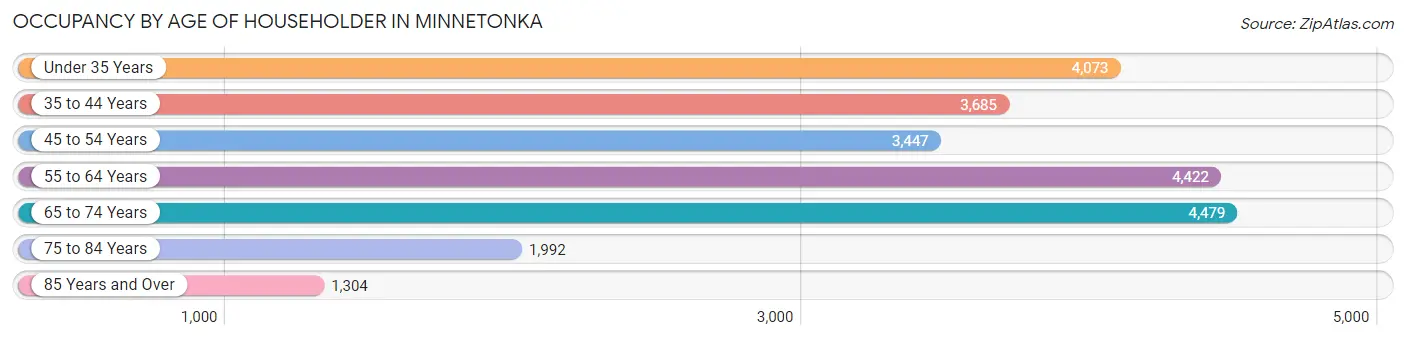
| Age Bracket | # Households | % Households |
| Under 35 Years | 4,073 | 17.4% |
| 35 to 44 Years | 3,685 | 15.8% |
| 45 to 54 Years | 3,447 | 14.7% |
| 55 to 64 Years | 4,422 | 18.9% |
| 65 to 74 Years | 4,479 | 19.1% |
| 75 to 84 Years | 1,992 | 8.5% |
| 85 Years and Over | 1,304 | 5.6% |
| Total | 23,402 | 100.0% |
Housing Finances in Minnetonka
Median Income by Occupancy in Minnetonka
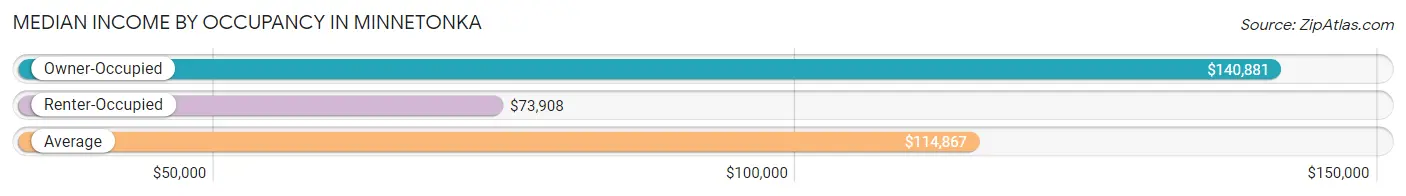
| Occupancy Type | # Households | Median Income |
| Owner-Occupied | 16,905 (72.2%) | $140,881 |
| Renter-Occupied | 6,497 (27.8%) | $73,908 |
| Average | 23,402 (100.0%) | $114,867 |
Occupancy by Householder Income Bracket in Minnetonka
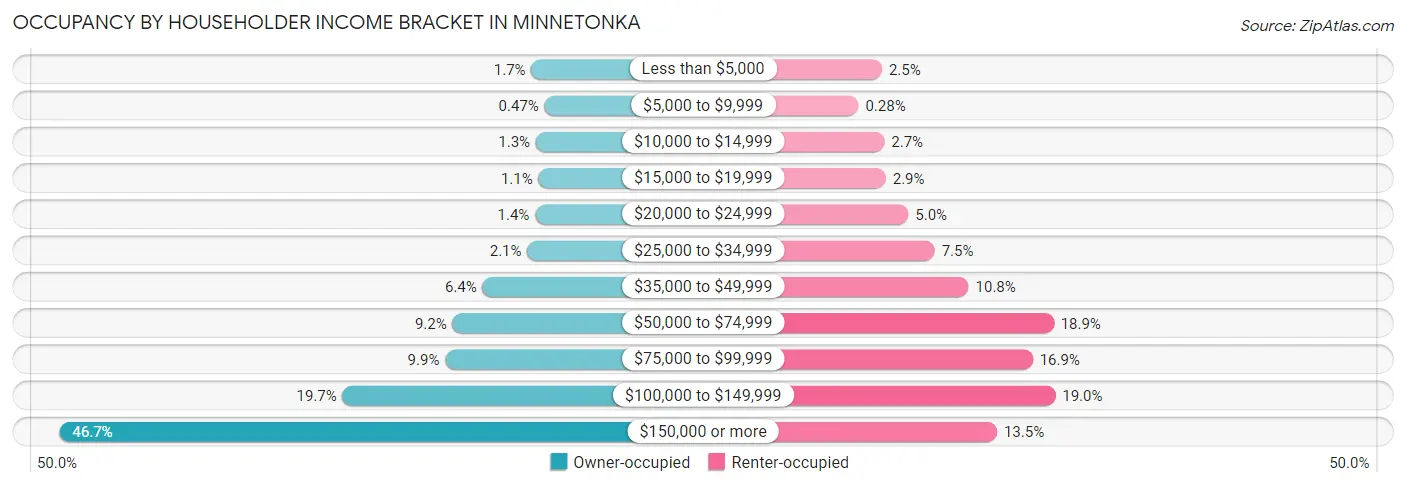
| Income Bracket | Owner-occupied | Renter-occupied |
| Less than $5,000 | 292 (1.7%) | 164 (2.5%) |
| $5,000 to $9,999 | 79 (0.5%) | 18 (0.3%) |
| $10,000 to $14,999 | 219 (1.3%) | 178 (2.7%) |
| $15,000 to $19,999 | 178 (1.1%) | 187 (2.9%) |
| $20,000 to $24,999 | 232 (1.4%) | 327 (5.0%) |
| $25,000 to $34,999 | 359 (2.1%) | 490 (7.5%) |
| $35,000 to $49,999 | 1,078 (6.4%) | 700 (10.8%) |
| $50,000 to $74,999 | 1,562 (9.2%) | 1,226 (18.9%) |
| $75,000 to $99,999 | 1,680 (9.9%) | 1,096 (16.9%) |
| $100,000 to $149,999 | 3,334 (19.7%) | 1,236 (19.0%) |
| $150,000 or more | 7,892 (46.7%) | 875 (13.5%) |
| Total | 16,905 (100.0%) | 6,497 (100.0%) |
Monthly Housing Cost Tiers in Minnetonka
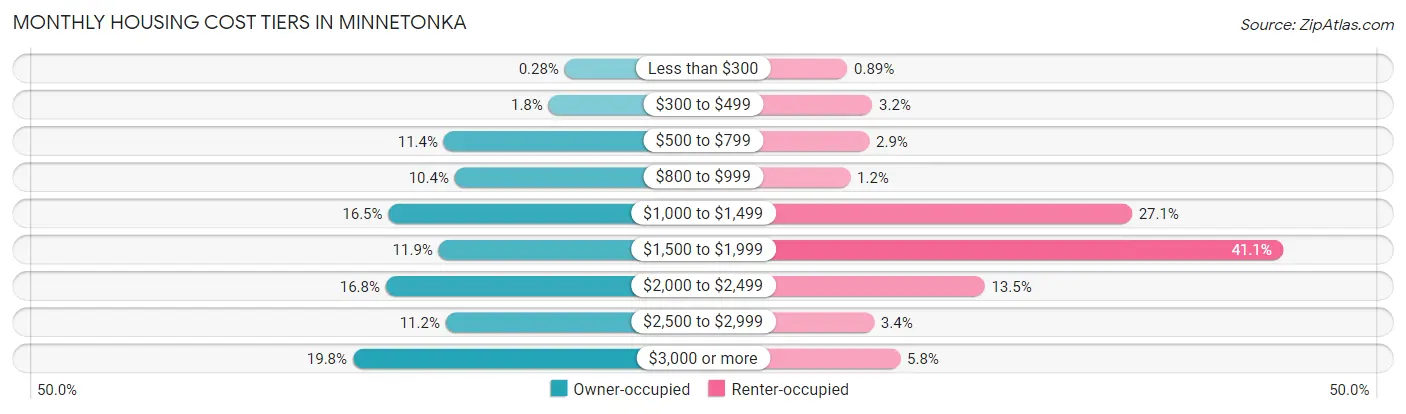
| Monthly Cost | Owner-occupied | Renter-occupied |
| Less than $300 | 48 (0.3%) | 58 (0.9%) |
| $300 to $499 | 298 (1.8%) | 208 (3.2%) |
| $500 to $799 | 1,929 (11.4%) | 190 (2.9%) |
| $800 to $999 | 1,758 (10.4%) | 76 (1.2%) |
| $1,000 to $1,499 | 2,791 (16.5%) | 1,760 (27.1%) |
| $1,500 to $1,999 | 2,008 (11.9%) | 2,669 (41.1%) |
| $2,000 to $2,499 | 2,831 (16.8%) | 880 (13.5%) |
| $2,500 to $2,999 | 1,898 (11.2%) | 218 (3.4%) |
| $3,000 or more | 3,344 (19.8%) | 375 (5.8%) |
| Total | 16,905 (100.0%) | 6,497 (100.0%) |
Physical Housing Characteristics in Minnetonka
Housing Structures in Minnetonka
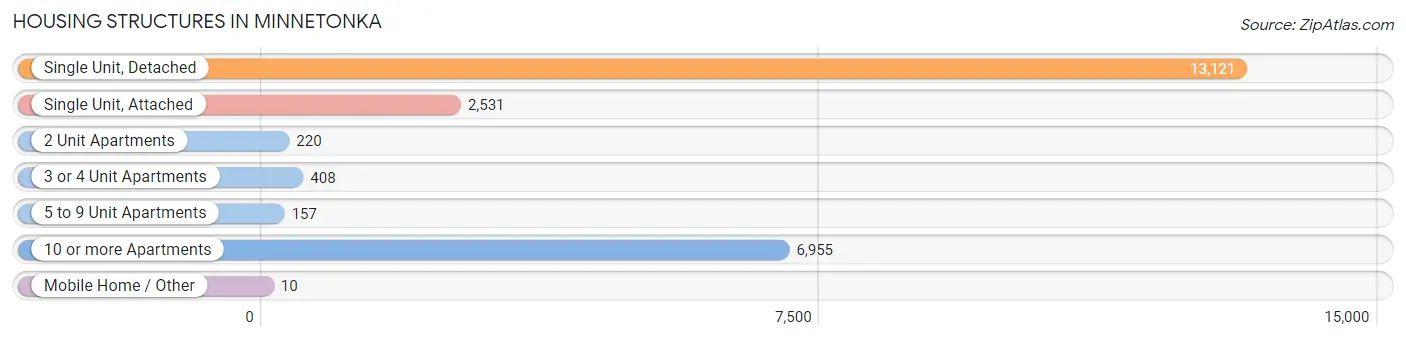
| Structure Type | # Housing Units | % Housing Units |
| Single Unit, Detached | 13,121 | 56.1% |
| Single Unit, Attached | 2,531 | 10.8% |
| 2 Unit Apartments | 220 | 0.9% |
| 3 or 4 Unit Apartments | 408 | 1.7% |
| 5 to 9 Unit Apartments | 157 | 0.7% |
| 10 or more Apartments | 6,955 | 29.7% |
| Mobile Home / Other | 10 | 0.0% |
| Total | 23,402 | 100.0% |
Housing Structures by Occupancy in Minnetonka
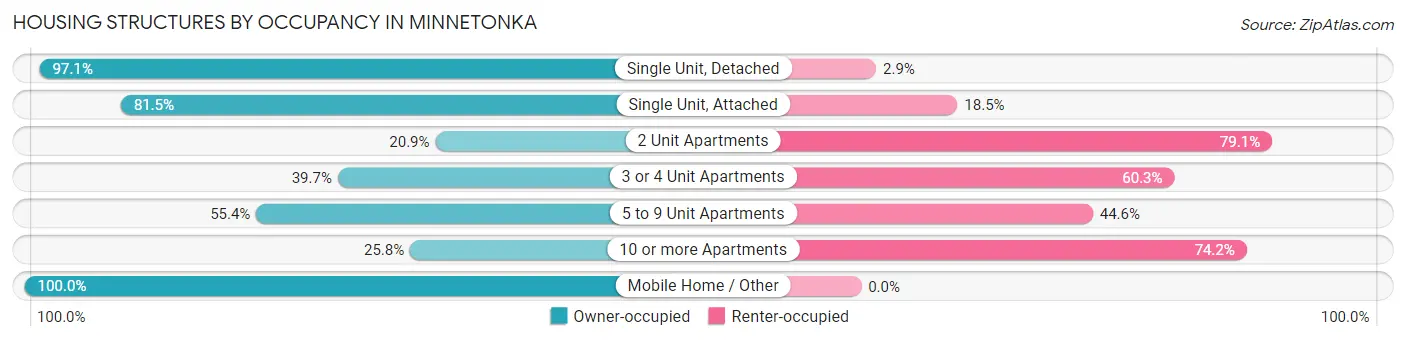
| Structure Type | Owner-occupied | Renter-occupied |
| Single Unit, Detached | 12,745 (97.1%) | 376 (2.9%) |
| Single Unit, Attached | 2,062 (81.5%) | 469 (18.5%) |
| 2 Unit Apartments | 46 (20.9%) | 174 (79.1%) |
| 3 or 4 Unit Apartments | 162 (39.7%) | 246 (60.3%) |
| 5 to 9 Unit Apartments | 87 (55.4%) | 70 (44.6%) |
| 10 or more Apartments | 1,793 (25.8%) | 5,162 (74.2%) |
| Mobile Home / Other | 10 (100.0%) | 0 (0.0%) |
| Total | 16,905 (72.2%) | 6,497 (27.8%) |
Housing Structures by Number of Rooms in Minnetonka
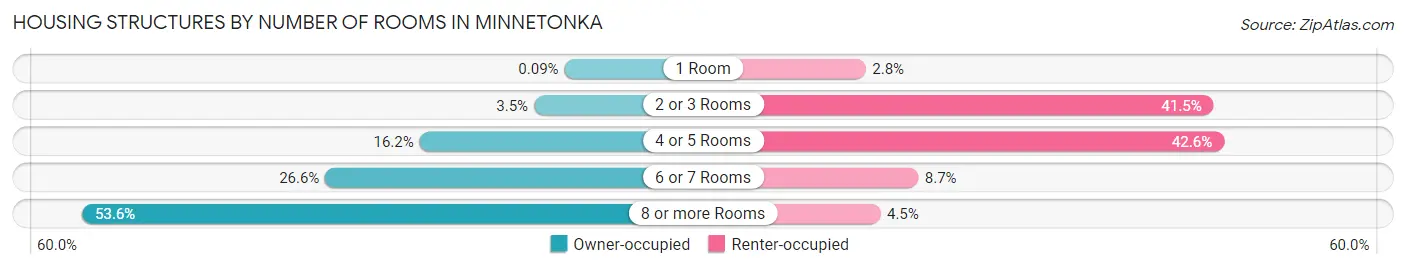
| Number of Rooms | Owner-occupied | Renter-occupied |
| 1 Room | 16 (0.1%) | 183 (2.8%) |
| 2 or 3 Rooms | 586 (3.5%) | 2,694 (41.5%) |
| 4 or 5 Rooms | 2,734 (16.2%) | 2,769 (42.6%) |
| 6 or 7 Rooms | 4,503 (26.6%) | 562 (8.6%) |
| 8 or more Rooms | 9,066 (53.6%) | 289 (4.4%) |
| Total | 16,905 (100.0%) | 6,497 (100.0%) |
Housing Structure by Heating Type in Minnetonka
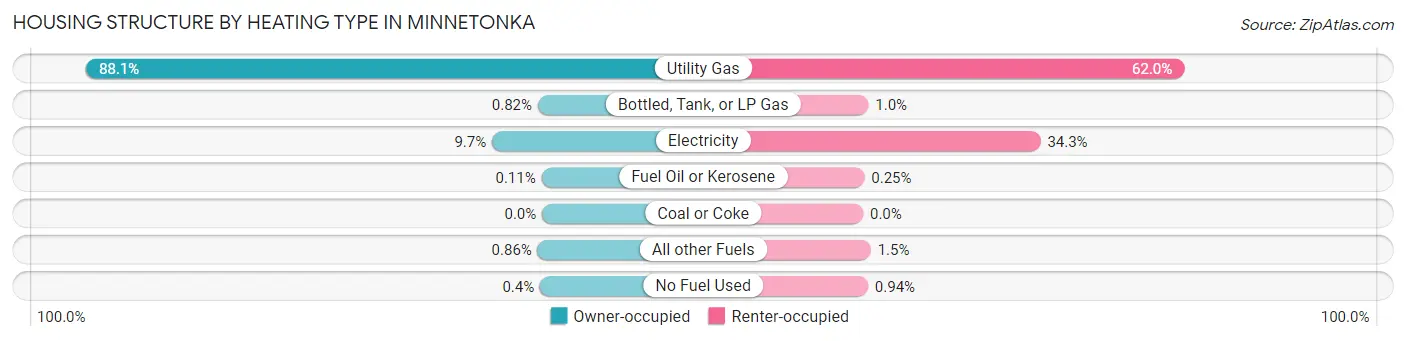
| Heating Type | Owner-occupied | Renter-occupied |
| Utility Gas | 14,900 (88.1%) | 4,030 (62.0%) |
| Bottled, Tank, or LP Gas | 139 (0.8%) | 66 (1.0%) |
| Electricity | 1,635 (9.7%) | 2,227 (34.3%) |
| Fuel Oil or Kerosene | 19 (0.1%) | 16 (0.3%) |
| Coal or Coke | 0 (0.0%) | 0 (0.0%) |
| All other Fuels | 145 (0.9%) | 97 (1.5%) |
| No Fuel Used | 67 (0.4%) | 61 (0.9%) |
| Total | 16,905 (100.0%) | 6,497 (100.0%) |
Household Vehicle Usage in Minnetonka
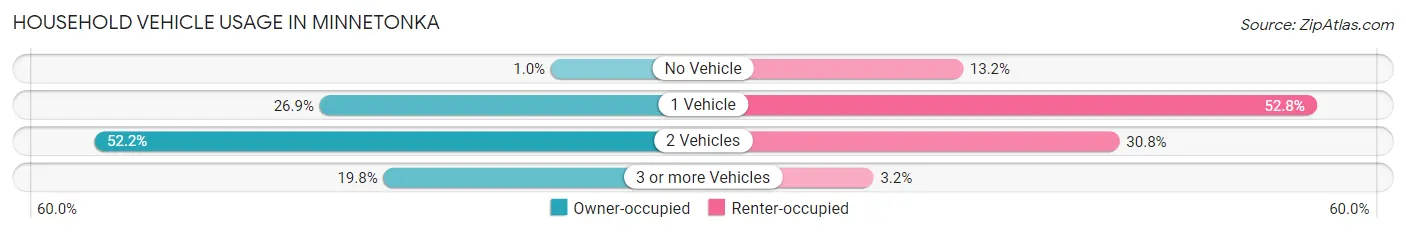
| Vehicles per Household | Owner-occupied | Renter-occupied |
| No Vehicle | 175 (1.0%) | 858 (13.2%) |
| 1 Vehicle | 4,554 (26.9%) | 3,433 (52.8%) |
| 2 Vehicles | 8,829 (52.2%) | 1,998 (30.7%) |
| 3 or more Vehicles | 3,347 (19.8%) | 208 (3.2%) |
| Total | 16,905 (100.0%) | 6,497 (100.0%) |
Real Estate & Mortgages in Minnetonka
Real Estate and Mortgage Overview in Minnetonka
| Characteristic | Without Mortgage | With Mortgage |
| Housing Units | 5,438 | 11,467 |
| Median Property Value | $402,600 | $443,100 |
| Median Household Income | $105,515 | $6,133 |
| Monthly Housing Costs | $871 | $3,283 |
| Real Estate Taxes | $4,707 | $38 |
Property Value by Mortgage Status in Minnetonka
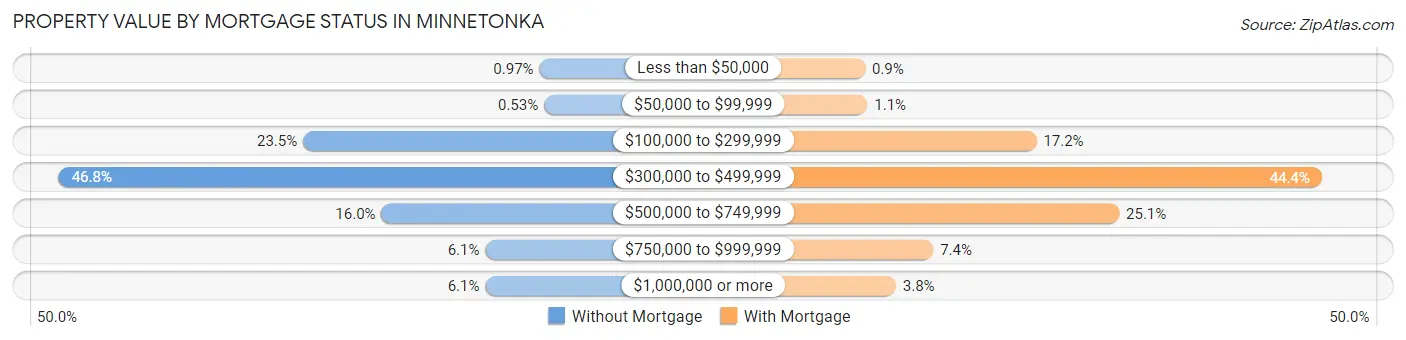
| Property Value | Without Mortgage | With Mortgage |
| Less than $50,000 | 53 (1.0%) | 103 (0.9%) |
| $50,000 to $99,999 | 29 (0.5%) | 129 (1.1%) |
| $100,000 to $299,999 | 1,277 (23.5%) | 1,976 (17.2%) |
| $300,000 to $499,999 | 2,542 (46.8%) | 5,092 (44.4%) |
| $500,000 to $749,999 | 871 (16.0%) | 2,878 (25.1%) |
| $750,000 to $999,999 | 333 (6.1%) | 849 (7.4%) |
| $1,000,000 or more | 333 (6.1%) | 440 (3.8%) |
| Total | 5,438 (100.0%) | 11,467 (100.0%) |
Household Income by Mortgage Status in Minnetonka

| Household Income | Without Mortgage | With Mortgage |
| Less than $10,000 | 201 (3.7%) | 242 (2.1%) |
| $10,000 to $24,999 | 383 (7.0%) | 170 (1.5%) |
| $25,000 to $34,999 | 191 (3.5%) | 246 (2.1%) |
| $35,000 to $49,999 | 451 (8.3%) | 168 (1.5%) |
| $50,000 to $74,999 | 686 (12.6%) | 627 (5.5%) |
| $75,000 to $99,999 | 686 (12.6%) | 876 (7.6%) |
| $100,000 to $149,999 | 1,081 (19.9%) | 994 (8.7%) |
| $150,000 or more | 1,759 (32.4%) | 2,253 (19.7%) |
| Total | 5,438 (100.0%) | 11,467 (100.0%) |
Property Value to Household Income Ratio in Minnetonka
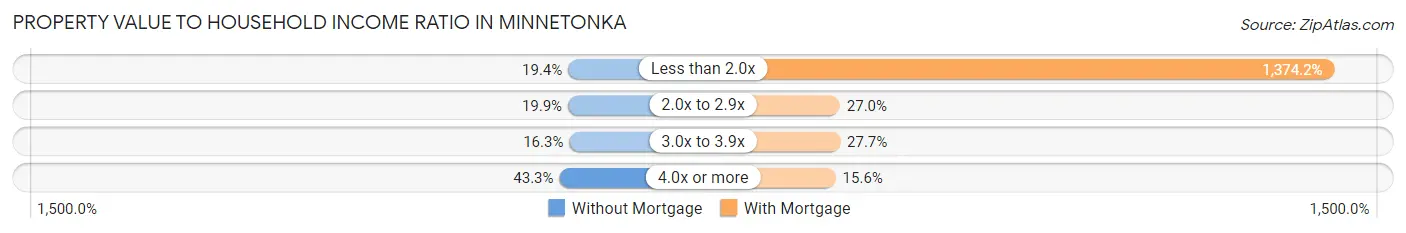
| Value-to-Income Ratio | Without Mortgage | With Mortgage |
| Less than 2.0x | 1,053 (19.4%) | 157,582 (1,374.2%) |
| 2.0x to 2.9x | 1,081 (19.9%) | 3,099 (27.0%) |
| 3.0x to 3.9x | 888 (16.3%) | 3,173 (27.7%) |
| 4.0x or more | 2,353 (43.3%) | 1,792 (15.6%) |
| Total | 5,438 (100.0%) | 11,467 (100.0%) |
Real Estate Taxes by Mortgage Status in Minnetonka
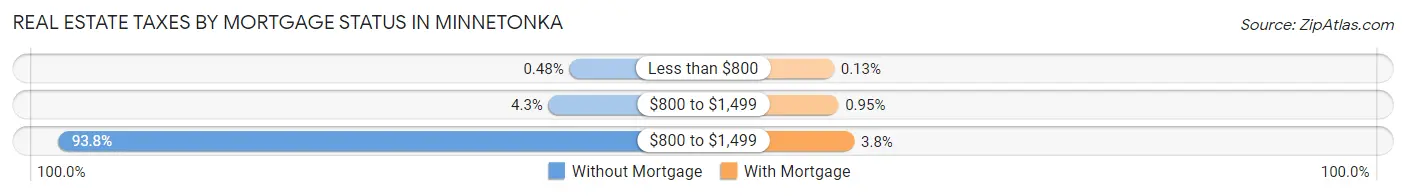
| Property Taxes | Without Mortgage | With Mortgage |
| Less than $800 | 26 (0.5%) | 15 (0.1%) |
| $800 to $1,499 | 233 (4.3%) | 109 (0.9%) |
| $800 to $1,499 | 5,098 (93.8%) | 440 (3.8%) |
| Total | 5,438 (100.0%) | 11,467 (100.0%) |
Health & Disability in Minnetonka
Health Insurance Coverage by Age in Minnetonka
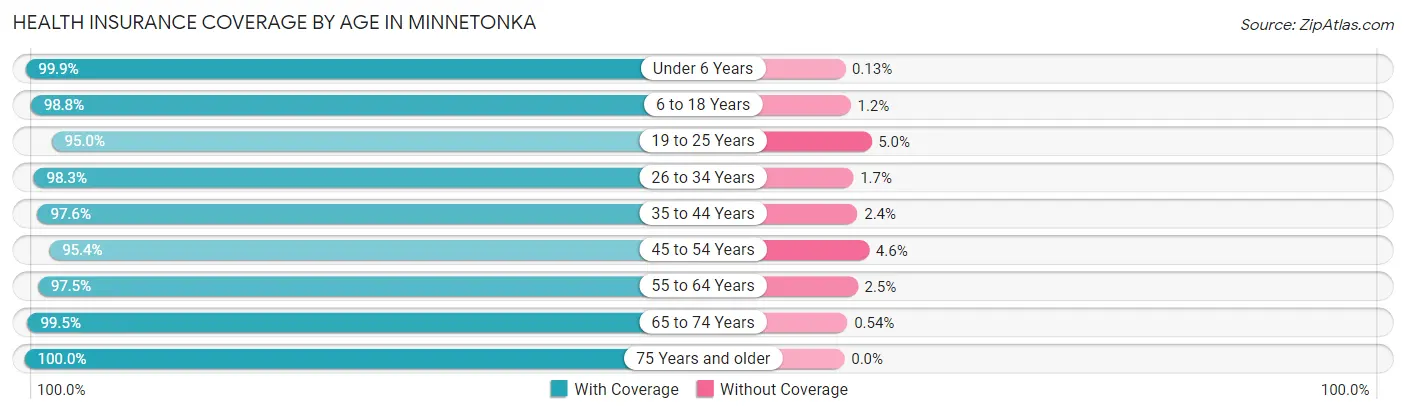
| Age Bracket | With Coverage | Without Coverage |
| Under 6 Years | 3,732 (99.9%) | 5 (0.1%) |
| 6 to 18 Years | 7,685 (98.8%) | 90 (1.2%) |
| 19 to 25 Years | 2,684 (95.0%) | 142 (5.0%) |
| 26 to 34 Years | 6,776 (98.3%) | 115 (1.7%) |
| 35 to 44 Years | 6,808 (97.6%) | 169 (2.4%) |
| 45 to 54 Years | 5,951 (95.4%) | 286 (4.6%) |
| 55 to 64 Years | 7,380 (97.5%) | 187 (2.5%) |
| 65 to 74 Years | 6,775 (99.5%) | 37 (0.5%) |
| 75 Years and older | 4,479 (100.0%) | 0 (0.0%) |
| Total | 52,270 (98.1%) | 1,031 (1.9%) |
Health Insurance Coverage by Citizenship Status in Minnetonka
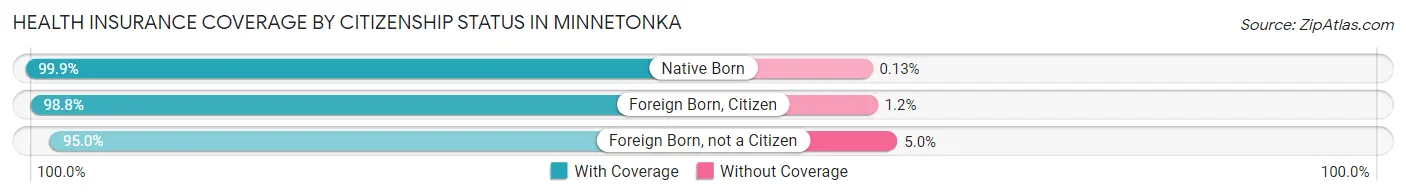
| Citizenship Status | With Coverage | Without Coverage |
| Native Born | 3,732 (99.9%) | 5 (0.1%) |
| Foreign Born, Citizen | 7,685 (98.8%) | 90 (1.2%) |
| Foreign Born, not a Citizen | 2,684 (95.0%) | 142 (5.0%) |
Health Insurance Coverage by Household Income in Minnetonka
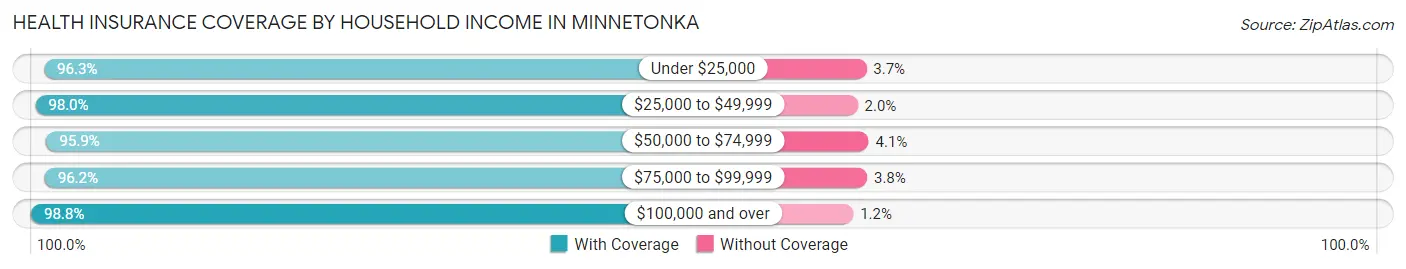
| Household Income | With Coverage | Without Coverage |
| Under $25,000 | 2,545 (96.3%) | 97 (3.7%) |
| $25,000 to $49,999 | 3,790 (98.0%) | 78 (2.0%) |
| $50,000 to $74,999 | 4,921 (95.9%) | 210 (4.1%) |
| $75,000 to $99,999 | 5,202 (96.2%) | 205 (3.8%) |
| $100,000 and over | 35,713 (98.8%) | 436 (1.2%) |
Public vs Private Health Insurance Coverage by Age in Minnetonka
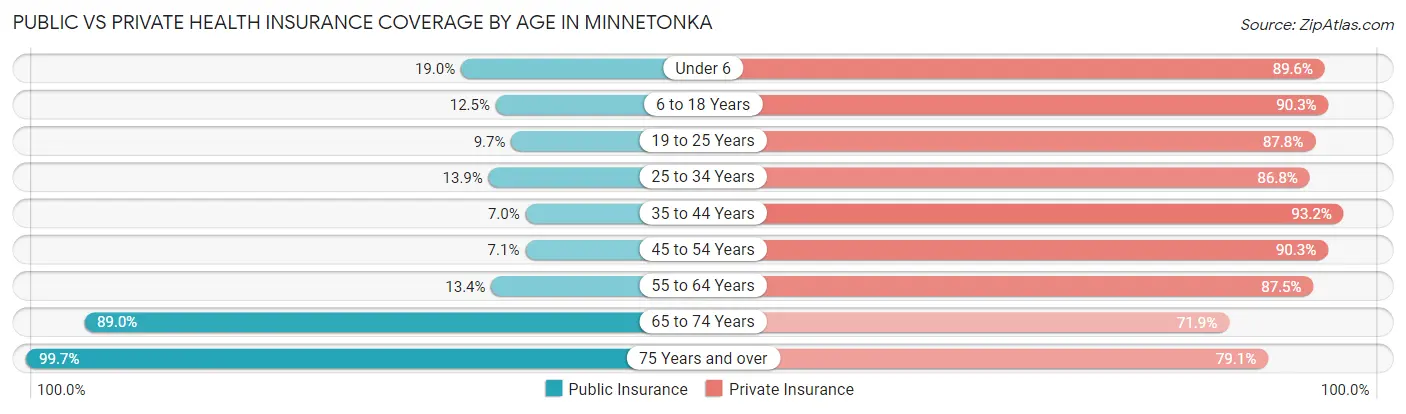
| Age Bracket | Public Insurance | Private Insurance |
| Under 6 | 710 (19.0%) | 3,350 (89.6%) |
| 6 to 18 Years | 975 (12.5%) | 7,022 (90.3%) |
| 19 to 25 Years | 273 (9.7%) | 2,482 (87.8%) |
| 25 to 34 Years | 956 (13.9%) | 5,984 (86.8%) |
| 35 to 44 Years | 489 (7.0%) | 6,499 (93.1%) |
| 45 to 54 Years | 441 (7.1%) | 5,629 (90.2%) |
| 55 to 64 Years | 1,011 (13.4%) | 6,623 (87.5%) |
| 65 to 74 Years | 6,061 (89.0%) | 4,896 (71.9%) |
| 75 Years and over | 4,466 (99.7%) | 3,543 (79.1%) |
| Total | 15,382 (28.9%) | 46,028 (86.4%) |
Disability Status by Sex by Age in Minnetonka
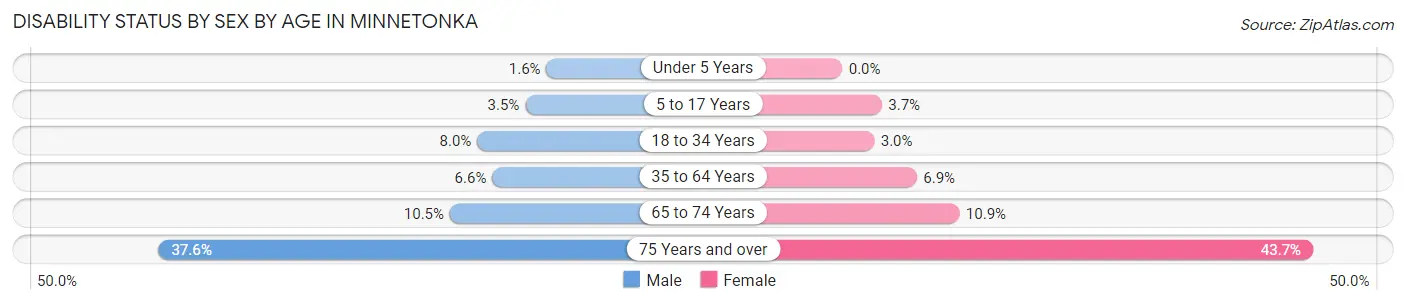
| Age Bracket | Male | Female |
| Under 5 Years | 26 (1.6%) | 0 (0.0%) |
| 5 to 17 Years | 153 (3.5%) | 134 (3.7%) |
| 18 to 34 Years | 418 (8.0%) | 145 (3.0%) |
| 35 to 64 Years | 663 (6.6%) | 743 (6.9%) |
| 65 to 74 Years | 350 (10.5%) | 379 (10.9%) |
| 75 Years and over | 686 (37.6%) | 1,160 (43.7%) |
Disability Class by Sex by Age in Minnetonka
Disability Class: Hearing Difficulty
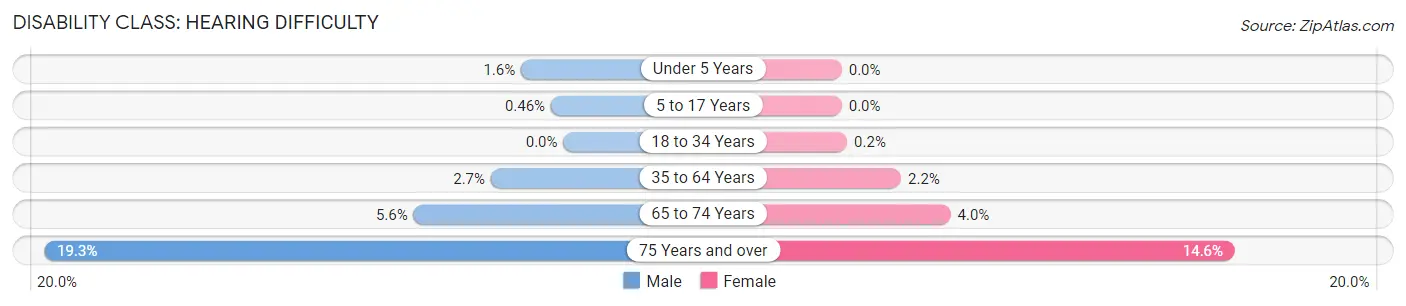
| Age Bracket | Male | Female |
| Under 5 Years | 26 (1.6%) | 0 (0.0%) |
| 5 to 17 Years | 20 (0.5%) | 0 (0.0%) |
| 18 to 34 Years | 0 (0.0%) | 10 (0.2%) |
| 35 to 64 Years | 270 (2.7%) | 236 (2.2%) |
| 65 to 74 Years | 185 (5.6%) | 141 (4.0%) |
| 75 Years and over | 352 (19.3%) | 387 (14.6%) |
Disability Class: Vision Difficulty
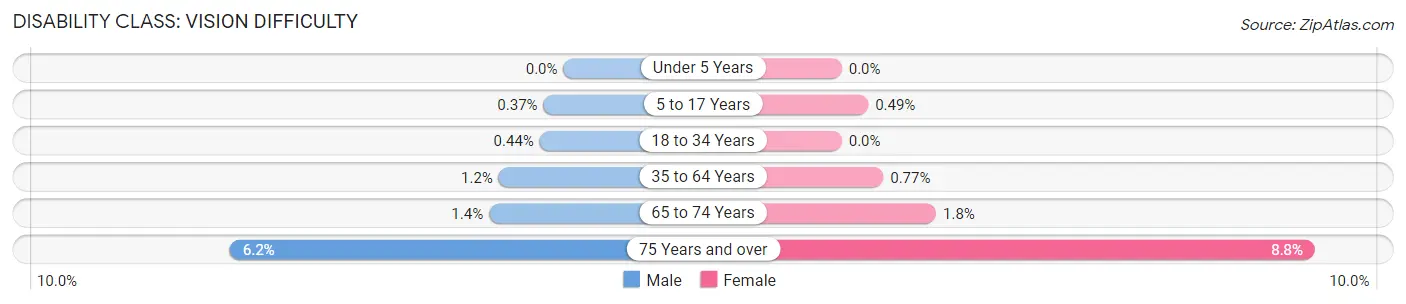
| Age Bracket | Male | Female |
| Under 5 Years | 0 (0.0%) | 0 (0.0%) |
| 5 to 17 Years | 16 (0.4%) | 18 (0.5%) |
| 18 to 34 Years | 23 (0.4%) | 0 (0.0%) |
| 35 to 64 Years | 121 (1.2%) | 83 (0.8%) |
| 65 to 74 Years | 46 (1.4%) | 61 (1.8%) |
| 75 Years and over | 113 (6.2%) | 233 (8.8%) |
Disability Class: Cognitive Difficulty
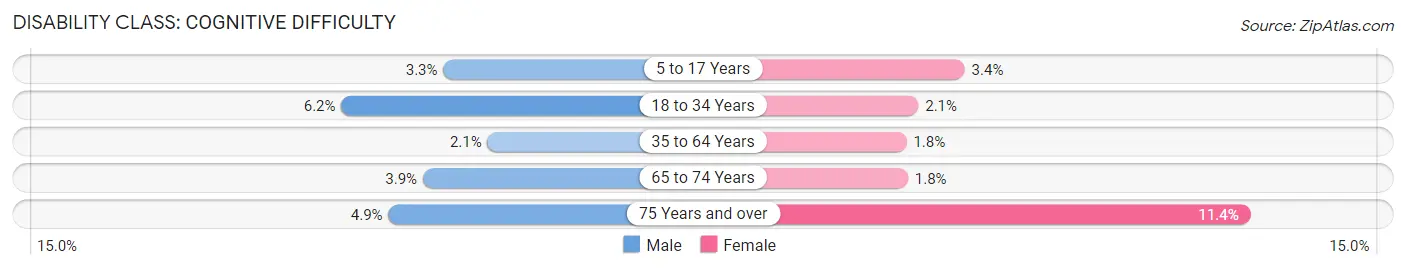
| Age Bracket | Male | Female |
| 5 to 17 Years | 144 (3.3%) | 125 (3.4%) |
| 18 to 34 Years | 323 (6.2%) | 104 (2.1%) |
| 35 to 64 Years | 212 (2.1%) | 193 (1.8%) |
| 65 to 74 Years | 130 (3.9%) | 64 (1.8%) |
| 75 Years and over | 89 (4.9%) | 302 (11.4%) |
Disability Class: Ambulatory Difficulty
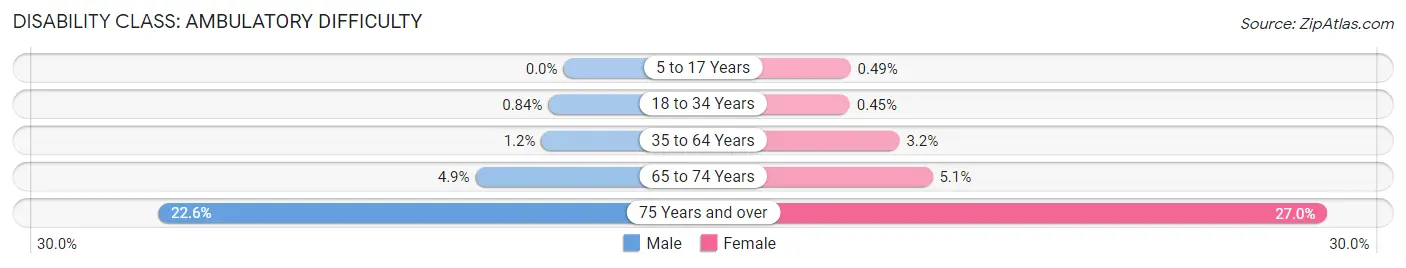
| Age Bracket | Male | Female |
| 5 to 17 Years | 0 (0.0%) | 18 (0.5%) |
| 18 to 34 Years | 44 (0.8%) | 22 (0.4%) |
| 35 to 64 Years | 124 (1.2%) | 344 (3.2%) |
| 65 to 74 Years | 163 (4.9%) | 176 (5.1%) |
| 75 Years and over | 412 (22.6%) | 717 (27.0%) |
Disability Class: Self-Care Difficulty
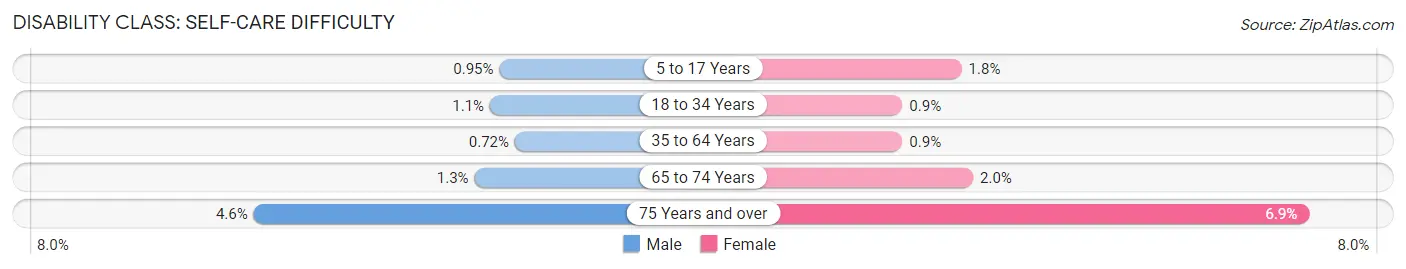
| Age Bracket | Male | Female |
| 5 to 17 Years | 41 (0.9%) | 65 (1.8%) |
| 18 to 34 Years | 57 (1.1%) | 44 (0.9%) |
| 35 to 64 Years | 72 (0.7%) | 97 (0.9%) |
| 65 to 74 Years | 44 (1.3%) | 68 (1.9%) |
| 75 Years and over | 84 (4.6%) | 184 (6.9%) |
Technology Access in Minnetonka
Computing Device Access in Minnetonka
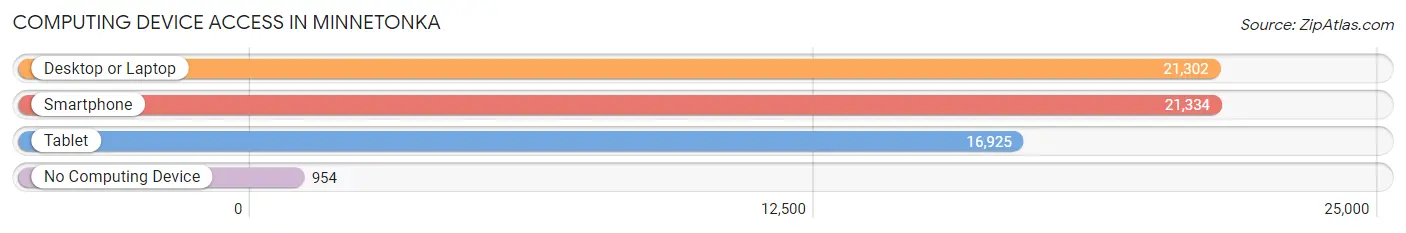
| Device Type | # Households | % Households |
| Desktop or Laptop | 21,302 | 91.0% |
| Smartphone | 21,334 | 91.2% |
| Tablet | 16,925 | 72.3% |
| No Computing Device | 954 | 4.1% |
| Total | 23,402 | 100.0% |
Internet Access in Minnetonka
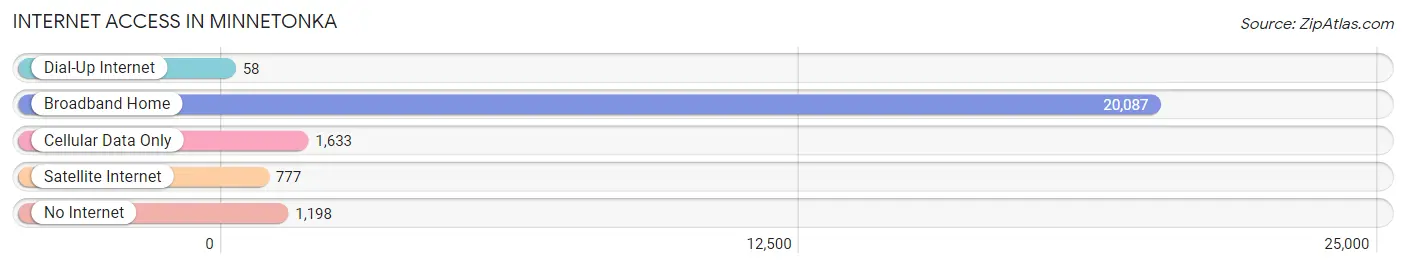
| Internet Type | # Households | % Households |
| Dial-Up Internet | 58 | 0.3% |
| Broadband Home | 20,087 | 85.8% |
| Cellular Data Only | 1,633 | 7.0% |
| Satellite Internet | 777 | 3.3% |
| No Internet | 1,198 | 5.1% |
| Total | 23,402 | 100.0% |
Minnetonka Summary
Minnetonka, Minnesota is a city located in Hennepin County, Minnesota, United States. It is a suburb of Minneapolis and is located about 10 miles west of the city. The population of Minnetonka was 51,301 at the 2010 census.
History
The area that is now Minnetonka was first settled by the Dakota Sioux in the mid-1700s. The first European settlers arrived in the area in the early 1800s. The area was originally known as "Minnehaha Falls," named after the nearby waterfall. The name was later changed to Minnetonka, which is derived from the Dakota Sioux word meaning "great water."
The first permanent settlers in the area were the family of John and Mary Goodrich, who arrived in 1852. The Goodriches built a log cabin on the shores of Lake Minnetonka and began farming the land. The area quickly grew in popularity as a summer resort destination, and by the late 1800s, the area was home to several resorts and hotels.
In the early 1900s, the area began to develop into a residential community. The first subdivision was built in 1906, and the city of Minnetonka was officially incorporated in 1954.
Geography
Minnetonka is located in Hennepin County, Minnesota, about 10 miles west of Minneapolis. The city is situated on the shores of Lake Minnetonka, a large lake that is part of the Minneapolis-St. Paul metropolitan area. The city covers an area of 33.2 square miles, of which 28.2 square miles is land and 5.0 square miles is water.
The city is bordered by the cities of Hopkins to the north, Eden Prairie to the east, Deephaven to the south, and St. Louis Park to the west. The city is also bordered by the townships of Minnetrista to the north, Medina to the east, and Wayzata to the south.
Economy
Minnetonka is home to a diverse economy, with a mix of retail, manufacturing, and service industries. The city is home to several large employers, including Cargill, UnitedHealth Group, and Carlson Companies.
The city is also home to several shopping centers, including Ridgedale Center, The Shoppes at Knollwood, and The Shoppes at Arbor Lakes.
Demographics
As of the 2010 census, the population of Minnetonka was 51,301. The racial makeup of the city was 87.2% White, 4.7% African American, 0.3% Native American, 4.2% Asian, 0.1% Pacific Islander, 1.7% from other races, and 2.0% from two or more races. Hispanic or Latino of any race were 4.3% of the population.
The median household income in Minnetonka was $86,945, and the median family income was $103,945. The per capita income for the city was $41,945. About 3.2% of families and 4.7% of the population were below the poverty line, including 5.2% of those under age 18 and 4.2% of those age 65 or over.
Common Questions
What is Per Capita Income in Minnetonka?
Per Capita income in Minnetonka is $69,529.
What is the Median Family Income in Minnetonka?
Median Family Income in Minnetonka is $151,779.
What is the Median Household income in Minnetonka?
Median Household Income in Minnetonka is $114,867.
What is Income or Wage Gap in Minnetonka?
Income or Wage Gap in Minnetonka is 34.3%.
Women in Minnetonka earn 65.7 cents for every dollar earned by a man.
What is Family Income Deficit in Minnetonka?
Family Income Deficit in Minnetonka is $7,232.
Families that are below poverty line in Minnetonka earn $7,232 less on average than the poverty threshold level.
What is Inequality or Gini Index in Minnetonka?
Inequality or Gini Index in Minnetonka is 0.46.
What is the Total Population of Minnetonka?
Total Population of Minnetonka is 53,529.
What is the Total Male Population of Minnetonka?
Total Male Population of Minnetonka is 26,558.
What is the Total Female Population of Minnetonka?
Total Female Population of Minnetonka is 26,971.
What is the Ratio of Males per 100 Females in Minnetonka?
There are 98.47 Males per 100 Females in Minnetonka.
What is the Ratio of Females per 100 Males in Minnetonka?
There are 101.56 Females per 100 Males in Minnetonka.
What is the Median Population Age in Minnetonka?
Median Population Age in Minnetonka is 42.5 Years.
What is the Average Family Size in Minnetonka
Average Family Size in Minnetonka is 2.9 People.
What is the Average Household Size in Minnetonka
Average Household Size in Minnetonka is 2.3 People.
How Large is the Labor Force in Minnetonka?
There are 30,467 People in the Labor Forcein in Minnetonka.
What is the Percentage of People in the Labor Force in Minnetonka?
69.9% of People are in the Labor Force in Minnetonka.
What is the Unemployment Rate in Minnetonka?
Unemployment Rate in Minnetonka is 2.5%.