Hibbing, MN Map & Demographics
Hibbing Map
Hibbing Overview
$32,781
PER CAPITA INCOME
$79,313
AVG FAMILY INCOME
$52,881
AVG HOUSEHOLD INCOME
15.4%
WAGE / INCOME GAP [ % ]
84.6¢/ $1
WAGE / INCOME GAP [ $ ]
$11,954
FAMILY INCOME DEFICIT
0.44
INEQUALITY / GINI INDEX
16,167
TOTAL POPULATION
8,055
MALE POPULATION
8,112
FEMALE POPULATION
99.30
MALES / 100 FEMALES
100.71
FEMALES / 100 MALES
42.5
MEDIAN AGE
2.9
AVG FAMILY SIZE
2.1
AVG HOUSEHOLD SIZE
7,626
LABOR FORCE [ PEOPLE ]
57.0%
PERCENT IN LABOR FORCE
4.9%
UNEMPLOYMENT RATE
Hibbing Zip Codes
Hibbing Area Codes
Income in Hibbing
Income Overview in Hibbing
Per Capita Income in Hibbing is $32,781, while median incomes of families and households are $79,313 and $52,881 respectively.
| Characteristic | Number | Measure |
| Per Capita Income | 16,167 | $32,781 |
| Median Family Income | 3,889 | $79,313 |
| Mean Family Income | 3,889 | $90,336 |
| Median Household Income | 7,458 | $52,881 |
| Mean Household Income | 7,458 | $70,971 |
| Income Deficit | 3,889 | $11,954 |
| Wage / Income Gap (%) | 16,167 | 15.40% |
| Wage / Income Gap ($) | 16,167 | 84.60¢ per $1 |
| Gini / Inequality Index | 16,167 | 0.44 |
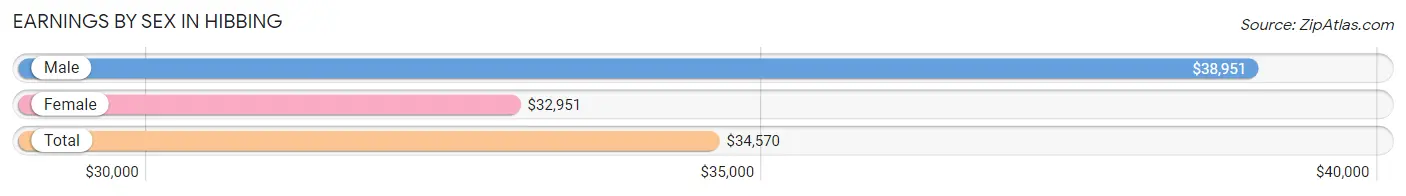
Earnings by Sex in Hibbing
Average Earnings in Hibbing are $34,570, $38,951 for men and $32,951 for women, a difference of 15.4%.
| Sex | Number | Average Earnings |
| Male | 4,207 (52.9%) | $38,951 |
| Female | 3,752 (47.1%) | $32,951 |
| Total | 7,959 (100.0%) | $34,570 |
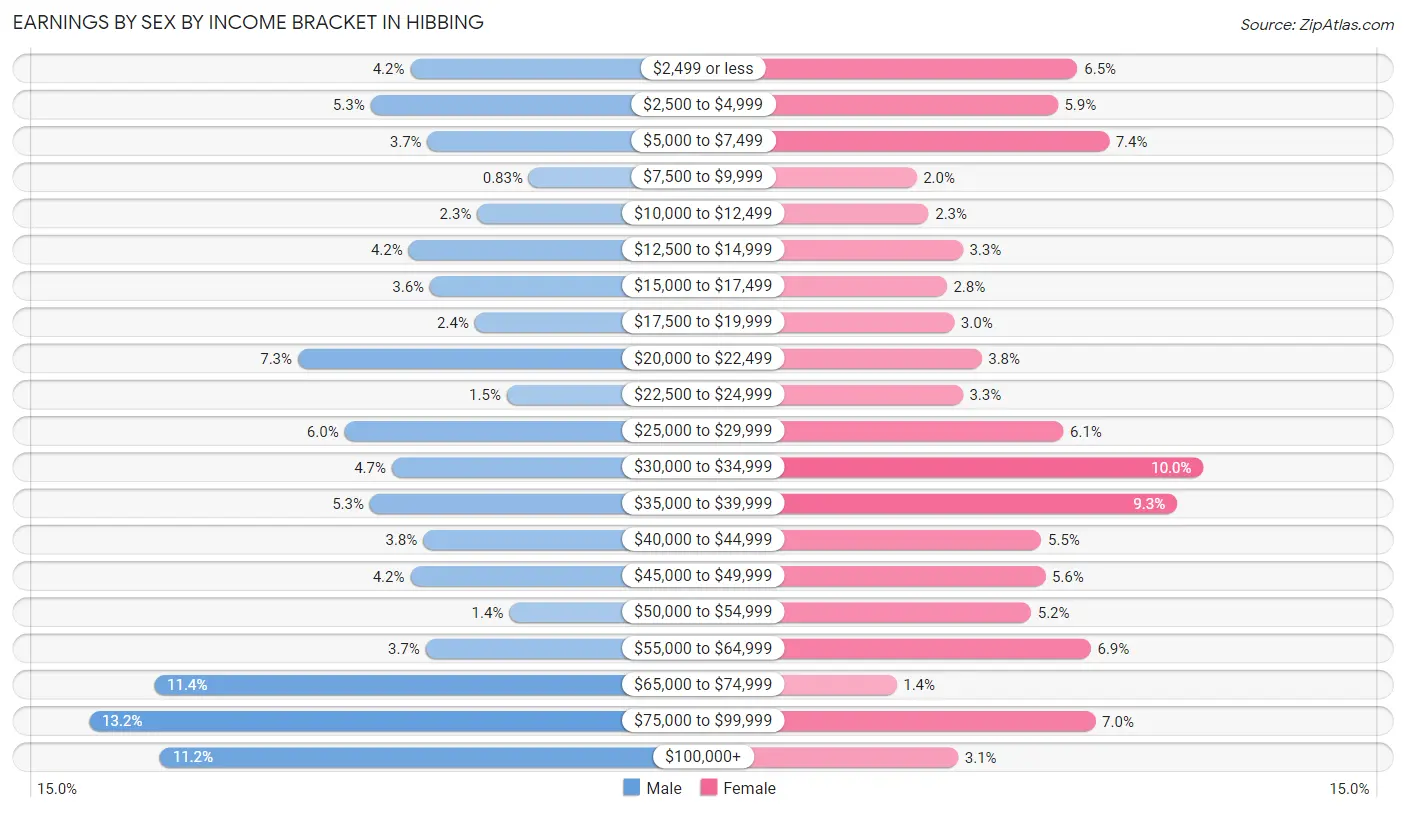
Earnings by Sex by Income Bracket in Hibbing
The most common earnings brackets in Hibbing are $75,000 to $99,999 for men (555 | 13.2%) and $30,000 to $34,999 for women (376 | 10.0%).
| Income | Male | Female |
| $2,499 or less | 175 (4.2%) | 243 (6.5%) |
| $2,500 to $4,999 | 222 (5.3%) | 222 (5.9%) |
| $5,000 to $7,499 | 155 (3.7%) | 276 (7.4%) |
| $7,500 to $9,999 | 35 (0.8%) | 73 (1.9%) |
| $10,000 to $12,499 | 96 (2.3%) | 86 (2.3%) |
| $12,500 to $14,999 | 177 (4.2%) | 122 (3.3%) |
| $15,000 to $17,499 | 152 (3.6%) | 105 (2.8%) |
| $17,500 to $19,999 | 99 (2.4%) | 113 (3.0%) |
| $20,000 to $22,499 | 308 (7.3%) | 142 (3.8%) |
| $22,500 to $24,999 | 61 (1.5%) | 122 (3.3%) |
| $25,000 to $29,999 | 253 (6.0%) | 228 (6.1%) |
| $30,000 to $34,999 | 197 (4.7%) | 376 (10.0%) |
| $35,000 to $39,999 | 223 (5.3%) | 348 (9.3%) |
| $40,000 to $44,999 | 160 (3.8%) | 205 (5.5%) |
| $45,000 to $49,999 | 175 (4.2%) | 209 (5.6%) |
| $50,000 to $54,999 | 58 (1.4%) | 194 (5.2%) |
| $55,000 to $64,999 | 157 (3.7%) | 257 (6.9%) |
| $65,000 to $74,999 | 478 (11.4%) | 52 (1.4%) |
| $75,000 to $99,999 | 555 (13.2%) | 262 (7.0%) |
| $100,000+ | 471 (11.2%) | 117 (3.1%) |
| Total | 4,207 (100.0%) | 3,752 (100.0%) |
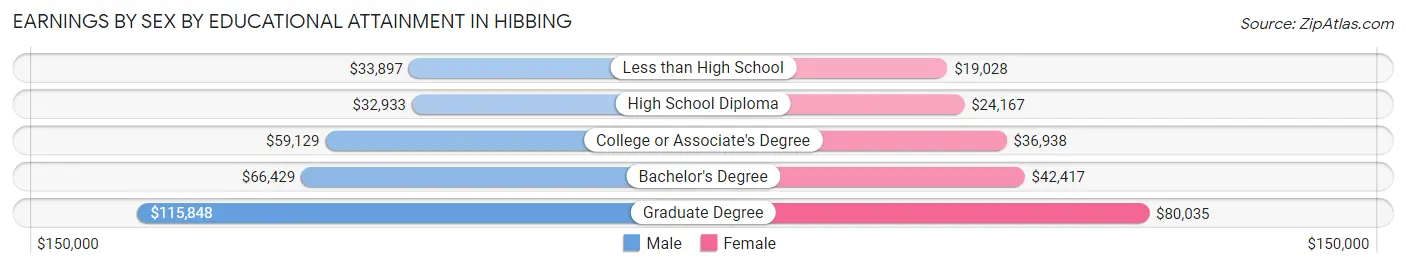
Earnings by Sex by Educational Attainment in Hibbing
Average earnings in Hibbing are $48,768 for men and $35,638 for women, a difference of 26.9%. Men with an educational attainment of graduate degree enjoy the highest average annual earnings of $115,848, while those with high school diploma education earn the least with $32,933. Women with an educational attainment of graduate degree earn the most with the average annual earnings of $80,035, while those with less than high school education have the smallest earnings of $19,028.
| Educational Attainment | Male Income | Female Income |
| Less than High School | $33,897 | $19,028 |
| High School Diploma | $32,933 | $24,167 |
| College or Associate's Degree | $59,129 | $36,938 |
| Bachelor's Degree | $66,429 | $42,417 |
| Graduate Degree | $115,848 | $80,035 |
| Total | $48,768 | $35,638 |
Family Income in Hibbing
Family Income Brackets in Hibbing
According to the Hibbing family income data, there are 836 families falling into the $100,000 to $149,999 income range, which is the most common income bracket and makes up 21.5% of all families. Conversely, the less than $10,000 income bracket is the least frequent group with only 62 families (1.6%) belonging to this category.
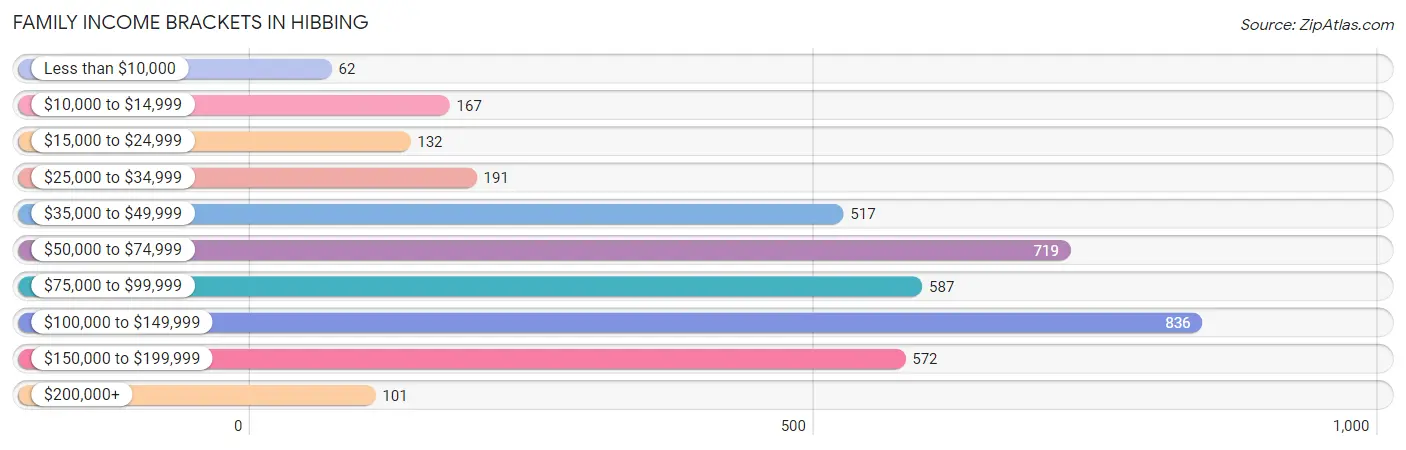
| Income Bracket | # Families | % Families |
| Less than $10,000 | 62 | 1.6% |
| $10,000 to $14,999 | 167 | 4.3% |
| $15,000 to $24,999 | 132 | 3.4% |
| $25,000 to $34,999 | 191 | 4.9% |
| $35,000 to $49,999 | 517 | 13.3% |
| $50,000 to $74,999 | 719 | 18.5% |
| $75,000 to $99,999 | 587 | 15.1% |
| $100,000 to $149,999 | 836 | 21.5% |
| $150,000 to $199,999 | 572 | 14.7% |
| $200,000+ | 101 | 2.6% |
Family Income by Famaliy Size in Hibbing
7+ person families (82 | 2.1%) account for the highest median family income in Hibbing with $250,001 per family, while 3-person families (617 | 15.9%) have the highest median income of $37,672 per family member.
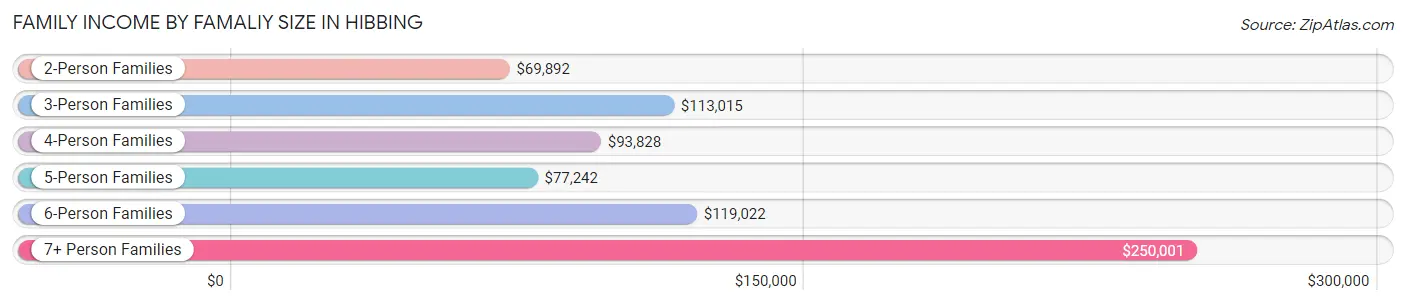
| Income Bracket | # Families | Median Income |
| 2-Person Families | 2,191 (56.3%) | $69,892 |
| 3-Person Families | 617 (15.9%) | $113,015 |
| 4-Person Families | 543 (14.0%) | $93,828 |
| 5-Person Families | 328 (8.4%) | $77,242 |
| 6-Person Families | 128 (3.3%) | $119,022 |
| 7+ Person Families | 82 (2.1%) | $250,001 |
| Total | 3,889 (100.0%) | $79,313 |
Family Income by Number of Earners in Hibbing
The median family income in Hibbing is $79,313, with families comprising 3+ earners (358) having the highest median family income of $150,909, while families with 1 earner (1,216) have the lowest median family income of $51,442, accounting for 9.2% and 31.3% of families, respectively.
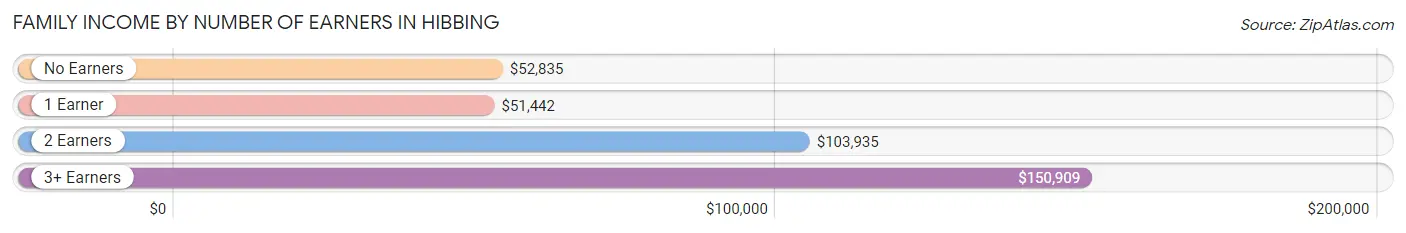
| Number of Earners | # Families | Median Income |
| No Earners | 788 (20.3%) | $52,835 |
| 1 Earner | 1,216 (31.3%) | $51,442 |
| 2 Earners | 1,527 (39.3%) | $103,935 |
| 3+ Earners | 358 (9.2%) | $150,909 |
| Total | 3,889 (100.0%) | $79,313 |
Household Income in Hibbing
Household Income Brackets in Hibbing
With 1,238 households falling in the category, the $50,000 to $74,999 income range is the most frequent in Hibbing, accounting for 16.6% of all households. In contrast, only 172 households (2.3%) fall into the $200,000+ income bracket, making it the least populous group.
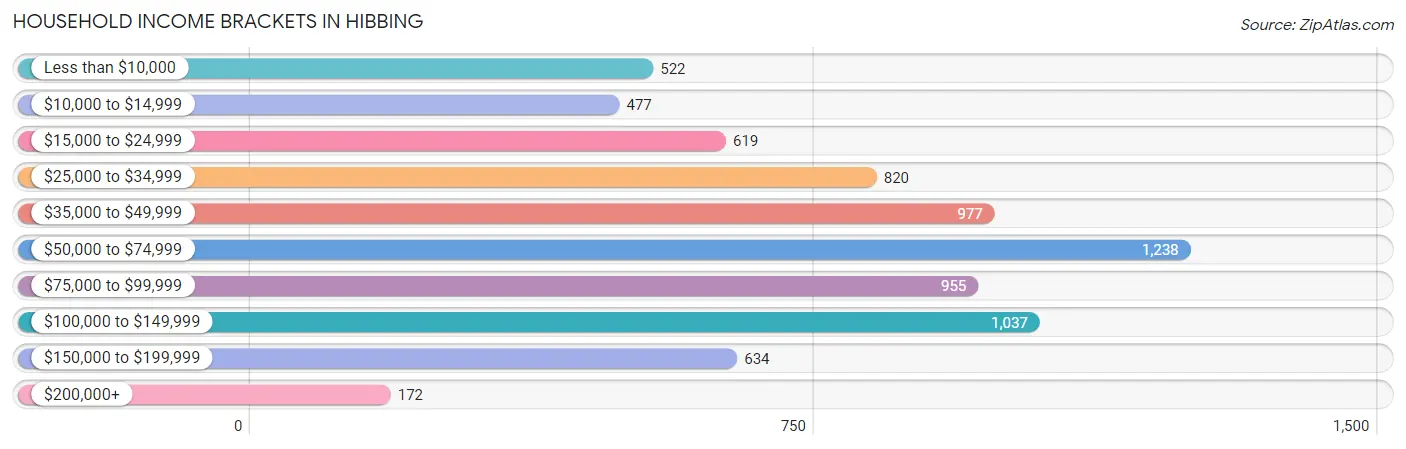
| Income Bracket | # Households | % Households |
| Less than $10,000 | 522 | 7.0% |
| $10,000 to $14,999 | 477 | 6.4% |
| $15,000 to $24,999 | 619 | 8.3% |
| $25,000 to $34,999 | 820 | 11.0% |
| $35,000 to $49,999 | 977 | 13.1% |
| $50,000 to $74,999 | 1,238 | 16.6% |
| $75,000 to $99,999 | 955 | 12.8% |
| $100,000 to $149,999 | 1,037 | 13.9% |
| $150,000 to $199,999 | 634 | 8.5% |
| $200,000+ | 172 | 2.3% |
Household Income by Householder Age in Hibbing
The median household income in Hibbing is $52,881, with the highest median household income of $75,268 found in the 45 to 64 years age bracket for the primary householder. A total of 2,576 households (34.5%) fall into this category. Meanwhile, the 15 to 24 years age bracket for the primary householder has the lowest median household income of $34,688, with 212 households (2.8%) in this group.
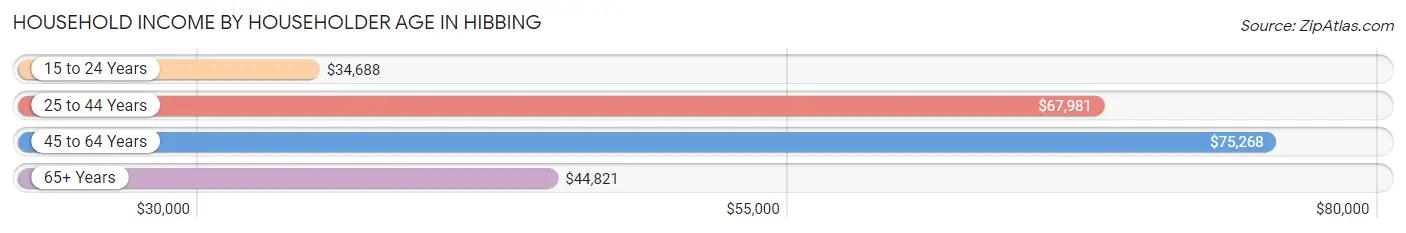
| Income Bracket | # Households | Median Income |
| 15 to 24 Years | 212 (2.8%) | $34,688 |
| 25 to 44 Years | 2,116 (28.4%) | $67,981 |
| 45 to 64 Years | 2,576 (34.5%) | $75,268 |
| 65+ Years | 2,554 (34.3%) | $44,821 |
| Total | 7,458 (100.0%) | $52,881 |
Poverty in Hibbing
Income Below Poverty by Sex and Age in Hibbing
With 13.9% poverty level for males and 14.5% for females among the residents of Hibbing, 18 to 24 year old males and 15 year old females are the most vulnerable to poverty, with 198 males (31.4%) and 16 females (27.6%) in their respective age groups living below the poverty level.
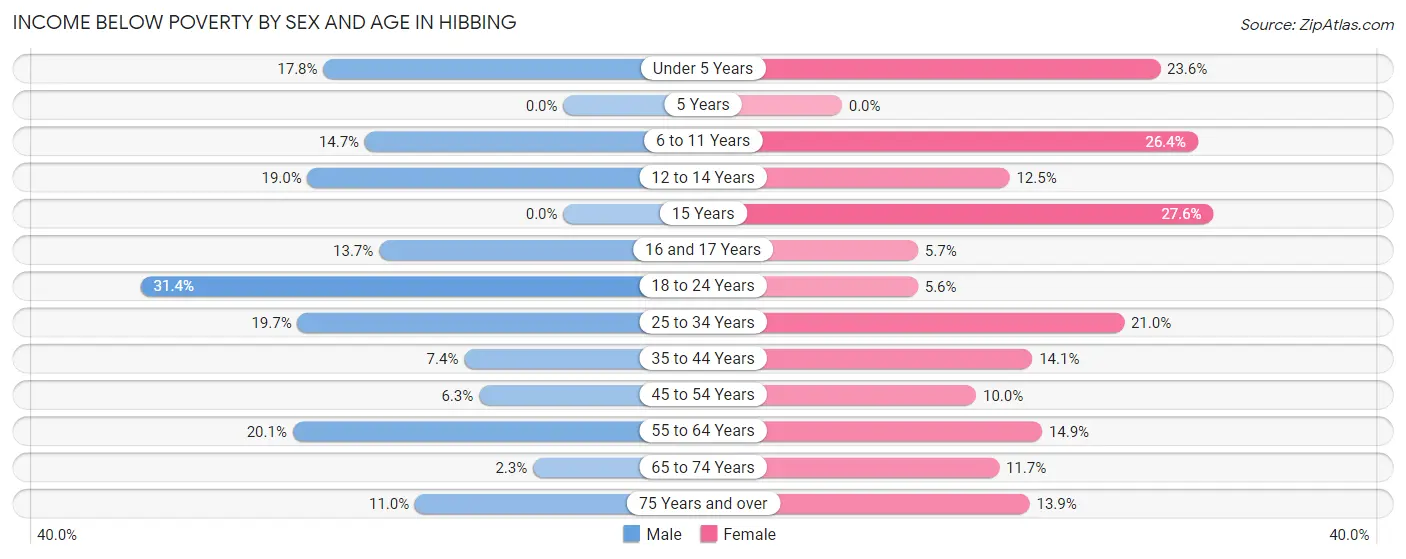
| Age Bracket | Male | Female |
| Under 5 Years | 77 (17.8%) | 82 (23.6%) |
| 5 Years | 0 (0.0%) | 0 (0.0%) |
| 6 to 11 Years | 81 (14.7%) | 150 (26.4%) |
| 12 to 14 Years | 49 (19.0%) | 34 (12.4%) |
| 15 Years | 0 (0.0%) | 16 (27.6%) |
| 16 and 17 Years | 29 (13.7%) | 17 (5.7%) |
| 18 to 24 Years | 198 (31.4%) | 31 (5.6%) |
| 25 to 34 Years | 213 (19.7%) | 203 (20.9%) |
| 35 to 44 Years | 72 (7.4%) | 110 (14.1%) |
| 45 to 54 Years | 51 (6.3%) | 95 (10.0%) |
| 55 to 64 Years | 263 (20.1%) | 158 (14.9%) |
| 65 to 74 Years | 23 (2.2%) | 118 (11.7%) |
| 75 Years and over | 50 (11.0%) | 142 (13.9%) |
| Total | 1,106 (13.9%) | 1,156 (14.5%) |
Income Above Poverty by Sex and Age in Hibbing
According to the poverty statistics in Hibbing, males aged 5 years and females aged 5 years are the age groups that are most secure financially, with 100.0% of males and 100.0% of females in these age groups living above the poverty line.
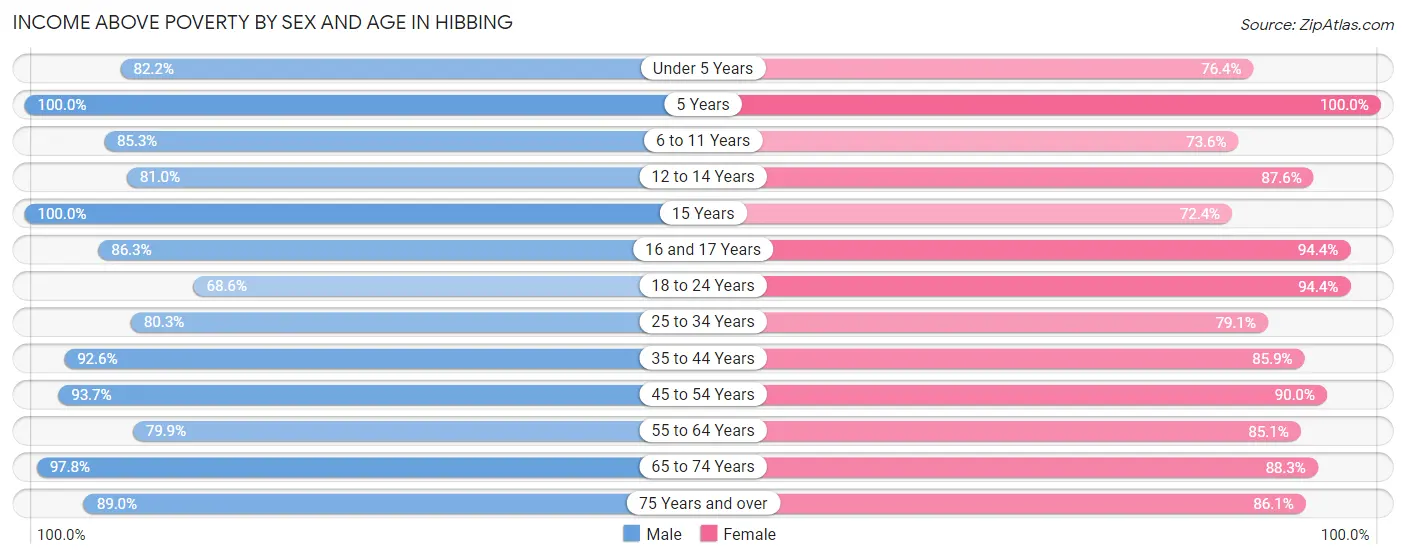
| Age Bracket | Male | Female |
| Under 5 Years | 355 (82.2%) | 265 (76.4%) |
| 5 Years | 79 (100.0%) | 54 (100.0%) |
| 6 to 11 Years | 469 (85.3%) | 418 (73.6%) |
| 12 to 14 Years | 209 (81.0%) | 239 (87.5%) |
| 15 Years | 133 (100.0%) | 42 (72.4%) |
| 16 and 17 Years | 183 (86.3%) | 284 (94.4%) |
| 18 to 24 Years | 433 (68.6%) | 519 (94.4%) |
| 25 to 34 Years | 866 (80.3%) | 766 (79.0%) |
| 35 to 44 Years | 906 (92.6%) | 668 (85.9%) |
| 45 to 54 Years | 764 (93.7%) | 858 (90.0%) |
| 55 to 64 Years | 1,046 (79.9%) | 905 (85.1%) |
| 65 to 74 Years | 997 (97.8%) | 893 (88.3%) |
| 75 Years and over | 404 (89.0%) | 877 (86.1%) |
| Total | 6,844 (86.1%) | 6,788 (85.5%) |
Income Below Poverty Among Married-Couple Families in Hibbing
The poverty statistics for married-couple families in Hibbing show that 4.2% or 119 of the total 2,815 families live below the poverty line. Families with 5 or more children have the highest poverty rate of 43.5%, comprising of 10 families. On the other hand, families with no children have the lowest poverty rate of 3.3%, which includes 59 families.
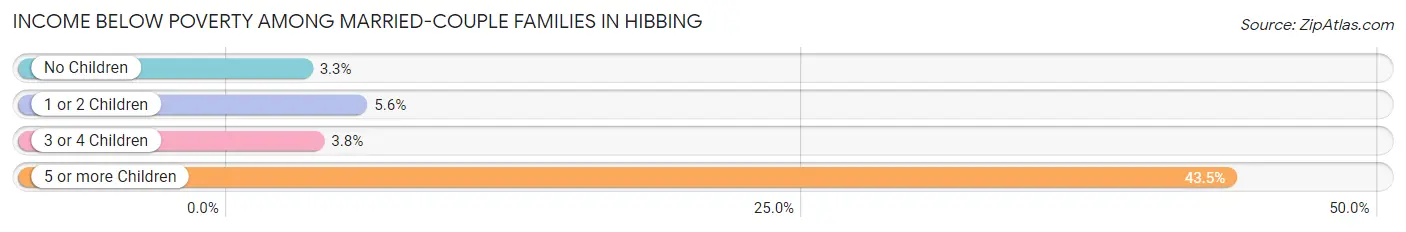
| Children | Above Poverty | Below Poverty |
| No Children | 1,757 (96.8%) | 59 (3.3%) |
| 1 or 2 Children | 670 (94.4%) | 40 (5.6%) |
| 3 or 4 Children | 256 (96.2%) | 10 (3.8%) |
| 5 or more Children | 13 (56.5%) | 10 (43.5%) |
| Total | 2,696 (95.8%) | 119 (4.2%) |
Income Below Poverty Among Single-Parent Households in Hibbing
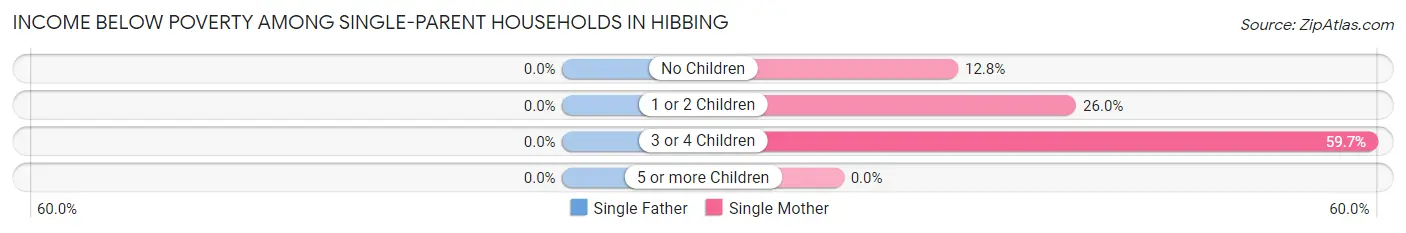
| Children | Single Father | Single Mother |
| No Children | 0 (0.0%) | 29 (12.8%) |
| 1 or 2 Children | 0 (0.0%) | 73 (26.0%) |
| 3 or 4 Children | 0 (0.0%) | 80 (59.7%) |
| 5 or more Children | 0 (0.0%) | 0 (0.0%) |
| Total | 0 (0.0%) | 182 (28.0%) |
Income Below Poverty Among Married-Couple vs Single-Parent Households in Hibbing
The poverty data for Hibbing shows that 119 of the married-couple family households (4.2%) and 182 of the single-parent households (17.0%) are living below the poverty level. Within the married-couple family households, those with 5 or more children have the highest poverty rate, with 10 households (43.5%) falling below the poverty line. Among the single-parent households, those with 3 or 4 children have the highest poverty rate, with 80 household (44.4%) living below poverty.
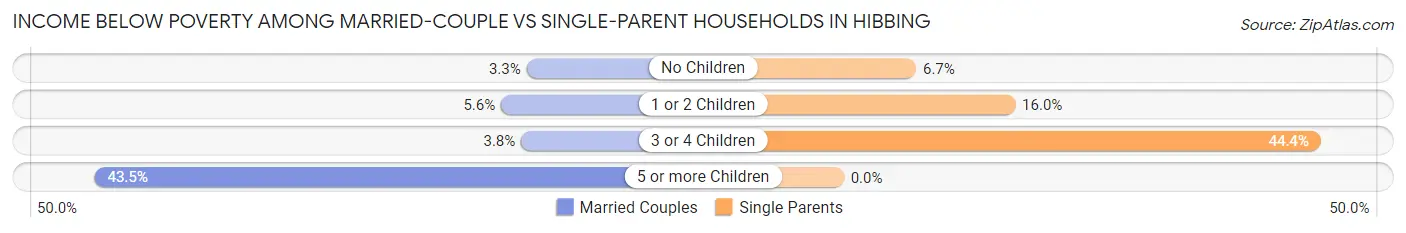
| Children | Married-Couple Families | Single-Parent Households |
| No Children | 59 (3.3%) | 29 (6.7%) |
| 1 or 2 Children | 40 (5.6%) | 73 (16.0%) |
| 3 or 4 Children | 10 (3.8%) | 80 (44.4%) |
| 5 or more Children | 10 (43.5%) | 0 (0.0%) |
| Total | 119 (4.2%) | 182 (17.0%) |
Race in Hibbing
The most populous races in Hibbing are White / Caucasian (15,087 | 93.3%), Two or more Races (655 | 4.1%), and Black / African American (325 | 2.0%).
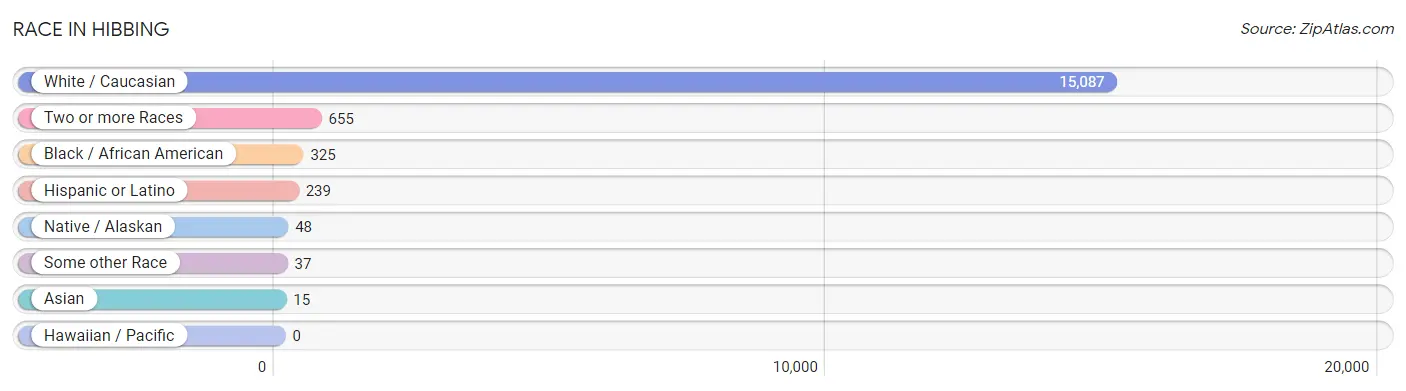
| Race | # Population | % Population |
| Asian | 15 | 0.1% |
| Black / African American | 325 | 2.0% |
| Hawaiian / Pacific | 0 | 0.0% |
| Hispanic or Latino | 239 | 1.5% |
| Native / Alaskan | 48 | 0.3% |
| White / Caucasian | 15,087 | 93.3% |
| Two or more Races | 655 | 4.1% |
| Some other Race | 37 | 0.2% |
| Total | 16,167 | 100.0% |
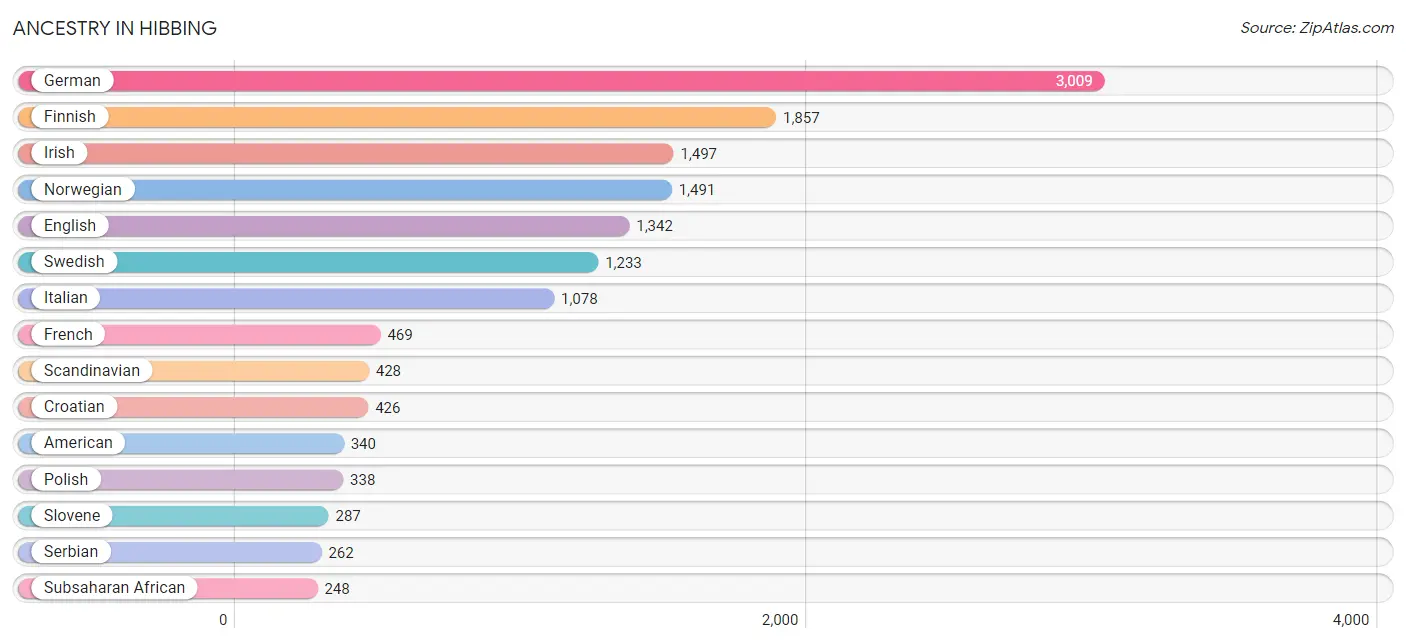
Ancestry in Hibbing
The most populous ancestries reported in Hibbing are German (3,009 | 18.6%), Finnish (1,857 | 11.5%), Irish (1,497 | 9.3%), Norwegian (1,491 | 9.2%), and English (1,342 | 8.3%), together accounting for 56.9% of all Hibbing residents.
| Ancestry | # Population | % Population |
| American | 340 | 2.1% |
| Arab | 19 | 0.1% |
| Austrian | 56 | 0.4% |
| Belgian | 47 | 0.3% |
| British | 41 | 0.3% |
| Central American | 8 | 0.1% |
| Central American Indian | 7 | 0.0% |
| Chippewa | 72 | 0.4% |
| Cree | 9 | 0.1% |
| Croatian | 426 | 2.6% |
| Cuban | 13 | 0.1% |
| Czech | 134 | 0.8% |
| Czechoslovakian | 58 | 0.4% |
| Danish | 69 | 0.4% |
| Dutch | 104 | 0.6% |
| Eastern European | 25 | 0.2% |
| English | 1,342 | 8.3% |
| European | 145 | 0.9% |
| Finnish | 1,857 | 11.5% |
| French | 469 | 2.9% |
| French Canadian | 80 | 0.5% |
| German | 3,009 | 18.6% |
| Greek | 29 | 0.2% |
| Honduran | 8 | 0.1% |
| Hungarian | 19 | 0.1% |
| Irish | 1,497 | 9.3% |
| Italian | 1,078 | 6.7% |
| Kenyan | 185 | 1.1% |
| Korean | 111 | 0.7% |
| Lebanese | 19 | 0.1% |
| Mexican | 105 | 0.6% |
| Northern European | 4 | 0.0% |
| Norwegian | 1,491 | 9.2% |
| Pennsylvania German | 17 | 0.1% |
| Polish | 338 | 2.1% |
| Portuguese | 37 | 0.2% |
| Puerto Rican | 93 | 0.6% |
| Romanian | 11 | 0.1% |
| Russian | 30 | 0.2% |
| Samoan | 11 | 0.1% |
| Scandinavian | 428 | 2.6% |
| Scotch-Irish | 28 | 0.2% |
| Scottish | 91 | 0.6% |
| Seminole | 9 | 0.1% |
| Serbian | 262 | 1.6% |
| Slovak | 31 | 0.2% |
| Slovene | 287 | 1.8% |
| Somali | 63 | 0.4% |
| Spaniard | 11 | 0.1% |
| Spanish | 9 | 0.1% |
| Subsaharan African | 248 | 1.5% |
| Swedish | 1,233 | 7.6% |
| Swiss | 17 | 0.1% |
| Syrian | 9 | 0.1% |
| Welsh | 9 | 0.1% |
| Yugoslavian | 100 | 0.6% | View All 56 Rows |
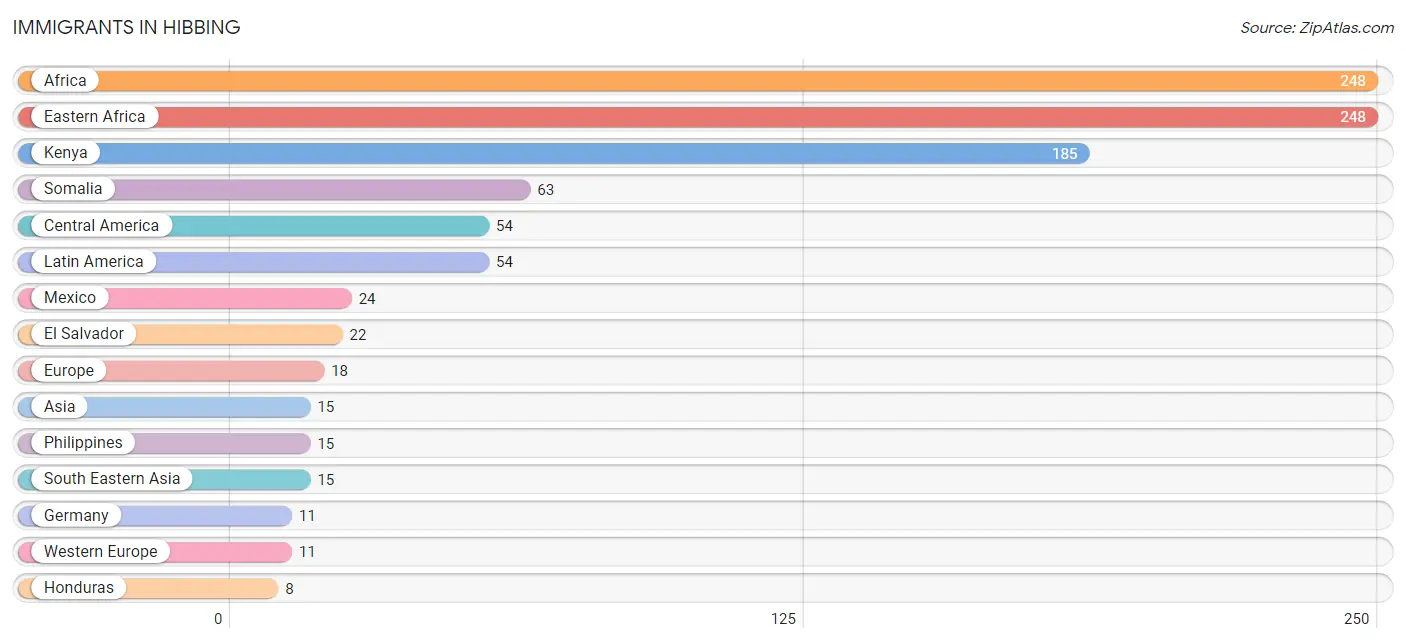
Immigrants in Hibbing
The most numerous immigrant groups reported in Hibbing came from Africa (248 | 1.5%), Eastern Africa (248 | 1.5%), Kenya (185 | 1.1%), Somalia (63 | 0.4%), and Central America (54 | 0.3%), together accounting for 4.9% of all Hibbing residents.
| Immigration Origin | # Population | % Population |
| Africa | 248 | 1.5% |
| Asia | 15 | 0.1% |
| Central America | 54 | 0.3% |
| Eastern Africa | 248 | 1.5% |
| El Salvador | 22 | 0.1% |
| Europe | 18 | 0.1% |
| Germany | 11 | 0.1% |
| Honduras | 8 | 0.1% |
| Ireland | 7 | 0.0% |
| Kenya | 185 | 1.1% |
| Latin America | 54 | 0.3% |
| Mexico | 24 | 0.2% |
| Northern Europe | 7 | 0.0% |
| Philippines | 15 | 0.1% |
| Somalia | 63 | 0.4% |
| South Eastern Asia | 15 | 0.1% |
| Western Europe | 11 | 0.1% | View All 17 Rows |
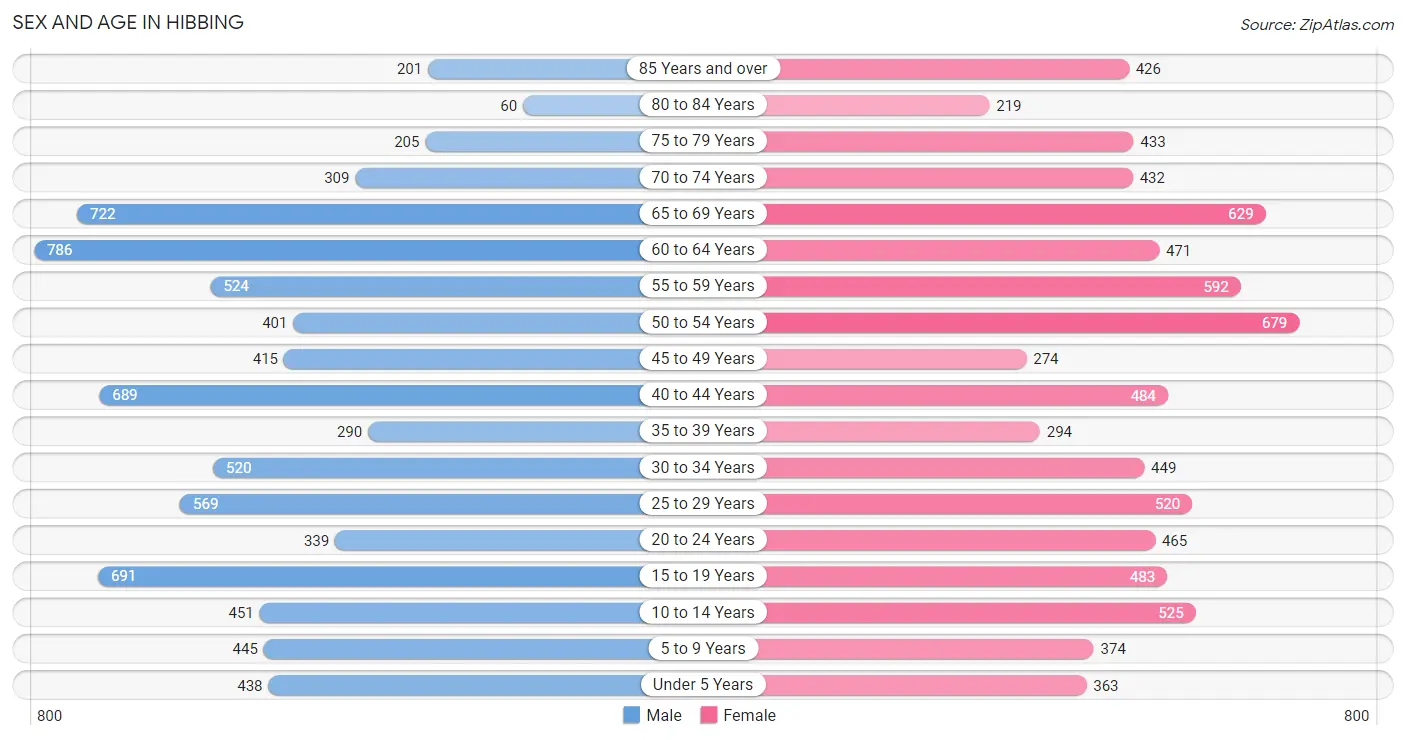
Sex and Age in Hibbing
Sex and Age in Hibbing
The most populous age groups in Hibbing are 60 to 64 Years (786 | 9.8%) for men and 50 to 54 Years (679 | 8.4%) for women.
| Age Bracket | Male | Female |
| Under 5 Years | 438 (5.4%) | 363 (4.5%) |
| 5 to 9 Years | 445 (5.5%) | 374 (4.6%) |
| 10 to 14 Years | 451 (5.6%) | 525 (6.5%) |
| 15 to 19 Years | 691 (8.6%) | 483 (5.9%) |
| 20 to 24 Years | 339 (4.2%) | 465 (5.7%) |
| 25 to 29 Years | 569 (7.1%) | 520 (6.4%) |
| 30 to 34 Years | 520 (6.5%) | 449 (5.5%) |
| 35 to 39 Years | 290 (3.6%) | 294 (3.6%) |
| 40 to 44 Years | 689 (8.6%) | 484 (6.0%) |
| 45 to 49 Years | 415 (5.1%) | 274 (3.4%) |
| 50 to 54 Years | 401 (5.0%) | 679 (8.4%) |
| 55 to 59 Years | 524 (6.5%) | 592 (7.3%) |
| 60 to 64 Years | 786 (9.8%) | 471 (5.8%) |
| 65 to 69 Years | 722 (9.0%) | 629 (7.7%) |
| 70 to 74 Years | 309 (3.8%) | 432 (5.3%) |
| 75 to 79 Years | 205 (2.5%) | 433 (5.3%) |
| 80 to 84 Years | 60 (0.7%) | 219 (2.7%) |
| 85 Years and over | 201 (2.5%) | 426 (5.2%) |
| Total | 8,055 (100.0%) | 8,112 (100.0%) |
Families and Households in Hibbing
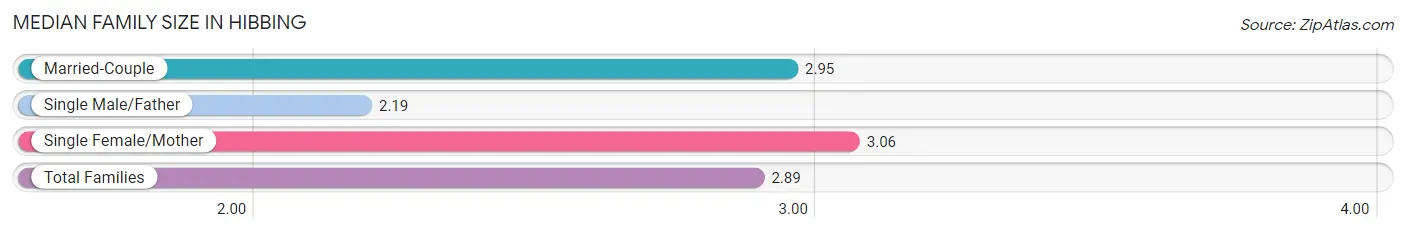
Median Family Size in Hibbing
The median family size in Hibbing is 2.89 persons per family, with single female/mother families (649 | 16.7%) accounting for the largest median family size of 3.06 persons per family. On the other hand, single male/father families (425 | 10.9%) represent the smallest median family size with 2.19 persons per family.
| Family Type | # Families | Family Size |
| Married-Couple | 2,815 (72.4%) | 2.95 |
| Single Male/Father | 425 (10.9%) | 2.19 |
| Single Female/Mother | 649 (16.7%) | 3.06 |
| Total Families | 3,889 (100.0%) | 2.89 |
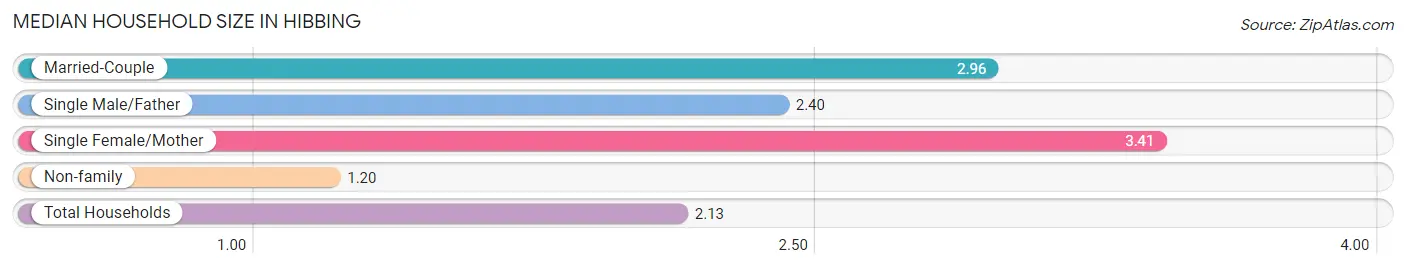
Median Household Size in Hibbing
The median household size in Hibbing is 2.13 persons per household, with single female/mother households (649 | 8.7%) accounting for the largest median household size of 3.41 persons per household. non-family households (3,569 | 47.8%) represent the smallest median household size with 1.20 persons per household.
| Household Type | # Households | Household Size |
| Married-Couple | 2,815 (37.7%) | 2.96 |
| Single Male/Father | 425 (5.7%) | 2.40 |
| Single Female/Mother | 649 (8.7%) | 3.41 |
| Non-family | 3,569 (47.8%) | 1.20 |
| Total Households | 7,458 (100.0%) | 2.13 |
Household Size by Marriage Status in Hibbing
Out of a total of 7,458 households in Hibbing, 3,889 (52.1%) are family households, while 3,569 (47.8%) are nonfamily households. The most numerous type of family households are 2-person households, comprising 2,062, and the most common type of nonfamily households are 1-person households, comprising 2,994.
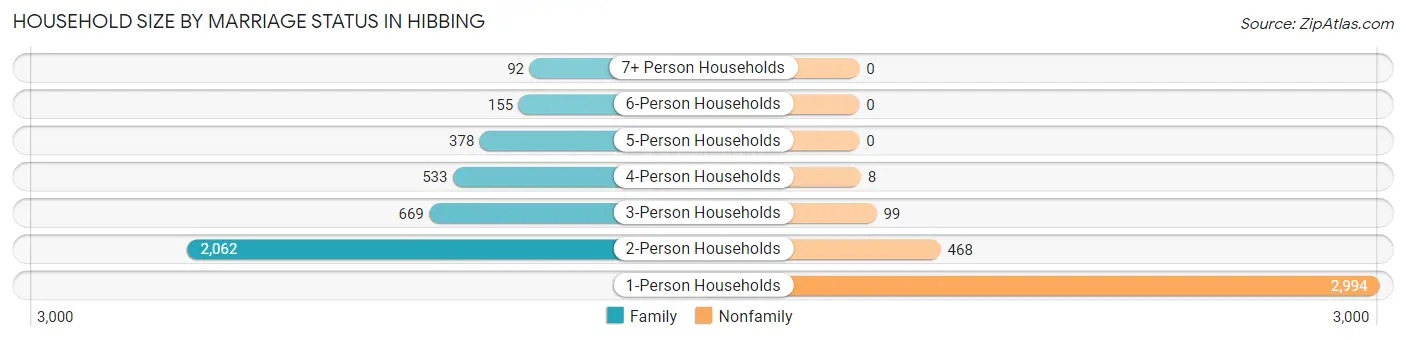
| Household Size | Family Households | Nonfamily Households |
| 1-Person Households | - | 2,994 (40.1%) |
| 2-Person Households | 2,062 (27.7%) | 468 (6.3%) |
| 3-Person Households | 669 (9.0%) | 99 (1.3%) |
| 4-Person Households | 533 (7.1%) | 8 (0.1%) |
| 5-Person Households | 378 (5.1%) | 0 (0.0%) |
| 6-Person Households | 155 (2.1%) | 0 (0.0%) |
| 7+ Person Households | 92 (1.2%) | 0 (0.0%) |
| Total | 3,889 (52.1%) | 3,569 (47.8%) |
Female Fertility in Hibbing
Fertility by Age in Hibbing
Average fertility rate in Hibbing is 62.0 births per 1,000 women. Women in the age bracket of 20 to 34 years have the highest fertility rate with 129.0 births per 1,000 women. Women in the age bracket of 20 to 34 years acount for 97.4% of all women with births.
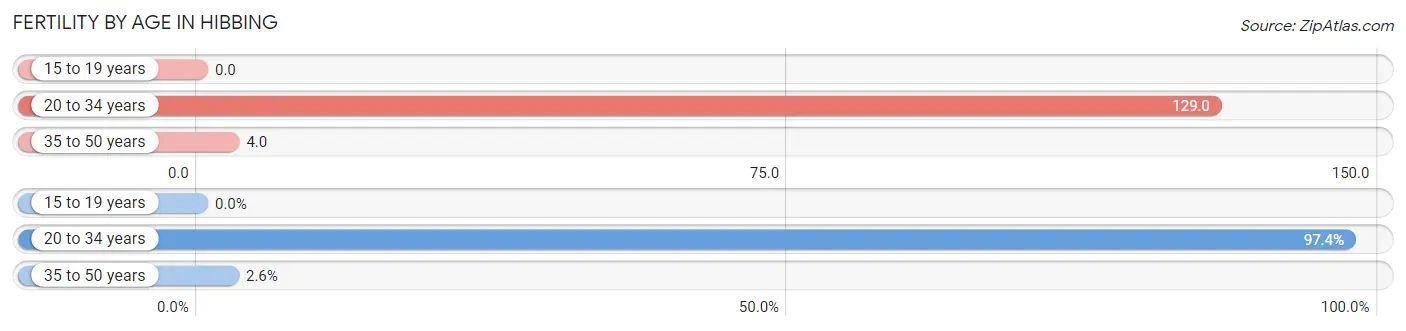
| Age Bracket | Women with Births | Births / 1,000 Women |
| 15 to 19 years | 0 (0.0%) | 0.0 |
| 20 to 34 years | 185 (97.4%) | 129.0 |
| 35 to 50 years | 5 (2.6%) | 4.0 |
| Total | 190 (100.0%) | 62.0 |
Fertility by Age by Marriage Status in Hibbing
38.4% of women with births (190) in Hibbing are married. The highest percentage of unmarried women with births falls into 20 to 34 years age bracket with 63.2% of them unmarried at the time of birth, while the lowest percentage of unmarried women with births belong to 35 to 50 years age bracket with 0.0% of them unmarried.
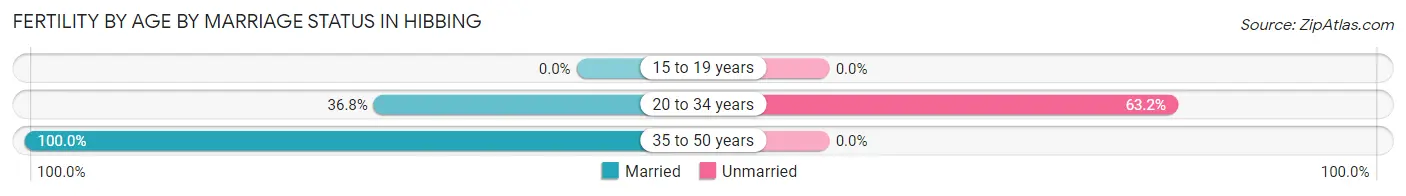
| Age Bracket | Married | Unmarried |
| 15 to 19 years | 0 (0.0%) | 0 (0.0%) |
| 20 to 34 years | 68 (36.8%) | 117 (63.2%) |
| 35 to 50 years | 5 (100.0%) | 0 (0.0%) |
| Total | 73 (38.4%) | 117 (61.6%) |
Fertility by Education in Hibbing
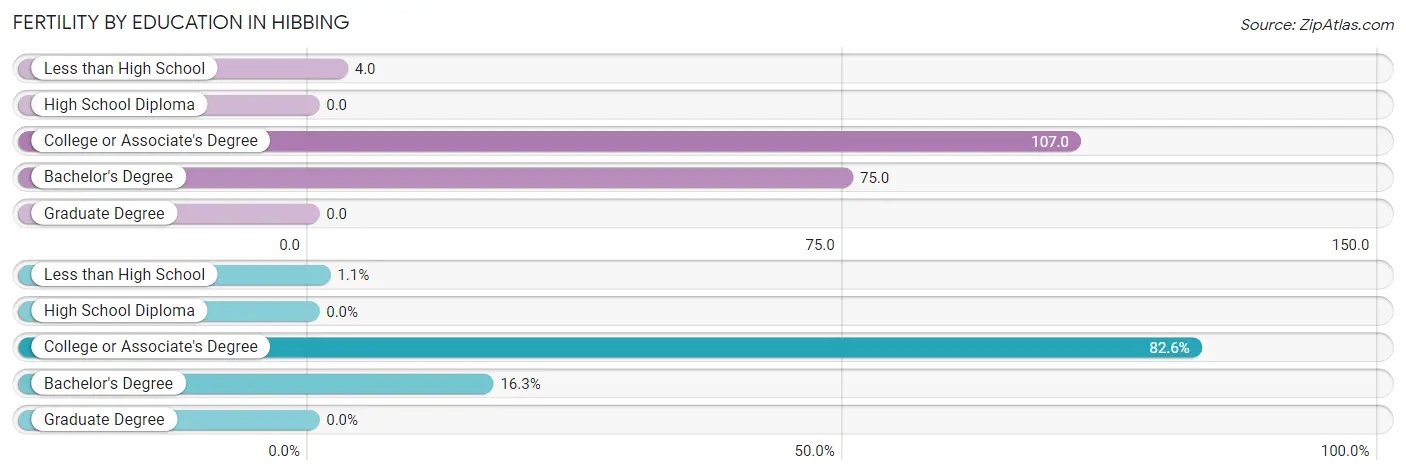
| Educational Attainment | Women with Births | Births / 1,000 Women |
| Less than High School | 2 (1.1%) | 4.0 |
| High School Diploma | 0 (0.0%) | 0.0 |
| College or Associate's Degree | 157 (82.6%) | 107.0 |
| Bachelor's Degree | 31 (16.3%) | 75.0 |
| Graduate Degree | 0 (0.0%) | 0.0 |
| Total | 190 (100.0%) | 62.0 |
Fertility by Education by Marriage Status in Hibbing
61.6% of women with births in Hibbing are unmarried. Women with the educational attainment of bachelor's degree are most likely to be married with 100.0% of them married at childbirth, while women with the educational attainment of less than high school are least likely to be married with 100.0% of them unmarried at childbirth.
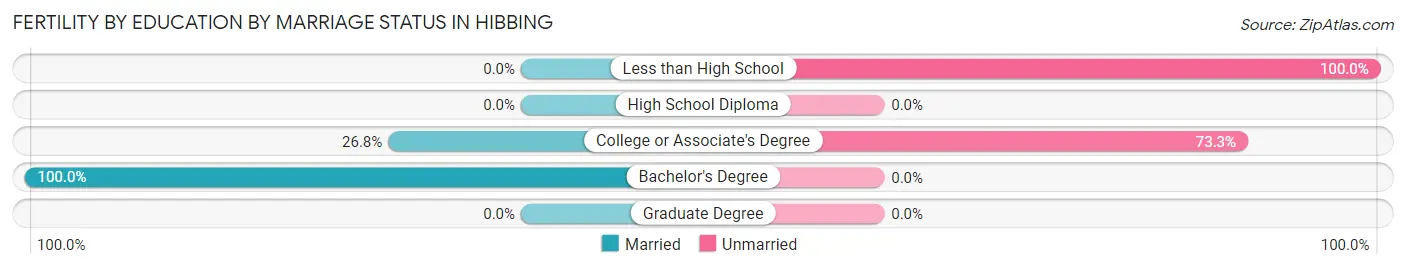
| Educational Attainment | Married | Unmarried |
| Less than High School | 0 (0.0%) | 2 (100.0%) |
| High School Diploma | 0 (0.0%) | 0 (0.0%) |
| College or Associate's Degree | 42 (26.8%) | 115 (73.3%) |
| Bachelor's Degree | 31 (100.0%) | 0 (0.0%) |
| Graduate Degree | 0 (0.0%) | 0 (0.0%) |
| Total | 73 (38.4%) | 117 (61.6%) |
Employment Characteristics in Hibbing
Employment by Class of Employer in Hibbing
Among the 7,010 employed individuals in Hibbing, private company employees (4,752 | 67.8%), not-for-profit organizations (750 | 10.7%), and local government employees (477 | 6.8%) make up the most common classes of employment.
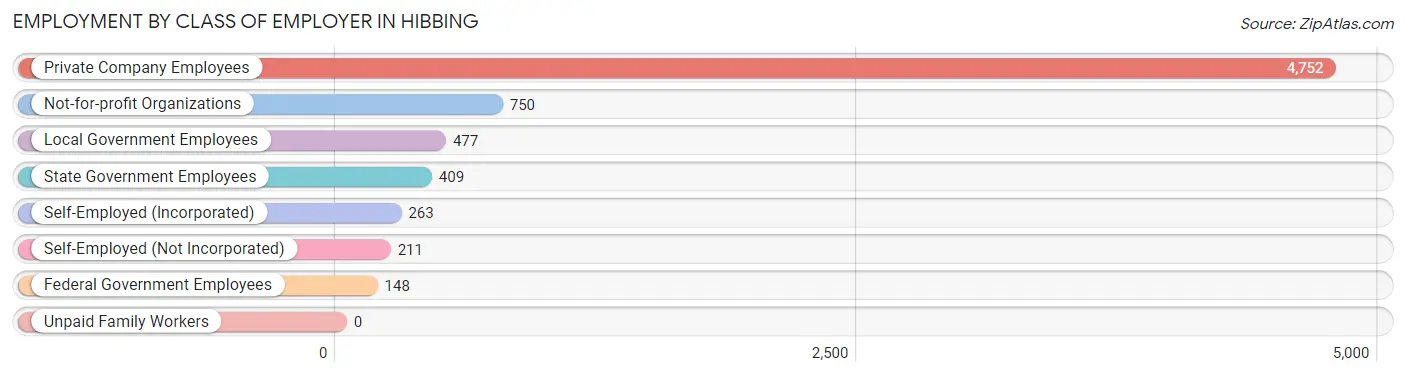
| Employer Class | # Employees | % Employees |
| Private Company Employees | 4,752 | 67.8% |
| Self-Employed (Incorporated) | 263 | 3.7% |
| Self-Employed (Not Incorporated) | 211 | 3.0% |
| Not-for-profit Organizations | 750 | 10.7% |
| Local Government Employees | 477 | 6.8% |
| State Government Employees | 409 | 5.8% |
| Federal Government Employees | 148 | 2.1% |
| Unpaid Family Workers | 0 | 0.0% |
| Total | 7,010 | 100.0% |
Employment Status by Age in Hibbing
According to the labor force statistics for Hibbing, out of the total population over 16 years of age (13,379), 57.0% or 7,626 individuals are in the labor force, with 4.9% or 374 of them unemployed. The age group with the highest labor force participation rate is 20 to 24 years, with 89.6% or 720 individuals in the labor force. Within the labor force, the 20 to 24 years age range has the highest percentage of unemployed individuals, with 14.2% or 102 of them being unemployed.
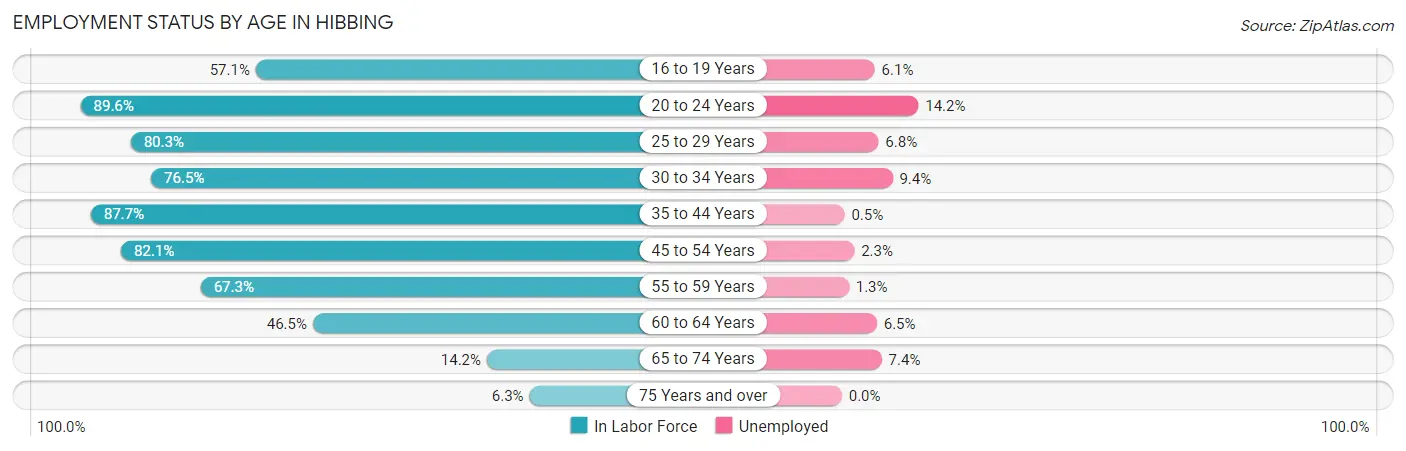
| Age Bracket | In Labor Force | Unemployed |
| 16 to 19 Years | 561 (57.1%) | 34 (6.1%) |
| 20 to 24 Years | 720 (89.6%) | 102 (14.2%) |
| 25 to 29 Years | 874 (80.3%) | 59 (6.8%) |
| 30 to 34 Years | 741 (76.5%) | 70 (9.4%) |
| 35 to 44 Years | 1,541 (87.7%) | 8 (0.5%) |
| 45 to 54 Years | 1,452 (82.1%) | 33 (2.3%) |
| 55 to 59 Years | 751 (67.3%) | 10 (1.3%) |
| 60 to 64 Years | 585 (46.5%) | 38 (6.5%) |
| 65 to 74 Years | 297 (14.2%) | 22 (7.4%) |
| 75 Years and over | 97 (6.3%) | 0 (0.0%) |
| Total | 7,626 (57.0%) | 374 (4.9%) |
Employment Status by Educational Attainment in Hibbing
According to labor force statistics for Hibbing, 74.7% of individuals (5,944) out of the total population between 25 and 64 years of age (7,957) are in the labor force, with 3.7% or 220 of them being unemployed. The group with the highest labor force participation rate are those with the educational attainment of college / associate degree, with 78.3% or 3,196 individuals in the labor force. Within the labor force, individuals with high school diploma education have the highest percentage of unemployment, with 7.5% or 109 of them being unemployed.
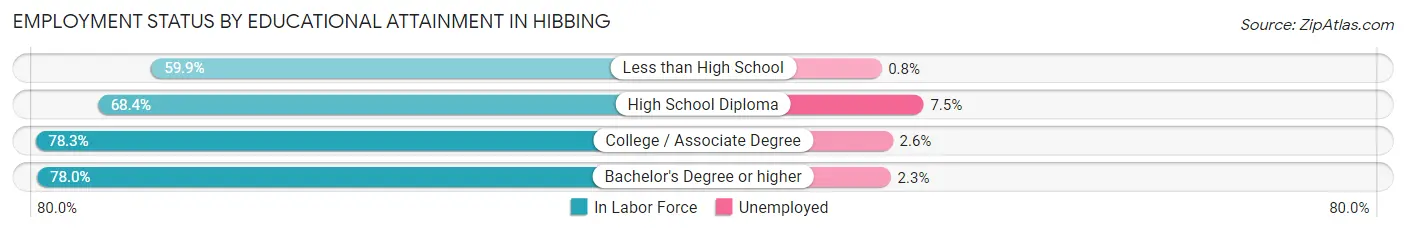
| Educational Attainment | In Labor Force | Unemployed |
| Less than High School | 243 (59.9%) | 3 (0.8%) |
| High School Diploma | 1,451 (68.4%) | 159 (7.5%) |
| College / Associate Degree | 3,196 (78.3%) | 106 (2.6%) |
| Bachelor's Degree or higher | 1,051 (78.0%) | 31 (2.3%) |
| Total | 5,944 (74.7%) | 294 (3.7%) |
Employment Occupations by Sex in Hibbing
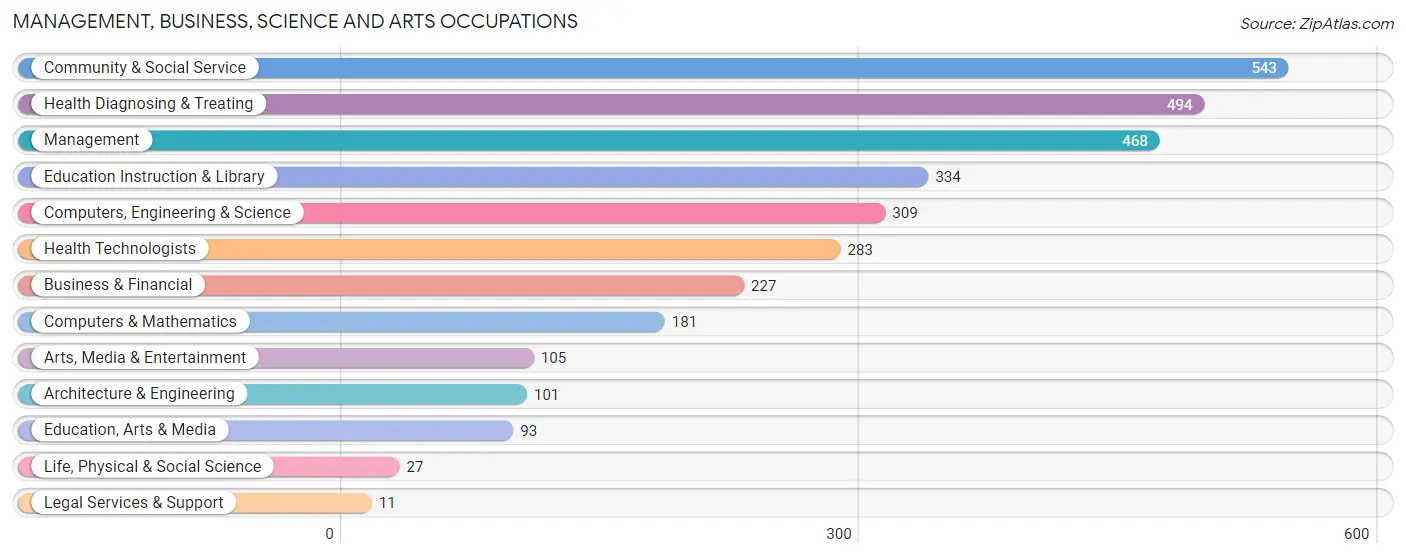
Management, Business, Science and Arts Occupations
The most common Management, Business, Science and Arts occupations in Hibbing are Community & Social Service (543 | 7.5%), Health Diagnosing & Treating (494 | 6.8%), Management (468 | 6.5%), Education Instruction & Library (334 | 4.6%), and Computers, Engineering & Science (309 | 4.3%).
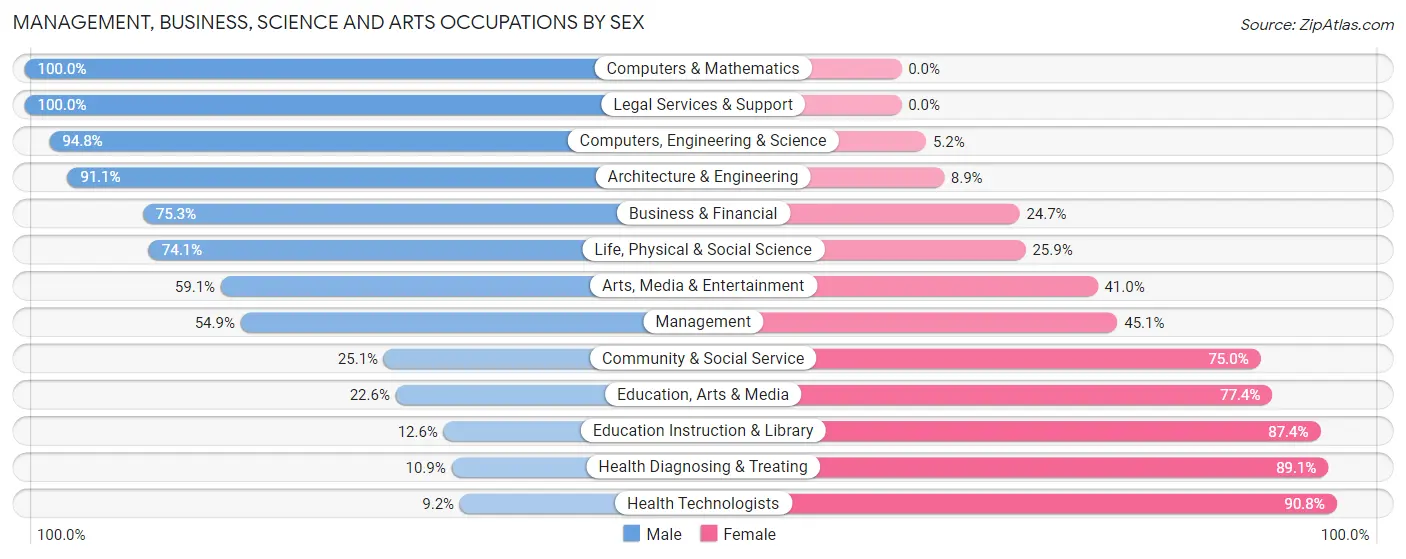
Management, Business, Science and Arts Occupations by Sex
Within the Management, Business, Science and Arts occupations in Hibbing, the most male-oriented occupations are Computers & Mathematics (100.0%), Legal Services & Support (100.0%), and Computers, Engineering & Science (94.8%), while the most female-oriented occupations are Health Technologists (90.8%), Health Diagnosing & Treating (89.1%), and Education Instruction & Library (87.4%).
| Occupation | Male | Female |
| Management | 257 (54.9%) | 211 (45.1%) |
| Business & Financial | 171 (75.3%) | 56 (24.7%) |
| Computers, Engineering & Science | 293 (94.8%) | 16 (5.2%) |
| Computers & Mathematics | 181 (100.0%) | 0 (0.0%) |
| Architecture & Engineering | 92 (91.1%) | 9 (8.9%) |
| Life, Physical & Social Science | 20 (74.1%) | 7 (25.9%) |
| Community & Social Service | 136 (25.1%) | 407 (75.0%) |
| Education, Arts & Media | 21 (22.6%) | 72 (77.4%) |
| Legal Services & Support | 11 (100.0%) | 0 (0.0%) |
| Education Instruction & Library | 42 (12.6%) | 292 (87.4%) |
| Arts, Media & Entertainment | 62 (59.1%) | 43 (40.9%) |
| Health Diagnosing & Treating | 54 (10.9%) | 440 (89.1%) |
| Health Technologists | 26 (9.2%) | 257 (90.8%) |
| Total (Category) | 911 (44.6%) | 1,130 (55.4%) |
| Total (Overall) | 3,831 (52.9%) | 3,406 (47.1%) |
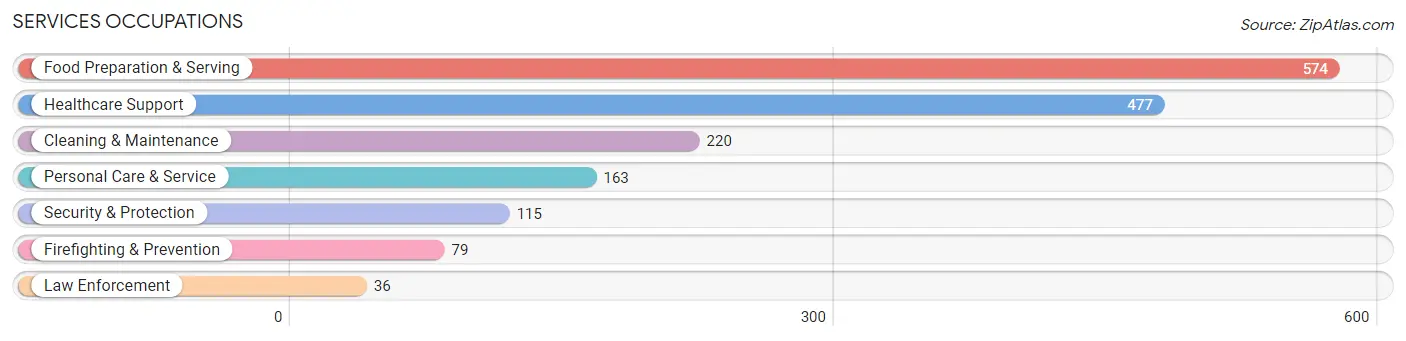
Services Occupations
The most common Services occupations in Hibbing are Food Preparation & Serving (574 | 7.9%), Healthcare Support (477 | 6.6%), Cleaning & Maintenance (220 | 3.0%), Personal Care & Service (163 | 2.2%), and Security & Protection (115 | 1.6%).
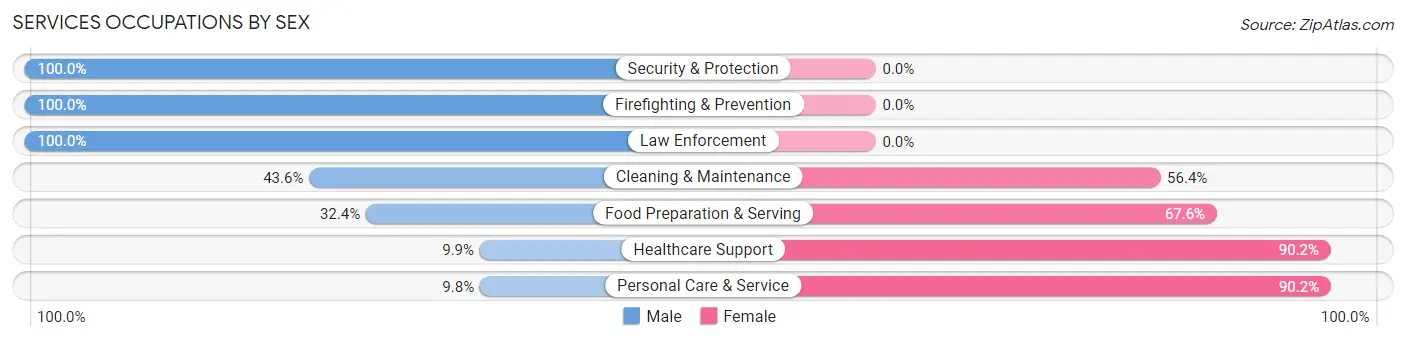
Services Occupations by Sex
Within the Services occupations in Hibbing, the most male-oriented occupations are Security & Protection (100.0%), Firefighting & Prevention (100.0%), and Law Enforcement (100.0%), while the most female-oriented occupations are Personal Care & Service (90.2%), Healthcare Support (90.1%), and Food Preparation & Serving (67.6%).
| Occupation | Male | Female |
| Healthcare Support | 47 (9.9%) | 430 (90.1%) |
| Security & Protection | 115 (100.0%) | 0 (0.0%) |
| Firefighting & Prevention | 79 (100.0%) | 0 (0.0%) |
| Law Enforcement | 36 (100.0%) | 0 (0.0%) |
| Food Preparation & Serving | 186 (32.4%) | 388 (67.6%) |
| Cleaning & Maintenance | 96 (43.6%) | 124 (56.4%) |
| Personal Care & Service | 16 (9.8%) | 147 (90.2%) |
| Total (Category) | 460 (29.7%) | 1,089 (70.3%) |
| Total (Overall) | 3,831 (52.9%) | 3,406 (47.1%) |
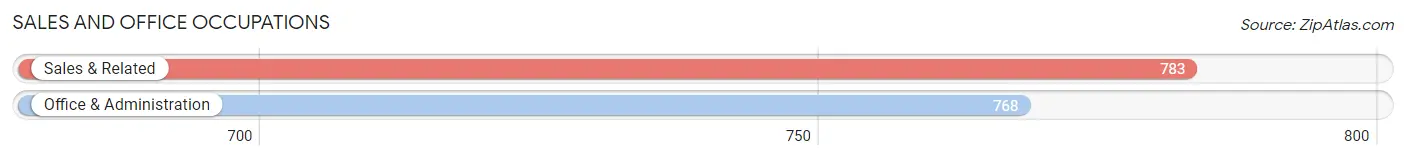
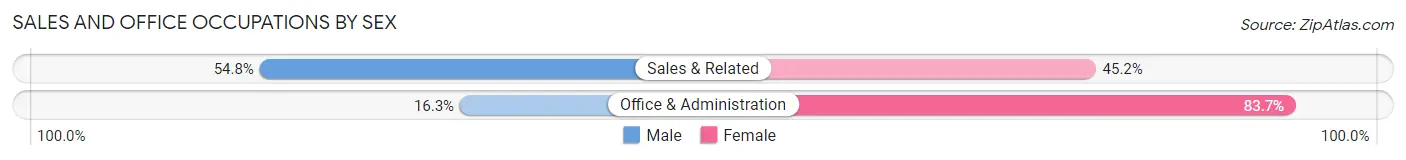
Sales and Office Occupations
The most common Sales and Office occupations in Hibbing are Sales & Related (783 | 10.8%), and Office & Administration (768 | 10.6%).
Sales and Office Occupations by Sex
| Occupation | Male | Female |
| Sales & Related | 429 (54.8%) | 354 (45.2%) |
| Office & Administration | 125 (16.3%) | 643 (83.7%) |
| Total (Category) | 554 (35.7%) | 997 (64.3%) |
| Total (Overall) | 3,831 (52.9%) | 3,406 (47.1%) |
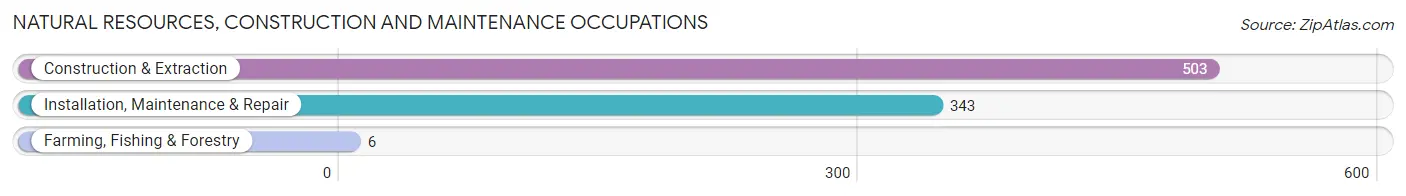
Natural Resources, Construction and Maintenance Occupations
The most common Natural Resources, Construction and Maintenance occupations in Hibbing are Construction & Extraction (503 | 7.0%), Installation, Maintenance & Repair (343 | 4.7%), and Farming, Fishing & Forestry (6 | 0.1%).
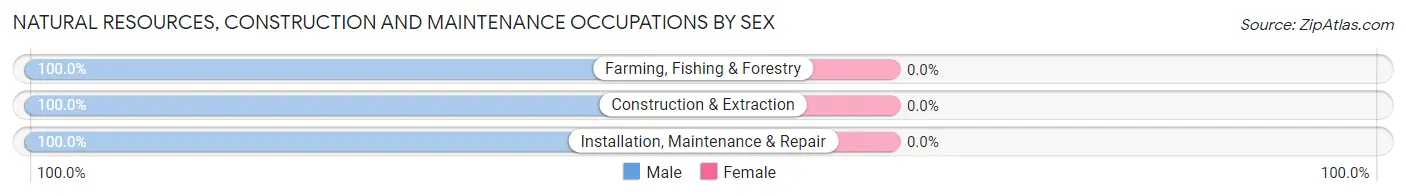
Natural Resources, Construction and Maintenance Occupations by Sex
| Occupation | Male | Female |
| Farming, Fishing & Forestry | 6 (100.0%) | 0 (0.0%) |
| Construction & Extraction | 503 (100.0%) | 0 (0.0%) |
| Installation, Maintenance & Repair | 343 (100.0%) | 0 (0.0%) |
| Total (Category) | 852 (100.0%) | 0 (0.0%) |
| Total (Overall) | 3,831 (52.9%) | 3,406 (47.1%) |
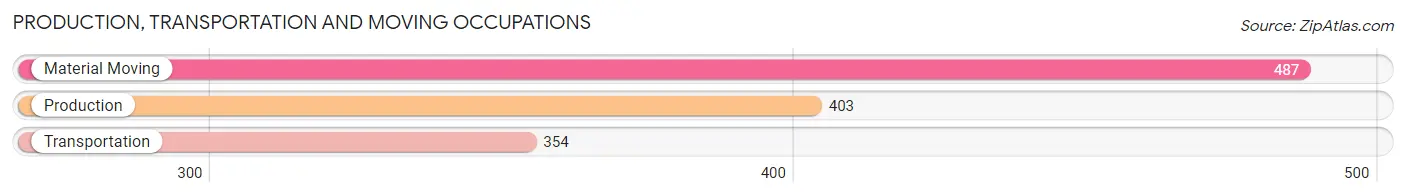
Production, Transportation and Moving Occupations
The most common Production, Transportation and Moving occupations in Hibbing are Material Moving (487 | 6.7%), Production (403 | 5.6%), and Transportation (354 | 4.9%).
Production, Transportation and Moving Occupations by Sex
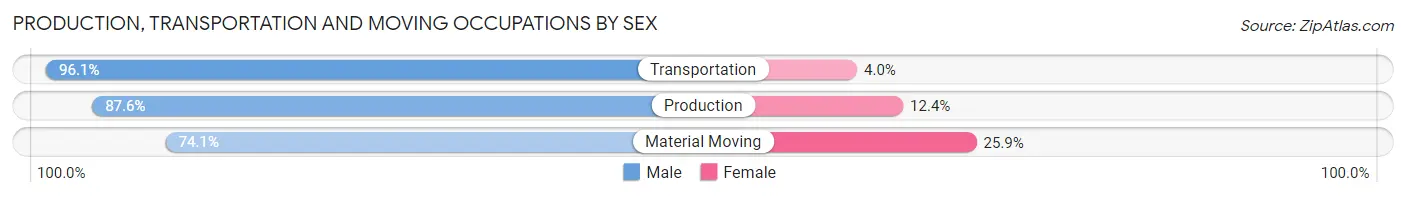
| Occupation | Male | Female |
| Production | 353 (87.6%) | 50 (12.4%) |
| Transportation | 340 (96.1%) | 14 (4.0%) |
| Material Moving | 361 (74.1%) | 126 (25.9%) |
| Total (Category) | 1,054 (84.7%) | 190 (15.3%) |
| Total (Overall) | 3,831 (52.9%) | 3,406 (47.1%) |
Employment Industries by Sex in Hibbing
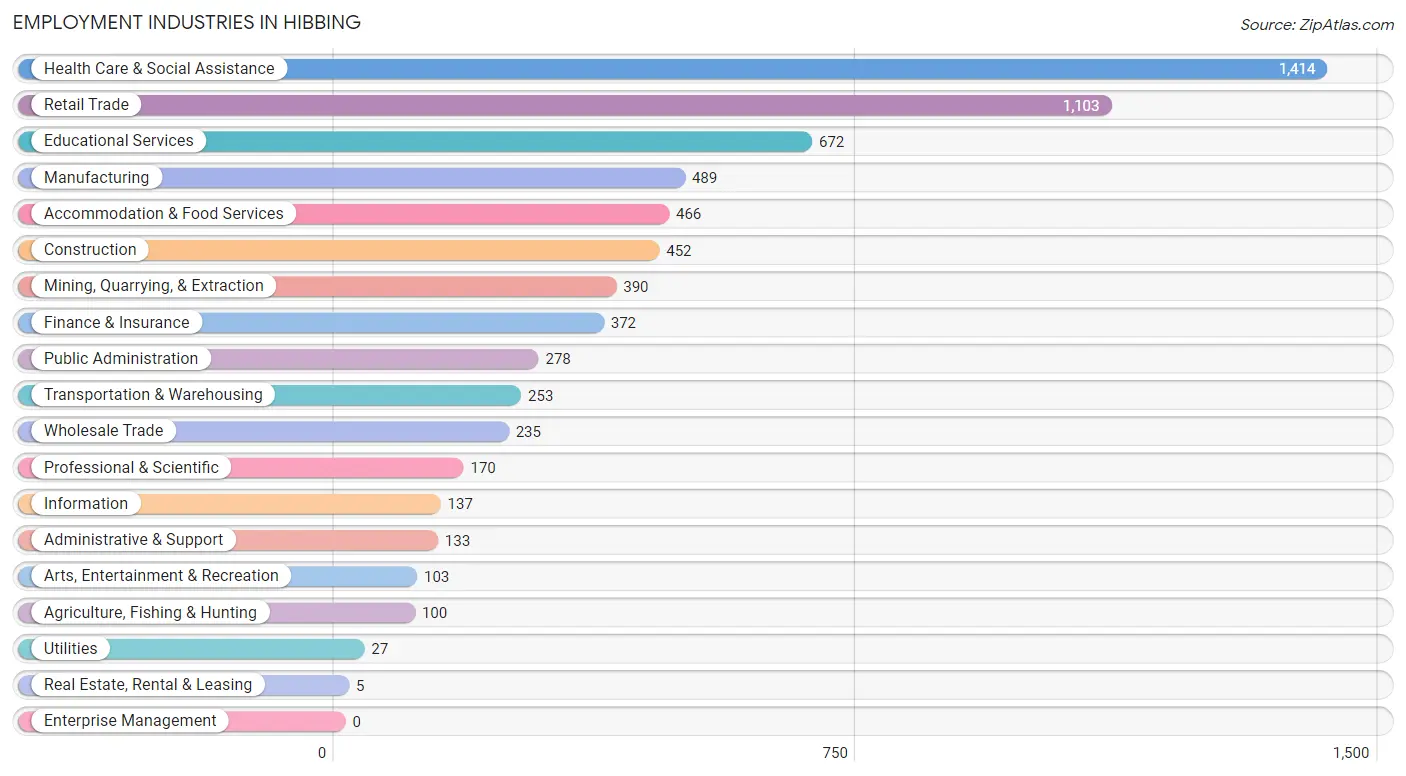
Employment Industries in Hibbing
The major employment industries in Hibbing include Health Care & Social Assistance (1,414 | 19.5%), Retail Trade (1,103 | 15.2%), Educational Services (672 | 9.3%), Manufacturing (489 | 6.8%), and Accommodation & Food Services (466 | 6.4%).
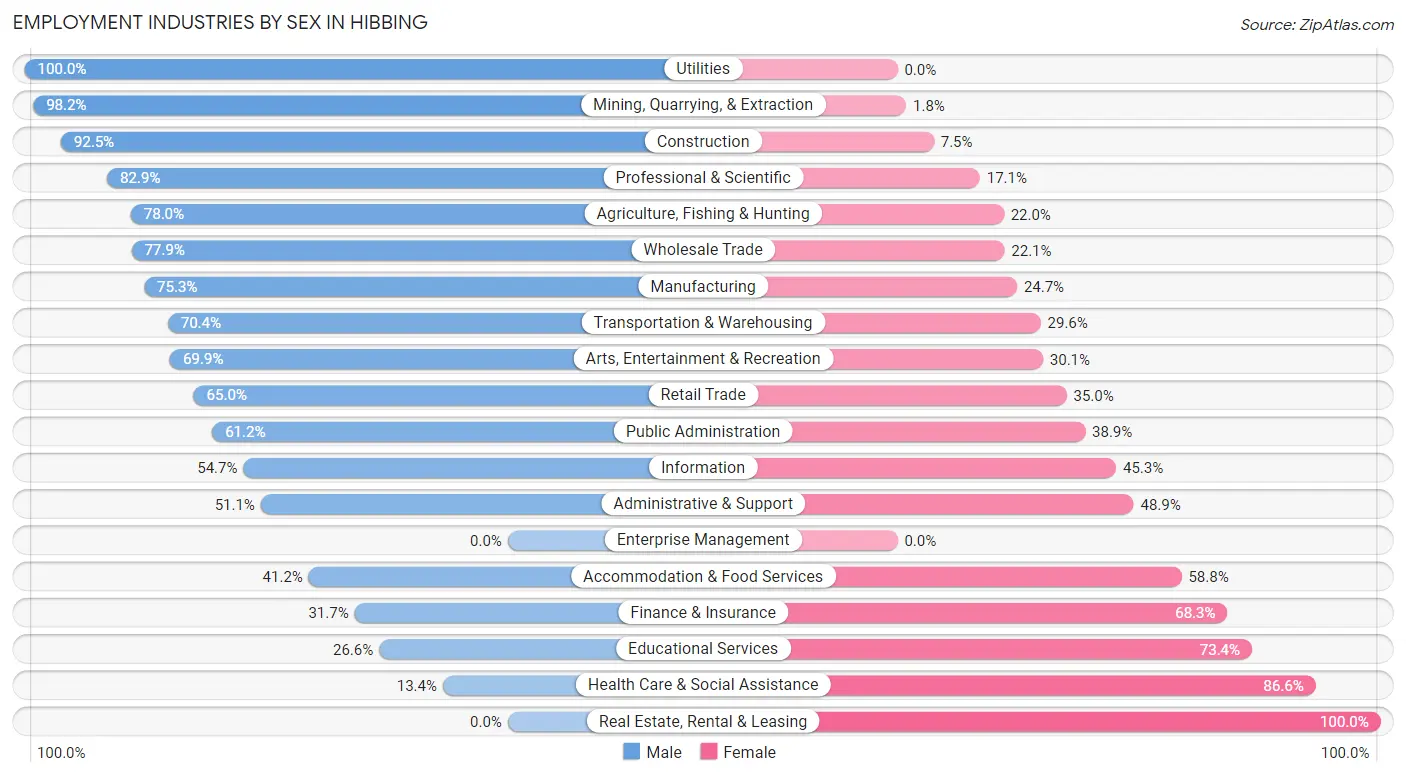
Employment Industries by Sex in Hibbing
The Hibbing industries that see more men than women are Utilities (100.0%), Mining, Quarrying, & Extraction (98.2%), and Construction (92.5%), whereas the industries that tend to have a higher number of women are Real Estate, Rental & Leasing (100.0%), Health Care & Social Assistance (86.6%), and Educational Services (73.4%).
| Industry | Male | Female |
| Agriculture, Fishing & Hunting | 78 (78.0%) | 22 (22.0%) |
| Mining, Quarrying, & Extraction | 383 (98.2%) | 7 (1.8%) |
| Construction | 418 (92.5%) | 34 (7.5%) |
| Manufacturing | 368 (75.3%) | 121 (24.7%) |
| Wholesale Trade | 183 (77.9%) | 52 (22.1%) |
| Retail Trade | 717 (65.0%) | 386 (35.0%) |
| Transportation & Warehousing | 178 (70.4%) | 75 (29.6%) |
| Utilities | 27 (100.0%) | 0 (0.0%) |
| Information | 75 (54.7%) | 62 (45.3%) |
| Finance & Insurance | 118 (31.7%) | 254 (68.3%) |
| Real Estate, Rental & Leasing | 0 (0.0%) | 5 (100.0%) |
| Professional & Scientific | 141 (82.9%) | 29 (17.1%) |
| Enterprise Management | 0 (0.0%) | 0 (0.0%) |
| Administrative & Support | 68 (51.1%) | 65 (48.9%) |
| Educational Services | 179 (26.6%) | 493 (73.4%) |
| Health Care & Social Assistance | 190 (13.4%) | 1,224 (86.6%) |
| Arts, Entertainment & Recreation | 72 (69.9%) | 31 (30.1%) |
| Accommodation & Food Services | 192 (41.2%) | 274 (58.8%) |
| Public Administration | 170 (61.2%) | 108 (38.9%) |
| Total | 3,831 (52.9%) | 3,406 (47.1%) |
Education in Hibbing
School Enrollment in Hibbing
The most common levels of schooling among the 3,477 students in Hibbing are high school (863 | 24.8%), middle school (774 | 22.3%), and college / undergraduate (668 | 19.2%).
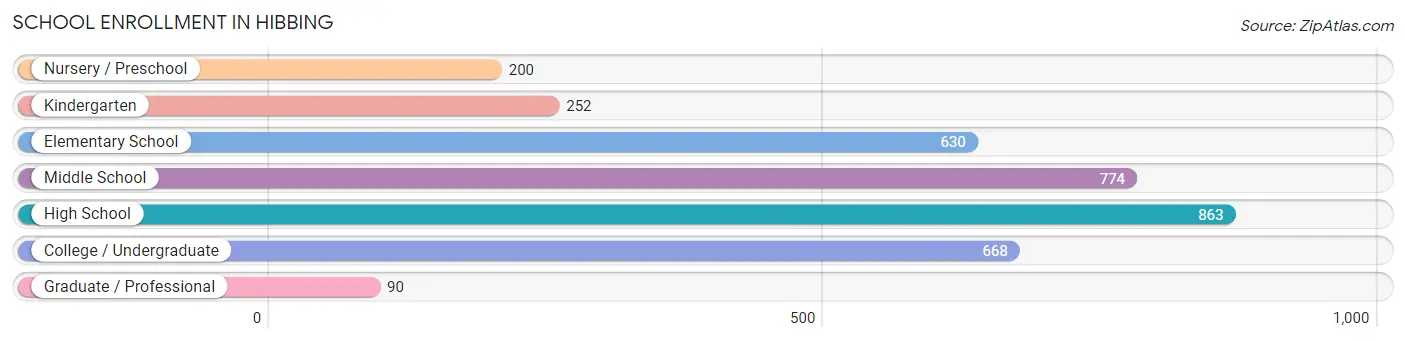
| School Level | # Students | % Students |
| Nursery / Preschool | 200 | 5.8% |
| Kindergarten | 252 | 7.2% |
| Elementary School | 630 | 18.1% |
| Middle School | 774 | 22.3% |
| High School | 863 | 24.8% |
| College / Undergraduate | 668 | 19.2% |
| Graduate / Professional | 90 | 2.6% |
| Total | 3,477 | 100.0% |
School Enrollment by Age by Funding Source in Hibbing
Out of a total of 3,477 students who are enrolled in schools in Hibbing, 191 (5.5%) attend a private institution, while the remaining 3,286 (94.5%) are enrolled in public schools. The age group of 3 to 4 year olds has the highest likelihood of being enrolled in private schools, with 39 (24.2% in the age bracket) enrolled. Conversely, the age group of 25 to 34 year olds has the lowest likelihood of being enrolled in a private school, with 103 (100.0% in the age bracket) attending a public institution.
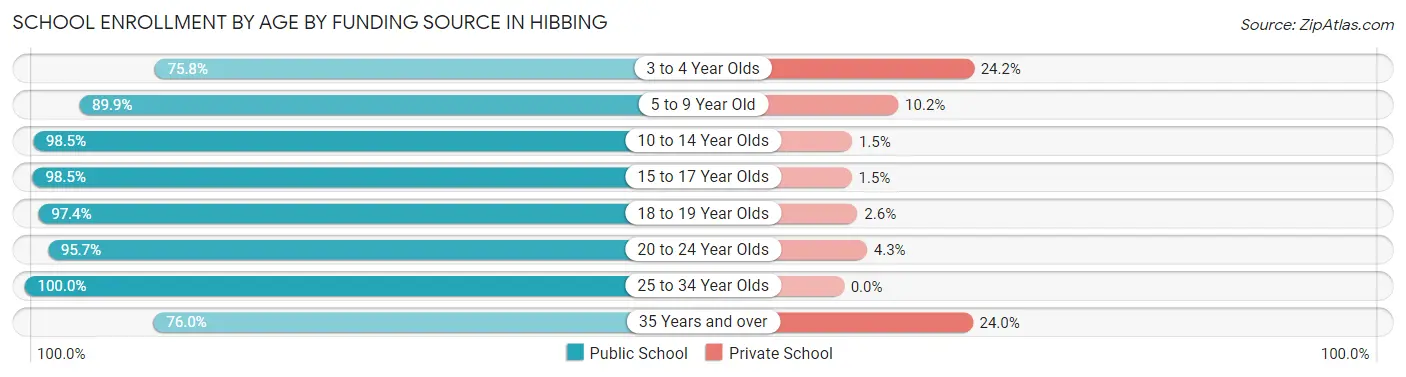
| Age Bracket | Public School | Private School |
| 3 to 4 Year Olds | 122 (75.8%) | 39 (24.2%) |
| 5 to 9 Year Old | 699 (89.8%) | 79 (10.2%) |
| 10 to 14 Year Olds | 961 (98.5%) | 15 (1.5%) |
| 15 to 17 Year Olds | 666 (98.5%) | 10 (1.5%) |
| 18 to 19 Year Olds | 305 (97.4%) | 8 (2.6%) |
| 20 to 24 Year Olds | 354 (95.7%) | 16 (4.3%) |
| 25 to 34 Year Olds | 103 (100.0%) | 0 (0.0%) |
| 35 Years and over | 76 (76.0%) | 24 (24.0%) |
| Total | 3,286 (94.5%) | 191 (5.5%) |
Educational Attainment by Field of Study in Hibbing
Education (582 | 22.9%), science & technology (369 | 14.5%), bio, nature & agricultural (289 | 11.4%), engineering (270 | 10.6%), and business (200 | 7.9%) are the most common fields of study among 2,537 individuals in Hibbing who have obtained a bachelor's degree or higher.
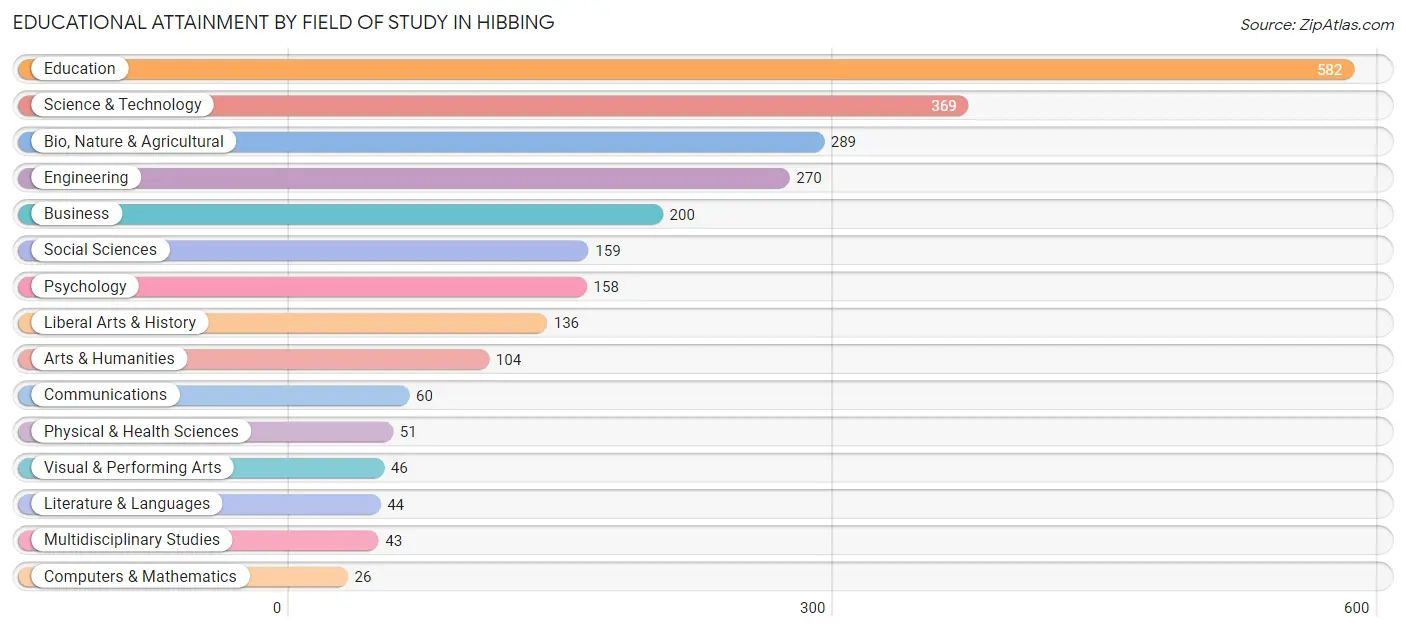
| Field of Study | # Graduates | % Graduates |
| Computers & Mathematics | 26 | 1.0% |
| Bio, Nature & Agricultural | 289 | 11.4% |
| Physical & Health Sciences | 51 | 2.0% |
| Psychology | 158 | 6.2% |
| Social Sciences | 159 | 6.3% |
| Engineering | 270 | 10.6% |
| Multidisciplinary Studies | 43 | 1.7% |
| Science & Technology | 369 | 14.5% |
| Business | 200 | 7.9% |
| Education | 582 | 22.9% |
| Literature & Languages | 44 | 1.7% |
| Liberal Arts & History | 136 | 5.4% |
| Visual & Performing Arts | 46 | 1.8% |
| Communications | 60 | 2.4% |
| Arts & Humanities | 104 | 4.1% |
| Total | 2,537 | 100.0% |
Transportation & Commute in Hibbing
Vehicle Availability by Sex in Hibbing
The most prevalent vehicle ownership categories in Hibbing are males with 2 vehicles (1,387, accounting for 37.6%) and females with 2 vehicles (1,059, making up 42.4%).
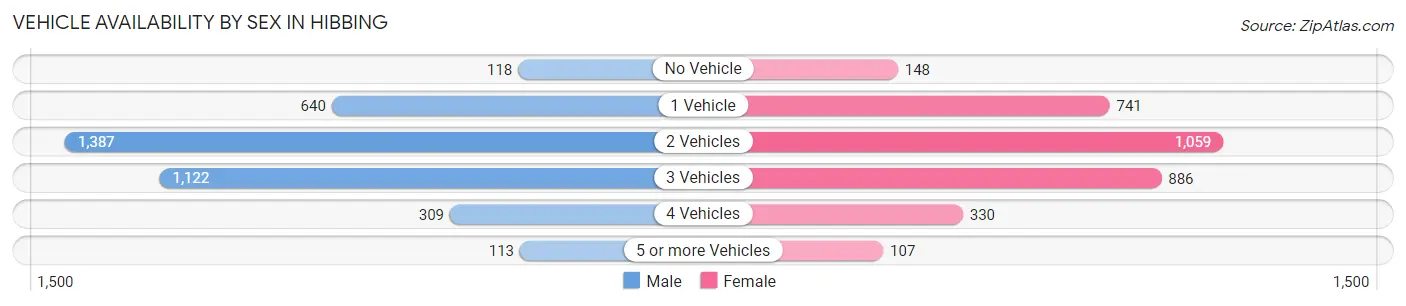
| Vehicles Available | Male | Female |
| No Vehicle | 118 (3.2%) | 148 (4.5%) |
| 1 Vehicle | 640 (17.3%) | 741 (22.7%) |
| 2 Vehicles | 1,387 (37.6%) | 1,059 (32.4%) |
| 3 Vehicles | 1,122 (30.4%) | 886 (27.1%) |
| 4 Vehicles | 309 (8.4%) | 330 (10.1%) |
| 5 or more Vehicles | 113 (3.1%) | 107 (3.3%) |
| Total | 3,689 (100.0%) | 3,271 (100.0%) |
Commute Time in Hibbing
The most frequently occuring commute durations in Hibbing are 5 to 9 minutes (1,921 commuters, 28.3%), 10 to 14 minutes (1,366 commuters, 20.2%), and 15 to 19 minutes (1,126 commuters, 16.6%).
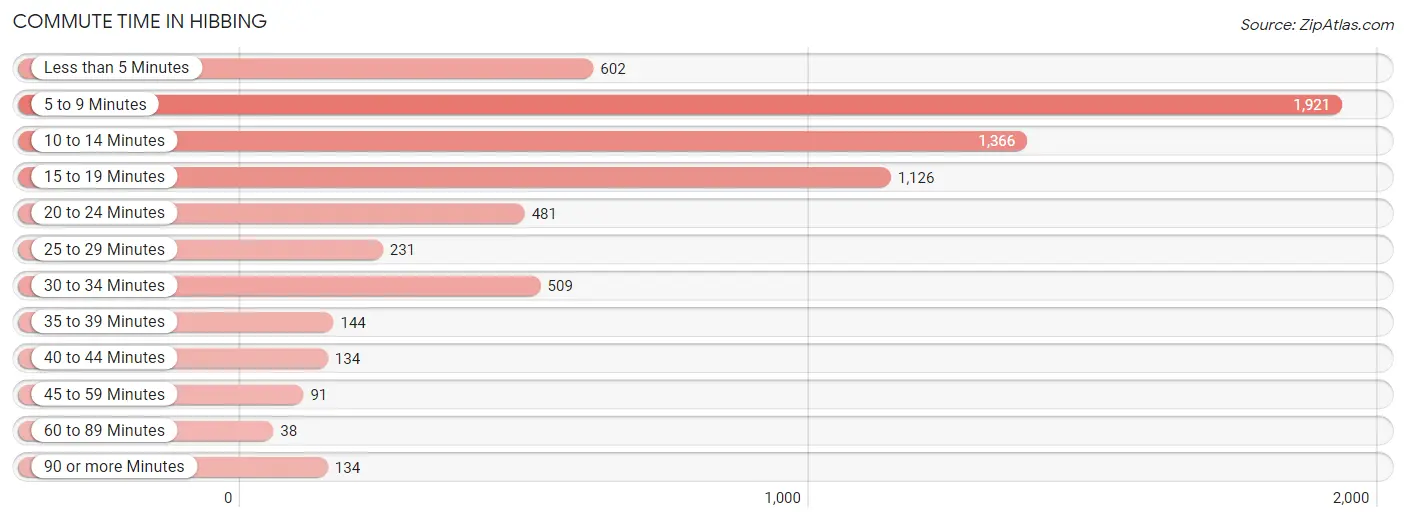
| Commute Time | # Commuters | % Commuters |
| Less than 5 Minutes | 602 | 8.9% |
| 5 to 9 Minutes | 1,921 | 28.3% |
| 10 to 14 Minutes | 1,366 | 20.2% |
| 15 to 19 Minutes | 1,126 | 16.6% |
| 20 to 24 Minutes | 481 | 7.1% |
| 25 to 29 Minutes | 231 | 3.4% |
| 30 to 34 Minutes | 509 | 7.5% |
| 35 to 39 Minutes | 144 | 2.1% |
| 40 to 44 Minutes | 134 | 2.0% |
| 45 to 59 Minutes | 91 | 1.3% |
| 60 to 89 Minutes | 38 | 0.6% |
| 90 or more Minutes | 134 | 2.0% |
Commute Time by Sex in Hibbing
The most common commute times in Hibbing are 5 to 9 minutes (837 commuters, 23.2%) for males and 5 to 9 minutes (1,084 commuters, 34.3%) for females.
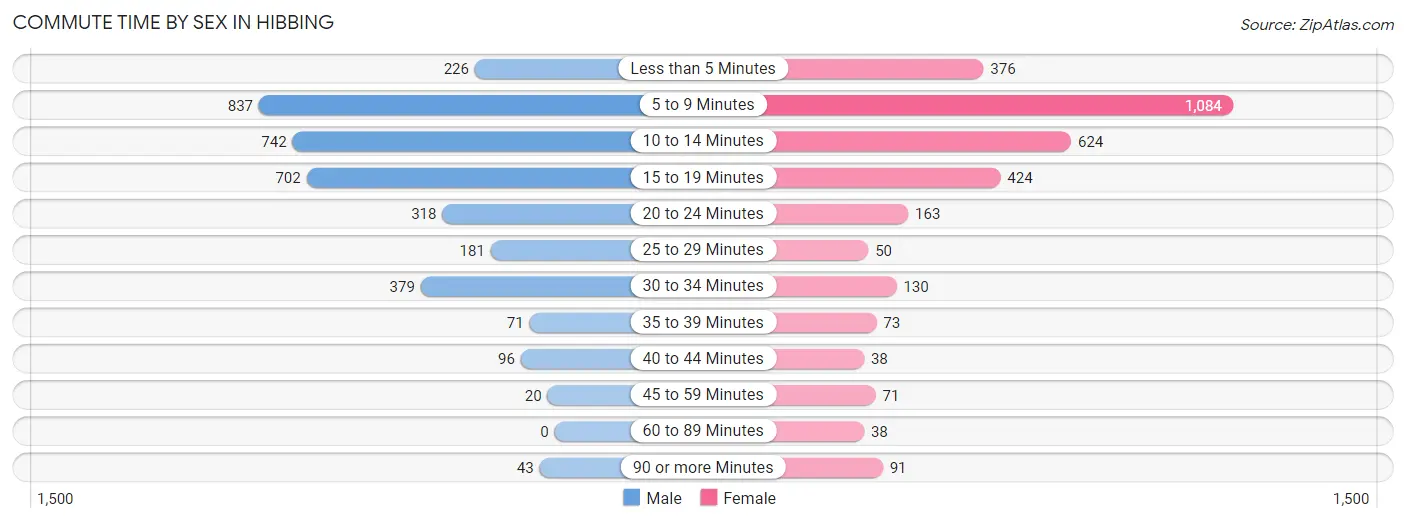
| Commute Time | Male | Female |
| Less than 5 Minutes | 226 (6.2%) | 376 (11.9%) |
| 5 to 9 Minutes | 837 (23.2%) | 1,084 (34.3%) |
| 10 to 14 Minutes | 742 (20.5%) | 624 (19.7%) |
| 15 to 19 Minutes | 702 (19.4%) | 424 (13.4%) |
| 20 to 24 Minutes | 318 (8.8%) | 163 (5.1%) |
| 25 to 29 Minutes | 181 (5.0%) | 50 (1.6%) |
| 30 to 34 Minutes | 379 (10.5%) | 130 (4.1%) |
| 35 to 39 Minutes | 71 (2.0%) | 73 (2.3%) |
| 40 to 44 Minutes | 96 (2.7%) | 38 (1.2%) |
| 45 to 59 Minutes | 20 (0.5%) | 71 (2.2%) |
| 60 to 89 Minutes | 0 (0.0%) | 38 (1.2%) |
| 90 or more Minutes | 43 (1.2%) | 91 (2.9%) |
Time of Departure to Work by Sex in Hibbing
The most frequent times of departure to work in Hibbing are 6:00 AM to 6:29 AM (500, 13.8%) for males and 7:30 AM to 7:59 AM (828, 26.2%) for females.
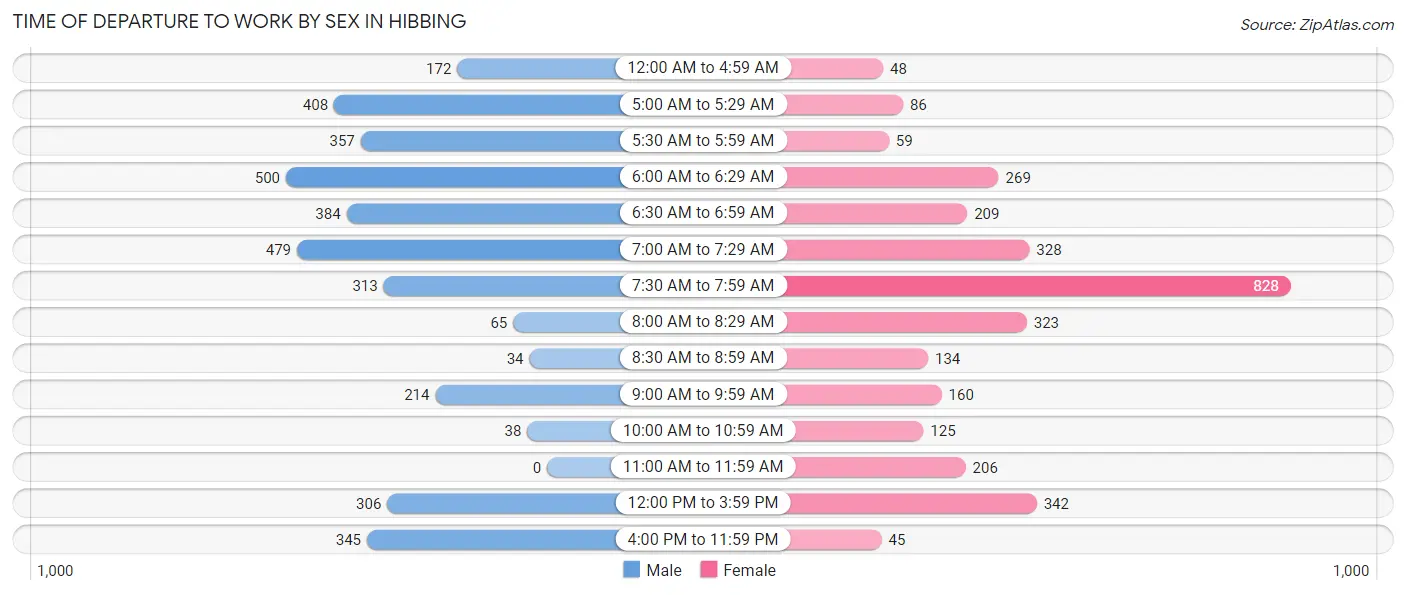
| Time of Departure | Male | Female |
| 12:00 AM to 4:59 AM | 172 (4.8%) | 48 (1.5%) |
| 5:00 AM to 5:29 AM | 408 (11.3%) | 86 (2.7%) |
| 5:30 AM to 5:59 AM | 357 (9.9%) | 59 (1.9%) |
| 6:00 AM to 6:29 AM | 500 (13.8%) | 269 (8.5%) |
| 6:30 AM to 6:59 AM | 384 (10.6%) | 209 (6.6%) |
| 7:00 AM to 7:29 AM | 479 (13.3%) | 328 (10.4%) |
| 7:30 AM to 7:59 AM | 313 (8.7%) | 828 (26.2%) |
| 8:00 AM to 8:29 AM | 65 (1.8%) | 323 (10.2%) |
| 8:30 AM to 8:59 AM | 34 (0.9%) | 134 (4.2%) |
| 9:00 AM to 9:59 AM | 214 (5.9%) | 160 (5.1%) |
| 10:00 AM to 10:59 AM | 38 (1.1%) | 125 (4.0%) |
| 11:00 AM to 11:59 AM | 0 (0.0%) | 206 (6.5%) |
| 12:00 PM to 3:59 PM | 306 (8.5%) | 342 (10.8%) |
| 4:00 PM to 11:59 PM | 345 (9.5%) | 45 (1.4%) |
| Total | 3,615 (100.0%) | 3,162 (100.0%) |
Housing Occupancy in Hibbing
Occupancy by Ownership in Hibbing
Of the total 7,458 dwellings in Hibbing, owner-occupied units account for 5,495 (73.7%), while renter-occupied units make up 1,963 (26.3%).
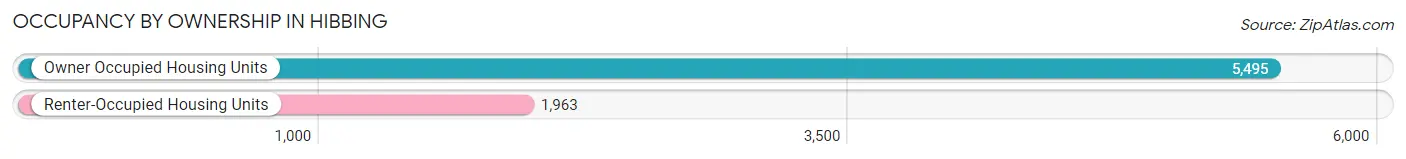
| Occupancy | # Housing Units | % Housing Units |
| Owner Occupied Housing Units | 5,495 | 73.7% |
| Renter-Occupied Housing Units | 1,963 | 26.3% |
| Total Occupied Housing Units | 7,458 | 100.0% |
Occupancy by Household Size in Hibbing
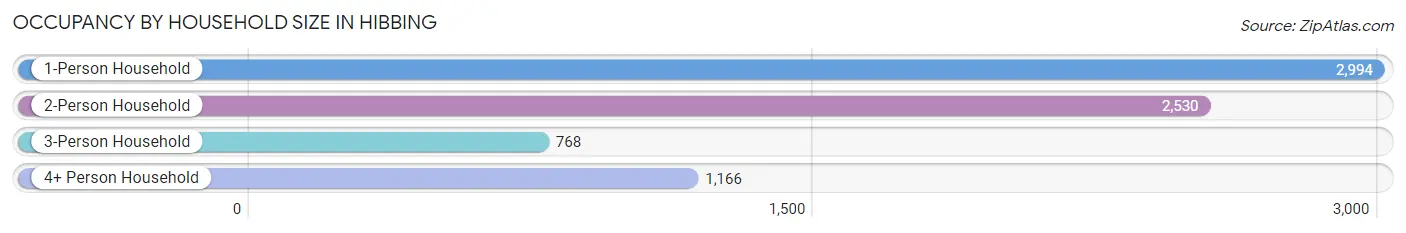
| Household Size | # Housing Units | % Housing Units |
| 1-Person Household | 2,994 | 40.1% |
| 2-Person Household | 2,530 | 33.9% |
| 3-Person Household | 768 | 10.3% |
| 4+ Person Household | 1,166 | 15.6% |
| Total Housing Units | 7,458 | 100.0% |
Occupancy by Ownership by Household Size in Hibbing
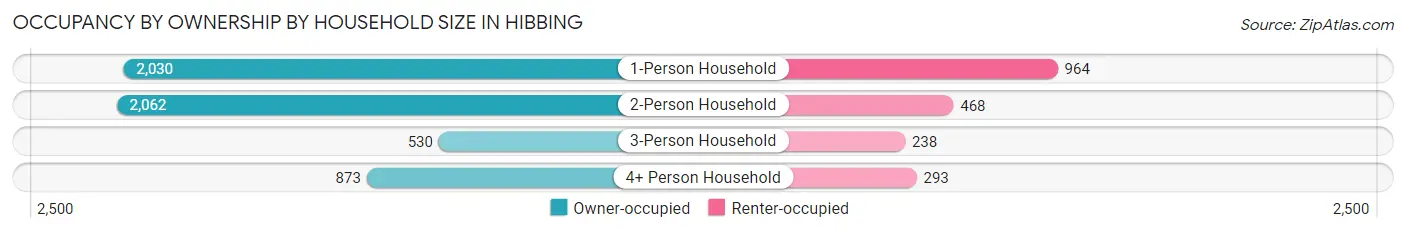
| Household Size | Owner-occupied | Renter-occupied |
| 1-Person Household | 2,030 (67.8%) | 964 (32.2%) |
| 2-Person Household | 2,062 (81.5%) | 468 (18.5%) |
| 3-Person Household | 530 (69.0%) | 238 (31.0%) |
| 4+ Person Household | 873 (74.9%) | 293 (25.1%) |
| Total Housing Units | 5,495 (73.7%) | 1,963 (26.3%) |
Occupancy by Educational Attainment in Hibbing
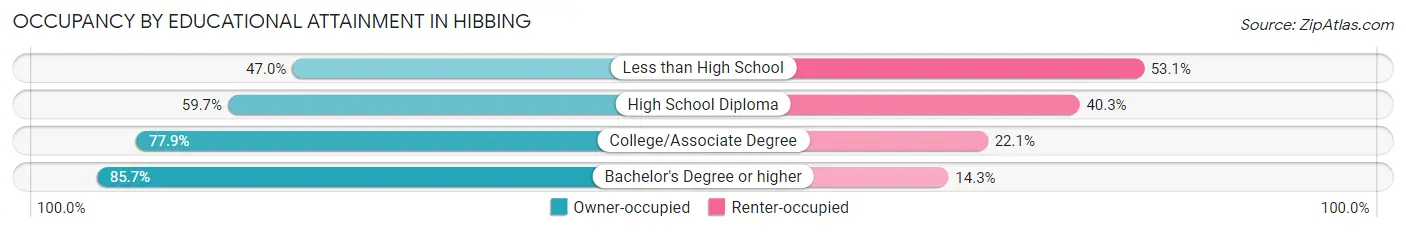
| Household Size | Owner-occupied | Renter-occupied |
| Less than High School | 185 (46.9%) | 209 (53.0%) |
| High School Diploma | 1,025 (59.7%) | 692 (40.3%) |
| College/Associate Degree | 2,957 (77.9%) | 840 (22.1%) |
| Bachelor's Degree or higher | 1,328 (85.7%) | 222 (14.3%) |
Occupancy by Age of Householder in Hibbing
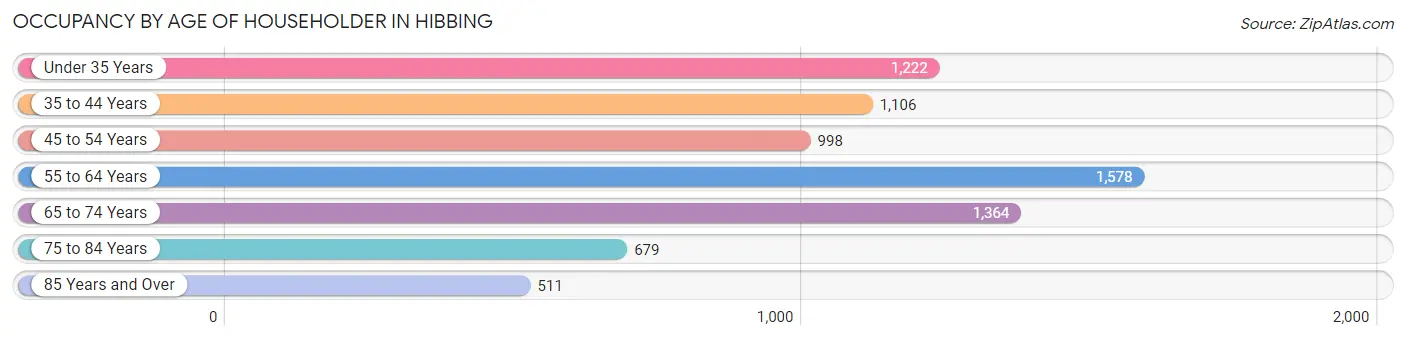
| Age Bracket | # Households | % Households |
| Under 35 Years | 1,222 | 16.4% |
| 35 to 44 Years | 1,106 | 14.8% |
| 45 to 54 Years | 998 | 13.4% |
| 55 to 64 Years | 1,578 | 21.2% |
| 65 to 74 Years | 1,364 | 18.3% |
| 75 to 84 Years | 679 | 9.1% |
| 85 Years and Over | 511 | 6.9% |
| Total | 7,458 | 100.0% |
Housing Finances in Hibbing
Median Income by Occupancy in Hibbing
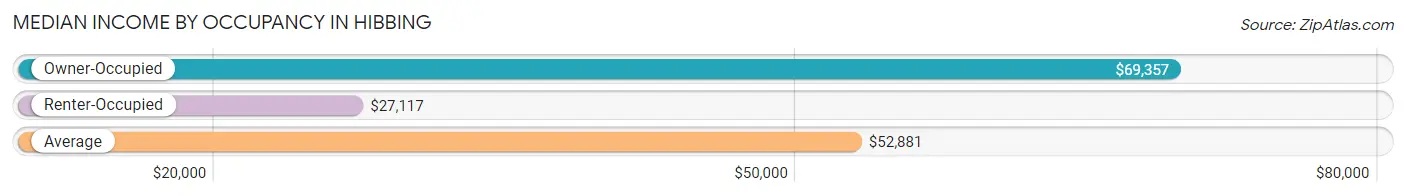
| Occupancy Type | # Households | Median Income |
| Owner-Occupied | 5,495 (73.7%) | $69,357 |
| Renter-Occupied | 1,963 (26.3%) | $27,117 |
| Average | 7,458 (100.0%) | $52,881 |
Occupancy by Householder Income Bracket in Hibbing
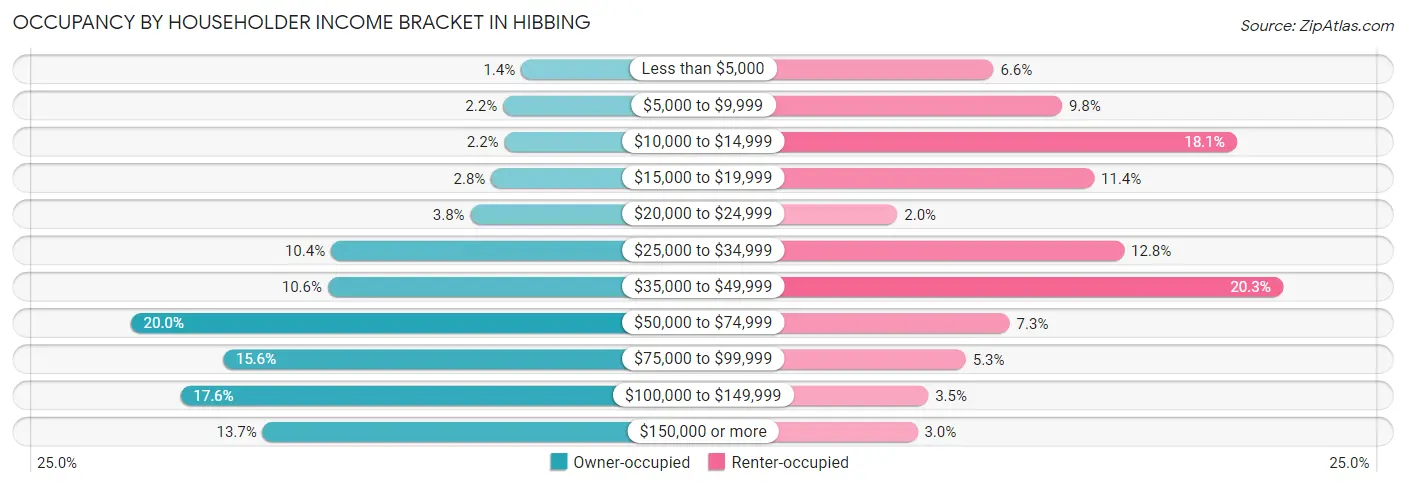
| Income Bracket | Owner-occupied | Renter-occupied |
| Less than $5,000 | 75 (1.4%) | 129 (6.6%) |
| $5,000 to $9,999 | 122 (2.2%) | 193 (9.8%) |
| $10,000 to $14,999 | 118 (2.1%) | 356 (18.1%) |
| $15,000 to $19,999 | 153 (2.8%) | 223 (11.4%) |
| $20,000 to $24,999 | 207 (3.8%) | 39 (2.0%) |
| $25,000 to $34,999 | 572 (10.4%) | 251 (12.8%) |
| $35,000 to $49,999 | 580 (10.6%) | 399 (20.3%) |
| $50,000 to $74,999 | 1,096 (20.0%) | 144 (7.3%) |
| $75,000 to $99,999 | 855 (15.6%) | 103 (5.2%) |
| $100,000 to $149,999 | 966 (17.6%) | 68 (3.5%) |
| $150,000 or more | 751 (13.7%) | 58 (2.9%) |
| Total | 5,495 (100.0%) | 1,963 (100.0%) |
Monthly Housing Cost Tiers in Hibbing
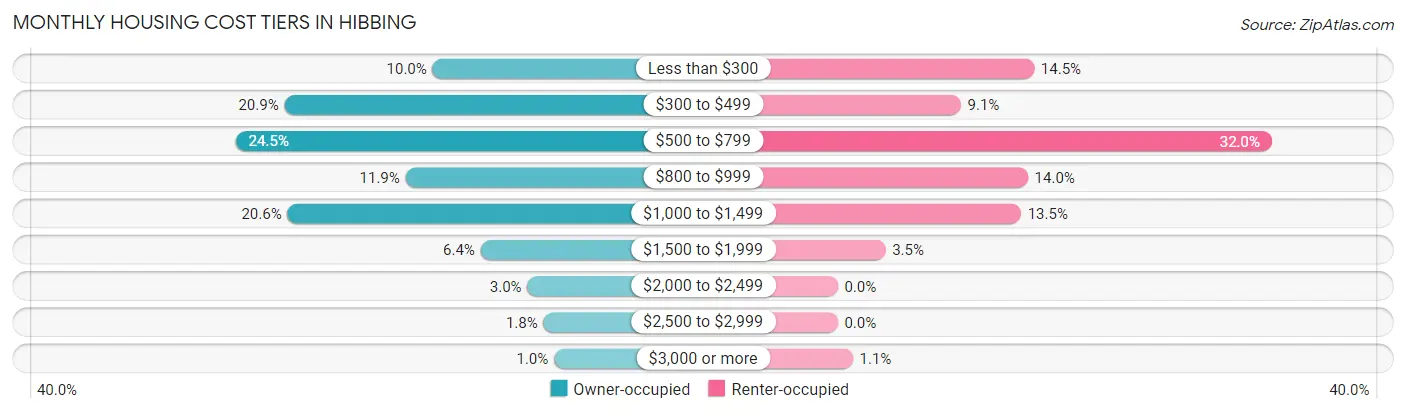
| Monthly Cost | Owner-occupied | Renter-occupied |
| Less than $300 | 547 (10.0%) | 284 (14.5%) |
| $300 to $499 | 1,146 (20.9%) | 178 (9.1%) |
| $500 to $799 | 1,344 (24.5%) | 628 (32.0%) |
| $800 to $999 | 656 (11.9%) | 275 (14.0%) |
| $1,000 to $1,499 | 1,134 (20.6%) | 265 (13.5%) |
| $1,500 to $1,999 | 352 (6.4%) | 69 (3.5%) |
| $2,000 to $2,499 | 163 (3.0%) | 0 (0.0%) |
| $2,500 to $2,999 | 98 (1.8%) | 0 (0.0%) |
| $3,000 or more | 55 (1.0%) | 22 (1.1%) |
| Total | 5,495 (100.0%) | 1,963 (100.0%) |
Physical Housing Characteristics in Hibbing
Housing Structures in Hibbing
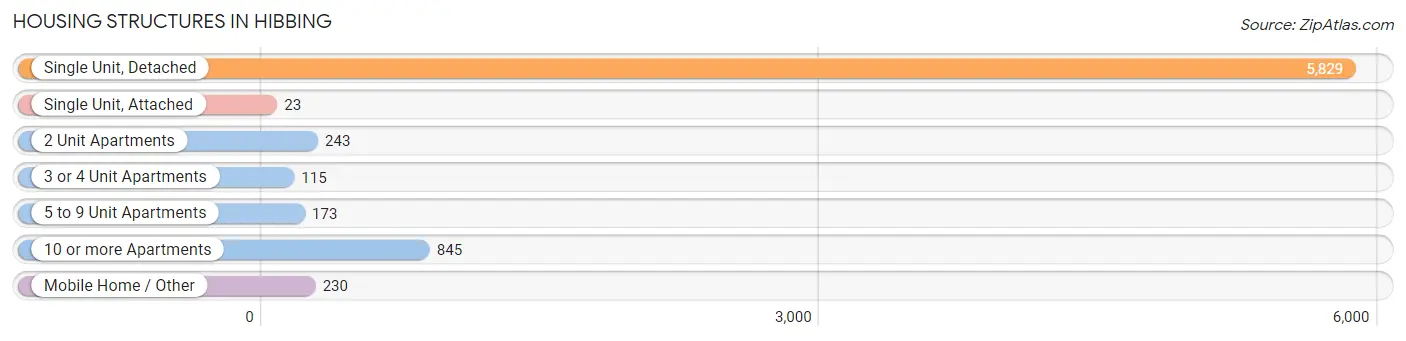
| Structure Type | # Housing Units | % Housing Units |
| Single Unit, Detached | 5,829 | 78.2% |
| Single Unit, Attached | 23 | 0.3% |
| 2 Unit Apartments | 243 | 3.3% |
| 3 or 4 Unit Apartments | 115 | 1.5% |
| 5 to 9 Unit Apartments | 173 | 2.3% |
| 10 or more Apartments | 845 | 11.3% |
| Mobile Home / Other | 230 | 3.1% |
| Total | 7,458 | 100.0% |
Housing Structures by Occupancy in Hibbing
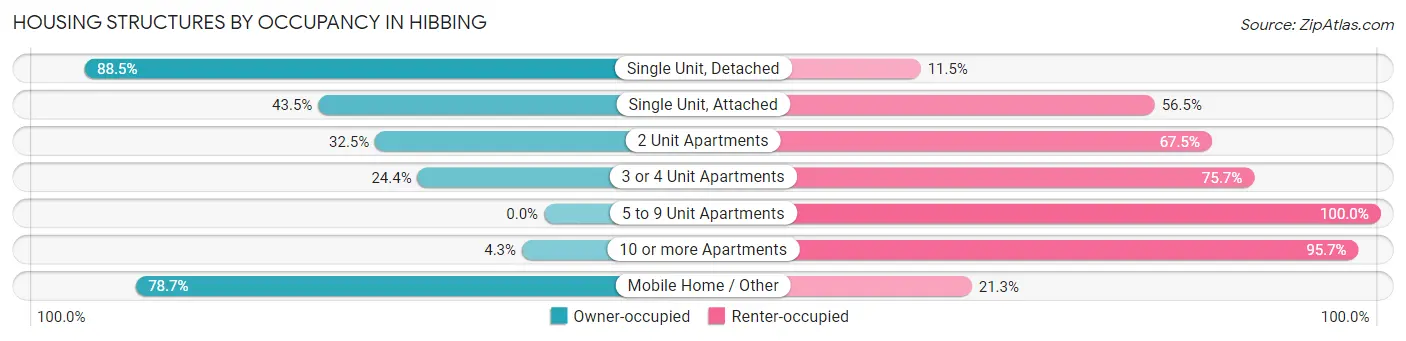
| Structure Type | Owner-occupied | Renter-occupied |
| Single Unit, Detached | 5,161 (88.5%) | 668 (11.5%) |
| Single Unit, Attached | 10 (43.5%) | 13 (56.5%) |
| 2 Unit Apartments | 79 (32.5%) | 164 (67.5%) |
| 3 or 4 Unit Apartments | 28 (24.3%) | 87 (75.6%) |
| 5 to 9 Unit Apartments | 0 (0.0%) | 173 (100.0%) |
| 10 or more Apartments | 36 (4.3%) | 809 (95.7%) |
| Mobile Home / Other | 181 (78.7%) | 49 (21.3%) |
| Total | 5,495 (73.7%) | 1,963 (26.3%) |
Housing Structures by Number of Rooms in Hibbing
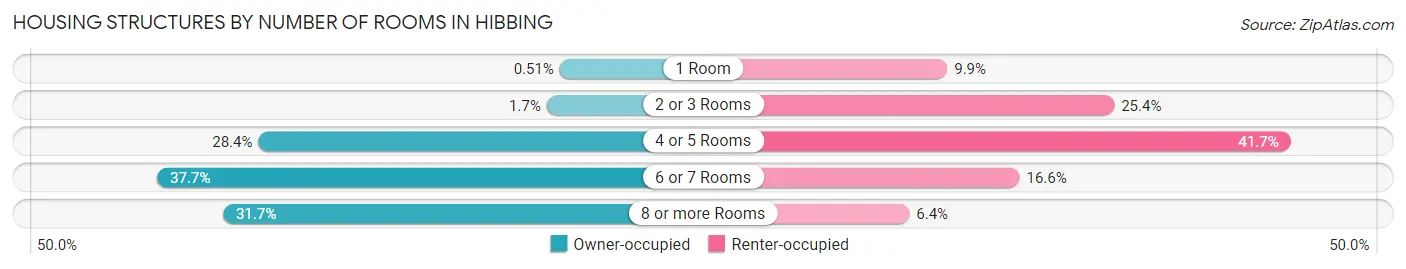
| Number of Rooms | Owner-occupied | Renter-occupied |
| 1 Room | 28 (0.5%) | 195 (9.9%) |
| 2 or 3 Rooms | 94 (1.7%) | 498 (25.4%) |
| 4 or 5 Rooms | 1,560 (28.4%) | 818 (41.7%) |
| 6 or 7 Rooms | 2,074 (37.7%) | 326 (16.6%) |
| 8 or more Rooms | 1,739 (31.7%) | 126 (6.4%) |
| Total | 5,495 (100.0%) | 1,963 (100.0%) |
Housing Structure by Heating Type in Hibbing
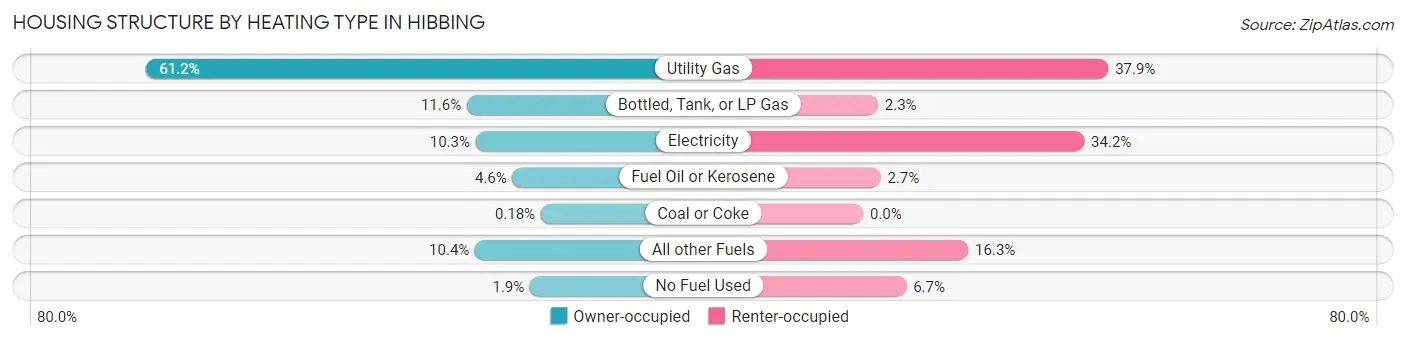
| Heating Type | Owner-occupied | Renter-occupied |
| Utility Gas | 3,362 (61.2%) | 744 (37.9%) |
| Bottled, Tank, or LP Gas | 638 (11.6%) | 45 (2.3%) |
| Electricity | 563 (10.2%) | 671 (34.2%) |
| Fuel Oil or Kerosene | 251 (4.6%) | 53 (2.7%) |
| Coal or Coke | 10 (0.2%) | 0 (0.0%) |
| All other Fuels | 569 (10.3%) | 319 (16.3%) |
| No Fuel Used | 102 (1.9%) | 131 (6.7%) |
| Total | 5,495 (100.0%) | 1,963 (100.0%) |
Household Vehicle Usage in Hibbing
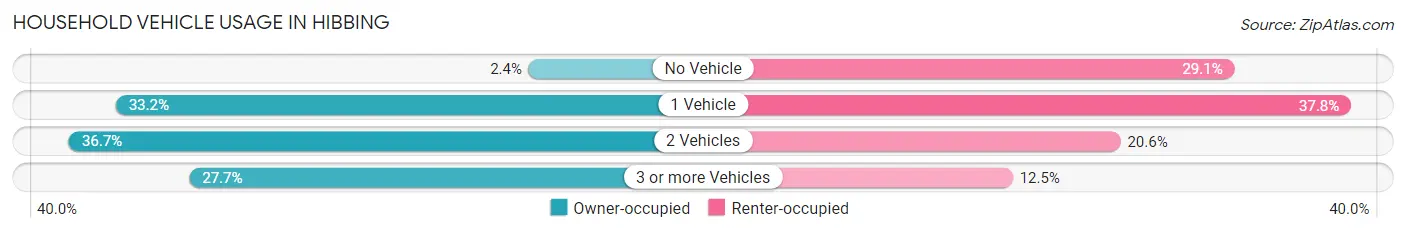
| Vehicles per Household | Owner-occupied | Renter-occupied |
| No Vehicle | 133 (2.4%) | 571 (29.1%) |
| 1 Vehicle | 1,824 (33.2%) | 742 (37.8%) |
| 2 Vehicles | 2,016 (36.7%) | 404 (20.6%) |
| 3 or more Vehicles | 1,522 (27.7%) | 246 (12.5%) |
| Total | 5,495 (100.0%) | 1,963 (100.0%) |
Real Estate & Mortgages in Hibbing
Real Estate and Mortgage Overview in Hibbing
| Characteristic | Without Mortgage | With Mortgage |
| Housing Units | 2,671 | 2,824 |
| Median Property Value | $117,600 | $122,200 |
| Median Household Income | $52,825 | $580 |
| Monthly Housing Costs | $452 | $13 |
| Real Estate Taxes | $1,092 | $116 |
Property Value by Mortgage Status in Hibbing
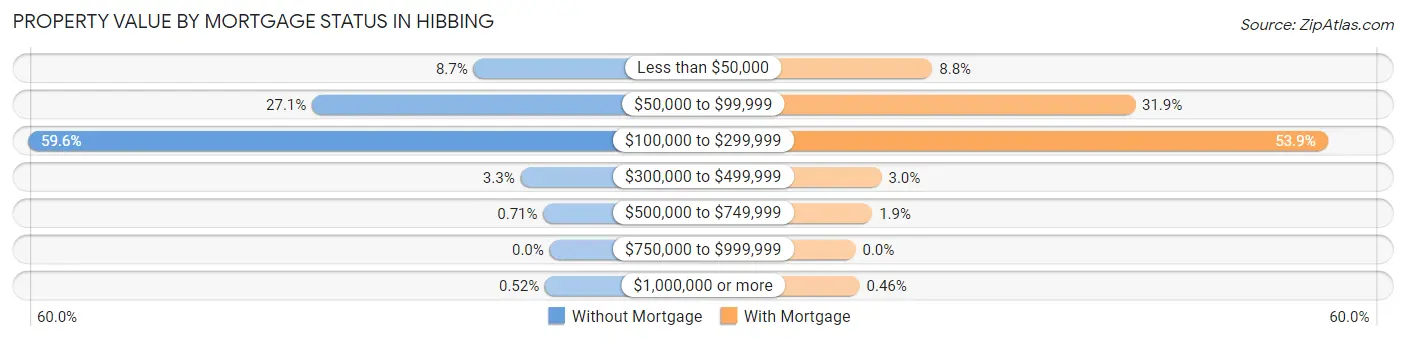
| Property Value | Without Mortgage | With Mortgage |
| Less than $50,000 | 232 (8.7%) | 248 (8.8%) |
| $50,000 to $99,999 | 725 (27.1%) | 902 (31.9%) |
| $100,000 to $299,999 | 1,592 (59.6%) | 1,523 (53.9%) |
| $300,000 to $499,999 | 89 (3.3%) | 84 (3.0%) |
| $500,000 to $749,999 | 19 (0.7%) | 54 (1.9%) |
| $750,000 to $999,999 | 0 (0.0%) | 0 (0.0%) |
| $1,000,000 or more | 14 (0.5%) | 13 (0.5%) |
| Total | 2,671 (100.0%) | 2,824 (100.0%) |
Household Income by Mortgage Status in Hibbing
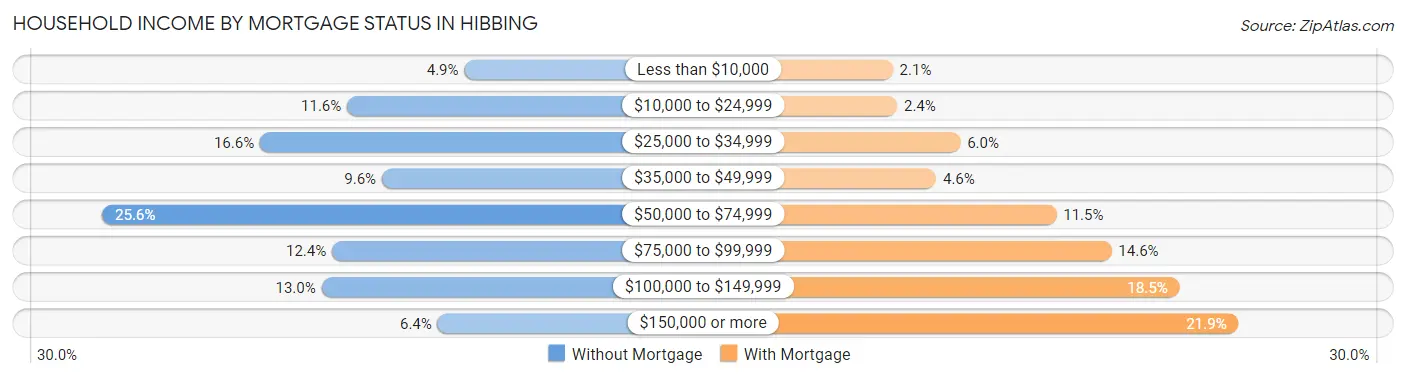
| Household Income | Without Mortgage | With Mortgage |
| Less than $10,000 | 130 (4.9%) | 60 (2.1%) |
| $10,000 to $24,999 | 309 (11.6%) | 67 (2.4%) |
| $25,000 to $34,999 | 442 (16.6%) | 169 (6.0%) |
| $35,000 to $49,999 | 256 (9.6%) | 130 (4.6%) |
| $50,000 to $74,999 | 683 (25.6%) | 324 (11.5%) |
| $75,000 to $99,999 | 332 (12.4%) | 413 (14.6%) |
| $100,000 to $149,999 | 348 (13.0%) | 523 (18.5%) |
| $150,000 or more | 171 (6.4%) | 618 (21.9%) |
| Total | 2,671 (100.0%) | 2,824 (100.0%) |
Property Value to Household Income Ratio in Hibbing
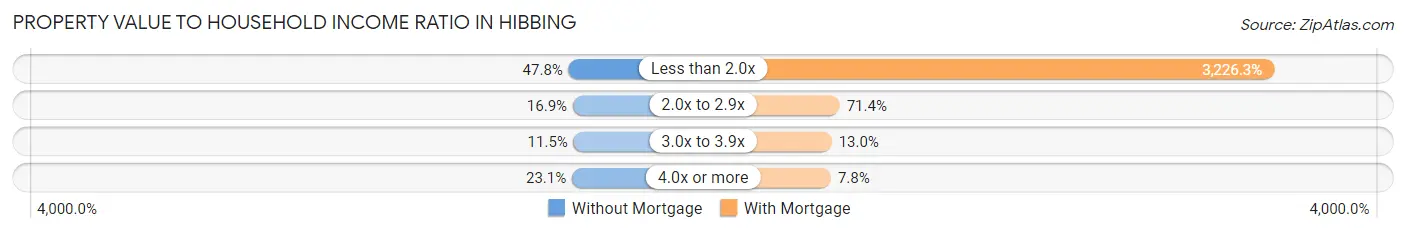
| Value-to-Income Ratio | Without Mortgage | With Mortgage |
| Less than 2.0x | 1,276 (47.8%) | 91,111 (3,226.3%) |
| 2.0x to 2.9x | 452 (16.9%) | 2,015 (71.4%) |
| 3.0x to 3.9x | 307 (11.5%) | 366 (13.0%) |
| 4.0x or more | 617 (23.1%) | 221 (7.8%) |
| Total | 2,671 (100.0%) | 2,824 (100.0%) |
Real Estate Taxes by Mortgage Status in Hibbing
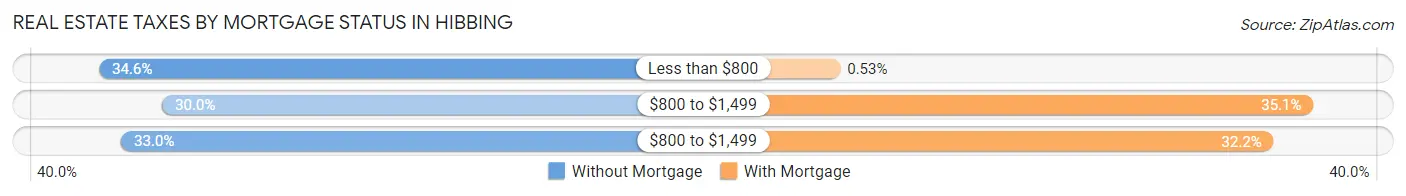
| Property Taxes | Without Mortgage | With Mortgage |
| Less than $800 | 923 (34.6%) | 15 (0.5%) |
| $800 to $1,499 | 800 (29.9%) | 991 (35.1%) |
| $800 to $1,499 | 880 (33.0%) | 909 (32.2%) |
| Total | 2,671 (100.0%) | 2,824 (100.0%) |
Health & Disability in Hibbing
Health Insurance Coverage by Age in Hibbing
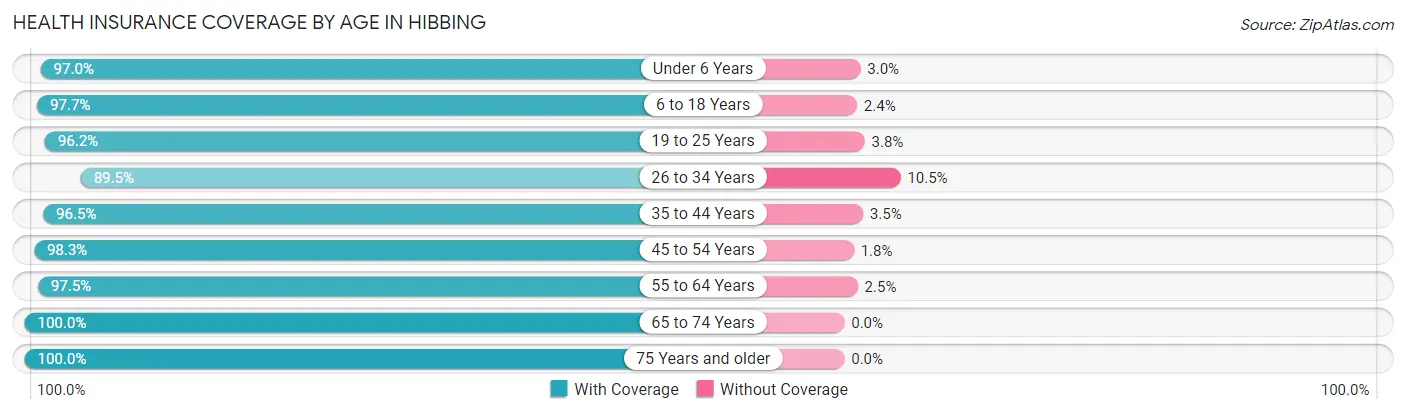
| Age Bracket | With Coverage | Without Coverage |
| Under 6 Years | 906 (97.0%) | 28 (3.0%) |
| 6 to 18 Years | 2,451 (97.7%) | 59 (2.4%) |
| 19 to 25 Years | 1,217 (96.2%) | 48 (3.8%) |
| 26 to 34 Years | 1,702 (89.5%) | 199 (10.5%) |
| 35 to 44 Years | 1,695 (96.5%) | 61 (3.5%) |
| 45 to 54 Years | 1,737 (98.3%) | 31 (1.8%) |
| 55 to 64 Years | 2,313 (97.5%) | 59 (2.5%) |
| 65 to 74 Years | 2,031 (100.0%) | 0 (0.0%) |
| 75 Years and older | 1,473 (100.0%) | 0 (0.0%) |
| Total | 15,525 (97.0%) | 485 (3.0%) |
Health Insurance Coverage by Citizenship Status in Hibbing
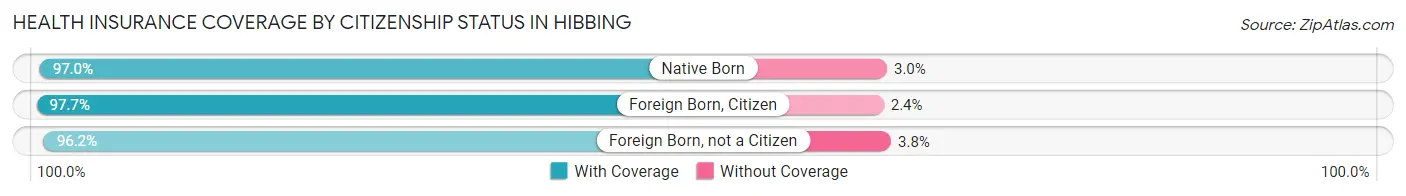
| Citizenship Status | With Coverage | Without Coverage |
| Native Born | 906 (97.0%) | 28 (3.0%) |
| Foreign Born, Citizen | 2,451 (97.7%) | 59 (2.4%) |
| Foreign Born, not a Citizen | 1,217 (96.2%) | 48 (3.8%) |
Health Insurance Coverage by Household Income in Hibbing
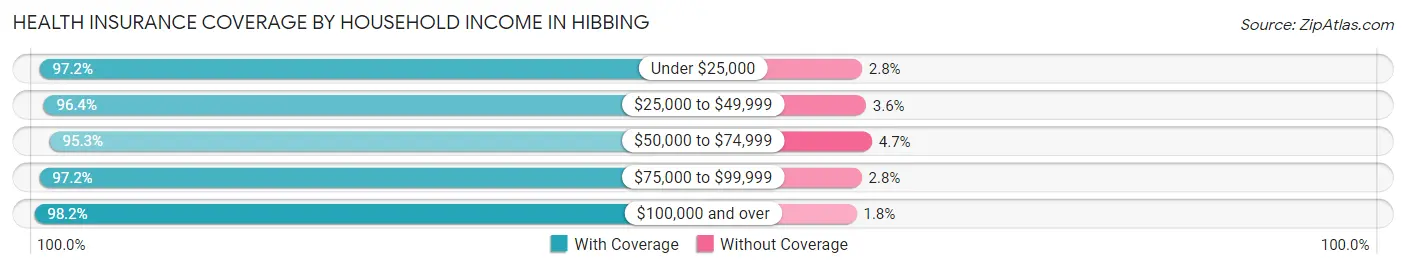
| Household Income | With Coverage | Without Coverage |
| Under $25,000 | 2,207 (97.2%) | 64 (2.8%) |
| $25,000 to $49,999 | 3,245 (96.4%) | 120 (3.6%) |
| $50,000 to $74,999 | 2,394 (95.3%) | 118 (4.7%) |
| $75,000 to $99,999 | 2,308 (97.2%) | 66 (2.8%) |
| $100,000 and over | 5,230 (98.2%) | 97 (1.8%) |
Public vs Private Health Insurance Coverage by Age in Hibbing
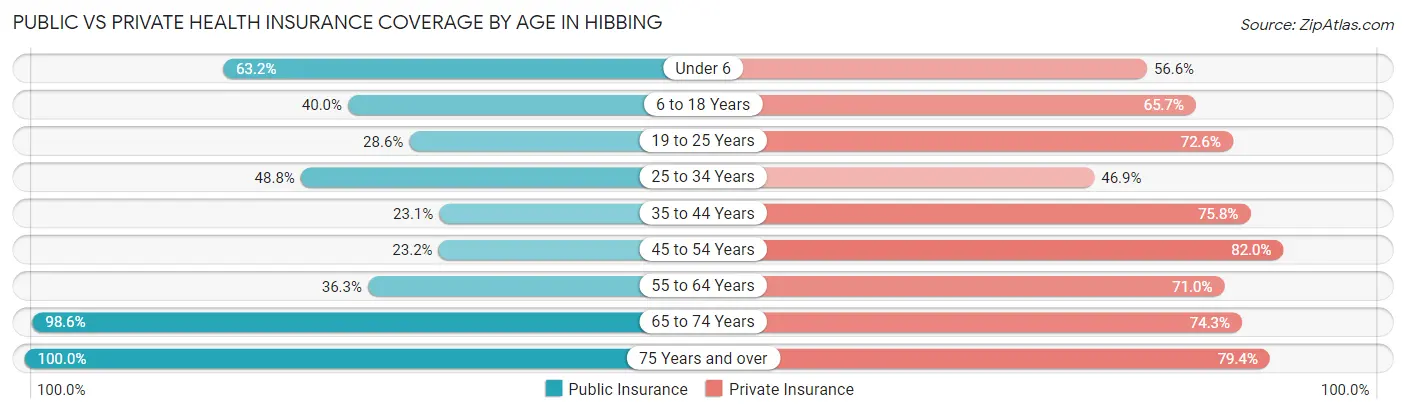
| Age Bracket | Public Insurance | Private Insurance |
| Under 6 | 590 (63.2%) | 529 (56.6%) |
| 6 to 18 Years | 1,004 (40.0%) | 1,649 (65.7%) |
| 19 to 25 Years | 362 (28.6%) | 918 (72.6%) |
| 25 to 34 Years | 927 (48.8%) | 891 (46.9%) |
| 35 to 44 Years | 405 (23.1%) | 1,331 (75.8%) |
| 45 to 54 Years | 410 (23.2%) | 1,449 (82.0%) |
| 55 to 64 Years | 861 (36.3%) | 1,684 (71.0%) |
| 65 to 74 Years | 2,002 (98.6%) | 1,508 (74.3%) |
| 75 Years and over | 1,473 (100.0%) | 1,170 (79.4%) |
| Total | 8,034 (50.2%) | 11,129 (69.5%) |
Disability Status by Sex by Age in Hibbing
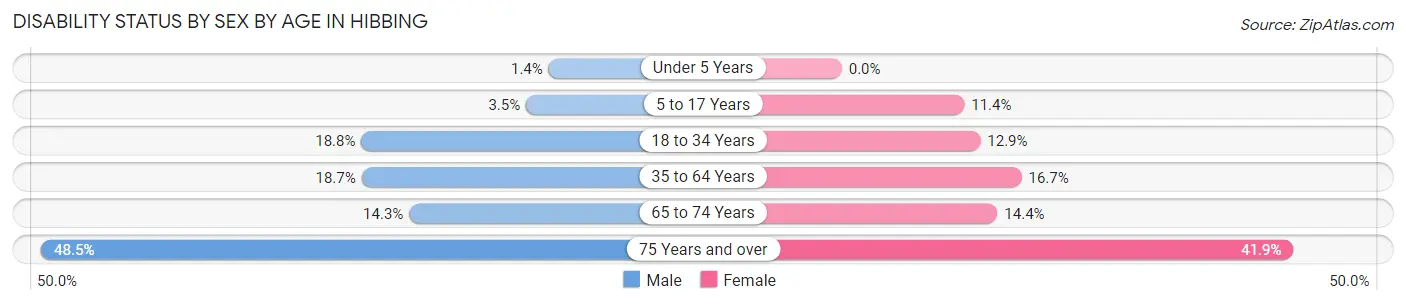
| Age Bracket | Male | Female |
| Under 5 Years | 6 (1.4%) | 0 (0.0%) |
| 5 to 17 Years | 43 (3.5%) | 143 (11.4%) |
| 18 to 34 Years | 329 (18.8%) | 200 (12.9%) |
| 35 to 64 Years | 581 (18.7%) | 466 (16.7%) |
| 65 to 74 Years | 146 (14.3%) | 146 (14.4%) |
| 75 Years and over | 220 (48.5%) | 427 (41.9%) |
Disability Class by Sex by Age in Hibbing
Disability Class: Hearing Difficulty
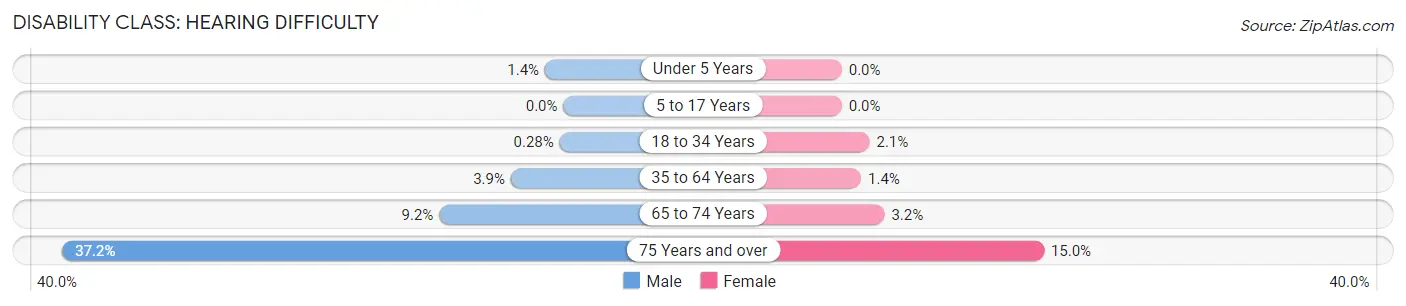
| Age Bracket | Male | Female |
| Under 5 Years | 6 (1.4%) | 0 (0.0%) |
| 5 to 17 Years | 0 (0.0%) | 0 (0.0%) |
| 18 to 34 Years | 5 (0.3%) | 32 (2.1%) |
| 35 to 64 Years | 121 (3.9%) | 40 (1.4%) |
| 65 to 74 Years | 94 (9.2%) | 32 (3.2%) |
| 75 Years and over | 169 (37.2%) | 153 (15.0%) |
Disability Class: Vision Difficulty
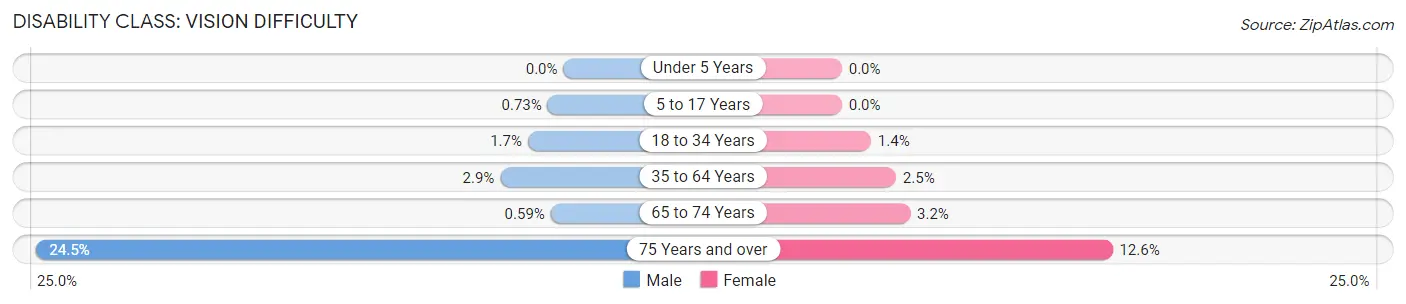
| Age Bracket | Male | Female |
| Under 5 Years | 0 (0.0%) | 0 (0.0%) |
| 5 to 17 Years | 9 (0.7%) | 0 (0.0%) |
| 18 to 34 Years | 29 (1.7%) | 21 (1.3%) |
| 35 to 64 Years | 91 (2.9%) | 70 (2.5%) |
| 65 to 74 Years | 6 (0.6%) | 32 (3.2%) |
| 75 Years and over | 111 (24.4%) | 128 (12.6%) |
Disability Class: Cognitive Difficulty
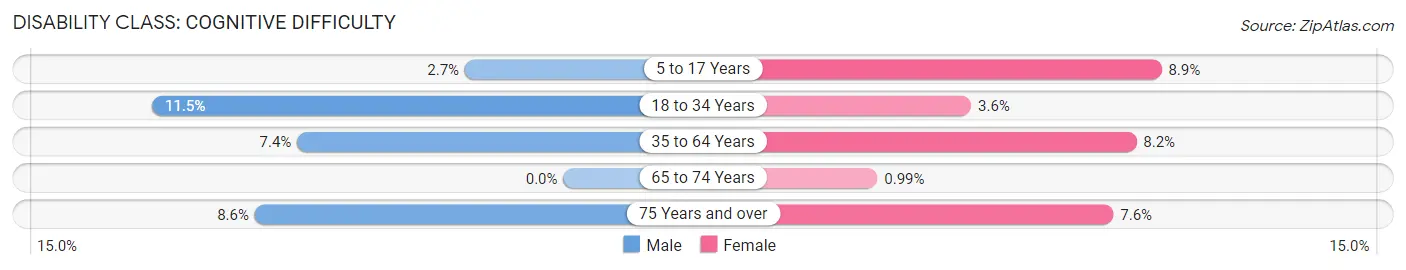
| Age Bracket | Male | Female |
| 5 to 17 Years | 34 (2.7%) | 112 (8.9%) |
| 18 to 34 Years | 201 (11.5%) | 56 (3.6%) |
| 35 to 64 Years | 230 (7.4%) | 229 (8.2%) |
| 65 to 74 Years | 0 (0.0%) | 10 (1.0%) |
| 75 Years and over | 39 (8.6%) | 77 (7.6%) |
Disability Class: Ambulatory Difficulty
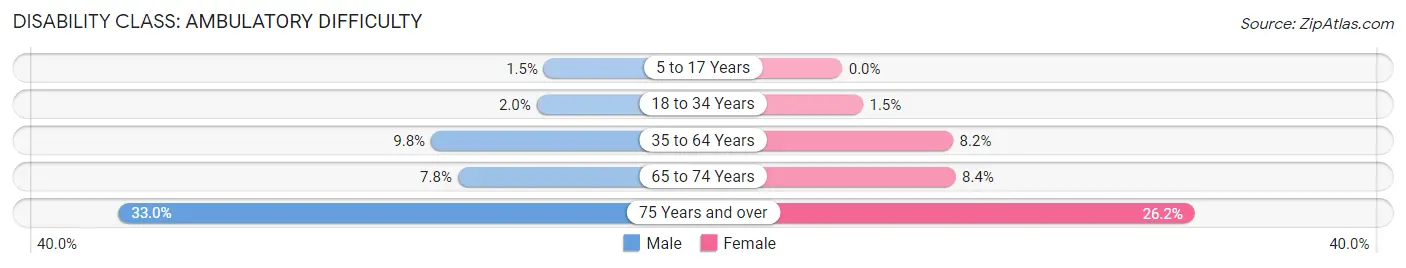
| Age Bracket | Male | Female |
| 5 to 17 Years | 18 (1.5%) | 0 (0.0%) |
| 18 to 34 Years | 35 (2.0%) | 24 (1.5%) |
| 35 to 64 Years | 305 (9.8%) | 230 (8.2%) |
| 65 to 74 Years | 80 (7.8%) | 85 (8.4%) |
| 75 Years and over | 150 (33.0%) | 267 (26.2%) |
Disability Class: Self-Care Difficulty
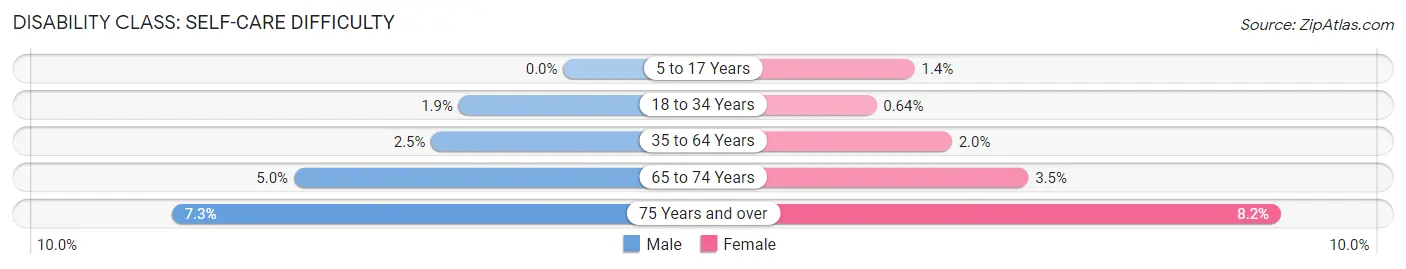
| Age Bracket | Male | Female |
| 5 to 17 Years | 0 (0.0%) | 17 (1.3%) |
| 18 to 34 Years | 34 (1.9%) | 10 (0.6%) |
| 35 to 64 Years | 76 (2.5%) | 57 (2.0%) |
| 65 to 74 Years | 51 (5.0%) | 35 (3.5%) |
| 75 Years and over | 33 (7.3%) | 83 (8.2%) |
Technology Access in Hibbing
Computing Device Access in Hibbing
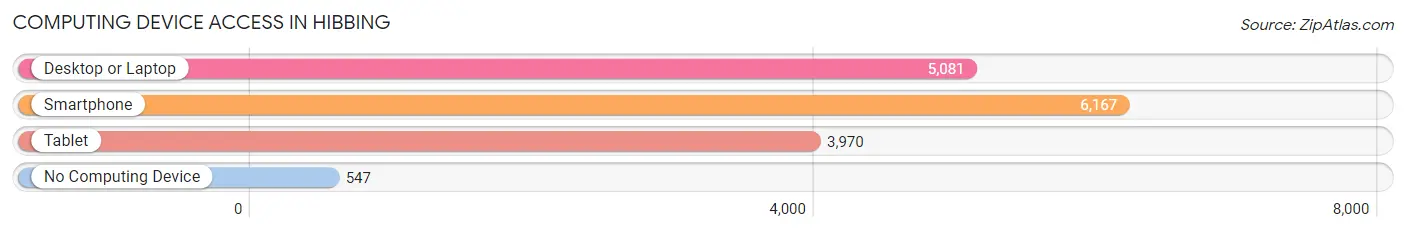
| Device Type | # Households | % Households |
| Desktop or Laptop | 5,081 | 68.1% |
| Smartphone | 6,167 | 82.7% |
| Tablet | 3,970 | 53.2% |
| No Computing Device | 547 | 7.3% |
| Total | 7,458 | 100.0% |
Internet Access in Hibbing
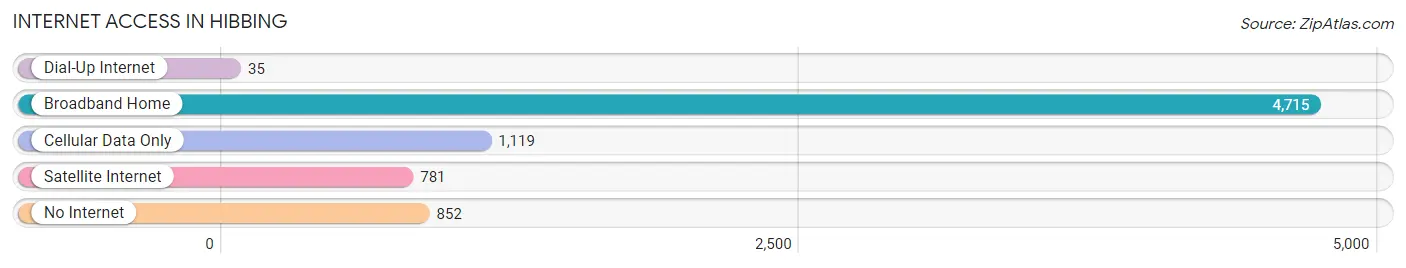
| Internet Type | # Households | % Households |
| Dial-Up Internet | 35 | 0.5% |
| Broadband Home | 4,715 | 63.2% |
| Cellular Data Only | 1,119 | 15.0% |
| Satellite Internet | 781 | 10.5% |
| No Internet | 852 | 11.4% |
| Total | 7,458 | 100.0% |
Hibbing Summary
Hibbing, Minnesota is a city located in the Iron Range region of the state. It is the largest city in St. Louis County and the second largest city in the state. The city is located in the Mesabi Iron Range, a region known for its rich iron ore deposits. The city was founded in 1893 and has a population of 16,361 as of the 2010 census.
Geography
Hibbing is located in the Mesabi Iron Range region of Minnesota. The city is situated on the Mesabi Range, a large iron ore deposit that stretches from northern Minnesota into Canada. The city is located on the western edge of the range, near the city of Virginia. The city is located at an elevation of 1,400 feet above sea level. The city is surrounded by forests and lakes, and is located near the headwaters of the Mississippi River.
The city is located in St. Louis County, and is bordered by the cities of Chisholm, Buhl, and Virginia. The city is located approximately 75 miles north of Duluth, and is accessible by Highway 169.
History
Hibbing was founded in 1893 by Frank Hibbing, a German immigrant who had come to the area to work in the iron ore mines. The city was originally named Hibbing after him, and was incorporated in 1895. The city quickly grew as the iron ore industry in the area flourished. By the early 1900s, Hibbing had become the largest city in the Iron Range region.
The city was the site of a major labor dispute in 1916, when the miners of the Mesabi Range went on strike. The strike lasted for several months, and was eventually settled in favor of the miners.
The city continued to grow throughout the 20th century, and by the 1950s it had become the largest city in the state. The city was the site of a major mining disaster in 1924, when a mine explosion killed 36 miners.
Economy
Hibbing's economy is largely based on the mining industry. The city is home to several large iron ore mines, and is the site of the world's largest open-pit iron ore mine. The city is also home to several steel mills, and is a major producer of steel products.
The city is also home to several manufacturing companies, including a paper mill, a wood products plant, and a printing plant. The city is also home to several retail stores, restaurants, and other businesses.
Demographics
As of the 2010 census, the population of Hibbing was 16,361. The city has a population density of 1,845 people per square mile. The racial makeup of the city is 94.3% White, 0.7% African American, 0.4% Native American, 0.3% Asian, 0.1% Pacific Islander, and 3.2% from other races.
The median household income in the city is $41,945, and the median family income is $50,945. The per capita income in the city is $20,945. The city has a poverty rate of 16.3%.
Conclusion
Hibbing, Minnesota is a city located in the Iron Range region of the state. It is the largest city in St. Louis County and the second largest city in the state. The city is located in the Mesabi Iron Range, a region known for its rich iron ore deposits. The city was founded in 1893 and has a population of 16,361 as of the 2010 census. The city's economy is largely based on the mining industry, and it is home to several large iron ore mines and steel mills. The city is also home to several manufacturing companies, retail stores, restaurants, and other businesses. The population of the city is 94.3% White, 0.7% African American, 0.4% Native American, 0.3% Asian, 0.1% Pacific Islander, and 3.2% from other races. The median household income in the city is $41,945, and the median family income is $50,945. The per capita income in the city is $20,945. The city has a poverty rate of 16.3%.
Common Questions
What is Per Capita Income in Hibbing?
Per Capita income in Hibbing is $32,781.
What is the Median Family Income in Hibbing?
Median Family Income in Hibbing is $79,313.
What is the Median Household income in Hibbing?
Median Household Income in Hibbing is $52,881.
What is Income or Wage Gap in Hibbing?
Income or Wage Gap in Hibbing is 15.4%.
Women in Hibbing earn 84.6 cents for every dollar earned by a man.
What is Family Income Deficit in Hibbing?
Family Income Deficit in Hibbing is $11,954.
Families that are below poverty line in Hibbing earn $11,954 less on average than the poverty threshold level.
What is Inequality or Gini Index in Hibbing?
Inequality or Gini Index in Hibbing is 0.44.
What is the Total Population of Hibbing?
Total Population of Hibbing is 16,167.
What is the Total Male Population of Hibbing?
Total Male Population of Hibbing is 8,055.
What is the Total Female Population of Hibbing?
Total Female Population of Hibbing is 8,112.
What is the Ratio of Males per 100 Females in Hibbing?
There are 99.30 Males per 100 Females in Hibbing.
What is the Ratio of Females per 100 Males in Hibbing?
There are 100.71 Females per 100 Males in Hibbing.
What is the Median Population Age in Hibbing?
Median Population Age in Hibbing is 42.5 Years.
What is the Average Family Size in Hibbing
Average Family Size in Hibbing is 2.9 People.
What is the Average Household Size in Hibbing
Average Household Size in Hibbing is 2.1 People.
How Large is the Labor Force in Hibbing?
There are 7,626 People in the Labor Forcein in Hibbing.
What is the Percentage of People in the Labor Force in Hibbing?
57.0% of People are in the Labor Force in Hibbing.
What is the Unemployment Rate in Hibbing?
Unemployment Rate in Hibbing is 4.9%.