Maurertown, VA Map & Demographics
Maurertown Map
Maurertown Overview
$27,812
PER CAPITA INCOME
$80,536
AVG FAMILY INCOME
$79,318
AVG HOUSEHOLD INCOME
0.37
INEQUALITY / GINI INDEX
1,019
TOTAL POPULATION
420
MALE POPULATION
599
FEMALE POPULATION
70.12
MALES / 100 FEMALES
142.62
FEMALES / 100 MALES
52.5
MEDIAN AGE
3.6
AVG FAMILY SIZE
3.0
AVG HOUSEHOLD SIZE
482
LABOR FORCE [ PEOPLE ]
58.1%
PERCENT IN LABOR FORCE
2.5%
UNEMPLOYMENT RATE
Maurertown Zip Codes
Maurertown Area Codes
Income in Maurertown
Income Overview in Maurertown
Per Capita Income in Maurertown is $27,812, while median incomes of families and households are $80,536 and $79,318 respectively.
| Characteristic | Number | Measure |
| Per Capita Income | 1,019 | $27,812 |
| Median Family Income | 198 | $80,536 |
| Mean Family Income | 198 | $101,369 |
| Median Household Income | 324 | $79,318 |
| Mean Household Income | 324 | $85,506 |
| Income Deficit | 198 | $0 |
| Wage / Income Gap (%) | 1,019 | 0.00% |
| Wage / Income Gap ($) | 1,019 | 100.00¢ per $1 |
| Gini / Inequality Index | 1,019 | 0.37 |
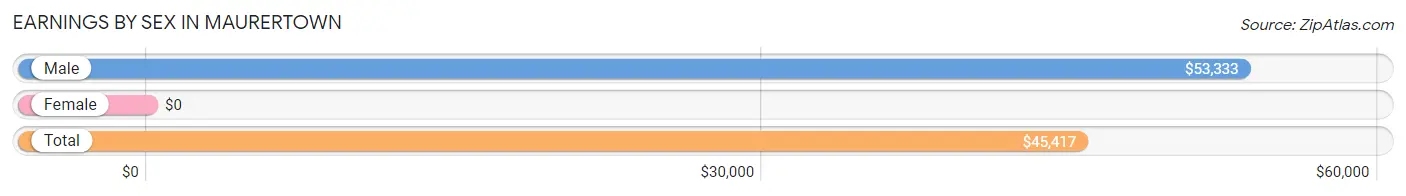
Earnings by Sex in Maurertown
| Sex | Number | Average Earnings |
| Male | 236 (45.4%) | $53,333 |
| Female | 284 (54.6%) | $0 |
| Total | 520 (100.0%) | $45,417 |
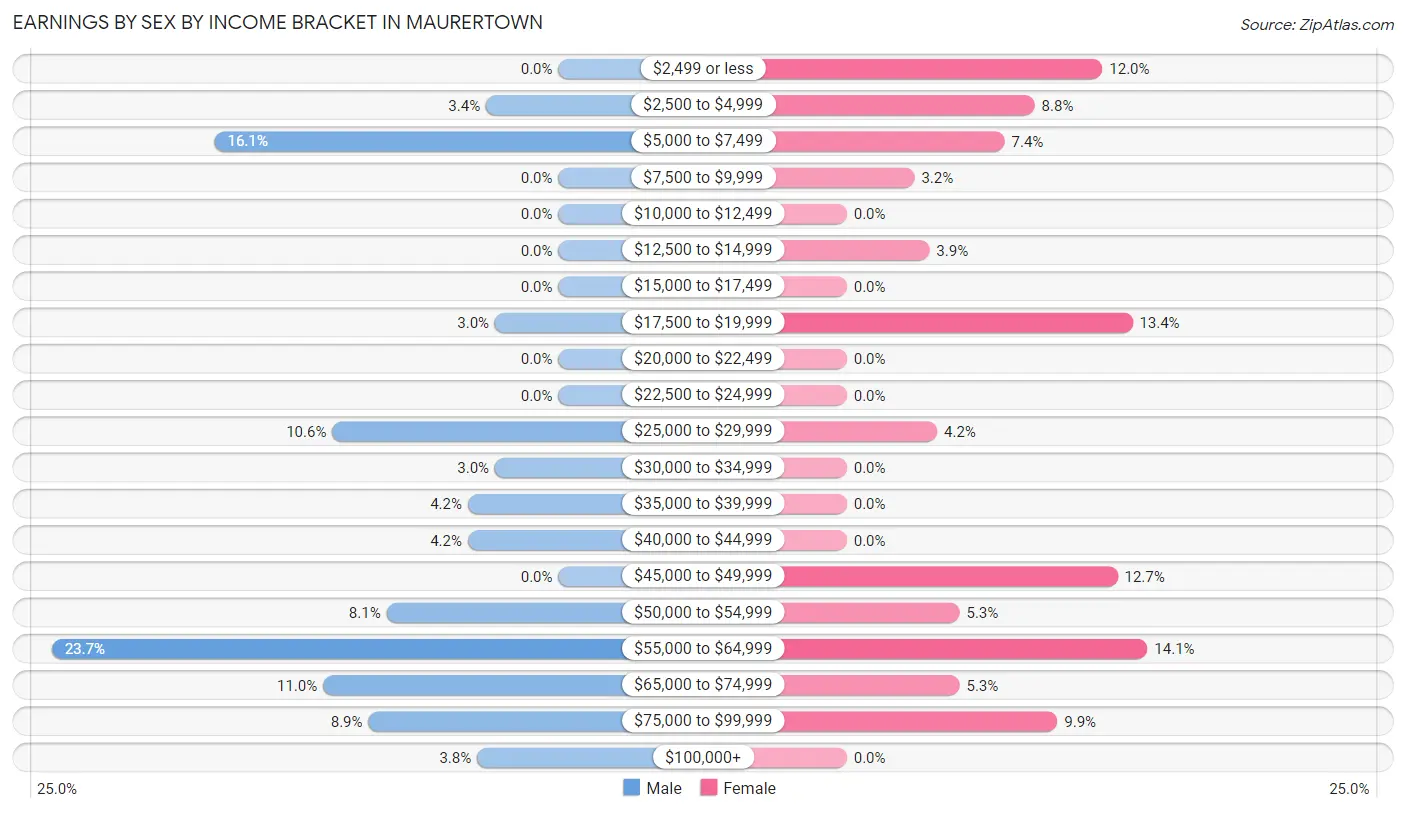
Earnings by Sex by Income Bracket in Maurertown
The most common earnings brackets in Maurertown are $55,000 to $64,999 for men (56 | 23.7%) and $55,000 to $64,999 for women (40 | 14.1%).
| Income | Male | Female |
| $2,499 or less | 0 (0.0%) | 34 (12.0%) |
| $2,500 to $4,999 | 8 (3.4%) | 25 (8.8%) |
| $5,000 to $7,499 | 38 (16.1%) | 21 (7.4%) |
| $7,500 to $9,999 | 0 (0.0%) | 9 (3.2%) |
| $10,000 to $12,499 | 0 (0.0%) | 0 (0.0%) |
| $12,500 to $14,999 | 0 (0.0%) | 11 (3.9%) |
| $15,000 to $17,499 | 0 (0.0%) | 0 (0.0%) |
| $17,500 to $19,999 | 7 (3.0%) | 38 (13.4%) |
| $20,000 to $22,499 | 0 (0.0%) | 0 (0.0%) |
| $22,500 to $24,999 | 0 (0.0%) | 0 (0.0%) |
| $25,000 to $29,999 | 25 (10.6%) | 12 (4.2%) |
| $30,000 to $34,999 | 7 (3.0%) | 0 (0.0%) |
| $35,000 to $39,999 | 10 (4.2%) | 0 (0.0%) |
| $40,000 to $44,999 | 10 (4.2%) | 0 (0.0%) |
| $45,000 to $49,999 | 0 (0.0%) | 36 (12.7%) |
| $50,000 to $54,999 | 19 (8.1%) | 15 (5.3%) |
| $55,000 to $64,999 | 56 (23.7%) | 40 (14.1%) |
| $65,000 to $74,999 | 26 (11.0%) | 15 (5.3%) |
| $75,000 to $99,999 | 21 (8.9%) | 28 (9.9%) |
| $100,000+ | 9 (3.8%) | 0 (0.0%) |
| Total | 236 (100.0%) | 284 (100.0%) |
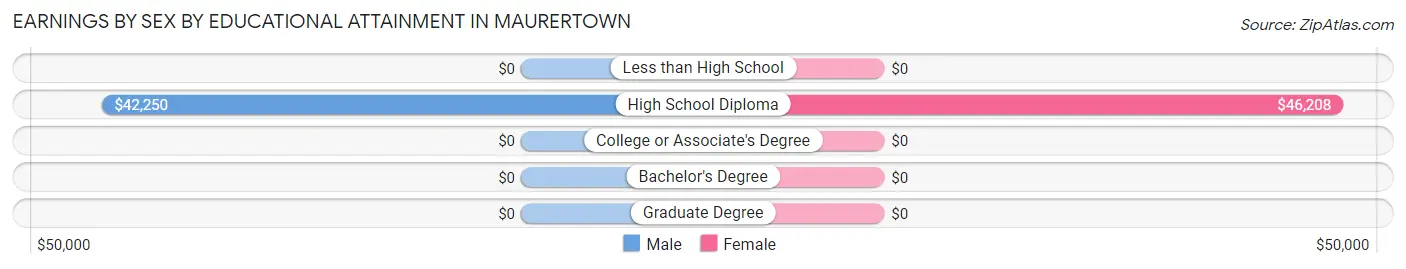
Earnings by Sex by Educational Attainment in Maurertown
Average earnings in Maurertown are $54,722 for men and $48,750 for women, a difference of 10.9%. Men with an educational attainment of high school diploma enjoy the highest average annual earnings of $42,250, while those with high school diploma education earn the least with $42,250. Women with an educational attainment of high school diploma earn the most with the average annual earnings of $46,208, while those with high school diploma education have the smallest earnings of $46,208.
| Educational Attainment | Male Income | Female Income |
| Less than High School | - | - |
| High School Diploma | $42,250 | $46,208 |
| College or Associate's Degree | - | - |
| Bachelor's Degree | - | - |
| Graduate Degree | - | - |
| Total | $54,722 | $48,750 |
Family Income in Maurertown
Family Income Brackets in Maurertown
According to the Maurertown family income data, there are 64 families falling into the $75,000 to $99,999 income range, which is the most common income bracket and makes up 32.3% of all families.
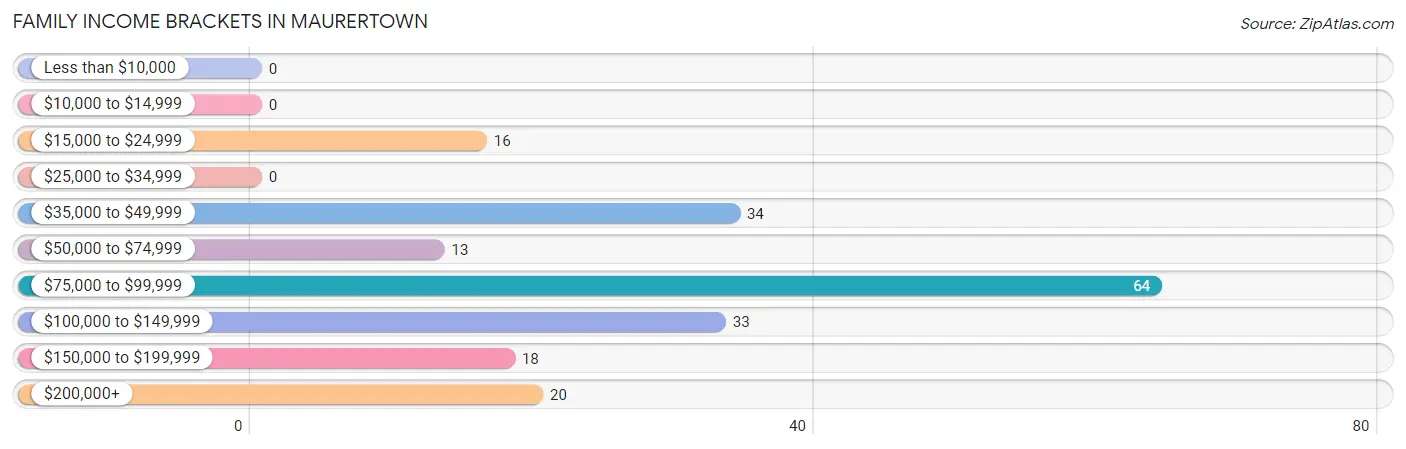
| Income Bracket | # Families | % Families |
| Less than $10,000 | 0 | 0.0% |
| $10,000 to $14,999 | 0 | 0.0% |
| $15,000 to $24,999 | 16 | 8.1% |
| $25,000 to $34,999 | 0 | 0.0% |
| $35,000 to $49,999 | 34 | 17.2% |
| $50,000 to $74,999 | 13 | 6.6% |
| $75,000 to $99,999 | 64 | 32.3% |
| $100,000 to $149,999 | 33 | 16.7% |
| $150,000 to $199,999 | 18 | 9.1% |
| $200,000+ | 20 | 10.1% |
Family Income by Famaliy Size in Maurertown
3-person families (25 | 12.6%) account for the highest median family income in Maurertown with $161,406 per family, while 3-person families (25 | 12.6%) have the highest median income of $53,802 per family member.
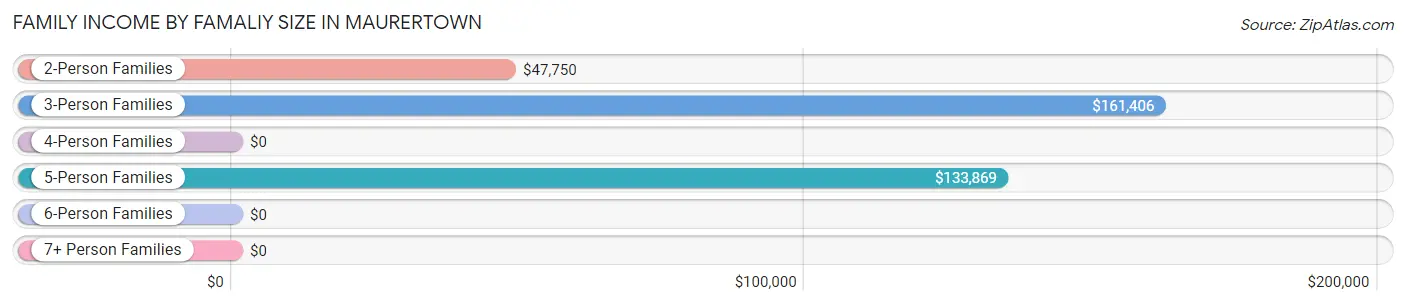
| Income Bracket | # Families | Median Income |
| 2-Person Families | 82 (41.4%) | $47,750 |
| 3-Person Families | 25 (12.6%) | $161,406 |
| 4-Person Families | 48 (24.2%) | $0 |
| 5-Person Families | 43 (21.7%) | $133,869 |
| 6-Person Families | 0 (0.0%) | $0 |
| 7+ Person Families | 0 (0.0%) | $0 |
| Total | 198 (100.0%) | $80,536 |
Family Income by Number of Earners in Maurertown
The median family income in Maurertown is $80,536, with families comprising 3+ earners (53) having the highest median family income of $138,646, while families with no earners (51) have the lowest median family income of $41,615, accounting for 26.8% and 25.8% of families, respectively.
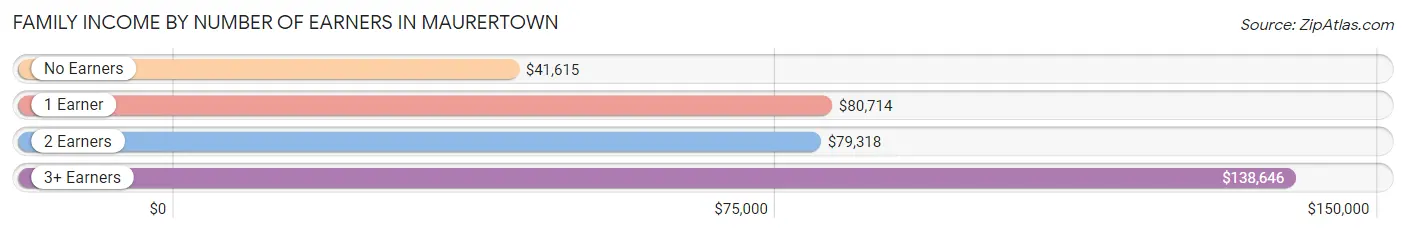
| Number of Earners | # Families | Median Income |
| No Earners | 51 (25.8%) | $41,615 |
| 1 Earner | 20 (10.1%) | $80,714 |
| 2 Earners | 74 (37.4%) | $79,318 |
| 3+ Earners | 53 (26.8%) | $138,646 |
| Total | 198 (100.0%) | $80,536 |
Household Income in Maurertown
Household Income Brackets in Maurertown
With 83 households falling in the category, the $100,000 to $149,999 income range is the most frequent in Maurertown, accounting for 25.6% of all households.
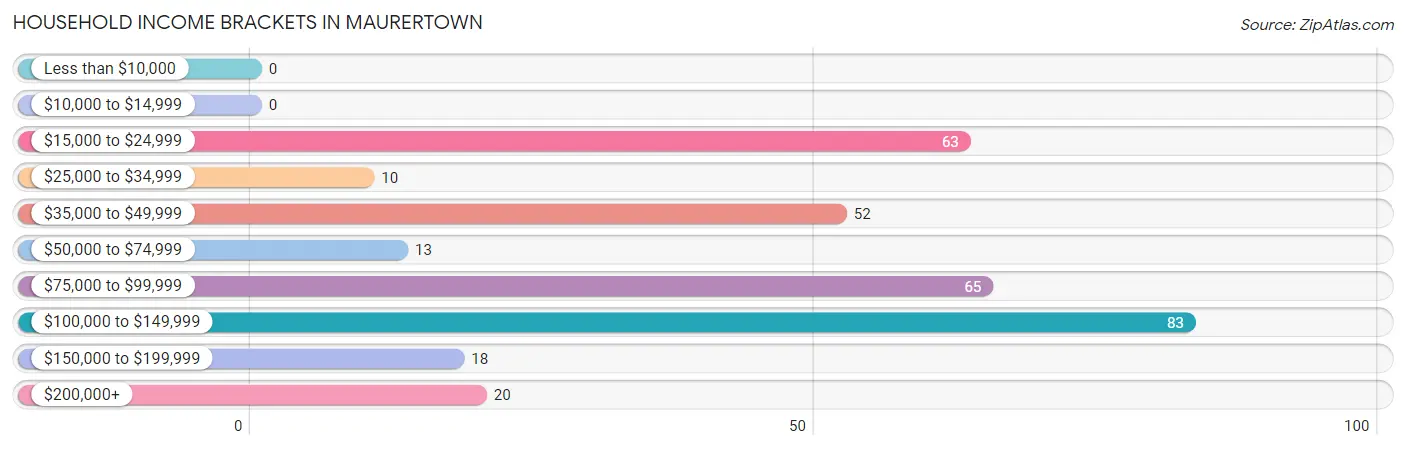
| Income Bracket | # Households | % Households |
| Less than $10,000 | 0 | 0.0% |
| $10,000 to $14,999 | 0 | 0.0% |
| $15,000 to $24,999 | 63 | 19.4% |
| $25,000 to $34,999 | 10 | 3.1% |
| $35,000 to $49,999 | 52 | 16.0% |
| $50,000 to $74,999 | 13 | 4.0% |
| $75,000 to $99,999 | 65 | 20.1% |
| $100,000 to $149,999 | 83 | 25.6% |
| $150,000 to $199,999 | 18 | 5.6% |
| $200,000+ | 20 | 6.2% |
Household Income by Householder Age in Maurertown
The median household income in Maurertown is $79,318, with the highest median household income of $111,371 found in the 45 to 64 years age bracket for the primary householder. A total of 150 households (46.3%) fall into this category.

| Income Bracket | # Households | Median Income |
| 15 to 24 Years | 0 (0.0%) | $0 |
| 25 to 44 Years | 21 (6.5%) | $0 |
| 45 to 64 Years | 150 (46.3%) | $111,371 |
| 65+ Years | 153 (47.2%) | $37,875 |
| Total | 324 (100.0%) | $79,318 |
Poverty in Maurertown
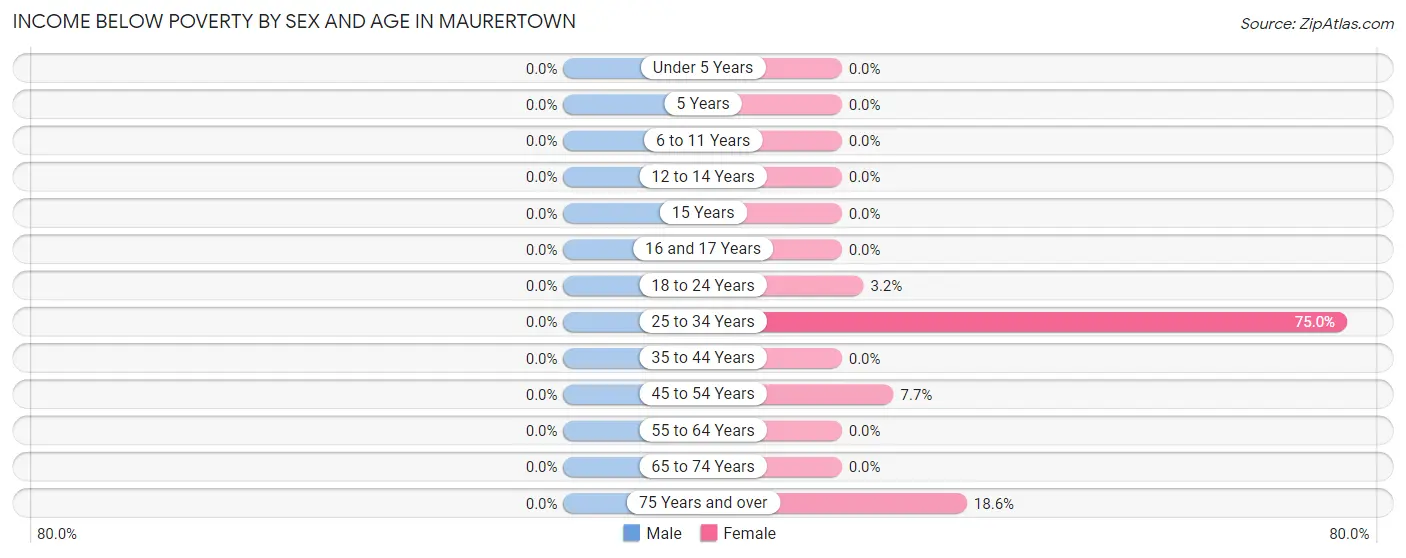
Income Below Poverty by Sex and Age in Maurertown
| Age Bracket | Male | Female |
| Under 5 Years | 0 (0.0%) | 0 (0.0%) |
| 5 Years | 0 (0.0%) | 0 (0.0%) |
| 6 to 11 Years | 0 (0.0%) | 0 (0.0%) |
| 12 to 14 Years | 0 (0.0%) | 0 (0.0%) |
| 15 Years | 0 (0.0%) | 0 (0.0%) |
| 16 and 17 Years | 0 (0.0%) | 0 (0.0%) |
| 18 to 24 Years | 0 (0.0%) | 2 (3.2%) |
| 25 to 34 Years | 0 (0.0%) | 36 (75.0%) |
| 35 to 44 Years | 0 (0.0%) | 0 (0.0%) |
| 45 to 54 Years | 0 (0.0%) | 12 (7.7%) |
| 55 to 64 Years | 0 (0.0%) | 0 (0.0%) |
| 65 to 74 Years | 0 (0.0%) | 0 (0.0%) |
| 75 Years and over | 0 (0.0%) | 21 (18.6%) |
| Total | 0 (0.0%) | 71 (12.5%) |
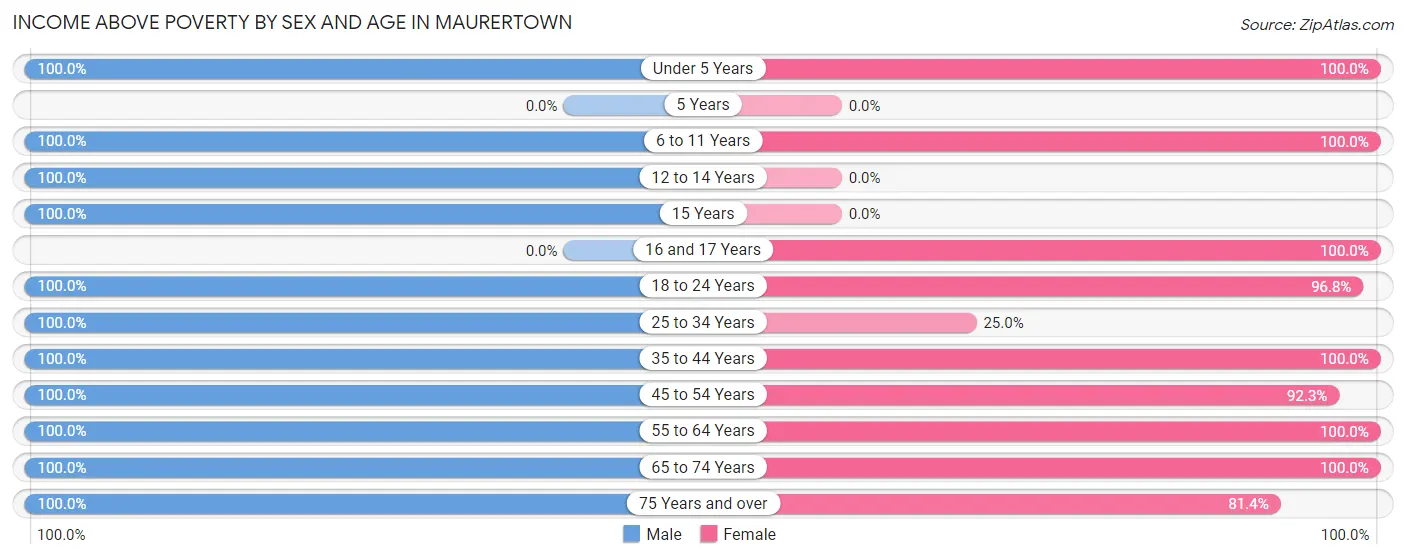
Income Above Poverty by Sex and Age in Maurertown
According to the poverty statistics in Maurertown, males aged under 5 years and females aged under 5 years are the age groups that are most secure financially, with 100.0% of males and 100.0% of females in these age groups living above the poverty line.
| Age Bracket | Male | Female |
| Under 5 Years | 9 (100.0%) | 53 (100.0%) |
| 5 Years | 0 (0.0%) | 0 (0.0%) |
| 6 to 11 Years | 10 (100.0%) | 27 (100.0%) |
| 12 to 14 Years | 46 (100.0%) | 0 (0.0%) |
| 15 Years | 18 (100.0%) | 0 (0.0%) |
| 16 and 17 Years | 0 (0.0%) | 22 (100.0%) |
| 18 to 24 Years | 39 (100.0%) | 60 (96.8%) |
| 25 to 34 Years | 29 (100.0%) | 12 (25.0%) |
| 35 to 44 Years | 20 (100.0%) | 9 (100.0%) |
| 45 to 54 Years | 41 (100.0%) | 144 (92.3%) |
| 55 to 64 Years | 89 (100.0%) | 39 (100.0%) |
| 65 to 74 Years | 51 (100.0%) | 37 (100.0%) |
| 75 Years and over | 49 (100.0%) | 92 (81.4%) |
| Total | 401 (100.0%) | 495 (87.5%) |
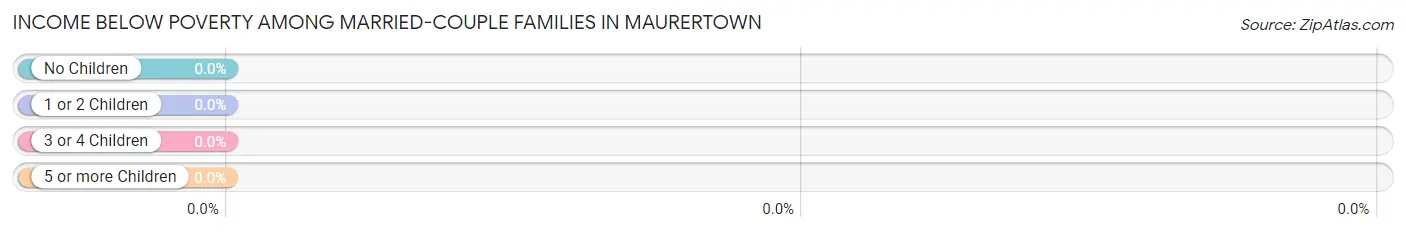
Income Below Poverty Among Married-Couple Families in Maurertown
| Children | Above Poverty | Below Poverty |
| No Children | 93 (100.0%) | 0 (0.0%) |
| 1 or 2 Children | 29 (100.0%) | 0 (0.0%) |
| 3 or 4 Children | 31 (100.0%) | 0 (0.0%) |
| 5 or more Children | 0 (0.0%) | 0 (0.0%) |
| Total | 153 (100.0%) | 0 (0.0%) |
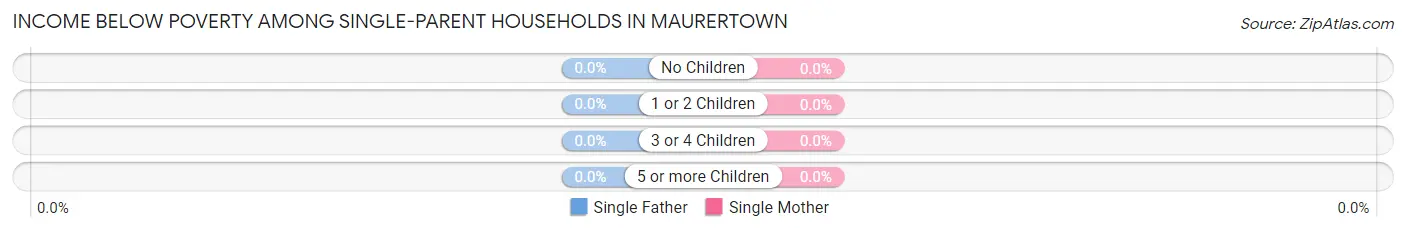
Income Below Poverty Among Single-Parent Households in Maurertown
| Children | Single Father | Single Mother |
| No Children | 0 (0.0%) | 0 (0.0%) |
| 1 or 2 Children | 0 (0.0%) | 0 (0.0%) |
| 3 or 4 Children | 0 (0.0%) | 0 (0.0%) |
| 5 or more Children | 0 (0.0%) | 0 (0.0%) |
| Total | 0 (0.0%) | 0 (0.0%) |
Income Below Poverty Among Married-Couple vs Single-Parent Households in Maurertown
| Children | Married-Couple Families | Single-Parent Households |
| No Children | 0 (0.0%) | 0 (0.0%) |
| 1 or 2 Children | 0 (0.0%) | 0 (0.0%) |
| 3 or 4 Children | 0 (0.0%) | 0 (0.0%) |
| 5 or more Children | 0 (0.0%) | 0 (0.0%) |
| Total | 0 (0.0%) | 0 (0.0%) |
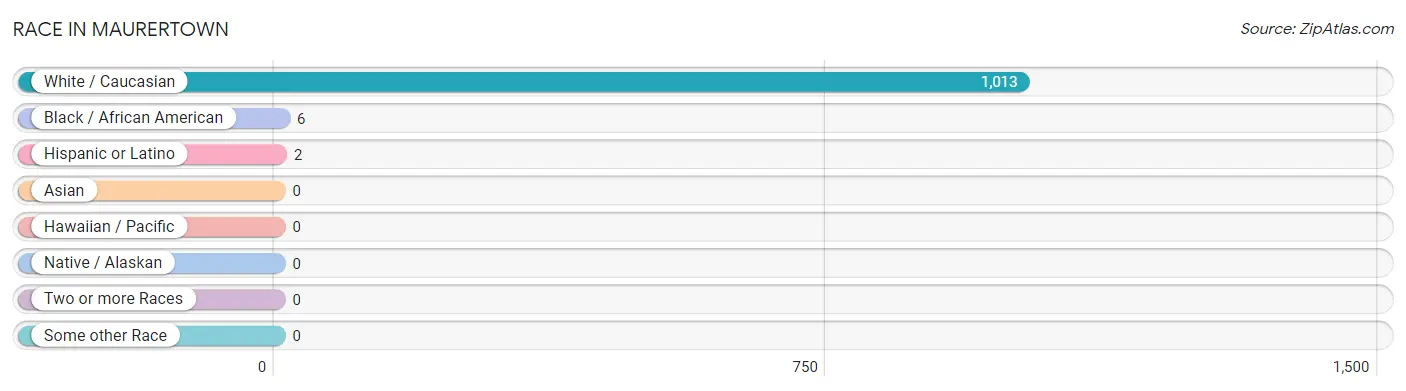
Race in Maurertown
The most populous races in Maurertown are White / Caucasian (1,013 | 99.4%), Black / African American (6 | 0.6%), and Hispanic or Latino (2 | 0.2%).
| Race | # Population | % Population |
| Asian | 0 | 0.0% |
| Black / African American | 6 | 0.6% |
| Hawaiian / Pacific | 0 | 0.0% |
| Hispanic or Latino | 2 | 0.2% |
| Native / Alaskan | 0 | 0.0% |
| White / Caucasian | 1,013 | 99.4% |
| Two or more Races | 0 | 0.0% |
| Some other Race | 0 | 0.0% |
| Total | 1,019 | 100.0% |
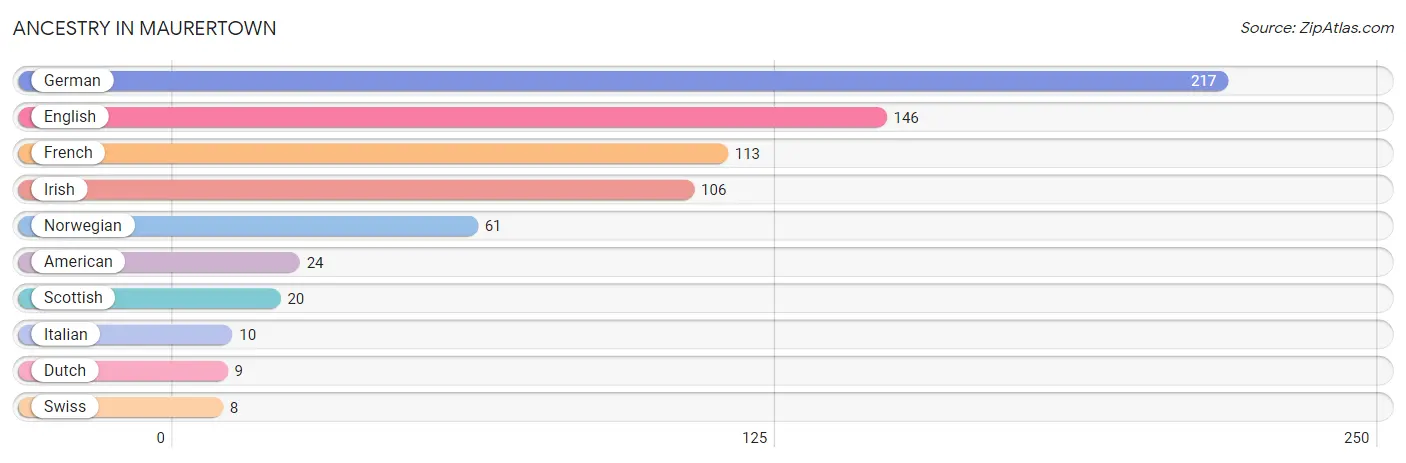
Ancestry in Maurertown
The most populous ancestries reported in Maurertown are German (217 | 21.3%), English (146 | 14.3%), French (113 | 11.1%), Irish (106 | 10.4%), and Norwegian (61 | 6.0%), together accounting for 63.1% of all Maurertown residents.
| Ancestry | # Population | % Population |
| American | 24 | 2.4% |
| Dutch | 9 | 0.9% |
| English | 146 | 14.3% |
| French | 113 | 11.1% |
| German | 217 | 21.3% |
| Irish | 106 | 10.4% |
| Italian | 10 | 1.0% |
| Norwegian | 61 | 6.0% |
| Scottish | 20 | 2.0% |
| Swiss | 8 | 0.8% | View All 10 Rows |
Immigrants in Maurertown

| Immigration Origin | # Population | % Population | View All 0 Rows |
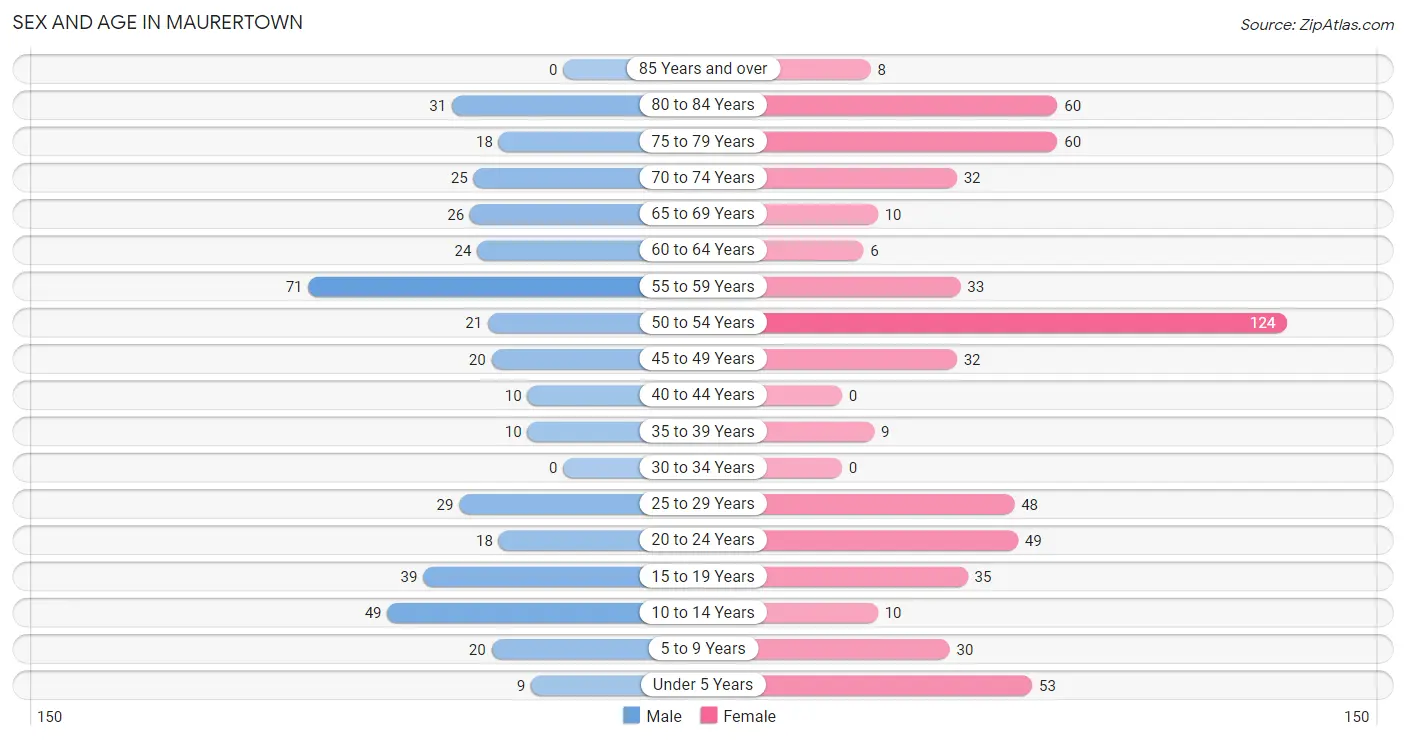
Sex and Age in Maurertown
Sex and Age in Maurertown
The most populous age groups in Maurertown are 55 to 59 Years (71 | 16.9%) for men and 50 to 54 Years (124 | 20.7%) for women.
| Age Bracket | Male | Female |
| Under 5 Years | 9 (2.1%) | 53 (8.8%) |
| 5 to 9 Years | 20 (4.8%) | 30 (5.0%) |
| 10 to 14 Years | 49 (11.7%) | 10 (1.7%) |
| 15 to 19 Years | 39 (9.3%) | 35 (5.8%) |
| 20 to 24 Years | 18 (4.3%) | 49 (8.2%) |
| 25 to 29 Years | 29 (6.9%) | 48 (8.0%) |
| 30 to 34 Years | 0 (0.0%) | 0 (0.0%) |
| 35 to 39 Years | 10 (2.4%) | 9 (1.5%) |
| 40 to 44 Years | 10 (2.4%) | 0 (0.0%) |
| 45 to 49 Years | 20 (4.8%) | 32 (5.3%) |
| 50 to 54 Years | 21 (5.0%) | 124 (20.7%) |
| 55 to 59 Years | 71 (16.9%) | 33 (5.5%) |
| 60 to 64 Years | 24 (5.7%) | 6 (1.0%) |
| 65 to 69 Years | 26 (6.2%) | 10 (1.7%) |
| 70 to 74 Years | 25 (5.9%) | 32 (5.3%) |
| 75 to 79 Years | 18 (4.3%) | 60 (10.0%) |
| 80 to 84 Years | 31 (7.4%) | 60 (10.0%) |
| 85 Years and over | 0 (0.0%) | 8 (1.3%) |
| Total | 420 (100.0%) | 599 (100.0%) |
Families and Households in Maurertown
Median Family Size in Maurertown
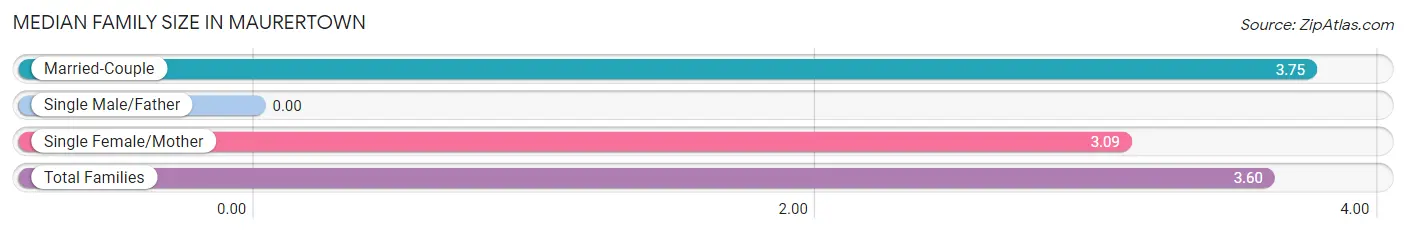
| Family Type | # Families | Family Size |
| Married-Couple | 153 (77.3%) | 3.75 |
| Single Male/Father | 0 (0.0%) | - |
| Single Female/Mother | 45 (22.7%) | 3.09 |
| Total Families | 198 (100.0%) | 3.60 |
Median Household Size in Maurertown
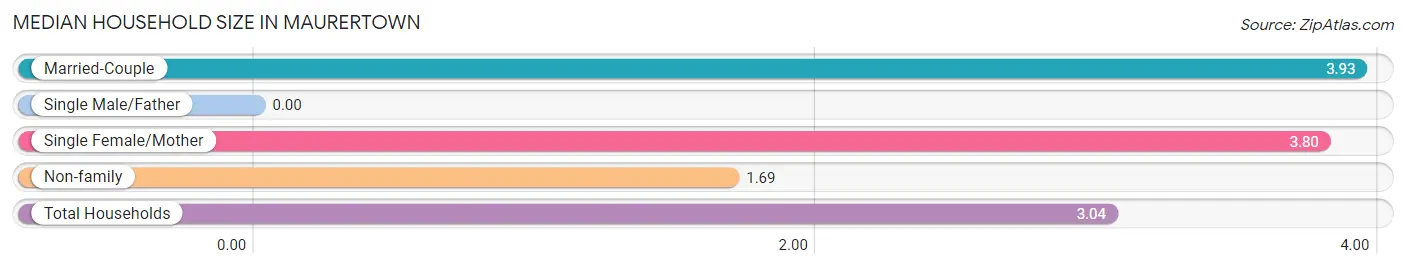
| Household Type | # Households | Household Size |
| Married-Couple | 153 (47.2%) | 3.93 |
| Single Male/Father | 0 (0.0%) | - |
| Single Female/Mother | 45 (13.9%) | 3.80 |
| Non-family | 126 (38.9%) | 1.69 |
| Total Households | 324 (100.0%) | 3.04 |
Household Size by Marriage Status in Maurertown
Out of a total of 324 households in Maurertown, 198 (61.1%) are family households, while 126 (38.9%) are nonfamily households. The most numerous type of family households are 2-person households, comprising 82, and the most common type of nonfamily households are 2-person households, comprising 61.
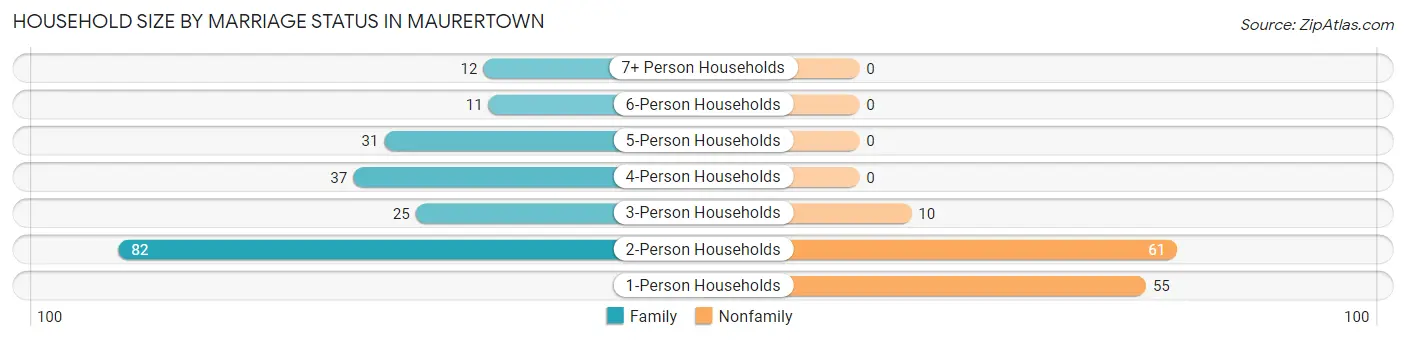
| Household Size | Family Households | Nonfamily Households |
| 1-Person Households | - | 55 (17.0%) |
| 2-Person Households | 82 (25.3%) | 61 (18.8%) |
| 3-Person Households | 25 (7.7%) | 10 (3.1%) |
| 4-Person Households | 37 (11.4%) | 0 (0.0%) |
| 5-Person Households | 31 (9.6%) | 0 (0.0%) |
| 6-Person Households | 11 (3.4%) | 0 (0.0%) |
| 7+ Person Households | 12 (3.7%) | 0 (0.0%) |
| Total | 198 (61.1%) | 126 (38.9%) |
Female Fertility in Maurertown
Fertility by Age in Maurertown
Average fertility rate in Maurertown is 12.0 births per 1,000 women. Women in the age bracket of 15 to 19 years have the highest fertility rate with 57.0 births per 1,000 women. Women in the age bracket of 15 to 19 years acount for 100.0% of all women with births.
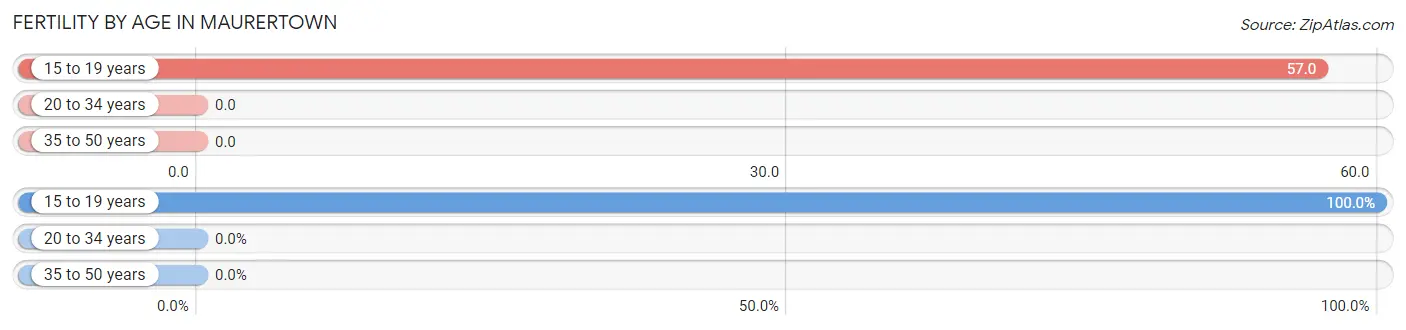
| Age Bracket | Women with Births | Births / 1,000 Women |
| 15 to 19 years | 2 (100.0%) | 57.0 |
| 20 to 34 years | 0 (0.0%) | 0.0 |
| 35 to 50 years | 0 (0.0%) | 0.0 |
| Total | 2 (100.0%) | 12.0 |
Fertility by Age by Marriage Status in Maurertown
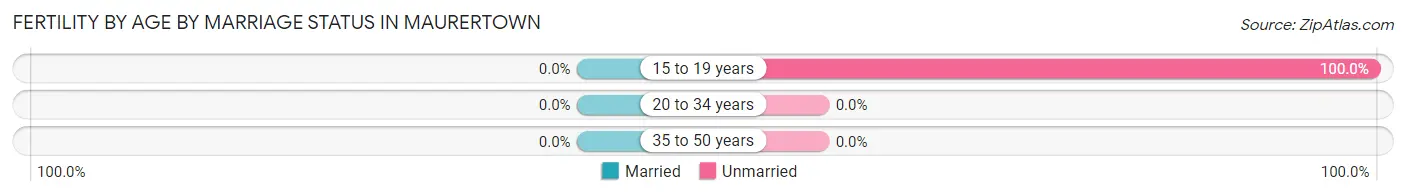
| Age Bracket | Married | Unmarried |
| 15 to 19 years | 0 (0.0%) | 2 (100.0%) |
| 20 to 34 years | 0 (0.0%) | 0 (0.0%) |
| 35 to 50 years | 0 (0.0%) | 0 (0.0%) |
| Total | 0 (0.0%) | 2 (100.0%) |
Fertility by Education in Maurertown
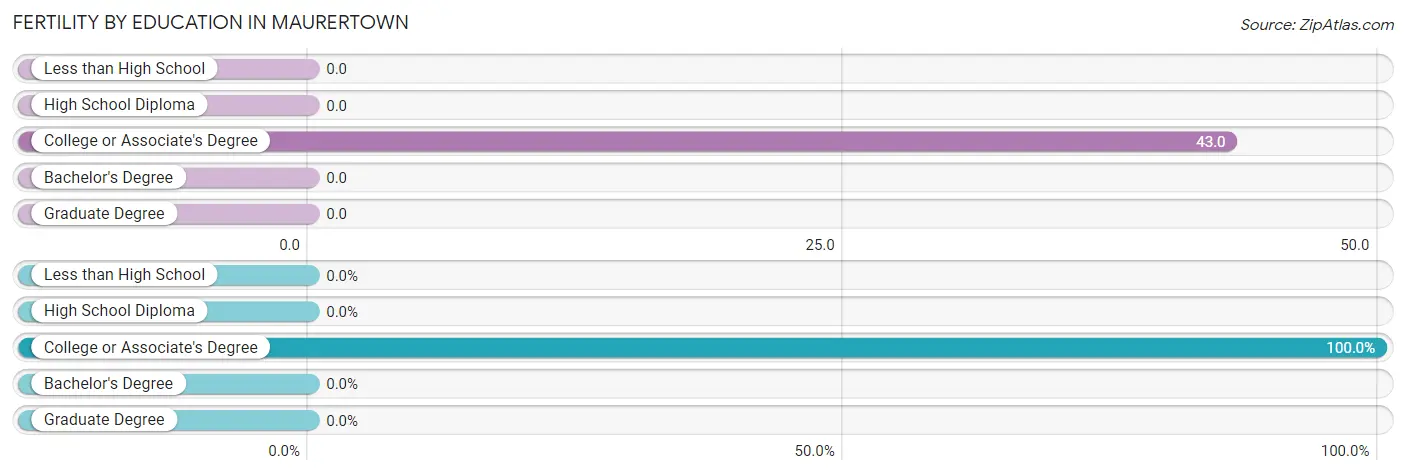
| Educational Attainment | Women with Births | Births / 1,000 Women |
| Less than High School | 0 (0.0%) | 0.0 |
| High School Diploma | 0 (0.0%) | 0.0 |
| College or Associate's Degree | 2 (100.0%) | 43.0 |
| Bachelor's Degree | 0 (0.0%) | 0.0 |
| Graduate Degree | 0 (0.0%) | 0.0 |
| Total | 2 (100.0%) | 12.0 |
Fertility by Education by Marriage Status in Maurertown
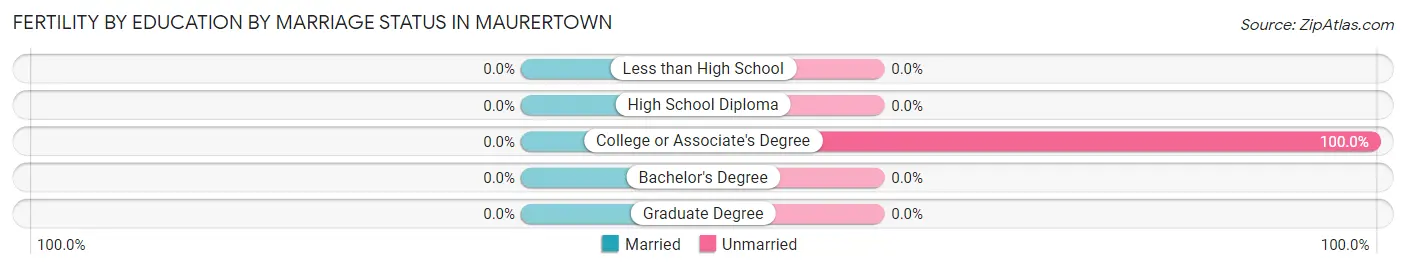
| Educational Attainment | Married | Unmarried |
| Less than High School | 0 (0.0%) | 0 (0.0%) |
| High School Diploma | 0 (0.0%) | 0 (0.0%) |
| College or Associate's Degree | 0 (0.0%) | 2 (100.0%) |
| Bachelor's Degree | 0 (0.0%) | 0 (0.0%) |
| Graduate Degree | 0 (0.0%) | 0 (0.0%) |
| Total | 0 (0.0%) | 2 (100.0%) |
Employment Characteristics in Maurertown
Employment by Class of Employer in Maurertown
Among the 456 employed individuals in Maurertown, private company employees (339 | 74.3%), not-for-profit organizations (65 | 14.2%), and self-employed (incorporated) (23 | 5.0%) make up the most common classes of employment.
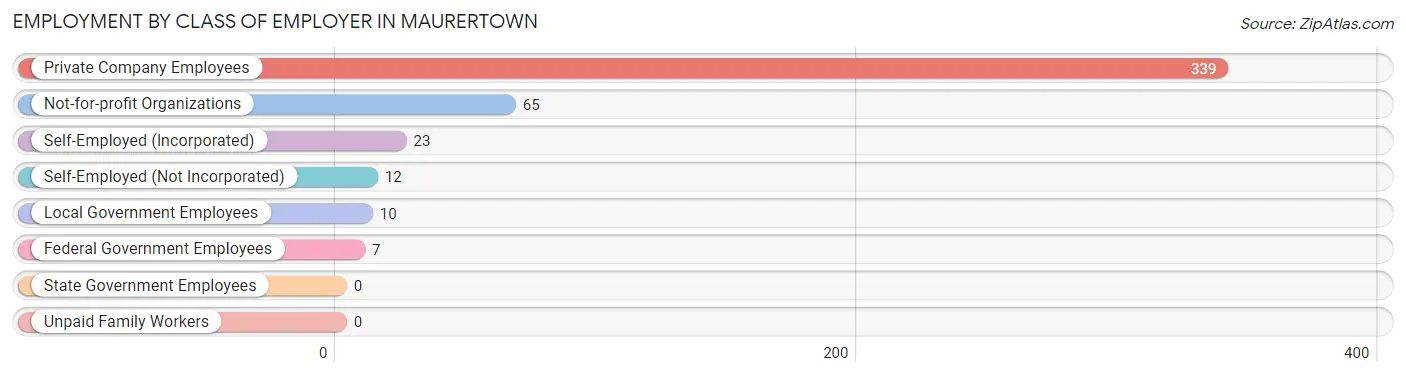
| Employer Class | # Employees | % Employees |
| Private Company Employees | 339 | 74.3% |
| Self-Employed (Incorporated) | 23 | 5.0% |
| Self-Employed (Not Incorporated) | 12 | 2.6% |
| Not-for-profit Organizations | 65 | 14.2% |
| Local Government Employees | 10 | 2.2% |
| State Government Employees | 0 | 0.0% |
| Federal Government Employees | 7 | 1.5% |
| Unpaid Family Workers | 0 | 0.0% |
| Total | 456 | 100.0% |
Employment Status by Age in Maurertown
According to the labor force statistics for Maurertown, out of the total population over 16 years of age (830), 58.1% or 482 individuals are in the labor force, with 2.5% or 12 of them unemployed. The age group with the highest labor force participation rate is 20 to 24 years, with 100.0% or 67 individuals in the labor force. Within the labor force, the 16 to 19 years age range has the highest percentage of unemployed individuals, with 26.7% or 12 of them being unemployed.
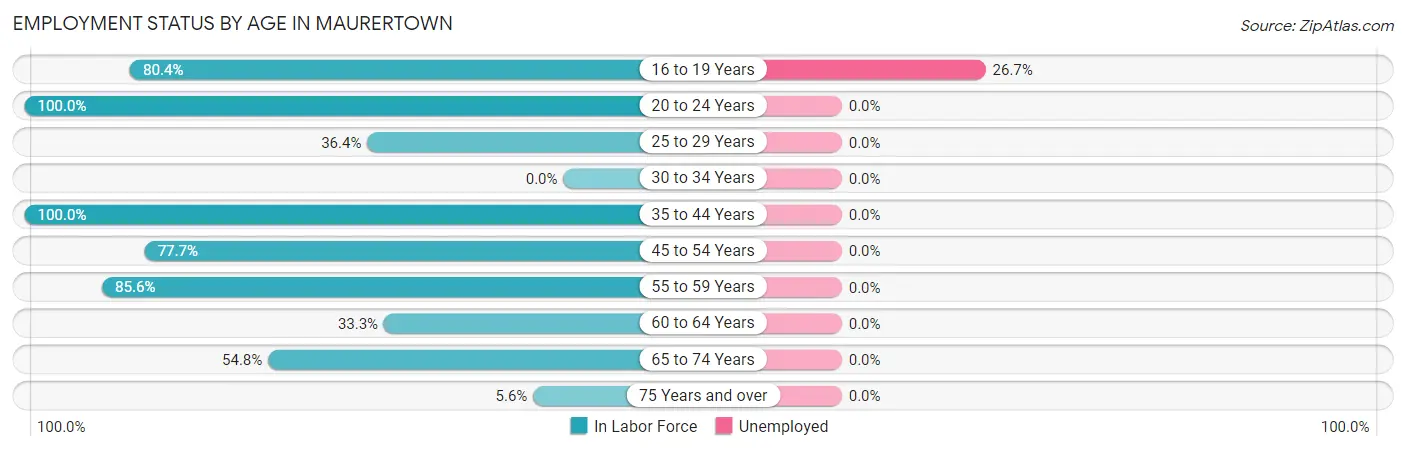
| Age Bracket | In Labor Force | Unemployed |
| 16 to 19 Years | 45 (80.4%) | 12 (26.7%) |
| 20 to 24 Years | 67 (100.0%) | 0 (0.0%) |
| 25 to 29 Years | 28 (36.4%) | 0 (0.0%) |
| 30 to 34 Years | 0 (0.0%) | 0 (0.0%) |
| 35 to 44 Years | 29 (100.0%) | 0 (0.0%) |
| 45 to 54 Years | 153 (77.7%) | 0 (0.0%) |
| 55 to 59 Years | 89 (85.6%) | 0 (0.0%) |
| 60 to 64 Years | 10 (33.3%) | 0 (0.0%) |
| 65 to 74 Years | 51 (54.8%) | 0 (0.0%) |
| 75 Years and over | 10 (5.6%) | 0 (0.0%) |
| Total | 482 (58.1%) | 12 (2.5%) |
Employment Status by Educational Attainment in Maurertown
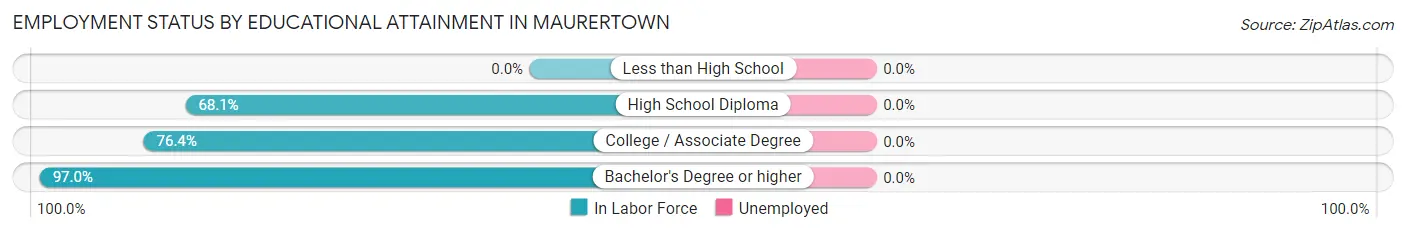
| Educational Attainment | In Labor Force | Unemployed |
| Less than High School | 0 (0.0%) | 0 (0.0%) |
| High School Diploma | 160 (68.1%) | 0 (0.0%) |
| College / Associate Degree | 84 (76.4%) | 0 (0.0%) |
| Bachelor's Degree or higher | 65 (97.0%) | 0 (0.0%) |
| Total | 309 (70.7%) | 0 (0.0%) |
Employment Occupations by Sex in Maurertown
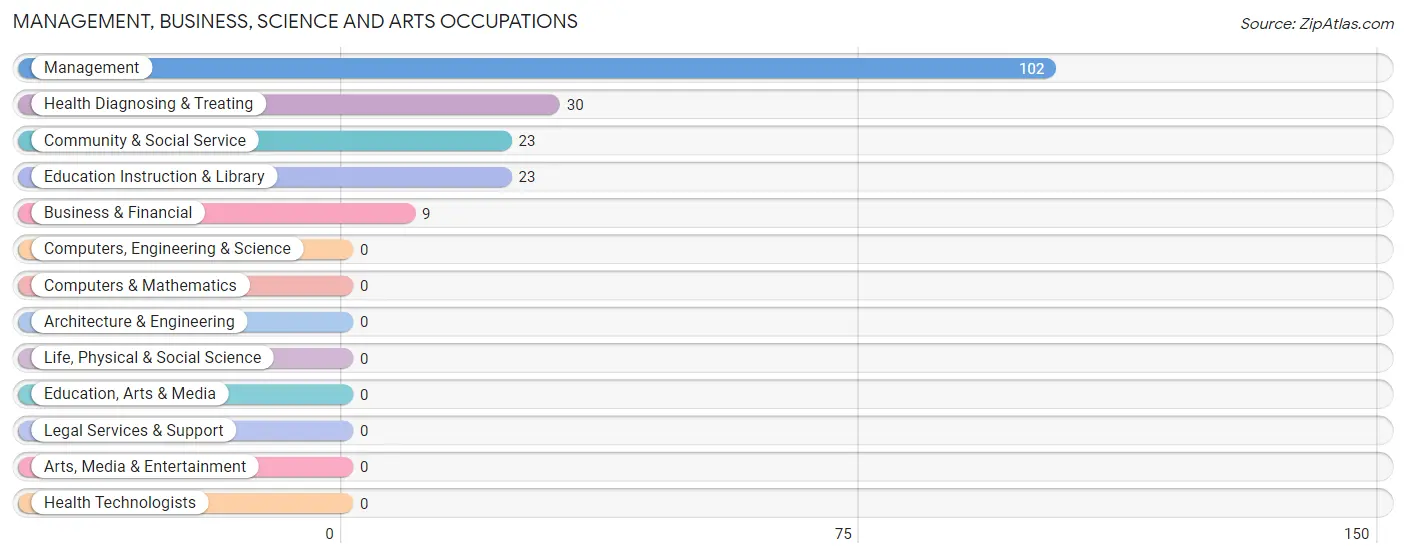
Management, Business, Science and Arts Occupations
The most common Management, Business, Science and Arts occupations in Maurertown are Management (102 | 21.7%), Health Diagnosing & Treating (30 | 6.4%), Community & Social Service (23 | 4.9%), Education Instruction & Library (23 | 4.9%), and Business & Financial (9 | 1.9%).
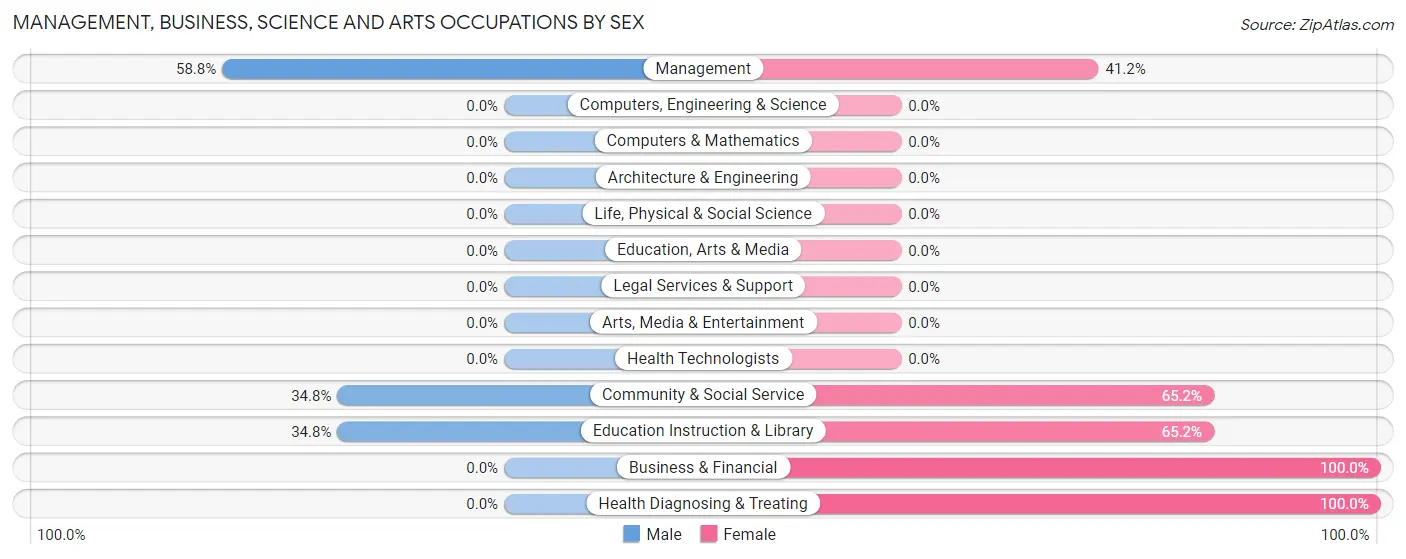
Management, Business, Science and Arts Occupations by Sex
Within the Management, Business, Science and Arts occupations in Maurertown, the most male-oriented occupations are Management (58.8%), Community & Social Service (34.8%), and Education Instruction & Library (34.8%), while the most female-oriented occupations are Business & Financial (100.0%), Health Diagnosing & Treating (100.0%), and Community & Social Service (65.2%).
| Occupation | Male | Female |
| Management | 60 (58.8%) | 42 (41.2%) |
| Business & Financial | 0 (0.0%) | 9 (100.0%) |
| Computers, Engineering & Science | 0 (0.0%) | 0 (0.0%) |
| Computers & Mathematics | 0 (0.0%) | 0 (0.0%) |
| Architecture & Engineering | 0 (0.0%) | 0 (0.0%) |
| Life, Physical & Social Science | 0 (0.0%) | 0 (0.0%) |
| Community & Social Service | 8 (34.8%) | 15 (65.2%) |
| Education, Arts & Media | 0 (0.0%) | 0 (0.0%) |
| Legal Services & Support | 0 (0.0%) | 0 (0.0%) |
| Education Instruction & Library | 8 (34.8%) | 15 (65.2%) |
| Arts, Media & Entertainment | 0 (0.0%) | 0 (0.0%) |
| Health Diagnosing & Treating | 0 (0.0%) | 30 (100.0%) |
| Health Technologists | 0 (0.0%) | 0 (0.0%) |
| Total (Category) | 68 (41.5%) | 96 (58.5%) |
| Total (Overall) | 211 (44.9%) | 259 (55.1%) |
Services Occupations
The most common Services occupations in Maurertown are Food Preparation & Serving (53 | 11.3%), Security & Protection (1 | 0.2%), and Firefighting & Prevention (1 | 0.2%).
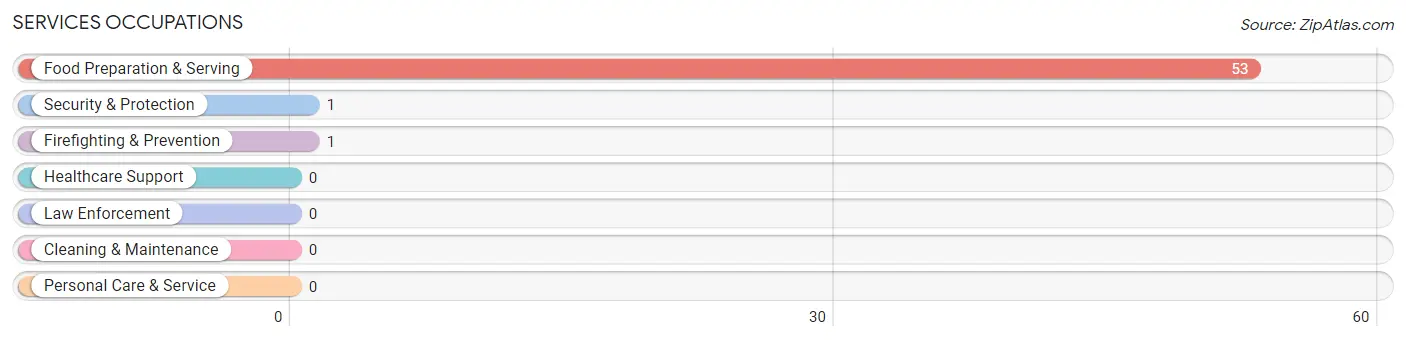
Services Occupations by Sex
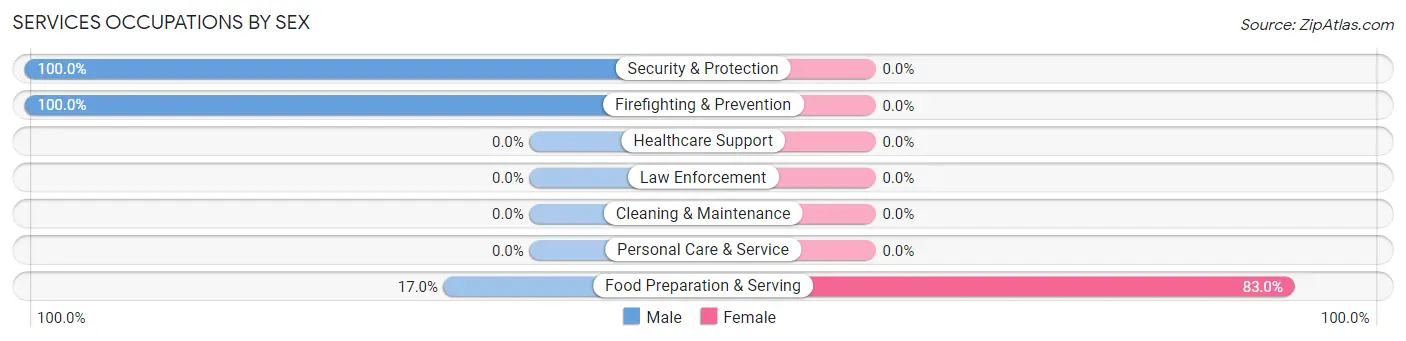
| Occupation | Male | Female |
| Healthcare Support | 0 (0.0%) | 0 (0.0%) |
| Security & Protection | 1 (100.0%) | 0 (0.0%) |
| Firefighting & Prevention | 1 (100.0%) | 0 (0.0%) |
| Law Enforcement | 0 (0.0%) | 0 (0.0%) |
| Food Preparation & Serving | 9 (17.0%) | 44 (83.0%) |
| Cleaning & Maintenance | 0 (0.0%) | 0 (0.0%) |
| Personal Care & Service | 0 (0.0%) | 0 (0.0%) |
| Total (Category) | 10 (18.5%) | 44 (81.5%) |
| Total (Overall) | 211 (44.9%) | 259 (55.1%) |
Sales and Office Occupations
The most common Sales and Office occupations in Maurertown are Sales & Related (82 | 17.4%), and Office & Administration (48 | 10.2%).
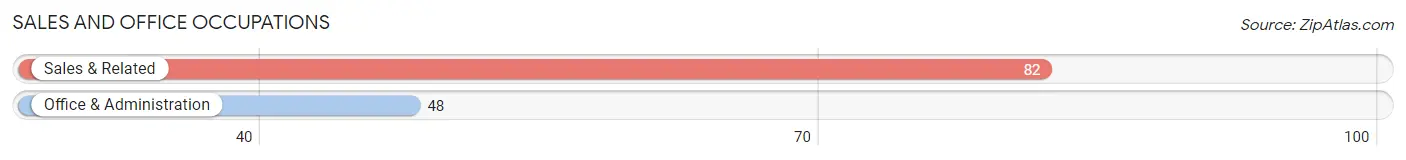
Sales and Office Occupations by Sex
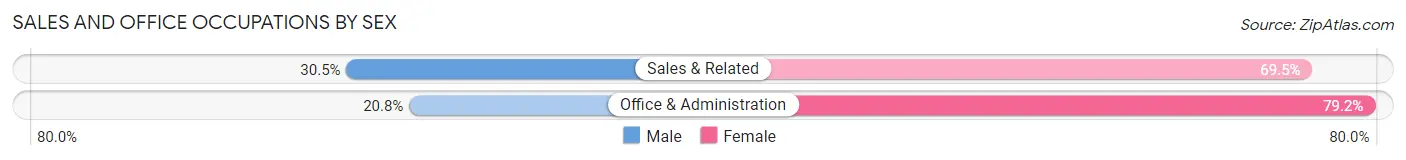
| Occupation | Male | Female |
| Sales & Related | 25 (30.5%) | 57 (69.5%) |
| Office & Administration | 10 (20.8%) | 38 (79.2%) |
| Total (Category) | 35 (26.9%) | 95 (73.1%) |
| Total (Overall) | 211 (44.9%) | 259 (55.1%) |
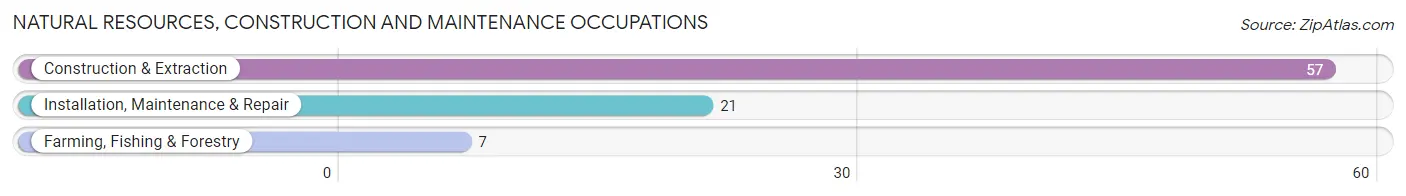
Natural Resources, Construction and Maintenance Occupations
The most common Natural Resources, Construction and Maintenance occupations in Maurertown are Construction & Extraction (57 | 12.1%), Installation, Maintenance & Repair (21 | 4.5%), and Farming, Fishing & Forestry (7 | 1.5%).
Natural Resources, Construction and Maintenance Occupations by Sex
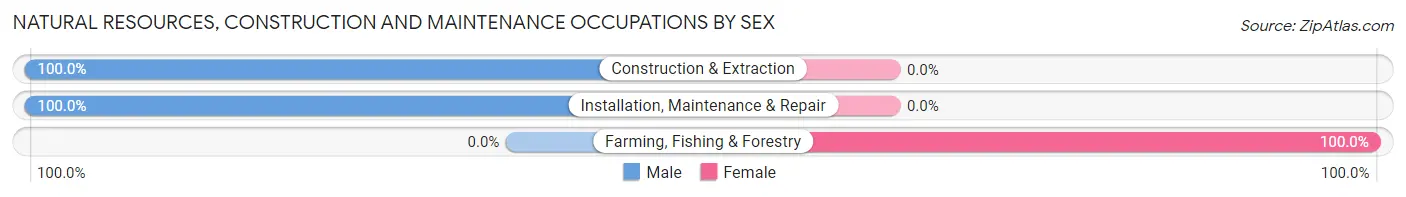
| Occupation | Male | Female |
| Farming, Fishing & Forestry | 0 (0.0%) | 7 (100.0%) |
| Construction & Extraction | 57 (100.0%) | 0 (0.0%) |
| Installation, Maintenance & Repair | 21 (100.0%) | 0 (0.0%) |
| Total (Category) | 78 (91.8%) | 7 (8.2%) |
| Total (Overall) | 211 (44.9%) | 259 (55.1%) |
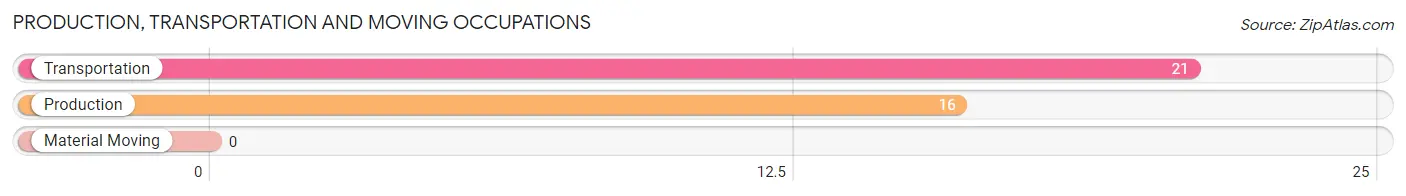
Production, Transportation and Moving Occupations
The most common Production, Transportation and Moving occupations in Maurertown are Transportation (21 | 4.5%), and Production (16 | 3.4%).
Production, Transportation and Moving Occupations by Sex
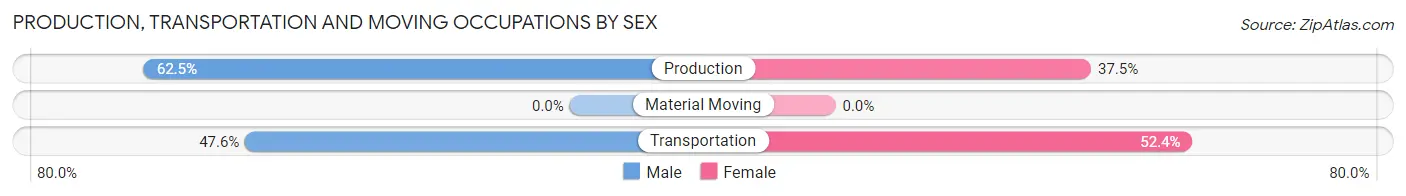
| Occupation | Male | Female |
| Production | 10 (62.5%) | 6 (37.5%) |
| Transportation | 10 (47.6%) | 11 (52.4%) |
| Material Moving | 0 (0.0%) | 0 (0.0%) |
| Total (Category) | 20 (54.0%) | 17 (46.0%) |
| Total (Overall) | 211 (44.9%) | 259 (55.1%) |
Employment Industries by Sex in Maurertown
Employment Industries in Maurertown
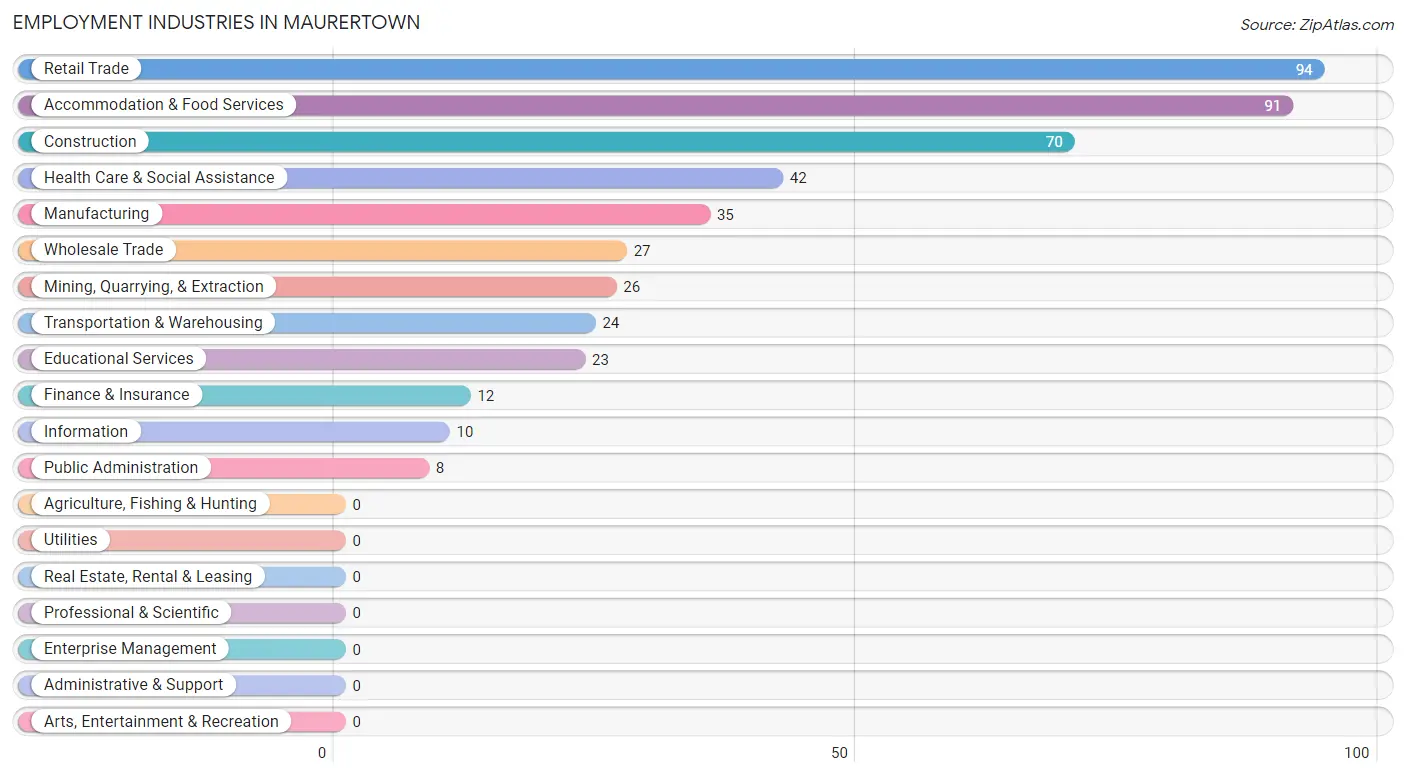
The major employment industries in Maurertown include Retail Trade (94 | 20.0%), Accommodation & Food Services (91 | 19.4%), Construction (70 | 14.9%), Health Care & Social Assistance (42 | 8.9%), and Manufacturing (35 | 7.4%).
Employment Industries by Sex in Maurertown
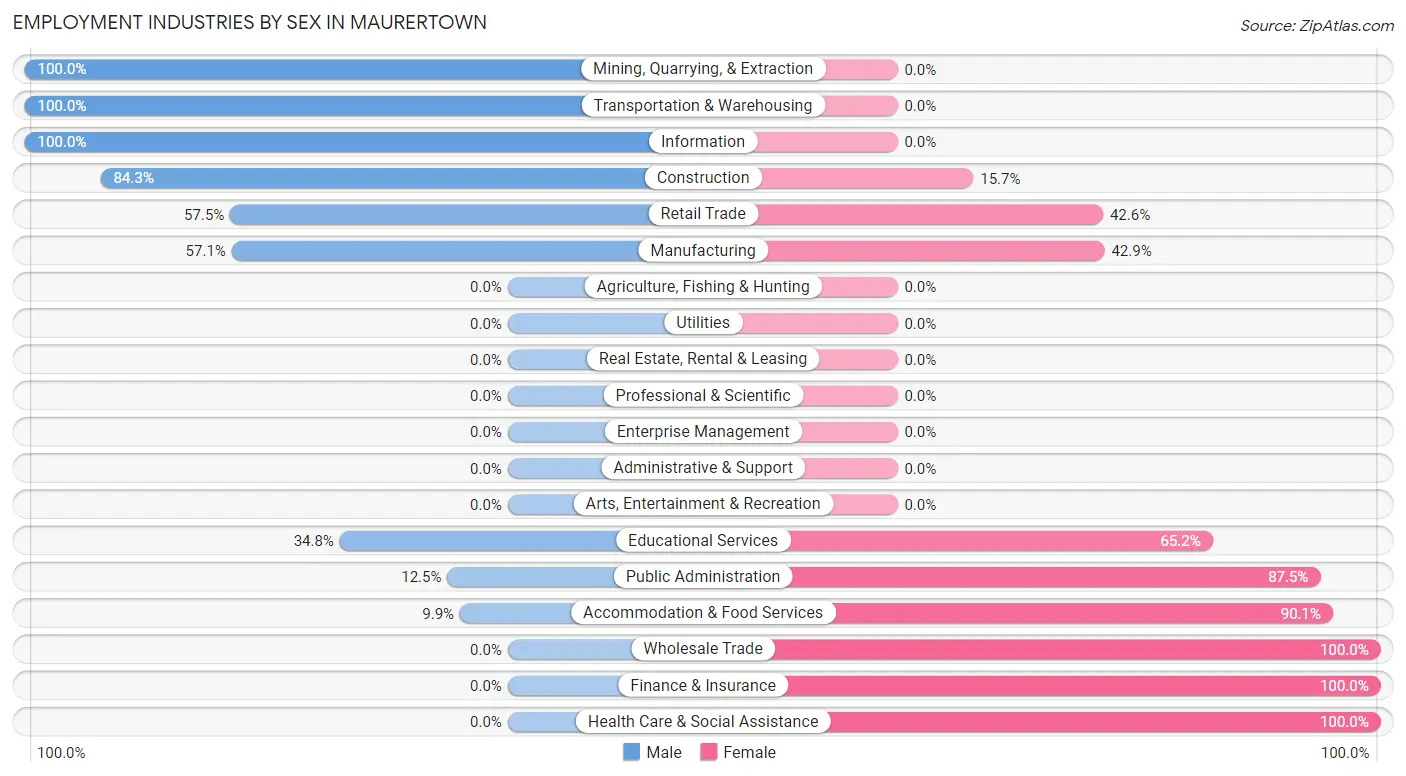
The Maurertown industries that see more men than women are Mining, Quarrying, & Extraction (100.0%), Transportation & Warehousing (100.0%), and Information (100.0%), whereas the industries that tend to have a higher number of women are Wholesale Trade (100.0%), Finance & Insurance (100.0%), and Health Care & Social Assistance (100.0%).
| Industry | Male | Female |
| Agriculture, Fishing & Hunting | 0 (0.0%) | 0 (0.0%) |
| Mining, Quarrying, & Extraction | 26 (100.0%) | 0 (0.0%) |
| Construction | 59 (84.3%) | 11 (15.7%) |
| Manufacturing | 20 (57.1%) | 15 (42.9%) |
| Wholesale Trade | 0 (0.0%) | 27 (100.0%) |
| Retail Trade | 54 (57.5%) | 40 (42.5%) |
| Transportation & Warehousing | 24 (100.0%) | 0 (0.0%) |
| Utilities | 0 (0.0%) | 0 (0.0%) |
| Information | 10 (100.0%) | 0 (0.0%) |
| Finance & Insurance | 0 (0.0%) | 12 (100.0%) |
| Real Estate, Rental & Leasing | 0 (0.0%) | 0 (0.0%) |
| Professional & Scientific | 0 (0.0%) | 0 (0.0%) |
| Enterprise Management | 0 (0.0%) | 0 (0.0%) |
| Administrative & Support | 0 (0.0%) | 0 (0.0%) |
| Educational Services | 8 (34.8%) | 15 (65.2%) |
| Health Care & Social Assistance | 0 (0.0%) | 42 (100.0%) |
| Arts, Entertainment & Recreation | 0 (0.0%) | 0 (0.0%) |
| Accommodation & Food Services | 9 (9.9%) | 82 (90.1%) |
| Public Administration | 1 (12.5%) | 7 (87.5%) |
| Total | 211 (44.9%) | 259 (55.1%) |
Education in Maurertown
School Enrollment in Maurertown
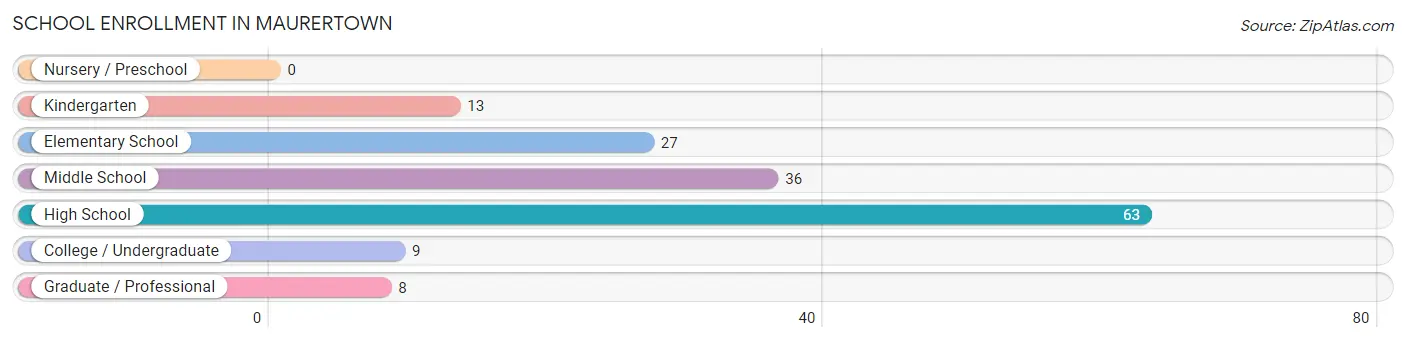
The most common levels of schooling among the 156 students in Maurertown are high school (63 | 40.4%), middle school (36 | 23.1%), and elementary school (27 | 17.3%).
| School Level | # Students | % Students |
| Nursery / Preschool | 0 | 0.0% |
| Kindergarten | 13 | 8.3% |
| Elementary School | 27 | 17.3% |
| Middle School | 36 | 23.1% |
| High School | 63 | 40.4% |
| College / Undergraduate | 9 | 5.8% |
| Graduate / Professional | 8 | 5.1% |
| Total | 156 | 100.0% |
School Enrollment by Age by Funding Source in Maurertown
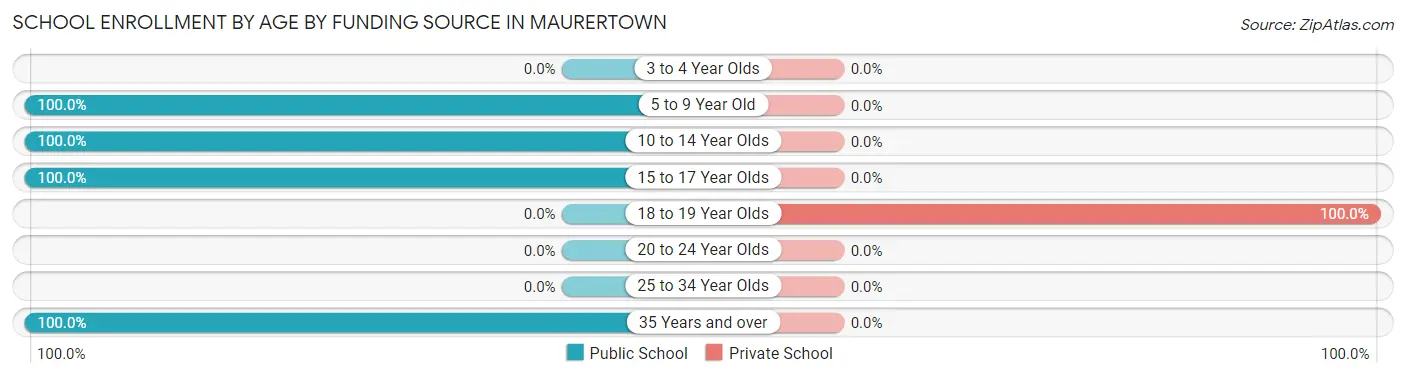
Out of a total of 156 students who are enrolled in schools in Maurertown, 9 (5.8%) attend a private institution, while the remaining 147 (94.2%) are enrolled in public schools. The age group of 18 to 19 year olds has the highest likelihood of being enrolled in private schools, with 9 (100.0% in the age bracket) enrolled. Conversely, the age group of 5 to 9 year old has the lowest likelihood of being enrolled in a private school, with 40 (100.0% in the age bracket) attending a public institution.
| Age Bracket | Public School | Private School |
| 3 to 4 Year Olds | 0 (0.0%) | 0 (0.0%) |
| 5 to 9 Year Old | 40 (100.0%) | 0 (0.0%) |
| 10 to 14 Year Olds | 59 (100.0%) | 0 (0.0%) |
| 15 to 17 Year Olds | 40 (100.0%) | 0 (0.0%) |
| 18 to 19 Year Olds | 0 (0.0%) | 9 (100.0%) |
| 20 to 24 Year Olds | 0 (0.0%) | 0 (0.0%) |
| 25 to 34 Year Olds | 0 (0.0%) | 0 (0.0%) |
| 35 Years and over | 8 (100.0%) | 0 (0.0%) |
| Total | 147 (94.2%) | 9 (5.8%) |
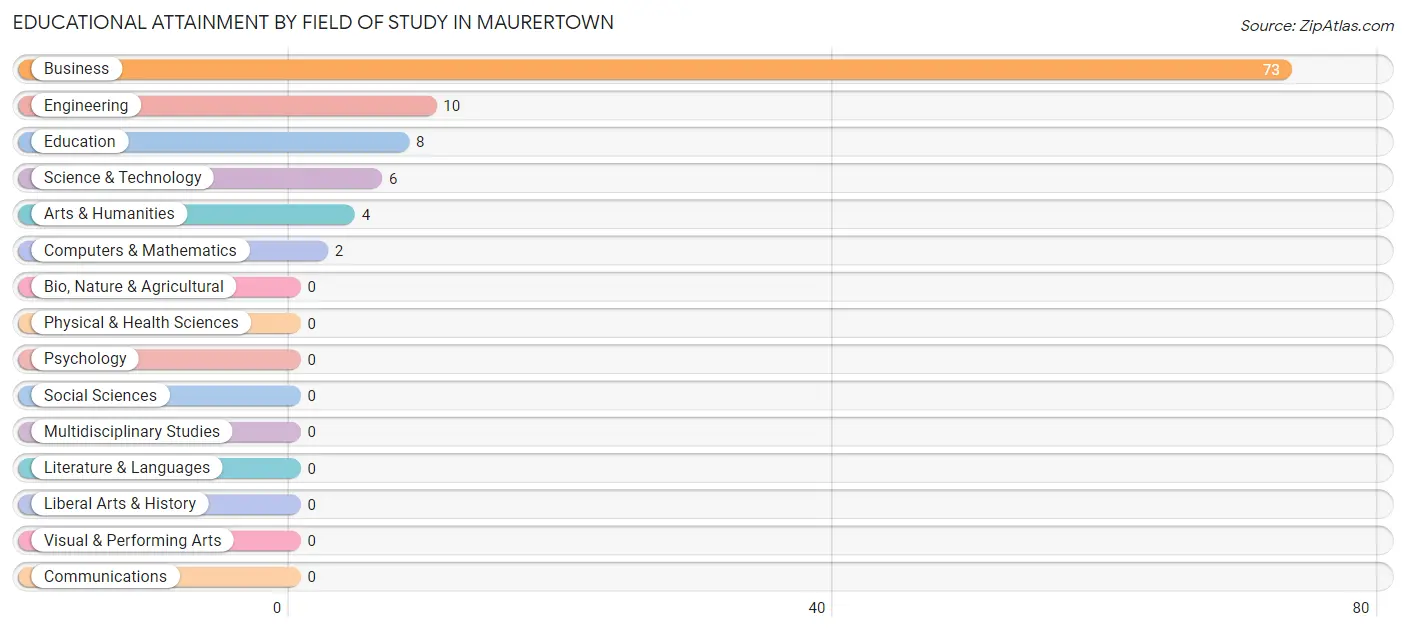
Educational Attainment by Field of Study in Maurertown
Business (73 | 70.9%), engineering (10 | 9.7%), education (8 | 7.8%), science & technology (6 | 5.8%), and arts & humanities (4 | 3.9%) are the most common fields of study among 103 individuals in Maurertown who have obtained a bachelor's degree or higher.
| Field of Study | # Graduates | % Graduates |
| Computers & Mathematics | 2 | 1.9% |
| Bio, Nature & Agricultural | 0 | 0.0% |
| Physical & Health Sciences | 0 | 0.0% |
| Psychology | 0 | 0.0% |
| Social Sciences | 0 | 0.0% |
| Engineering | 10 | 9.7% |
| Multidisciplinary Studies | 0 | 0.0% |
| Science & Technology | 6 | 5.8% |
| Business | 73 | 70.9% |
| Education | 8 | 7.8% |
| Literature & Languages | 0 | 0.0% |
| Liberal Arts & History | 0 | 0.0% |
| Visual & Performing Arts | 0 | 0.0% |
| Communications | 0 | 0.0% |
| Arts & Humanities | 4 | 3.9% |
| Total | 103 | 100.0% |
Transportation & Commute in Maurertown
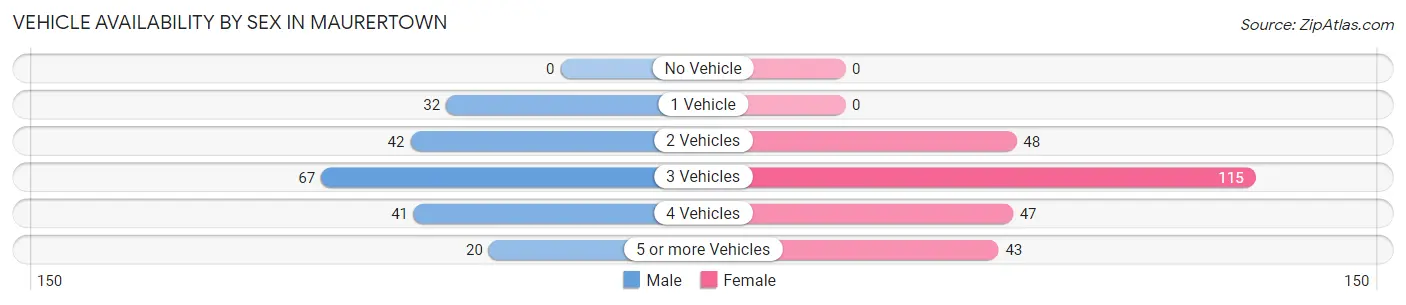
Vehicle Availability by Sex in Maurertown
The most prevalent vehicle ownership categories in Maurertown are males with 3 vehicles (67, accounting for 33.2%) and females with 3 vehicles (115, making up 26.5%).
| Vehicles Available | Male | Female |
| No Vehicle | 0 (0.0%) | 0 (0.0%) |
| 1 Vehicle | 32 (15.8%) | 0 (0.0%) |
| 2 Vehicles | 42 (20.8%) | 48 (19.0%) |
| 3 Vehicles | 67 (33.2%) | 115 (45.5%) |
| 4 Vehicles | 41 (20.3%) | 47 (18.6%) |
| 5 or more Vehicles | 20 (9.9%) | 43 (17.0%) |
| Total | 202 (100.0%) | 253 (100.0%) |
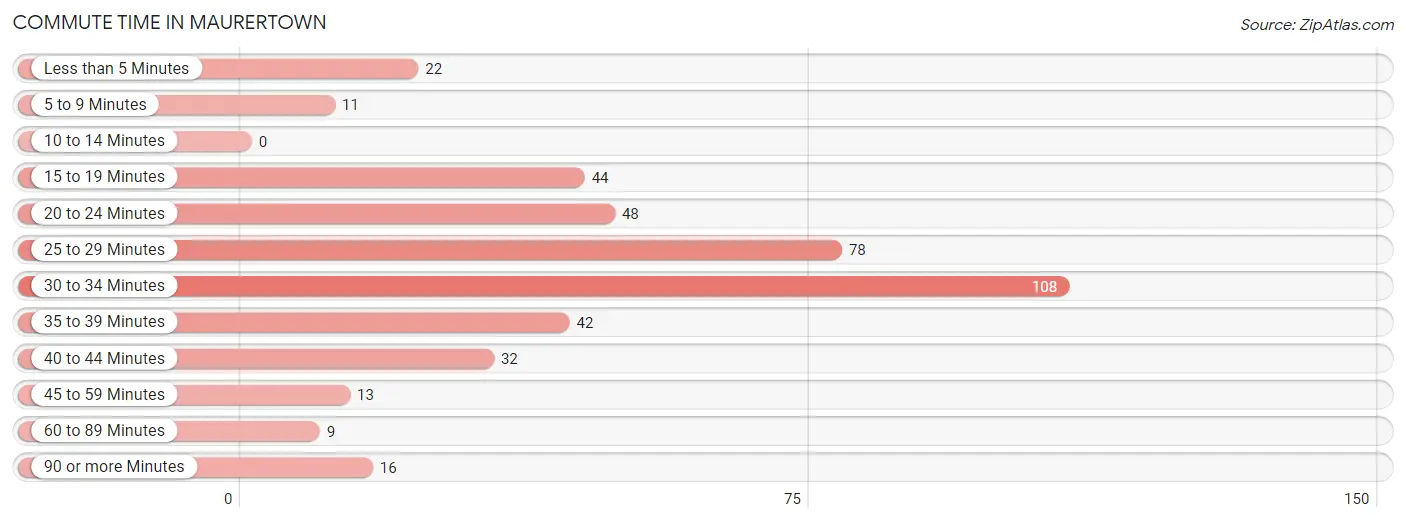
Commute Time in Maurertown
The most frequently occuring commute durations in Maurertown are 30 to 34 minutes (108 commuters, 25.5%), 25 to 29 minutes (78 commuters, 18.4%), and 20 to 24 minutes (48 commuters, 11.4%).
| Commute Time | # Commuters | % Commuters |
| Less than 5 Minutes | 22 | 5.2% |
| 5 to 9 Minutes | 11 | 2.6% |
| 10 to 14 Minutes | 0 | 0.0% |
| 15 to 19 Minutes | 44 | 10.4% |
| 20 to 24 Minutes | 48 | 11.4% |
| 25 to 29 Minutes | 78 | 18.4% |
| 30 to 34 Minutes | 108 | 25.5% |
| 35 to 39 Minutes | 42 | 9.9% |
| 40 to 44 Minutes | 32 | 7.6% |
| 45 to 59 Minutes | 13 | 3.1% |
| 60 to 89 Minutes | 9 | 2.1% |
| 90 or more Minutes | 16 | 3.8% |
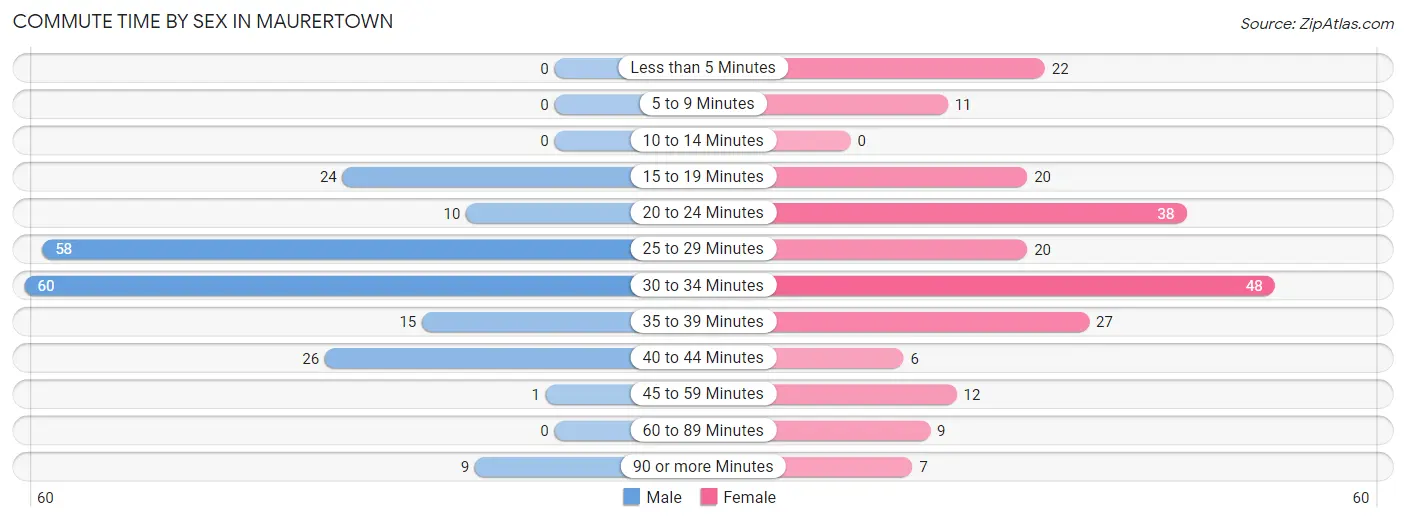
Commute Time by Sex in Maurertown
The most common commute times in Maurertown are 30 to 34 minutes (60 commuters, 29.6%) for males and 30 to 34 minutes (48 commuters, 21.8%) for females.
| Commute Time | Male | Female |
| Less than 5 Minutes | 0 (0.0%) | 22 (10.0%) |
| 5 to 9 Minutes | 0 (0.0%) | 11 (5.0%) |
| 10 to 14 Minutes | 0 (0.0%) | 0 (0.0%) |
| 15 to 19 Minutes | 24 (11.8%) | 20 (9.1%) |
| 20 to 24 Minutes | 10 (4.9%) | 38 (17.3%) |
| 25 to 29 Minutes | 58 (28.6%) | 20 (9.1%) |
| 30 to 34 Minutes | 60 (29.6%) | 48 (21.8%) |
| 35 to 39 Minutes | 15 (7.4%) | 27 (12.3%) |
| 40 to 44 Minutes | 26 (12.8%) | 6 (2.7%) |
| 45 to 59 Minutes | 1 (0.5%) | 12 (5.4%) |
| 60 to 89 Minutes | 0 (0.0%) | 9 (4.1%) |
| 90 or more Minutes | 9 (4.4%) | 7 (3.2%) |
Time of Departure to Work by Sex in Maurertown
The most frequent times of departure to work in Maurertown are 6:00 AM to 6:29 AM (84, 41.4%) for males and 8:00 AM to 8:29 AM (49, 22.3%) for females.
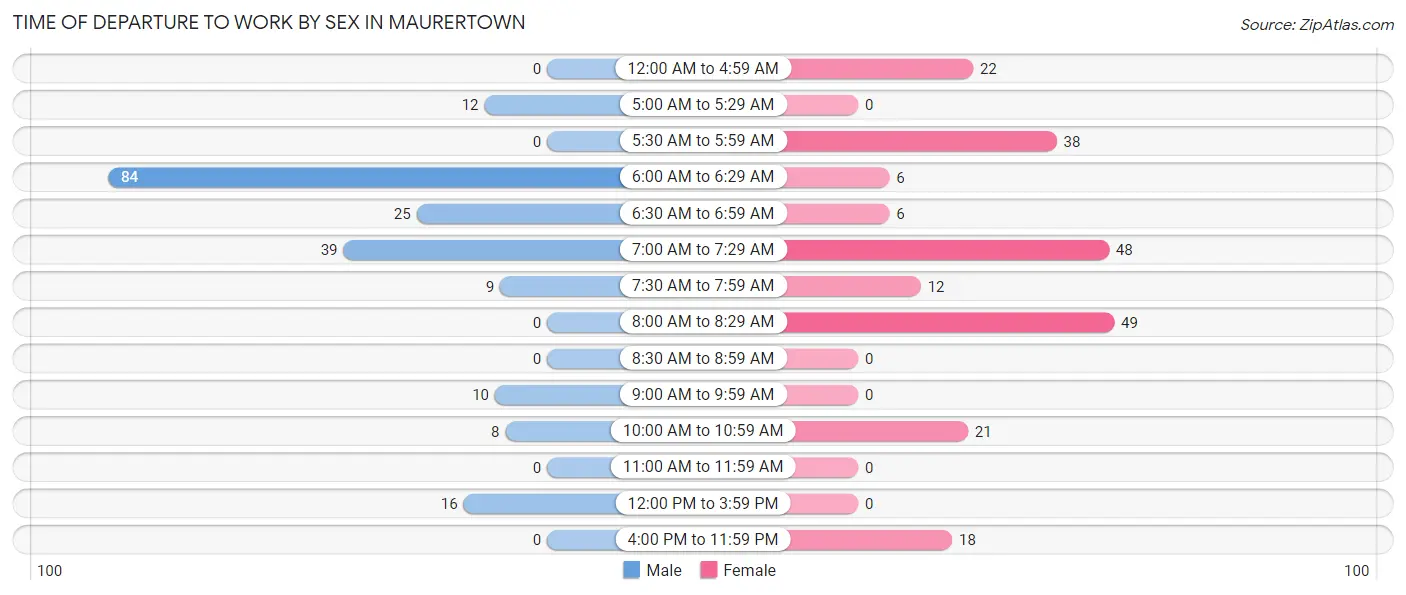
| Time of Departure | Male | Female |
| 12:00 AM to 4:59 AM | 0 (0.0%) | 22 (10.0%) |
| 5:00 AM to 5:29 AM | 12 (5.9%) | 0 (0.0%) |
| 5:30 AM to 5:59 AM | 0 (0.0%) | 38 (17.3%) |
| 6:00 AM to 6:29 AM | 84 (41.4%) | 6 (2.7%) |
| 6:30 AM to 6:59 AM | 25 (12.3%) | 6 (2.7%) |
| 7:00 AM to 7:29 AM | 39 (19.2%) | 48 (21.8%) |
| 7:30 AM to 7:59 AM | 9 (4.4%) | 12 (5.4%) |
| 8:00 AM to 8:29 AM | 0 (0.0%) | 49 (22.3%) |
| 8:30 AM to 8:59 AM | 0 (0.0%) | 0 (0.0%) |
| 9:00 AM to 9:59 AM | 10 (4.9%) | 0 (0.0%) |
| 10:00 AM to 10:59 AM | 8 (3.9%) | 21 (9.6%) |
| 11:00 AM to 11:59 AM | 0 (0.0%) | 0 (0.0%) |
| 12:00 PM to 3:59 PM | 16 (7.9%) | 0 (0.0%) |
| 4:00 PM to 11:59 PM | 0 (0.0%) | 18 (8.2%) |
| Total | 203 (100.0%) | 220 (100.0%) |
Housing Occupancy in Maurertown
Occupancy by Ownership in Maurertown
Of the total 324 dwellings in Maurertown, owner-occupied units account for 258 (79.6%), while renter-occupied units make up 66 (20.4%).
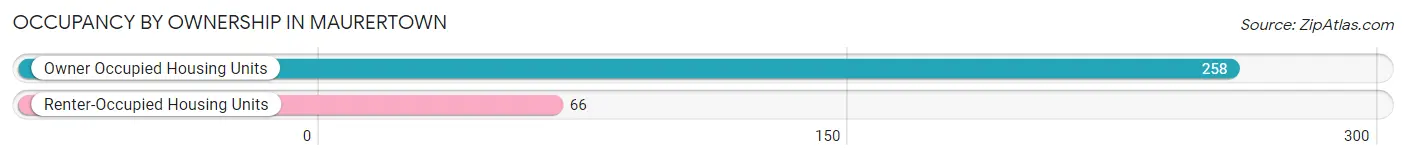
| Occupancy | # Housing Units | % Housing Units |
| Owner Occupied Housing Units | 258 | 79.6% |
| Renter-Occupied Housing Units | 66 | 20.4% |
| Total Occupied Housing Units | 324 | 100.0% |
Occupancy by Household Size in Maurertown
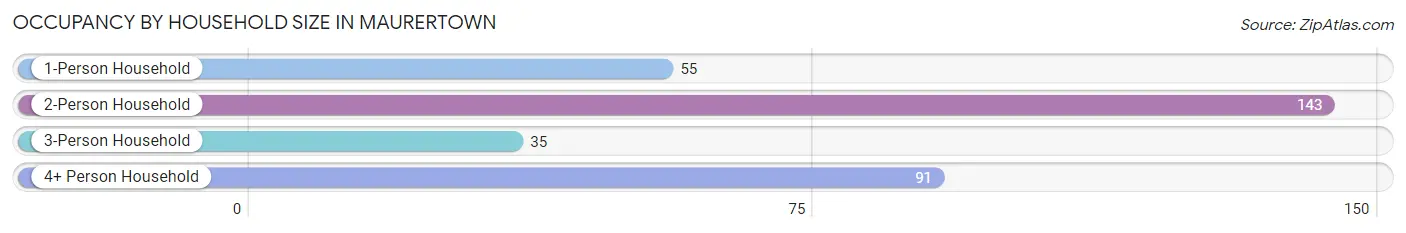
| Household Size | # Housing Units | % Housing Units |
| 1-Person Household | 55 | 17.0% |
| 2-Person Household | 143 | 44.1% |
| 3-Person Household | 35 | 10.8% |
| 4+ Person Household | 91 | 28.1% |
| Total Housing Units | 324 | 100.0% |
Occupancy by Ownership by Household Size in Maurertown
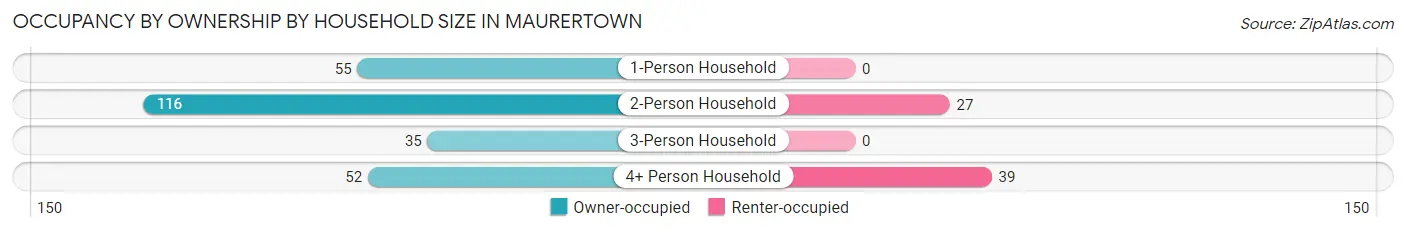
| Household Size | Owner-occupied | Renter-occupied |
| 1-Person Household | 55 (100.0%) | 0 (0.0%) |
| 2-Person Household | 116 (81.1%) | 27 (18.9%) |
| 3-Person Household | 35 (100.0%) | 0 (0.0%) |
| 4+ Person Household | 52 (57.1%) | 39 (42.9%) |
| Total Housing Units | 258 (79.6%) | 66 (20.4%) |
Occupancy by Educational Attainment in Maurertown
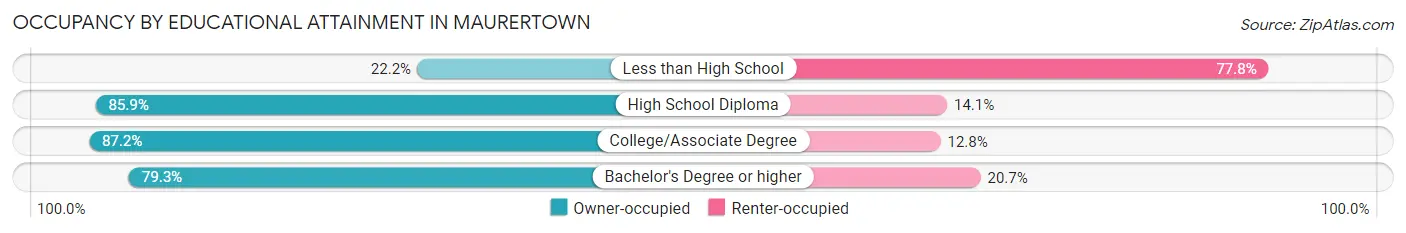
| Household Size | Owner-occupied | Renter-occupied |
| Less than High School | 6 (22.2%) | 21 (77.8%) |
| High School Diploma | 165 (85.9%) | 27 (14.1%) |
| College/Associate Degree | 41 (87.2%) | 6 (12.8%) |
| Bachelor's Degree or higher | 46 (79.3%) | 12 (20.7%) |
Occupancy by Age of Householder in Maurertown
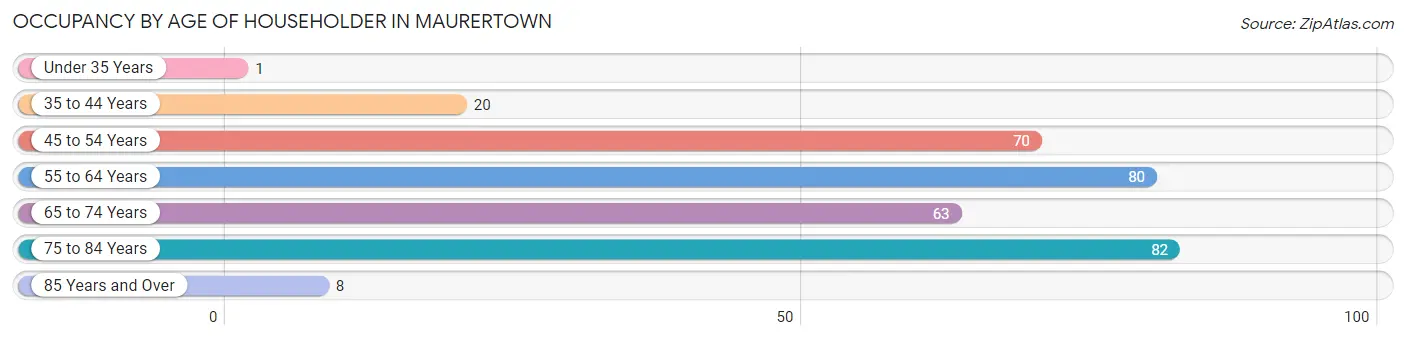
| Age Bracket | # Households | % Households |
| Under 35 Years | 1 | 0.3% |
| 35 to 44 Years | 20 | 6.2% |
| 45 to 54 Years | 70 | 21.6% |
| 55 to 64 Years | 80 | 24.7% |
| 65 to 74 Years | 63 | 19.4% |
| 75 to 84 Years | 82 | 25.3% |
| 85 Years and Over | 8 | 2.5% |
| Total | 324 | 100.0% |
Housing Finances in Maurertown
Median Income by Occupancy in Maurertown
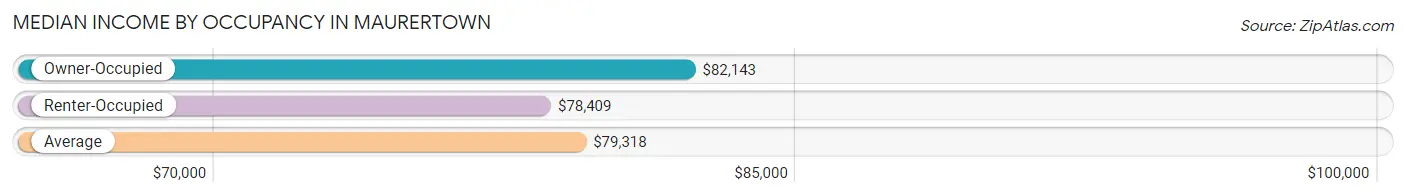
| Occupancy Type | # Households | Median Income |
| Owner-Occupied | 258 (79.6%) | $82,143 |
| Renter-Occupied | 66 (20.4%) | $78,409 |
| Average | 324 (100.0%) | $79,318 |
Occupancy by Householder Income Bracket in Maurertown
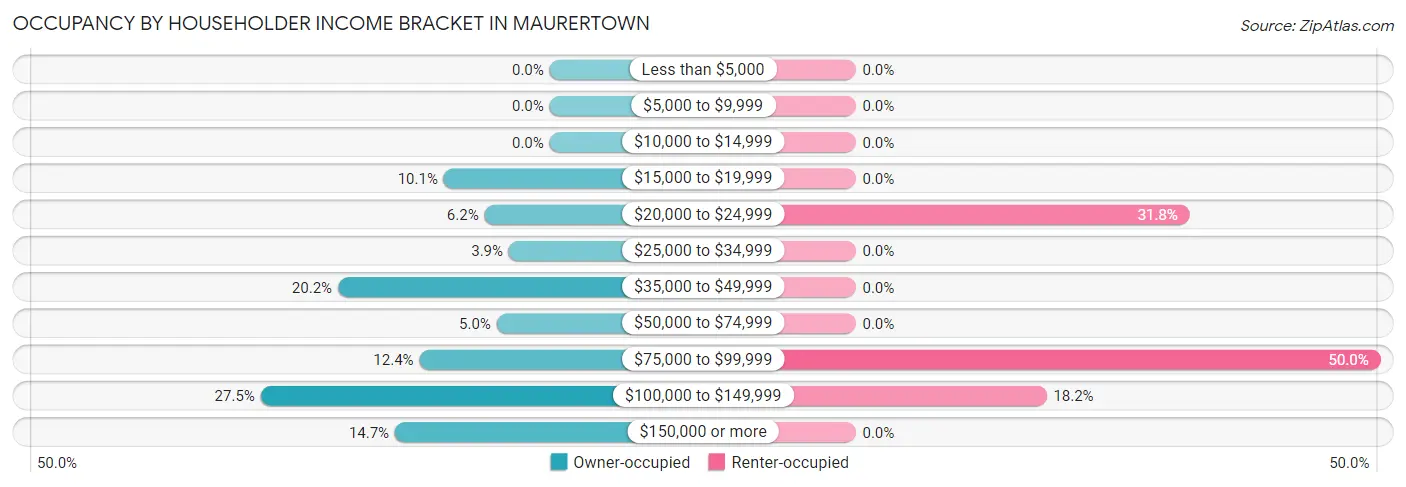
| Income Bracket | Owner-occupied | Renter-occupied |
| Less than $5,000 | 0 (0.0%) | 0 (0.0%) |
| $5,000 to $9,999 | 0 (0.0%) | 0 (0.0%) |
| $10,000 to $14,999 | 0 (0.0%) | 0 (0.0%) |
| $15,000 to $19,999 | 26 (10.1%) | 0 (0.0%) |
| $20,000 to $24,999 | 16 (6.2%) | 21 (31.8%) |
| $25,000 to $34,999 | 10 (3.9%) | 0 (0.0%) |
| $35,000 to $49,999 | 52 (20.2%) | 0 (0.0%) |
| $50,000 to $74,999 | 13 (5.0%) | 0 (0.0%) |
| $75,000 to $99,999 | 32 (12.4%) | 33 (50.0%) |
| $100,000 to $149,999 | 71 (27.5%) | 12 (18.2%) |
| $150,000 or more | 38 (14.7%) | 0 (0.0%) |
| Total | 258 (100.0%) | 66 (100.0%) |
Monthly Housing Cost Tiers in Maurertown
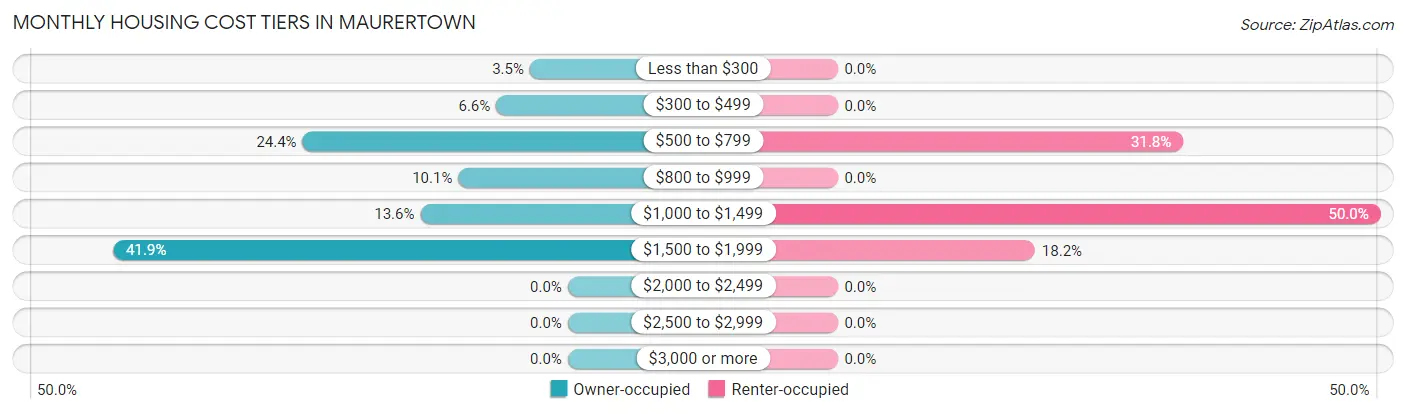
| Monthly Cost | Owner-occupied | Renter-occupied |
| Less than $300 | 9 (3.5%) | 0 (0.0%) |
| $300 to $499 | 17 (6.6%) | 0 (0.0%) |
| $500 to $799 | 63 (24.4%) | 21 (31.8%) |
| $800 to $999 | 26 (10.1%) | 0 (0.0%) |
| $1,000 to $1,499 | 35 (13.6%) | 33 (50.0%) |
| $1,500 to $1,999 | 108 (41.9%) | 12 (18.2%) |
| $2,000 to $2,499 | 0 (0.0%) | 0 (0.0%) |
| $2,500 to $2,999 | 0 (0.0%) | 0 (0.0%) |
| $3,000 or more | 0 (0.0%) | 0 (0.0%) |
| Total | 258 (100.0%) | 66 (100.0%) |
Physical Housing Characteristics in Maurertown
Housing Structures in Maurertown
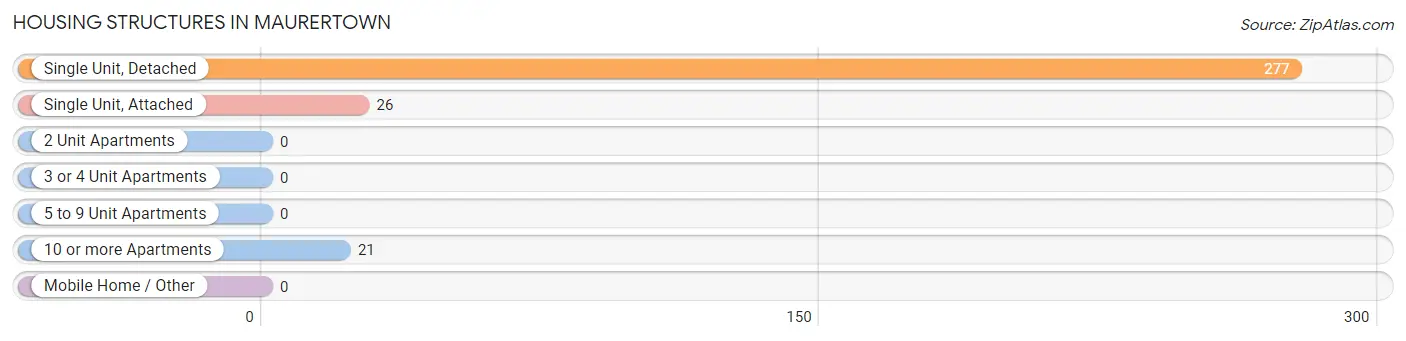
| Structure Type | # Housing Units | % Housing Units |
| Single Unit, Detached | 277 | 85.5% |
| Single Unit, Attached | 26 | 8.0% |
| 2 Unit Apartments | 0 | 0.0% |
| 3 or 4 Unit Apartments | 0 | 0.0% |
| 5 to 9 Unit Apartments | 0 | 0.0% |
| 10 or more Apartments | 21 | 6.5% |
| Mobile Home / Other | 0 | 0.0% |
| Total | 324 | 100.0% |
Housing Structures by Occupancy in Maurertown
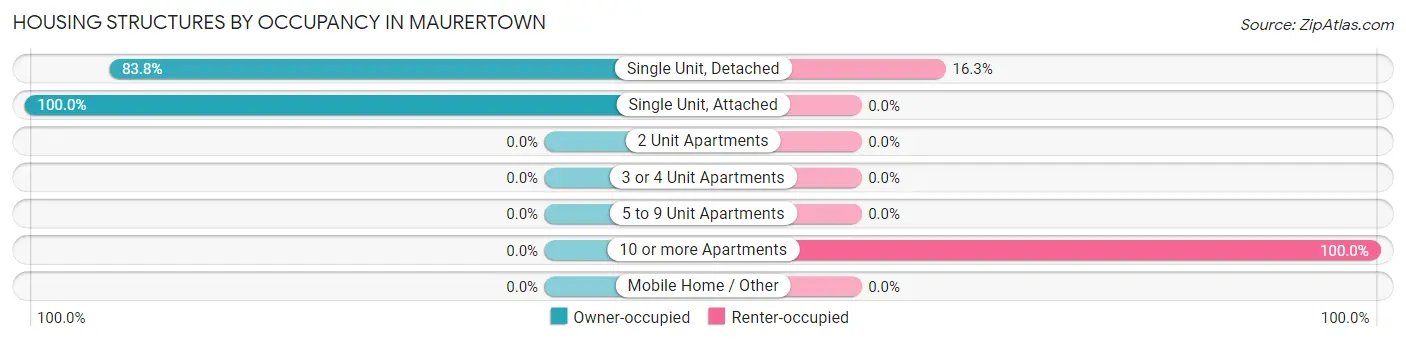
| Structure Type | Owner-occupied | Renter-occupied |
| Single Unit, Detached | 232 (83.8%) | 45 (16.3%) |
| Single Unit, Attached | 26 (100.0%) | 0 (0.0%) |
| 2 Unit Apartments | 0 (0.0%) | 0 (0.0%) |
| 3 or 4 Unit Apartments | 0 (0.0%) | 0 (0.0%) |
| 5 to 9 Unit Apartments | 0 (0.0%) | 0 (0.0%) |
| 10 or more Apartments | 0 (0.0%) | 21 (100.0%) |
| Mobile Home / Other | 0 (0.0%) | 0 (0.0%) |
| Total | 258 (79.6%) | 66 (20.4%) |
Housing Structures by Number of Rooms in Maurertown
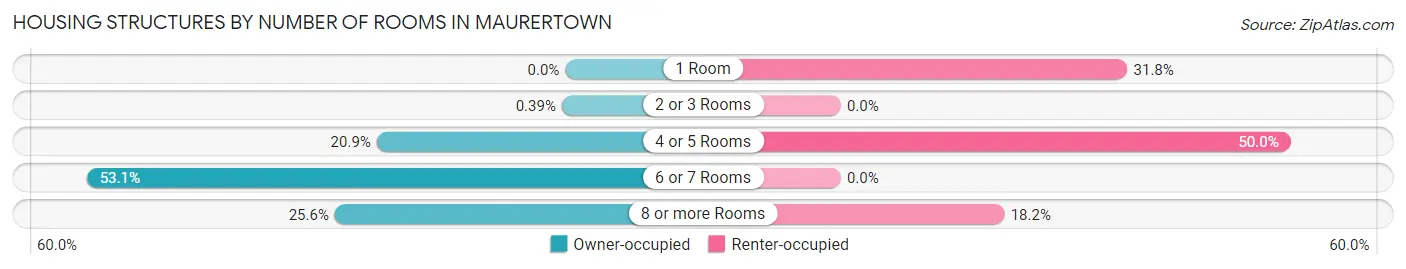
| Number of Rooms | Owner-occupied | Renter-occupied |
| 1 Room | 0 (0.0%) | 21 (31.8%) |
| 2 or 3 Rooms | 1 (0.4%) | 0 (0.0%) |
| 4 or 5 Rooms | 54 (20.9%) | 33 (50.0%) |
| 6 or 7 Rooms | 137 (53.1%) | 0 (0.0%) |
| 8 or more Rooms | 66 (25.6%) | 12 (18.2%) |
| Total | 258 (100.0%) | 66 (100.0%) |
Housing Structure by Heating Type in Maurertown
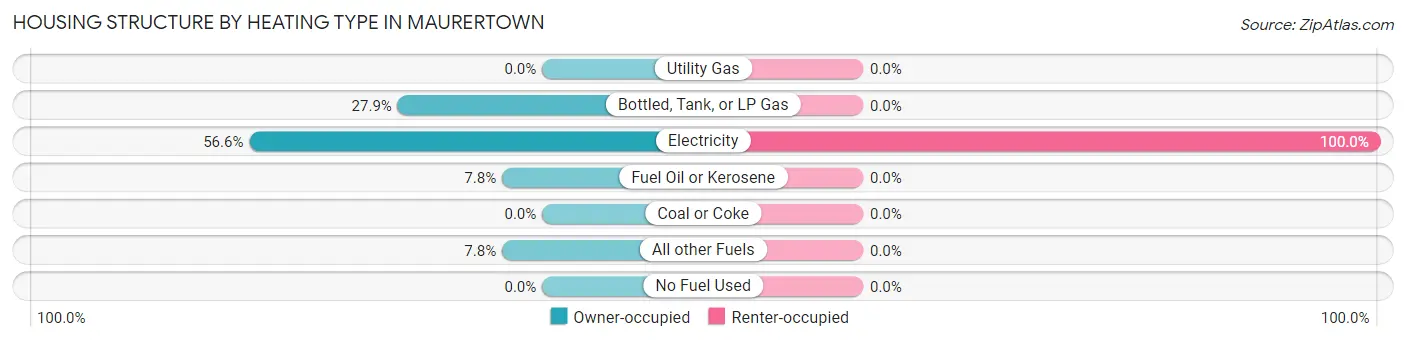
| Heating Type | Owner-occupied | Renter-occupied |
| Utility Gas | 0 (0.0%) | 0 (0.0%) |
| Bottled, Tank, or LP Gas | 72 (27.9%) | 0 (0.0%) |
| Electricity | 146 (56.6%) | 66 (100.0%) |
| Fuel Oil or Kerosene | 20 (7.7%) | 0 (0.0%) |
| Coal or Coke | 0 (0.0%) | 0 (0.0%) |
| All other Fuels | 20 (7.7%) | 0 (0.0%) |
| No Fuel Used | 0 (0.0%) | 0 (0.0%) |
| Total | 258 (100.0%) | 66 (100.0%) |
Household Vehicle Usage in Maurertown
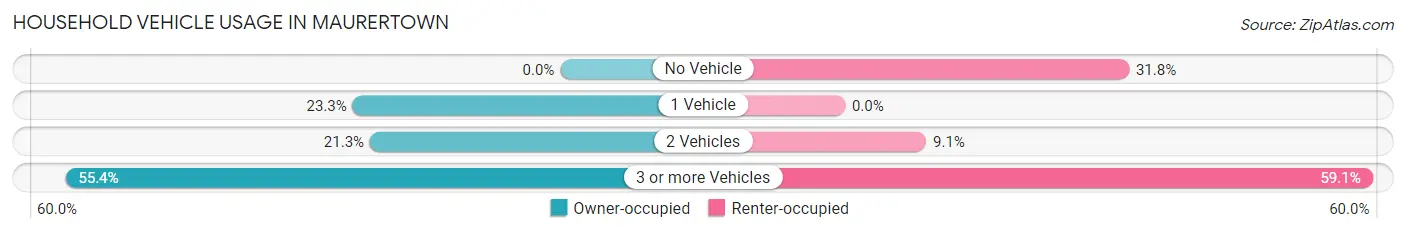
| Vehicles per Household | Owner-occupied | Renter-occupied |
| No Vehicle | 0 (0.0%) | 21 (31.8%) |
| 1 Vehicle | 60 (23.3%) | 0 (0.0%) |
| 2 Vehicles | 55 (21.3%) | 6 (9.1%) |
| 3 or more Vehicles | 143 (55.4%) | 39 (59.1%) |
| Total | 258 (100.0%) | 66 (100.0%) |
Real Estate & Mortgages in Maurertown
Real Estate and Mortgage Overview in Maurertown
| Characteristic | Without Mortgage | With Mortgage |
| Housing Units | 76 | 182 |
| Median Property Value | $262,500 | $248,600 |
| Median Household Income | $105,833 | $27 |
| Monthly Housing Costs | $553 | $0 |
| Real Estate Taxes | $1,380 | $26 |
Property Value by Mortgage Status in Maurertown
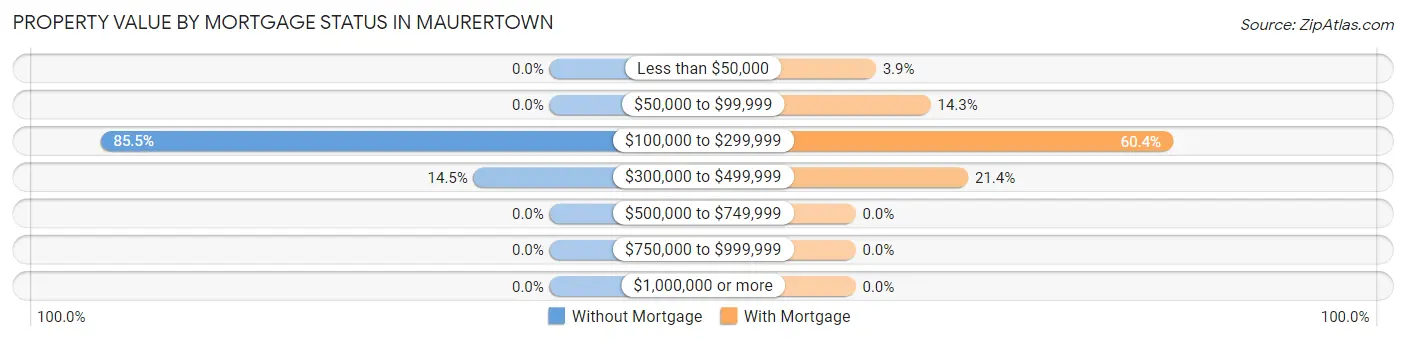
| Property Value | Without Mortgage | With Mortgage |
| Less than $50,000 | 0 (0.0%) | 7 (3.8%) |
| $50,000 to $99,999 | 0 (0.0%) | 26 (14.3%) |
| $100,000 to $299,999 | 65 (85.5%) | 110 (60.4%) |
| $300,000 to $499,999 | 11 (14.5%) | 39 (21.4%) |
| $500,000 to $749,999 | 0 (0.0%) | 0 (0.0%) |
| $750,000 to $999,999 | 0 (0.0%) | 0 (0.0%) |
| $1,000,000 or more | 0 (0.0%) | 0 (0.0%) |
| Total | 76 (100.0%) | 182 (100.0%) |
Household Income by Mortgage Status in Maurertown
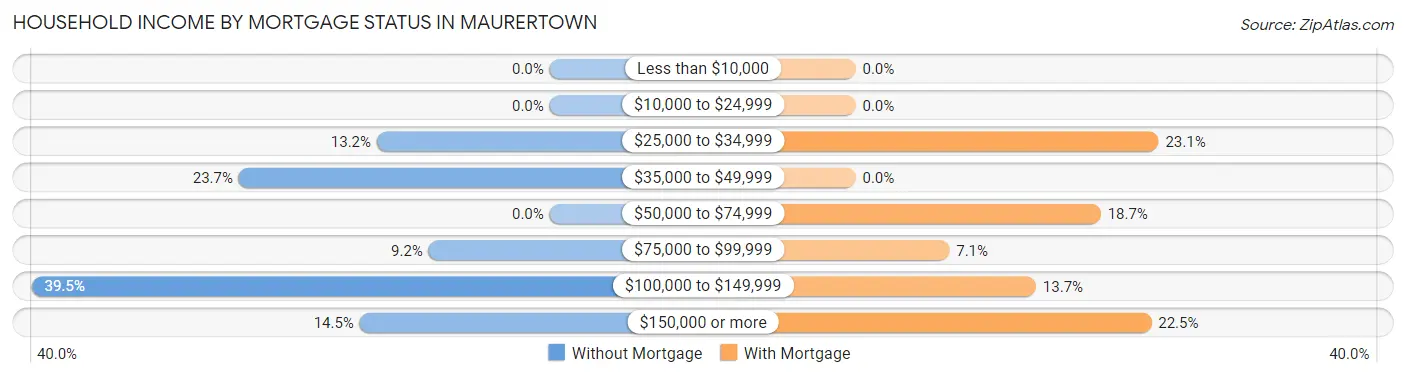
| Household Income | Without Mortgage | With Mortgage |
| Less than $10,000 | 0 (0.0%) | 0 (0.0%) |
| $10,000 to $24,999 | 0 (0.0%) | 0 (0.0%) |
| $25,000 to $34,999 | 10 (13.2%) | 42 (23.1%) |
| $35,000 to $49,999 | 18 (23.7%) | 0 (0.0%) |
| $50,000 to $74,999 | 0 (0.0%) | 34 (18.7%) |
| $75,000 to $99,999 | 7 (9.2%) | 13 (7.1%) |
| $100,000 to $149,999 | 30 (39.5%) | 25 (13.7%) |
| $150,000 or more | 11 (14.5%) | 41 (22.5%) |
| Total | 76 (100.0%) | 182 (100.0%) |
Property Value to Household Income Ratio in Maurertown
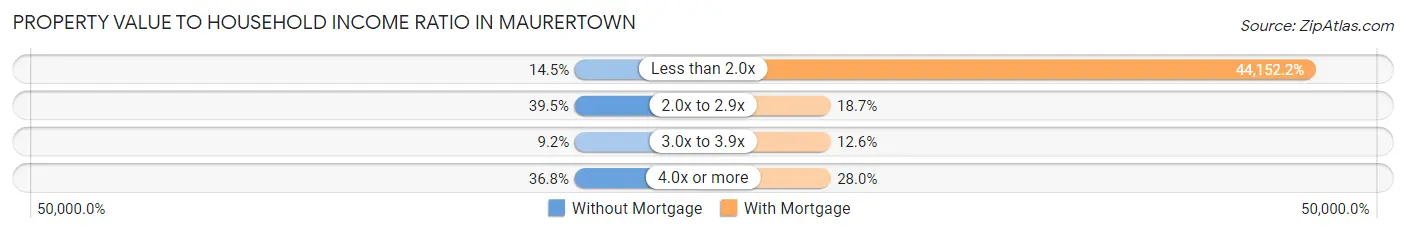
| Value-to-Income Ratio | Without Mortgage | With Mortgage |
| Less than 2.0x | 11 (14.5%) | 80,357 (44,152.2%) |
| 2.0x to 2.9x | 30 (39.5%) | 34 (18.7%) |
| 3.0x to 3.9x | 7 (9.2%) | 23 (12.6%) |
| 4.0x or more | 28 (36.8%) | 51 (28.0%) |
| Total | 76 (100.0%) | 182 (100.0%) |
Real Estate Taxes by Mortgage Status in Maurertown
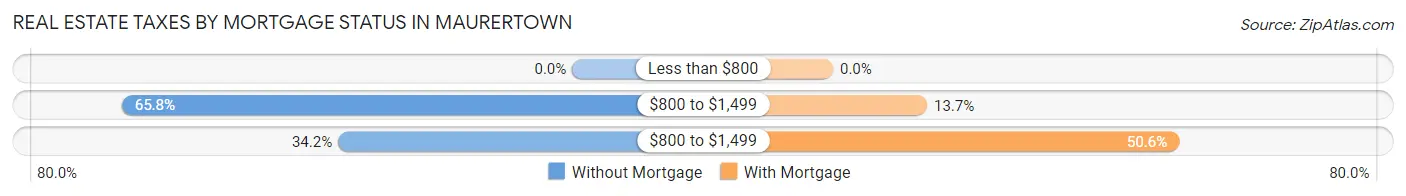
| Property Taxes | Without Mortgage | With Mortgage |
| Less than $800 | 0 (0.0%) | 0 (0.0%) |
| $800 to $1,499 | 50 (65.8%) | 25 (13.7%) |
| $800 to $1,499 | 26 (34.2%) | 92 (50.5%) |
| Total | 76 (100.0%) | 182 (100.0%) |
Health & Disability in Maurertown
Health Insurance Coverage by Age in Maurertown
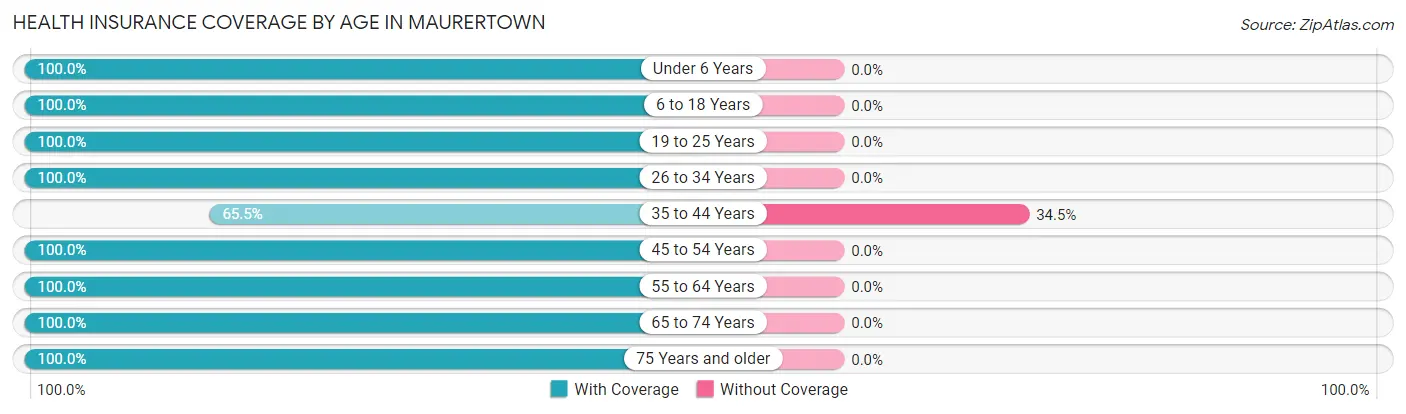
| Age Bracket | With Coverage | Without Coverage |
| Under 6 Years | 62 (100.0%) | 0 (0.0%) |
| 6 to 18 Years | 172 (100.0%) | 0 (0.0%) |
| 19 to 25 Years | 91 (100.0%) | 0 (0.0%) |
| 26 to 34 Years | 64 (100.0%) | 0 (0.0%) |
| 35 to 44 Years | 19 (65.5%) | 10 (34.5%) |
| 45 to 54 Years | 197 (100.0%) | 0 (0.0%) |
| 55 to 64 Years | 128 (100.0%) | 0 (0.0%) |
| 65 to 74 Years | 88 (100.0%) | 0 (0.0%) |
| 75 Years and older | 162 (100.0%) | 0 (0.0%) |
| Total | 983 (99.0%) | 10 (1.0%) |
Health Insurance Coverage by Citizenship Status in Maurertown
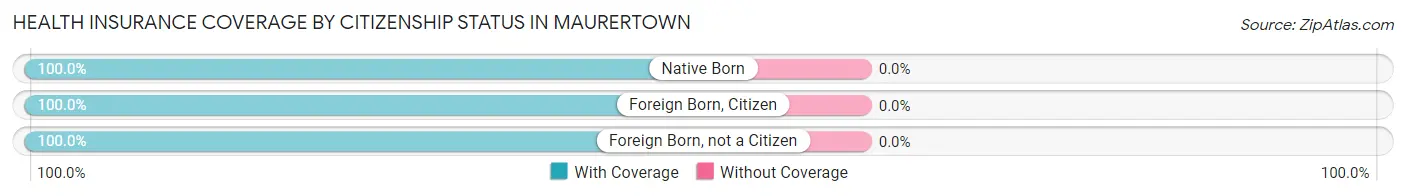
| Citizenship Status | With Coverage | Without Coverage |
| Native Born | 62 (100.0%) | 0 (0.0%) |
| Foreign Born, Citizen | 172 (100.0%) | 0 (0.0%) |
| Foreign Born, not a Citizen | 91 (100.0%) | 0 (0.0%) |
Health Insurance Coverage by Household Income in Maurertown
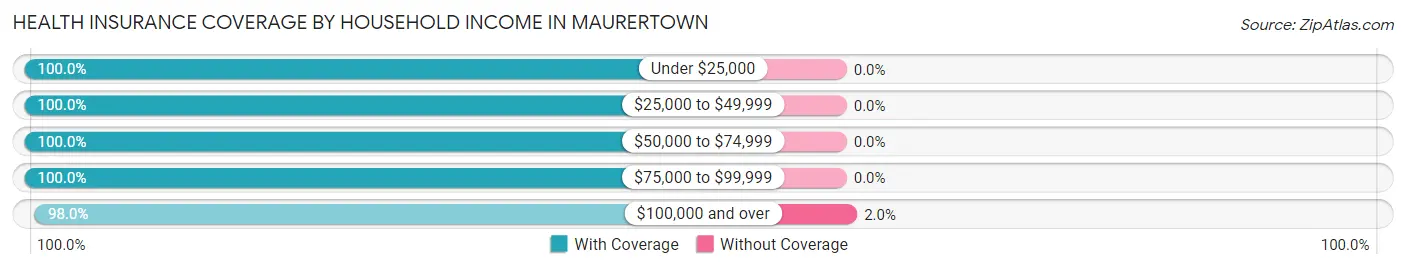
| Household Income | With Coverage | Without Coverage |
| Under $25,000 | 109 (100.0%) | 0 (0.0%) |
| $25,000 to $49,999 | 95 (100.0%) | 0 (0.0%) |
| $50,000 to $74,999 | 27 (100.0%) | 0 (0.0%) |
| $75,000 to $99,999 | 243 (100.0%) | 0 (0.0%) |
| $100,000 and over | 501 (98.0%) | 10 (2.0%) |
Public vs Private Health Insurance Coverage by Age in Maurertown
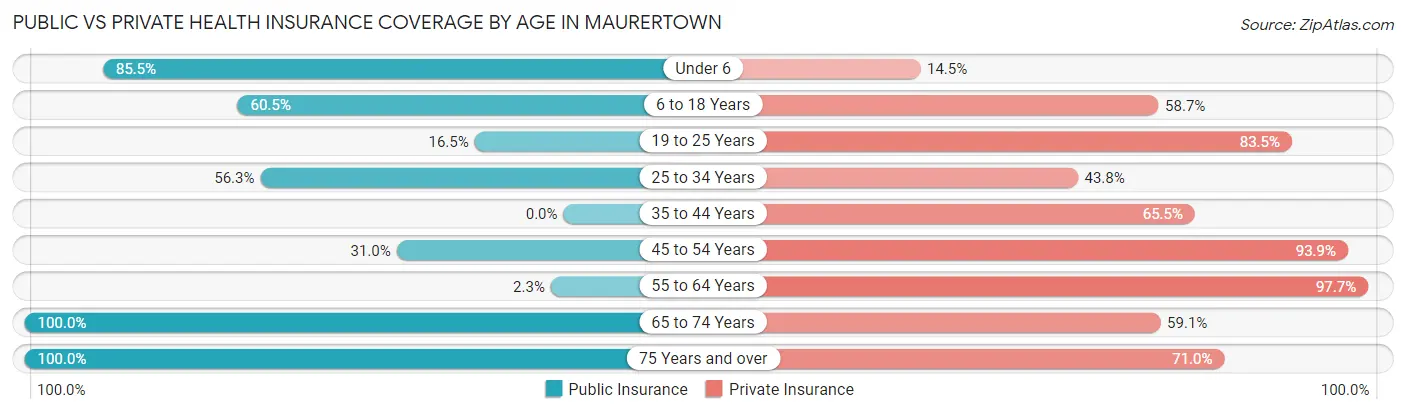
| Age Bracket | Public Insurance | Private Insurance |
| Under 6 | 53 (85.5%) | 9 (14.5%) |
| 6 to 18 Years | 104 (60.5%) | 101 (58.7%) |
| 19 to 25 Years | 15 (16.5%) | 76 (83.5%) |
| 25 to 34 Years | 36 (56.2%) | 28 (43.8%) |
| 35 to 44 Years | 0 (0.0%) | 19 (65.5%) |
| 45 to 54 Years | 61 (31.0%) | 185 (93.9%) |
| 55 to 64 Years | 3 (2.3%) | 125 (97.7%) |
| 65 to 74 Years | 88 (100.0%) | 52 (59.1%) |
| 75 Years and over | 162 (100.0%) | 115 (71.0%) |
| Total | 522 (52.6%) | 710 (71.5%) |
Disability Status by Sex by Age in Maurertown
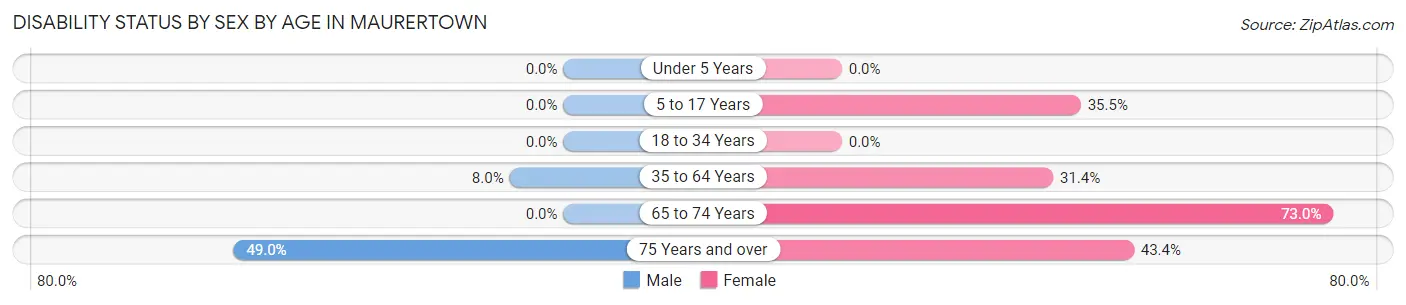
| Age Bracket | Male | Female |
| Under 5 Years | 0 (0.0%) | 0 (0.0%) |
| 5 to 17 Years | 0 (0.0%) | 22 (35.5%) |
| 18 to 34 Years | 0 (0.0%) | 0 (0.0%) |
| 35 to 64 Years | 12 (8.0%) | 64 (31.4%) |
| 65 to 74 Years | 0 (0.0%) | 27 (73.0%) |
| 75 Years and over | 24 (49.0%) | 49 (43.4%) |
Disability Class by Sex by Age in Maurertown
Disability Class: Hearing Difficulty
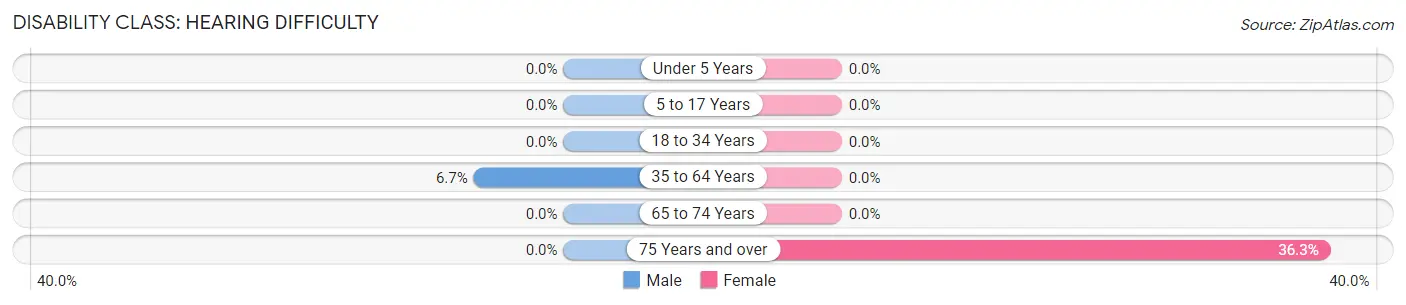
| Age Bracket | Male | Female |
| Under 5 Years | 0 (0.0%) | 0 (0.0%) |
| 5 to 17 Years | 0 (0.0%) | 0 (0.0%) |
| 18 to 34 Years | 0 (0.0%) | 0 (0.0%) |
| 35 to 64 Years | 10 (6.7%) | 0 (0.0%) |
| 65 to 74 Years | 0 (0.0%) | 0 (0.0%) |
| 75 Years and over | 0 (0.0%) | 41 (36.3%) |
Disability Class: Vision Difficulty
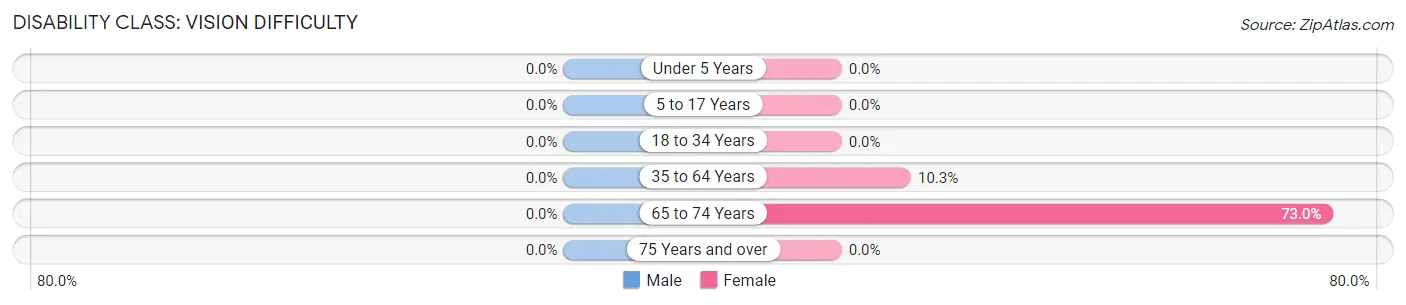
| Age Bracket | Male | Female |
| Under 5 Years | 0 (0.0%) | 0 (0.0%) |
| 5 to 17 Years | 0 (0.0%) | 0 (0.0%) |
| 18 to 34 Years | 0 (0.0%) | 0 (0.0%) |
| 35 to 64 Years | 0 (0.0%) | 21 (10.3%) |
| 65 to 74 Years | 0 (0.0%) | 27 (73.0%) |
| 75 Years and over | 0 (0.0%) | 0 (0.0%) |
Disability Class: Cognitive Difficulty
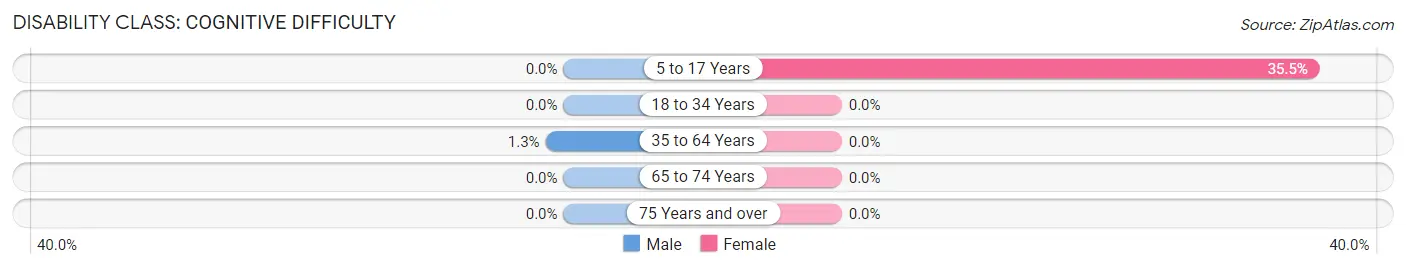
| Age Bracket | Male | Female |
| 5 to 17 Years | 0 (0.0%) | 22 (35.5%) |
| 18 to 34 Years | 0 (0.0%) | 0 (0.0%) |
| 35 to 64 Years | 2 (1.3%) | 0 (0.0%) |
| 65 to 74 Years | 0 (0.0%) | 0 (0.0%) |
| 75 Years and over | 0 (0.0%) | 0 (0.0%) |
Disability Class: Ambulatory Difficulty
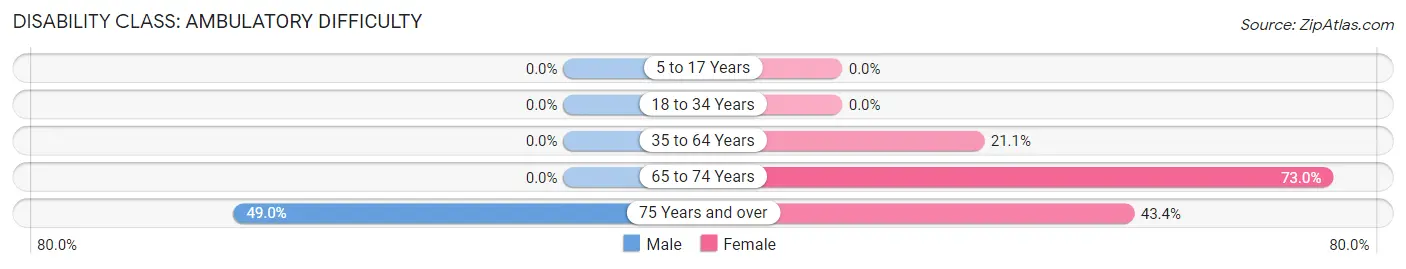
| Age Bracket | Male | Female |
| 5 to 17 Years | 0 (0.0%) | 0 (0.0%) |
| 18 to 34 Years | 0 (0.0%) | 0 (0.0%) |
| 35 to 64 Years | 0 (0.0%) | 43 (21.1%) |
| 65 to 74 Years | 0 (0.0%) | 27 (73.0%) |
| 75 Years and over | 24 (49.0%) | 49 (43.4%) |
Disability Class: Self-Care Difficulty
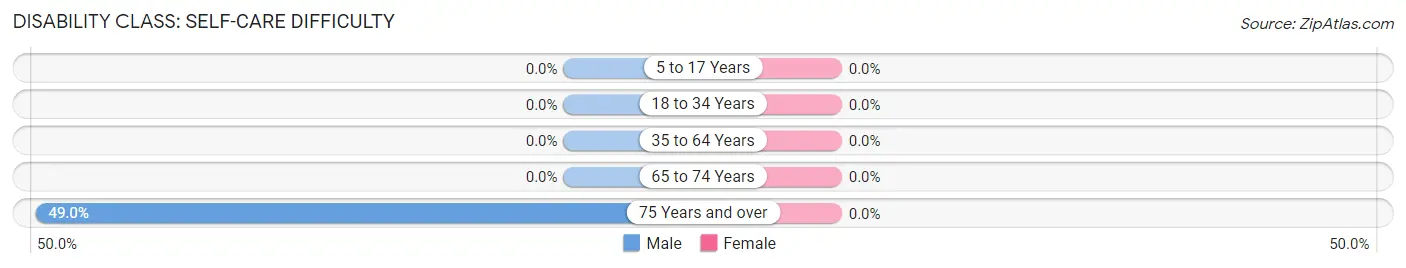
| Age Bracket | Male | Female |
| 5 to 17 Years | 0 (0.0%) | 0 (0.0%) |
| 18 to 34 Years | 0 (0.0%) | 0 (0.0%) |
| 35 to 64 Years | 0 (0.0%) | 0 (0.0%) |
| 65 to 74 Years | 0 (0.0%) | 0 (0.0%) |
| 75 Years and over | 24 (49.0%) | 0 (0.0%) |
Technology Access in Maurertown
Computing Device Access in Maurertown
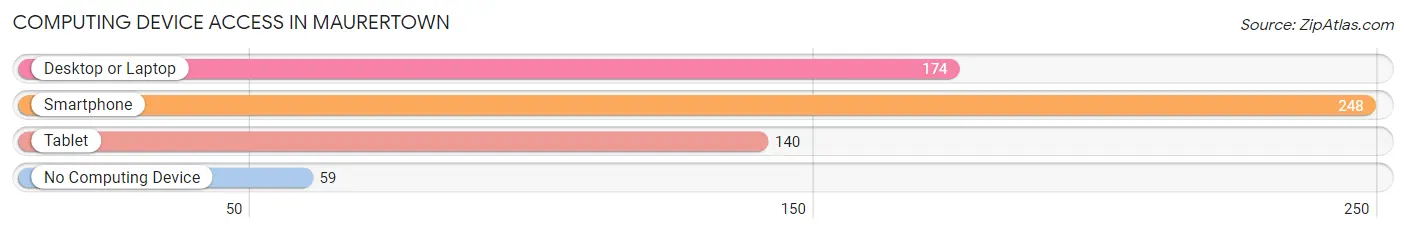
| Device Type | # Households | % Households |
| Desktop or Laptop | 174 | 53.7% |
| Smartphone | 248 | 76.5% |
| Tablet | 140 | 43.2% |
| No Computing Device | 59 | 18.2% |
| Total | 324 | 100.0% |
Internet Access in Maurertown
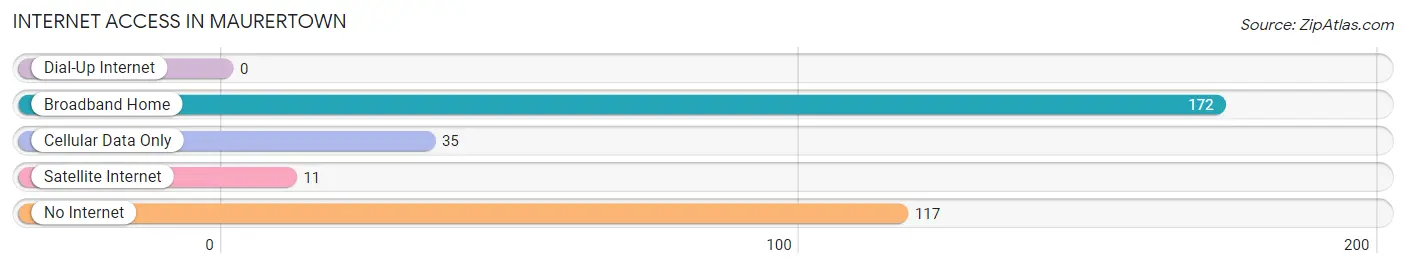
| Internet Type | # Households | % Households |
| Dial-Up Internet | 0 | 0.0% |
| Broadband Home | 172 | 53.1% |
| Cellular Data Only | 35 | 10.8% |
| Satellite Internet | 11 | 3.4% |
| No Internet | 117 | 36.1% |
| Total | 324 | 100.0% |
Maurertown Summary
Maurertown is a small unincorporated community located in Shenandoah County, Virginia. It is situated in the northern part of the county, near the border with West Virginia. The community is located along the banks of the North Fork of the Shenandoah River, and is home to a population of approximately 500 people.
History
Maurertown was first settled in the late 1700s by German immigrants, who named the community after their family name. The town was officially established in 1820, and was incorporated in 1836. The town was named after the Maurer family, who were among the first settlers in the area.
The town was an important stop on the Winchester and Potomac Railroad, which ran through the area in the mid-1800s. The railroad was a major factor in the growth of the town, as it provided a convenient way for people to travel to and from the area.
The town was also home to a number of businesses, including a flour mill, a sawmill, a blacksmith shop, and a general store. The town also had a post office, which was established in 1837.
Geography
Maurertown is located in the northern part of Shenandoah County, Virginia. It is situated along the banks of the North Fork of the Shenandoah River, and is approximately 10 miles south of the West Virginia border. The town is located in the Appalachian Mountains, and is surrounded by rolling hills and forests.
The town is located at an elevation of 1,400 feet, and has a total area of 0.6 square miles. The climate in the area is temperate, with hot summers and cold winters.
Economy
The economy of Maurertown is largely based on agriculture and tourism. The town is home to a number of farms, which produce a variety of crops, including corn, soybeans, wheat, and hay. The town is also home to a number of tourist attractions, including the Shenandoah National Park, the George Washington National Forest, and the Appalachian Trail.
The town is also home to a number of small businesses, including restaurants, shops, and a gas station. The town is also home to a number of bed and breakfasts, which cater to tourists visiting the area.
Demographics
As of the 2010 census, the population of Maurertown was 498. The racial makeup of the town was 97.2% White, 0.6% African American, 0.2% Native American, 0.2% Asian, 0.2% from other races, and 1.8% from two or more races. Hispanic or Latino of any race were 1.2% of the population.
The median household income in Maurertown was $41,250, and the median family income was $45,625. The per capita income for the town was $19,845. About 8.3% of families and 10.2% of the population were below the poverty line, including 14.3% of those under age 18 and 8.3% of those age 65 or over.
Common Questions
What is Per Capita Income in Maurertown?
Per Capita income in Maurertown is $27,812.
What is the Median Family Income in Maurertown?
Median Family Income in Maurertown is $80,536.
What is the Median Household income in Maurertown?
Median Household Income in Maurertown is $79,318.
What is Inequality or Gini Index in Maurertown?
Inequality or Gini Index in Maurertown is 0.37.
What is the Total Population of Maurertown?
Total Population of Maurertown is 1,019.
What is the Total Male Population of Maurertown?
Total Male Population of Maurertown is 420.
What is the Total Female Population of Maurertown?
Total Female Population of Maurertown is 599.
What is the Ratio of Males per 100 Females in Maurertown?
There are 70.12 Males per 100 Females in Maurertown.
What is the Ratio of Females per 100 Males in Maurertown?
There are 142.62 Females per 100 Males in Maurertown.
What is the Median Population Age in Maurertown?
Median Population Age in Maurertown is 52.5 Years.
What is the Average Family Size in Maurertown
Average Family Size in Maurertown is 3.6 People.
What is the Average Household Size in Maurertown
Average Household Size in Maurertown is 3.0 People.
How Large is the Labor Force in Maurertown?
There are 482 People in the Labor Forcein in Maurertown.
What is the Percentage of People in the Labor Force in Maurertown?
58.1% of People are in the Labor Force in Maurertown.
What is the Unemployment Rate in Maurertown?
Unemployment Rate in Maurertown is 2.5%.