Augusta Springs, VA Map & Demographics
Augusta Springs Map
Augusta Springs Overview
$27,132
PER CAPITA INCOME
$78,333
AVG HOUSEHOLD INCOME
0.31
INEQUALITY / GINI INDEX
124
TOTAL POPULATION
54
MALE POPULATION
70
FEMALE POPULATION
77.14
MALES / 100 FEMALES
129.63
FEMALES / 100 MALES
22.9
MEDIAN AGE
2.9
AVG FAMILY SIZE
2.8
AVG HOUSEHOLD SIZE
79
LABOR FORCE [ PEOPLE ]
91.9%
PERCENT IN LABOR FORCE
Augusta Springs Zip Codes
Augusta Springs Area Codes
Income in Augusta Springs
Income Overview in Augusta Springs
| Characteristic | Number | Measure |
| Per Capita Income | 124 | $27,132 |
| Median Family Income | 32 | $0 |
| Mean Family Income | 32 | $67,619 |
| Median Household Income | 44 | $78,333 |
| Mean Household Income | 44 | $70,239 |
| Income Deficit | 32 | $0 |
| Wage / Income Gap (%) | 124 | 0.00% |
| Wage / Income Gap ($) | 124 | 100.00¢ per $1 |
| Gini / Inequality Index | 124 | 0.31 |
Earnings by Sex in Augusta Springs
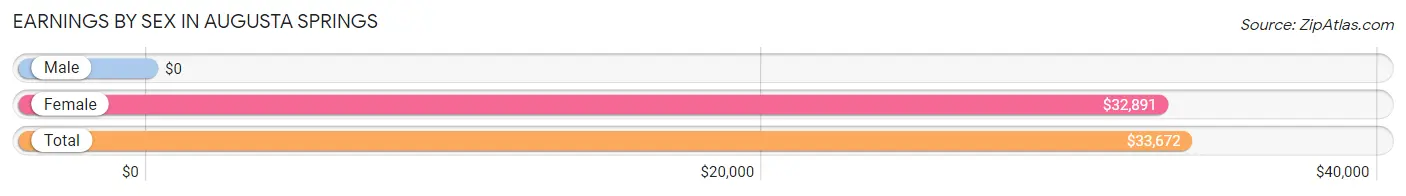
| Sex | Number | Average Earnings |
| Male | 34 (43.0%) | $0 |
| Female | 45 (57.0%) | $32,891 |
| Total | 79 (100.0%) | $33,672 |
Earnings by Sex by Income Bracket in Augusta Springs
The most common earnings brackets in Augusta Springs are $35,000 to $39,999 for men (15 | 44.1%) and $30,000 to $34,999 for women (25 | 55.6%).
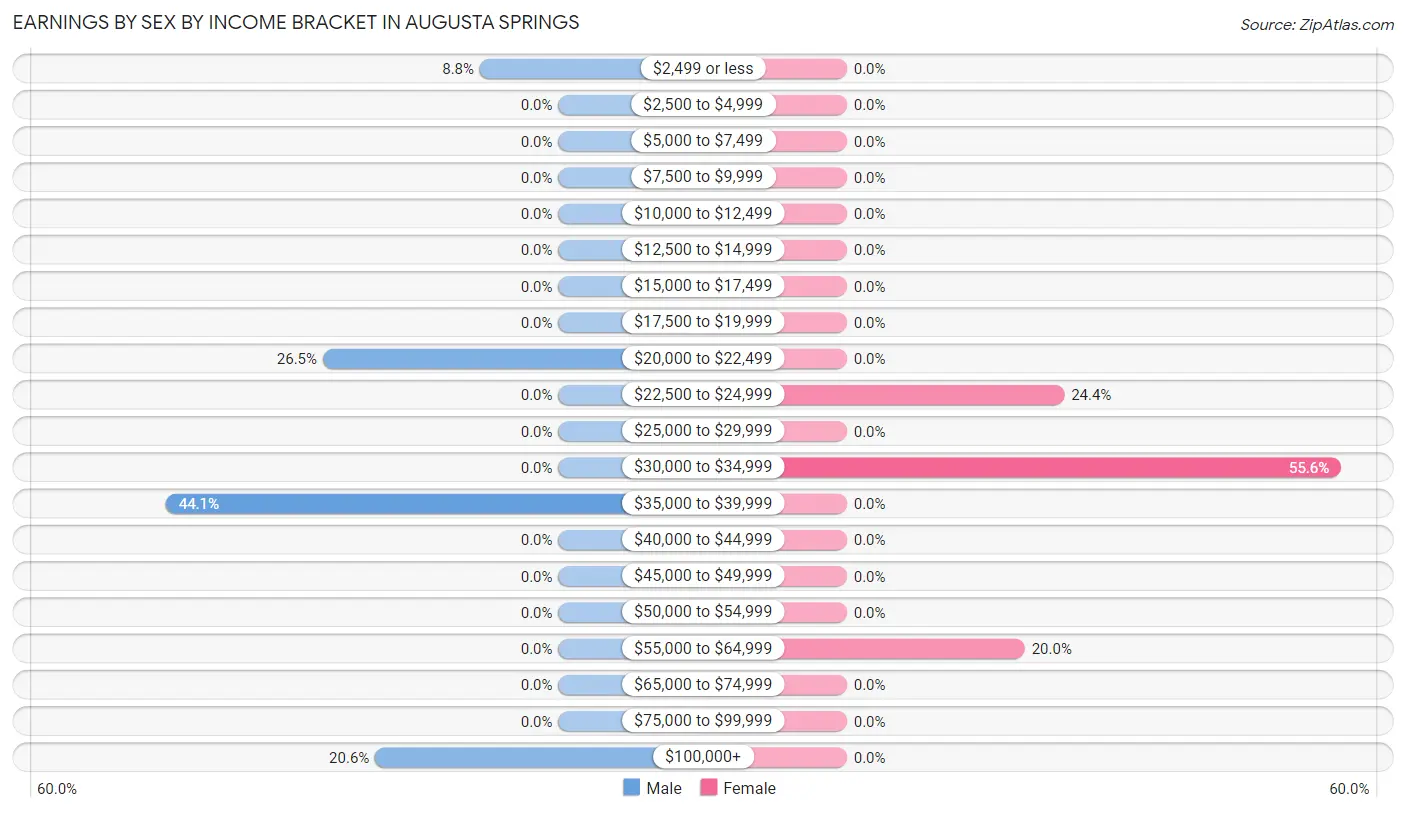
| Income | Male | Female |
| $2,499 or less | 3 (8.8%) | 0 (0.0%) |
| $2,500 to $4,999 | 0 (0.0%) | 0 (0.0%) |
| $5,000 to $7,499 | 0 (0.0%) | 0 (0.0%) |
| $7,500 to $9,999 | 0 (0.0%) | 0 (0.0%) |
| $10,000 to $12,499 | 0 (0.0%) | 0 (0.0%) |
| $12,500 to $14,999 | 0 (0.0%) | 0 (0.0%) |
| $15,000 to $17,499 | 0 (0.0%) | 0 (0.0%) |
| $17,500 to $19,999 | 0 (0.0%) | 0 (0.0%) |
| $20,000 to $22,499 | 9 (26.5%) | 0 (0.0%) |
| $22,500 to $24,999 | 0 (0.0%) | 11 (24.4%) |
| $25,000 to $29,999 | 0 (0.0%) | 0 (0.0%) |
| $30,000 to $34,999 | 0 (0.0%) | 25 (55.6%) |
| $35,000 to $39,999 | 15 (44.1%) | 0 (0.0%) |
| $40,000 to $44,999 | 0 (0.0%) | 0 (0.0%) |
| $45,000 to $49,999 | 0 (0.0%) | 0 (0.0%) |
| $50,000 to $54,999 | 0 (0.0%) | 0 (0.0%) |
| $55,000 to $64,999 | 0 (0.0%) | 9 (20.0%) |
| $65,000 to $74,999 | 0 (0.0%) | 0 (0.0%) |
| $75,000 to $99,999 | 0 (0.0%) | 0 (0.0%) |
| $100,000+ | 7 (20.6%) | 0 (0.0%) |
| Total | 34 (100.0%) | 45 (100.0%) |
Earnings by Sex by Educational Attainment in Augusta Springs
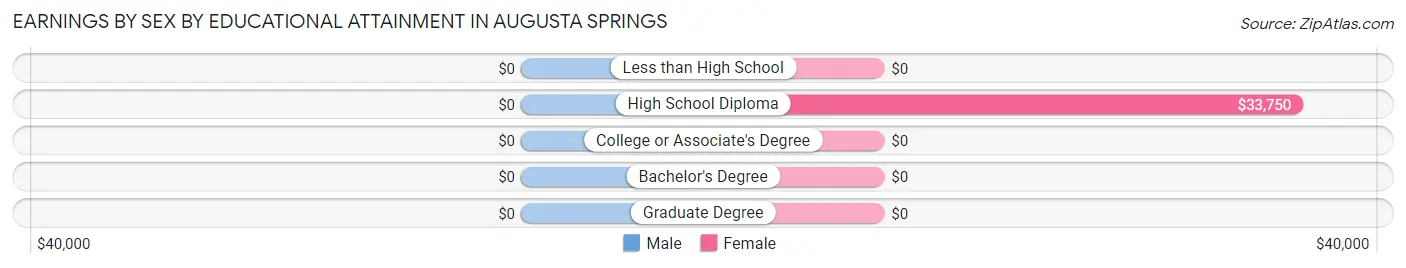
| Educational Attainment | Male Income | Female Income |
| Less than High School | - | - |
| High School Diploma | - | - |
| College or Associate's Degree | - | - |
| Bachelor's Degree | - | - |
| Graduate Degree | - | - |
| Total | - | - |
Family Income in Augusta Springs
Family Income Brackets in Augusta Springs
According to the Augusta Springs family income data, there are 16 families falling into the $25,000 to $34,999 income range, which is the most common income bracket and makes up 50.0% of all families.
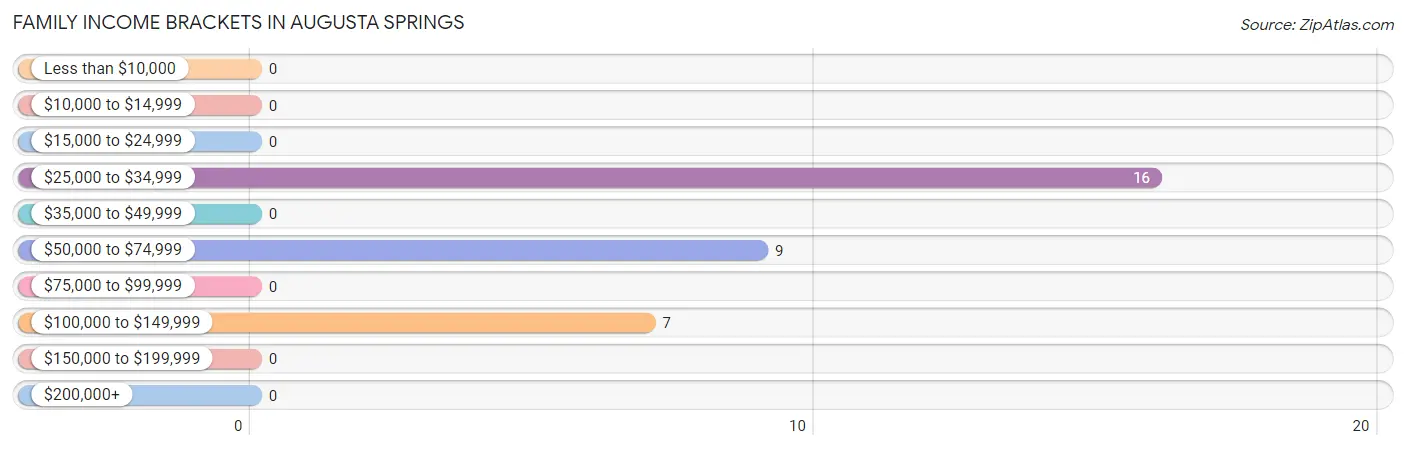
| Income Bracket | # Families | % Families |
| Less than $10,000 | 0 | 0.0% |
| $10,000 to $14,999 | 0 | 0.0% |
| $15,000 to $24,999 | 0 | 0.0% |
| $25,000 to $34,999 | 16 | 50.0% |
| $35,000 to $49,999 | 0 | 0.0% |
| $50,000 to $74,999 | 9 | 28.1% |
| $75,000 to $99,999 | 0 | 0.0% |
| $100,000 to $149,999 | 7 | 21.9% |
| $150,000 to $199,999 | 0 | 0.0% |
| $200,000+ | 0 | 0.0% |
Family Income by Famaliy Size in Augusta Springs
| Income Bracket | # Families | Median Income |
| 2-Person Families | 16 (50.0%) | $0 |
| 3-Person Families | 16 (50.0%) | $0 |
| 4-Person Families | 0 (0.0%) | $0 |
| 5-Person Families | 0 (0.0%) | $0 |
| 6-Person Families | 0 (0.0%) | $0 |
| 7+ Person Families | 0 (0.0%) | $0 |
| Total | 32 (100.0%) | $0 |
Family Income by Number of Earners in Augusta Springs
| Number of Earners | # Families | Median Income |
| No Earners | 0 (0.0%) | $0 |
| 1 Earner | 23 (71.9%) | $0 |
| 2 Earners | 9 (28.1%) | $0 |
| 3+ Earners | 0 (0.0%) | $0 |
| Total | 32 (100.0%) | $0 |
Household Income in Augusta Springs
Household Income Brackets in Augusta Springs
With 18 households falling in the category, the $75,000 to $99,999 income range is the most frequent in Augusta Springs, accounting for 40.9% of all households.
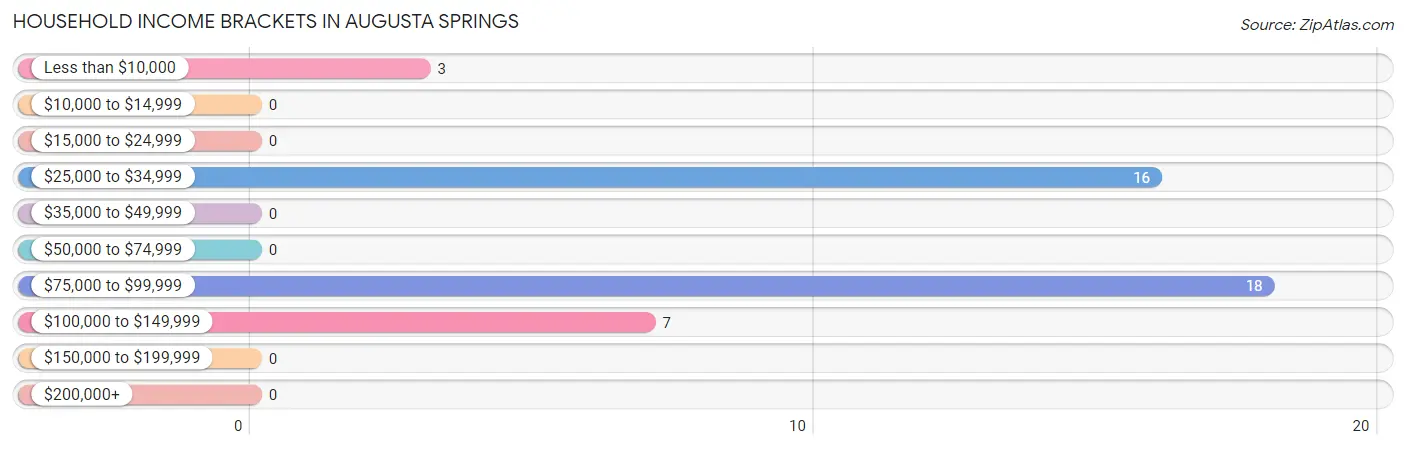
| Income Bracket | # Households | % Households |
| Less than $10,000 | 3 | 6.8% |
| $10,000 to $14,999 | 0 | 0.0% |
| $15,000 to $24,999 | 0 | 0.0% |
| $25,000 to $34,999 | 16 | 36.4% |
| $35,000 to $49,999 | 0 | 0.0% |
| $50,000 to $74,999 | 0 | 0.0% |
| $75,000 to $99,999 | 18 | 40.9% |
| $100,000 to $149,999 | 7 | 15.9% |
| $150,000 to $199,999 | 0 | 0.0% |
| $200,000+ | 0 | 0.0% |
Household Income by Householder Age in Augusta Springs
The median household income in Augusta Springs is $78,333, with the highest median household income of $95,556 found in the 45 to 64 years age bracket for the primary householder. A total of 28 households (63.6%) fall into this category.
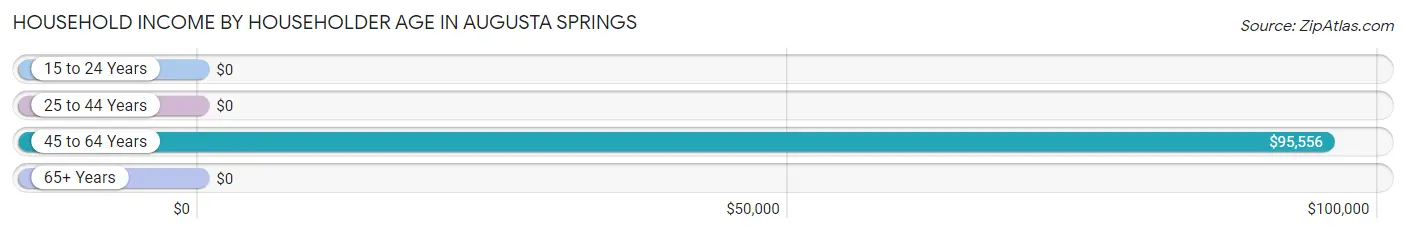
| Income Bracket | # Households | Median Income |
| 15 to 24 Years | 0 (0.0%) | $0 |
| 25 to 44 Years | 16 (36.4%) | $0 |
| 45 to 64 Years | 28 (63.6%) | $95,556 |
| 65+ Years | 0 (0.0%) | $0 |
| Total | 44 (100.0%) | $78,333 |
Poverty in Augusta Springs
Income Below Poverty by Sex and Age in Augusta Springs
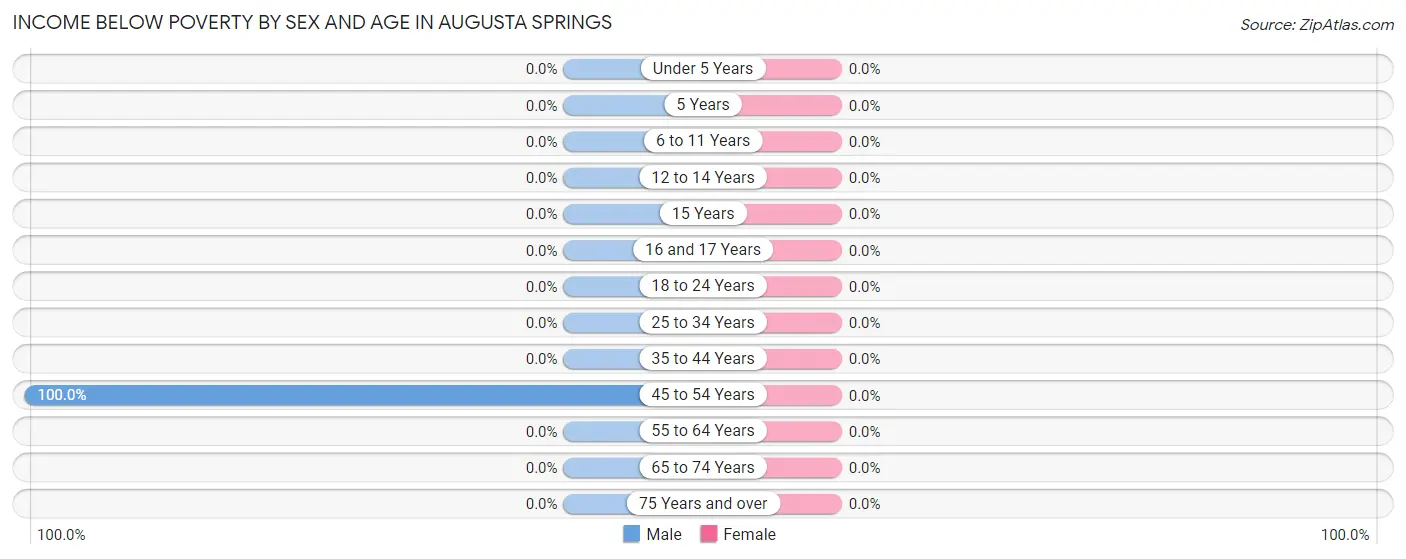
| Age Bracket | Male | Female |
| Under 5 Years | 0 (0.0%) | 0 (0.0%) |
| 5 Years | 0 (0.0%) | 0 (0.0%) |
| 6 to 11 Years | 0 (0.0%) | 0 (0.0%) |
| 12 to 14 Years | 0 (0.0%) | 0 (0.0%) |
| 15 Years | 0 (0.0%) | 0 (0.0%) |
| 16 and 17 Years | 0 (0.0%) | 0 (0.0%) |
| 18 to 24 Years | 0 (0.0%) | 0 (0.0%) |
| 25 to 34 Years | 0 (0.0%) | 0 (0.0%) |
| 35 to 44 Years | 0 (0.0%) | 0 (0.0%) |
| 45 to 54 Years | 3 (100.0%) | 0 (0.0%) |
| 55 to 64 Years | 0 (0.0%) | 0 (0.0%) |
| 65 to 74 Years | 0 (0.0%) | 0 (0.0%) |
| 75 Years and over | 0 (0.0%) | 0 (0.0%) |
| Total | 3 (5.6%) | 0 (0.0%) |
Income Above Poverty by Sex and Age in Augusta Springs
According to the poverty statistics in Augusta Springs, males aged 12 to 14 years and females aged 6 to 11 years are the age groups that are most secure financially, with 100.0% of males and 100.0% of females in these age groups living above the poverty line.
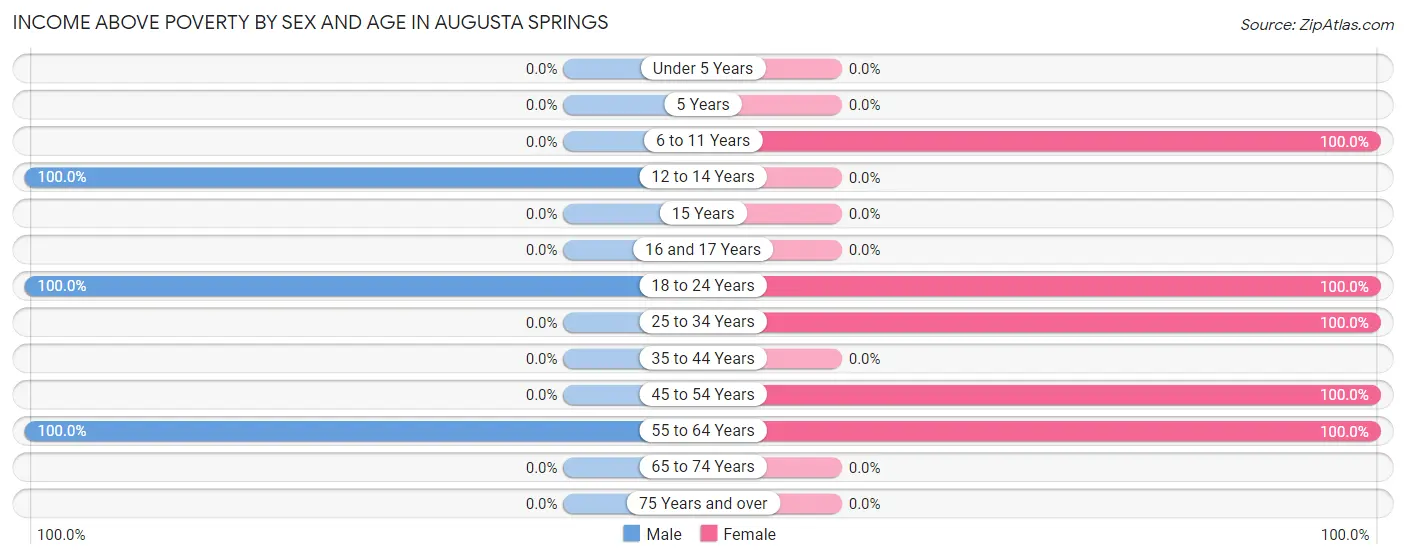
| Age Bracket | Male | Female |
| Under 5 Years | 0 (0.0%) | 0 (0.0%) |
| 5 Years | 0 (0.0%) | 0 (0.0%) |
| 6 to 11 Years | 0 (0.0%) | 18 (100.0%) |
| 12 to 14 Years | 20 (100.0%) | 0 (0.0%) |
| 15 Years | 0 (0.0%) | 0 (0.0%) |
| 16 and 17 Years | 0 (0.0%) | 0 (0.0%) |
| 18 to 24 Years | 15 (100.0%) | 11 (100.0%) |
| 25 to 34 Years | 0 (0.0%) | 16 (100.0%) |
| 35 to 44 Years | 0 (0.0%) | 0 (0.0%) |
| 45 to 54 Years | 0 (0.0%) | 16 (100.0%) |
| 55 to 64 Years | 16 (100.0%) | 9 (100.0%) |
| 65 to 74 Years | 0 (0.0%) | 0 (0.0%) |
| 75 Years and over | 0 (0.0%) | 0 (0.0%) |
| Total | 51 (94.4%) | 70 (100.0%) |
Income Below Poverty Among Married-Couple Families in Augusta Springs
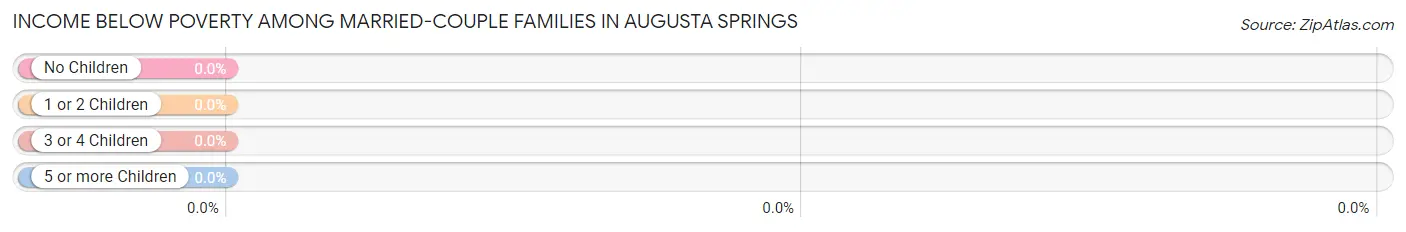
| Children | Above Poverty | Below Poverty |
| No Children | 7 (100.0%) | 0 (0.0%) |
| 1 or 2 Children | 0 (0.0%) | 0 (0.0%) |
| 3 or 4 Children | 0 (0.0%) | 0 (0.0%) |
| 5 or more Children | 0 (0.0%) | 0 (0.0%) |
| Total | 7 (100.0%) | 0 (0.0%) |
Income Below Poverty Among Single-Parent Households in Augusta Springs
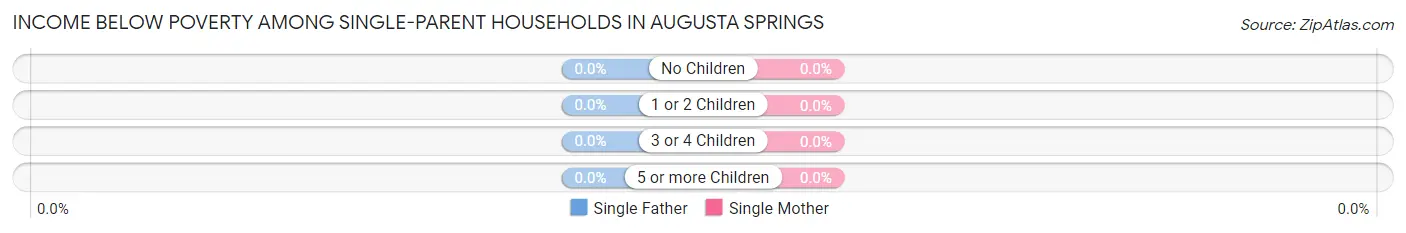
| Children | Single Father | Single Mother |
| No Children | 0 (0.0%) | 0 (0.0%) |
| 1 or 2 Children | 0 (0.0%) | 0 (0.0%) |
| 3 or 4 Children | 0 (0.0%) | 0 (0.0%) |
| 5 or more Children | 0 (0.0%) | 0 (0.0%) |
| Total | 0 (0.0%) | 0 (0.0%) |
Income Below Poverty Among Married-Couple vs Single-Parent Households in Augusta Springs
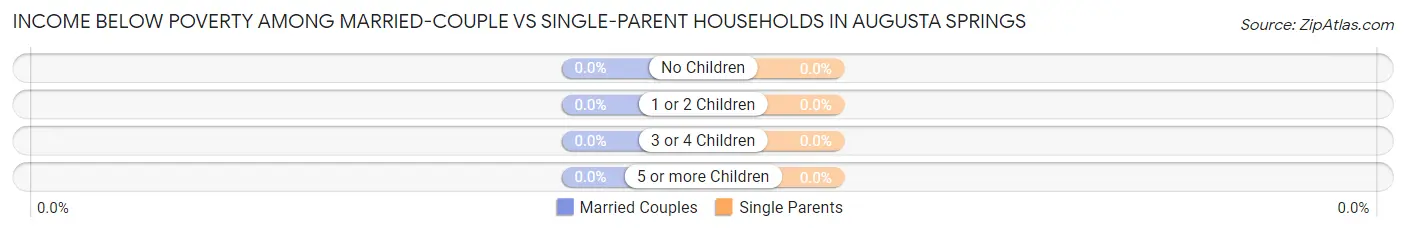
| Children | Married-Couple Families | Single-Parent Households |
| No Children | 0 (0.0%) | 0 (0.0%) |
| 1 or 2 Children | 0 (0.0%) | 0 (0.0%) |
| 3 or 4 Children | 0 (0.0%) | 0 (0.0%) |
| 5 or more Children | 0 (0.0%) | 0 (0.0%) |
| Total | 0 (0.0%) | 0 (0.0%) |
Race in Augusta Springs
The most populous races in Augusta Springs are White / Caucasian (121 | 97.6%), and Native / Alaskan (3 | 2.4%).
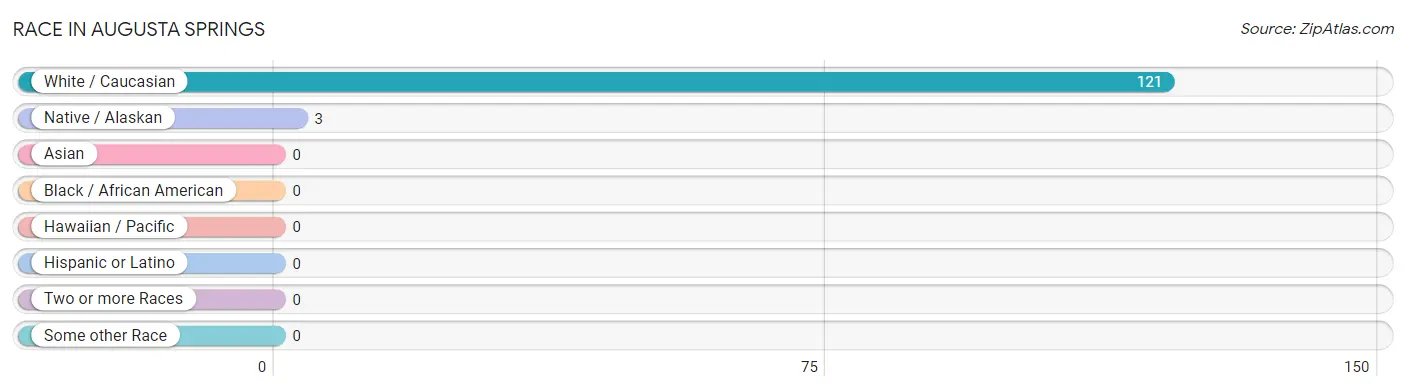
| Race | # Population | % Population |
| Asian | 0 | 0.0% |
| Black / African American | 0 | 0.0% |
| Hawaiian / Pacific | 0 | 0.0% |
| Hispanic or Latino | 0 | 0.0% |
| Native / Alaskan | 3 | 2.4% |
| White / Caucasian | 121 | 97.6% |
| Two or more Races | 0 | 0.0% |
| Some other Race | 0 | 0.0% |
| Total | 124 | 100.0% |
Ancestry in Augusta Springs
The most populous ancestries reported in Augusta Springs are American (53 | 42.7%), English (14 | 11.3%), German (7 | 5.7%), Irish (7 | 5.7%), and Cherokee (3 | 2.4%), together accounting for 67.7% of all Augusta Springs residents.
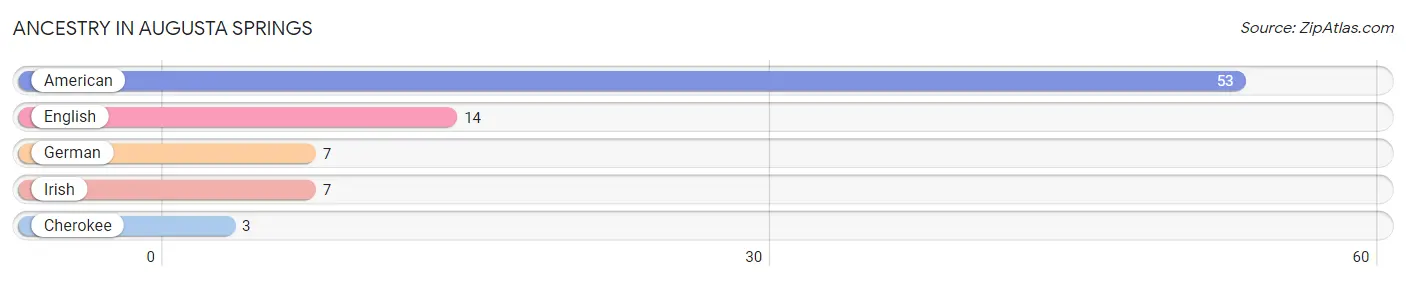
| Ancestry | # Population | % Population |
| American | 53 | 42.7% |
| Cherokee | 3 | 2.4% |
| English | 14 | 11.3% |
| German | 7 | 5.7% |
| Irish | 7 | 5.7% | View All 5 Rows |
Immigrants in Augusta Springs

| Immigration Origin | # Population | % Population | View All 0 Rows |
Sex and Age in Augusta Springs
Sex and Age in Augusta Springs
The most populous age groups in Augusta Springs are 10 to 14 Years (20 | 37.0%) for men and 5 to 9 Years (18 | 25.7%) for women.
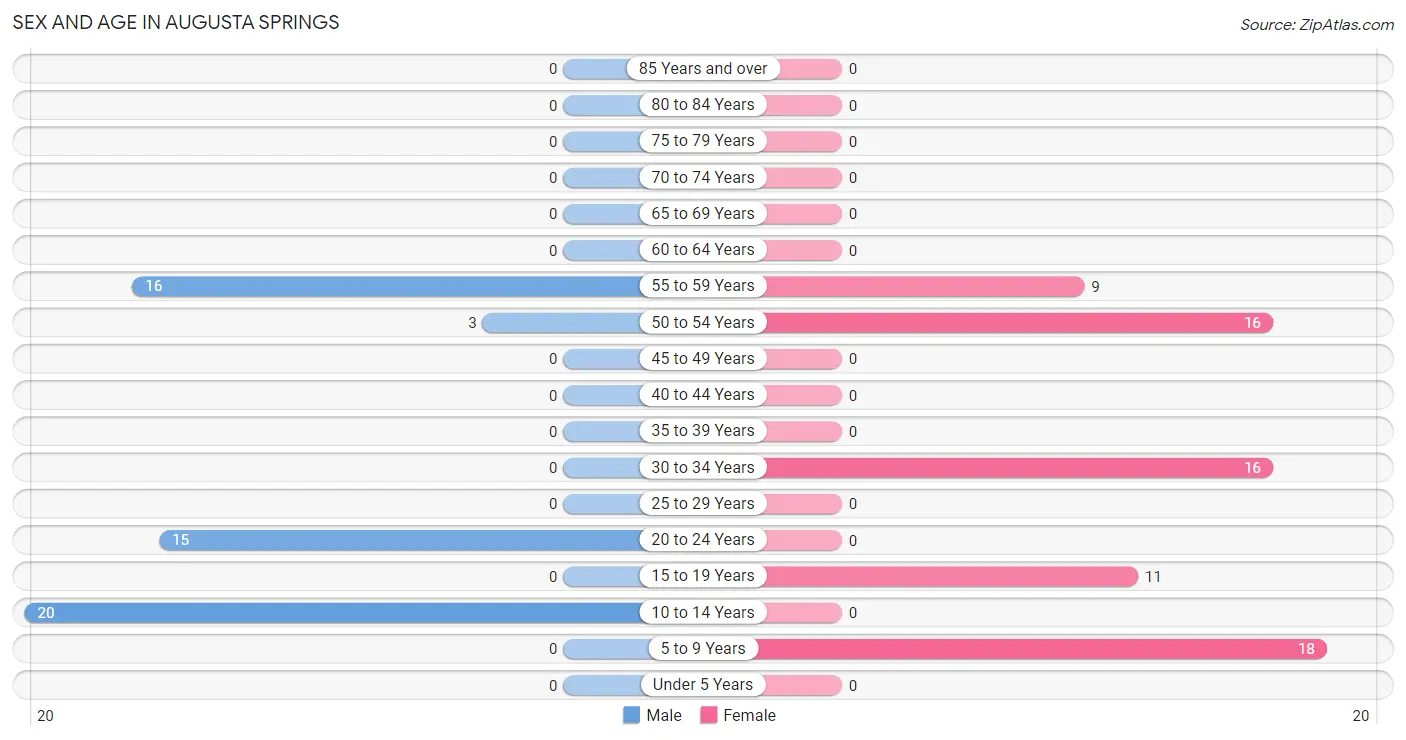
| Age Bracket | Male | Female |
| Under 5 Years | 0 (0.0%) | 0 (0.0%) |
| 5 to 9 Years | 0 (0.0%) | 18 (25.7%) |
| 10 to 14 Years | 20 (37.0%) | 0 (0.0%) |
| 15 to 19 Years | 0 (0.0%) | 11 (15.7%) |
| 20 to 24 Years | 15 (27.8%) | 0 (0.0%) |
| 25 to 29 Years | 0 (0.0%) | 0 (0.0%) |
| 30 to 34 Years | 0 (0.0%) | 16 (22.9%) |
| 35 to 39 Years | 0 (0.0%) | 0 (0.0%) |
| 40 to 44 Years | 0 (0.0%) | 0 (0.0%) |
| 45 to 49 Years | 0 (0.0%) | 0 (0.0%) |
| 50 to 54 Years | 3 (5.6%) | 16 (22.9%) |
| 55 to 59 Years | 16 (29.6%) | 9 (12.9%) |
| 60 to 64 Years | 0 (0.0%) | 0 (0.0%) |
| 65 to 69 Years | 0 (0.0%) | 0 (0.0%) |
| 70 to 74 Years | 0 (0.0%) | 0 (0.0%) |
| 75 to 79 Years | 0 (0.0%) | 0 (0.0%) |
| 80 to 84 Years | 0 (0.0%) | 0 (0.0%) |
| 85 Years and over | 0 (0.0%) | 0 (0.0%) |
| Total | 54 (100.0%) | 70 (100.0%) |
Families and Households in Augusta Springs
Median Family Size in Augusta Springs
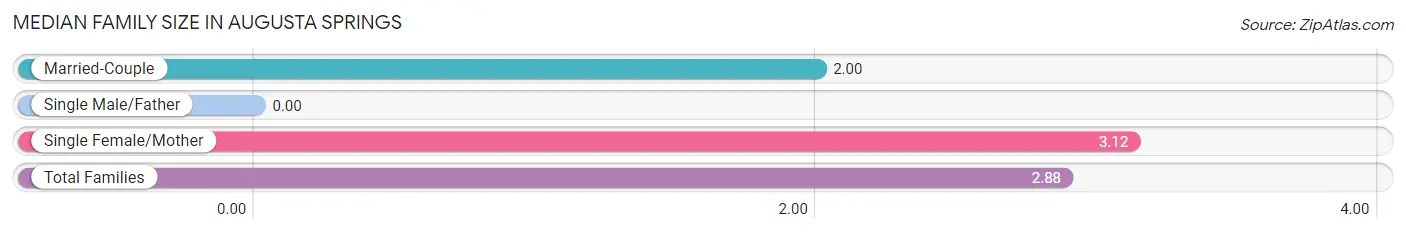
| Family Type | # Families | Family Size |
| Married-Couple | 7 (21.9%) | 2.00 |
| Single Male/Father | 0 (0.0%) | - |
| Single Female/Mother | 25 (78.1%) | 3.12 |
| Total Families | 32 (100.0%) | 2.88 |
Median Household Size in Augusta Springs
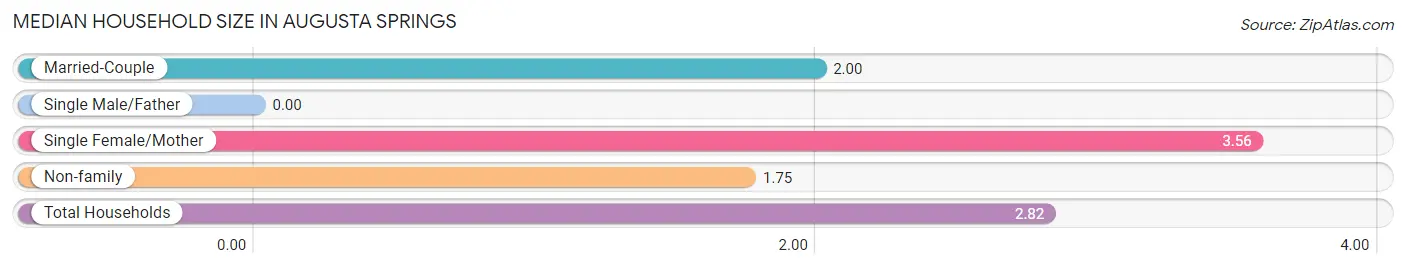
| Household Type | # Households | Household Size |
| Married-Couple | 7 (15.9%) | 2.00 |
| Single Male/Father | 0 (0.0%) | - |
| Single Female/Mother | 25 (56.8%) | 3.56 |
| Non-family | 12 (27.3%) | 1.75 |
| Total Households | 44 (100.0%) | 2.82 |
Household Size by Marriage Status in Augusta Springs
Out of a total of 44 households in Augusta Springs, 32 (72.7%) are family households, while 12 (27.3%) are nonfamily households. The most numerous type of family households are 3-person households, comprising 25, and the most common type of nonfamily households are 2-person households, comprising 9.
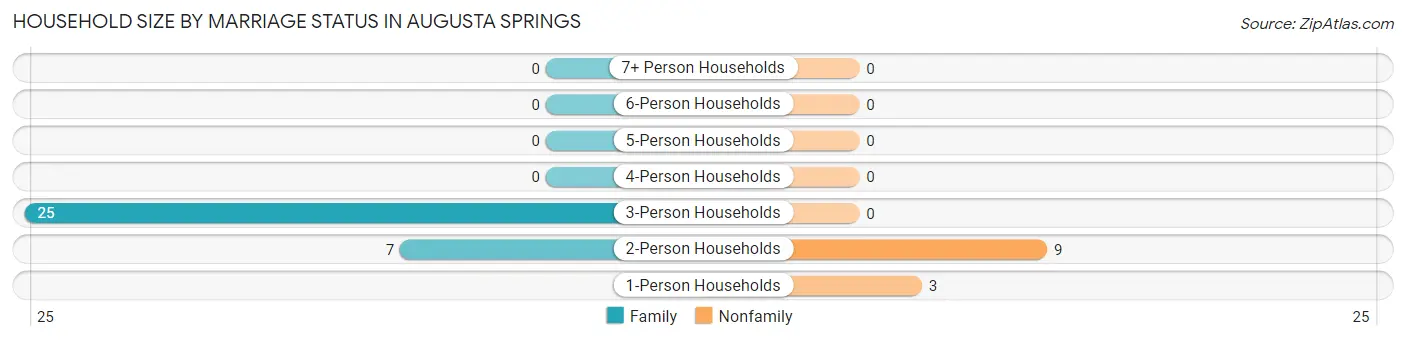
| Household Size | Family Households | Nonfamily Households |
| 1-Person Households | - | 3 (6.8%) |
| 2-Person Households | 7 (15.9%) | 9 (20.4%) |
| 3-Person Households | 25 (56.8%) | 0 (0.0%) |
| 4-Person Households | 0 (0.0%) | 0 (0.0%) |
| 5-Person Households | 0 (0.0%) | 0 (0.0%) |
| 6-Person Households | 0 (0.0%) | 0 (0.0%) |
| 7+ Person Households | 0 (0.0%) | 0 (0.0%) |
| Total | 32 (72.7%) | 12 (27.3%) |
Female Fertility in Augusta Springs
Fertility by Age in Augusta Springs
| Age Bracket | Women with Births | Births / 1,000 Women |
| 15 to 19 years | 0 (0.0%) | 0.0 |
| 20 to 34 years | 0 (0.0%) | 0.0 |
| 35 to 50 years | 0 (0.0%) | 0.0 |
| Total | 0 (0.0%) | 0.0 |
Fertility by Age by Marriage Status in Augusta Springs
| Age Bracket | Married | Unmarried |
| 15 to 19 years | 0 (0.0%) | 0 (0.0%) |
| 20 to 34 years | 0 (0.0%) | 0 (0.0%) |
| 35 to 50 years | 0 (0.0%) | 0 (0.0%) |
| Total | 0 (0.0%) | 0 (0.0%) |
Fertility by Education in Augusta Springs
| Educational Attainment | Women with Births | Births / 1,000 Women |
| Less than High School | 0 (0.0%) | 0.0 |
| High School Diploma | 0 (0.0%) | 0.0 |
| College or Associate's Degree | 0 (0.0%) | 0.0 |
| Bachelor's Degree | 0 (0.0%) | 0.0 |
| Graduate Degree | 0 (0.0%) | 0.0 |
| Total | 0 (0.0%) | 0.0 |
Fertility by Education by Marriage Status in Augusta Springs
| Educational Attainment | Married | Unmarried |
| Less than High School | 0 (0.0%) | 0 (0.0%) |
| High School Diploma | 0 (0.0%) | 0 (0.0%) |
| College or Associate's Degree | 0 (0.0%) | 0 (0.0%) |
| Bachelor's Degree | 0 (0.0%) | 0 (0.0%) |
| Graduate Degree | 0 (0.0%) | 0 (0.0%) |
| Total | 0 (0.0%) | 0 (0.0%) |
Employment Characteristics in Augusta Springs
Employment by Class of Employer in Augusta Springs
Among the 79 employed individuals in Augusta Springs, private company employees (42 | 53.2%), state government employees (18 | 22.8%), and local government employees (16 | 20.3%) make up the most common classes of employment.
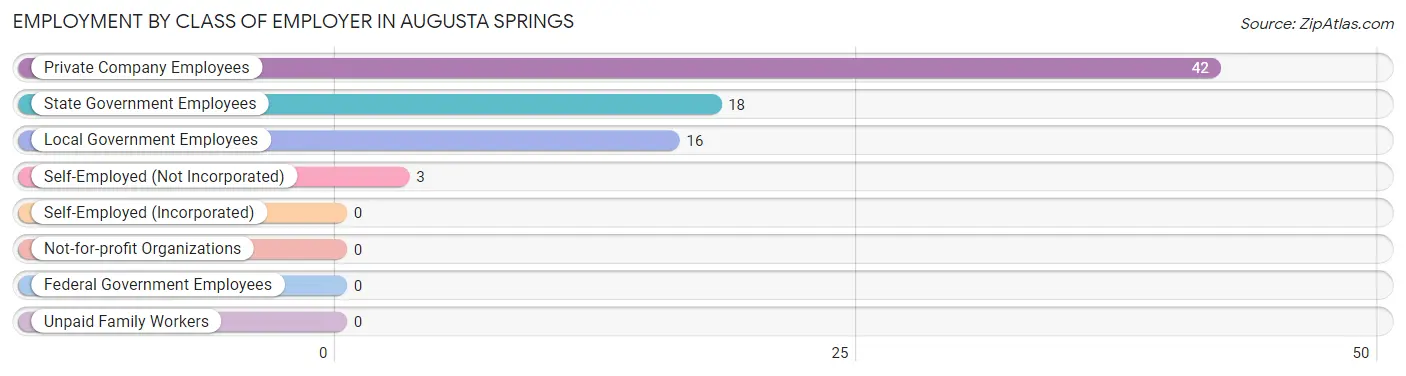
| Employer Class | # Employees | % Employees |
| Private Company Employees | 42 | 53.2% |
| Self-Employed (Incorporated) | 0 | 0.0% |
| Self-Employed (Not Incorporated) | 3 | 3.8% |
| Not-for-profit Organizations | 0 | 0.0% |
| Local Government Employees | 16 | 20.3% |
| State Government Employees | 18 | 22.8% |
| Federal Government Employees | 0 | 0.0% |
| Unpaid Family Workers | 0 | 0.0% |
| Total | 79 | 100.0% |
Employment Status by Age in Augusta Springs
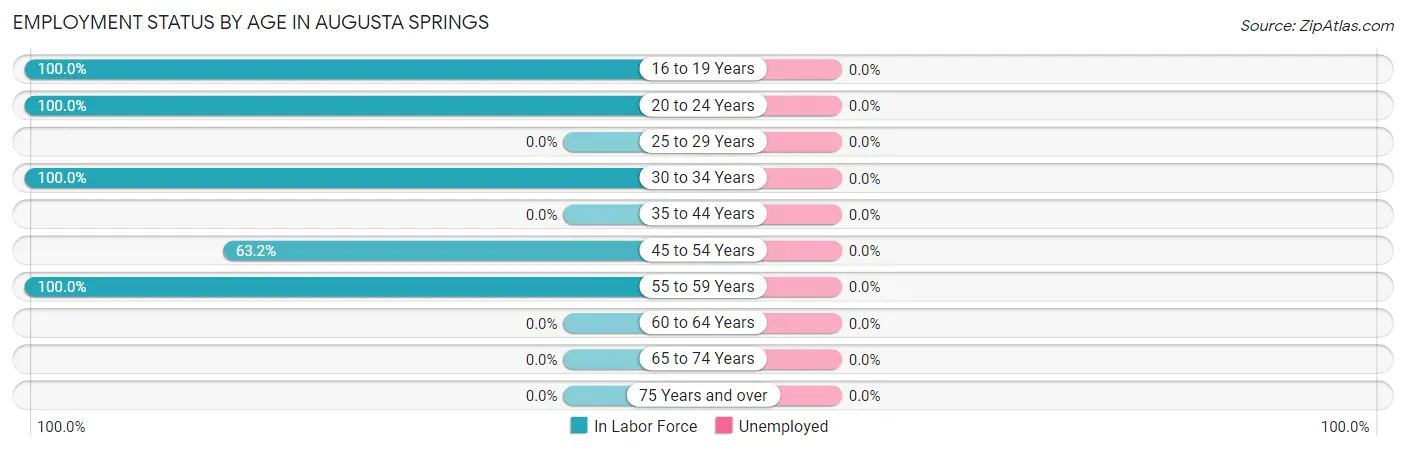
| Age Bracket | In Labor Force | Unemployed |
| 16 to 19 Years | 11 (100.0%) | 0 (0.0%) |
| 20 to 24 Years | 15 (100.0%) | 0 (0.0%) |
| 25 to 29 Years | 0 (0.0%) | 0 (0.0%) |
| 30 to 34 Years | 16 (100.0%) | 0 (0.0%) |
| 35 to 44 Years | 0 (0.0%) | 0 (0.0%) |
| 45 to 54 Years | 12 (63.2%) | 0 (0.0%) |
| 55 to 59 Years | 25 (100.0%) | 0 (0.0%) |
| 60 to 64 Years | 0 (0.0%) | 0 (0.0%) |
| 65 to 74 Years | 0 (0.0%) | 0 (0.0%) |
| 75 Years and over | 0 (0.0%) | 0 (0.0%) |
| Total | 79 (91.9%) | 0 (0.0%) |
Employment Status by Educational Attainment in Augusta Springs
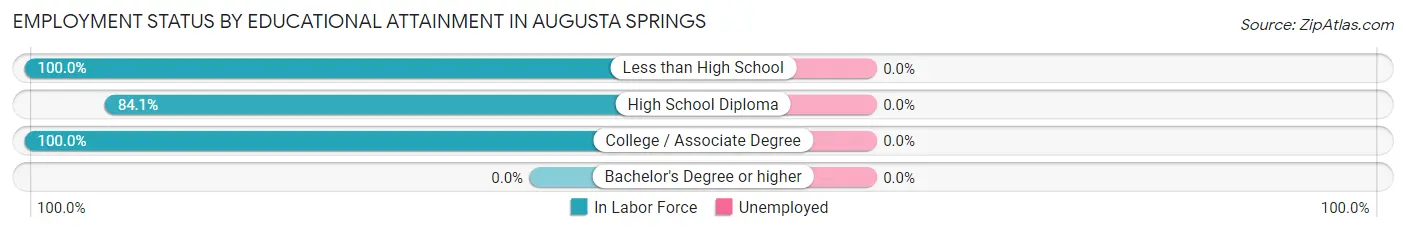
| Educational Attainment | In Labor Force | Unemployed |
| Less than High School | 9 (100.0%) | 0 (0.0%) |
| High School Diploma | 37 (84.1%) | 0 (0.0%) |
| College / Associate Degree | 7 (100.0%) | 0 (0.0%) |
| Bachelor's Degree or higher | 0 (0.0%) | 0 (0.0%) |
| Total | 53 (88.3%) | 0 (0.0%) |
Employment Occupations by Sex in Augusta Springs
Management, Business, Science and Arts Occupations
The most common Management, Business, Science and Arts occupations in Augusta Springs are , and Business & Financial (9 | 11.4%).
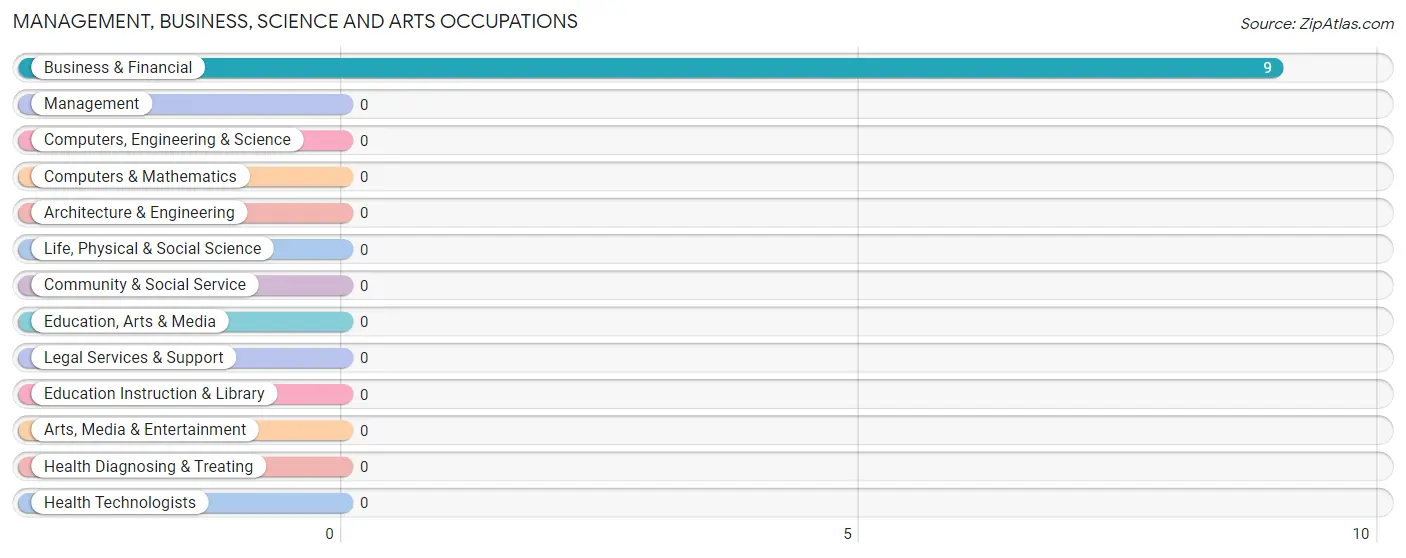
Management, Business, Science and Arts Occupations by Sex
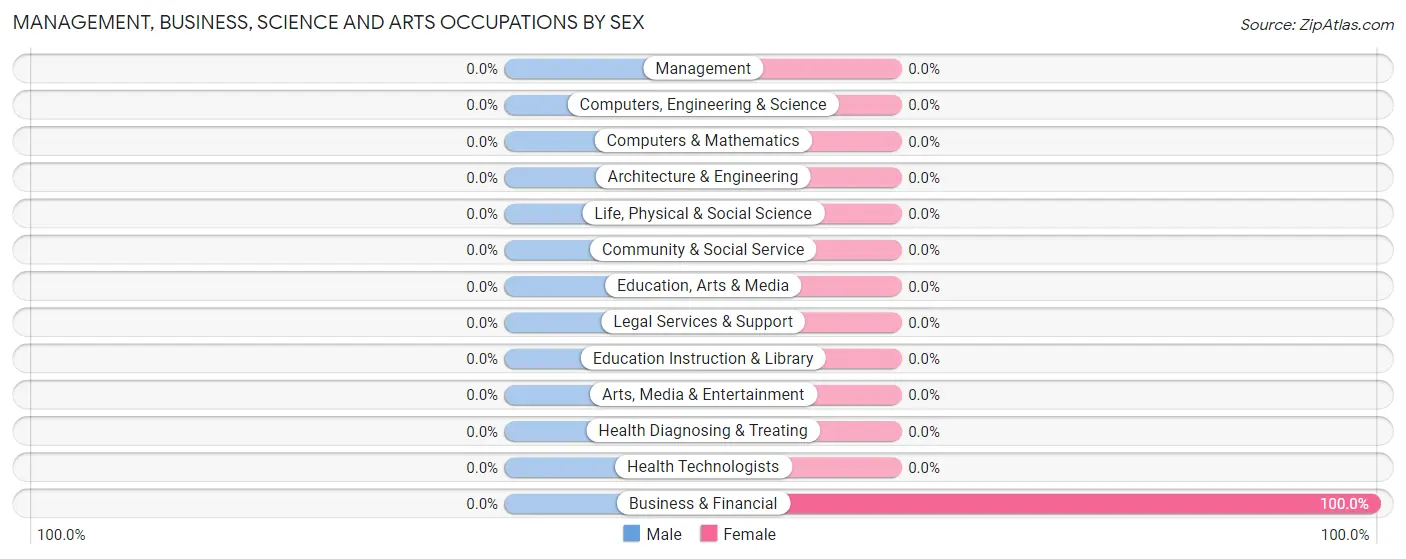
| Occupation | Male | Female |
| Management | 0 (0.0%) | 0 (0.0%) |
| Business & Financial | 0 (0.0%) | 9 (100.0%) |
| Computers, Engineering & Science | 0 (0.0%) | 0 (0.0%) |
| Computers & Mathematics | 0 (0.0%) | 0 (0.0%) |
| Architecture & Engineering | 0 (0.0%) | 0 (0.0%) |
| Life, Physical & Social Science | 0 (0.0%) | 0 (0.0%) |
| Community & Social Service | 0 (0.0%) | 0 (0.0%) |
| Education, Arts & Media | 0 (0.0%) | 0 (0.0%) |
| Legal Services & Support | 0 (0.0%) | 0 (0.0%) |
| Education Instruction & Library | 0 (0.0%) | 0 (0.0%) |
| Arts, Media & Entertainment | 0 (0.0%) | 0 (0.0%) |
| Health Diagnosing & Treating | 0 (0.0%) | 0 (0.0%) |
| Health Technologists | 0 (0.0%) | 0 (0.0%) |
| Total (Category) | 0 (0.0%) | 9 (100.0%) |
| Total (Overall) | 34 (43.0%) | 45 (57.0%) |
Services Occupations
The most common Services occupations in Augusta Springs are Food Preparation & Serving (16 | 20.3%), and Cleaning & Maintenance (9 | 11.4%).
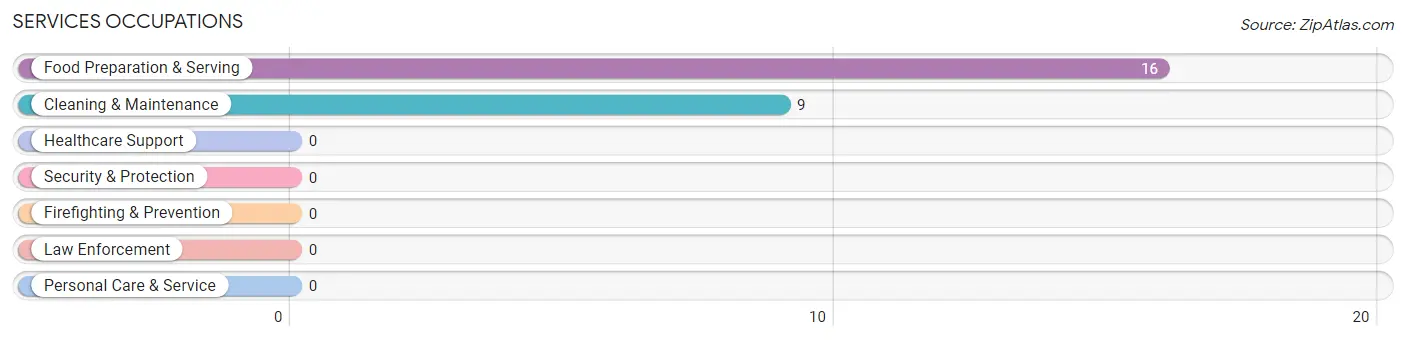
Services Occupations by Sex
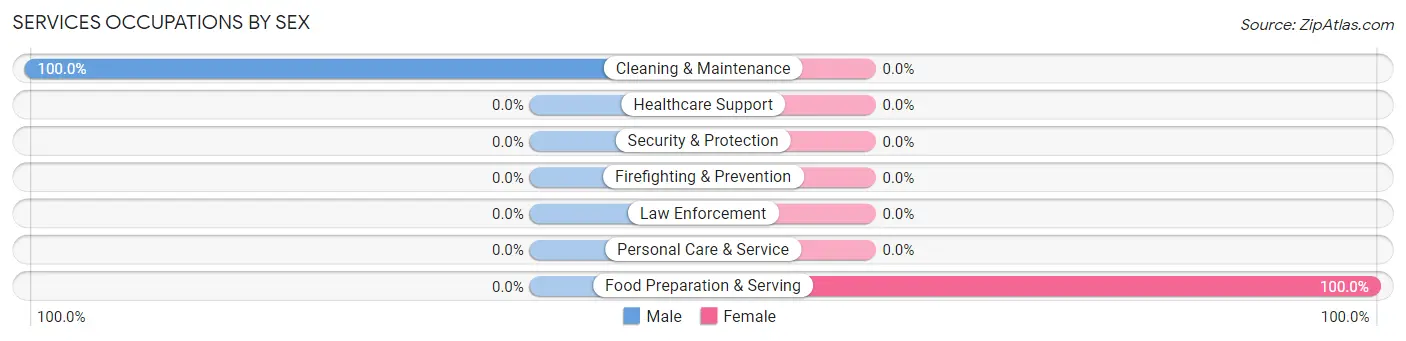
| Occupation | Male | Female |
| Healthcare Support | 0 (0.0%) | 0 (0.0%) |
| Security & Protection | 0 (0.0%) | 0 (0.0%) |
| Firefighting & Prevention | 0 (0.0%) | 0 (0.0%) |
| Law Enforcement | 0 (0.0%) | 0 (0.0%) |
| Food Preparation & Serving | 0 (0.0%) | 16 (100.0%) |
| Cleaning & Maintenance | 9 (100.0%) | 0 (0.0%) |
| Personal Care & Service | 0 (0.0%) | 0 (0.0%) |
| Total (Category) | 9 (36.0%) | 16 (64.0%) |
| Total (Overall) | 34 (43.0%) | 45 (57.0%) |
Sales and Office Occupations
The most common Sales and Office occupations in Augusta Springs are Office & Administration (24 | 30.4%), and Sales & Related (11 | 13.9%).

Sales and Office Occupations by Sex
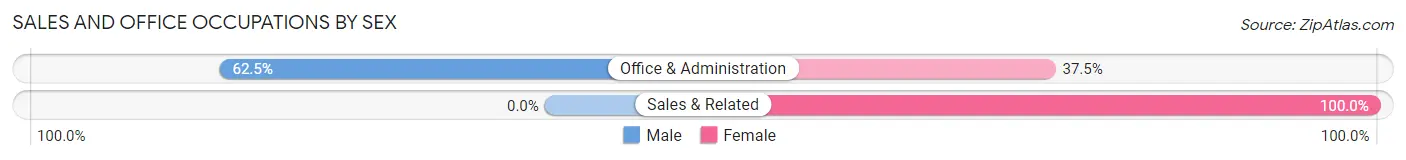
| Occupation | Male | Female |
| Sales & Related | 0 (0.0%) | 11 (100.0%) |
| Office & Administration | 15 (62.5%) | 9 (37.5%) |
| Total (Category) | 15 (42.9%) | 20 (57.1%) |
| Total (Overall) | 34 (43.0%) | 45 (57.0%) |
Natural Resources, Construction and Maintenance Occupations
The most common Natural Resources, Construction and Maintenance occupations in Augusta Springs are , and Construction & Extraction (10 | 12.7%).
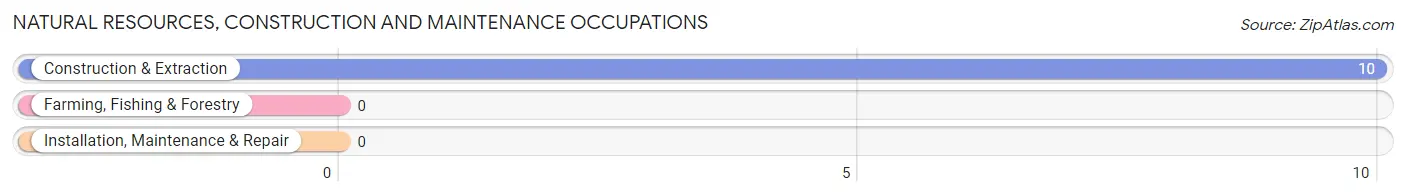
Natural Resources, Construction and Maintenance Occupations by Sex
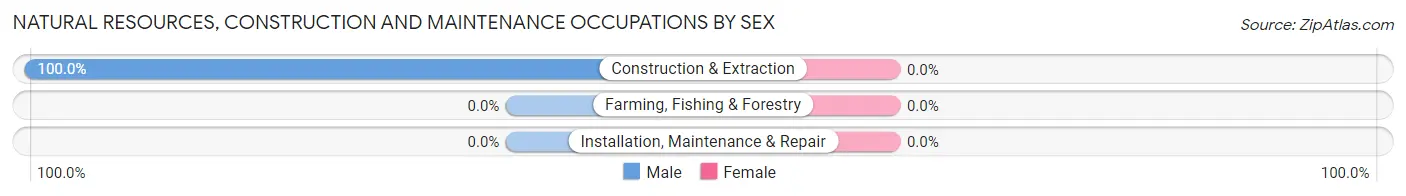
| Occupation | Male | Female |
| Farming, Fishing & Forestry | 0 (0.0%) | 0 (0.0%) |
| Construction & Extraction | 10 (100.0%) | 0 (0.0%) |
| Installation, Maintenance & Repair | 0 (0.0%) | 0 (0.0%) |
| Total (Category) | 10 (100.0%) | 0 (0.0%) |
| Total (Overall) | 34 (43.0%) | 45 (57.0%) |
Production, Transportation and Moving Occupations
Production, Transportation and Moving Occupations by Sex
| Occupation | Male | Female |
| Production | 0 (0.0%) | 0 (0.0%) |
| Transportation | 0 (0.0%) | 0 (0.0%) |
| Material Moving | 0 (0.0%) | 0 (0.0%) |
| Total (Category) | 0 (0.0%) | 0 (0.0%) |
| Total (Overall) | 34 (43.0%) | 45 (57.0%) |
Employment Industries by Sex in Augusta Springs
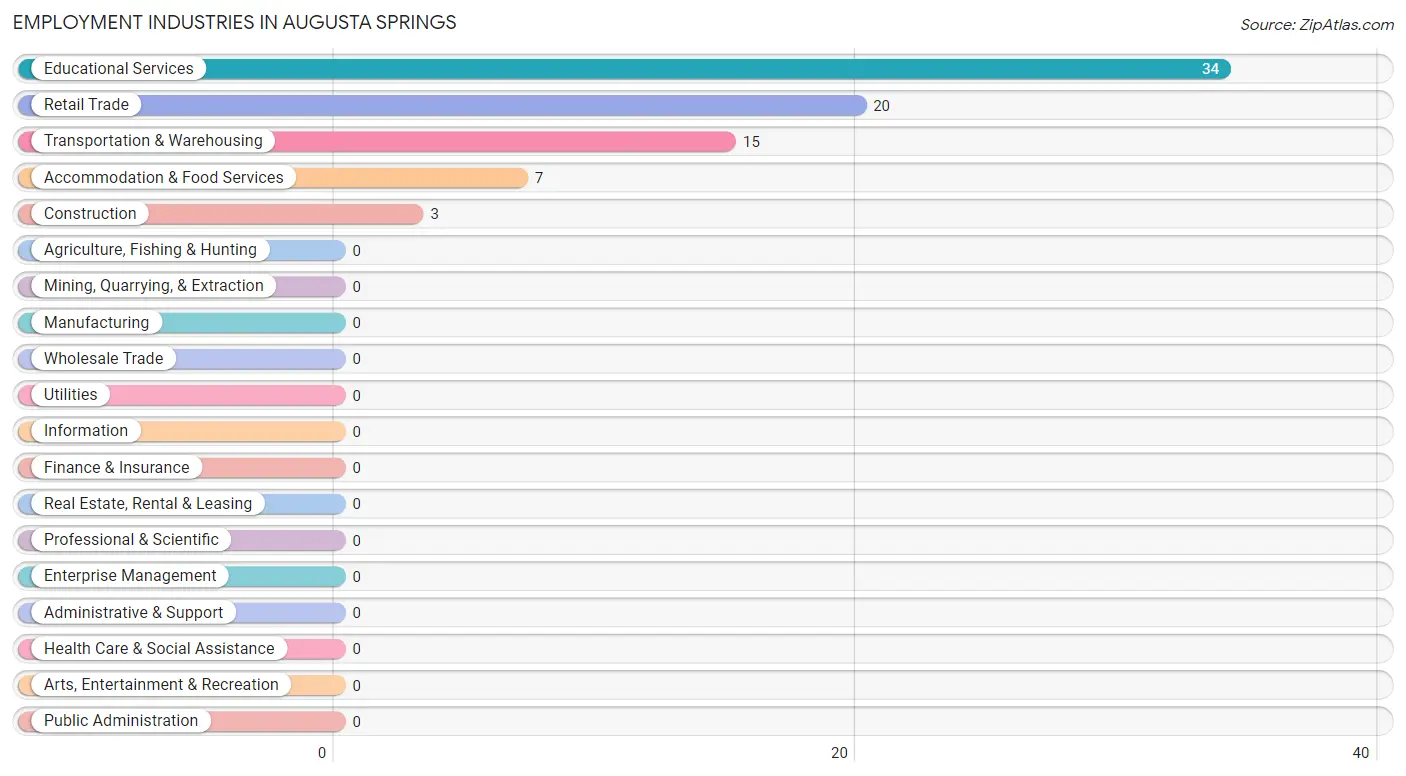
Employment Industries in Augusta Springs
The major employment industries in Augusta Springs include Educational Services (34 | 43.0%), Retail Trade (20 | 25.3%), Transportation & Warehousing (15 | 19.0%), Accommodation & Food Services (7 | 8.9%), and Construction (3 | 3.8%).
Employment Industries by Sex in Augusta Springs
The Augusta Springs industries that see more men than women are Construction (100.0%), Transportation & Warehousing (100.0%), and Accommodation & Food Services (100.0%), whereas the industries that tend to have a higher number of women are Retail Trade (100.0%), and Educational Services (73.5%).
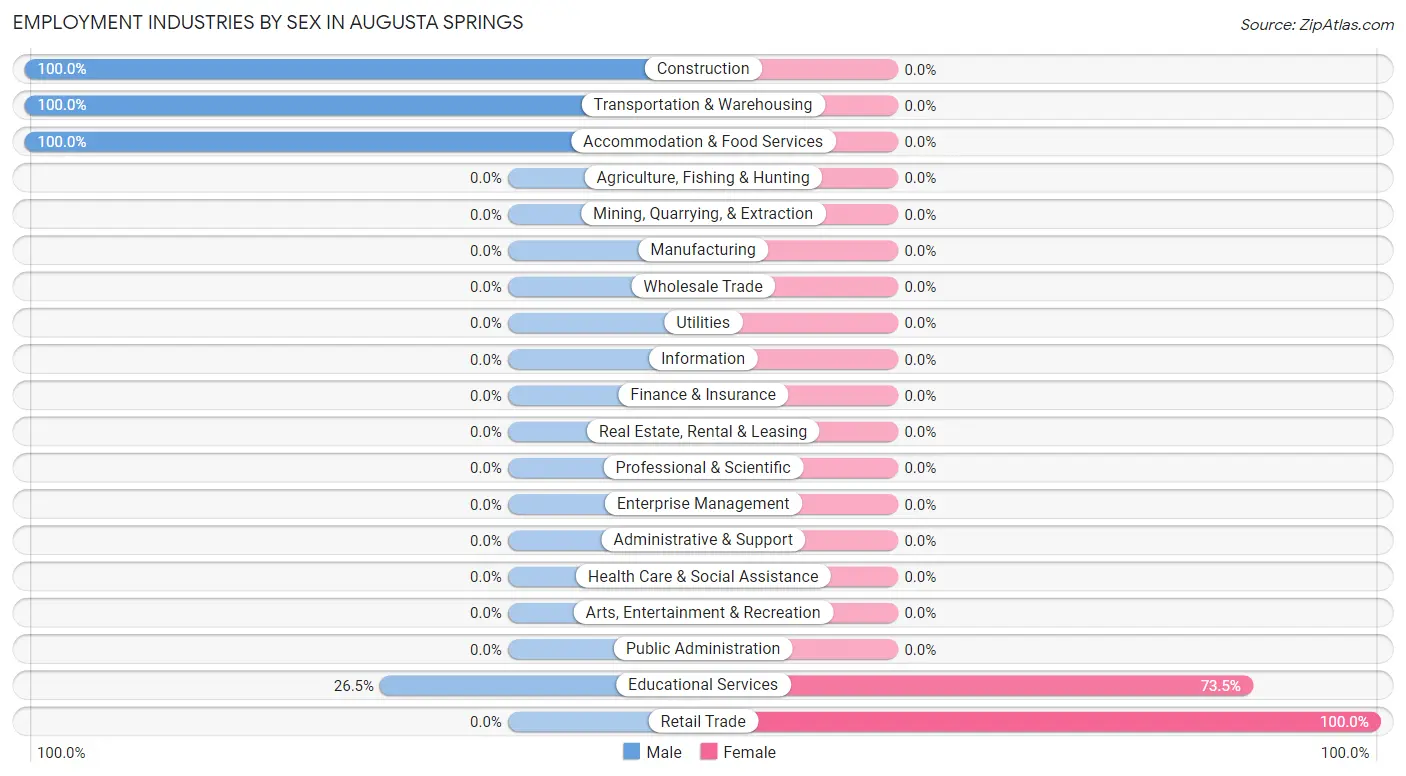
| Industry | Male | Female |
| Agriculture, Fishing & Hunting | 0 (0.0%) | 0 (0.0%) |
| Mining, Quarrying, & Extraction | 0 (0.0%) | 0 (0.0%) |
| Construction | 3 (100.0%) | 0 (0.0%) |
| Manufacturing | 0 (0.0%) | 0 (0.0%) |
| Wholesale Trade | 0 (0.0%) | 0 (0.0%) |
| Retail Trade | 0 (0.0%) | 20 (100.0%) |
| Transportation & Warehousing | 15 (100.0%) | 0 (0.0%) |
| Utilities | 0 (0.0%) | 0 (0.0%) |
| Information | 0 (0.0%) | 0 (0.0%) |
| Finance & Insurance | 0 (0.0%) | 0 (0.0%) |
| Real Estate, Rental & Leasing | 0 (0.0%) | 0 (0.0%) |
| Professional & Scientific | 0 (0.0%) | 0 (0.0%) |
| Enterprise Management | 0 (0.0%) | 0 (0.0%) |
| Administrative & Support | 0 (0.0%) | 0 (0.0%) |
| Educational Services | 9 (26.5%) | 25 (73.5%) |
| Health Care & Social Assistance | 0 (0.0%) | 0 (0.0%) |
| Arts, Entertainment & Recreation | 0 (0.0%) | 0 (0.0%) |
| Accommodation & Food Services | 7 (100.0%) | 0 (0.0%) |
| Public Administration | 0 (0.0%) | 0 (0.0%) |
| Total | 34 (43.0%) | 45 (57.0%) |
Education in Augusta Springs
School Enrollment in Augusta Springs
The most common levels of schooling among the 38 students in Augusta Springs are middle school (20 | 52.6%), and elementary school (18 | 47.4%).
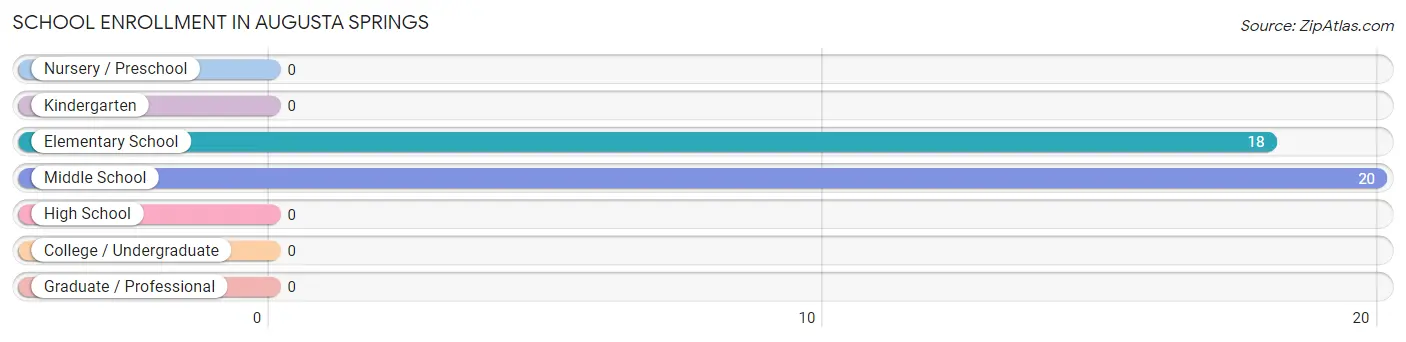
| School Level | # Students | % Students |
| Nursery / Preschool | 0 | 0.0% |
| Kindergarten | 0 | 0.0% |
| Elementary School | 18 | 47.4% |
| Middle School | 20 | 52.6% |
| High School | 0 | 0.0% |
| College / Undergraduate | 0 | 0.0% |
| Graduate / Professional | 0 | 0.0% |
| Total | 38 | 100.0% |
School Enrollment by Age by Funding Source in Augusta Springs
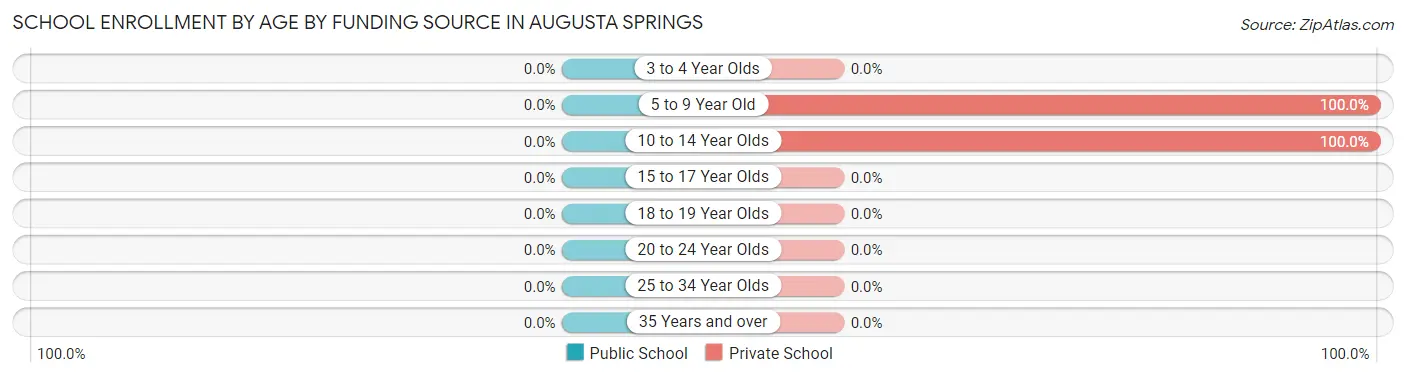
| Age Bracket | Public School | Private School |
| 3 to 4 Year Olds | 0 (0.0%) | 0 (0.0%) |
| 5 to 9 Year Old | 0 (0.0%) | 18 (100.0%) |
| 10 to 14 Year Olds | 0 (0.0%) | 20 (100.0%) |
| 15 to 17 Year Olds | 0 (0.0%) | 0 (0.0%) |
| 18 to 19 Year Olds | 0 (0.0%) | 0 (0.0%) |
| 20 to 24 Year Olds | 0 (0.0%) | 0 (0.0%) |
| 25 to 34 Year Olds | 0 (0.0%) | 0 (0.0%) |
| 35 Years and over | 0 (0.0%) | 0 (0.0%) |
| Total | 0 (0.0%) | 38 (100.0%) |
Educational Attainment by Field of Study in Augusta Springs
| Field of Study | # Graduates | % Graduates |
| Computers & Mathematics | 0 | 0.0% |
| Bio, Nature & Agricultural | 0 | 0.0% |
| Physical & Health Sciences | 0 | 0.0% |
| Psychology | 0 | 0.0% |
| Social Sciences | 0 | 0.0% |
| Engineering | 0 | 0.0% |
| Multidisciplinary Studies | 0 | 0.0% |
| Science & Technology | 0 | 0.0% |
| Business | 0 | 0.0% |
| Education | 0 | 0.0% |
| Literature & Languages | 0 | 0.0% |
| Liberal Arts & History | 0 | 0.0% |
| Visual & Performing Arts | 0 | 0.0% |
| Communications | 0 | 0.0% |
| Arts & Humanities | 0 | 0.0% |
| Total | 0 | 0.0% |
Transportation & Commute in Augusta Springs
Vehicle Availability by Sex in Augusta Springs
The most prevalent vehicle ownership categories in Augusta Springs are males with 2 vehicles (27, accounting for 79.4%) and females with 2 vehicles (29, making up 60.0%).
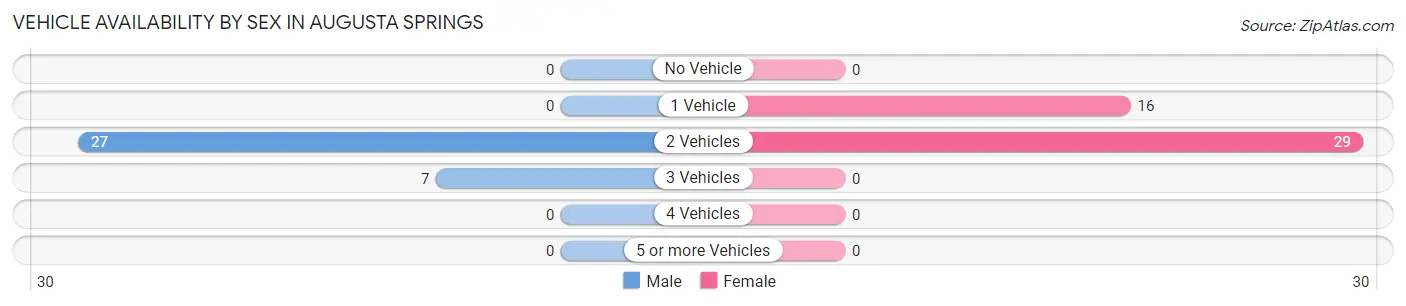
| Vehicles Available | Male | Female |
| No Vehicle | 0 (0.0%) | 0 (0.0%) |
| 1 Vehicle | 0 (0.0%) | 16 (35.6%) |
| 2 Vehicles | 27 (79.4%) | 29 (64.4%) |
| 3 Vehicles | 7 (20.6%) | 0 (0.0%) |
| 4 Vehicles | 0 (0.0%) | 0 (0.0%) |
| 5 or more Vehicles | 0 (0.0%) | 0 (0.0%) |
| Total | 34 (100.0%) | 45 (100.0%) |
Commute Time in Augusta Springs
The most frequently occuring commute durations in Augusta Springs are 45 to 59 minutes (33 commuters, 41.8%), 5 to 9 minutes (16 commuters, 20.3%), and 30 to 34 minutes (14 commuters, 17.7%).
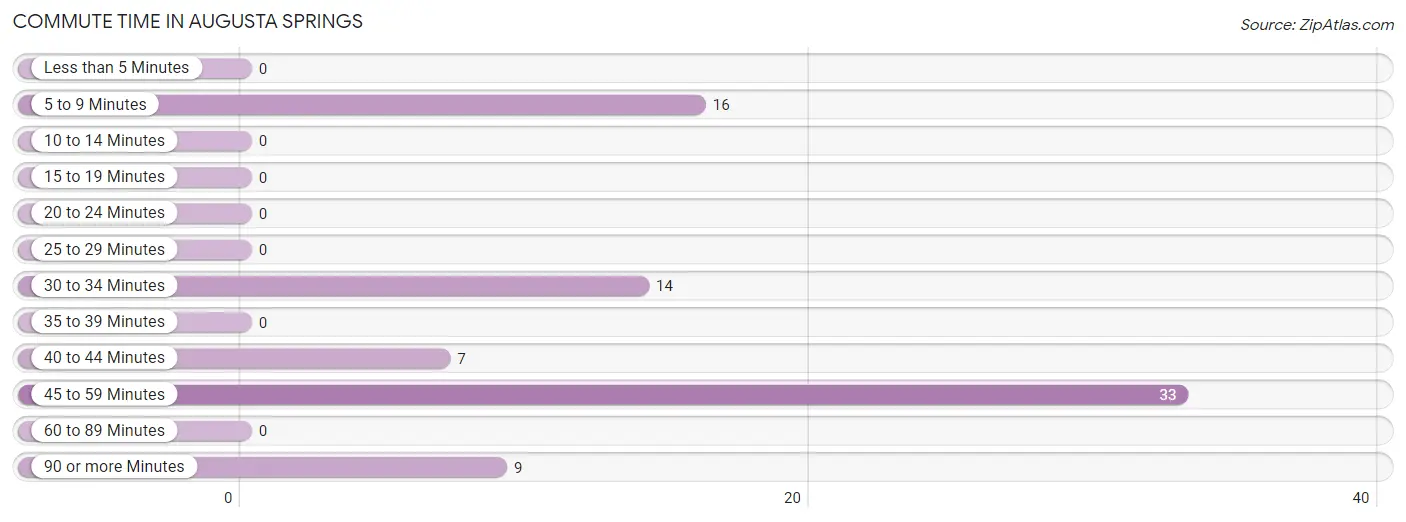
| Commute Time | # Commuters | % Commuters |
| Less than 5 Minutes | 0 | 0.0% |
| 5 to 9 Minutes | 16 | 20.3% |
| 10 to 14 Minutes | 0 | 0.0% |
| 15 to 19 Minutes | 0 | 0.0% |
| 20 to 24 Minutes | 0 | 0.0% |
| 25 to 29 Minutes | 0 | 0.0% |
| 30 to 34 Minutes | 14 | 17.7% |
| 35 to 39 Minutes | 0 | 0.0% |
| 40 to 44 Minutes | 7 | 8.9% |
| 45 to 59 Minutes | 33 | 41.8% |
| 60 to 89 Minutes | 0 | 0.0% |
| 90 or more Minutes | 9 | 11.4% |
Commute Time by Sex in Augusta Springs
The most common commute times in Augusta Springs are 45 to 59 minutes (24 commuters, 70.6%) for males and 5 to 9 minutes (16 commuters, 35.6%) for females.
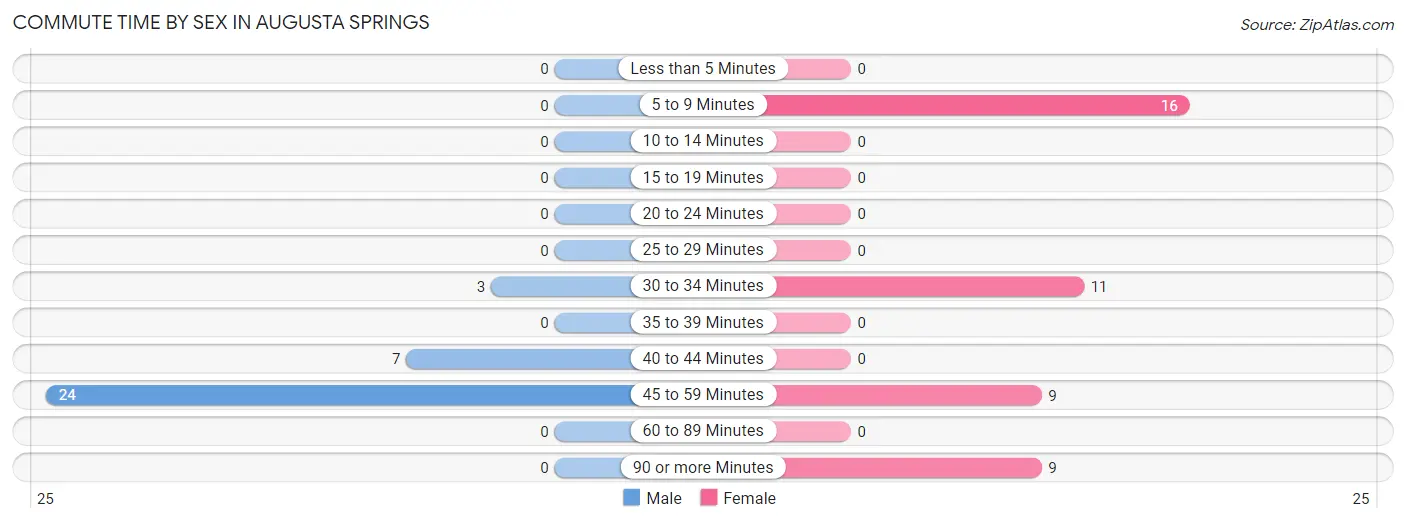
| Commute Time | Male | Female |
| Less than 5 Minutes | 0 (0.0%) | 0 (0.0%) |
| 5 to 9 Minutes | 0 (0.0%) | 16 (35.6%) |
| 10 to 14 Minutes | 0 (0.0%) | 0 (0.0%) |
| 15 to 19 Minutes | 0 (0.0%) | 0 (0.0%) |
| 20 to 24 Minutes | 0 (0.0%) | 0 (0.0%) |
| 25 to 29 Minutes | 0 (0.0%) | 0 (0.0%) |
| 30 to 34 Minutes | 3 (8.8%) | 11 (24.4%) |
| 35 to 39 Minutes | 0 (0.0%) | 0 (0.0%) |
| 40 to 44 Minutes | 7 (20.6%) | 0 (0.0%) |
| 45 to 59 Minutes | 24 (70.6%) | 9 (20.0%) |
| 60 to 89 Minutes | 0 (0.0%) | 0 (0.0%) |
| 90 or more Minutes | 0 (0.0%) | 9 (20.0%) |
Time of Departure to Work by Sex in Augusta Springs
The most frequent times of departure to work in Augusta Springs are 6:00 AM to 6:29 AM (31, 91.2%) for males and 7:00 AM to 7:29 AM (16, 35.6%) for females.
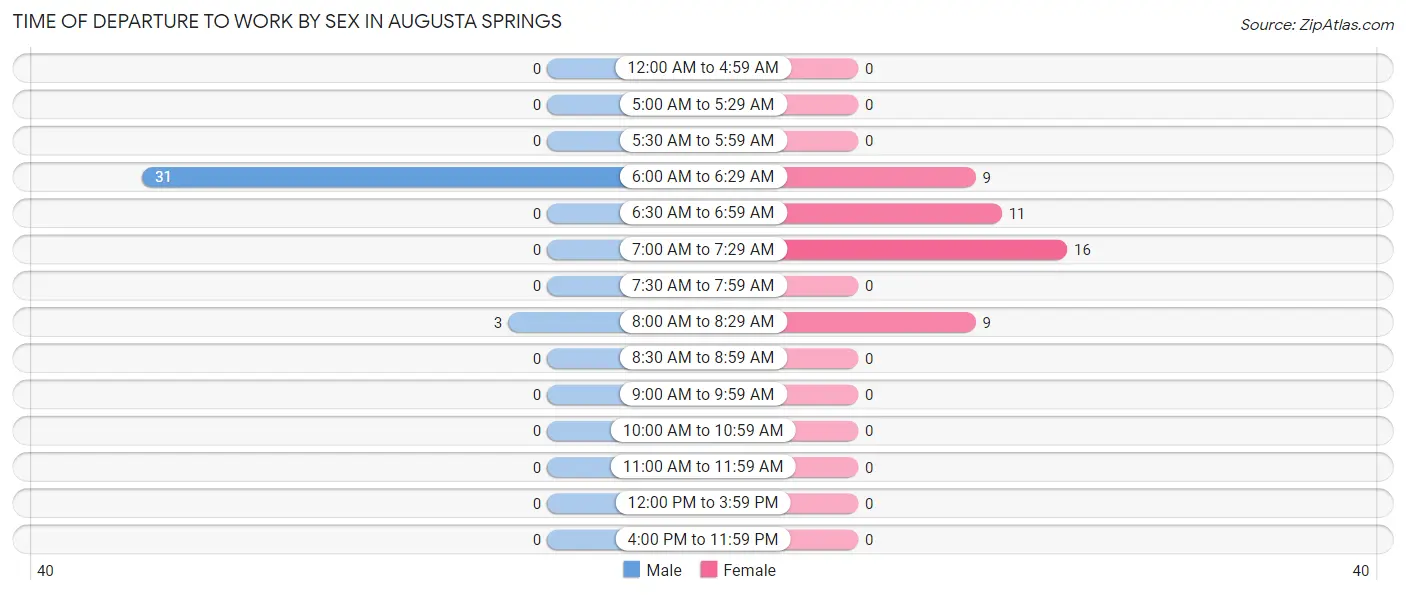
| Time of Departure | Male | Female |
| 12:00 AM to 4:59 AM | 0 (0.0%) | 0 (0.0%) |
| 5:00 AM to 5:29 AM | 0 (0.0%) | 0 (0.0%) |
| 5:30 AM to 5:59 AM | 0 (0.0%) | 0 (0.0%) |
| 6:00 AM to 6:29 AM | 31 (91.2%) | 9 (20.0%) |
| 6:30 AM to 6:59 AM | 0 (0.0%) | 11 (24.4%) |
| 7:00 AM to 7:29 AM | 0 (0.0%) | 16 (35.6%) |
| 7:30 AM to 7:59 AM | 0 (0.0%) | 0 (0.0%) |
| 8:00 AM to 8:29 AM | 3 (8.8%) | 9 (20.0%) |
| 8:30 AM to 8:59 AM | 0 (0.0%) | 0 (0.0%) |
| 9:00 AM to 9:59 AM | 0 (0.0%) | 0 (0.0%) |
| 10:00 AM to 10:59 AM | 0 (0.0%) | 0 (0.0%) |
| 11:00 AM to 11:59 AM | 0 (0.0%) | 0 (0.0%) |
| 12:00 PM to 3:59 PM | 0 (0.0%) | 0 (0.0%) |
| 4:00 PM to 11:59 PM | 0 (0.0%) | 0 (0.0%) |
| Total | 34 (100.0%) | 45 (100.0%) |
Housing Occupancy in Augusta Springs
Occupancy by Ownership in Augusta Springs
Of the total 44 dwellings in Augusta Springs, owner-occupied units account for 28 (63.6%), while renter-occupied units make up 16 (36.4%).
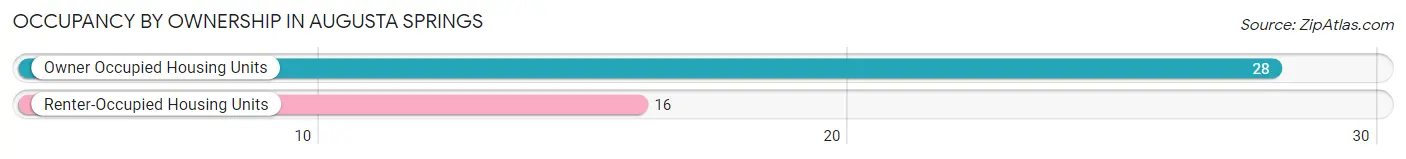
| Occupancy | # Housing Units | % Housing Units |
| Owner Occupied Housing Units | 28 | 63.6% |
| Renter-Occupied Housing Units | 16 | 36.4% |
| Total Occupied Housing Units | 44 | 100.0% |
Occupancy by Household Size in Augusta Springs
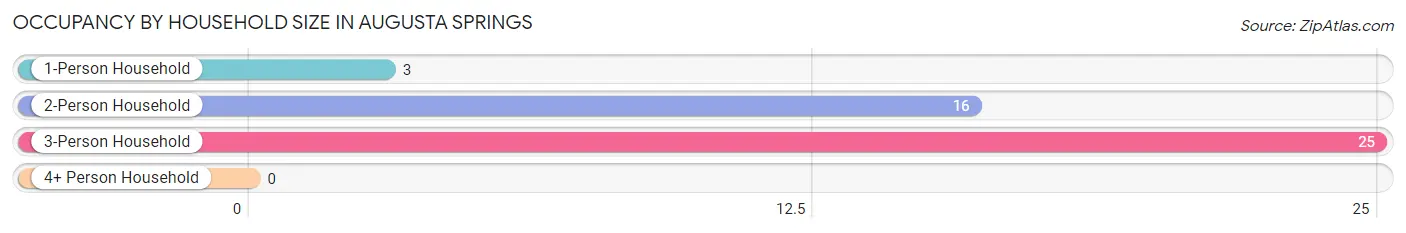
| Household Size | # Housing Units | % Housing Units |
| 1-Person Household | 3 | 6.8% |
| 2-Person Household | 16 | 36.4% |
| 3-Person Household | 25 | 56.8% |
| 4+ Person Household | 0 | 0.0% |
| Total Housing Units | 44 | 100.0% |
Occupancy by Ownership by Household Size in Augusta Springs
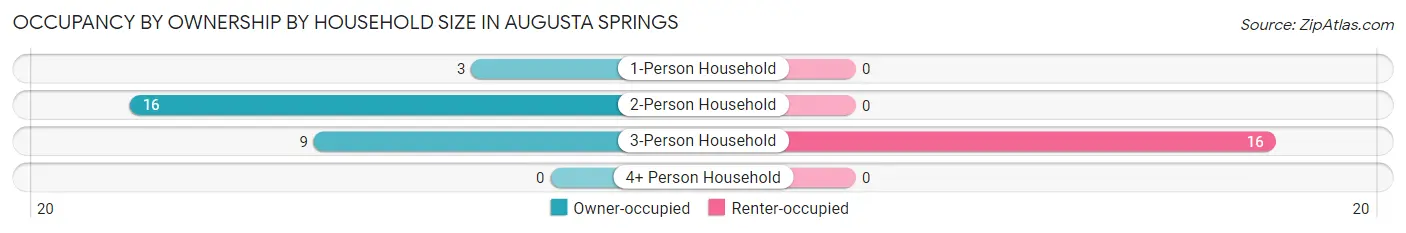
| Household Size | Owner-occupied | Renter-occupied |
| 1-Person Household | 3 (100.0%) | 0 (0.0%) |
| 2-Person Household | 16 (100.0%) | 0 (0.0%) |
| 3-Person Household | 9 (36.0%) | 16 (64.0%) |
| 4+ Person Household | 0 (0.0%) | 0 (0.0%) |
| Total Housing Units | 28 (63.6%) | 16 (36.4%) |
Occupancy by Educational Attainment in Augusta Springs
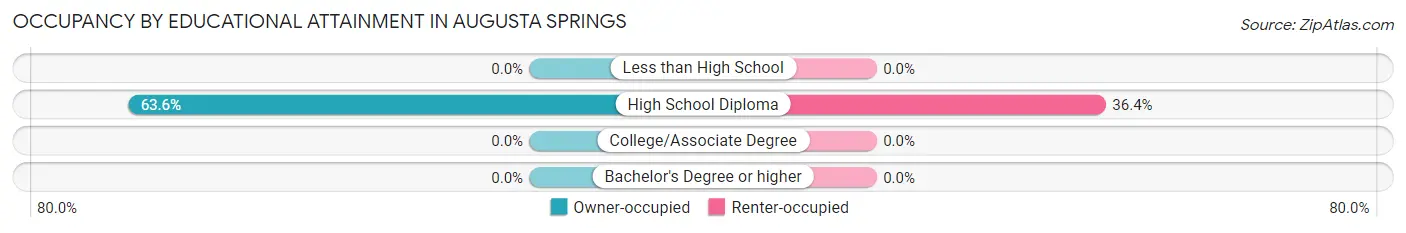
| Household Size | Owner-occupied | Renter-occupied |
| Less than High School | 0 (0.0%) | 0 (0.0%) |
| High School Diploma | 28 (63.6%) | 16 (36.4%) |
| College/Associate Degree | 0 (0.0%) | 0 (0.0%) |
| Bachelor's Degree or higher | 0 (0.0%) | 0 (0.0%) |
Occupancy by Age of Householder in Augusta Springs
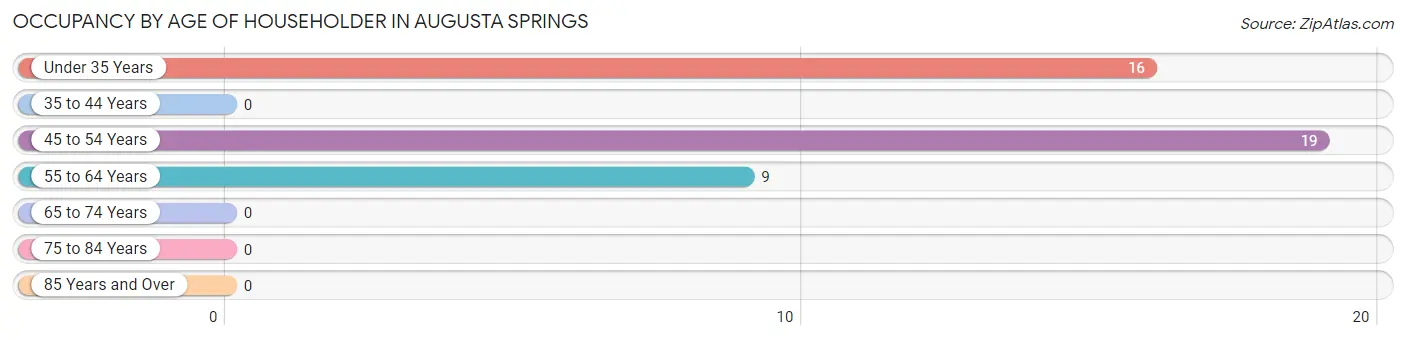
| Age Bracket | # Households | % Households |
| Under 35 Years | 16 | 36.4% |
| 35 to 44 Years | 0 | 0.0% |
| 45 to 54 Years | 19 | 43.2% |
| 55 to 64 Years | 9 | 20.4% |
| 65 to 74 Years | 0 | 0.0% |
| 75 to 84 Years | 0 | 0.0% |
| 85 Years and Over | 0 | 0.0% |
| Total | 44 | 100.0% |
Housing Finances in Augusta Springs
Median Income by Occupancy in Augusta Springs
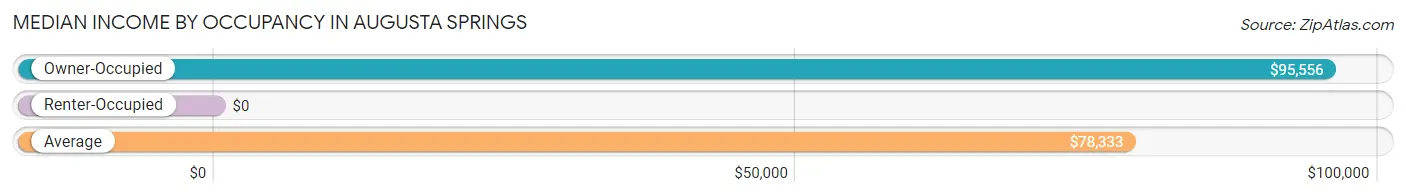
| Occupancy Type | # Households | Median Income |
| Owner-Occupied | 28 (63.6%) | $95,556 |
| Renter-Occupied | 16 (36.4%) | $0 |
| Average | 44 (100.0%) | $78,333 |
Occupancy by Householder Income Bracket in Augusta Springs
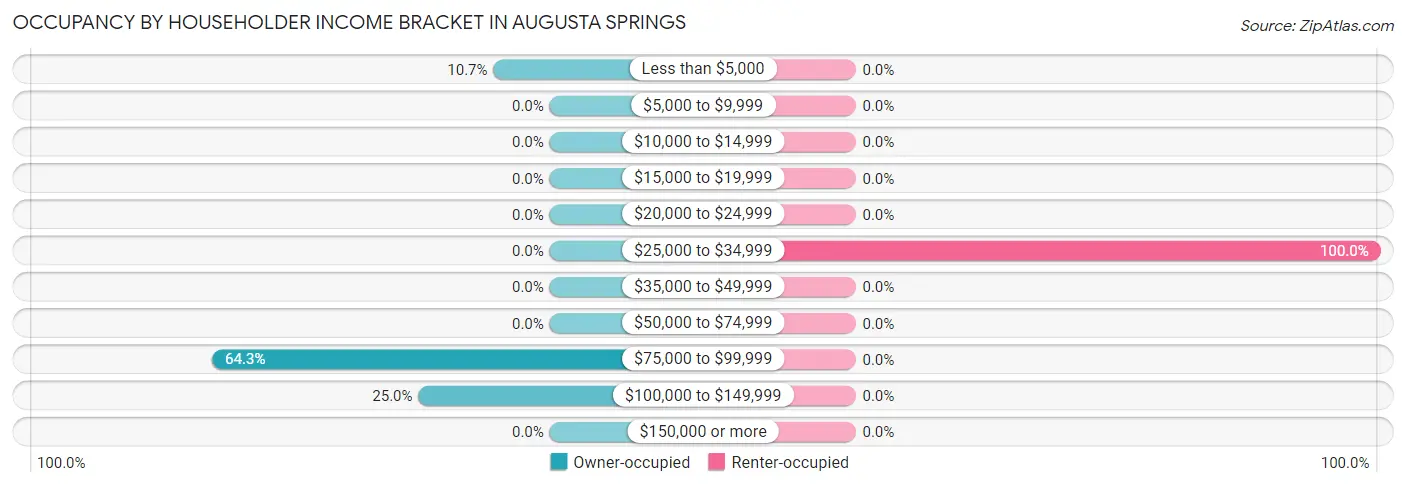
| Income Bracket | Owner-occupied | Renter-occupied |
| Less than $5,000 | 3 (10.7%) | 0 (0.0%) |
| $5,000 to $9,999 | 0 (0.0%) | 0 (0.0%) |
| $10,000 to $14,999 | 0 (0.0%) | 0 (0.0%) |
| $15,000 to $19,999 | 0 (0.0%) | 0 (0.0%) |
| $20,000 to $24,999 | 0 (0.0%) | 0 (0.0%) |
| $25,000 to $34,999 | 0 (0.0%) | 16 (100.0%) |
| $35,000 to $49,999 | 0 (0.0%) | 0 (0.0%) |
| $50,000 to $74,999 | 0 (0.0%) | 0 (0.0%) |
| $75,000 to $99,999 | 18 (64.3%) | 0 (0.0%) |
| $100,000 to $149,999 | 7 (25.0%) | 0 (0.0%) |
| $150,000 or more | 0 (0.0%) | 0 (0.0%) |
| Total | 28 (100.0%) | 16 (100.0%) |
Monthly Housing Cost Tiers in Augusta Springs
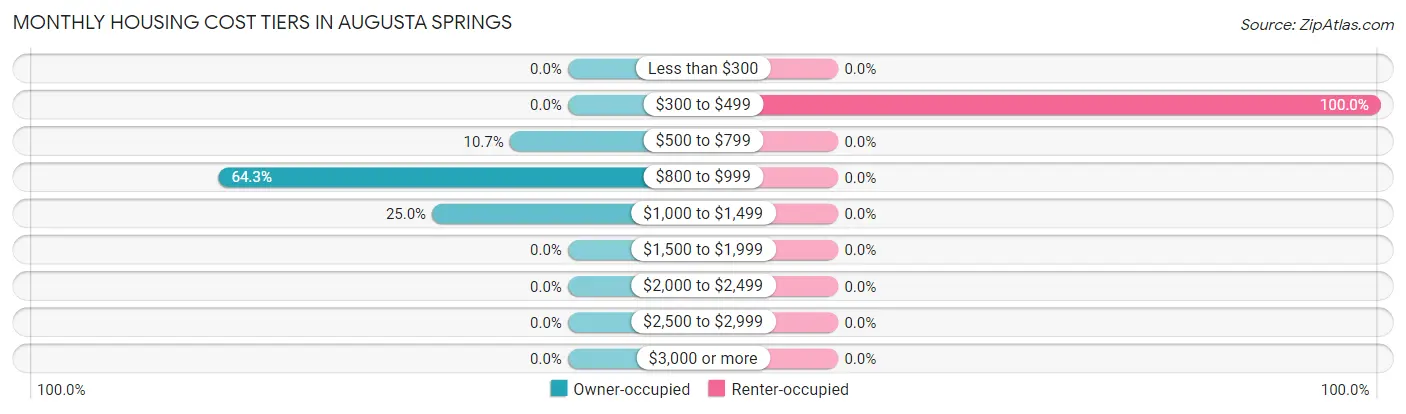
| Monthly Cost | Owner-occupied | Renter-occupied |
| Less than $300 | 0 (0.0%) | 0 (0.0%) |
| $300 to $499 | 0 (0.0%) | 16 (100.0%) |
| $500 to $799 | 3 (10.7%) | 0 (0.0%) |
| $800 to $999 | 18 (64.3%) | 0 (0.0%) |
| $1,000 to $1,499 | 7 (25.0%) | 0 (0.0%) |
| $1,500 to $1,999 | 0 (0.0%) | 0 (0.0%) |
| $2,000 to $2,499 | 0 (0.0%) | 0 (0.0%) |
| $2,500 to $2,999 | 0 (0.0%) | 0 (0.0%) |
| $3,000 or more | 0 (0.0%) | 0 (0.0%) |
| Total | 28 (100.0%) | 16 (100.0%) |
Physical Housing Characteristics in Augusta Springs
Housing Structures in Augusta Springs
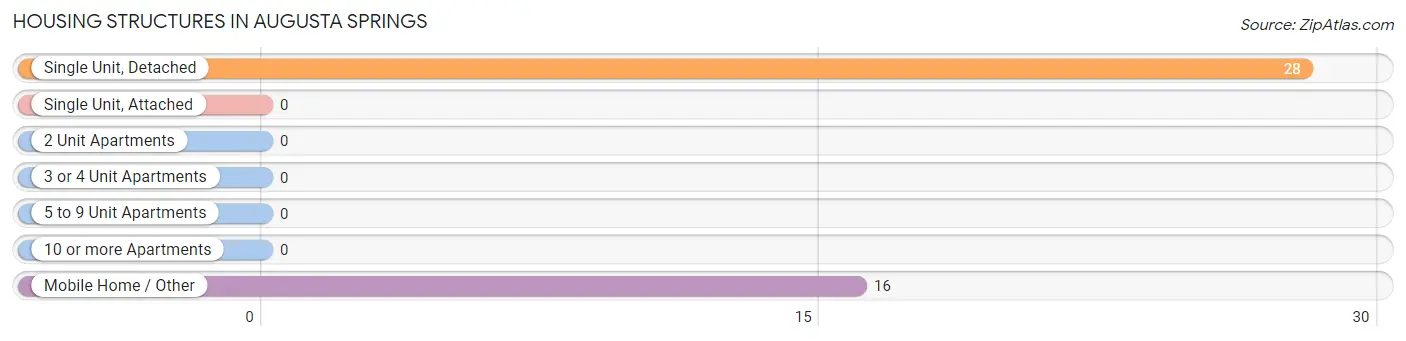
| Structure Type | # Housing Units | % Housing Units |
| Single Unit, Detached | 28 | 63.6% |
| Single Unit, Attached | 0 | 0.0% |
| 2 Unit Apartments | 0 | 0.0% |
| 3 or 4 Unit Apartments | 0 | 0.0% |
| 5 to 9 Unit Apartments | 0 | 0.0% |
| 10 or more Apartments | 0 | 0.0% |
| Mobile Home / Other | 16 | 36.4% |
| Total | 44 | 100.0% |
Housing Structures by Occupancy in Augusta Springs
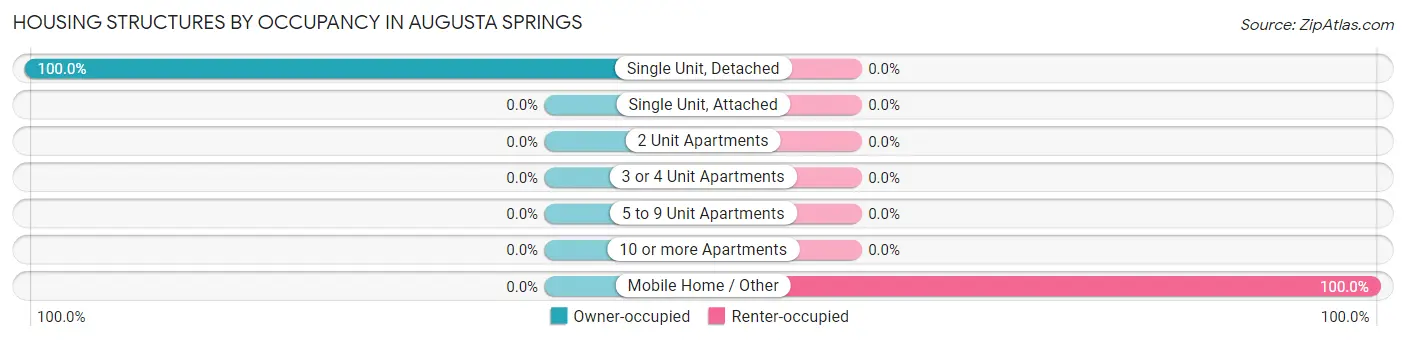
| Structure Type | Owner-occupied | Renter-occupied |
| Single Unit, Detached | 28 (100.0%) | 0 (0.0%) |
| Single Unit, Attached | 0 (0.0%) | 0 (0.0%) |
| 2 Unit Apartments | 0 (0.0%) | 0 (0.0%) |
| 3 or 4 Unit Apartments | 0 (0.0%) | 0 (0.0%) |
| 5 to 9 Unit Apartments | 0 (0.0%) | 0 (0.0%) |
| 10 or more Apartments | 0 (0.0%) | 0 (0.0%) |
| Mobile Home / Other | 0 (0.0%) | 16 (100.0%) |
| Total | 28 (63.6%) | 16 (36.4%) |
Housing Structures by Number of Rooms in Augusta Springs
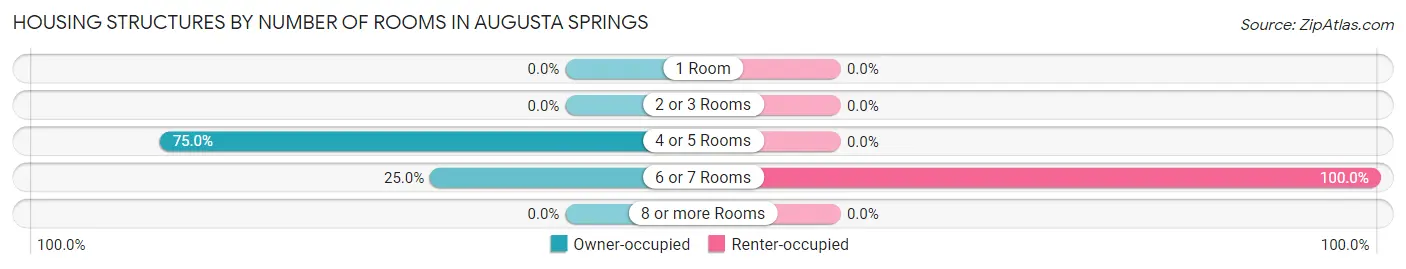
| Number of Rooms | Owner-occupied | Renter-occupied |
| 1 Room | 0 (0.0%) | 0 (0.0%) |
| 2 or 3 Rooms | 0 (0.0%) | 0 (0.0%) |
| 4 or 5 Rooms | 21 (75.0%) | 0 (0.0%) |
| 6 or 7 Rooms | 7 (25.0%) | 16 (100.0%) |
| 8 or more Rooms | 0 (0.0%) | 0 (0.0%) |
| Total | 28 (100.0%) | 16 (100.0%) |
Housing Structure by Heating Type in Augusta Springs
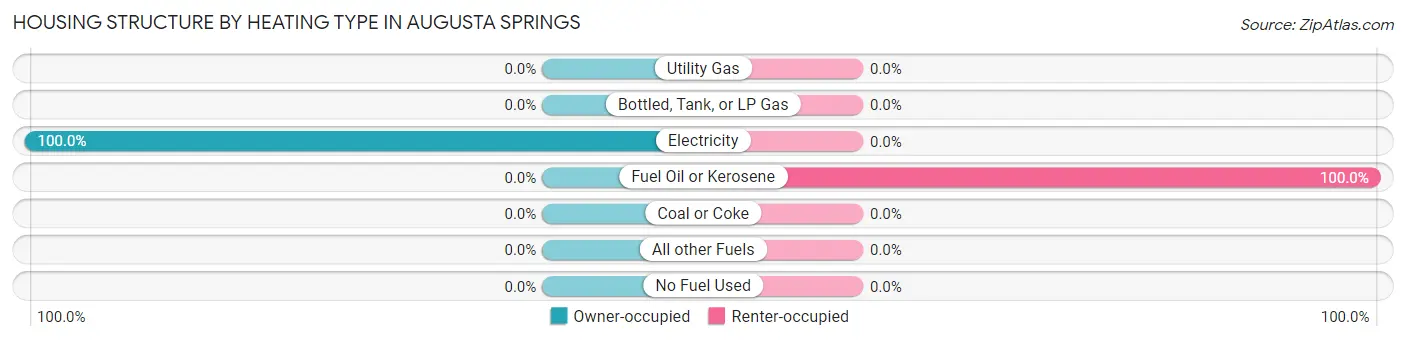
| Heating Type | Owner-occupied | Renter-occupied |
| Utility Gas | 0 (0.0%) | 0 (0.0%) |
| Bottled, Tank, or LP Gas | 0 (0.0%) | 0 (0.0%) |
| Electricity | 28 (100.0%) | 0 (0.0%) |
| Fuel Oil or Kerosene | 0 (0.0%) | 16 (100.0%) |
| Coal or Coke | 0 (0.0%) | 0 (0.0%) |
| All other Fuels | 0 (0.0%) | 0 (0.0%) |
| No Fuel Used | 0 (0.0%) | 0 (0.0%) |
| Total | 28 (100.0%) | 16 (100.0%) |
Household Vehicle Usage in Augusta Springs
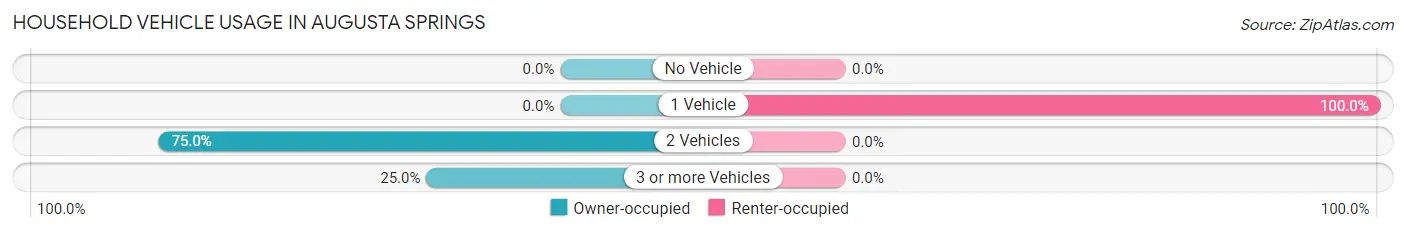
| Vehicles per Household | Owner-occupied | Renter-occupied |
| No Vehicle | 0 (0.0%) | 0 (0.0%) |
| 1 Vehicle | 0 (0.0%) | 16 (100.0%) |
| 2 Vehicles | 21 (75.0%) | 0 (0.0%) |
| 3 or more Vehicles | 7 (25.0%) | 0 (0.0%) |
| Total | 28 (100.0%) | 16 (100.0%) |
Real Estate & Mortgages in Augusta Springs
Real Estate and Mortgage Overview in Augusta Springs
| Characteristic | Without Mortgage | With Mortgage |
| Housing Units | 0 | 28 |
| Median Property Value | - | - |
| Median Household Income | - | - |
| Monthly Housing Costs | - | - |
| Real Estate Taxes | - | - |
Property Value by Mortgage Status in Augusta Springs
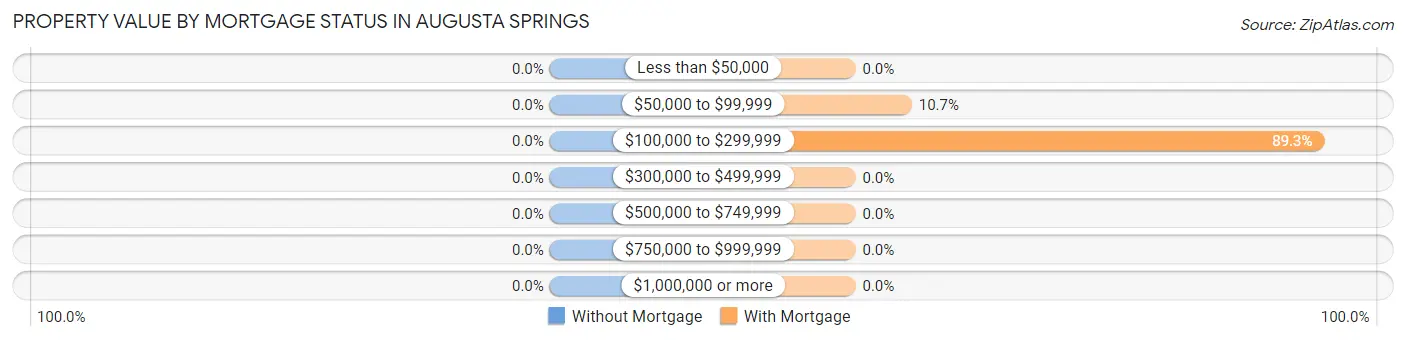
| Property Value | Without Mortgage | With Mortgage |
| Less than $50,000 | 0 (0.0%) | 0 (0.0%) |
| $50,000 to $99,999 | 0 (0.0%) | 3 (10.7%) |
| $100,000 to $299,999 | 0 (0.0%) | 25 (89.3%) |
| $300,000 to $499,999 | 0 (0.0%) | 0 (0.0%) |
| $500,000 to $749,999 | 0 (0.0%) | 0 (0.0%) |
| $750,000 to $999,999 | 0 (0.0%) | 0 (0.0%) |
| $1,000,000 or more | 0 (0.0%) | 0 (0.0%) |
| Total | 0 (0.0%) | 28 (100.0%) |
Household Income by Mortgage Status in Augusta Springs
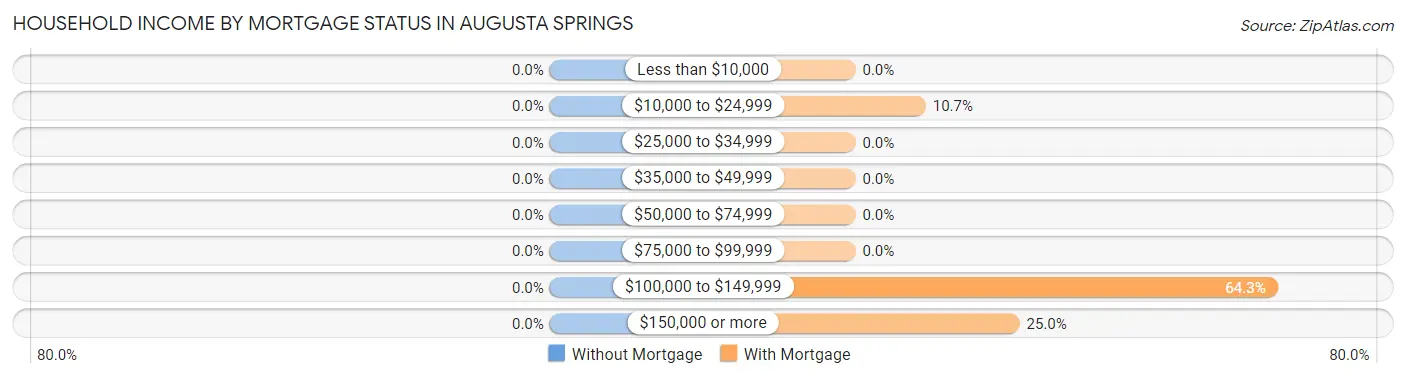
| Household Income | Without Mortgage | With Mortgage |
| Less than $10,000 | 0 (0.0%) | 0 (0.0%) |
| $10,000 to $24,999 | 0 (0.0%) | 3 (10.7%) |
| $25,000 to $34,999 | 0 (0.0%) | 0 (0.0%) |
| $35,000 to $49,999 | 0 (0.0%) | 0 (0.0%) |
| $50,000 to $74,999 | 0 (0.0%) | 0 (0.0%) |
| $75,000 to $99,999 | 0 (0.0%) | 0 (0.0%) |
| $100,000 to $149,999 | 0 (0.0%) | 18 (64.3%) |
| $150,000 or more | 0 (0.0%) | 7 (25.0%) |
| Total | 0 (0.0%) | 28 (100.0%) |
Property Value to Household Income Ratio in Augusta Springs
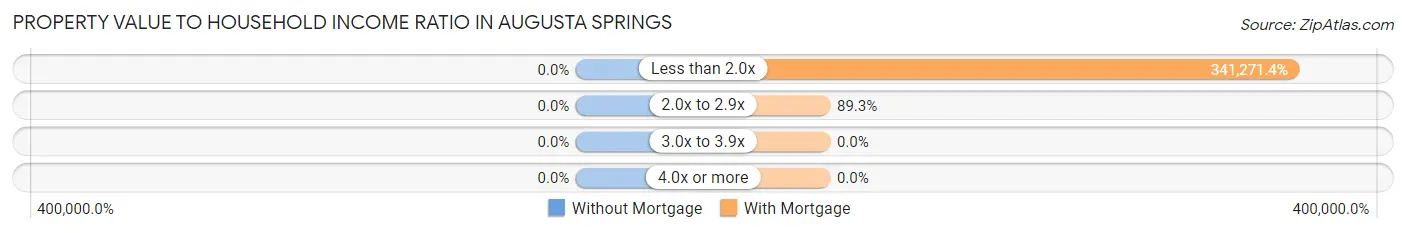
| Value-to-Income Ratio | Without Mortgage | With Mortgage |
| Less than 2.0x | 0 (0.0%) | 95,556 (341,271.4%) |
| 2.0x to 2.9x | 0 (0.0%) | 25 (89.3%) |
| 3.0x to 3.9x | 0 (0.0%) | 0 (0.0%) |
| 4.0x or more | 0 (0.0%) | 0 (0.0%) |
| Total | 0 (0.0%) | 28 (100.0%) |
Real Estate Taxes by Mortgage Status in Augusta Springs
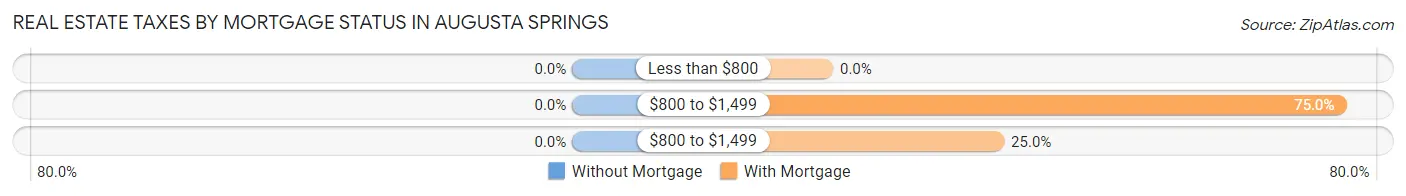
| Property Taxes | Without Mortgage | With Mortgage |
| Less than $800 | 0 (0.0%) | 0 (0.0%) |
| $800 to $1,499 | 0 (0.0%) | 21 (75.0%) |
| $800 to $1,499 | 0 (0.0%) | 7 (25.0%) |
| Total | 0 (0.0%) | 28 (100.0%) |
Health & Disability in Augusta Springs
Health Insurance Coverage by Age in Augusta Springs
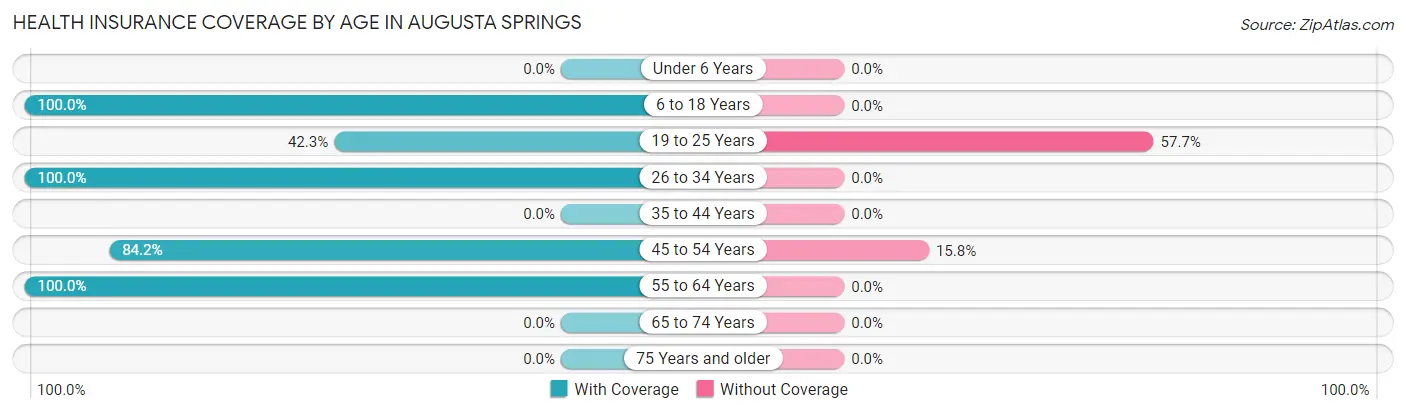
| Age Bracket | With Coverage | Without Coverage |
| Under 6 Years | 0 (0.0%) | 0 (0.0%) |
| 6 to 18 Years | 38 (100.0%) | 0 (0.0%) |
| 19 to 25 Years | 11 (42.3%) | 15 (57.7%) |
| 26 to 34 Years | 16 (100.0%) | 0 (0.0%) |
| 35 to 44 Years | 0 (0.0%) | 0 (0.0%) |
| 45 to 54 Years | 16 (84.2%) | 3 (15.8%) |
| 55 to 64 Years | 25 (100.0%) | 0 (0.0%) |
| 65 to 74 Years | 0 (0.0%) | 0 (0.0%) |
| 75 Years and older | 0 (0.0%) | 0 (0.0%) |
| Total | 106 (85.5%) | 18 (14.5%) |
Health Insurance Coverage by Citizenship Status in Augusta Springs
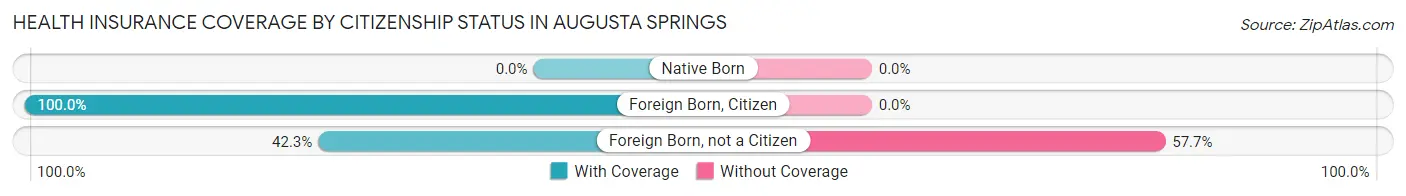
| Citizenship Status | With Coverage | Without Coverage |
| Native Born | 0 (0.0%) | 0 (0.0%) |
| Foreign Born, Citizen | 38 (100.0%) | 0 (0.0%) |
| Foreign Born, not a Citizen | 11 (42.3%) | 15 (57.7%) |
Health Insurance Coverage by Household Income in Augusta Springs
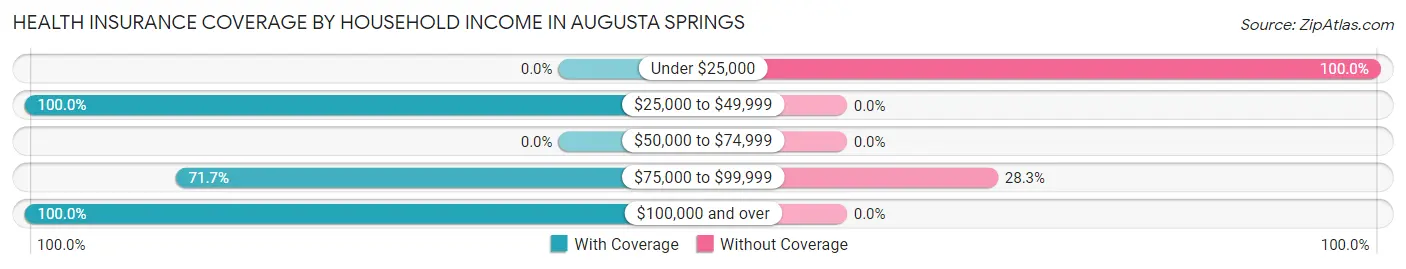
| Household Income | With Coverage | Without Coverage |
| Under $25,000 | 0 (0.0%) | 3 (100.0%) |
| $25,000 to $49,999 | 54 (100.0%) | 0 (0.0%) |
| $50,000 to $74,999 | 0 (0.0%) | 0 (0.0%) |
| $75,000 to $99,999 | 38 (71.7%) | 15 (28.3%) |
| $100,000 and over | 14 (100.0%) | 0 (0.0%) |
Public vs Private Health Insurance Coverage by Age in Augusta Springs
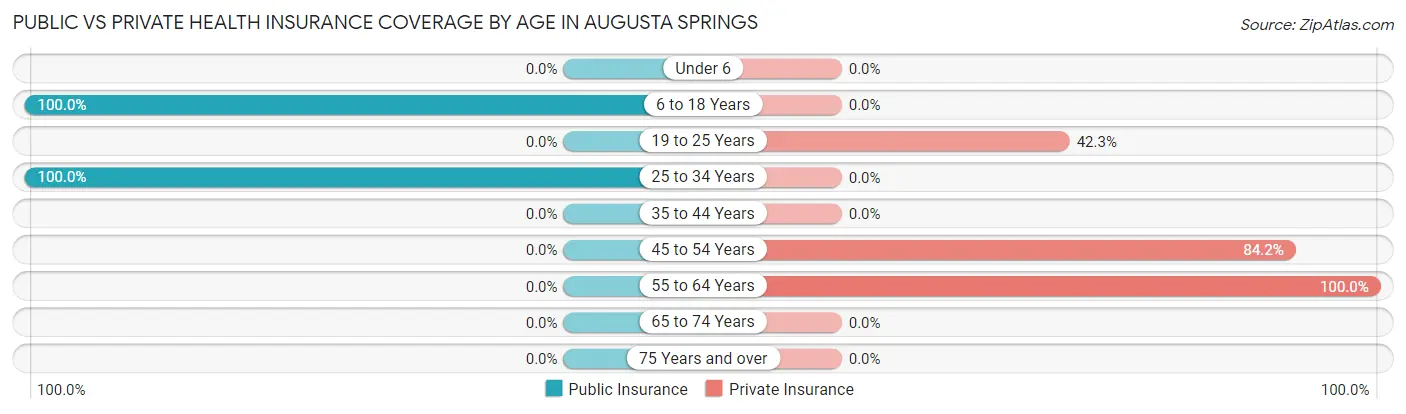
| Age Bracket | Public Insurance | Private Insurance |
| Under 6 | 0 (0.0%) | 0 (0.0%) |
| 6 to 18 Years | 38 (100.0%) | 0 (0.0%) |
| 19 to 25 Years | 0 (0.0%) | 11 (42.3%) |
| 25 to 34 Years | 16 (100.0%) | 0 (0.0%) |
| 35 to 44 Years | 0 (0.0%) | 0 (0.0%) |
| 45 to 54 Years | 0 (0.0%) | 16 (84.2%) |
| 55 to 64 Years | 0 (0.0%) | 25 (100.0%) |
| 65 to 74 Years | 0 (0.0%) | 0 (0.0%) |
| 75 Years and over | 0 (0.0%) | 0 (0.0%) |
| Total | 54 (43.5%) | 52 (41.9%) |
Disability Status by Sex by Age in Augusta Springs
| Age Bracket | Male | Female |
| Under 5 Years | 0 (0.0%) | 0 (0.0%) |
| 5 to 17 Years | 0 (0.0%) | 0 (0.0%) |
| 18 to 34 Years | 0 (0.0%) | 0 (0.0%) |
| 35 to 64 Years | 0 (0.0%) | 0 (0.0%) |
| 65 to 74 Years | 0 (0.0%) | 0 (0.0%) |
| 75 Years and over | 0 (0.0%) | 0 (0.0%) |
Disability Class by Sex by Age in Augusta Springs
Disability Class: Hearing Difficulty
| Age Bracket | Male | Female |
| Under 5 Years | 0 (0.0%) | 0 (0.0%) |
| 5 to 17 Years | 0 (0.0%) | 0 (0.0%) |
| 18 to 34 Years | 0 (0.0%) | 0 (0.0%) |
| 35 to 64 Years | 0 (0.0%) | 0 (0.0%) |
| 65 to 74 Years | 0 (0.0%) | 0 (0.0%) |
| 75 Years and over | 0 (0.0%) | 0 (0.0%) |
Disability Class: Vision Difficulty
| Age Bracket | Male | Female |
| Under 5 Years | 0 (0.0%) | 0 (0.0%) |
| 5 to 17 Years | 0 (0.0%) | 0 (0.0%) |
| 18 to 34 Years | 0 (0.0%) | 0 (0.0%) |
| 35 to 64 Years | 0 (0.0%) | 0 (0.0%) |
| 65 to 74 Years | 0 (0.0%) | 0 (0.0%) |
| 75 Years and over | 0 (0.0%) | 0 (0.0%) |
Disability Class: Cognitive Difficulty
| Age Bracket | Male | Female |
| 5 to 17 Years | 0 (0.0%) | 0 (0.0%) |
| 18 to 34 Years | 0 (0.0%) | 0 (0.0%) |
| 35 to 64 Years | 0 (0.0%) | 0 (0.0%) |
| 65 to 74 Years | 0 (0.0%) | 0 (0.0%) |
| 75 Years and over | 0 (0.0%) | 0 (0.0%) |
Disability Class: Ambulatory Difficulty
| Age Bracket | Male | Female |
| 5 to 17 Years | 0 (0.0%) | 0 (0.0%) |
| 18 to 34 Years | 0 (0.0%) | 0 (0.0%) |
| 35 to 64 Years | 0 (0.0%) | 0 (0.0%) |
| 65 to 74 Years | 0 (0.0%) | 0 (0.0%) |
| 75 Years and over | 0 (0.0%) | 0 (0.0%) |
Disability Class: Self-Care Difficulty
| Age Bracket | Male | Female |
| 5 to 17 Years | 0 (0.0%) | 0 (0.0%) |
| 18 to 34 Years | 0 (0.0%) | 0 (0.0%) |
| 35 to 64 Years | 0 (0.0%) | 0 (0.0%) |
| 65 to 74 Years | 0 (0.0%) | 0 (0.0%) |
| 75 Years and over | 0 (0.0%) | 0 (0.0%) |
Technology Access in Augusta Springs
Computing Device Access in Augusta Springs
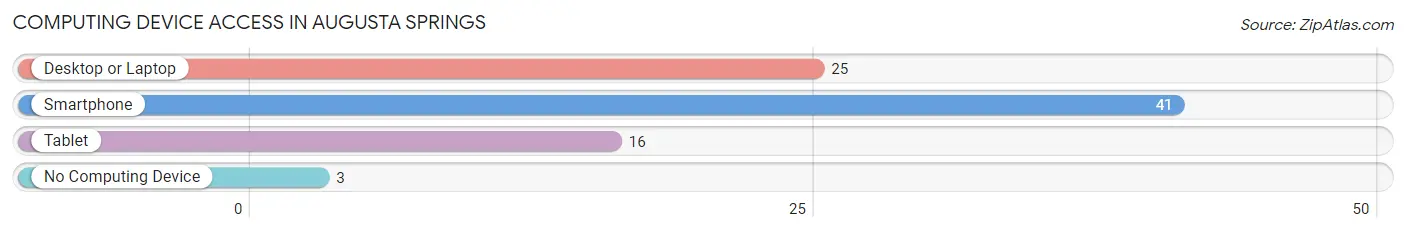
| Device Type | # Households | % Households |
| Desktop or Laptop | 25 | 56.8% |
| Smartphone | 41 | 93.2% |
| Tablet | 16 | 36.4% |
| No Computing Device | 3 | 6.8% |
| Total | 44 | 100.0% |
Internet Access in Augusta Springs
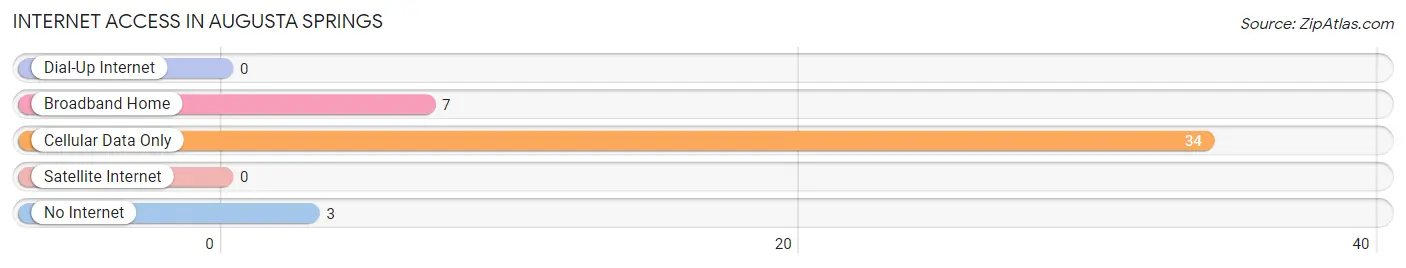
| Internet Type | # Households | % Households |
| Dial-Up Internet | 0 | 0.0% |
| Broadband Home | 7 | 15.9% |
| Cellular Data Only | 34 | 77.3% |
| Satellite Internet | 0 | 0.0% |
| No Internet | 3 | 6.8% |
| Total | 44 | 100.0% |
Augusta Springs Summary
Augusta Springs is a small unincorporated community located in Augusta County, Virginia. It is situated in the Shenandoah Valley, approximately 10 miles south of Staunton and 25 miles north of Harrisonburg. The community is located along the banks of the South River, a tributary of the Shenandoah River.
History
Augusta Springs was first settled in the late 1700s by German immigrants. The area was originally known as “New Germany” and was home to a number of German-speaking families. The community was officially established in 1820 and was named after Augusta County, which was named after Augusta of Saxe-Gotha, the mother of King George III.
The community was a popular destination for travelers in the 19th century, as it was located along the Valley Turnpike, a major transportation route. The turnpike connected Staunton to Harrisonburg and was used by stagecoaches, wagons, and other travelers.
In the late 19th century, Augusta Springs became a popular destination for health seekers. The area was known for its natural springs, which were believed to have healing properties. The springs were also used to power a number of mills in the area.
Geography
Augusta Springs is located in the Shenandoah Valley, a region of the Appalachian Mountains. The area is characterized by rolling hills and valleys, with the South River running through the community. The area is also home to a number of creeks and streams, as well as several small lakes.
The climate in Augusta Springs is temperate, with hot summers and cold winters. The average annual temperature is around 55 degrees Fahrenheit. The area receives an average of 43 inches of precipitation per year, with most of it falling in the form of rain.
Economy
The economy of Augusta Springs is largely based on agriculture. The area is home to a number of farms, which produce a variety of crops, including corn, soybeans, wheat, and hay. The area is also home to a number of livestock farms, which produce beef, pork, and poultry.
In addition to agriculture, the area is home to a number of small businesses, including restaurants, shops, and other services. The area is also home to a number of wineries, which produce a variety of wines.
Demographics
As of the 2010 census, the population of Augusta Springs was 1,093. The population is largely white (94.3%), with a small percentage of African Americans (2.2%) and Hispanics (2.2%). The median household income is $45,000, and the median age is 44.
Conclusion
Augusta Springs is a small unincorporated community located in Augusta County, Virginia. It is situated in the Shenandoah Valley, approximately 10 miles south of Staunton and 25 miles north of Harrisonburg. The community is known for its natural springs, which were believed to have healing properties. The economy of Augusta Springs is largely based on agriculture, with a number of farms producing a variety of crops and livestock. The population of Augusta Springs is largely white, with a median household income of $45,000 and a median age of 44.
Common Questions
What is Per Capita Income in Augusta Springs?
Per Capita income in Augusta Springs is $27,132.
What is the Median Household income in Augusta Springs?
Median Household Income in Augusta Springs is $78,333.
What is Inequality or Gini Index in Augusta Springs?
Inequality or Gini Index in Augusta Springs is 0.31.
What is the Total Population of Augusta Springs?
Total Population of Augusta Springs is 124.
What is the Total Male Population of Augusta Springs?
Total Male Population of Augusta Springs is 54.
What is the Total Female Population of Augusta Springs?
Total Female Population of Augusta Springs is 70.
What is the Ratio of Males per 100 Females in Augusta Springs?
There are 77.14 Males per 100 Females in Augusta Springs.
What is the Ratio of Females per 100 Males in Augusta Springs?
There are 129.63 Females per 100 Males in Augusta Springs.
What is the Median Population Age in Augusta Springs?
Median Population Age in Augusta Springs is 22.9 Years.
What is the Average Family Size in Augusta Springs
Average Family Size in Augusta Springs is 2.9 People.
What is the Average Household Size in Augusta Springs
Average Household Size in Augusta Springs is 2.8 People.
How Large is the Labor Force in Augusta Springs?
There are 79 People in the Labor Forcein in Augusta Springs.
What is the Percentage of People in the Labor Force in Augusta Springs?
91.9% of People are in the Labor Force in Augusta Springs.