Schuyler, VA Map & Demographics
Schuyler Map
Schuyler Overview
$21,261
PER CAPITA INCOME
9.5%
WAGE / INCOME GAP [ % ]
90.5¢/ $1
WAGE / INCOME GAP [ $ ]
0.44
INEQUALITY / GINI INDEX
323
TOTAL POPULATION
208
MALE POPULATION
115
FEMALE POPULATION
180.87
MALES / 100 FEMALES
55.29
FEMALES / 100 MALES
58.4
MEDIAN AGE
2.6
AVG FAMILY SIZE
2.3
AVG HOUSEHOLD SIZE
162
LABOR FORCE [ PEOPLE ]
55.3%
PERCENT IN LABOR FORCE
Schuyler Zip Codes
Schuyler Area Codes
Income in Schuyler
Income Overview in Schuyler
| Characteristic | Number | Measure |
| Per Capita Income | 323 | $21,261 |
| Median Family Income | 83 | $0 |
| Mean Family Income | 83 | $45,029 |
| Median Household Income | 143 | $0 |
| Mean Household Income | 143 | $44,052 |
| Income Deficit | 83 | $0 |
| Wage / Income Gap (%) | 323 | 9.46% |
| Wage / Income Gap ($) | 323 | 90.54¢ per $1 |
| Gini / Inequality Index | 323 | 0.44 |
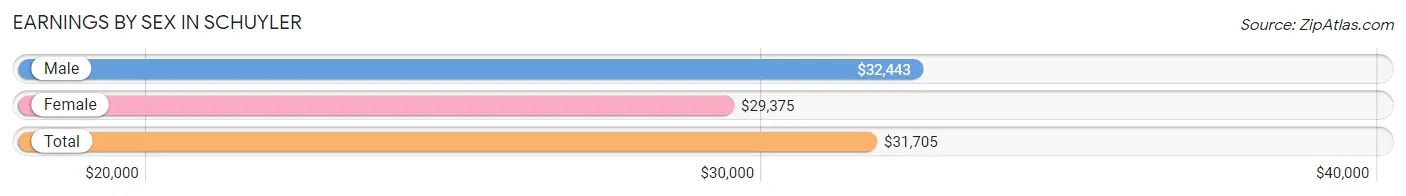
Earnings by Sex in Schuyler
Average Earnings in Schuyler are $31,705, $32,443 for men and $29,375 for women, a difference of 9.5%.
| Sex | Number | Average Earnings |
| Male | 99 (61.1%) | $32,443 |
| Female | 63 (38.9%) | $29,375 |
| Total | 162 (100.0%) | $31,705 |
Earnings by Sex by Income Bracket in Schuyler
The most common earnings brackets in Schuyler are $30,000 to $34,999 for men (42 | 42.4%) and $25,000 to $29,999 for women (26 | 41.3%).
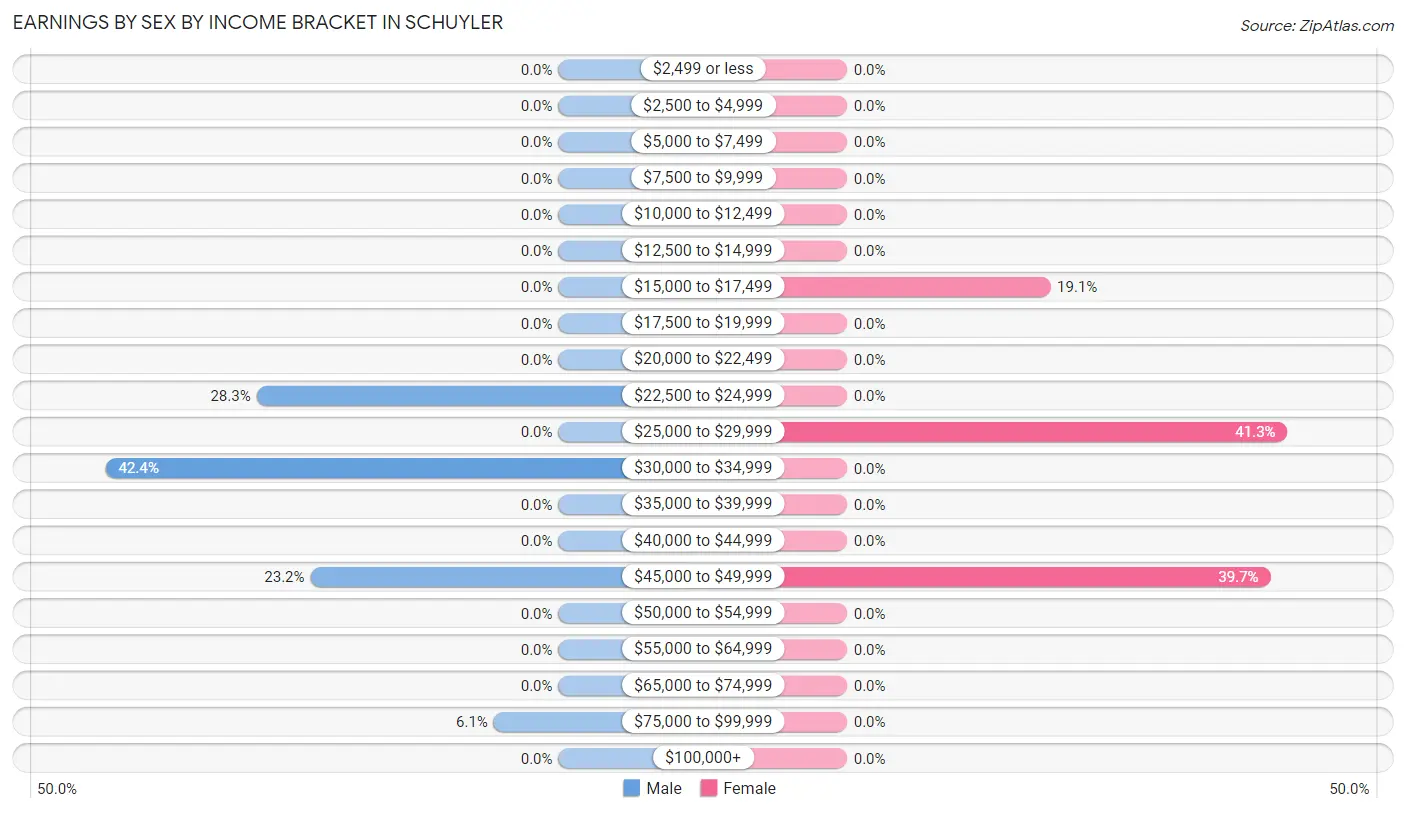
| Income | Male | Female |
| $2,499 or less | 0 (0.0%) | 0 (0.0%) |
| $2,500 to $4,999 | 0 (0.0%) | 0 (0.0%) |
| $5,000 to $7,499 | 0 (0.0%) | 0 (0.0%) |
| $7,500 to $9,999 | 0 (0.0%) | 0 (0.0%) |
| $10,000 to $12,499 | 0 (0.0%) | 0 (0.0%) |
| $12,500 to $14,999 | 0 (0.0%) | 0 (0.0%) |
| $15,000 to $17,499 | 0 (0.0%) | 12 (19.1%) |
| $17,500 to $19,999 | 0 (0.0%) | 0 (0.0%) |
| $20,000 to $22,499 | 0 (0.0%) | 0 (0.0%) |
| $22,500 to $24,999 | 28 (28.3%) | 0 (0.0%) |
| $25,000 to $29,999 | 0 (0.0%) | 26 (41.3%) |
| $30,000 to $34,999 | 42 (42.4%) | 0 (0.0%) |
| $35,000 to $39,999 | 0 (0.0%) | 0 (0.0%) |
| $40,000 to $44,999 | 0 (0.0%) | 0 (0.0%) |
| $45,000 to $49,999 | 23 (23.2%) | 25 (39.7%) |
| $50,000 to $54,999 | 0 (0.0%) | 0 (0.0%) |
| $55,000 to $64,999 | 0 (0.0%) | 0 (0.0%) |
| $65,000 to $74,999 | 0 (0.0%) | 0 (0.0%) |
| $75,000 to $99,999 | 6 (6.1%) | 0 (0.0%) |
| $100,000+ | 0 (0.0%) | 0 (0.0%) |
| Total | 99 (100.0%) | 63 (100.0%) |
Earnings by Sex by Educational Attainment in Schuyler
| Educational Attainment | Male Income | Female Income |
| Less than High School | - | - |
| High School Diploma | - | - |
| College or Associate's Degree | - | - |
| Bachelor's Degree | - | - |
| Graduate Degree | - | - |
| Total | $34,188 | $0 |
Family Income in Schuyler
Family Income Brackets in Schuyler
According to the Schuyler family income data, there are 52 families falling into the less than $10,000 income range, which is the most common income bracket and makes up 62.6% of all families.
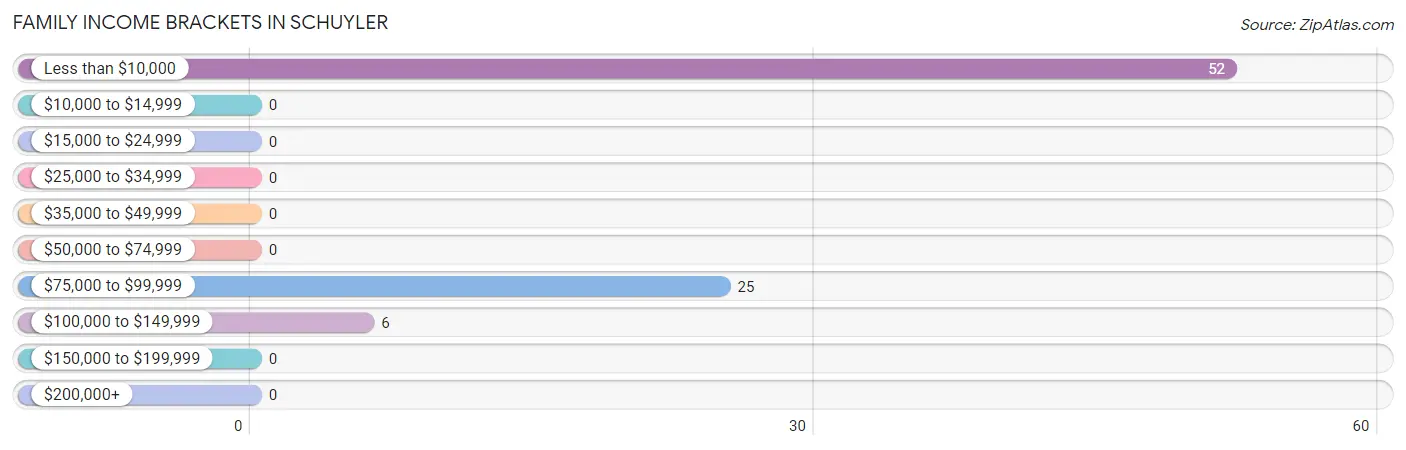
| Income Bracket | # Families | % Families |
| Less than $10,000 | 52 | 62.7% |
| $10,000 to $14,999 | 0 | 0.0% |
| $15,000 to $24,999 | 0 | 0.0% |
| $25,000 to $34,999 | 0 | 0.0% |
| $35,000 to $49,999 | 0 | 0.0% |
| $50,000 to $74,999 | 0 | 0.0% |
| $75,000 to $99,999 | 25 | 30.1% |
| $100,000 to $149,999 | 6 | 7.2% |
| $150,000 to $199,999 | 0 | 0.0% |
| $200,000+ | 0 | 0.0% |
Family Income by Famaliy Size in Schuyler
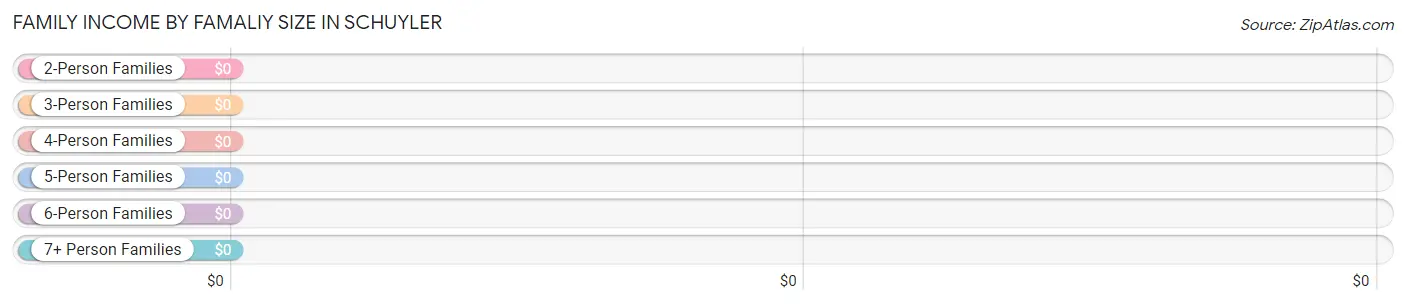
| Income Bracket | # Families | Median Income |
| 2-Person Families | 58 (69.9%) | $0 |
| 3-Person Families | 0 (0.0%) | $0 |
| 4-Person Families | 25 (30.1%) | $0 |
| 5-Person Families | 0 (0.0%) | $0 |
| 6-Person Families | 0 (0.0%) | $0 |
| 7+ Person Families | 0 (0.0%) | $0 |
| Total | 83 (100.0%) | $0 |
Family Income by Number of Earners in Schuyler
| Number of Earners | # Families | Median Income |
| No Earners | 52 (62.6%) | $0 |
| 1 Earner | 0 (0.0%) | $0 |
| 2 Earners | 31 (37.3%) | $0 |
| 3+ Earners | 0 (0.0%) | $0 |
| Total | 83 (100.0%) | $0 |
Household Income in Schuyler
Household Income Brackets in Schuyler
With 52 households falling in the category, the less than $10,000 income range is the most frequent in Schuyler, accounting for 36.4% of all households.
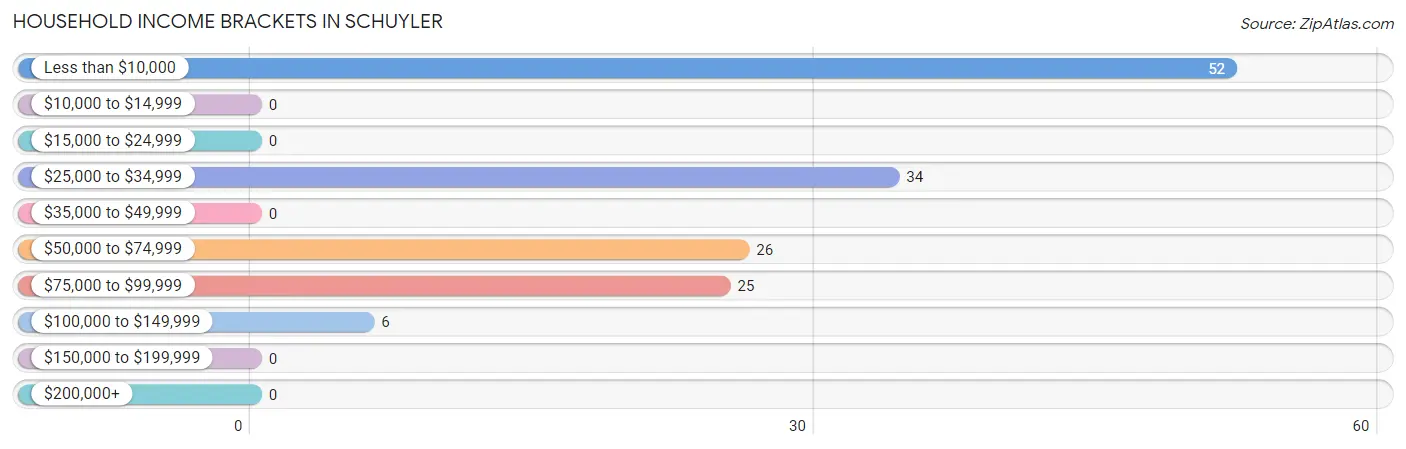
| Income Bracket | # Households | % Households |
| Less than $10,000 | 52 | 36.4% |
| $10,000 to $14,999 | 0 | 0.0% |
| $15,000 to $24,999 | 0 | 0.0% |
| $25,000 to $34,999 | 34 | 23.8% |
| $35,000 to $49,999 | 0 | 0.0% |
| $50,000 to $74,999 | 26 | 18.2% |
| $75,000 to $99,999 | 25 | 17.5% |
| $100,000 to $149,999 | 6 | 4.2% |
| $150,000 to $199,999 | 0 | 0.0% |
| $200,000+ | 0 | 0.0% |
Household Income by Householder Age in Schuyler
| Income Bracket | # Households | Median Income |
| 15 to 24 Years | 26 (18.2%) | $0 |
| 25 to 44 Years | 25 (17.5%) | $0 |
| 45 to 64 Years | 86 (60.1%) | $0 |
| 65+ Years | 6 (4.2%) | $0 |
| Total | 143 (100.0%) | $0 |
Poverty in Schuyler
Income Below Poverty by Sex and Age in Schuyler
With 38.0% poverty level for males and 45.2% for females among the residents of Schuyler, 65 to 74 year old males and 55 to 64 year old females are the most vulnerable to poverty, with 59 males (90.8%) and 52 females (81.2%) in their respective age groups living below the poverty level.
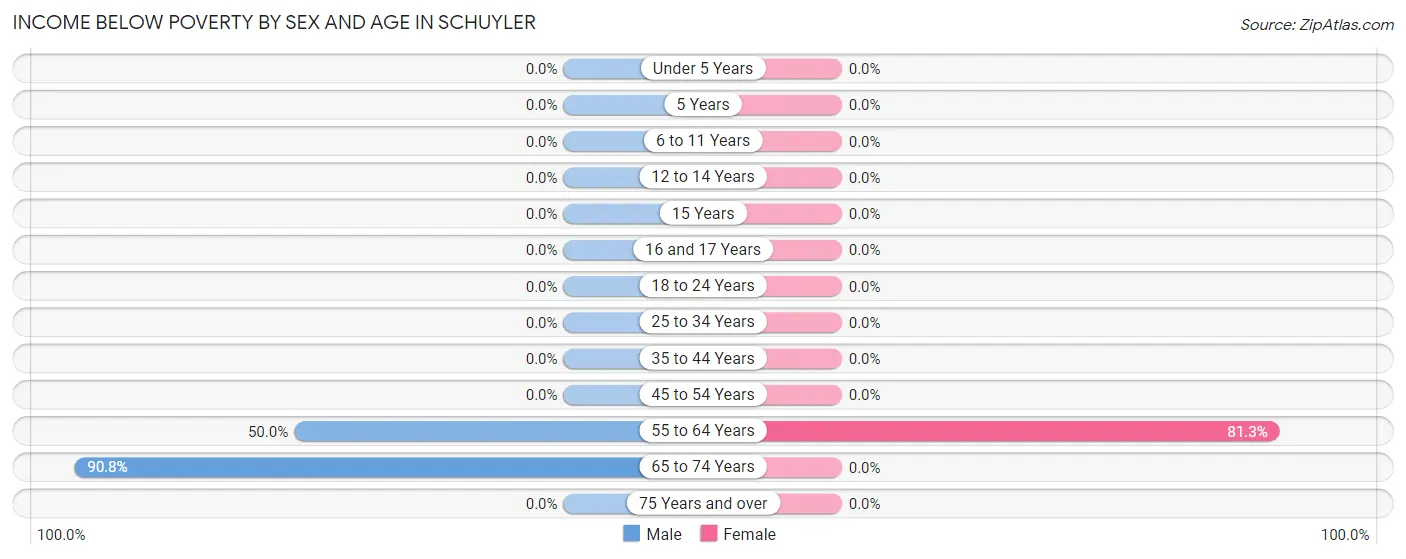
| Age Bracket | Male | Female |
| Under 5 Years | 0 (0.0%) | 0 (0.0%) |
| 5 Years | 0 (0.0%) | 0 (0.0%) |
| 6 to 11 Years | 0 (0.0%) | 0 (0.0%) |
| 12 to 14 Years | 0 (0.0%) | 0 (0.0%) |
| 15 Years | 0 (0.0%) | 0 (0.0%) |
| 16 and 17 Years | 0 (0.0%) | 0 (0.0%) |
| 18 to 24 Years | 0 (0.0%) | 0 (0.0%) |
| 25 to 34 Years | 0 (0.0%) | 0 (0.0%) |
| 35 to 44 Years | 0 (0.0%) | 0 (0.0%) |
| 45 to 54 Years | 0 (0.0%) | 0 (0.0%) |
| 55 to 64 Years | 20 (50.0%) | 52 (81.2%) |
| 65 to 74 Years | 59 (90.8%) | 0 (0.0%) |
| 75 Years and over | 0 (0.0%) | 0 (0.0%) |
| Total | 79 (38.0%) | 52 (45.2%) |
Income Above Poverty by Sex and Age in Schuyler
According to the poverty statistics in Schuyler, males aged 6 to 11 years and females aged 18 to 24 years are the age groups that are most secure financially, with 100.0% of males and 100.0% of females in these age groups living above the poverty line.
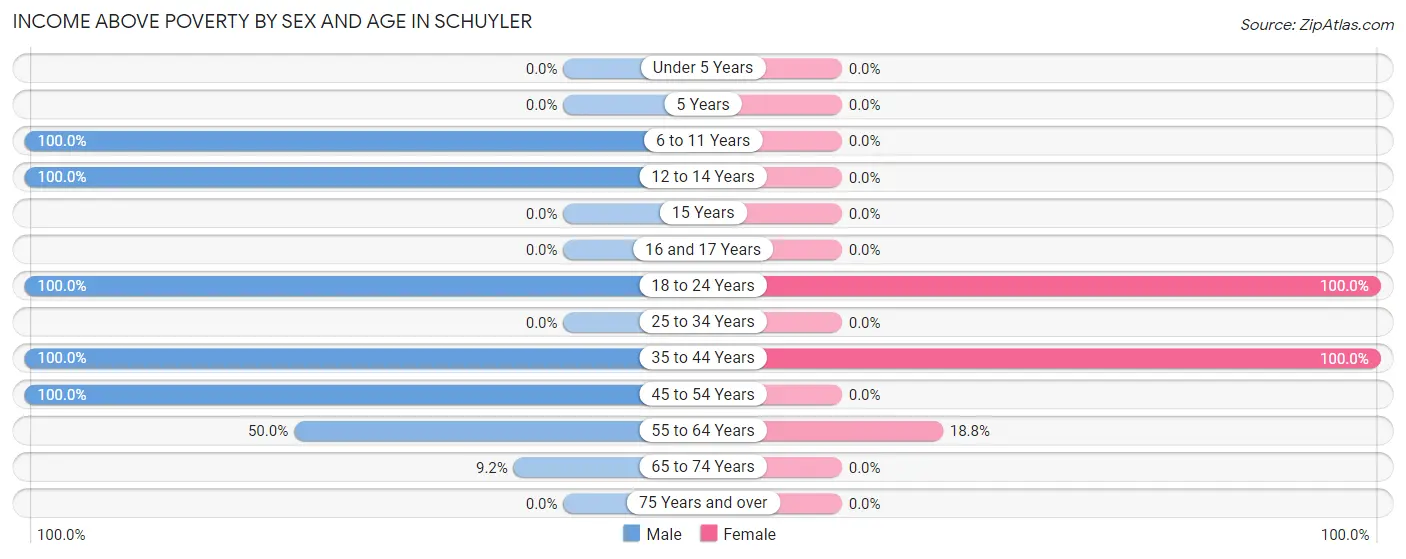
| Age Bracket | Male | Female |
| Under 5 Years | 0 (0.0%) | 0 (0.0%) |
| 5 Years | 0 (0.0%) | 0 (0.0%) |
| 6 to 11 Years | 15 (100.0%) | 0 (0.0%) |
| 12 to 14 Years | 15 (100.0%) | 0 (0.0%) |
| 15 Years | 0 (0.0%) | 0 (0.0%) |
| 16 and 17 Years | 0 (0.0%) | 0 (0.0%) |
| 18 to 24 Years | 28 (100.0%) | 26 (100.0%) |
| 25 to 34 Years | 0 (0.0%) | 0 (0.0%) |
| 35 to 44 Years | 23 (100.0%) | 25 (100.0%) |
| 45 to 54 Years | 22 (100.0%) | 0 (0.0%) |
| 55 to 64 Years | 20 (50.0%) | 12 (18.8%) |
| 65 to 74 Years | 6 (9.2%) | 0 (0.0%) |
| 75 Years and over | 0 (0.0%) | 0 (0.0%) |
| Total | 129 (62.0%) | 63 (54.8%) |
Income Below Poverty Among Married-Couple Families in Schuyler
The poverty statistics for married-couple families in Schuyler show that 67.5% or 52 of the total 77 families live below the poverty line. Families with no children have the highest poverty rate of 100.0%, comprising of 52 families. On the other hand, families with 1 or 2 children have the lowest poverty rate of 0.0%, which includes 0 families.
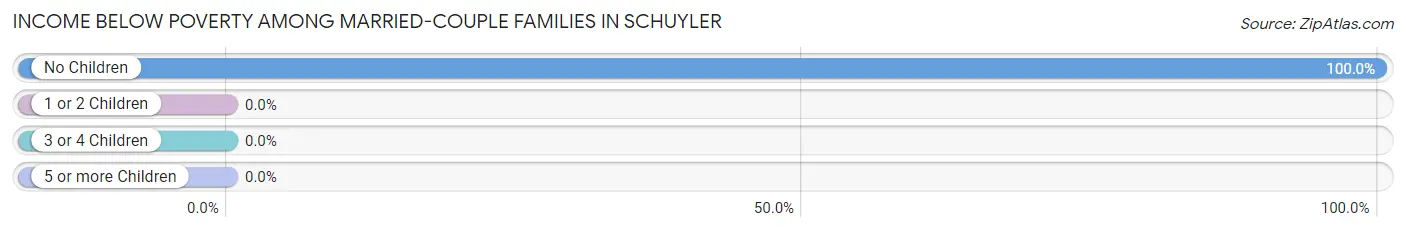
| Children | Above Poverty | Below Poverty |
| No Children | 0 (0.0%) | 52 (100.0%) |
| 1 or 2 Children | 25 (100.0%) | 0 (0.0%) |
| 3 or 4 Children | 0 (0.0%) | 0 (0.0%) |
| 5 or more Children | 0 (0.0%) | 0 (0.0%) |
| Total | 25 (32.5%) | 52 (67.5%) |
Income Below Poverty Among Single-Parent Households in Schuyler
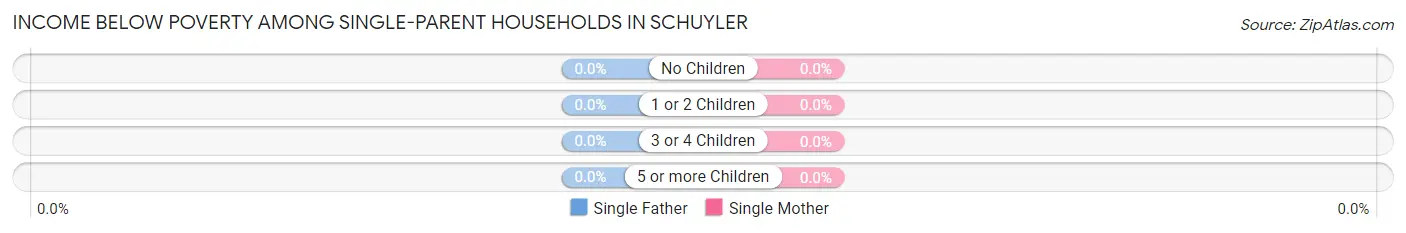
| Children | Single Father | Single Mother |
| No Children | 0 (0.0%) | 0 (0.0%) |
| 1 or 2 Children | 0 (0.0%) | 0 (0.0%) |
| 3 or 4 Children | 0 (0.0%) | 0 (0.0%) |
| 5 or more Children | 0 (0.0%) | 0 (0.0%) |
| Total | 0 (0.0%) | 0 (0.0%) |
Income Below Poverty Among Married-Couple vs Single-Parent Households in Schuyler
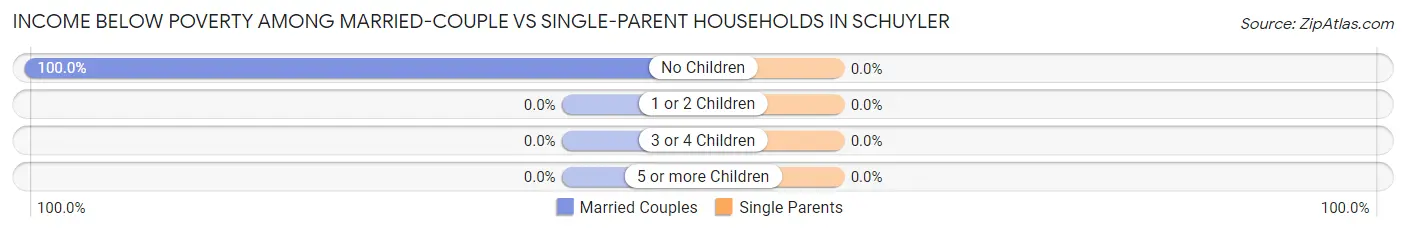
| Children | Married-Couple Families | Single-Parent Households |
| No Children | 52 (100.0%) | 0 (0.0%) |
| 1 or 2 Children | 0 (0.0%) | 0 (0.0%) |
| 3 or 4 Children | 0 (0.0%) | 0 (0.0%) |
| 5 or more Children | 0 (0.0%) | 0 (0.0%) |
| Total | 52 (67.5%) | 0 (0.0%) |
Race in Schuyler
The most populous races in Schuyler are , and White / Caucasian (323 | 100.0%).
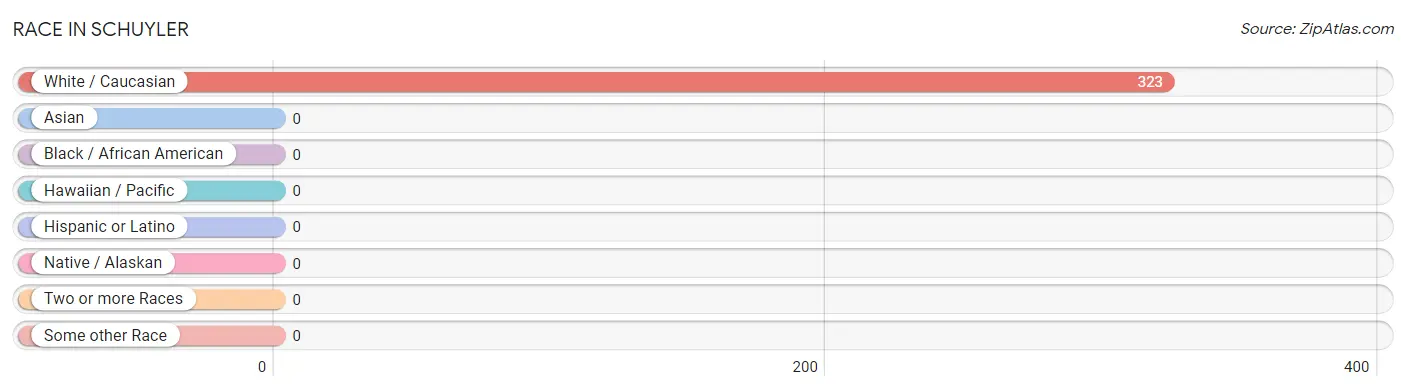
| Race | # Population | % Population |
| Asian | 0 | 0.0% |
| Black / African American | 0 | 0.0% |
| Hawaiian / Pacific | 0 | 0.0% |
| Hispanic or Latino | 0 | 0.0% |
| Native / Alaskan | 0 | 0.0% |
| White / Caucasian | 323 | 100.0% |
| Two or more Races | 0 | 0.0% |
| Some other Race | 0 | 0.0% |
| Total | 323 | 100.0% |
Ancestry in Schuyler
The most populous ancestries reported in Schuyler are American (78 | 24.1%), German (54 | 16.7%), Irish (48 | 14.9%), and English (20 | 6.2%), together accounting for 61.9% of all Schuyler residents.
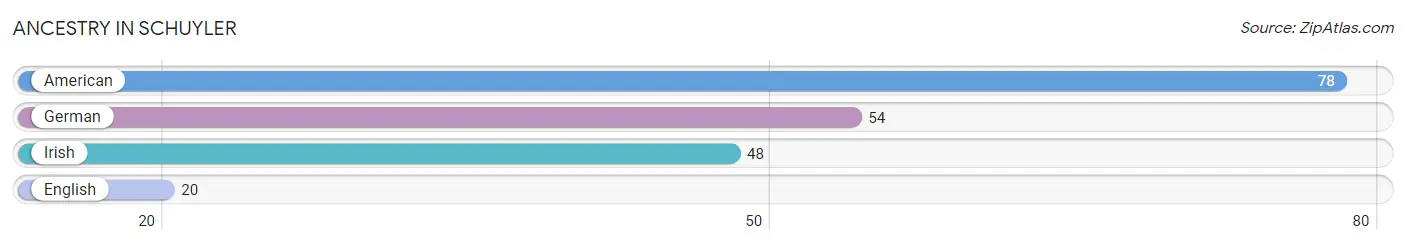
| Ancestry | # Population | % Population |
| American | 78 | 24.1% |
| English | 20 | 6.2% |
| German | 54 | 16.7% |
| Irish | 48 | 14.9% | View All 4 Rows |
Immigrants in Schuyler

| Immigration Origin | # Population | % Population | View All 0 Rows |
Sex and Age in Schuyler
Sex and Age in Schuyler
The most populous age groups in Schuyler are 65 to 69 Years (65 | 31.2%) for men and 60 to 64 Years (64 | 55.6%) for women.
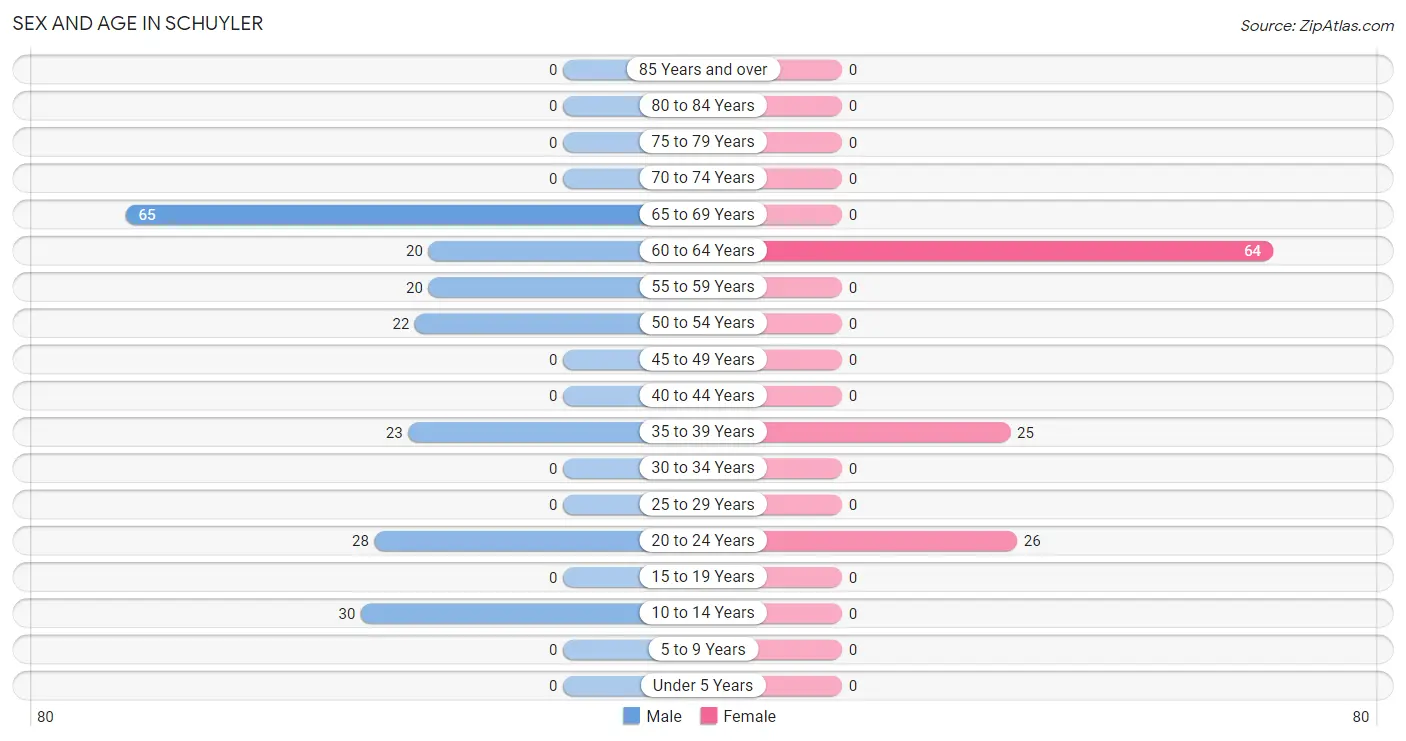
| Age Bracket | Male | Female |
| Under 5 Years | 0 (0.0%) | 0 (0.0%) |
| 5 to 9 Years | 0 (0.0%) | 0 (0.0%) |
| 10 to 14 Years | 30 (14.4%) | 0 (0.0%) |
| 15 to 19 Years | 0 (0.0%) | 0 (0.0%) |
| 20 to 24 Years | 28 (13.5%) | 26 (22.6%) |
| 25 to 29 Years | 0 (0.0%) | 0 (0.0%) |
| 30 to 34 Years | 0 (0.0%) | 0 (0.0%) |
| 35 to 39 Years | 23 (11.1%) | 25 (21.7%) |
| 40 to 44 Years | 0 (0.0%) | 0 (0.0%) |
| 45 to 49 Years | 0 (0.0%) | 0 (0.0%) |
| 50 to 54 Years | 22 (10.6%) | 0 (0.0%) |
| 55 to 59 Years | 20 (9.6%) | 0 (0.0%) |
| 60 to 64 Years | 20 (9.6%) | 64 (55.6%) |
| 65 to 69 Years | 65 (31.2%) | 0 (0.0%) |
| 70 to 74 Years | 0 (0.0%) | 0 (0.0%) |
| 75 to 79 Years | 0 (0.0%) | 0 (0.0%) |
| 80 to 84 Years | 0 (0.0%) | 0 (0.0%) |
| 85 Years and over | 0 (0.0%) | 0 (0.0%) |
| Total | 208 (100.0%) | 115 (100.0%) |
Families and Households in Schuyler
Median Family Size in Schuyler
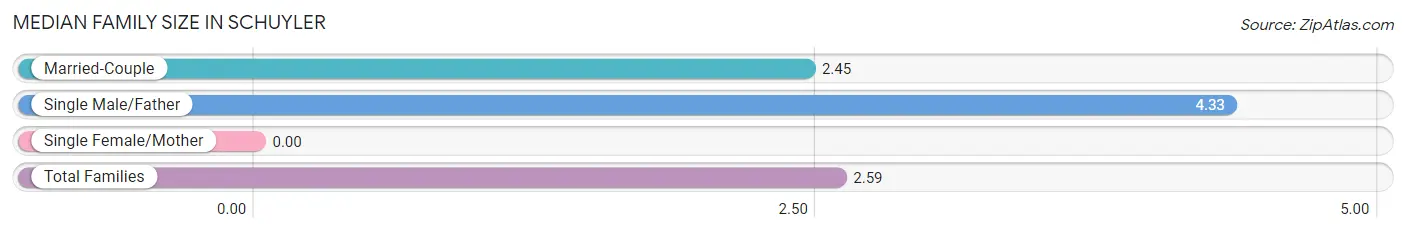
| Family Type | # Families | Family Size |
| Married-Couple | 77 (92.8%) | 2.45 |
| Single Male/Father | 6 (7.2%) | 4.33 |
| Single Female/Mother | 0 (0.0%) | - |
| Total Families | 83 (100.0%) | 2.59 |
Median Household Size in Schuyler
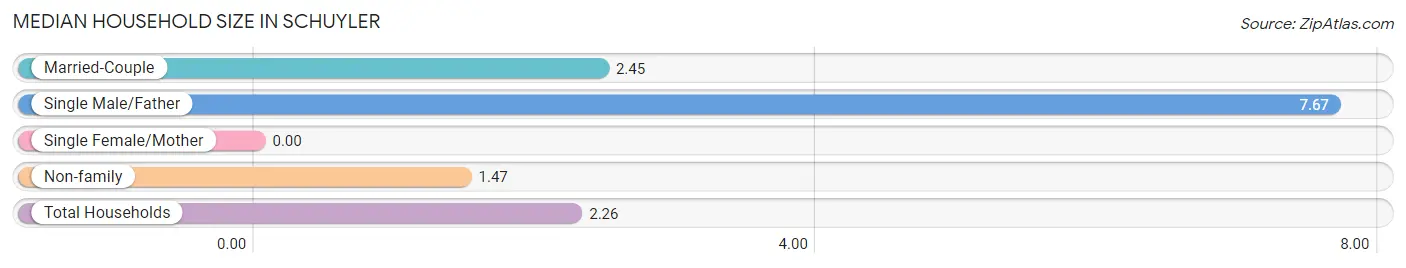
| Household Type | # Households | Household Size |
| Married-Couple | 77 (53.8%) | 2.45 |
| Single Male/Father | 6 (4.2%) | 7.67 |
| Single Female/Mother | 0 (0.0%) | - |
| Non-family | 60 (42.0%) | 1.47 |
| Total Households | 143 (100.0%) | 2.26 |
Household Size by Marriage Status in Schuyler
Out of a total of 143 households in Schuyler, 83 (58.0%) are family households, while 60 (42.0%) are nonfamily households. The most numerous type of family households are 2-person households, comprising 52, and the most common type of nonfamily households are 1-person households, comprising 34.
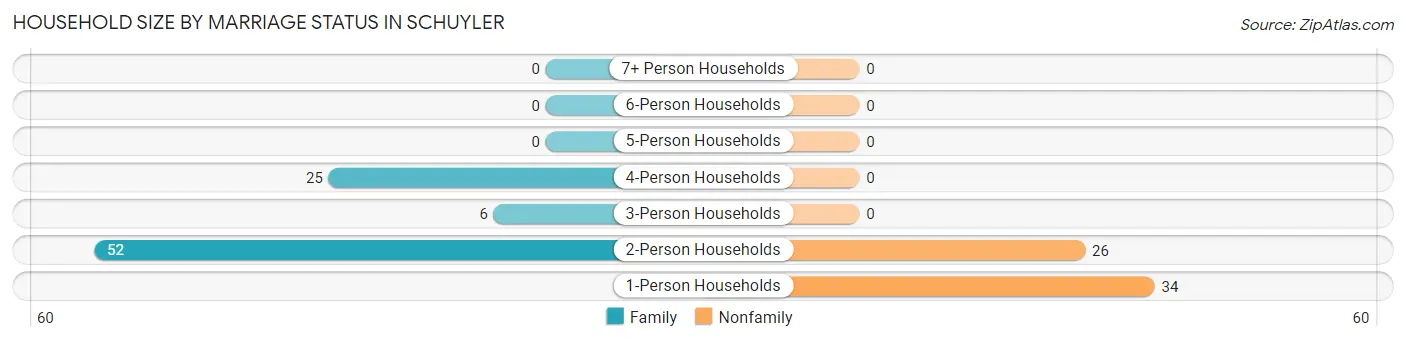
| Household Size | Family Households | Nonfamily Households |
| 1-Person Households | - | 34 (23.8%) |
| 2-Person Households | 52 (36.4%) | 26 (18.2%) |
| 3-Person Households | 6 (4.2%) | 0 (0.0%) |
| 4-Person Households | 25 (17.5%) | 0 (0.0%) |
| 5-Person Households | 0 (0.0%) | 0 (0.0%) |
| 6-Person Households | 0 (0.0%) | 0 (0.0%) |
| 7+ Person Households | 0 (0.0%) | 0 (0.0%) |
| Total | 83 (58.0%) | 60 (42.0%) |
Female Fertility in Schuyler
Fertility by Age in Schuyler
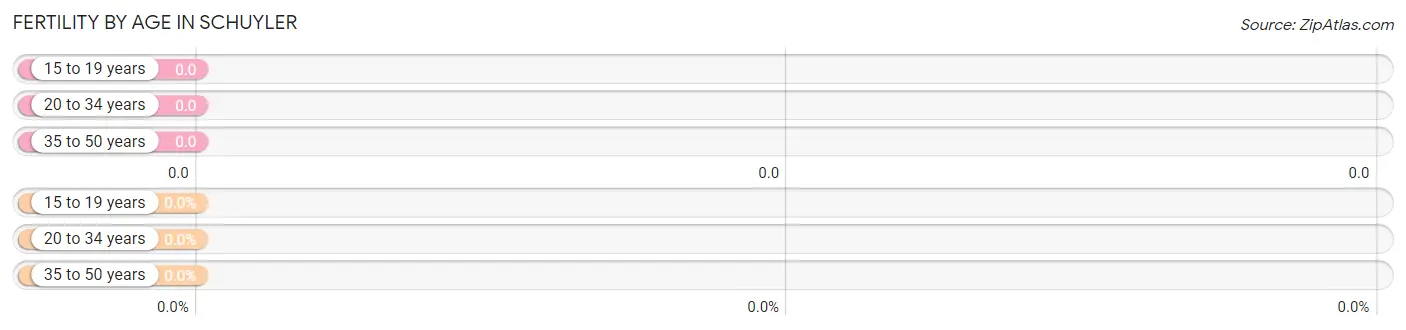
| Age Bracket | Women with Births | Births / 1,000 Women |
| 15 to 19 years | 0 (0.0%) | 0.0 |
| 20 to 34 years | 0 (0.0%) | 0.0 |
| 35 to 50 years | 0 (0.0%) | 0.0 |
| Total | 0 (0.0%) | 0.0 |
Fertility by Age by Marriage Status in Schuyler
| Age Bracket | Married | Unmarried |
| 15 to 19 years | 0 (0.0%) | 0 (0.0%) |
| 20 to 34 years | 0 (0.0%) | 0 (0.0%) |
| 35 to 50 years | 0 (0.0%) | 0 (0.0%) |
| Total | 0 (0.0%) | 0 (0.0%) |
Fertility by Education in Schuyler
| Educational Attainment | Women with Births | Births / 1,000 Women |
| Less than High School | 0 (0.0%) | 0.0 |
| High School Diploma | 0 (0.0%) | 0.0 |
| College or Associate's Degree | 0 (0.0%) | 0.0 |
| Bachelor's Degree | 0 (0.0%) | 0.0 |
| Graduate Degree | 0 (0.0%) | 0.0 |
| Total | 0 (0.0%) | 0.0 |
Fertility by Education by Marriage Status in Schuyler
| Educational Attainment | Married | Unmarried |
| Less than High School | 0 (0.0%) | 0 (0.0%) |
| High School Diploma | 0 (0.0%) | 0 (0.0%) |
| College or Associate's Degree | 0 (0.0%) | 0 (0.0%) |
| Bachelor's Degree | 0 (0.0%) | 0 (0.0%) |
| Graduate Degree | 0 (0.0%) | 0 (0.0%) |
| Total | 0 (0.0%) | 0 (0.0%) |
Employment Characteristics in Schuyler
Employment by Class of Employer in Schuyler
Among the 162 employed individuals in Schuyler, private company employees (105 | 64.8%), local government employees (26 | 16.1%), and not-for-profit organizations (25 | 15.4%) make up the most common classes of employment.
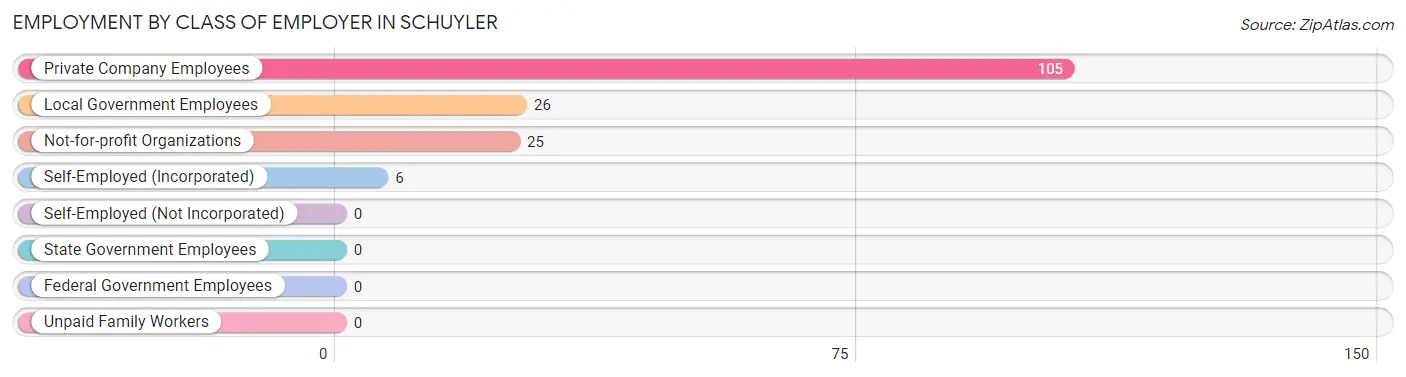
| Employer Class | # Employees | % Employees |
| Private Company Employees | 105 | 64.8% |
| Self-Employed (Incorporated) | 6 | 3.7% |
| Self-Employed (Not Incorporated) | 0 | 0.0% |
| Not-for-profit Organizations | 25 | 15.4% |
| Local Government Employees | 26 | 16.1% |
| State Government Employees | 0 | 0.0% |
| Federal Government Employees | 0 | 0.0% |
| Unpaid Family Workers | 0 | 0.0% |
| Total | 162 | 100.0% |
Employment Status by Age in Schuyler
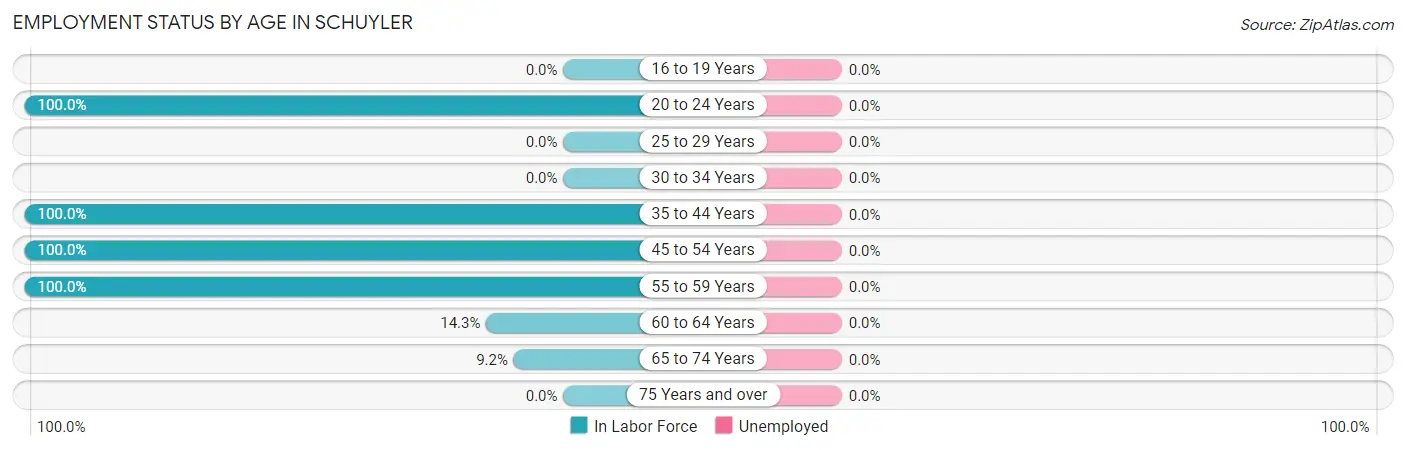
| Age Bracket | In Labor Force | Unemployed |
| 16 to 19 Years | 0 (0.0%) | 0 (0.0%) |
| 20 to 24 Years | 54 (100.0%) | 0 (0.0%) |
| 25 to 29 Years | 0 (0.0%) | 0 (0.0%) |
| 30 to 34 Years | 0 (0.0%) | 0 (0.0%) |
| 35 to 44 Years | 48 (100.0%) | 0 (0.0%) |
| 45 to 54 Years | 22 (100.0%) | 0 (0.0%) |
| 55 to 59 Years | 20 (100.0%) | 0 (0.0%) |
| 60 to 64 Years | 12 (14.3%) | 0 (0.0%) |
| 65 to 74 Years | 6 (9.2%) | 0 (0.0%) |
| 75 Years and over | 0 (0.0%) | 0 (0.0%) |
| Total | 162 (55.3%) | 0 (0.0%) |
Employment Status by Educational Attainment in Schuyler
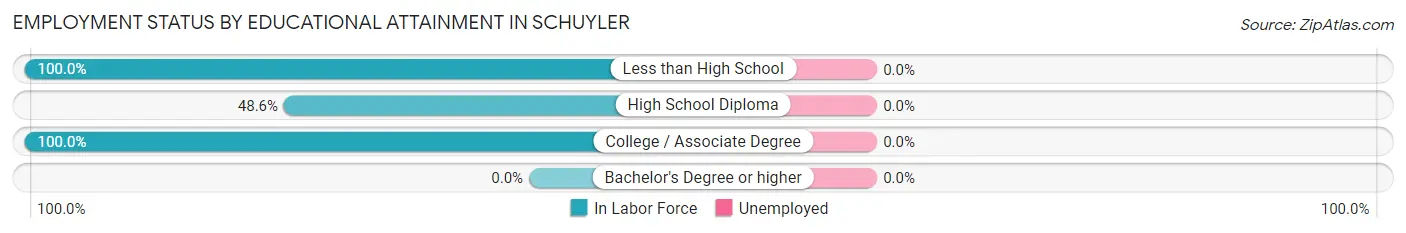
| Educational Attainment | In Labor Force | Unemployed |
| Less than High School | 22 (100.0%) | 0 (0.0%) |
| High School Diploma | 68 (48.6%) | 0 (0.0%) |
| College / Associate Degree | 12 (100.0%) | 0 (0.0%) |
| Bachelor's Degree or higher | 0 (0.0%) | 0 (0.0%) |
| Total | 102 (58.6%) | 0 (0.0%) |
Employment Occupations by Sex in Schuyler
Management, Business, Science and Arts Occupations
The most common Management, Business, Science and Arts occupations in Schuyler are , and Management (25 | 15.4%).
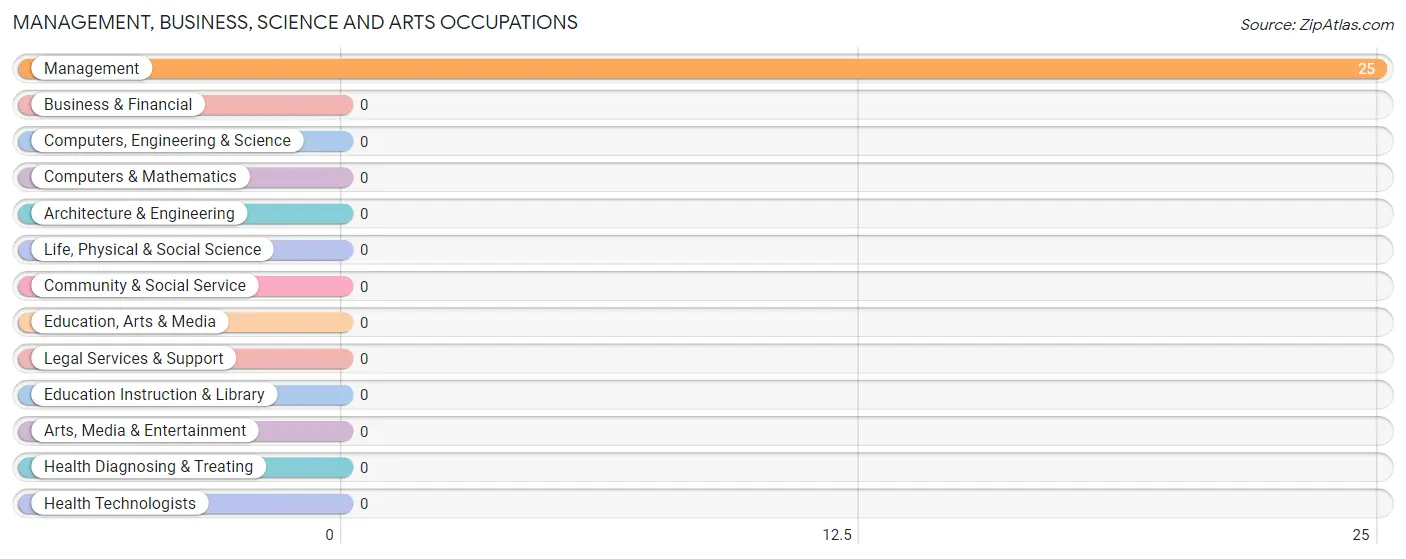
Management, Business, Science and Arts Occupations by Sex
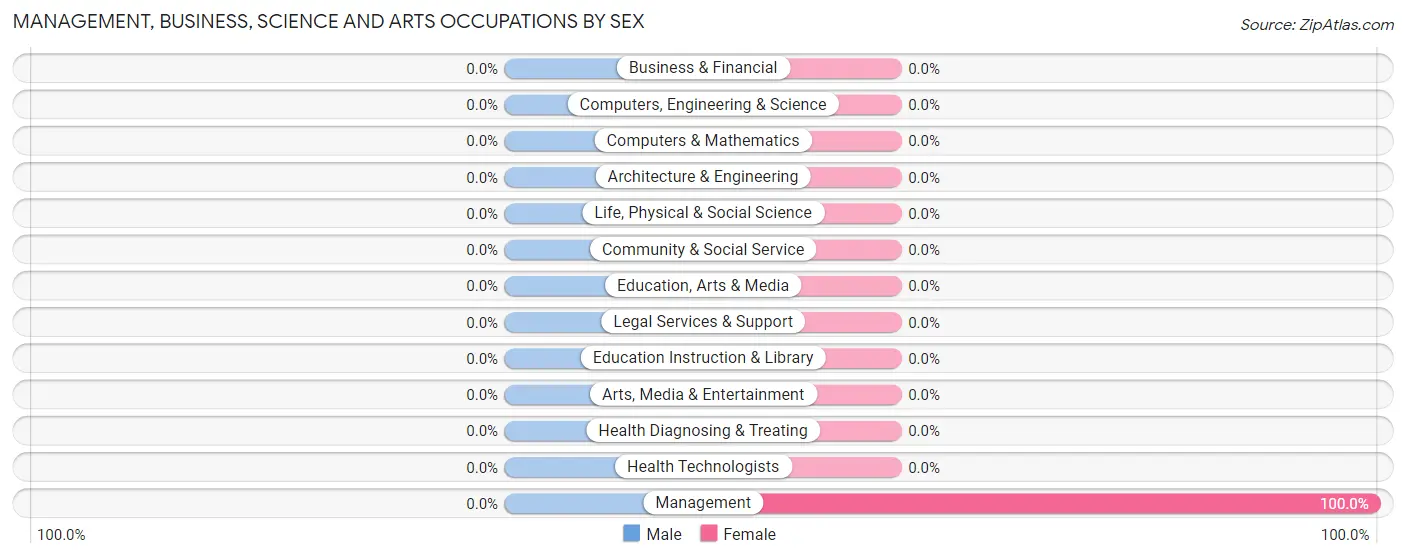
| Occupation | Male | Female |
| Management | 0 (0.0%) | 25 (100.0%) |
| Business & Financial | 0 (0.0%) | 0 (0.0%) |
| Computers, Engineering & Science | 0 (0.0%) | 0 (0.0%) |
| Computers & Mathematics | 0 (0.0%) | 0 (0.0%) |
| Architecture & Engineering | 0 (0.0%) | 0 (0.0%) |
| Life, Physical & Social Science | 0 (0.0%) | 0 (0.0%) |
| Community & Social Service | 0 (0.0%) | 0 (0.0%) |
| Education, Arts & Media | 0 (0.0%) | 0 (0.0%) |
| Legal Services & Support | 0 (0.0%) | 0 (0.0%) |
| Education Instruction & Library | 0 (0.0%) | 0 (0.0%) |
| Arts, Media & Entertainment | 0 (0.0%) | 0 (0.0%) |
| Health Diagnosing & Treating | 0 (0.0%) | 0 (0.0%) |
| Health Technologists | 0 (0.0%) | 0 (0.0%) |
| Total (Category) | 0 (0.0%) | 25 (100.0%) |
| Total (Overall) | 99 (61.1%) | 63 (38.9%) |
Services Occupations
The most common Services occupations in Schuyler are , and Personal Care & Service (38 | 23.5%).
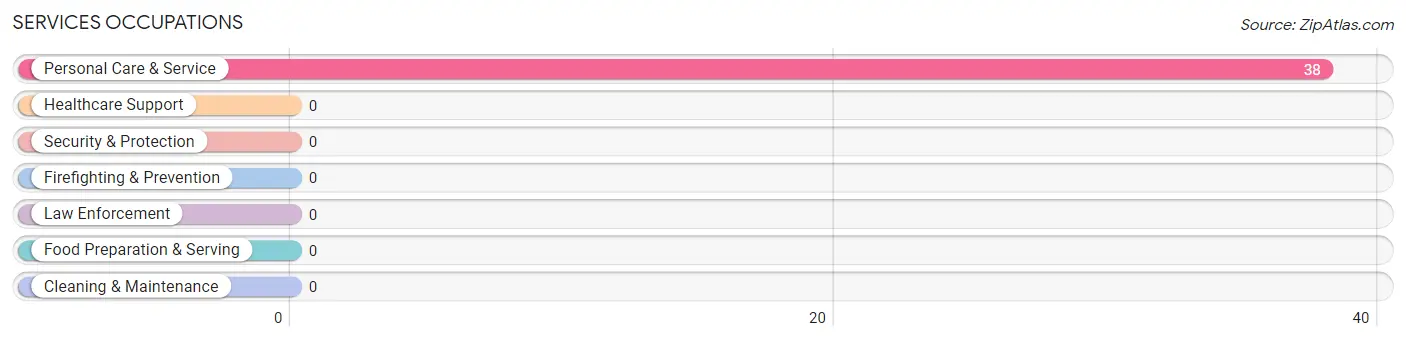
Services Occupations by Sex
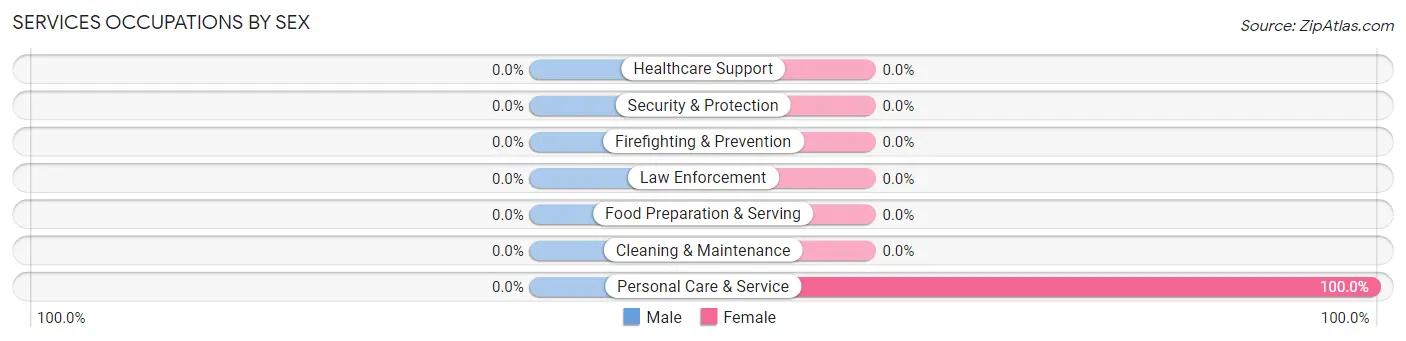
| Occupation | Male | Female |
| Healthcare Support | 0 (0.0%) | 0 (0.0%) |
| Security & Protection | 0 (0.0%) | 0 (0.0%) |
| Firefighting & Prevention | 0 (0.0%) | 0 (0.0%) |
| Law Enforcement | 0 (0.0%) | 0 (0.0%) |
| Food Preparation & Serving | 0 (0.0%) | 0 (0.0%) |
| Cleaning & Maintenance | 0 (0.0%) | 0 (0.0%) |
| Personal Care & Service | 0 (0.0%) | 38 (100.0%) |
| Total (Category) | 0 (0.0%) | 38 (100.0%) |
| Total (Overall) | 99 (61.1%) | 63 (38.9%) |
Sales and Office Occupations
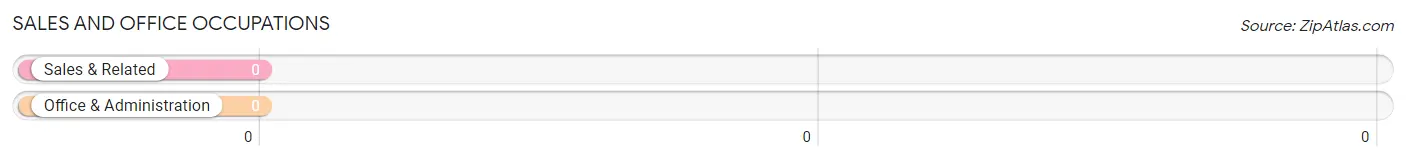
Sales and Office Occupations by Sex
| Occupation | Male | Female |
| Sales & Related | 0 (0.0%) | 0 (0.0%) |
| Office & Administration | 0 (0.0%) | 0 (0.0%) |
| Total (Category) | 0 (0.0%) | 0 (0.0%) |
| Total (Overall) | 99 (61.1%) | 63 (38.9%) |
Natural Resources, Construction and Maintenance Occupations
The most common Natural Resources, Construction and Maintenance occupations in Schuyler are , and Construction & Extraction (76 | 46.9%).
Natural Resources, Construction and Maintenance Occupations by Sex
| Occupation | Male | Female |
| Farming, Fishing & Forestry | 0 (0.0%) | 0 (0.0%) |
| Construction & Extraction | 76 (100.0%) | 0 (0.0%) |
| Installation, Maintenance & Repair | 0 (0.0%) | 0 (0.0%) |
| Total (Category) | 76 (100.0%) | 0 (0.0%) |
| Total (Overall) | 99 (61.1%) | 63 (38.9%) |
Production, Transportation and Moving Occupations
The most common Production, Transportation and Moving occupations in Schuyler are , and Production (23 | 14.2%).
Production, Transportation and Moving Occupations by Sex
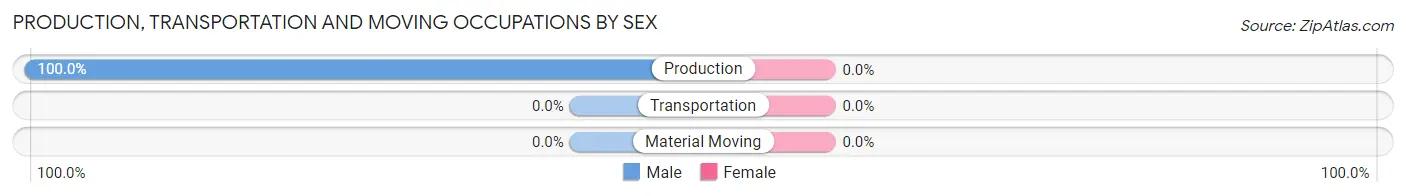
| Occupation | Male | Female |
| Production | 23 (100.0%) | 0 (0.0%) |
| Transportation | 0 (0.0%) | 0 (0.0%) |
| Material Moving | 0 (0.0%) | 0 (0.0%) |
| Total (Category) | 23 (100.0%) | 0 (0.0%) |
| Total (Overall) | 99 (61.1%) | 63 (38.9%) |
Employment Industries by Sex in Schuyler
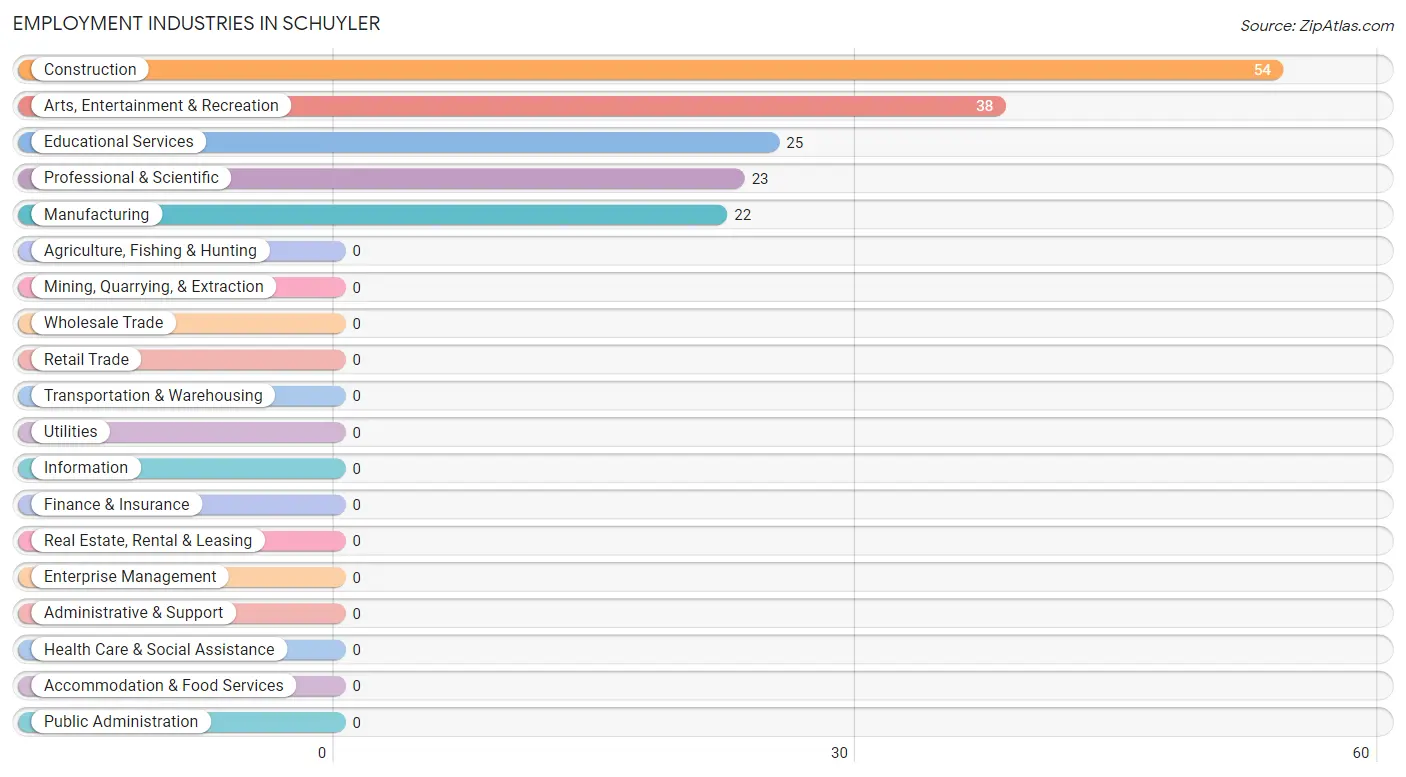
Employment Industries in Schuyler
The major employment industries in Schuyler include Construction (54 | 33.3%), Arts, Entertainment & Recreation (38 | 23.5%), Educational Services (25 | 15.4%), Professional & Scientific (23 | 14.2%), and Manufacturing (22 | 13.6%).
Employment Industries by Sex in Schuyler
The Schuyler industries that see more men than women are Construction (100.0%), Manufacturing (100.0%), and Professional & Scientific (100.0%), whereas the industries that tend to have a higher number of women are Educational Services (100.0%), and Arts, Entertainment & Recreation (100.0%).
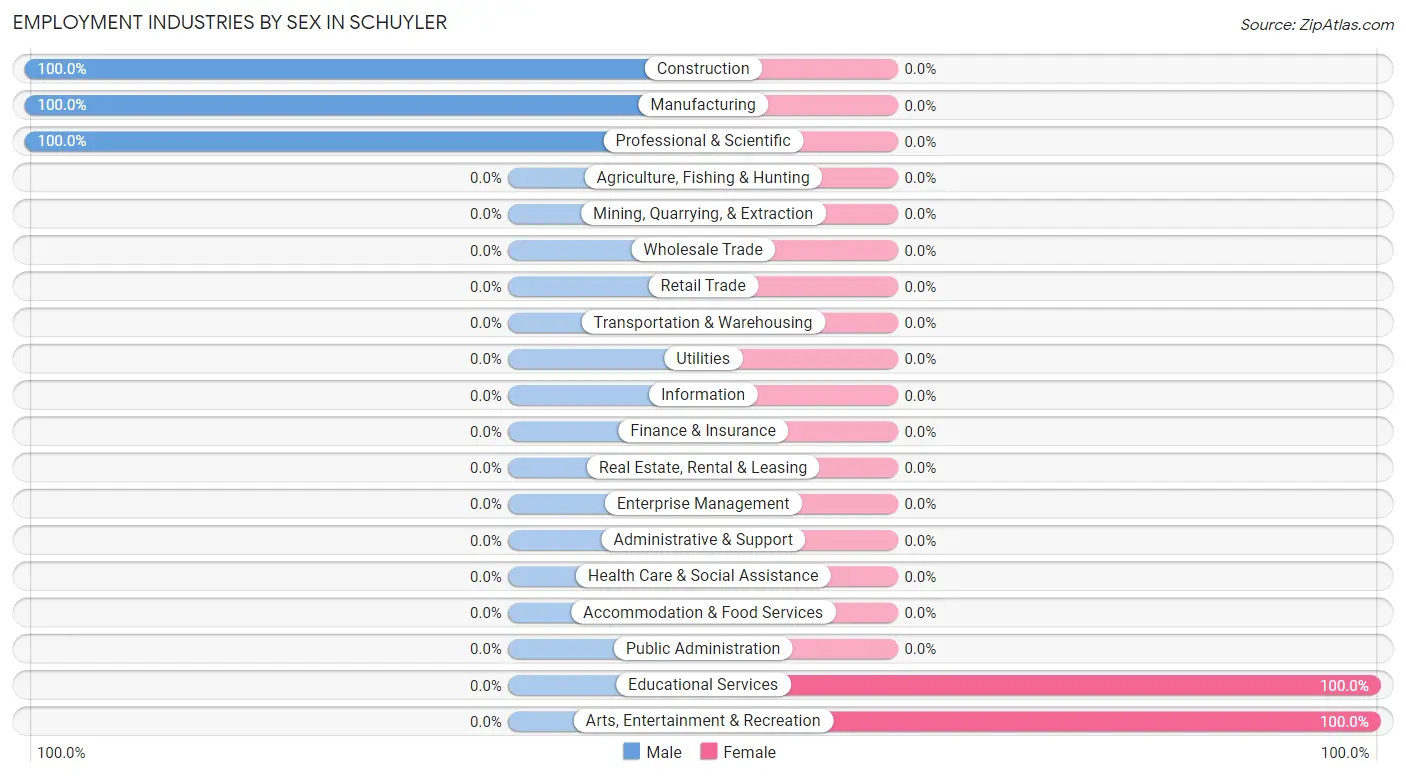
| Industry | Male | Female |
| Agriculture, Fishing & Hunting | 0 (0.0%) | 0 (0.0%) |
| Mining, Quarrying, & Extraction | 0 (0.0%) | 0 (0.0%) |
| Construction | 54 (100.0%) | 0 (0.0%) |
| Manufacturing | 22 (100.0%) | 0 (0.0%) |
| Wholesale Trade | 0 (0.0%) | 0 (0.0%) |
| Retail Trade | 0 (0.0%) | 0 (0.0%) |
| Transportation & Warehousing | 0 (0.0%) | 0 (0.0%) |
| Utilities | 0 (0.0%) | 0 (0.0%) |
| Information | 0 (0.0%) | 0 (0.0%) |
| Finance & Insurance | 0 (0.0%) | 0 (0.0%) |
| Real Estate, Rental & Leasing | 0 (0.0%) | 0 (0.0%) |
| Professional & Scientific | 23 (100.0%) | 0 (0.0%) |
| Enterprise Management | 0 (0.0%) | 0 (0.0%) |
| Administrative & Support | 0 (0.0%) | 0 (0.0%) |
| Educational Services | 0 (0.0%) | 25 (100.0%) |
| Health Care & Social Assistance | 0 (0.0%) | 0 (0.0%) |
| Arts, Entertainment & Recreation | 0 (0.0%) | 38 (100.0%) |
| Accommodation & Food Services | 0 (0.0%) | 0 (0.0%) |
| Public Administration | 0 (0.0%) | 0 (0.0%) |
| Total | 99 (61.1%) | 63 (38.9%) |
Education in Schuyler
School Enrollment in Schuyler
The most common levels of schooling among the 56 students in Schuyler are middle school (30 | 53.6%), and college / undergraduate (26 | 46.4%).
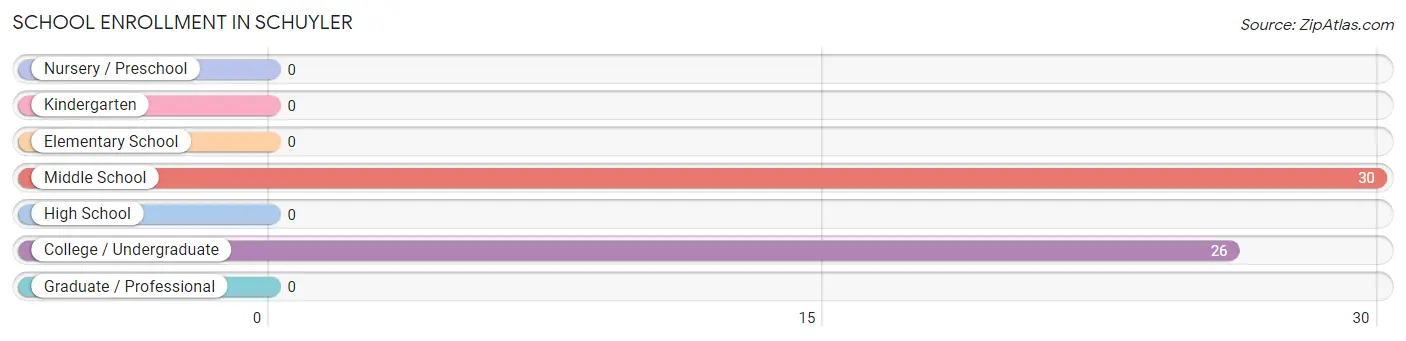
| School Level | # Students | % Students |
| Nursery / Preschool | 0 | 0.0% |
| Kindergarten | 0 | 0.0% |
| Elementary School | 0 | 0.0% |
| Middle School | 30 | 53.6% |
| High School | 0 | 0.0% |
| College / Undergraduate | 26 | 46.4% |
| Graduate / Professional | 0 | 0.0% |
| Total | 56 | 100.0% |
School Enrollment by Age by Funding Source in Schuyler
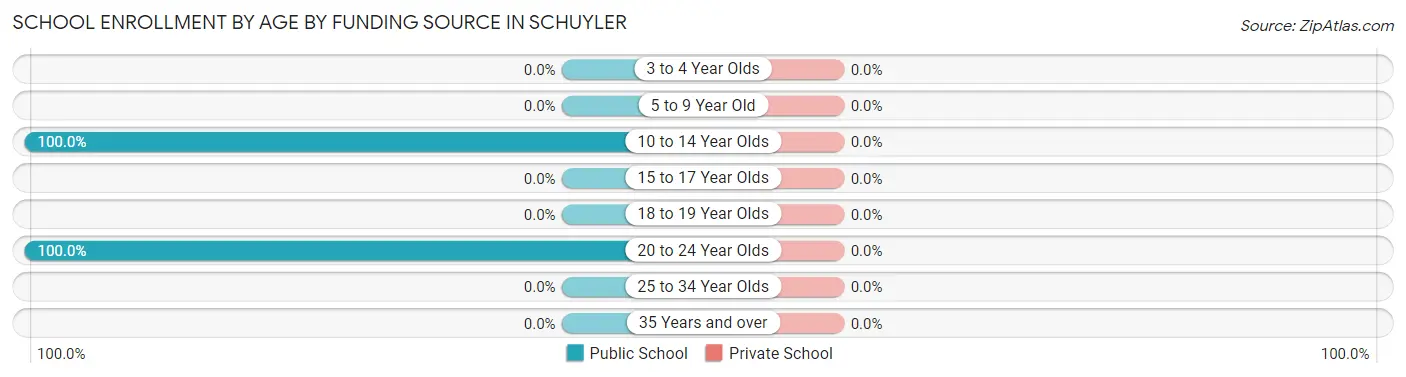
| Age Bracket | Public School | Private School |
| 3 to 4 Year Olds | 0 (0.0%) | 0 (0.0%) |
| 5 to 9 Year Old | 0 (0.0%) | 0 (0.0%) |
| 10 to 14 Year Olds | 30 (100.0%) | 0 (0.0%) |
| 15 to 17 Year Olds | 0 (0.0%) | 0 (0.0%) |
| 18 to 19 Year Olds | 0 (0.0%) | 0 (0.0%) |
| 20 to 24 Year Olds | 26 (100.0%) | 0 (0.0%) |
| 25 to 34 Year Olds | 0 (0.0%) | 0 (0.0%) |
| 35 Years and over | 0 (0.0%) | 0 (0.0%) |
| Total | 56 (100.0%) | 0 (0.0%) |
Educational Attainment by Field of Study in Schuyler
| Field of Study | # Graduates | % Graduates |
| Computers & Mathematics | 0 | 0.0% |
| Bio, Nature & Agricultural | 0 | 0.0% |
| Physical & Health Sciences | 0 | 0.0% |
| Psychology | 0 | 0.0% |
| Social Sciences | 0 | 0.0% |
| Engineering | 0 | 0.0% |
| Multidisciplinary Studies | 0 | 0.0% |
| Science & Technology | 0 | 0.0% |
| Business | 0 | 0.0% |
| Education | 0 | 0.0% |
| Literature & Languages | 0 | 0.0% |
| Liberal Arts & History | 0 | 0.0% |
| Visual & Performing Arts | 0 | 0.0% |
| Communications | 0 | 0.0% |
| Arts & Humanities | 0 | 0.0% |
| Total | 0 | 0.0% |
Transportation & Commute in Schuyler
Vehicle Availability by Sex in Schuyler
The most prevalent vehicle ownership categories in Schuyler are males with 3 vehicles (28, accounting for 28.3%) and females with 3 vehicles (26, making up 44.4%).
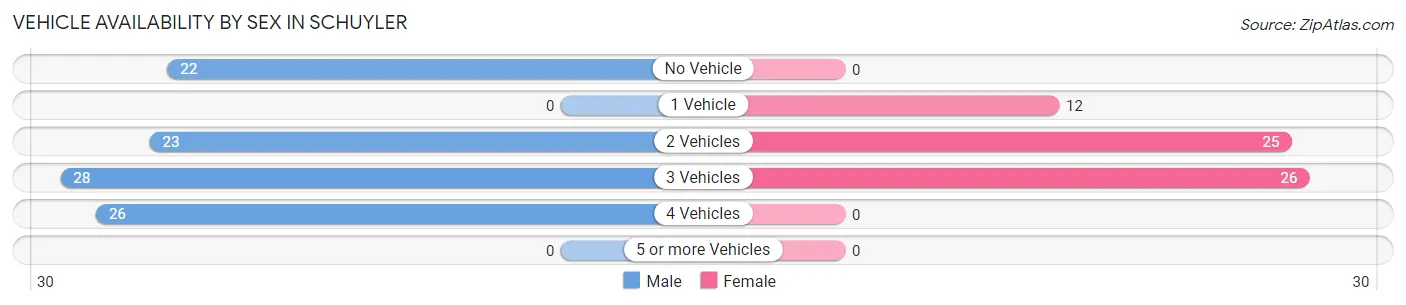
| Vehicles Available | Male | Female |
| No Vehicle | 22 (22.2%) | 0 (0.0%) |
| 1 Vehicle | 0 (0.0%) | 12 (19.1%) |
| 2 Vehicles | 23 (23.2%) | 25 (39.7%) |
| 3 Vehicles | 28 (28.3%) | 26 (41.3%) |
| 4 Vehicles | 26 (26.3%) | 0 (0.0%) |
| 5 or more Vehicles | 0 (0.0%) | 0 (0.0%) |
| Total | 99 (100.0%) | 63 (100.0%) |
Commute Time in Schuyler
The most frequently occuring commute durations in Schuyler are 25 to 29 minutes (48 commuters, 29.6%), 90 or more minutes (32 commuters, 19.8%), and 45 to 59 minutes (28 commuters, 17.3%).
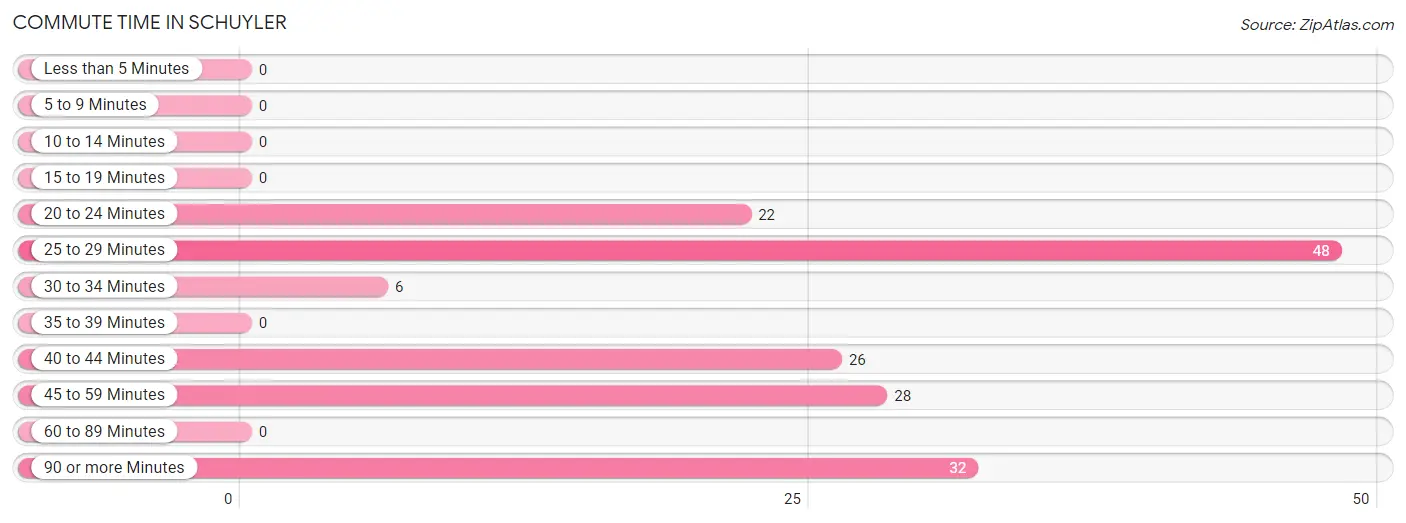
| Commute Time | # Commuters | % Commuters |
| Less than 5 Minutes | 0 | 0.0% |
| 5 to 9 Minutes | 0 | 0.0% |
| 10 to 14 Minutes | 0 | 0.0% |
| 15 to 19 Minutes | 0 | 0.0% |
| 20 to 24 Minutes | 22 | 13.6% |
| 25 to 29 Minutes | 48 | 29.6% |
| 30 to 34 Minutes | 6 | 3.7% |
| 35 to 39 Minutes | 0 | 0.0% |
| 40 to 44 Minutes | 26 | 16.1% |
| 45 to 59 Minutes | 28 | 17.3% |
| 60 to 89 Minutes | 0 | 0.0% |
| 90 or more Minutes | 32 | 19.8% |
Commute Time by Sex in Schuyler
The most common commute times in Schuyler are 45 to 59 minutes (28 commuters, 28.3%) for males and 40 to 44 minutes (26 commuters, 41.3%) for females.
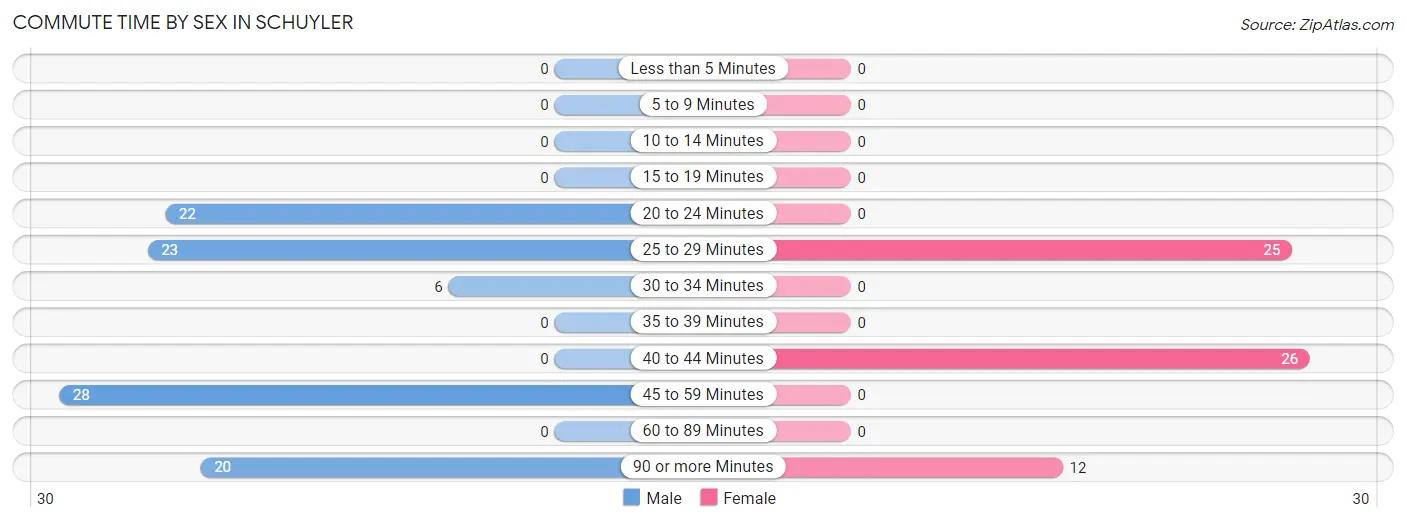
| Commute Time | Male | Female |
| Less than 5 Minutes | 0 (0.0%) | 0 (0.0%) |
| 5 to 9 Minutes | 0 (0.0%) | 0 (0.0%) |
| 10 to 14 Minutes | 0 (0.0%) | 0 (0.0%) |
| 15 to 19 Minutes | 0 (0.0%) | 0 (0.0%) |
| 20 to 24 Minutes | 22 (22.2%) | 0 (0.0%) |
| 25 to 29 Minutes | 23 (23.2%) | 25 (39.7%) |
| 30 to 34 Minutes | 6 (6.1%) | 0 (0.0%) |
| 35 to 39 Minutes | 0 (0.0%) | 0 (0.0%) |
| 40 to 44 Minutes | 0 (0.0%) | 26 (41.3%) |
| 45 to 59 Minutes | 28 (28.3%) | 0 (0.0%) |
| 60 to 89 Minutes | 0 (0.0%) | 0 (0.0%) |
| 90 or more Minutes | 20 (20.2%) | 12 (19.1%) |
Time of Departure to Work by Sex in Schuyler
The most frequent times of departure to work in Schuyler are 6:30 AM to 6:59 AM (51, 51.5%) for males and 12:00 PM to 3:59 PM (26, 41.3%) for females.
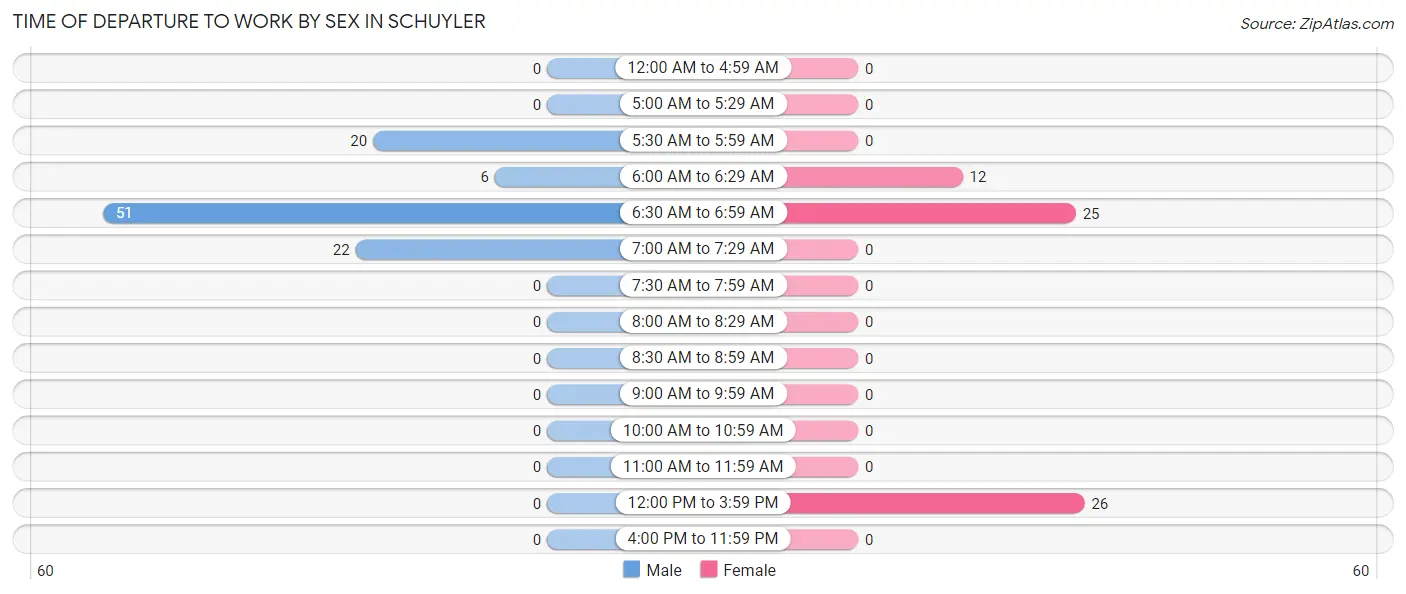
| Time of Departure | Male | Female |
| 12:00 AM to 4:59 AM | 0 (0.0%) | 0 (0.0%) |
| 5:00 AM to 5:29 AM | 0 (0.0%) | 0 (0.0%) |
| 5:30 AM to 5:59 AM | 20 (20.2%) | 0 (0.0%) |
| 6:00 AM to 6:29 AM | 6 (6.1%) | 12 (19.1%) |
| 6:30 AM to 6:59 AM | 51 (51.5%) | 25 (39.7%) |
| 7:00 AM to 7:29 AM | 22 (22.2%) | 0 (0.0%) |
| 7:30 AM to 7:59 AM | 0 (0.0%) | 0 (0.0%) |
| 8:00 AM to 8:29 AM | 0 (0.0%) | 0 (0.0%) |
| 8:30 AM to 8:59 AM | 0 (0.0%) | 0 (0.0%) |
| 9:00 AM to 9:59 AM | 0 (0.0%) | 0 (0.0%) |
| 10:00 AM to 10:59 AM | 0 (0.0%) | 0 (0.0%) |
| 11:00 AM to 11:59 AM | 0 (0.0%) | 0 (0.0%) |
| 12:00 PM to 3:59 PM | 0 (0.0%) | 26 (41.3%) |
| 4:00 PM to 11:59 PM | 0 (0.0%) | 0 (0.0%) |
| Total | 99 (100.0%) | 63 (100.0%) |
Housing Occupancy in Schuyler
Occupancy by Ownership in Schuyler
Of the total 143 dwellings in Schuyler, owner-occupied units account for 58 (40.6%), while renter-occupied units make up 85 (59.4%).
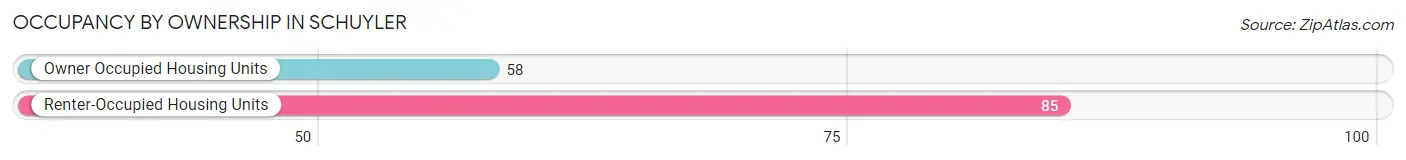
| Occupancy | # Housing Units | % Housing Units |
| Owner Occupied Housing Units | 58 | 40.6% |
| Renter-Occupied Housing Units | 85 | 59.4% |
| Total Occupied Housing Units | 143 | 100.0% |
Occupancy by Household Size in Schuyler
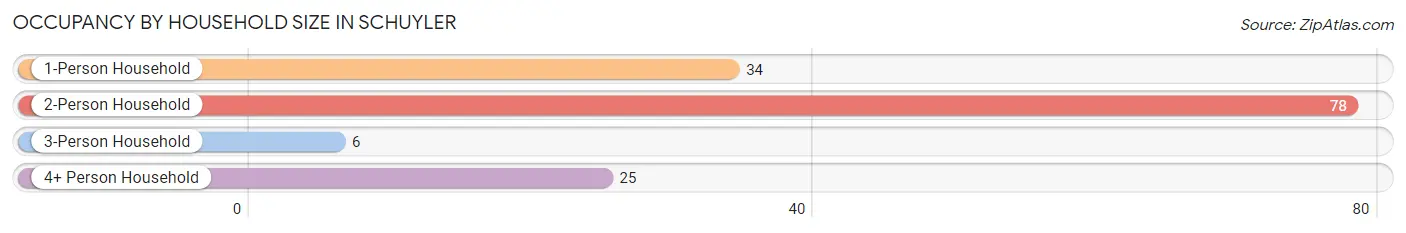
| Household Size | # Housing Units | % Housing Units |
| 1-Person Household | 34 | 23.8% |
| 2-Person Household | 78 | 54.5% |
| 3-Person Household | 6 | 4.2% |
| 4+ Person Household | 25 | 17.5% |
| Total Housing Units | 143 | 100.0% |
Occupancy by Ownership by Household Size in Schuyler
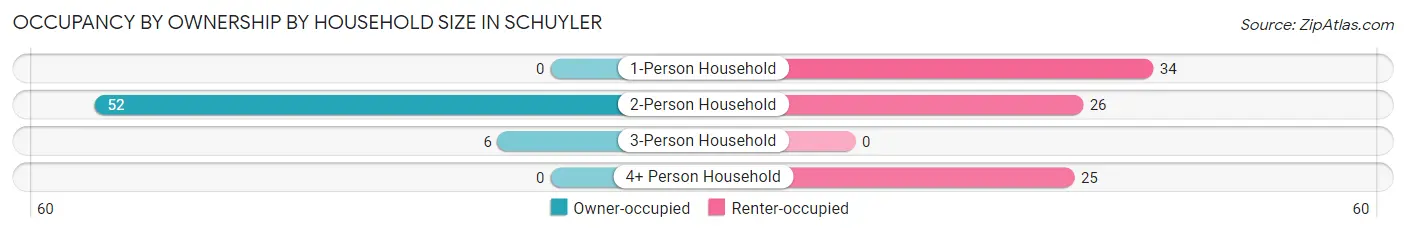
| Household Size | Owner-occupied | Renter-occupied |
| 1-Person Household | 0 (0.0%) | 34 (100.0%) |
| 2-Person Household | 52 (66.7%) | 26 (33.3%) |
| 3-Person Household | 6 (100.0%) | 0 (0.0%) |
| 4+ Person Household | 0 (0.0%) | 25 (100.0%) |
| Total Housing Units | 58 (40.6%) | 85 (59.4%) |
Occupancy by Educational Attainment in Schuyler
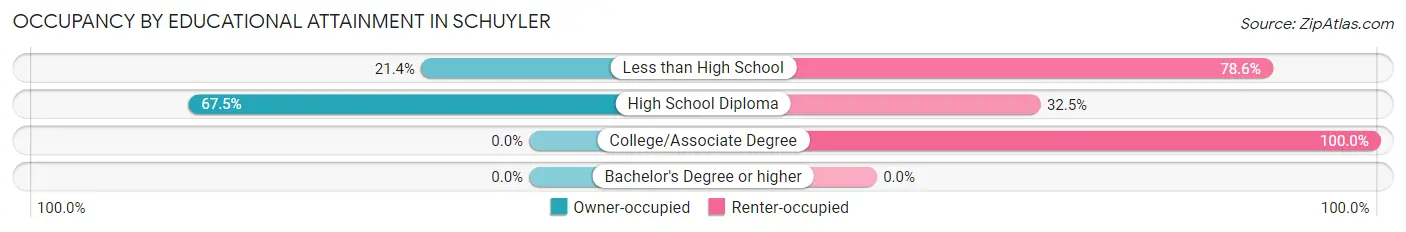
| Household Size | Owner-occupied | Renter-occupied |
| Less than High School | 6 (21.4%) | 22 (78.6%) |
| High School Diploma | 52 (67.5%) | 25 (32.5%) |
| College/Associate Degree | 0 (0.0%) | 38 (100.0%) |
| Bachelor's Degree or higher | 0 (0.0%) | 0 (0.0%) |
Occupancy by Age of Householder in Schuyler
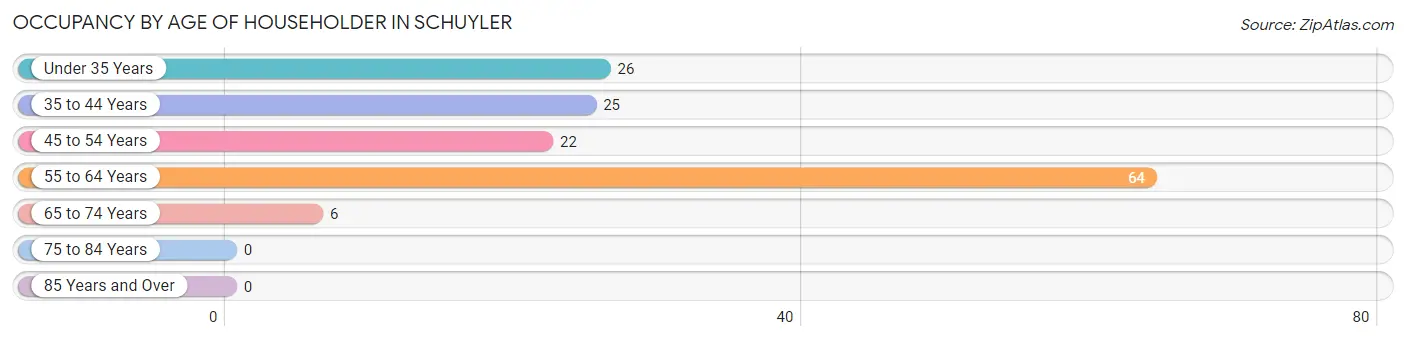
| Age Bracket | # Households | % Households |
| Under 35 Years | 26 | 18.2% |
| 35 to 44 Years | 25 | 17.5% |
| 45 to 54 Years | 22 | 15.4% |
| 55 to 64 Years | 64 | 44.8% |
| 65 to 74 Years | 6 | 4.2% |
| 75 to 84 Years | 0 | 0.0% |
| 85 Years and Over | 0 | 0.0% |
| Total | 143 | 100.0% |
Housing Finances in Schuyler
Median Income by Occupancy in Schuyler
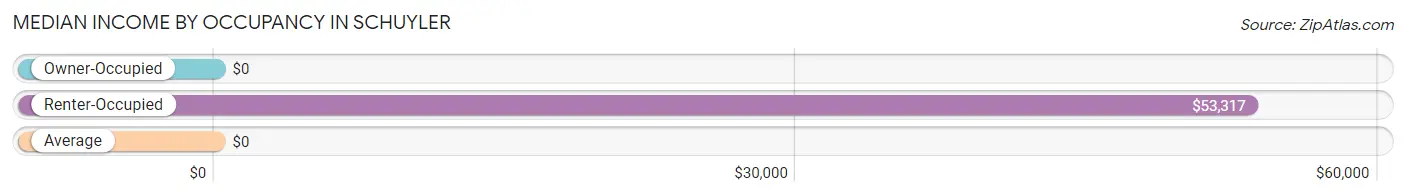
| Occupancy Type | # Households | Median Income |
| Owner-Occupied | 58 (40.6%) | $0 |
| Renter-Occupied | 85 (59.4%) | $53,317 |
| Average | 143 (100.0%) | $0 |
Occupancy by Householder Income Bracket in Schuyler
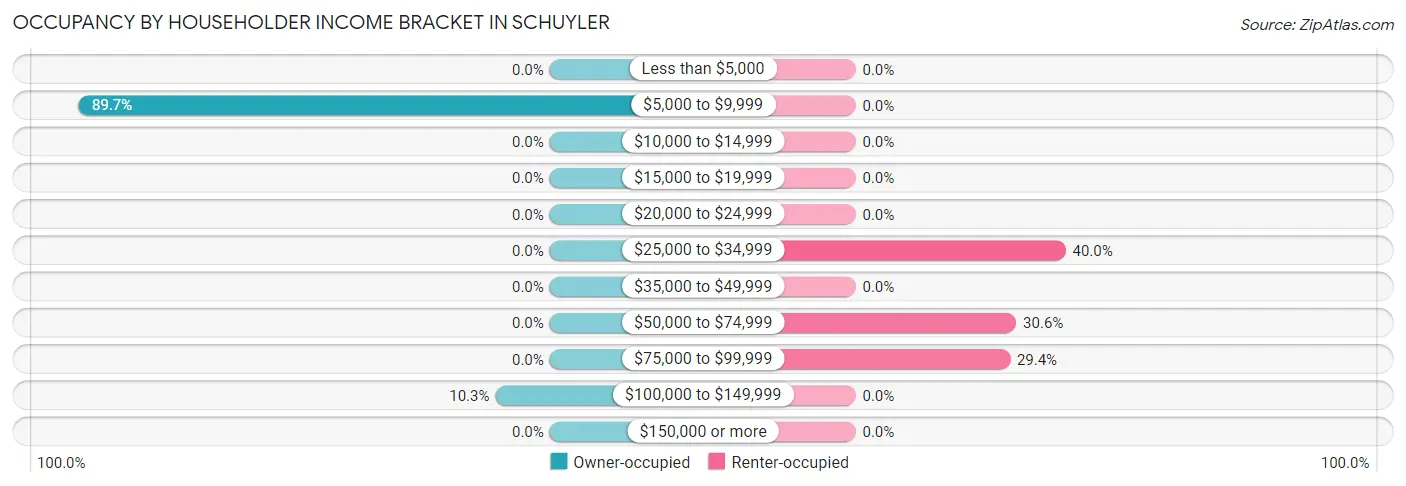
| Income Bracket | Owner-occupied | Renter-occupied |
| Less than $5,000 | 0 (0.0%) | 0 (0.0%) |
| $5,000 to $9,999 | 52 (89.7%) | 0 (0.0%) |
| $10,000 to $14,999 | 0 (0.0%) | 0 (0.0%) |
| $15,000 to $19,999 | 0 (0.0%) | 0 (0.0%) |
| $20,000 to $24,999 | 0 (0.0%) | 0 (0.0%) |
| $25,000 to $34,999 | 0 (0.0%) | 34 (40.0%) |
| $35,000 to $49,999 | 0 (0.0%) | 0 (0.0%) |
| $50,000 to $74,999 | 0 (0.0%) | 26 (30.6%) |
| $75,000 to $99,999 | 0 (0.0%) | 25 (29.4%) |
| $100,000 to $149,999 | 6 (10.3%) | 0 (0.0%) |
| $150,000 or more | 0 (0.0%) | 0 (0.0%) |
| Total | 58 (100.0%) | 85 (100.0%) |
Monthly Housing Cost Tiers in Schuyler
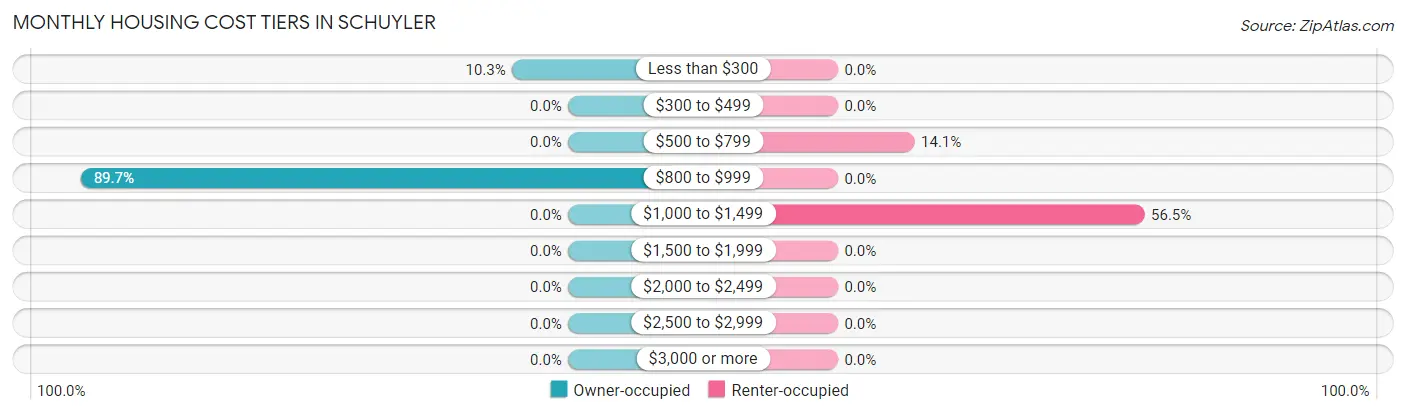
| Monthly Cost | Owner-occupied | Renter-occupied |
| Less than $300 | 6 (10.3%) | 0 (0.0%) |
| $300 to $499 | 0 (0.0%) | 0 (0.0%) |
| $500 to $799 | 0 (0.0%) | 12 (14.1%) |
| $800 to $999 | 52 (89.7%) | 0 (0.0%) |
| $1,000 to $1,499 | 0 (0.0%) | 48 (56.5%) |
| $1,500 to $1,999 | 0 (0.0%) | 0 (0.0%) |
| $2,000 to $2,499 | 0 (0.0%) | 0 (0.0%) |
| $2,500 to $2,999 | 0 (0.0%) | 0 (0.0%) |
| $3,000 or more | 0 (0.0%) | 0 (0.0%) |
| Total | 58 (100.0%) | 85 (100.0%) |
Physical Housing Characteristics in Schuyler
Housing Structures in Schuyler
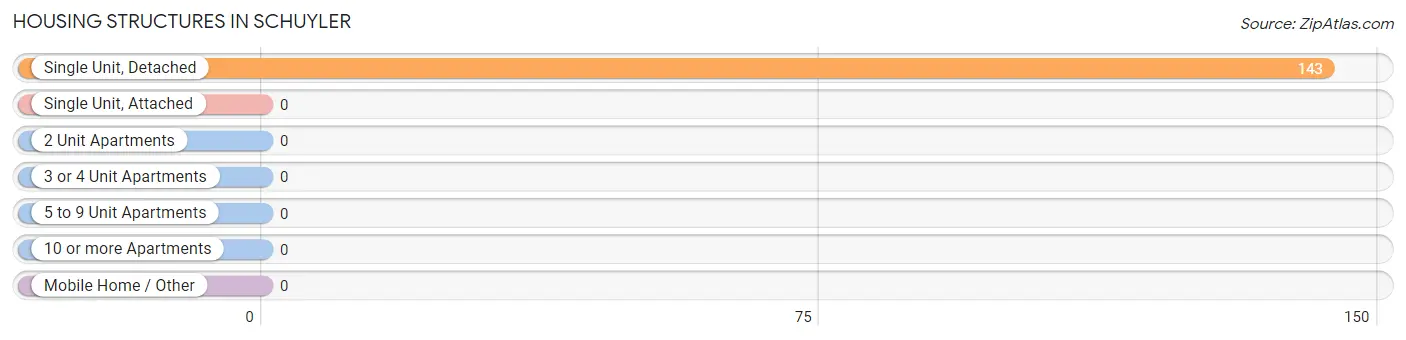
| Structure Type | # Housing Units | % Housing Units |
| Single Unit, Detached | 143 | 100.0% |
| Single Unit, Attached | 0 | 0.0% |
| 2 Unit Apartments | 0 | 0.0% |
| 3 or 4 Unit Apartments | 0 | 0.0% |
| 5 to 9 Unit Apartments | 0 | 0.0% |
| 10 or more Apartments | 0 | 0.0% |
| Mobile Home / Other | 0 | 0.0% |
| Total | 143 | 100.0% |
Housing Structures by Occupancy in Schuyler
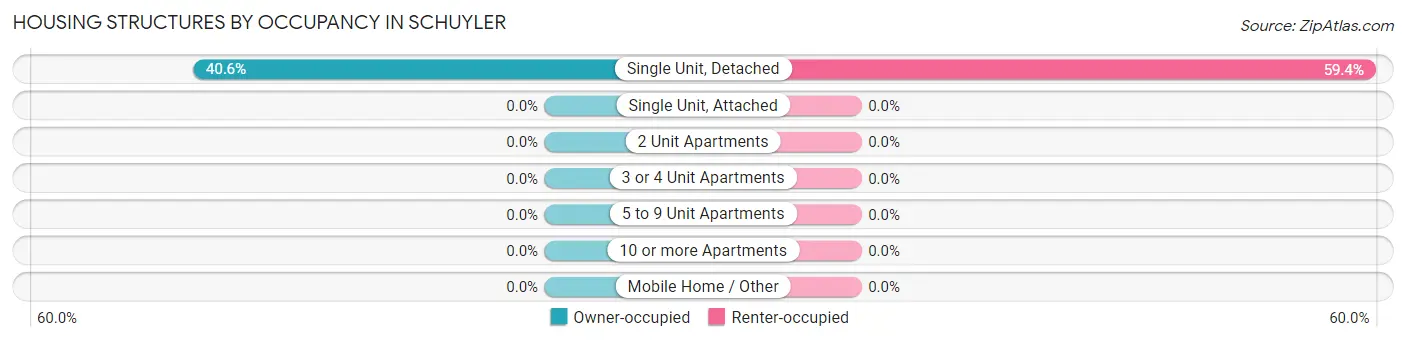
| Structure Type | Owner-occupied | Renter-occupied |
| Single Unit, Detached | 58 (40.6%) | 85 (59.4%) |
| Single Unit, Attached | 0 (0.0%) | 0 (0.0%) |
| 2 Unit Apartments | 0 (0.0%) | 0 (0.0%) |
| 3 or 4 Unit Apartments | 0 (0.0%) | 0 (0.0%) |
| 5 to 9 Unit Apartments | 0 (0.0%) | 0 (0.0%) |
| 10 or more Apartments | 0 (0.0%) | 0 (0.0%) |
| Mobile Home / Other | 0 (0.0%) | 0 (0.0%) |
| Total | 58 (40.6%) | 85 (59.4%) |
Housing Structures by Number of Rooms in Schuyler
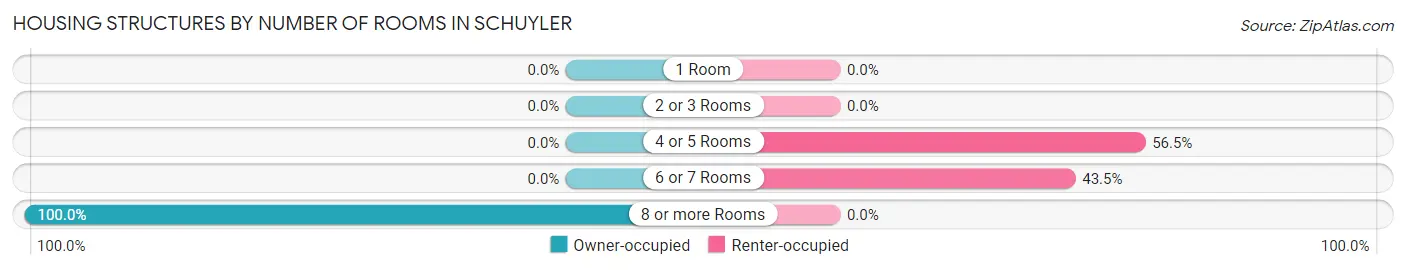
| Number of Rooms | Owner-occupied | Renter-occupied |
| 1 Room | 0 (0.0%) | 0 (0.0%) |
| 2 or 3 Rooms | 0 (0.0%) | 0 (0.0%) |
| 4 or 5 Rooms | 0 (0.0%) | 48 (56.5%) |
| 6 or 7 Rooms | 0 (0.0%) | 37 (43.5%) |
| 8 or more Rooms | 58 (100.0%) | 0 (0.0%) |
| Total | 58 (100.0%) | 85 (100.0%) |
Housing Structure by Heating Type in Schuyler
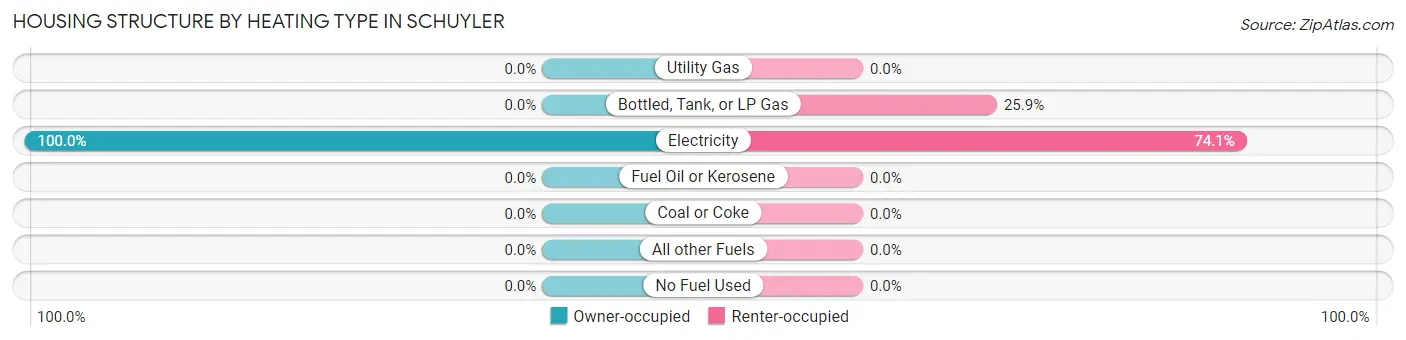
| Heating Type | Owner-occupied | Renter-occupied |
| Utility Gas | 0 (0.0%) | 0 (0.0%) |
| Bottled, Tank, or LP Gas | 0 (0.0%) | 22 (25.9%) |
| Electricity | 58 (100.0%) | 63 (74.1%) |
| Fuel Oil or Kerosene | 0 (0.0%) | 0 (0.0%) |
| Coal or Coke | 0 (0.0%) | 0 (0.0%) |
| All other Fuels | 0 (0.0%) | 0 (0.0%) |
| No Fuel Used | 0 (0.0%) | 0 (0.0%) |
| Total | 58 (100.0%) | 85 (100.0%) |
Household Vehicle Usage in Schuyler
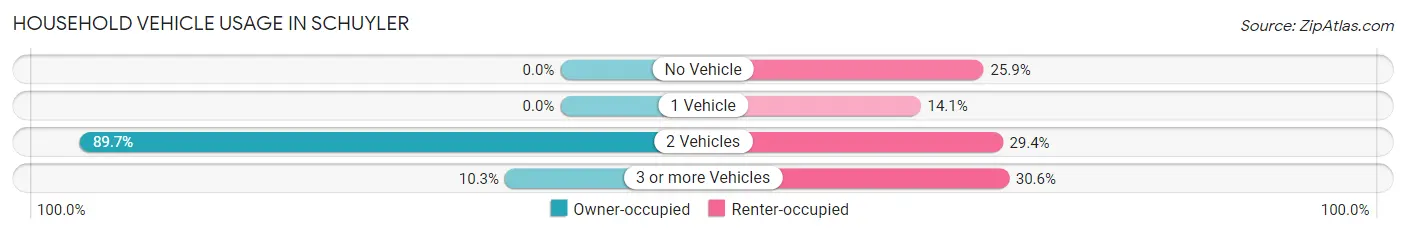
| Vehicles per Household | Owner-occupied | Renter-occupied |
| No Vehicle | 0 (0.0%) | 22 (25.9%) |
| 1 Vehicle | 0 (0.0%) | 12 (14.1%) |
| 2 Vehicles | 52 (89.7%) | 25 (29.4%) |
| 3 or more Vehicles | 6 (10.3%) | 26 (30.6%) |
| Total | 58 (100.0%) | 85 (100.0%) |
Real Estate & Mortgages in Schuyler
Real Estate and Mortgage Overview in Schuyler
| Characteristic | Without Mortgage | With Mortgage |
| Housing Units | 6 | 52 |
| Median Property Value | - | - |
| Median Household Income | - | - |
| Monthly Housing Costs | - | - |
| Real Estate Taxes | - | - |
Property Value by Mortgage Status in Schuyler
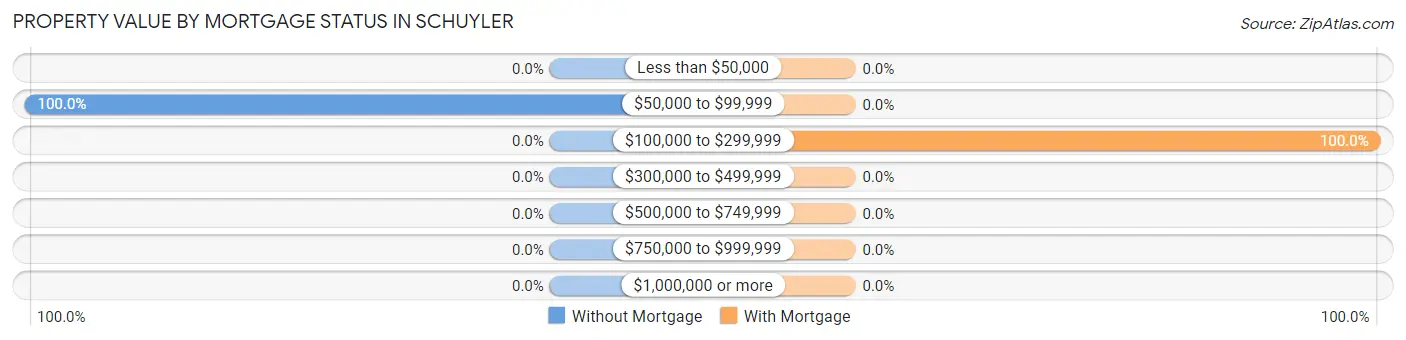
| Property Value | Without Mortgage | With Mortgage |
| Less than $50,000 | 0 (0.0%) | 0 (0.0%) |
| $50,000 to $99,999 | 6 (100.0%) | 0 (0.0%) |
| $100,000 to $299,999 | 0 (0.0%) | 52 (100.0%) |
| $300,000 to $499,999 | 0 (0.0%) | 0 (0.0%) |
| $500,000 to $749,999 | 0 (0.0%) | 0 (0.0%) |
| $750,000 to $999,999 | 0 (0.0%) | 0 (0.0%) |
| $1,000,000 or more | 0 (0.0%) | 0 (0.0%) |
| Total | 6 (100.0%) | 52 (100.0%) |
Household Income by Mortgage Status in Schuyler
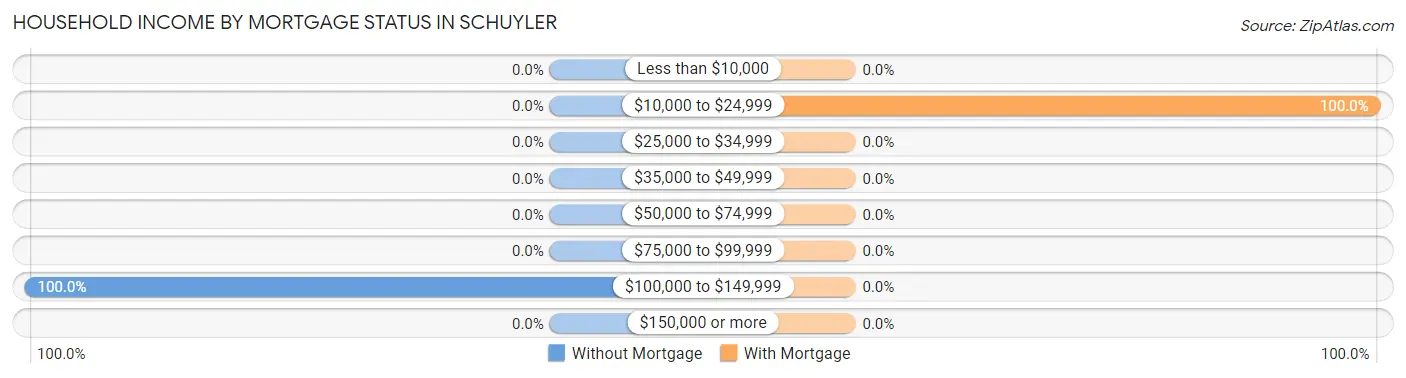
| Household Income | Without Mortgage | With Mortgage |
| Less than $10,000 | 0 (0.0%) | 0 (0.0%) |
| $10,000 to $24,999 | 0 (0.0%) | 52 (100.0%) |
| $25,000 to $34,999 | 0 (0.0%) | 0 (0.0%) |
| $35,000 to $49,999 | 0 (0.0%) | 0 (0.0%) |
| $50,000 to $74,999 | 0 (0.0%) | 0 (0.0%) |
| $75,000 to $99,999 | 0 (0.0%) | 0 (0.0%) |
| $100,000 to $149,999 | 6 (100.0%) | 0 (0.0%) |
| $150,000 or more | 0 (0.0%) | 0 (0.0%) |
| Total | 6 (100.0%) | 52 (100.0%) |
Property Value to Household Income Ratio in Schuyler
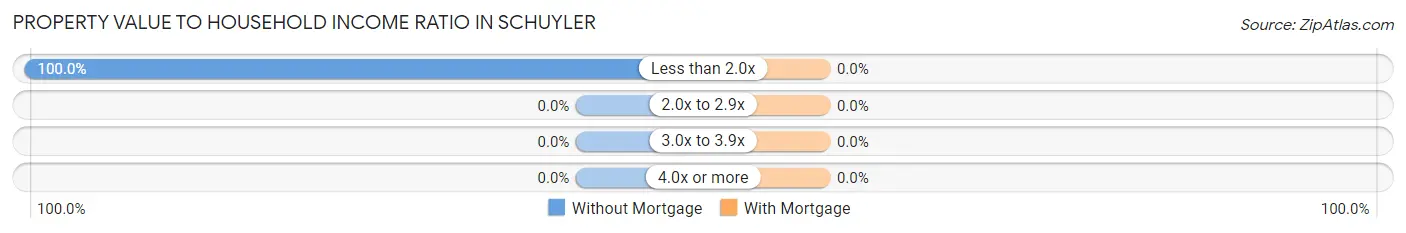
| Value-to-Income Ratio | Without Mortgage | With Mortgage |
| Less than 2.0x | 6 (100.0%) | 0 (0.0%) |
| 2.0x to 2.9x | 0 (0.0%) | 0 (0.0%) |
| 3.0x to 3.9x | 0 (0.0%) | 0 (0.0%) |
| 4.0x or more | 0 (0.0%) | 0 (0.0%) |
| Total | 6 (100.0%) | 52 (100.0%) |
Real Estate Taxes by Mortgage Status in Schuyler
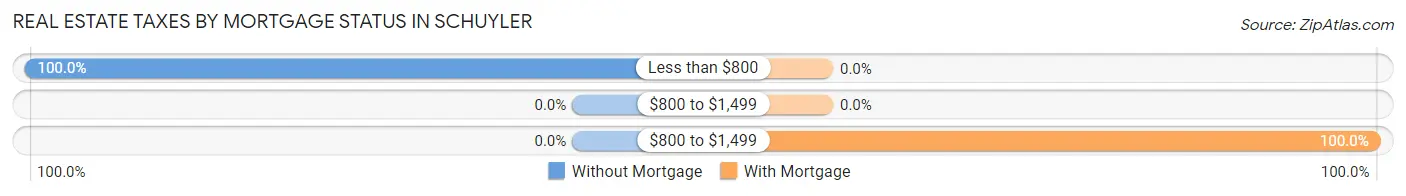
| Property Taxes | Without Mortgage | With Mortgage |
| Less than $800 | 6 (100.0%) | 0 (0.0%) |
| $800 to $1,499 | 0 (0.0%) | 0 (0.0%) |
| $800 to $1,499 | 0 (0.0%) | 52 (100.0%) |
| Total | 6 (100.0%) | 52 (100.0%) |
Health & Disability in Schuyler
Health Insurance Coverage by Age in Schuyler
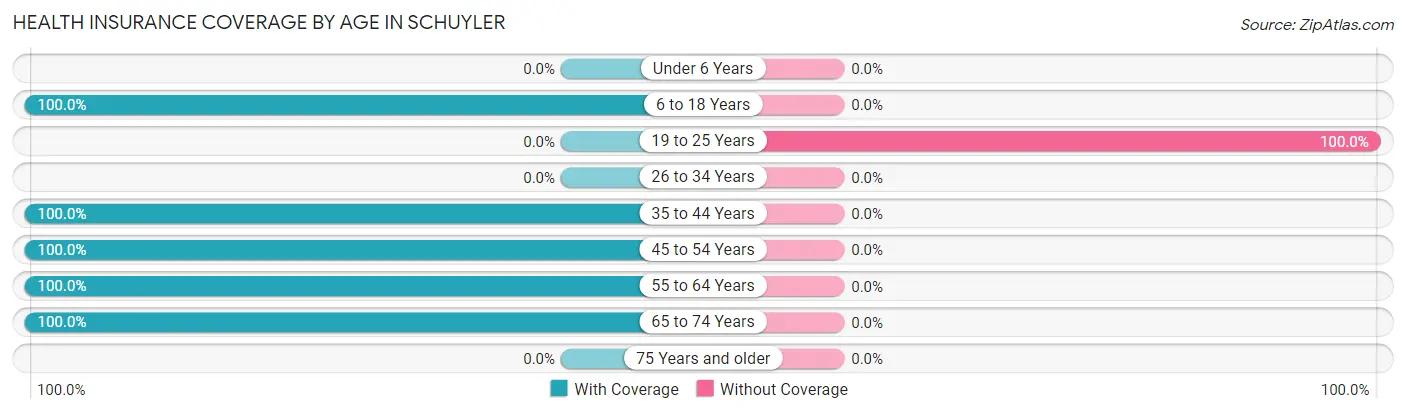
| Age Bracket | With Coverage | Without Coverage |
| Under 6 Years | 0 (0.0%) | 0 (0.0%) |
| 6 to 18 Years | 30 (100.0%) | 0 (0.0%) |
| 19 to 25 Years | 0 (0.0%) | 54 (100.0%) |
| 26 to 34 Years | 0 (0.0%) | 0 (0.0%) |
| 35 to 44 Years | 48 (100.0%) | 0 (0.0%) |
| 45 to 54 Years | 22 (100.0%) | 0 (0.0%) |
| 55 to 64 Years | 104 (100.0%) | 0 (0.0%) |
| 65 to 74 Years | 65 (100.0%) | 0 (0.0%) |
| 75 Years and older | 0 (0.0%) | 0 (0.0%) |
| Total | 269 (83.3%) | 54 (16.7%) |
Health Insurance Coverage by Citizenship Status in Schuyler
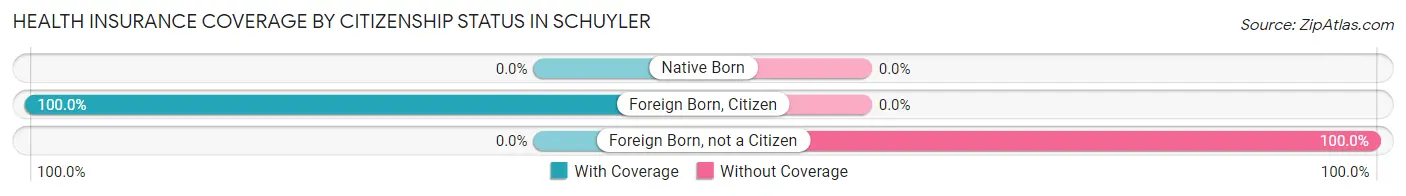
| Citizenship Status | With Coverage | Without Coverage |
| Native Born | 0 (0.0%) | 0 (0.0%) |
| Foreign Born, Citizen | 30 (100.0%) | 0 (0.0%) |
| Foreign Born, not a Citizen | 0 (0.0%) | 54 (100.0%) |
Health Insurance Coverage by Household Income in Schuyler
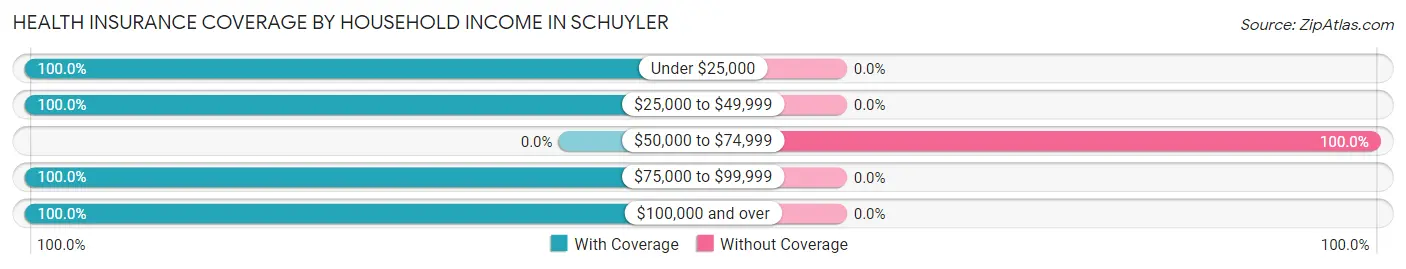
| Household Income | With Coverage | Without Coverage |
| Under $25,000 | 111 (100.0%) | 0 (0.0%) |
| $25,000 to $49,999 | 34 (100.0%) | 0 (0.0%) |
| $50,000 to $74,999 | 0 (0.0%) | 54 (100.0%) |
| $75,000 to $99,999 | 78 (100.0%) | 0 (0.0%) |
| $100,000 and over | 46 (100.0%) | 0 (0.0%) |
Public vs Private Health Insurance Coverage by Age in Schuyler
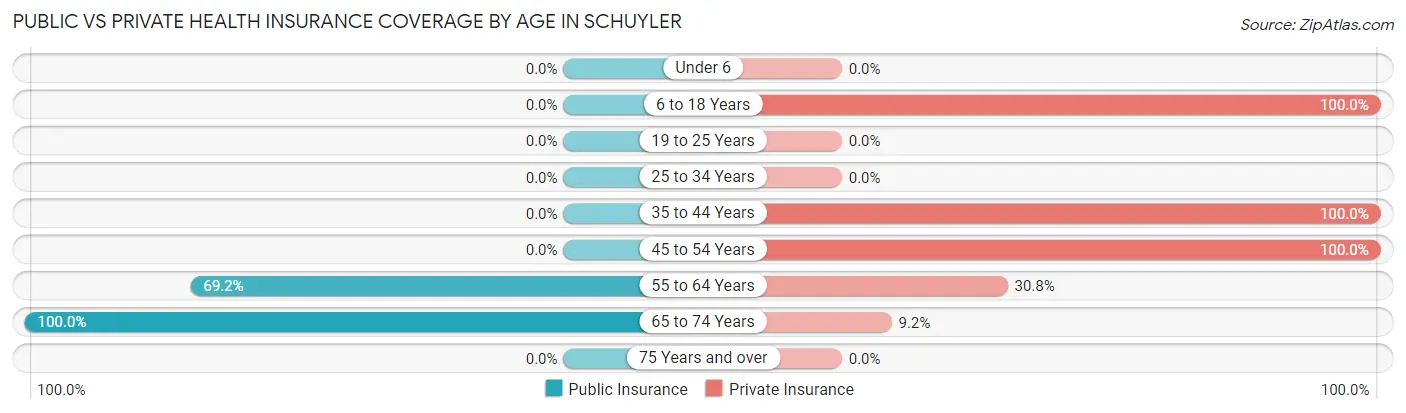
| Age Bracket | Public Insurance | Private Insurance |
| Under 6 | 0 (0.0%) | 0 (0.0%) |
| 6 to 18 Years | 0 (0.0%) | 30 (100.0%) |
| 19 to 25 Years | 0 (0.0%) | 0 (0.0%) |
| 25 to 34 Years | 0 (0.0%) | 0 (0.0%) |
| 35 to 44 Years | 0 (0.0%) | 48 (100.0%) |
| 45 to 54 Years | 0 (0.0%) | 22 (100.0%) |
| 55 to 64 Years | 72 (69.2%) | 32 (30.8%) |
| 65 to 74 Years | 65 (100.0%) | 6 (9.2%) |
| 75 Years and over | 0 (0.0%) | 0 (0.0%) |
| Total | 137 (42.4%) | 138 (42.7%) |
Disability Status by Sex by Age in Schuyler
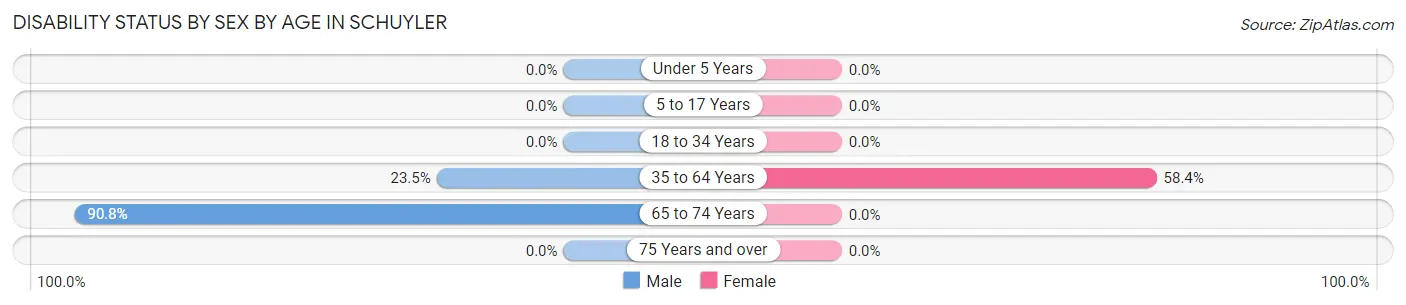
| Age Bracket | Male | Female |
| Under 5 Years | 0 (0.0%) | 0 (0.0%) |
| 5 to 17 Years | 0 (0.0%) | 0 (0.0%) |
| 18 to 34 Years | 0 (0.0%) | 0 (0.0%) |
| 35 to 64 Years | 20 (23.5%) | 52 (58.4%) |
| 65 to 74 Years | 59 (90.8%) | 0 (0.0%) |
| 75 Years and over | 0 (0.0%) | 0 (0.0%) |
Disability Class by Sex by Age in Schuyler
Disability Class: Hearing Difficulty
| Age Bracket | Male | Female |
| Under 5 Years | 0 (0.0%) | 0 (0.0%) |
| 5 to 17 Years | 0 (0.0%) | 0 (0.0%) |
| 18 to 34 Years | 0 (0.0%) | 0 (0.0%) |
| 35 to 64 Years | 0 (0.0%) | 0 (0.0%) |
| 65 to 74 Years | 0 (0.0%) | 0 (0.0%) |
| 75 Years and over | 0 (0.0%) | 0 (0.0%) |
Disability Class: Vision Difficulty
| Age Bracket | Male | Female |
| Under 5 Years | 0 (0.0%) | 0 (0.0%) |
| 5 to 17 Years | 0 (0.0%) | 0 (0.0%) |
| 18 to 34 Years | 0 (0.0%) | 0 (0.0%) |
| 35 to 64 Years | 0 (0.0%) | 0 (0.0%) |
| 65 to 74 Years | 0 (0.0%) | 0 (0.0%) |
| 75 Years and over | 0 (0.0%) | 0 (0.0%) |
Disability Class: Cognitive Difficulty
| Age Bracket | Male | Female |
| 5 to 17 Years | 0 (0.0%) | 0 (0.0%) |
| 18 to 34 Years | 0 (0.0%) | 0 (0.0%) |
| 35 to 64 Years | 0 (0.0%) | 0 (0.0%) |
| 65 to 74 Years | 0 (0.0%) | 0 (0.0%) |
| 75 Years and over | 0 (0.0%) | 0 (0.0%) |
Disability Class: Ambulatory Difficulty
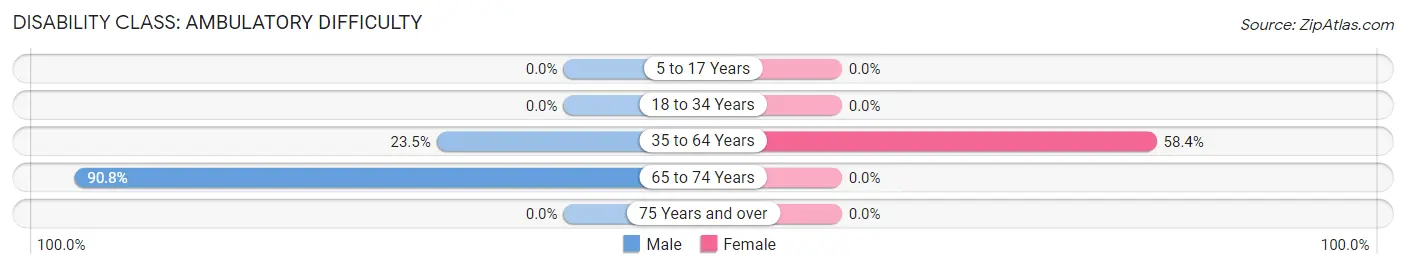
| Age Bracket | Male | Female |
| 5 to 17 Years | 0 (0.0%) | 0 (0.0%) |
| 18 to 34 Years | 0 (0.0%) | 0 (0.0%) |
| 35 to 64 Years | 20 (23.5%) | 52 (58.4%) |
| 65 to 74 Years | 59 (90.8%) | 0 (0.0%) |
| 75 Years and over | 0 (0.0%) | 0 (0.0%) |
Disability Class: Self-Care Difficulty
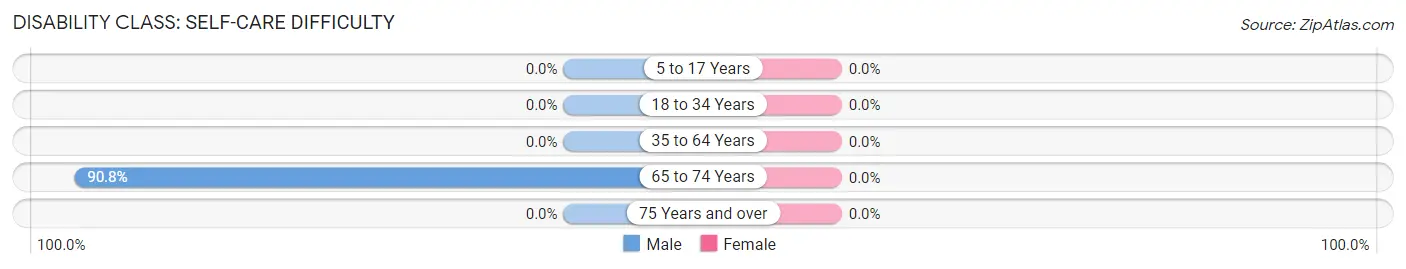
| Age Bracket | Male | Female |
| 5 to 17 Years | 0 (0.0%) | 0 (0.0%) |
| 18 to 34 Years | 0 (0.0%) | 0 (0.0%) |
| 35 to 64 Years | 0 (0.0%) | 0 (0.0%) |
| 65 to 74 Years | 59 (90.8%) | 0 (0.0%) |
| 75 Years and over | 0 (0.0%) | 0 (0.0%) |
Technology Access in Schuyler
Computing Device Access in Schuyler
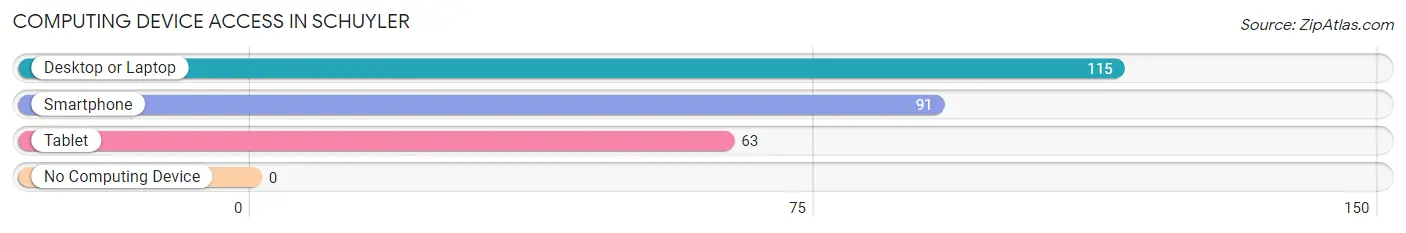
| Device Type | # Households | % Households |
| Desktop or Laptop | 115 | 80.4% |
| Smartphone | 91 | 63.6% |
| Tablet | 63 | 44.1% |
| No Computing Device | 0 | 0.0% |
| Total | 143 | 100.0% |
Internet Access in Schuyler
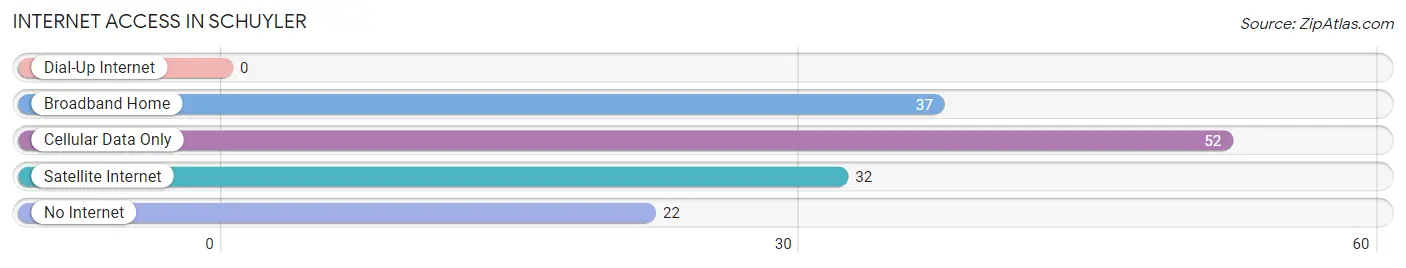
| Internet Type | # Households | % Households |
| Dial-Up Internet | 0 | 0.0% |
| Broadband Home | 37 | 25.9% |
| Cellular Data Only | 52 | 36.4% |
| Satellite Internet | 32 | 22.4% |
| No Internet | 22 | 15.4% |
| Total | 143 | 100.0% |
Schuyler Summary
Schuyler, Virginia is a small town located in Nelson County, Virginia. It is situated in the foothills of the Blue Ridge Mountains and is part of the Charlottesville Metropolitan Statistical Area. The town has a population of approximately 1,000 people and is known for its rural charm and scenic beauty.
History
Schuyler was founded in 1790 by William Schuyler, a Revolutionary War veteran. The town was originally known as Schuyler’s Crossroads, and was named after William Schuyler’s father, who had served in the Revolutionary War. The town was incorporated in 1837 and was named after William Schuyler.
The town was an important stop on the stagecoach route between Charlottesville and Lynchburg. It was also a stop on the Virginia Central Railroad, which ran from Richmond to Lynchburg. The railroad was an important factor in the growth of the town, as it allowed for the transportation of goods and people.
Geography
Schuyler is located in the foothills of the Blue Ridge Mountains in Nelson County, Virginia. The town is situated at an elevation of 1,000 feet and is surrounded by rolling hills and lush forests. The town is located approximately 25 miles from Charlottesville and is accessible via US Route 29.
The climate in Schuyler is mild and humid, with temperatures ranging from the mid-30s in the winter to the mid-80s in the summer. The town receives an average of 45 inches of precipitation per year, with most of it falling in the form of rain.
Economy
The economy of Schuyler is largely based on agriculture and tourism. The town is home to several farms, which produce a variety of crops, including corn, soybeans, wheat, and hay. The town is also home to several wineries, which produce a variety of wines.
Tourism is an important part of the economy of Schuyler. The town is home to several historic sites, including the Schuyler House, which was built in 1790 and is listed on the National Register of Historic Places. The town is also home to several parks, including the Schuyler County Park, which offers camping, fishing, and hiking.
Demographics
As of the 2010 census, Schuyler had a population of 1,000 people. The racial makeup of the town was 95.2% White, 1.2% African American, 0.2% Native American, 0.2% Asian, 0.2% from other races, and 2.2% from two or more races. The median household income was $41,250, and the median family income was $50,000.
Schuyler is a small town with a rich history and a strong sense of community. The town is home to a variety of businesses and attractions, and is a popular destination for tourists. The town is also home to a variety of parks and historic sites, making it a great place to visit and explore.
Common Questions
What is Per Capita Income in Schuyler?
Per Capita income in Schuyler is $21,261.
What is Income or Wage Gap in Schuyler?
Income or Wage Gap in Schuyler is 9.5%.
Women in Schuyler earn 90.5 cents for every dollar earned by a man.
What is Inequality or Gini Index in Schuyler?
Inequality or Gini Index in Schuyler is 0.44.
What is the Total Population of Schuyler?
Total Population of Schuyler is 323.
What is the Total Male Population of Schuyler?
Total Male Population of Schuyler is 208.
What is the Total Female Population of Schuyler?
Total Female Population of Schuyler is 115.
What is the Ratio of Males per 100 Females in Schuyler?
There are 180.87 Males per 100 Females in Schuyler.
What is the Ratio of Females per 100 Males in Schuyler?
There are 55.29 Females per 100 Males in Schuyler.
What is the Median Population Age in Schuyler?
Median Population Age in Schuyler is 58.4 Years.
What is the Average Family Size in Schuyler
Average Family Size in Schuyler is 2.6 People.
What is the Average Household Size in Schuyler
Average Household Size in Schuyler is 2.3 People.
How Large is the Labor Force in Schuyler?
There are 162 People in the Labor Forcein in Schuyler.
What is the Percentage of People in the Labor Force in Schuyler?
55.3% of People are in the Labor Force in Schuyler.