Crisfield, MD Map & Demographics
Crisfield Map
Crisfield Overview
$25,560
PER CAPITA INCOME
$51,709
AVG FAMILY INCOME
$38,417
AVG HOUSEHOLD INCOME
11.8%
WAGE / INCOME GAP [ % ]
88.2¢/ $1
WAGE / INCOME GAP [ $ ]
0.49
INEQUALITY / GINI INDEX
2,445
TOTAL POPULATION
966
MALE POPULATION
1,479
FEMALE POPULATION
65.31
MALES / 100 FEMALES
153.11
FEMALES / 100 MALES
35.8
MEDIAN AGE
2.9
AVG FAMILY SIZE
2.2
AVG HOUSEHOLD SIZE
1,181
LABOR FORCE [ PEOPLE ]
60.4%
PERCENT IN LABOR FORCE
14.5%
UNEMPLOYMENT RATE
Crisfield Zip Codes
Income in Crisfield
Income Overview in Crisfield
Per Capita Income in Crisfield is $25,560, while median incomes of families and households are $51,709 and $38,417 respectively.
| Characteristic | Number | Measure |
| Per Capita Income | 2,445 | $25,560 |
| Median Family Income | 615 | $51,709 |
| Mean Family Income | 615 | $67,673 |
| Median Household Income | 1,109 | $38,417 |
| Mean Household Income | 1,109 | $53,341 |
| Income Deficit | 615 | $0 |
| Wage / Income Gap (%) | 2,445 | 11.81% |
| Wage / Income Gap ($) | 2,445 | 88.19¢ per $1 |
| Gini / Inequality Index | 2,445 | 0.49 |
Earnings by Sex in Crisfield
Average Earnings in Crisfield are $28,725, $29,460 for men and $25,980 for women, a difference of 11.8%.
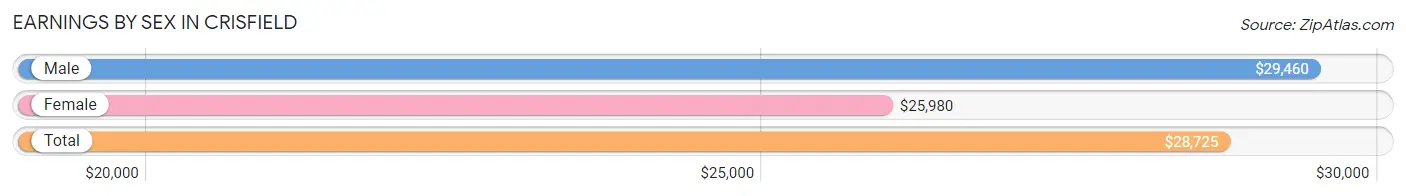
| Sex | Number | Average Earnings |
| Male | 503 (41.7%) | $29,460 |
| Female | 702 (58.3%) | $25,980 |
| Total | 1,205 (100.0%) | $28,725 |
Earnings by Sex by Income Bracket in Crisfield
The most common earnings brackets in Crisfield are $25,000 to $29,999 for men (153 | 30.4%) and $22,500 to $24,999 for women (117 | 16.7%).
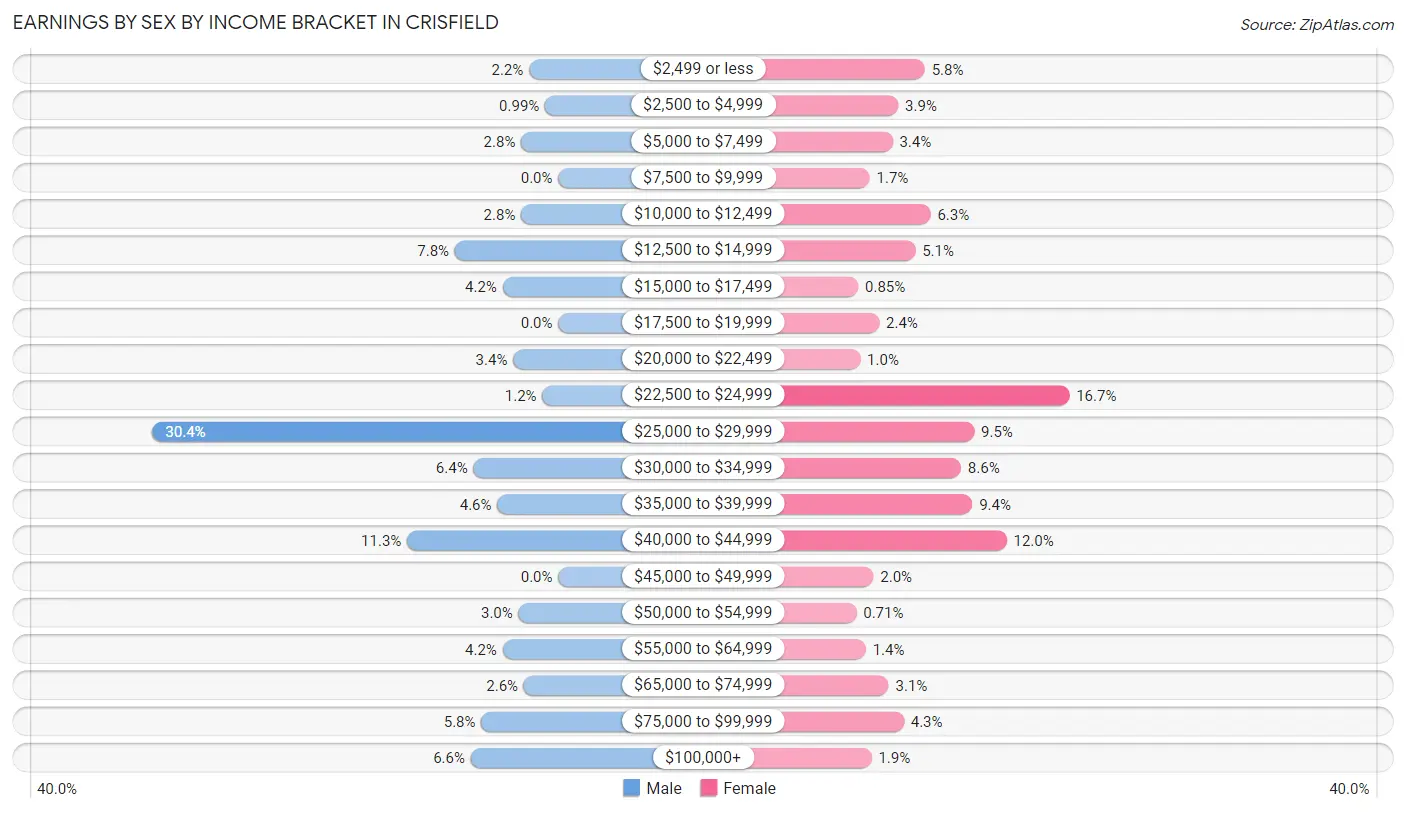
| Income | Male | Female |
| $2,499 or less | 11 (2.2%) | 41 (5.8%) |
| $2,500 to $4,999 | 5 (1.0%) | 27 (3.8%) |
| $5,000 to $7,499 | 14 (2.8%) | 24 (3.4%) |
| $7,500 to $9,999 | 0 (0.0%) | 12 (1.7%) |
| $10,000 to $12,499 | 14 (2.8%) | 44 (6.3%) |
| $12,500 to $14,999 | 39 (7.7%) | 36 (5.1%) |
| $15,000 to $17,499 | 21 (4.2%) | 6 (0.9%) |
| $17,500 to $19,999 | 0 (0.0%) | 17 (2.4%) |
| $20,000 to $22,499 | 17 (3.4%) | 7 (1.0%) |
| $22,500 to $24,999 | 6 (1.2%) | 117 (16.7%) |
| $25,000 to $29,999 | 153 (30.4%) | 67 (9.5%) |
| $30,000 to $34,999 | 32 (6.4%) | 60 (8.6%) |
| $35,000 to $39,999 | 23 (4.6%) | 66 (9.4%) |
| $40,000 to $44,999 | 57 (11.3%) | 84 (12.0%) |
| $45,000 to $49,999 | 0 (0.0%) | 14 (2.0%) |
| $50,000 to $54,999 | 15 (3.0%) | 5 (0.7%) |
| $55,000 to $64,999 | 21 (4.2%) | 10 (1.4%) |
| $65,000 to $74,999 | 13 (2.6%) | 22 (3.1%) |
| $75,000 to $99,999 | 29 (5.8%) | 30 (4.3%) |
| $100,000+ | 33 (6.6%) | 13 (1.8%) |
| Total | 503 (100.0%) | 702 (100.0%) |
Earnings by Sex by Educational Attainment in Crisfield
Average earnings in Crisfield are $29,534 for men and $29,922 for women, a difference of 1.3%. Men with an educational attainment of college or associate's degree enjoy the highest average annual earnings of $44,125, while those with less than high school education earn the least with $14,336. Women with an educational attainment of graduate degree earn the most with the average annual earnings of $58,750, while those with less than high school education have the smallest earnings of $6,442.
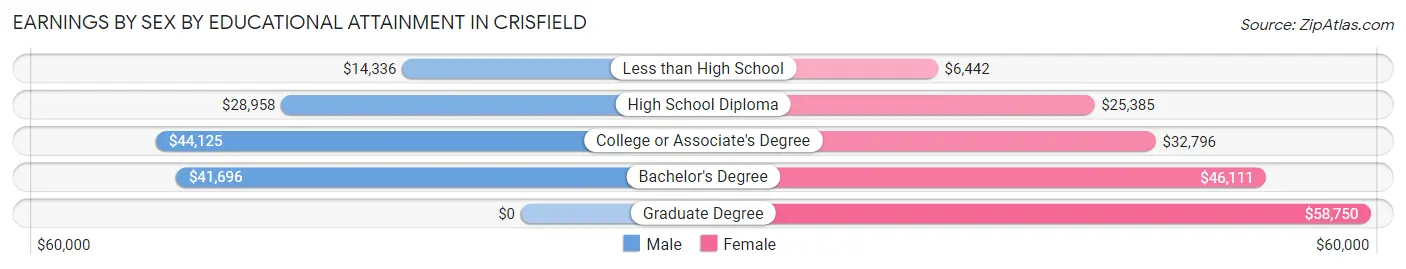
| Educational Attainment | Male Income | Female Income |
| Less than High School | $14,336 | $6,442 |
| High School Diploma | $28,958 | $25,385 |
| College or Associate's Degree | $44,125 | $32,796 |
| Bachelor's Degree | $41,696 | $46,111 |
| Graduate Degree | - | - |
| Total | $29,534 | $29,922 |
Family Income in Crisfield
Family Income Brackets in Crisfield
According to the Crisfield family income data, there are 159 families falling into the $50,000 to $74,999 income range, which is the most common income bracket and makes up 25.9% of all families. Conversely, the $200,000+ income bracket is the least frequent group with only 22 families (3.6%) belonging to this category.
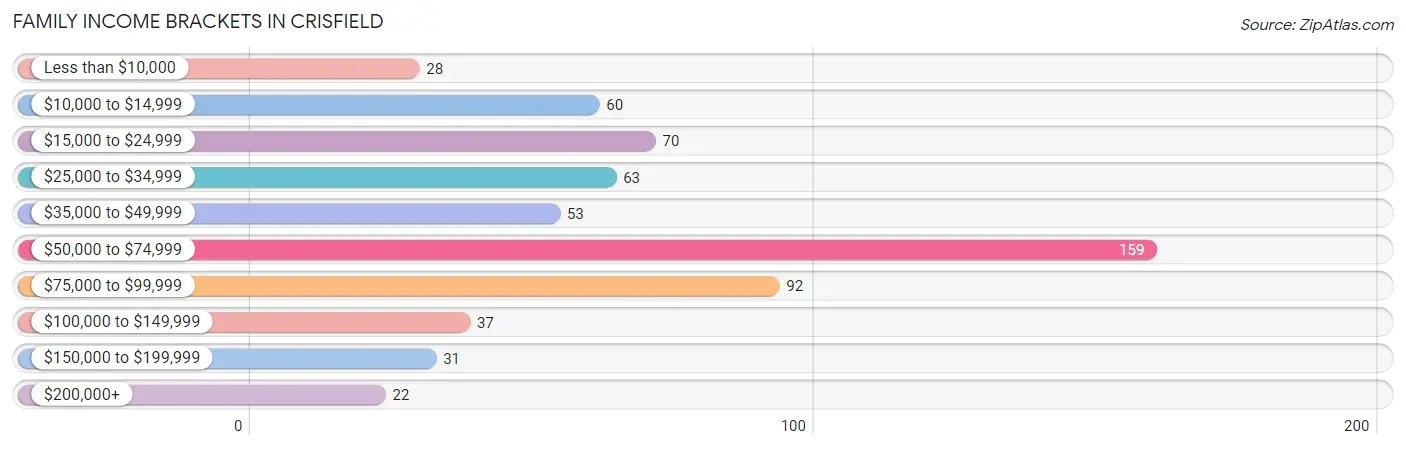
| Income Bracket | # Families | % Families |
| Less than $10,000 | 28 | 4.6% |
| $10,000 to $14,999 | 60 | 9.8% |
| $15,000 to $24,999 | 70 | 11.4% |
| $25,000 to $34,999 | 63 | 10.2% |
| $35,000 to $49,999 | 53 | 8.6% |
| $50,000 to $74,999 | 159 | 25.9% |
| $75,000 to $99,999 | 92 | 15.0% |
| $100,000 to $149,999 | 37 | 6.0% |
| $150,000 to $199,999 | 31 | 5.0% |
| $200,000+ | 22 | 3.6% |
Family Income by Famaliy Size in Crisfield
5-person families (47 | 7.6%) account for the highest median family income in Crisfield with $58,750 per family, while 2-person families (358 | 58.2%) have the highest median income of $25,459 per family member.
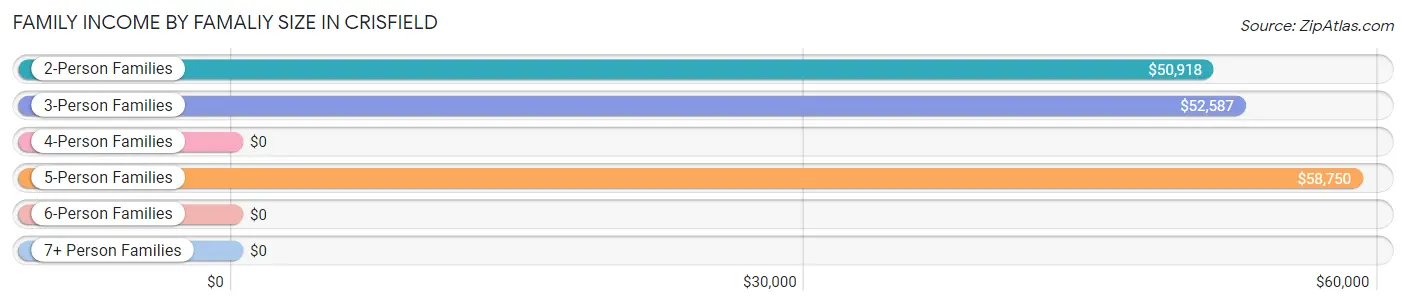
| Income Bracket | # Families | Median Income |
| 2-Person Families | 358 (58.2%) | $50,918 |
| 3-Person Families | 147 (23.9%) | $52,587 |
| 4-Person Families | 56 (9.1%) | $0 |
| 5-Person Families | 47 (7.6%) | $58,750 |
| 6-Person Families | 0 (0.0%) | $0 |
| 7+ Person Families | 7 (1.1%) | $0 |
| Total | 615 (100.0%) | $51,709 |
Family Income by Number of Earners in Crisfield
The median family income in Crisfield is $51,709, with families comprising 3+ earners (20) having the highest median family income of $250,001, while families with 1 earner (235) have the lowest median family income of $25,757, accounting for 3.3% and 38.2% of families, respectively.
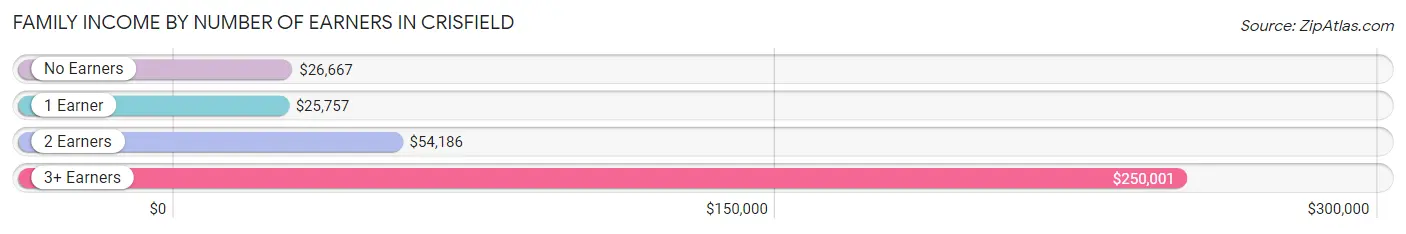
| Number of Earners | # Families | Median Income |
| No Earners | 74 (12.0%) | $26,667 |
| 1 Earner | 235 (38.2%) | $25,757 |
| 2 Earners | 286 (46.5%) | $54,186 |
| 3+ Earners | 20 (3.3%) | $250,001 |
| Total | 615 (100.0%) | $51,709 |
Household Income in Crisfield
Household Income Brackets in Crisfield
With 253 households falling in the category, the $50,000 to $74,999 income range is the most frequent in Crisfield, accounting for 22.8% of all households. In contrast, only 22 households (2.0%) fall into the $200,000+ income bracket, making it the least populous group.
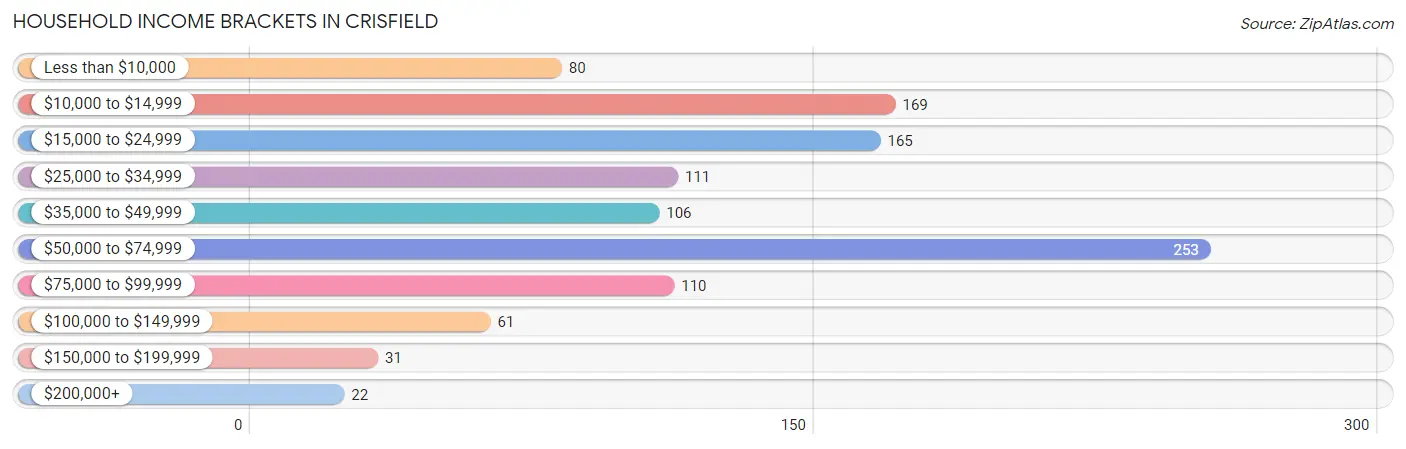
| Income Bracket | # Households | % Households |
| Less than $10,000 | 80 | 7.2% |
| $10,000 to $14,999 | 169 | 15.2% |
| $15,000 to $24,999 | 165 | 14.9% |
| $25,000 to $34,999 | 111 | 10.0% |
| $35,000 to $49,999 | 106 | 9.6% |
| $50,000 to $74,999 | 253 | 22.8% |
| $75,000 to $99,999 | 110 | 9.9% |
| $100,000 to $149,999 | 61 | 5.5% |
| $150,000 to $199,999 | 31 | 2.8% |
| $200,000+ | 22 | 2.0% |
Household Income by Householder Age in Crisfield
The median household income in Crisfield is $38,417, with the highest median household income of $50,510 found in the 15 to 24 years age bracket for the primary householder. A total of 78 households (7.0%) fall into this category. Meanwhile, the 25 to 44 years age bracket for the primary householder has the lowest median household income of $25,905, with 259 households (23.4%) in this group.
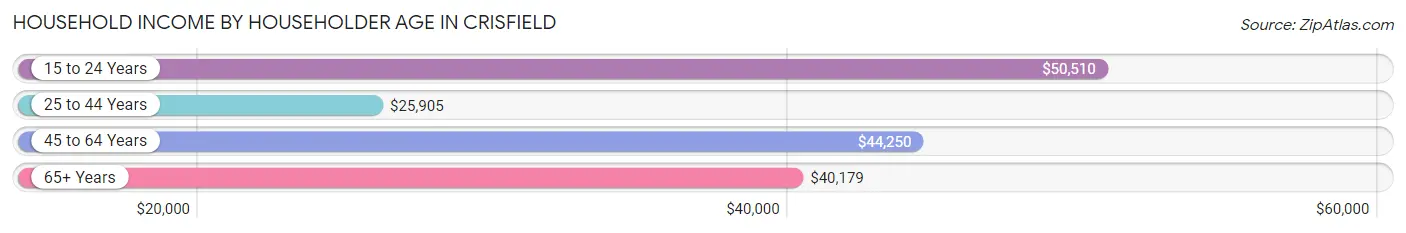
| Income Bracket | # Households | Median Income |
| 15 to 24 Years | 78 (7.0%) | $50,510 |
| 25 to 44 Years | 259 (23.4%) | $25,905 |
| 45 to 64 Years | 381 (34.4%) | $44,250 |
| 65+ Years | 391 (35.3%) | $40,179 |
| Total | 1,109 (100.0%) | $38,417 |
Poverty in Crisfield
Income Below Poverty by Sex and Age in Crisfield
With 22.1% poverty level for males and 28.7% for females among the residents of Crisfield, 12 to 14 year old males and 25 to 34 year old females are the most vulnerable to poverty, with 14 males (100.0%) and 134 females (66.0%) in their respective age groups living below the poverty level.
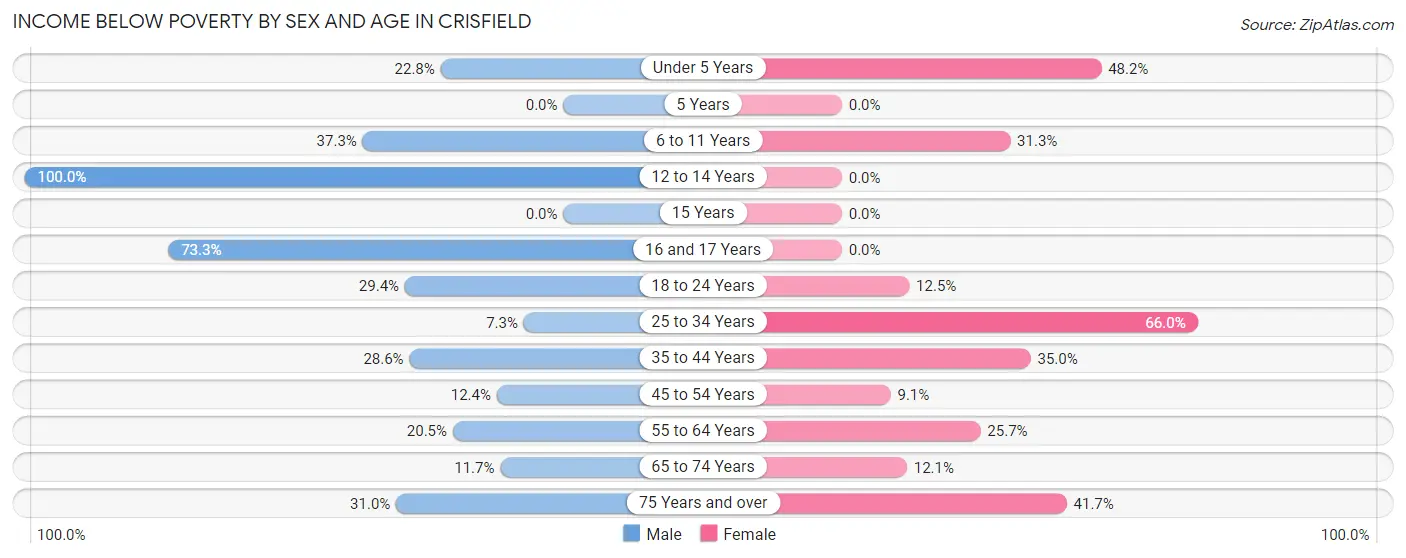
| Age Bracket | Male | Female |
| Under 5 Years | 18 (22.8%) | 39 (48.1%) |
| 5 Years | 0 (0.0%) | 0 (0.0%) |
| 6 to 11 Years | 38 (37.2%) | 45 (31.2%) |
| 12 to 14 Years | 14 (100.0%) | 0 (0.0%) |
| 15 Years | 0 (0.0%) | 0 (0.0%) |
| 16 and 17 Years | 22 (73.3%) | 0 (0.0%) |
| 18 to 24 Years | 5 (29.4%) | 20 (12.5%) |
| 25 to 34 Years | 13 (7.3%) | 134 (66.0%) |
| 35 to 44 Years | 34 (28.6%) | 41 (35.0%) |
| 45 to 54 Years | 10 (12.3%) | 19 (9.0%) |
| 55 to 64 Years | 24 (20.5%) | 44 (25.7%) |
| 65 to 74 Years | 20 (11.7%) | 14 (12.1%) |
| 75 Years and over | 9 (31.0%) | 58 (41.7%) |
| Total | 207 (22.1%) | 414 (28.7%) |
Income Above Poverty by Sex and Age in Crisfield
According to the poverty statistics in Crisfield, males aged 5 years and females aged 12 to 14 years are the age groups that are most secure financially, with 100.0% of males and 100.0% of females in these age groups living above the poverty line.
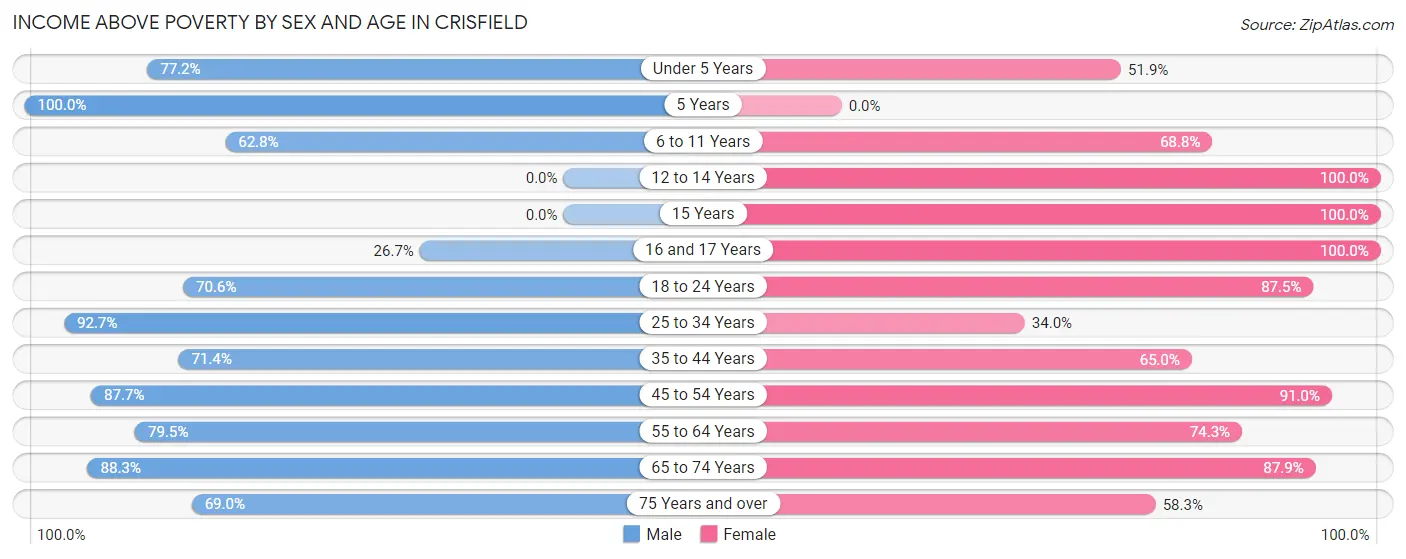
| Age Bracket | Male | Female |
| Under 5 Years | 61 (77.2%) | 42 (51.8%) |
| 5 Years | 2 (100.0%) | 0 (0.0%) |
| 6 to 11 Years | 64 (62.7%) | 99 (68.8%) |
| 12 to 14 Years | 0 (0.0%) | 52 (100.0%) |
| 15 Years | 0 (0.0%) | 3 (100.0%) |
| 16 and 17 Years | 8 (26.7%) | 45 (100.0%) |
| 18 to 24 Years | 12 (70.6%) | 140 (87.5%) |
| 25 to 34 Years | 164 (92.7%) | 69 (34.0%) |
| 35 to 44 Years | 85 (71.4%) | 76 (65.0%) |
| 45 to 54 Years | 71 (87.6%) | 191 (90.9%) |
| 55 to 64 Years | 93 (79.5%) | 127 (74.3%) |
| 65 to 74 Years | 151 (88.3%) | 102 (87.9%) |
| 75 Years and over | 20 (69.0%) | 81 (58.3%) |
| Total | 731 (77.9%) | 1,027 (71.3%) |
Income Below Poverty Among Married-Couple Families in Crisfield
The poverty statistics for married-couple families in Crisfield show that 10.1% or 29 of the total 288 families live below the poverty line. Families with 1 or 2 children have the highest poverty rate of 31.9%, comprising of 29 families. On the other hand, families with no children have the lowest poverty rate of 0.0%, which includes 0 families.
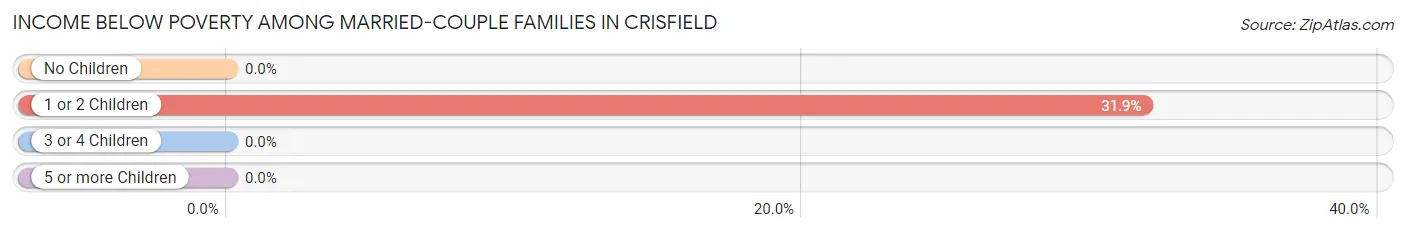
| Children | Above Poverty | Below Poverty |
| No Children | 191 (100.0%) | 0 (0.0%) |
| 1 or 2 Children | 62 (68.1%) | 29 (31.9%) |
| 3 or 4 Children | 6 (100.0%) | 0 (0.0%) |
| 5 or more Children | 0 (0.0%) | 0 (0.0%) |
| Total | 259 (89.9%) | 29 (10.1%) |
Income Below Poverty Among Single-Parent Households in Crisfield
According to the poverty data in Crisfield, 29.0% or 20 single-father households and 32.6% or 84 single-mother households are living below the poverty line. Among single-father households, those with 3 or 4 children have the highest poverty rate, with 7 households (100.0%) experiencing poverty. Likewise, among single-mother households, those with 5 or more children have the highest poverty rate, with 4 households (100.0%) falling below the poverty line.
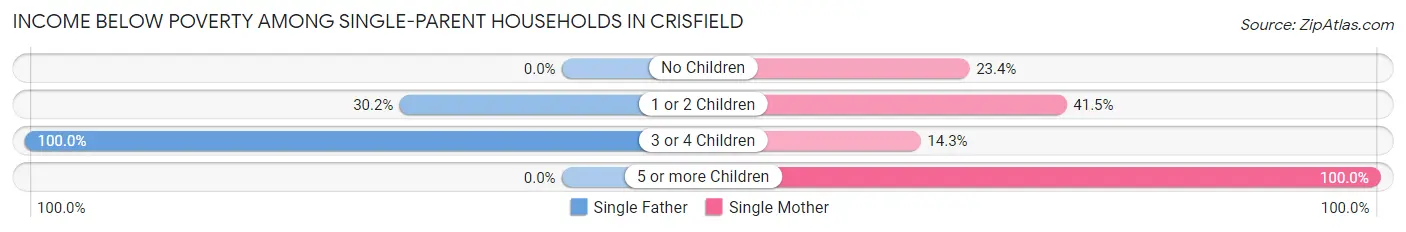
| Children | Single Father | Single Mother |
| No Children | 0 (0.0%) | 18 (23.4%) |
| 1 or 2 Children | 13 (30.2%) | 56 (41.5%) |
| 3 or 4 Children | 7 (100.0%) | 6 (14.3%) |
| 5 or more Children | 0 (0.0%) | 4 (100.0%) |
| Total | 20 (29.0%) | 84 (32.6%) |
Income Below Poverty Among Married-Couple vs Single-Parent Households in Crisfield
The poverty data for Crisfield shows that 29 of the married-couple family households (10.1%) and 104 of the single-parent households (31.8%) are living below the poverty level. Within the married-couple family households, those with 1 or 2 children have the highest poverty rate, with 29 households (31.9%) falling below the poverty line. Among the single-parent households, those with 5 or more children have the highest poverty rate, with 4 household (100.0%) living below poverty.
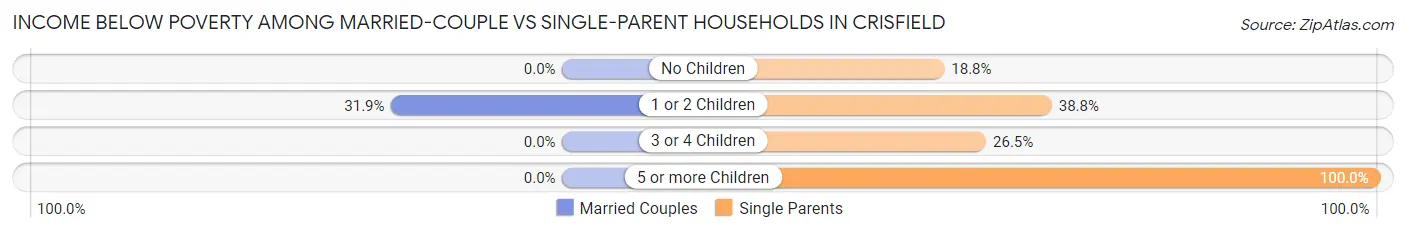
| Children | Married-Couple Families | Single-Parent Households |
| No Children | 0 (0.0%) | 18 (18.8%) |
| 1 or 2 Children | 29 (31.9%) | 69 (38.8%) |
| 3 or 4 Children | 0 (0.0%) | 13 (26.5%) |
| 5 or more Children | 0 (0.0%) | 4 (100.0%) |
| Total | 29 (10.1%) | 104 (31.8%) |
Race in Crisfield
The most populous races in Crisfield are White / Caucasian (1,369 | 56.0%), Black / African American (855 | 35.0%), and Two or more Races (129 | 5.3%).
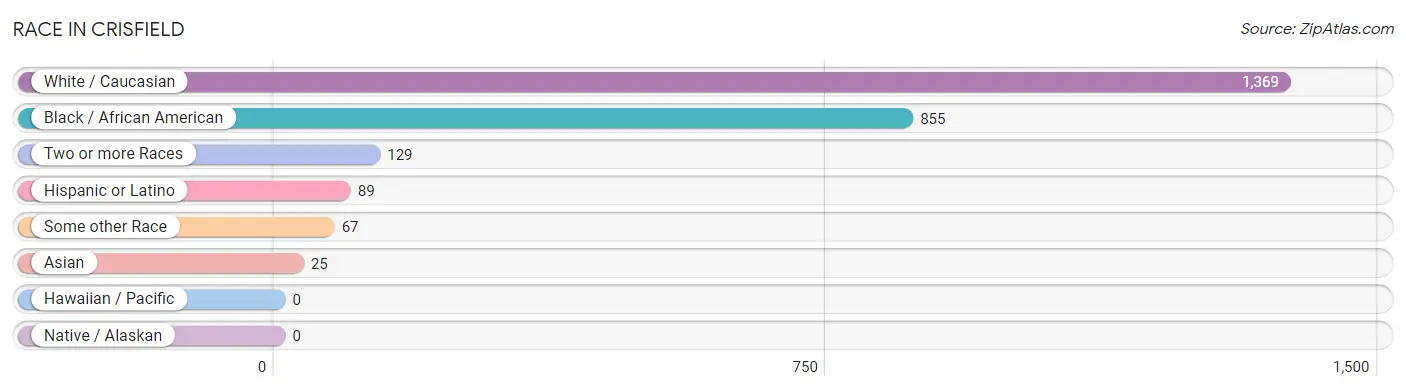
| Race | # Population | % Population |
| Asian | 25 | 1.0% |
| Black / African American | 855 | 35.0% |
| Hawaiian / Pacific | 0 | 0.0% |
| Hispanic or Latino | 89 | 3.6% |
| Native / Alaskan | 0 | 0.0% |
| White / Caucasian | 1,369 | 56.0% |
| Two or more Races | 129 | 5.3% |
| Some other Race | 67 | 2.7% |
| Total | 2,445 | 100.0% |
Ancestry in Crisfield
The most populous ancestries reported in Crisfield are American (1,069 | 43.7%), English (125 | 5.1%), German (99 | 4.1%), Irish (99 | 4.1%), and Mexican (67 | 2.7%), together accounting for 59.7% of all Crisfield residents.
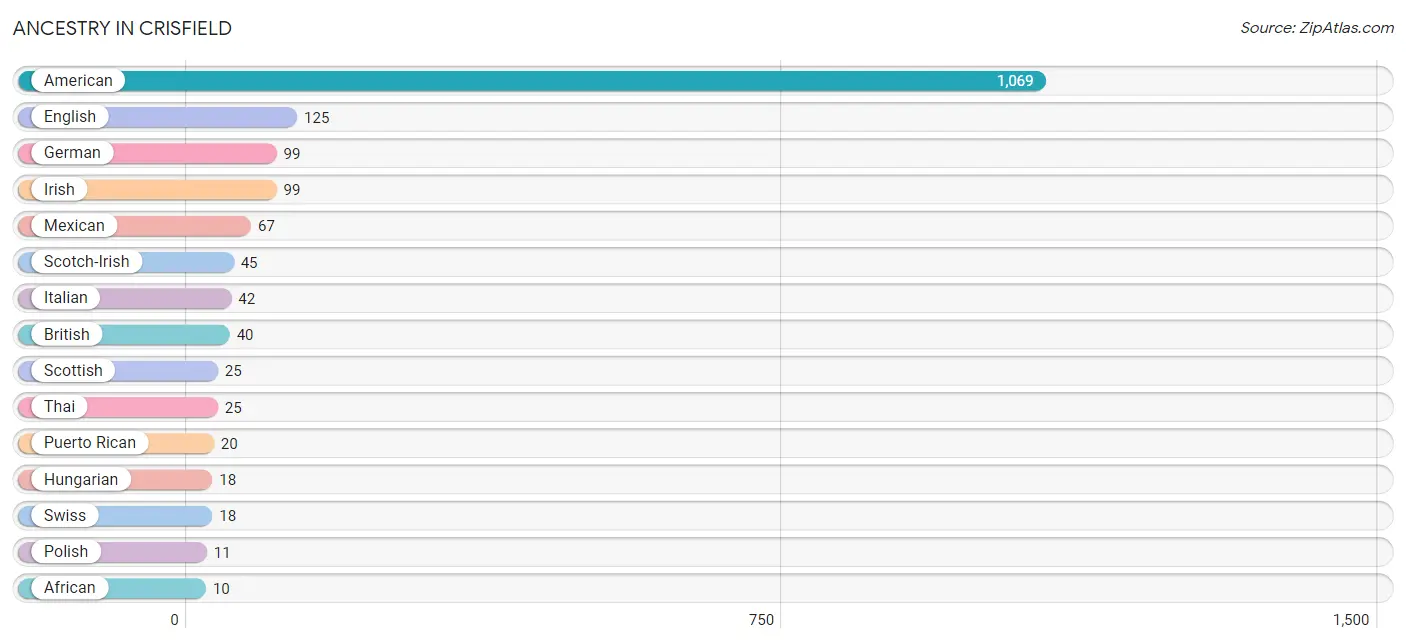
| Ancestry | # Population | % Population |
| African | 10 | 0.4% |
| American | 1,069 | 43.7% |
| Belgian | 5 | 0.2% |
| British | 40 | 1.6% |
| Cherokee | 3 | 0.1% |
| Dutch | 7 | 0.3% |
| English | 125 | 5.1% |
| European | 8 | 0.3% |
| French | 8 | 0.3% |
| German | 99 | 4.1% |
| Hungarian | 18 | 0.7% |
| Irish | 99 | 4.1% |
| Italian | 42 | 1.7% |
| Mexican | 67 | 2.7% |
| Pennsylvania German | 10 | 0.4% |
| Polish | 11 | 0.4% |
| Puerto Rican | 20 | 0.8% |
| Scotch-Irish | 45 | 1.8% |
| Scottish | 25 | 1.0% |
| Spaniard | 2 | 0.1% |
| Sri Lankan | 10 | 0.4% |
| Subsaharan African | 10 | 0.4% |
| Swiss | 18 | 0.7% |
| Thai | 25 | 1.0% | View All 24 Rows |
Immigrants in Crisfield
The most numerous immigrant groups reported in Crisfield came from Europe (19 | 0.8%), Central America (15 | 0.6%), Latin America (15 | 0.6%), Mexico (15 | 0.6%), and Northern Europe (12 | 0.5%), together accounting for 3.1% of all Crisfield residents.
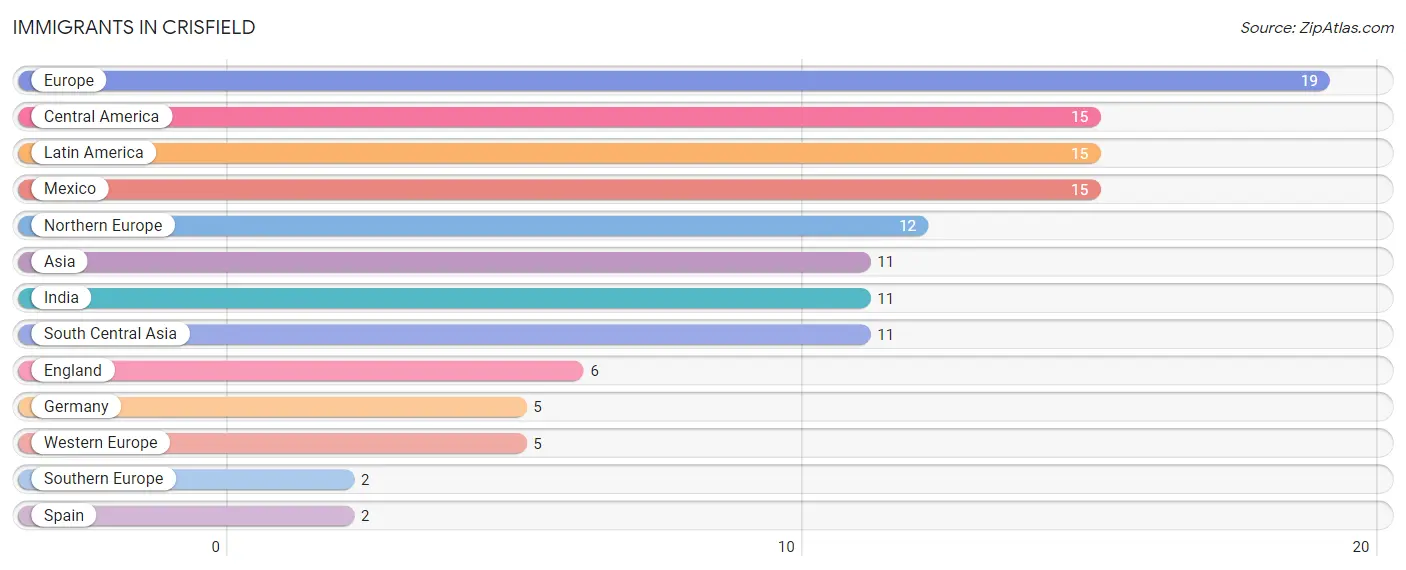
| Immigration Origin | # Population | % Population |
| Asia | 11 | 0.4% |
| Central America | 15 | 0.6% |
| England | 6 | 0.3% |
| Europe | 19 | 0.8% |
| Germany | 5 | 0.2% |
| India | 11 | 0.4% |
| Latin America | 15 | 0.6% |
| Mexico | 15 | 0.6% |
| Northern Europe | 12 | 0.5% |
| South Central Asia | 11 | 0.4% |
| Southern Europe | 2 | 0.1% |
| Spain | 2 | 0.1% |
| Western Europe | 5 | 0.2% | View All 13 Rows |
Sex and Age in Crisfield
Sex and Age in Crisfield
The most populous age groups in Crisfield are 25 to 29 Years (134 | 13.9%) for men and 50 to 54 Years (164 | 11.1%) for women.
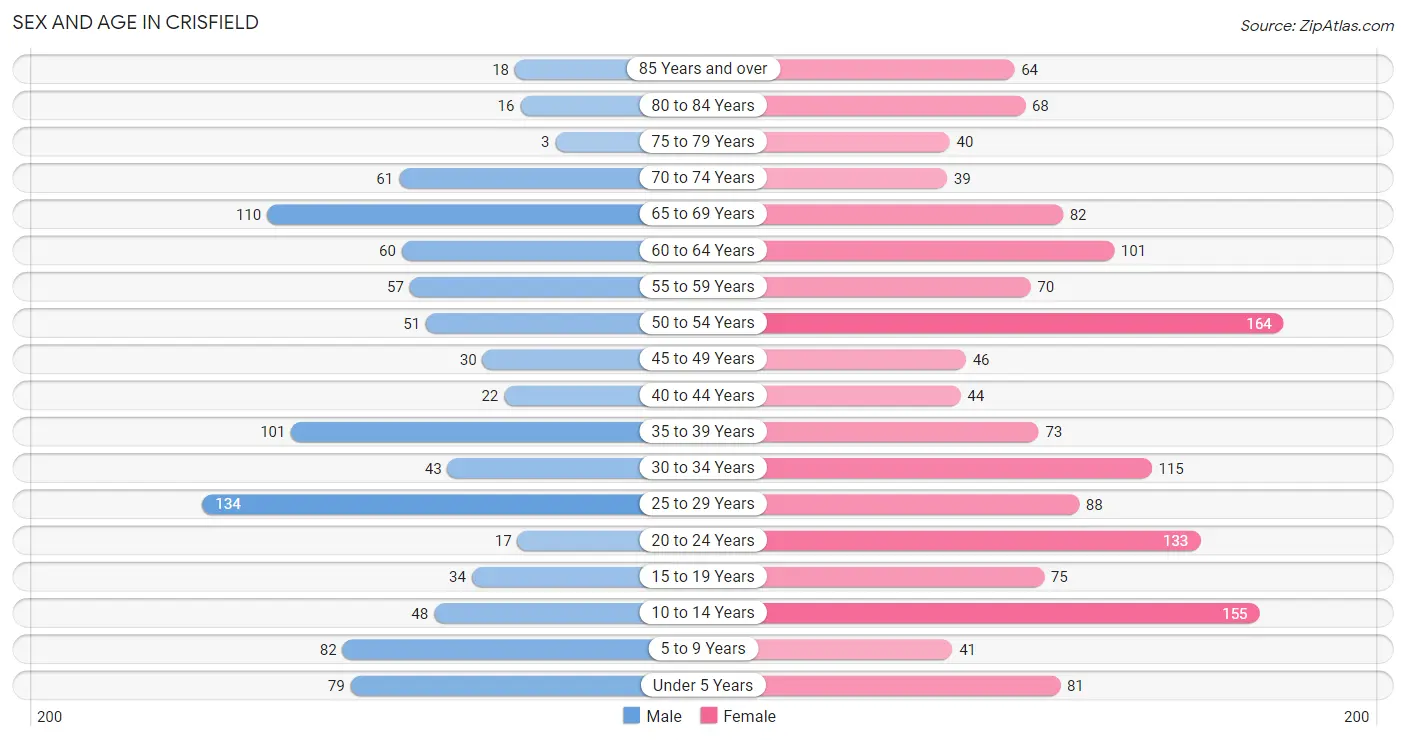
| Age Bracket | Male | Female |
| Under 5 Years | 79 (8.2%) | 81 (5.5%) |
| 5 to 9 Years | 82 (8.5%) | 41 (2.8%) |
| 10 to 14 Years | 48 (5.0%) | 155 (10.5%) |
| 15 to 19 Years | 34 (3.5%) | 75 (5.1%) |
| 20 to 24 Years | 17 (1.8%) | 133 (9.0%) |
| 25 to 29 Years | 134 (13.9%) | 88 (5.9%) |
| 30 to 34 Years | 43 (4.4%) | 115 (7.8%) |
| 35 to 39 Years | 101 (10.5%) | 73 (4.9%) |
| 40 to 44 Years | 22 (2.3%) | 44 (3.0%) |
| 45 to 49 Years | 30 (3.1%) | 46 (3.1%) |
| 50 to 54 Years | 51 (5.3%) | 164 (11.1%) |
| 55 to 59 Years | 57 (5.9%) | 70 (4.7%) |
| 60 to 64 Years | 60 (6.2%) | 101 (6.8%) |
| 65 to 69 Years | 110 (11.4%) | 82 (5.5%) |
| 70 to 74 Years | 61 (6.3%) | 39 (2.6%) |
| 75 to 79 Years | 3 (0.3%) | 40 (2.7%) |
| 80 to 84 Years | 16 (1.7%) | 68 (4.6%) |
| 85 Years and over | 18 (1.9%) | 64 (4.3%) |
| Total | 966 (100.0%) | 1,479 (100.0%) |
Families and Households in Crisfield
Median Family Size in Crisfield
The median family size in Crisfield is 2.86 persons per family, with single male/father families (69 | 11.2%) accounting for the largest median family size of 3.2 persons per family. On the other hand, married-couple families (288 | 46.8%) represent the smallest median family size with 2.73 persons per family.
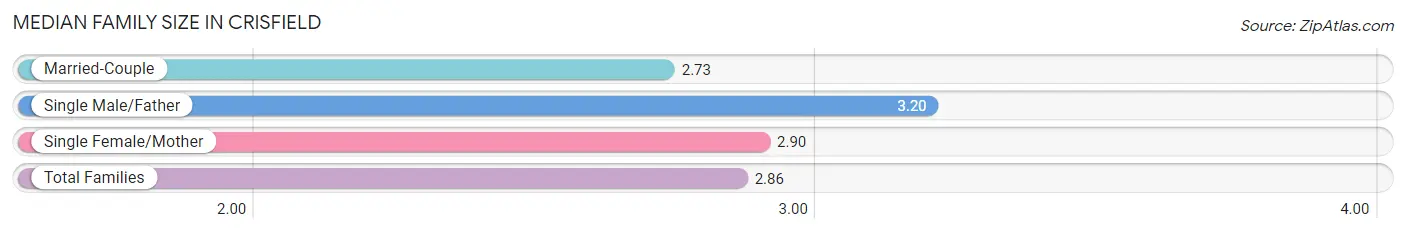
| Family Type | # Families | Family Size |
| Married-Couple | 288 (46.8%) | 2.73 |
| Single Male/Father | 69 (11.2%) | 3.20 |
| Single Female/Mother | 258 (41.9%) | 2.90 |
| Total Families | 615 (100.0%) | 2.86 |
Median Household Size in Crisfield
The median household size in Crisfield is 2.16 persons per household, with single male/father households (69 | 6.2%) accounting for the largest median household size of 3.72 persons per household. non-family households (494 | 44.5%) represent the smallest median household size with 1.20 persons per household.
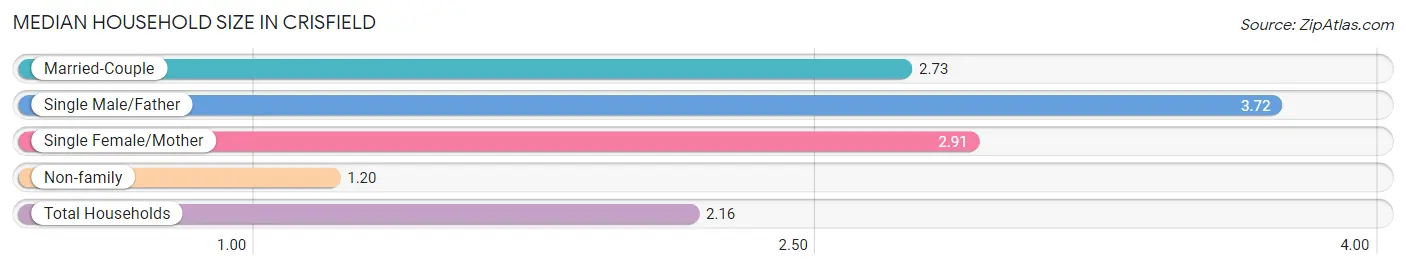
| Household Type | # Households | Household Size |
| Married-Couple | 288 (26.0%) | 2.73 |
| Single Male/Father | 69 (6.2%) | 3.72 |
| Single Female/Mother | 258 (23.3%) | 2.91 |
| Non-family | 494 (44.5%) | 1.20 |
| Total Households | 1,109 (100.0%) | 2.16 |
Household Size by Marriage Status in Crisfield
Out of a total of 1,109 households in Crisfield, 615 (55.5%) are family households, while 494 (44.5%) are nonfamily households. The most numerous type of family households are 2-person households, comprising 352, and the most common type of nonfamily households are 1-person households, comprising 440.
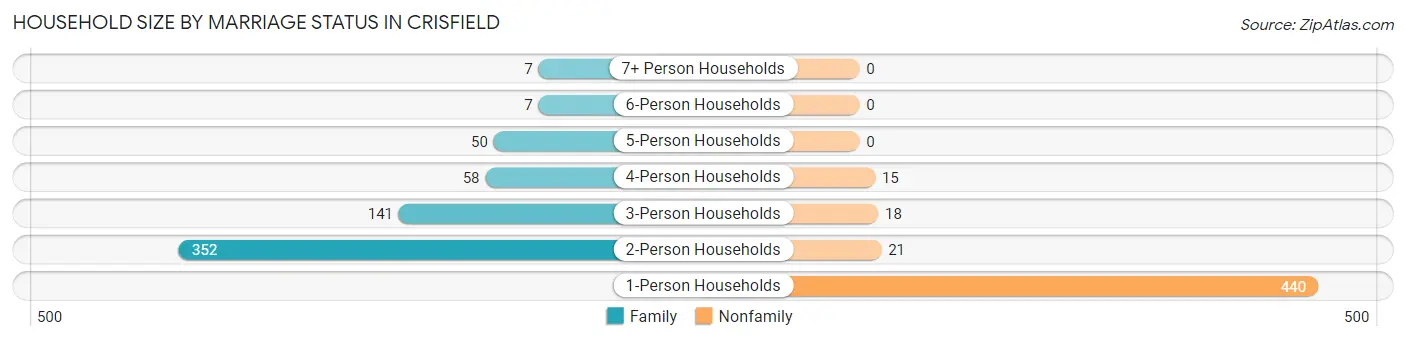
| Household Size | Family Households | Nonfamily Households |
| 1-Person Households | - | 440 (39.7%) |
| 2-Person Households | 352 (31.7%) | 21 (1.9%) |
| 3-Person Households | 141 (12.7%) | 18 (1.6%) |
| 4-Person Households | 58 (5.2%) | 15 (1.3%) |
| 5-Person Households | 50 (4.5%) | 0 (0.0%) |
| 6-Person Households | 7 (0.6%) | 0 (0.0%) |
| 7+ Person Households | 7 (0.6%) | 0 (0.0%) |
| Total | 615 (55.5%) | 494 (44.5%) |
Female Fertility in Crisfield
Fertility by Age in Crisfield
Average fertility rate in Crisfield is 33.0 births per 1,000 women. Women in the age bracket of 20 to 34 years have the highest fertility rate with 65.0 births per 1,000 women. Women in the age bracket of 20 to 34 years acount for 100.0% of all women with births.
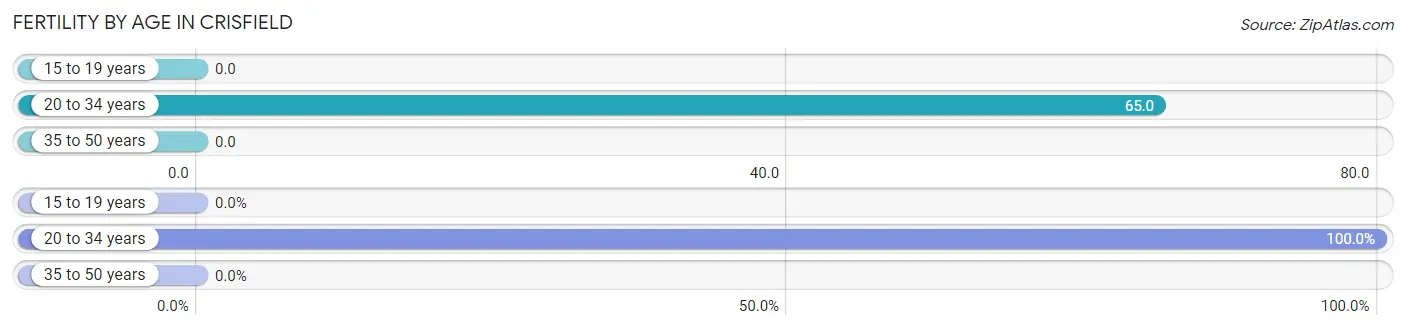
| Age Bracket | Women with Births | Births / 1,000 Women |
| 15 to 19 years | 0 (0.0%) | 0.0 |
| 20 to 34 years | 22 (100.0%) | 65.0 |
| 35 to 50 years | 0 (0.0%) | 0.0 |
| Total | 22 (100.0%) | 33.0 |
Fertility by Age by Marriage Status in Crisfield
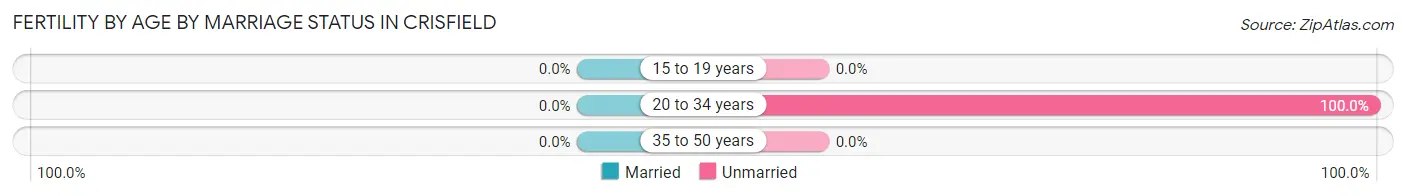
| Age Bracket | Married | Unmarried |
| 15 to 19 years | 0 (0.0%) | 0 (0.0%) |
| 20 to 34 years | 0 (0.0%) | 22 (100.0%) |
| 35 to 50 years | 0 (0.0%) | 0 (0.0%) |
| Total | 0 (0.0%) | 22 (100.0%) |
Fertility by Education in Crisfield
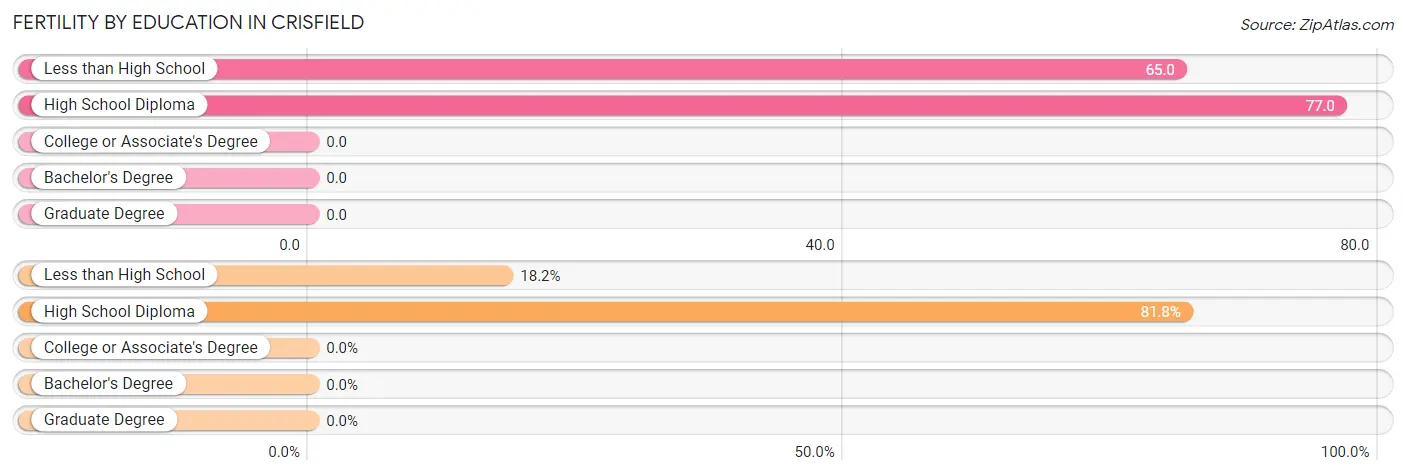
| Educational Attainment | Women with Births | Births / 1,000 Women |
| Less than High School | 4 (18.2%) | 65.0 |
| High School Diploma | 18 (81.8%) | 77.0 |
| College or Associate's Degree | 0 (0.0%) | 0.0 |
| Bachelor's Degree | 0 (0.0%) | 0.0 |
| Graduate Degree | 0 (0.0%) | 0.0 |
| Total | 22 (100.0%) | 33.0 |
Fertility by Education by Marriage Status in Crisfield
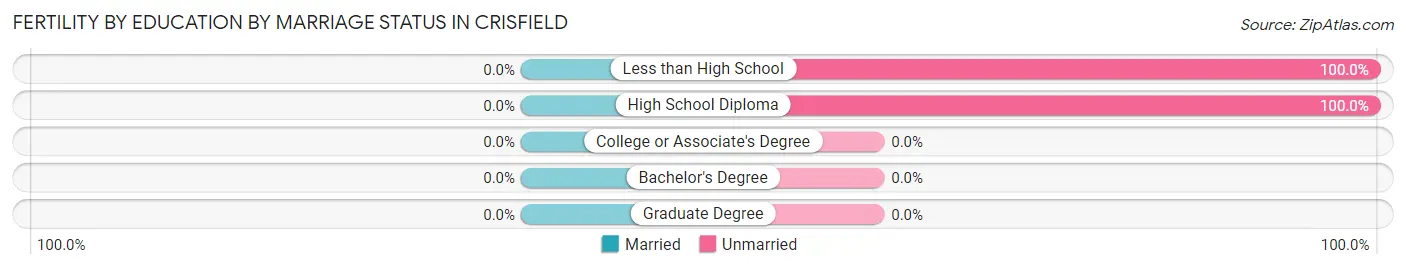
| Educational Attainment | Married | Unmarried |
| Less than High School | 0 (0.0%) | 4 (100.0%) |
| High School Diploma | 0 (0.0%) | 18 (100.0%) |
| College or Associate's Degree | 0 (0.0%) | 0 (0.0%) |
| Bachelor's Degree | 0 (0.0%) | 0 (0.0%) |
| Graduate Degree | 0 (0.0%) | 0 (0.0%) |
| Total | 0 (0.0%) | 22 (100.0%) |
Employment Characteristics in Crisfield
Employment by Class of Employer in Crisfield
Among the 1,003 employed individuals in Crisfield, private company employees (749 | 74.7%), not-for-profit organizations (88 | 8.8%), and local government employees (62 | 6.2%) make up the most common classes of employment.
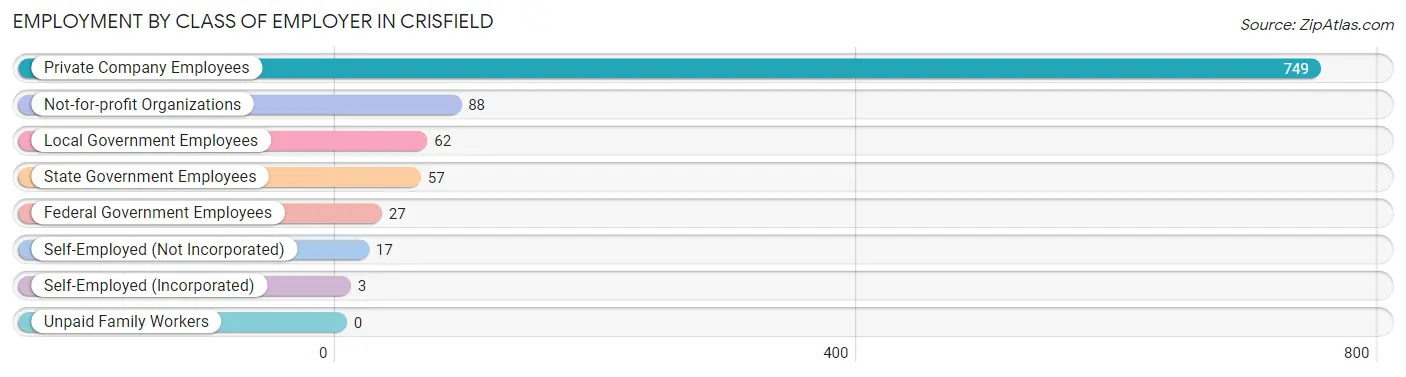
| Employer Class | # Employees | % Employees |
| Private Company Employees | 749 | 74.7% |
| Self-Employed (Incorporated) | 3 | 0.3% |
| Self-Employed (Not Incorporated) | 17 | 1.7% |
| Not-for-profit Organizations | 88 | 8.8% |
| Local Government Employees | 62 | 6.2% |
| State Government Employees | 57 | 5.7% |
| Federal Government Employees | 27 | 2.7% |
| Unpaid Family Workers | 0 | 0.0% |
| Total | 1,003 | 100.0% |
Employment Status by Age in Crisfield
According to the labor force statistics for Crisfield, out of the total population over 16 years of age (1,956), 60.4% or 1,181 individuals are in the labor force, with 14.5% or 171 of them unemployed. The age group with the highest labor force participation rate is 20 to 24 years, with 94.0% or 141 individuals in the labor force. Within the labor force, the 75 years and over age range has the highest percentage of unemployed individuals, with 100.0% or 13 of them being unemployed.
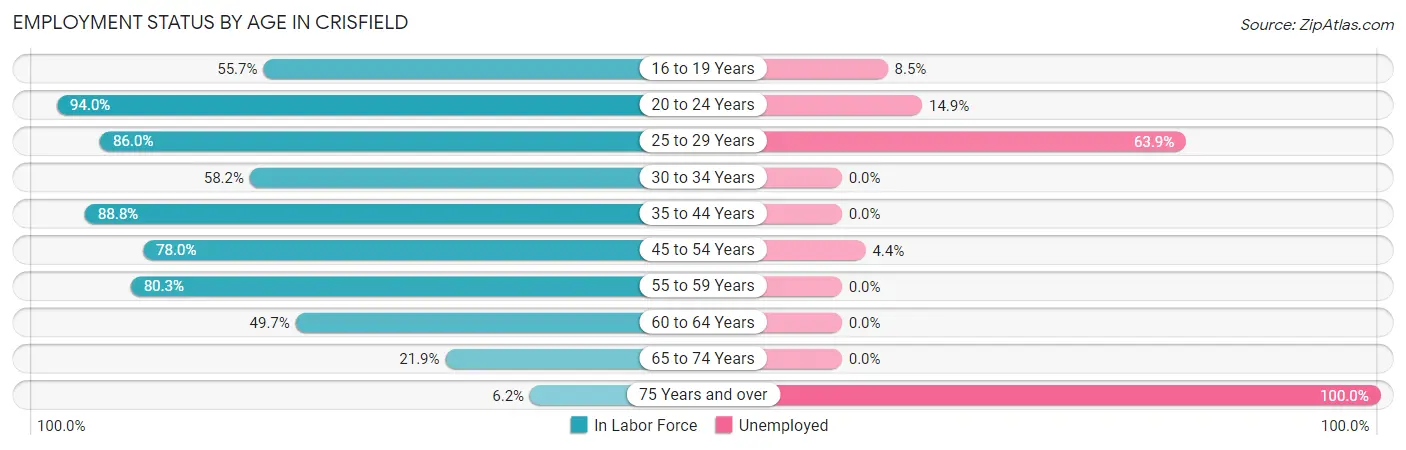
| Age Bracket | In Labor Force | Unemployed |
| 16 to 19 Years | 59 (55.7%) | 5 (8.5%) |
| 20 to 24 Years | 141 (94.0%) | 21 (14.9%) |
| 25 to 29 Years | 191 (86.0%) | 122 (63.9%) |
| 30 to 34 Years | 92 (58.2%) | 0 (0.0%) |
| 35 to 44 Years | 213 (88.8%) | 0 (0.0%) |
| 45 to 54 Years | 227 (78.0%) | 10 (4.4%) |
| 55 to 59 Years | 102 (80.3%) | 0 (0.0%) |
| 60 to 64 Years | 80 (49.7%) | 0 (0.0%) |
| 65 to 74 Years | 64 (21.9%) | 0 (0.0%) |
| 75 Years and over | 13 (6.2%) | 13 (100.0%) |
| Total | 1,181 (60.4%) | 171 (14.5%) |
Employment Status by Educational Attainment in Crisfield
According to labor force statistics for Crisfield, 75.5% of individuals (905) out of the total population between 25 and 64 years of age (1,199) are in the labor force, with 14.6% or 132 of them being unemployed. The group with the highest labor force participation rate are those with the educational attainment of bachelor's degree or higher, with 86.4% or 204 individuals in the labor force. Within the labor force, individuals with high school diploma education have the highest percentage of unemployment, with 33.6% or 126 of them being unemployed.
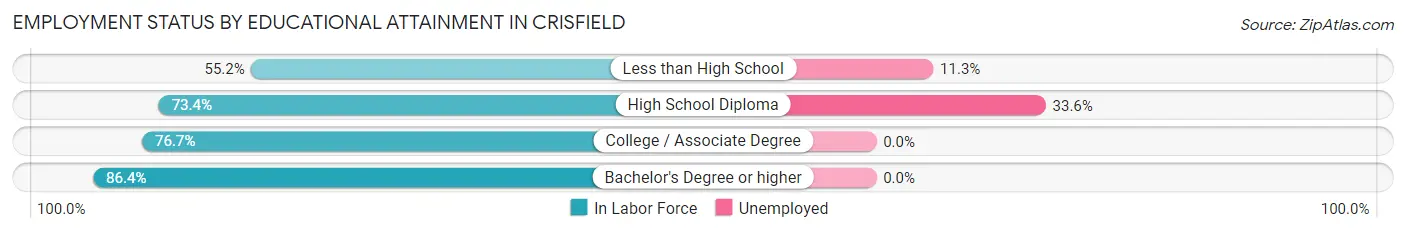
| Educational Attainment | In Labor Force | Unemployed |
| Less than High School | 53 (55.2%) | 11 (11.3%) |
| High School Diploma | 375 (73.4%) | 172 (33.6%) |
| College / Associate Degree | 273 (76.7%) | 0 (0.0%) |
| Bachelor's Degree or higher | 204 (86.4%) | 0 (0.0%) |
| Total | 905 (75.5%) | 175 (14.6%) |
Employment Occupations by Sex in Crisfield
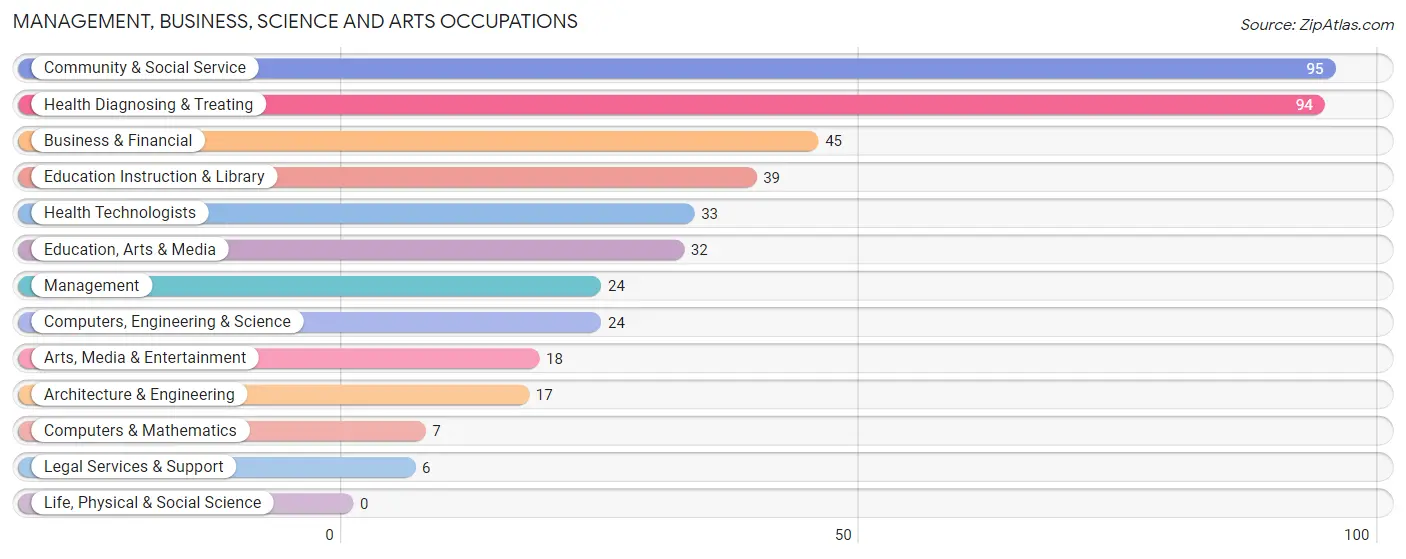
Management, Business, Science and Arts Occupations
The most common Management, Business, Science and Arts occupations in Crisfield are Community & Social Service (95 | 9.4%), Health Diagnosing & Treating (94 | 9.3%), Business & Financial (45 | 4.4%), Education Instruction & Library (39 | 3.9%), and Health Technologists (33 | 3.3%).
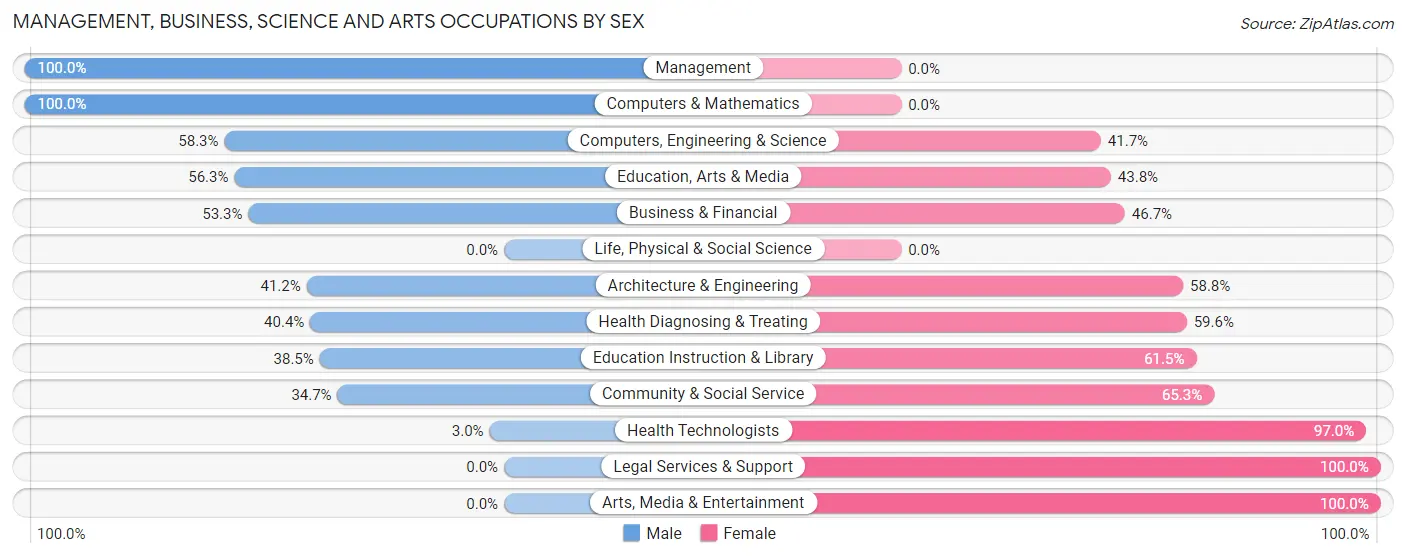
Management, Business, Science and Arts Occupations by Sex
Within the Management, Business, Science and Arts occupations in Crisfield, the most male-oriented occupations are Management (100.0%), Computers & Mathematics (100.0%), and Computers, Engineering & Science (58.3%), while the most female-oriented occupations are Legal Services & Support (100.0%), Arts, Media & Entertainment (100.0%), and Health Technologists (97.0%).
| Occupation | Male | Female |
| Management | 24 (100.0%) | 0 (0.0%) |
| Business & Financial | 24 (53.3%) | 21 (46.7%) |
| Computers, Engineering & Science | 14 (58.3%) | 10 (41.7%) |
| Computers & Mathematics | 7 (100.0%) | 0 (0.0%) |
| Architecture & Engineering | 7 (41.2%) | 10 (58.8%) |
| Life, Physical & Social Science | 0 (0.0%) | 0 (0.0%) |
| Community & Social Service | 33 (34.7%) | 62 (65.3%) |
| Education, Arts & Media | 18 (56.2%) | 14 (43.8%) |
| Legal Services & Support | 0 (0.0%) | 6 (100.0%) |
| Education Instruction & Library | 15 (38.5%) | 24 (61.5%) |
| Arts, Media & Entertainment | 0 (0.0%) | 18 (100.0%) |
| Health Diagnosing & Treating | 38 (40.4%) | 56 (59.6%) |
| Health Technologists | 1 (3.0%) | 32 (97.0%) |
| Total (Category) | 133 (47.2%) | 149 (52.8%) |
| Total (Overall) | 343 (33.9%) | 668 (66.1%) |
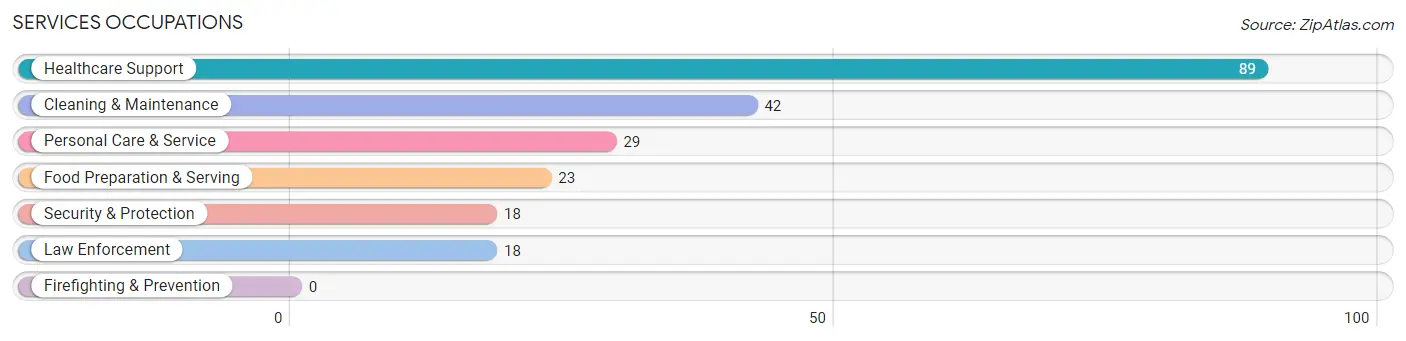
Services Occupations
The most common Services occupations in Crisfield are Healthcare Support (89 | 8.8%), Cleaning & Maintenance (42 | 4.2%), Personal Care & Service (29 | 2.9%), Food Preparation & Serving (23 | 2.3%), and Security & Protection (18 | 1.8%).
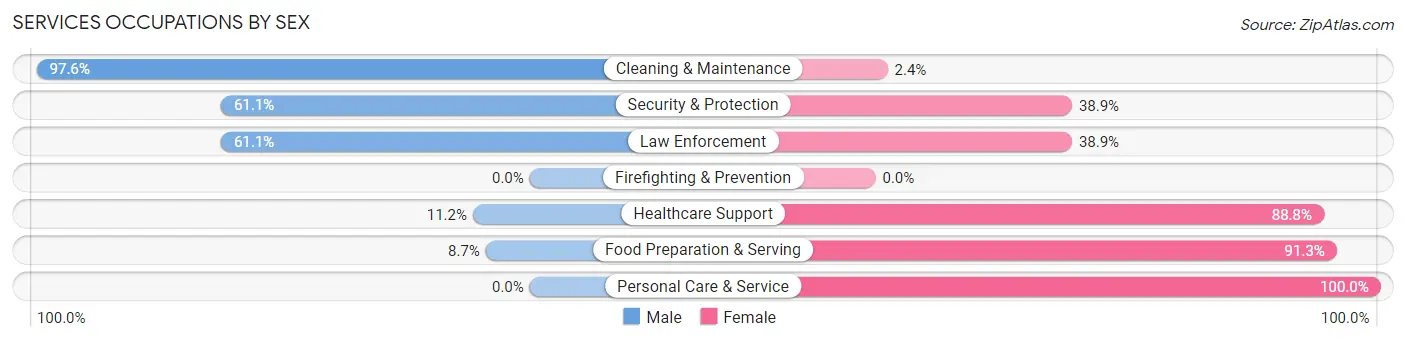
Services Occupations by Sex
Within the Services occupations in Crisfield, the most male-oriented occupations are Cleaning & Maintenance (97.6%), Security & Protection (61.1%), and Law Enforcement (61.1%), while the most female-oriented occupations are Personal Care & Service (100.0%), Food Preparation & Serving (91.3%), and Healthcare Support (88.8%).
| Occupation | Male | Female |
| Healthcare Support | 10 (11.2%) | 79 (88.8%) |
| Security & Protection | 11 (61.1%) | 7 (38.9%) |
| Firefighting & Prevention | 0 (0.0%) | 0 (0.0%) |
| Law Enforcement | 11 (61.1%) | 7 (38.9%) |
| Food Preparation & Serving | 2 (8.7%) | 21 (91.3%) |
| Cleaning & Maintenance | 41 (97.6%) | 1 (2.4%) |
| Personal Care & Service | 0 (0.0%) | 29 (100.0%) |
| Total (Category) | 64 (31.8%) | 137 (68.2%) |
| Total (Overall) | 343 (33.9%) | 668 (66.1%) |
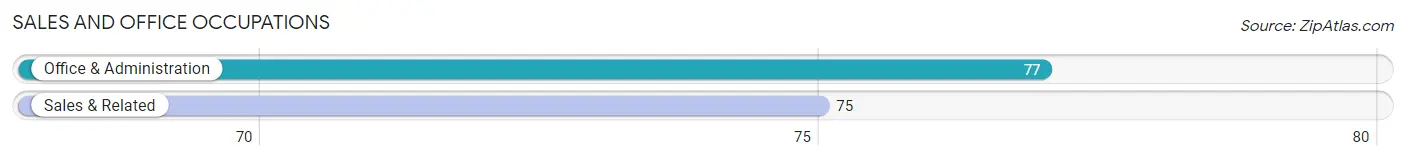
Sales and Office Occupations
The most common Sales and Office occupations in Crisfield are Office & Administration (77 | 7.6%), and Sales & Related (75 | 7.4%).
Sales and Office Occupations by Sex
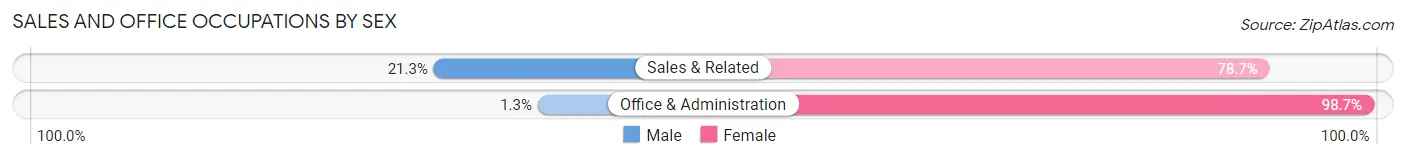
| Occupation | Male | Female |
| Sales & Related | 16 (21.3%) | 59 (78.7%) |
| Office & Administration | 1 (1.3%) | 76 (98.7%) |
| Total (Category) | 17 (11.2%) | 135 (88.8%) |
| Total (Overall) | 343 (33.9%) | 668 (66.1%) |
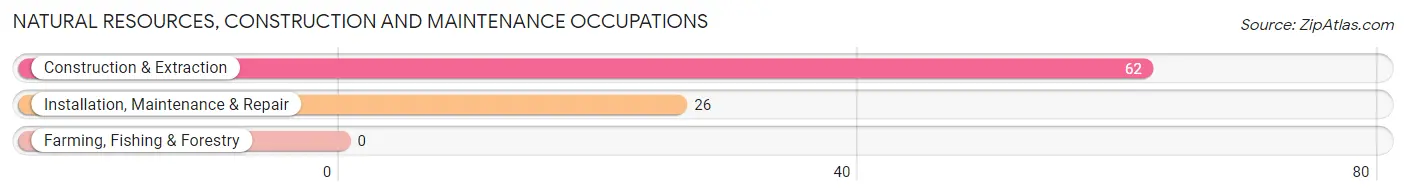
Natural Resources, Construction and Maintenance Occupations
The most common Natural Resources, Construction and Maintenance occupations in Crisfield are Construction & Extraction (62 | 6.1%), and Installation, Maintenance & Repair (26 | 2.6%).
Natural Resources, Construction and Maintenance Occupations by Sex
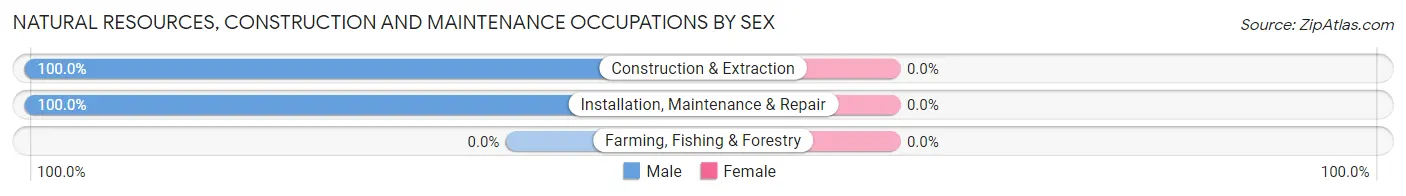
| Occupation | Male | Female |
| Farming, Fishing & Forestry | 0 (0.0%) | 0 (0.0%) |
| Construction & Extraction | 62 (100.0%) | 0 (0.0%) |
| Installation, Maintenance & Repair | 26 (100.0%) | 0 (0.0%) |
| Total (Category) | 88 (100.0%) | 0 (0.0%) |
| Total (Overall) | 343 (33.9%) | 668 (66.1%) |
Production, Transportation and Moving Occupations
The most common Production, Transportation and Moving occupations in Crisfield are Material Moving (194 | 19.2%), Production (71 | 7.0%), and Transportation (23 | 2.3%).
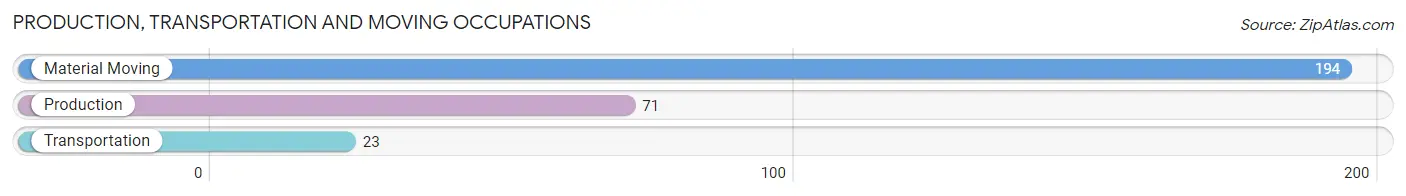
Production, Transportation and Moving Occupations by Sex
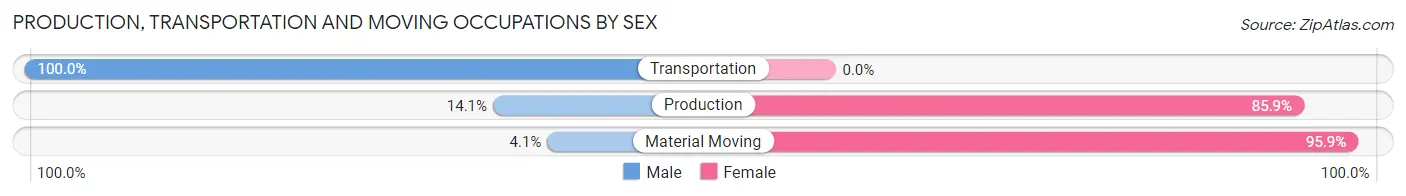
| Occupation | Male | Female |
| Production | 10 (14.1%) | 61 (85.9%) |
| Transportation | 23 (100.0%) | 0 (0.0%) |
| Material Moving | 8 (4.1%) | 186 (95.9%) |
| Total (Category) | 41 (14.2%) | 247 (85.8%) |
| Total (Overall) | 343 (33.9%) | 668 (66.1%) |
Employment Industries by Sex in Crisfield
Employment Industries in Crisfield
The major employment industries in Crisfield include Retail Trade (325 | 32.2%), Health Care & Social Assistance (237 | 23.4%), Manufacturing (74 | 7.3%), Educational Services (55 | 5.4%), and Public Administration (55 | 5.4%).
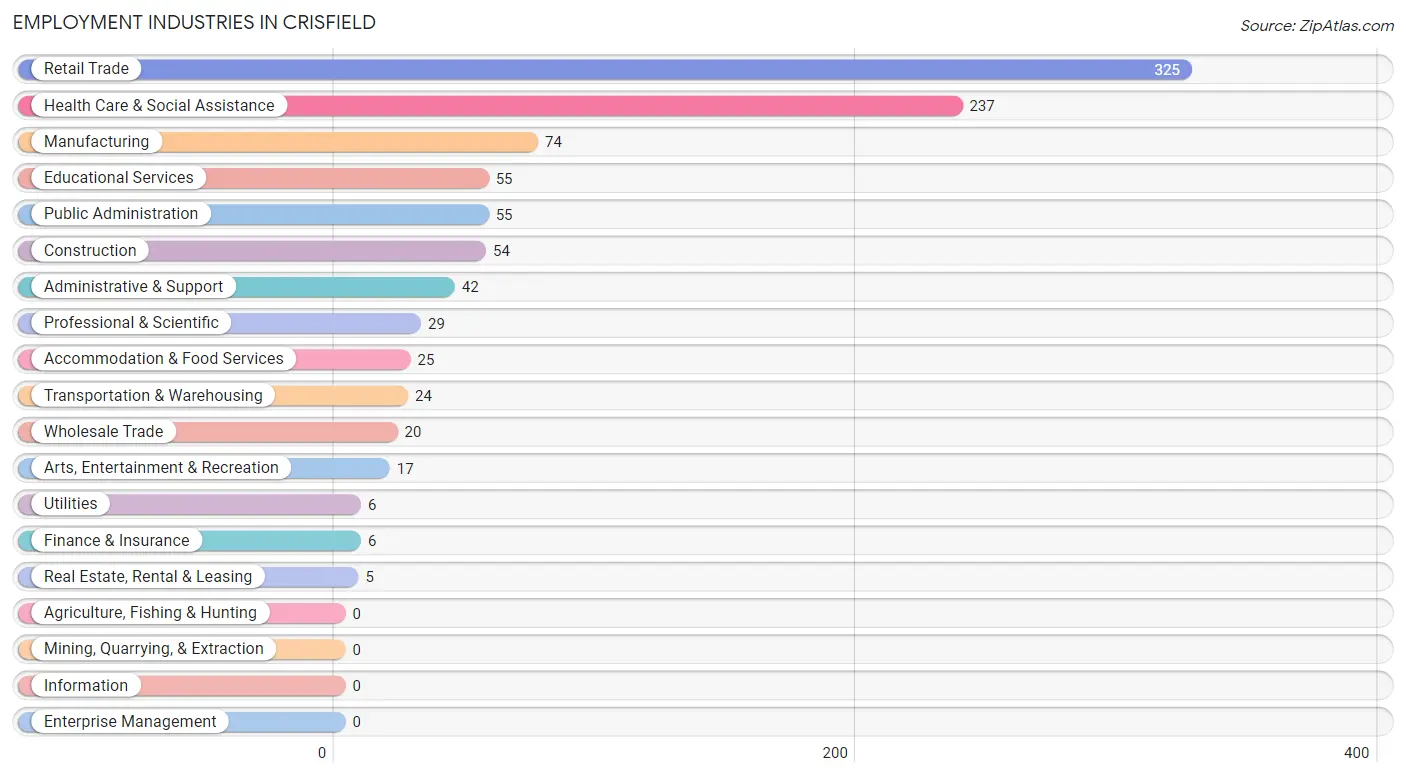
Employment Industries by Sex in Crisfield
The Crisfield industries that see more men than women are Transportation & Warehousing (100.0%), Utilities (100.0%), and Real Estate, Rental & Leasing (100.0%), whereas the industries that tend to have a higher number of women are Finance & Insurance (100.0%), Accommodation & Food Services (92.0%), and Manufacturing (90.5%).
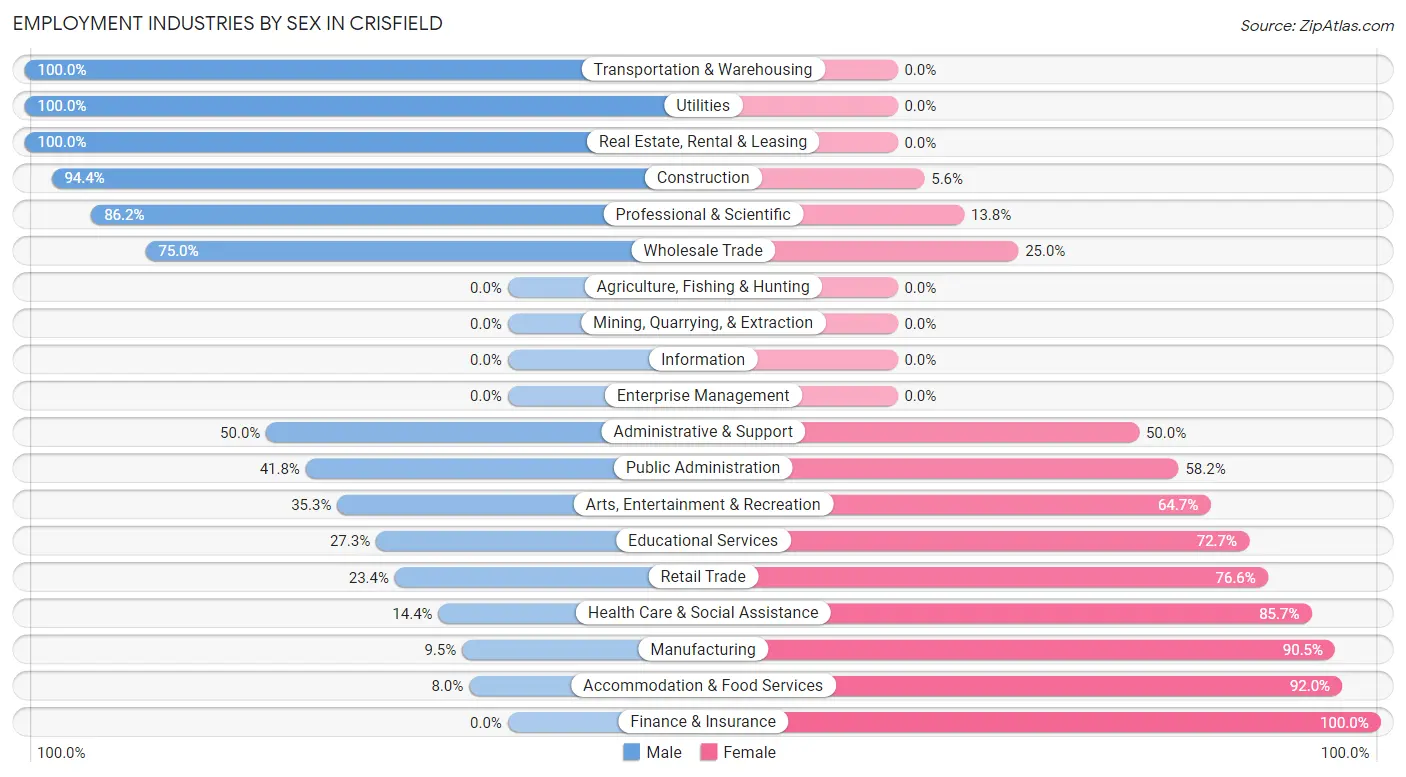
| Industry | Male | Female |
| Agriculture, Fishing & Hunting | 0 (0.0%) | 0 (0.0%) |
| Mining, Quarrying, & Extraction | 0 (0.0%) | 0 (0.0%) |
| Construction | 51 (94.4%) | 3 (5.6%) |
| Manufacturing | 7 (9.5%) | 67 (90.5%) |
| Wholesale Trade | 15 (75.0%) | 5 (25.0%) |
| Retail Trade | 76 (23.4%) | 249 (76.6%) |
| Transportation & Warehousing | 24 (100.0%) | 0 (0.0%) |
| Utilities | 6 (100.0%) | 0 (0.0%) |
| Information | 0 (0.0%) | 0 (0.0%) |
| Finance & Insurance | 0 (0.0%) | 6 (100.0%) |
| Real Estate, Rental & Leasing | 5 (100.0%) | 0 (0.0%) |
| Professional & Scientific | 25 (86.2%) | 4 (13.8%) |
| Enterprise Management | 0 (0.0%) | 0 (0.0%) |
| Administrative & Support | 21 (50.0%) | 21 (50.0%) |
| Educational Services | 15 (27.3%) | 40 (72.7%) |
| Health Care & Social Assistance | 34 (14.3%) | 203 (85.7%) |
| Arts, Entertainment & Recreation | 6 (35.3%) | 11 (64.7%) |
| Accommodation & Food Services | 2 (8.0%) | 23 (92.0%) |
| Public Administration | 23 (41.8%) | 32 (58.2%) |
| Total | 343 (33.9%) | 668 (66.1%) |
Education in Crisfield
School Enrollment in Crisfield
The most common levels of schooling among the 557 students in Crisfield are elementary school (192 | 34.5%), middle school (126 | 22.6%), and high school (80 | 14.4%).
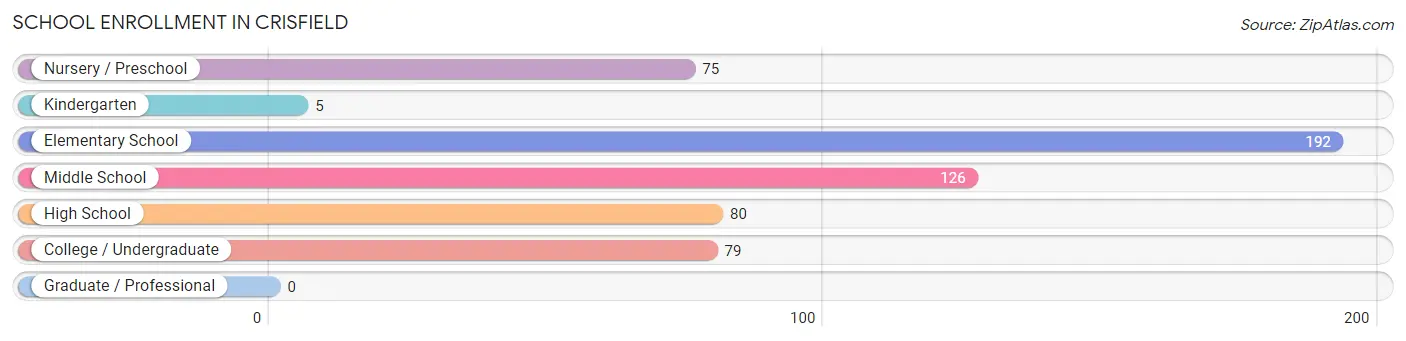
| School Level | # Students | % Students |
| Nursery / Preschool | 75 | 13.5% |
| Kindergarten | 5 | 0.9% |
| Elementary School | 192 | 34.5% |
| Middle School | 126 | 22.6% |
| High School | 80 | 14.4% |
| College / Undergraduate | 79 | 14.2% |
| Graduate / Professional | 0 | 0.0% |
| Total | 557 | 100.0% |
School Enrollment by Age by Funding Source in Crisfield
Out of a total of 557 students who are enrolled in schools in Crisfield, 207 (37.2%) attend a private institution, while the remaining 350 (62.8%) are enrolled in public schools. The age group of 3 to 4 year olds has the highest likelihood of being enrolled in private schools, with 45 (62.5% in the age bracket) enrolled. Conversely, the age group of 18 to 19 year olds has the lowest likelihood of being enrolled in a private school, with 17 (100.0% in the age bracket) attending a public institution.
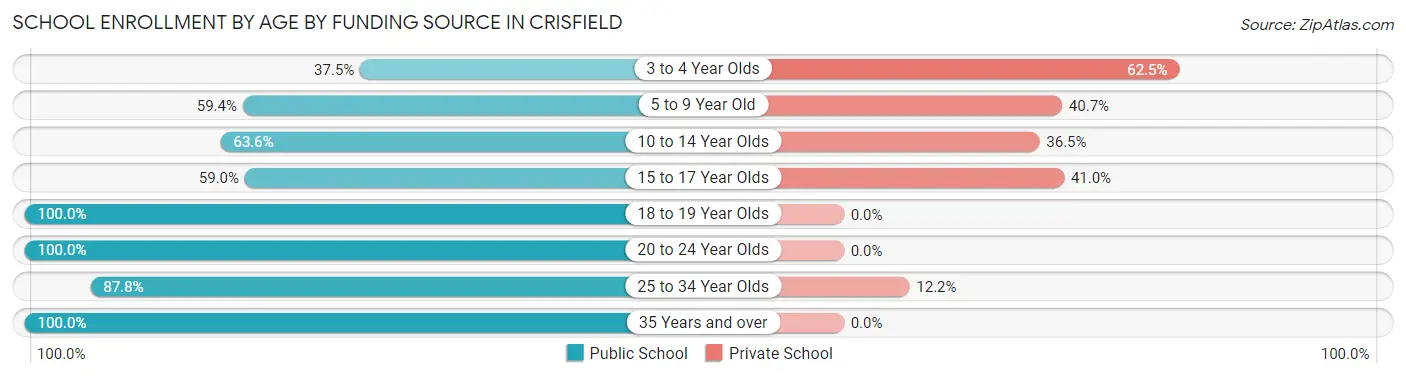
| Age Bracket | Public School | Private School |
| 3 to 4 Year Olds | 27 (37.5%) | 45 (62.5%) |
| 5 to 9 Year Old | 73 (59.4%) | 50 (40.6%) |
| 10 to 14 Year Olds | 129 (63.5%) | 74 (36.4%) |
| 15 to 17 Year Olds | 46 (59.0%) | 32 (41.0%) |
| 18 to 19 Year Olds | 17 (100.0%) | 0 (0.0%) |
| 20 to 24 Year Olds | 9 (100.0%) | 0 (0.0%) |
| 25 to 34 Year Olds | 43 (87.8%) | 6 (12.2%) |
| 35 Years and over | 6 (100.0%) | 0 (0.0%) |
| Total | 350 (62.8%) | 207 (37.2%) |
Educational Attainment by Field of Study in Crisfield
Education (73 | 25.7%), business (44 | 15.5%), bio, nature & agricultural (39 | 13.7%), physical & health sciences (37 | 13.0%), and social sciences (25 | 8.8%) are the most common fields of study among 284 individuals in Crisfield who have obtained a bachelor's degree or higher.
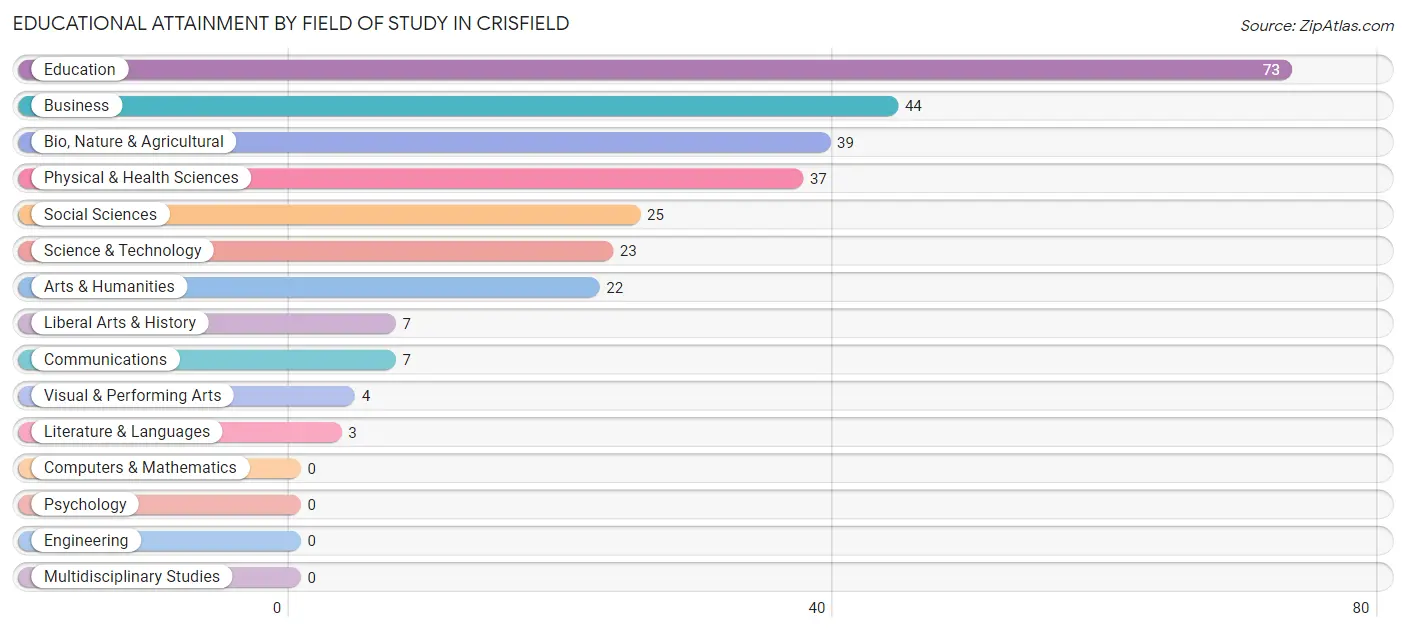
| Field of Study | # Graduates | % Graduates |
| Computers & Mathematics | 0 | 0.0% |
| Bio, Nature & Agricultural | 39 | 13.7% |
| Physical & Health Sciences | 37 | 13.0% |
| Psychology | 0 | 0.0% |
| Social Sciences | 25 | 8.8% |
| Engineering | 0 | 0.0% |
| Multidisciplinary Studies | 0 | 0.0% |
| Science & Technology | 23 | 8.1% |
| Business | 44 | 15.5% |
| Education | 73 | 25.7% |
| Literature & Languages | 3 | 1.1% |
| Liberal Arts & History | 7 | 2.5% |
| Visual & Performing Arts | 4 | 1.4% |
| Communications | 7 | 2.5% |
| Arts & Humanities | 22 | 7.7% |
| Total | 284 | 100.0% |
Transportation & Commute in Crisfield
Vehicle Availability by Sex in Crisfield
The most prevalent vehicle ownership categories in Crisfield are males with 2 vehicles (127, accounting for 37.3%) and females with 2 vehicles (229, making up 19.2%).
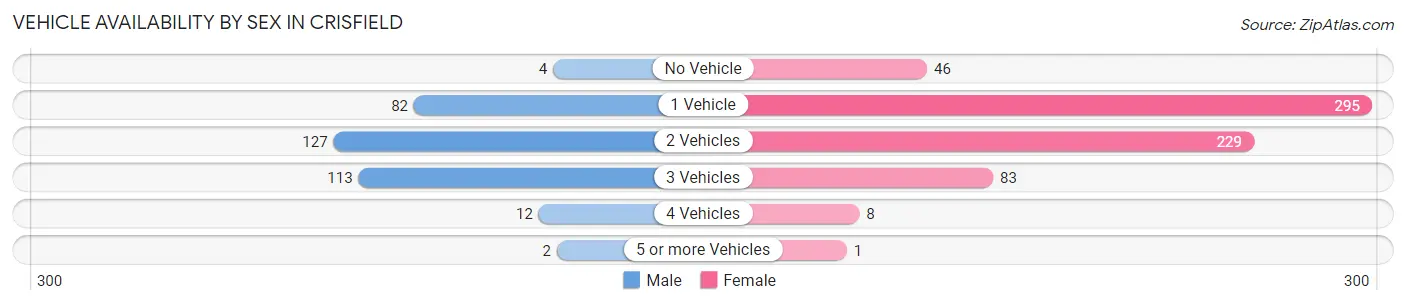
| Vehicles Available | Male | Female |
| No Vehicle | 4 (1.2%) | 46 (7.0%) |
| 1 Vehicle | 82 (24.1%) | 295 (44.6%) |
| 2 Vehicles | 127 (37.3%) | 229 (34.6%) |
| 3 Vehicles | 113 (33.2%) | 83 (12.5%) |
| 4 Vehicles | 12 (3.5%) | 8 (1.2%) |
| 5 or more Vehicles | 2 (0.6%) | 1 (0.2%) |
| Total | 340 (100.0%) | 662 (100.0%) |
Commute Time in Crisfield
The most frequently occuring commute durations in Crisfield are 5 to 9 minutes (284 commuters, 29.2%), 10 to 14 minutes (136 commuters, 14.0%), and 15 to 19 minutes (104 commuters, 10.7%).
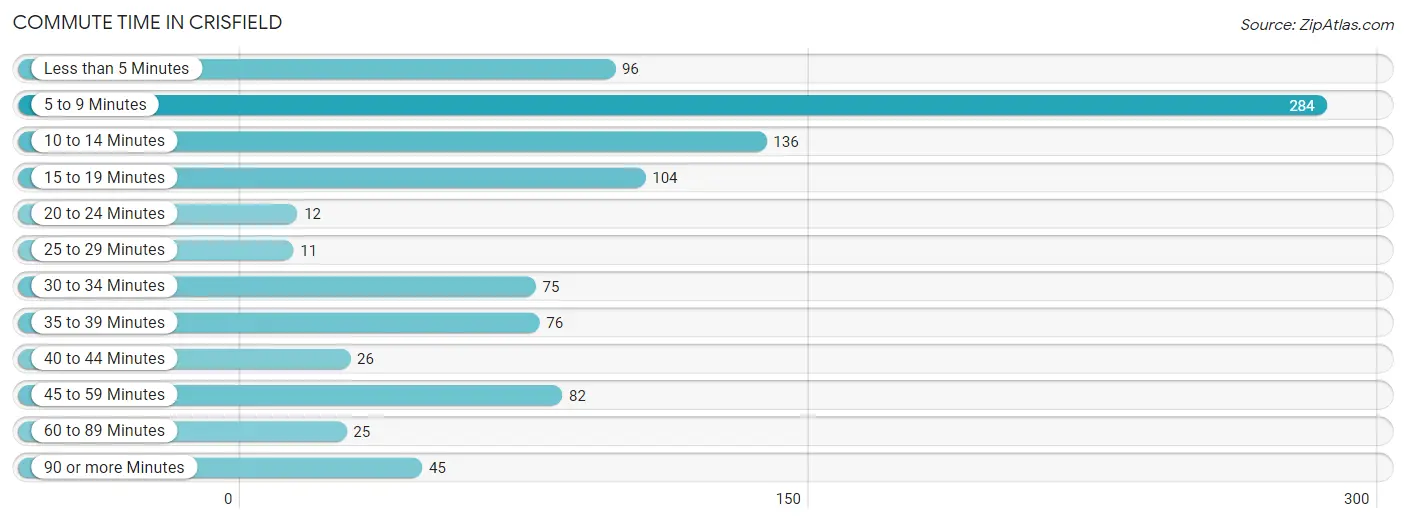
| Commute Time | # Commuters | % Commuters |
| Less than 5 Minutes | 96 | 9.9% |
| 5 to 9 Minutes | 284 | 29.2% |
| 10 to 14 Minutes | 136 | 14.0% |
| 15 to 19 Minutes | 104 | 10.7% |
| 20 to 24 Minutes | 12 | 1.2% |
| 25 to 29 Minutes | 11 | 1.1% |
| 30 to 34 Minutes | 75 | 7.7% |
| 35 to 39 Minutes | 76 | 7.8% |
| 40 to 44 Minutes | 26 | 2.7% |
| 45 to 59 Minutes | 82 | 8.4% |
| 60 to 89 Minutes | 25 | 2.6% |
| 90 or more Minutes | 45 | 4.6% |
Commute Time by Sex in Crisfield
The most common commute times in Crisfield are 15 to 19 minutes (67 commuters, 20.1%) for males and 5 to 9 minutes (253 commuters, 39.7%) for females.
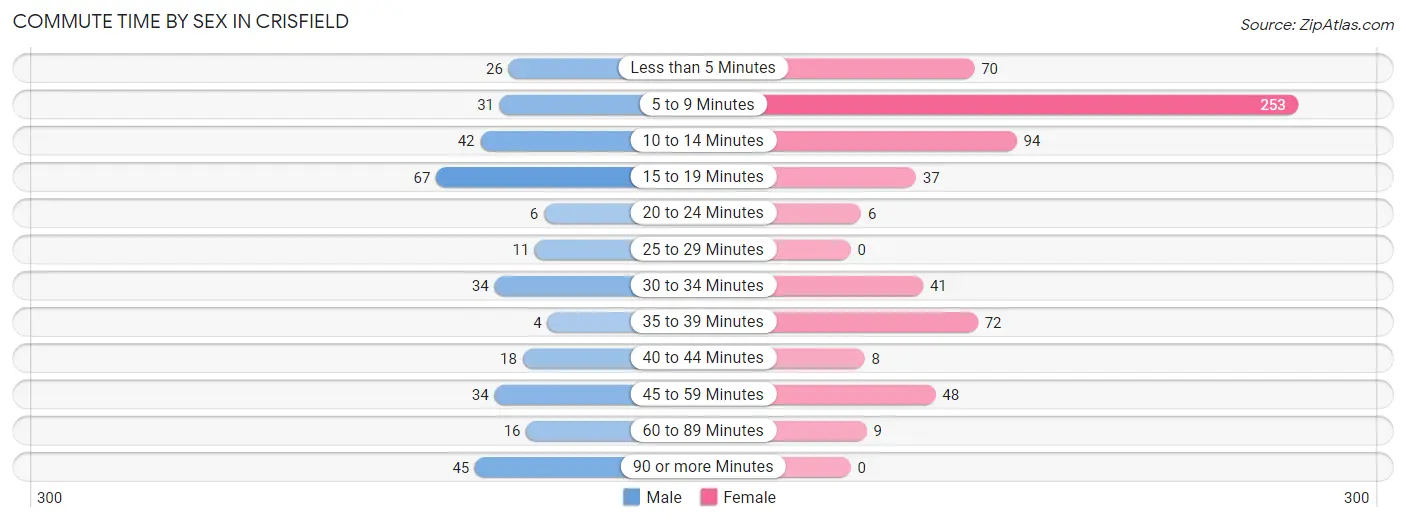
| Commute Time | Male | Female |
| Less than 5 Minutes | 26 (7.8%) | 70 (11.0%) |
| 5 to 9 Minutes | 31 (9.3%) | 253 (39.7%) |
| 10 to 14 Minutes | 42 (12.6%) | 94 (14.7%) |
| 15 to 19 Minutes | 67 (20.1%) | 37 (5.8%) |
| 20 to 24 Minutes | 6 (1.8%) | 6 (0.9%) |
| 25 to 29 Minutes | 11 (3.3%) | 0 (0.0%) |
| 30 to 34 Minutes | 34 (10.2%) | 41 (6.4%) |
| 35 to 39 Minutes | 4 (1.2%) | 72 (11.3%) |
| 40 to 44 Minutes | 18 (5.4%) | 8 (1.3%) |
| 45 to 59 Minutes | 34 (10.2%) | 48 (7.5%) |
| 60 to 89 Minutes | 16 (4.8%) | 9 (1.4%) |
| 90 or more Minutes | 45 (13.5%) | 0 (0.0%) |
Time of Departure to Work by Sex in Crisfield
The most frequent times of departure to work in Crisfield are 7:00 AM to 7:29 AM (68, 20.4%) for males and 8:00 AM to 8:29 AM (164, 25.7%) for females.
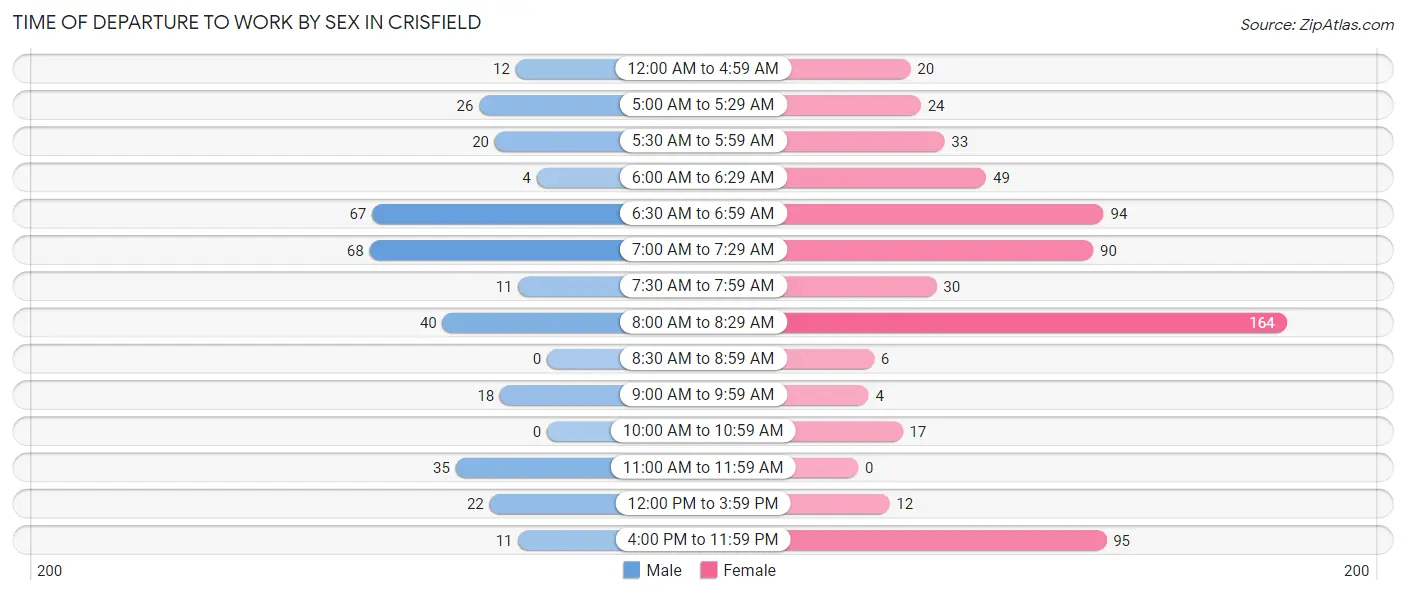
| Time of Departure | Male | Female |
| 12:00 AM to 4:59 AM | 12 (3.6%) | 20 (3.1%) |
| 5:00 AM to 5:29 AM | 26 (7.8%) | 24 (3.8%) |
| 5:30 AM to 5:59 AM | 20 (6.0%) | 33 (5.2%) |
| 6:00 AM to 6:29 AM | 4 (1.2%) | 49 (7.7%) |
| 6:30 AM to 6:59 AM | 67 (20.1%) | 94 (14.7%) |
| 7:00 AM to 7:29 AM | 68 (20.4%) | 90 (14.1%) |
| 7:30 AM to 7:59 AM | 11 (3.3%) | 30 (4.7%) |
| 8:00 AM to 8:29 AM | 40 (12.0%) | 164 (25.7%) |
| 8:30 AM to 8:59 AM | 0 (0.0%) | 6 (0.9%) |
| 9:00 AM to 9:59 AM | 18 (5.4%) | 4 (0.6%) |
| 10:00 AM to 10:59 AM | 0 (0.0%) | 17 (2.7%) |
| 11:00 AM to 11:59 AM | 35 (10.5%) | 0 (0.0%) |
| 12:00 PM to 3:59 PM | 22 (6.6%) | 12 (1.9%) |
| 4:00 PM to 11:59 PM | 11 (3.3%) | 95 (14.9%) |
| Total | 334 (100.0%) | 638 (100.0%) |
Housing Occupancy in Crisfield
Occupancy by Ownership in Crisfield
Of the total 1,109 dwellings in Crisfield, owner-occupied units account for 519 (46.8%), while renter-occupied units make up 590 (53.2%).
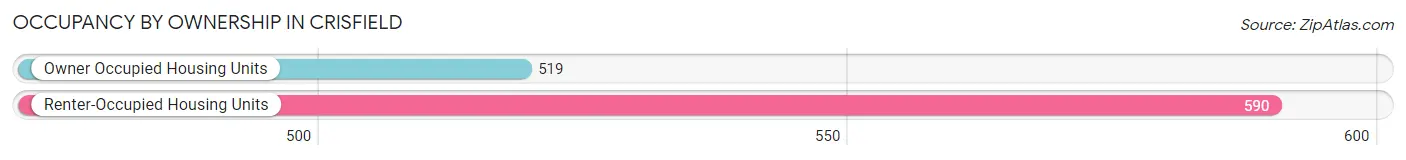
| Occupancy | # Housing Units | % Housing Units |
| Owner Occupied Housing Units | 519 | 46.8% |
| Renter-Occupied Housing Units | 590 | 53.2% |
| Total Occupied Housing Units | 1,109 | 100.0% |
Occupancy by Household Size in Crisfield
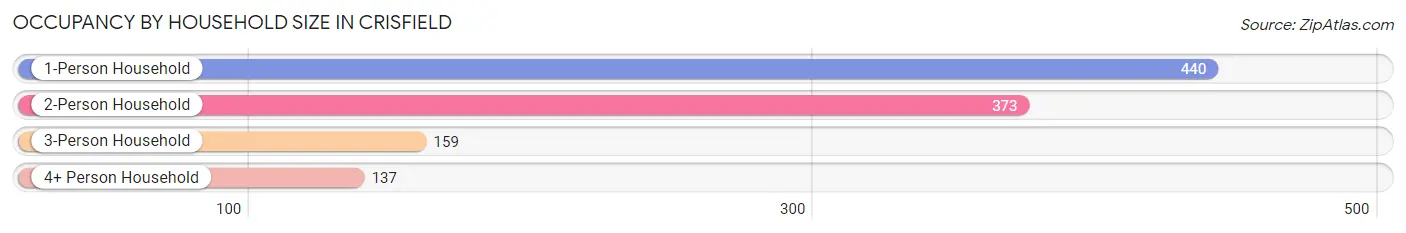
| Household Size | # Housing Units | % Housing Units |
| 1-Person Household | 440 | 39.7% |
| 2-Person Household | 373 | 33.6% |
| 3-Person Household | 159 | 14.3% |
| 4+ Person Household | 137 | 12.3% |
| Total Housing Units | 1,109 | 100.0% |
Occupancy by Ownership by Household Size in Crisfield
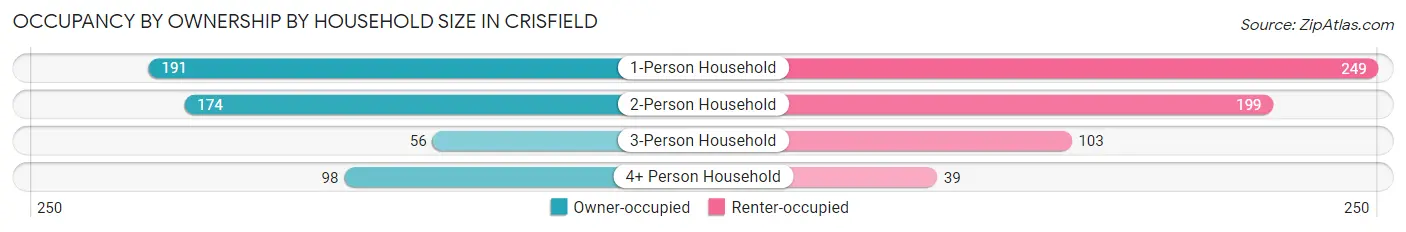
| Household Size | Owner-occupied | Renter-occupied |
| 1-Person Household | 191 (43.4%) | 249 (56.6%) |
| 2-Person Household | 174 (46.7%) | 199 (53.3%) |
| 3-Person Household | 56 (35.2%) | 103 (64.8%) |
| 4+ Person Household | 98 (71.5%) | 39 (28.5%) |
| Total Housing Units | 519 (46.8%) | 590 (53.2%) |
Occupancy by Educational Attainment in Crisfield
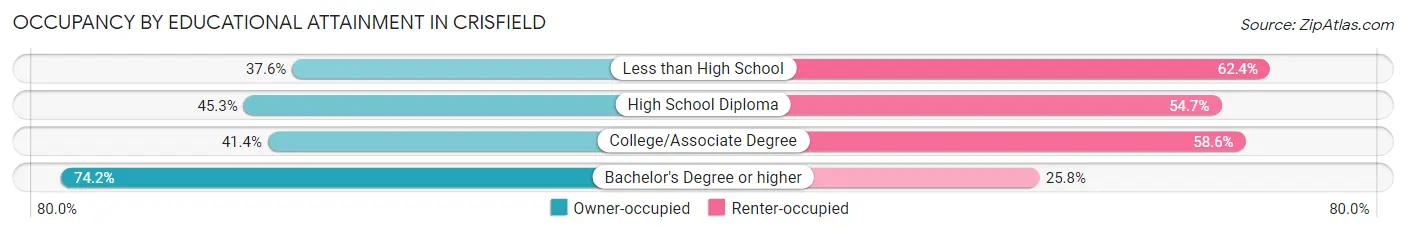
| Household Size | Owner-occupied | Renter-occupied |
| Less than High School | 74 (37.6%) | 123 (62.4%) |
| High School Diploma | 177 (45.3%) | 214 (54.7%) |
| College/Associate Degree | 150 (41.4%) | 212 (58.6%) |
| Bachelor's Degree or higher | 118 (74.2%) | 41 (25.8%) |
Occupancy by Age of Householder in Crisfield
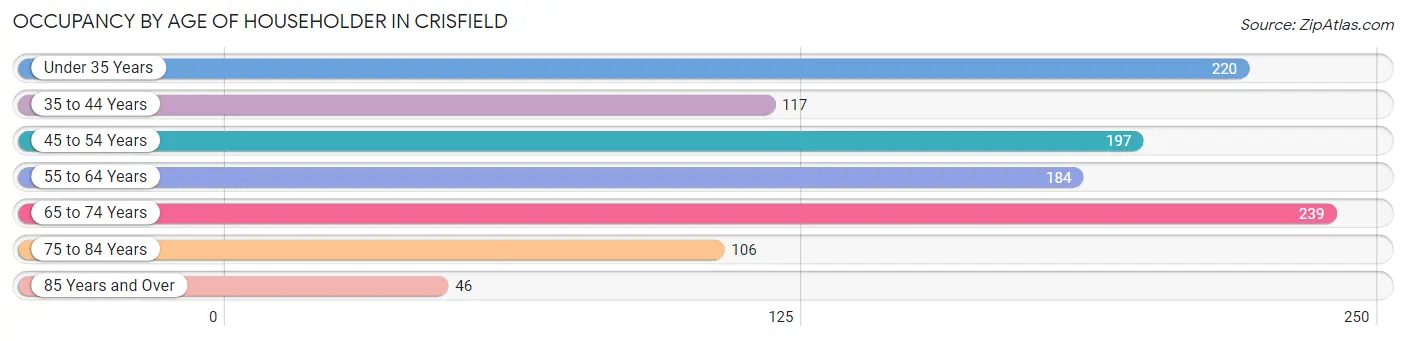
| Age Bracket | # Households | % Households |
| Under 35 Years | 220 | 19.8% |
| 35 to 44 Years | 117 | 10.5% |
| 45 to 54 Years | 197 | 17.8% |
| 55 to 64 Years | 184 | 16.6% |
| 65 to 74 Years | 239 | 21.5% |
| 75 to 84 Years | 106 | 9.6% |
| 85 Years and Over | 46 | 4.2% |
| Total | 1,109 | 100.0% |
Housing Finances in Crisfield
Median Income by Occupancy in Crisfield
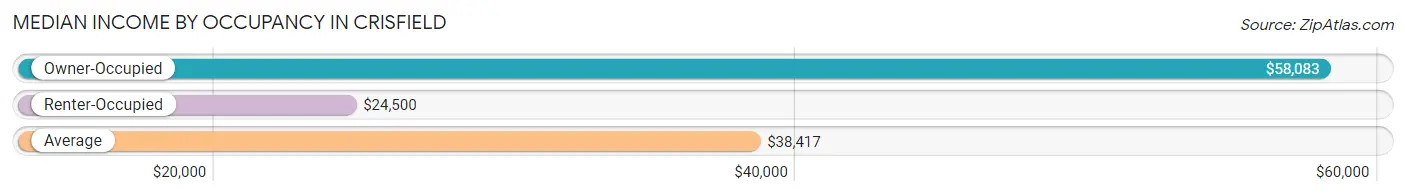
| Occupancy Type | # Households | Median Income |
| Owner-Occupied | 519 (46.8%) | $58,083 |
| Renter-Occupied | 590 (53.2%) | $24,500 |
| Average | 1,109 (100.0%) | $38,417 |
Occupancy by Householder Income Bracket in Crisfield
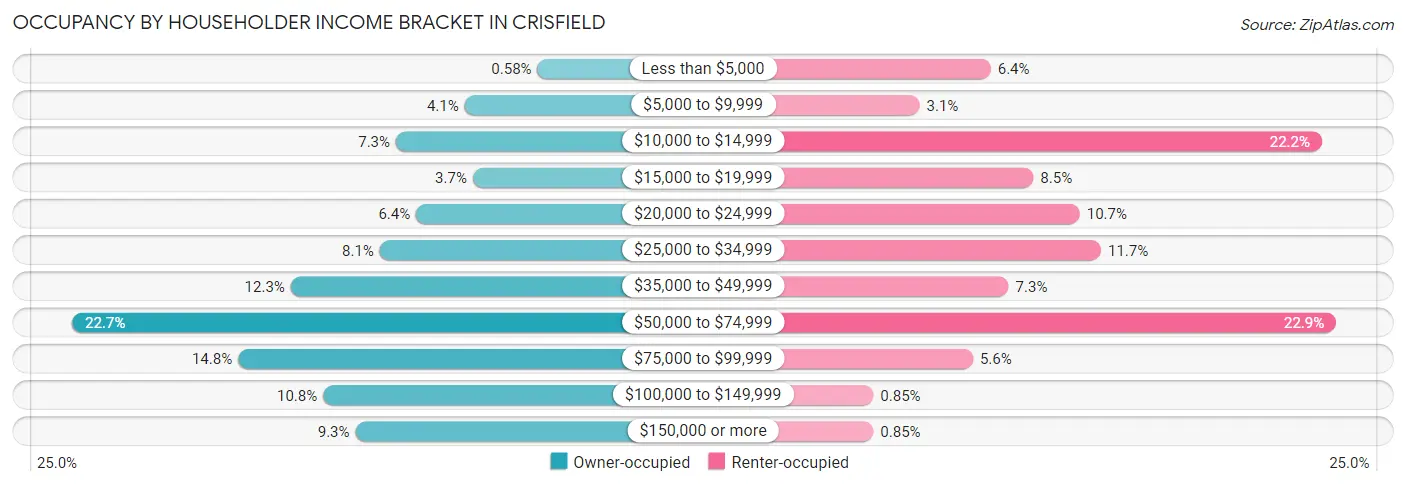
| Income Bracket | Owner-occupied | Renter-occupied |
| Less than $5,000 | 3 (0.6%) | 38 (6.4%) |
| $5,000 to $9,999 | 21 (4.1%) | 18 (3.0%) |
| $10,000 to $14,999 | 38 (7.3%) | 131 (22.2%) |
| $15,000 to $19,999 | 19 (3.7%) | 50 (8.5%) |
| $20,000 to $24,999 | 33 (6.4%) | 63 (10.7%) |
| $25,000 to $34,999 | 42 (8.1%) | 69 (11.7%) |
| $35,000 to $49,999 | 64 (12.3%) | 43 (7.3%) |
| $50,000 to $74,999 | 118 (22.7%) | 135 (22.9%) |
| $75,000 to $99,999 | 77 (14.8%) | 33 (5.6%) |
| $100,000 to $149,999 | 56 (10.8%) | 5 (0.9%) |
| $150,000 or more | 48 (9.2%) | 5 (0.9%) |
| Total | 519 (100.0%) | 590 (100.0%) |
Monthly Housing Cost Tiers in Crisfield
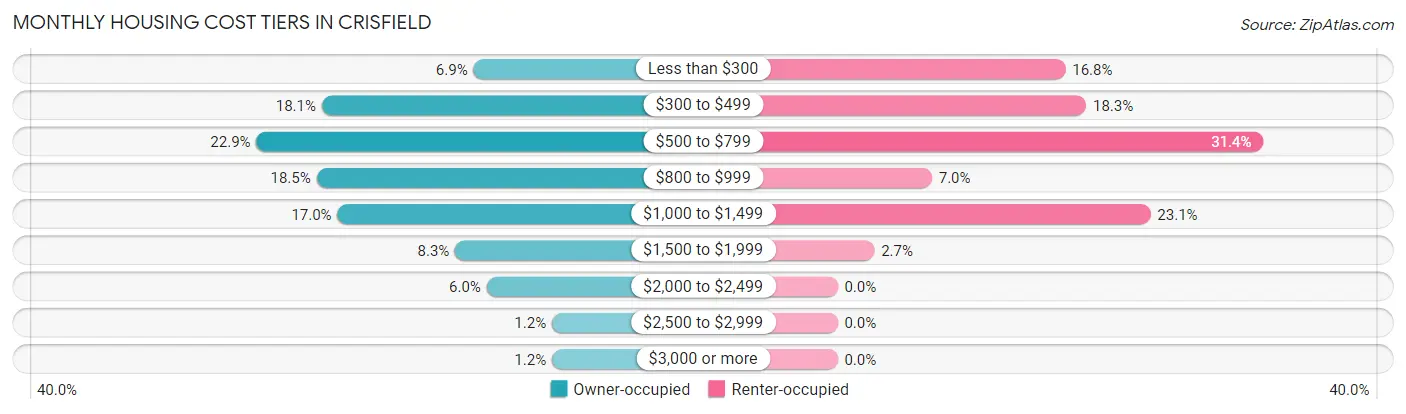
| Monthly Cost | Owner-occupied | Renter-occupied |
| Less than $300 | 36 (6.9%) | 99 (16.8%) |
| $300 to $499 | 94 (18.1%) | 108 (18.3%) |
| $500 to $799 | 119 (22.9%) | 185 (31.4%) |
| $800 to $999 | 96 (18.5%) | 41 (7.0%) |
| $1,000 to $1,499 | 88 (17.0%) | 136 (23.1%) |
| $1,500 to $1,999 | 43 (8.3%) | 16 (2.7%) |
| $2,000 to $2,499 | 31 (6.0%) | 0 (0.0%) |
| $2,500 to $2,999 | 6 (1.2%) | 0 (0.0%) |
| $3,000 or more | 6 (1.2%) | 0 (0.0%) |
| Total | 519 (100.0%) | 590 (100.0%) |
Physical Housing Characteristics in Crisfield
Housing Structures in Crisfield
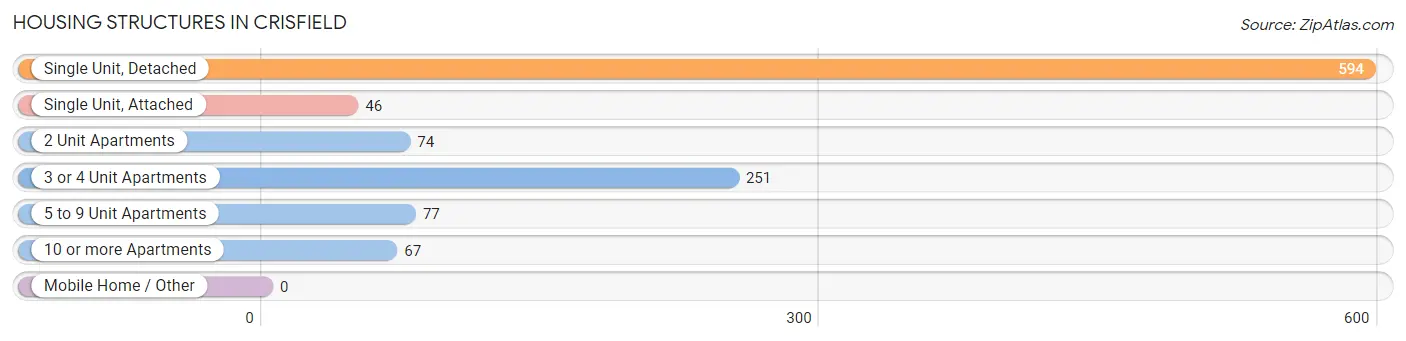
| Structure Type | # Housing Units | % Housing Units |
| Single Unit, Detached | 594 | 53.6% |
| Single Unit, Attached | 46 | 4.2% |
| 2 Unit Apartments | 74 | 6.7% |
| 3 or 4 Unit Apartments | 251 | 22.6% |
| 5 to 9 Unit Apartments | 77 | 6.9% |
| 10 or more Apartments | 67 | 6.0% |
| Mobile Home / Other | 0 | 0.0% |
| Total | 1,109 | 100.0% |
Housing Structures by Occupancy in Crisfield
| Structure Type | Owner-occupied | Renter-occupied |
| Single Unit, Detached | 455 (76.6%) | 139 (23.4%) |
| Single Unit, Attached | 14 (30.4%) | 32 (69.6%) |
| 2 Unit Apartments | 3 (4.1%) | 71 (96.0%) |
| 3 or 4 Unit Apartments | 14 (5.6%) | 237 (94.4%) |
| 5 to 9 Unit Apartments | 0 (0.0%) | 77 (100.0%) |
| 10 or more Apartments | 33 (49.2%) | 34 (50.7%) |
| Mobile Home / Other | 0 (0.0%) | 0 (0.0%) |
| Total | 519 (46.8%) | 590 (53.2%) |
Housing Structures by Number of Rooms in Crisfield
| Number of Rooms | Owner-occupied | Renter-occupied |
| 1 Room | 0 (0.0%) | 3 (0.5%) |
| 2 or 3 Rooms | 5 (1.0%) | 175 (29.7%) |
| 4 or 5 Rooms | 189 (36.4%) | 370 (62.7%) |
| 6 or 7 Rooms | 156 (30.1%) | 37 (6.3%) |
| 8 or more Rooms | 169 (32.6%) | 5 (0.9%) |
| Total | 519 (100.0%) | 590 (100.0%) |
Housing Structure by Heating Type in Crisfield
| Heating Type | Owner-occupied | Renter-occupied |
| Utility Gas | 15 (2.9%) | 74 (12.5%) |
| Bottled, Tank, or LP Gas | 65 (12.5%) | 42 (7.1%) |
| Electricity | 349 (67.2%) | 421 (71.4%) |
| Fuel Oil or Kerosene | 39 (7.5%) | 53 (9.0%) |
| Coal or Coke | 0 (0.0%) | 0 (0.0%) |
| All other Fuels | 51 (9.8%) | 0 (0.0%) |
| No Fuel Used | 0 (0.0%) | 0 (0.0%) |
| Total | 519 (100.0%) | 590 (100.0%) |
Household Vehicle Usage in Crisfield
| Vehicles per Household | Owner-occupied | Renter-occupied |
| No Vehicle | 23 (4.4%) | 169 (28.6%) |
| 1 Vehicle | 237 (45.7%) | 293 (49.7%) |
| 2 Vehicles | 152 (29.3%) | 123 (20.8%) |
| 3 or more Vehicles | 107 (20.6%) | 5 (0.9%) |
| Total | 519 (100.0%) | 590 (100.0%) |
Real Estate & Mortgages in Crisfield
Real Estate and Mortgage Overview in Crisfield
| Characteristic | Without Mortgage | With Mortgage |
| Housing Units | 241 | 278 |
| Median Property Value | $130,500 | $127,000 |
| Median Household Income | $53,563 | $25 |
| Monthly Housing Costs | $512 | $6 |
| Real Estate Taxes | $1,894 | $0 |
Property Value by Mortgage Status in Crisfield
| Property Value | Without Mortgage | With Mortgage |
| Less than $50,000 | 27 (11.2%) | 12 (4.3%) |
| $50,000 to $99,999 | 29 (12.0%) | 96 (34.5%) |
| $100,000 to $299,999 | 181 (75.1%) | 152 (54.7%) |
| $300,000 to $499,999 | 0 (0.0%) | 13 (4.7%) |
| $500,000 to $749,999 | 0 (0.0%) | 5 (1.8%) |
| $750,000 to $999,999 | 0 (0.0%) | 0 (0.0%) |
| $1,000,000 or more | 4 (1.7%) | 0 (0.0%) |
| Total | 241 (100.0%) | 278 (100.0%) |
Household Income by Mortgage Status in Crisfield
| Household Income | Without Mortgage | With Mortgage |
| Less than $10,000 | 21 (8.7%) | 6 (2.2%) |
| $10,000 to $24,999 | 44 (18.3%) | 3 (1.1%) |
| $25,000 to $34,999 | 22 (9.1%) | 46 (16.6%) |
| $35,000 to $49,999 | 25 (10.4%) | 20 (7.2%) |
| $50,000 to $74,999 | 75 (31.1%) | 39 (14.0%) |
| $75,000 to $99,999 | 13 (5.4%) | 43 (15.5%) |
| $100,000 to $149,999 | 18 (7.5%) | 64 (23.0%) |
| $150,000 or more | 23 (9.5%) | 38 (13.7%) |
| Total | 241 (100.0%) | 278 (100.0%) |
Property Value to Household Income Ratio in Crisfield
| Value-to-Income Ratio | Without Mortgage | With Mortgage |
| Less than 2.0x | 75 (31.1%) | 59,848 (21,528.1%) |
| 2.0x to 2.9x | 55 (22.8%) | 167 (60.1%) |
| 3.0x to 3.9x | 31 (12.9%) | 16 (5.8%) |
| 4.0x or more | 80 (33.2%) | 19 (6.8%) |
| Total | 241 (100.0%) | 278 (100.0%) |
Real Estate Taxes by Mortgage Status in Crisfield
| Property Taxes | Without Mortgage | With Mortgage |
| Less than $800 | 24 (10.0%) | 0 (0.0%) |
| $800 to $1,499 | 45 (18.7%) | 0 (0.0%) |
| $800 to $1,499 | 143 (59.3%) | 107 (38.5%) |
| Total | 241 (100.0%) | 278 (100.0%) |
Health & Disability in Crisfield
Health Insurance Coverage by Age in Crisfield
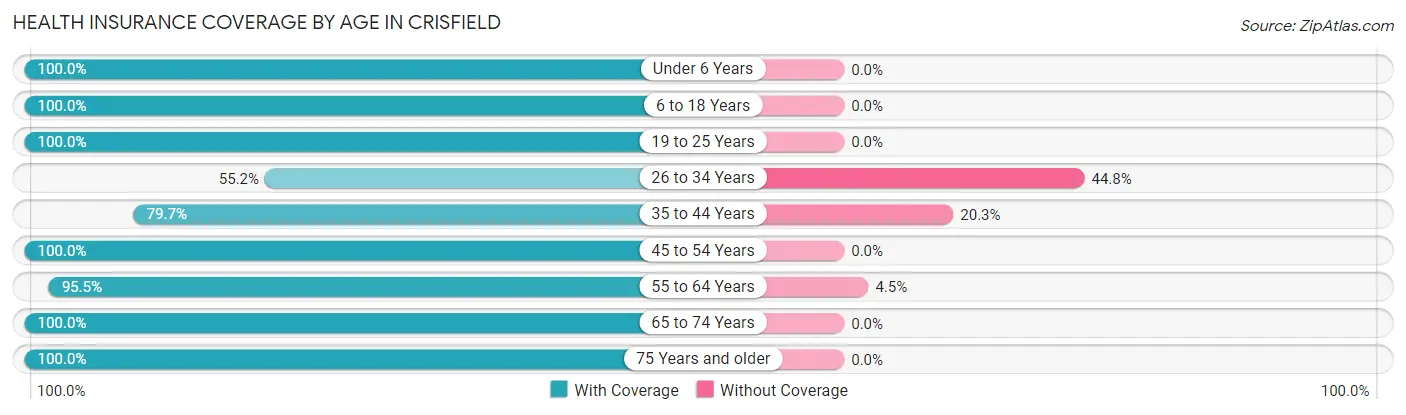
| Age Bracket | With Coverage | Without Coverage |
| Under 6 Years | 162 (100.0%) | 0 (0.0%) |
| 6 to 18 Years | 411 (100.0%) | 0 (0.0%) |
| 19 to 25 Years | 202 (100.0%) | 0 (0.0%) |
| 26 to 34 Years | 191 (55.2%) | 155 (44.8%) |
| 35 to 44 Years | 188 (79.7%) | 48 (20.3%) |
| 45 to 54 Years | 291 (100.0%) | 0 (0.0%) |
| 55 to 64 Years | 275 (95.5%) | 13 (4.5%) |
| 65 to 74 Years | 287 (100.0%) | 0 (0.0%) |
| 75 Years and older | 168 (100.0%) | 0 (0.0%) |
| Total | 2,175 (91.0%) | 216 (9.0%) |
Health Insurance Coverage by Citizenship Status in Crisfield
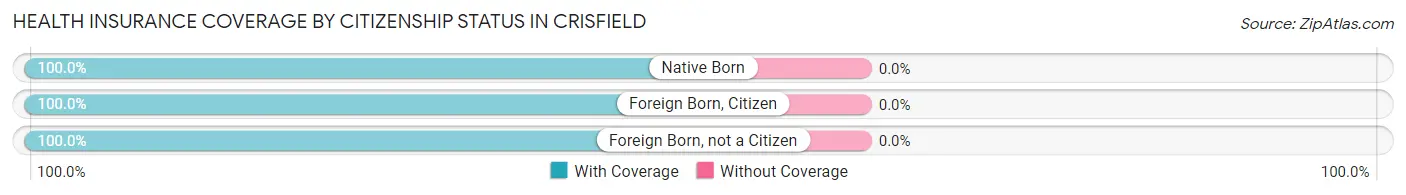
| Citizenship Status | With Coverage | Without Coverage |
| Native Born | 162 (100.0%) | 0 (0.0%) |
| Foreign Born, Citizen | 411 (100.0%) | 0 (0.0%) |
| Foreign Born, not a Citizen | 202 (100.0%) | 0 (0.0%) |
Health Insurance Coverage by Household Income in Crisfield
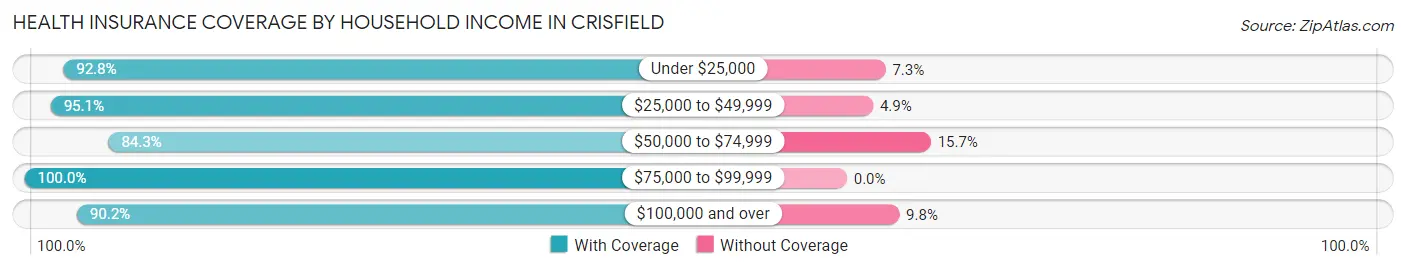
| Household Income | With Coverage | Without Coverage |
| Under $25,000 | 652 (92.7%) | 51 (7.2%) |
| $25,000 to $49,999 | 349 (95.1%) | 18 (4.9%) |
| $50,000 to $74,999 | 622 (84.3%) | 116 (15.7%) |
| $75,000 to $99,999 | 266 (100.0%) | 0 (0.0%) |
| $100,000 and over | 285 (90.2%) | 31 (9.8%) |
Public vs Private Health Insurance Coverage by Age in Crisfield
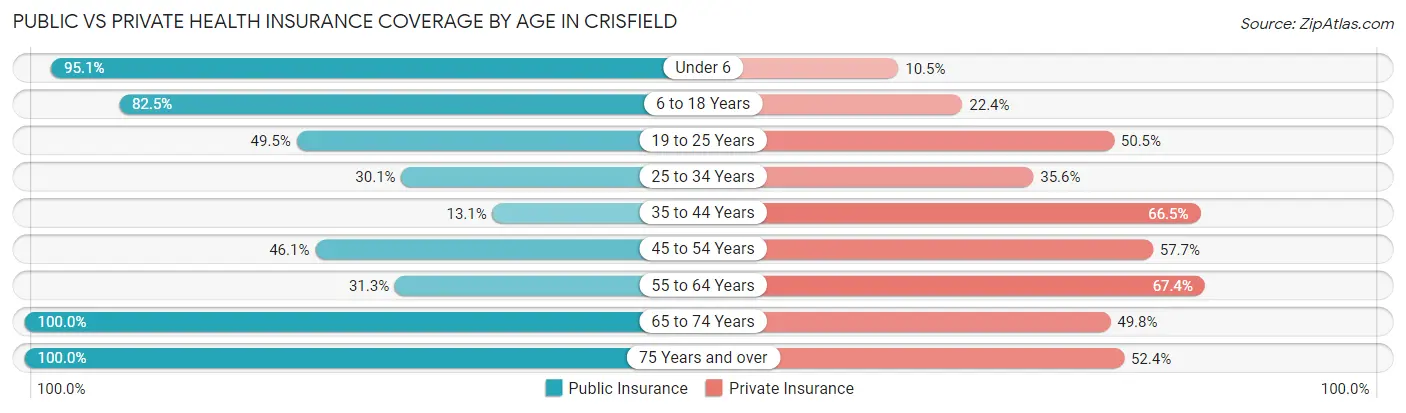
| Age Bracket | Public Insurance | Private Insurance |
| Under 6 | 154 (95.1%) | 17 (10.5%) |
| 6 to 18 Years | 339 (82.5%) | 92 (22.4%) |
| 19 to 25 Years | 100 (49.5%) | 102 (50.5%) |
| 25 to 34 Years | 104 (30.1%) | 123 (35.5%) |
| 35 to 44 Years | 31 (13.1%) | 157 (66.5%) |
| 45 to 54 Years | 134 (46.1%) | 168 (57.7%) |
| 55 to 64 Years | 90 (31.2%) | 194 (67.4%) |
| 65 to 74 Years | 287 (100.0%) | 143 (49.8%) |
| 75 Years and over | 168 (100.0%) | 88 (52.4%) |
| Total | 1,407 (58.9%) | 1,084 (45.3%) |
Disability Status by Sex by Age in Crisfield
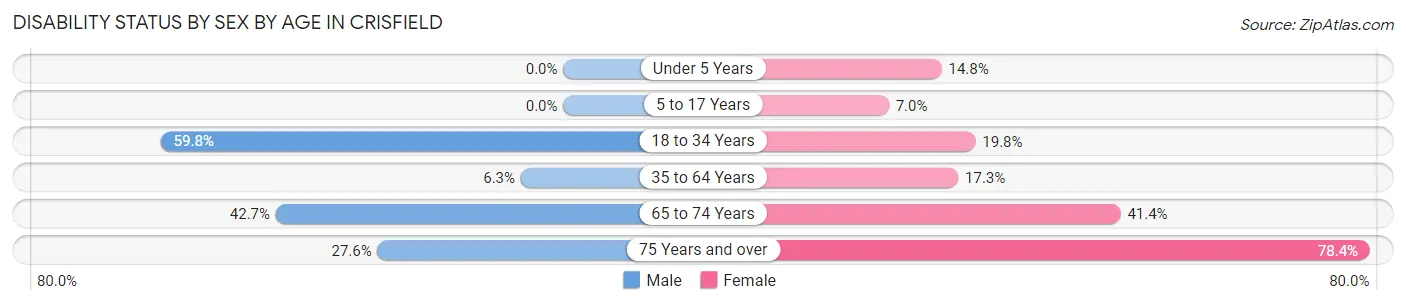
| Age Bracket | Male | Female |
| Under 5 Years | 0 (0.0%) | 12 (14.8%) |
| 5 to 17 Years | 0 (0.0%) | 17 (7.0%) |
| 18 to 34 Years | 116 (59.8%) | 72 (19.8%) |
| 35 to 64 Years | 20 (6.3%) | 86 (17.3%) |
| 65 to 74 Years | 73 (42.7%) | 48 (41.4%) |
| 75 Years and over | 8 (27.6%) | 109 (78.4%) |
Disability Class by Sex by Age in Crisfield
Disability Class: Hearing Difficulty
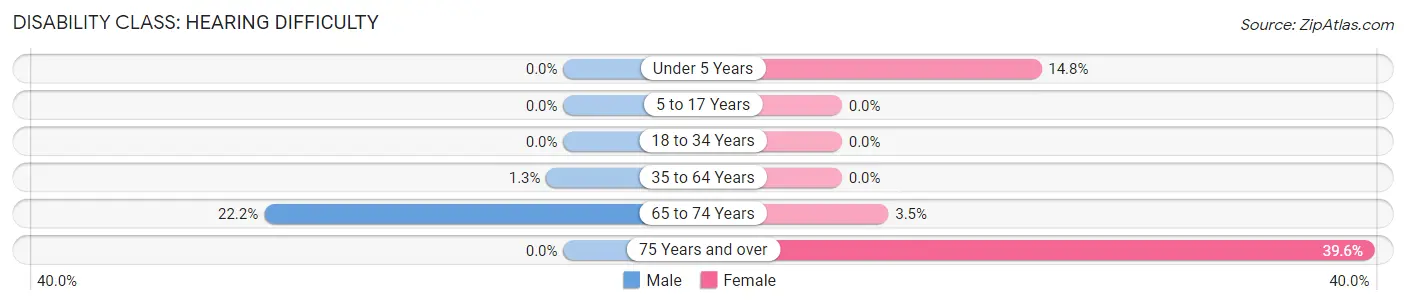
| Age Bracket | Male | Female |
| Under 5 Years | 0 (0.0%) | 12 (14.8%) |
| 5 to 17 Years | 0 (0.0%) | 0 (0.0%) |
| 18 to 34 Years | 0 (0.0%) | 0 (0.0%) |
| 35 to 64 Years | 4 (1.3%) | 0 (0.0%) |
| 65 to 74 Years | 38 (22.2%) | 4 (3.5%) |
| 75 Years and over | 0 (0.0%) | 55 (39.6%) |
Disability Class: Vision Difficulty
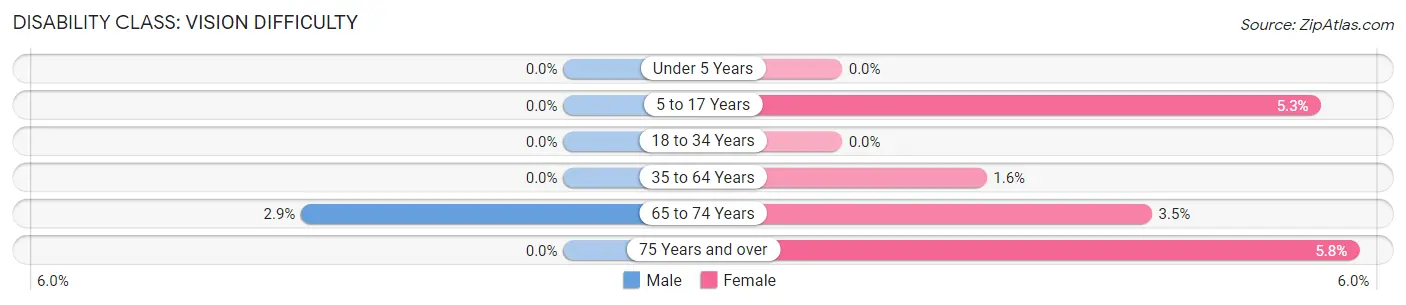
| Age Bracket | Male | Female |
| Under 5 Years | 0 (0.0%) | 0 (0.0%) |
| 5 to 17 Years | 0 (0.0%) | 13 (5.3%) |
| 18 to 34 Years | 0 (0.0%) | 0 (0.0%) |
| 35 to 64 Years | 0 (0.0%) | 8 (1.6%) |
| 65 to 74 Years | 5 (2.9%) | 4 (3.5%) |
| 75 Years and over | 0 (0.0%) | 8 (5.8%) |
Disability Class: Cognitive Difficulty
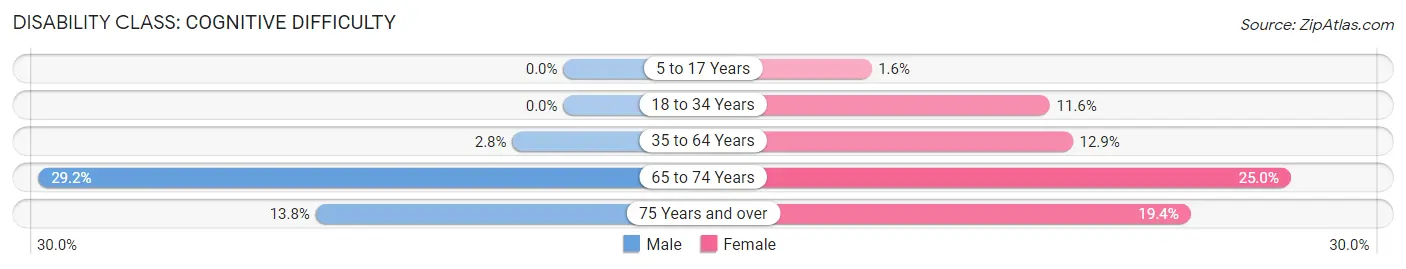
| Age Bracket | Male | Female |
| 5 to 17 Years | 0 (0.0%) | 4 (1.6%) |
| 18 to 34 Years | 0 (0.0%) | 42 (11.6%) |
| 35 to 64 Years | 9 (2.8%) | 64 (12.9%) |
| 65 to 74 Years | 50 (29.2%) | 29 (25.0%) |
| 75 Years and over | 4 (13.8%) | 27 (19.4%) |
Disability Class: Ambulatory Difficulty
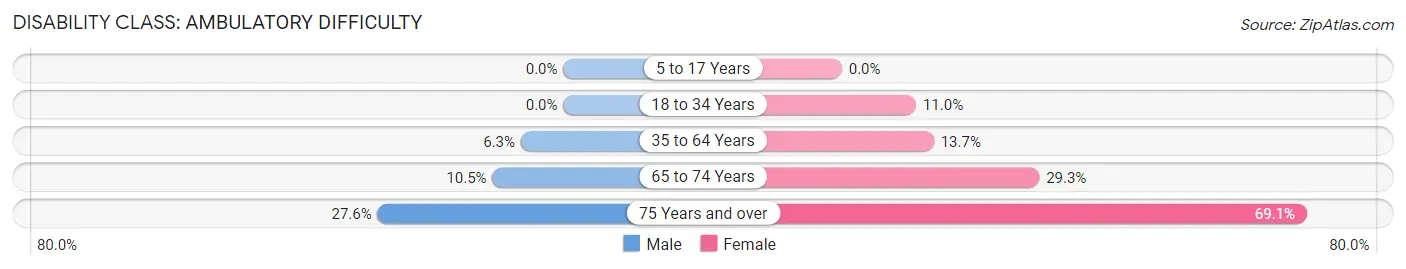
| Age Bracket | Male | Female |
| 5 to 17 Years | 0 (0.0%) | 0 (0.0%) |
| 18 to 34 Years | 0 (0.0%) | 40 (11.0%) |
| 35 to 64 Years | 20 (6.3%) | 68 (13.7%) |
| 65 to 74 Years | 18 (10.5%) | 34 (29.3%) |
| 75 Years and over | 8 (27.6%) | 96 (69.1%) |
Disability Class: Self-Care Difficulty
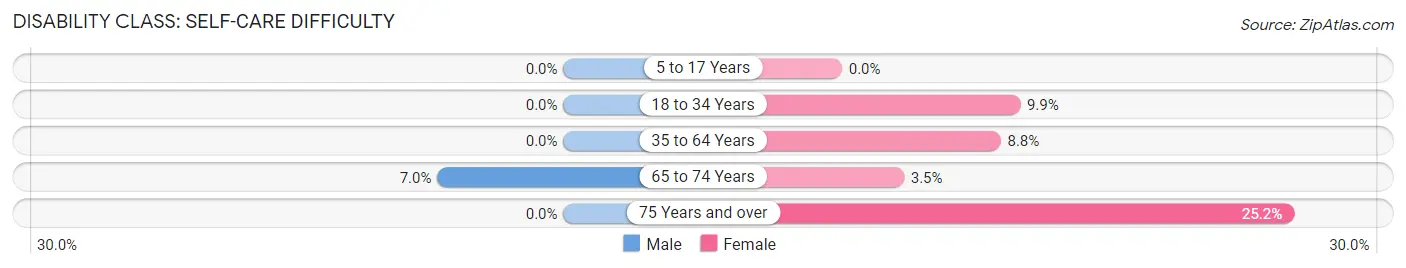
| Age Bracket | Male | Female |
| 5 to 17 Years | 0 (0.0%) | 0 (0.0%) |
| 18 to 34 Years | 0 (0.0%) | 36 (9.9%) |
| 35 to 64 Years | 0 (0.0%) | 44 (8.8%) |
| 65 to 74 Years | 12 (7.0%) | 4 (3.5%) |
| 75 Years and over | 0 (0.0%) | 35 (25.2%) |
Technology Access in Crisfield
Computing Device Access in Crisfield
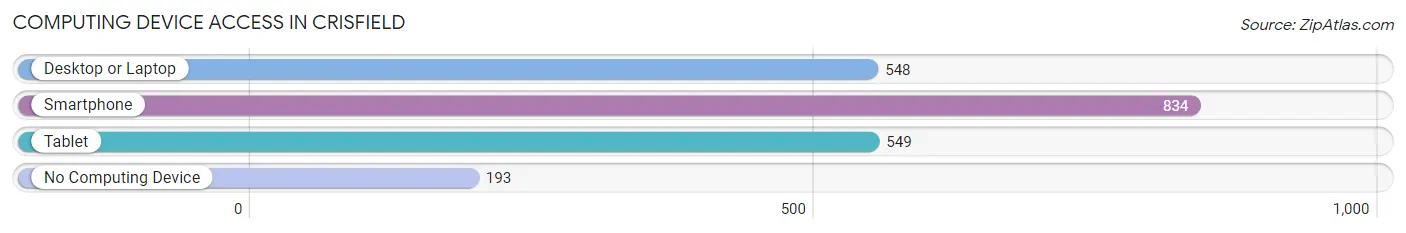
| Device Type | # Households | % Households |
| Desktop or Laptop | 548 | 49.4% |
| Smartphone | 834 | 75.2% |
| Tablet | 549 | 49.5% |
| No Computing Device | 193 | 17.4% |
| Total | 1,109 | 100.0% |
Internet Access in Crisfield
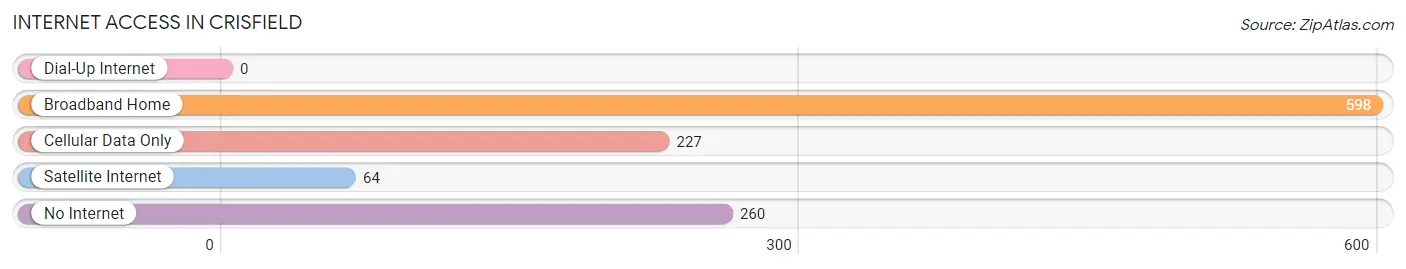
| Internet Type | # Households | % Households |
| Dial-Up Internet | 0 | 0.0% |
| Broadband Home | 598 | 53.9% |
| Cellular Data Only | 227 | 20.5% |
| Satellite Internet | 64 | 5.8% |
| No Internet | 260 | 23.4% |
| Total | 1,109 | 100.0% |
Crisfield Summary
Crisfield, Maryland is a small town located on the Eastern Shore of the Chesapeake Bay. It is the county seat of Somerset County and is located about 50 miles south of Salisbury. The town has a population of 2,726 as of the 2010 census.
History
Crisfield was founded in 1663 by English settlers who were granted a charter by the Maryland General Assembly. The town was named after John Crisfield, who was a prominent landowner in the area. The town was a major port for the Chesapeake Bay oyster industry and was known as the "Seafood Capital of the World". The town was also a major center for the seafood packing industry.
In the late 19th century, Crisfield was a popular resort destination for wealthy Baltimoreans. The town was home to several large hotels, including the Crisfield Hotel, which was built in 1887. The town was also home to a number of amusement parks, including the popular "Crisfield Amusement Park" which opened in 1895.
In the early 20th century, Crisfield was a major center for the seafood industry. The town was home to several large seafood packing plants, including the National Seafood Company, which was founded in 1906. The town was also home to several large seafood processing plants, including the National Fish Company, which was founded in 1910.
Geography
Crisfield is located on the Eastern Shore of the Chesapeake Bay. The town is situated on a peninsula between the Tangier Sound and the Chesapeake Bay. The town is bordered by the towns of Princess Anne to the north, Marion Station to the east, and Deal Island to the south. The town is located about 50 miles south of Salisbury and about 90 miles east of Washington, D.C.
The town has a total area of 2.2 square miles, all of which is land. The town is located at an elevation of 10 feet above sea level.
Economy
Crisfield's economy is largely based on the seafood industry. The town is home to several large seafood processing plants, including the National Seafood Company and the National Fish Company. The town is also home to several seafood restaurants, including the popular "Crisfield Seafood House".
The town is also home to several marinas, including the Crisfield Marina and the Tangier Sound Marina. The town is also home to several boatyards, including the Crisfield Boatyard and the Tangier Sound Boatyard.
Demographics
As of the 2010 census, there were 2,726 people, 1,093 households, and 690 families residing in the town. The population density was 1,228.3 people per square mile. The racial makeup of the town was 73.3% White, 22.2% African American, 0.4% Native American, 0.7% Asian, 0.1% Pacific Islander, 1.2% from other races, and 2.1% from two or more races. Hispanic or Latino of any race were 3.2% of the population.
The median income for a household in the town was $35,938, and the median income for a family was $41,250. Males had a median income of $31,250 versus $25,000 for females. The per capita income for the town was $17,845. About 15.2% of families and 18.2% of the population were below the poverty line, including 25.2% of those under age 18 and 11.2% of those age 65 or over.
Common Questions
What is Per Capita Income in Crisfield?
Per Capita income in Crisfield is $25,560.
What is the Median Family Income in Crisfield?
Median Family Income in Crisfield is $51,709.
What is the Median Household income in Crisfield?
Median Household Income in Crisfield is $38,417.
What is Income or Wage Gap in Crisfield?
Income or Wage Gap in Crisfield is 11.8%.
Women in Crisfield earn 88.2 cents for every dollar earned by a man.
What is Inequality or Gini Index in Crisfield?
Inequality or Gini Index in Crisfield is 0.49.
What is the Total Population of Crisfield?
Total Population of Crisfield is 2,445.
What is the Total Male Population of Crisfield?
Total Male Population of Crisfield is 966.
What is the Total Female Population of Crisfield?
Total Female Population of Crisfield is 1,479.
What is the Ratio of Males per 100 Females in Crisfield?
There are 65.31 Males per 100 Females in Crisfield.
What is the Ratio of Females per 100 Males in Crisfield?
There are 153.11 Females per 100 Males in Crisfield.
What is the Median Population Age in Crisfield?
Median Population Age in Crisfield is 35.8 Years.
What is the Average Family Size in Crisfield
Average Family Size in Crisfield is 2.9 People.
What is the Average Household Size in Crisfield
Average Household Size in Crisfield is 2.2 People.
How Large is the Labor Force in Crisfield?
There are 1,181 People in the Labor Forcein in Crisfield.
What is the Percentage of People in the Labor Force in Crisfield?
60.4% of People are in the Labor Force in Crisfield.
What is the Unemployment Rate in Crisfield?
Unemployment Rate in Crisfield is 14.5%.