Leitersburg, MD Map & Demographics
Leitersburg Map
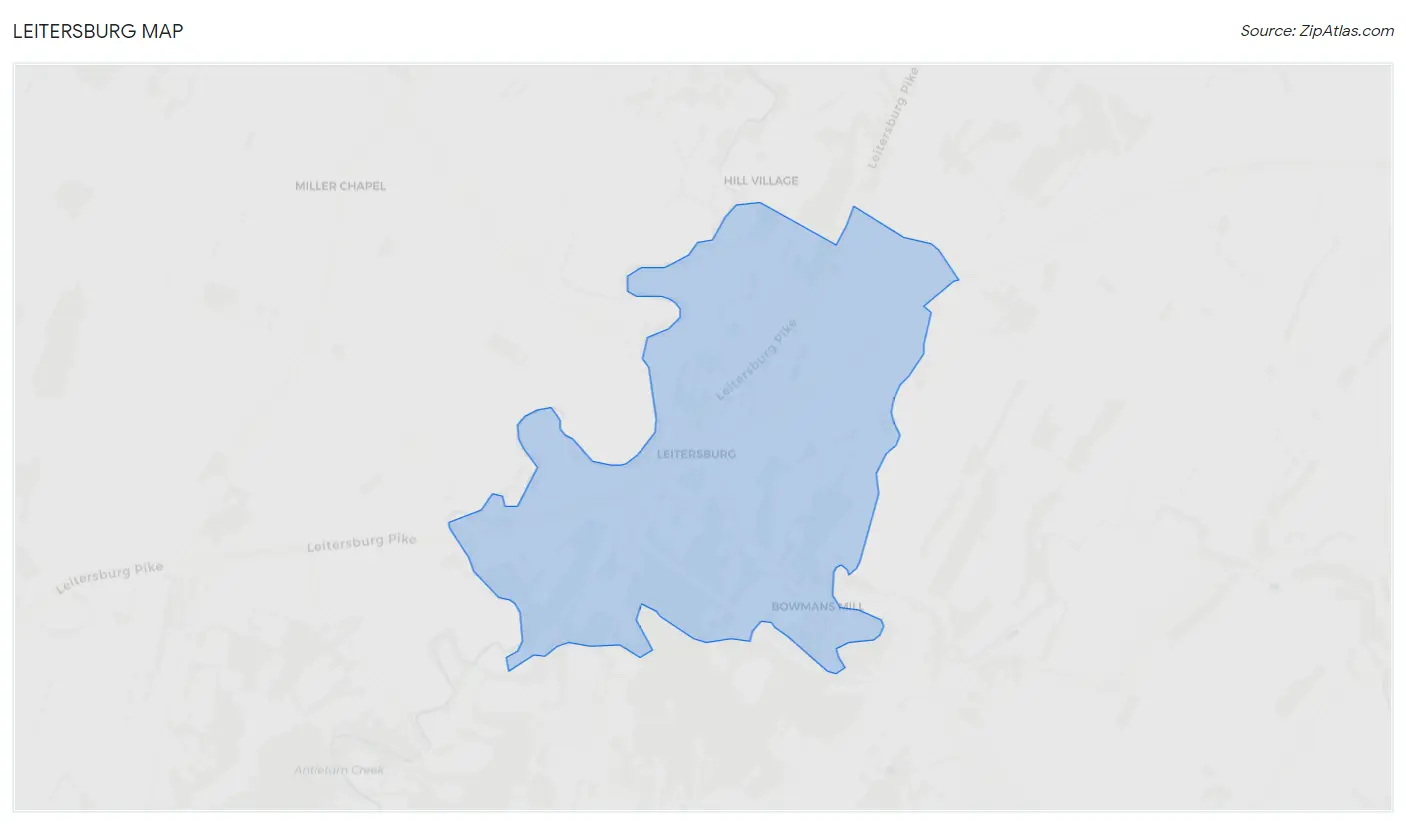
Leitersburg Overview
$23,055
PER CAPITA INCOME
39.0%
WAGE / INCOME GAP [ % ]
61.0¢/ $1
WAGE / INCOME GAP [ $ ]
0.68
INEQUALITY / GINI INDEX
355
TOTAL POPULATION
173
MALE POPULATION
182
FEMALE POPULATION
95.05
MALES / 100 FEMALES
105.20
FEMALES / 100 MALES
53.3
MEDIAN AGE
3.1
AVG FAMILY SIZE
1.7
AVG HOUSEHOLD SIZE
113
LABOR FORCE [ PEOPLE ]
37.9%
PERCENT IN LABOR FORCE
Income in Leitersburg
Income Overview in Leitersburg
| Characteristic | Number | Measure |
| Per Capita Income | 355 | $23,055 |
| Median Family Income | 64 | $0 |
| Mean Family Income | 64 | $92,813 |
| Median Household Income | 206 | $0 |
| Mean Household Income | 206 | $35,639 |
| Income Deficit | 64 | $0 |
| Wage / Income Gap (%) | 355 | 39.01% |
| Wage / Income Gap ($) | 355 | 60.99¢ per $1 |
| Gini / Inequality Index | 355 | 0.68 |
Earnings by Sex in Leitersburg
Average Earnings in Leitersburg are $40,893, $34,306 for men and $56,250 for women, a difference of 39.0%.
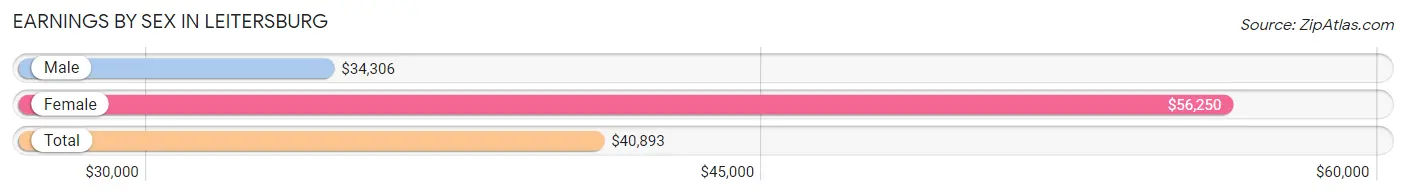
| Sex | Number | Average Earnings |
| Male | 81 (65.8%) | $34,306 |
| Female | 42 (34.2%) | $56,250 |
| Total | 123 (100.0%) | $40,893 |
Earnings by Sex by Income Bracket in Leitersburg
The most common earnings brackets in Leitersburg are $2,499 or less for men (17 | 21.0%) and $55,000 to $64,999 for women (18 | 42.9%).
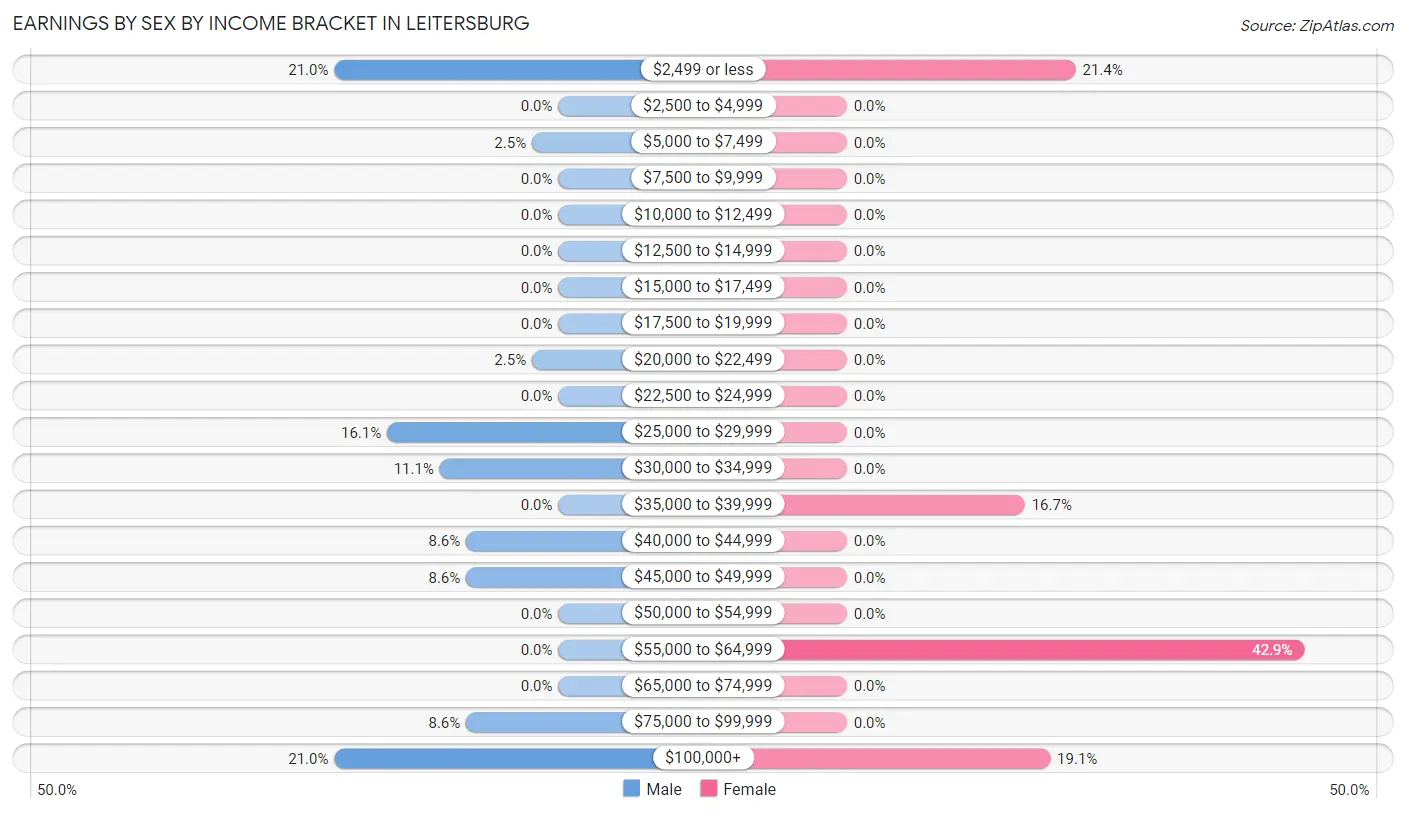
| Income | Male | Female |
| $2,499 or less | 17 (21.0%) | 9 (21.4%) |
| $2,500 to $4,999 | 0 (0.0%) | 0 (0.0%) |
| $5,000 to $7,499 | 2 (2.5%) | 0 (0.0%) |
| $7,500 to $9,999 | 0 (0.0%) | 0 (0.0%) |
| $10,000 to $12,499 | 0 (0.0%) | 0 (0.0%) |
| $12,500 to $14,999 | 0 (0.0%) | 0 (0.0%) |
| $15,000 to $17,499 | 0 (0.0%) | 0 (0.0%) |
| $17,500 to $19,999 | 0 (0.0%) | 0 (0.0%) |
| $20,000 to $22,499 | 2 (2.5%) | 0 (0.0%) |
| $22,500 to $24,999 | 0 (0.0%) | 0 (0.0%) |
| $25,000 to $29,999 | 13 (16.1%) | 0 (0.0%) |
| $30,000 to $34,999 | 9 (11.1%) | 0 (0.0%) |
| $35,000 to $39,999 | 0 (0.0%) | 7 (16.7%) |
| $40,000 to $44,999 | 7 (8.6%) | 0 (0.0%) |
| $45,000 to $49,999 | 7 (8.6%) | 0 (0.0%) |
| $50,000 to $54,999 | 0 (0.0%) | 0 (0.0%) |
| $55,000 to $64,999 | 0 (0.0%) | 18 (42.9%) |
| $65,000 to $74,999 | 0 (0.0%) | 0 (0.0%) |
| $75,000 to $99,999 | 7 (8.6%) | 0 (0.0%) |
| $100,000+ | 17 (21.0%) | 8 (19.1%) |
| Total | 81 (100.0%) | 42 (100.0%) |
Earnings by Sex by Educational Attainment in Leitersburg
| Educational Attainment | Male Income | Female Income |
| Less than High School | - | - |
| High School Diploma | - | - |
| College or Associate's Degree | - | - |
| Bachelor's Degree | - | - |
| Graduate Degree | - | - |
| Total | - | - |
Family Income in Leitersburg
Family Income Brackets in Leitersburg
According to the Leitersburg family income data, there are 17 families falling into the $150,000 to $199,999 income range, which is the most common income bracket and makes up 26.6% of all families.
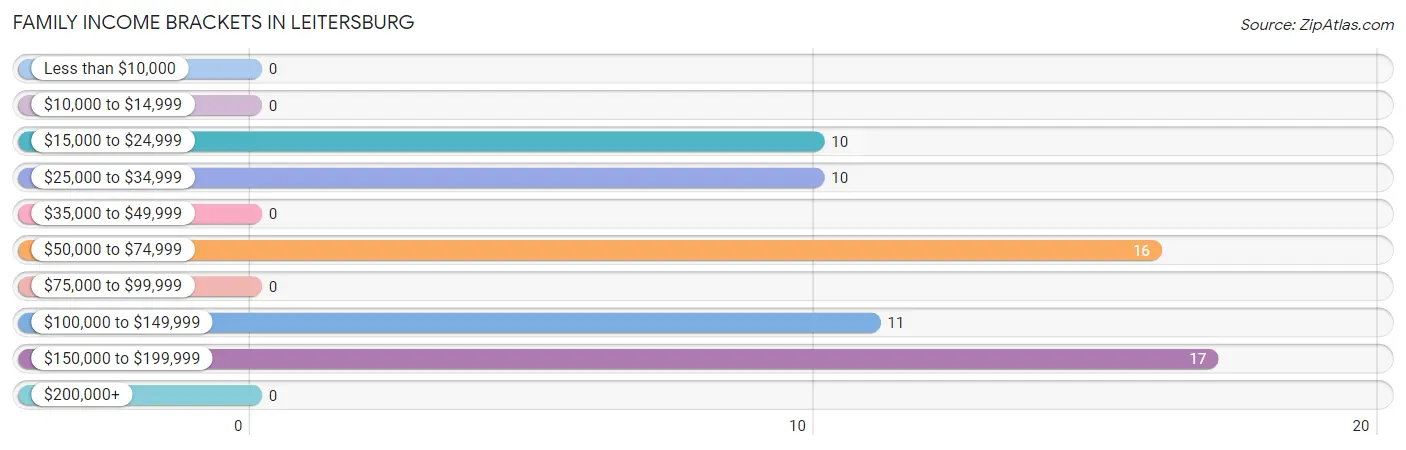
| Income Bracket | # Families | % Families |
| Less than $10,000 | 0 | 0.0% |
| $10,000 to $14,999 | 0 | 0.0% |
| $15,000 to $24,999 | 10 | 15.6% |
| $25,000 to $34,999 | 10 | 15.6% |
| $35,000 to $49,999 | 0 | 0.0% |
| $50,000 to $74,999 | 16 | 25.0% |
| $75,000 to $99,999 | 0 | 0.0% |
| $100,000 to $149,999 | 11 | 17.2% |
| $150,000 to $199,999 | 17 | 26.6% |
| $200,000+ | 0 | 0.0% |
Family Income by Famaliy Size in Leitersburg
| Income Bracket | # Families | Median Income |
| 2-Person Families | 36 (56.2%) | $0 |
| 3-Person Families | 7 (10.9%) | $0 |
| 4-Person Families | 15 (23.4%) | $0 |
| 5-Person Families | 6 (9.4%) | $0 |
| 6-Person Families | 0 (0.0%) | $0 |
| 7+ Person Families | 0 (0.0%) | $0 |
| Total | 64 (100.0%) | $0 |
Family Income by Number of Earners in Leitersburg
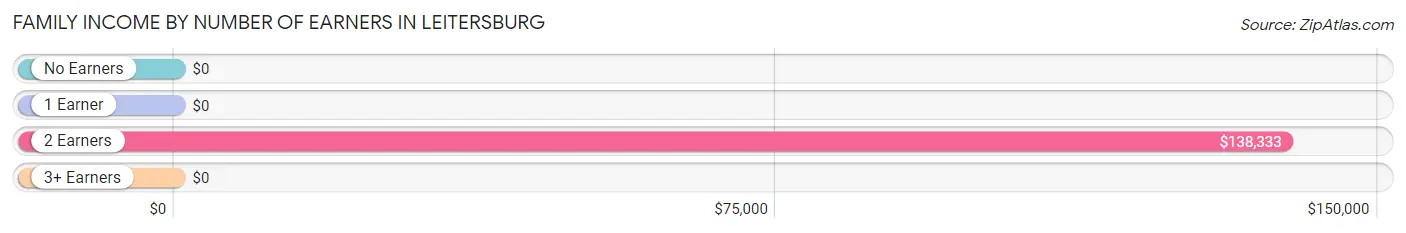
| Number of Earners | # Families | Median Income |
| No Earners | 20 (31.2%) | $0 |
| 1 Earner | 12 (18.8%) | $0 |
| 2 Earners | 22 (34.4%) | $138,333 |
| 3+ Earners | 10 (15.6%) | $0 |
| Total | 64 (100.0%) | $0 |
Household Income in Leitersburg
Household Income Brackets in Leitersburg
With 114 households falling in the category, the less than $10,000 income range is the most frequent in Leitersburg, accounting for 55.3% of all households.
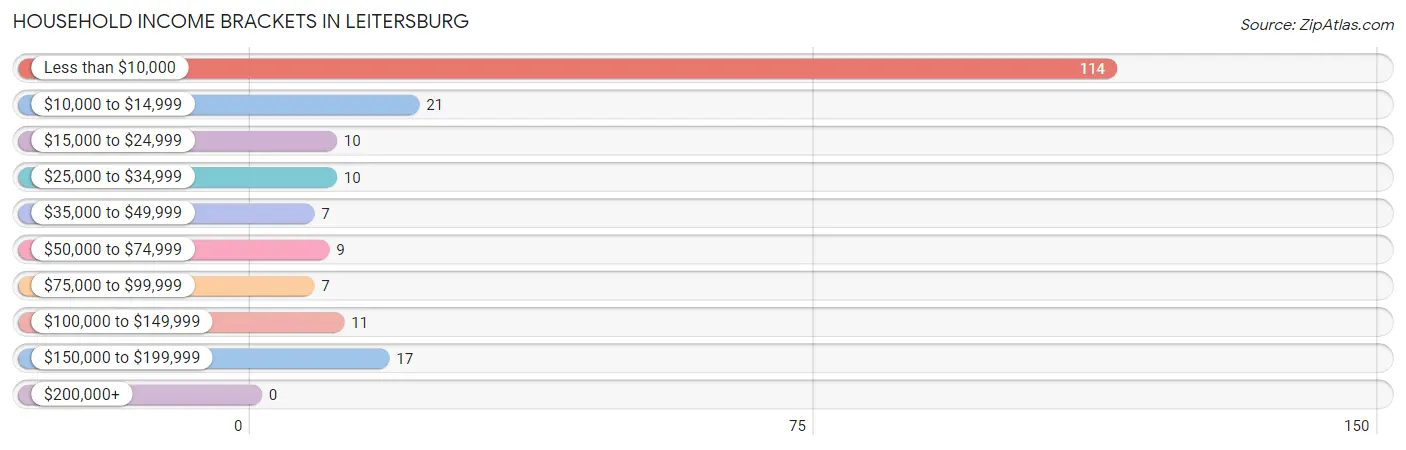
| Income Bracket | # Households | % Households |
| Less than $10,000 | 114 | 55.3% |
| $10,000 to $14,999 | 21 | 10.2% |
| $15,000 to $24,999 | 10 | 4.9% |
| $25,000 to $34,999 | 10 | 4.9% |
| $35,000 to $49,999 | 7 | 3.4% |
| $50,000 to $74,999 | 9 | 4.4% |
| $75,000 to $99,999 | 7 | 3.4% |
| $100,000 to $149,999 | 11 | 5.3% |
| $150,000 to $199,999 | 17 | 8.3% |
| $200,000+ | 0 | 0.0% |
Household Income by Householder Age in Leitersburg
The median household income in Leitersburg is $0, with the highest median household income of $7,003 found in the 65+ years age bracket for the primary householder. A total of 133 households (64.6%) fall into this category.
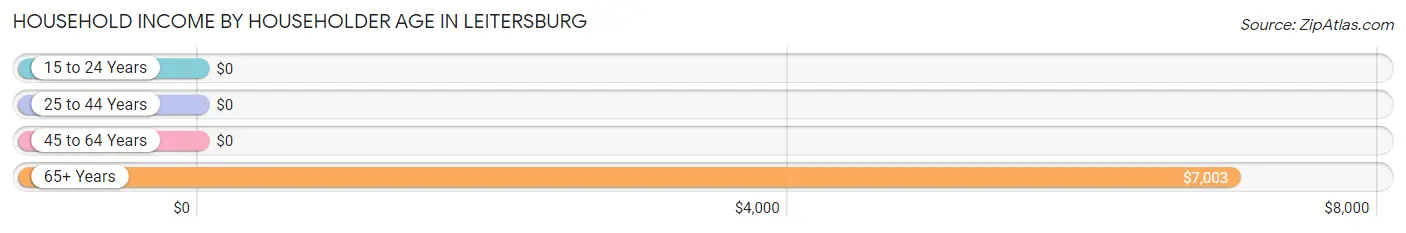
| Income Bracket | # Households | Median Income |
| 15 to 24 Years | 0 (0.0%) | $0 |
| 25 to 44 Years | 25 (12.1%) | $0 |
| 45 to 64 Years | 48 (23.3%) | $0 |
| 65+ Years | 133 (64.6%) | $7,003 |
| Total | 206 (100.0%) | $0 |
Poverty in Leitersburg
Income Below Poverty by Sex and Age in Leitersburg
With 15.0% poverty level for males and 57.1% for females among the residents of Leitersburg, 45 to 54 year old males and 75 year old and over females are the most vulnerable to poverty, with 21 males (45.7%) and 93 females (90.3%) in their respective age groups living below the poverty level.
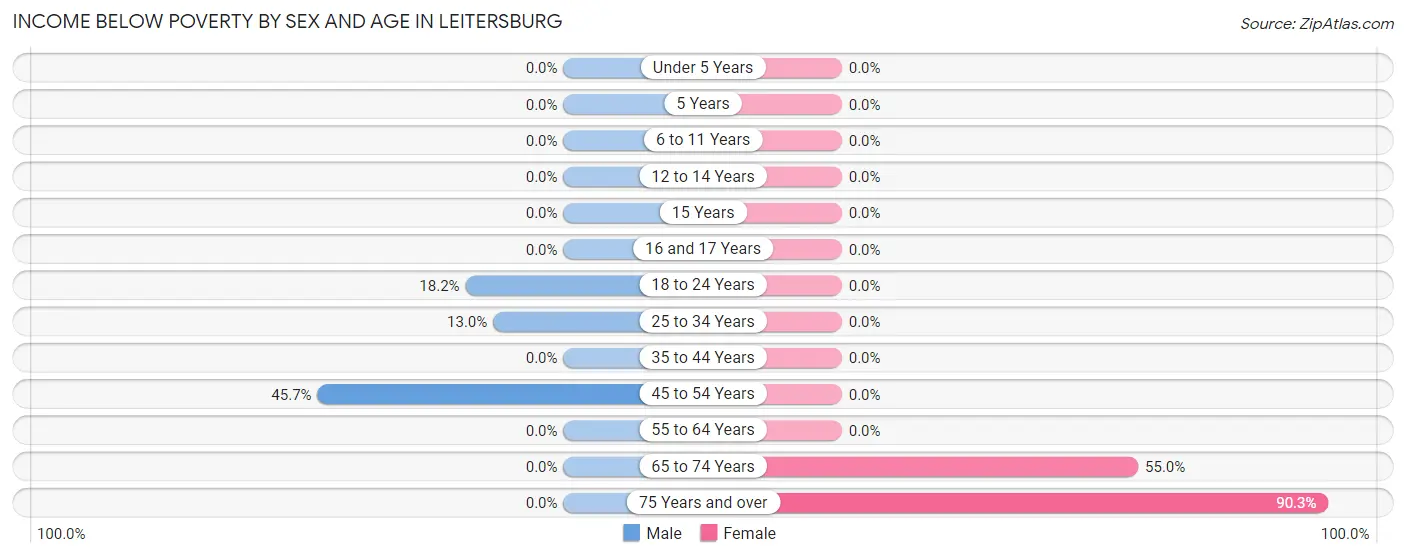
| Age Bracket | Male | Female |
| Under 5 Years | 0 (0.0%) | 0 (0.0%) |
| 5 Years | 0 (0.0%) | 0 (0.0%) |
| 6 to 11 Years | 0 (0.0%) | 0 (0.0%) |
| 12 to 14 Years | 0 (0.0%) | 0 (0.0%) |
| 15 Years | 0 (0.0%) | 0 (0.0%) |
| 16 and 17 Years | 0 (0.0%) | 0 (0.0%) |
| 18 to 24 Years | 2 (18.2%) | 0 (0.0%) |
| 25 to 34 Years | 3 (13.0%) | 0 (0.0%) |
| 35 to 44 Years | 0 (0.0%) | 0 (0.0%) |
| 45 to 54 Years | 21 (45.7%) | 0 (0.0%) |
| 55 to 64 Years | 0 (0.0%) | 0 (0.0%) |
| 65 to 74 Years | 0 (0.0%) | 11 (55.0%) |
| 75 Years and over | 0 (0.0%) | 93 (90.3%) |
| Total | 26 (15.0%) | 104 (57.1%) |
Income Above Poverty by Sex and Age in Leitersburg
According to the poverty statistics in Leitersburg, males aged under 5 years and females aged under 5 years are the age groups that are most secure financially, with 100.0% of males and 100.0% of females in these age groups living above the poverty line.
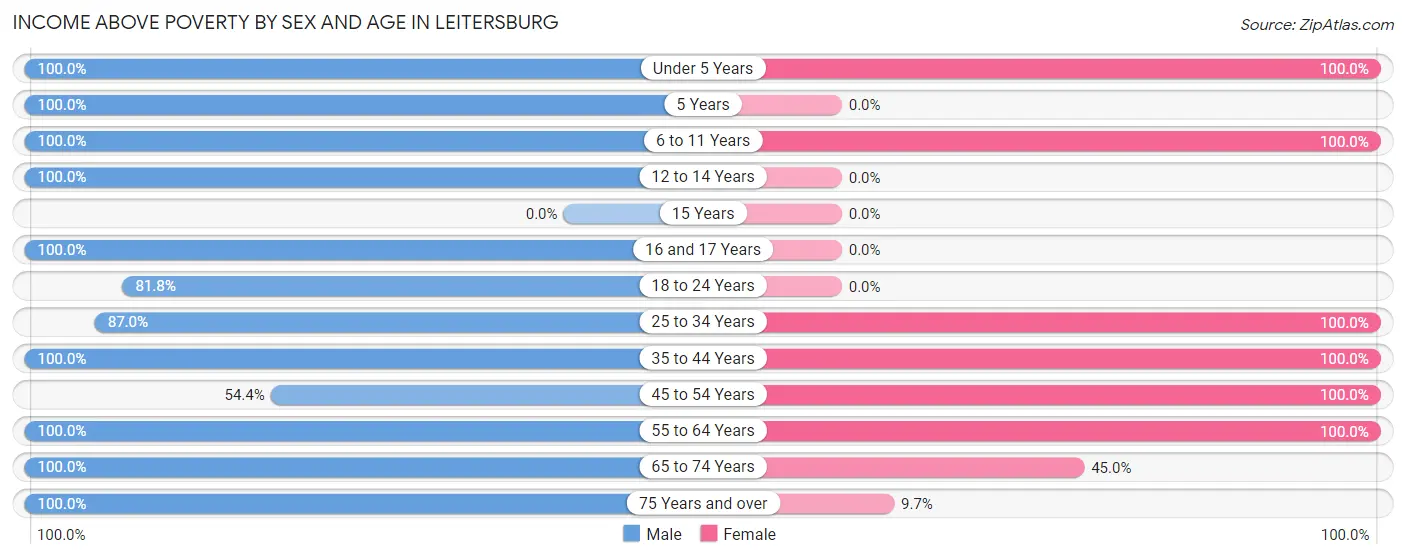
| Age Bracket | Male | Female |
| Under 5 Years | 15 (100.0%) | 12 (100.0%) |
| 5 Years | 7 (100.0%) | 0 (0.0%) |
| 6 to 11 Years | 8 (100.0%) | 8 (100.0%) |
| 12 to 14 Years | 7 (100.0%) | 0 (0.0%) |
| 15 Years | 0 (0.0%) | 0 (0.0%) |
| 16 and 17 Years | 11 (100.0%) | 0 (0.0%) |
| 18 to 24 Years | 9 (81.8%) | 0 (0.0%) |
| 25 to 34 Years | 20 (87.0%) | 14 (100.0%) |
| 35 to 44 Years | 7 (100.0%) | 7 (100.0%) |
| 45 to 54 Years | 25 (54.3%) | 10 (100.0%) |
| 55 to 64 Years | 7 (100.0%) | 8 (100.0%) |
| 65 to 74 Years | 21 (100.0%) | 9 (45.0%) |
| 75 Years and over | 10 (100.0%) | 10 (9.7%) |
| Total | 147 (85.0%) | 78 (42.9%) |
Income Below Poverty Among Married-Couple Families in Leitersburg
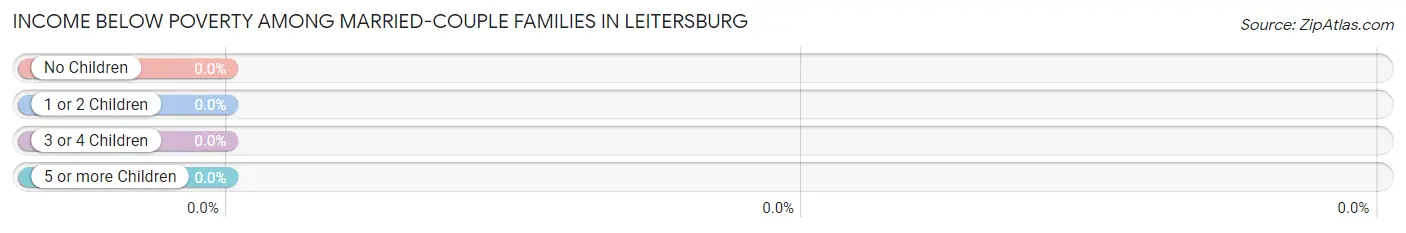
| Children | Above Poverty | Below Poverty |
| No Children | 26 (100.0%) | 0 (0.0%) |
| 1 or 2 Children | 15 (100.0%) | 0 (0.0%) |
| 3 or 4 Children | 6 (100.0%) | 0 (0.0%) |
| 5 or more Children | 0 (0.0%) | 0 (0.0%) |
| Total | 47 (100.0%) | 0 (0.0%) |
Income Below Poverty Among Single-Parent Households in Leitersburg
| Children | Single Father | Single Mother |
| No Children | 0 (0.0%) | 0 (0.0%) |
| 1 or 2 Children | 0 (0.0%) | 0 (0.0%) |
| 3 or 4 Children | 0 (0.0%) | 0 (0.0%) |
| 5 or more Children | 0 (0.0%) | 0 (0.0%) |
| Total | 0 (0.0%) | 0 (0.0%) |
Income Below Poverty Among Married-Couple vs Single-Parent Households in Leitersburg
| Children | Married-Couple Families | Single-Parent Households |
| No Children | 0 (0.0%) | 0 (0.0%) |
| 1 or 2 Children | 0 (0.0%) | 0 (0.0%) |
| 3 or 4 Children | 0 (0.0%) | 0 (0.0%) |
| 5 or more Children | 0 (0.0%) | 0 (0.0%) |
| Total | 0 (0.0%) | 0 (0.0%) |
Race in Leitersburg
The most populous races in Leitersburg are White / Caucasian (353 | 99.4%), and Black / African American (2 | 0.6%).
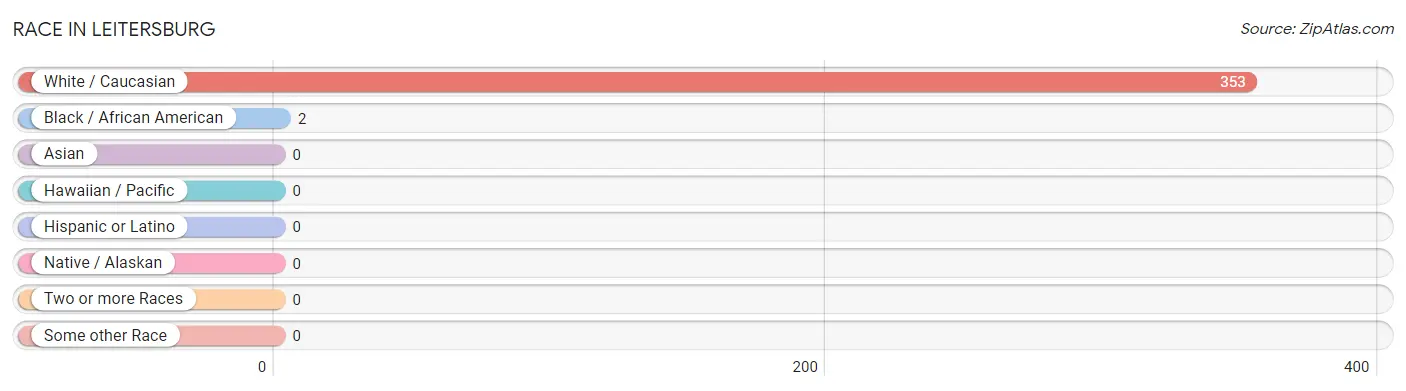
| Race | # Population | % Population |
| Asian | 0 | 0.0% |
| Black / African American | 2 | 0.6% |
| Hawaiian / Pacific | 0 | 0.0% |
| Hispanic or Latino | 0 | 0.0% |
| Native / Alaskan | 0 | 0.0% |
| White / Caucasian | 353 | 99.4% |
| Two or more Races | 0 | 0.0% |
| Some other Race | 0 | 0.0% |
| Total | 355 | 100.0% |
Ancestry in Leitersburg
The most populous ancestries reported in Leitersburg are English (33 | 9.3%), American (21 | 5.9%), German (19 | 5.3%), Irish (18 | 5.1%), and French (10 | 2.8%), together accounting for 28.5% of all Leitersburg residents.
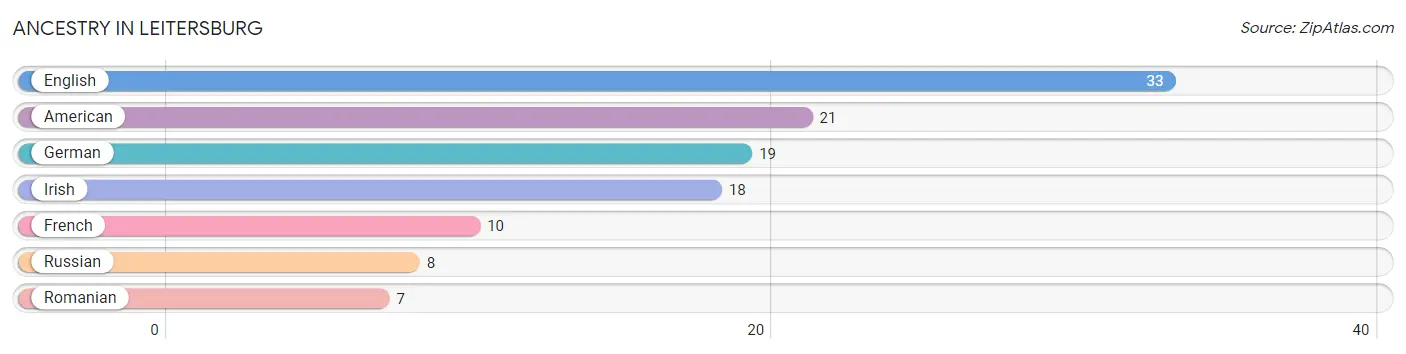
| Ancestry | # Population | % Population |
| American | 21 | 5.9% |
| English | 33 | 9.3% |
| French | 10 | 2.8% |
| German | 19 | 5.3% |
| Irish | 18 | 5.1% |
| Romanian | 7 | 2.0% |
| Russian | 8 | 2.2% | View All 7 Rows |
Immigrants in Leitersburg
The most numerous immigrant groups reported in Leitersburg came from Eastern Europe (7 | 2.0%), Europe (7 | 2.0%), and Romania (7 | 2.0%), together accounting for 5.9% of all Leitersburg residents.
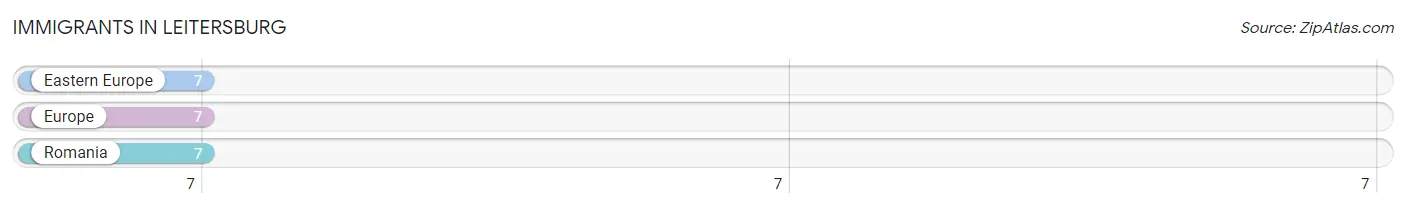
| Immigration Origin | # Population | % Population |
| Eastern Europe | 7 | 2.0% |
| Europe | 7 | 2.0% |
| Romania | 7 | 2.0% | View All 3 Rows |
Sex and Age in Leitersburg
Sex and Age in Leitersburg
The most populous age groups in Leitersburg are 45 to 49 Years (24 | 13.9%) for men and 80 to 84 Years (83 | 45.6%) for women.
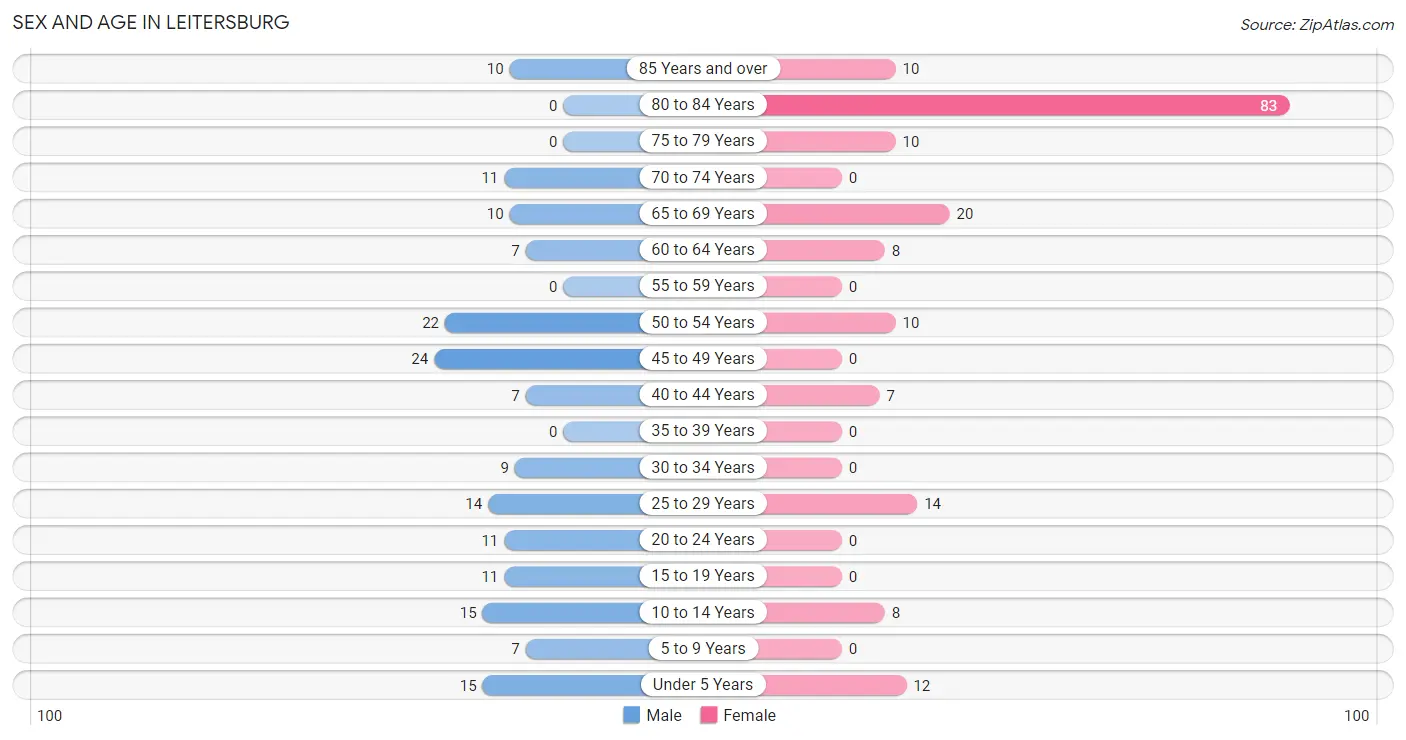
| Age Bracket | Male | Female |
| Under 5 Years | 15 (8.7%) | 12 (6.6%) |
| 5 to 9 Years | 7 (4.1%) | 0 (0.0%) |
| 10 to 14 Years | 15 (8.7%) | 8 (4.4%) |
| 15 to 19 Years | 11 (6.4%) | 0 (0.0%) |
| 20 to 24 Years | 11 (6.4%) | 0 (0.0%) |
| 25 to 29 Years | 14 (8.1%) | 14 (7.7%) |
| 30 to 34 Years | 9 (5.2%) | 0 (0.0%) |
| 35 to 39 Years | 0 (0.0%) | 0 (0.0%) |
| 40 to 44 Years | 7 (4.1%) | 7 (3.8%) |
| 45 to 49 Years | 24 (13.9%) | 0 (0.0%) |
| 50 to 54 Years | 22 (12.7%) | 10 (5.5%) |
| 55 to 59 Years | 0 (0.0%) | 0 (0.0%) |
| 60 to 64 Years | 7 (4.1%) | 8 (4.4%) |
| 65 to 69 Years | 10 (5.8%) | 20 (11.0%) |
| 70 to 74 Years | 11 (6.4%) | 0 (0.0%) |
| 75 to 79 Years | 0 (0.0%) | 10 (5.5%) |
| 80 to 84 Years | 0 (0.0%) | 83 (45.6%) |
| 85 Years and over | 10 (5.8%) | 10 (5.5%) |
| Total | 173 (100.0%) | 182 (100.0%) |
Families and Households in Leitersburg
Median Family Size in Leitersburg
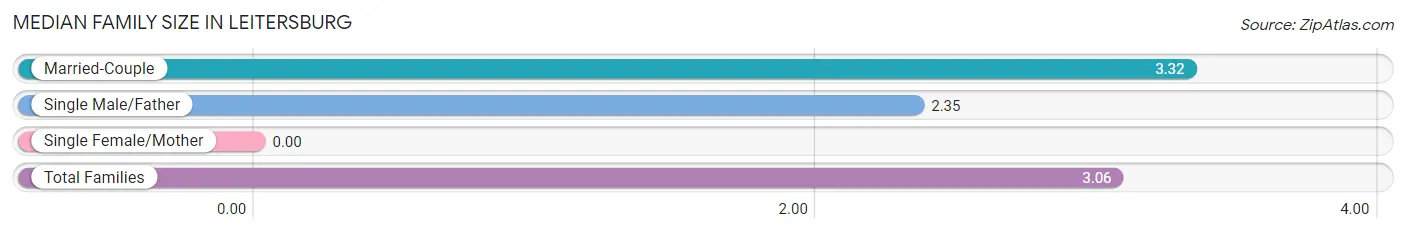
| Family Type | # Families | Family Size |
| Married-Couple | 47 (73.4%) | 3.32 |
| Single Male/Father | 17 (26.6%) | 2.35 |
| Single Female/Mother | 0 (0.0%) | - |
| Total Families | 64 (100.0%) | 3.06 |
Median Household Size in Leitersburg
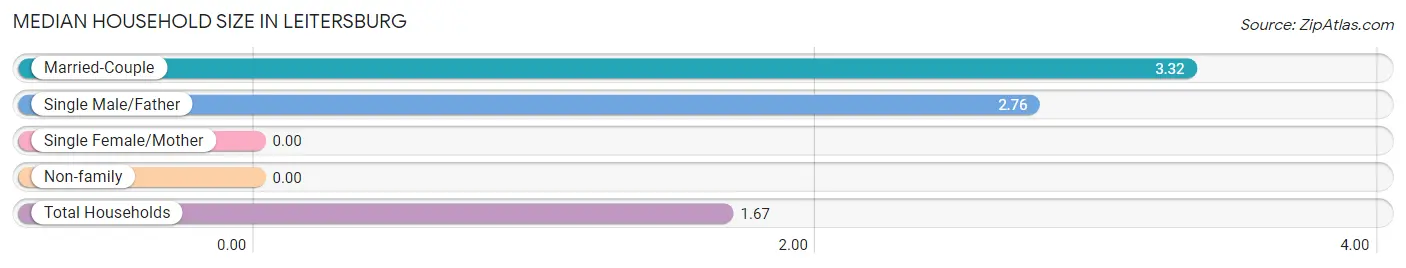
| Household Type | # Households | Household Size |
| Married-Couple | 47 (22.8%) | 3.32 |
| Single Male/Father | 17 (8.3%) | 2.76 |
| Single Female/Mother | 0 (0.0%) | - |
| Non-family | 142 (68.9%) | - |
| Total Households | 206 (100.0%) | 1.67 |
Household Size by Marriage Status in Leitersburg
Out of a total of 206 households in Leitersburg, 64 (31.1%) are family households, while 142 (68.9%) are nonfamily households. The most numerous type of family households are 2-person households, comprising 36, and the most common type of nonfamily households are 1-person households, comprising 142.
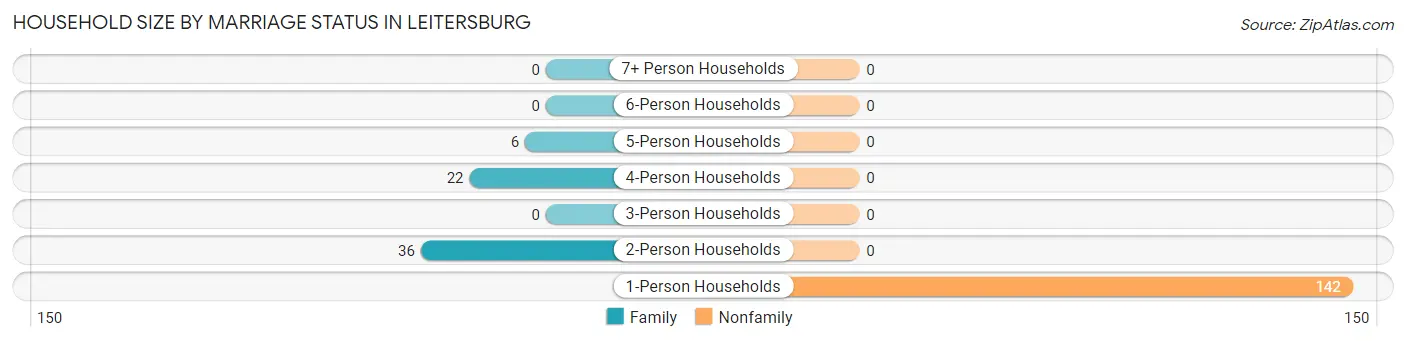
| Household Size | Family Households | Nonfamily Households |
| 1-Person Households | - | 142 (68.9%) |
| 2-Person Households | 36 (17.5%) | 0 (0.0%) |
| 3-Person Households | 0 (0.0%) | 0 (0.0%) |
| 4-Person Households | 22 (10.7%) | 0 (0.0%) |
| 5-Person Households | 6 (2.9%) | 0 (0.0%) |
| 6-Person Households | 0 (0.0%) | 0 (0.0%) |
| 7+ Person Households | 0 (0.0%) | 0 (0.0%) |
| Total | 64 (31.1%) | 142 (68.9%) |
Female Fertility in Leitersburg
Fertility by Age in Leitersburg
| Age Bracket | Women with Births | Births / 1,000 Women |
| 15 to 19 years | 0 (0.0%) | 0.0 |
| 20 to 34 years | 0 (0.0%) | 0.0 |
| 35 to 50 years | 0 (0.0%) | 0.0 |
| Total | 0 (0.0%) | 0.0 |
Fertility by Age by Marriage Status in Leitersburg
| Age Bracket | Married | Unmarried |
| 15 to 19 years | 0 (0.0%) | 0 (0.0%) |
| 20 to 34 years | 0 (0.0%) | 0 (0.0%) |
| 35 to 50 years | 0 (0.0%) | 0 (0.0%) |
| Total | 0 (0.0%) | 0 (0.0%) |
Fertility by Education in Leitersburg
| Educational Attainment | Women with Births | Births / 1,000 Women |
| Less than High School | 0 (0.0%) | 0.0 |
| High School Diploma | 0 (0.0%) | 0.0 |
| College or Associate's Degree | 0 (0.0%) | 0.0 |
| Bachelor's Degree | 0 (0.0%) | 0.0 |
| Graduate Degree | 0 (0.0%) | 0.0 |
| Total | 0 (0.0%) | 0.0 |
Fertility by Education by Marriage Status in Leitersburg
| Educational Attainment | Married | Unmarried |
| Less than High School | 0 (0.0%) | 0 (0.0%) |
| High School Diploma | 0 (0.0%) | 0 (0.0%) |
| College or Associate's Degree | 0 (0.0%) | 0 (0.0%) |
| Bachelor's Degree | 0 (0.0%) | 0 (0.0%) |
| Graduate Degree | 0 (0.0%) | 0 (0.0%) |
| Total | 0 (0.0%) | 0 (0.0%) |
Employment Characteristics in Leitersburg
Employment by Class of Employer in Leitersburg
Among the 113 employed individuals in Leitersburg, private company employees (94 | 83.2%), local government employees (11 | 9.7%), and federal government employees (8 | 7.1%) make up the most common classes of employment.
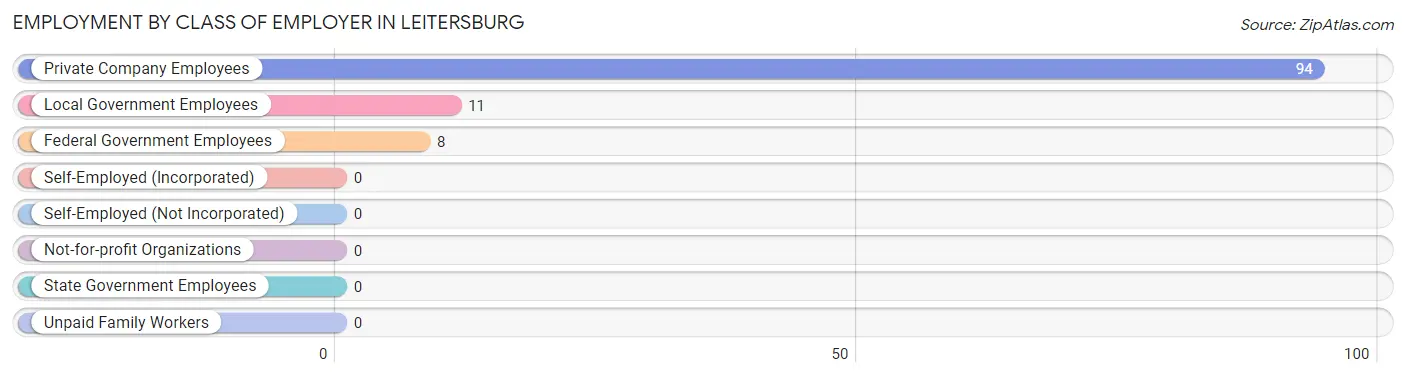
| Employer Class | # Employees | % Employees |
| Private Company Employees | 94 | 83.2% |
| Self-Employed (Incorporated) | 0 | 0.0% |
| Self-Employed (Not Incorporated) | 0 | 0.0% |
| Not-for-profit Organizations | 0 | 0.0% |
| Local Government Employees | 11 | 9.7% |
| State Government Employees | 0 | 0.0% |
| Federal Government Employees | 8 | 7.1% |
| Unpaid Family Workers | 0 | 0.0% |
| Total | 113 | 100.0% |
Employment Status by Age in Leitersburg
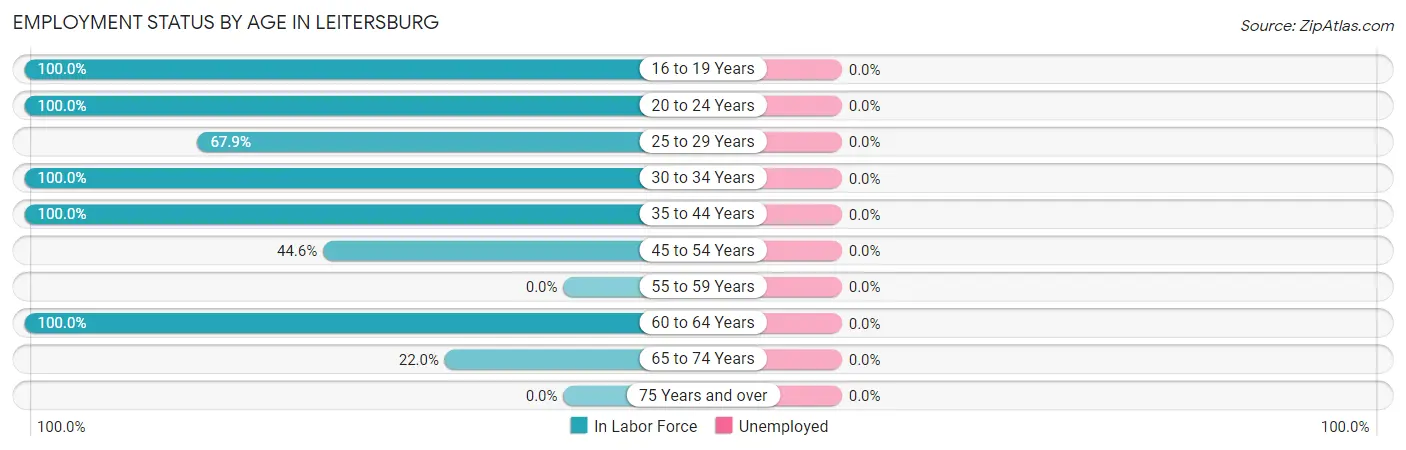
| Age Bracket | In Labor Force | Unemployed |
| 16 to 19 Years | 11 (100.0%) | 0 (0.0%) |
| 20 to 24 Years | 11 (100.0%) | 0 (0.0%) |
| 25 to 29 Years | 19 (67.9%) | 0 (0.0%) |
| 30 to 34 Years | 9 (100.0%) | 0 (0.0%) |
| 35 to 44 Years | 14 (100.0%) | 0 (0.0%) |
| 45 to 54 Years | 25 (44.6%) | 0 (0.0%) |
| 55 to 59 Years | 0 (0.0%) | 0 (0.0%) |
| 60 to 64 Years | 15 (100.0%) | 0 (0.0%) |
| 65 to 74 Years | 9 (22.0%) | 0 (0.0%) |
| 75 Years and over | 0 (0.0%) | 0 (0.0%) |
| Total | 113 (37.9%) | 0 (0.0%) |
Employment Status by Educational Attainment in Leitersburg
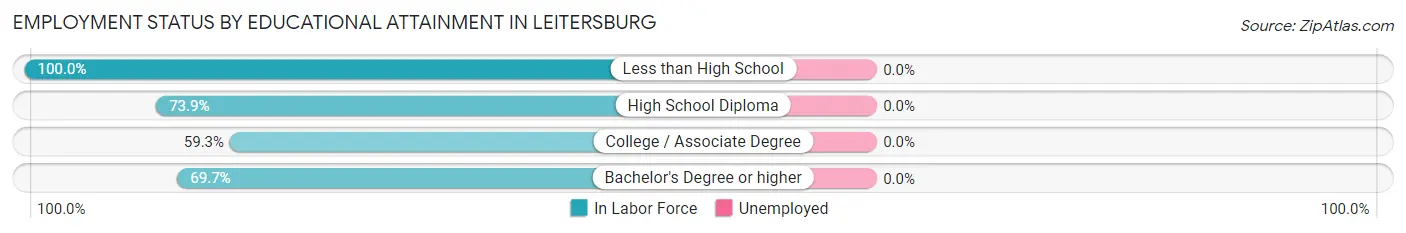
| Educational Attainment | In Labor Force | Unemployed |
| Less than High School | 7 (100.0%) | 0 (0.0%) |
| High School Diploma | 17 (73.9%) | 0 (0.0%) |
| College / Associate Degree | 35 (59.3%) | 0 (0.0%) |
| Bachelor's Degree or higher | 23 (69.7%) | 0 (0.0%) |
| Total | 82 (67.2%) | 0 (0.0%) |
Employment Occupations by Sex in Leitersburg
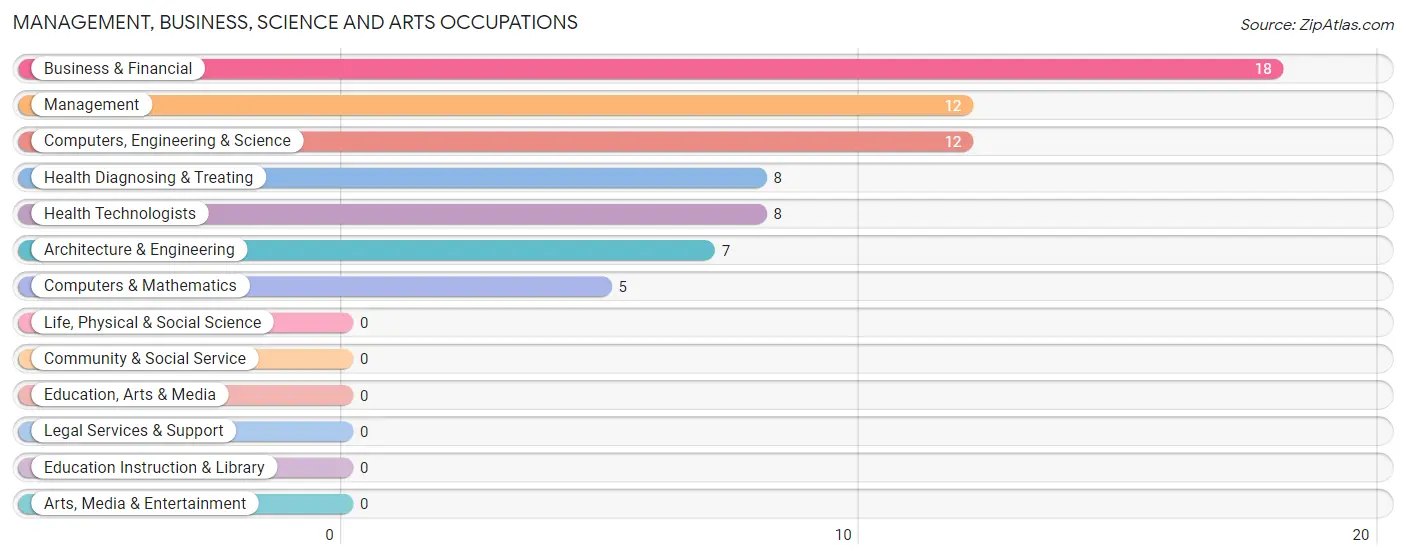
Management, Business, Science and Arts Occupations
The most common Management, Business, Science and Arts occupations in Leitersburg are Business & Financial (18 | 15.9%), Management (12 | 10.6%), Computers, Engineering & Science (12 | 10.6%), Health Diagnosing & Treating (8 | 7.1%), and Health Technologists (8 | 7.1%).
Management, Business, Science and Arts Occupations by Sex
Within the Management, Business, Science and Arts occupations in Leitersburg, the most male-oriented occupations are Management (100.0%), Computers, Engineering & Science (100.0%), and Computers & Mathematics (100.0%), while the most female-oriented occupations are Business & Financial (100.0%), Health Diagnosing & Treating (100.0%), and Health Technologists (100.0%).
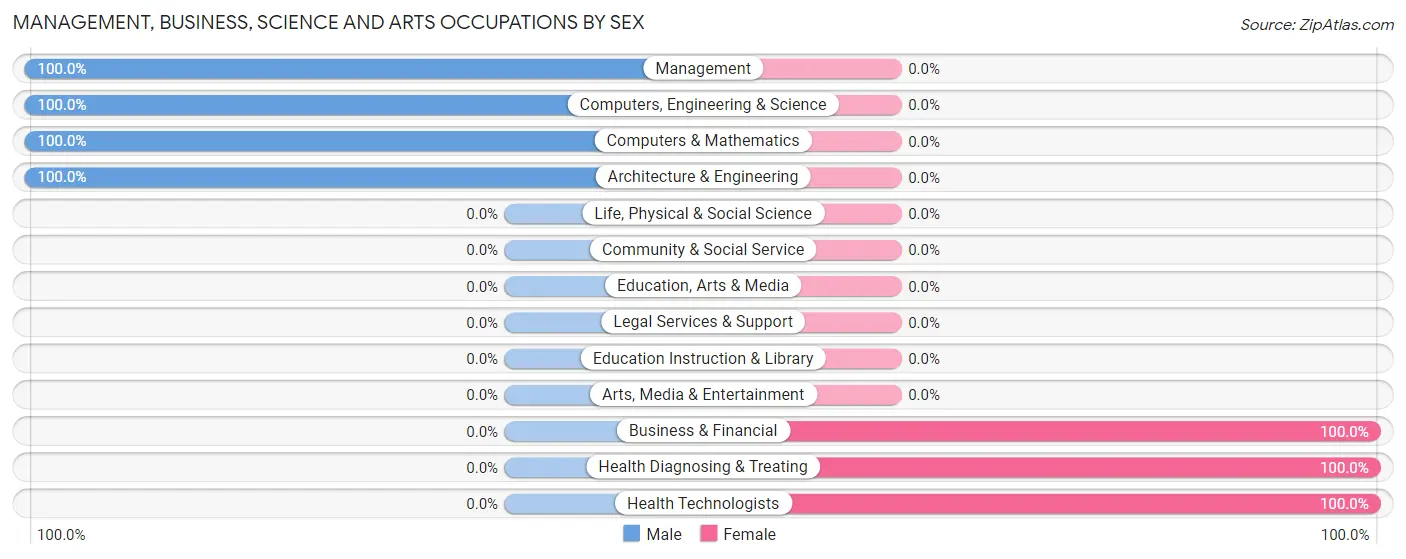
| Occupation | Male | Female |
| Management | 12 (100.0%) | 0 (0.0%) |
| Business & Financial | 0 (0.0%) | 18 (100.0%) |
| Computers, Engineering & Science | 12 (100.0%) | 0 (0.0%) |
| Computers & Mathematics | 5 (100.0%) | 0 (0.0%) |
| Architecture & Engineering | 7 (100.0%) | 0 (0.0%) |
| Life, Physical & Social Science | 0 (0.0%) | 0 (0.0%) |
| Community & Social Service | 0 (0.0%) | 0 (0.0%) |
| Education, Arts & Media | 0 (0.0%) | 0 (0.0%) |
| Legal Services & Support | 0 (0.0%) | 0 (0.0%) |
| Education Instruction & Library | 0 (0.0%) | 0 (0.0%) |
| Arts, Media & Entertainment | 0 (0.0%) | 0 (0.0%) |
| Health Diagnosing & Treating | 0 (0.0%) | 8 (100.0%) |
| Health Technologists | 0 (0.0%) | 8 (100.0%) |
| Total (Category) | 24 (48.0%) | 26 (52.0%) |
| Total (Overall) | 71 (62.8%) | 42 (37.2%) |
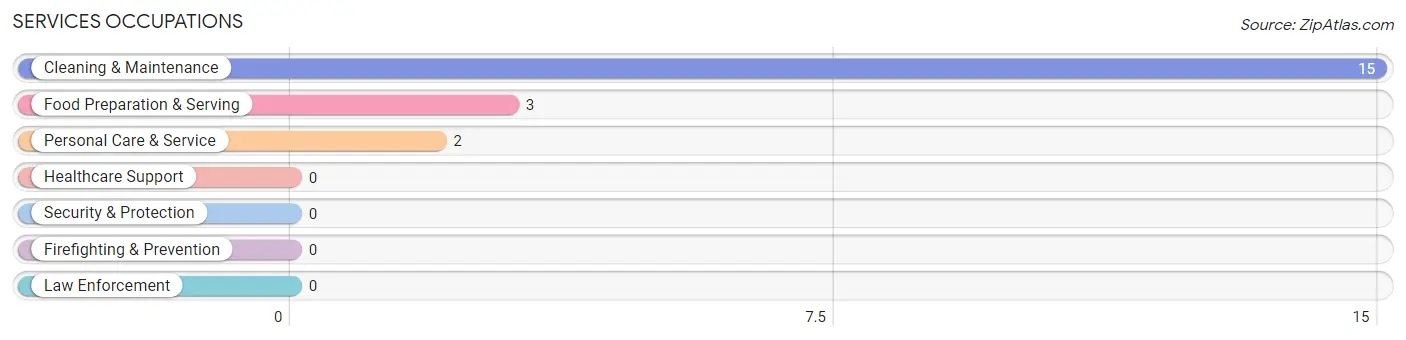
Services Occupations
The most common Services occupations in Leitersburg are Cleaning & Maintenance (15 | 13.3%), Food Preparation & Serving (3 | 2.6%), and Personal Care & Service (2 | 1.8%).
Services Occupations by Sex
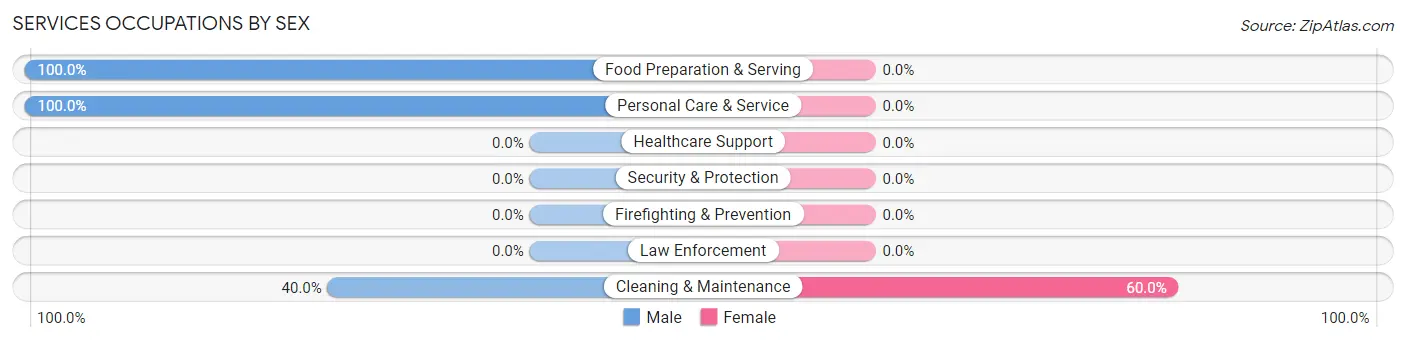
| Occupation | Male | Female |
| Healthcare Support | 0 (0.0%) | 0 (0.0%) |
| Security & Protection | 0 (0.0%) | 0 (0.0%) |
| Firefighting & Prevention | 0 (0.0%) | 0 (0.0%) |
| Law Enforcement | 0 (0.0%) | 0 (0.0%) |
| Food Preparation & Serving | 3 (100.0%) | 0 (0.0%) |
| Cleaning & Maintenance | 6 (40.0%) | 9 (60.0%) |
| Personal Care & Service | 2 (100.0%) | 0 (0.0%) |
| Total (Category) | 11 (55.0%) | 9 (45.0%) |
| Total (Overall) | 71 (62.8%) | 42 (37.2%) |
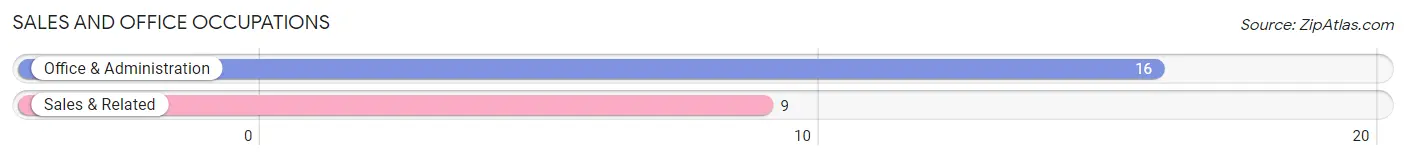
Sales and Office Occupations
The most common Sales and Office occupations in Leitersburg are Office & Administration (16 | 14.2%), and Sales & Related (9 | 8.0%).
Sales and Office Occupations by Sex
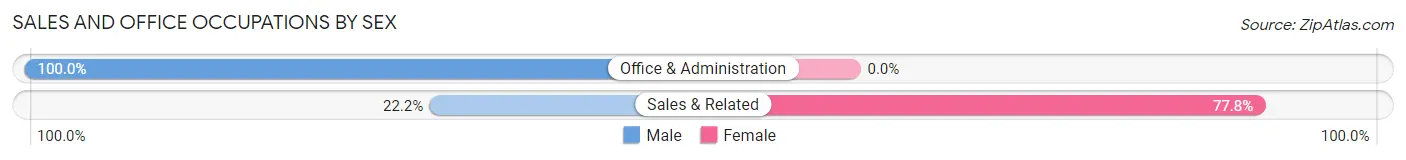
| Occupation | Male | Female |
| Sales & Related | 2 (22.2%) | 7 (77.8%) |
| Office & Administration | 16 (100.0%) | 0 (0.0%) |
| Total (Category) | 18 (72.0%) | 7 (28.0%) |
| Total (Overall) | 71 (62.8%) | 42 (37.2%) |
Natural Resources, Construction and Maintenance Occupations
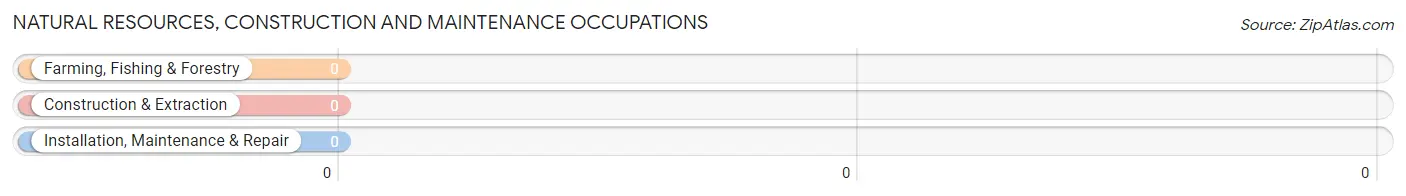
Natural Resources, Construction and Maintenance Occupations by Sex
| Occupation | Male | Female |
| Farming, Fishing & Forestry | 0 (0.0%) | 0 (0.0%) |
| Construction & Extraction | 0 (0.0%) | 0 (0.0%) |
| Installation, Maintenance & Repair | 0 (0.0%) | 0 (0.0%) |
| Total (Category) | 0 (0.0%) | 0 (0.0%) |
| Total (Overall) | 71 (62.8%) | 42 (37.2%) |
Production, Transportation and Moving Occupations
The most common Production, Transportation and Moving occupations in Leitersburg are , and Material Moving (18 | 15.9%).
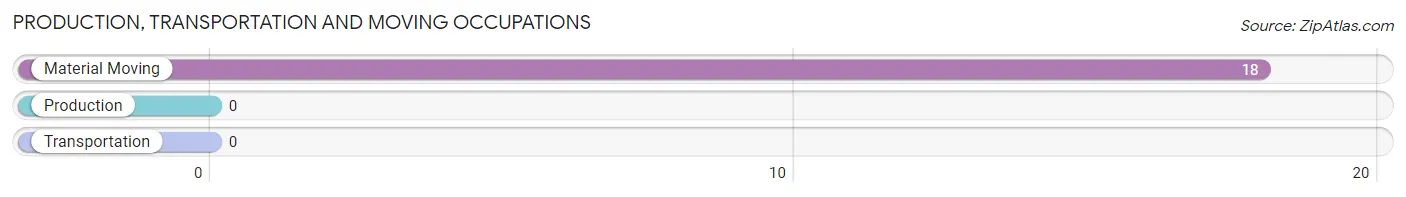
Production, Transportation and Moving Occupations by Sex
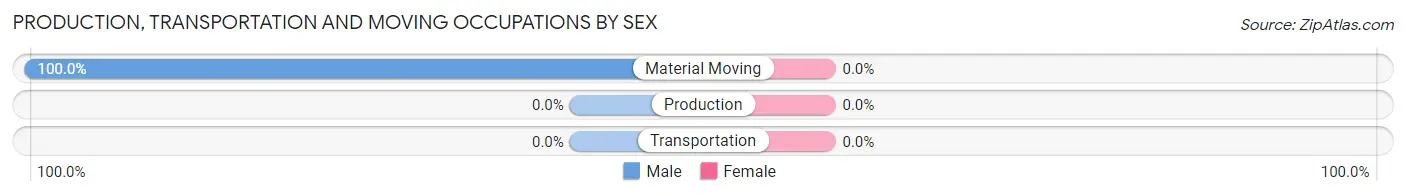
| Occupation | Male | Female |
| Production | 0 (0.0%) | 0 (0.0%) |
| Transportation | 0 (0.0%) | 0 (0.0%) |
| Material Moving | 18 (100.0%) | 0 (0.0%) |
| Total (Category) | 18 (100.0%) | 0 (0.0%) |
| Total (Overall) | 71 (62.8%) | 42 (37.2%) |
Employment Industries by Sex in Leitersburg
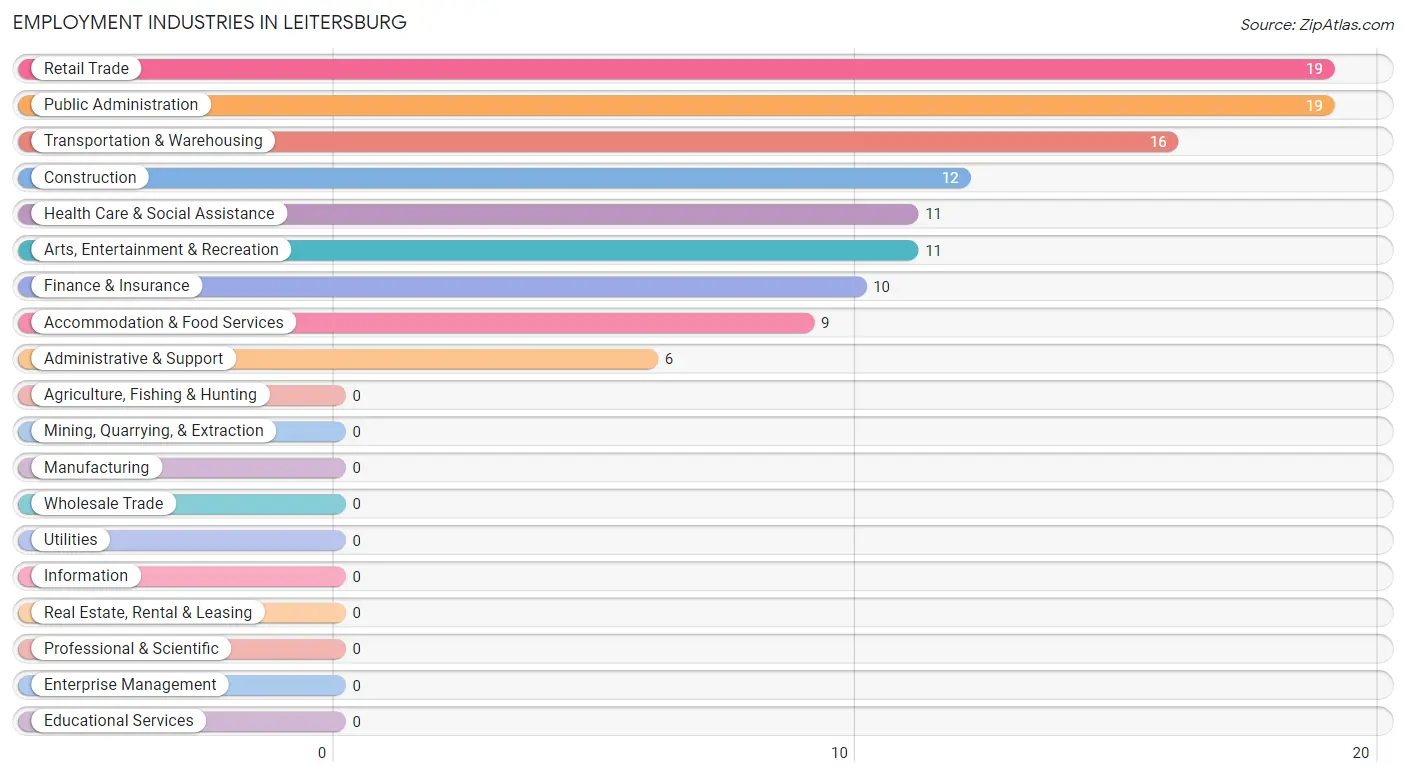
Employment Industries in Leitersburg
The major employment industries in Leitersburg include Retail Trade (19 | 16.8%), Public Administration (19 | 16.8%), Transportation & Warehousing (16 | 14.2%), Construction (12 | 10.6%), and Health Care & Social Assistance (11 | 9.7%).
Employment Industries by Sex in Leitersburg
The Leitersburg industries that see more men than women are Construction (100.0%), Transportation & Warehousing (100.0%), and Administrative & Support (100.0%), whereas the industries that tend to have a higher number of women are Finance & Insurance (100.0%), Accommodation & Food Services (100.0%), and Health Care & Social Assistance (72.7%).
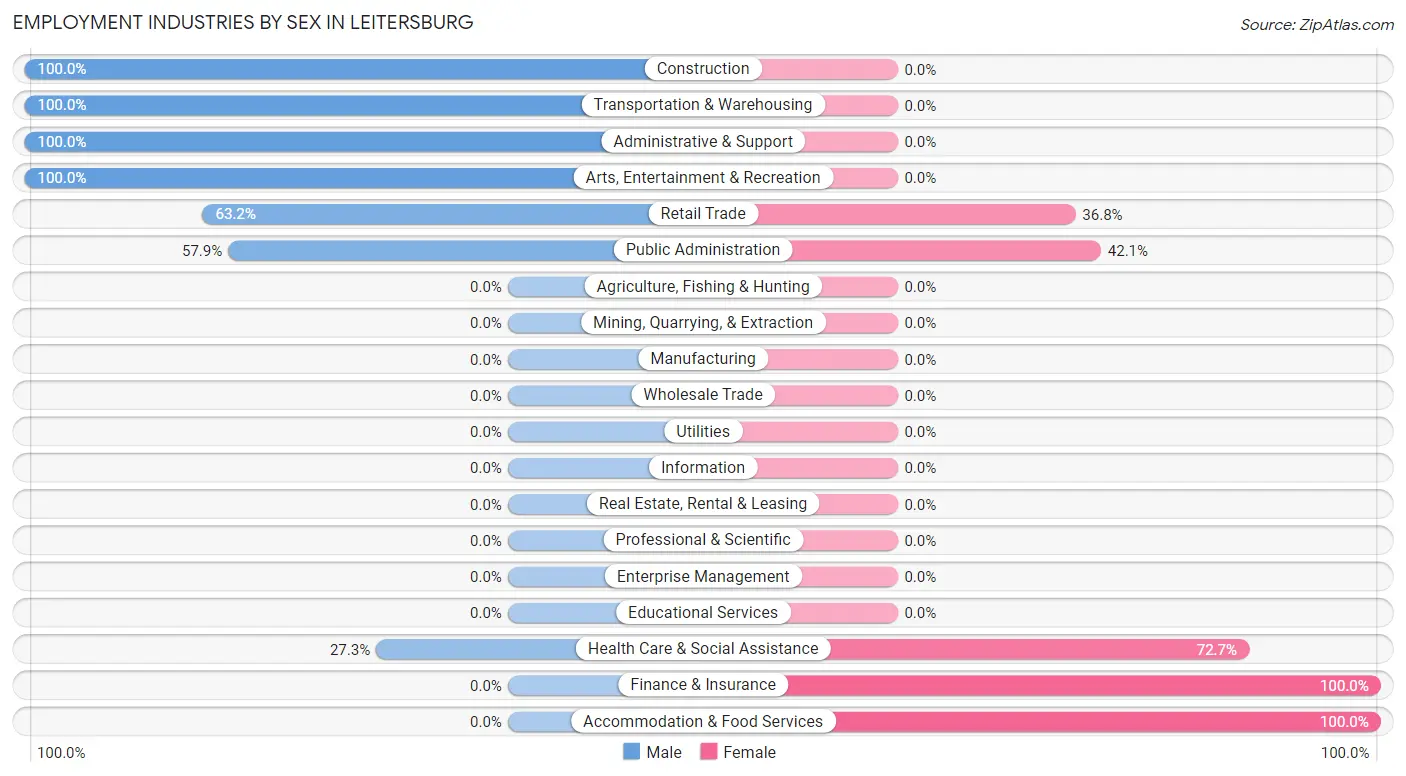
| Industry | Male | Female |
| Agriculture, Fishing & Hunting | 0 (0.0%) | 0 (0.0%) |
| Mining, Quarrying, & Extraction | 0 (0.0%) | 0 (0.0%) |
| Construction | 12 (100.0%) | 0 (0.0%) |
| Manufacturing | 0 (0.0%) | 0 (0.0%) |
| Wholesale Trade | 0 (0.0%) | 0 (0.0%) |
| Retail Trade | 12 (63.2%) | 7 (36.8%) |
| Transportation & Warehousing | 16 (100.0%) | 0 (0.0%) |
| Utilities | 0 (0.0%) | 0 (0.0%) |
| Information | 0 (0.0%) | 0 (0.0%) |
| Finance & Insurance | 0 (0.0%) | 10 (100.0%) |
| Real Estate, Rental & Leasing | 0 (0.0%) | 0 (0.0%) |
| Professional & Scientific | 0 (0.0%) | 0 (0.0%) |
| Enterprise Management | 0 (0.0%) | 0 (0.0%) |
| Administrative & Support | 6 (100.0%) | 0 (0.0%) |
| Educational Services | 0 (0.0%) | 0 (0.0%) |
| Health Care & Social Assistance | 3 (27.3%) | 8 (72.7%) |
| Arts, Entertainment & Recreation | 11 (100.0%) | 0 (0.0%) |
| Accommodation & Food Services | 0 (0.0%) | 9 (100.0%) |
| Public Administration | 11 (57.9%) | 8 (42.1%) |
| Total | 71 (62.8%) | 42 (37.2%) |
Education in Leitersburg
School Enrollment in Leitersburg
The most common levels of schooling among the 47 students in Leitersburg are middle school (23 | 48.9%), high school (11 | 23.4%), and kindergarten (7 | 14.9%).
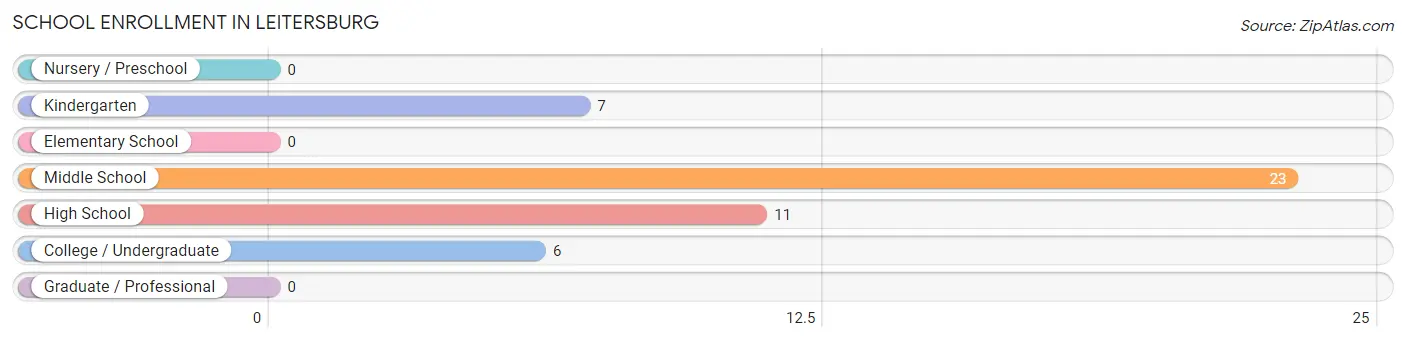
| School Level | # Students | % Students |
| Nursery / Preschool | 0 | 0.0% |
| Kindergarten | 7 | 14.9% |
| Elementary School | 0 | 0.0% |
| Middle School | 23 | 48.9% |
| High School | 11 | 23.4% |
| College / Undergraduate | 6 | 12.8% |
| Graduate / Professional | 0 | 0.0% |
| Total | 47 | 100.0% |
School Enrollment by Age by Funding Source in Leitersburg
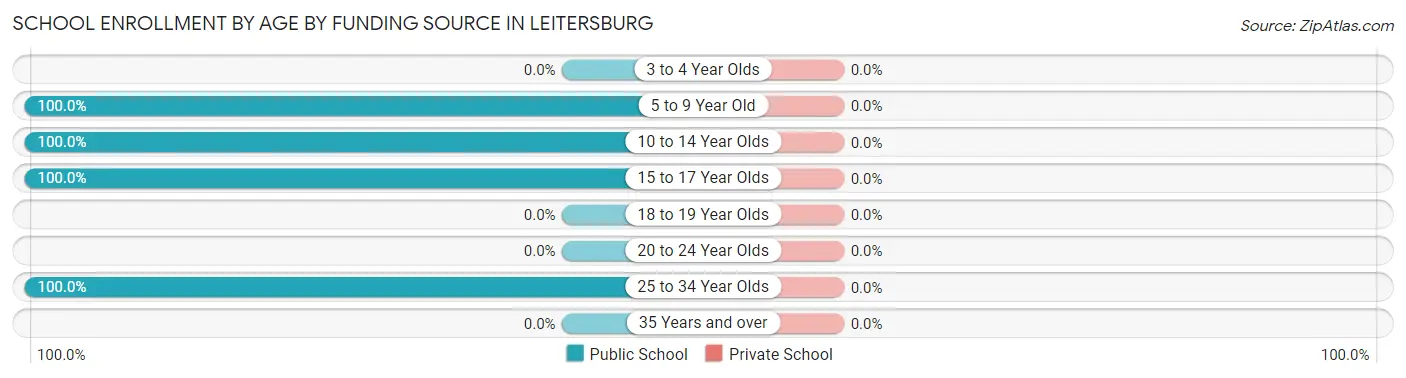
| Age Bracket | Public School | Private School |
| 3 to 4 Year Olds | 0 (0.0%) | 0 (0.0%) |
| 5 to 9 Year Old | 7 (100.0%) | 0 (0.0%) |
| 10 to 14 Year Olds | 23 (100.0%) | 0 (0.0%) |
| 15 to 17 Year Olds | 11 (100.0%) | 0 (0.0%) |
| 18 to 19 Year Olds | 0 (0.0%) | 0 (0.0%) |
| 20 to 24 Year Olds | 0 (0.0%) | 0 (0.0%) |
| 25 to 34 Year Olds | 6 (100.0%) | 0 (0.0%) |
| 35 Years and over | 0 (0.0%) | 0 (0.0%) |
| Total | 47 (100.0%) | 0 (0.0%) |
Educational Attainment by Field of Study in Leitersburg
Education (26 | 47.3%), bio, nature & agricultural (11 | 20.0%), liberal arts & history (10 | 18.2%), and science & technology (8 | 14.5%) are the most common fields of study among 55 individuals in Leitersburg who have obtained a bachelor's degree or higher.
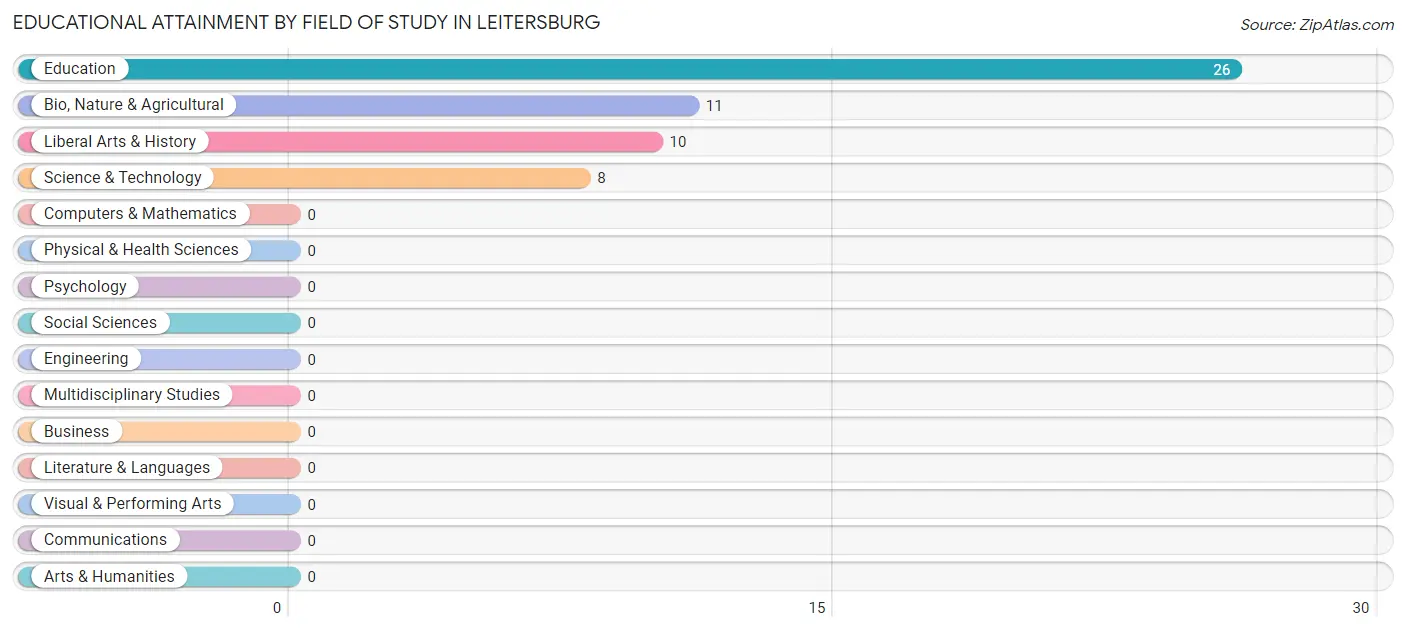
| Field of Study | # Graduates | % Graduates |
| Computers & Mathematics | 0 | 0.0% |
| Bio, Nature & Agricultural | 11 | 20.0% |
| Physical & Health Sciences | 0 | 0.0% |
| Psychology | 0 | 0.0% |
| Social Sciences | 0 | 0.0% |
| Engineering | 0 | 0.0% |
| Multidisciplinary Studies | 0 | 0.0% |
| Science & Technology | 8 | 14.5% |
| Business | 0 | 0.0% |
| Education | 26 | 47.3% |
| Literature & Languages | 0 | 0.0% |
| Liberal Arts & History | 10 | 18.2% |
| Visual & Performing Arts | 0 | 0.0% |
| Communications | 0 | 0.0% |
| Arts & Humanities | 0 | 0.0% |
| Total | 55 | 100.0% |
Transportation & Commute in Leitersburg
Vehicle Availability by Sex in Leitersburg
The most prevalent vehicle ownership categories in Leitersburg are males with 4 vehicles (32, accounting for 50.0%) and females with 4 vehicles (10, making up 76.2%).
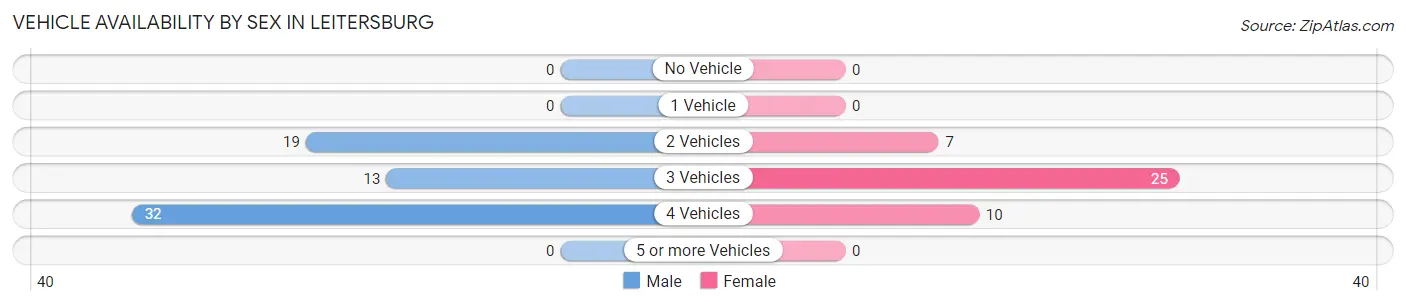
| Vehicles Available | Male | Female |
| No Vehicle | 0 (0.0%) | 0 (0.0%) |
| 1 Vehicle | 0 (0.0%) | 0 (0.0%) |
| 2 Vehicles | 19 (29.7%) | 7 (16.7%) |
| 3 Vehicles | 13 (20.3%) | 25 (59.5%) |
| 4 Vehicles | 32 (50.0%) | 10 (23.8%) |
| 5 or more Vehicles | 0 (0.0%) | 0 (0.0%) |
| Total | 64 (100.0%) | 42 (100.0%) |
Commute Time in Leitersburg
The most frequently occuring commute durations in Leitersburg are 15 to 19 minutes (26 commuters, 26.5%), 20 to 24 minutes (26 commuters, 26.5%), and 30 to 34 minutes (15 commuters, 15.3%).
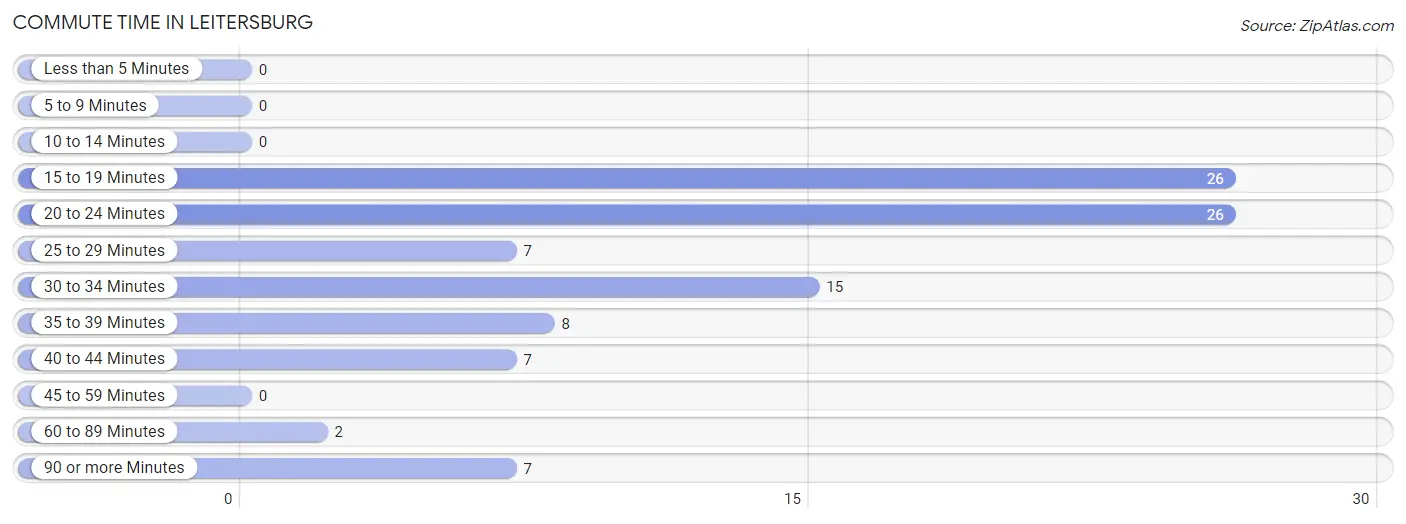
| Commute Time | # Commuters | % Commuters |
| Less than 5 Minutes | 0 | 0.0% |
| 5 to 9 Minutes | 0 | 0.0% |
| 10 to 14 Minutes | 0 | 0.0% |
| 15 to 19 Minutes | 26 | 26.5% |
| 20 to 24 Minutes | 26 | 26.5% |
| 25 to 29 Minutes | 7 | 7.1% |
| 30 to 34 Minutes | 15 | 15.3% |
| 35 to 39 Minutes | 8 | 8.2% |
| 40 to 44 Minutes | 7 | 7.1% |
| 45 to 59 Minutes | 0 | 0.0% |
| 60 to 89 Minutes | 2 | 2.0% |
| 90 or more Minutes | 7 | 7.1% |
Commute Time by Sex in Leitersburg
The most common commute times in Leitersburg are 15 to 19 minutes (26 commuters, 39.4%) for males and 20 to 24 minutes (17 commuters, 53.1%) for females.
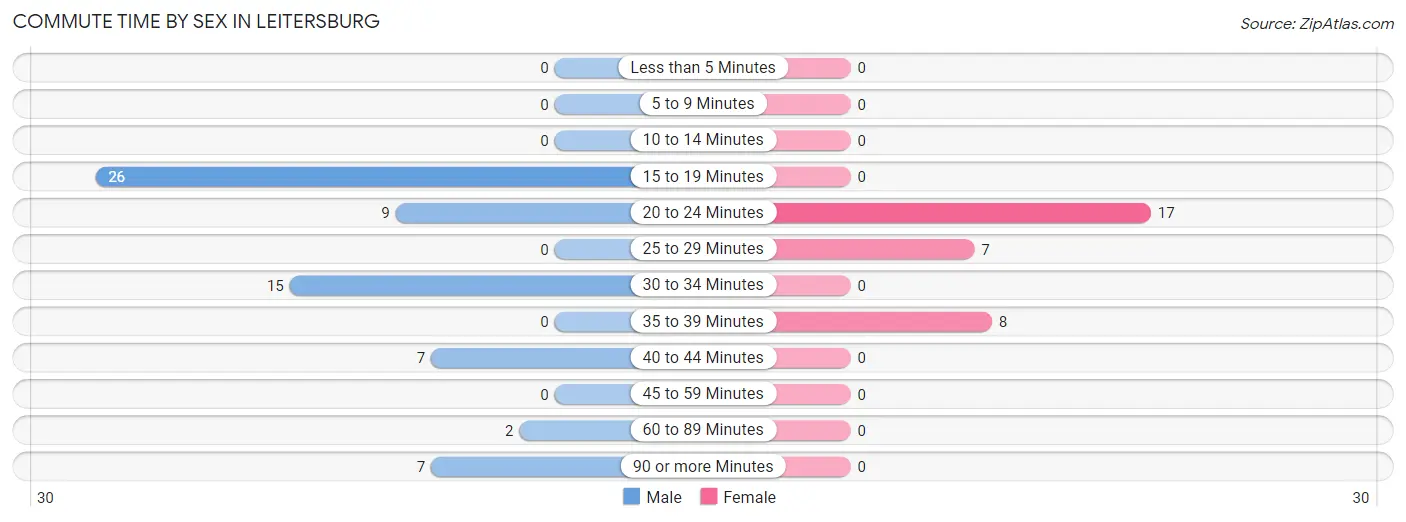
| Commute Time | Male | Female |
| Less than 5 Minutes | 0 (0.0%) | 0 (0.0%) |
| 5 to 9 Minutes | 0 (0.0%) | 0 (0.0%) |
| 10 to 14 Minutes | 0 (0.0%) | 0 (0.0%) |
| 15 to 19 Minutes | 26 (39.4%) | 0 (0.0%) |
| 20 to 24 Minutes | 9 (13.6%) | 17 (53.1%) |
| 25 to 29 Minutes | 0 (0.0%) | 7 (21.9%) |
| 30 to 34 Minutes | 15 (22.7%) | 0 (0.0%) |
| 35 to 39 Minutes | 0 (0.0%) | 8 (25.0%) |
| 40 to 44 Minutes | 7 (10.6%) | 0 (0.0%) |
| 45 to 59 Minutes | 0 (0.0%) | 0 (0.0%) |
| 60 to 89 Minutes | 2 (3.0%) | 0 (0.0%) |
| 90 or more Minutes | 7 (10.6%) | 0 (0.0%) |
Time of Departure to Work by Sex in Leitersburg
The most frequent times of departure to work in Leitersburg are 7:00 AM to 7:29 AM (25, 37.9%) for males and 6:30 AM to 6:59 AM (17, 53.1%) for females.
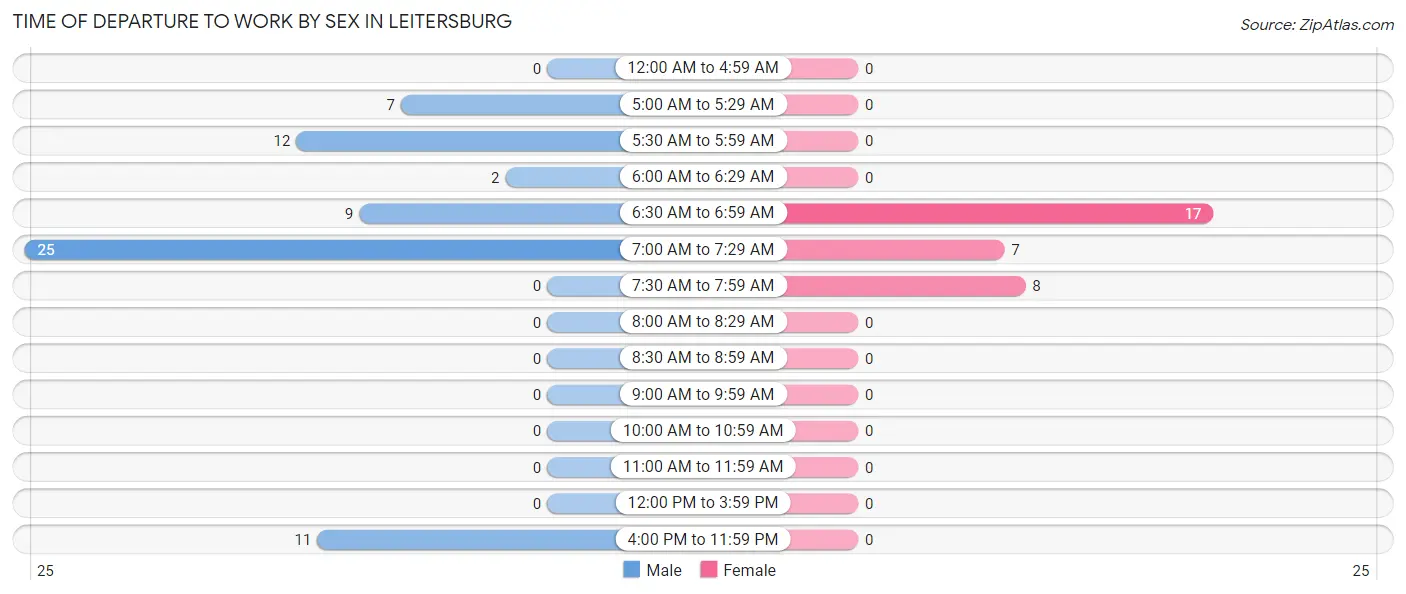
| Time of Departure | Male | Female |
| 12:00 AM to 4:59 AM | 0 (0.0%) | 0 (0.0%) |
| 5:00 AM to 5:29 AM | 7 (10.6%) | 0 (0.0%) |
| 5:30 AM to 5:59 AM | 12 (18.2%) | 0 (0.0%) |
| 6:00 AM to 6:29 AM | 2 (3.0%) | 0 (0.0%) |
| 6:30 AM to 6:59 AM | 9 (13.6%) | 17 (53.1%) |
| 7:00 AM to 7:29 AM | 25 (37.9%) | 7 (21.9%) |
| 7:30 AM to 7:59 AM | 0 (0.0%) | 8 (25.0%) |
| 8:00 AM to 8:29 AM | 0 (0.0%) | 0 (0.0%) |
| 8:30 AM to 8:59 AM | 0 (0.0%) | 0 (0.0%) |
| 9:00 AM to 9:59 AM | 0 (0.0%) | 0 (0.0%) |
| 10:00 AM to 10:59 AM | 0 (0.0%) | 0 (0.0%) |
| 11:00 AM to 11:59 AM | 0 (0.0%) | 0 (0.0%) |
| 12:00 PM to 3:59 PM | 0 (0.0%) | 0 (0.0%) |
| 4:00 PM to 11:59 PM | 11 (16.7%) | 0 (0.0%) |
| Total | 66 (100.0%) | 32 (100.0%) |
Housing Occupancy in Leitersburg
Occupancy by Ownership in Leitersburg
Of the total 206 dwellings in Leitersburg, owner-occupied units account for 161 (78.2%), while renter-occupied units make up 45 (21.8%).
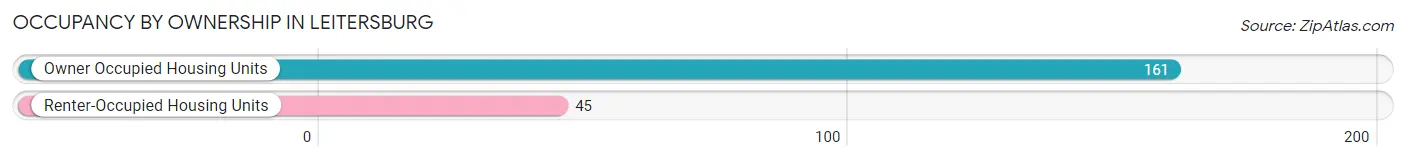
| Occupancy | # Housing Units | % Housing Units |
| Owner Occupied Housing Units | 161 | 78.2% |
| Renter-Occupied Housing Units | 45 | 21.8% |
| Total Occupied Housing Units | 206 | 100.0% |
Occupancy by Household Size in Leitersburg
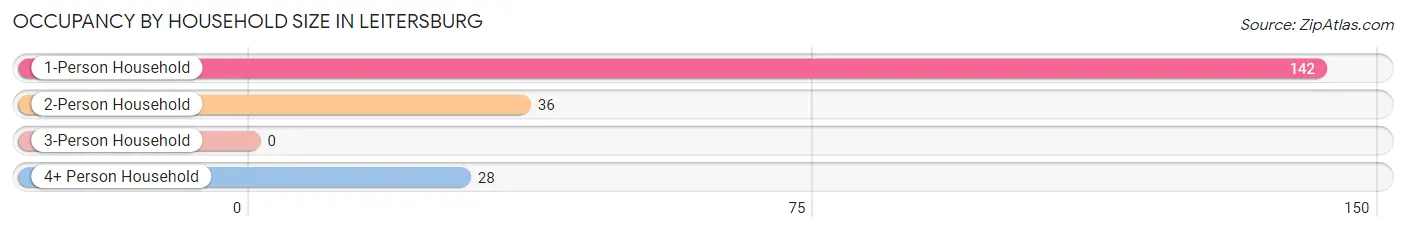
| Household Size | # Housing Units | % Housing Units |
| 1-Person Household | 142 | 68.9% |
| 2-Person Household | 36 | 17.5% |
| 3-Person Household | 0 | 0.0% |
| 4+ Person Household | 28 | 13.6% |
| Total Housing Units | 206 | 100.0% |
Occupancy by Ownership by Household Size in Leitersburg
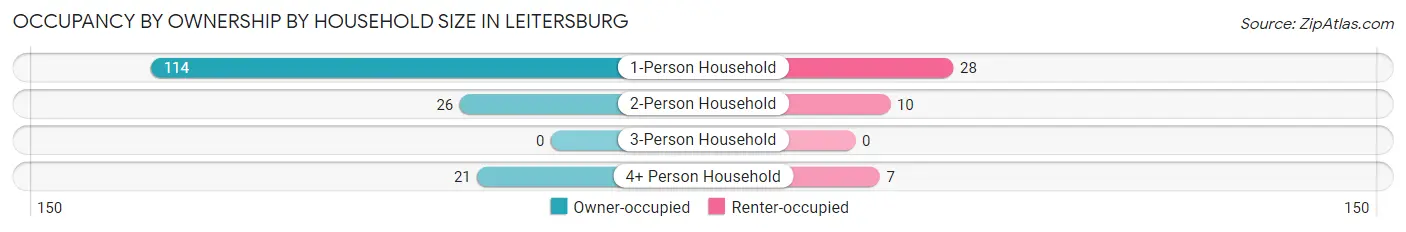
| Household Size | Owner-occupied | Renter-occupied |
| 1-Person Household | 114 (80.3%) | 28 (19.7%) |
| 2-Person Household | 26 (72.2%) | 10 (27.8%) |
| 3-Person Household | 0 (0.0%) | 0 (0.0%) |
| 4+ Person Household | 21 (75.0%) | 7 (25.0%) |
| Total Housing Units | 161 (78.2%) | 45 (21.8%) |
Occupancy by Educational Attainment in Leitersburg
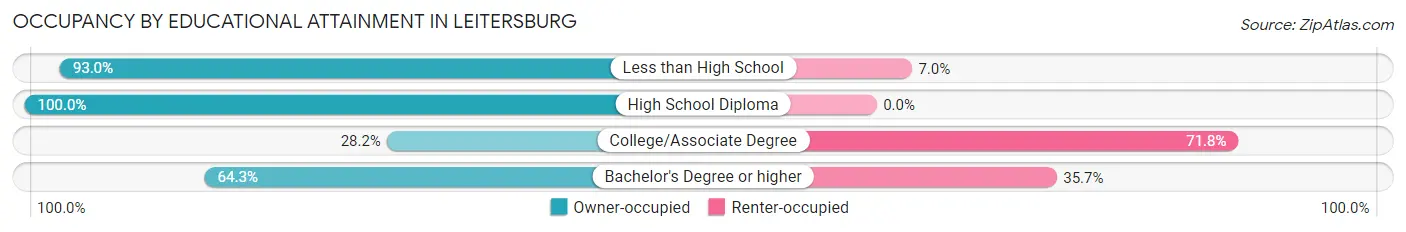
| Household Size | Owner-occupied | Renter-occupied |
| Less than High School | 93 (93.0%) | 7 (7.0%) |
| High School Diploma | 39 (100.0%) | 0 (0.0%) |
| College/Associate Degree | 11 (28.2%) | 28 (71.8%) |
| Bachelor's Degree or higher | 18 (64.3%) | 10 (35.7%) |
Occupancy by Age of Householder in Leitersburg
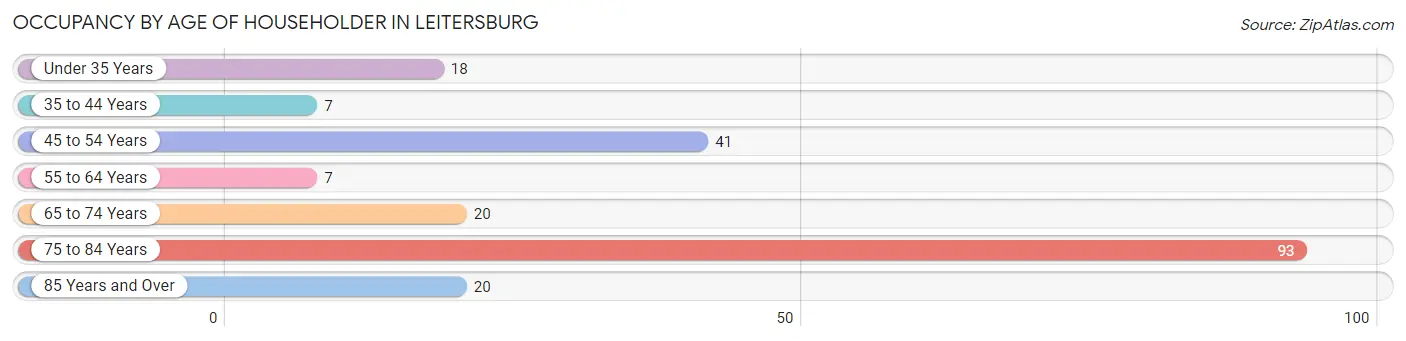
| Age Bracket | # Households | % Households |
| Under 35 Years | 18 | 8.7% |
| 35 to 44 Years | 7 | 3.4% |
| 45 to 54 Years | 41 | 19.9% |
| 55 to 64 Years | 7 | 3.4% |
| 65 to 74 Years | 20 | 9.7% |
| 75 to 84 Years | 93 | 45.2% |
| 85 Years and Over | 20 | 9.7% |
| Total | 206 | 100.0% |
Housing Finances in Leitersburg
Median Income by Occupancy in Leitersburg
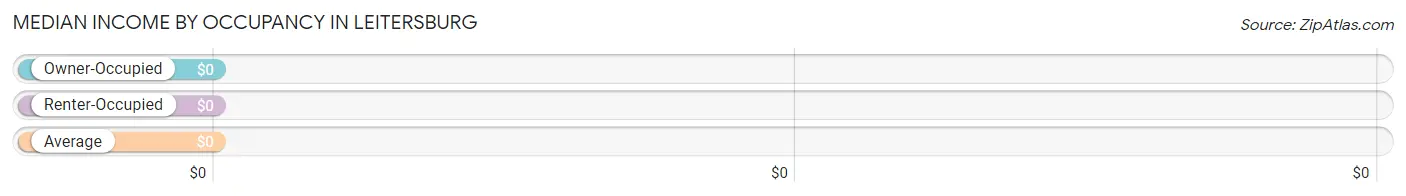
| Occupancy Type | # Households | Median Income |
| Owner-Occupied | 161 (78.2%) | $0 |
| Renter-Occupied | 45 (21.8%) | $0 |
| Average | 206 (100.0%) | $0 |
Occupancy by Householder Income Bracket in Leitersburg
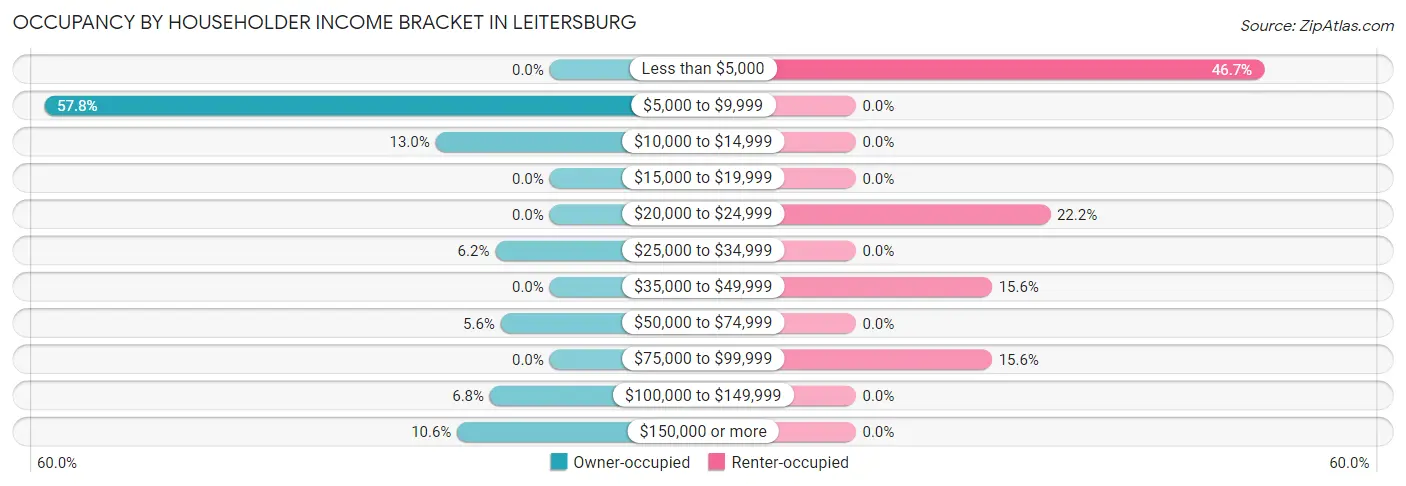
| Income Bracket | Owner-occupied | Renter-occupied |
| Less than $5,000 | 0 (0.0%) | 21 (46.7%) |
| $5,000 to $9,999 | 93 (57.8%) | 0 (0.0%) |
| $10,000 to $14,999 | 21 (13.0%) | 0 (0.0%) |
| $15,000 to $19,999 | 0 (0.0%) | 0 (0.0%) |
| $20,000 to $24,999 | 0 (0.0%) | 10 (22.2%) |
| $25,000 to $34,999 | 10 (6.2%) | 0 (0.0%) |
| $35,000 to $49,999 | 0 (0.0%) | 7 (15.6%) |
| $50,000 to $74,999 | 9 (5.6%) | 0 (0.0%) |
| $75,000 to $99,999 | 0 (0.0%) | 7 (15.6%) |
| $100,000 to $149,999 | 11 (6.8%) | 0 (0.0%) |
| $150,000 or more | 17 (10.6%) | 0 (0.0%) |
| Total | 161 (100.0%) | 45 (100.0%) |
Monthly Housing Cost Tiers in Leitersburg
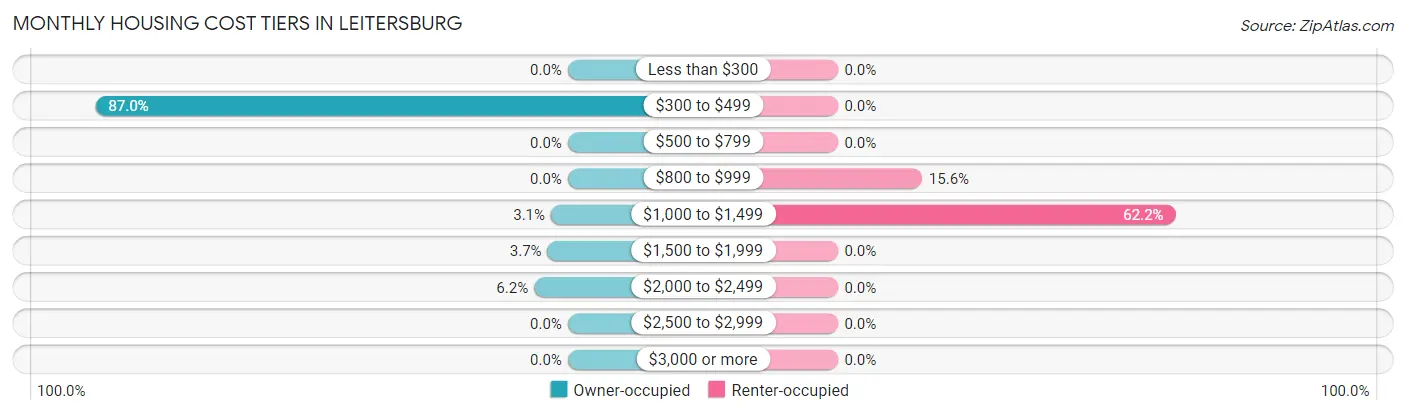
| Monthly Cost | Owner-occupied | Renter-occupied |
| Less than $300 | 0 (0.0%) | 0 (0.0%) |
| $300 to $499 | 140 (87.0%) | 0 (0.0%) |
| $500 to $799 | 0 (0.0%) | 0 (0.0%) |
| $800 to $999 | 0 (0.0%) | 7 (15.6%) |
| $1,000 to $1,499 | 5 (3.1%) | 28 (62.2%) |
| $1,500 to $1,999 | 6 (3.7%) | 0 (0.0%) |
| $2,000 to $2,499 | 10 (6.2%) | 0 (0.0%) |
| $2,500 to $2,999 | 0 (0.0%) | 0 (0.0%) |
| $3,000 or more | 0 (0.0%) | 0 (0.0%) |
| Total | 161 (100.0%) | 45 (100.0%) |
Physical Housing Characteristics in Leitersburg
Housing Structures in Leitersburg
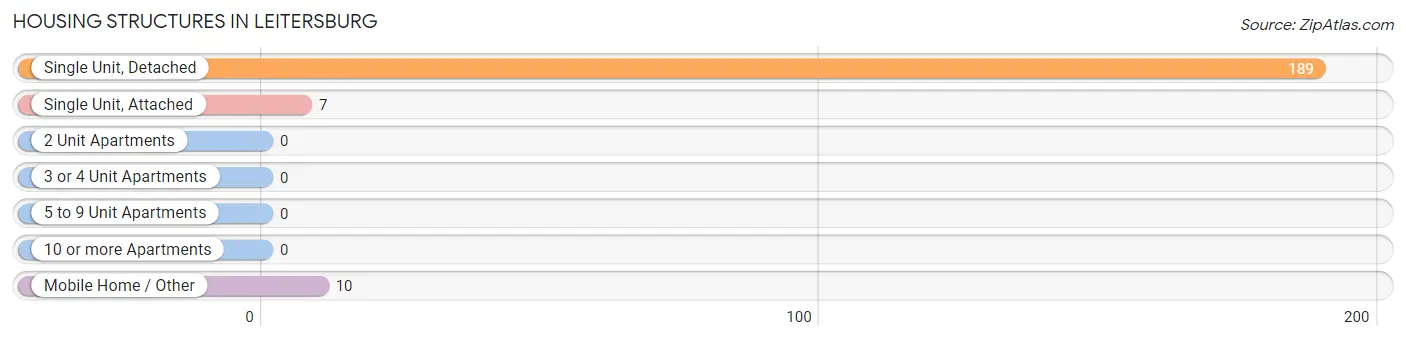
| Structure Type | # Housing Units | % Housing Units |
| Single Unit, Detached | 189 | 91.7% |
| Single Unit, Attached | 7 | 3.4% |
| 2 Unit Apartments | 0 | 0.0% |
| 3 or 4 Unit Apartments | 0 | 0.0% |
| 5 to 9 Unit Apartments | 0 | 0.0% |
| 10 or more Apartments | 0 | 0.0% |
| Mobile Home / Other | 10 | 4.9% |
| Total | 206 | 100.0% |
Housing Structures by Occupancy in Leitersburg
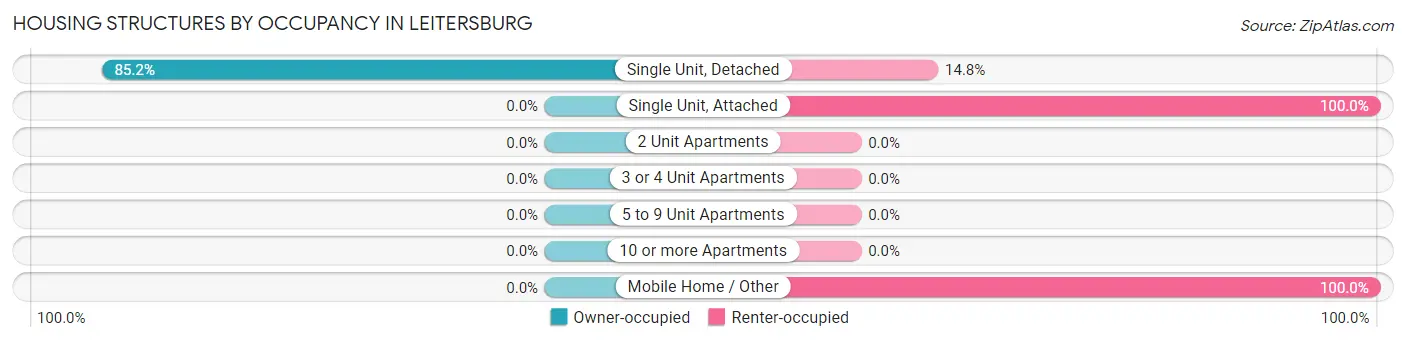
| Structure Type | Owner-occupied | Renter-occupied |
| Single Unit, Detached | 161 (85.2%) | 28 (14.8%) |
| Single Unit, Attached | 0 (0.0%) | 7 (100.0%) |
| 2 Unit Apartments | 0 (0.0%) | 0 (0.0%) |
| 3 or 4 Unit Apartments | 0 (0.0%) | 0 (0.0%) |
| 5 to 9 Unit Apartments | 0 (0.0%) | 0 (0.0%) |
| 10 or more Apartments | 0 (0.0%) | 0 (0.0%) |
| Mobile Home / Other | 0 (0.0%) | 10 (100.0%) |
| Total | 161 (78.2%) | 45 (21.8%) |
Housing Structures by Number of Rooms in Leitersburg
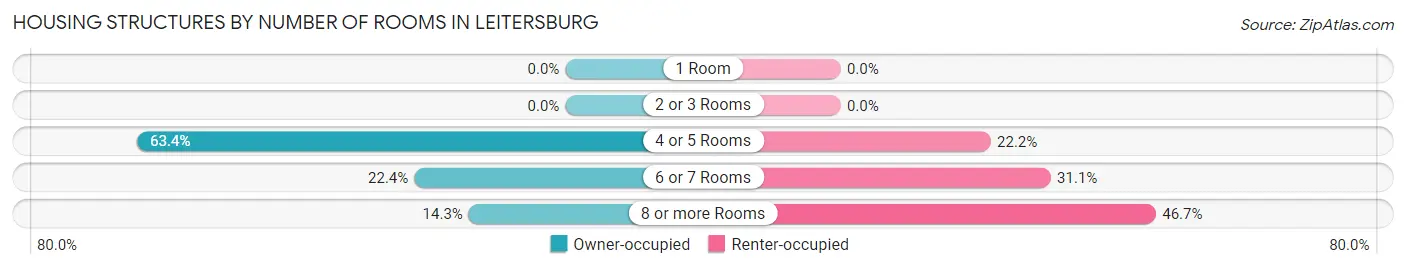
| Number of Rooms | Owner-occupied | Renter-occupied |
| 1 Room | 0 (0.0%) | 0 (0.0%) |
| 2 or 3 Rooms | 0 (0.0%) | 0 (0.0%) |
| 4 or 5 Rooms | 102 (63.3%) | 10 (22.2%) |
| 6 or 7 Rooms | 36 (22.4%) | 14 (31.1%) |
| 8 or more Rooms | 23 (14.3%) | 21 (46.7%) |
| Total | 161 (100.0%) | 45 (100.0%) |
Housing Structure by Heating Type in Leitersburg
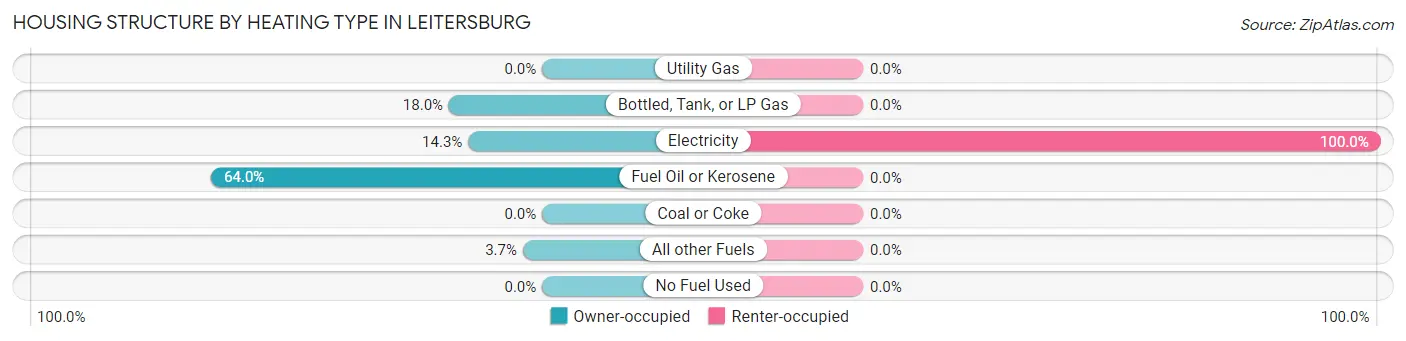
| Heating Type | Owner-occupied | Renter-occupied |
| Utility Gas | 0 (0.0%) | 0 (0.0%) |
| Bottled, Tank, or LP Gas | 29 (18.0%) | 0 (0.0%) |
| Electricity | 23 (14.3%) | 45 (100.0%) |
| Fuel Oil or Kerosene | 103 (64.0%) | 0 (0.0%) |
| Coal or Coke | 0 (0.0%) | 0 (0.0%) |
| All other Fuels | 6 (3.7%) | 0 (0.0%) |
| No Fuel Used | 0 (0.0%) | 0 (0.0%) |
| Total | 161 (100.0%) | 45 (100.0%) |
Household Vehicle Usage in Leitersburg
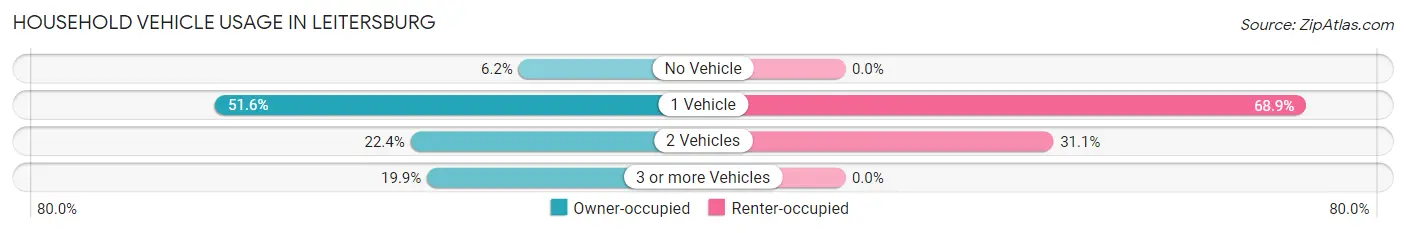
| Vehicles per Household | Owner-occupied | Renter-occupied |
| No Vehicle | 10 (6.2%) | 0 (0.0%) |
| 1 Vehicle | 83 (51.5%) | 31 (68.9%) |
| 2 Vehicles | 36 (22.4%) | 14 (31.1%) |
| 3 or more Vehicles | 32 (19.9%) | 0 (0.0%) |
| Total | 161 (100.0%) | 45 (100.0%) |
Real Estate & Mortgages in Leitersburg
Real Estate and Mortgage Overview in Leitersburg
| Characteristic | Without Mortgage | With Mortgage |
| Housing Units | 131 | 30 |
| Median Property Value | $270,700 | $0 |
| Median Household Income | $6,973 | $10 |
| Monthly Housing Costs | $437 | $0 |
| Real Estate Taxes | $2,394 | $0 |
Property Value by Mortgage Status in Leitersburg
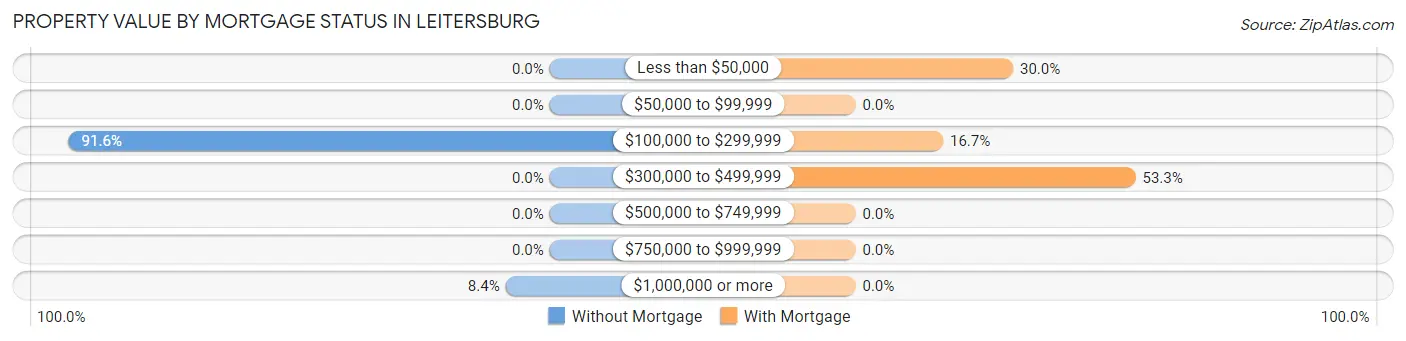
| Property Value | Without Mortgage | With Mortgage |
| Less than $50,000 | 0 (0.0%) | 9 (30.0%) |
| $50,000 to $99,999 | 0 (0.0%) | 0 (0.0%) |
| $100,000 to $299,999 | 120 (91.6%) | 5 (16.7%) |
| $300,000 to $499,999 | 0 (0.0%) | 16 (53.3%) |
| $500,000 to $749,999 | 0 (0.0%) | 0 (0.0%) |
| $750,000 to $999,999 | 0 (0.0%) | 0 (0.0%) |
| $1,000,000 or more | 11 (8.4%) | 0 (0.0%) |
| Total | 131 (100.0%) | 30 (100.0%) |
Household Income by Mortgage Status in Leitersburg
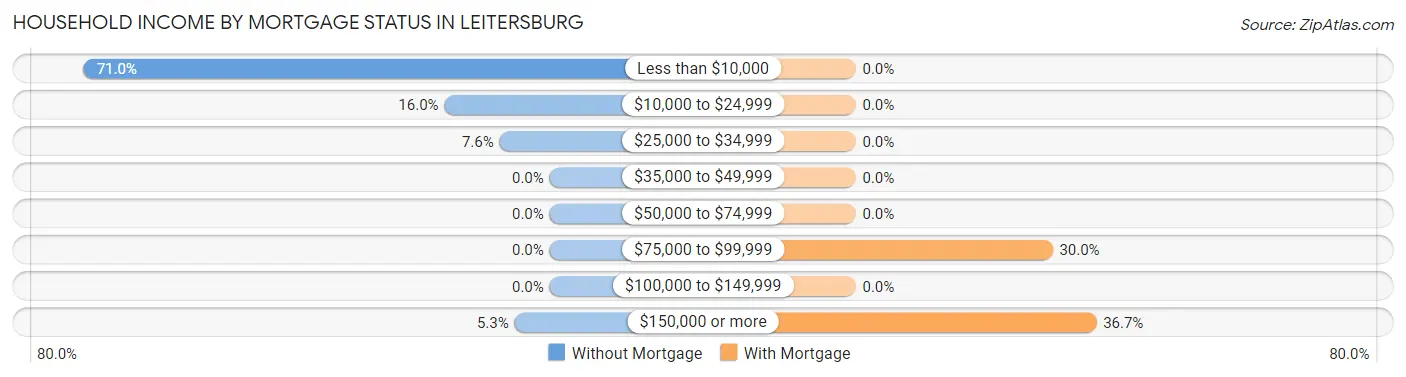
| Household Income | Without Mortgage | With Mortgage |
| Less than $10,000 | 93 (71.0%) | 0 (0.0%) |
| $10,000 to $24,999 | 21 (16.0%) | 0 (0.0%) |
| $25,000 to $34,999 | 10 (7.6%) | 0 (0.0%) |
| $35,000 to $49,999 | 0 (0.0%) | 0 (0.0%) |
| $50,000 to $74,999 | 0 (0.0%) | 0 (0.0%) |
| $75,000 to $99,999 | 0 (0.0%) | 9 (30.0%) |
| $100,000 to $149,999 | 0 (0.0%) | 0 (0.0%) |
| $150,000 or more | 7 (5.3%) | 11 (36.7%) |
| Total | 131 (100.0%) | 30 (100.0%) |
Property Value to Household Income Ratio in Leitersburg
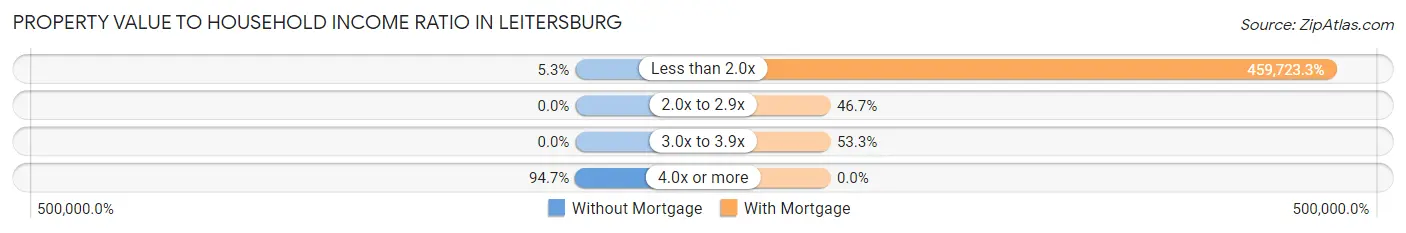
| Value-to-Income Ratio | Without Mortgage | With Mortgage |
| Less than 2.0x | 7 (5.3%) | 137,917 (459,723.3%) |
| 2.0x to 2.9x | 0 (0.0%) | 14 (46.7%) |
| 3.0x to 3.9x | 0 (0.0%) | 16 (53.3%) |
| 4.0x or more | 124 (94.7%) | 0 (0.0%) |
| Total | 131 (100.0%) | 30 (100.0%) |
Real Estate Taxes by Mortgage Status in Leitersburg
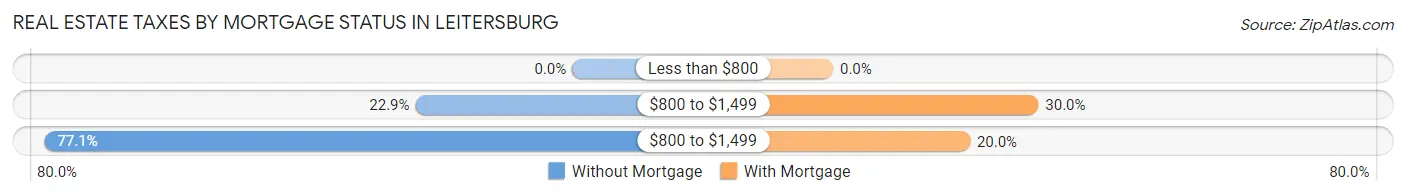
| Property Taxes | Without Mortgage | With Mortgage |
| Less than $800 | 0 (0.0%) | 0 (0.0%) |
| $800 to $1,499 | 30 (22.9%) | 9 (30.0%) |
| $800 to $1,499 | 101 (77.1%) | 6 (20.0%) |
| Total | 131 (100.0%) | 30 (100.0%) |
Health & Disability in Leitersburg
Health Insurance Coverage by Age in Leitersburg
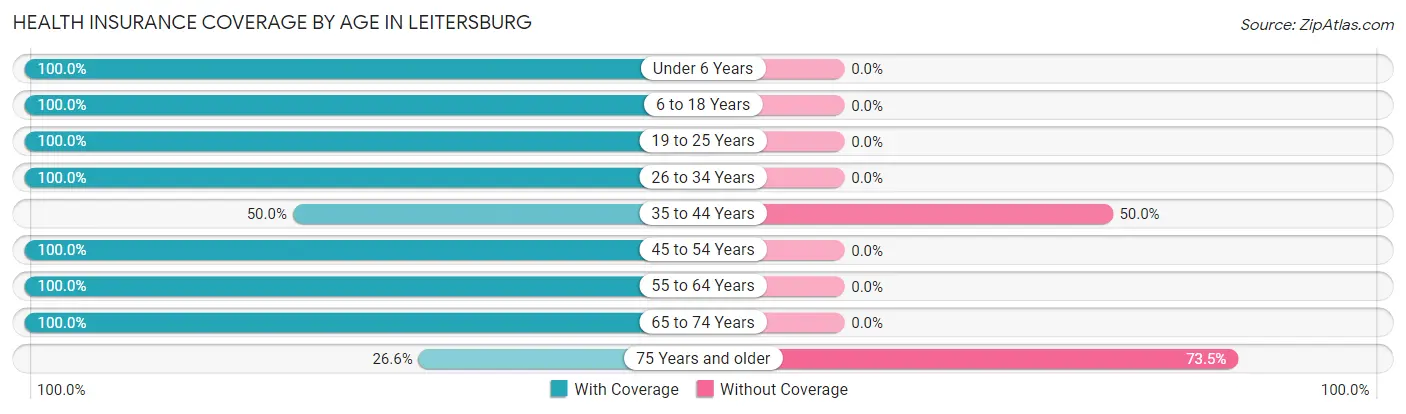
| Age Bracket | With Coverage | Without Coverage |
| Under 6 Years | 34 (100.0%) | 0 (0.0%) |
| 6 to 18 Years | 34 (100.0%) | 0 (0.0%) |
| 19 to 25 Years | 19 (100.0%) | 0 (0.0%) |
| 26 to 34 Years | 29 (100.0%) | 0 (0.0%) |
| 35 to 44 Years | 7 (50.0%) | 7 (50.0%) |
| 45 to 54 Years | 56 (100.0%) | 0 (0.0%) |
| 55 to 64 Years | 15 (100.0%) | 0 (0.0%) |
| 65 to 74 Years | 41 (100.0%) | 0 (0.0%) |
| 75 Years and older | 30 (26.6%) | 83 (73.5%) |
| Total | 265 (74.7%) | 90 (25.4%) |
Health Insurance Coverage by Citizenship Status in Leitersburg
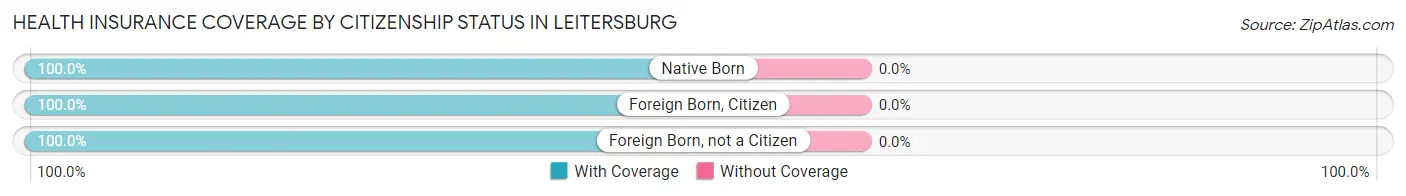
| Citizenship Status | With Coverage | Without Coverage |
| Native Born | 34 (100.0%) | 0 (0.0%) |
| Foreign Born, Citizen | 34 (100.0%) | 0 (0.0%) |
| Foreign Born, not a Citizen | 19 (100.0%) | 0 (0.0%) |
Health Insurance Coverage by Household Income in Leitersburg
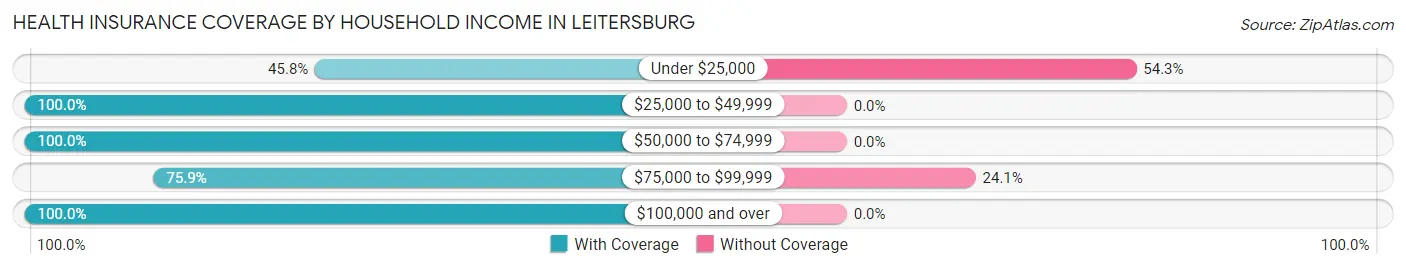
| Household Income | With Coverage | Without Coverage |
| Under $25,000 | 70 (45.8%) | 83 (54.2%) |
| $25,000 to $49,999 | 28 (100.0%) | 0 (0.0%) |
| $50,000 to $74,999 | 19 (100.0%) | 0 (0.0%) |
| $75,000 to $99,999 | 22 (75.9%) | 7 (24.1%) |
| $100,000 and over | 116 (100.0%) | 0 (0.0%) |
Public vs Private Health Insurance Coverage by Age in Leitersburg
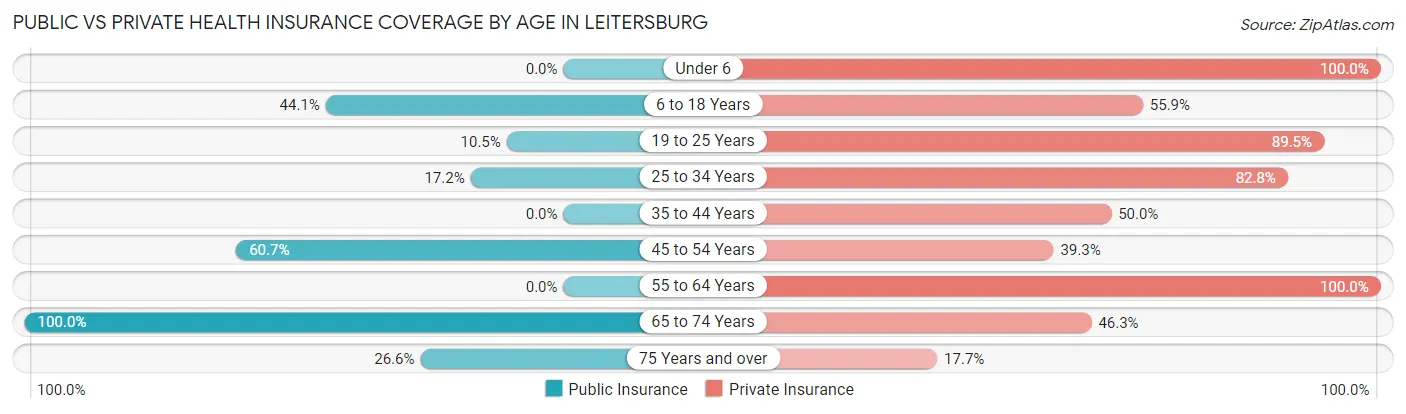
| Age Bracket | Public Insurance | Private Insurance |
| Under 6 | 0 (0.0%) | 34 (100.0%) |
| 6 to 18 Years | 15 (44.1%) | 19 (55.9%) |
| 19 to 25 Years | 2 (10.5%) | 17 (89.5%) |
| 25 to 34 Years | 5 (17.2%) | 24 (82.8%) |
| 35 to 44 Years | 0 (0.0%) | 7 (50.0%) |
| 45 to 54 Years | 34 (60.7%) | 22 (39.3%) |
| 55 to 64 Years | 0 (0.0%) | 15 (100.0%) |
| 65 to 74 Years | 41 (100.0%) | 19 (46.3%) |
| 75 Years and over | 30 (26.6%) | 20 (17.7%) |
| Total | 127 (35.8%) | 177 (49.9%) |
Disability Status by Sex by Age in Leitersburg
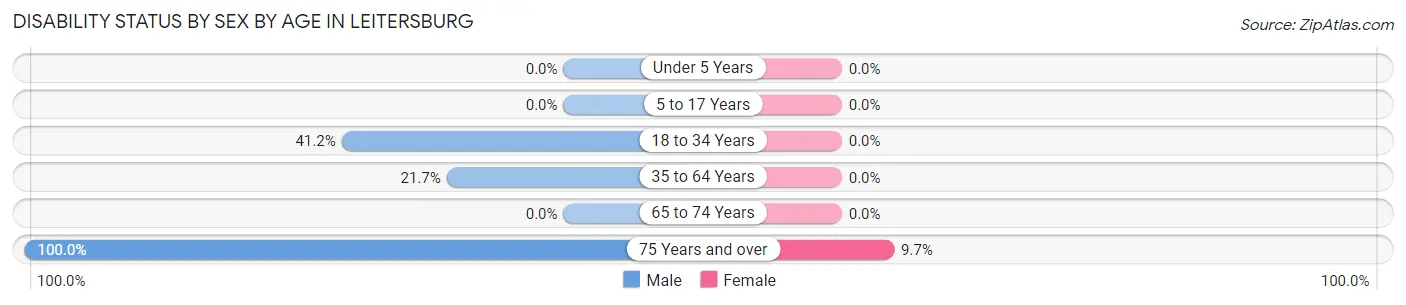
| Age Bracket | Male | Female |
| Under 5 Years | 0 (0.0%) | 0 (0.0%) |
| 5 to 17 Years | 0 (0.0%) | 0 (0.0%) |
| 18 to 34 Years | 14 (41.2%) | 0 (0.0%) |
| 35 to 64 Years | 13 (21.7%) | 0 (0.0%) |
| 65 to 74 Years | 0 (0.0%) | 0 (0.0%) |
| 75 Years and over | 10 (100.0%) | 10 (9.7%) |
Disability Class by Sex by Age in Leitersburg
Disability Class: Hearing Difficulty
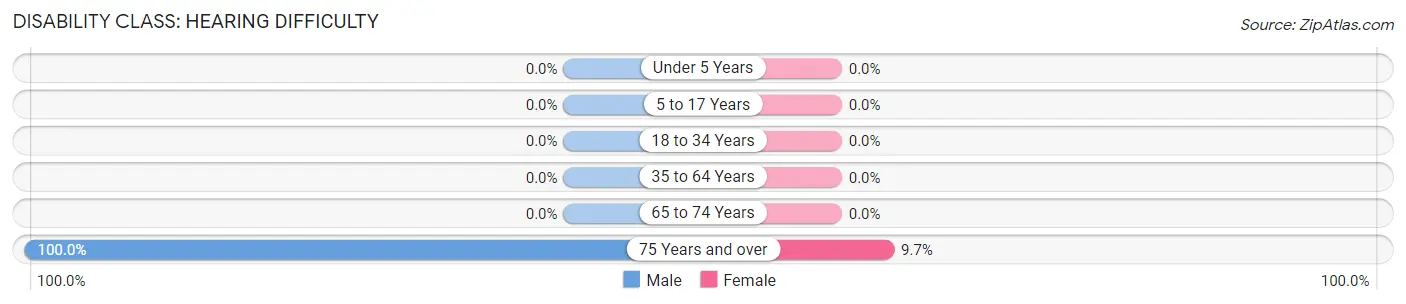
| Age Bracket | Male | Female |
| Under 5 Years | 0 (0.0%) | 0 (0.0%) |
| 5 to 17 Years | 0 (0.0%) | 0 (0.0%) |
| 18 to 34 Years | 0 (0.0%) | 0 (0.0%) |
| 35 to 64 Years | 0 (0.0%) | 0 (0.0%) |
| 65 to 74 Years | 0 (0.0%) | 0 (0.0%) |
| 75 Years and over | 10 (100.0%) | 10 (9.7%) |
Disability Class: Vision Difficulty
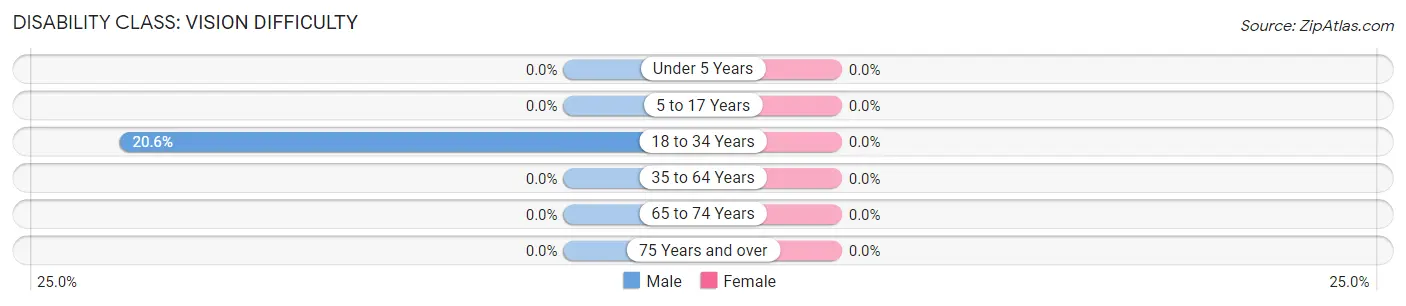
| Age Bracket | Male | Female |
| Under 5 Years | 0 (0.0%) | 0 (0.0%) |
| 5 to 17 Years | 0 (0.0%) | 0 (0.0%) |
| 18 to 34 Years | 7 (20.6%) | 0 (0.0%) |
| 35 to 64 Years | 0 (0.0%) | 0 (0.0%) |
| 65 to 74 Years | 0 (0.0%) | 0 (0.0%) |
| 75 Years and over | 0 (0.0%) | 0 (0.0%) |
Disability Class: Cognitive Difficulty
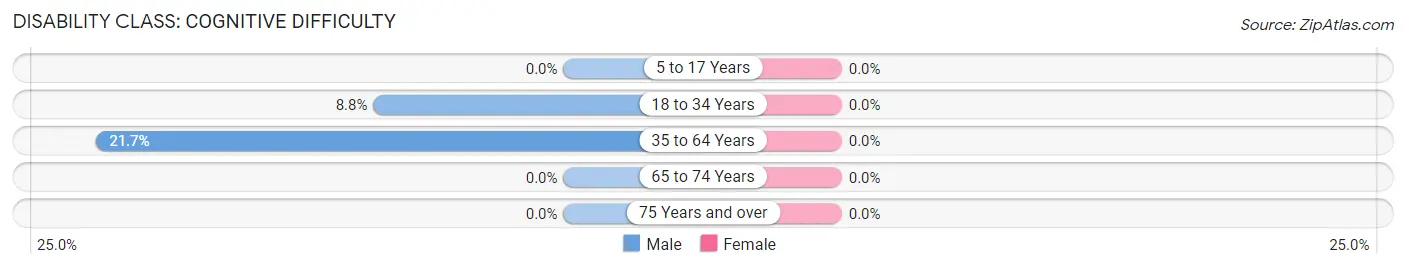
| Age Bracket | Male | Female |
| 5 to 17 Years | 0 (0.0%) | 0 (0.0%) |
| 18 to 34 Years | 3 (8.8%) | 0 (0.0%) |
| 35 to 64 Years | 13 (21.7%) | 0 (0.0%) |
| 65 to 74 Years | 0 (0.0%) | 0 (0.0%) |
| 75 Years and over | 0 (0.0%) | 0 (0.0%) |
Disability Class: Ambulatory Difficulty
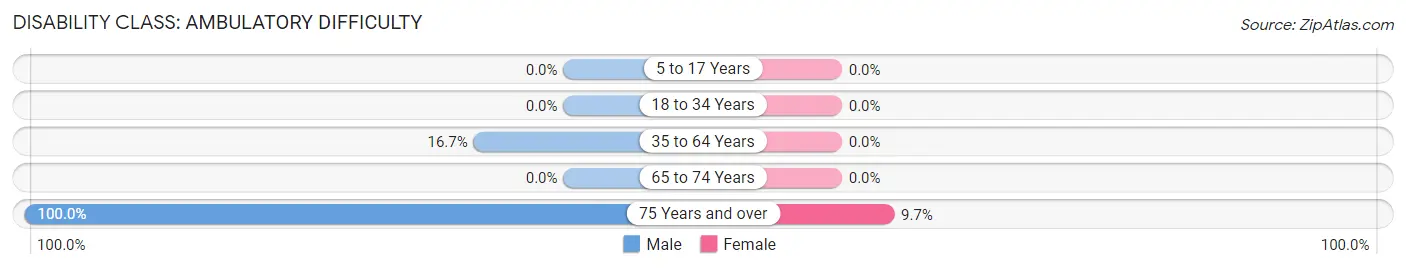
| Age Bracket | Male | Female |
| 5 to 17 Years | 0 (0.0%) | 0 (0.0%) |
| 18 to 34 Years | 0 (0.0%) | 0 (0.0%) |
| 35 to 64 Years | 10 (16.7%) | 0 (0.0%) |
| 65 to 74 Years | 0 (0.0%) | 0 (0.0%) |
| 75 Years and over | 10 (100.0%) | 10 (9.7%) |
Disability Class: Self-Care Difficulty
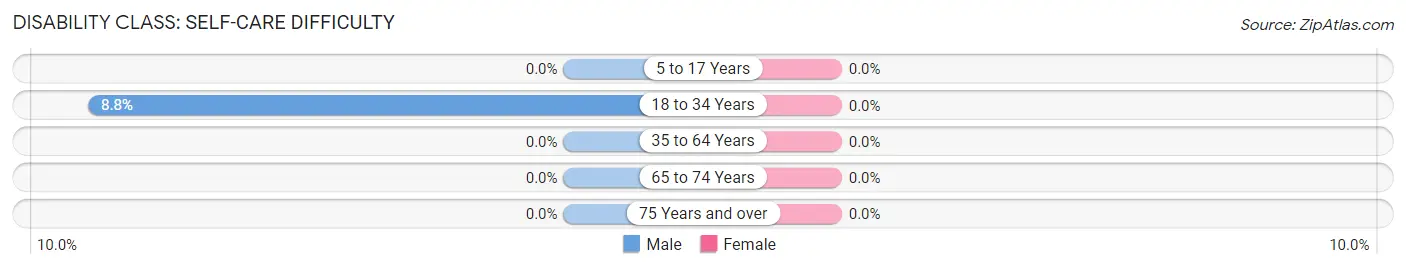
| Age Bracket | Male | Female |
| 5 to 17 Years | 0 (0.0%) | 0 (0.0%) |
| 18 to 34 Years | 3 (8.8%) | 0 (0.0%) |
| 35 to 64 Years | 0 (0.0%) | 0 (0.0%) |
| 65 to 74 Years | 0 (0.0%) | 0 (0.0%) |
| 75 Years and over | 0 (0.0%) | 0 (0.0%) |
Technology Access in Leitersburg
Computing Device Access in Leitersburg
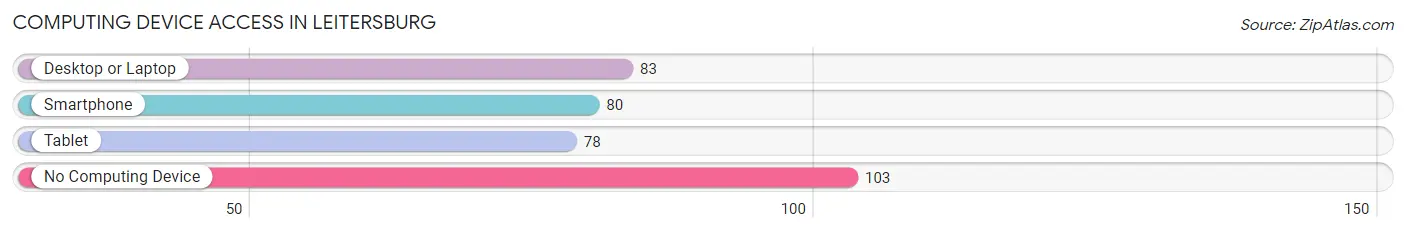
| Device Type | # Households | % Households |
| Desktop or Laptop | 83 | 40.3% |
| Smartphone | 80 | 38.8% |
| Tablet | 78 | 37.9% |
| No Computing Device | 103 | 50.0% |
| Total | 206 | 100.0% |
Internet Access in Leitersburg
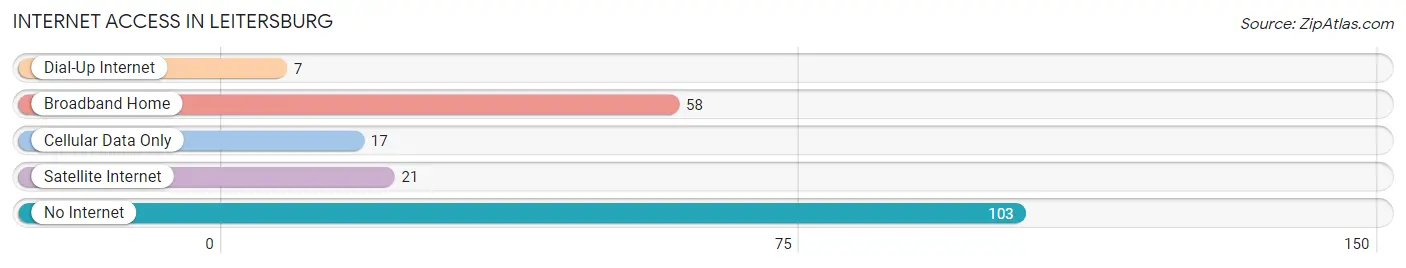
| Internet Type | # Households | % Households |
| Dial-Up Internet | 7 | 3.4% |
| Broadband Home | 58 | 28.2% |
| Cellular Data Only | 17 | 8.3% |
| Satellite Internet | 21 | 10.2% |
| No Internet | 103 | 50.0% |
| Total | 206 | 100.0% |
Leitersburg Summary
Leitersburg is a small unincorporated community located in Washington County, Maryland. It is situated in the northern part of the county, near the Pennsylvania border. The population of Leitersburg was 1,845 at the 2010 census.
History
Leitersburg was founded in 1790 by John Leiter, a German immigrant. The town was originally known as Leiter's Crossroads, and was a stop on the National Road, which was the first federally funded highway in the United States. The town was later renamed Leitersburg in honor of its founder.
In the 19th century, Leitersburg was a thriving agricultural community. The town was home to several mills, including a grist mill, a saw mill, and a woolen mill. The town also had a blacksmith shop, a general store, and a post office.
Geography
Leitersburg is located at 39°37'45" North, 77°41'45" West (39.62917, -77.69583). The town is situated in the northern part of Washington County, near the Pennsylvania border. It is bordered by the towns of Hagerstown to the south, Smithsburg to the east, and Waynesboro to the west.
The town is situated in the Appalachian Mountains, and is surrounded by rolling hills and farmland. The town is located in the Conococheague Creek watershed.
Economy
Leitersburg is a small, rural community with a primarily agricultural economy. The town is home to several farms, including dairy farms, beef farms, and vegetable farms. The town is also home to several small businesses, including a hardware store, a grocery store, and a restaurant.
Demographics
As of the 2010 census, the population of Leitersburg was 1,845. The racial makeup of the town was 94.3% White, 2.2% African American, 0.3% Native American, 0.7% Asian, 0.1% Pacific Islander, 0.7% from other races, and 1.7% from two or more races. Hispanic or Latino of any race were 2.2% of the population.
The median household income in Leitersburg was $50,938, and the median family income was $58,750. The per capita income for the town was $22,845. About 8.3% of families and 10.2% of the population were below the poverty line, including 14.2% of those under age 18 and 5.2% of those age 65 or over.
Common Questions
What is Per Capita Income in Leitersburg?
Per Capita income in Leitersburg is $23,055.
What is Income or Wage Gap in Leitersburg?
Income or Wage Gap in Leitersburg is 39.0%.
Women in Leitersburg earn 61.0 cents for every dollar earned by a man.
What is Inequality or Gini Index in Leitersburg?
Inequality or Gini Index in Leitersburg is 0.68.
What is the Total Population of Leitersburg?
Total Population of Leitersburg is 355.
What is the Total Male Population of Leitersburg?
Total Male Population of Leitersburg is 173.
What is the Total Female Population of Leitersburg?
Total Female Population of Leitersburg is 182.
What is the Ratio of Males per 100 Females in Leitersburg?
There are 95.05 Males per 100 Females in Leitersburg.
What is the Ratio of Females per 100 Males in Leitersburg?
There are 105.20 Females per 100 Males in Leitersburg.
What is the Median Population Age in Leitersburg?
Median Population Age in Leitersburg is 53.3 Years.
What is the Average Family Size in Leitersburg
Average Family Size in Leitersburg is 3.1 People.
What is the Average Household Size in Leitersburg
Average Household Size in Leitersburg is 1.7 People.
How Large is the Labor Force in Leitersburg?
There are 113 People in the Labor Forcein in Leitersburg.
What is the Percentage of People in the Labor Force in Leitersburg?
37.9% of People are in the Labor Force in Leitersburg.