Zip Codes with the Highest Percentage of Population Employed in Agriculture, Fishing & Hunting in New Haven, CT
RELATED REPORTS & OPTIONS
Agriculture, Fishing & Hunting
New Haven
Compare Zip Codes
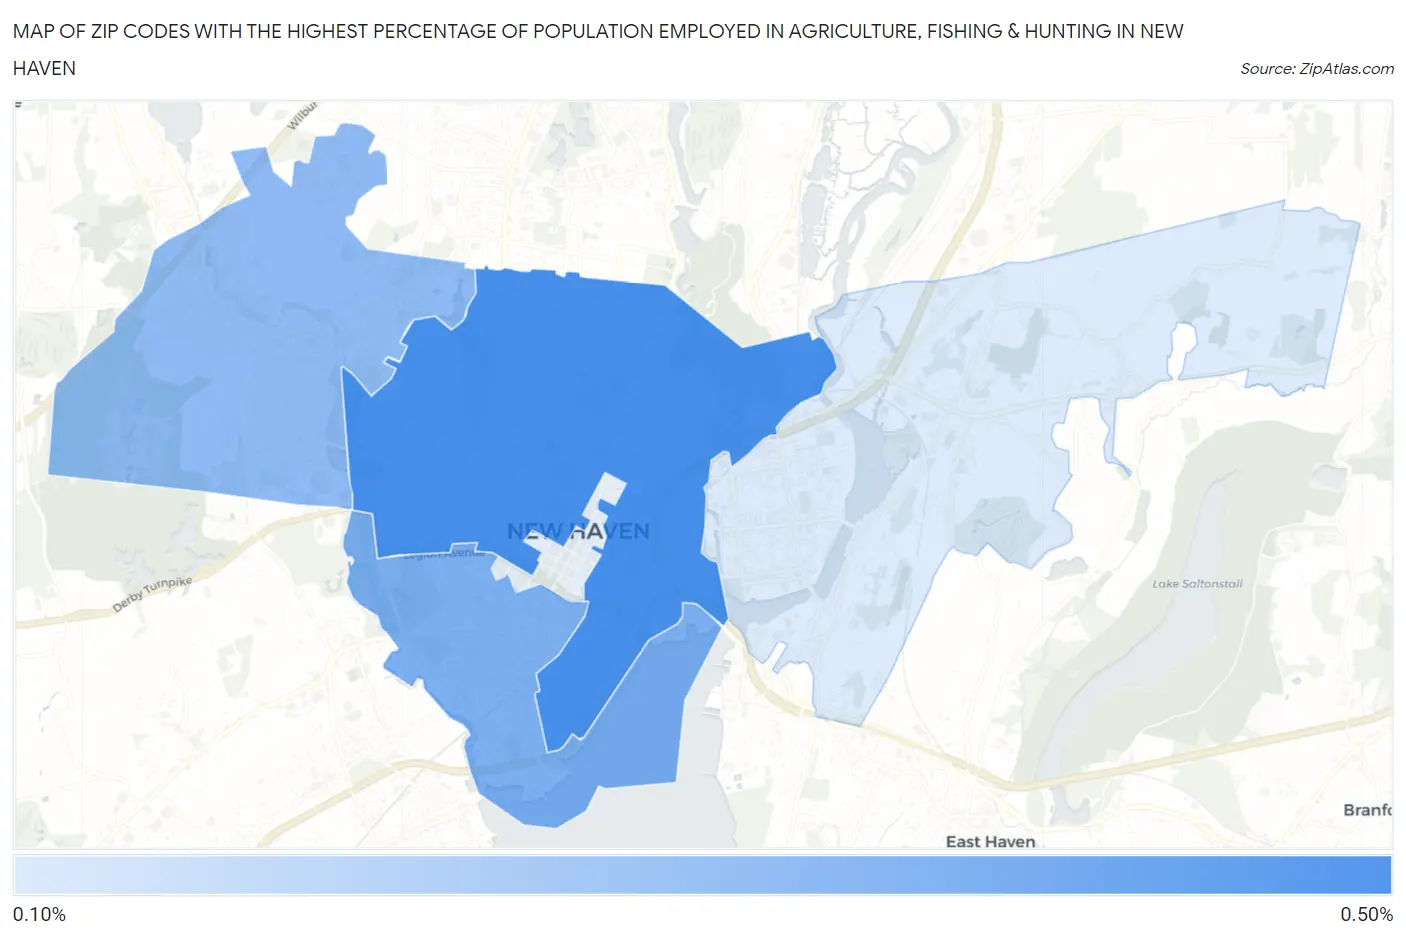
Map of Zip Codes with the Highest Percentage of Population Employed in Agriculture, Fishing & Hunting in New Haven
0.12%
0.42%
Zip Codes with the Highest Percentage of Population Employed in Agriculture, Fishing & Hunting in New Haven, CT
| Zip Code | % Employed | vs State | vs National | |
| 1. | 06511 | 0.42% | 0.36%(+0.060)#93 | 1.2%(-0.782)#20,008 |
| 2. | 06519 | 0.31% | 0.36%(-0.046)#106 | 1.2%(-0.888)#21,045 |
| 3. | 06515 | 0.27% | 0.36%(-0.084)#113 | 1.2%(-0.927)#21,498 |
| 4. | 06513 | 0.12% | 0.36%(-0.238)#155 | 1.2%(-1.08)#23,425 |
1
Common Questions
What are the Top 3 Zip Codes with the Highest Percentage of Population Employed in Agriculture, Fishing & Hunting in New Haven, CT?
Top 3 Zip Codes with the Highest Percentage of Population Employed in Agriculture, Fishing & Hunting in New Haven, CT are:
What zip code has the Highest Percentage of Population Employed in Agriculture, Fishing & Hunting in New Haven, CT?
06511 has the Highest Percentage of Population Employed in Agriculture, Fishing & Hunting in New Haven, CT with 0.42%.
What is the Percentage of Population Employed in Agriculture, Fishing & Hunting in New Haven, CT?
Percentage of Population Employed in Agriculture, Fishing & Hunting in New Haven is 0.30%.
What is the Percentage of Population Employed in Agriculture, Fishing & Hunting in Connecticut?
Percentage of Population Employed in Agriculture, Fishing & Hunting in Connecticut is 0.36%.
What is the Percentage of Population Employed in Agriculture, Fishing & Hunting in the United States?
Percentage of Population Employed in Agriculture, Fishing & Hunting in the United States is 1.2%.