Hebron, TX Map & Demographics
Hebron Map
Hebron Overview
$74,124
PER CAPITA INCOME
$196,250
AVG FAMILY INCOME
$151,250
AVG HOUSEHOLD INCOME
0.33
INEQUALITY / GINI INDEX
341
TOTAL POPULATION
163
MALE POPULATION
178
FEMALE POPULATION
91.57
MALES / 100 FEMALES
109.20
FEMALES / 100 MALES
46.5
MEDIAN AGE
3.2
AVG FAMILY SIZE
2.6
AVG HOUSEHOLD SIZE
203
LABOR FORCE [ PEOPLE ]
63.8%
PERCENT IN LABOR FORCE
Income in Hebron
Income Overview in Hebron
Per Capita Income in Hebron is $74,124, while median incomes of families and households are $196,250 and $151,250 respectively.
| Characteristic | Number | Measure |
| Per Capita Income | 341 | $74,124 |
| Median Family Income | 96 | $196,250 |
| Mean Family Income | 96 | $193,564 |
| Median Household Income | 133 | $151,250 |
| Mean Household Income | 133 | $183,986 |
| Income Deficit | 96 | $0 |
| Wage / Income Gap (%) | 341 | 0.00% |
| Wage / Income Gap ($) | 341 | 100.00¢ per $1 |
| Gini / Inequality Index | 341 | 0.33 |
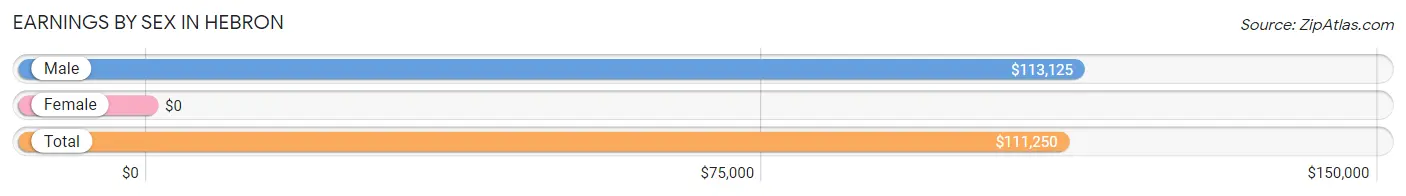
Earnings by Sex in Hebron
| Sex | Number | Average Earnings |
| Male | 113 (52.8%) | $113,125 |
| Female | 101 (47.2%) | $0 |
| Total | 214 (100.0%) | $111,250 |
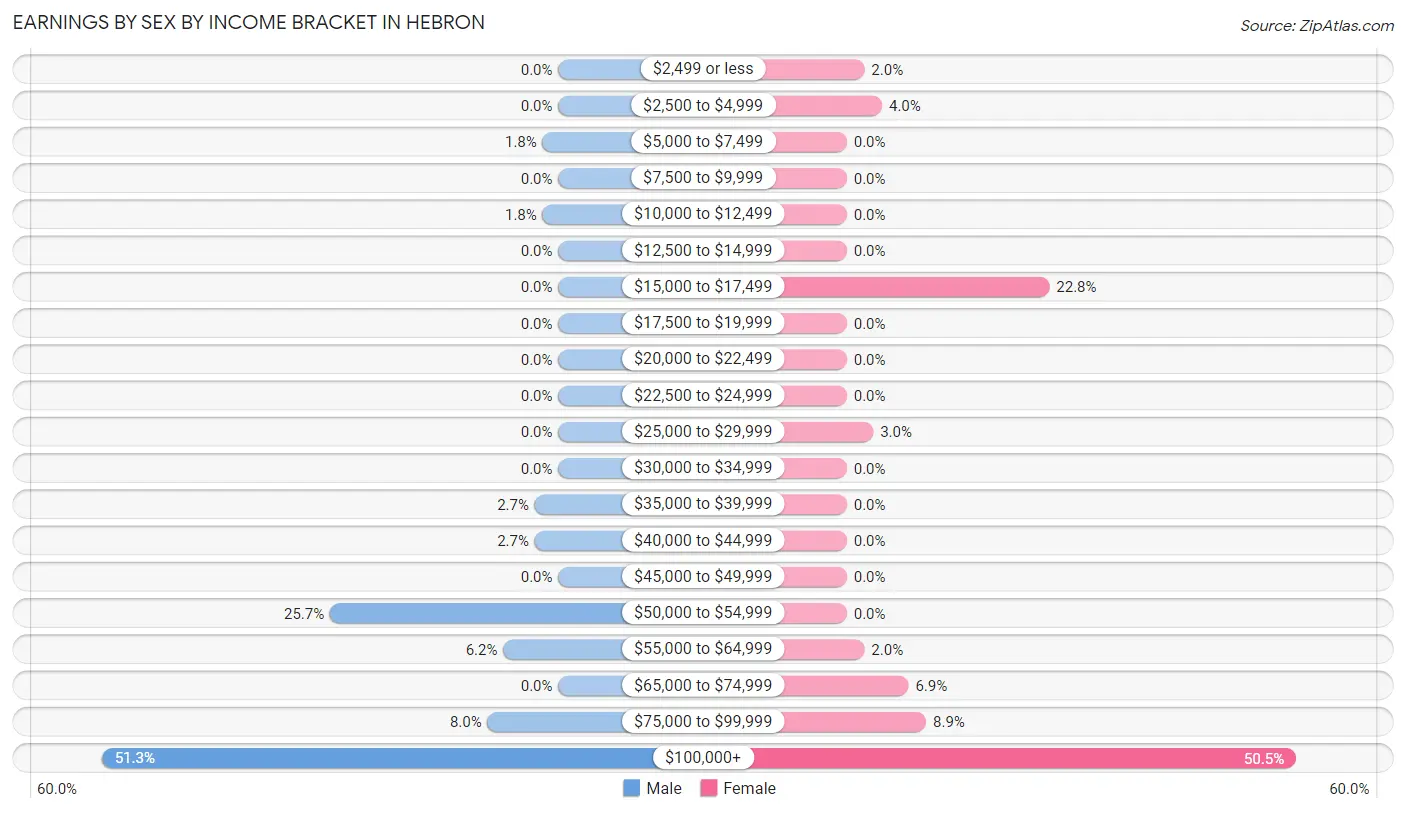
Earnings by Sex by Income Bracket in Hebron
The most common earnings brackets in Hebron are $100,000+ for men (58 | 51.3%) and $100,000+ for women (51 | 50.5%).
| Income | Male | Female |
| $2,499 or less | 0 (0.0%) | 2 (2.0%) |
| $2,500 to $4,999 | 0 (0.0%) | 4 (4.0%) |
| $5,000 to $7,499 | 2 (1.8%) | 0 (0.0%) |
| $7,500 to $9,999 | 0 (0.0%) | 0 (0.0%) |
| $10,000 to $12,499 | 2 (1.8%) | 0 (0.0%) |
| $12,500 to $14,999 | 0 (0.0%) | 0 (0.0%) |
| $15,000 to $17,499 | 0 (0.0%) | 23 (22.8%) |
| $17,500 to $19,999 | 0 (0.0%) | 0 (0.0%) |
| $20,000 to $22,499 | 0 (0.0%) | 0 (0.0%) |
| $22,500 to $24,999 | 0 (0.0%) | 0 (0.0%) |
| $25,000 to $29,999 | 0 (0.0%) | 3 (3.0%) |
| $30,000 to $34,999 | 0 (0.0%) | 0 (0.0%) |
| $35,000 to $39,999 | 3 (2.6%) | 0 (0.0%) |
| $40,000 to $44,999 | 3 (2.6%) | 0 (0.0%) |
| $45,000 to $49,999 | 0 (0.0%) | 0 (0.0%) |
| $50,000 to $54,999 | 29 (25.7%) | 0 (0.0%) |
| $55,000 to $64,999 | 7 (6.2%) | 2 (2.0%) |
| $65,000 to $74,999 | 0 (0.0%) | 7 (6.9%) |
| $75,000 to $99,999 | 9 (8.0%) | 9 (8.9%) |
| $100,000+ | 58 (51.3%) | 51 (50.5%) |
| Total | 113 (100.0%) | 101 (100.0%) |
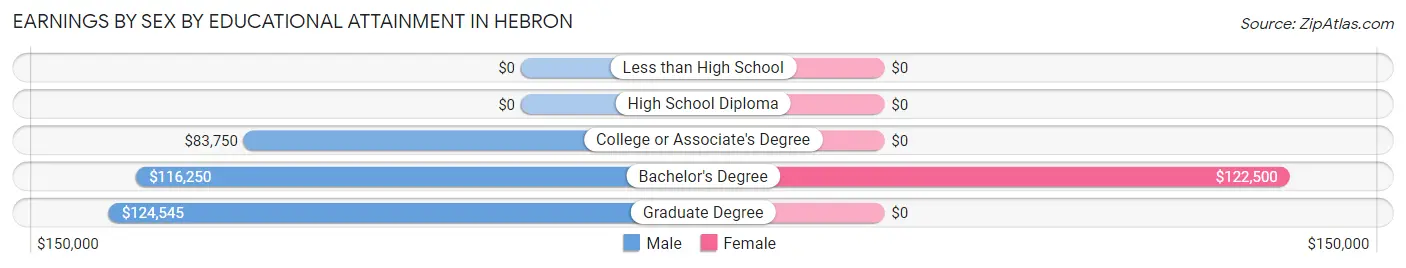
Earnings by Sex by Educational Attainment in Hebron
Average earnings in Hebron are $115,625 for men and $124,375 for women, a difference of 7.0%. Men with an educational attainment of graduate degree enjoy the highest average annual earnings of $124,545, while those with college or associate's degree education earn the least with $83,750. Women with an educational attainment of bachelor's degree earn the most with the average annual earnings of $122,500, while those with bachelor's degree education have the smallest earnings of $122,500.
| Educational Attainment | Male Income | Female Income |
| Less than High School | - | - |
| High School Diploma | - | - |
| College or Associate's Degree | $83,750 | $0 |
| Bachelor's Degree | $116,250 | $122,500 |
| Graduate Degree | $124,545 | $0 |
| Total | $115,625 | $124,375 |
Family Income in Hebron
Family Income Brackets in Hebron
According to the Hebron family income data, there are 48 families falling into the $200,000+ income range, which is the most common income bracket and makes up 50.0% of all families.
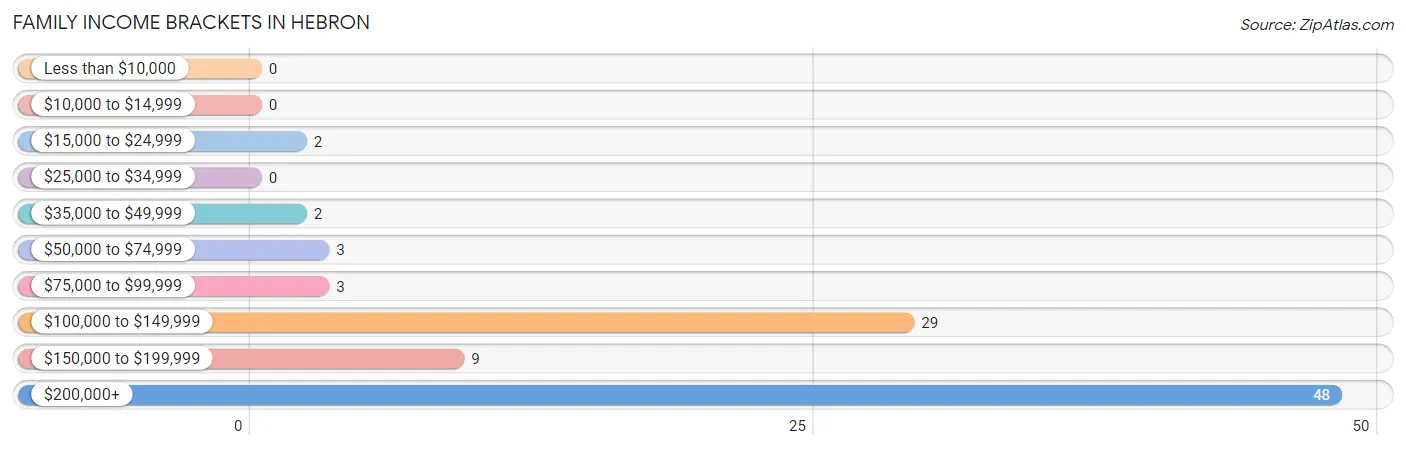
| Income Bracket | # Families | % Families |
| Less than $10,000 | 0 | 0.0% |
| $10,000 to $14,999 | 0 | 0.0% |
| $15,000 to $24,999 | 2 | 2.1% |
| $25,000 to $34,999 | 0 | 0.0% |
| $35,000 to $49,999 | 2 | 2.1% |
| $50,000 to $74,999 | 3 | 3.1% |
| $75,000 to $99,999 | 3 | 3.1% |
| $100,000 to $149,999 | 29 | 30.2% |
| $150,000 to $199,999 | 9 | 9.4% |
| $200,000+ | 48 | 50.0% |
Family Income by Famaliy Size in Hebron
2-person families (52 | 54.2%) account for the highest median family income in Hebron with $202,955 per family, while 2-person families (52 | 54.2%) have the highest median income of $101,478 per family member.
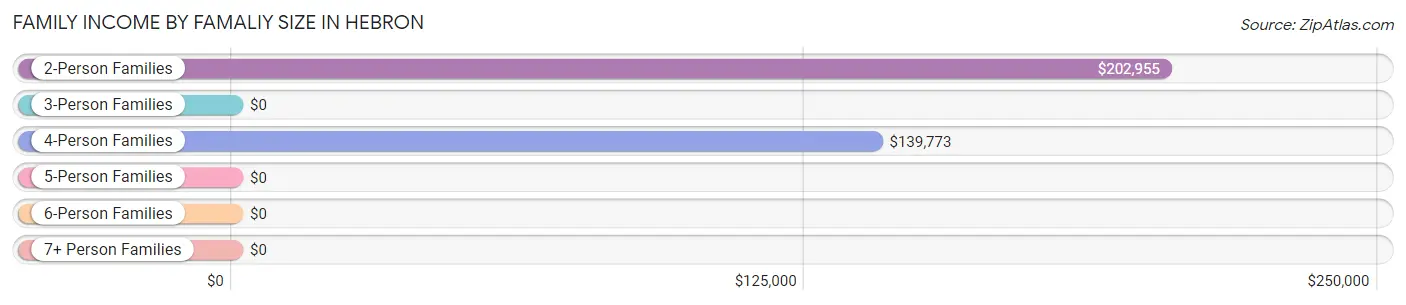
| Income Bracket | # Families | Median Income |
| 2-Person Families | 52 (54.2%) | $202,955 |
| 3-Person Families | 4 (4.2%) | $0 |
| 4-Person Families | 40 (41.7%) | $139,773 |
| 5-Person Families | 0 (0.0%) | $0 |
| 6-Person Families | 0 (0.0%) | $0 |
| 7+ Person Families | 0 (0.0%) | $0 |
| Total | 96 (100.0%) | $196,250 |
Family Income by Number of Earners in Hebron
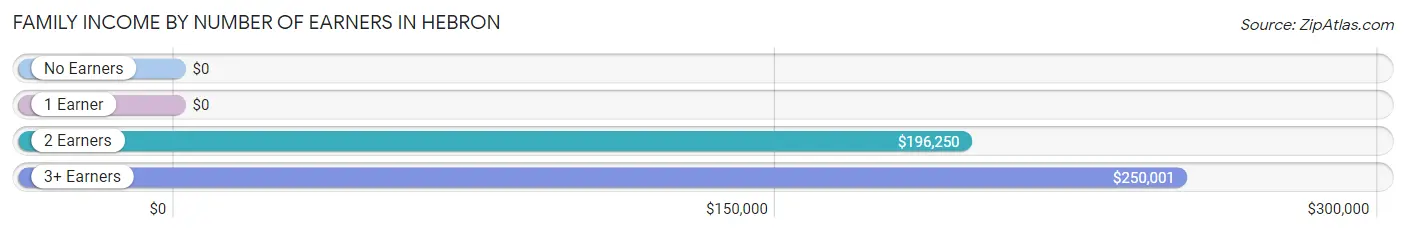
| Number of Earners | # Families | Median Income |
| No Earners | 7 (7.3%) | $0 |
| 1 Earner | 6 (6.2%) | $0 |
| 2 Earners | 76 (79.2%) | $196,250 |
| 3+ Earners | 7 (7.3%) | $250,001 |
| Total | 96 (100.0%) | $196,250 |
Household Income in Hebron
Household Income Brackets in Hebron
With 57 households falling in the category, the $200,000+ income range is the most frequent in Hebron, accounting for 42.9% of all households.
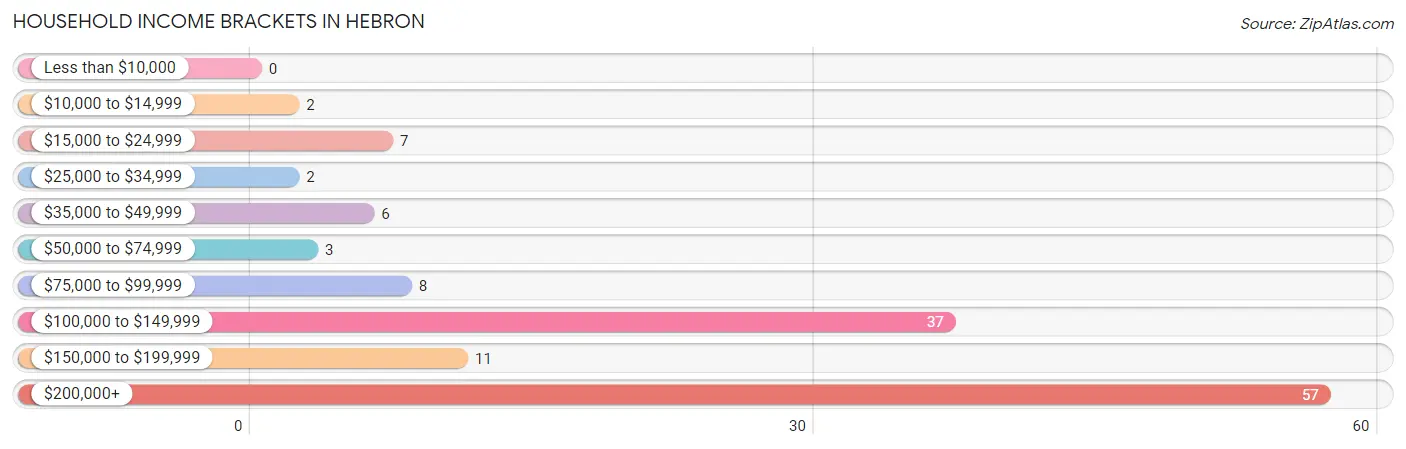
| Income Bracket | # Households | % Households |
| Less than $10,000 | 0 | 0.0% |
| $10,000 to $14,999 | 2 | 1.5% |
| $15,000 to $24,999 | 7 | 5.3% |
| $25,000 to $34,999 | 2 | 1.5% |
| $35,000 to $49,999 | 6 | 4.5% |
| $50,000 to $74,999 | 3 | 2.3% |
| $75,000 to $99,999 | 8 | 6.0% |
| $100,000 to $149,999 | 37 | 27.8% |
| $150,000 to $199,999 | 11 | 8.3% |
| $200,000+ | 57 | 42.9% |
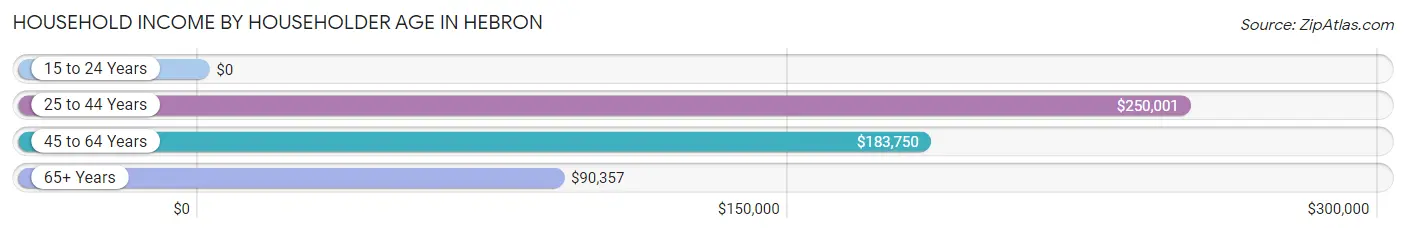
Household Income by Householder Age in Hebron
The median household income in Hebron is $151,250, with the highest median household income of $250,001 found in the 25 to 44 years age bracket for the primary householder. A total of 13 households (9.8%) fall into this category.
| Income Bracket | # Households | Median Income |
| 15 to 24 Years | 0 (0.0%) | $0 |
| 25 to 44 Years | 13 (9.8%) | $250,001 |
| 45 to 64 Years | 98 (73.7%) | $183,750 |
| 65+ Years | 22 (16.5%) | $90,357 |
| Total | 133 (100.0%) | $151,250 |
Poverty in Hebron
Income Below Poverty by Sex and Age in Hebron
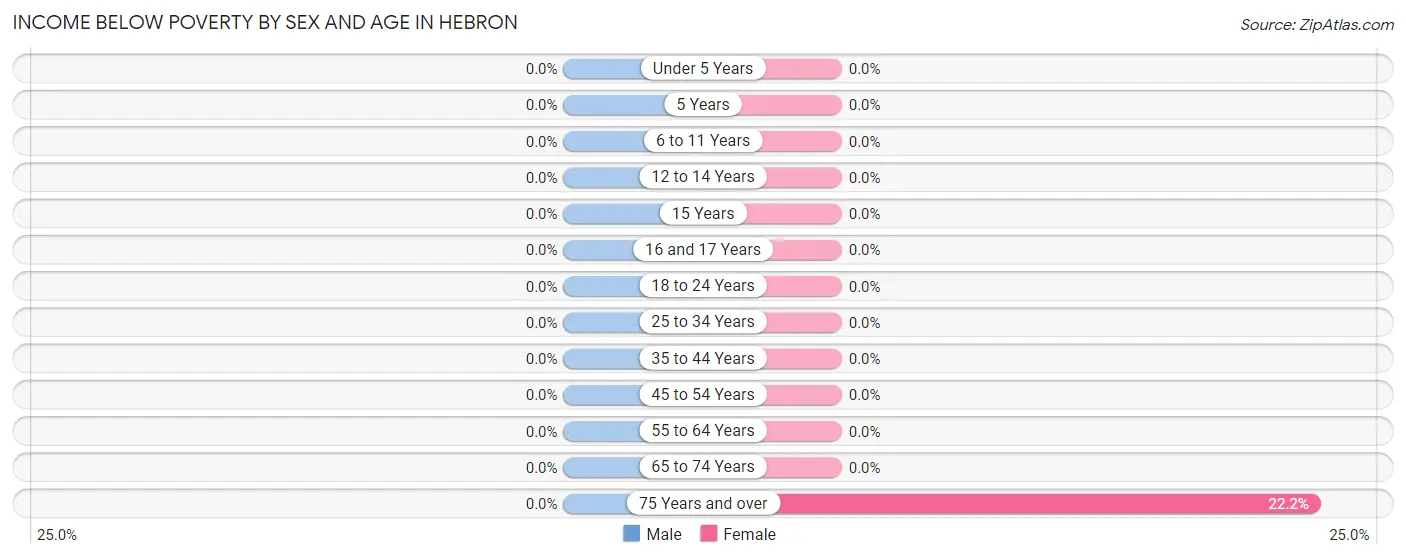
| Age Bracket | Male | Female |
| Under 5 Years | 0 (0.0%) | 0 (0.0%) |
| 5 Years | 0 (0.0%) | 0 (0.0%) |
| 6 to 11 Years | 0 (0.0%) | 0 (0.0%) |
| 12 to 14 Years | 0 (0.0%) | 0 (0.0%) |
| 15 Years | 0 (0.0%) | 0 (0.0%) |
| 16 and 17 Years | 0 (0.0%) | 0 (0.0%) |
| 18 to 24 Years | 0 (0.0%) | 0 (0.0%) |
| 25 to 34 Years | 0 (0.0%) | 0 (0.0%) |
| 35 to 44 Years | 0 (0.0%) | 0 (0.0%) |
| 45 to 54 Years | 0 (0.0%) | 0 (0.0%) |
| 55 to 64 Years | 0 (0.0%) | 0 (0.0%) |
| 65 to 74 Years | 0 (0.0%) | 0 (0.0%) |
| 75 Years and over | 0 (0.0%) | 2 (22.2%) |
| Total | 0 (0.0%) | 2 (1.1%) |
Income Above Poverty by Sex and Age in Hebron
According to the poverty statistics in Hebron, males aged under 5 years and females aged under 5 years are the age groups that are most secure financially, with 100.0% of males and 100.0% of females in these age groups living above the poverty line.
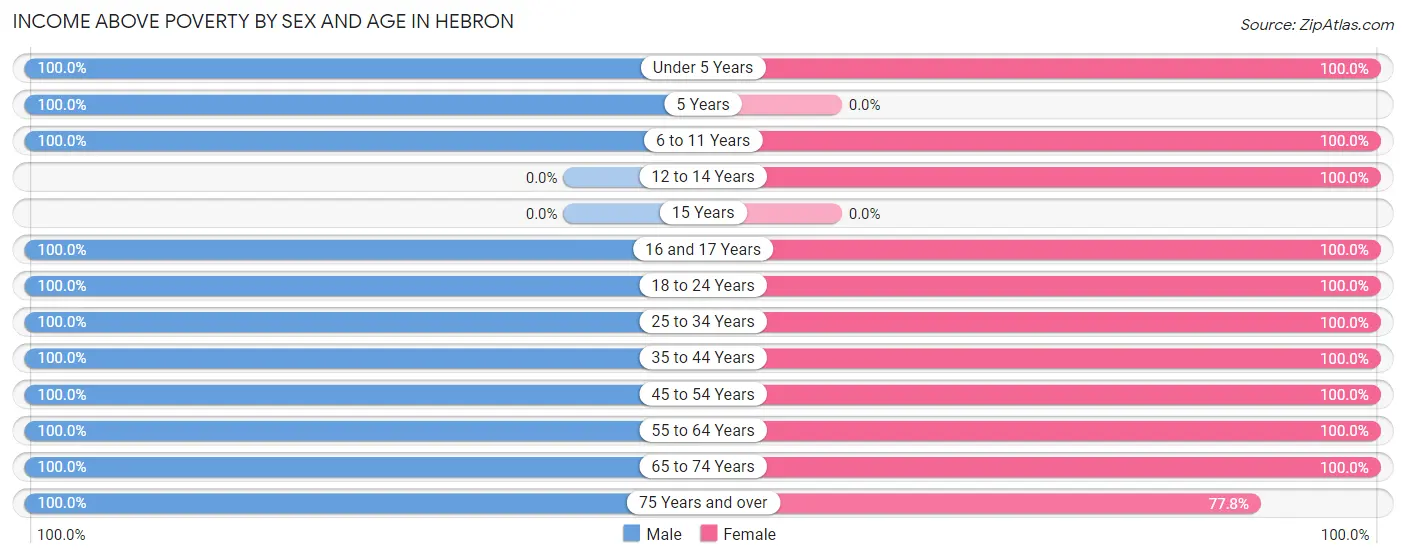
| Age Bracket | Male | Female |
| Under 5 Years | 10 (100.0%) | 4 (100.0%) |
| 5 Years | 1 (100.0%) | 0 (0.0%) |
| 6 to 11 Years | 4 (100.0%) | 2 (100.0%) |
| 12 to 14 Years | 0 (0.0%) | 2 (100.0%) |
| 15 Years | 0 (0.0%) | 0 (0.0%) |
| 16 and 17 Years | 30 (100.0%) | 1 (100.0%) |
| 18 to 24 Years | 5 (100.0%) | 45 (100.0%) |
| 25 to 34 Years | 6 (100.0%) | 3 (100.0%) |
| 35 to 44 Years | 5 (100.0%) | 15 (100.0%) |
| 45 to 54 Years | 66 (100.0%) | 39 (100.0%) |
| 55 to 64 Years | 27 (100.0%) | 47 (100.0%) |
| 65 to 74 Years | 7 (100.0%) | 11 (100.0%) |
| 75 Years and over | 2 (100.0%) | 7 (77.8%) |
| Total | 163 (100.0%) | 176 (98.9%) |
Income Below Poverty Among Married-Couple Families in Hebron
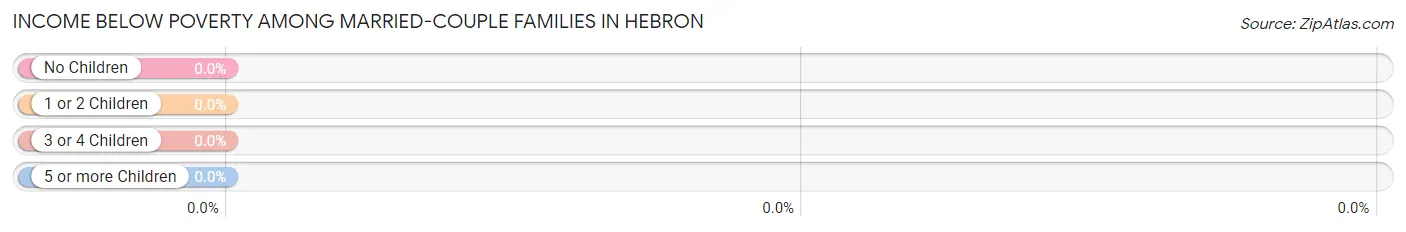
| Children | Above Poverty | Below Poverty |
| No Children | 51 (100.0%) | 0 (0.0%) |
| 1 or 2 Children | 35 (100.0%) | 0 (0.0%) |
| 3 or 4 Children | 0 (0.0%) | 0 (0.0%) |
| 5 or more Children | 0 (0.0%) | 0 (0.0%) |
| Total | 86 (100.0%) | 0 (0.0%) |
Income Below Poverty Among Single-Parent Households in Hebron
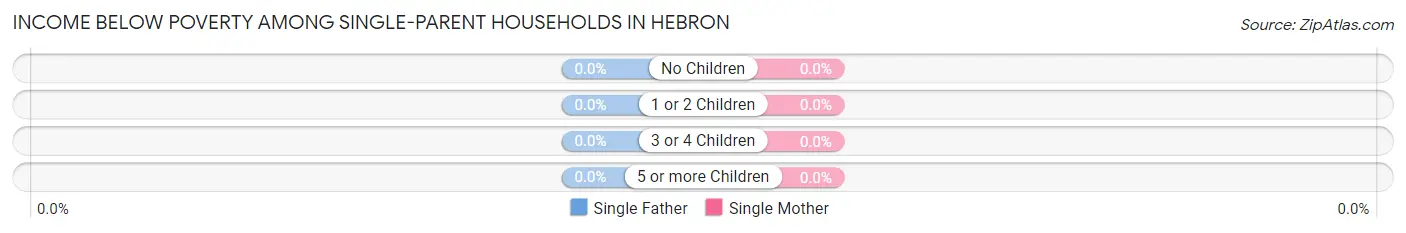
| Children | Single Father | Single Mother |
| No Children | 0 (0.0%) | 0 (0.0%) |
| 1 or 2 Children | 0 (0.0%) | 0 (0.0%) |
| 3 or 4 Children | 0 (0.0%) | 0 (0.0%) |
| 5 or more Children | 0 (0.0%) | 0 (0.0%) |
| Total | 0 (0.0%) | 0 (0.0%) |
Income Below Poverty Among Married-Couple vs Single-Parent Households in Hebron
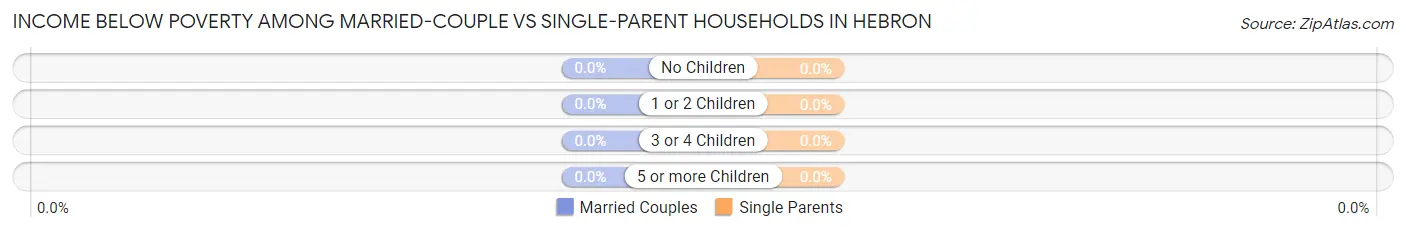
| Children | Married-Couple Families | Single-Parent Households |
| No Children | 0 (0.0%) | 0 (0.0%) |
| 1 or 2 Children | 0 (0.0%) | 0 (0.0%) |
| 3 or 4 Children | 0 (0.0%) | 0 (0.0%) |
| 5 or more Children | 0 (0.0%) | 0 (0.0%) |
| Total | 0 (0.0%) | 0 (0.0%) |
Race in Hebron
The most populous races in Hebron are White / Caucasian (166 | 48.7%), Asian (118 | 34.6%), and Black / African American (39 | 11.4%).
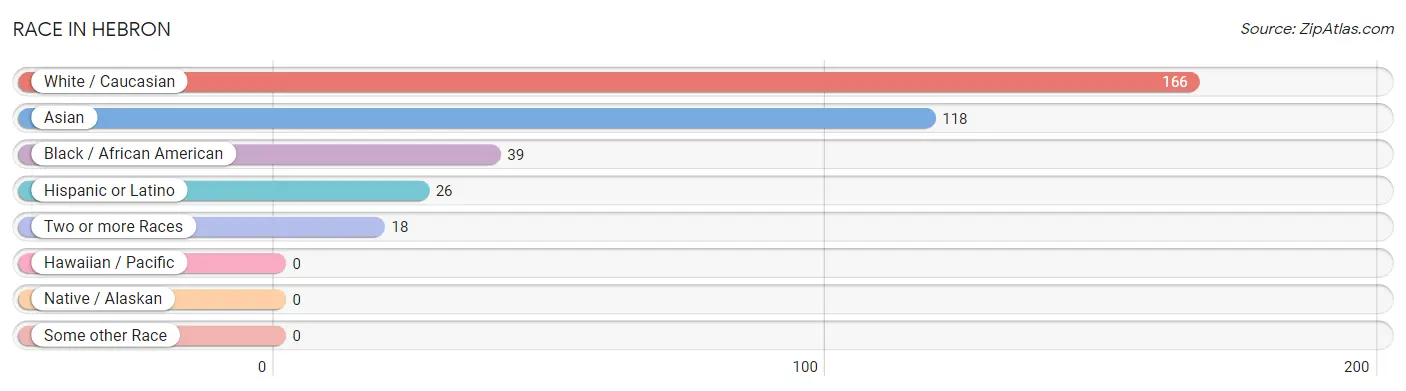
| Race | # Population | % Population |
| Asian | 118 | 34.6% |
| Black / African American | 39 | 11.4% |
| Hawaiian / Pacific | 0 | 0.0% |
| Hispanic or Latino | 26 | 7.6% |
| Native / Alaskan | 0 | 0.0% |
| White / Caucasian | 166 | 48.7% |
| Two or more Races | 18 | 5.3% |
| Some other Race | 0 | 0.0% |
| Total | 341 | 100.0% |
Ancestry in Hebron
The most populous ancestries reported in Hebron are Thai (106 | 31.1%), English (47 | 13.8%), German (44 | 12.9%), French (21 | 6.2%), and Irish (19 | 5.6%), together accounting for 69.5% of all Hebron residents.
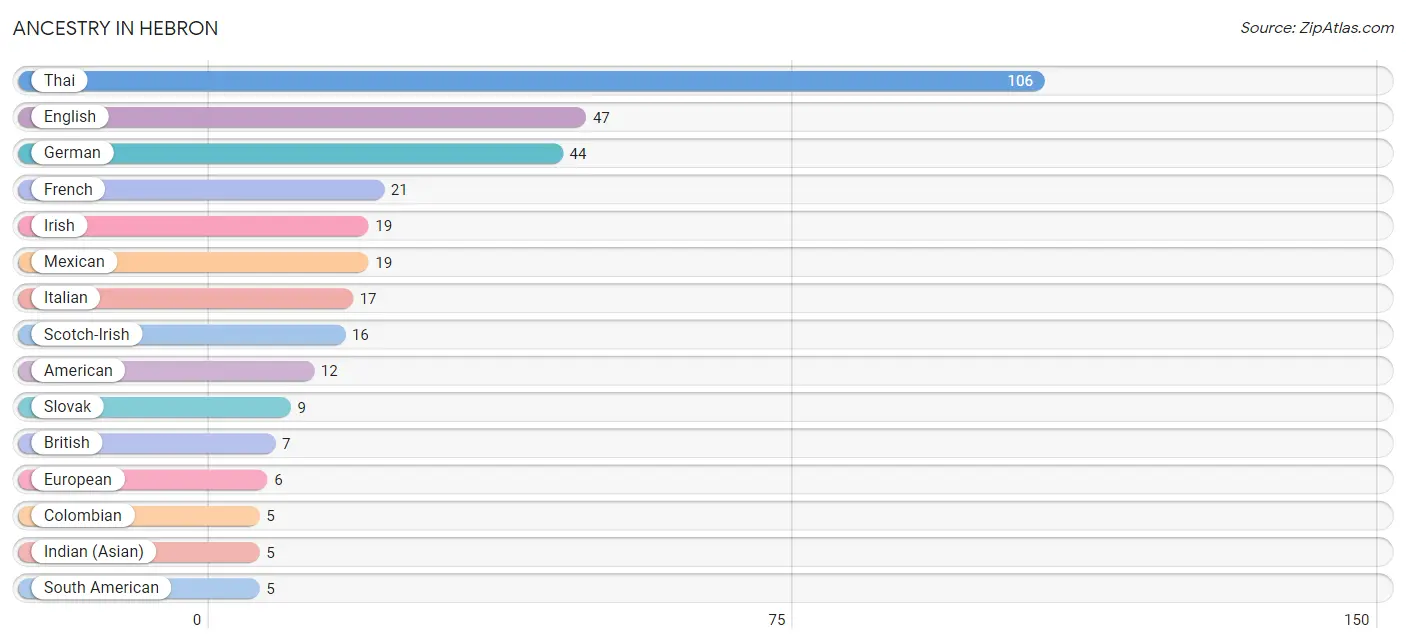
| Ancestry | # Population | % Population |
| American | 12 | 3.5% |
| Bhutanese | 2 | 0.6% |
| British | 7 | 2.1% |
| Burmese | 4 | 1.2% |
| Colombian | 5 | 1.5% |
| English | 47 | 13.8% |
| European | 6 | 1.8% |
| French | 21 | 6.2% |
| German | 44 | 12.9% |
| Greek | 4 | 1.2% |
| Indian (Asian) | 5 | 1.5% |
| Irish | 19 | 5.6% |
| Italian | 17 | 5.0% |
| Mexican | 19 | 5.6% |
| Scandinavian | 3 | 0.9% |
| Scotch-Irish | 16 | 4.7% |
| Slovak | 9 | 2.6% |
| South American | 5 | 1.5% |
| Spaniard | 2 | 0.6% |
| Thai | 106 | 31.1% |
| Ukrainian | 1 | 0.3% |
| Welsh | 4 | 1.2% | View All 22 Rows |
Immigrants in Hebron
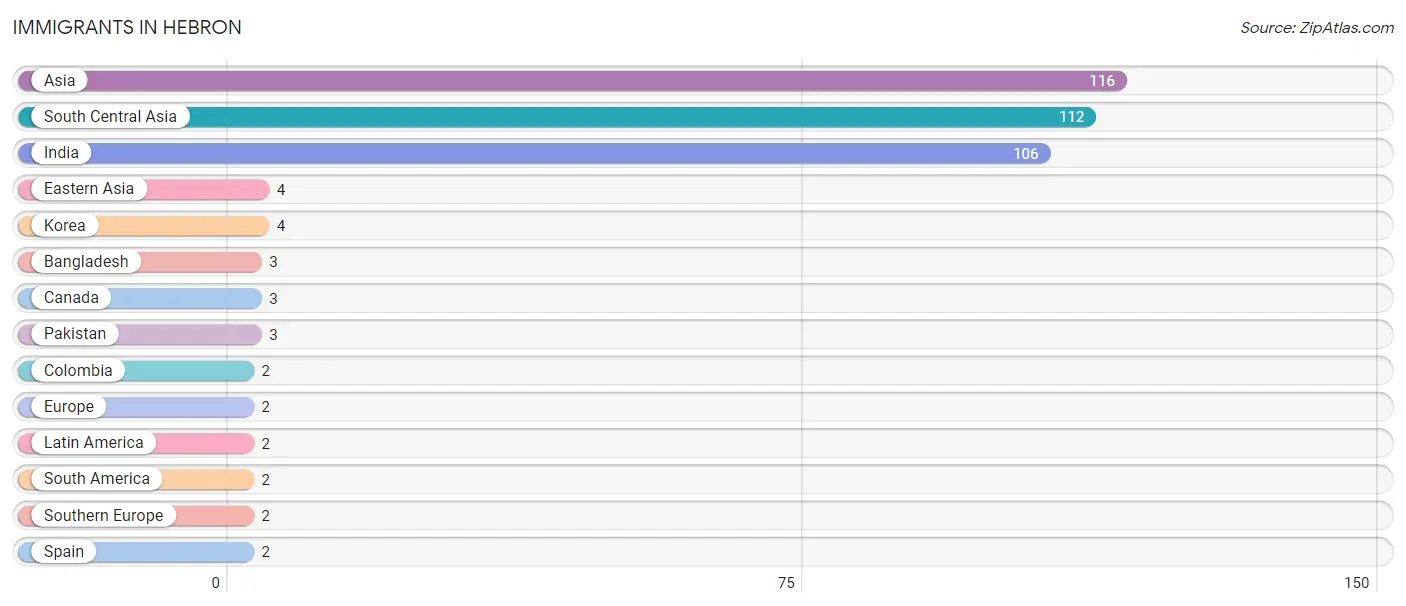
The most numerous immigrant groups reported in Hebron came from Asia (116 | 34.0%), South Central Asia (112 | 32.8%), India (106 | 31.1%), Eastern Asia (4 | 1.2%), and Korea (4 | 1.2%), together accounting for 100.3% of all Hebron residents.
| Immigration Origin | # Population | % Population |
| Asia | 116 | 34.0% |
| Bangladesh | 3 | 0.9% |
| Canada | 3 | 0.9% |
| Colombia | 2 | 0.6% |
| Eastern Asia | 4 | 1.2% |
| Europe | 2 | 0.6% |
| India | 106 | 31.1% |
| Korea | 4 | 1.2% |
| Latin America | 2 | 0.6% |
| Pakistan | 3 | 0.9% |
| South America | 2 | 0.6% |
| South Central Asia | 112 | 32.8% |
| Southern Europe | 2 | 0.6% |
| Spain | 2 | 0.6% | View All 14 Rows |
Sex and Age in Hebron
Sex and Age in Hebron
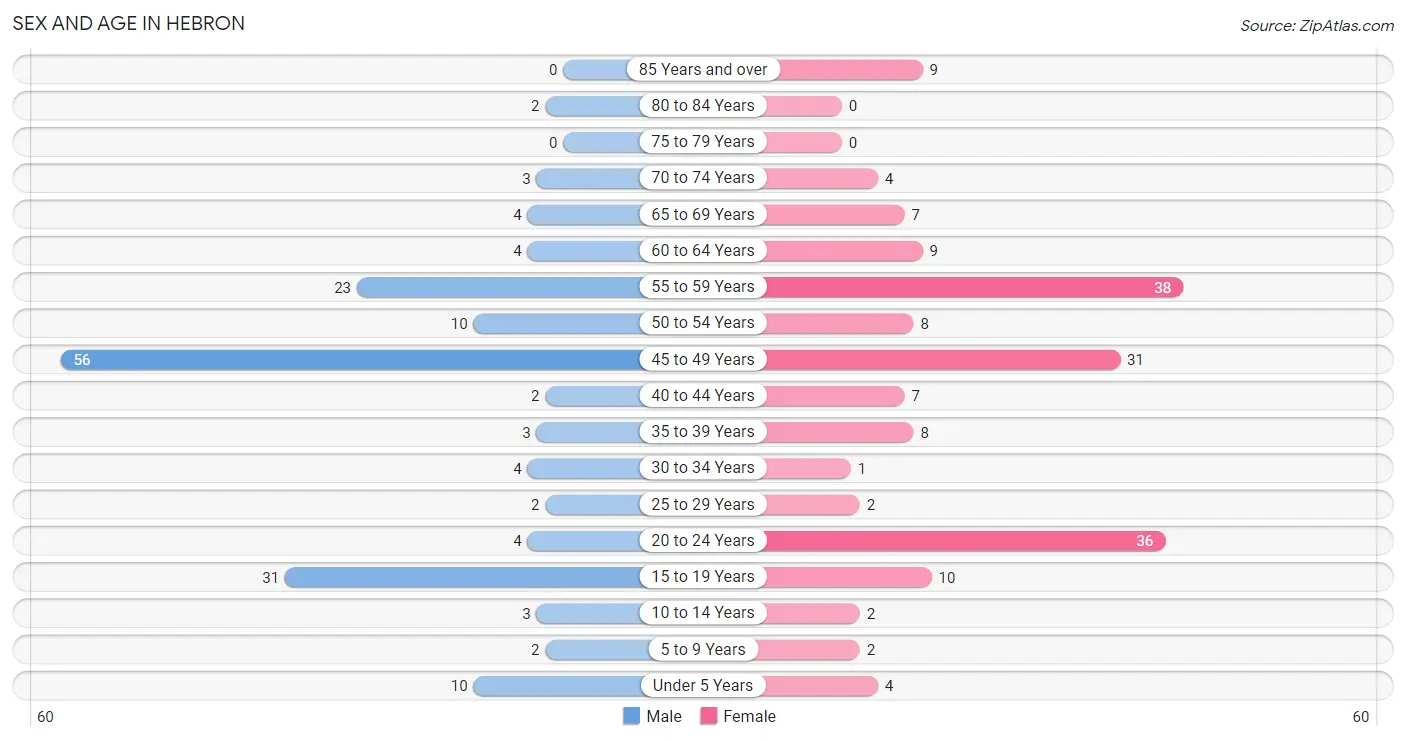
The most populous age groups in Hebron are 45 to 49 Years (56 | 34.4%) for men and 55 to 59 Years (38 | 21.3%) for women.
| Age Bracket | Male | Female |
| Under 5 Years | 10 (6.1%) | 4 (2.2%) |
| 5 to 9 Years | 2 (1.2%) | 2 (1.1%) |
| 10 to 14 Years | 3 (1.8%) | 2 (1.1%) |
| 15 to 19 Years | 31 (19.0%) | 10 (5.6%) |
| 20 to 24 Years | 4 (2.5%) | 36 (20.2%) |
| 25 to 29 Years | 2 (1.2%) | 2 (1.1%) |
| 30 to 34 Years | 4 (2.5%) | 1 (0.6%) |
| 35 to 39 Years | 3 (1.8%) | 8 (4.5%) |
| 40 to 44 Years | 2 (1.2%) | 7 (3.9%) |
| 45 to 49 Years | 56 (34.4%) | 31 (17.4%) |
| 50 to 54 Years | 10 (6.1%) | 8 (4.5%) |
| 55 to 59 Years | 23 (14.1%) | 38 (21.3%) |
| 60 to 64 Years | 4 (2.5%) | 9 (5.1%) |
| 65 to 69 Years | 4 (2.5%) | 7 (3.9%) |
| 70 to 74 Years | 3 (1.8%) | 4 (2.2%) |
| 75 to 79 Years | 0 (0.0%) | 0 (0.0%) |
| 80 to 84 Years | 2 (1.2%) | 0 (0.0%) |
| 85 Years and over | 0 (0.0%) | 9 (5.1%) |
| Total | 163 (100.0%) | 178 (100.0%) |
Families and Households in Hebron
Median Family Size in Hebron
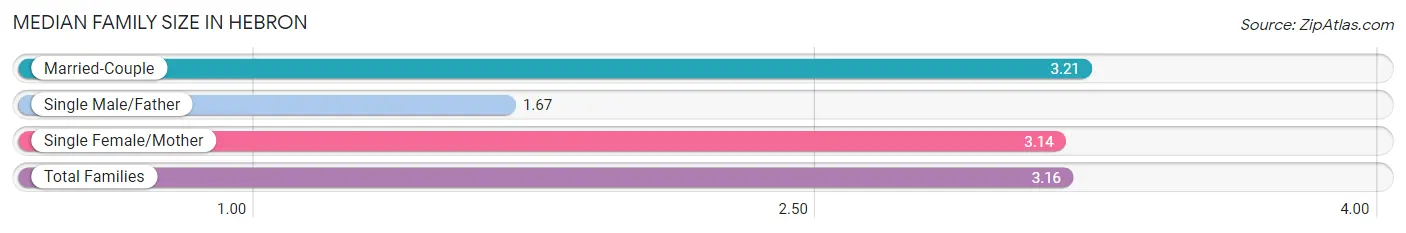
The median family size in Hebron is 3.16 persons per family, with married-couple families (86 | 89.6%) accounting for the largest median family size of 3.21 persons per family. On the other hand, single male/father families (3 | 3.1%) represent the smallest median family size with 1.67 persons per family.
| Family Type | # Families | Family Size |
| Married-Couple | 86 (89.6%) | 3.21 |
| Single Male/Father | 3 (3.1%) | 1.67 |
| Single Female/Mother | 7 (7.3%) | 3.14 |
| Total Families | 96 (100.0%) | 3.16 |
Median Household Size in Hebron
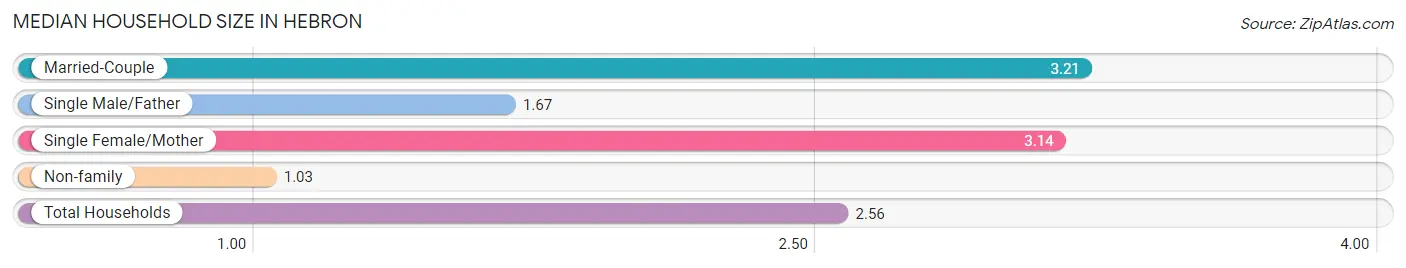
The median household size in Hebron is 2.56 persons per household, with married-couple households (86 | 64.7%) accounting for the largest median household size of 3.21 persons per household. non-family households (37 | 27.8%) represent the smallest median household size with 1.03 persons per household.
| Household Type | # Households | Household Size |
| Married-Couple | 86 (64.7%) | 3.21 |
| Single Male/Father | 3 (2.3%) | 1.67 |
| Single Female/Mother | 7 (5.3%) | 3.14 |
| Non-family | 37 (27.8%) | 1.03 |
| Total Households | 133 (100.0%) | 2.56 |
Household Size by Marriage Status in Hebron
Out of a total of 133 households in Hebron, 96 (72.2%) are family households, while 37 (27.8%) are nonfamily households. The most numerous type of family households are 2-person households, comprising 52, and the most common type of nonfamily households are 1-person households, comprising 36.
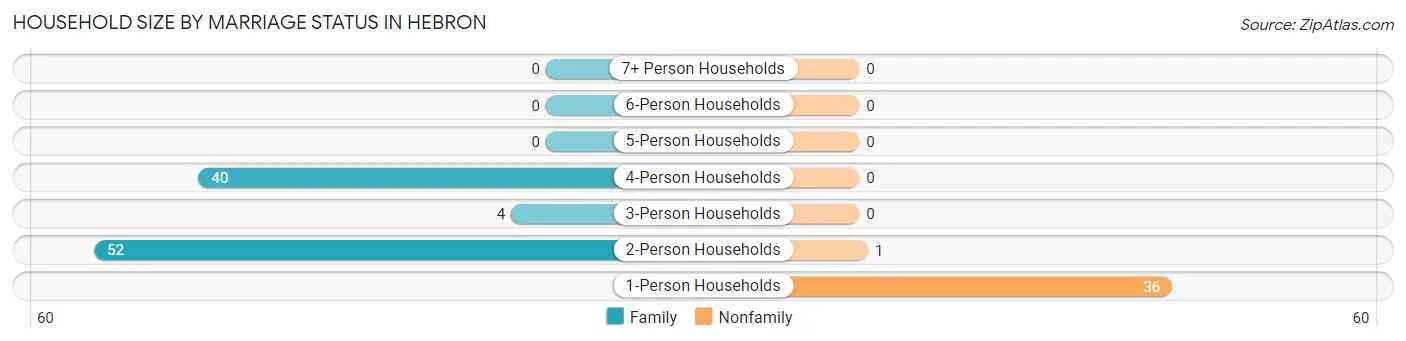
| Household Size | Family Households | Nonfamily Households |
| 1-Person Households | - | 36 (27.1%) |
| 2-Person Households | 52 (39.1%) | 1 (0.7%) |
| 3-Person Households | 4 (3.0%) | 0 (0.0%) |
| 4-Person Households | 40 (30.1%) | 0 (0.0%) |
| 5-Person Households | 0 (0.0%) | 0 (0.0%) |
| 6-Person Households | 0 (0.0%) | 0 (0.0%) |
| 7+ Person Households | 0 (0.0%) | 0 (0.0%) |
| Total | 96 (72.2%) | 37 (27.8%) |
Female Fertility in Hebron
Fertility by Age in Hebron
Average fertility rate in Hebron is 21.0 births per 1,000 women. Women in the age bracket of 35 to 50 years have the highest fertility rate with 42.0 births per 1,000 women. Women in the age bracket of 35 to 50 years acount for 100.0% of all women with births.
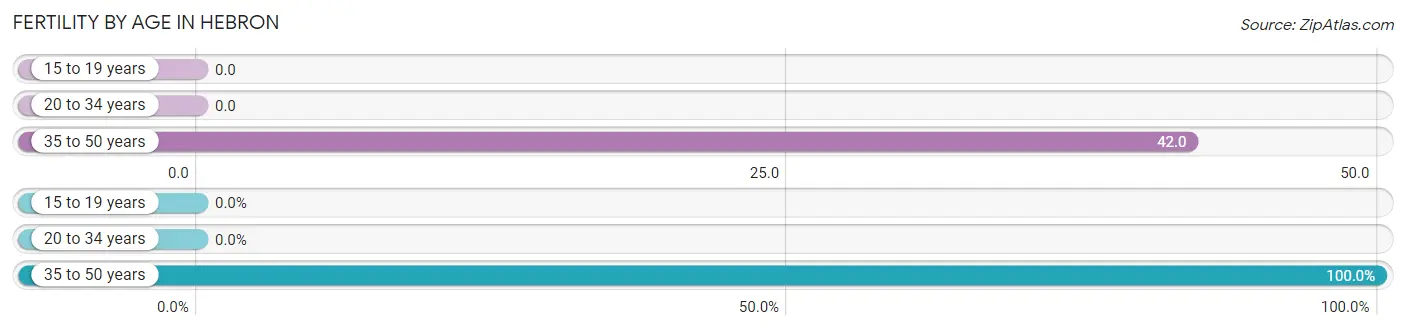
| Age Bracket | Women with Births | Births / 1,000 Women |
| 15 to 19 years | 0 (0.0%) | 0.0 |
| 20 to 34 years | 0 (0.0%) | 0.0 |
| 35 to 50 years | 2 (100.0%) | 42.0 |
| Total | 2 (100.0%) | 21.0 |
Fertility by Age by Marriage Status in Hebron
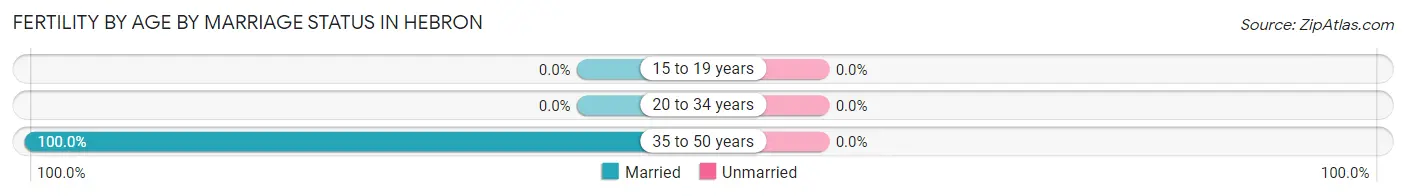
| Age Bracket | Married | Unmarried |
| 15 to 19 years | 0 (0.0%) | 0 (0.0%) |
| 20 to 34 years | 0 (0.0%) | 0 (0.0%) |
| 35 to 50 years | 2 (100.0%) | 0 (0.0%) |
| Total | 2 (100.0%) | 0 (0.0%) |
Fertility by Education in Hebron
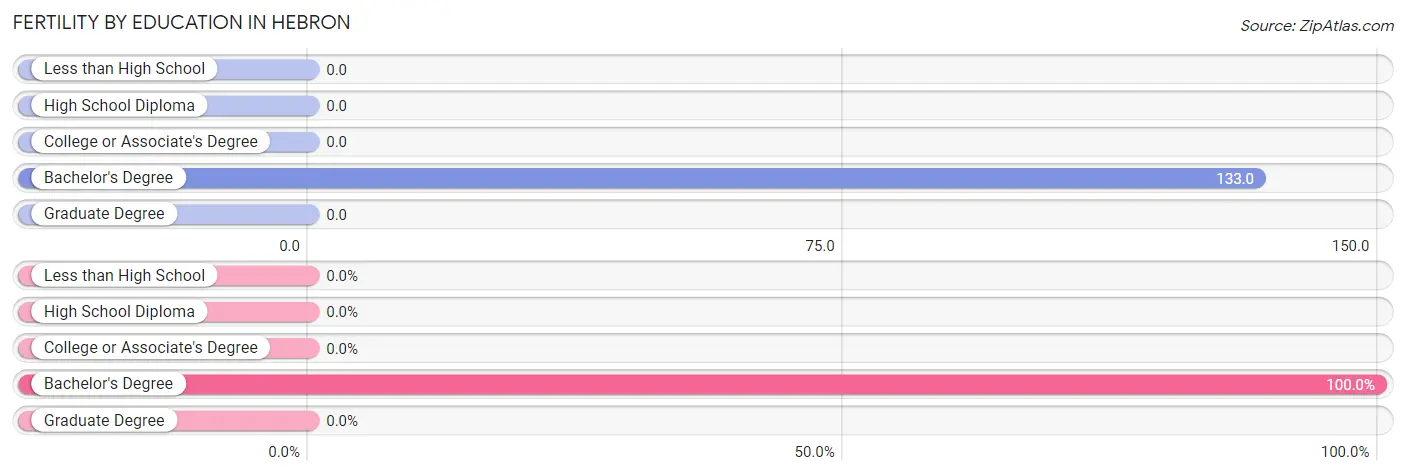
| Educational Attainment | Women with Births | Births / 1,000 Women |
| Less than High School | 0 (0.0%) | 0.0 |
| High School Diploma | 0 (0.0%) | 0.0 |
| College or Associate's Degree | 0 (0.0%) | 0.0 |
| Bachelor's Degree | 2 (100.0%) | 133.0 |
| Graduate Degree | 0 (0.0%) | 0.0 |
| Total | 2 (100.0%) | 21.0 |
Fertility by Education by Marriage Status in Hebron
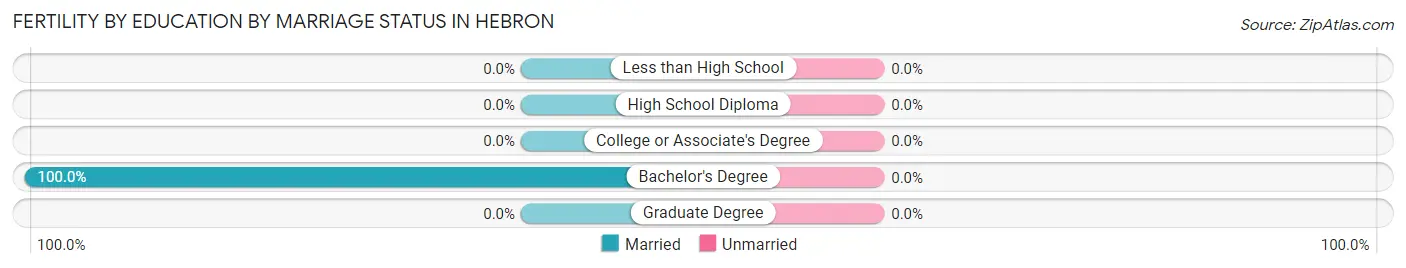
| Educational Attainment | Married | Unmarried |
| Less than High School | 0 (0.0%) | 0 (0.0%) |
| High School Diploma | 0 (0.0%) | 0 (0.0%) |
| College or Associate's Degree | 0 (0.0%) | 0 (0.0%) |
| Bachelor's Degree | 2 (100.0%) | 0 (0.0%) |
| Graduate Degree | 0 (0.0%) | 0 (0.0%) |
| Total | 2 (100.0%) | 0 (0.0%) |
Employment Characteristics in Hebron
Employment by Class of Employer in Hebron
Among the 193 employed individuals in Hebron, private company employees (170 | 88.1%), local government employees (9 | 4.7%), and self-employed (incorporated) (5 | 2.6%) make up the most common classes of employment.
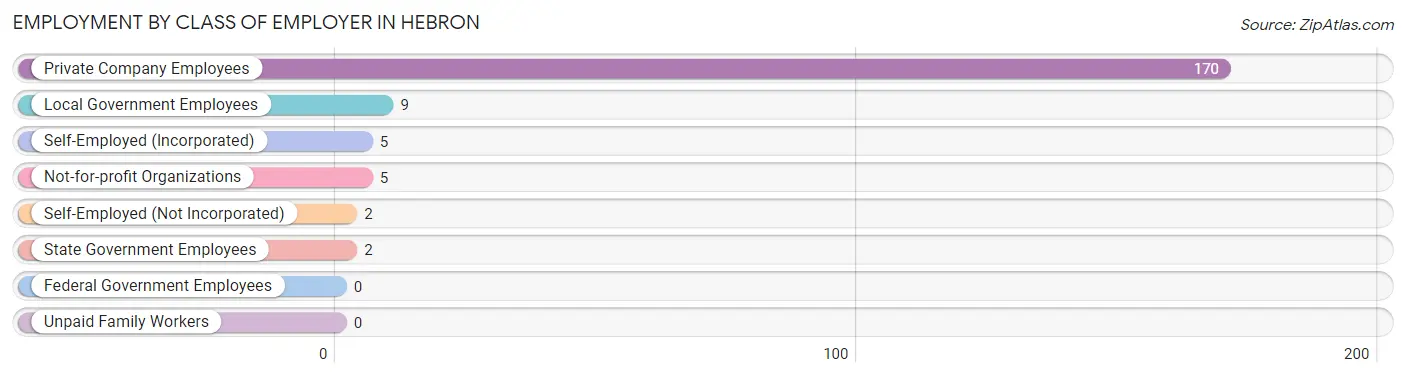
| Employer Class | # Employees | % Employees |
| Private Company Employees | 170 | 88.1% |
| Self-Employed (Incorporated) | 5 | 2.6% |
| Self-Employed (Not Incorporated) | 2 | 1.0% |
| Not-for-profit Organizations | 5 | 2.6% |
| Local Government Employees | 9 | 4.7% |
| State Government Employees | 2 | 1.0% |
| Federal Government Employees | 0 | 0.0% |
| Unpaid Family Workers | 0 | 0.0% |
| Total | 193 | 100.0% |
Employment Status by Age in Hebron
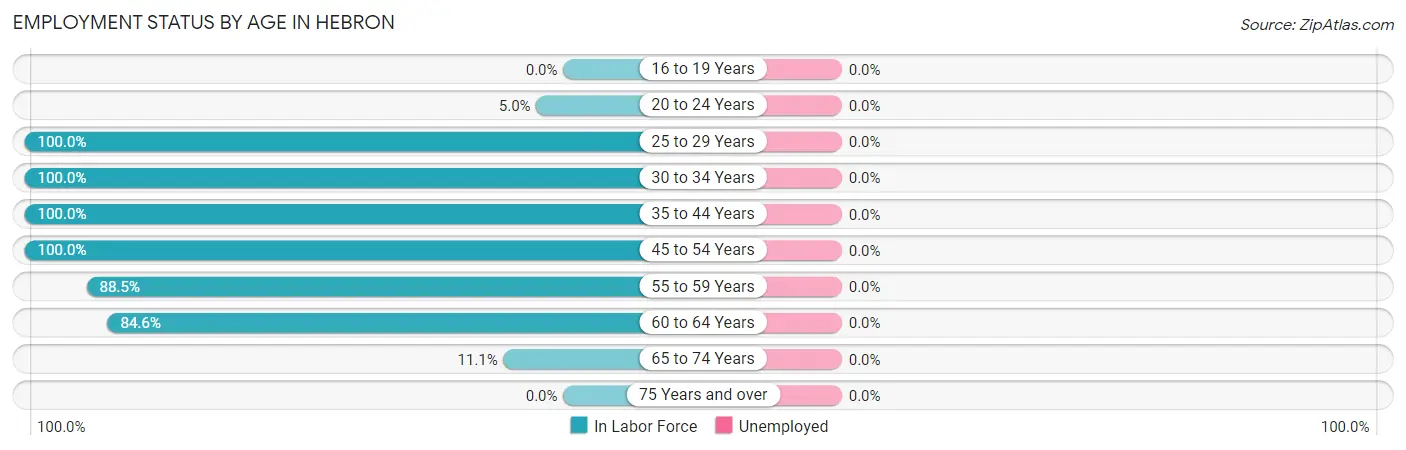
| Age Bracket | In Labor Force | Unemployed |
| 16 to 19 Years | 0 (0.0%) | 0 (0.0%) |
| 20 to 24 Years | 2 (5.0%) | 0 (0.0%) |
| 25 to 29 Years | 4 (100.0%) | 0 (0.0%) |
| 30 to 34 Years | 5 (100.0%) | 0 (0.0%) |
| 35 to 44 Years | 20 (100.0%) | 0 (0.0%) |
| 45 to 54 Years | 105 (100.0%) | 0 (0.0%) |
| 55 to 59 Years | 54 (88.5%) | 0 (0.0%) |
| 60 to 64 Years | 11 (84.6%) | 0 (0.0%) |
| 65 to 74 Years | 2 (11.1%) | 0 (0.0%) |
| 75 Years and over | 0 (0.0%) | 0 (0.0%) |
| Total | 203 (63.8%) | 0 (0.0%) |
Employment Status by Educational Attainment in Hebron
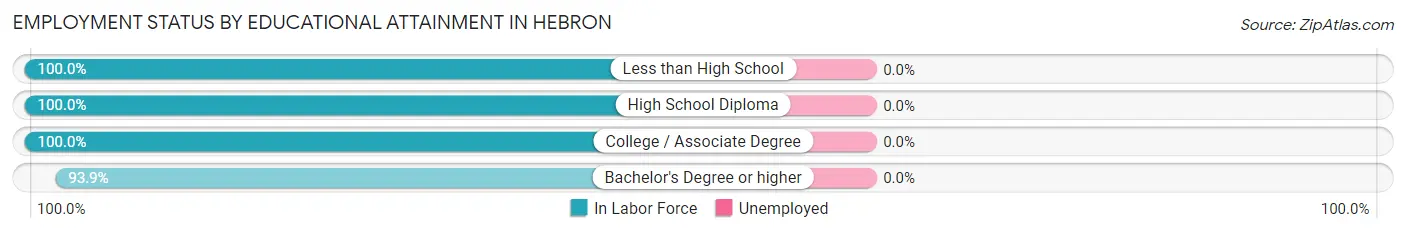
| Educational Attainment | In Labor Force | Unemployed |
| Less than High School | 1 (100.0%) | 0 (0.0%) |
| High School Diploma | 53 (100.0%) | 0 (0.0%) |
| College / Associate Degree | 7 (100.0%) | 0 (0.0%) |
| Bachelor's Degree or higher | 138 (93.9%) | 0 (0.0%) |
| Total | 199 (95.7%) | 0 (0.0%) |
Employment Occupations by Sex in Hebron
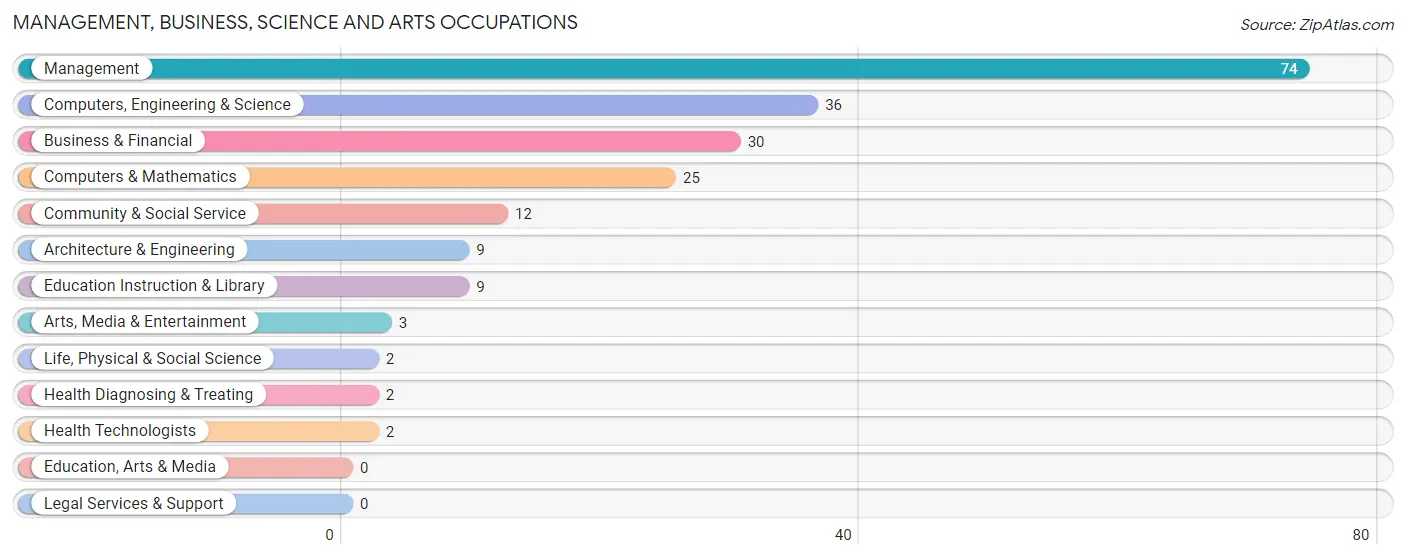
Management, Business, Science and Arts Occupations
The most common Management, Business, Science and Arts occupations in Hebron are Management (74 | 36.4%), Computers, Engineering & Science (36 | 17.7%), Business & Financial (30 | 14.8%), Computers & Mathematics (25 | 12.3%), and Community & Social Service (12 | 5.9%).
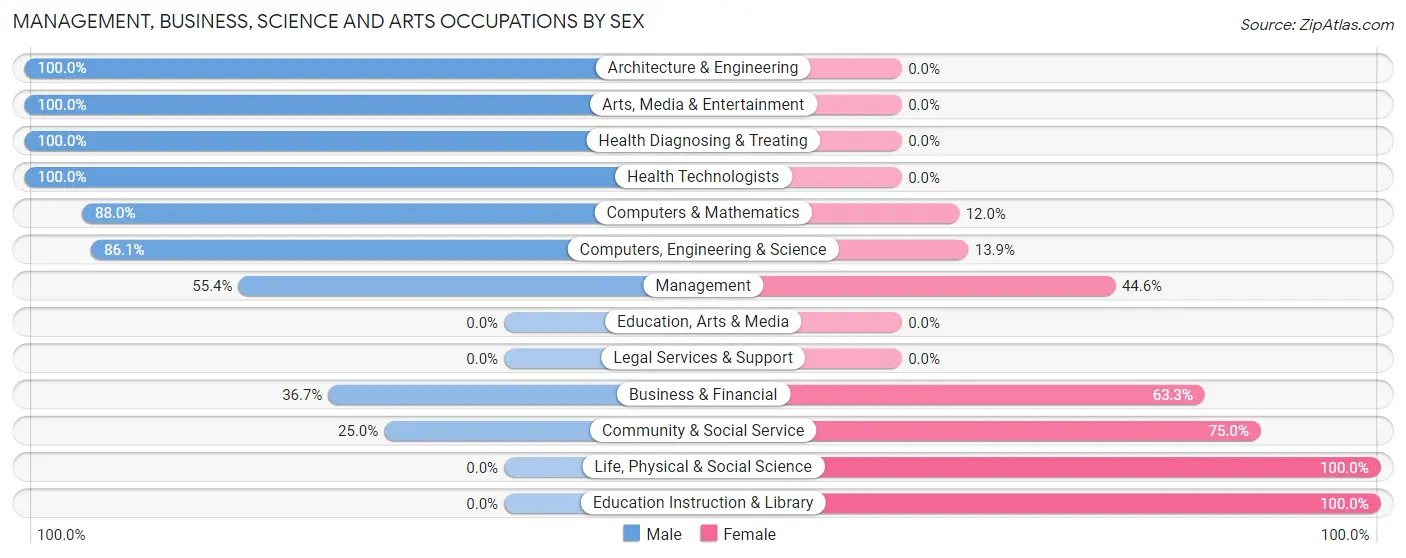
Management, Business, Science and Arts Occupations by Sex
Within the Management, Business, Science and Arts occupations in Hebron, the most male-oriented occupations are Architecture & Engineering (100.0%), Arts, Media & Entertainment (100.0%), and Health Diagnosing & Treating (100.0%), while the most female-oriented occupations are Life, Physical & Social Science (100.0%), Education Instruction & Library (100.0%), and Community & Social Service (75.0%).
| Occupation | Male | Female |
| Management | 41 (55.4%) | 33 (44.6%) |
| Business & Financial | 11 (36.7%) | 19 (63.3%) |
| Computers, Engineering & Science | 31 (86.1%) | 5 (13.9%) |
| Computers & Mathematics | 22 (88.0%) | 3 (12.0%) |
| Architecture & Engineering | 9 (100.0%) | 0 (0.0%) |
| Life, Physical & Social Science | 0 (0.0%) | 2 (100.0%) |
| Community & Social Service | 3 (25.0%) | 9 (75.0%) |
| Education, Arts & Media | 0 (0.0%) | 0 (0.0%) |
| Legal Services & Support | 0 (0.0%) | 0 (0.0%) |
| Education Instruction & Library | 0 (0.0%) | 9 (100.0%) |
| Arts, Media & Entertainment | 3 (100.0%) | 0 (0.0%) |
| Health Diagnosing & Treating | 2 (100.0%) | 0 (0.0%) |
| Health Technologists | 2 (100.0%) | 0 (0.0%) |
| Total (Category) | 88 (57.1%) | 66 (42.9%) |
| Total (Overall) | 108 (53.2%) | 95 (46.8%) |
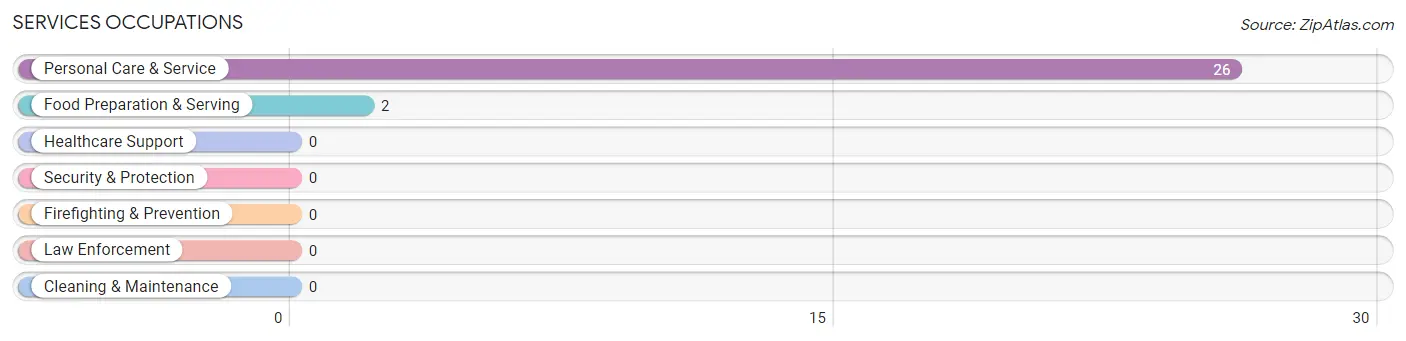
Services Occupations
The most common Services occupations in Hebron are Personal Care & Service (26 | 12.8%), and Food Preparation & Serving (2 | 1.0%).
Services Occupations by Sex
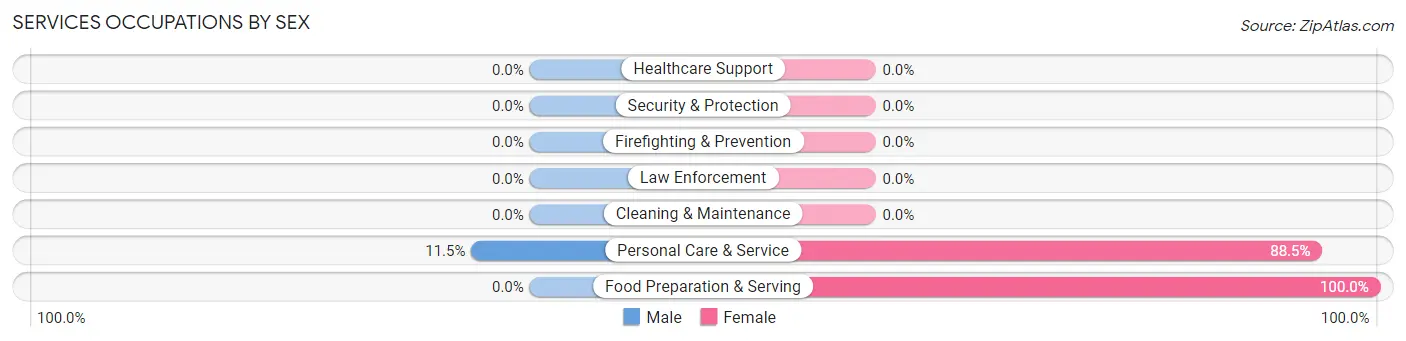
| Occupation | Male | Female |
| Healthcare Support | 0 (0.0%) | 0 (0.0%) |
| Security & Protection | 0 (0.0%) | 0 (0.0%) |
| Firefighting & Prevention | 0 (0.0%) | 0 (0.0%) |
| Law Enforcement | 0 (0.0%) | 0 (0.0%) |
| Food Preparation & Serving | 0 (0.0%) | 2 (100.0%) |
| Cleaning & Maintenance | 0 (0.0%) | 0 (0.0%) |
| Personal Care & Service | 3 (11.5%) | 23 (88.5%) |
| Total (Category) | 3 (10.7%) | 25 (89.3%) |
| Total (Overall) | 108 (53.2%) | 95 (46.8%) |
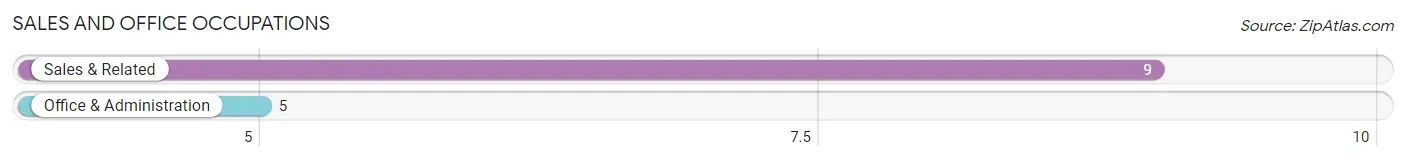
Sales and Office Occupations
The most common Sales and Office occupations in Hebron are Sales & Related (9 | 4.4%), and Office & Administration (5 | 2.5%).
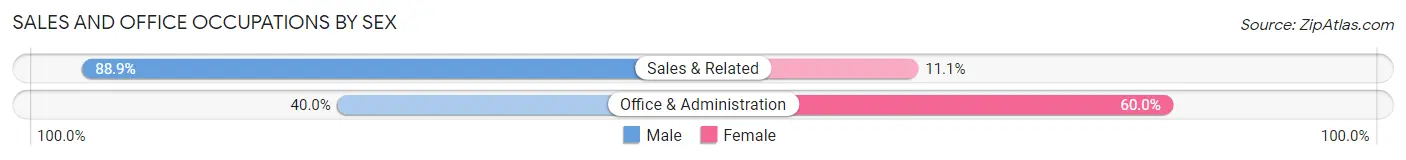
Sales and Office Occupations by Sex
| Occupation | Male | Female |
| Sales & Related | 8 (88.9%) | 1 (11.1%) |
| Office & Administration | 2 (40.0%) | 3 (60.0%) |
| Total (Category) | 10 (71.4%) | 4 (28.6%) |
| Total (Overall) | 108 (53.2%) | 95 (46.8%) |
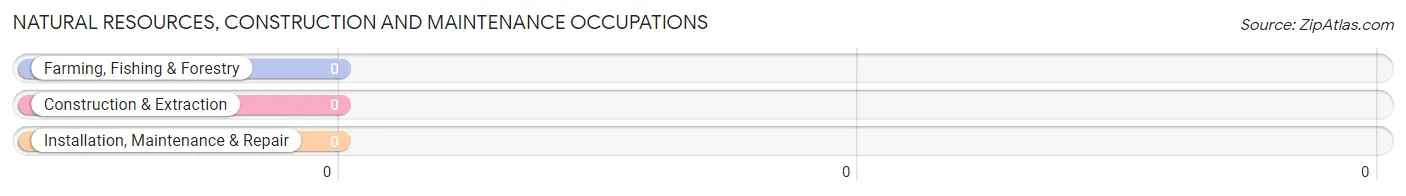
Natural Resources, Construction and Maintenance Occupations
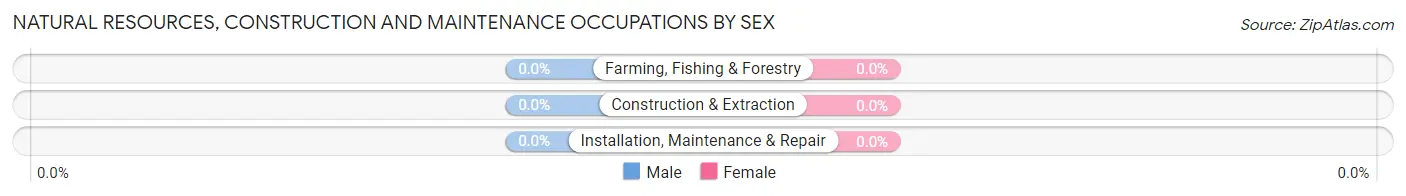
Natural Resources, Construction and Maintenance Occupations by Sex
| Occupation | Male | Female |
| Farming, Fishing & Forestry | 0 (0.0%) | 0 (0.0%) |
| Construction & Extraction | 0 (0.0%) | 0 (0.0%) |
| Installation, Maintenance & Repair | 0 (0.0%) | 0 (0.0%) |
| Total (Category) | 0 (0.0%) | 0 (0.0%) |
| Total (Overall) | 108 (53.2%) | 95 (46.8%) |
Production, Transportation and Moving Occupations
The most common Production, Transportation and Moving occupations in Hebron are Production (5 | 2.5%), and Material Moving (2 | 1.0%).
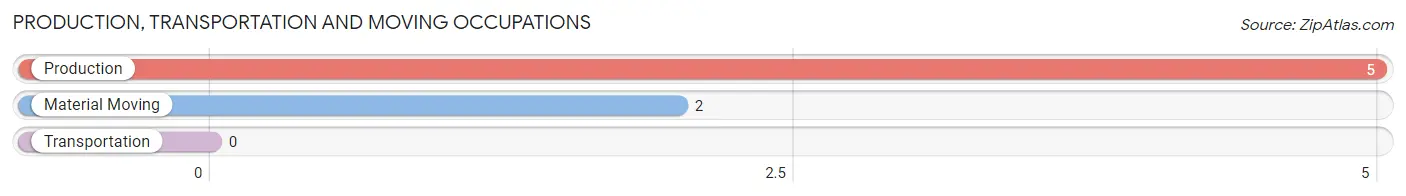
Production, Transportation and Moving Occupations by Sex
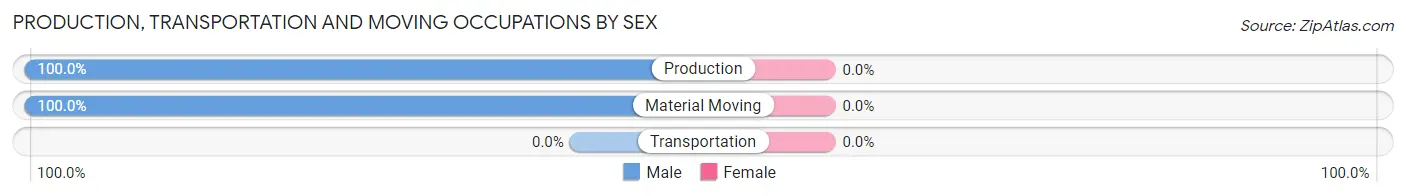
| Occupation | Male | Female |
| Production | 5 (100.0%) | 0 (0.0%) |
| Transportation | 0 (0.0%) | 0 (0.0%) |
| Material Moving | 2 (100.0%) | 0 (0.0%) |
| Total (Category) | 7 (100.0%) | 0 (0.0%) |
| Total (Overall) | 108 (53.2%) | 95 (46.8%) |
Employment Industries by Sex in Hebron
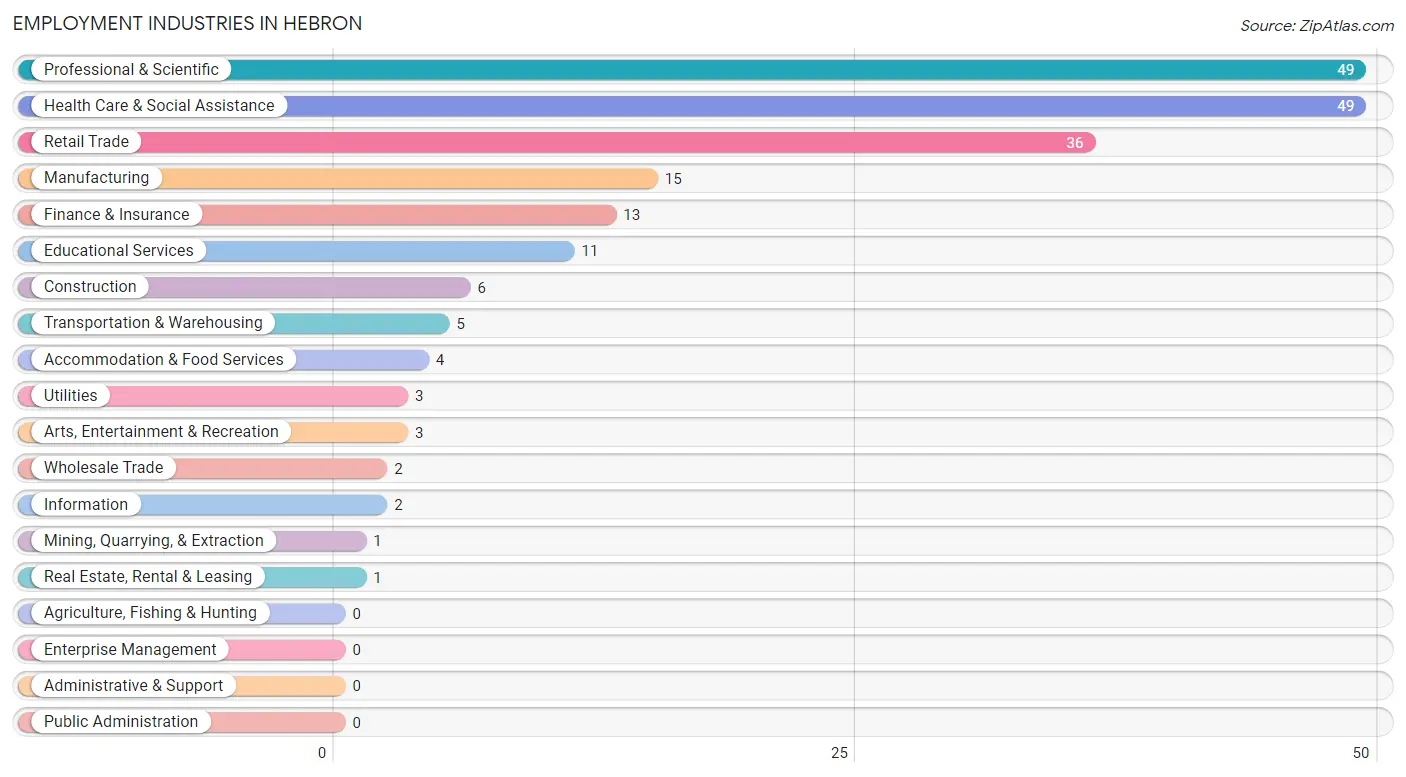
Employment Industries in Hebron
The major employment industries in Hebron include Professional & Scientific (49 | 24.1%), Health Care & Social Assistance (49 | 24.1%), Retail Trade (36 | 17.7%), Manufacturing (15 | 7.4%), and Finance & Insurance (13 | 6.4%).
Employment Industries by Sex in Hebron
The Hebron industries that see more men than women are Mining, Quarrying, & Extraction (100.0%), Wholesale Trade (100.0%), and Retail Trade (100.0%), whereas the industries that tend to have a higher number of women are Utilities (100.0%), Information (100.0%), and Real Estate, Rental & Leasing (100.0%).
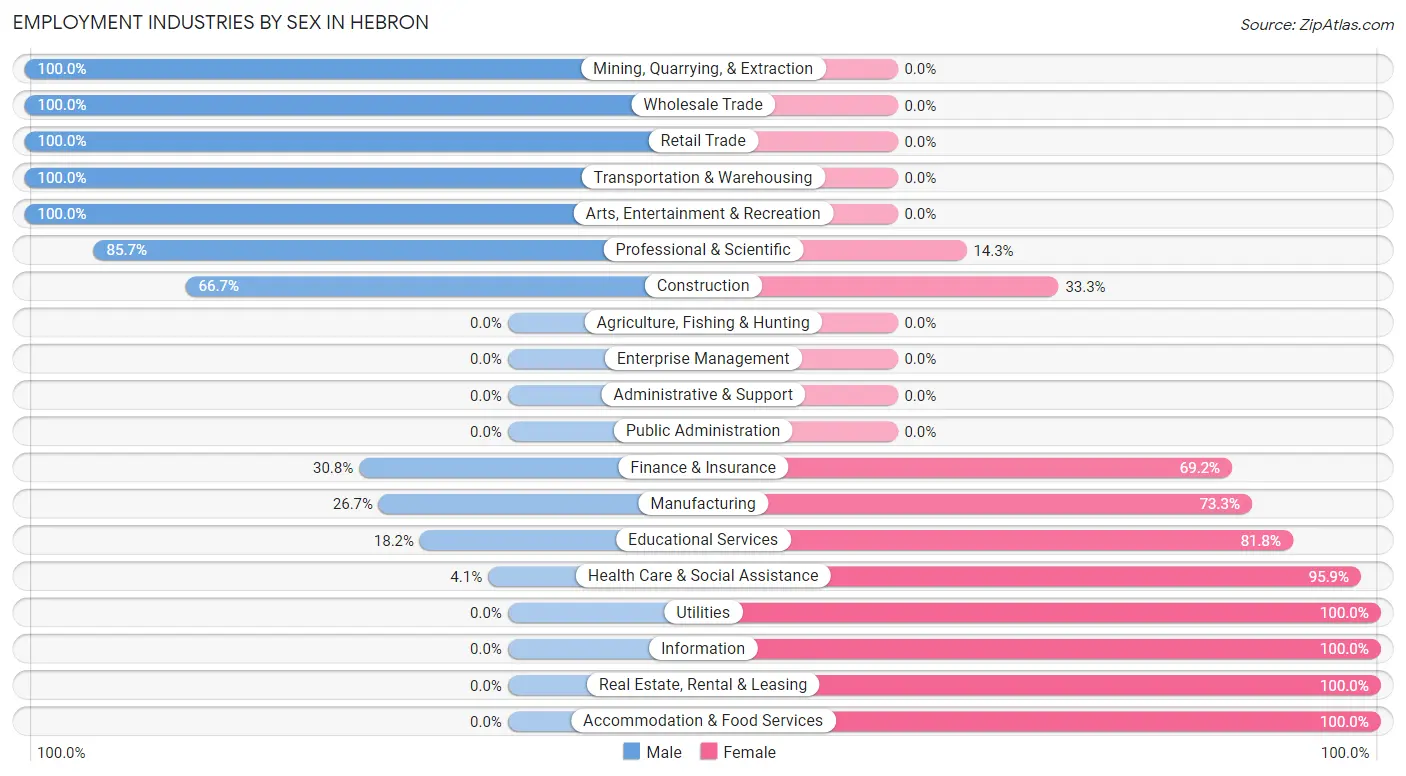
| Industry | Male | Female |
| Agriculture, Fishing & Hunting | 0 (0.0%) | 0 (0.0%) |
| Mining, Quarrying, & Extraction | 1 (100.0%) | 0 (0.0%) |
| Construction | 4 (66.7%) | 2 (33.3%) |
| Manufacturing | 4 (26.7%) | 11 (73.3%) |
| Wholesale Trade | 2 (100.0%) | 0 (0.0%) |
| Retail Trade | 36 (100.0%) | 0 (0.0%) |
| Transportation & Warehousing | 5 (100.0%) | 0 (0.0%) |
| Utilities | 0 (0.0%) | 3 (100.0%) |
| Information | 0 (0.0%) | 2 (100.0%) |
| Finance & Insurance | 4 (30.8%) | 9 (69.2%) |
| Real Estate, Rental & Leasing | 0 (0.0%) | 1 (100.0%) |
| Professional & Scientific | 42 (85.7%) | 7 (14.3%) |
| Enterprise Management | 0 (0.0%) | 0 (0.0%) |
| Administrative & Support | 0 (0.0%) | 0 (0.0%) |
| Educational Services | 2 (18.2%) | 9 (81.8%) |
| Health Care & Social Assistance | 2 (4.1%) | 47 (95.9%) |
| Arts, Entertainment & Recreation | 3 (100.0%) | 0 (0.0%) |
| Accommodation & Food Services | 0 (0.0%) | 4 (100.0%) |
| Public Administration | 0 (0.0%) | 0 (0.0%) |
| Total | 108 (53.2%) | 95 (46.8%) |
Education in Hebron
School Enrollment in Hebron
The most common levels of schooling among the 89 students in Hebron are college / undergraduate (46 | 51.7%), high school (32 | 36.0%), and middle school (5 | 5.6%).
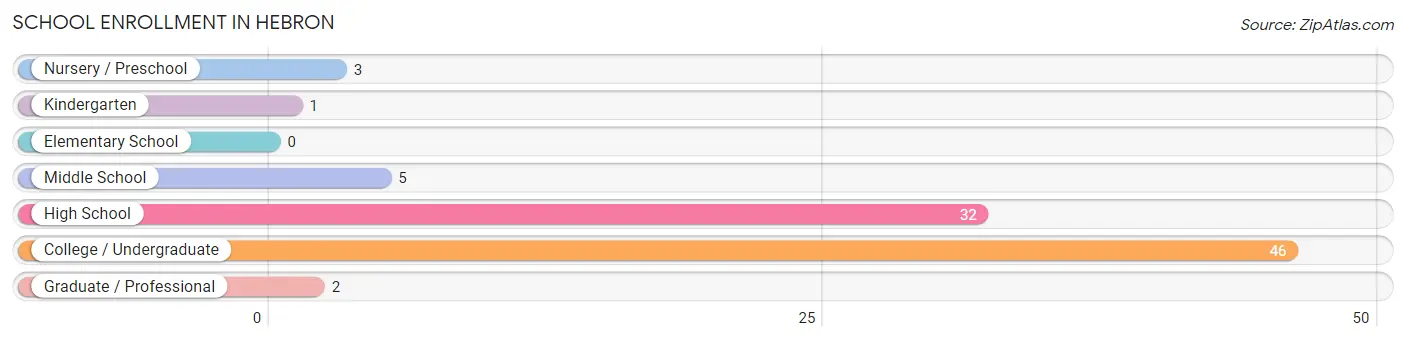
| School Level | # Students | % Students |
| Nursery / Preschool | 3 | 3.4% |
| Kindergarten | 1 | 1.1% |
| Elementary School | 0 | 0.0% |
| Middle School | 5 | 5.6% |
| High School | 32 | 36.0% |
| College / Undergraduate | 46 | 51.7% |
| Graduate / Professional | 2 | 2.2% |
| Total | 89 | 100.0% |
School Enrollment by Age by Funding Source in Hebron
Out of a total of 89 students who are enrolled in schools in Hebron, 39 (43.8%) attend a private institution, while the remaining 50 (56.2%) are enrolled in public schools. The age group of 3 to 4 year olds has the highest likelihood of being enrolled in private schools, with 3 (100.0% in the age bracket) enrolled. Conversely, the age group of 5 to 9 year old has the lowest likelihood of being enrolled in a private school, with 1 (100.0% in the age bracket) attending a public institution.
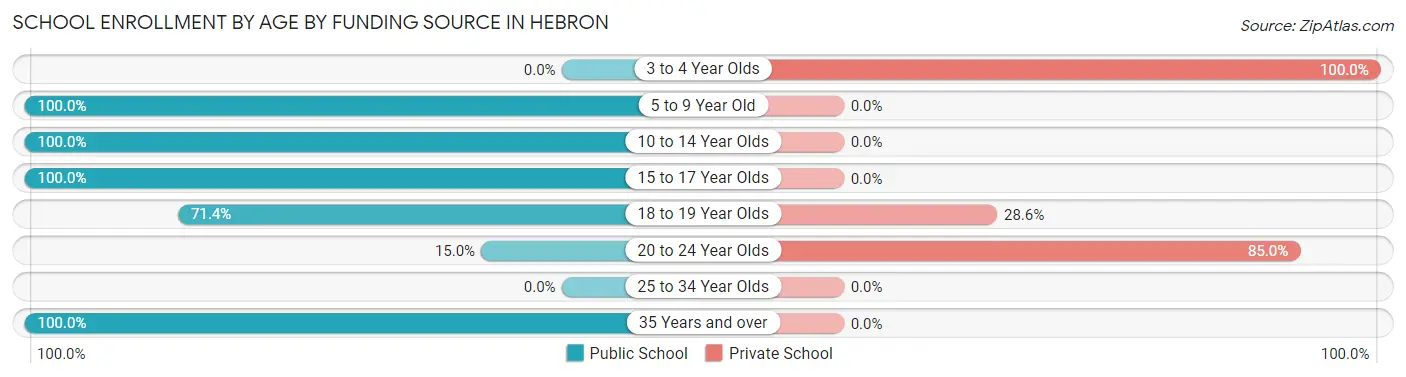
| Age Bracket | Public School | Private School |
| 3 to 4 Year Olds | 0 (0.0%) | 3 (100.0%) |
| 5 to 9 Year Old | 1 (100.0%) | 0 (0.0%) |
| 10 to 14 Year Olds | 5 (100.0%) | 0 (0.0%) |
| 15 to 17 Year Olds | 31 (100.0%) | 0 (0.0%) |
| 18 to 19 Year Olds | 5 (71.4%) | 2 (28.6%) |
| 20 to 24 Year Olds | 6 (15.0%) | 34 (85.0%) |
| 25 to 34 Year Olds | 0 (0.0%) | 0 (0.0%) |
| 35 Years and over | 2 (100.0%) | 0 (0.0%) |
| Total | 50 (56.2%) | 39 (43.8%) |
Educational Attainment by Field of Study in Hebron
Business (54 | 34.2%), engineering (39 | 24.7%), social sciences (27 | 17.1%), physical & health sciences (10 | 6.3%), and education (9 | 5.7%) are the most common fields of study among 158 individuals in Hebron who have obtained a bachelor's degree or higher.
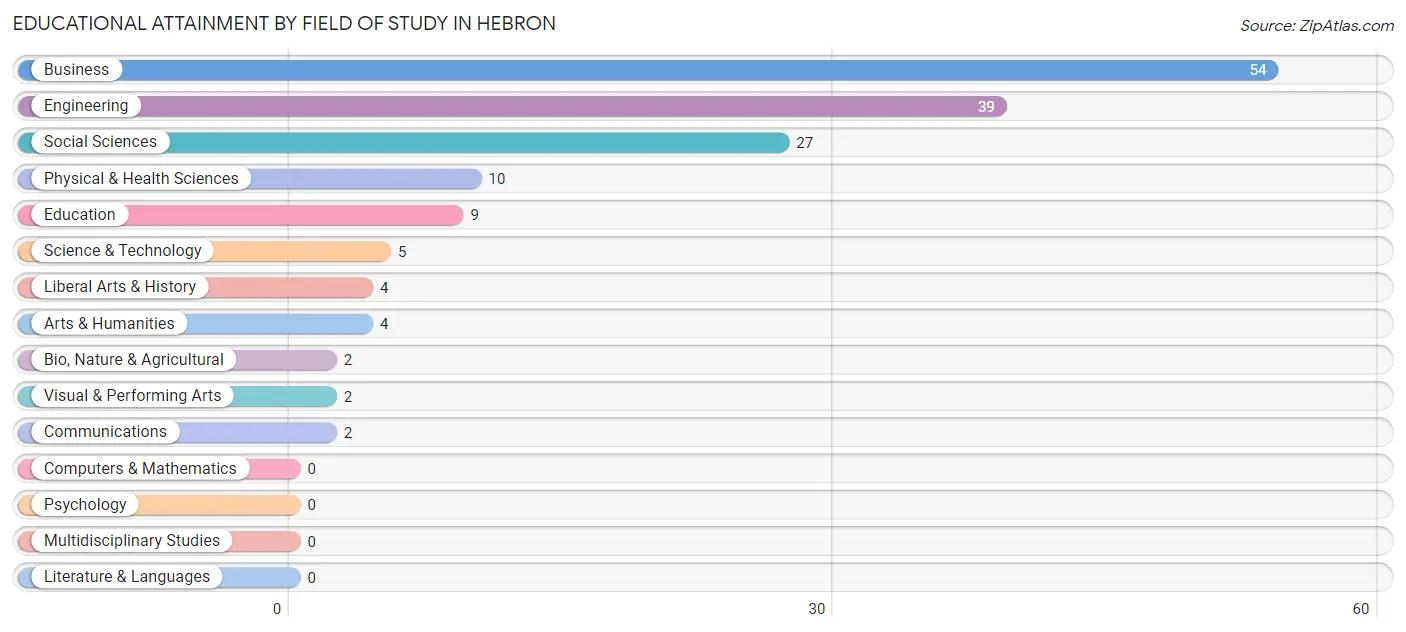
| Field of Study | # Graduates | % Graduates |
| Computers & Mathematics | 0 | 0.0% |
| Bio, Nature & Agricultural | 2 | 1.3% |
| Physical & Health Sciences | 10 | 6.3% |
| Psychology | 0 | 0.0% |
| Social Sciences | 27 | 17.1% |
| Engineering | 39 | 24.7% |
| Multidisciplinary Studies | 0 | 0.0% |
| Science & Technology | 5 | 3.2% |
| Business | 54 | 34.2% |
| Education | 9 | 5.7% |
| Literature & Languages | 0 | 0.0% |
| Liberal Arts & History | 4 | 2.5% |
| Visual & Performing Arts | 2 | 1.3% |
| Communications | 2 | 1.3% |
| Arts & Humanities | 4 | 2.5% |
| Total | 158 | 100.0% |
Transportation & Commute in Hebron
Vehicle Availability by Sex in Hebron
The most prevalent vehicle ownership categories in Hebron are males with 2 vehicles (47, accounting for 45.6%) and females with 2 vehicles (49, making up 52.2%).
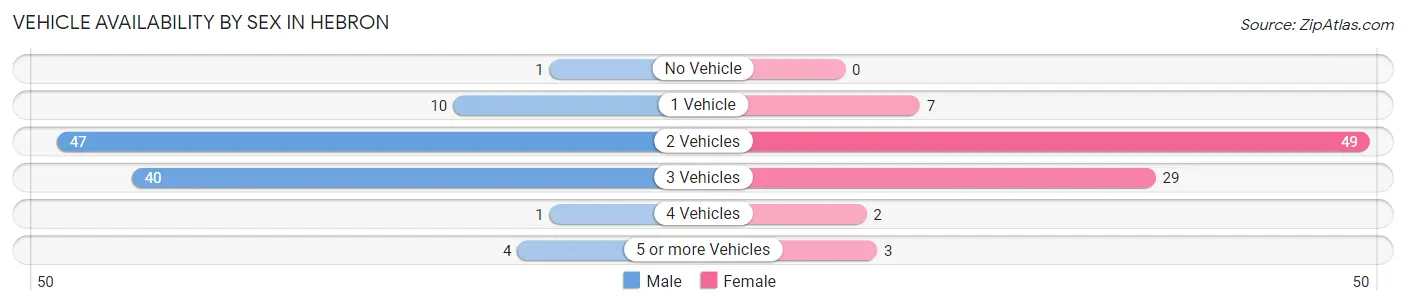
| Vehicles Available | Male | Female |
| No Vehicle | 1 (1.0%) | 0 (0.0%) |
| 1 Vehicle | 10 (9.7%) | 7 (7.8%) |
| 2 Vehicles | 47 (45.6%) | 49 (54.4%) |
| 3 Vehicles | 40 (38.8%) | 29 (32.2%) |
| 4 Vehicles | 1 (1.0%) | 2 (2.2%) |
| 5 or more Vehicles | 4 (3.9%) | 3 (3.3%) |
| Total | 103 (100.0%) | 90 (100.0%) |
Commute Time in Hebron
The most frequently occuring commute durations in Hebron are 20 to 24 minutes (33 commuters, 22.8%), 35 to 39 minutes (32 commuters, 22.1%), and 5 to 9 minutes (26 commuters, 17.9%).
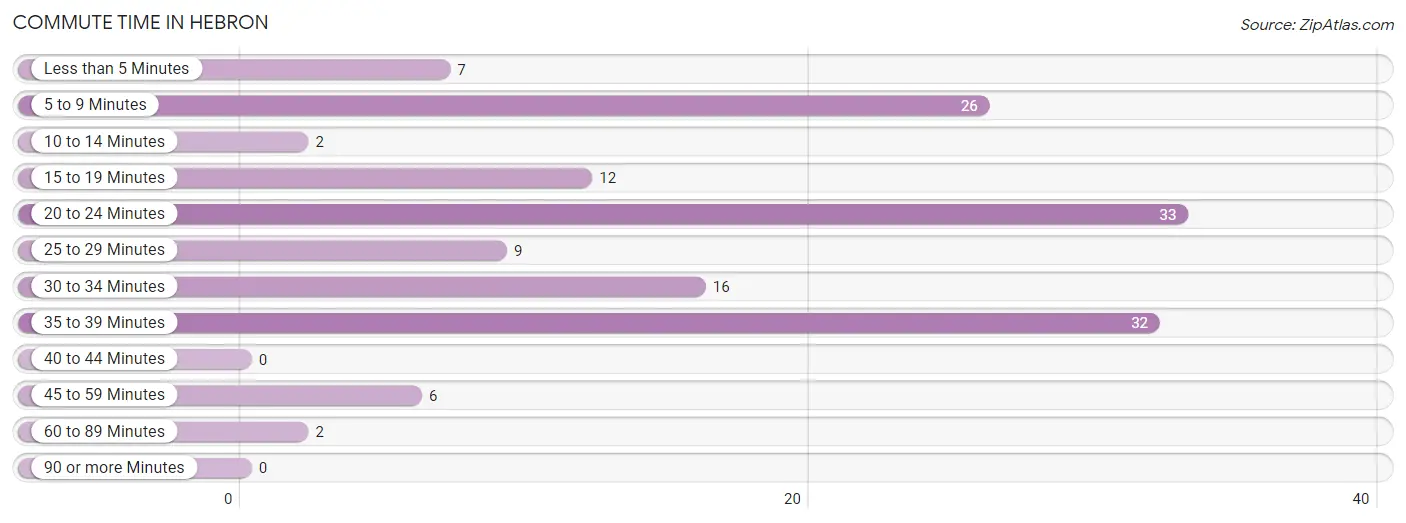
| Commute Time | # Commuters | % Commuters |
| Less than 5 Minutes | 7 | 4.8% |
| 5 to 9 Minutes | 26 | 17.9% |
| 10 to 14 Minutes | 2 | 1.4% |
| 15 to 19 Minutes | 12 | 8.3% |
| 20 to 24 Minutes | 33 | 22.8% |
| 25 to 29 Minutes | 9 | 6.2% |
| 30 to 34 Minutes | 16 | 11.0% |
| 35 to 39 Minutes | 32 | 22.1% |
| 40 to 44 Minutes | 0 | 0.0% |
| 45 to 59 Minutes | 6 | 4.1% |
| 60 to 89 Minutes | 2 | 1.4% |
| 90 or more Minutes | 0 | 0.0% |
Commute Time by Sex in Hebron
The most common commute times in Hebron are 35 to 39 minutes (29 commuters, 43.9%) for males and 20 to 24 minutes (28 commuters, 35.4%) for females.
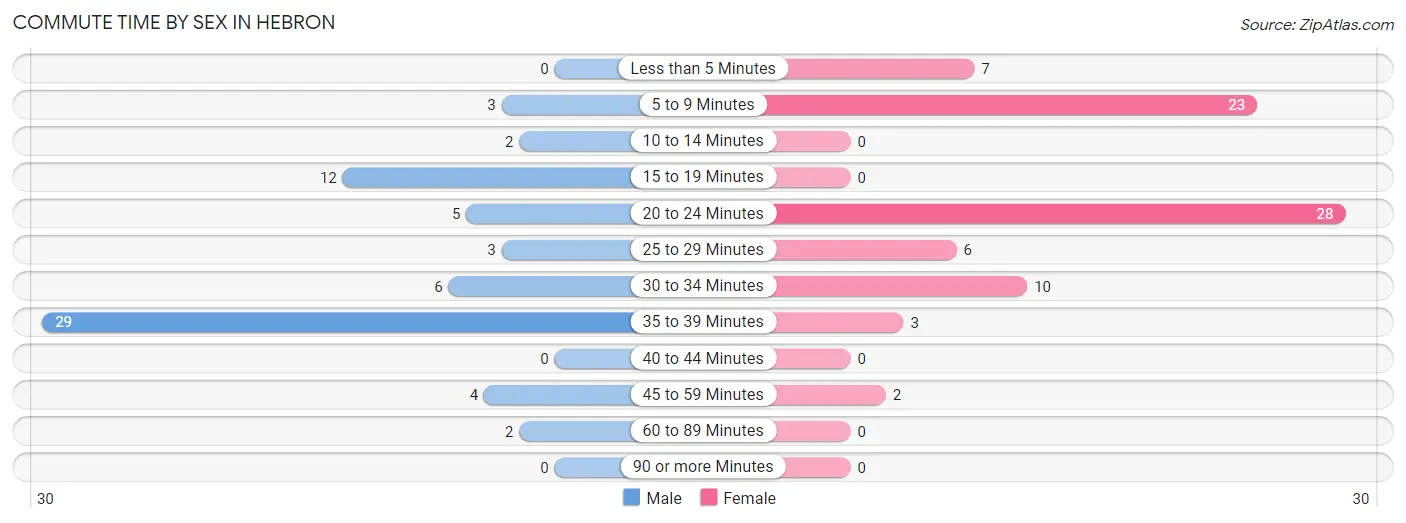
| Commute Time | Male | Female |
| Less than 5 Minutes | 0 (0.0%) | 7 (8.9%) |
| 5 to 9 Minutes | 3 (4.5%) | 23 (29.1%) |
| 10 to 14 Minutes | 2 (3.0%) | 0 (0.0%) |
| 15 to 19 Minutes | 12 (18.2%) | 0 (0.0%) |
| 20 to 24 Minutes | 5 (7.6%) | 28 (35.4%) |
| 25 to 29 Minutes | 3 (4.5%) | 6 (7.6%) |
| 30 to 34 Minutes | 6 (9.1%) | 10 (12.7%) |
| 35 to 39 Minutes | 29 (43.9%) | 3 (3.8%) |
| 40 to 44 Minutes | 0 (0.0%) | 0 (0.0%) |
| 45 to 59 Minutes | 4 (6.1%) | 2 (2.5%) |
| 60 to 89 Minutes | 2 (3.0%) | 0 (0.0%) |
| 90 or more Minutes | 0 (0.0%) | 0 (0.0%) |
Time of Departure to Work by Sex in Hebron
The most frequent times of departure to work in Hebron are 6:30 AM to 6:59 AM (30, 45.5%) for males and 8:00 AM to 8:29 AM (32, 40.5%) for females.
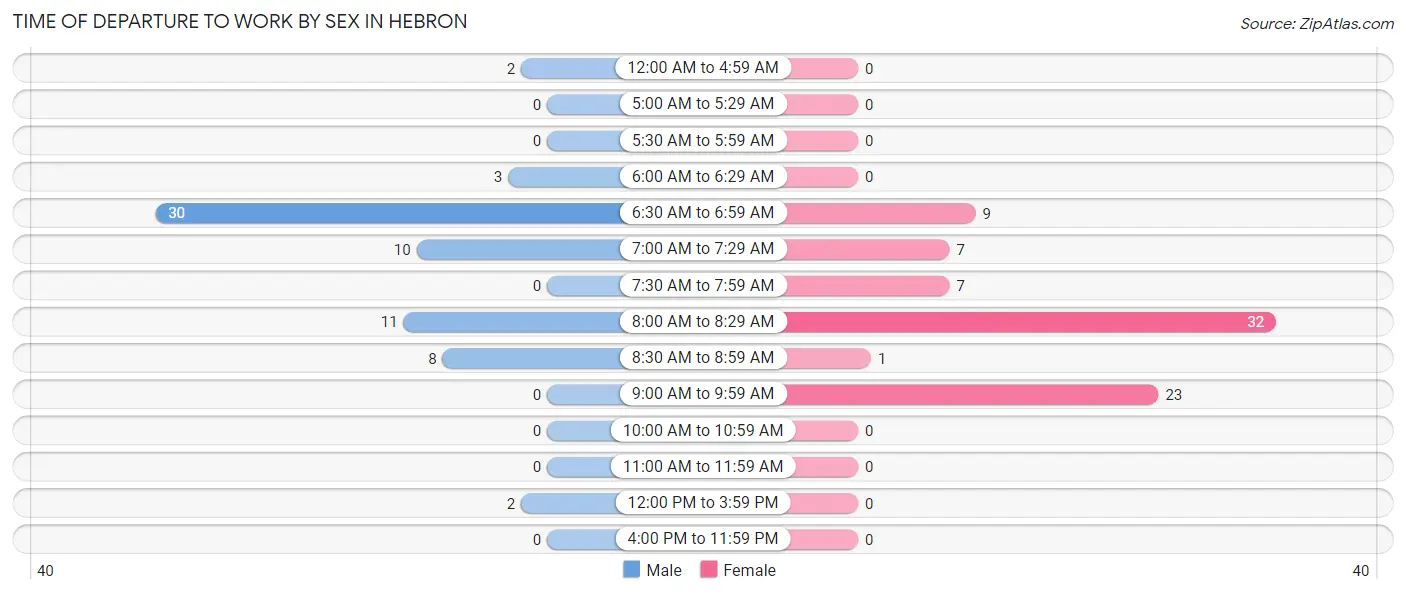
| Time of Departure | Male | Female |
| 12:00 AM to 4:59 AM | 2 (3.0%) | 0 (0.0%) |
| 5:00 AM to 5:29 AM | 0 (0.0%) | 0 (0.0%) |
| 5:30 AM to 5:59 AM | 0 (0.0%) | 0 (0.0%) |
| 6:00 AM to 6:29 AM | 3 (4.5%) | 0 (0.0%) |
| 6:30 AM to 6:59 AM | 30 (45.5%) | 9 (11.4%) |
| 7:00 AM to 7:29 AM | 10 (15.1%) | 7 (8.9%) |
| 7:30 AM to 7:59 AM | 0 (0.0%) | 7 (8.9%) |
| 8:00 AM to 8:29 AM | 11 (16.7%) | 32 (40.5%) |
| 8:30 AM to 8:59 AM | 8 (12.1%) | 1 (1.3%) |
| 9:00 AM to 9:59 AM | 0 (0.0%) | 23 (29.1%) |
| 10:00 AM to 10:59 AM | 0 (0.0%) | 0 (0.0%) |
| 11:00 AM to 11:59 AM | 0 (0.0%) | 0 (0.0%) |
| 12:00 PM to 3:59 PM | 2 (3.0%) | 0 (0.0%) |
| 4:00 PM to 11:59 PM | 0 (0.0%) | 0 (0.0%) |
| Total | 66 (100.0%) | 79 (100.0%) |
Housing Occupancy in Hebron
Occupancy by Ownership in Hebron
Of the total 133 dwellings in Hebron, owner-occupied units account for 120 (90.2%), while renter-occupied units make up 13 (9.8%).
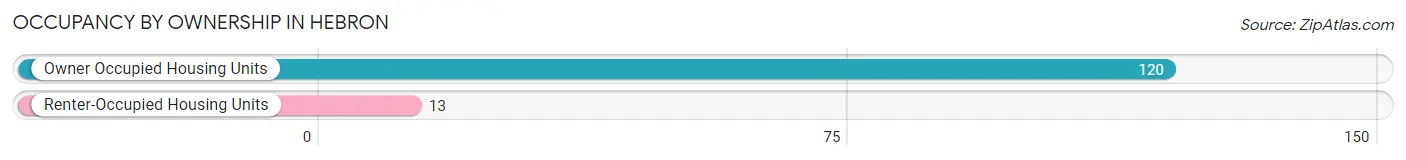
| Occupancy | # Housing Units | % Housing Units |
| Owner Occupied Housing Units | 120 | 90.2% |
| Renter-Occupied Housing Units | 13 | 9.8% |
| Total Occupied Housing Units | 133 | 100.0% |
Occupancy by Household Size in Hebron
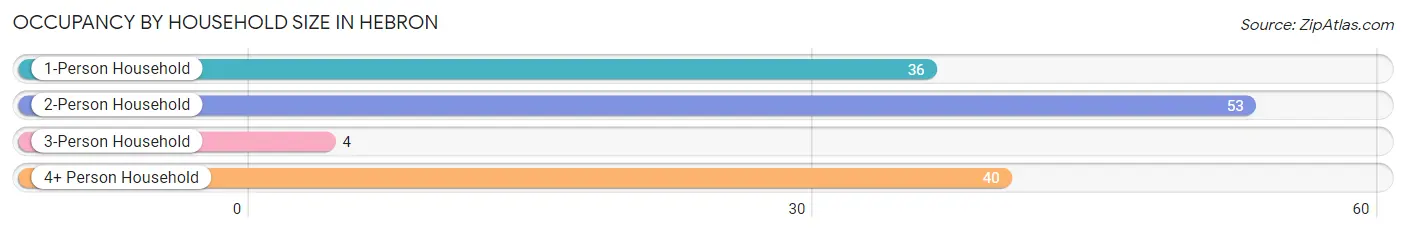
| Household Size | # Housing Units | % Housing Units |
| 1-Person Household | 36 | 27.1% |
| 2-Person Household | 53 | 39.9% |
| 3-Person Household | 4 | 3.0% |
| 4+ Person Household | 40 | 30.1% |
| Total Housing Units | 133 | 100.0% |
Occupancy by Ownership by Household Size in Hebron
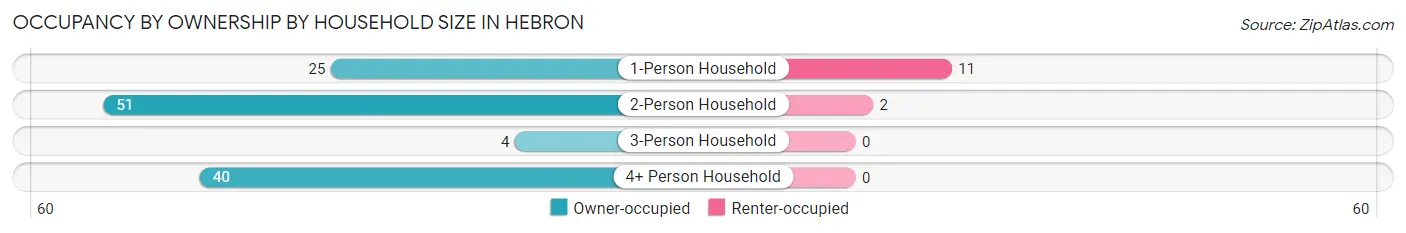
| Household Size | Owner-occupied | Renter-occupied |
| 1-Person Household | 25 (69.4%) | 11 (30.6%) |
| 2-Person Household | 51 (96.2%) | 2 (3.8%) |
| 3-Person Household | 4 (100.0%) | 0 (0.0%) |
| 4+ Person Household | 40 (100.0%) | 0 (0.0%) |
| Total Housing Units | 120 (90.2%) | 13 (9.8%) |
Occupancy by Educational Attainment in Hebron
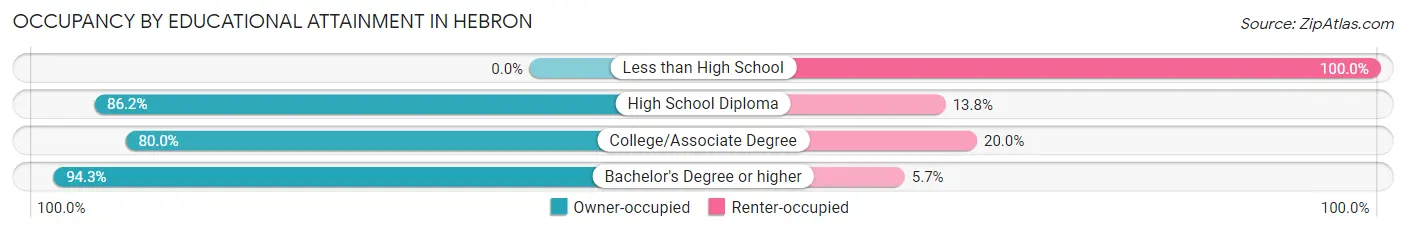
| Household Size | Owner-occupied | Renter-occupied |
| Less than High School | 0 (0.0%) | 1 (100.0%) |
| High School Diploma | 25 (86.2%) | 4 (13.8%) |
| College/Associate Degree | 12 (80.0%) | 3 (20.0%) |
| Bachelor's Degree or higher | 83 (94.3%) | 5 (5.7%) |
Occupancy by Age of Householder in Hebron
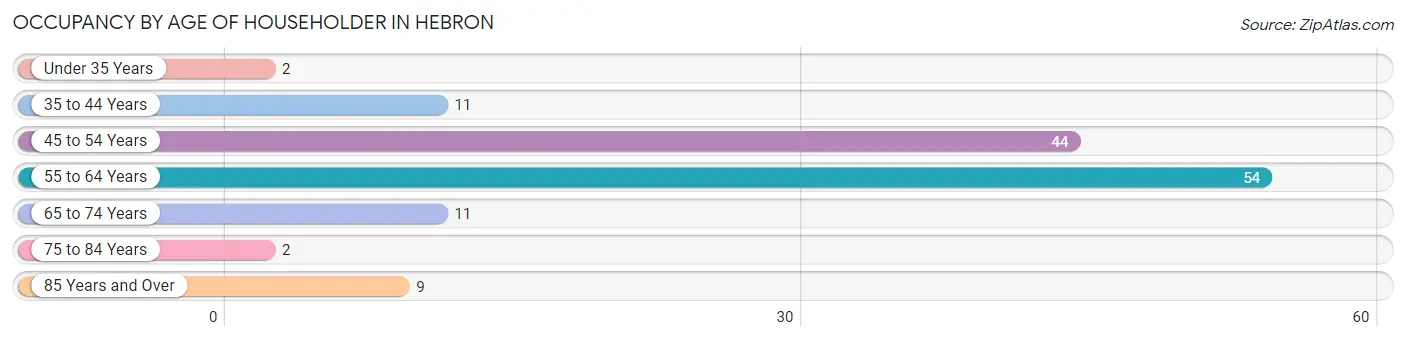
| Age Bracket | # Households | % Households |
| Under 35 Years | 2 | 1.5% |
| 35 to 44 Years | 11 | 8.3% |
| 45 to 54 Years | 44 | 33.1% |
| 55 to 64 Years | 54 | 40.6% |
| 65 to 74 Years | 11 | 8.3% |
| 75 to 84 Years | 2 | 1.5% |
| 85 Years and Over | 9 | 6.8% |
| Total | 133 | 100.0% |
Housing Finances in Hebron
Median Income by Occupancy in Hebron
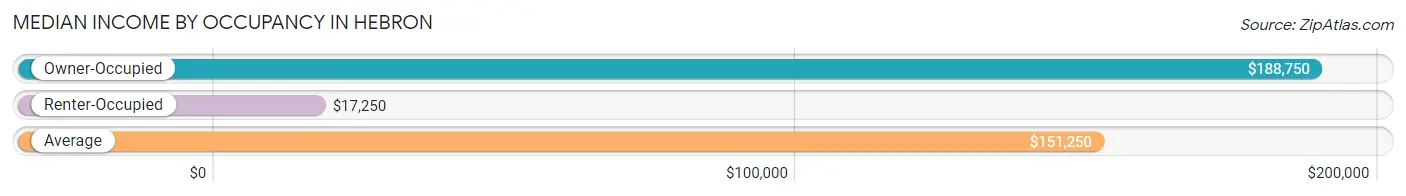
| Occupancy Type | # Households | Median Income |
| Owner-Occupied | 120 (90.2%) | $188,750 |
| Renter-Occupied | 13 (9.8%) | $17,250 |
| Average | 133 (100.0%) | $151,250 |
Occupancy by Householder Income Bracket in Hebron
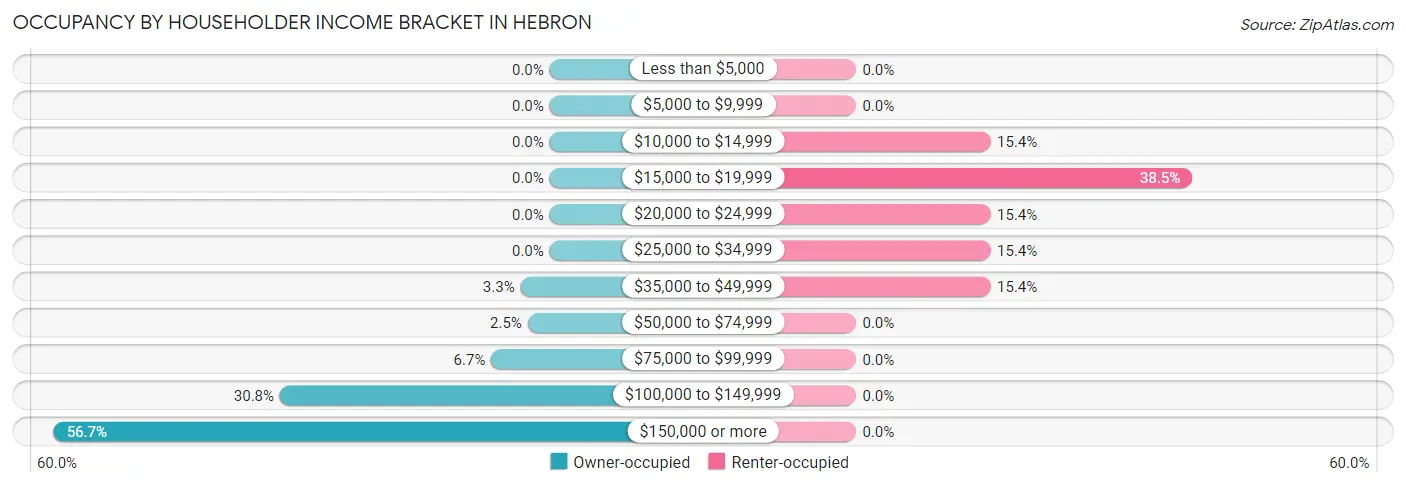
| Income Bracket | Owner-occupied | Renter-occupied |
| Less than $5,000 | 0 (0.0%) | 0 (0.0%) |
| $5,000 to $9,999 | 0 (0.0%) | 0 (0.0%) |
| $10,000 to $14,999 | 0 (0.0%) | 2 (15.4%) |
| $15,000 to $19,999 | 0 (0.0%) | 5 (38.5%) |
| $20,000 to $24,999 | 0 (0.0%) | 2 (15.4%) |
| $25,000 to $34,999 | 0 (0.0%) | 2 (15.4%) |
| $35,000 to $49,999 | 4 (3.3%) | 2 (15.4%) |
| $50,000 to $74,999 | 3 (2.5%) | 0 (0.0%) |
| $75,000 to $99,999 | 8 (6.7%) | 0 (0.0%) |
| $100,000 to $149,999 | 37 (30.8%) | 0 (0.0%) |
| $150,000 or more | 68 (56.7%) | 0 (0.0%) |
| Total | 120 (100.0%) | 13 (100.0%) |
Monthly Housing Cost Tiers in Hebron
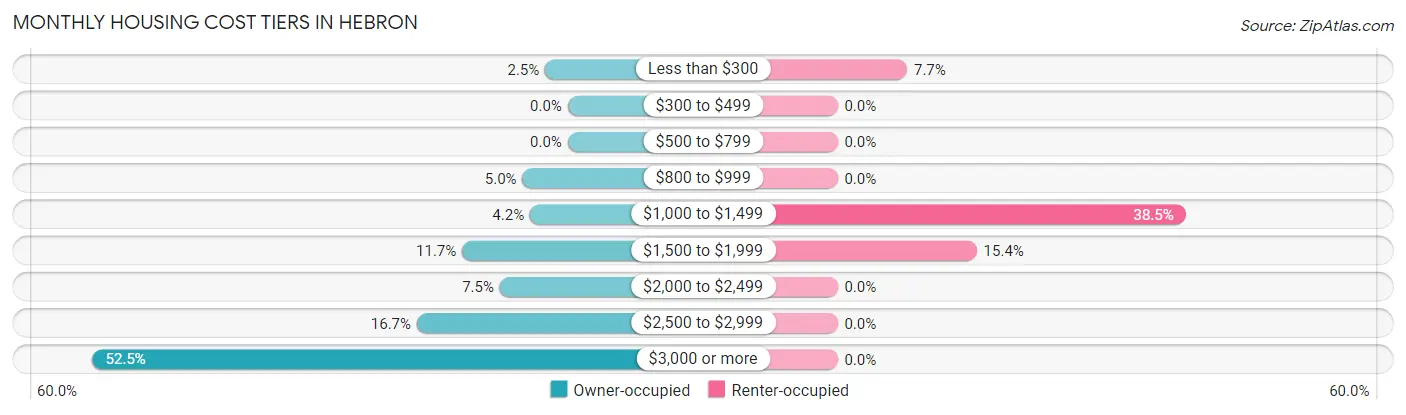
| Monthly Cost | Owner-occupied | Renter-occupied |
| Less than $300 | 3 (2.5%) | 1 (7.7%) |
| $300 to $499 | 0 (0.0%) | 0 (0.0%) |
| $500 to $799 | 0 (0.0%) | 0 (0.0%) |
| $800 to $999 | 6 (5.0%) | 0 (0.0%) |
| $1,000 to $1,499 | 5 (4.2%) | 5 (38.5%) |
| $1,500 to $1,999 | 14 (11.7%) | 2 (15.4%) |
| $2,000 to $2,499 | 9 (7.5%) | 0 (0.0%) |
| $2,500 to $2,999 | 20 (16.7%) | 0 (0.0%) |
| $3,000 or more | 63 (52.5%) | 0 (0.0%) |
| Total | 120 (100.0%) | 13 (100.0%) |
Physical Housing Characteristics in Hebron
Housing Structures in Hebron
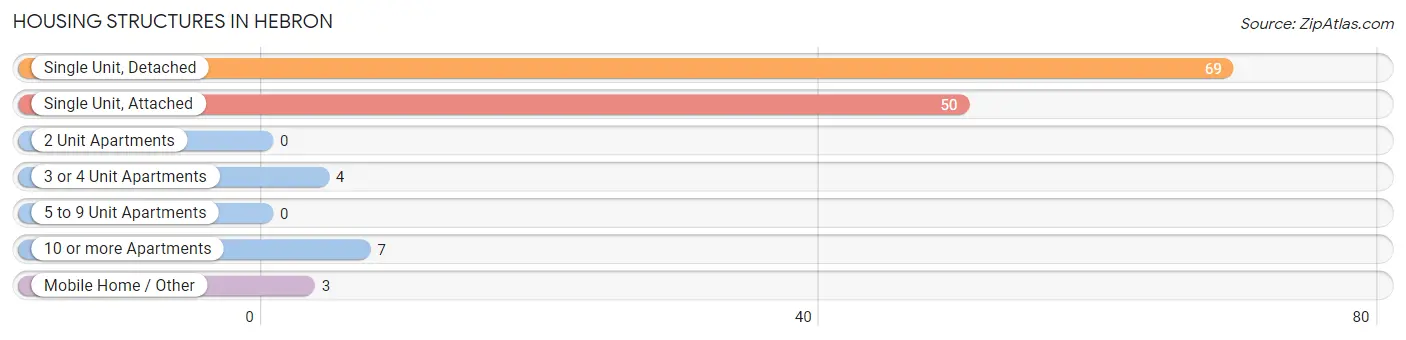
| Structure Type | # Housing Units | % Housing Units |
| Single Unit, Detached | 69 | 51.9% |
| Single Unit, Attached | 50 | 37.6% |
| 2 Unit Apartments | 0 | 0.0% |
| 3 or 4 Unit Apartments | 4 | 3.0% |
| 5 to 9 Unit Apartments | 0 | 0.0% |
| 10 or more Apartments | 7 | 5.3% |
| Mobile Home / Other | 3 | 2.3% |
| Total | 133 | 100.0% |
Housing Structures by Occupancy in Hebron
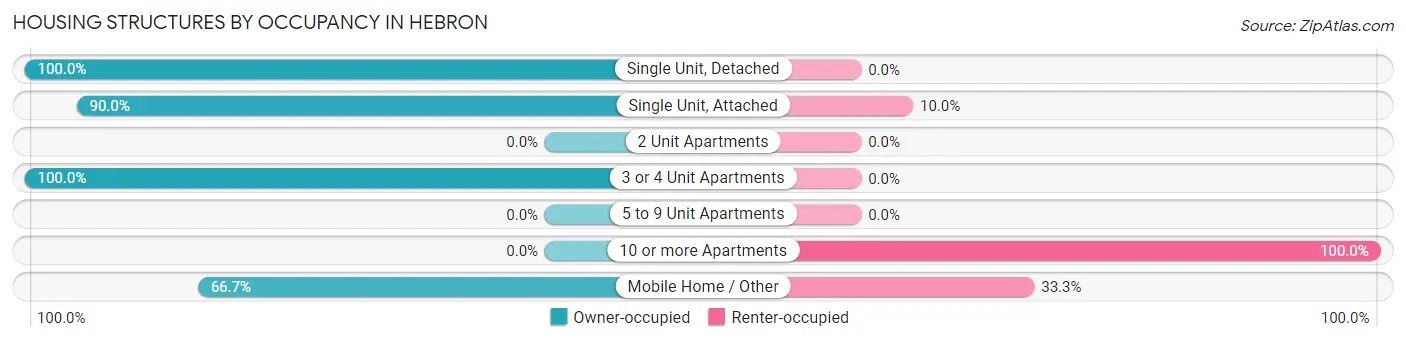
| Structure Type | Owner-occupied | Renter-occupied |
| Single Unit, Detached | 69 (100.0%) | 0 (0.0%) |
| Single Unit, Attached | 45 (90.0%) | 5 (10.0%) |
| 2 Unit Apartments | 0 (0.0%) | 0 (0.0%) |
| 3 or 4 Unit Apartments | 4 (100.0%) | 0 (0.0%) |
| 5 to 9 Unit Apartments | 0 (0.0%) | 0 (0.0%) |
| 10 or more Apartments | 0 (0.0%) | 7 (100.0%) |
| Mobile Home / Other | 2 (66.7%) | 1 (33.3%) |
| Total | 120 (90.2%) | 13 (9.8%) |
Housing Structures by Number of Rooms in Hebron
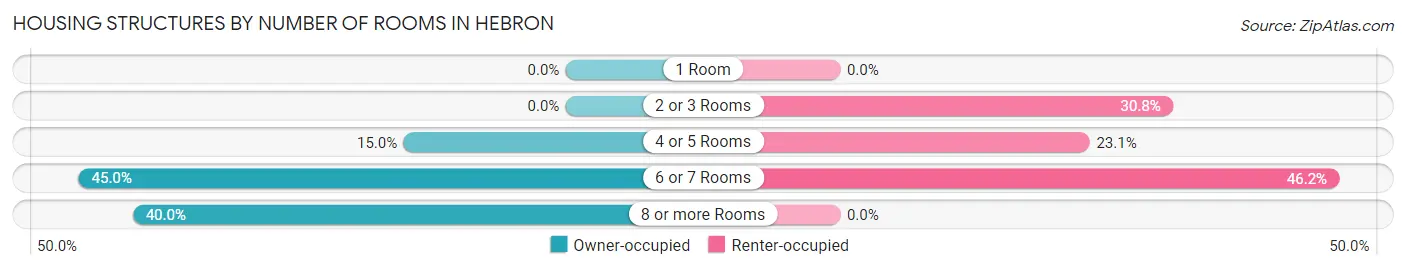
| Number of Rooms | Owner-occupied | Renter-occupied |
| 1 Room | 0 (0.0%) | 0 (0.0%) |
| 2 or 3 Rooms | 0 (0.0%) | 4 (30.8%) |
| 4 or 5 Rooms | 18 (15.0%) | 3 (23.1%) |
| 6 or 7 Rooms | 54 (45.0%) | 6 (46.2%) |
| 8 or more Rooms | 48 (40.0%) | 0 (0.0%) |
| Total | 120 (100.0%) | 13 (100.0%) |
Housing Structure by Heating Type in Hebron
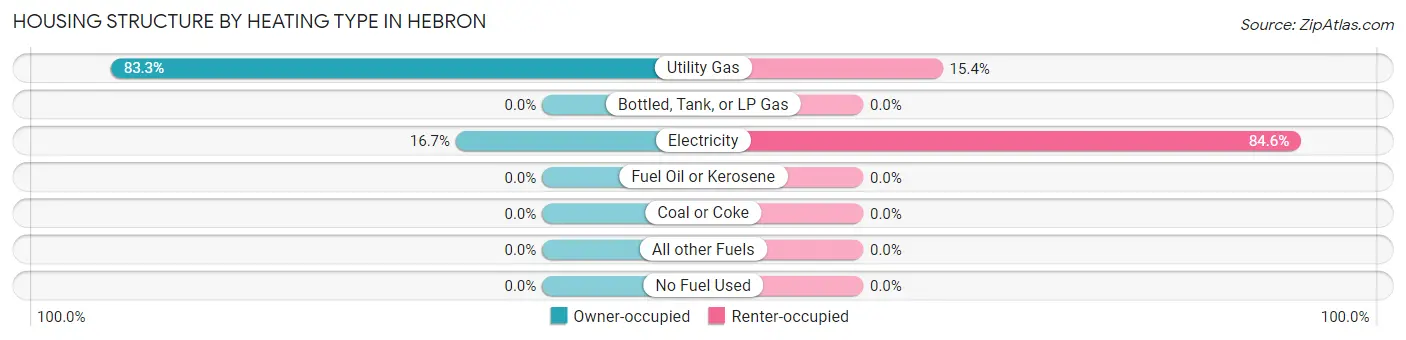
| Heating Type | Owner-occupied | Renter-occupied |
| Utility Gas | 100 (83.3%) | 2 (15.4%) |
| Bottled, Tank, or LP Gas | 0 (0.0%) | 0 (0.0%) |
| Electricity | 20 (16.7%) | 11 (84.6%) |
| Fuel Oil or Kerosene | 0 (0.0%) | 0 (0.0%) |
| Coal or Coke | 0 (0.0%) | 0 (0.0%) |
| All other Fuels | 0 (0.0%) | 0 (0.0%) |
| No Fuel Used | 0 (0.0%) | 0 (0.0%) |
| Total | 120 (100.0%) | 13 (100.0%) |
Household Vehicle Usage in Hebron
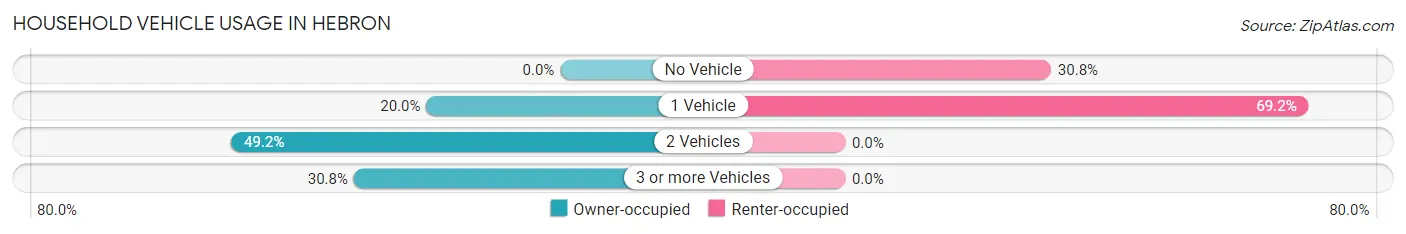
| Vehicles per Household | Owner-occupied | Renter-occupied |
| No Vehicle | 0 (0.0%) | 4 (30.8%) |
| 1 Vehicle | 24 (20.0%) | 9 (69.2%) |
| 2 Vehicles | 59 (49.2%) | 0 (0.0%) |
| 3 or more Vehicles | 37 (30.8%) | 0 (0.0%) |
| Total | 120 (100.0%) | 13 (100.0%) |
Real Estate & Mortgages in Hebron
Real Estate and Mortgage Overview in Hebron
| Characteristic | Without Mortgage | With Mortgage |
| Housing Units | 16 | 104 |
| Median Property Value | $357,100 | $440,500 |
| Median Household Income | $90,625 | $66 |
| Monthly Housing Costs | $983 | $63 |
| Real Estate Taxes | - | - |
Property Value by Mortgage Status in Hebron
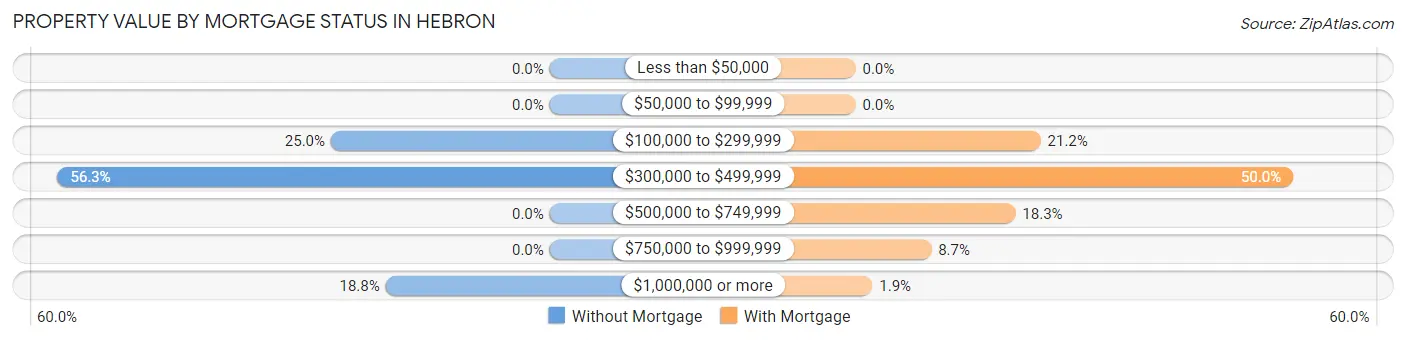
| Property Value | Without Mortgage | With Mortgage |
| Less than $50,000 | 0 (0.0%) | 0 (0.0%) |
| $50,000 to $99,999 | 0 (0.0%) | 0 (0.0%) |
| $100,000 to $299,999 | 4 (25.0%) | 22 (21.1%) |
| $300,000 to $499,999 | 9 (56.2%) | 52 (50.0%) |
| $500,000 to $749,999 | 0 (0.0%) | 19 (18.3%) |
| $750,000 to $999,999 | 0 (0.0%) | 9 (8.6%) |
| $1,000,000 or more | 3 (18.8%) | 2 (1.9%) |
| Total | 16 (100.0%) | 104 (100.0%) |
Household Income by Mortgage Status in Hebron
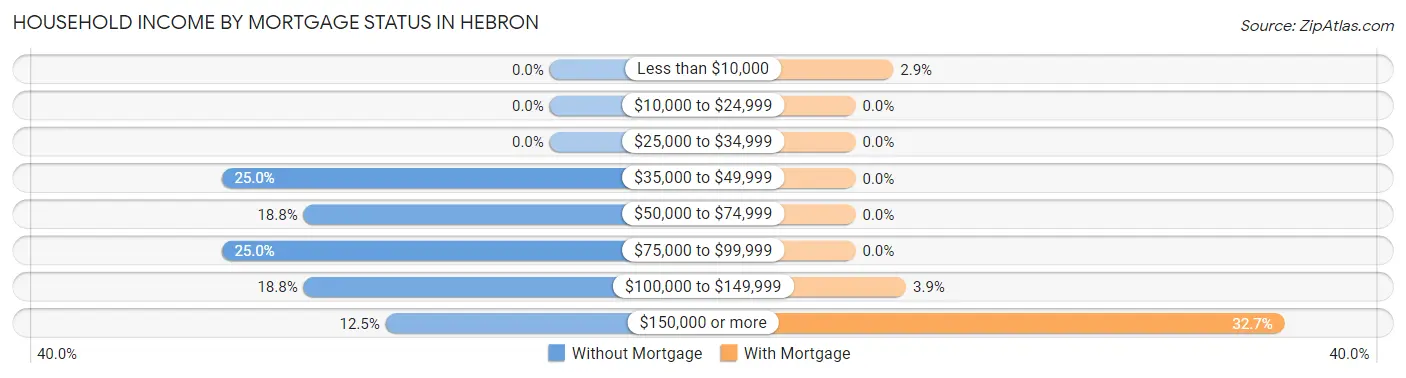
| Household Income | Without Mortgage | With Mortgage |
| Less than $10,000 | 0 (0.0%) | 3 (2.9%) |
| $10,000 to $24,999 | 0 (0.0%) | 0 (0.0%) |
| $25,000 to $34,999 | 0 (0.0%) | 0 (0.0%) |
| $35,000 to $49,999 | 4 (25.0%) | 0 (0.0%) |
| $50,000 to $74,999 | 3 (18.8%) | 0 (0.0%) |
| $75,000 to $99,999 | 4 (25.0%) | 0 (0.0%) |
| $100,000 to $149,999 | 3 (18.8%) | 4 (3.8%) |
| $150,000 or more | 2 (12.5%) | 34 (32.7%) |
| Total | 16 (100.0%) | 104 (100.0%) |
Property Value to Household Income Ratio in Hebron
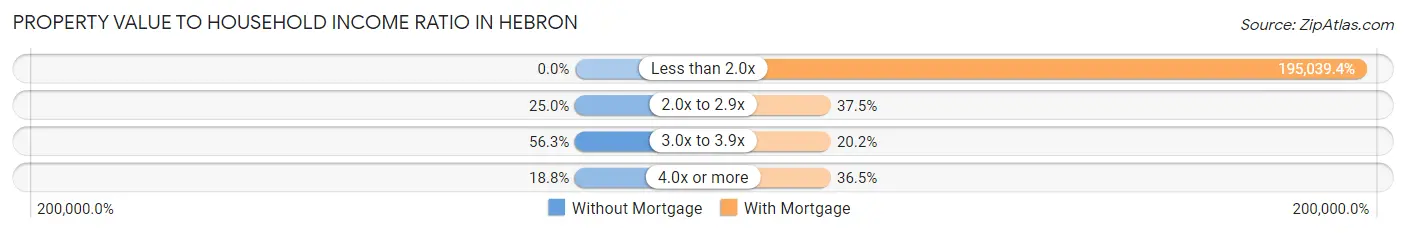
| Value-to-Income Ratio | Without Mortgage | With Mortgage |
| Less than 2.0x | 0 (0.0%) | 202,841 (195,039.4%) |
| 2.0x to 2.9x | 4 (25.0%) | 39 (37.5%) |
| 3.0x to 3.9x | 9 (56.2%) | 21 (20.2%) |
| 4.0x or more | 3 (18.8%) | 38 (36.5%) |
| Total | 16 (100.0%) | 104 (100.0%) |
Real Estate Taxes by Mortgage Status in Hebron
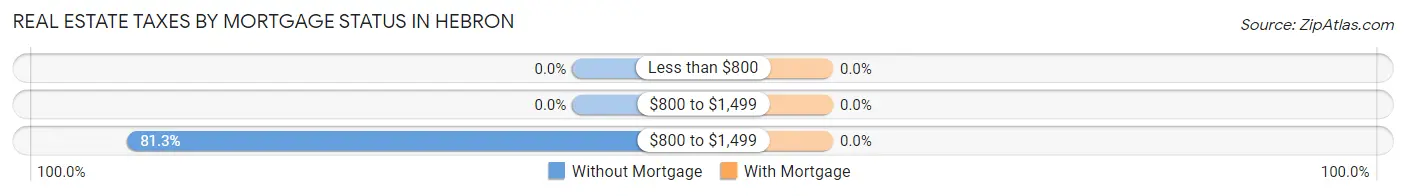
| Property Taxes | Without Mortgage | With Mortgage |
| Less than $800 | 0 (0.0%) | 0 (0.0%) |
| $800 to $1,499 | 0 (0.0%) | 0 (0.0%) |
| $800 to $1,499 | 13 (81.2%) | 0 (0.0%) |
| Total | 16 (100.0%) | 104 (100.0%) |
Health & Disability in Hebron
Health Insurance Coverage by Age in Hebron
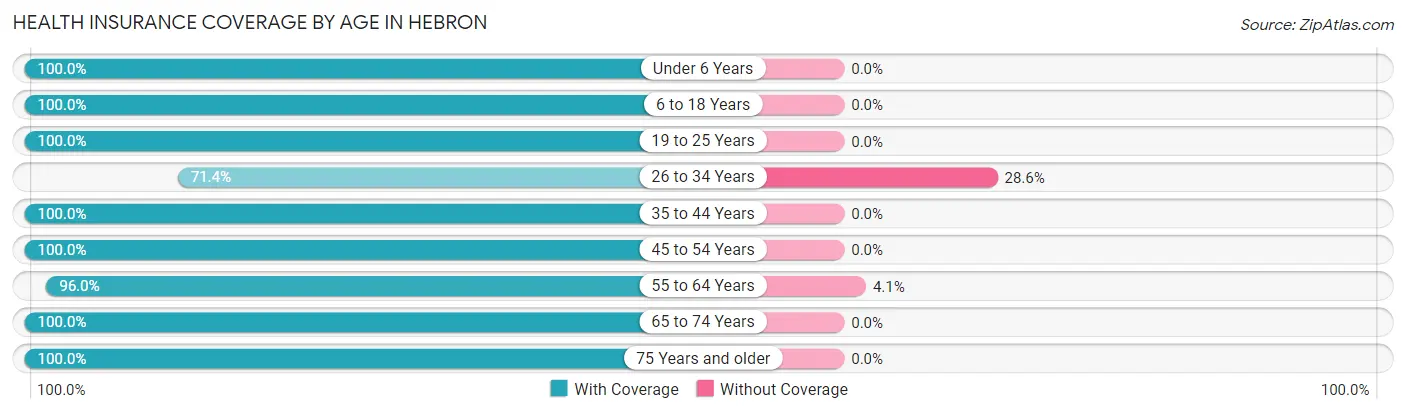
| Age Bracket | With Coverage | Without Coverage |
| Under 6 Years | 15 (100.0%) | 0 (0.0%) |
| 6 to 18 Years | 42 (100.0%) | 0 (0.0%) |
| 19 to 25 Years | 49 (100.0%) | 0 (0.0%) |
| 26 to 34 Years | 5 (71.4%) | 2 (28.6%) |
| 35 to 44 Years | 20 (100.0%) | 0 (0.0%) |
| 45 to 54 Years | 105 (100.0%) | 0 (0.0%) |
| 55 to 64 Years | 71 (96.0%) | 3 (4.1%) |
| 65 to 74 Years | 18 (100.0%) | 0 (0.0%) |
| 75 Years and older | 11 (100.0%) | 0 (0.0%) |
| Total | 336 (98.5%) | 5 (1.5%) |
Health Insurance Coverage by Citizenship Status in Hebron
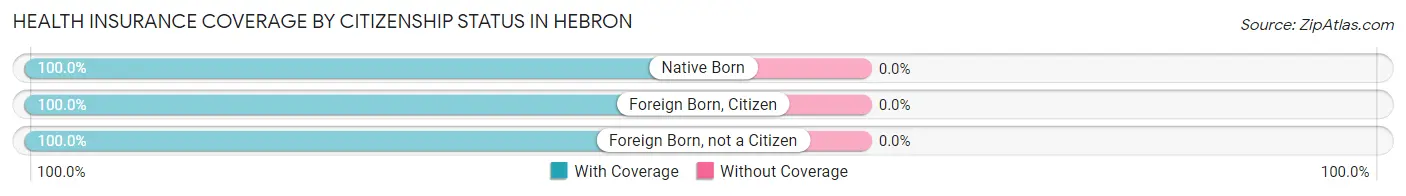
| Citizenship Status | With Coverage | Without Coverage |
| Native Born | 15 (100.0%) | 0 (0.0%) |
| Foreign Born, Citizen | 42 (100.0%) | 0 (0.0%) |
| Foreign Born, not a Citizen | 49 (100.0%) | 0 (0.0%) |
Health Insurance Coverage by Household Income in Hebron
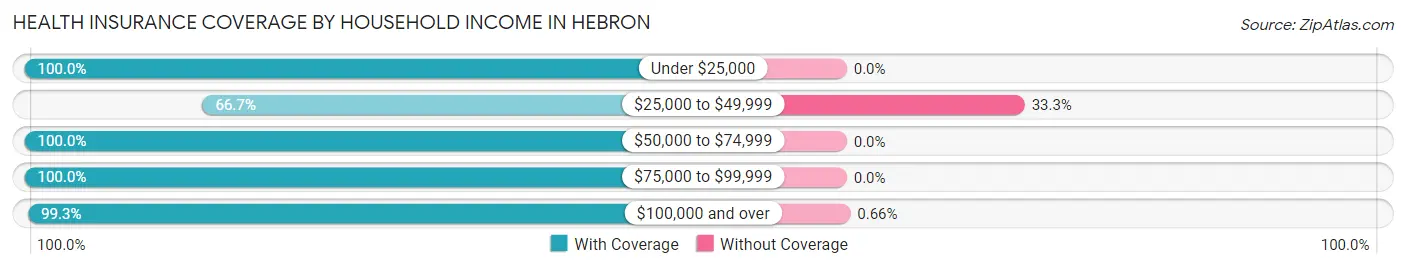
| Household Income | With Coverage | Without Coverage |
| Under $25,000 | 11 (100.0%) | 0 (0.0%) |
| $25,000 to $49,999 | 6 (66.7%) | 3 (33.3%) |
| $50,000 to $74,999 | 6 (100.0%) | 0 (0.0%) |
| $75,000 to $99,999 | 12 (100.0%) | 0 (0.0%) |
| $100,000 and over | 301 (99.3%) | 2 (0.7%) |
Public vs Private Health Insurance Coverage by Age in Hebron
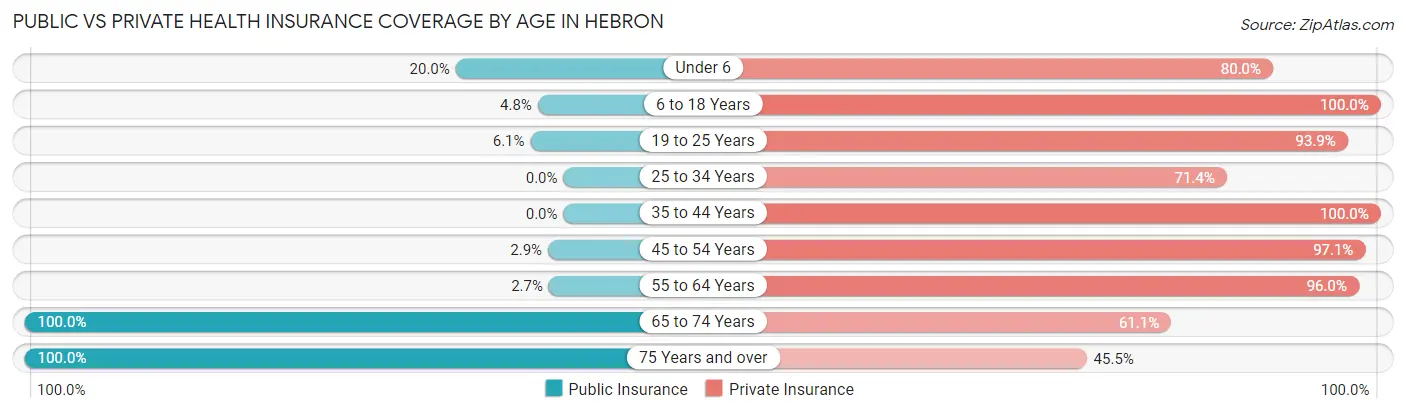
| Age Bracket | Public Insurance | Private Insurance |
| Under 6 | 3 (20.0%) | 12 (80.0%) |
| 6 to 18 Years | 2 (4.8%) | 42 (100.0%) |
| 19 to 25 Years | 3 (6.1%) | 46 (93.9%) |
| 25 to 34 Years | 0 (0.0%) | 5 (71.4%) |
| 35 to 44 Years | 0 (0.0%) | 20 (100.0%) |
| 45 to 54 Years | 3 (2.9%) | 102 (97.1%) |
| 55 to 64 Years | 2 (2.7%) | 71 (96.0%) |
| 65 to 74 Years | 18 (100.0%) | 11 (61.1%) |
| 75 Years and over | 11 (100.0%) | 5 (45.5%) |
| Total | 42 (12.3%) | 314 (92.1%) |
Disability Status by Sex by Age in Hebron
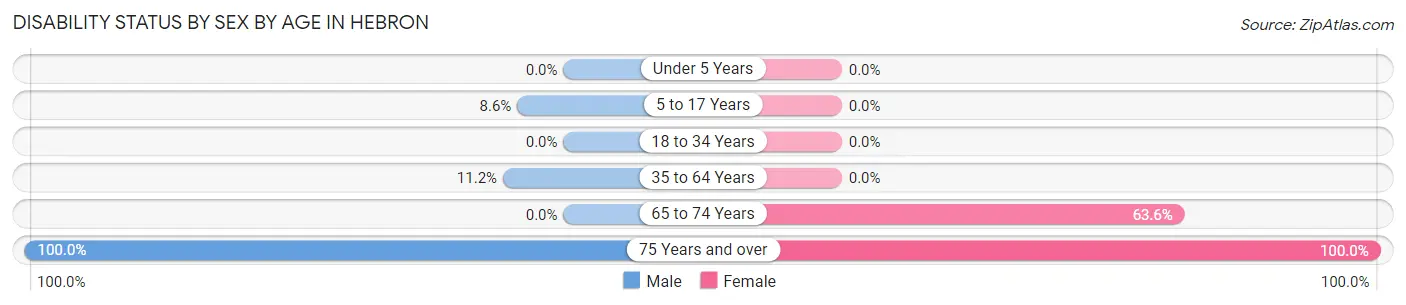
| Age Bracket | Male | Female |
| Under 5 Years | 0 (0.0%) | 0 (0.0%) |
| 5 to 17 Years | 3 (8.6%) | 0 (0.0%) |
| 18 to 34 Years | 0 (0.0%) | 0 (0.0%) |
| 35 to 64 Years | 11 (11.2%) | 0 (0.0%) |
| 65 to 74 Years | 0 (0.0%) | 7 (63.6%) |
| 75 Years and over | 2 (100.0%) | 9 (100.0%) |
Disability Class by Sex by Age in Hebron
Disability Class: Hearing Difficulty
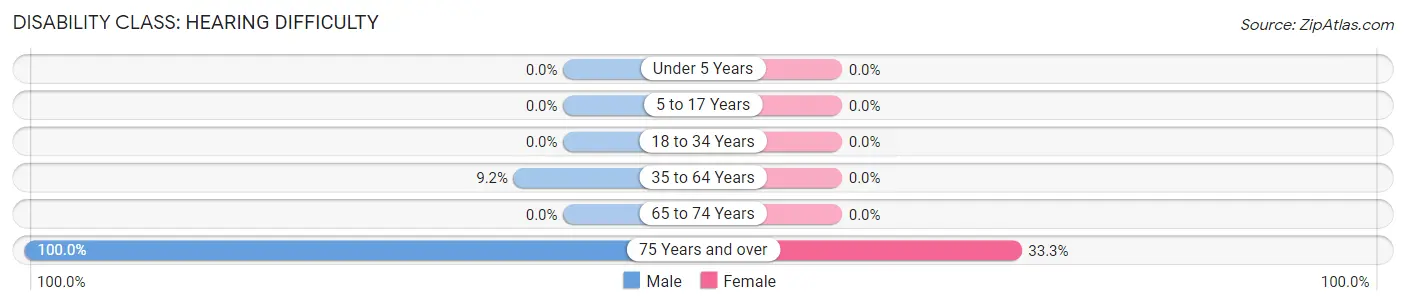
| Age Bracket | Male | Female |
| Under 5 Years | 0 (0.0%) | 0 (0.0%) |
| 5 to 17 Years | 0 (0.0%) | 0 (0.0%) |
| 18 to 34 Years | 0 (0.0%) | 0 (0.0%) |
| 35 to 64 Years | 9 (9.2%) | 0 (0.0%) |
| 65 to 74 Years | 0 (0.0%) | 0 (0.0%) |
| 75 Years and over | 2 (100.0%) | 3 (33.3%) |
Disability Class: Vision Difficulty
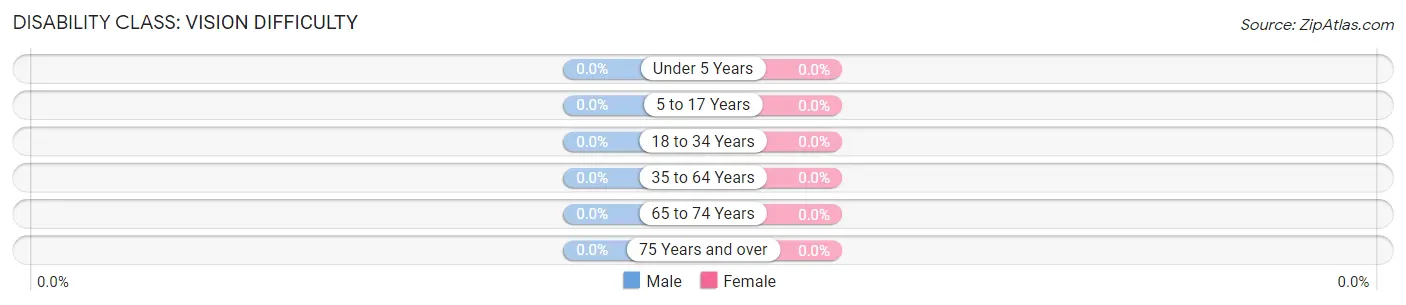
| Age Bracket | Male | Female |
| Under 5 Years | 0 (0.0%) | 0 (0.0%) |
| 5 to 17 Years | 0 (0.0%) | 0 (0.0%) |
| 18 to 34 Years | 0 (0.0%) | 0 (0.0%) |
| 35 to 64 Years | 0 (0.0%) | 0 (0.0%) |
| 65 to 74 Years | 0 (0.0%) | 0 (0.0%) |
| 75 Years and over | 0 (0.0%) | 0 (0.0%) |
Disability Class: Cognitive Difficulty
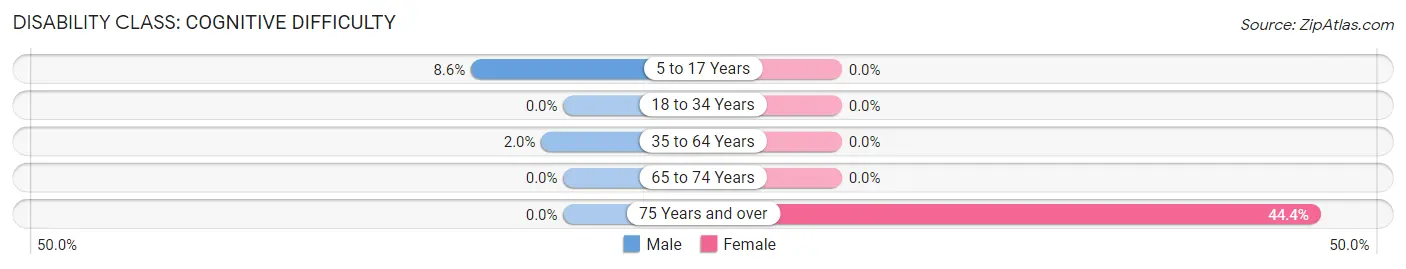
| Age Bracket | Male | Female |
| 5 to 17 Years | 3 (8.6%) | 0 (0.0%) |
| 18 to 34 Years | 0 (0.0%) | 0 (0.0%) |
| 35 to 64 Years | 2 (2.0%) | 0 (0.0%) |
| 65 to 74 Years | 0 (0.0%) | 0 (0.0%) |
| 75 Years and over | 0 (0.0%) | 4 (44.4%) |
Disability Class: Ambulatory Difficulty
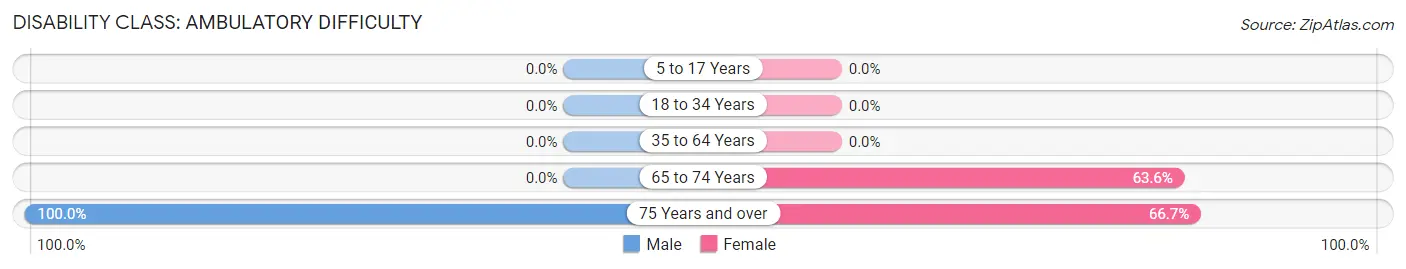
| Age Bracket | Male | Female |
| 5 to 17 Years | 0 (0.0%) | 0 (0.0%) |
| 18 to 34 Years | 0 (0.0%) | 0 (0.0%) |
| 35 to 64 Years | 0 (0.0%) | 0 (0.0%) |
| 65 to 74 Years | 0 (0.0%) | 7 (63.6%) |
| 75 Years and over | 2 (100.0%) | 6 (66.7%) |
Disability Class: Self-Care Difficulty
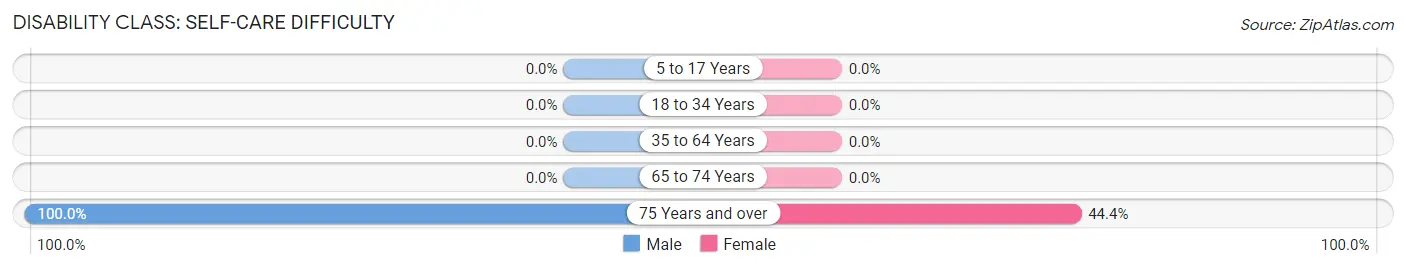
| Age Bracket | Male | Female |
| 5 to 17 Years | 0 (0.0%) | 0 (0.0%) |
| 18 to 34 Years | 0 (0.0%) | 0 (0.0%) |
| 35 to 64 Years | 0 (0.0%) | 0 (0.0%) |
| 65 to 74 Years | 0 (0.0%) | 0 (0.0%) |
| 75 Years and over | 2 (100.0%) | 4 (44.4%) |
Technology Access in Hebron
Computing Device Access in Hebron
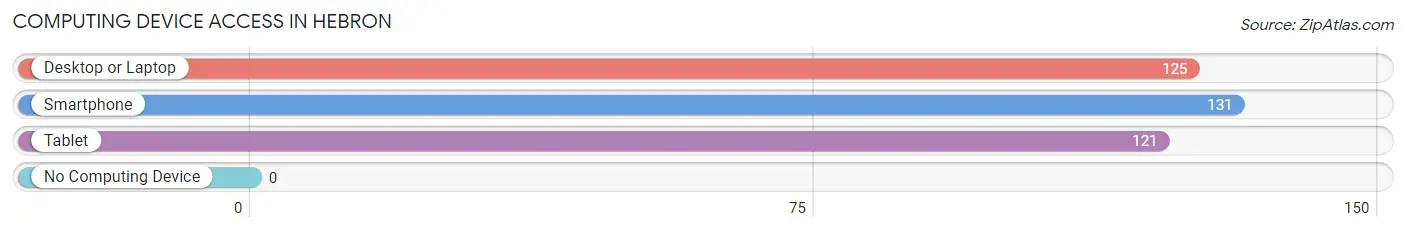
| Device Type | # Households | % Households |
| Desktop or Laptop | 125 | 94.0% |
| Smartphone | 131 | 98.5% |
| Tablet | 121 | 91.0% |
| No Computing Device | 0 | 0.0% |
| Total | 133 | 100.0% |
Internet Access in Hebron
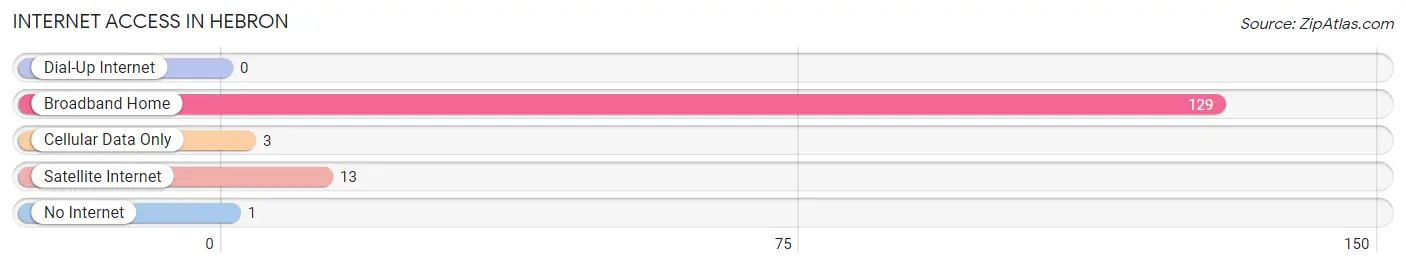
| Internet Type | # Households | % Households |
| Dial-Up Internet | 0 | 0.0% |
| Broadband Home | 129 | 97.0% |
| Cellular Data Only | 3 | 2.3% |
| Satellite Internet | 13 | 9.8% |
| No Internet | 1 | 0.7% |
| Total | 133 | 100.0% |
Hebron Summary
Hebron is a small town located in Denton County, Texas, United States. It is situated about 25 miles north of Dallas and is part of the Dallas-Fort Worth-Arlington metropolitan area. The town was founded in 1854 and was named after the biblical city of Hebron. As of the 2010 census, the population of Hebron was 1,845.
Geography
Hebron is located at 33°10'25" North, 97°7'25" West (33.173611, -97.123611). It is situated in the northern part of Denton County, about 25 miles north of Dallas. The town is bordered by the cities of Lewisville to the east, Flower Mound to the south, and Coppell to the west. The town has a total area of 1.2 square miles, all of which is land.
Climate
Hebron has a humid subtropical climate, with hot summers and mild winters. The average annual temperature is 68°F, with an average high of 91°F in the summer and an average low of 44°F in the winter. The average annual precipitation is 37.5 inches, with an average of 4.5 inches of snowfall per year.
Demographics
As of the 2010 census, there were 1,845 people, 690 households, and 517 families residing in Hebron. The population density was 1,539.2 people per square mile. The racial makeup of the town was 81.2% White, 8.2% African American, 0.2% Native American, 5.2% Asian, 0.1% Pacific Islander, 3.2% from other races, and 1.9% from two or more races. Hispanic or Latino of any race were 8.7% of the population.
There were 690 households, out of which 37.2% had children under the age of 18 living with them, 58.3% were married couples living together, 10.1% had a female householder with no husband present, and 27.2% were non-families. 22.2% of all households were made up of individuals, and 5.2% had someone living alone who was 65 years of age or older. The average household size was 2.68 and the average family size was 3.17.
The median age in Hebron was 36.2 years. 25.7% of residents were under the age of 18; 7.2% were between the ages of 18 and 24; 30.2% were from 25 to 44; 28.2% were from 45 to 64; and 8.7% were 65 years of age or older. The gender makeup of the town was 49.2% male and 50.8% female.
Economy
Hebron is a small town with a limited economy. The town is home to several small businesses, including a grocery store, a hardware store, a pharmacy, and a few restaurants. The town also has a few manufacturing companies, including a plastics manufacturer and a metal fabrication company. The town is also home to a few small farms.
The median household income in Hebron was $63,958 in 2019, and the median family income was $76,917. The per capita income for the town was $30,945. About 6.2% of families and 8.3% of the population were below the poverty line, including 10.2% of those under age 18 and 6.3% of those age 65 or over.
History
Hebron was founded in 1854 by a group of settlers from Tennessee. The town was named after the biblical city of Hebron. The town was originally a farming community, and the main crops grown were cotton, corn, and wheat.
In the late 19th century, Hebron began to grow and develop. The town was incorporated in 1891, and the first mayor was elected in 1892. The town was connected to the railroad in 1895, and the first bank was established in 1896.
In the early 20th century, Hebron continued to grow and develop. The town was connected to the electric grid in 1912, and the first telephone service was established in 1913. The town also had a school, a post office, and a few churches.
In the late 20th century, Hebron began to experience rapid growth. The town was connected to the interstate highway system in the 1980s, and the population of the town more than doubled between 1990 and 2000. The town has continued to grow since then, and the population was estimated to be 1,845 in 2019.
Common Questions
What is Per Capita Income in Hebron?
Per Capita income in Hebron is $74,124.
What is the Median Family Income in Hebron?
Median Family Income in Hebron is $196,250.
What is the Median Household income in Hebron?
Median Household Income in Hebron is $151,250.
What is Inequality or Gini Index in Hebron?
Inequality or Gini Index in Hebron is 0.33.
What is the Total Population of Hebron?
Total Population of Hebron is 341.
What is the Total Male Population of Hebron?
Total Male Population of Hebron is 163.
What is the Total Female Population of Hebron?
Total Female Population of Hebron is 178.
What is the Ratio of Males per 100 Females in Hebron?
There are 91.57 Males per 100 Females in Hebron.
What is the Ratio of Females per 100 Males in Hebron?
There are 109.20 Females per 100 Males in Hebron.
What is the Median Population Age in Hebron?
Median Population Age in Hebron is 46.5 Years.
What is the Average Family Size in Hebron
Average Family Size in Hebron is 3.2 People.
What is the Average Household Size in Hebron
Average Household Size in Hebron is 2.6 People.
How Large is the Labor Force in Hebron?
There are 203 People in the Labor Forcein in Hebron.
What is the Percentage of People in the Labor Force in Hebron?
63.8% of People are in the Labor Force in Hebron.