Hurstbourne, KY Map & Demographics
Hurstbourne Map
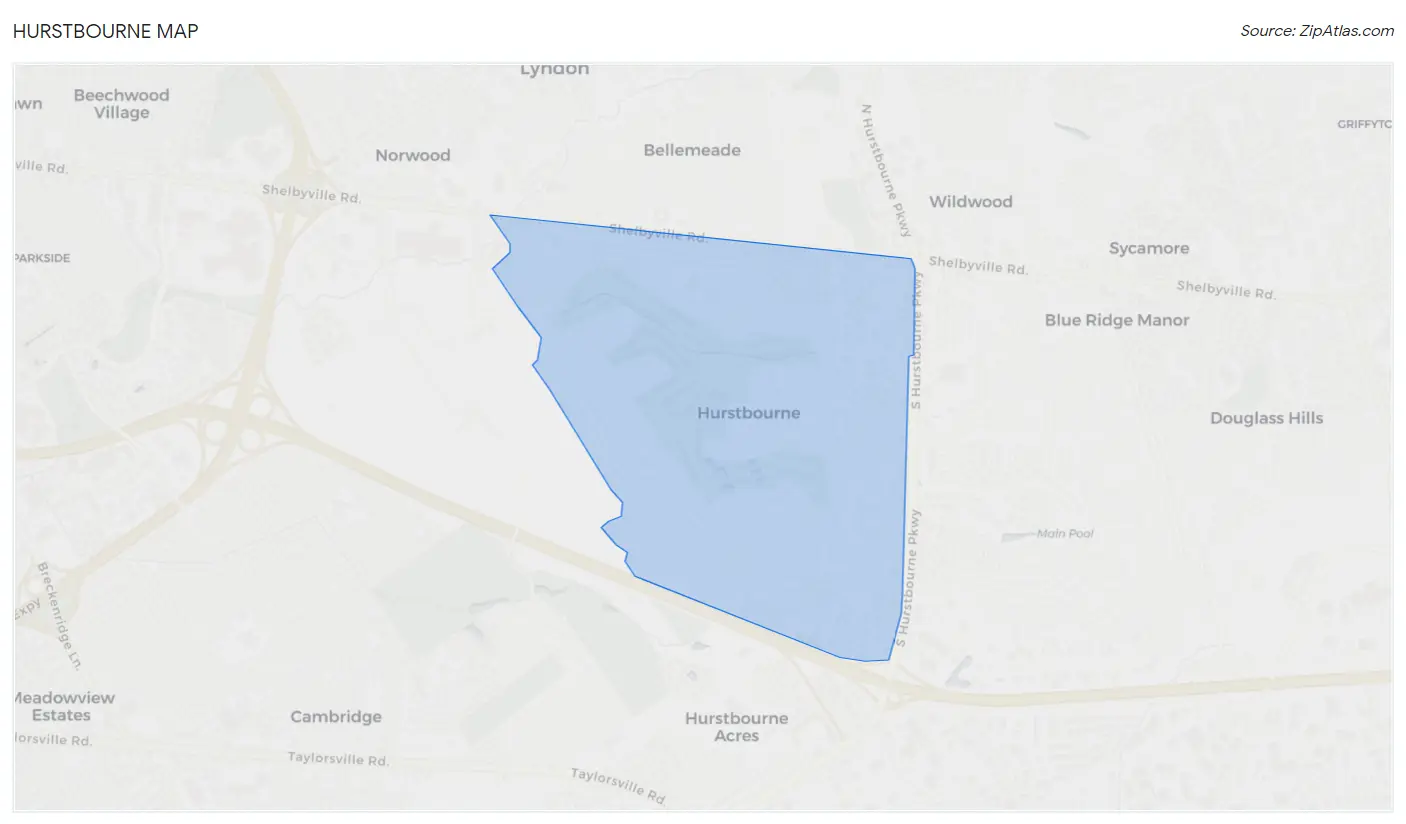
Hurstbourne Overview
$60,939
PER CAPITA INCOME
$134,671
AVG FAMILY INCOME
$117,031
AVG HOUSEHOLD INCOME
33.9%
WAGE / INCOME GAP [ % ]
66.1¢/ $1
WAGE / INCOME GAP [ $ ]
0.44
INEQUALITY / GINI INDEX
4,654
TOTAL POPULATION
2,443
MALE POPULATION
2,211
FEMALE POPULATION
110.49
MALES / 100 FEMALES
90.50
FEMALES / 100 MALES
38.3
MEDIAN AGE
3.2
AVG FAMILY SIZE
2.6
AVG HOUSEHOLD SIZE
2,200
LABOR FORCE [ PEOPLE ]
65.5%
PERCENT IN LABOR FORCE
3.2%
UNEMPLOYMENT RATE
Hurstbourne Area Codes
Income in Hurstbourne
Income Overview in Hurstbourne
Per Capita Income in Hurstbourne is $60,939, while median incomes of families and households are $134,671 and $117,031 respectively.
| Characteristic | Number | Measure |
| Per Capita Income | 4,654 | $60,939 |
| Median Family Income | 1,211 | $134,671 |
| Mean Family Income | 1,211 | $195,255 |
| Median Household Income | 1,770 | $117,031 |
| Mean Household Income | 1,770 | $160,277 |
| Income Deficit | 1,211 | $0 |
| Wage / Income Gap (%) | 4,654 | 33.87% |
| Wage / Income Gap ($) | 4,654 | 66.13¢ per $1 |
| Gini / Inequality Index | 4,654 | 0.44 |
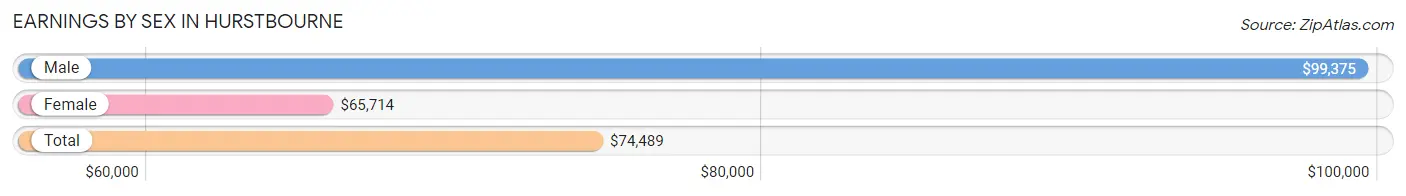
Earnings by Sex in Hurstbourne
Average Earnings in Hurstbourne are $74,489, $99,375 for men and $65,714 for women, a difference of 33.9%.
| Sex | Number | Average Earnings |
| Male | 1,312 (59.7%) | $99,375 |
| Female | 886 (40.3%) | $65,714 |
| Total | 2,198 (100.0%) | $74,489 |
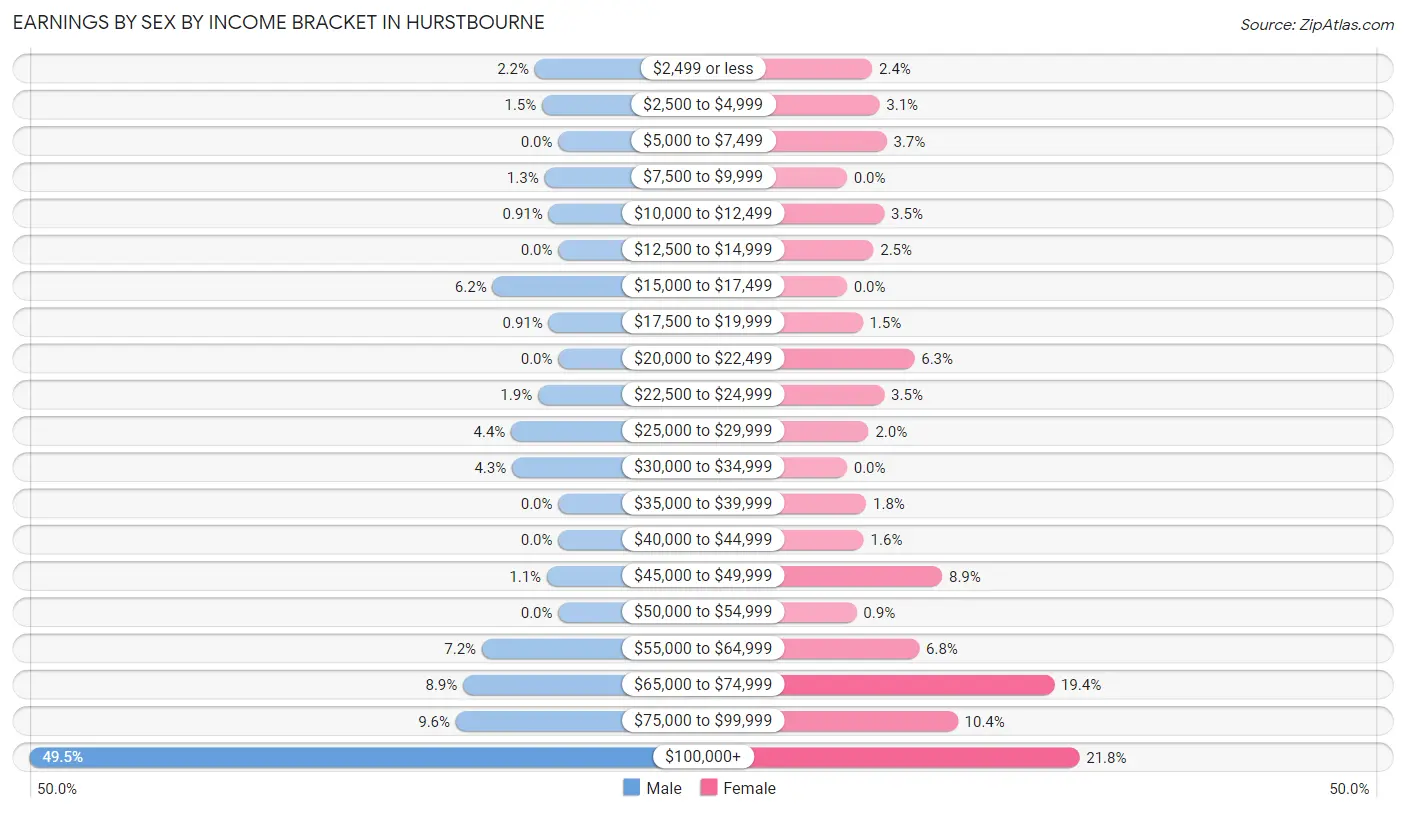
Earnings by Sex by Income Bracket in Hurstbourne
The most common earnings brackets in Hurstbourne are $100,000+ for men (650 | 49.5%) and $100,000+ for women (193 | 21.8%).
| Income | Male | Female |
| $2,499 or less | 29 (2.2%) | 21 (2.4%) |
| $2,500 to $4,999 | 20 (1.5%) | 27 (3.0%) |
| $5,000 to $7,499 | 0 (0.0%) | 33 (3.7%) |
| $7,500 to $9,999 | 17 (1.3%) | 0 (0.0%) |
| $10,000 to $12,499 | 12 (0.9%) | 31 (3.5%) |
| $12,500 to $14,999 | 0 (0.0%) | 22 (2.5%) |
| $15,000 to $17,499 | 81 (6.2%) | 0 (0.0%) |
| $17,500 to $19,999 | 12 (0.9%) | 13 (1.5%) |
| $20,000 to $22,499 | 0 (0.0%) | 56 (6.3%) |
| $22,500 to $24,999 | 25 (1.9%) | 31 (3.5%) |
| $25,000 to $29,999 | 58 (4.4%) | 18 (2.0%) |
| $30,000 to $34,999 | 57 (4.3%) | 0 (0.0%) |
| $35,000 to $39,999 | 0 (0.0%) | 16 (1.8%) |
| $40,000 to $44,999 | 0 (0.0%) | 14 (1.6%) |
| $45,000 to $49,999 | 14 (1.1%) | 79 (8.9%) |
| $50,000 to $54,999 | 0 (0.0%) | 8 (0.9%) |
| $55,000 to $64,999 | 94 (7.2%) | 60 (6.8%) |
| $65,000 to $74,999 | 117 (8.9%) | 172 (19.4%) |
| $75,000 to $99,999 | 126 (9.6%) | 92 (10.4%) |
| $100,000+ | 650 (49.5%) | 193 (21.8%) |
| Total | 1,312 (100.0%) | 886 (100.0%) |
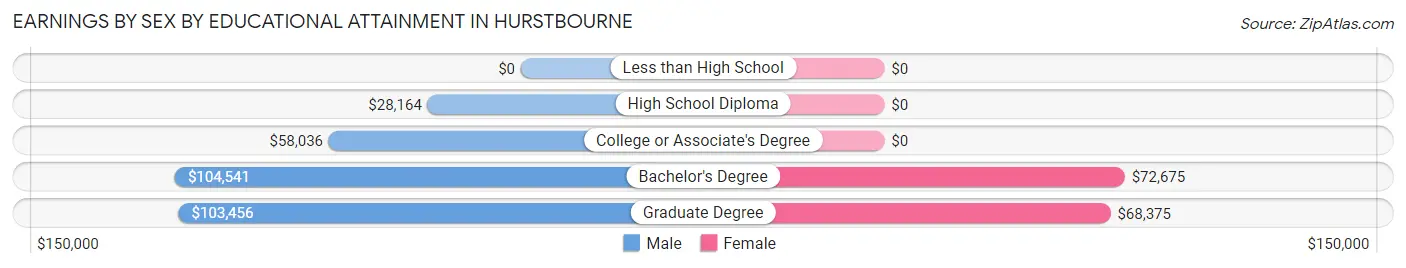
Earnings by Sex by Educational Attainment in Hurstbourne
Average earnings in Hurstbourne are $103,798 for men and $66,862 for women, a difference of 35.6%. Men with an educational attainment of bachelor's degree enjoy the highest average annual earnings of $104,541, while those with high school diploma education earn the least with $28,164. Women with an educational attainment of bachelor's degree earn the most with the average annual earnings of $72,675, while those with graduate degree education have the smallest earnings of $68,375.
| Educational Attainment | Male Income | Female Income |
| Less than High School | - | - |
| High School Diploma | $28,164 | $0 |
| College or Associate's Degree | $58,036 | $0 |
| Bachelor's Degree | $104,541 | $72,675 |
| Graduate Degree | $103,456 | $68,375 |
| Total | $103,798 | $66,862 |
Family Income in Hurstbourne
Family Income Brackets in Hurstbourne
According to the Hurstbourne family income data, there are 460 families falling into the $100,000 to $149,999 income range, which is the most common income bracket and makes up 38.0% of all families.
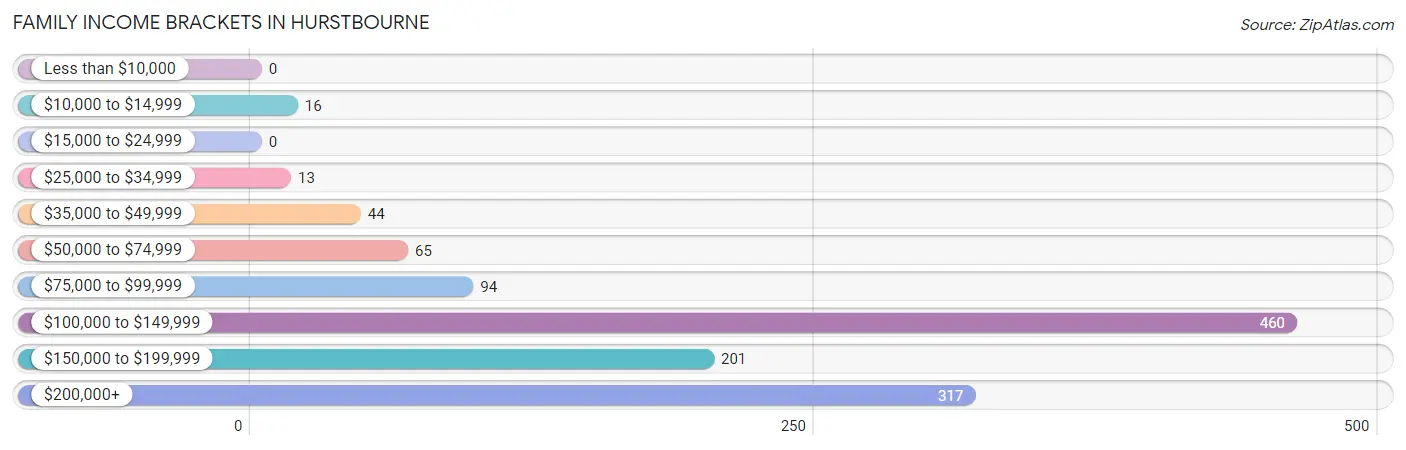
| Income Bracket | # Families | % Families |
| Less than $10,000 | 0 | 0.0% |
| $10,000 to $14,999 | 16 | 1.3% |
| $15,000 to $24,999 | 0 | 0.0% |
| $25,000 to $34,999 | 13 | 1.1% |
| $35,000 to $49,999 | 44 | 3.6% |
| $50,000 to $74,999 | 65 | 5.4% |
| $75,000 to $99,999 | 94 | 7.8% |
| $100,000 to $149,999 | 460 | 38.0% |
| $150,000 to $199,999 | 201 | 16.6% |
| $200,000+ | 317 | 26.2% |
Family Income by Famaliy Size in Hurstbourne
4-person families (319 | 26.3%) account for the highest median family income in Hurstbourne with $191,250 per family, while 2-person families (562 | 46.4%) have the highest median income of $63,250 per family member.
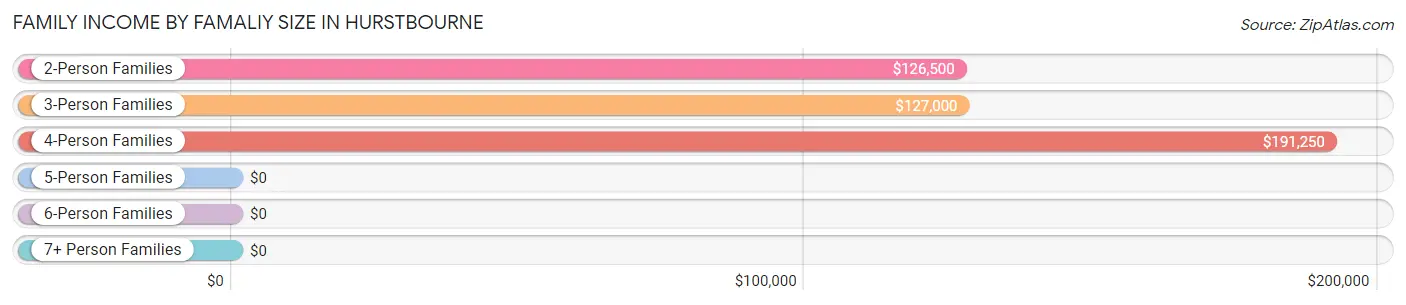
| Income Bracket | # Families | Median Income |
| 2-Person Families | 562 (46.4%) | $126,500 |
| 3-Person Families | 206 (17.0%) | $127,000 |
| 4-Person Families | 319 (26.3%) | $191,250 |
| 5-Person Families | 98 (8.1%) | $0 |
| 6-Person Families | 26 (2.1%) | $0 |
| 7+ Person Families | 0 (0.0%) | $0 |
| Total | 1,211 (100.0%) | $134,671 |
Family Income by Number of Earners in Hurstbourne
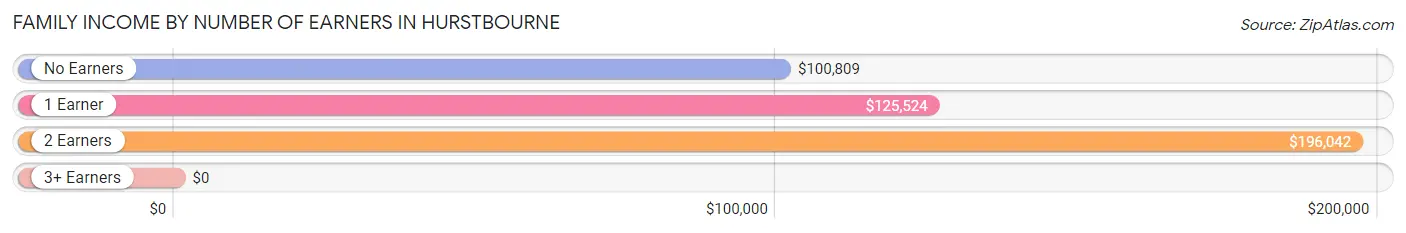
| Number of Earners | # Families | Median Income |
| No Earners | 161 (13.3%) | $100,809 |
| 1 Earner | 496 (41.0%) | $125,524 |
| 2 Earners | 503 (41.5%) | $196,042 |
| 3+ Earners | 51 (4.2%) | $0 |
| Total | 1,211 (100.0%) | $134,671 |
Household Income in Hurstbourne
Household Income Brackets in Hurstbourne
With 653 households falling in the category, the $100,000 to $149,999 income range is the most frequent in Hurstbourne, accounting for 36.9% of all households. In contrast, only 44 households (2.5%) fall into the less than $10,000 income bracket, making it the least populous group.
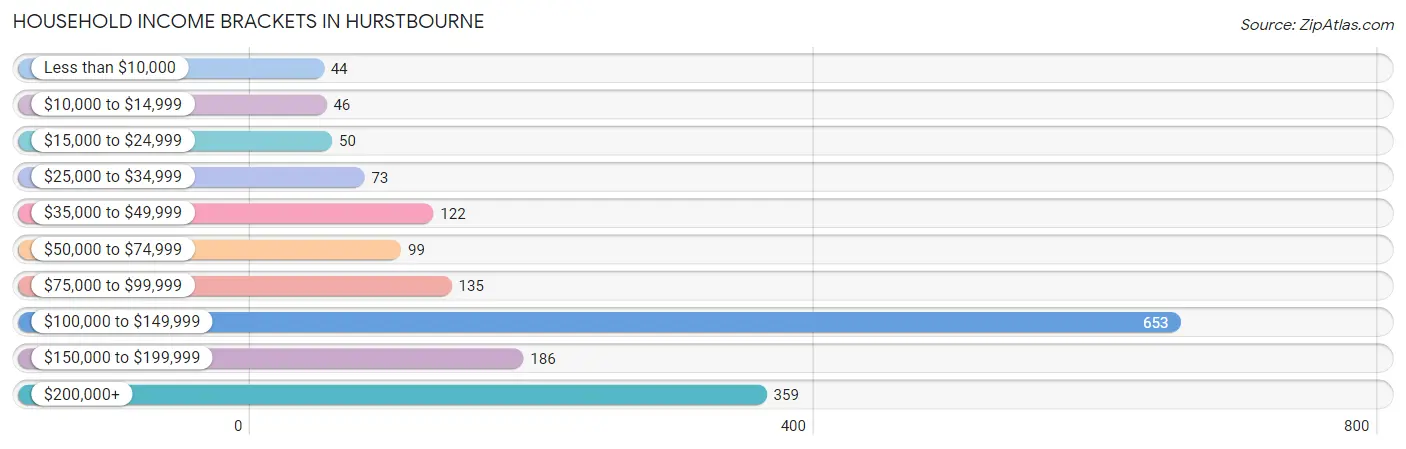
| Income Bracket | # Households | % Households |
| Less than $10,000 | 44 | 2.5% |
| $10,000 to $14,999 | 46 | 2.6% |
| $15,000 to $24,999 | 50 | 2.8% |
| $25,000 to $34,999 | 73 | 4.1% |
| $35,000 to $49,999 | 122 | 6.9% |
| $50,000 to $74,999 | 99 | 5.6% |
| $75,000 to $99,999 | 135 | 7.6% |
| $100,000 to $149,999 | 653 | 36.9% |
| $150,000 to $199,999 | 186 | 10.5% |
| $200,000+ | 359 | 20.3% |
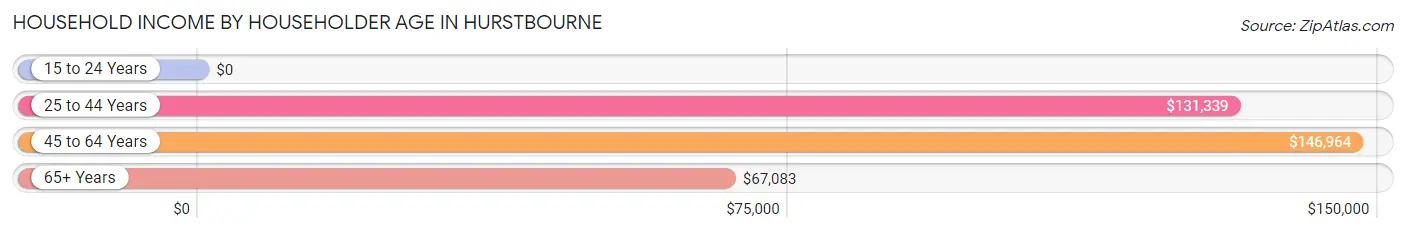
Household Income by Householder Age in Hurstbourne
The median household income in Hurstbourne is $117,031, with the highest median household income of $146,964 found in the 45 to 64 years age bracket for the primary householder. A total of 429 households (24.2%) fall into this category. Meanwhile, the 15 to 24 years age bracket for the primary householder has the lowest median household income of $0, with 44 households (2.5%) in this group.
| Income Bracket | # Households | Median Income |
| 15 to 24 Years | 44 (2.5%) | $0 |
| 25 to 44 Years | 706 (39.9%) | $131,339 |
| 45 to 64 Years | 429 (24.2%) | $146,964 |
| 65+ Years | 591 (33.4%) | $67,083 |
| Total | 1,770 (100.0%) | $117,031 |
Poverty in Hurstbourne
Income Below Poverty by Sex and Age in Hurstbourne
With 3.1% poverty level for males and 3.5% for females among the residents of Hurstbourne, 18 to 24 year old males and 75 year old and over females are the most vulnerable to poverty, with 44 males (23.8%) and 45 females (16.0%) in their respective age groups living below the poverty level.
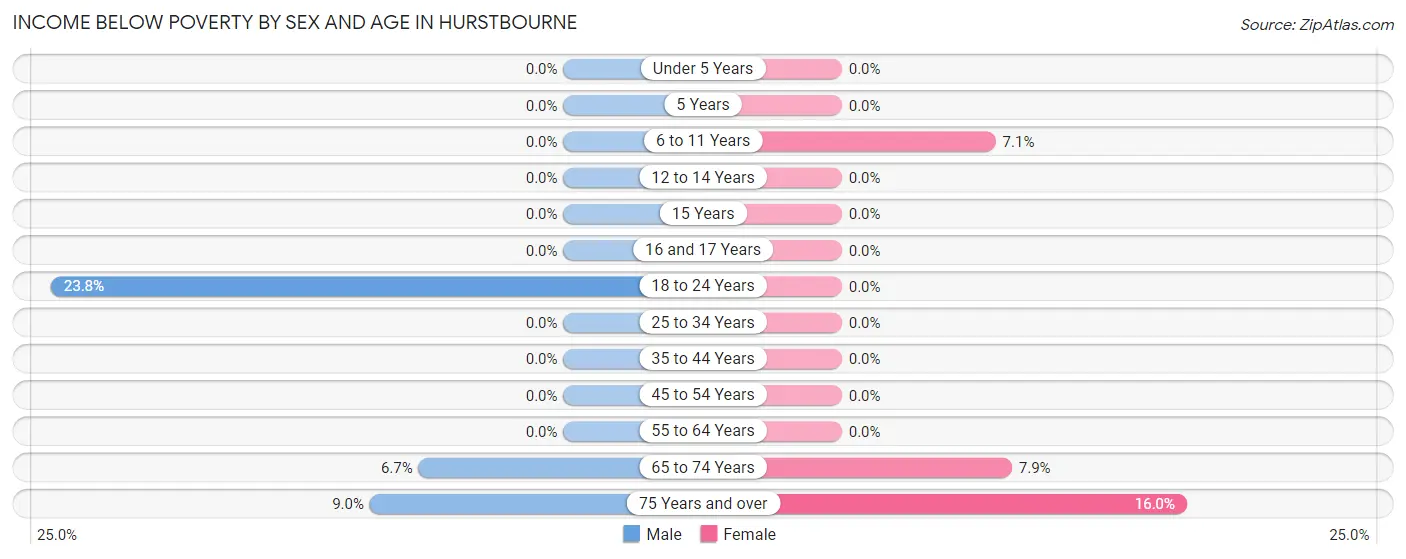
| Age Bracket | Male | Female |
| Under 5 Years | 0 (0.0%) | 0 (0.0%) |
| 5 Years | 0 (0.0%) | 0 (0.0%) |
| 6 to 11 Years | 0 (0.0%) | 17 (7.1%) |
| 12 to 14 Years | 0 (0.0%) | 0 (0.0%) |
| 15 Years | 0 (0.0%) | 0 (0.0%) |
| 16 and 17 Years | 0 (0.0%) | 0 (0.0%) |
| 18 to 24 Years | 44 (23.8%) | 0 (0.0%) |
| 25 to 34 Years | 0 (0.0%) | 0 (0.0%) |
| 35 to 44 Years | 0 (0.0%) | 0 (0.0%) |
| 45 to 54 Years | 0 (0.0%) | 0 (0.0%) |
| 55 to 64 Years | 0 (0.0%) | 0 (0.0%) |
| 65 to 74 Years | 16 (6.7%) | 15 (7.9%) |
| 75 Years and over | 15 (9.0%) | 45 (16.0%) |
| Total | 75 (3.1%) | 77 (3.5%) |
Income Above Poverty by Sex and Age in Hurstbourne
According to the poverty statistics in Hurstbourne, males aged under 5 years and females aged under 5 years are the age groups that are most secure financially, with 100.0% of males and 100.0% of females in these age groups living above the poverty line.
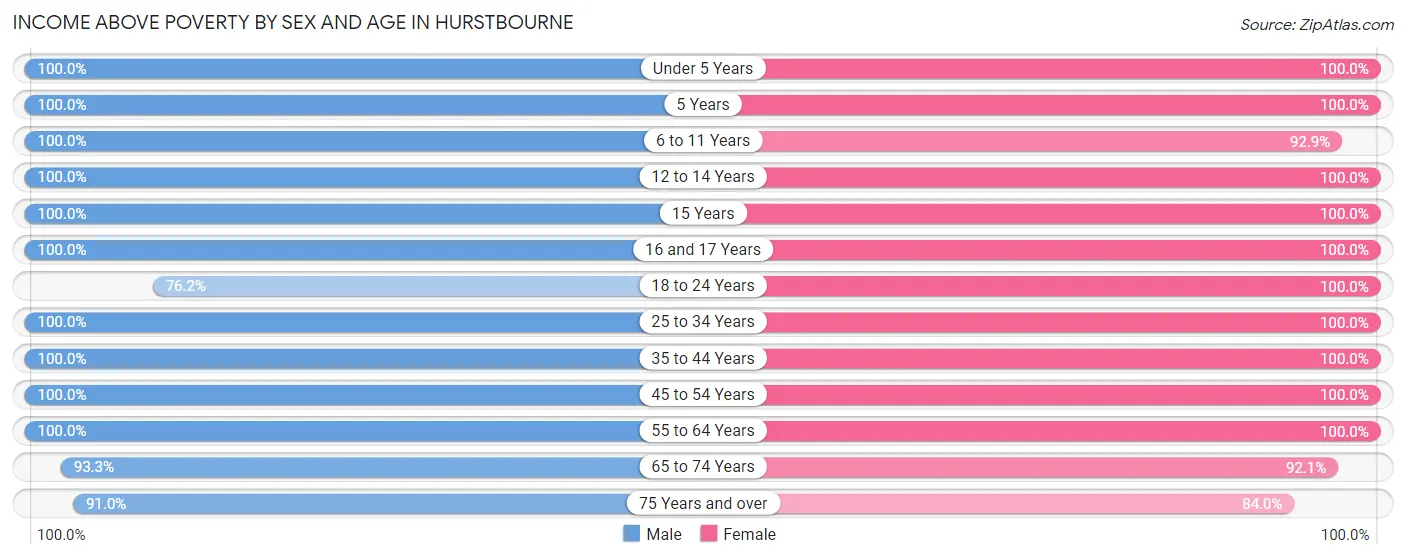
| Age Bracket | Male | Female |
| Under 5 Years | 171 (100.0%) | 248 (100.0%) |
| 5 Years | 36 (100.0%) | 29 (100.0%) |
| 6 to 11 Years | 303 (100.0%) | 221 (92.9%) |
| 12 to 14 Years | 125 (100.0%) | 46 (100.0%) |
| 15 Years | 61 (100.0%) | 38 (100.0%) |
| 16 and 17 Years | 13 (100.0%) | 10 (100.0%) |
| 18 to 24 Years | 141 (76.2%) | 35 (100.0%) |
| 25 to 34 Years | 324 (100.0%) | 309 (100.0%) |
| 35 to 44 Years | 373 (100.0%) | 384 (100.0%) |
| 45 to 54 Years | 236 (100.0%) | 202 (100.0%) |
| 55 to 64 Years | 211 (100.0%) | 201 (100.0%) |
| 65 to 74 Years | 222 (93.3%) | 175 (92.1%) |
| 75 Years and over | 152 (91.0%) | 236 (84.0%) |
| Total | 2,368 (96.9%) | 2,134 (96.5%) |
Income Below Poverty Among Married-Couple Families in Hurstbourne
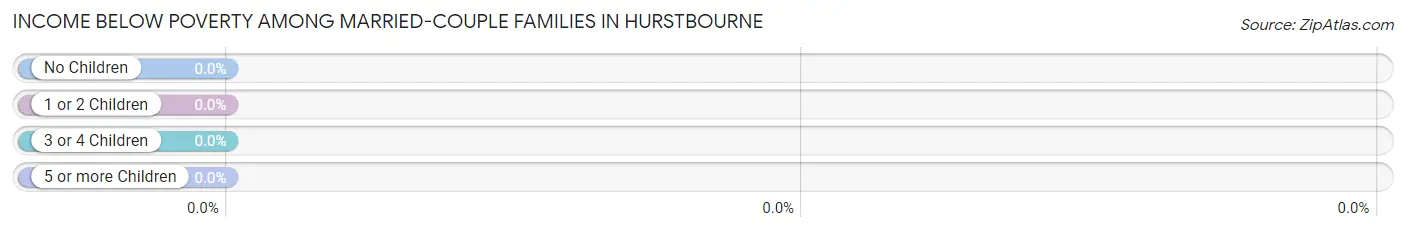
| Children | Above Poverty | Below Poverty |
| No Children | 540 (100.0%) | 0 (0.0%) |
| 1 or 2 Children | 458 (100.0%) | 0 (0.0%) |
| 3 or 4 Children | 115 (100.0%) | 0 (0.0%) |
| 5 or more Children | 0 (0.0%) | 0 (0.0%) |
| Total | 1,113 (100.0%) | 0 (0.0%) |
Income Below Poverty Among Single-Parent Households in Hurstbourne
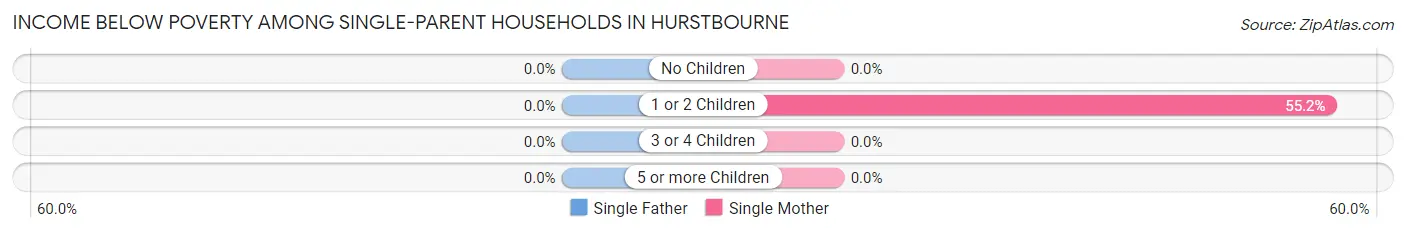
| Children | Single Father | Single Mother |
| No Children | 0 (0.0%) | 0 (0.0%) |
| 1 or 2 Children | 0 (0.0%) | 16 (55.2%) |
| 3 or 4 Children | 0 (0.0%) | 0 (0.0%) |
| 5 or more Children | 0 (0.0%) | 0 (0.0%) |
| Total | 0 (0.0%) | 16 (23.5%) |
Income Below Poverty Among Married-Couple vs Single-Parent Households in Hurstbourne
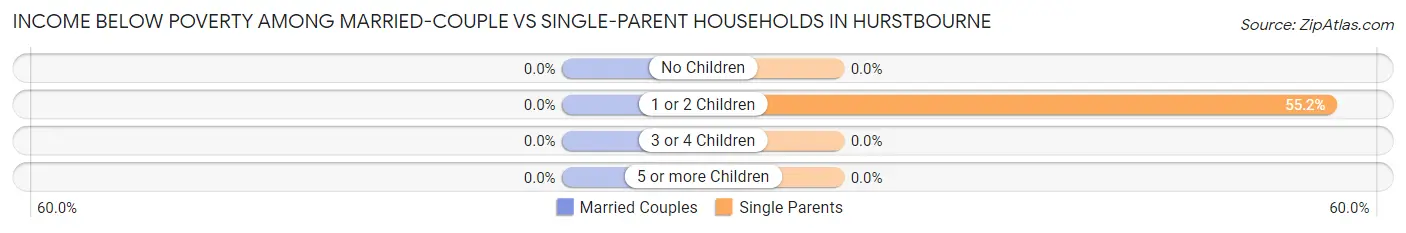
| Children | Married-Couple Families | Single-Parent Households |
| No Children | 0 (0.0%) | 0 (0.0%) |
| 1 or 2 Children | 0 (0.0%) | 16 (55.2%) |
| 3 or 4 Children | 0 (0.0%) | 0 (0.0%) |
| 5 or more Children | 0 (0.0%) | 0 (0.0%) |
| Total | 0 (0.0%) | 16 (16.3%) |
Race in Hurstbourne
The most populous races in Hurstbourne are White / Caucasian (2,867 | 61.6%), Asian (1,065 | 22.9%), and Two or more Races (478 | 10.3%).
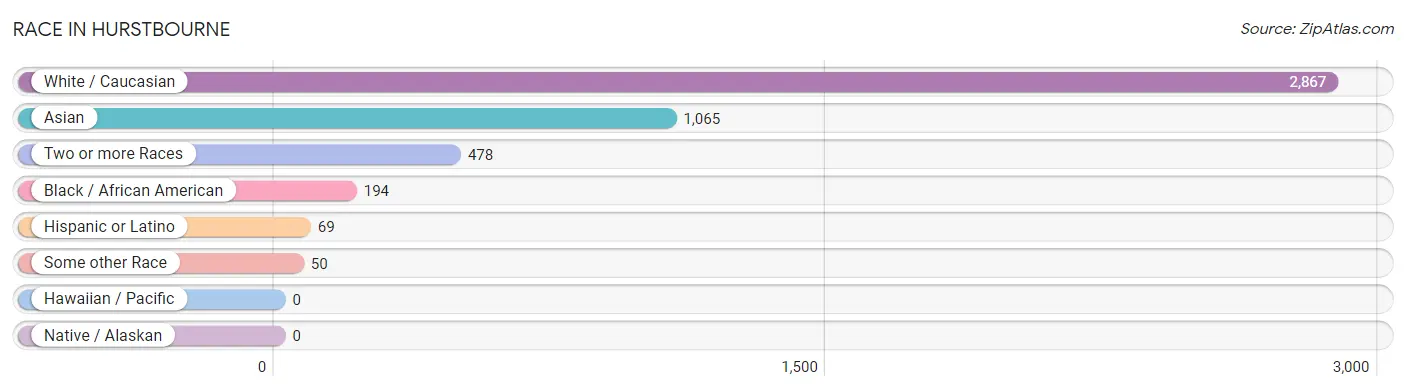
| Race | # Population | % Population |
| Asian | 1,065 | 22.9% |
| Black / African American | 194 | 4.2% |
| Hawaiian / Pacific | 0 | 0.0% |
| Hispanic or Latino | 69 | 1.5% |
| Native / Alaskan | 0 | 0.0% |
| White / Caucasian | 2,867 | 61.6% |
| Two or more Races | 478 | 10.3% |
| Some other Race | 50 | 1.1% |
| Total | 4,654 | 100.0% |
Ancestry in Hurstbourne
The most populous ancestries reported in Hurstbourne are German (1,062 | 22.8%), Thai (871 | 18.7%), English (676 | 14.5%), Irish (445 | 9.6%), and Lithuanian (429 | 9.2%), together accounting for 74.8% of all Hurstbourne residents.
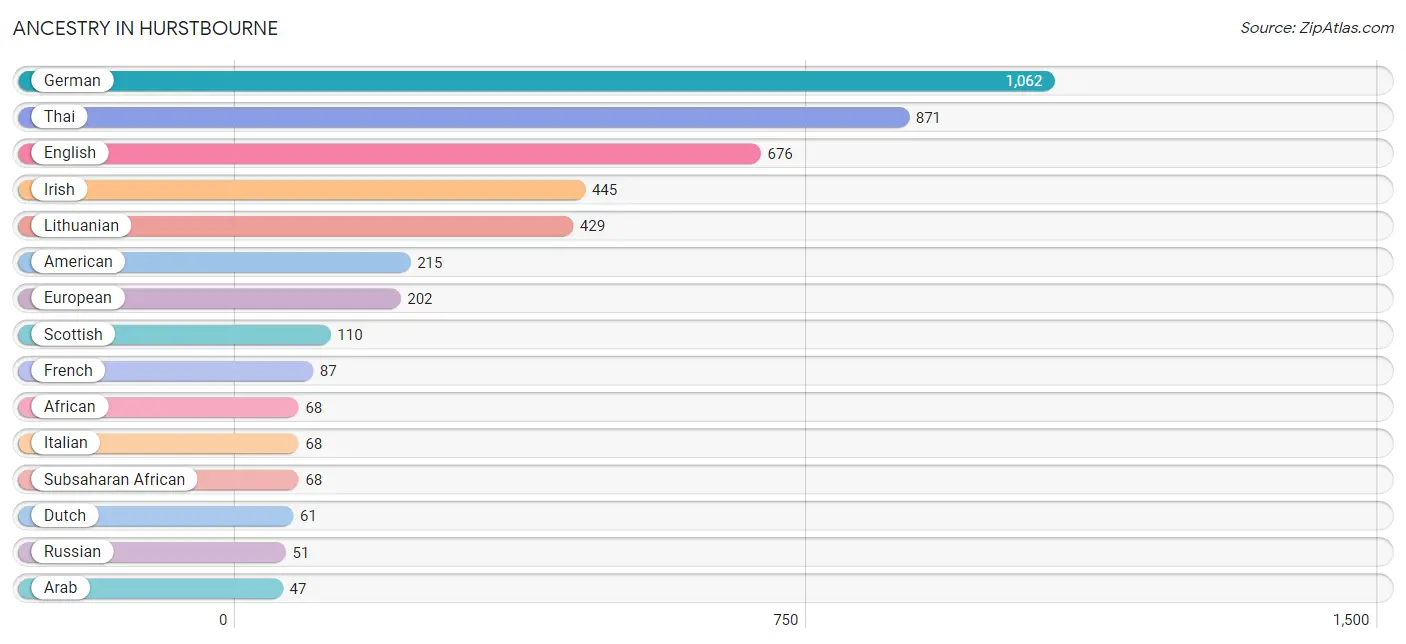
| Ancestry | # Population | % Population |
| African | 68 | 1.5% |
| American | 215 | 4.6% |
| Arab | 47 | 1.0% |
| Burmese | 26 | 0.6% |
| Central American | 14 | 0.3% |
| Cuban | 3 | 0.1% |
| Czech | 16 | 0.3% |
| Danish | 39 | 0.8% |
| Dutch | 61 | 1.3% |
| Eastern European | 16 | 0.3% |
| English | 676 | 14.5% |
| European | 202 | 4.3% |
| French | 87 | 1.9% |
| German | 1,062 | 22.8% |
| Greek | 15 | 0.3% |
| Honduran | 14 | 0.3% |
| Indian (Asian) | 31 | 0.7% |
| Iraqi | 47 | 1.0% |
| Irish | 445 | 9.6% |
| Italian | 68 | 1.5% |
| Lithuanian | 429 | 9.2% |
| Mexican | 45 | 1.0% |
| Norwegian | 13 | 0.3% |
| Polish | 46 | 1.0% |
| Russian | 51 | 1.1% |
| Scandinavian | 16 | 0.3% |
| Scotch-Irish | 35 | 0.7% |
| Scottish | 110 | 2.4% |
| Spanish | 7 | 0.2% |
| Subsaharan African | 68 | 1.5% |
| Swiss | 32 | 0.7% |
| Thai | 871 | 18.7% |
| Welsh | 45 | 1.0% | View All 33 Rows |
Immigrants in Hurstbourne
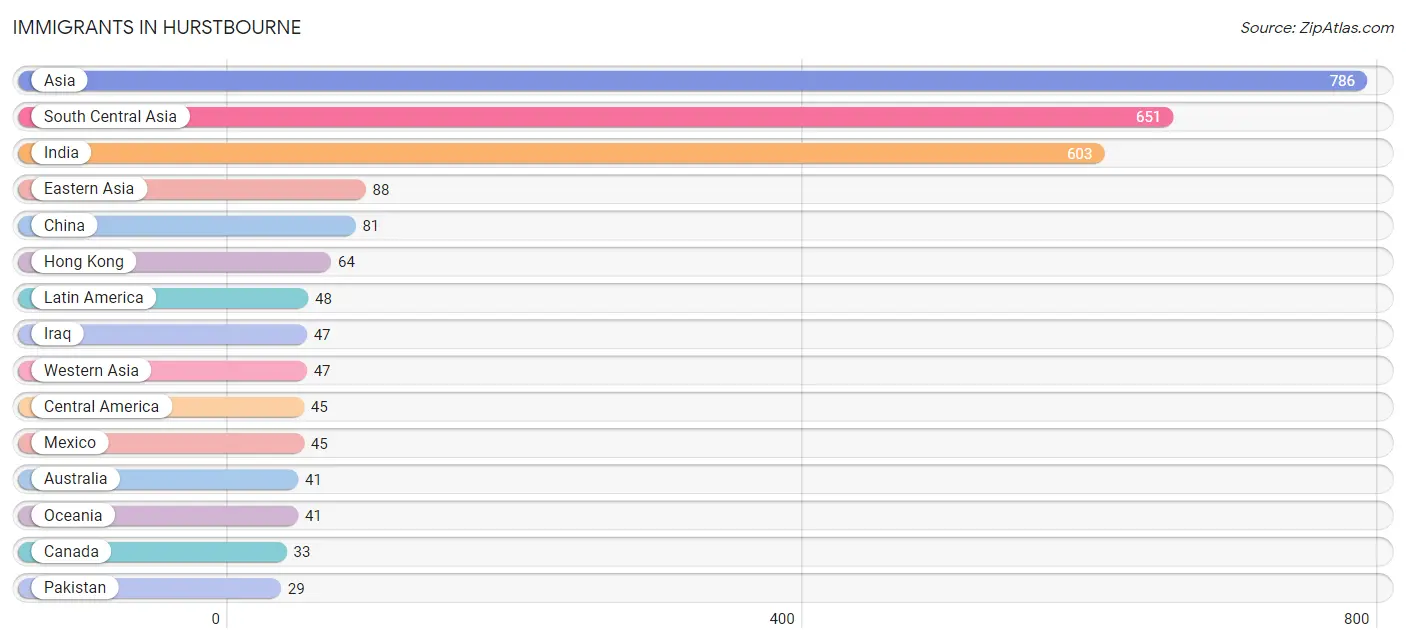
The most numerous immigrant groups reported in Hurstbourne came from Asia (786 | 16.9%), South Central Asia (651 | 14.0%), India (603 | 13.0%), Eastern Asia (88 | 1.9%), and China (81 | 1.7%), together accounting for 47.5% of all Hurstbourne residents.
| Immigration Origin | # Population | % Population |
| Asia | 786 | 16.9% |
| Australia | 41 | 0.9% |
| Canada | 33 | 0.7% |
| Caribbean | 3 | 0.1% |
| Central America | 45 | 1.0% |
| China | 81 | 1.7% |
| Cuba | 3 | 0.1% |
| Eastern Asia | 88 | 1.9% |
| Hong Kong | 64 | 1.4% |
| India | 603 | 13.0% |
| Iran | 19 | 0.4% |
| Iraq | 47 | 1.0% |
| Korea | 7 | 0.2% |
| Latin America | 48 | 1.0% |
| Mexico | 45 | 1.0% |
| Oceania | 41 | 0.9% |
| Pakistan | 29 | 0.6% |
| South Central Asia | 651 | 14.0% |
| Western Asia | 47 | 1.0% | View All 19 Rows |
Sex and Age in Hurstbourne
Sex and Age in Hurstbourne
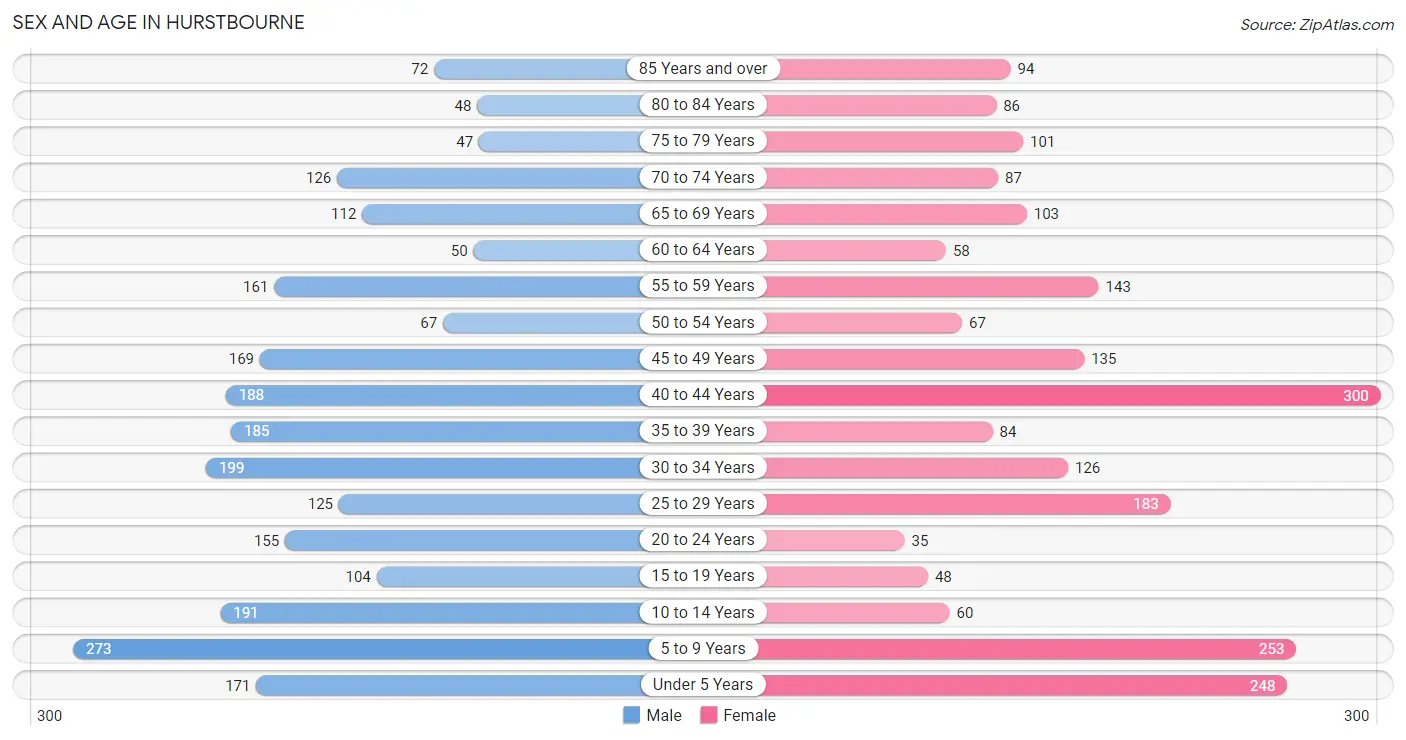
The most populous age groups in Hurstbourne are 5 to 9 Years (273 | 11.2%) for men and 40 to 44 Years (300 | 13.6%) for women.
| Age Bracket | Male | Female |
| Under 5 Years | 171 (7.0%) | 248 (11.2%) |
| 5 to 9 Years | 273 (11.2%) | 253 (11.4%) |
| 10 to 14 Years | 191 (7.8%) | 60 (2.7%) |
| 15 to 19 Years | 104 (4.3%) | 48 (2.2%) |
| 20 to 24 Years | 155 (6.3%) | 35 (1.6%) |
| 25 to 29 Years | 125 (5.1%) | 183 (8.3%) |
| 30 to 34 Years | 199 (8.2%) | 126 (5.7%) |
| 35 to 39 Years | 185 (7.6%) | 84 (3.8%) |
| 40 to 44 Years | 188 (7.7%) | 300 (13.6%) |
| 45 to 49 Years | 169 (6.9%) | 135 (6.1%) |
| 50 to 54 Years | 67 (2.7%) | 67 (3.0%) |
| 55 to 59 Years | 161 (6.6%) | 143 (6.5%) |
| 60 to 64 Years | 50 (2.1%) | 58 (2.6%) |
| 65 to 69 Years | 112 (4.6%) | 103 (4.7%) |
| 70 to 74 Years | 126 (5.2%) | 87 (3.9%) |
| 75 to 79 Years | 47 (1.9%) | 101 (4.6%) |
| 80 to 84 Years | 48 (2.0%) | 86 (3.9%) |
| 85 Years and over | 72 (2.9%) | 94 (4.3%) |
| Total | 2,443 (100.0%) | 2,211 (100.0%) |
Families and Households in Hurstbourne
Median Family Size in Hurstbourne
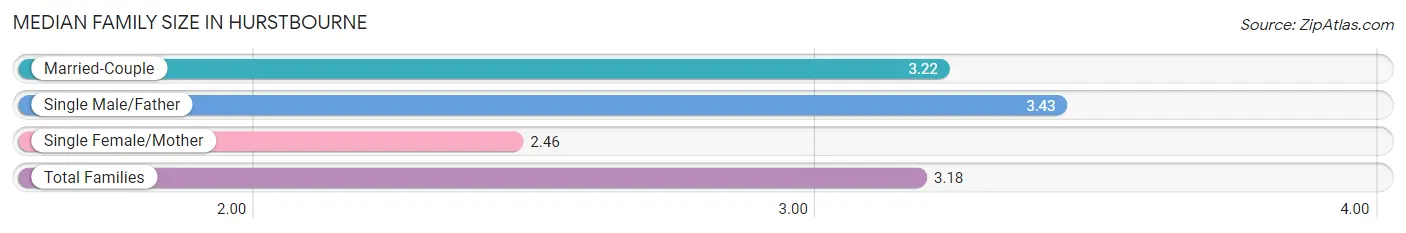
The median family size in Hurstbourne is 3.18 persons per family, with single male/father families (30 | 2.5%) accounting for the largest median family size of 3.43 persons per family. On the other hand, single female/mother families (68 | 5.6%) represent the smallest median family size with 2.46 persons per family.
| Family Type | # Families | Family Size |
| Married-Couple | 1,113 (91.9%) | 3.22 |
| Single Male/Father | 30 (2.5%) | 3.43 |
| Single Female/Mother | 68 (5.6%) | 2.46 |
| Total Families | 1,211 (100.0%) | 3.18 |
Median Household Size in Hurstbourne
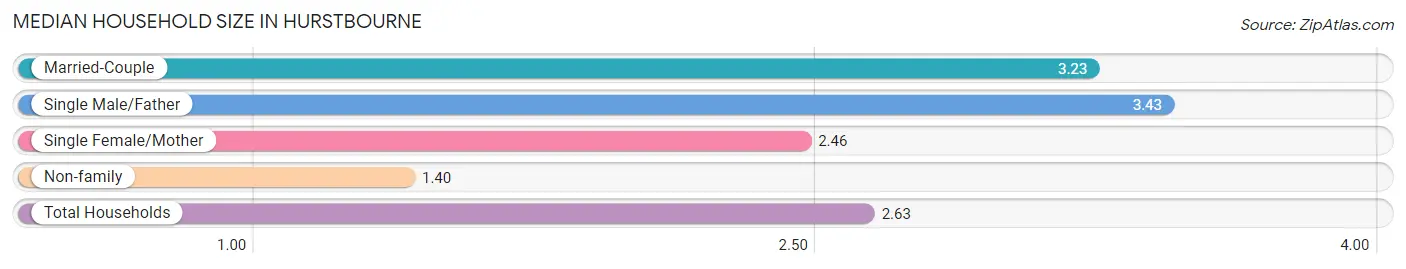
The median household size in Hurstbourne is 2.63 persons per household, with single male/father households (30 | 1.7%) accounting for the largest median household size of 3.43 persons per household. non-family households (559 | 31.6%) represent the smallest median household size with 1.40 persons per household.
| Household Type | # Households | Household Size |
| Married-Couple | 1,113 (62.9%) | 3.23 |
| Single Male/Father | 30 (1.7%) | 3.43 |
| Single Female/Mother | 68 (3.8%) | 2.46 |
| Non-family | 559 (31.6%) | 1.40 |
| Total Households | 1,770 (100.0%) | 2.63 |
Household Size by Marriage Status in Hurstbourne
Out of a total of 1,770 households in Hurstbourne, 1,211 (68.4%) are family households, while 559 (31.6%) are nonfamily households. The most numerous type of family households are 2-person households, comprising 562, and the most common type of nonfamily households are 1-person households, comprising 346.
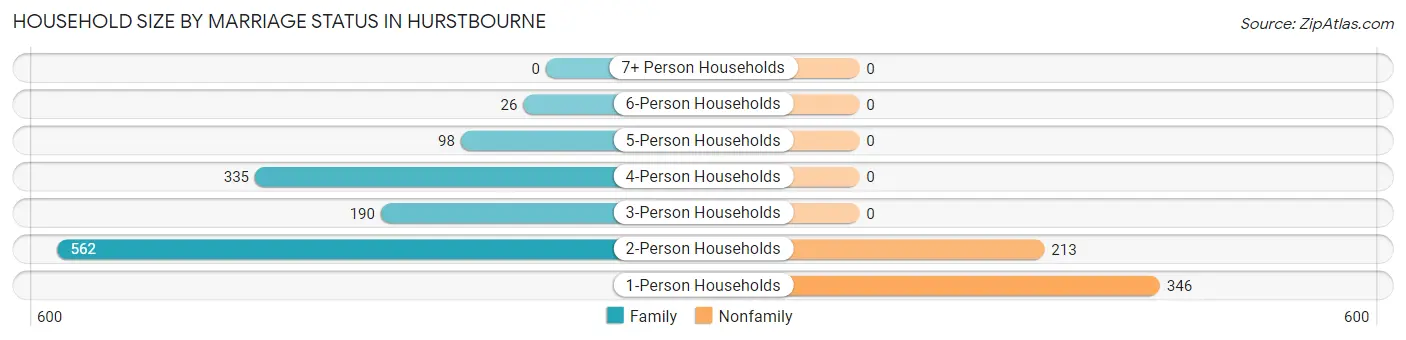
| Household Size | Family Households | Nonfamily Households |
| 1-Person Households | - | 346 (19.6%) |
| 2-Person Households | 562 (31.8%) | 213 (12.0%) |
| 3-Person Households | 190 (10.7%) | 0 (0.0%) |
| 4-Person Households | 335 (18.9%) | 0 (0.0%) |
| 5-Person Households | 98 (5.5%) | 0 (0.0%) |
| 6-Person Households | 26 (1.5%) | 0 (0.0%) |
| 7+ Person Households | 0 (0.0%) | 0 (0.0%) |
| Total | 1,211 (68.4%) | 559 (31.6%) |
Female Fertility in Hurstbourne
Fertility by Age in Hurstbourne
Average fertility rate in Hurstbourne is 64.0 births per 1,000 women. Women in the age bracket of 20 to 34 years have the highest fertility rate with 172.0 births per 1,000 women. Women in the age bracket of 20 to 34 years acount for 100.0% of all women with births.
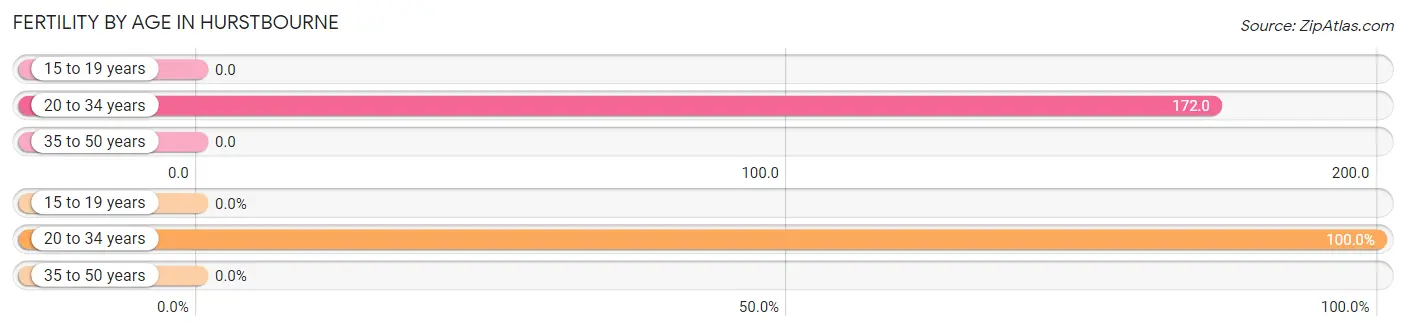
| Age Bracket | Women with Births | Births / 1,000 Women |
| 15 to 19 years | 0 (0.0%) | 0.0 |
| 20 to 34 years | 59 (100.0%) | 172.0 |
| 35 to 50 years | 0 (0.0%) | 0.0 |
| Total | 59 (100.0%) | 64.0 |
Fertility by Age by Marriage Status in Hurstbourne
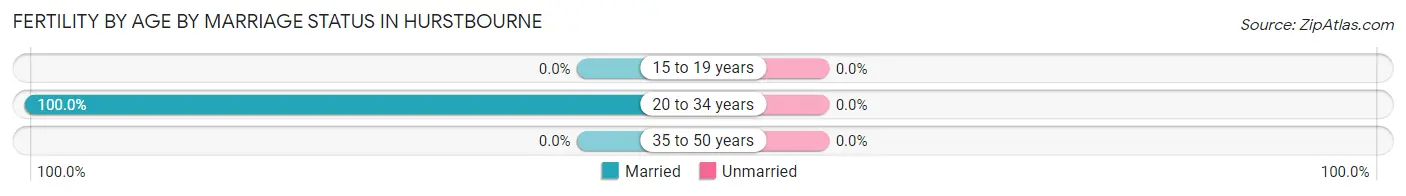
| Age Bracket | Married | Unmarried |
| 15 to 19 years | 0 (0.0%) | 0 (0.0%) |
| 20 to 34 years | 59 (100.0%) | 0 (0.0%) |
| 35 to 50 years | 0 (0.0%) | 0 (0.0%) |
| Total | 59 (100.0%) | 0 (0.0%) |
Fertility by Education in Hurstbourne
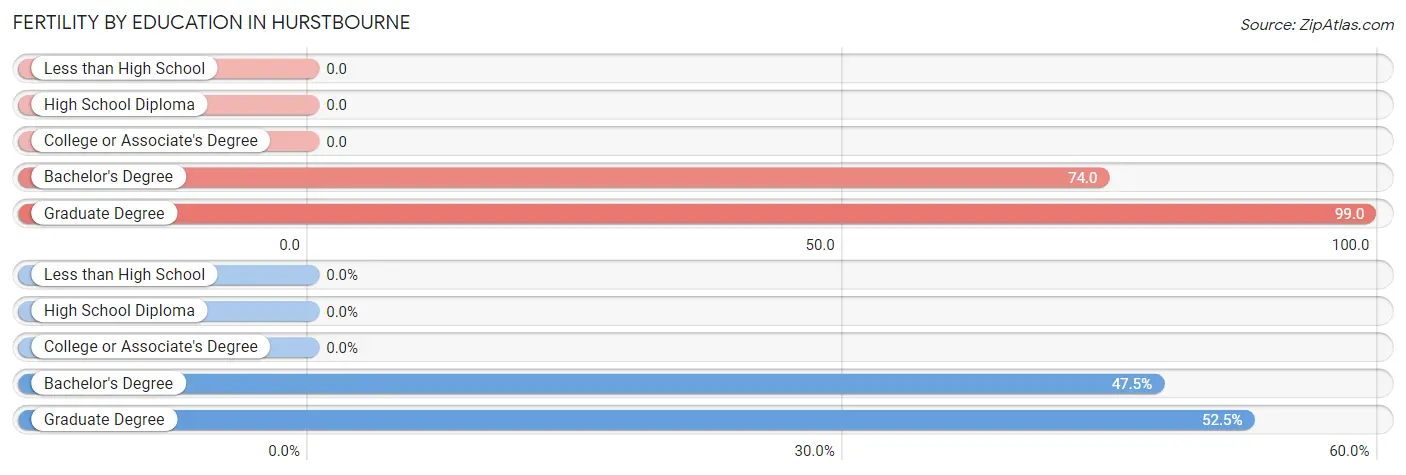
| Educational Attainment | Women with Births | Births / 1,000 Women |
| Less than High School | 0 (0.0%) | 0.0 |
| High School Diploma | 0 (0.0%) | 0.0 |
| College or Associate's Degree | 0 (0.0%) | 0.0 |
| Bachelor's Degree | 28 (47.5%) | 74.0 |
| Graduate Degree | 31 (52.5%) | 99.0 |
| Total | 59 (100.0%) | 64.0 |
Fertility by Education by Marriage Status in Hurstbourne
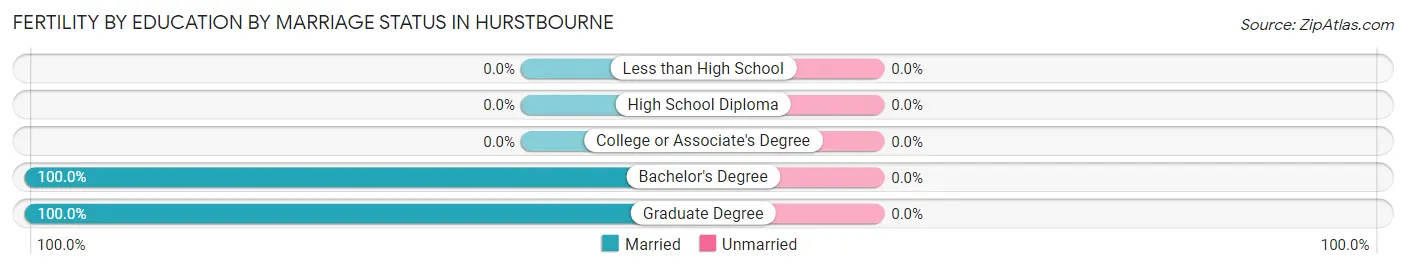
| Educational Attainment | Married | Unmarried |
| Less than High School | 0 (0.0%) | 0 (0.0%) |
| High School Diploma | 0 (0.0%) | 0 (0.0%) |
| College or Associate's Degree | 0 (0.0%) | 0 (0.0%) |
| Bachelor's Degree | 28 (100.0%) | 0 (0.0%) |
| Graduate Degree | 31 (100.0%) | 0 (0.0%) |
| Total | 59 (100.0%) | 0 (0.0%) |
Employment Characteristics in Hurstbourne
Employment by Class of Employer in Hurstbourne
Among the 2,129 employed individuals in Hurstbourne, private company employees (1,529 | 71.8%), not-for-profit organizations (218 | 10.2%), and self-employed (not incorporated) (159 | 7.5%) make up the most common classes of employment.
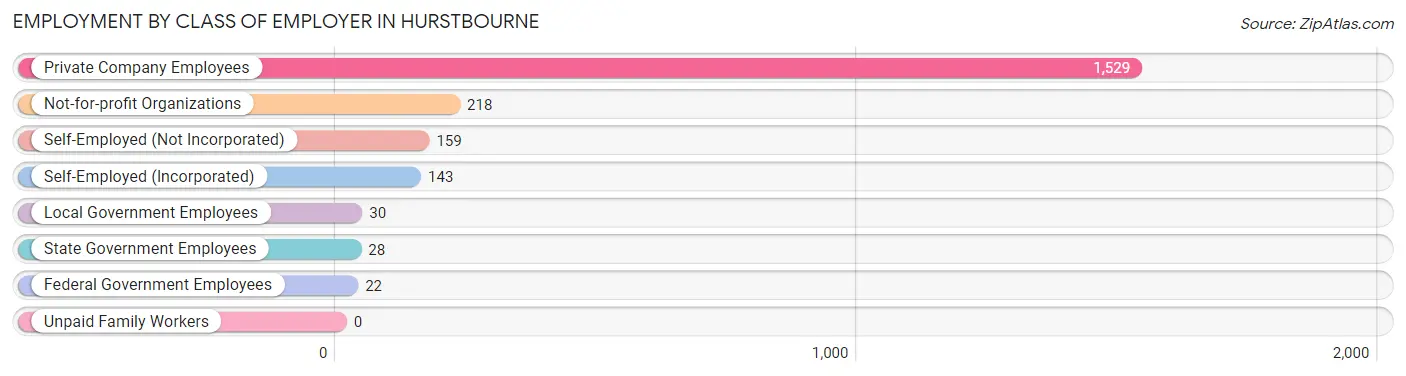
| Employer Class | # Employees | % Employees |
| Private Company Employees | 1,529 | 71.8% |
| Self-Employed (Incorporated) | 143 | 6.7% |
| Self-Employed (Not Incorporated) | 159 | 7.5% |
| Not-for-profit Organizations | 218 | 10.2% |
| Local Government Employees | 30 | 1.4% |
| State Government Employees | 28 | 1.3% |
| Federal Government Employees | 22 | 1.0% |
| Unpaid Family Workers | 0 | 0.0% |
| Total | 2,129 | 100.0% |
Employment Status by Age in Hurstbourne
According to the labor force statistics for Hurstbourne, out of the total population over 16 years of age (3,359), 65.5% or 2,200 individuals are in the labor force, with 3.2% or 70 of them unemployed. The age group with the highest labor force participation rate is 30 to 34 years, with 89.5% or 291 individuals in the labor force. Within the labor force, the 60 to 64 years age range has the highest percentage of unemployed individuals, with 14.5% or 12 of them being unemployed.
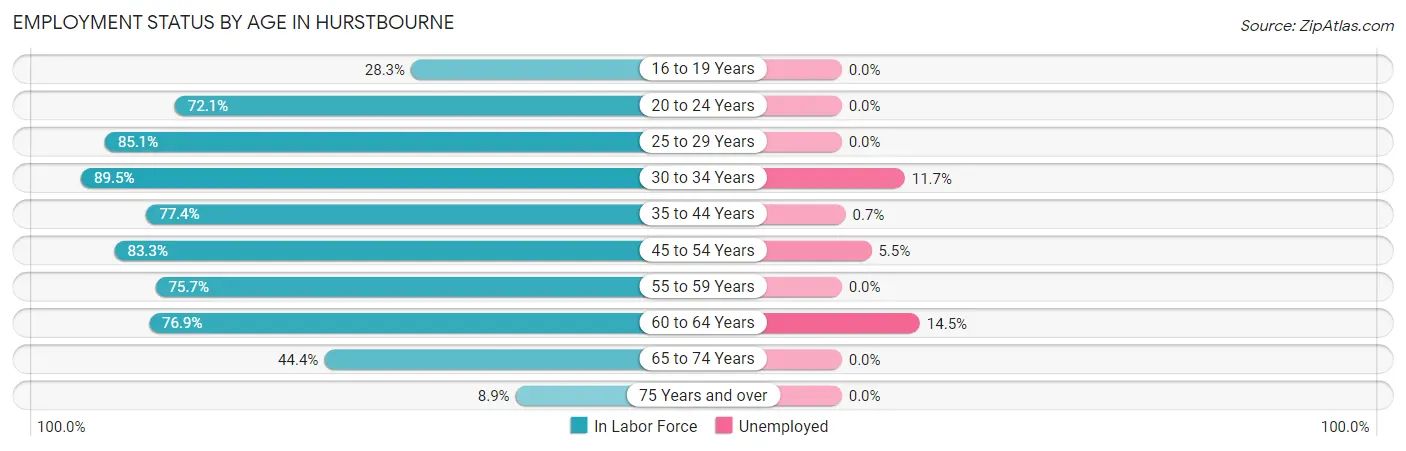
| Age Bracket | In Labor Force | Unemployed |
| 16 to 19 Years | 15 (28.3%) | 0 (0.0%) |
| 20 to 24 Years | 137 (72.1%) | 0 (0.0%) |
| 25 to 29 Years | 262 (85.1%) | 0 (0.0%) |
| 30 to 34 Years | 291 (89.5%) | 34 (11.7%) |
| 35 to 44 Years | 586 (77.4%) | 4 (0.7%) |
| 45 to 54 Years | 365 (83.3%) | 20 (5.5%) |
| 55 to 59 Years | 230 (75.7%) | 0 (0.0%) |
| 60 to 64 Years | 83 (76.9%) | 12 (14.5%) |
| 65 to 74 Years | 190 (44.4%) | 0 (0.0%) |
| 75 Years and over | 40 (8.9%) | 0 (0.0%) |
| Total | 2,200 (65.5%) | 70 (3.2%) |
Employment Status by Educational Attainment in Hurstbourne
According to labor force statistics for Hurstbourne, 81.1% of individuals (1,817) out of the total population between 25 and 64 years of age (2,240) are in the labor force, with 3.9% or 71 of them being unemployed. The group with the highest labor force participation rate are those with the educational attainment of bachelor's degree or higher, with 88.1% or 1,578 individuals in the labor force. Within the labor force, individuals with bachelor's degree or higher education have the highest percentage of unemployment, with 4.4% or 69 of them being unemployed.
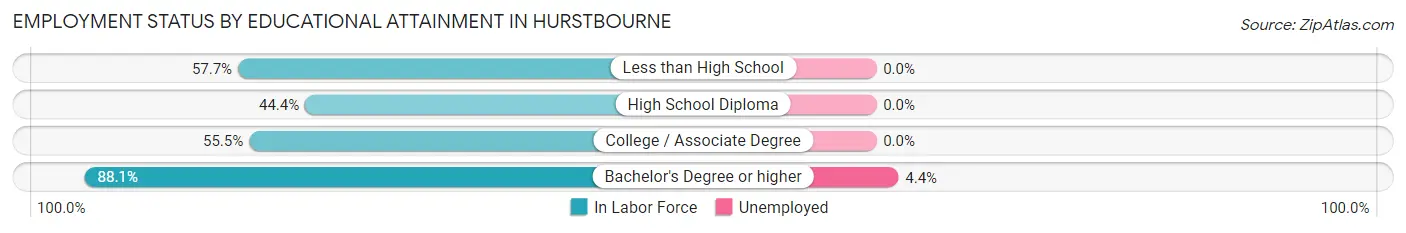
| Educational Attainment | In Labor Force | Unemployed |
| Less than High School | 75 (57.7%) | 0 (0.0%) |
| High School Diploma | 48 (44.4%) | 0 (0.0%) |
| College / Associate Degree | 117 (55.5%) | 0 (0.0%) |
| Bachelor's Degree or higher | 1,578 (88.1%) | 79 (4.4%) |
| Total | 1,817 (81.1%) | 87 (3.9%) |
Employment Occupations by Sex in Hurstbourne
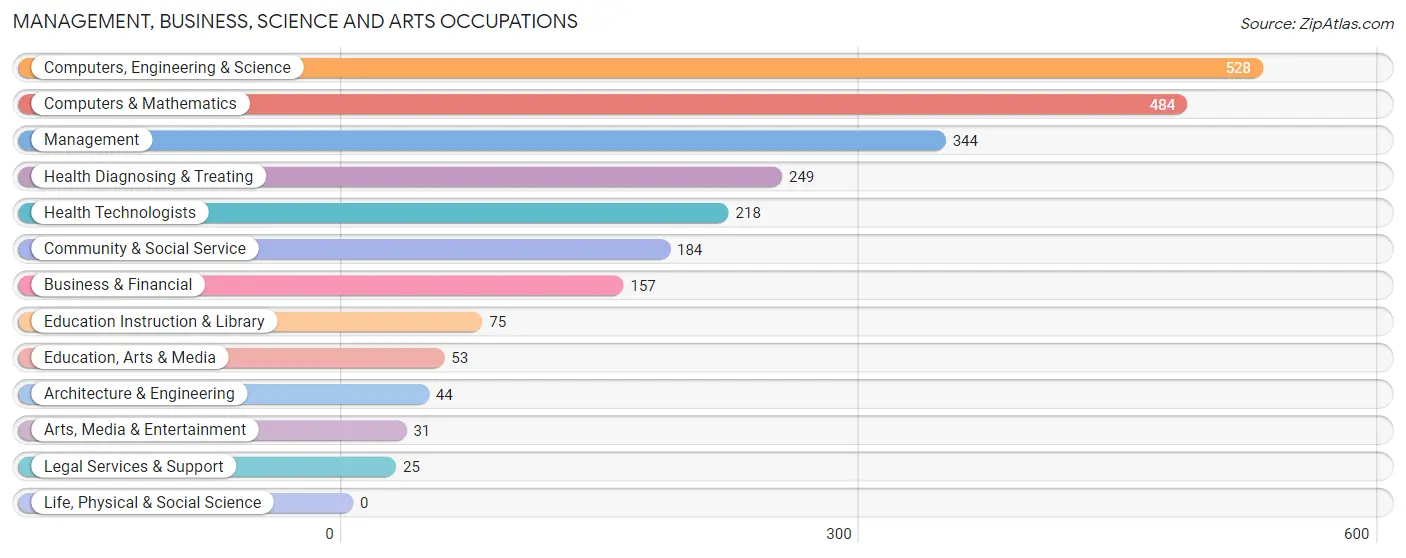
Management, Business, Science and Arts Occupations
The most common Management, Business, Science and Arts occupations in Hurstbourne are Computers, Engineering & Science (528 | 24.8%), Computers & Mathematics (484 | 22.7%), Management (344 | 16.2%), Health Diagnosing & Treating (249 | 11.7%), and Health Technologists (218 | 10.2%).
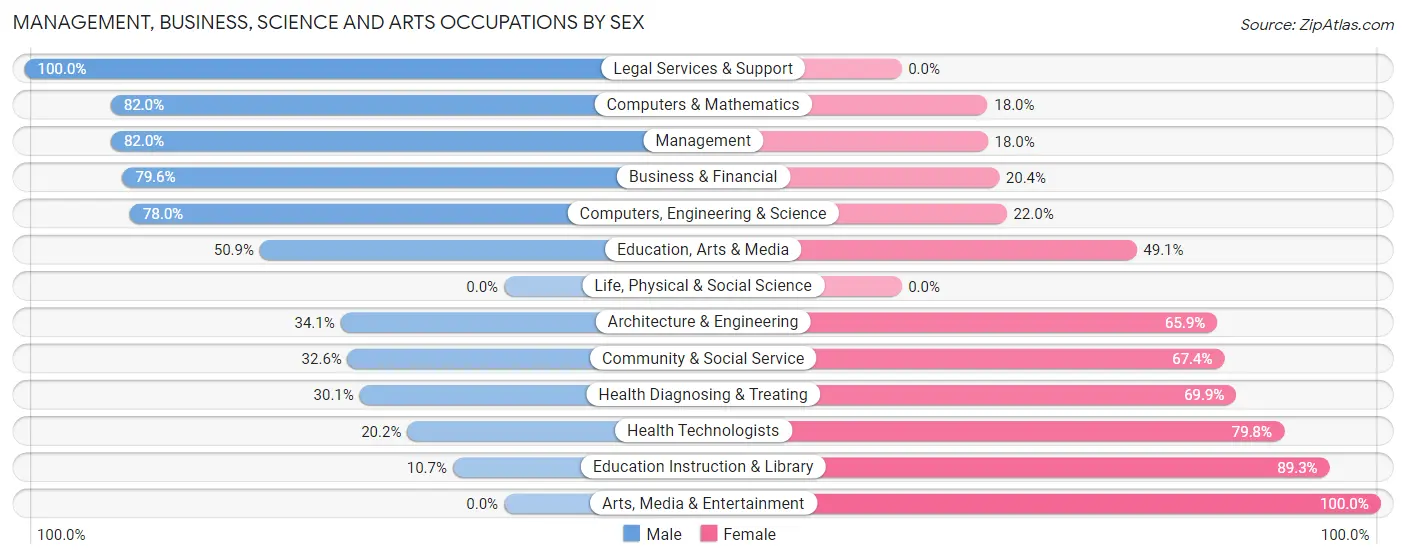
Management, Business, Science and Arts Occupations by Sex
Within the Management, Business, Science and Arts occupations in Hurstbourne, the most male-oriented occupations are Legal Services & Support (100.0%), Computers & Mathematics (82.0%), and Management (82.0%), while the most female-oriented occupations are Arts, Media & Entertainment (100.0%), Education Instruction & Library (89.3%), and Health Technologists (79.8%).
| Occupation | Male | Female |
| Management | 282 (82.0%) | 62 (18.0%) |
| Business & Financial | 125 (79.6%) | 32 (20.4%) |
| Computers, Engineering & Science | 412 (78.0%) | 116 (22.0%) |
| Computers & Mathematics | 397 (82.0%) | 87 (18.0%) |
| Architecture & Engineering | 15 (34.1%) | 29 (65.9%) |
| Life, Physical & Social Science | 0 (0.0%) | 0 (0.0%) |
| Community & Social Service | 60 (32.6%) | 124 (67.4%) |
| Education, Arts & Media | 27 (50.9%) | 26 (49.1%) |
| Legal Services & Support | 25 (100.0%) | 0 (0.0%) |
| Education Instruction & Library | 8 (10.7%) | 67 (89.3%) |
| Arts, Media & Entertainment | 0 (0.0%) | 31 (100.0%) |
| Health Diagnosing & Treating | 75 (30.1%) | 174 (69.9%) |
| Health Technologists | 44 (20.2%) | 174 (79.8%) |
| Total (Category) | 954 (65.2%) | 508 (34.7%) |
| Total (Overall) | 1,312 (61.6%) | 817 (38.4%) |
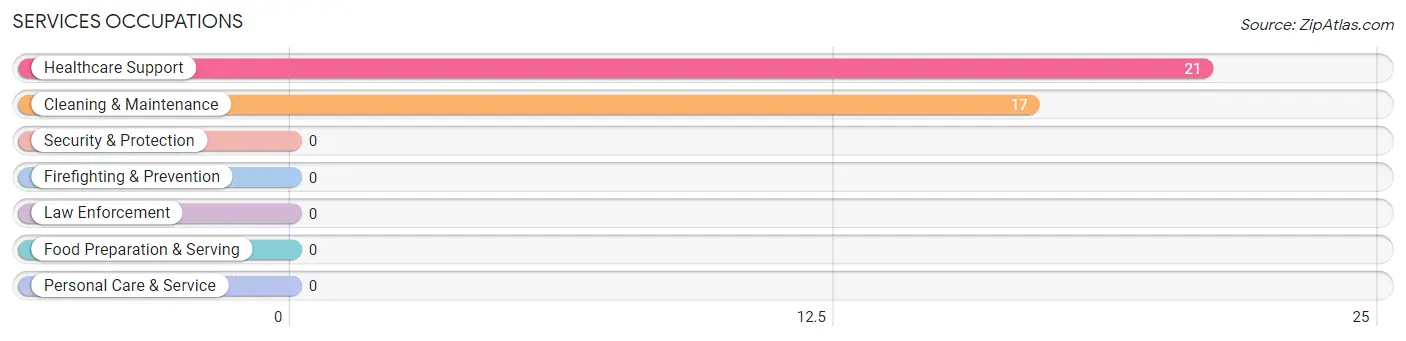
Services Occupations
The most common Services occupations in Hurstbourne are Healthcare Support (21 | 1.0%), and Cleaning & Maintenance (17 | 0.8%).
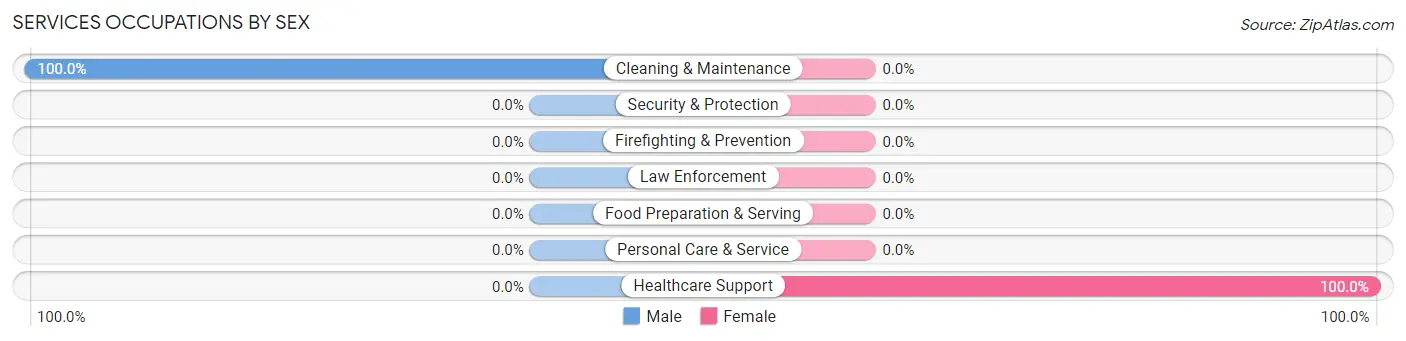
Services Occupations by Sex
| Occupation | Male | Female |
| Healthcare Support | 0 (0.0%) | 21 (100.0%) |
| Security & Protection | 0 (0.0%) | 0 (0.0%) |
| Firefighting & Prevention | 0 (0.0%) | 0 (0.0%) |
| Law Enforcement | 0 (0.0%) | 0 (0.0%) |
| Food Preparation & Serving | 0 (0.0%) | 0 (0.0%) |
| Cleaning & Maintenance | 17 (100.0%) | 0 (0.0%) |
| Personal Care & Service | 0 (0.0%) | 0 (0.0%) |
| Total (Category) | 17 (44.7%) | 21 (55.3%) |
| Total (Overall) | 1,312 (61.6%) | 817 (38.4%) |
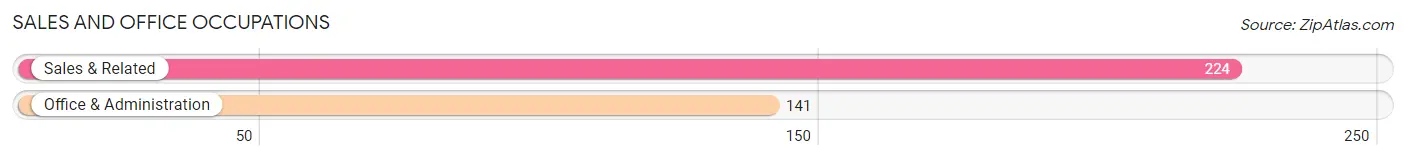
Sales and Office Occupations
The most common Sales and Office occupations in Hurstbourne are Sales & Related (224 | 10.5%), and Office & Administration (141 | 6.6%).
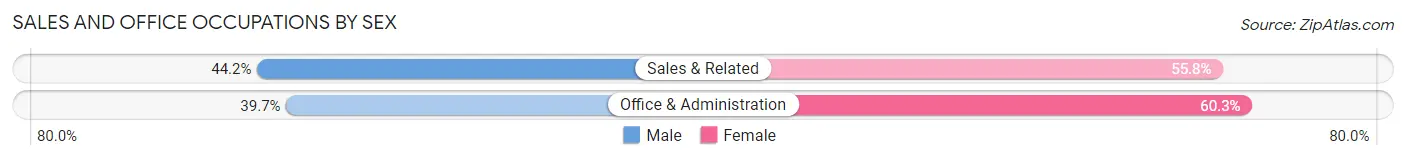
Sales and Office Occupations by Sex
| Occupation | Male | Female |
| Sales & Related | 99 (44.2%) | 125 (55.8%) |
| Office & Administration | 56 (39.7%) | 85 (60.3%) |
| Total (Category) | 155 (42.5%) | 210 (57.5%) |
| Total (Overall) | 1,312 (61.6%) | 817 (38.4%) |
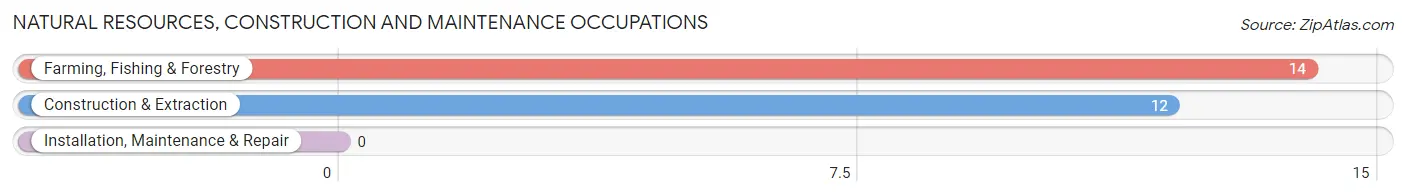
Natural Resources, Construction and Maintenance Occupations
The most common Natural Resources, Construction and Maintenance occupations in Hurstbourne are Farming, Fishing & Forestry (14 | 0.7%), and Construction & Extraction (12 | 0.6%).
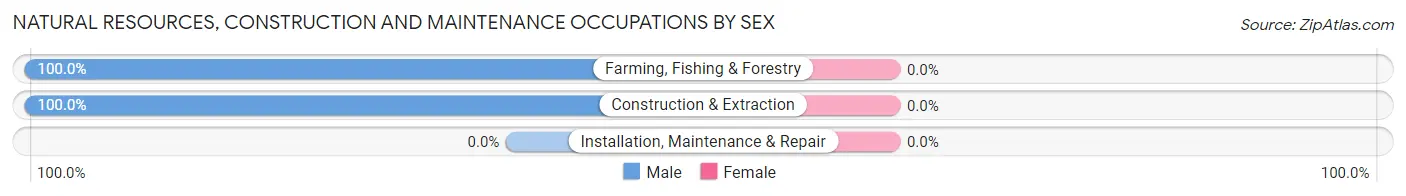
Natural Resources, Construction and Maintenance Occupations by Sex
| Occupation | Male | Female |
| Farming, Fishing & Forestry | 14 (100.0%) | 0 (0.0%) |
| Construction & Extraction | 12 (100.0%) | 0 (0.0%) |
| Installation, Maintenance & Repair | 0 (0.0%) | 0 (0.0%) |
| Total (Category) | 26 (100.0%) | 0 (0.0%) |
| Total (Overall) | 1,312 (61.6%) | 817 (38.4%) |
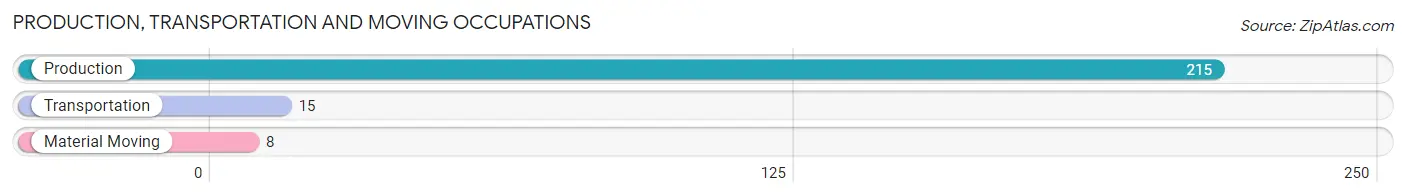
Production, Transportation and Moving Occupations
The most common Production, Transportation and Moving occupations in Hurstbourne are Production (215 | 10.1%), Transportation (15 | 0.7%), and Material Moving (8 | 0.4%).
Production, Transportation and Moving Occupations by Sex
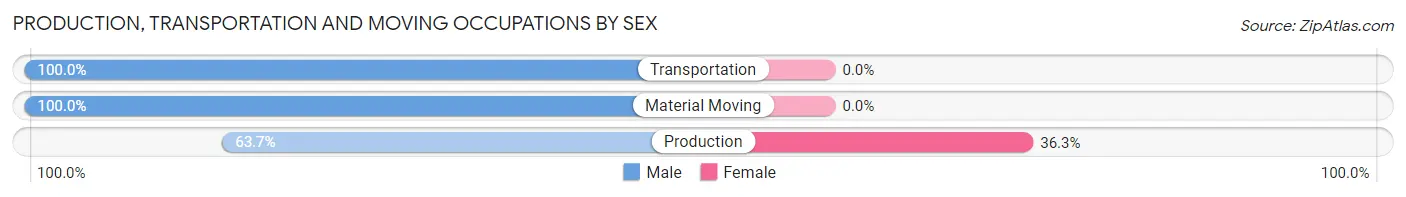
| Occupation | Male | Female |
| Production | 137 (63.7%) | 78 (36.3%) |
| Transportation | 15 (100.0%) | 0 (0.0%) |
| Material Moving | 8 (100.0%) | 0 (0.0%) |
| Total (Category) | 160 (67.2%) | 78 (32.8%) |
| Total (Overall) | 1,312 (61.6%) | 817 (38.4%) |
Employment Industries by Sex in Hurstbourne
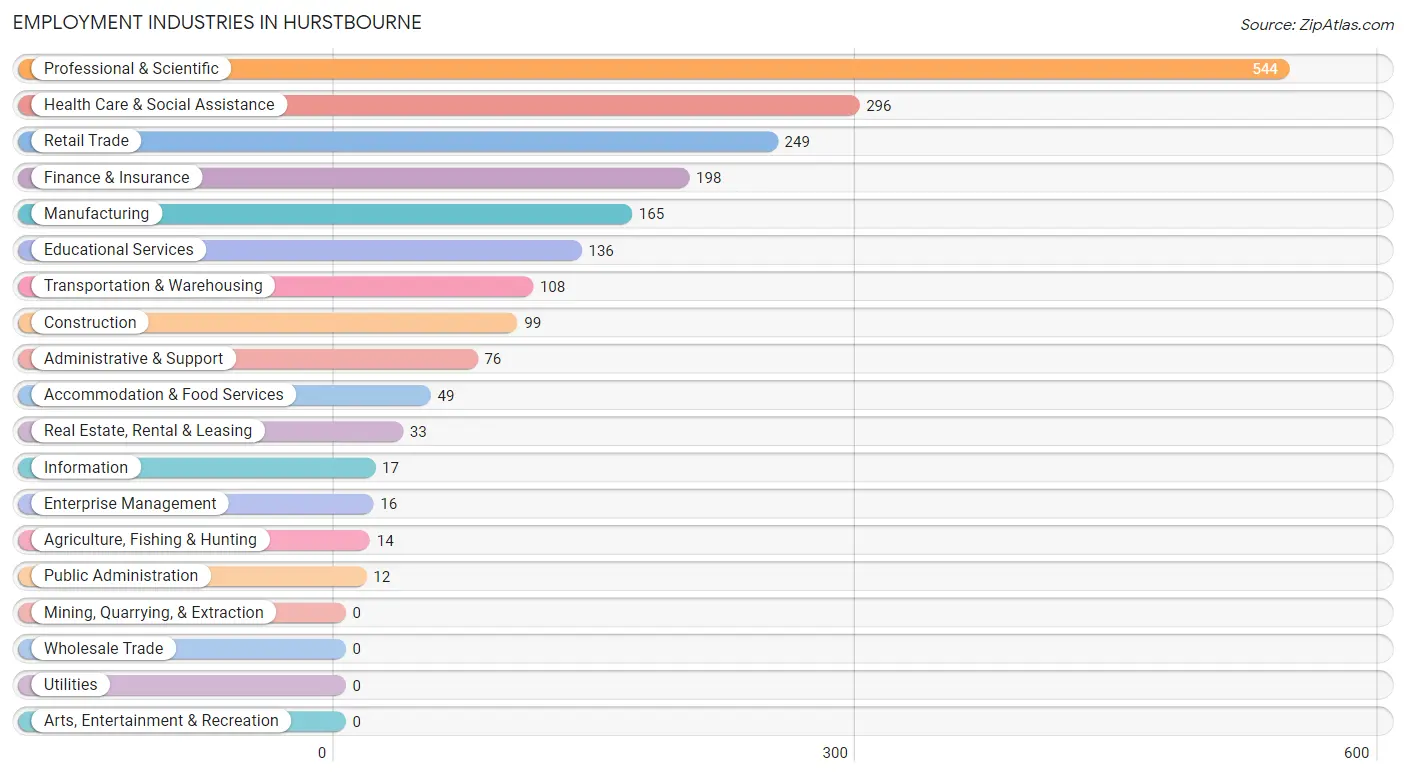
Employment Industries in Hurstbourne
The major employment industries in Hurstbourne include Professional & Scientific (544 | 25.6%), Health Care & Social Assistance (296 | 13.9%), Retail Trade (249 | 11.7%), Finance & Insurance (198 | 9.3%), and Manufacturing (165 | 7.7%).
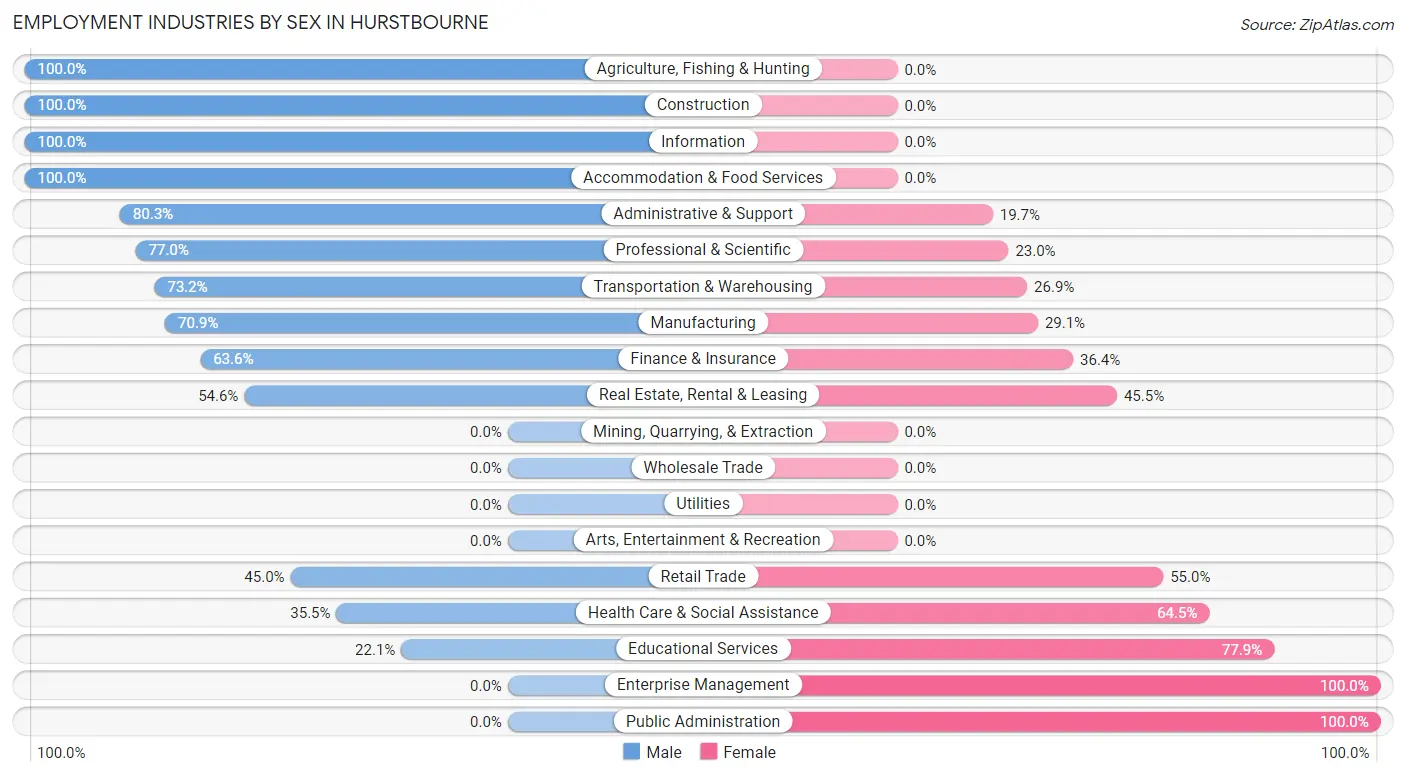
Employment Industries by Sex in Hurstbourne
The Hurstbourne industries that see more men than women are Agriculture, Fishing & Hunting (100.0%), Construction (100.0%), and Information (100.0%), whereas the industries that tend to have a higher number of women are Enterprise Management (100.0%), Public Administration (100.0%), and Educational Services (77.9%).
| Industry | Male | Female |
| Agriculture, Fishing & Hunting | 14 (100.0%) | 0 (0.0%) |
| Mining, Quarrying, & Extraction | 0 (0.0%) | 0 (0.0%) |
| Construction | 99 (100.0%) | 0 (0.0%) |
| Manufacturing | 117 (70.9%) | 48 (29.1%) |
| Wholesale Trade | 0 (0.0%) | 0 (0.0%) |
| Retail Trade | 112 (45.0%) | 137 (55.0%) |
| Transportation & Warehousing | 79 (73.2%) | 29 (26.9%) |
| Utilities | 0 (0.0%) | 0 (0.0%) |
| Information | 17 (100.0%) | 0 (0.0%) |
| Finance & Insurance | 126 (63.6%) | 72 (36.4%) |
| Real Estate, Rental & Leasing | 18 (54.5%) | 15 (45.5%) |
| Professional & Scientific | 419 (77.0%) | 125 (23.0%) |
| Enterprise Management | 0 (0.0%) | 16 (100.0%) |
| Administrative & Support | 61 (80.3%) | 15 (19.7%) |
| Educational Services | 30 (22.1%) | 106 (77.9%) |
| Health Care & Social Assistance | 105 (35.5%) | 191 (64.5%) |
| Arts, Entertainment & Recreation | 0 (0.0%) | 0 (0.0%) |
| Accommodation & Food Services | 49 (100.0%) | 0 (0.0%) |
| Public Administration | 0 (0.0%) | 12 (100.0%) |
| Total | 1,312 (61.6%) | 817 (38.4%) |
Education in Hurstbourne
School Enrollment in Hurstbourne
The most common levels of schooling among the 1,354 students in Hurstbourne are elementary school (471 | 34.8%), nursery / preschool (242 | 17.9%), and middle school (183 | 13.5%).
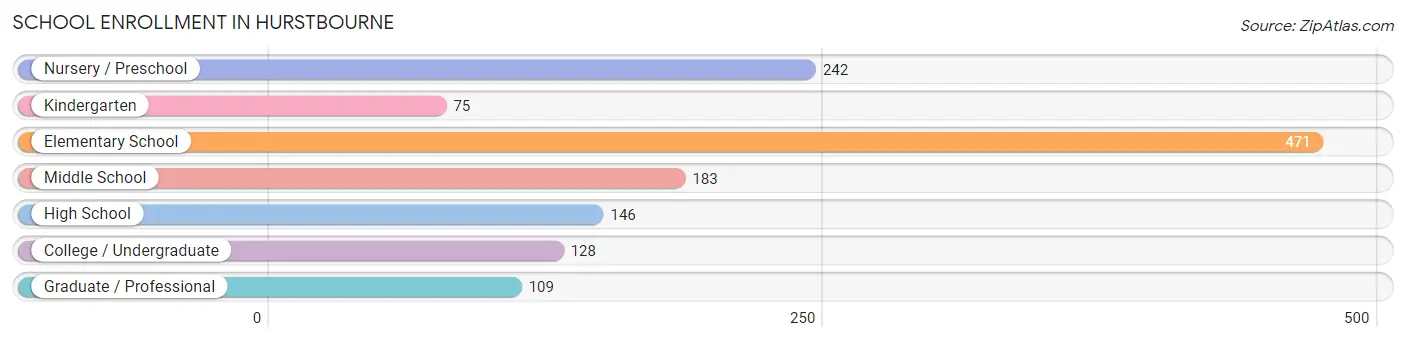
| School Level | # Students | % Students |
| Nursery / Preschool | 242 | 17.9% |
| Kindergarten | 75 | 5.5% |
| Elementary School | 471 | 34.8% |
| Middle School | 183 | 13.5% |
| High School | 146 | 10.8% |
| College / Undergraduate | 128 | 9.5% |
| Graduate / Professional | 109 | 8.1% |
| Total | 1,354 | 100.0% |
School Enrollment by Age by Funding Source in Hurstbourne
Out of a total of 1,354 students who are enrolled in schools in Hurstbourne, 723 (53.4%) attend a private institution, while the remaining 631 (46.6%) are enrolled in public schools. The age group of 3 to 4 year olds has the highest likelihood of being enrolled in private schools, with 203 (87.5% in the age bracket) enrolled. Conversely, the age group of 18 to 19 year olds has the lowest likelihood of being enrolled in a private school, with 30 (100.0% in the age bracket) attending a public institution.
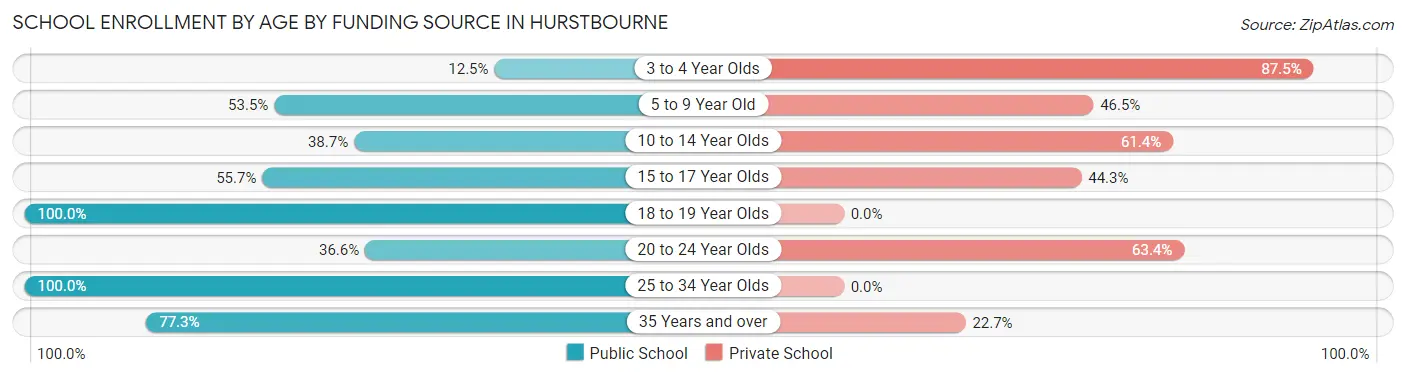
| Age Bracket | Public School | Private School |
| 3 to 4 Year Olds | 29 (12.5%) | 203 (87.5%) |
| 5 to 9 Year Old | 274 (53.5%) | 238 (46.5%) |
| 10 to 14 Year Olds | 97 (38.7%) | 154 (61.4%) |
| 15 to 17 Year Olds | 68 (55.7%) | 54 (44.3%) |
| 18 to 19 Year Olds | 30 (100.0%) | 0 (0.0%) |
| 20 to 24 Year Olds | 30 (36.6%) | 52 (63.4%) |
| 25 to 34 Year Olds | 28 (100.0%) | 0 (0.0%) |
| 35 Years and over | 75 (77.3%) | 22 (22.7%) |
| Total | 631 (46.6%) | 723 (53.4%) |
Educational Attainment by Field of Study in Hurstbourne
Business (615 | 26.4%), science & technology (329 | 14.1%), engineering (307 | 13.2%), social sciences (190 | 8.2%), and computers & mathematics (183 | 7.9%) are the most common fields of study among 2,331 individuals in Hurstbourne who have obtained a bachelor's degree or higher.
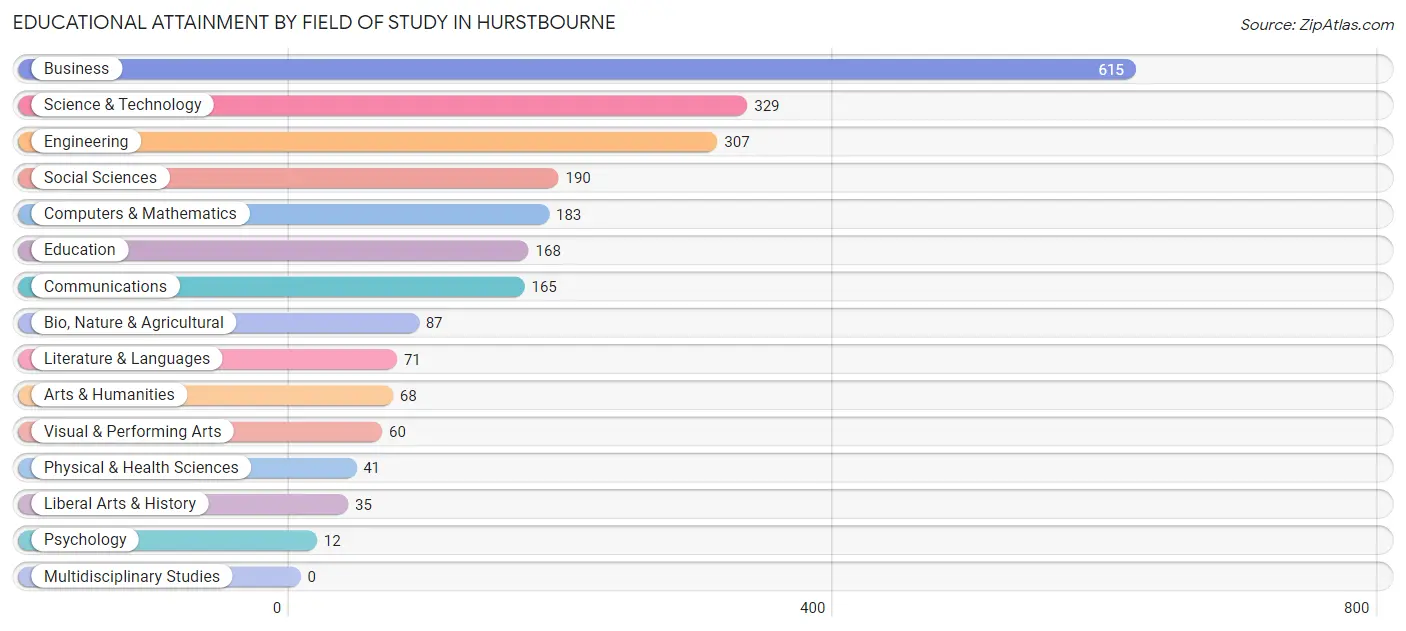
| Field of Study | # Graduates | % Graduates |
| Computers & Mathematics | 183 | 7.9% |
| Bio, Nature & Agricultural | 87 | 3.7% |
| Physical & Health Sciences | 41 | 1.8% |
| Psychology | 12 | 0.5% |
| Social Sciences | 190 | 8.2% |
| Engineering | 307 | 13.2% |
| Multidisciplinary Studies | 0 | 0.0% |
| Science & Technology | 329 | 14.1% |
| Business | 615 | 26.4% |
| Education | 168 | 7.2% |
| Literature & Languages | 71 | 3.0% |
| Liberal Arts & History | 35 | 1.5% |
| Visual & Performing Arts | 60 | 2.6% |
| Communications | 165 | 7.1% |
| Arts & Humanities | 68 | 2.9% |
| Total | 2,331 | 100.0% |
Transportation & Commute in Hurstbourne
Vehicle Availability by Sex in Hurstbourne
The most prevalent vehicle ownership categories in Hurstbourne are males with 2 vehicles (619, accounting for 47.2%) and females with 2 vehicles (429, making up 75.8%).
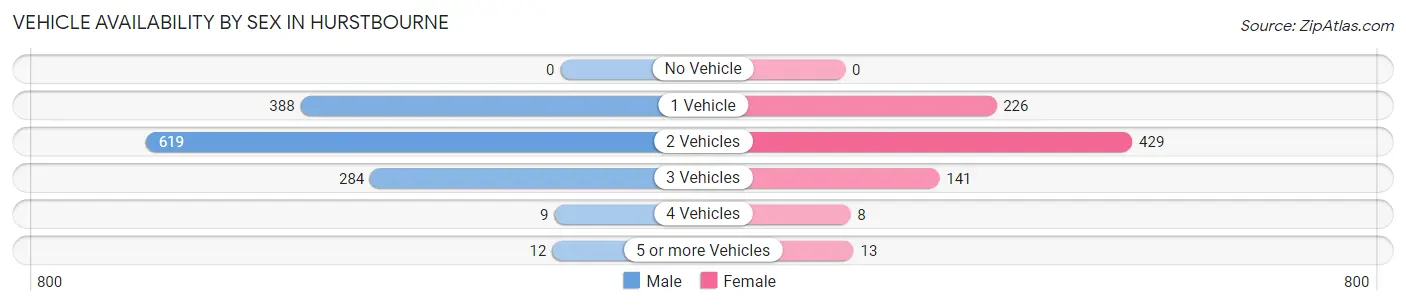
| Vehicles Available | Male | Female |
| No Vehicle | 0 (0.0%) | 0 (0.0%) |
| 1 Vehicle | 388 (29.6%) | 226 (27.7%) |
| 2 Vehicles | 619 (47.2%) | 429 (52.5%) |
| 3 Vehicles | 284 (21.6%) | 141 (17.3%) |
| 4 Vehicles | 9 (0.7%) | 8 (1.0%) |
| 5 or more Vehicles | 12 (0.9%) | 13 (1.6%) |
| Total | 1,312 (100.0%) | 817 (100.0%) |
Commute Time in Hurstbourne
The most frequently occuring commute durations in Hurstbourne are 20 to 24 minutes (526 commuters, 29.6%), 15 to 19 minutes (353 commuters, 19.8%), and 30 to 34 minutes (197 commuters, 11.1%).
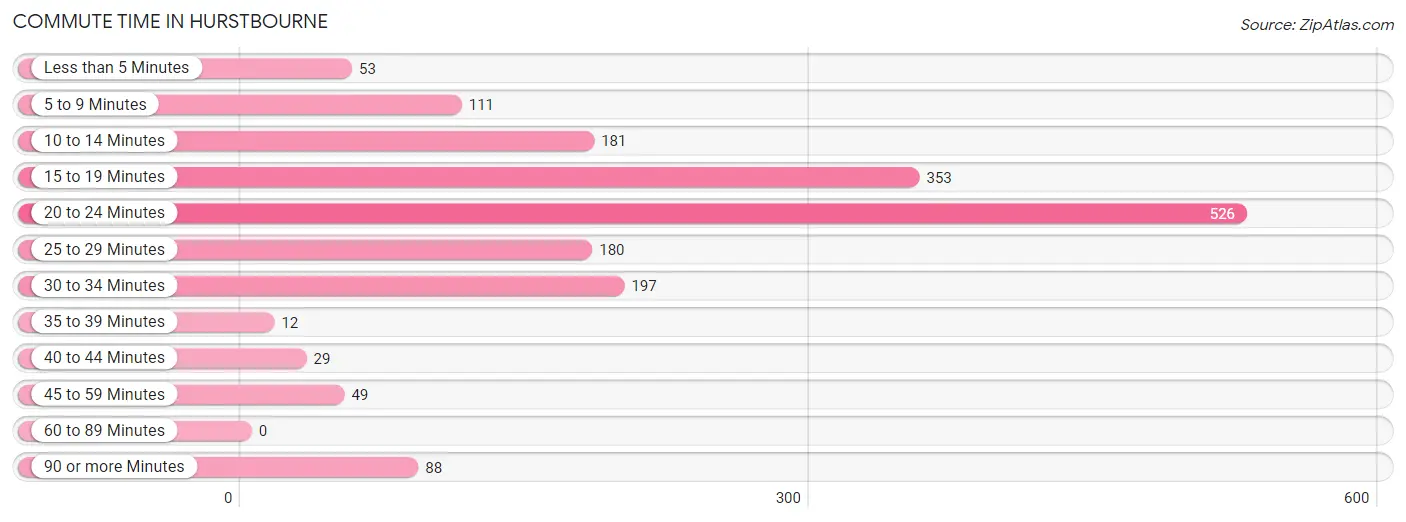
| Commute Time | # Commuters | % Commuters |
| Less than 5 Minutes | 53 | 3.0% |
| 5 to 9 Minutes | 111 | 6.2% |
| 10 to 14 Minutes | 181 | 10.2% |
| 15 to 19 Minutes | 353 | 19.8% |
| 20 to 24 Minutes | 526 | 29.6% |
| 25 to 29 Minutes | 180 | 10.1% |
| 30 to 34 Minutes | 197 | 11.1% |
| 35 to 39 Minutes | 12 | 0.7% |
| 40 to 44 Minutes | 29 | 1.6% |
| 45 to 59 Minutes | 49 | 2.8% |
| 60 to 89 Minutes | 0 | 0.0% |
| 90 or more Minutes | 88 | 5.0% |
Commute Time by Sex in Hurstbourne
The most common commute times in Hurstbourne are 20 to 24 minutes (296 commuters, 28.2%) for males and 20 to 24 minutes (230 commuters, 31.5%) for females.
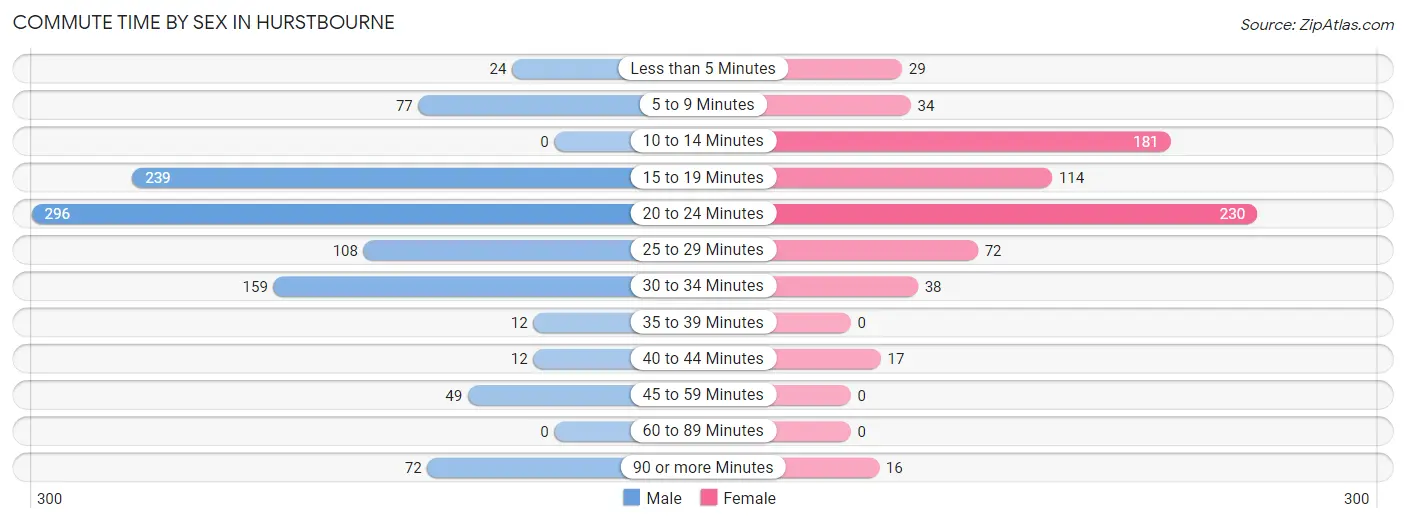
| Commute Time | Male | Female |
| Less than 5 Minutes | 24 (2.3%) | 29 (4.0%) |
| 5 to 9 Minutes | 77 (7.3%) | 34 (4.6%) |
| 10 to 14 Minutes | 0 (0.0%) | 181 (24.8%) |
| 15 to 19 Minutes | 239 (22.8%) | 114 (15.6%) |
| 20 to 24 Minutes | 296 (28.2%) | 230 (31.5%) |
| 25 to 29 Minutes | 108 (10.3%) | 72 (9.9%) |
| 30 to 34 Minutes | 159 (15.2%) | 38 (5.2%) |
| 35 to 39 Minutes | 12 (1.1%) | 0 (0.0%) |
| 40 to 44 Minutes | 12 (1.1%) | 17 (2.3%) |
| 45 to 59 Minutes | 49 (4.7%) | 0 (0.0%) |
| 60 to 89 Minutes | 0 (0.0%) | 0 (0.0%) |
| 90 or more Minutes | 72 (6.9%) | 16 (2.2%) |
Time of Departure to Work by Sex in Hurstbourne
The most frequent times of departure to work in Hurstbourne are 7:30 AM to 7:59 AM (197, 18.8%) for males and 8:30 AM to 8:59 AM (189, 25.9%) for females.
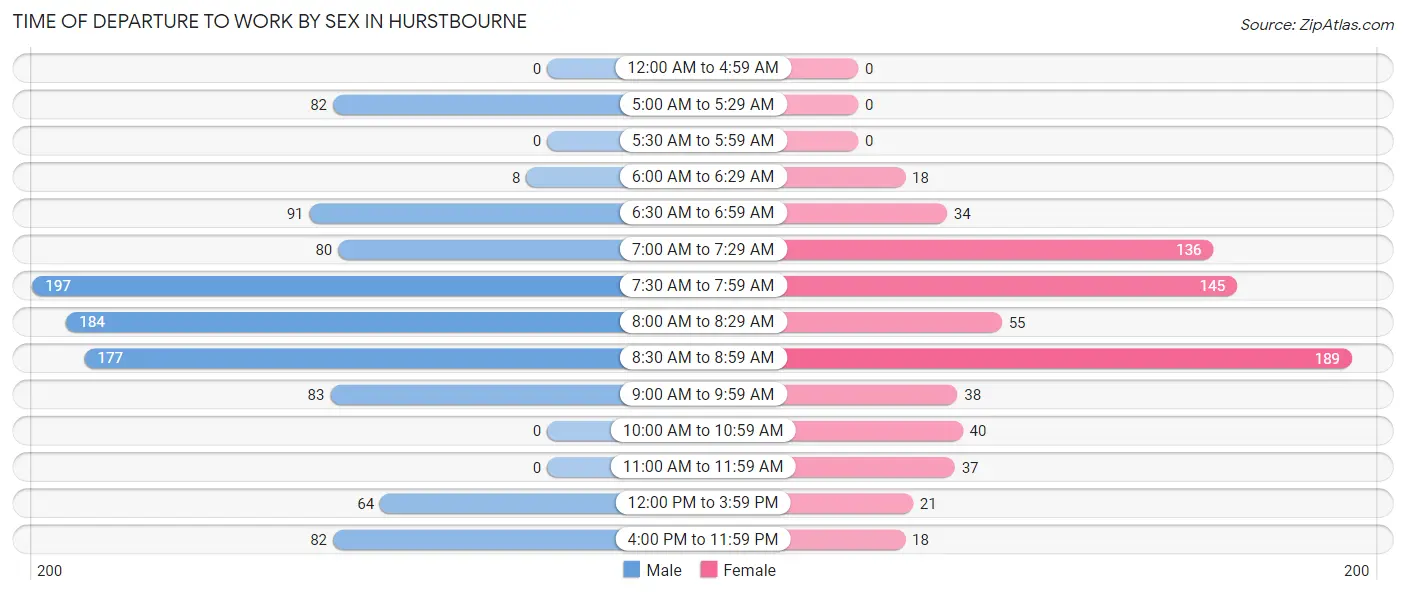
| Time of Departure | Male | Female |
| 12:00 AM to 4:59 AM | 0 (0.0%) | 0 (0.0%) |
| 5:00 AM to 5:29 AM | 82 (7.8%) | 0 (0.0%) |
| 5:30 AM to 5:59 AM | 0 (0.0%) | 0 (0.0%) |
| 6:00 AM to 6:29 AM | 8 (0.8%) | 18 (2.5%) |
| 6:30 AM to 6:59 AM | 91 (8.7%) | 34 (4.6%) |
| 7:00 AM to 7:29 AM | 80 (7.6%) | 136 (18.6%) |
| 7:30 AM to 7:59 AM | 197 (18.8%) | 145 (19.8%) |
| 8:00 AM to 8:29 AM | 184 (17.6%) | 55 (7.5%) |
| 8:30 AM to 8:59 AM | 177 (16.9%) | 189 (25.9%) |
| 9:00 AM to 9:59 AM | 83 (7.9%) | 38 (5.2%) |
| 10:00 AM to 10:59 AM | 0 (0.0%) | 40 (5.5%) |
| 11:00 AM to 11:59 AM | 0 (0.0%) | 37 (5.1%) |
| 12:00 PM to 3:59 PM | 64 (6.1%) | 21 (2.9%) |
| 4:00 PM to 11:59 PM | 82 (7.8%) | 18 (2.5%) |
| Total | 1,048 (100.0%) | 731 (100.0%) |
Housing Occupancy in Hurstbourne
Occupancy by Ownership in Hurstbourne
Of the total 1,770 dwellings in Hurstbourne, owner-occupied units account for 998 (56.4%), while renter-occupied units make up 772 (43.6%).
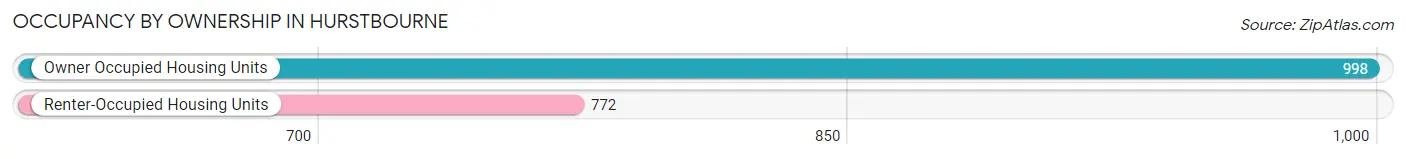
| Occupancy | # Housing Units | % Housing Units |
| Owner Occupied Housing Units | 998 | 56.4% |
| Renter-Occupied Housing Units | 772 | 43.6% |
| Total Occupied Housing Units | 1,770 | 100.0% |
Occupancy by Household Size in Hurstbourne
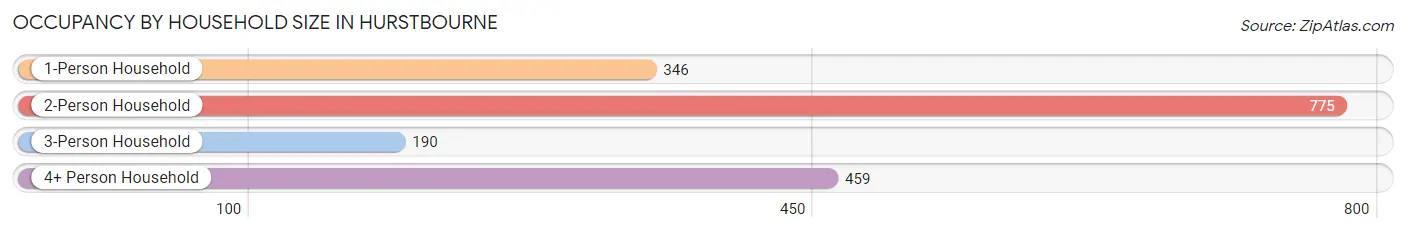
| Household Size | # Housing Units | % Housing Units |
| 1-Person Household | 346 | 19.6% |
| 2-Person Household | 775 | 43.8% |
| 3-Person Household | 190 | 10.7% |
| 4+ Person Household | 459 | 25.9% |
| Total Housing Units | 1,770 | 100.0% |
Occupancy by Ownership by Household Size in Hurstbourne
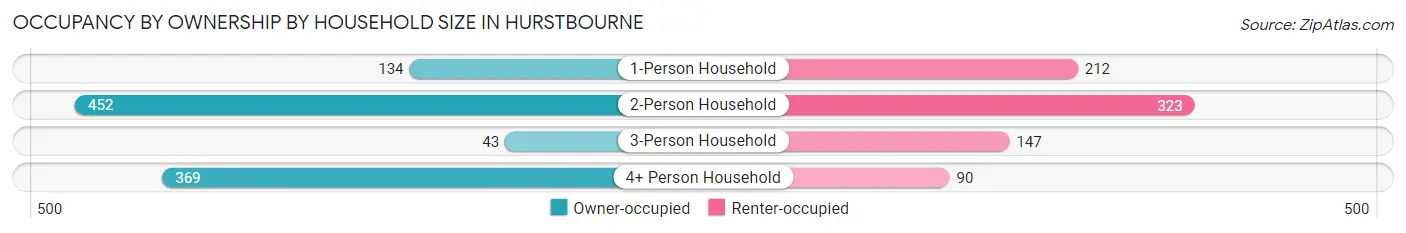
| Household Size | Owner-occupied | Renter-occupied |
| 1-Person Household | 134 (38.7%) | 212 (61.3%) |
| 2-Person Household | 452 (58.3%) | 323 (41.7%) |
| 3-Person Household | 43 (22.6%) | 147 (77.4%) |
| 4+ Person Household | 369 (80.4%) | 90 (19.6%) |
| Total Housing Units | 998 (56.4%) | 772 (43.6%) |
Occupancy by Educational Attainment in Hurstbourne
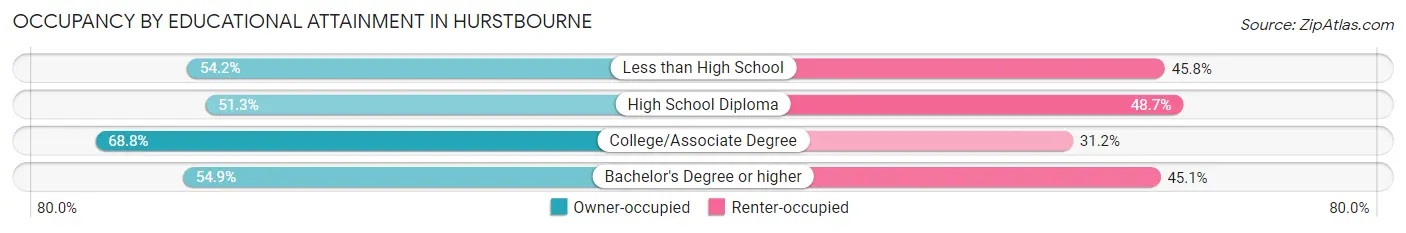
| Household Size | Owner-occupied | Renter-occupied |
| Less than High School | 45 (54.2%) | 38 (45.8%) |
| High School Diploma | 115 (51.3%) | 109 (48.7%) |
| College/Associate Degree | 172 (68.8%) | 78 (31.2%) |
| Bachelor's Degree or higher | 666 (54.9%) | 547 (45.1%) |
Occupancy by Age of Householder in Hurstbourne
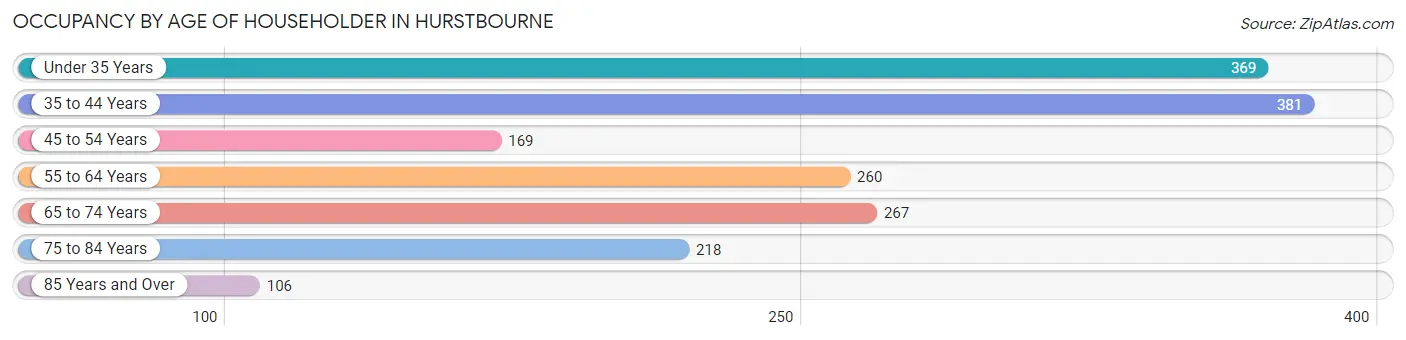
| Age Bracket | # Households | % Households |
| Under 35 Years | 369 | 20.8% |
| 35 to 44 Years | 381 | 21.5% |
| 45 to 54 Years | 169 | 9.6% |
| 55 to 64 Years | 260 | 14.7% |
| 65 to 74 Years | 267 | 15.1% |
| 75 to 84 Years | 218 | 12.3% |
| 85 Years and Over | 106 | 6.0% |
| Total | 1,770 | 100.0% |
Housing Finances in Hurstbourne
Median Income by Occupancy in Hurstbourne
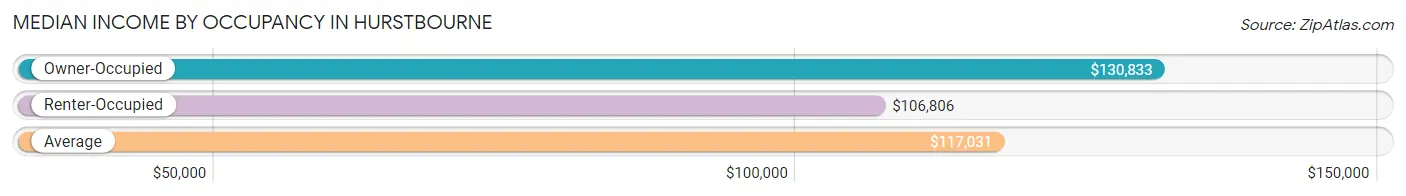
| Occupancy Type | # Households | Median Income |
| Owner-Occupied | 998 (56.4%) | $130,833 |
| Renter-Occupied | 772 (43.6%) | $106,806 |
| Average | 1,770 (100.0%) | $117,031 |
Occupancy by Householder Income Bracket in Hurstbourne
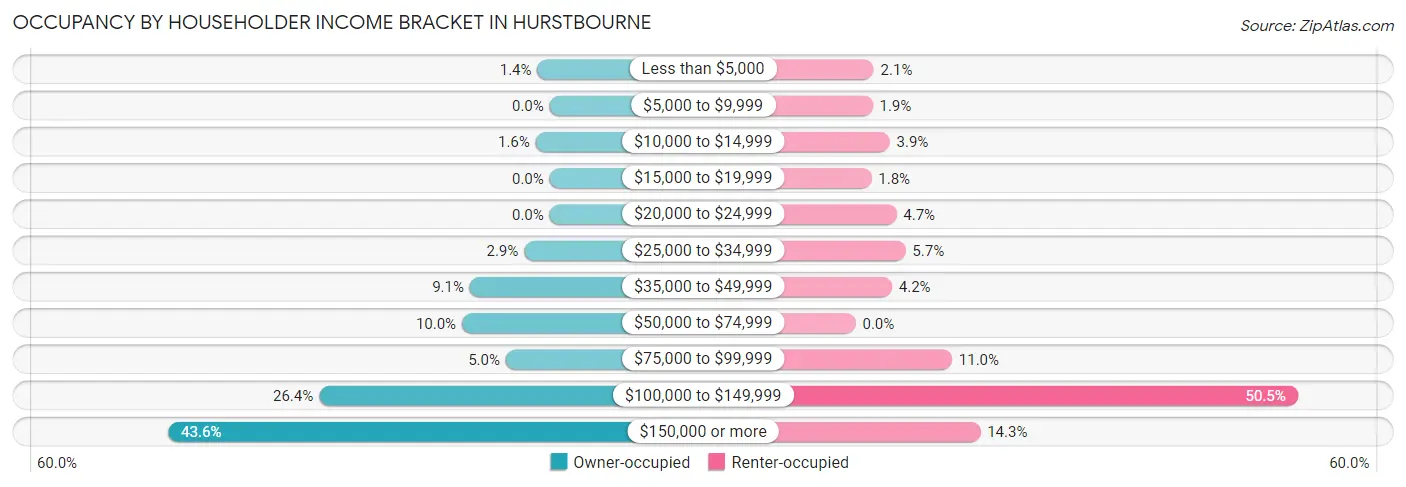
| Income Bracket | Owner-occupied | Renter-occupied |
| Less than $5,000 | 14 (1.4%) | 16 (2.1%) |
| $5,000 to $9,999 | 0 (0.0%) | 15 (1.9%) |
| $10,000 to $14,999 | 16 (1.6%) | 30 (3.9%) |
| $15,000 to $19,999 | 0 (0.0%) | 14 (1.8%) |
| $20,000 to $24,999 | 0 (0.0%) | 36 (4.7%) |
| $25,000 to $34,999 | 29 (2.9%) | 44 (5.7%) |
| $35,000 to $49,999 | 91 (9.1%) | 32 (4.2%) |
| $50,000 to $74,999 | 100 (10.0%) | 0 (0.0%) |
| $75,000 to $99,999 | 50 (5.0%) | 85 (11.0%) |
| $100,000 to $149,999 | 263 (26.4%) | 390 (50.5%) |
| $150,000 or more | 435 (43.6%) | 110 (14.2%) |
| Total | 998 (100.0%) | 772 (100.0%) |
Monthly Housing Cost Tiers in Hurstbourne
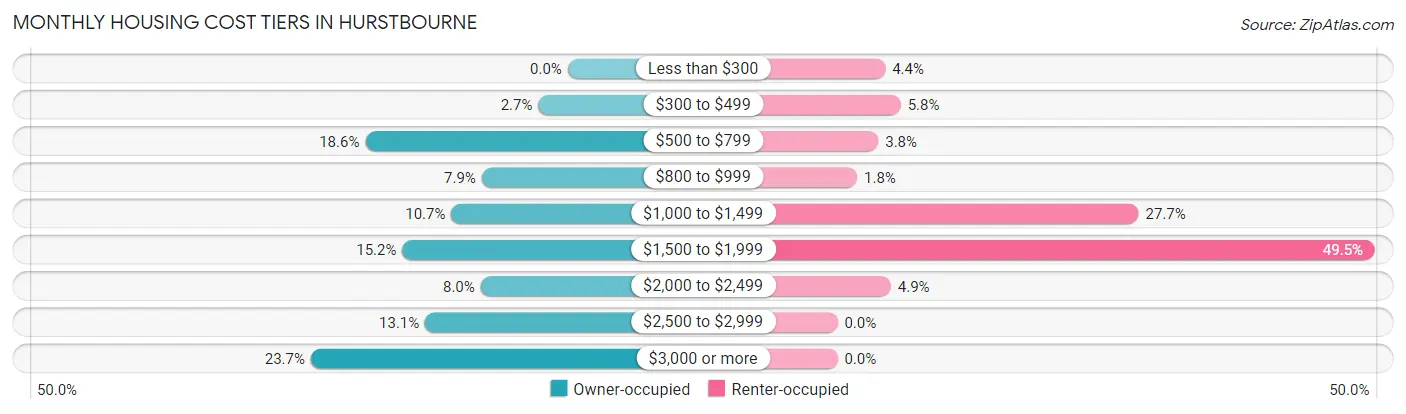
| Monthly Cost | Owner-occupied | Renter-occupied |
| Less than $300 | 0 (0.0%) | 34 (4.4%) |
| $300 to $499 | 27 (2.7%) | 45 (5.8%) |
| $500 to $799 | 186 (18.6%) | 29 (3.8%) |
| $800 to $999 | 79 (7.9%) | 14 (1.8%) |
| $1,000 to $1,499 | 107 (10.7%) | 214 (27.7%) |
| $1,500 to $1,999 | 152 (15.2%) | 382 (49.5%) |
| $2,000 to $2,499 | 80 (8.0%) | 38 (4.9%) |
| $2,500 to $2,999 | 131 (13.1%) | 0 (0.0%) |
| $3,000 or more | 236 (23.6%) | 0 (0.0%) |
| Total | 998 (100.0%) | 772 (100.0%) |
Physical Housing Characteristics in Hurstbourne
Housing Structures in Hurstbourne
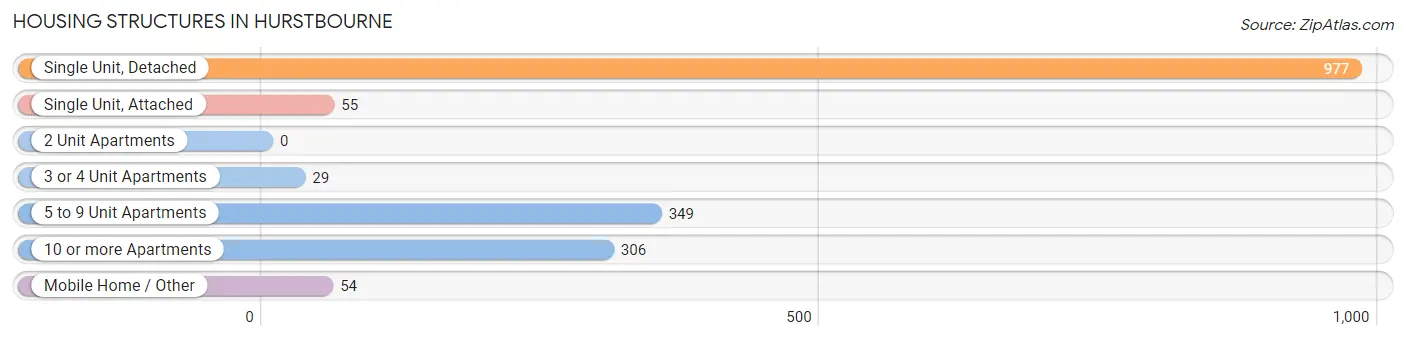
| Structure Type | # Housing Units | % Housing Units |
| Single Unit, Detached | 977 | 55.2% |
| Single Unit, Attached | 55 | 3.1% |
| 2 Unit Apartments | 0 | 0.0% |
| 3 or 4 Unit Apartments | 29 | 1.6% |
| 5 to 9 Unit Apartments | 349 | 19.7% |
| 10 or more Apartments | 306 | 17.3% |
| Mobile Home / Other | 54 | 3.0% |
| Total | 1,770 | 100.0% |
Housing Structures by Occupancy in Hurstbourne
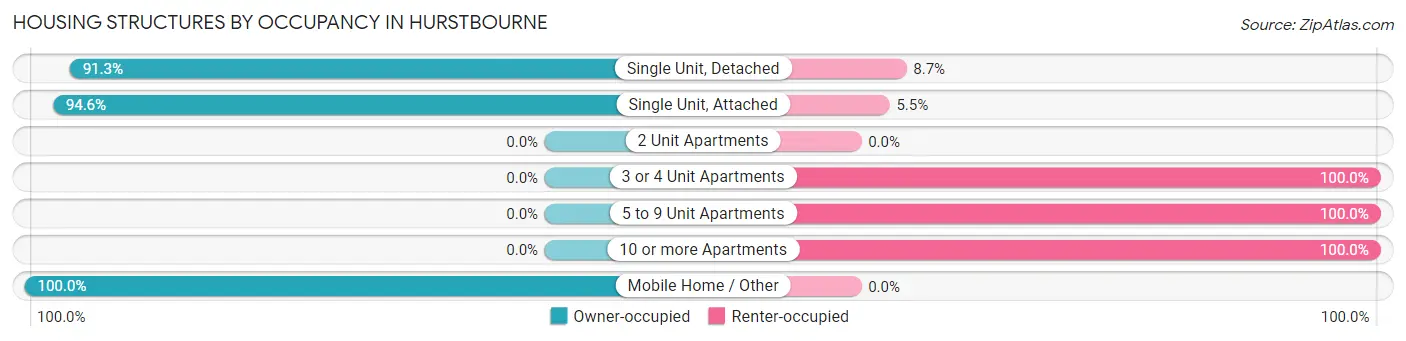
| Structure Type | Owner-occupied | Renter-occupied |
| Single Unit, Detached | 892 (91.3%) | 85 (8.7%) |
| Single Unit, Attached | 52 (94.6%) | 3 (5.4%) |
| 2 Unit Apartments | 0 (0.0%) | 0 (0.0%) |
| 3 or 4 Unit Apartments | 0 (0.0%) | 29 (100.0%) |
| 5 to 9 Unit Apartments | 0 (0.0%) | 349 (100.0%) |
| 10 or more Apartments | 0 (0.0%) | 306 (100.0%) |
| Mobile Home / Other | 54 (100.0%) | 0 (0.0%) |
| Total | 998 (56.4%) | 772 (43.6%) |
Housing Structures by Number of Rooms in Hurstbourne
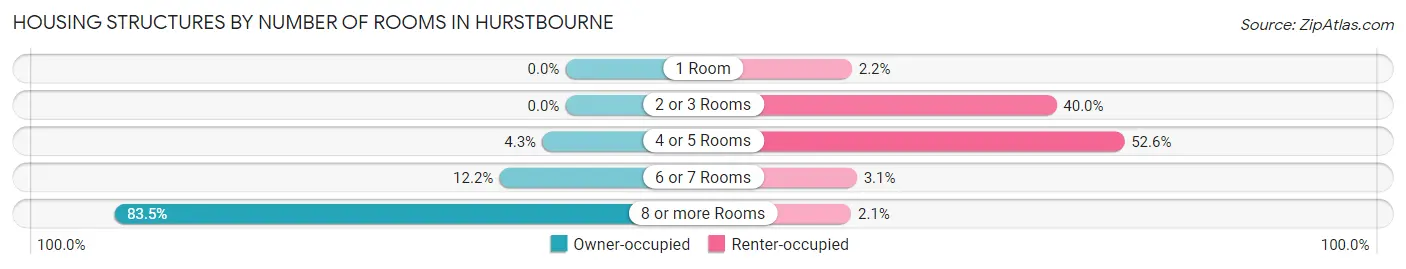
| Number of Rooms | Owner-occupied | Renter-occupied |
| 1 Room | 0 (0.0%) | 17 (2.2%) |
| 2 or 3 Rooms | 0 (0.0%) | 309 (40.0%) |
| 4 or 5 Rooms | 43 (4.3%) | 406 (52.6%) |
| 6 or 7 Rooms | 122 (12.2%) | 24 (3.1%) |
| 8 or more Rooms | 833 (83.5%) | 16 (2.1%) |
| Total | 998 (100.0%) | 772 (100.0%) |
Housing Structure by Heating Type in Hurstbourne
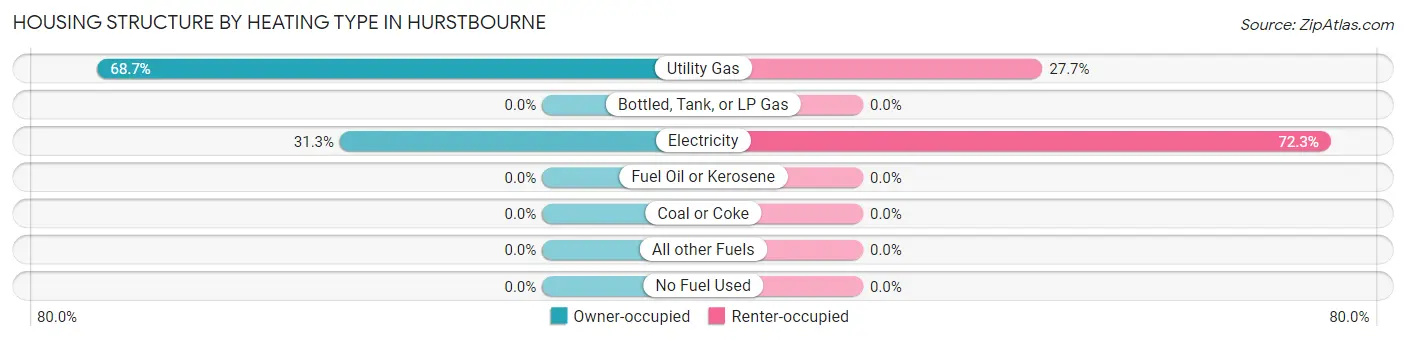
| Heating Type | Owner-occupied | Renter-occupied |
| Utility Gas | 686 (68.7%) | 214 (27.7%) |
| Bottled, Tank, or LP Gas | 0 (0.0%) | 0 (0.0%) |
| Electricity | 312 (31.3%) | 558 (72.3%) |
| Fuel Oil or Kerosene | 0 (0.0%) | 0 (0.0%) |
| Coal or Coke | 0 (0.0%) | 0 (0.0%) |
| All other Fuels | 0 (0.0%) | 0 (0.0%) |
| No Fuel Used | 0 (0.0%) | 0 (0.0%) |
| Total | 998 (100.0%) | 772 (100.0%) |
Household Vehicle Usage in Hurstbourne
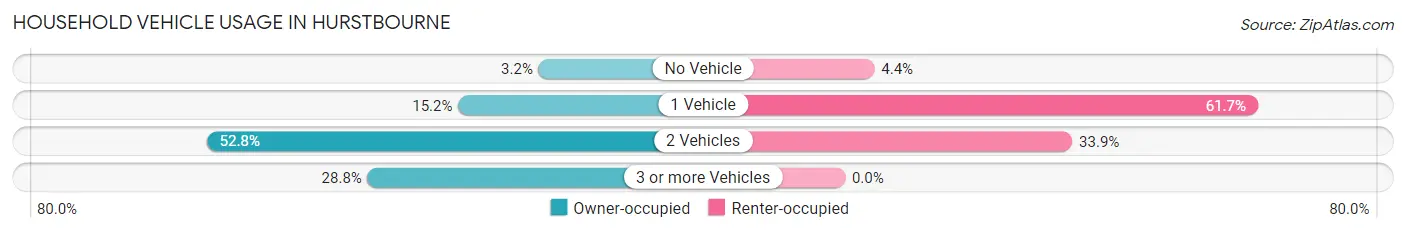
| Vehicles per Household | Owner-occupied | Renter-occupied |
| No Vehicle | 32 (3.2%) | 34 (4.4%) |
| 1 Vehicle | 152 (15.2%) | 476 (61.7%) |
| 2 Vehicles | 527 (52.8%) | 262 (33.9%) |
| 3 or more Vehicles | 287 (28.8%) | 0 (0.0%) |
| Total | 998 (100.0%) | 772 (100.0%) |
Real Estate & Mortgages in Hurstbourne
Real Estate and Mortgage Overview in Hurstbourne
| Characteristic | Without Mortgage | With Mortgage |
| Housing Units | 414 | 584 |
| Median Property Value | $464,400 | $582,400 |
| Median Household Income | $113,125 | $272 |
| Monthly Housing Costs | $824 | $209 |
| Real Estate Taxes | $3,882 | $0 |
Property Value by Mortgage Status in Hurstbourne
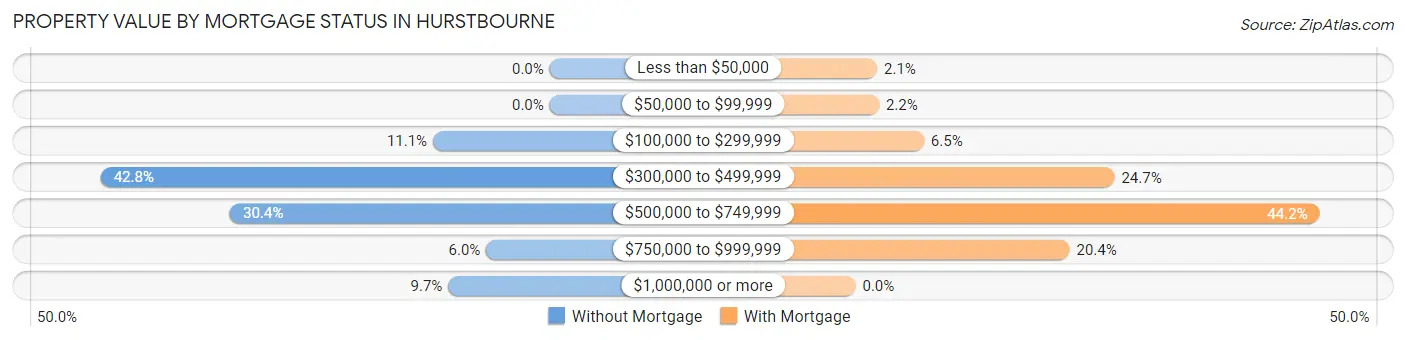
| Property Value | Without Mortgage | With Mortgage |
| Less than $50,000 | 0 (0.0%) | 12 (2.1%) |
| $50,000 to $99,999 | 0 (0.0%) | 13 (2.2%) |
| $100,000 to $299,999 | 46 (11.1%) | 38 (6.5%) |
| $300,000 to $499,999 | 177 (42.7%) | 144 (24.7%) |
| $500,000 to $749,999 | 126 (30.4%) | 258 (44.2%) |
| $750,000 to $999,999 | 25 (6.0%) | 119 (20.4%) |
| $1,000,000 or more | 40 (9.7%) | 0 (0.0%) |
| Total | 414 (100.0%) | 584 (100.0%) |
Household Income by Mortgage Status in Hurstbourne
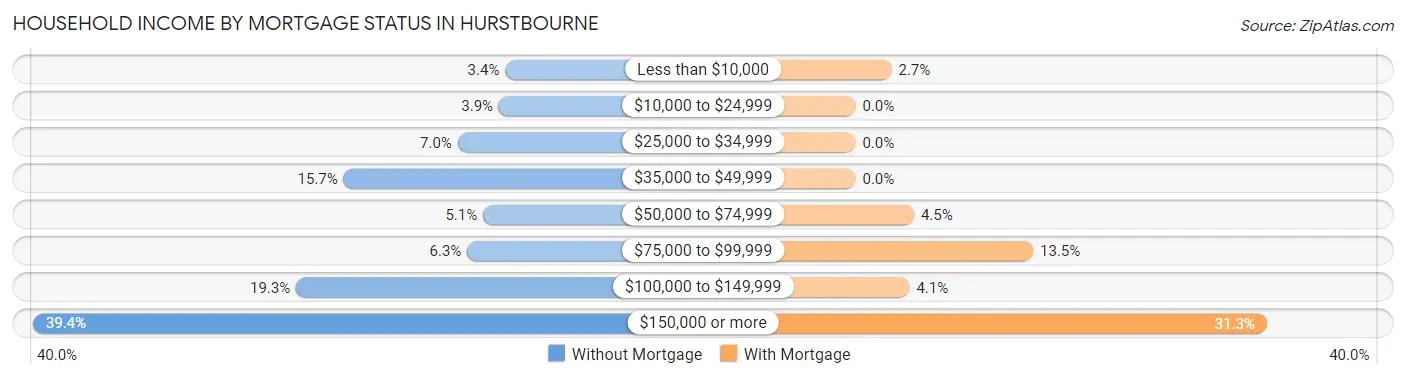
| Household Income | Without Mortgage | With Mortgage |
| Less than $10,000 | 14 (3.4%) | 16 (2.7%) |
| $10,000 to $24,999 | 16 (3.9%) | 0 (0.0%) |
| $25,000 to $34,999 | 29 (7.0%) | 0 (0.0%) |
| $35,000 to $49,999 | 65 (15.7%) | 0 (0.0%) |
| $50,000 to $74,999 | 21 (5.1%) | 26 (4.4%) |
| $75,000 to $99,999 | 26 (6.3%) | 79 (13.5%) |
| $100,000 to $149,999 | 80 (19.3%) | 24 (4.1%) |
| $150,000 or more | 163 (39.4%) | 183 (31.3%) |
| Total | 414 (100.0%) | 584 (100.0%) |
Property Value to Household Income Ratio in Hurstbourne
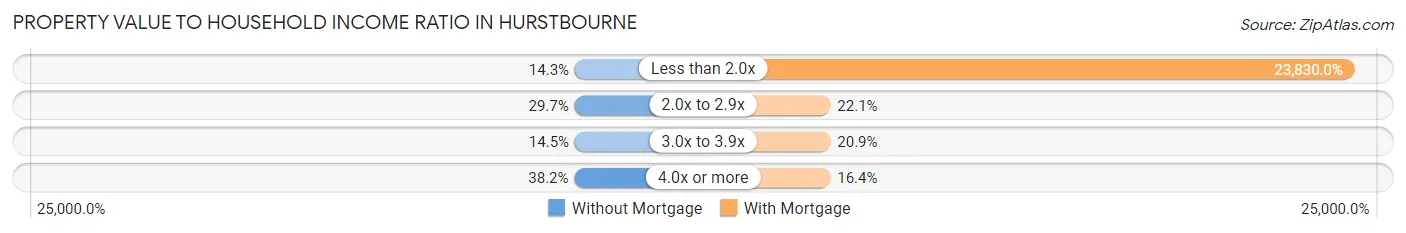
| Value-to-Income Ratio | Without Mortgage | With Mortgage |
| Less than 2.0x | 59 (14.2%) | 139,167 (23,830.0%) |
| 2.0x to 2.9x | 123 (29.7%) | 129 (22.1%) |
| 3.0x to 3.9x | 60 (14.5%) | 122 (20.9%) |
| 4.0x or more | 158 (38.2%) | 96 (16.4%) |
| Total | 414 (100.0%) | 584 (100.0%) |
Real Estate Taxes by Mortgage Status in Hurstbourne
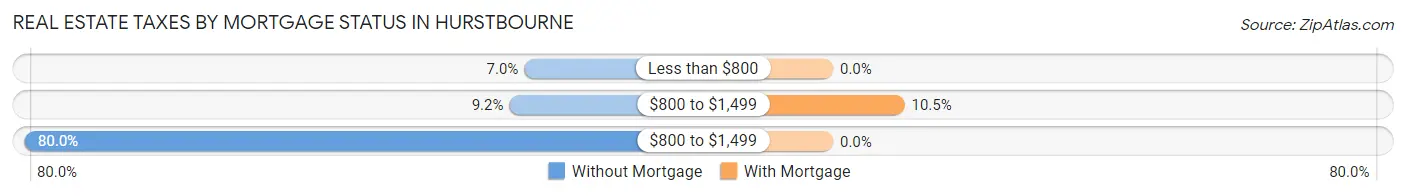
| Property Taxes | Without Mortgage | With Mortgage |
| Less than $800 | 29 (7.0%) | 0 (0.0%) |
| $800 to $1,499 | 38 (9.2%) | 61 (10.4%) |
| $800 to $1,499 | 331 (79.9%) | 0 (0.0%) |
| Total | 414 (100.0%) | 584 (100.0%) |
Health & Disability in Hurstbourne
Health Insurance Coverage by Age in Hurstbourne
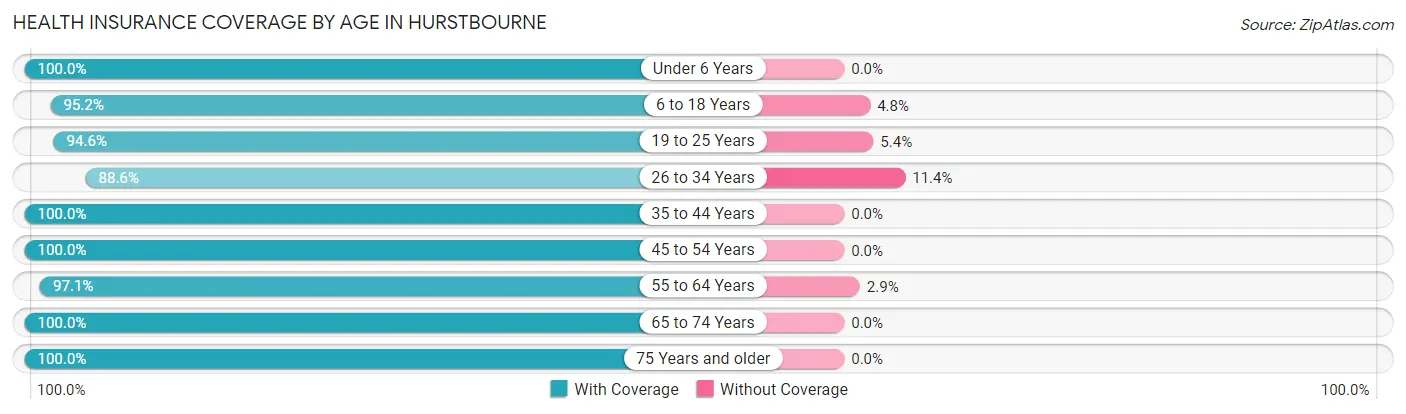
| Age Bracket | With Coverage | Without Coverage |
| Under 6 Years | 484 (100.0%) | 0 (0.0%) |
| 6 to 18 Years | 808 (95.2%) | 41 (4.8%) |
| 19 to 25 Years | 244 (94.6%) | 14 (5.4%) |
| 26 to 34 Years | 514 (88.6%) | 66 (11.4%) |
| 35 to 44 Years | 757 (100.0%) | 0 (0.0%) |
| 45 to 54 Years | 438 (100.0%) | 0 (0.0%) |
| 55 to 64 Years | 400 (97.1%) | 12 (2.9%) |
| 65 to 74 Years | 428 (100.0%) | 0 (0.0%) |
| 75 Years and older | 448 (100.0%) | 0 (0.0%) |
| Total | 4,521 (97.1%) | 133 (2.9%) |
Health Insurance Coverage by Citizenship Status in Hurstbourne
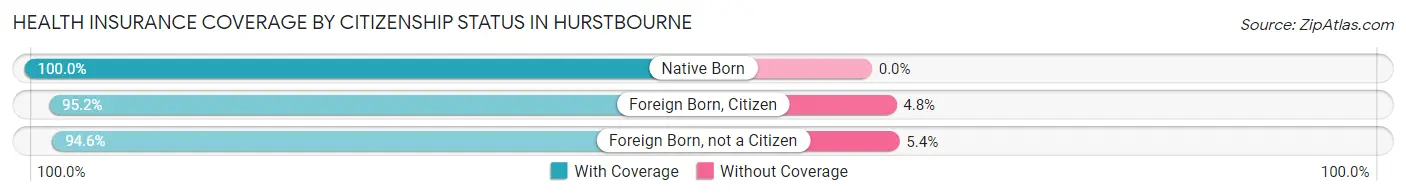
| Citizenship Status | With Coverage | Without Coverage |
| Native Born | 484 (100.0%) | 0 (0.0%) |
| Foreign Born, Citizen | 808 (95.2%) | 41 (4.8%) |
| Foreign Born, not a Citizen | 244 (94.6%) | 14 (5.4%) |
Health Insurance Coverage by Household Income in Hurstbourne
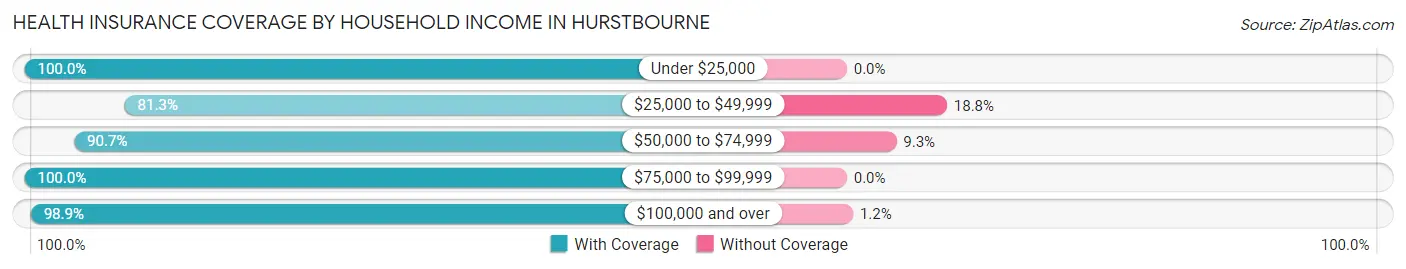
| Household Income | With Coverage | Without Coverage |
| Under $25,000 | 158 (100.0%) | 0 (0.0%) |
| $25,000 to $49,999 | 286 (81.2%) | 66 (18.8%) |
| $50,000 to $74,999 | 254 (90.7%) | 26 (9.3%) |
| $75,000 to $99,999 | 304 (100.0%) | 0 (0.0%) |
| $100,000 and over | 3,519 (98.9%) | 41 (1.1%) |
Public vs Private Health Insurance Coverage by Age in Hurstbourne
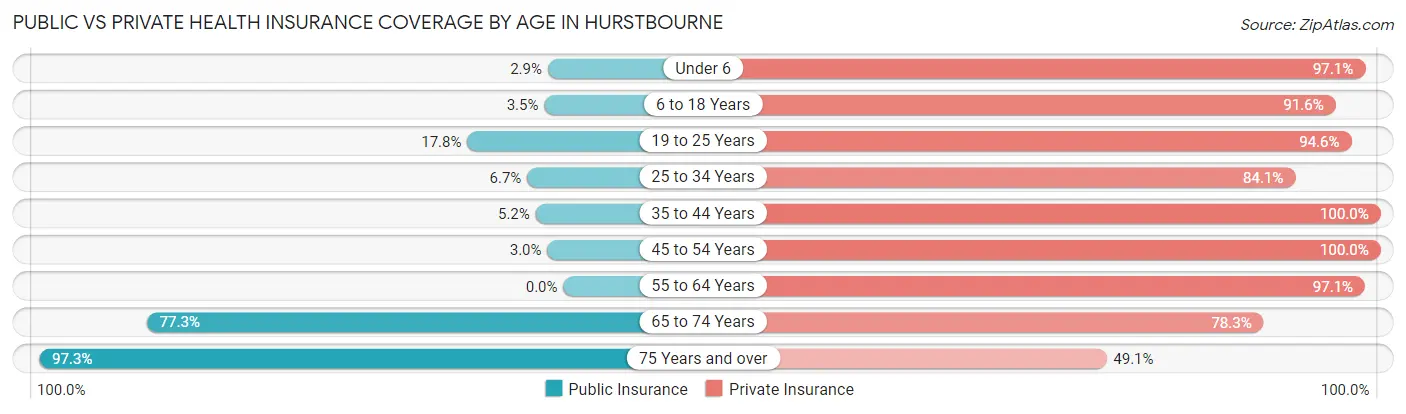
| Age Bracket | Public Insurance | Private Insurance |
| Under 6 | 14 (2.9%) | 470 (97.1%) |
| 6 to 18 Years | 30 (3.5%) | 778 (91.6%) |
| 19 to 25 Years | 46 (17.8%) | 244 (94.6%) |
| 25 to 34 Years | 39 (6.7%) | 488 (84.1%) |
| 35 to 44 Years | 39 (5.1%) | 757 (100.0%) |
| 45 to 54 Years | 13 (3.0%) | 438 (100.0%) |
| 55 to 64 Years | 0 (0.0%) | 400 (97.1%) |
| 65 to 74 Years | 331 (77.3%) | 335 (78.3%) |
| 75 Years and over | 436 (97.3%) | 220 (49.1%) |
| Total | 948 (20.4%) | 4,130 (88.7%) |
Disability Status by Sex by Age in Hurstbourne
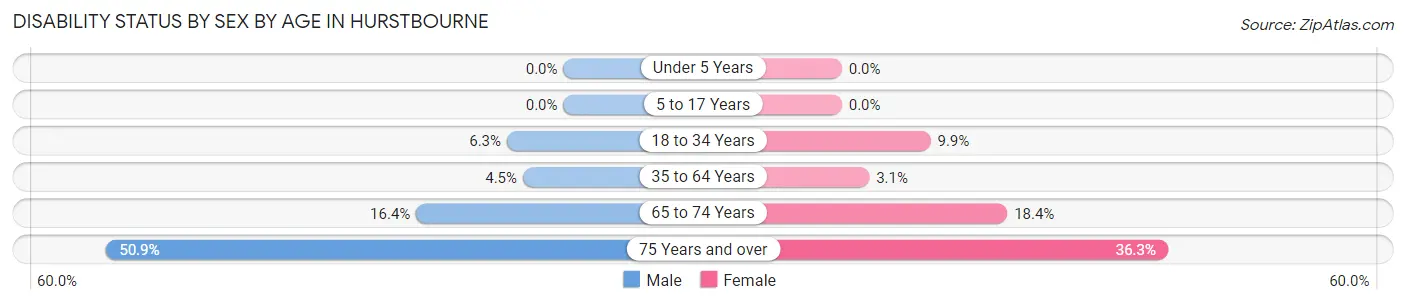
| Age Bracket | Male | Female |
| Under 5 Years | 0 (0.0%) | 0 (0.0%) |
| 5 to 17 Years | 0 (0.0%) | 0 (0.0%) |
| 18 to 34 Years | 32 (6.3%) | 34 (9.9%) |
| 35 to 64 Years | 37 (4.5%) | 24 (3.0%) |
| 65 to 74 Years | 39 (16.4%) | 35 (18.4%) |
| 75 Years and over | 85 (50.9%) | 102 (36.3%) |
Disability Class by Sex by Age in Hurstbourne
Disability Class: Hearing Difficulty
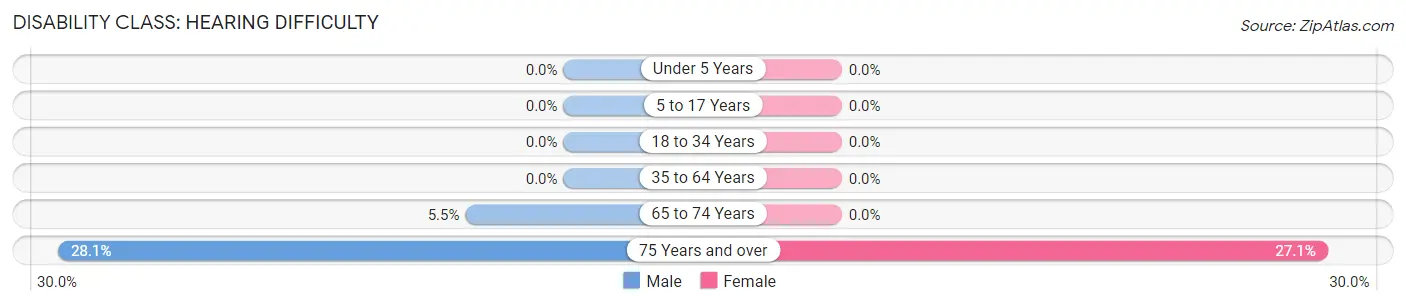
| Age Bracket | Male | Female |
| Under 5 Years | 0 (0.0%) | 0 (0.0%) |
| 5 to 17 Years | 0 (0.0%) | 0 (0.0%) |
| 18 to 34 Years | 0 (0.0%) | 0 (0.0%) |
| 35 to 64 Years | 0 (0.0%) | 0 (0.0%) |
| 65 to 74 Years | 13 (5.5%) | 0 (0.0%) |
| 75 Years and over | 47 (28.1%) | 76 (27.1%) |
Disability Class: Vision Difficulty
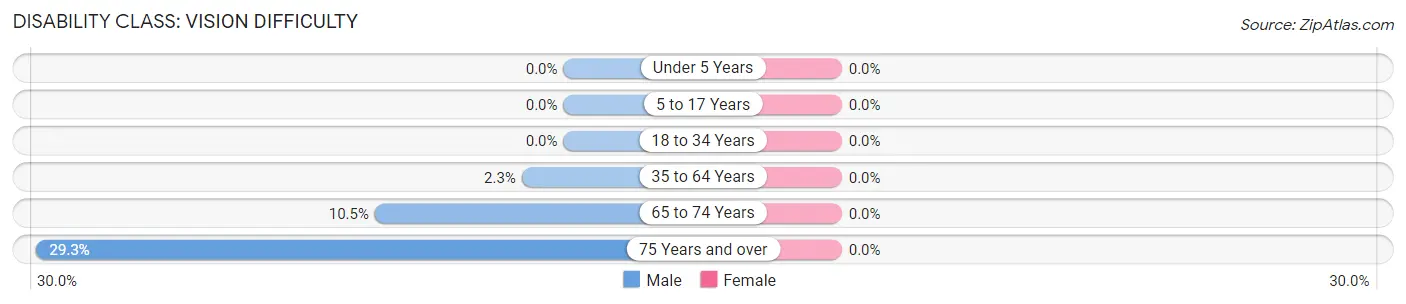
| Age Bracket | Male | Female |
| Under 5 Years | 0 (0.0%) | 0 (0.0%) |
| 5 to 17 Years | 0 (0.0%) | 0 (0.0%) |
| 18 to 34 Years | 0 (0.0%) | 0 (0.0%) |
| 35 to 64 Years | 19 (2.3%) | 0 (0.0%) |
| 65 to 74 Years | 25 (10.5%) | 0 (0.0%) |
| 75 Years and over | 49 (29.3%) | 0 (0.0%) |
Disability Class: Cognitive Difficulty
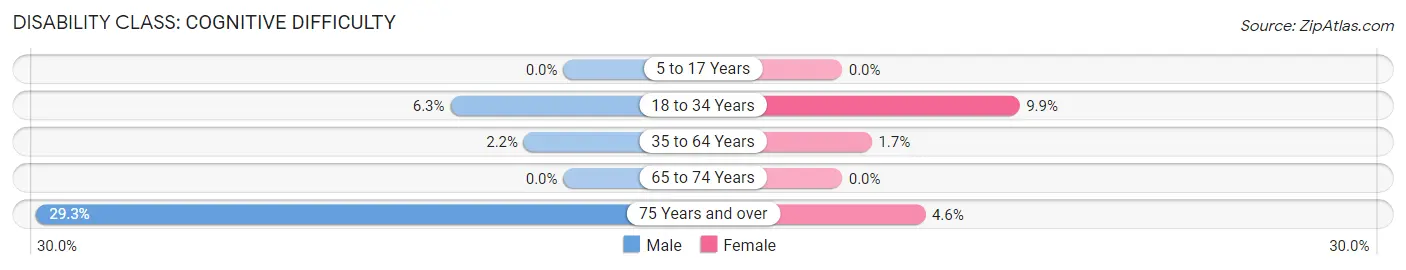
| Age Bracket | Male | Female |
| 5 to 17 Years | 0 (0.0%) | 0 (0.0%) |
| 18 to 34 Years | 32 (6.3%) | 34 (9.9%) |
| 35 to 64 Years | 18 (2.2%) | 13 (1.7%) |
| 65 to 74 Years | 0 (0.0%) | 0 (0.0%) |
| 75 Years and over | 49 (29.3%) | 13 (4.6%) |
Disability Class: Ambulatory Difficulty
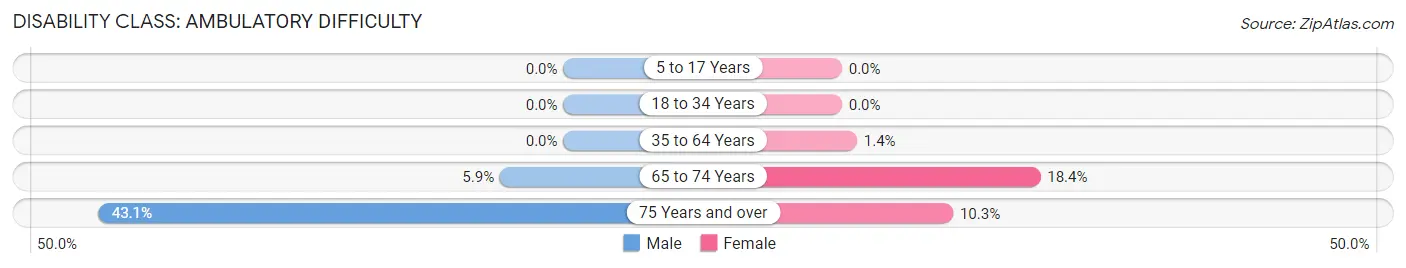
| Age Bracket | Male | Female |
| 5 to 17 Years | 0 (0.0%) | 0 (0.0%) |
| 18 to 34 Years | 0 (0.0%) | 0 (0.0%) |
| 35 to 64 Years | 0 (0.0%) | 11 (1.4%) |
| 65 to 74 Years | 14 (5.9%) | 35 (18.4%) |
| 75 Years and over | 72 (43.1%) | 29 (10.3%) |
Disability Class: Self-Care Difficulty
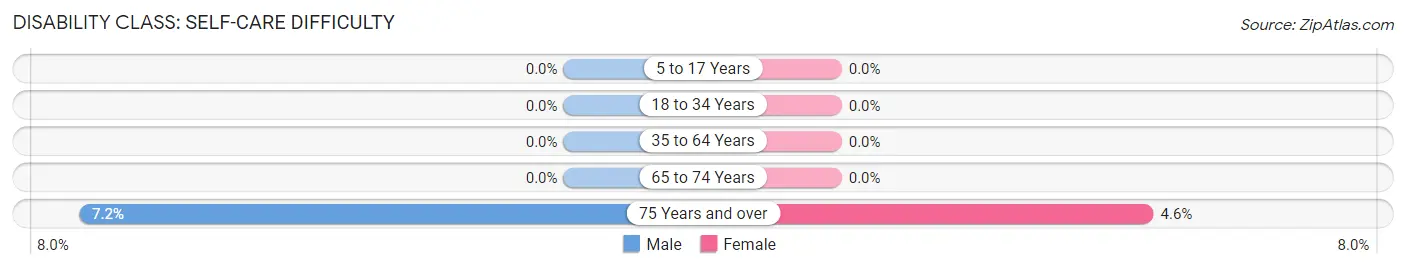
| Age Bracket | Male | Female |
| 5 to 17 Years | 0 (0.0%) | 0 (0.0%) |
| 18 to 34 Years | 0 (0.0%) | 0 (0.0%) |
| 35 to 64 Years | 0 (0.0%) | 0 (0.0%) |
| 65 to 74 Years | 0 (0.0%) | 0 (0.0%) |
| 75 Years and over | 12 (7.2%) | 13 (4.6%) |
Technology Access in Hurstbourne
Computing Device Access in Hurstbourne
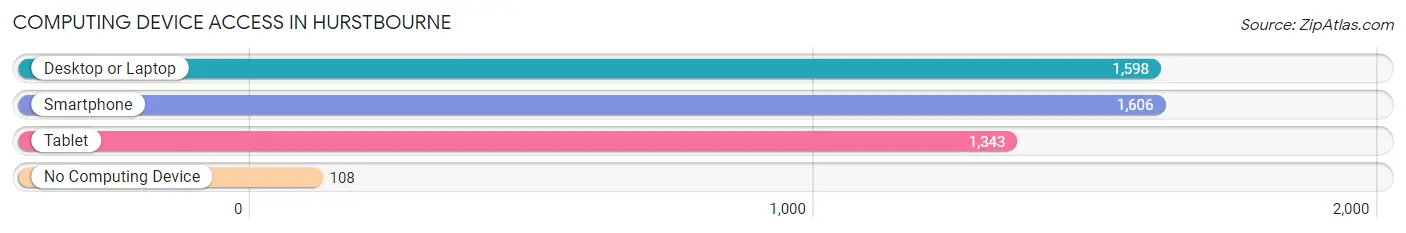
| Device Type | # Households | % Households |
| Desktop or Laptop | 1,598 | 90.3% |
| Smartphone | 1,606 | 90.7% |
| Tablet | 1,343 | 75.9% |
| No Computing Device | 108 | 6.1% |
| Total | 1,770 | 100.0% |
Internet Access in Hurstbourne
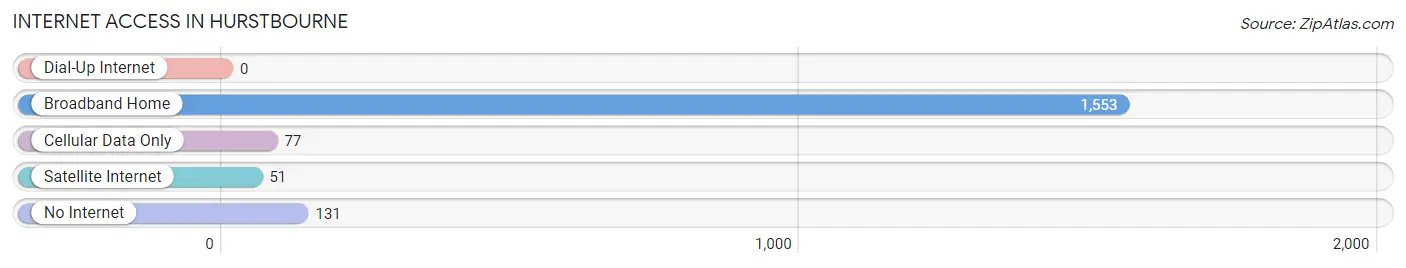
| Internet Type | # Households | % Households |
| Dial-Up Internet | 0 | 0.0% |
| Broadband Home | 1,553 | 87.7% |
| Cellular Data Only | 77 | 4.3% |
| Satellite Internet | 51 | 2.9% |
| No Internet | 131 | 7.4% |
| Total | 1,770 | 100.0% |
Hurstbourne Summary
Hurstbourne is a small city located in Jefferson County, Kentucky. It is a suburb of Louisville and is part of the Louisville Metro area. The city has a population of approximately 4,000 people and is located just south of the city of Louisville.
Hurstbourne was founded in the late 1800s and was originally known as Hurstville. The city was named after the Hurst family, who were early settlers in the area. The city was incorporated in 1952 and has since grown to become a thriving community.
Geography
Hurstbourne is located in the eastern part of Jefferson County, Kentucky. It is situated on the south side of Louisville, just off of Interstate 64. The city is bordered by the cities of Jeffersontown and Middletown to the north, and by the cities of St. Matthews and Lyndon to the south. The city is located in a hilly area, with the highest point being the Hurstbourne Hill, which is located in the center of the city.
The city has a total area of 2.2 square miles, all of which is land. The city is located in the Eastern Time Zone and observes Daylight Saving Time.
Economy
Hurstbourne has a strong economy, with a variety of businesses located in the city. The city is home to several large employers, including the University of Louisville, Norton Healthcare, and the Louisville International Airport. The city also has a number of small businesses, including restaurants, retail stores, and professional services.
The city also has a number of industrial parks, which are home to a variety of manufacturing and distribution companies. The city is also home to a number of corporate headquarters, including the headquarters of Brown-Forman Corporation, the parent company of Jack Daniel's whiskey.
Demographics
As of the 2010 census, the population of Hurstbourne was 4,039. The racial makeup of the city was 87.3% White, 8.2% African American, 0.3% Native American, 1.2% Asian, 0.1% Pacific Islander, and 2.1% from other races. Hispanic or Latino of any race were 3.2% of the population.
The median household income in Hurstbourne was $63,917, and the median family income was $76,917. The per capita income for the city was $31,917. About 4.2% of families and 5.7% of the population were below the poverty line, including 6.3% of those under age 18 and 4.2% of those age 65 or over.
Conclusion
Hurstbourne is a small city located in Jefferson County, Kentucky. It is a suburb of Louisville and is part of the Louisville Metro area. The city has a population of approximately 4,000 people and is located just south of the city of Louisville. The city has a strong economy, with a variety of businesses located in the city. The city is home to several large employers, including the University of Louisville, Norton Healthcare, and the Louisville International Airport. The city also has a number of small businesses, including restaurants, retail stores, and professional services. The racial makeup of the city was 87.3% White, 8.2% African American, 0.3% Native American, 1.2% Asian, 0.1% Pacific Islander, and 2.1% from other races. The median household income in Hurstbourne was $63,917, and the median family income was $76,917. The per capita income for the city was $31,917.
Common Questions
What is Per Capita Income in Hurstbourne?
Per Capita income in Hurstbourne is $60,939.
What is the Median Family Income in Hurstbourne?
Median Family Income in Hurstbourne is $134,671.
What is the Median Household income in Hurstbourne?
Median Household Income in Hurstbourne is $117,031.
What is Income or Wage Gap in Hurstbourne?
Income or Wage Gap in Hurstbourne is 33.9%.
Women in Hurstbourne earn 66.1 cents for every dollar earned by a man.
What is Inequality or Gini Index in Hurstbourne?
Inequality or Gini Index in Hurstbourne is 0.44.
What is the Total Population of Hurstbourne?
Total Population of Hurstbourne is 4,654.
What is the Total Male Population of Hurstbourne?
Total Male Population of Hurstbourne is 2,443.
What is the Total Female Population of Hurstbourne?
Total Female Population of Hurstbourne is 2,211.
What is the Ratio of Males per 100 Females in Hurstbourne?
There are 110.49 Males per 100 Females in Hurstbourne.
What is the Ratio of Females per 100 Males in Hurstbourne?
There are 90.50 Females per 100 Males in Hurstbourne.
What is the Median Population Age in Hurstbourne?
Median Population Age in Hurstbourne is 38.3 Years.
What is the Average Family Size in Hurstbourne
Average Family Size in Hurstbourne is 3.2 People.
What is the Average Household Size in Hurstbourne
Average Household Size in Hurstbourne is 2.6 People.
How Large is the Labor Force in Hurstbourne?
There are 2,200 People in the Labor Forcein in Hurstbourne.
What is the Percentage of People in the Labor Force in Hurstbourne?
65.5% of People are in the Labor Force in Hurstbourne.
What is the Unemployment Rate in Hurstbourne?
Unemployment Rate in Hurstbourne is 3.2%.