Hurstbourne Acres, KY Map & Demographics
Hurstbourne Acres Map
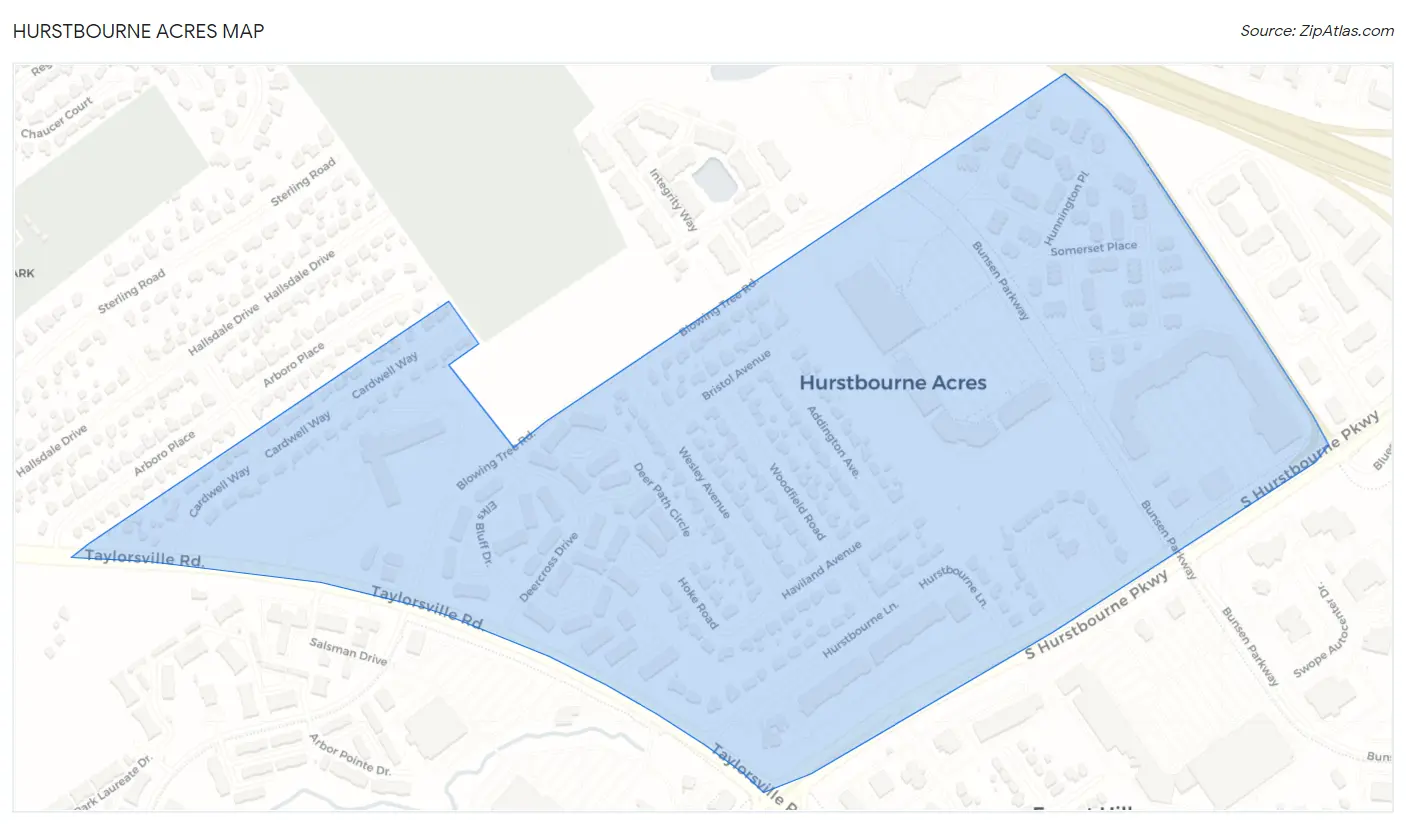
Hurstbourne Acres Overview
$34,831
PER CAPITA INCOME
$78,125
AVG FAMILY INCOME
$67,645
AVG HOUSEHOLD INCOME
17.0%
WAGE / INCOME GAP [ % ]
83.0¢/ $1
WAGE / INCOME GAP [ $ ]
0.31
INEQUALITY / GINI INDEX
1,999
TOTAL POPULATION
948
MALE POPULATION
1,051
FEMALE POPULATION
90.20
MALES / 100 FEMALES
110.86
FEMALES / 100 MALES
29.0
MEDIAN AGE
3.3
AVG FAMILY SIZE
2.0
AVG HOUSEHOLD SIZE
1,099
LABOR FORCE [ PEOPLE ]
68.1%
PERCENT IN LABOR FORCE
1.5%
UNEMPLOYMENT RATE
Hurstbourne Acres Area Codes
Income in Hurstbourne Acres
Income Overview in Hurstbourne Acres
Per Capita Income in Hurstbourne Acres is $34,831, while median incomes of families and households are $78,125 and $67,645 respectively.
| Characteristic | Number | Measure |
| Per Capita Income | 1,999 | $34,831 |
| Median Family Income | 378 | $78,125 |
| Mean Family Income | 378 | $88,159 |
| Median Household Income | 997 | $67,645 |
| Mean Household Income | 997 | $69,732 |
| Income Deficit | 378 | $0 |
| Wage / Income Gap (%) | 1,999 | 17.02% |
| Wage / Income Gap ($) | 1,999 | 82.98¢ per $1 |
| Gini / Inequality Index | 1,999 | 0.31 |
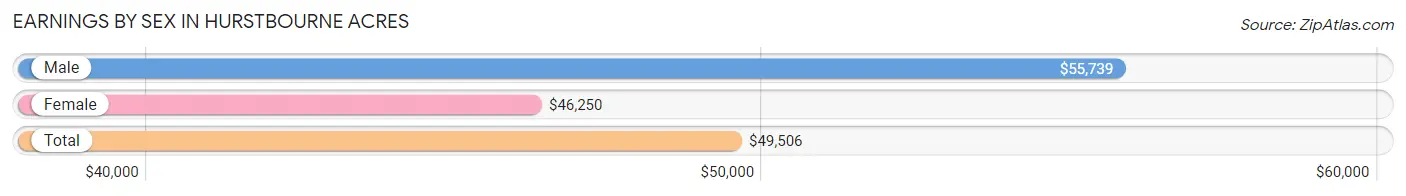
Earnings by Sex in Hurstbourne Acres
Average Earnings in Hurstbourne Acres are $49,506, $55,739 for men and $46,250 for women, a difference of 17.0%.
| Sex | Number | Average Earnings |
| Male | 738 (65.9%) | $55,739 |
| Female | 381 (34.1%) | $46,250 |
| Total | 1,119 (100.0%) | $49,506 |
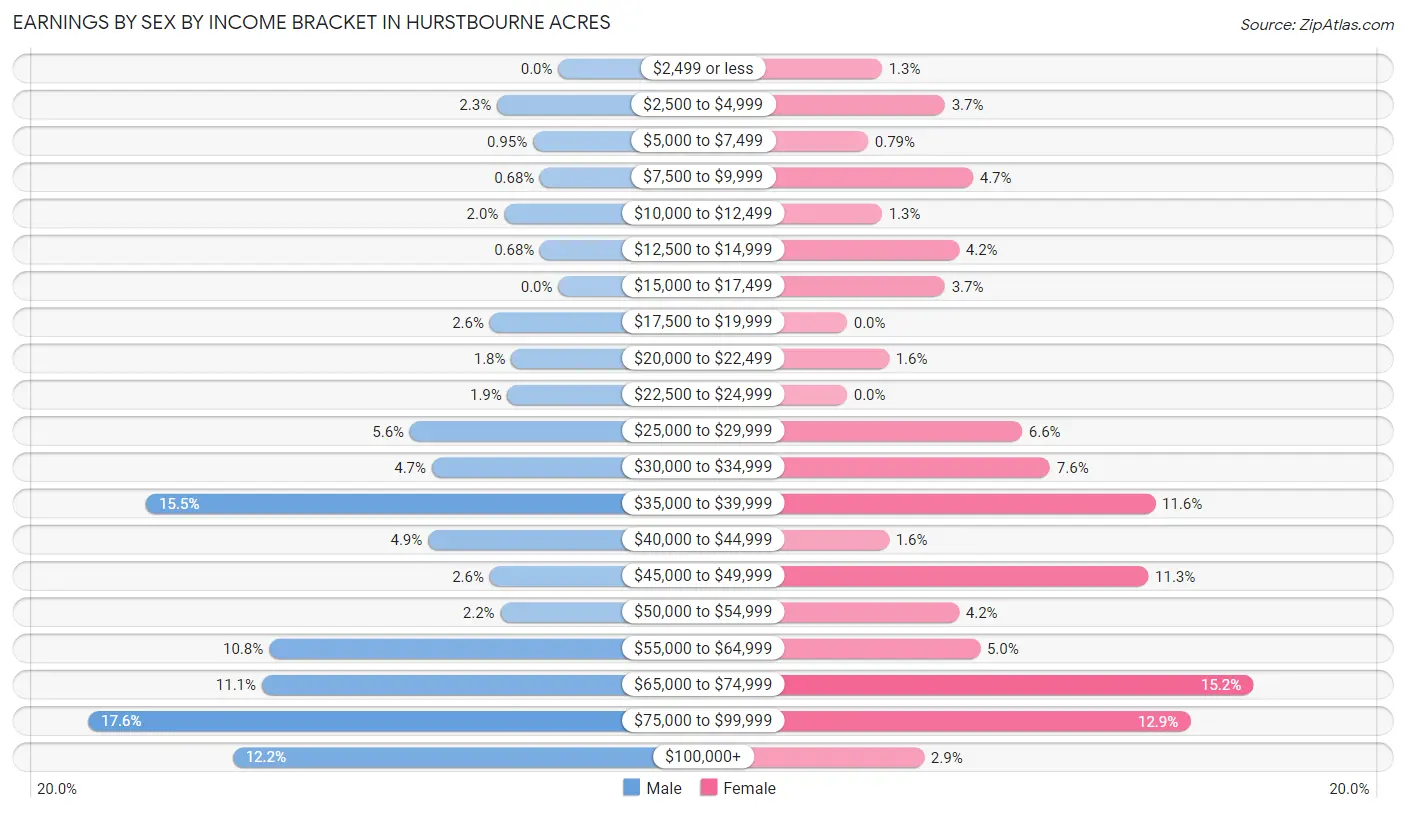
Earnings by Sex by Income Bracket in Hurstbourne Acres
The most common earnings brackets in Hurstbourne Acres are $75,000 to $99,999 for men (130 | 17.6%) and $65,000 to $74,999 for women (58 | 15.2%).
| Income | Male | Female |
| $2,499 or less | 0 (0.0%) | 5 (1.3%) |
| $2,500 to $4,999 | 17 (2.3%) | 14 (3.7%) |
| $5,000 to $7,499 | 7 (0.9%) | 3 (0.8%) |
| $7,500 to $9,999 | 5 (0.7%) | 18 (4.7%) |
| $10,000 to $12,499 | 15 (2.0%) | 5 (1.3%) |
| $12,500 to $14,999 | 5 (0.7%) | 16 (4.2%) |
| $15,000 to $17,499 | 0 (0.0%) | 14 (3.7%) |
| $17,500 to $19,999 | 19 (2.6%) | 0 (0.0%) |
| $20,000 to $22,499 | 13 (1.8%) | 6 (1.6%) |
| $22,500 to $24,999 | 14 (1.9%) | 0 (0.0%) |
| $25,000 to $29,999 | 41 (5.6%) | 25 (6.6%) |
| $30,000 to $34,999 | 35 (4.7%) | 29 (7.6%) |
| $35,000 to $39,999 | 114 (15.4%) | 44 (11.6%) |
| $40,000 to $44,999 | 36 (4.9%) | 6 (1.6%) |
| $45,000 to $49,999 | 19 (2.6%) | 43 (11.3%) |
| $50,000 to $54,999 | 16 (2.2%) | 16 (4.2%) |
| $55,000 to $64,999 | 80 (10.8%) | 19 (5.0%) |
| $65,000 to $74,999 | 82 (11.1%) | 58 (15.2%) |
| $75,000 to $99,999 | 130 (17.6%) | 49 (12.9%) |
| $100,000+ | 90 (12.2%) | 11 (2.9%) |
| Total | 738 (100.0%) | 381 (100.0%) |
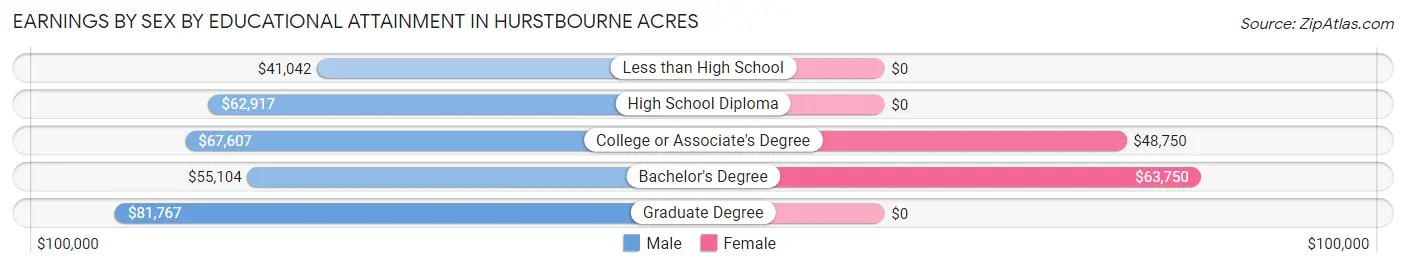
Earnings by Sex by Educational Attainment in Hurstbourne Acres
Average earnings in Hurstbourne Acres are $61,196 for men and $49,766 for women, a difference of 18.7%. Men with an educational attainment of graduate degree enjoy the highest average annual earnings of $81,767, while those with less than high school education earn the least with $41,042. Women with an educational attainment of bachelor's degree earn the most with the average annual earnings of $63,750, while those with college or associate's degree education have the smallest earnings of $48,750.
| Educational Attainment | Male Income | Female Income |
| Less than High School | $41,042 | $0 |
| High School Diploma | $62,917 | $0 |
| College or Associate's Degree | $67,607 | $48,750 |
| Bachelor's Degree | $55,104 | $63,750 |
| Graduate Degree | $81,767 | $0 |
| Total | $61,196 | $49,766 |
Family Income in Hurstbourne Acres
Family Income Brackets in Hurstbourne Acres
According to the Hurstbourne Acres family income data, there are 107 families falling into the $75,000 to $99,999 income range, which is the most common income bracket and makes up 28.3% of all families.
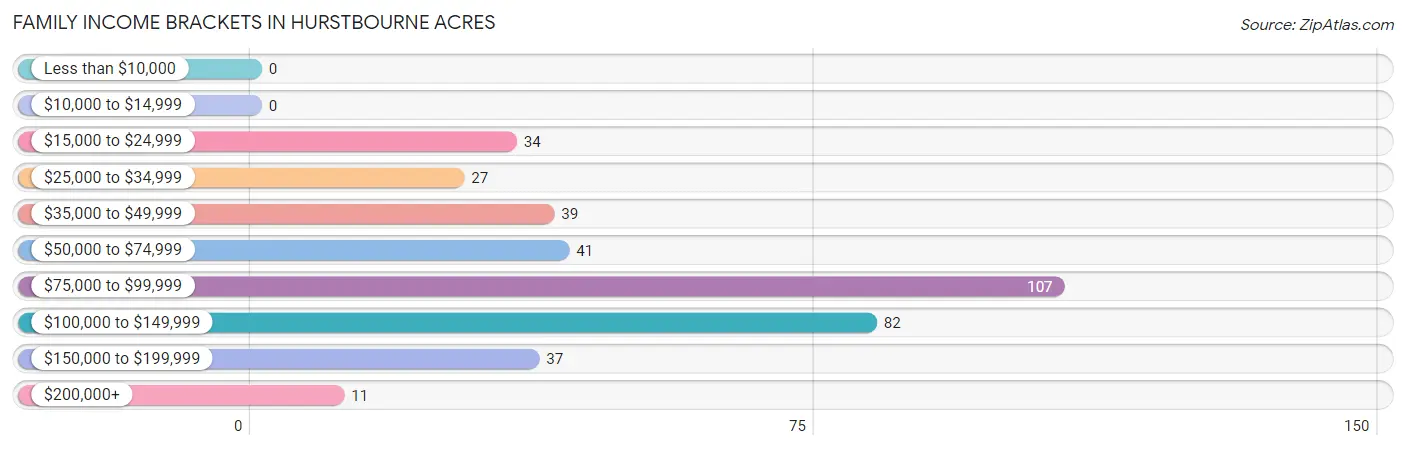
| Income Bracket | # Families | % Families |
| Less than $10,000 | 0 | 0.0% |
| $10,000 to $14,999 | 0 | 0.0% |
| $15,000 to $24,999 | 34 | 9.0% |
| $25,000 to $34,999 | 27 | 7.1% |
| $35,000 to $49,999 | 39 | 10.3% |
| $50,000 to $74,999 | 41 | 10.8% |
| $75,000 to $99,999 | 107 | 28.3% |
| $100,000 to $149,999 | 82 | 21.7% |
| $150,000 to $199,999 | 37 | 9.8% |
| $200,000+ | 11 | 2.9% |
Family Income by Famaliy Size in Hurstbourne Acres
4-person families (107 | 28.3%) account for the highest median family income in Hurstbourne Acres with $96,250 per family, while 2-person families (172 | 45.5%) have the highest median income of $37,958 per family member.
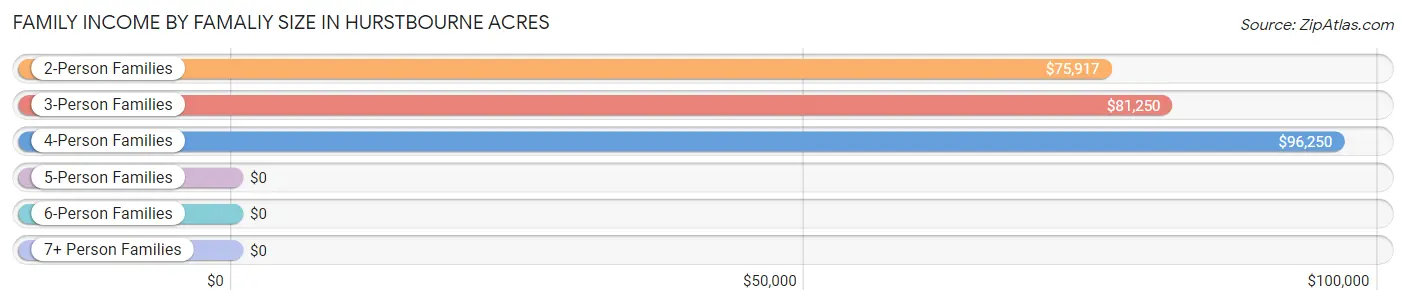
| Income Bracket | # Families | Median Income |
| 2-Person Families | 172 (45.5%) | $75,917 |
| 3-Person Families | 99 (26.2%) | $81,250 |
| 4-Person Families | 107 (28.3%) | $96,250 |
| 5-Person Families | 0 (0.0%) | $0 |
| 6-Person Families | 0 (0.0%) | $0 |
| 7+ Person Families | 0 (0.0%) | $0 |
| Total | 378 (100.0%) | $78,125 |
Family Income by Number of Earners in Hurstbourne Acres
The median family income in Hurstbourne Acres is $78,125, with families comprising 3+ earners (23) having the highest median family income of $177,750, while families with no earners (22) have the lowest median family income of $69,000, accounting for 6.1% and 5.8% of families, respectively.
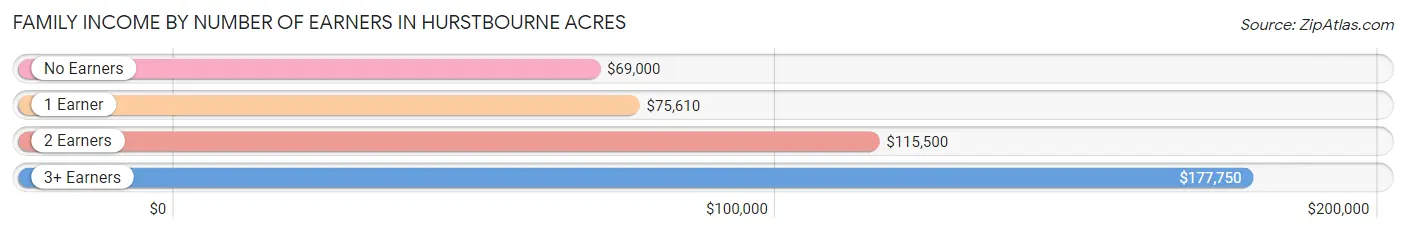
| Number of Earners | # Families | Median Income |
| No Earners | 22 (5.8%) | $69,000 |
| 1 Earner | 259 (68.5%) | $75,610 |
| 2 Earners | 74 (19.6%) | $115,500 |
| 3+ Earners | 23 (6.1%) | $177,750 |
| Total | 378 (100.0%) | $78,125 |
Household Income in Hurstbourne Acres
Household Income Brackets in Hurstbourne Acres
With 313 households falling in the category, the $50,000 to $74,999 income range is the most frequent in Hurstbourne Acres, accounting for 31.4% of all households. In contrast, only 5 households (0.5%) fall into the $10,000 to $14,999 income bracket, making it the least populous group.
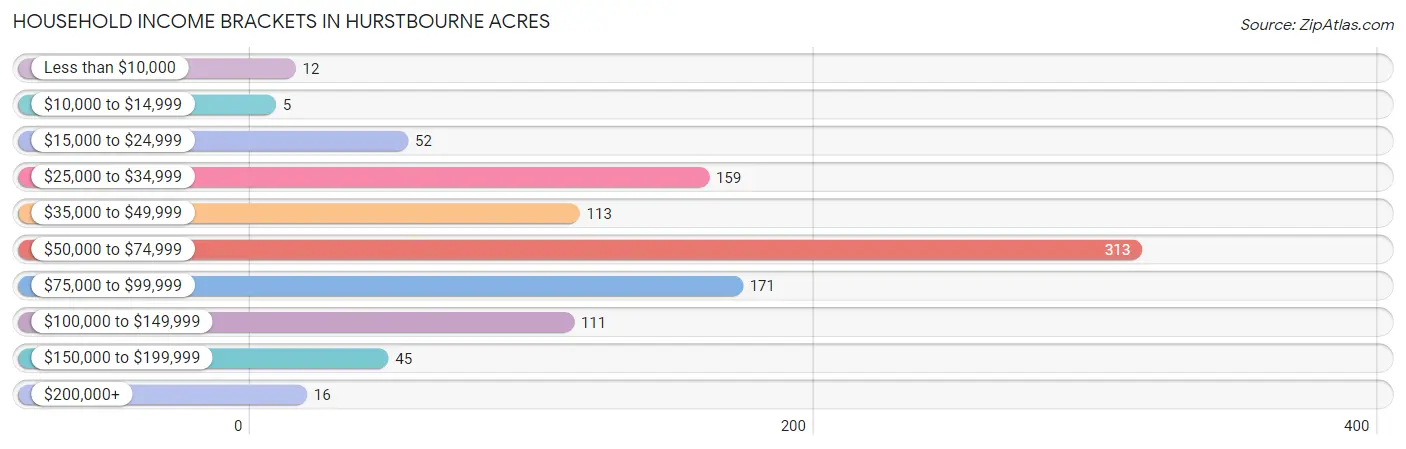
| Income Bracket | # Households | % Households |
| Less than $10,000 | 12 | 1.2% |
| $10,000 to $14,999 | 5 | 0.5% |
| $15,000 to $24,999 | 52 | 5.2% |
| $25,000 to $34,999 | 159 | 15.9% |
| $35,000 to $49,999 | 113 | 11.3% |
| $50,000 to $74,999 | 313 | 31.4% |
| $75,000 to $99,999 | 171 | 17.2% |
| $100,000 to $149,999 | 111 | 11.1% |
| $150,000 to $199,999 | 45 | 4.5% |
| $200,000+ | 16 | 1.6% |
Household Income by Householder Age in Hurstbourne Acres
The median household income in Hurstbourne Acres is $67,645, with the highest median household income of $68,765 found in the 25 to 44 years age bracket for the primary householder. A total of 570 households (57.2%) fall into this category. Meanwhile, the 65+ years age bracket for the primary householder has the lowest median household income of $33,500, with 188 households (18.9%) in this group.

| Income Bracket | # Households | Median Income |
| 15 to 24 Years | 81 (8.1%) | $62,417 |
| 25 to 44 Years | 570 (57.2%) | $68,765 |
| 45 to 64 Years | 158 (15.9%) | $68,125 |
| 65+ Years | 188 (18.9%) | $33,500 |
| Total | 997 (100.0%) | $67,645 |
Poverty in Hurstbourne Acres
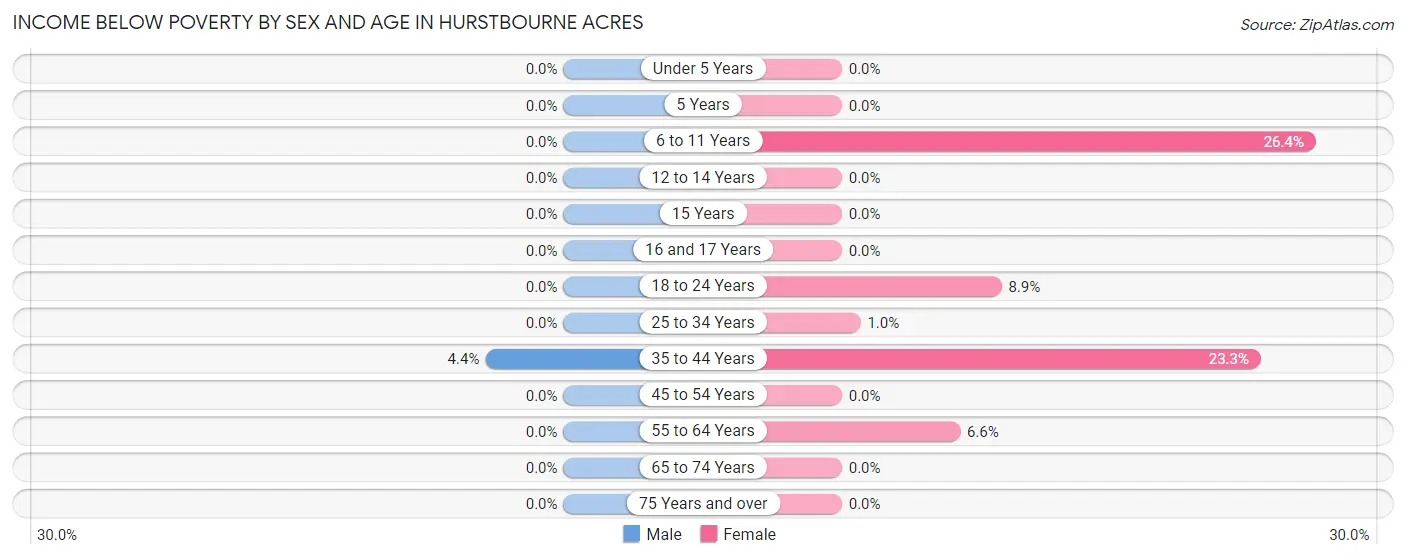
Income Below Poverty by Sex and Age in Hurstbourne Acres
With 0.7% poverty level for males and 5.4% for females among the residents of Hurstbourne Acres, 35 to 44 year old males and 6 to 11 year old females are the most vulnerable to poverty, with 7 males (4.3%) and 19 females (26.4%) in their respective age groups living below the poverty level.
| Age Bracket | Male | Female |
| Under 5 Years | 0 (0.0%) | 0 (0.0%) |
| 5 Years | 0 (0.0%) | 0 (0.0%) |
| 6 to 11 Years | 0 (0.0%) | 19 (26.4%) |
| 12 to 14 Years | 0 (0.0%) | 0 (0.0%) |
| 15 Years | 0 (0.0%) | 0 (0.0%) |
| 16 and 17 Years | 0 (0.0%) | 0 (0.0%) |
| 18 to 24 Years | 0 (0.0%) | 8 (8.9%) |
| 25 to 34 Years | 0 (0.0%) | 4 (1.0%) |
| 35 to 44 Years | 7 (4.3%) | 21 (23.3%) |
| 45 to 54 Years | 0 (0.0%) | 0 (0.0%) |
| 55 to 64 Years | 0 (0.0%) | 5 (6.6%) |
| 65 to 74 Years | 0 (0.0%) | 0 (0.0%) |
| 75 Years and over | 0 (0.0%) | 0 (0.0%) |
| Total | 7 (0.7%) | 57 (5.4%) |
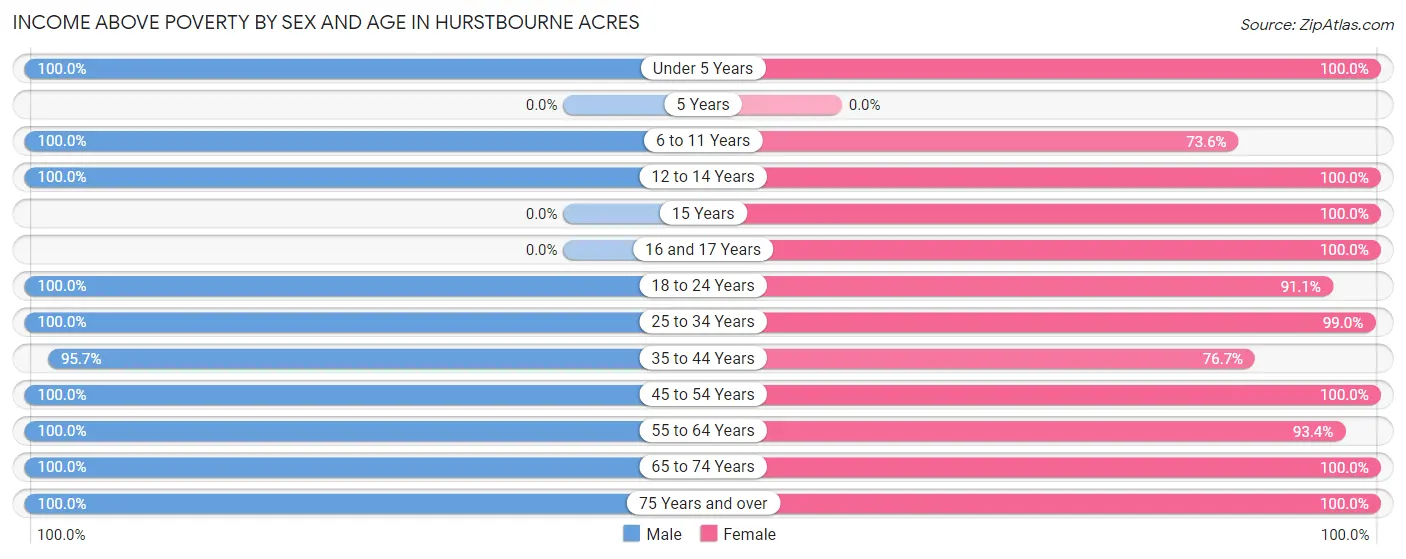
Income Above Poverty by Sex and Age in Hurstbourne Acres
According to the poverty statistics in Hurstbourne Acres, males aged under 5 years and females aged under 5 years are the age groups that are most secure financially, with 100.0% of males and 100.0% of females in these age groups living above the poverty line.
| Age Bracket | Male | Female |
| Under 5 Years | 76 (100.0%) | 128 (100.0%) |
| 5 Years | 0 (0.0%) | 0 (0.0%) |
| 6 to 11 Years | 58 (100.0%) | 53 (73.6%) |
| 12 to 14 Years | 31 (100.0%) | 15 (100.0%) |
| 15 Years | 0 (0.0%) | 5 (100.0%) |
| 16 and 17 Years | 0 (0.0%) | 5 (100.0%) |
| 18 to 24 Years | 92 (100.0%) | 82 (91.1%) |
| 25 to 34 Years | 340 (100.0%) | 381 (99.0%) |
| 35 to 44 Years | 154 (95.7%) | 69 (76.7%) |
| 45 to 54 Years | 97 (100.0%) | 24 (100.0%) |
| 55 to 64 Years | 31 (100.0%) | 71 (93.4%) |
| 65 to 74 Years | 44 (100.0%) | 68 (100.0%) |
| 75 Years and over | 18 (100.0%) | 93 (100.0%) |
| Total | 941 (99.3%) | 994 (94.6%) |
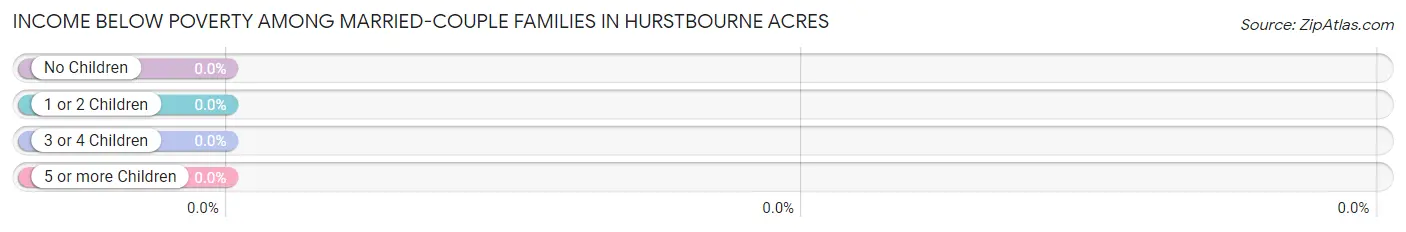
Income Below Poverty Among Married-Couple Families in Hurstbourne Acres
| Children | Above Poverty | Below Poverty |
| No Children | 133 (100.0%) | 0 (0.0%) |
| 1 or 2 Children | 170 (100.0%) | 0 (0.0%) |
| 3 or 4 Children | 0 (0.0%) | 0 (0.0%) |
| 5 or more Children | 0 (0.0%) | 0 (0.0%) |
| Total | 303 (100.0%) | 0 (0.0%) |
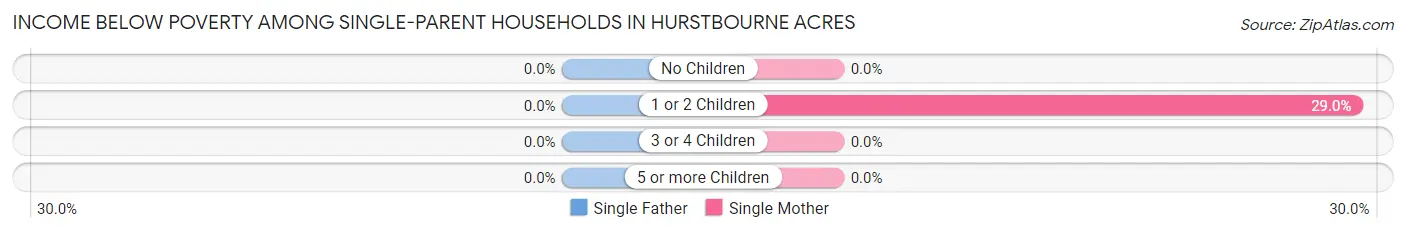
Income Below Poverty Among Single-Parent Households in Hurstbourne Acres
| Children | Single Father | Single Mother |
| No Children | 0 (0.0%) | 0 (0.0%) |
| 1 or 2 Children | 0 (0.0%) | 9 (29.0%) |
| 3 or 4 Children | 0 (0.0%) | 0 (0.0%) |
| 5 or more Children | 0 (0.0%) | 0 (0.0%) |
| Total | 0 (0.0%) | 9 (20.9%) |
Income Below Poverty Among Married-Couple vs Single-Parent Households in Hurstbourne Acres
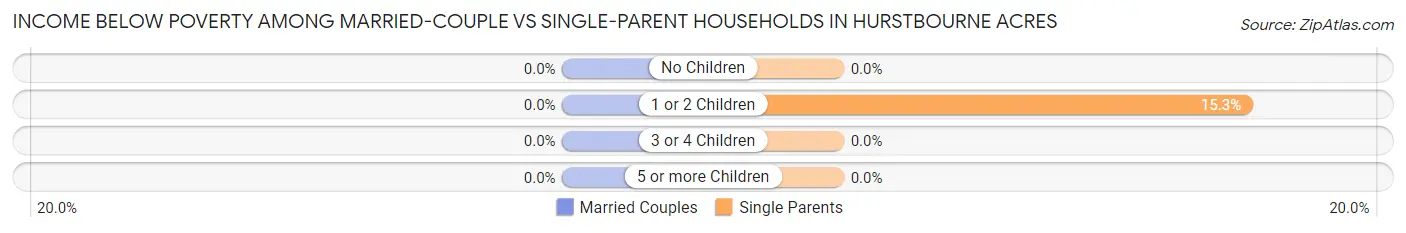
| Children | Married-Couple Families | Single-Parent Households |
| No Children | 0 (0.0%) | 0 (0.0%) |
| 1 or 2 Children | 0 (0.0%) | 9 (15.2%) |
| 3 or 4 Children | 0 (0.0%) | 0 (0.0%) |
| 5 or more Children | 0 (0.0%) | 0 (0.0%) |
| Total | 0 (0.0%) | 9 (12.0%) |
Race in Hurstbourne Acres
The most populous races in Hurstbourne Acres are White / Caucasian (912 | 45.6%), Asian (762 | 38.1%), and Black / African American (167 | 8.4%).
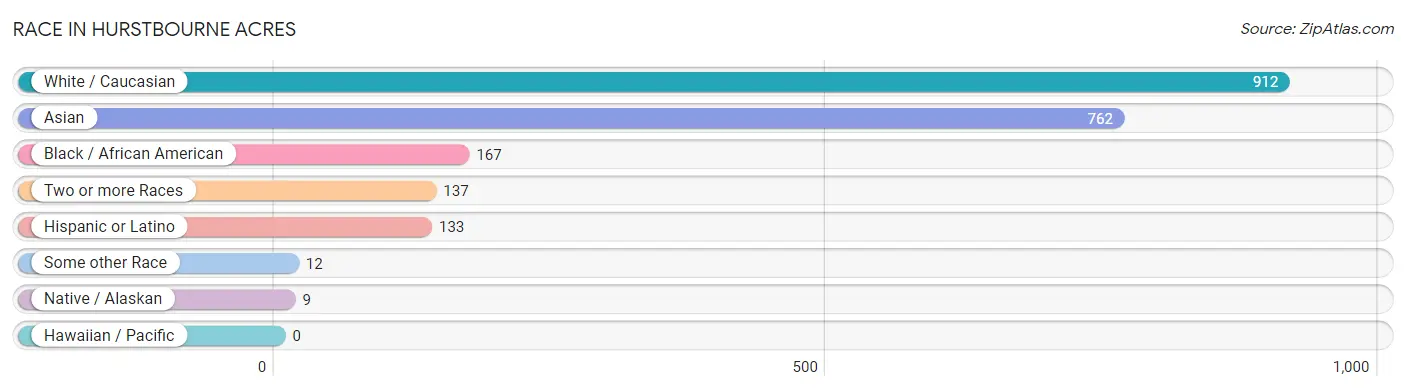
| Race | # Population | % Population |
| Asian | 762 | 38.1% |
| Black / African American | 167 | 8.4% |
| Hawaiian / Pacific | 0 | 0.0% |
| Hispanic or Latino | 133 | 6.7% |
| Native / Alaskan | 9 | 0.4% |
| White / Caucasian | 912 | 45.6% |
| Two or more Races | 137 | 6.9% |
| Some other Race | 12 | 0.6% |
| Total | 1,999 | 100.0% |
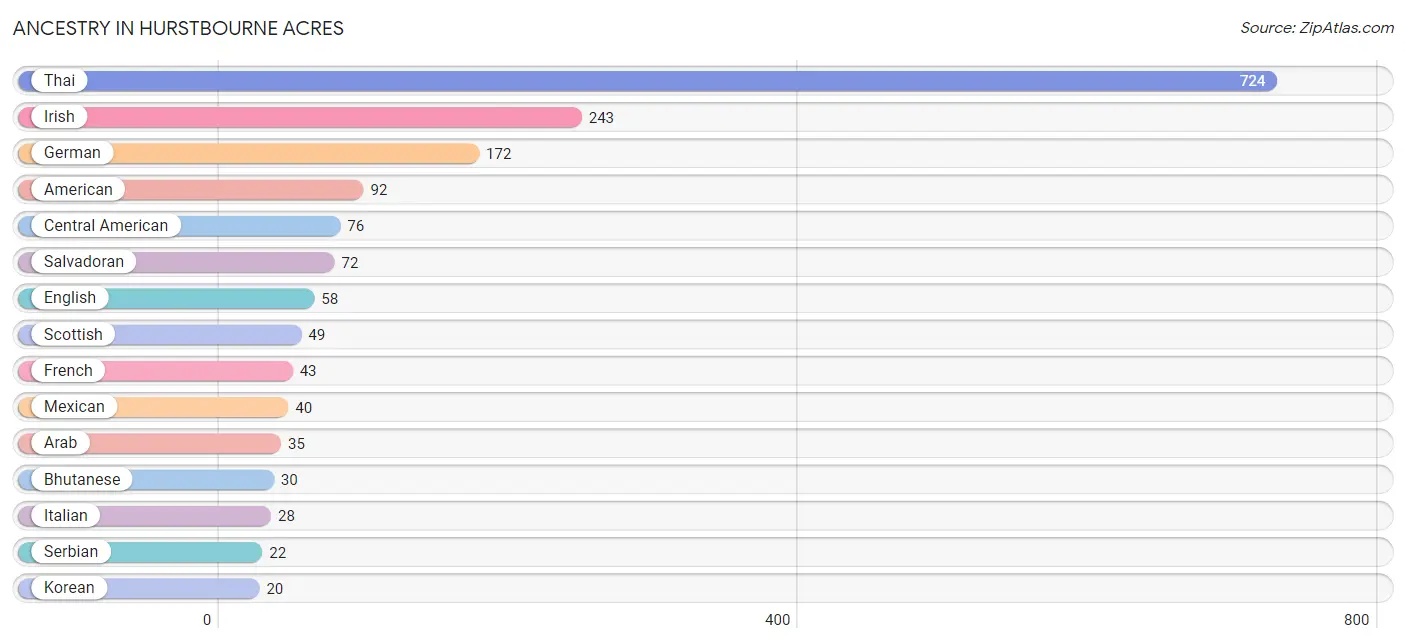
Ancestry in Hurstbourne Acres
The most populous ancestries reported in Hurstbourne Acres are Thai (724 | 36.2%), Irish (243 | 12.2%), German (172 | 8.6%), American (92 | 4.6%), and Central American (76 | 3.8%), together accounting for 65.4% of all Hurstbourne Acres residents.
| Ancestry | # Population | % Population |
| American | 92 | 4.6% |
| Arab | 35 | 1.8% |
| Bangladeshi | 7 | 0.4% |
| Bhutanese | 30 | 1.5% |
| British | 15 | 0.7% |
| Canadian | 6 | 0.3% |
| Central American | 76 | 3.8% |
| Cherokee | 4 | 0.2% |
| Costa Rican | 4 | 0.2% |
| English | 58 | 2.9% |
| European | 17 | 0.9% |
| French | 43 | 2.1% |
| German | 172 | 8.6% |
| Greek | 5 | 0.3% |
| Iraqi | 4 | 0.2% |
| Irish | 243 | 12.2% |
| Italian | 28 | 1.4% |
| Jamaican | 19 | 0.9% |
| Korean | 20 | 1.0% |
| Lebanese | 3 | 0.2% |
| Mexican | 40 | 2.0% |
| Norwegian | 9 | 0.4% |
| Polish | 13 | 0.6% |
| Portuguese | 5 | 0.3% |
| Puerto Rican | 4 | 0.2% |
| Romanian | 4 | 0.2% |
| Salvadoran | 72 | 3.6% |
| Scandinavian | 10 | 0.5% |
| Scottish | 49 | 2.5% |
| Serbian | 22 | 1.1% |
| South American | 4 | 0.2% |
| Thai | 724 | 36.2% |
| Venezuelan | 4 | 0.2% | View All 33 Rows |
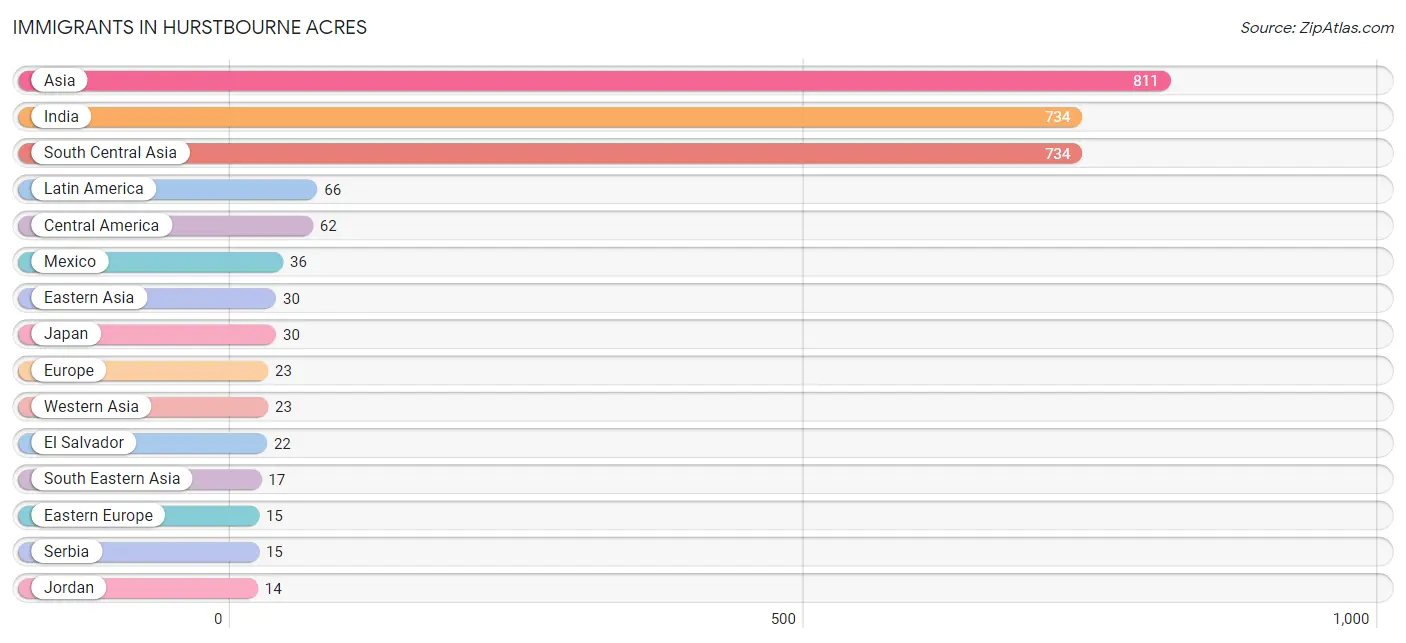
Immigrants in Hurstbourne Acres
The most numerous immigrant groups reported in Hurstbourne Acres came from Asia (811 | 40.6%), India (734 | 36.7%), South Central Asia (734 | 36.7%), Latin America (66 | 3.3%), and Central America (62 | 3.1%), together accounting for 120.4% of all Hurstbourne Acres residents.
| Immigration Origin | # Population | % Population |
| Africa | 7 | 0.4% |
| Asia | 811 | 40.6% |
| Canada | 6 | 0.3% |
| Central America | 62 | 3.1% |
| Costa Rica | 4 | 0.2% |
| Eastern Asia | 30 | 1.5% |
| Eastern Europe | 15 | 0.7% |
| Egypt | 7 | 0.4% |
| El Salvador | 22 | 1.1% |
| Europe | 23 | 1.1% |
| Germany | 8 | 0.4% |
| India | 734 | 36.7% |
| Japan | 30 | 1.5% |
| Jordan | 14 | 0.7% |
| Latin America | 66 | 3.3% |
| Lebanon | 9 | 0.4% |
| Mexico | 36 | 1.8% |
| Northern Africa | 7 | 0.4% |
| Philippines | 10 | 0.5% |
| Serbia | 15 | 0.7% |
| South America | 4 | 0.2% |
| South Central Asia | 734 | 36.7% |
| South Eastern Asia | 17 | 0.9% |
| Thailand | 7 | 0.4% |
| Venezuela | 4 | 0.2% |
| Western Asia | 23 | 1.1% |
| Western Europe | 8 | 0.4% | View All 27 Rows |
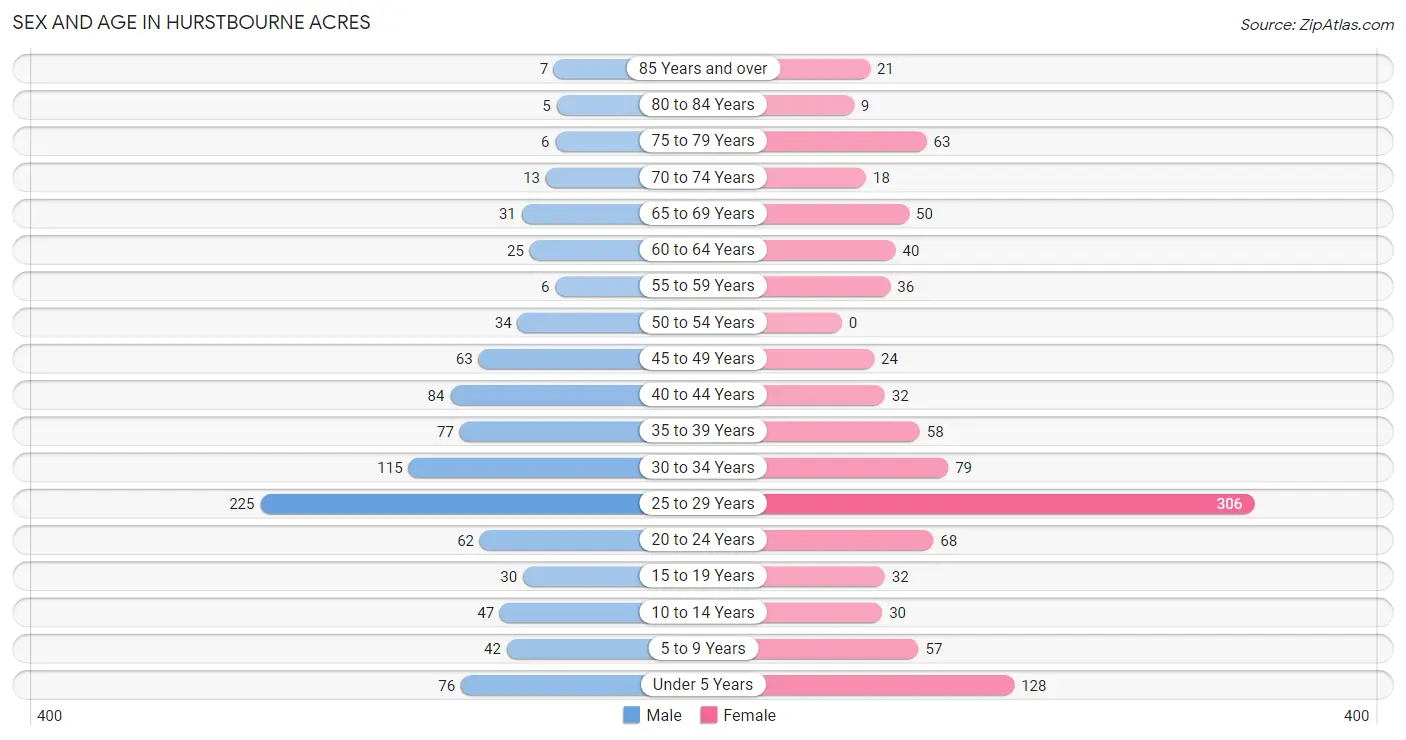
Sex and Age in Hurstbourne Acres
Sex and Age in Hurstbourne Acres
The most populous age groups in Hurstbourne Acres are 25 to 29 Years (225 | 23.7%) for men and 25 to 29 Years (306 | 29.1%) for women.
| Age Bracket | Male | Female |
| Under 5 Years | 76 (8.0%) | 128 (12.2%) |
| 5 to 9 Years | 42 (4.4%) | 57 (5.4%) |
| 10 to 14 Years | 47 (5.0%) | 30 (2.9%) |
| 15 to 19 Years | 30 (3.2%) | 32 (3.0%) |
| 20 to 24 Years | 62 (6.5%) | 68 (6.5%) |
| 25 to 29 Years | 225 (23.7%) | 306 (29.1%) |
| 30 to 34 Years | 115 (12.1%) | 79 (7.5%) |
| 35 to 39 Years | 77 (8.1%) | 58 (5.5%) |
| 40 to 44 Years | 84 (8.9%) | 32 (3.0%) |
| 45 to 49 Years | 63 (6.7%) | 24 (2.3%) |
| 50 to 54 Years | 34 (3.6%) | 0 (0.0%) |
| 55 to 59 Years | 6 (0.6%) | 36 (3.4%) |
| 60 to 64 Years | 25 (2.6%) | 40 (3.8%) |
| 65 to 69 Years | 31 (3.3%) | 50 (4.8%) |
| 70 to 74 Years | 13 (1.4%) | 18 (1.7%) |
| 75 to 79 Years | 6 (0.6%) | 63 (6.0%) |
| 80 to 84 Years | 5 (0.5%) | 9 (0.9%) |
| 85 Years and over | 7 (0.7%) | 21 (2.0%) |
| Total | 948 (100.0%) | 1,051 (100.0%) |
Families and Households in Hurstbourne Acres
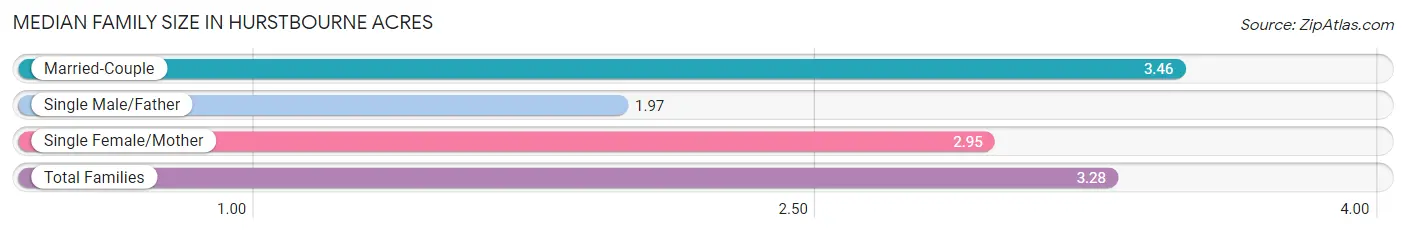
Median Family Size in Hurstbourne Acres
The median family size in Hurstbourne Acres is 3.28 persons per family, with married-couple families (303 | 80.2%) accounting for the largest median family size of 3.46 persons per family. On the other hand, single male/father families (32 | 8.5%) represent the smallest median family size with 1.97 persons per family.
| Family Type | # Families | Family Size |
| Married-Couple | 303 (80.2%) | 3.46 |
| Single Male/Father | 32 (8.5%) | 1.97 |
| Single Female/Mother | 43 (11.4%) | 2.95 |
| Total Families | 378 (100.0%) | 3.28 |
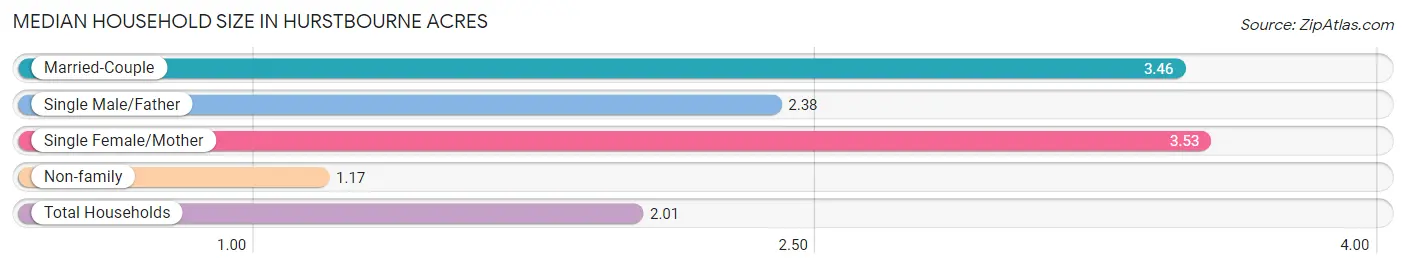
Median Household Size in Hurstbourne Acres
The median household size in Hurstbourne Acres is 2.01 persons per household, with single female/mother households (43 | 4.3%) accounting for the largest median household size of 3.53 persons per household. non-family households (619 | 62.1%) represent the smallest median household size with 1.17 persons per household.
| Household Type | # Households | Household Size |
| Married-Couple | 303 (30.4%) | 3.46 |
| Single Male/Father | 32 (3.2%) | 2.38 |
| Single Female/Mother | 43 (4.3%) | 3.53 |
| Non-family | 619 (62.1%) | 1.17 |
| Total Households | 997 (100.0%) | 2.01 |
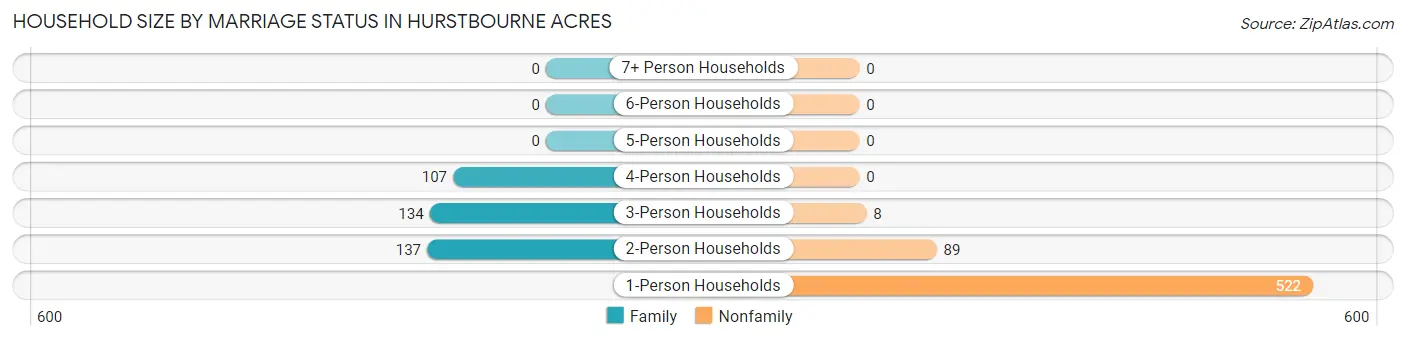
Household Size by Marriage Status in Hurstbourne Acres
Out of a total of 997 households in Hurstbourne Acres, 378 (37.9%) are family households, while 619 (62.1%) are nonfamily households. The most numerous type of family households are 2-person households, comprising 137, and the most common type of nonfamily households are 1-person households, comprising 522.
| Household Size | Family Households | Nonfamily Households |
| 1-Person Households | - | 522 (52.4%) |
| 2-Person Households | 137 (13.7%) | 89 (8.9%) |
| 3-Person Households | 134 (13.4%) | 8 (0.8%) |
| 4-Person Households | 107 (10.7%) | 0 (0.0%) |
| 5-Person Households | 0 (0.0%) | 0 (0.0%) |
| 6-Person Households | 0 (0.0%) | 0 (0.0%) |
| 7+ Person Households | 0 (0.0%) | 0 (0.0%) |
| Total | 378 (37.9%) | 619 (62.1%) |
Female Fertility in Hurstbourne Acres
Fertility by Age in Hurstbourne Acres
Average fertility rate in Hurstbourne Acres is 43.0 births per 1,000 women. Women in the age bracket of 20 to 34 years have the highest fertility rate with 57.0 births per 1,000 women. Women in the age bracket of 20 to 34 years acount for 100.0% of all women with births.
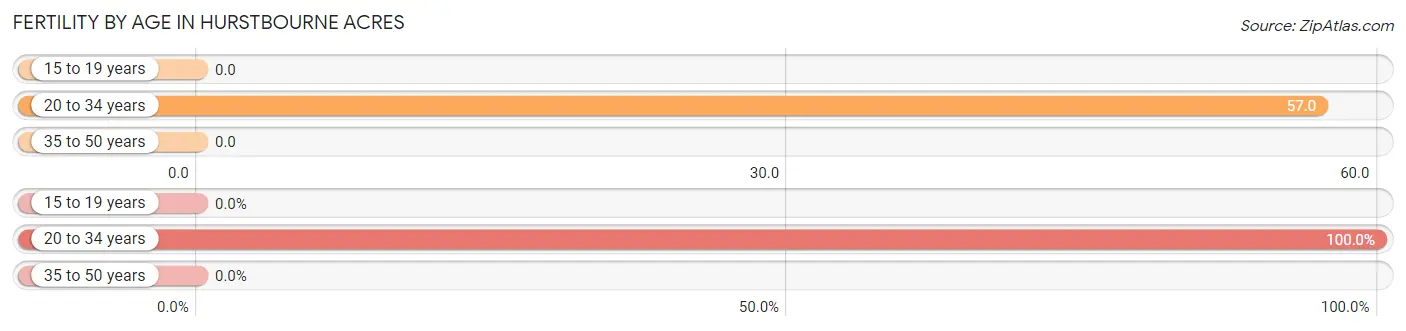
| Age Bracket | Women with Births | Births / 1,000 Women |
| 15 to 19 years | 0 (0.0%) | 0.0 |
| 20 to 34 years | 26 (100.0%) | 57.0 |
| 35 to 50 years | 0 (0.0%) | 0.0 |
| Total | 26 (100.0%) | 43.0 |
Fertility by Age by Marriage Status in Hurstbourne Acres
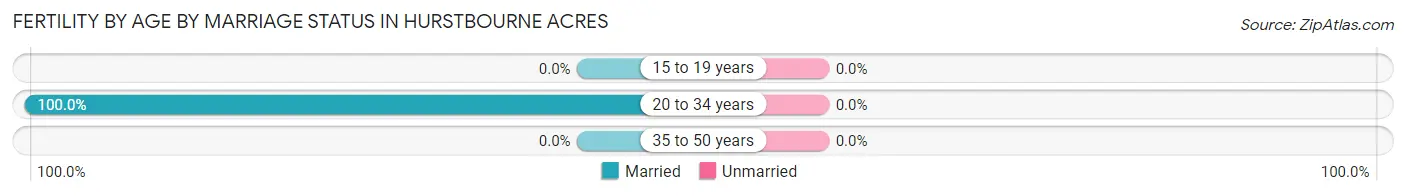
| Age Bracket | Married | Unmarried |
| 15 to 19 years | 0 (0.0%) | 0 (0.0%) |
| 20 to 34 years | 26 (100.0%) | 0 (0.0%) |
| 35 to 50 years | 0 (0.0%) | 0 (0.0%) |
| Total | 26 (100.0%) | 0 (0.0%) |
Fertility by Education in Hurstbourne Acres
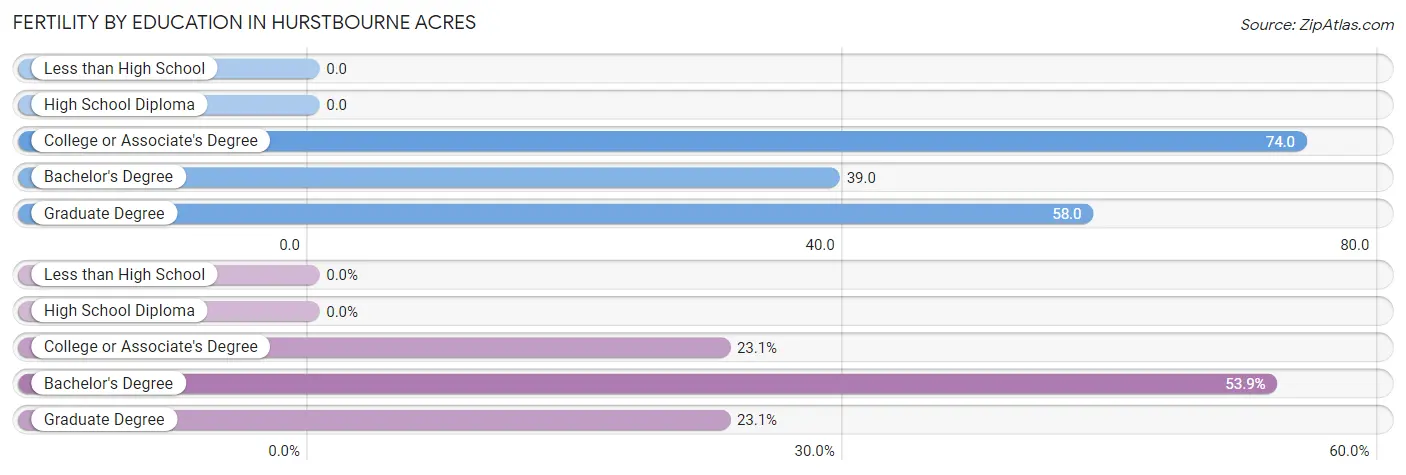
| Educational Attainment | Women with Births | Births / 1,000 Women |
| Less than High School | 0 (0.0%) | 0.0 |
| High School Diploma | 0 (0.0%) | 0.0 |
| College or Associate's Degree | 6 (23.1%) | 74.0 |
| Bachelor's Degree | 14 (53.8%) | 39.0 |
| Graduate Degree | 6 (23.1%) | 58.0 |
| Total | 26 (100.0%) | 43.0 |
Fertility by Education by Marriage Status in Hurstbourne Acres
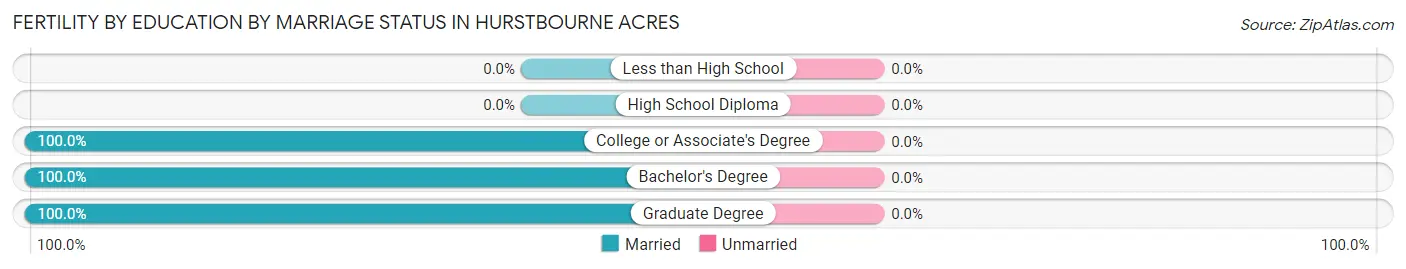
| Educational Attainment | Married | Unmarried |
| Less than High School | 0 (0.0%) | 0 (0.0%) |
| High School Diploma | 0 (0.0%) | 0 (0.0%) |
| College or Associate's Degree | 6 (100.0%) | 0 (0.0%) |
| Bachelor's Degree | 14 (100.0%) | 0 (0.0%) |
| Graduate Degree | 6 (100.0%) | 0 (0.0%) |
| Total | 26 (100.0%) | 0 (0.0%) |
Employment Characteristics in Hurstbourne Acres
Employment by Class of Employer in Hurstbourne Acres
Among the 1,067 employed individuals in Hurstbourne Acres, private company employees (852 | 79.8%), not-for-profit organizations (86 | 8.1%), and local government employees (58 | 5.4%) make up the most common classes of employment.
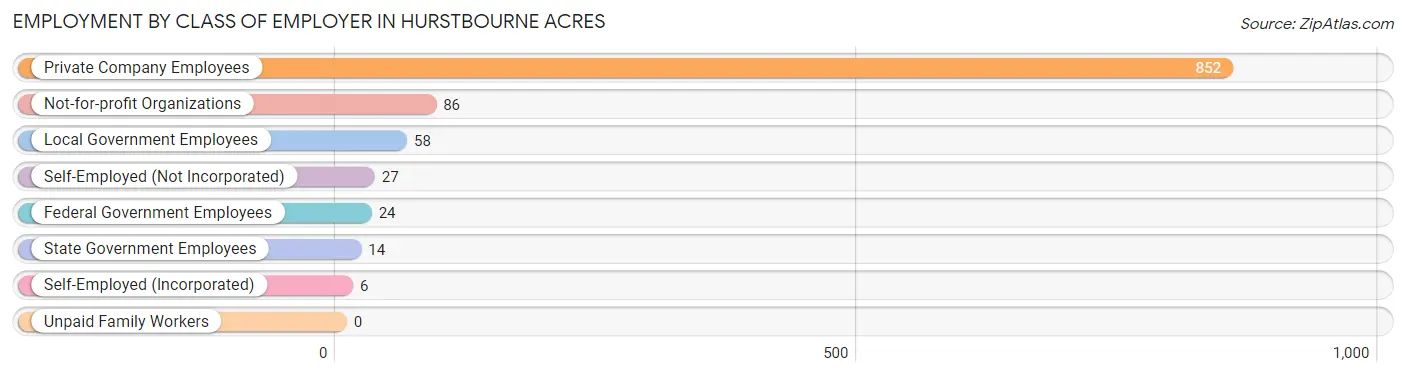
| Employer Class | # Employees | % Employees |
| Private Company Employees | 852 | 79.8% |
| Self-Employed (Incorporated) | 6 | 0.6% |
| Self-Employed (Not Incorporated) | 27 | 2.5% |
| Not-for-profit Organizations | 86 | 8.1% |
| Local Government Employees | 58 | 5.4% |
| State Government Employees | 14 | 1.3% |
| Federal Government Employees | 24 | 2.2% |
| Unpaid Family Workers | 0 | 0.0% |
| Total | 1,067 | 100.0% |
Employment Status by Age in Hurstbourne Acres
According to the labor force statistics for Hurstbourne Acres, out of the total population over 16 years of age (1,614), 68.1% or 1,099 individuals are in the labor force, with 1.5% or 16 of them unemployed. The age group with the highest labor force participation rate is 45 to 54 years, with 95.9% or 116 individuals in the labor force. Within the labor force, the 30 to 34 years age range has the highest percentage of unemployed individuals, with 4.7% or 7 of them being unemployed.
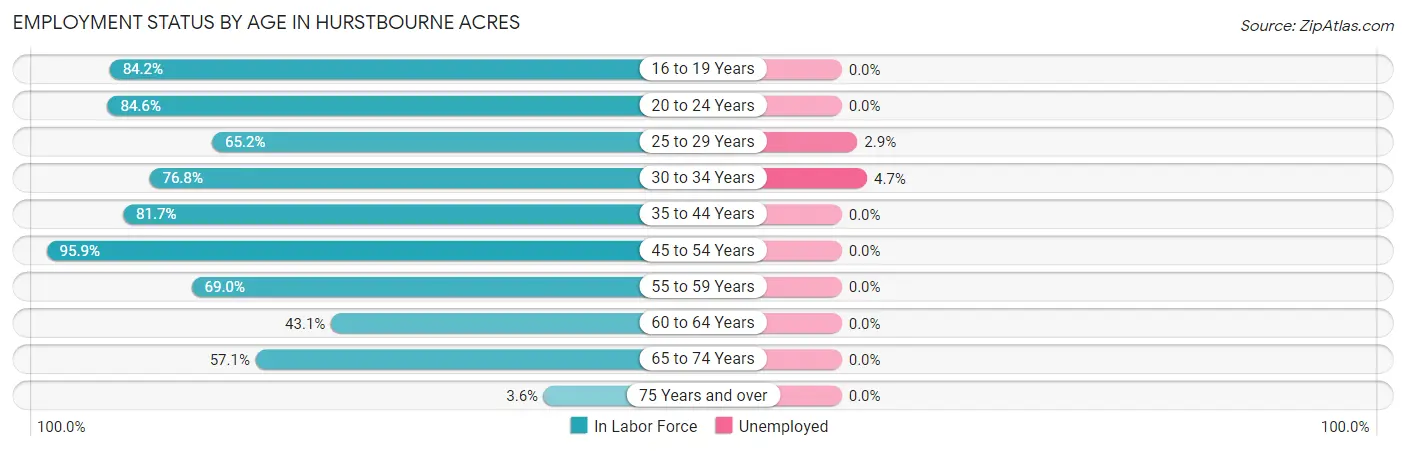
| Age Bracket | In Labor Force | Unemployed |
| 16 to 19 Years | 48 (84.2%) | 0 (0.0%) |
| 20 to 24 Years | 110 (84.6%) | 0 (0.0%) |
| 25 to 29 Years | 346 (65.2%) | 10 (2.9%) |
| 30 to 34 Years | 149 (76.8%) | 7 (4.7%) |
| 35 to 44 Years | 205 (81.7%) | 0 (0.0%) |
| 45 to 54 Years | 116 (95.9%) | 0 (0.0%) |
| 55 to 59 Years | 29 (69.0%) | 0 (0.0%) |
| 60 to 64 Years | 28 (43.1%) | 0 (0.0%) |
| 65 to 74 Years | 64 (57.1%) | 0 (0.0%) |
| 75 Years and over | 4 (3.6%) | 0 (0.0%) |
| Total | 1,099 (68.1%) | 16 (1.5%) |
Employment Status by Educational Attainment in Hurstbourne Acres
According to labor force statistics for Hurstbourne Acres, 72.5% of individuals (873) out of the total population between 25 and 64 years of age (1,204) are in the labor force, with 1.9% or 17 of them being unemployed. The group with the highest labor force participation rate are those with the educational attainment of less than high school, with 87.5% or 28 individuals in the labor force. Within the labor force, individuals with bachelor's degree or higher education have the highest percentage of unemployment, with 2.8% or 17 of them being unemployed.
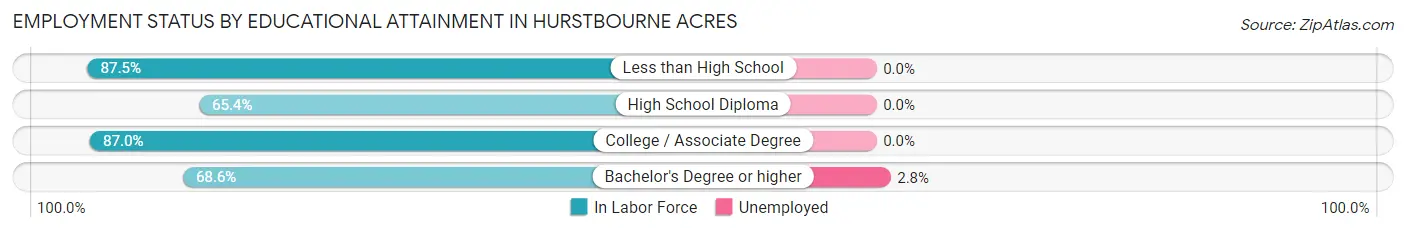
| Educational Attainment | In Labor Force | Unemployed |
| Less than High School | 28 (87.5%) | 0 (0.0%) |
| High School Diploma | 34 (65.4%) | 0 (0.0%) |
| College / Associate Degree | 201 (87.0%) | 0 (0.0%) |
| Bachelor's Degree or higher | 610 (68.6%) | 25 (2.8%) |
| Total | 873 (72.5%) | 23 (1.9%) |
Employment Occupations by Sex in Hurstbourne Acres
Management, Business, Science and Arts Occupations
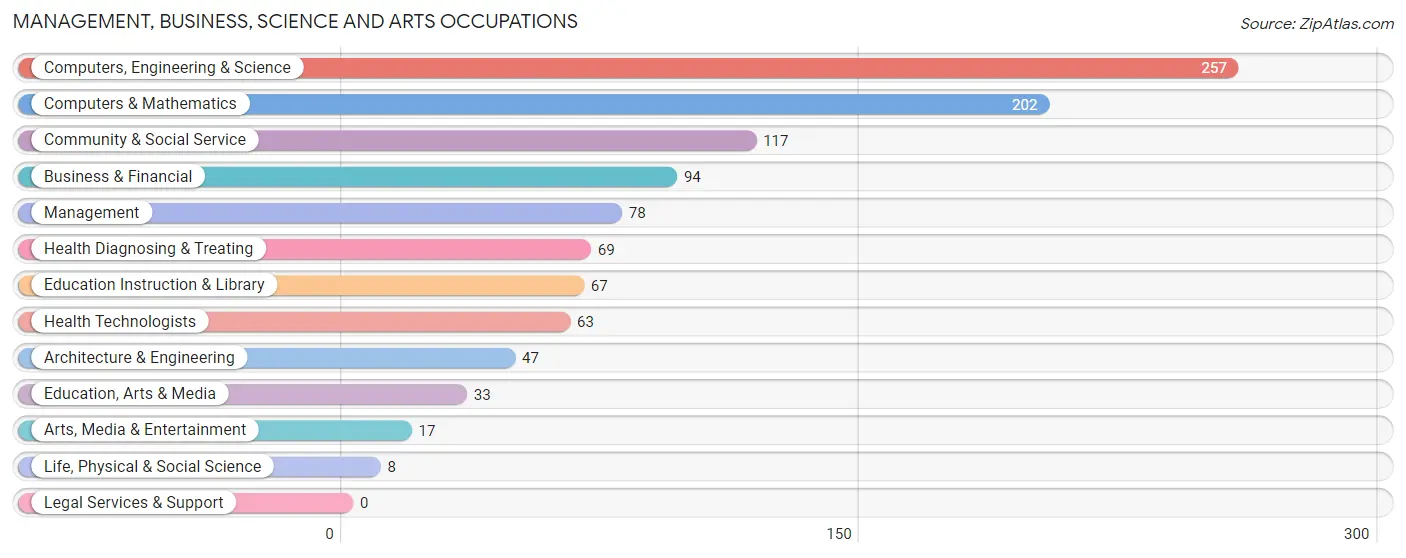
The most common Management, Business, Science and Arts occupations in Hurstbourne Acres are Computers, Engineering & Science (257 | 23.7%), Computers & Mathematics (202 | 18.7%), Community & Social Service (117 | 10.8%), Business & Financial (94 | 8.7%), and Management (78 | 7.2%).
Management, Business, Science and Arts Occupations by Sex
Within the Management, Business, Science and Arts occupations in Hurstbourne Acres, the most male-oriented occupations are Life, Physical & Social Science (100.0%), Business & Financial (90.4%), and Computers & Mathematics (89.6%), while the most female-oriented occupations are Education, Arts & Media (100.0%), Community & Social Service (74.4%), and Health Diagnosing & Treating (72.5%).
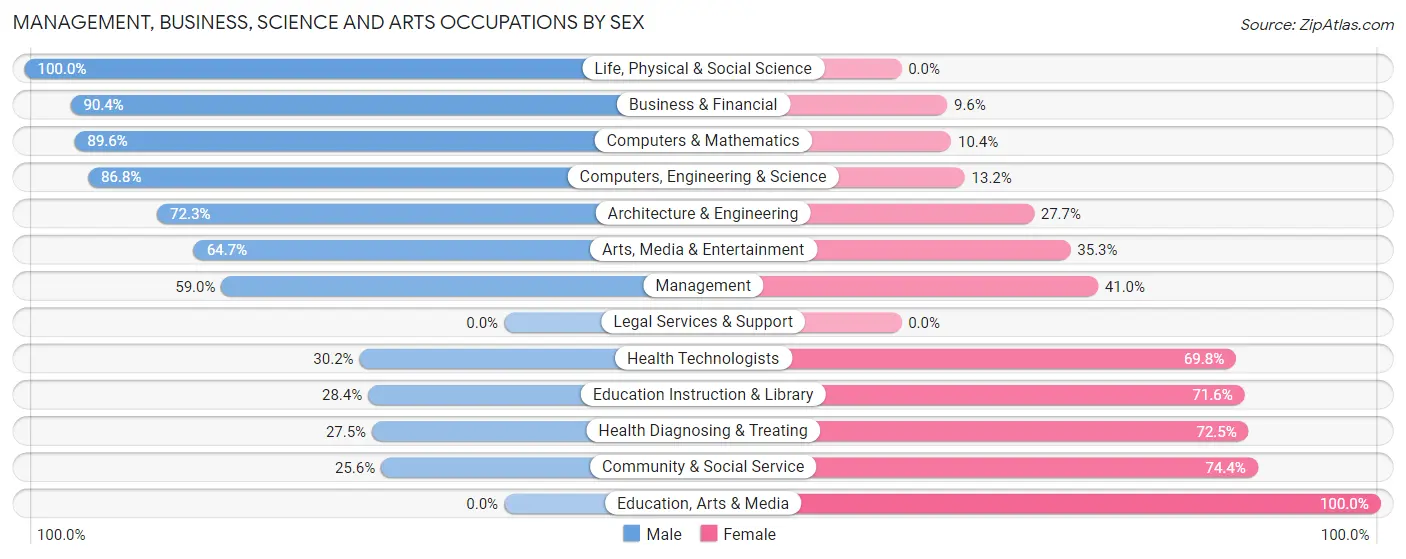
| Occupation | Male | Female |
| Management | 46 (59.0%) | 32 (41.0%) |
| Business & Financial | 85 (90.4%) | 9 (9.6%) |
| Computers, Engineering & Science | 223 (86.8%) | 34 (13.2%) |
| Computers & Mathematics | 181 (89.6%) | 21 (10.4%) |
| Architecture & Engineering | 34 (72.3%) | 13 (27.7%) |
| Life, Physical & Social Science | 8 (100.0%) | 0 (0.0%) |
| Community & Social Service | 30 (25.6%) | 87 (74.4%) |
| Education, Arts & Media | 0 (0.0%) | 33 (100.0%) |
| Legal Services & Support | 0 (0.0%) | 0 (0.0%) |
| Education Instruction & Library | 19 (28.4%) | 48 (71.6%) |
| Arts, Media & Entertainment | 11 (64.7%) | 6 (35.3%) |
| Health Diagnosing & Treating | 19 (27.5%) | 50 (72.5%) |
| Health Technologists | 19 (30.2%) | 44 (69.8%) |
| Total (Category) | 403 (65.5%) | 212 (34.5%) |
| Total (Overall) | 716 (66.2%) | 366 (33.8%) |
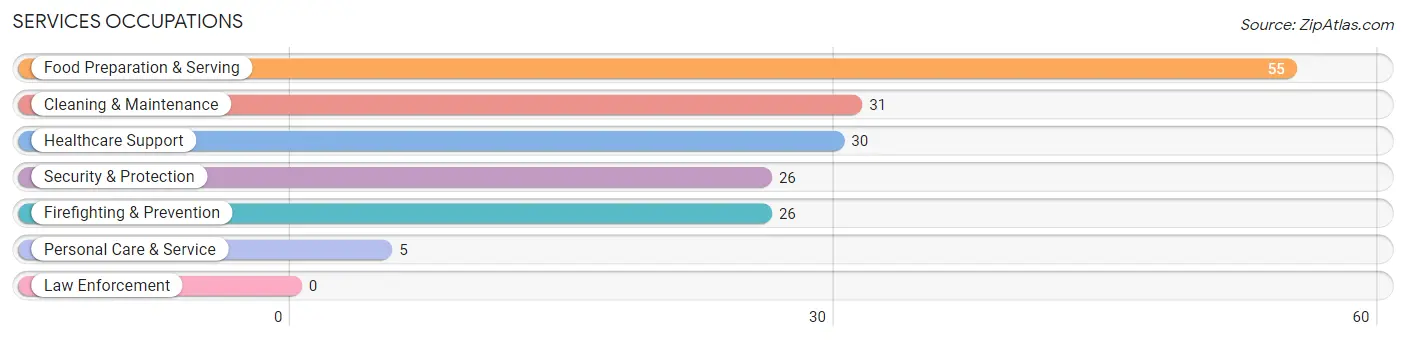
Services Occupations
The most common Services occupations in Hurstbourne Acres are Food Preparation & Serving (55 | 5.1%), Cleaning & Maintenance (31 | 2.9%), Healthcare Support (30 | 2.8%), Security & Protection (26 | 2.4%), and Firefighting & Prevention (26 | 2.4%).
Services Occupations by Sex
Within the Services occupations in Hurstbourne Acres, the most male-oriented occupations are Security & Protection (100.0%), Firefighting & Prevention (100.0%), and Cleaning & Maintenance (80.6%), while the most female-oriented occupations are Personal Care & Service (100.0%), Healthcare Support (60.0%), and Food Preparation & Serving (60.0%).
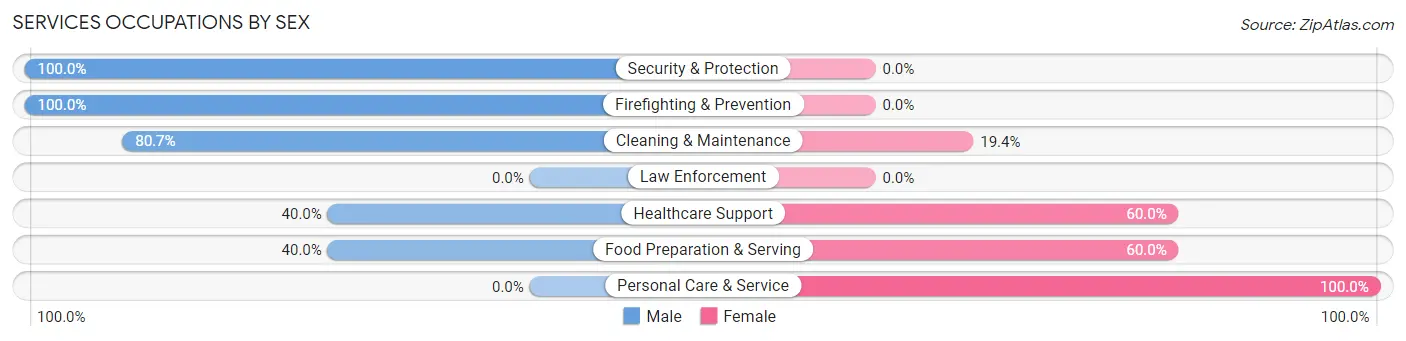
| Occupation | Male | Female |
| Healthcare Support | 12 (40.0%) | 18 (60.0%) |
| Security & Protection | 26 (100.0%) | 0 (0.0%) |
| Firefighting & Prevention | 26 (100.0%) | 0 (0.0%) |
| Law Enforcement | 0 (0.0%) | 0 (0.0%) |
| Food Preparation & Serving | 22 (40.0%) | 33 (60.0%) |
| Cleaning & Maintenance | 25 (80.6%) | 6 (19.4%) |
| Personal Care & Service | 0 (0.0%) | 5 (100.0%) |
| Total (Category) | 85 (57.8%) | 62 (42.2%) |
| Total (Overall) | 716 (66.2%) | 366 (33.8%) |
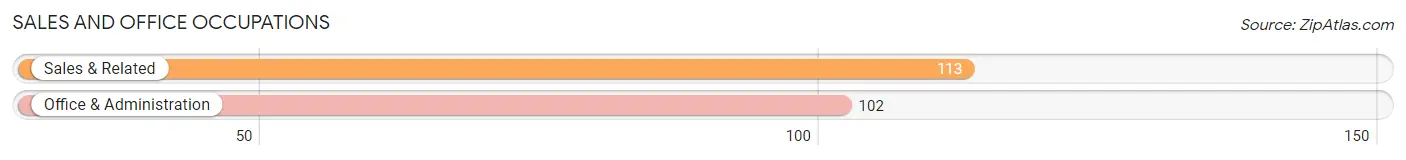
Sales and Office Occupations
The most common Sales and Office occupations in Hurstbourne Acres are Sales & Related (113 | 10.4%), and Office & Administration (102 | 9.4%).
Sales and Office Occupations by Sex
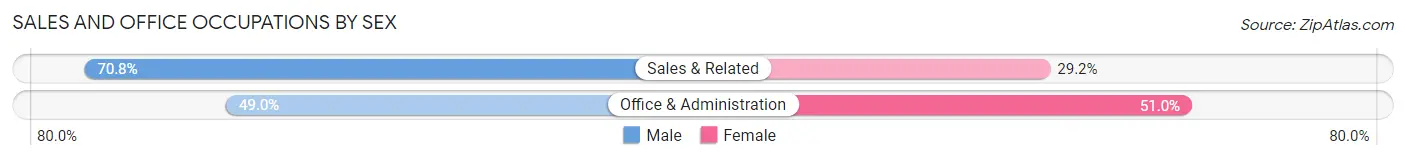
| Occupation | Male | Female |
| Sales & Related | 80 (70.8%) | 33 (29.2%) |
| Office & Administration | 50 (49.0%) | 52 (51.0%) |
| Total (Category) | 130 (60.5%) | 85 (39.5%) |
| Total (Overall) | 716 (66.2%) | 366 (33.8%) |
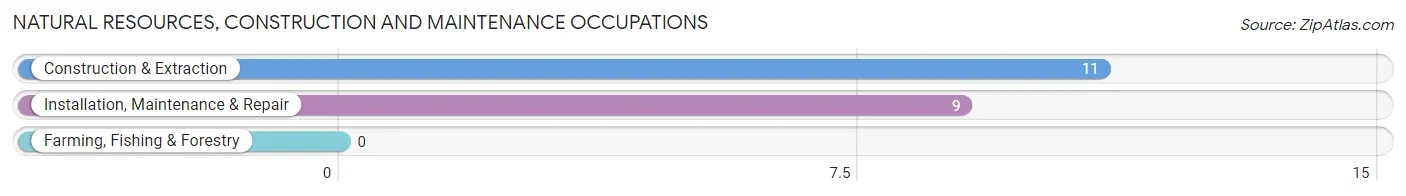
Natural Resources, Construction and Maintenance Occupations
The most common Natural Resources, Construction and Maintenance occupations in Hurstbourne Acres are Construction & Extraction (11 | 1.0%), and Installation, Maintenance & Repair (9 | 0.8%).
Natural Resources, Construction and Maintenance Occupations by Sex
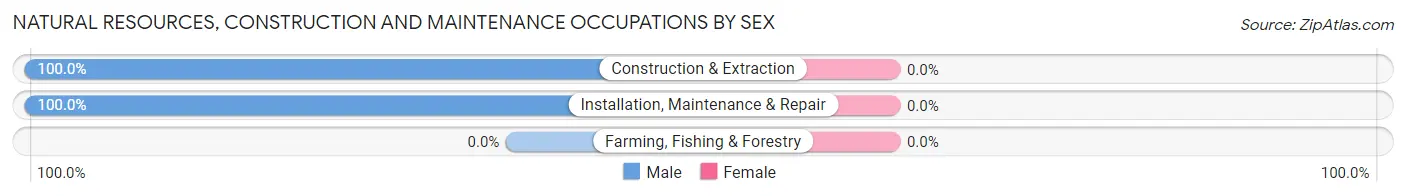
| Occupation | Male | Female |
| Farming, Fishing & Forestry | 0 (0.0%) | 0 (0.0%) |
| Construction & Extraction | 11 (100.0%) | 0 (0.0%) |
| Installation, Maintenance & Repair | 9 (100.0%) | 0 (0.0%) |
| Total (Category) | 20 (100.0%) | 0 (0.0%) |
| Total (Overall) | 716 (66.2%) | 366 (33.8%) |
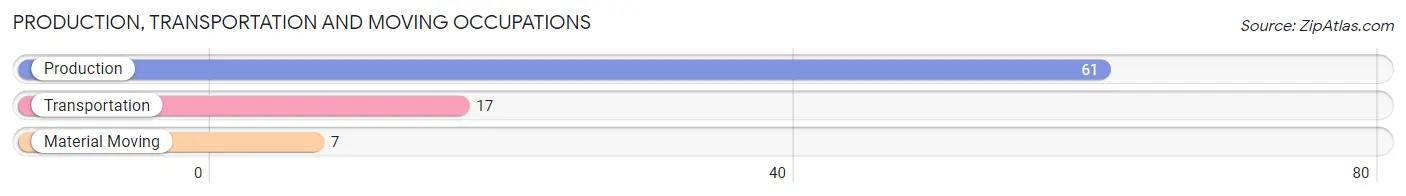
Production, Transportation and Moving Occupations
The most common Production, Transportation and Moving occupations in Hurstbourne Acres are Production (61 | 5.6%), Transportation (17 | 1.6%), and Material Moving (7 | 0.6%).
Production, Transportation and Moving Occupations by Sex
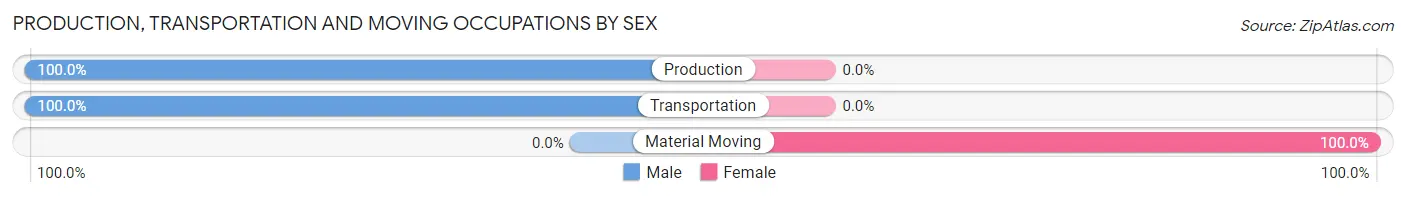
| Occupation | Male | Female |
| Production | 61 (100.0%) | 0 (0.0%) |
| Transportation | 17 (100.0%) | 0 (0.0%) |
| Material Moving | 0 (0.0%) | 7 (100.0%) |
| Total (Category) | 78 (91.8%) | 7 (8.2%) |
| Total (Overall) | 716 (66.2%) | 366 (33.8%) |
Employment Industries by Sex in Hurstbourne Acres
Employment Industries in Hurstbourne Acres
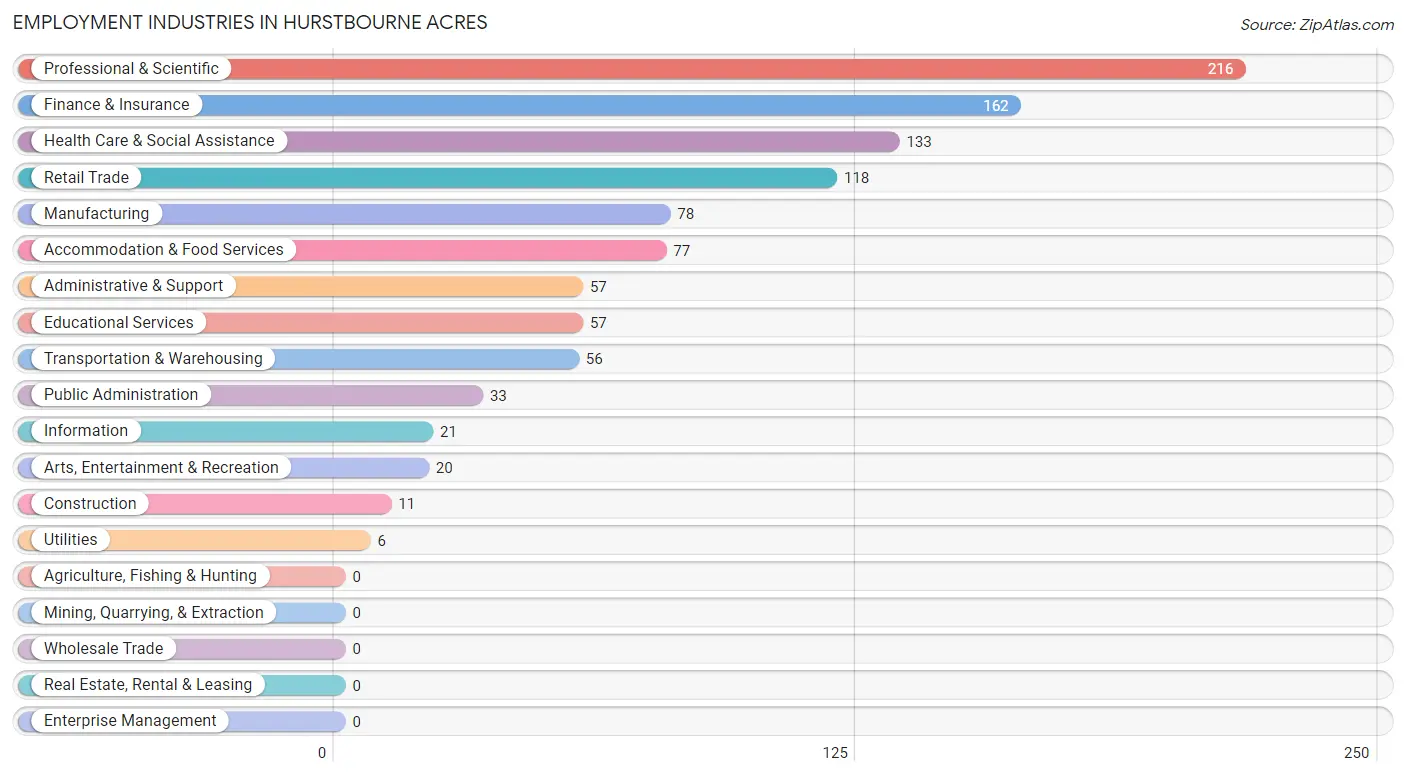
The major employment industries in Hurstbourne Acres include Professional & Scientific (216 | 20.0%), Finance & Insurance (162 | 15.0%), Health Care & Social Assistance (133 | 12.3%), Retail Trade (118 | 10.9%), and Manufacturing (78 | 7.2%).
Employment Industries by Sex in Hurstbourne Acres
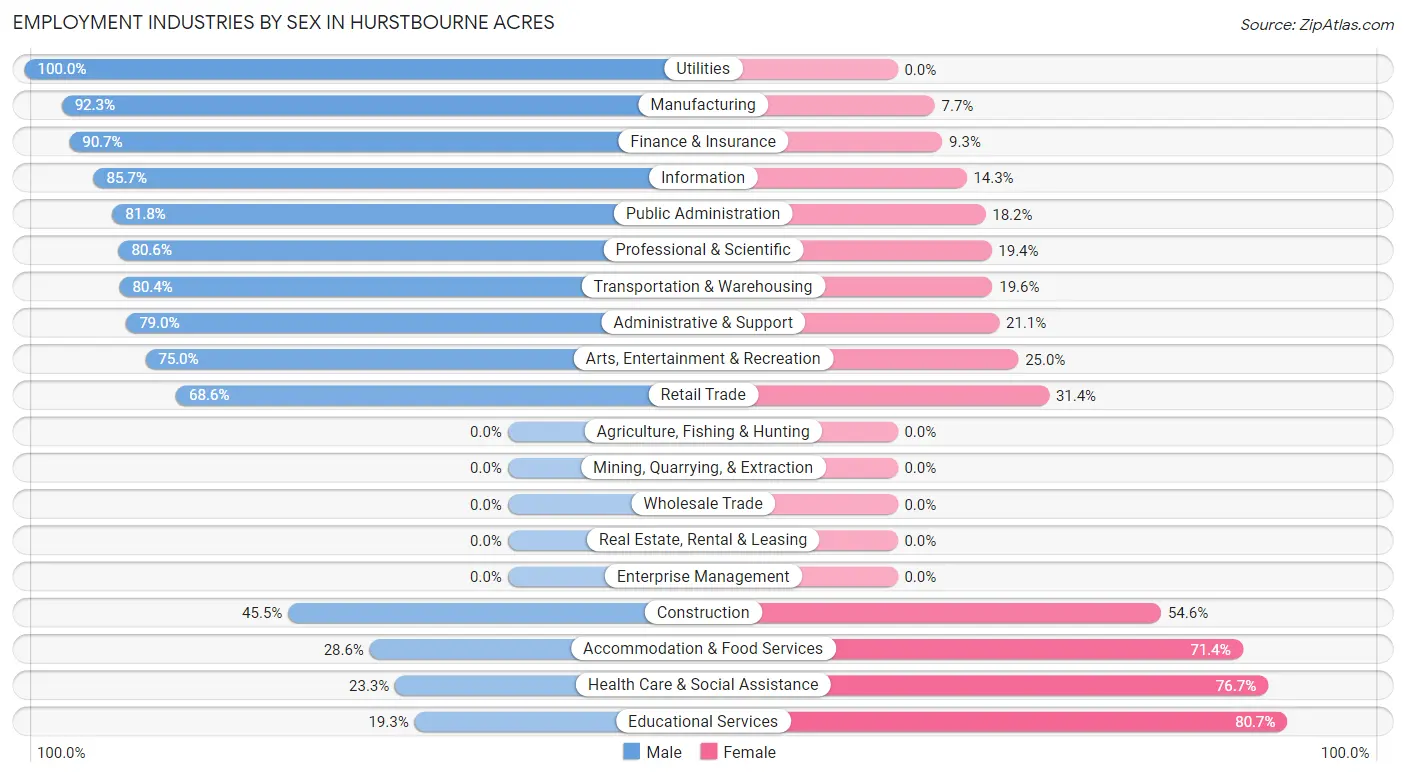
The Hurstbourne Acres industries that see more men than women are Utilities (100.0%), Manufacturing (92.3%), and Finance & Insurance (90.7%), whereas the industries that tend to have a higher number of women are Educational Services (80.7%), Health Care & Social Assistance (76.7%), and Accommodation & Food Services (71.4%).
| Industry | Male | Female |
| Agriculture, Fishing & Hunting | 0 (0.0%) | 0 (0.0%) |
| Mining, Quarrying, & Extraction | 0 (0.0%) | 0 (0.0%) |
| Construction | 5 (45.5%) | 6 (54.5%) |
| Manufacturing | 72 (92.3%) | 6 (7.7%) |
| Wholesale Trade | 0 (0.0%) | 0 (0.0%) |
| Retail Trade | 81 (68.6%) | 37 (31.4%) |
| Transportation & Warehousing | 45 (80.4%) | 11 (19.6%) |
| Utilities | 6 (100.0%) | 0 (0.0%) |
| Information | 18 (85.7%) | 3 (14.3%) |
| Finance & Insurance | 147 (90.7%) | 15 (9.3%) |
| Real Estate, Rental & Leasing | 0 (0.0%) | 0 (0.0%) |
| Professional & Scientific | 174 (80.6%) | 42 (19.4%) |
| Enterprise Management | 0 (0.0%) | 0 (0.0%) |
| Administrative & Support | 45 (78.9%) | 12 (21.0%) |
| Educational Services | 11 (19.3%) | 46 (80.7%) |
| Health Care & Social Assistance | 31 (23.3%) | 102 (76.7%) |
| Arts, Entertainment & Recreation | 15 (75.0%) | 5 (25.0%) |
| Accommodation & Food Services | 22 (28.6%) | 55 (71.4%) |
| Public Administration | 27 (81.8%) | 6 (18.2%) |
| Total | 716 (66.2%) | 366 (33.8%) |
Education in Hurstbourne Acres
School Enrollment in Hurstbourne Acres
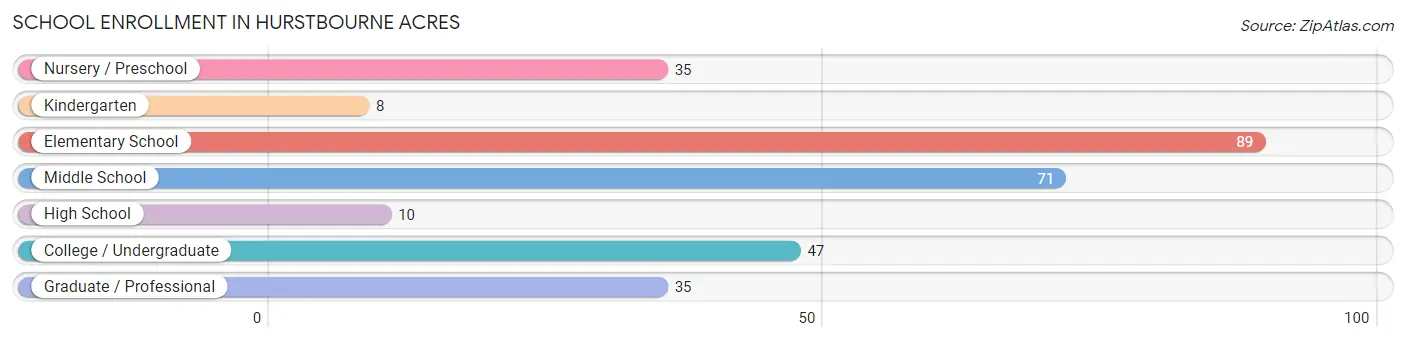
The most common levels of schooling among the 295 students in Hurstbourne Acres are elementary school (89 | 30.2%), middle school (71 | 24.1%), and college / undergraduate (47 | 15.9%).
| School Level | # Students | % Students |
| Nursery / Preschool | 35 | 11.9% |
| Kindergarten | 8 | 2.7% |
| Elementary School | 89 | 30.2% |
| Middle School | 71 | 24.1% |
| High School | 10 | 3.4% |
| College / Undergraduate | 47 | 15.9% |
| Graduate / Professional | 35 | 11.9% |
| Total | 295 | 100.0% |
School Enrollment by Age by Funding Source in Hurstbourne Acres
Out of a total of 295 students who are enrolled in schools in Hurstbourne Acres, 93 (31.5%) attend a private institution, while the remaining 202 (68.5%) are enrolled in public schools. The age group of 3 to 4 year olds has the highest likelihood of being enrolled in private schools, with 39 (100.0% in the age bracket) enrolled. Conversely, the age group of 10 to 14 year olds has the lowest likelihood of being enrolled in a private school, with 71 (100.0% in the age bracket) attending a public institution.
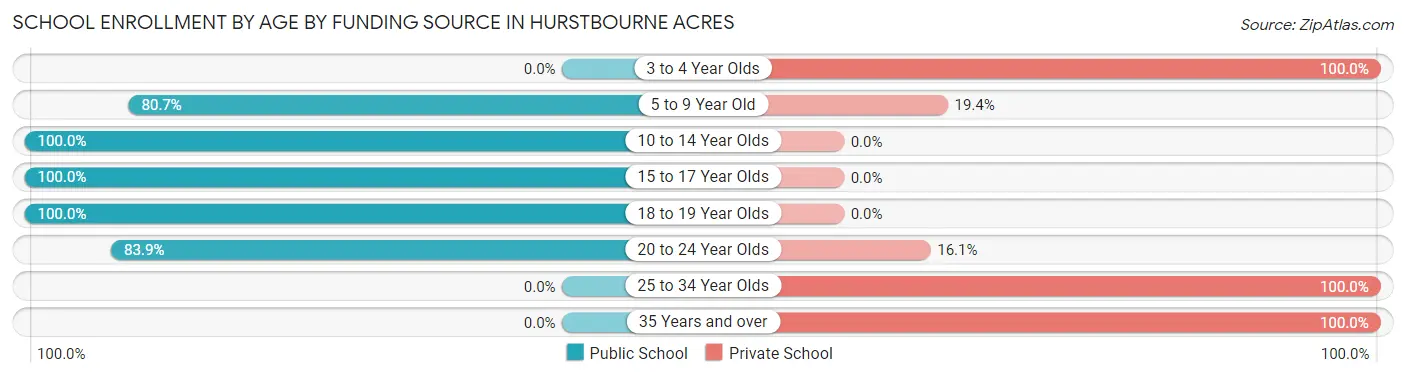
| Age Bracket | Public School | Private School |
| 3 to 4 Year Olds | 0 (0.0%) | 39 (100.0%) |
| 5 to 9 Year Old | 75 (80.6%) | 18 (19.4%) |
| 10 to 14 Year Olds | 71 (100.0%) | 0 (0.0%) |
| 15 to 17 Year Olds | 10 (100.0%) | 0 (0.0%) |
| 18 to 19 Year Olds | 20 (100.0%) | 0 (0.0%) |
| 20 to 24 Year Olds | 26 (83.9%) | 5 (16.1%) |
| 25 to 34 Year Olds | 0 (0.0%) | 10 (100.0%) |
| 35 Years and over | 0 (0.0%) | 21 (100.0%) |
| Total | 202 (68.5%) | 93 (31.5%) |
Educational Attainment by Field of Study in Hurstbourne Acres
Computers & mathematics (250 | 25.3%), engineering (169 | 17.1%), business (143 | 14.4%), science & technology (117 | 11.8%), and education (69 | 7.0%) are the most common fields of study among 990 individuals in Hurstbourne Acres who have obtained a bachelor's degree or higher.
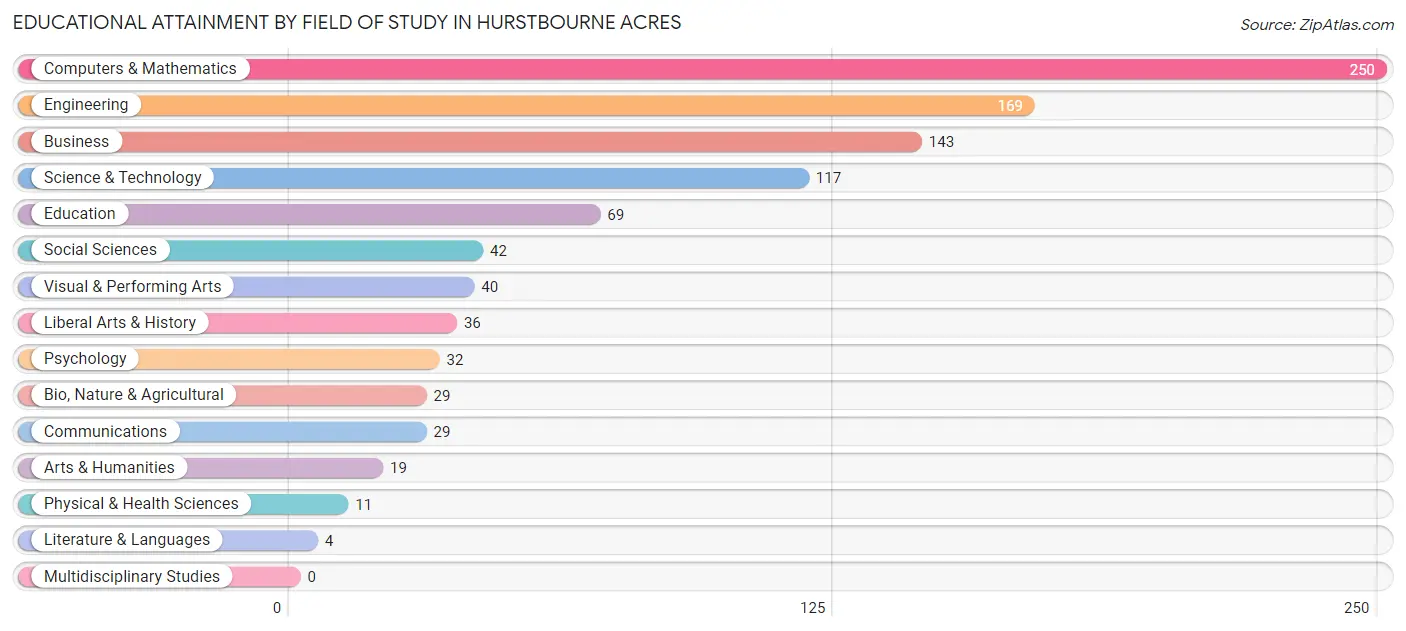
| Field of Study | # Graduates | % Graduates |
| Computers & Mathematics | 250 | 25.3% |
| Bio, Nature & Agricultural | 29 | 2.9% |
| Physical & Health Sciences | 11 | 1.1% |
| Psychology | 32 | 3.2% |
| Social Sciences | 42 | 4.2% |
| Engineering | 169 | 17.1% |
| Multidisciplinary Studies | 0 | 0.0% |
| Science & Technology | 117 | 11.8% |
| Business | 143 | 14.4% |
| Education | 69 | 7.0% |
| Literature & Languages | 4 | 0.4% |
| Liberal Arts & History | 36 | 3.6% |
| Visual & Performing Arts | 40 | 4.0% |
| Communications | 29 | 2.9% |
| Arts & Humanities | 19 | 1.9% |
| Total | 990 | 100.0% |
Transportation & Commute in Hurstbourne Acres
Vehicle Availability by Sex in Hurstbourne Acres
The most prevalent vehicle ownership categories in Hurstbourne Acres are males with 1 vehicle (466, accounting for 66.5%) and females with 1 vehicle (195, making up 127.3%).
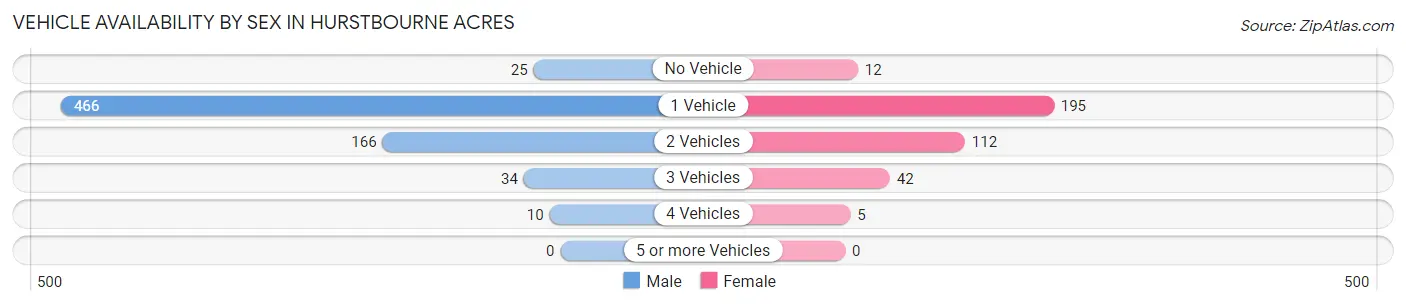
| Vehicles Available | Male | Female |
| No Vehicle | 25 (3.6%) | 12 (3.3%) |
| 1 Vehicle | 466 (66.5%) | 195 (53.3%) |
| 2 Vehicles | 166 (23.7%) | 112 (30.6%) |
| 3 Vehicles | 34 (4.9%) | 42 (11.5%) |
| 4 Vehicles | 10 (1.4%) | 5 (1.4%) |
| 5 or more Vehicles | 0 (0.0%) | 0 (0.0%) |
| Total | 701 (100.0%) | 366 (100.0%) |
Commute Time in Hurstbourne Acres
The most frequently occuring commute durations in Hurstbourne Acres are 20 to 24 minutes (316 commuters, 34.2%), 15 to 19 minutes (181 commuters, 19.6%), and 30 to 34 minutes (96 commuters, 10.4%).
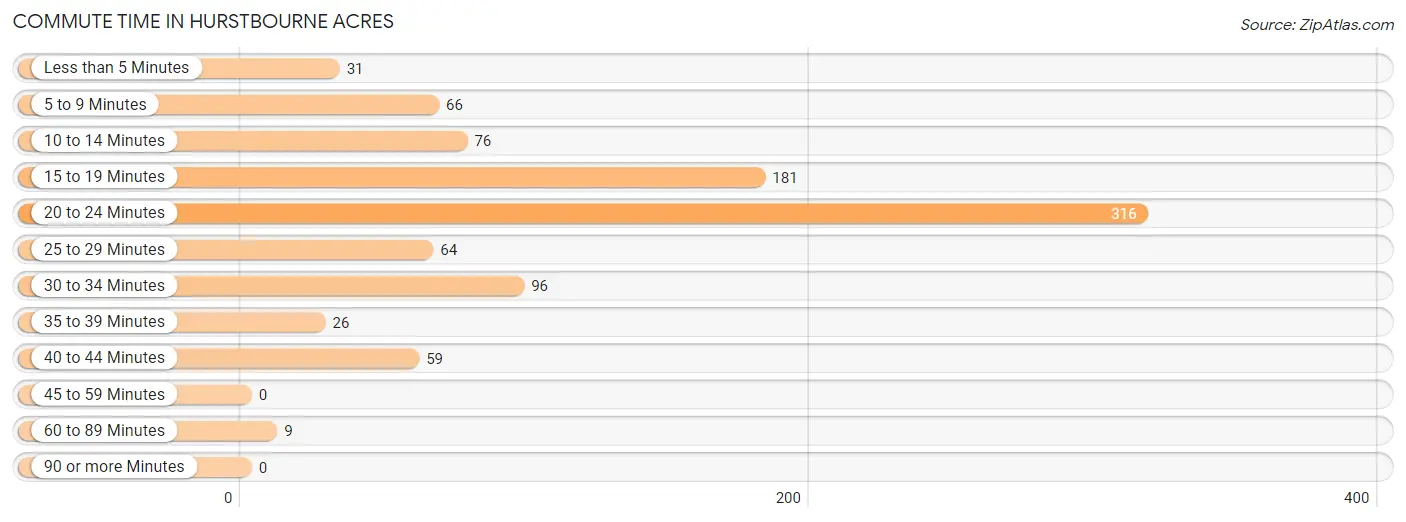
| Commute Time | # Commuters | % Commuters |
| Less than 5 Minutes | 31 | 3.4% |
| 5 to 9 Minutes | 66 | 7.1% |
| 10 to 14 Minutes | 76 | 8.2% |
| 15 to 19 Minutes | 181 | 19.6% |
| 20 to 24 Minutes | 316 | 34.2% |
| 25 to 29 Minutes | 64 | 6.9% |
| 30 to 34 Minutes | 96 | 10.4% |
| 35 to 39 Minutes | 26 | 2.8% |
| 40 to 44 Minutes | 59 | 6.4% |
| 45 to 59 Minutes | 0 | 0.0% |
| 60 to 89 Minutes | 9 | 1.0% |
| 90 or more Minutes | 0 | 0.0% |
Commute Time by Sex in Hurstbourne Acres
The most common commute times in Hurstbourne Acres are 20 to 24 minutes (209 commuters, 34.1%) for males and 20 to 24 minutes (107 commuters, 34.4%) for females.
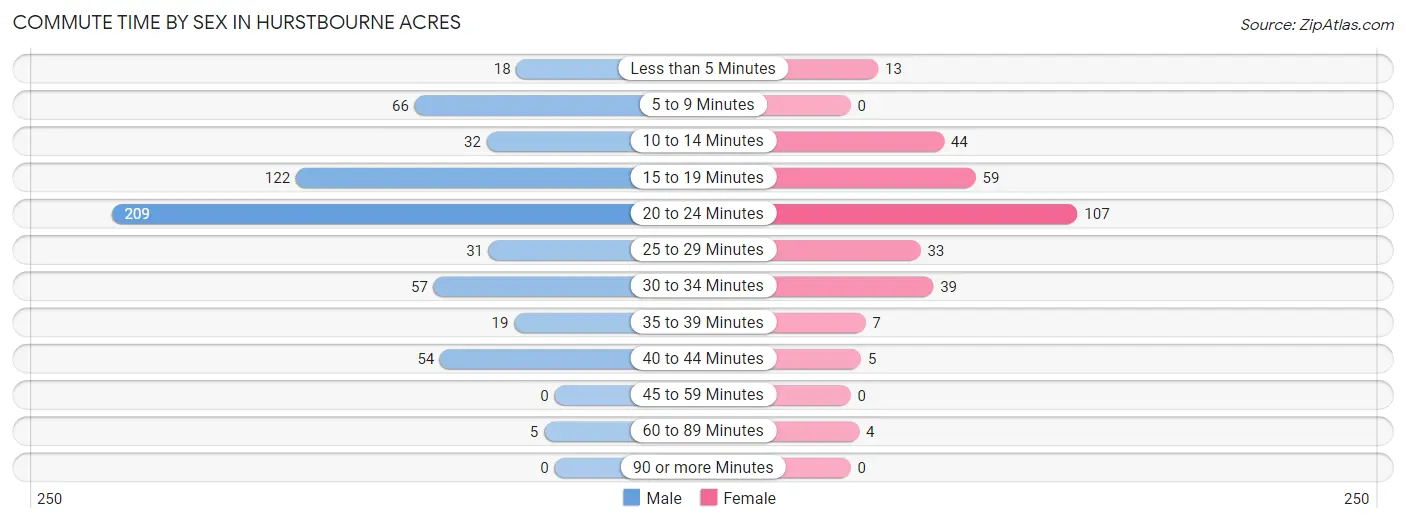
| Commute Time | Male | Female |
| Less than 5 Minutes | 18 (2.9%) | 13 (4.2%) |
| 5 to 9 Minutes | 66 (10.8%) | 0 (0.0%) |
| 10 to 14 Minutes | 32 (5.2%) | 44 (14.1%) |
| 15 to 19 Minutes | 122 (19.9%) | 59 (19.0%) |
| 20 to 24 Minutes | 209 (34.1%) | 107 (34.4%) |
| 25 to 29 Minutes | 31 (5.1%) | 33 (10.6%) |
| 30 to 34 Minutes | 57 (9.3%) | 39 (12.5%) |
| 35 to 39 Minutes | 19 (3.1%) | 7 (2.2%) |
| 40 to 44 Minutes | 54 (8.8%) | 5 (1.6%) |
| 45 to 59 Minutes | 0 (0.0%) | 0 (0.0%) |
| 60 to 89 Minutes | 5 (0.8%) | 4 (1.3%) |
| 90 or more Minutes | 0 (0.0%) | 0 (0.0%) |
Time of Departure to Work by Sex in Hurstbourne Acres
The most frequent times of departure to work in Hurstbourne Acres are 7:00 AM to 7:29 AM (145, 23.6%) for males and 8:00 AM to 8:29 AM (118, 37.9%) for females.
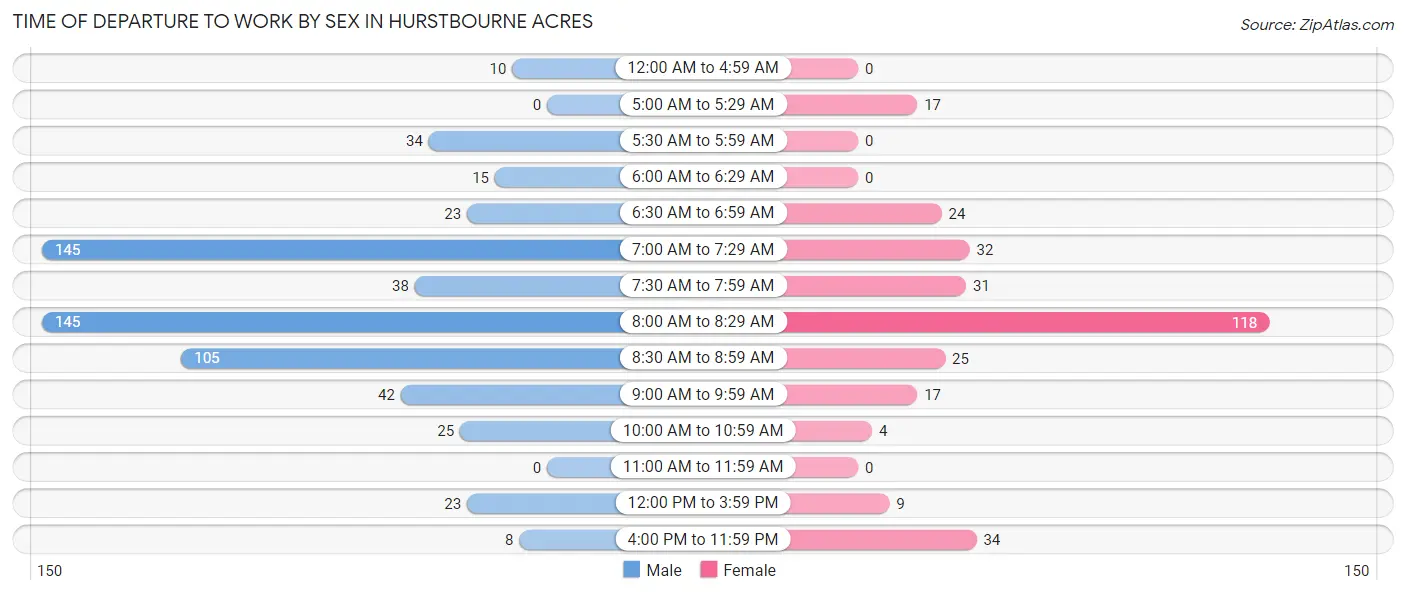
| Time of Departure | Male | Female |
| 12:00 AM to 4:59 AM | 10 (1.6%) | 0 (0.0%) |
| 5:00 AM to 5:29 AM | 0 (0.0%) | 17 (5.5%) |
| 5:30 AM to 5:59 AM | 34 (5.6%) | 0 (0.0%) |
| 6:00 AM to 6:29 AM | 15 (2.5%) | 0 (0.0%) |
| 6:30 AM to 6:59 AM | 23 (3.7%) | 24 (7.7%) |
| 7:00 AM to 7:29 AM | 145 (23.6%) | 32 (10.3%) |
| 7:30 AM to 7:59 AM | 38 (6.2%) | 31 (10.0%) |
| 8:00 AM to 8:29 AM | 145 (23.6%) | 118 (37.9%) |
| 8:30 AM to 8:59 AM | 105 (17.1%) | 25 (8.0%) |
| 9:00 AM to 9:59 AM | 42 (6.9%) | 17 (5.5%) |
| 10:00 AM to 10:59 AM | 25 (4.1%) | 4 (1.3%) |
| 11:00 AM to 11:59 AM | 0 (0.0%) | 0 (0.0%) |
| 12:00 PM to 3:59 PM | 23 (3.7%) | 9 (2.9%) |
| 4:00 PM to 11:59 PM | 8 (1.3%) | 34 (10.9%) |
| Total | 613 (100.0%) | 311 (100.0%) |
Housing Occupancy in Hurstbourne Acres
Occupancy by Ownership in Hurstbourne Acres
Of the total 997 dwellings in Hurstbourne Acres, owner-occupied units account for 143 (14.3%), while renter-occupied units make up 854 (85.7%).
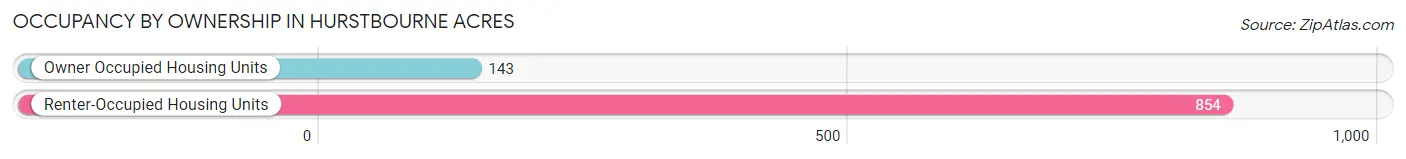
| Occupancy | # Housing Units | % Housing Units |
| Owner Occupied Housing Units | 143 | 14.3% |
| Renter-Occupied Housing Units | 854 | 85.7% |
| Total Occupied Housing Units | 997 | 100.0% |
Occupancy by Household Size in Hurstbourne Acres
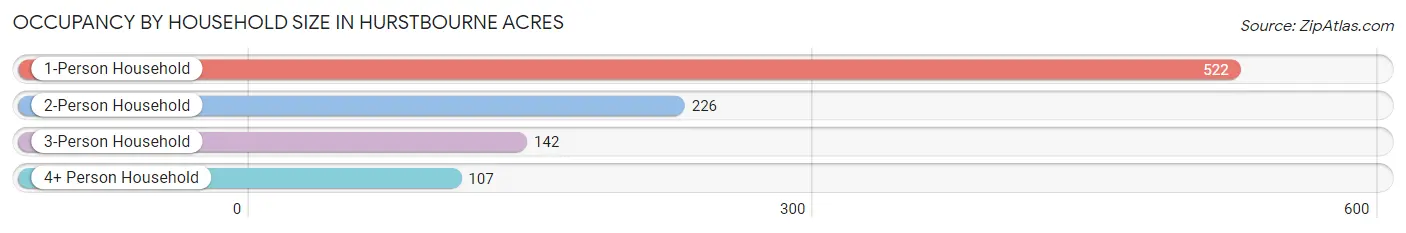
| Household Size | # Housing Units | % Housing Units |
| 1-Person Household | 522 | 52.4% |
| 2-Person Household | 226 | 22.7% |
| 3-Person Household | 142 | 14.2% |
| 4+ Person Household | 107 | 10.7% |
| Total Housing Units | 997 | 100.0% |
Occupancy by Ownership by Household Size in Hurstbourne Acres
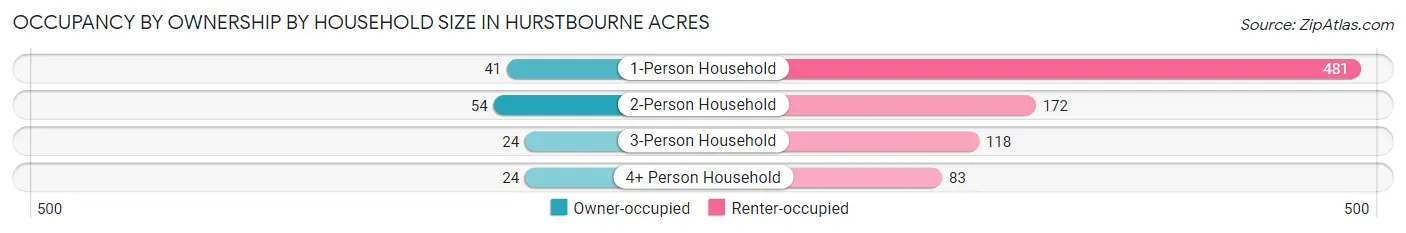
| Household Size | Owner-occupied | Renter-occupied |
| 1-Person Household | 41 (7.9%) | 481 (92.1%) |
| 2-Person Household | 54 (23.9%) | 172 (76.1%) |
| 3-Person Household | 24 (16.9%) | 118 (83.1%) |
| 4+ Person Household | 24 (22.4%) | 83 (77.6%) |
| Total Housing Units | 143 (14.3%) | 854 (85.7%) |
Occupancy by Educational Attainment in Hurstbourne Acres
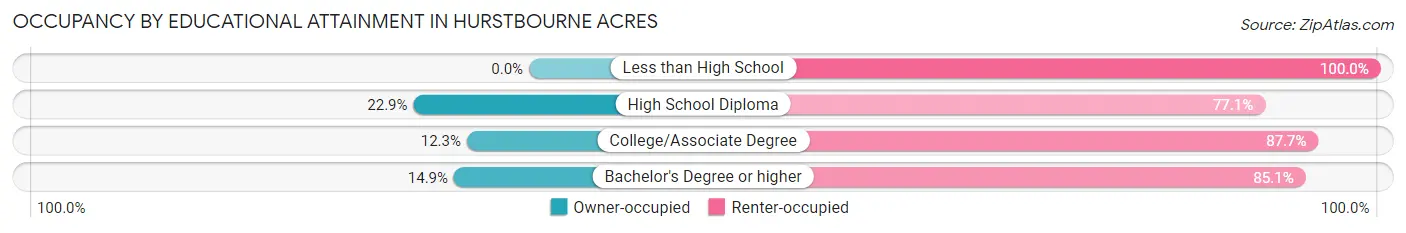
| Household Size | Owner-occupied | Renter-occupied |
| Less than High School | 0 (0.0%) | 37 (100.0%) |
| High School Diploma | 22 (22.9%) | 74 (77.1%) |
| College/Associate Degree | 37 (12.3%) | 263 (87.7%) |
| Bachelor's Degree or higher | 84 (14.9%) | 480 (85.1%) |
Occupancy by Age of Householder in Hurstbourne Acres
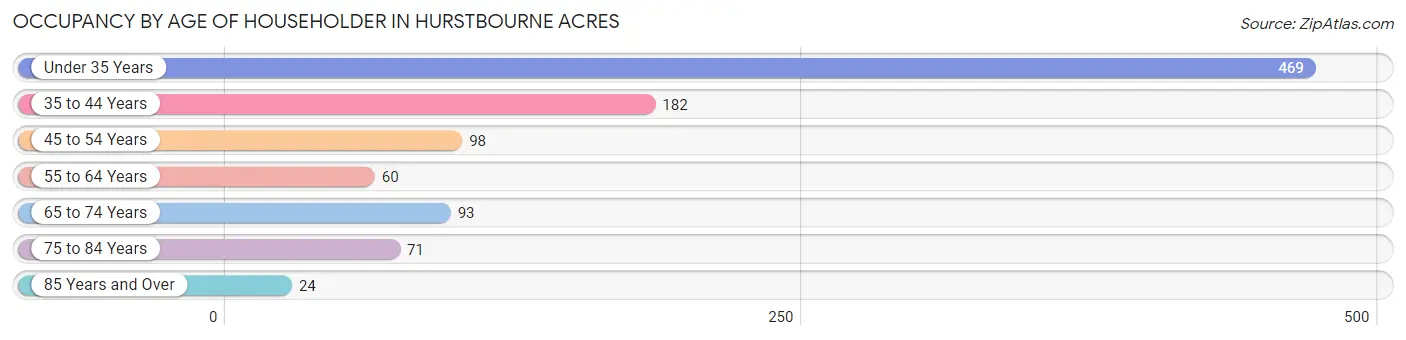
| Age Bracket | # Households | % Households |
| Under 35 Years | 469 | 47.0% |
| 35 to 44 Years | 182 | 18.2% |
| 45 to 54 Years | 98 | 9.8% |
| 55 to 64 Years | 60 | 6.0% |
| 65 to 74 Years | 93 | 9.3% |
| 75 to 84 Years | 71 | 7.1% |
| 85 Years and Over | 24 | 2.4% |
| Total | 997 | 100.0% |
Housing Finances in Hurstbourne Acres
Median Income by Occupancy in Hurstbourne Acres
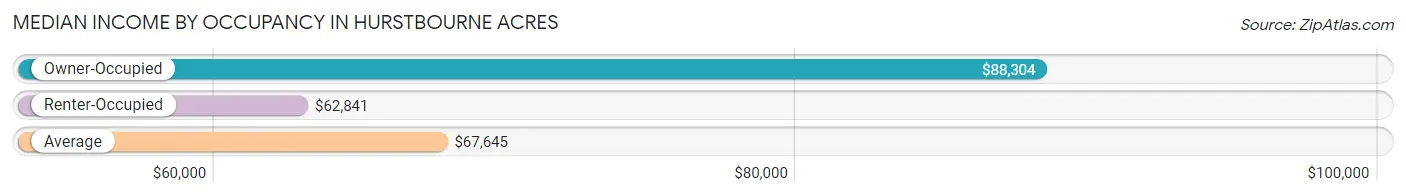
| Occupancy Type | # Households | Median Income |
| Owner-Occupied | 143 (14.3%) | $88,304 |
| Renter-Occupied | 854 (85.7%) | $62,841 |
| Average | 997 (100.0%) | $67,645 |
Occupancy by Householder Income Bracket in Hurstbourne Acres
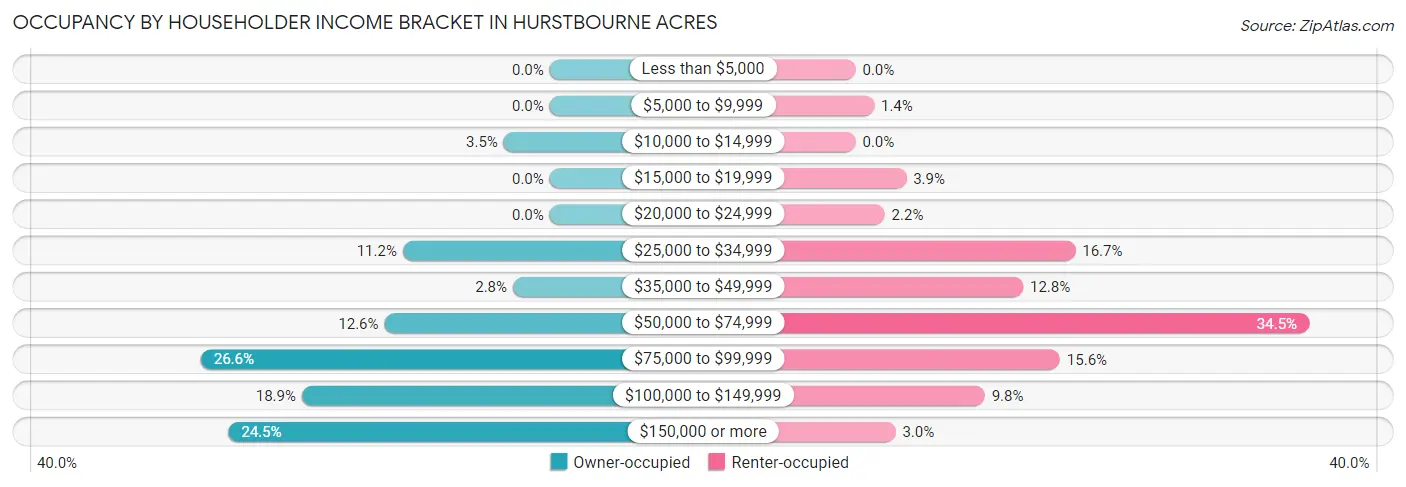
| Income Bracket | Owner-occupied | Renter-occupied |
| Less than $5,000 | 0 (0.0%) | 0 (0.0%) |
| $5,000 to $9,999 | 0 (0.0%) | 12 (1.4%) |
| $10,000 to $14,999 | 5 (3.5%) | 0 (0.0%) |
| $15,000 to $19,999 | 0 (0.0%) | 33 (3.9%) |
| $20,000 to $24,999 | 0 (0.0%) | 19 (2.2%) |
| $25,000 to $34,999 | 16 (11.2%) | 143 (16.7%) |
| $35,000 to $49,999 | 4 (2.8%) | 109 (12.8%) |
| $50,000 to $74,999 | 18 (12.6%) | 295 (34.5%) |
| $75,000 to $99,999 | 38 (26.6%) | 133 (15.6%) |
| $100,000 to $149,999 | 27 (18.9%) | 84 (9.8%) |
| $150,000 or more | 35 (24.5%) | 26 (3.0%) |
| Total | 143 (100.0%) | 854 (100.0%) |
Monthly Housing Cost Tiers in Hurstbourne Acres
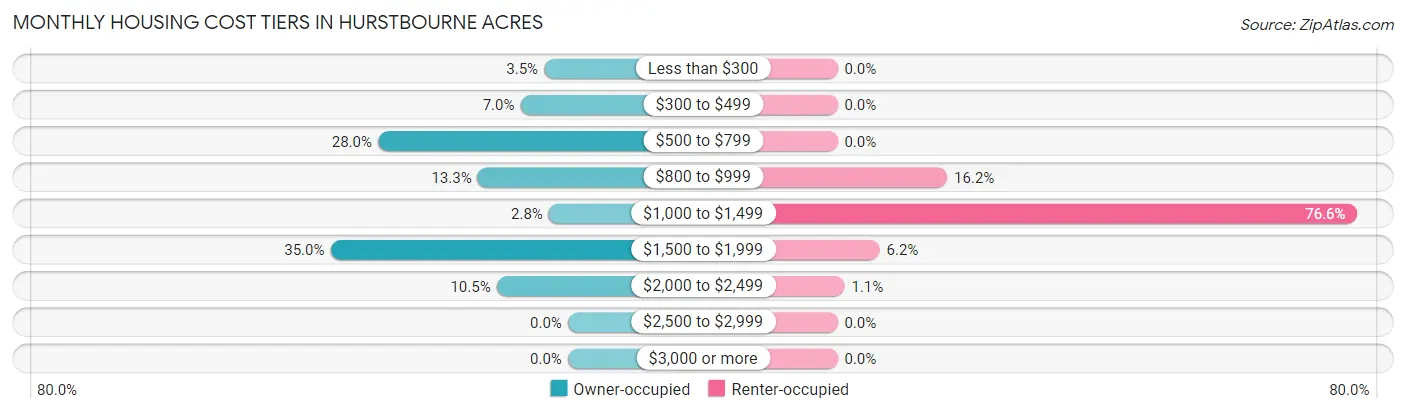
| Monthly Cost | Owner-occupied | Renter-occupied |
| Less than $300 | 5 (3.5%) | 0 (0.0%) |
| $300 to $499 | 10 (7.0%) | 0 (0.0%) |
| $500 to $799 | 40 (28.0%) | 0 (0.0%) |
| $800 to $999 | 19 (13.3%) | 138 (16.2%) |
| $1,000 to $1,499 | 4 (2.8%) | 654 (76.6%) |
| $1,500 to $1,999 | 50 (35.0%) | 53 (6.2%) |
| $2,000 to $2,499 | 15 (10.5%) | 9 (1.1%) |
| $2,500 to $2,999 | 0 (0.0%) | 0 (0.0%) |
| $3,000 or more | 0 (0.0%) | 0 (0.0%) |
| Total | 143 (100.0%) | 854 (100.0%) |
Physical Housing Characteristics in Hurstbourne Acres
Housing Structures in Hurstbourne Acres
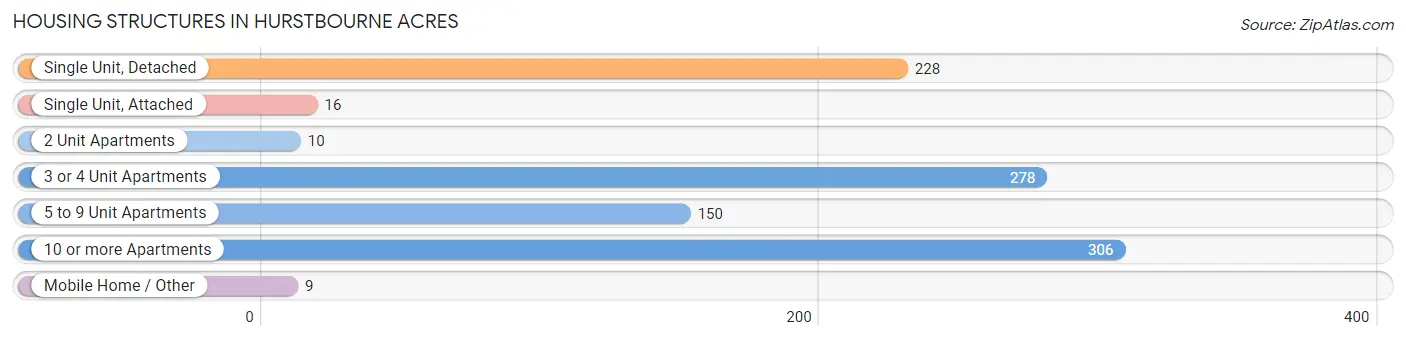
| Structure Type | # Housing Units | % Housing Units |
| Single Unit, Detached | 228 | 22.9% |
| Single Unit, Attached | 16 | 1.6% |
| 2 Unit Apartments | 10 | 1.0% |
| 3 or 4 Unit Apartments | 278 | 27.9% |
| 5 to 9 Unit Apartments | 150 | 15.0% |
| 10 or more Apartments | 306 | 30.7% |
| Mobile Home / Other | 9 | 0.9% |
| Total | 997 | 100.0% |
Housing Structures by Occupancy in Hurstbourne Acres
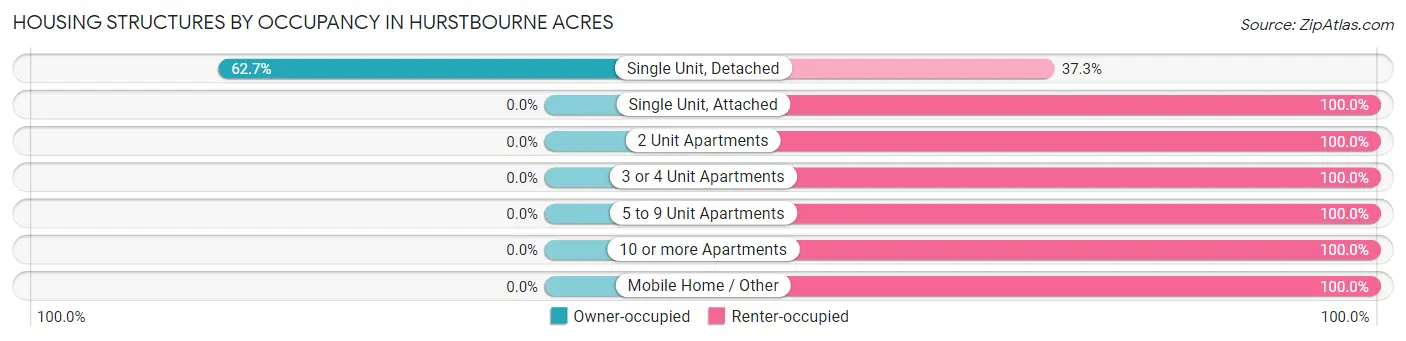
| Structure Type | Owner-occupied | Renter-occupied |
| Single Unit, Detached | 143 (62.7%) | 85 (37.3%) |
| Single Unit, Attached | 0 (0.0%) | 16 (100.0%) |
| 2 Unit Apartments | 0 (0.0%) | 10 (100.0%) |
| 3 or 4 Unit Apartments | 0 (0.0%) | 278 (100.0%) |
| 5 to 9 Unit Apartments | 0 (0.0%) | 150 (100.0%) |
| 10 or more Apartments | 0 (0.0%) | 306 (100.0%) |
| Mobile Home / Other | 0 (0.0%) | 9 (100.0%) |
| Total | 143 (14.3%) | 854 (85.7%) |
Housing Structures by Number of Rooms in Hurstbourne Acres
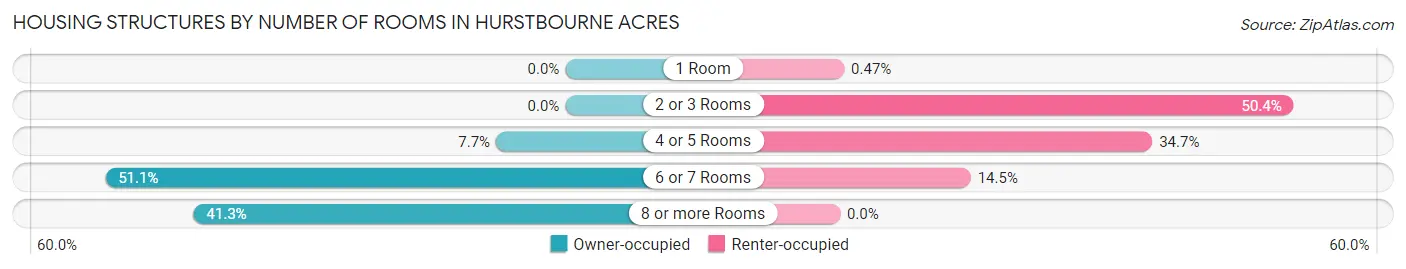
| Number of Rooms | Owner-occupied | Renter-occupied |
| 1 Room | 0 (0.0%) | 4 (0.5%) |
| 2 or 3 Rooms | 0 (0.0%) | 430 (50.3%) |
| 4 or 5 Rooms | 11 (7.7%) | 296 (34.7%) |
| 6 or 7 Rooms | 73 (51.0%) | 124 (14.5%) |
| 8 or more Rooms | 59 (41.3%) | 0 (0.0%) |
| Total | 143 (100.0%) | 854 (100.0%) |
Housing Structure by Heating Type in Hurstbourne Acres
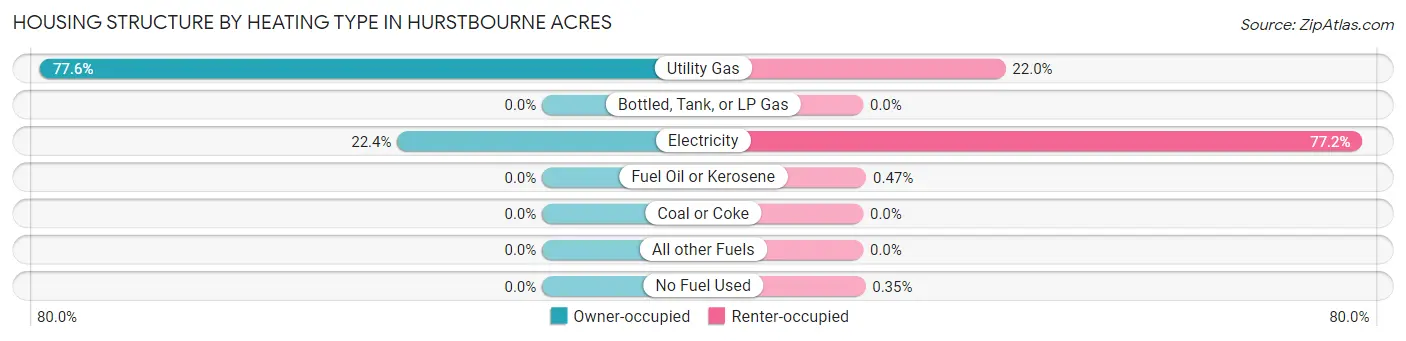
| Heating Type | Owner-occupied | Renter-occupied |
| Utility Gas | 111 (77.6%) | 188 (22.0%) |
| Bottled, Tank, or LP Gas | 0 (0.0%) | 0 (0.0%) |
| Electricity | 32 (22.4%) | 659 (77.2%) |
| Fuel Oil or Kerosene | 0 (0.0%) | 4 (0.5%) |
| Coal or Coke | 0 (0.0%) | 0 (0.0%) |
| All other Fuels | 0 (0.0%) | 0 (0.0%) |
| No Fuel Used | 0 (0.0%) | 3 (0.4%) |
| Total | 143 (100.0%) | 854 (100.0%) |
Household Vehicle Usage in Hurstbourne Acres
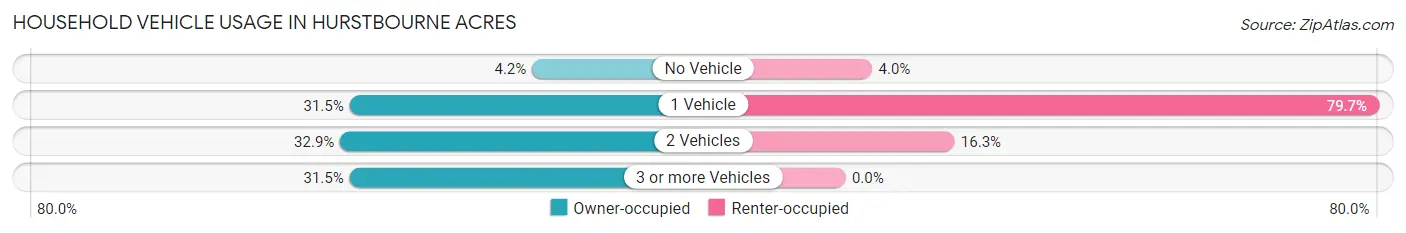
| Vehicles per Household | Owner-occupied | Renter-occupied |
| No Vehicle | 6 (4.2%) | 34 (4.0%) |
| 1 Vehicle | 45 (31.5%) | 681 (79.7%) |
| 2 Vehicles | 47 (32.9%) | 139 (16.3%) |
| 3 or more Vehicles | 45 (31.5%) | 0 (0.0%) |
| Total | 143 (100.0%) | 854 (100.0%) |
Real Estate & Mortgages in Hurstbourne Acres
Real Estate and Mortgage Overview in Hurstbourne Acres
| Characteristic | Without Mortgage | With Mortgage |
| Housing Units | 46 | 97 |
| Median Property Value | $262,500 | $259,700 |
| Median Household Income | $78,333 | $23 |
| Monthly Housing Costs | $637 | $0 |
| Real Estate Taxes | $2,700 | $4 |
Property Value by Mortgage Status in Hurstbourne Acres
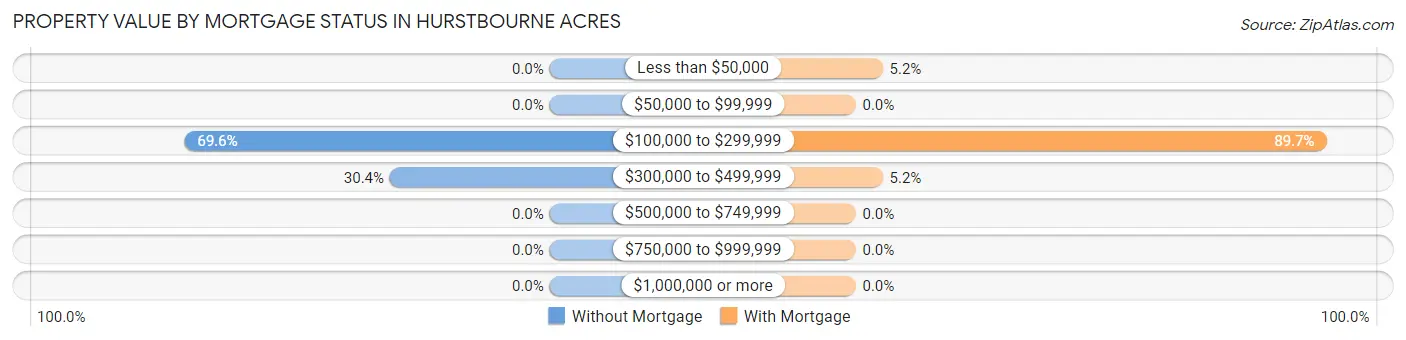
| Property Value | Without Mortgage | With Mortgage |
| Less than $50,000 | 0 (0.0%) | 5 (5.1%) |
| $50,000 to $99,999 | 0 (0.0%) | 0 (0.0%) |
| $100,000 to $299,999 | 32 (69.6%) | 87 (89.7%) |
| $300,000 to $499,999 | 14 (30.4%) | 5 (5.1%) |
| $500,000 to $749,999 | 0 (0.0%) | 0 (0.0%) |
| $750,000 to $999,999 | 0 (0.0%) | 0 (0.0%) |
| $1,000,000 or more | 0 (0.0%) | 0 (0.0%) |
| Total | 46 (100.0%) | 97 (100.0%) |
Household Income by Mortgage Status in Hurstbourne Acres
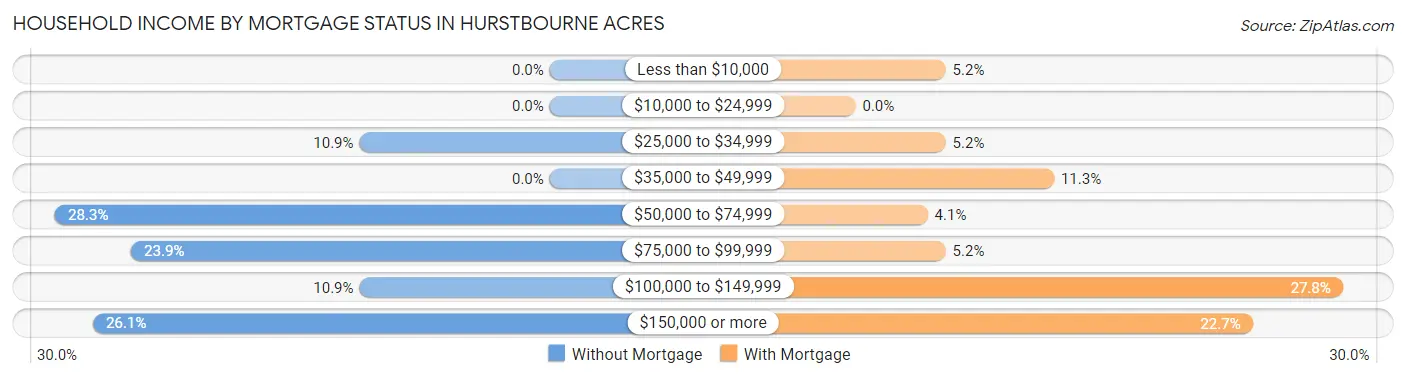
| Household Income | Without Mortgage | With Mortgage |
| Less than $10,000 | 0 (0.0%) | 5 (5.1%) |
| $10,000 to $24,999 | 0 (0.0%) | 0 (0.0%) |
| $25,000 to $34,999 | 5 (10.9%) | 5 (5.1%) |
| $35,000 to $49,999 | 0 (0.0%) | 11 (11.3%) |
| $50,000 to $74,999 | 13 (28.3%) | 4 (4.1%) |
| $75,000 to $99,999 | 11 (23.9%) | 5 (5.1%) |
| $100,000 to $149,999 | 5 (10.9%) | 27 (27.8%) |
| $150,000 or more | 12 (26.1%) | 22 (22.7%) |
| Total | 46 (100.0%) | 97 (100.0%) |
Property Value to Household Income Ratio in Hurstbourne Acres
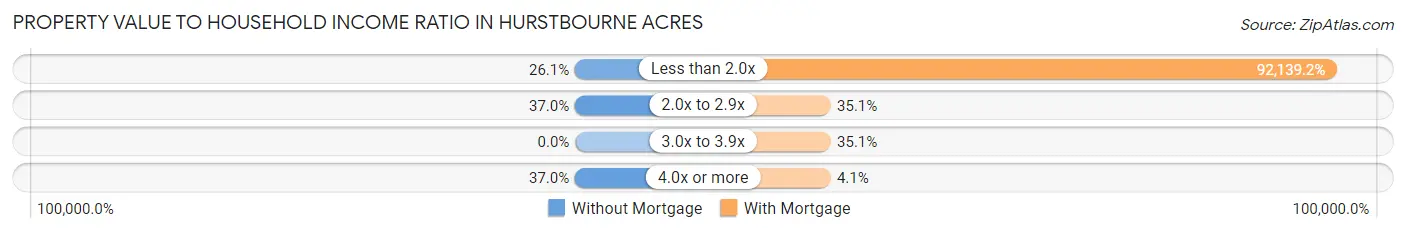
| Value-to-Income Ratio | Without Mortgage | With Mortgage |
| Less than 2.0x | 12 (26.1%) | 89,375 (92,139.2%) |
| 2.0x to 2.9x | 17 (37.0%) | 34 (35.0%) |
| 3.0x to 3.9x | 0 (0.0%) | 34 (35.0%) |
| 4.0x or more | 17 (37.0%) | 4 (4.1%) |
| Total | 46 (100.0%) | 97 (100.0%) |
Real Estate Taxes by Mortgage Status in Hurstbourne Acres
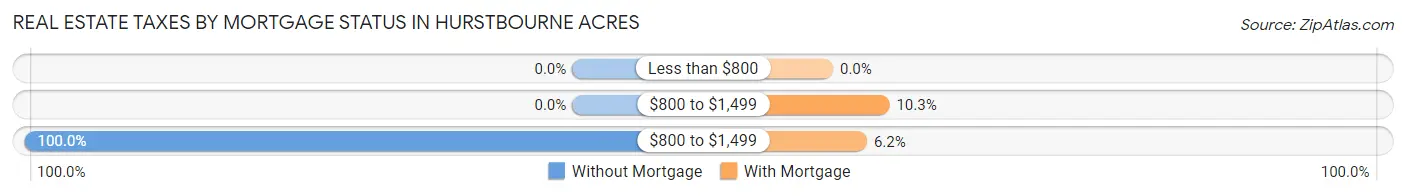
| Property Taxes | Without Mortgage | With Mortgage |
| Less than $800 | 0 (0.0%) | 0 (0.0%) |
| $800 to $1,499 | 0 (0.0%) | 10 (10.3%) |
| $800 to $1,499 | 46 (100.0%) | 6 (6.2%) |
| Total | 46 (100.0%) | 97 (100.0%) |
Health & Disability in Hurstbourne Acres
Health Insurance Coverage by Age in Hurstbourne Acres
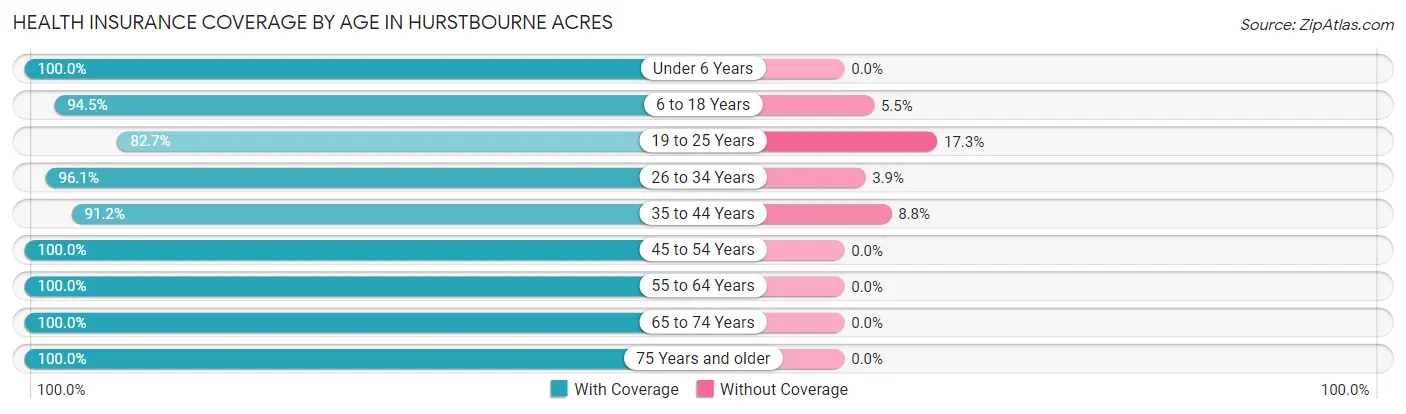
| Age Bracket | With Coverage | Without Coverage |
| Under 6 Years | 204 (100.0%) | 0 (0.0%) |
| 6 to 18 Years | 205 (94.5%) | 12 (5.5%) |
| 19 to 25 Years | 153 (82.7%) | 32 (17.3%) |
| 26 to 34 Years | 664 (96.1%) | 27 (3.9%) |
| 35 to 44 Years | 229 (91.2%) | 22 (8.8%) |
| 45 to 54 Years | 121 (100.0%) | 0 (0.0%) |
| 55 to 64 Years | 107 (100.0%) | 0 (0.0%) |
| 65 to 74 Years | 112 (100.0%) | 0 (0.0%) |
| 75 Years and older | 111 (100.0%) | 0 (0.0%) |
| Total | 1,906 (95.4%) | 93 (4.6%) |
Health Insurance Coverage by Citizenship Status in Hurstbourne Acres
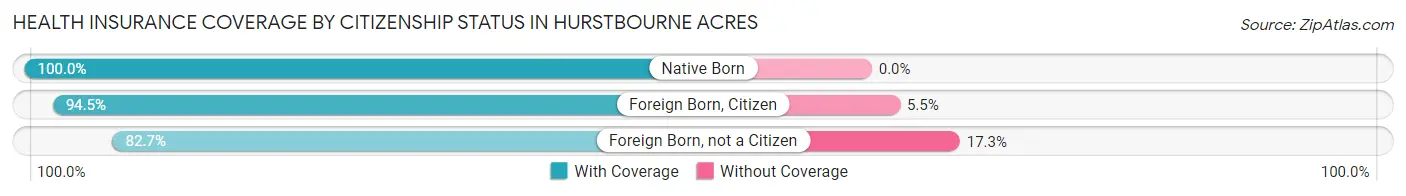
| Citizenship Status | With Coverage | Without Coverage |
| Native Born | 204 (100.0%) | 0 (0.0%) |
| Foreign Born, Citizen | 205 (94.5%) | 12 (5.5%) |
| Foreign Born, not a Citizen | 153 (82.7%) | 32 (17.3%) |
Health Insurance Coverage by Household Income in Hurstbourne Acres
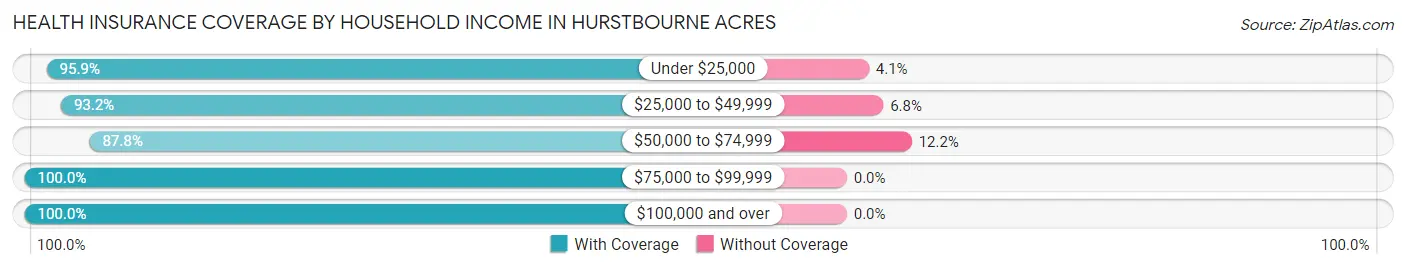
| Household Income | With Coverage | Without Coverage |
| Under $25,000 | 116 (95.9%) | 5 (4.1%) |
| $25,000 to $49,999 | 355 (93.2%) | 26 (6.8%) |
| $50,000 to $74,999 | 448 (87.8%) | 62 (12.2%) |
| $75,000 to $99,999 | 366 (100.0%) | 0 (0.0%) |
| $100,000 and over | 621 (100.0%) | 0 (0.0%) |
Public vs Private Health Insurance Coverage by Age in Hurstbourne Acres
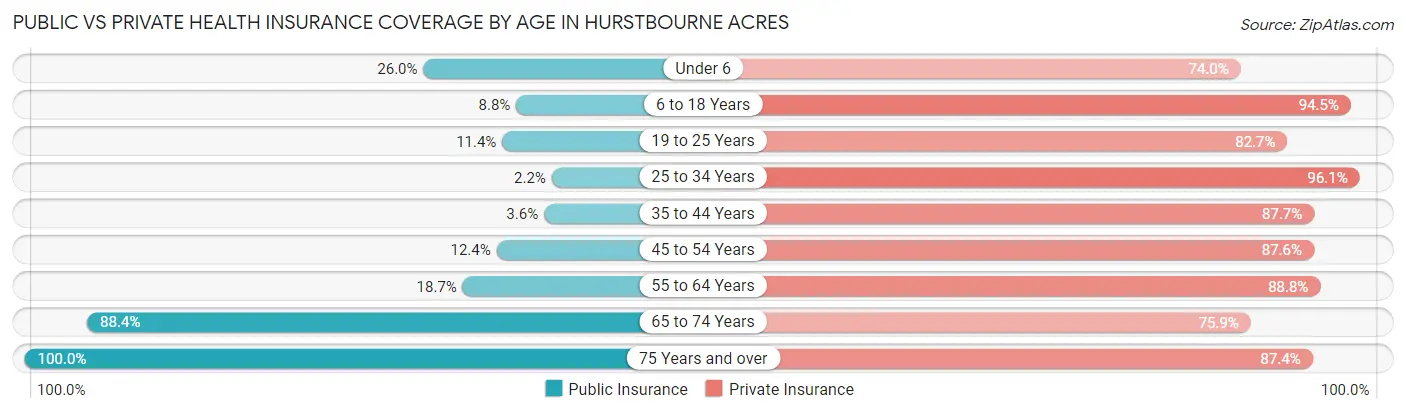
| Age Bracket | Public Insurance | Private Insurance |
| Under 6 | 53 (26.0%) | 151 (74.0%) |
| 6 to 18 Years | 19 (8.8%) | 205 (94.5%) |
| 19 to 25 Years | 21 (11.4%) | 153 (82.7%) |
| 25 to 34 Years | 15 (2.2%) | 664 (96.1%) |
| 35 to 44 Years | 9 (3.6%) | 220 (87.6%) |
| 45 to 54 Years | 15 (12.4%) | 106 (87.6%) |
| 55 to 64 Years | 20 (18.7%) | 95 (88.8%) |
| 65 to 74 Years | 99 (88.4%) | 85 (75.9%) |
| 75 Years and over | 111 (100.0%) | 97 (87.4%) |
| Total | 362 (18.1%) | 1,776 (88.8%) |
Disability Status by Sex by Age in Hurstbourne Acres
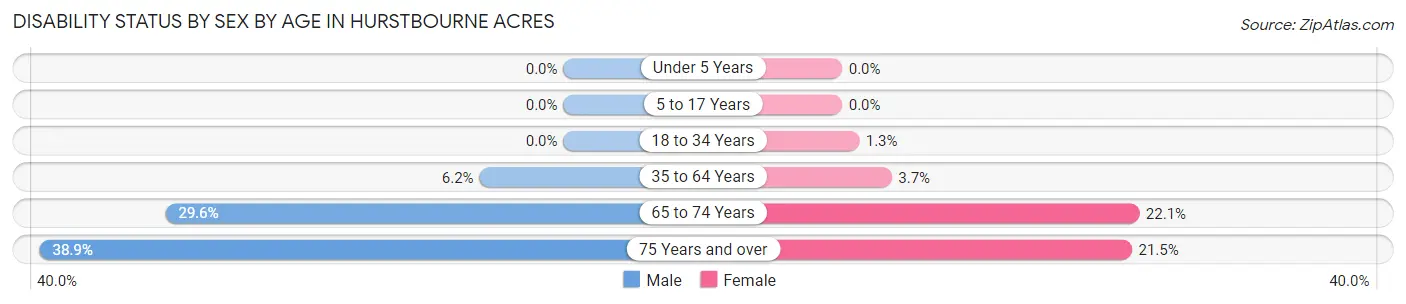
| Age Bracket | Male | Female |
| Under 5 Years | 0 (0.0%) | 0 (0.0%) |
| 5 to 17 Years | 0 (0.0%) | 0 (0.0%) |
| 18 to 34 Years | 0 (0.0%) | 6 (1.3%) |
| 35 to 64 Years | 18 (6.2%) | 7 (3.7%) |
| 65 to 74 Years | 13 (29.5%) | 15 (22.1%) |
| 75 Years and over | 7 (38.9%) | 20 (21.5%) |
Disability Class by Sex by Age in Hurstbourne Acres
Disability Class: Hearing Difficulty
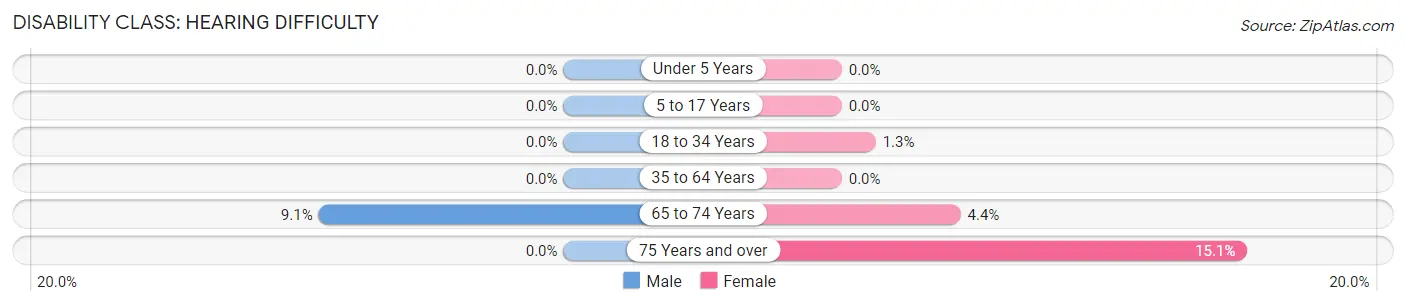
| Age Bracket | Male | Female |
| Under 5 Years | 0 (0.0%) | 0 (0.0%) |
| 5 to 17 Years | 0 (0.0%) | 0 (0.0%) |
| 18 to 34 Years | 0 (0.0%) | 6 (1.3%) |
| 35 to 64 Years | 0 (0.0%) | 0 (0.0%) |
| 65 to 74 Years | 4 (9.1%) | 3 (4.4%) |
| 75 Years and over | 0 (0.0%) | 14 (15.0%) |
Disability Class: Vision Difficulty
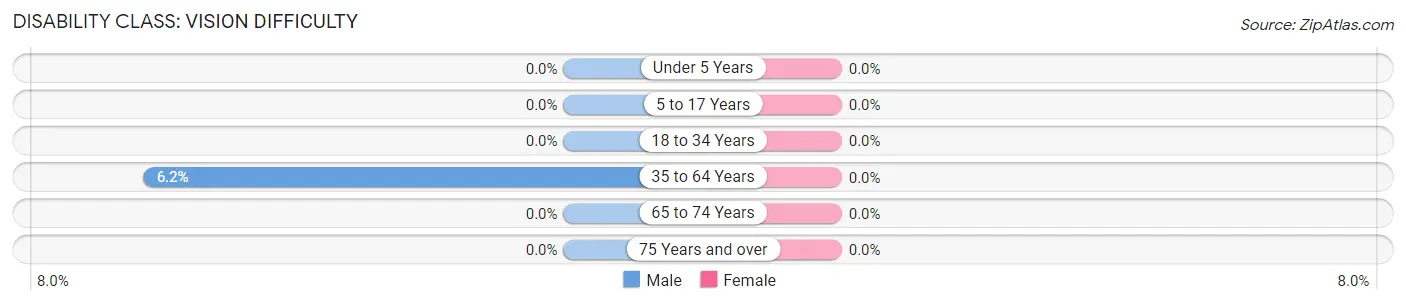
| Age Bracket | Male | Female |
| Under 5 Years | 0 (0.0%) | 0 (0.0%) |
| 5 to 17 Years | 0 (0.0%) | 0 (0.0%) |
| 18 to 34 Years | 0 (0.0%) | 0 (0.0%) |
| 35 to 64 Years | 18 (6.2%) | 0 (0.0%) |
| 65 to 74 Years | 0 (0.0%) | 0 (0.0%) |
| 75 Years and over | 0 (0.0%) | 0 (0.0%) |
Disability Class: Cognitive Difficulty
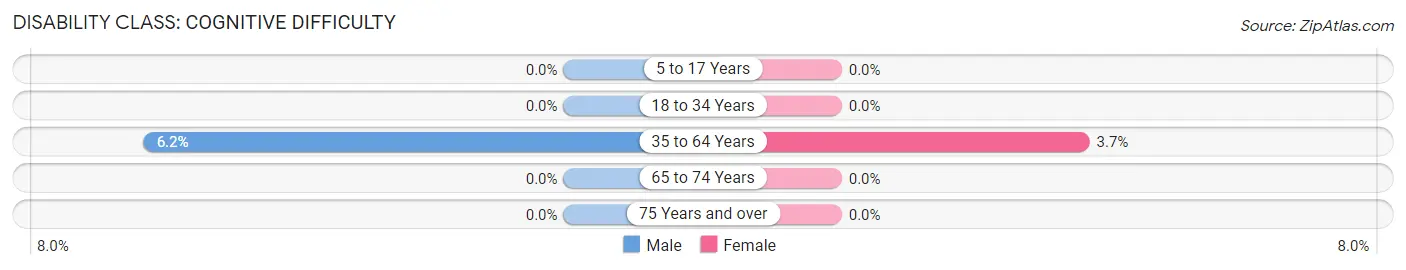
| Age Bracket | Male | Female |
| 5 to 17 Years | 0 (0.0%) | 0 (0.0%) |
| 18 to 34 Years | 0 (0.0%) | 0 (0.0%) |
| 35 to 64 Years | 18 (6.2%) | 7 (3.7%) |
| 65 to 74 Years | 0 (0.0%) | 0 (0.0%) |
| 75 Years and over | 0 (0.0%) | 0 (0.0%) |
Disability Class: Ambulatory Difficulty
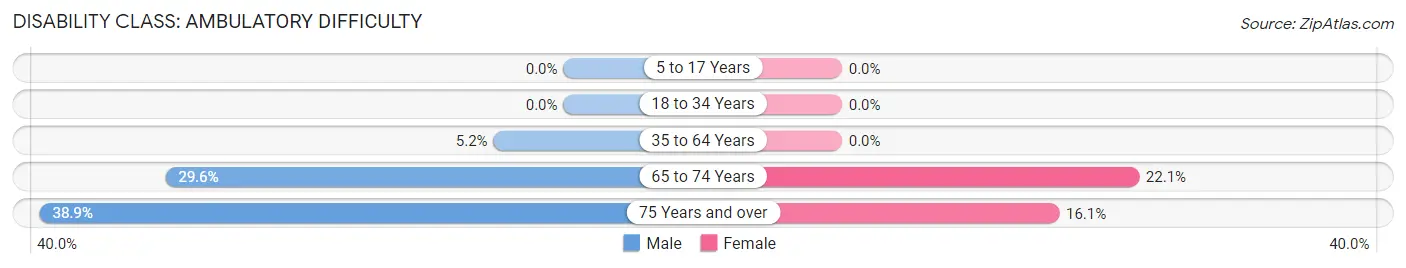
| Age Bracket | Male | Female |
| 5 to 17 Years | 0 (0.0%) | 0 (0.0%) |
| 18 to 34 Years | 0 (0.0%) | 0 (0.0%) |
| 35 to 64 Years | 15 (5.2%) | 0 (0.0%) |
| 65 to 74 Years | 13 (29.5%) | 15 (22.1%) |
| 75 Years and over | 7 (38.9%) | 15 (16.1%) |
Disability Class: Self-Care Difficulty
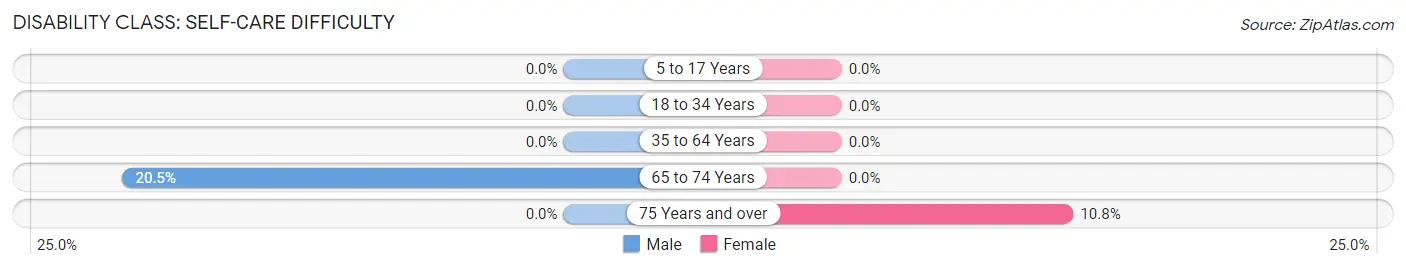
| Age Bracket | Male | Female |
| 5 to 17 Years | 0 (0.0%) | 0 (0.0%) |
| 18 to 34 Years | 0 (0.0%) | 0 (0.0%) |
| 35 to 64 Years | 0 (0.0%) | 0 (0.0%) |
| 65 to 74 Years | 9 (20.4%) | 0 (0.0%) |
| 75 Years and over | 0 (0.0%) | 10 (10.7%) |
Technology Access in Hurstbourne Acres
Computing Device Access in Hurstbourne Acres
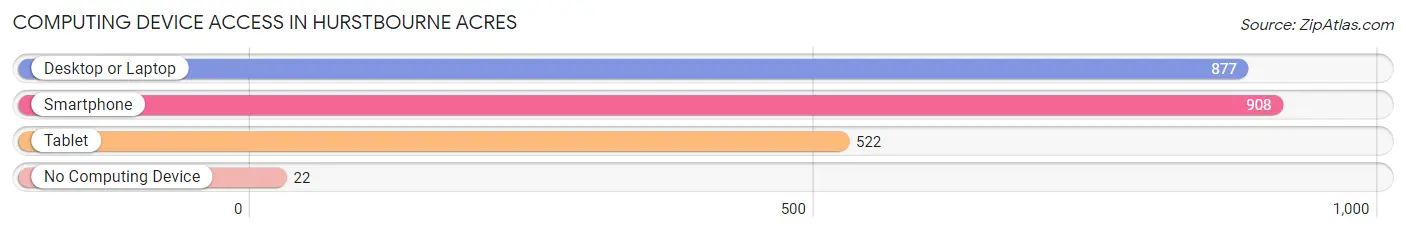
| Device Type | # Households | % Households |
| Desktop or Laptop | 877 | 88.0% |
| Smartphone | 908 | 91.1% |
| Tablet | 522 | 52.4% |
| No Computing Device | 22 | 2.2% |
| Total | 997 | 100.0% |
Internet Access in Hurstbourne Acres
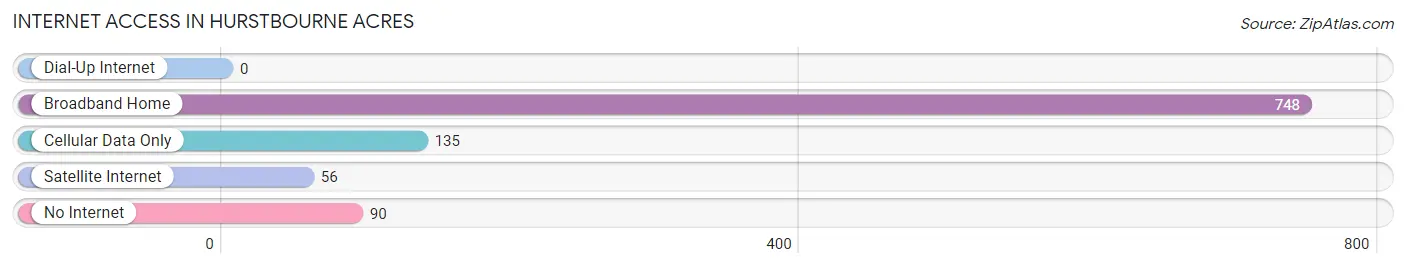
| Internet Type | # Households | % Households |
| Dial-Up Internet | 0 | 0.0% |
| Broadband Home | 748 | 75.0% |
| Cellular Data Only | 135 | 13.5% |
| Satellite Internet | 56 | 5.6% |
| No Internet | 90 | 9.0% |
| Total | 997 | 100.0% |
Hurstbourne Acres Summary
Hurstbourne Acres is a small city located in Jefferson County, Kentucky. It is a suburb of Louisville and is part of the Louisville Metro area. The city has a population of approximately 2,000 people and covers an area of 1.2 square miles.
History
Hurstbourne Acres was founded in the 1950s by the Hurst family. The family purchased the land from the Louisville and Nashville Railroad and developed it into a residential community. The city was incorporated in 1962 and was named after the Hurst family.
Geography
Hurstbourne Acres is located in the eastern part of Jefferson County, Kentucky. It is bordered by the cities of Jeffersontown to the north, St. Matthews to the east, and Lyndon to the south. The city is situated on the Hurstbourne River, which flows through the city and is a tributary of the Ohio River. The city is located in a hilly area and is surrounded by wooded areas.
Economy
Hurstbourne Acres is primarily a residential community, with most of its residents employed in the nearby cities of Louisville and Jeffersontown. The city does not have any major industries or businesses. However, there are several small businesses located in the city, including restaurants, retail stores, and professional services.
Demographics
As of the 2010 census, the population of Hurstbourne Acres was 2,000. The racial makeup of the city was 94.2% White, 2.2% African American, 0.7% Asian, 0.3% Native American, and 2.6% from other races. The median household income was $68,750, and the median family income was $76,250.
Conclusion
Hurstbourne Acres is a small city located in Jefferson County, Kentucky. It is a suburb of Louisville and is part of the Louisville Metro area. The city has a population of approximately 2,000 people and covers an area of 1.2 square miles. The city is primarily a residential community, with most of its residents employed in the nearby cities of Louisville and Jeffersontown. The racial makeup of the city was 94.2% White, 2.2% African American, 0.7% Asian, 0.3% Native American, and 2.6% from other races. The median household income was $68,750, and the median family income was $76,250.
Common Questions
What is Per Capita Income in Hurstbourne Acres?
Per Capita income in Hurstbourne Acres is $34,831.
What is the Median Family Income in Hurstbourne Acres?
Median Family Income in Hurstbourne Acres is $78,125.
What is the Median Household income in Hurstbourne Acres?
Median Household Income in Hurstbourne Acres is $67,645.
What is Income or Wage Gap in Hurstbourne Acres?
Income or Wage Gap in Hurstbourne Acres is 17.0%.
Women in Hurstbourne Acres earn 83.0 cents for every dollar earned by a man.
What is Inequality or Gini Index in Hurstbourne Acres?
Inequality or Gini Index in Hurstbourne Acres is 0.31.
What is the Total Population of Hurstbourne Acres?
Total Population of Hurstbourne Acres is 1,999.
What is the Total Male Population of Hurstbourne Acres?
Total Male Population of Hurstbourne Acres is 948.
What is the Total Female Population of Hurstbourne Acres?
Total Female Population of Hurstbourne Acres is 1,051.
What is the Ratio of Males per 100 Females in Hurstbourne Acres?
There are 90.20 Males per 100 Females in Hurstbourne Acres.
What is the Ratio of Females per 100 Males in Hurstbourne Acres?
There are 110.86 Females per 100 Males in Hurstbourne Acres.
What is the Median Population Age in Hurstbourne Acres?
Median Population Age in Hurstbourne Acres is 29.0 Years.
What is the Average Family Size in Hurstbourne Acres
Average Family Size in Hurstbourne Acres is 3.3 People.
What is the Average Household Size in Hurstbourne Acres
Average Household Size in Hurstbourne Acres is 2.0 People.
How Large is the Labor Force in Hurstbourne Acres?
There are 1,099 People in the Labor Forcein in Hurstbourne Acres.
What is the Percentage of People in the Labor Force in Hurstbourne Acres?
68.1% of People are in the Labor Force in Hurstbourne Acres.
What is the Unemployment Rate in Hurstbourne Acres?
Unemployment Rate in Hurstbourne Acres is 1.5%.