Inverness, CO Map & Demographics
Inverness Map
Inverness Overview
$76,343
PER CAPITA INCOME
$155,221
AVG FAMILY INCOME
$109,339
AVG HOUSEHOLD INCOME
41.1%
WAGE / INCOME GAP [ % ]
58.9¢/ $1
WAGE / INCOME GAP [ $ ]
0.38
INEQUALITY / GINI INDEX
2,772
TOTAL POPULATION
1,624
MALE POPULATION
1,148
FEMALE POPULATION
141.46
MALES / 100 FEMALES
70.69
FEMALES / 100 MALES
32.8
MEDIAN AGE
2.5
AVG FAMILY SIZE
1.6
AVG HOUSEHOLD SIZE
2,223
LABOR FORCE [ PEOPLE ]
90.9%
PERCENT IN LABOR FORCE
3.3%
UNEMPLOYMENT RATE
Income in Inverness
Income Overview in Inverness
Per Capita Income in Inverness is $76,343, while median incomes of families and households are $155,221 and $109,339 respectively.
| Characteristic | Number | Measure |
| Per Capita Income | 2,772 | $76,343 |
| Median Family Income | 589 | $155,221 |
| Mean Family Income | 589 | $177,823 |
| Median Household Income | 1,694 | $109,339 |
| Mean Household Income | 1,694 | $127,969 |
| Income Deficit | 589 | $0 |
| Wage / Income Gap (%) | 2,772 | 41.14% |
| Wage / Income Gap ($) | 2,772 | 58.86¢ per $1 |
| Gini / Inequality Index | 2,772 | 0.38 |
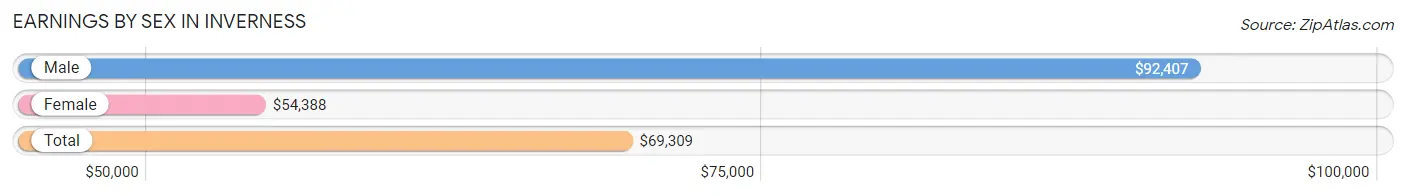
Earnings by Sex in Inverness
Average Earnings in Inverness are $69,309, $92,407 for men and $54,388 for women, a difference of 41.1%.
| Sex | Number | Average Earnings |
| Male | 1,358 (60.6%) | $92,407 |
| Female | 882 (39.4%) | $54,388 |
| Total | 2,240 (100.0%) | $69,309 |
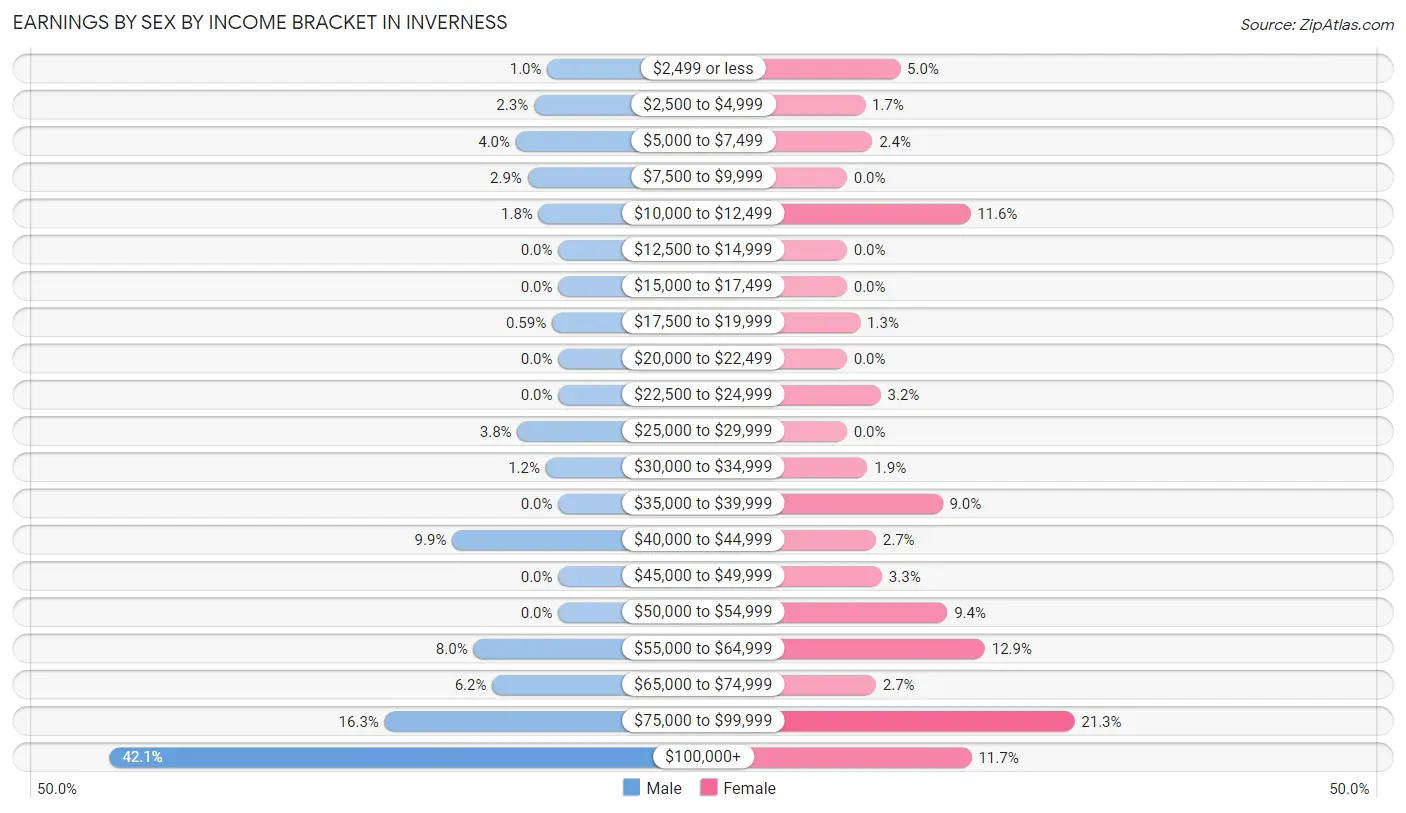
Earnings by Sex by Income Bracket in Inverness
The most common earnings brackets in Inverness are $100,000+ for men (571 | 42.0%) and $75,000 to $99,999 for women (188 | 21.3%).
| Income | Male | Female |
| $2,499 or less | 14 (1.0%) | 44 (5.0%) |
| $2,500 to $4,999 | 31 (2.3%) | 15 (1.7%) |
| $5,000 to $7,499 | 54 (4.0%) | 21 (2.4%) |
| $7,500 to $9,999 | 39 (2.9%) | 0 (0.0%) |
| $10,000 to $12,499 | 25 (1.8%) | 102 (11.6%) |
| $12,500 to $14,999 | 0 (0.0%) | 0 (0.0%) |
| $15,000 to $17,499 | 0 (0.0%) | 0 (0.0%) |
| $17,500 to $19,999 | 8 (0.6%) | 11 (1.3%) |
| $20,000 to $22,499 | 0 (0.0%) | 0 (0.0%) |
| $22,500 to $24,999 | 0 (0.0%) | 28 (3.2%) |
| $25,000 to $29,999 | 52 (3.8%) | 0 (0.0%) |
| $30,000 to $34,999 | 16 (1.2%) | 17 (1.9%) |
| $35,000 to $39,999 | 0 (0.0%) | 79 (9.0%) |
| $40,000 to $44,999 | 135 (9.9%) | 24 (2.7%) |
| $45,000 to $49,999 | 0 (0.0%) | 29 (3.3%) |
| $50,000 to $54,999 | 0 (0.0%) | 83 (9.4%) |
| $55,000 to $64,999 | 108 (8.0%) | 114 (12.9%) |
| $65,000 to $74,999 | 84 (6.2%) | 24 (2.7%) |
| $75,000 to $99,999 | 221 (16.3%) | 188 (21.3%) |
| $100,000+ | 571 (42.0%) | 103 (11.7%) |
| Total | 1,358 (100.0%) | 882 (100.0%) |
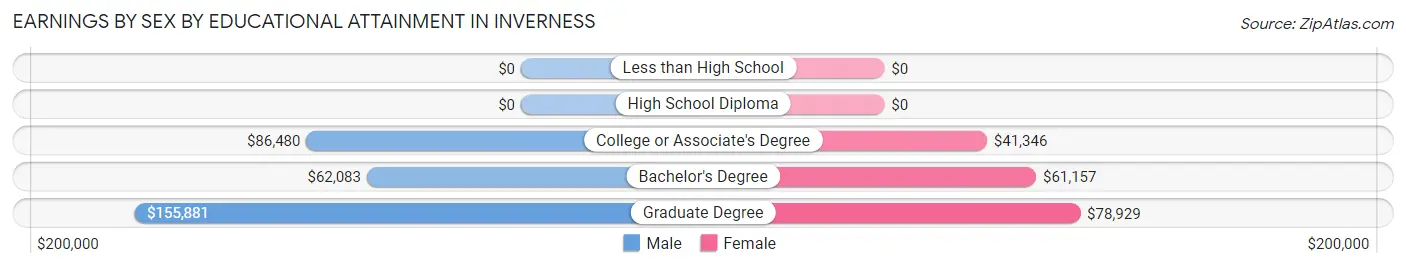
Earnings by Sex by Educational Attainment in Inverness
Average earnings in Inverness are $93,574 for men and $55,833 for women, a difference of 40.3%. Men with an educational attainment of graduate degree enjoy the highest average annual earnings of $155,881, while those with bachelor's degree education earn the least with $62,083. Women with an educational attainment of graduate degree earn the most with the average annual earnings of $78,929, while those with college or associate's degree education have the smallest earnings of $41,346.
| Educational Attainment | Male Income | Female Income |
| Less than High School | - | - |
| High School Diploma | - | - |
| College or Associate's Degree | $86,480 | $41,346 |
| Bachelor's Degree | $62,083 | $61,157 |
| Graduate Degree | $155,881 | $78,929 |
| Total | $93,574 | $55,833 |
Family Income in Inverness
Family Income Brackets in Inverness
According to the Inverness family income data, there are 199 families falling into the $200,000+ income range, which is the most common income bracket and makes up 33.8% of all families.
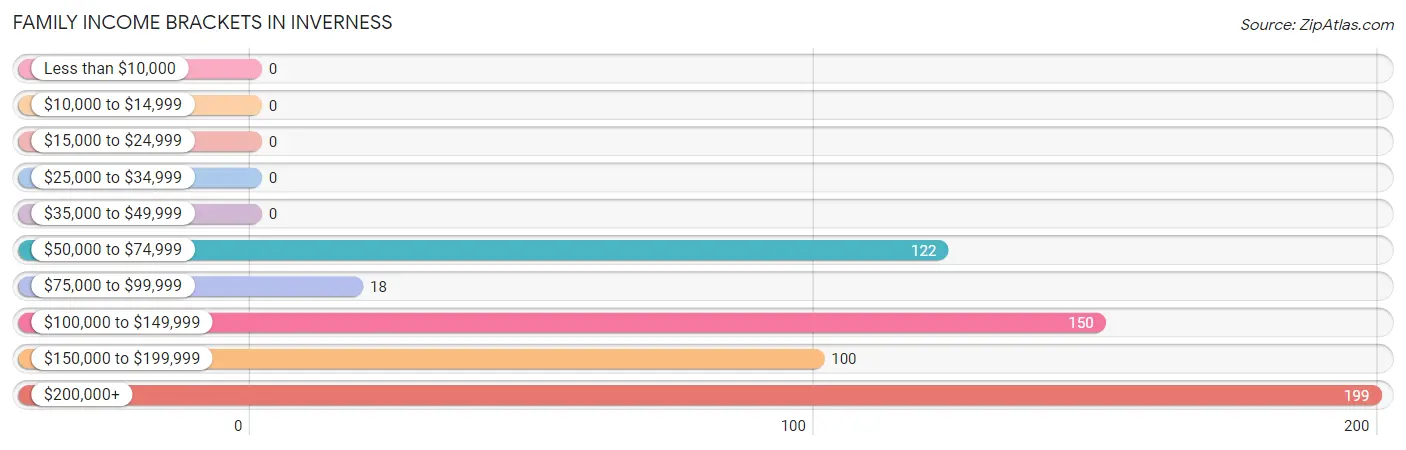
| Income Bracket | # Families | % Families |
| Less than $10,000 | 0 | 0.0% |
| $10,000 to $14,999 | 0 | 0.0% |
| $15,000 to $24,999 | 0 | 0.0% |
| $25,000 to $34,999 | 0 | 0.0% |
| $35,000 to $49,999 | 0 | 0.0% |
| $50,000 to $74,999 | 122 | 20.7% |
| $75,000 to $99,999 | 18 | 3.1% |
| $100,000 to $149,999 | 150 | 25.5% |
| $150,000 to $199,999 | 100 | 17.0% |
| $200,000+ | 199 | 33.8% |
Family Income by Famaliy Size in Inverness
3-person families (32 | 5.4%) account for the highest median family income in Inverness with $250,001 per family, while 3-person families (32 | 5.4%) have the highest median income of $83,334 per family member.
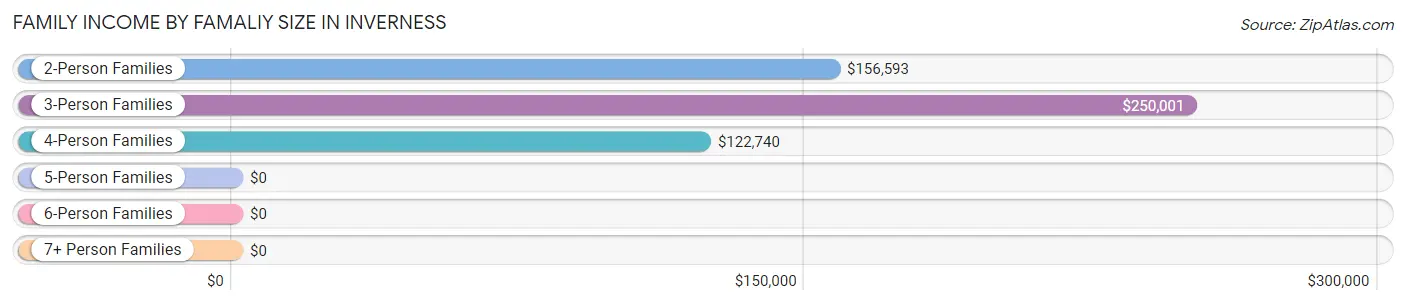
| Income Bracket | # Families | Median Income |
| 2-Person Families | 395 (67.1%) | $156,593 |
| 3-Person Families | 32 (5.4%) | $250,001 |
| 4-Person Families | 139 (23.6%) | $122,740 |
| 5-Person Families | 0 (0.0%) | $0 |
| 6-Person Families | 23 (3.9%) | $0 |
| 7+ Person Families | 0 (0.0%) | $0 |
| Total | 589 (100.0%) | $155,221 |
Family Income by Number of Earners in Inverness
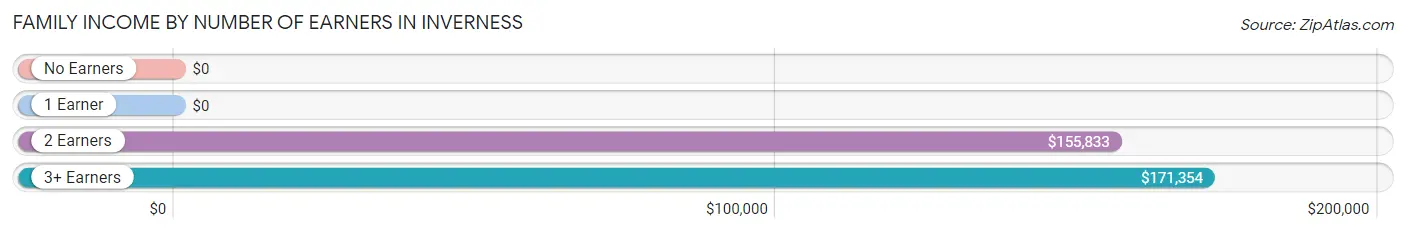
| Number of Earners | # Families | Median Income |
| No Earners | 15 (2.5%) | $0 |
| 1 Earner | 121 (20.5%) | $0 |
| 2 Earners | 396 (67.2%) | $155,833 |
| 3+ Earners | 57 (9.7%) | $171,354 |
| Total | 589 (100.0%) | $155,221 |
Household Income in Inverness
Household Income Brackets in Inverness
With 462 households falling in the category, the $100,000 to $149,999 income range is the most frequent in Inverness, accounting for 27.3% of all households. In contrast, only 19 households (1.1%) fall into the $15,000 to $24,999 income bracket, making it the least populous group.
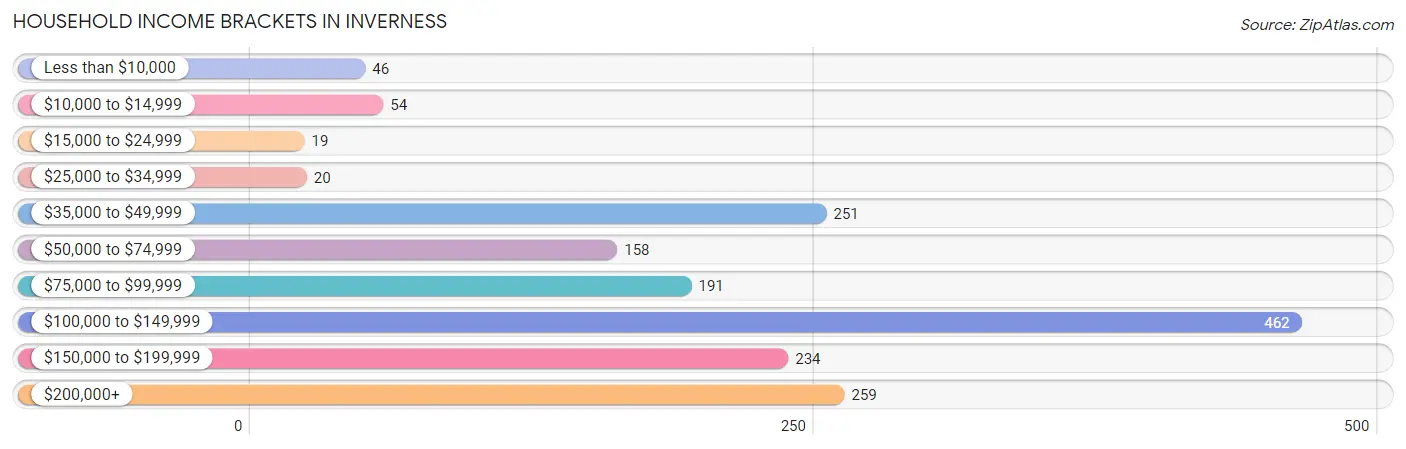
| Income Bracket | # Households | % Households |
| Less than $10,000 | 46 | 2.7% |
| $10,000 to $14,999 | 54 | 3.2% |
| $15,000 to $24,999 | 19 | 1.1% |
| $25,000 to $34,999 | 20 | 1.2% |
| $35,000 to $49,999 | 251 | 14.8% |
| $50,000 to $74,999 | 158 | 9.3% |
| $75,000 to $99,999 | 191 | 11.3% |
| $100,000 to $149,999 | 462 | 27.3% |
| $150,000 to $199,999 | 234 | 13.8% |
| $200,000+ | 259 | 15.3% |
Household Income by Householder Age in Inverness
The median household income in Inverness is $109,339, with the highest median household income of $146,186 found in the 45 to 64 years age bracket for the primary householder. A total of 349 households (20.6%) fall into this category. Meanwhile, the 15 to 24 years age bracket for the primary householder has the lowest median household income of $0, with 96 households (5.7%) in this group.
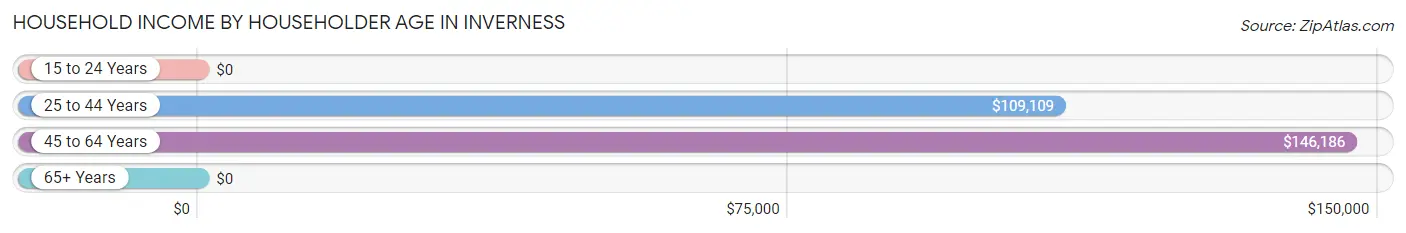
| Income Bracket | # Households | Median Income |
| 15 to 24 Years | 96 (5.7%) | $0 |
| 25 to 44 Years | 1,106 (65.3%) | $109,109 |
| 45 to 64 Years | 349 (20.6%) | $146,186 |
| 65+ Years | 143 (8.4%) | $0 |
| Total | 1,694 (100.0%) | $109,339 |
Poverty in Inverness
Income Below Poverty by Sex and Age in Inverness
With 4.1% poverty level for males and 5.0% for females among the residents of Inverness, 18 to 24 year old males and 18 to 24 year old females are the most vulnerable to poverty, with 31 males (26.5%) and 13 females (34.2%) in their respective age groups living below the poverty level.
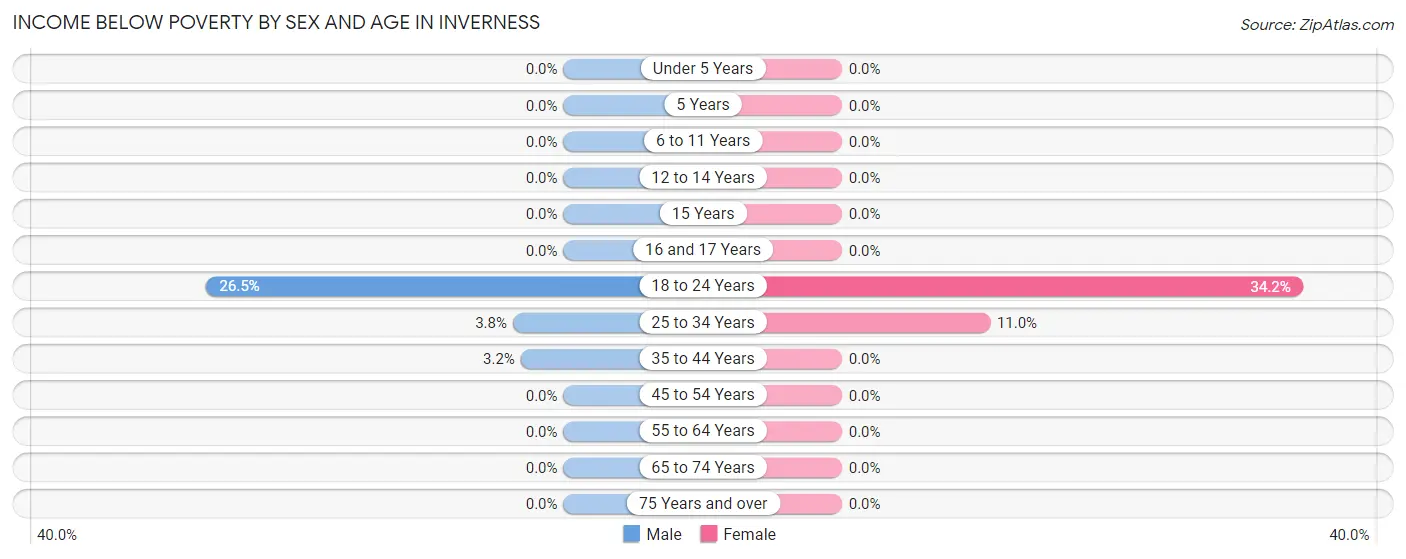
| Age Bracket | Male | Female |
| Under 5 Years | 0 (0.0%) | 0 (0.0%) |
| 5 Years | 0 (0.0%) | 0 (0.0%) |
| 6 to 11 Years | 0 (0.0%) | 0 (0.0%) |
| 12 to 14 Years | 0 (0.0%) | 0 (0.0%) |
| 15 Years | 0 (0.0%) | 0 (0.0%) |
| 16 and 17 Years | 0 (0.0%) | 0 (0.0%) |
| 18 to 24 Years | 31 (26.5%) | 13 (34.2%) |
| 25 to 34 Years | 25 (3.7%) | 44 (11.0%) |
| 35 to 44 Years | 10 (3.2%) | 0 (0.0%) |
| 45 to 54 Years | 0 (0.0%) | 0 (0.0%) |
| 55 to 64 Years | 0 (0.0%) | 0 (0.0%) |
| 65 to 74 Years | 0 (0.0%) | 0 (0.0%) |
| 75 Years and over | 0 (0.0%) | 0 (0.0%) |
| Total | 66 (4.1%) | 57 (5.0%) |
Income Above Poverty by Sex and Age in Inverness
According to the poverty statistics in Inverness, males aged under 5 years and females aged under 5 years are the age groups that are most secure financially, with 100.0% of males and 100.0% of females in these age groups living above the poverty line.
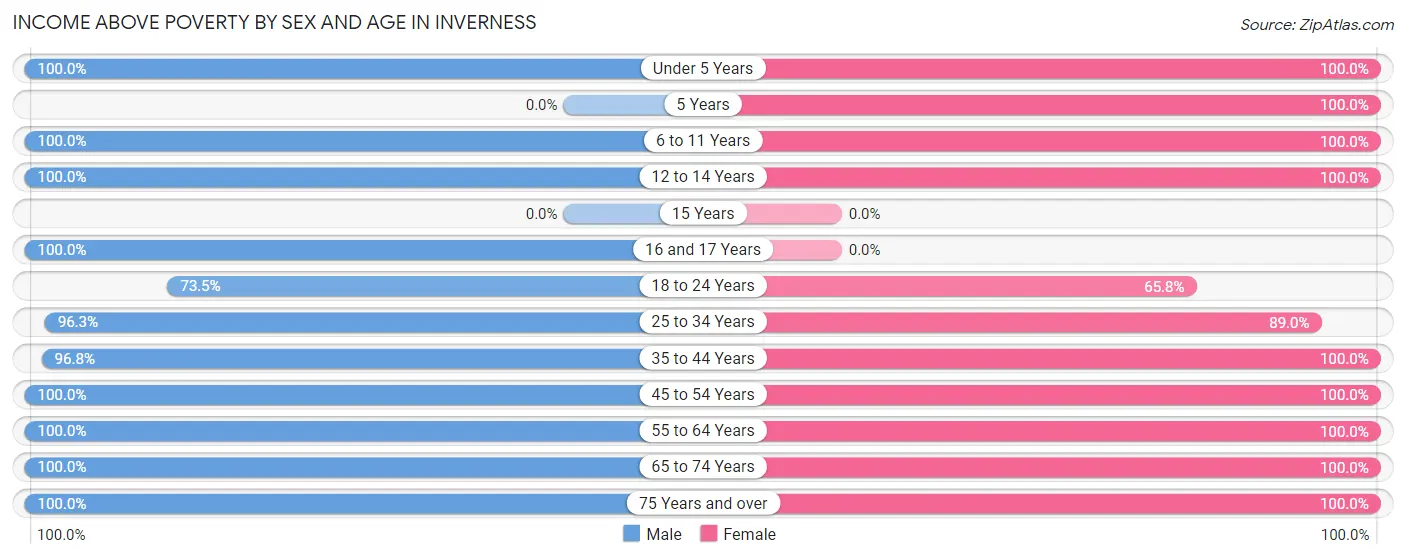
| Age Bracket | Male | Female |
| Under 5 Years | 72 (100.0%) | 58 (100.0%) |
| 5 Years | 0 (0.0%) | 16 (100.0%) |
| 6 to 11 Years | 112 (100.0%) | 14 (100.0%) |
| 12 to 14 Years | 44 (100.0%) | 10 (100.0%) |
| 15 Years | 0 (0.0%) | 0 (0.0%) |
| 16 and 17 Years | 3 (100.0%) | 0 (0.0%) |
| 18 to 24 Years | 86 (73.5%) | 25 (65.8%) |
| 25 to 34 Years | 642 (96.3%) | 356 (89.0%) |
| 35 to 44 Years | 305 (96.8%) | 195 (100.0%) |
| 45 to 54 Years | 72 (100.0%) | 94 (100.0%) |
| 55 to 64 Years | 144 (100.0%) | 197 (100.0%) |
| 65 to 74 Years | 61 (100.0%) | 75 (100.0%) |
| 75 Years and over | 17 (100.0%) | 51 (100.0%) |
| Total | 1,558 (95.9%) | 1,091 (95.0%) |
Income Below Poverty Among Married-Couple Families in Inverness
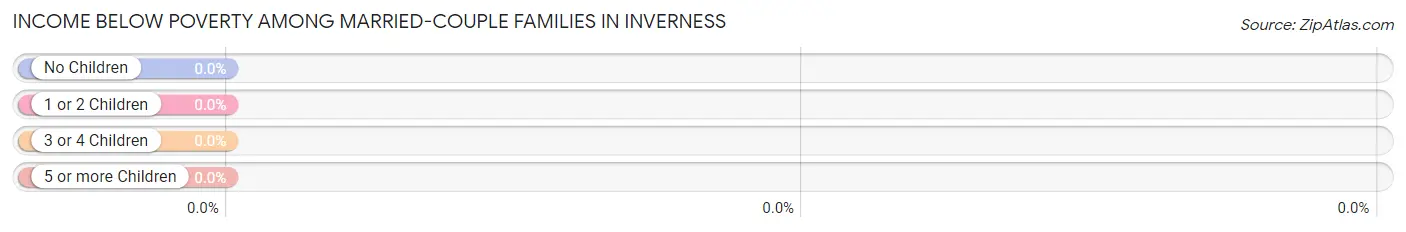
| Children | Above Poverty | Below Poverty |
| No Children | 335 (100.0%) | 0 (0.0%) |
| 1 or 2 Children | 184 (100.0%) | 0 (0.0%) |
| 3 or 4 Children | 0 (0.0%) | 0 (0.0%) |
| 5 or more Children | 0 (0.0%) | 0 (0.0%) |
| Total | 519 (100.0%) | 0 (0.0%) |
Income Below Poverty Among Single-Parent Households in Inverness
| Children | Single Father | Single Mother |
| No Children | 0 (0.0%) | 0 (0.0%) |
| 1 or 2 Children | 0 (0.0%) | 0 (0.0%) |
| 3 or 4 Children | 0 (0.0%) | 0 (0.0%) |
| 5 or more Children | 0 (0.0%) | 0 (0.0%) |
| Total | 0 (0.0%) | 0 (0.0%) |
Income Below Poverty Among Married-Couple vs Single-Parent Households in Inverness
| Children | Married-Couple Families | Single-Parent Households |
| No Children | 0 (0.0%) | 0 (0.0%) |
| 1 or 2 Children | 0 (0.0%) | 0 (0.0%) |
| 3 or 4 Children | 0 (0.0%) | 0 (0.0%) |
| 5 or more Children | 0 (0.0%) | 0 (0.0%) |
| Total | 0 (0.0%) | 0 (0.0%) |
Race in Inverness
The most populous races in Inverness are White / Caucasian (1,693 | 61.1%), Asian (555 | 20.0%), and Hispanic or Latino (237 | 8.6%).
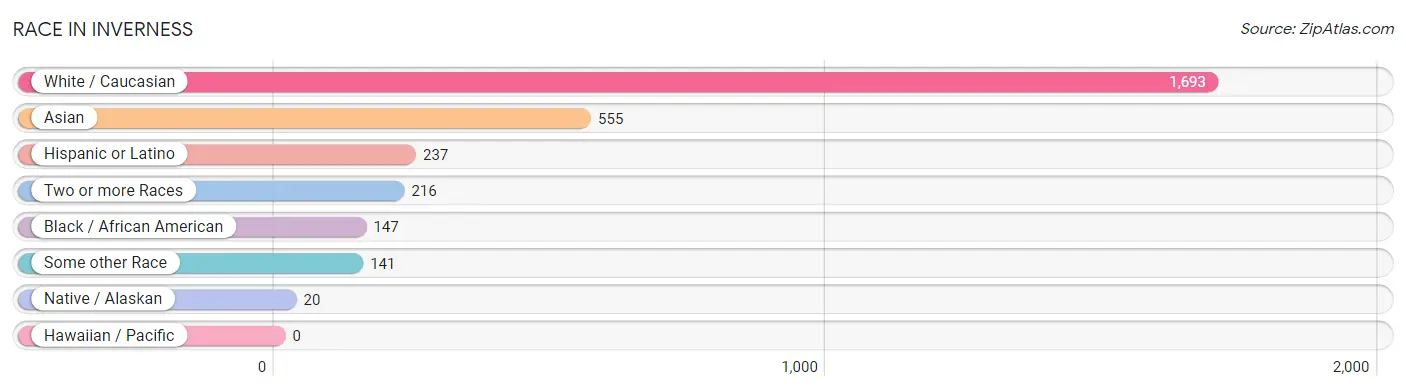
| Race | # Population | % Population |
| Asian | 555 | 20.0% |
| Black / African American | 147 | 5.3% |
| Hawaiian / Pacific | 0 | 0.0% |
| Hispanic or Latino | 237 | 8.6% |
| Native / Alaskan | 20 | 0.7% |
| White / Caucasian | 1,693 | 61.1% |
| Two or more Races | 216 | 7.8% |
| Some other Race | 141 | 5.1% |
| Total | 2,772 | 100.0% |
Ancestry in Inverness
The most populous ancestries reported in Inverness are German (481 | 17.3%), Thai (470 | 17.0%), English (263 | 9.5%), Irish (255 | 9.2%), and Mexican (169 | 6.1%), together accounting for 59.1% of all Inverness residents.
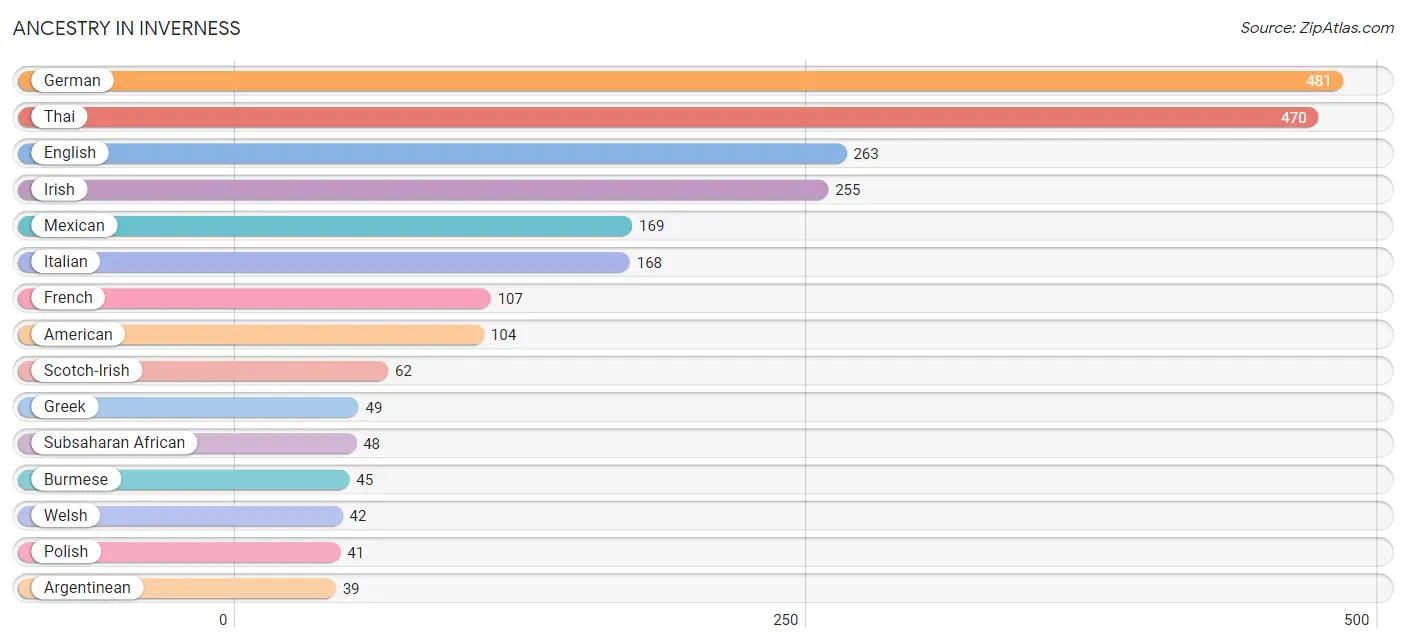
| Ancestry | # Population | % Population |
| African | 12 | 0.4% |
| American | 104 | 3.7% |
| Argentinean | 39 | 1.4% |
| Austrian | 19 | 0.7% |
| Belgian | 13 | 0.5% |
| Bhutanese | 14 | 0.5% |
| British | 28 | 1.0% |
| Burmese | 45 | 1.6% |
| Canadian | 14 | 0.5% |
| Choctaw | 20 | 0.7% |
| Croatian | 14 | 0.5% |
| Danish | 33 | 1.2% |
| Dutch | 38 | 1.4% |
| English | 263 | 9.5% |
| European | 34 | 1.2% |
| French | 107 | 3.9% |
| French Canadian | 11 | 0.4% |
| German | 481 | 17.3% |
| Ghanaian | 36 | 1.3% |
| Greek | 49 | 1.8% |
| Irish | 255 | 9.2% |
| Italian | 168 | 6.1% |
| Latvian | 17 | 0.6% |
| Malaysian | 13 | 0.5% |
| Mexican | 169 | 6.1% |
| Norwegian | 20 | 0.7% |
| Pakistani | 13 | 0.5% |
| Polish | 41 | 1.5% |
| Portuguese | 19 | 0.7% |
| Puerto Rican | 29 | 1.1% |
| Scotch-Irish | 62 | 2.2% |
| Serbian | 27 | 1.0% |
| Slavic | 17 | 0.6% |
| South American | 39 | 1.4% |
| Subsaharan African | 48 | 1.7% |
| Swedish | 38 | 1.4% |
| Thai | 470 | 17.0% |
| Welsh | 42 | 1.5% | View All 38 Rows |
Immigrants in Inverness
The most numerous immigrant groups reported in Inverness came from Asia (503 | 18.1%), India (431 | 15.5%), South Central Asia (431 | 15.5%), Latin America (83 | 3.0%), and Eastern Asia (59 | 2.1%), together accounting for 54.4% of all Inverness residents.
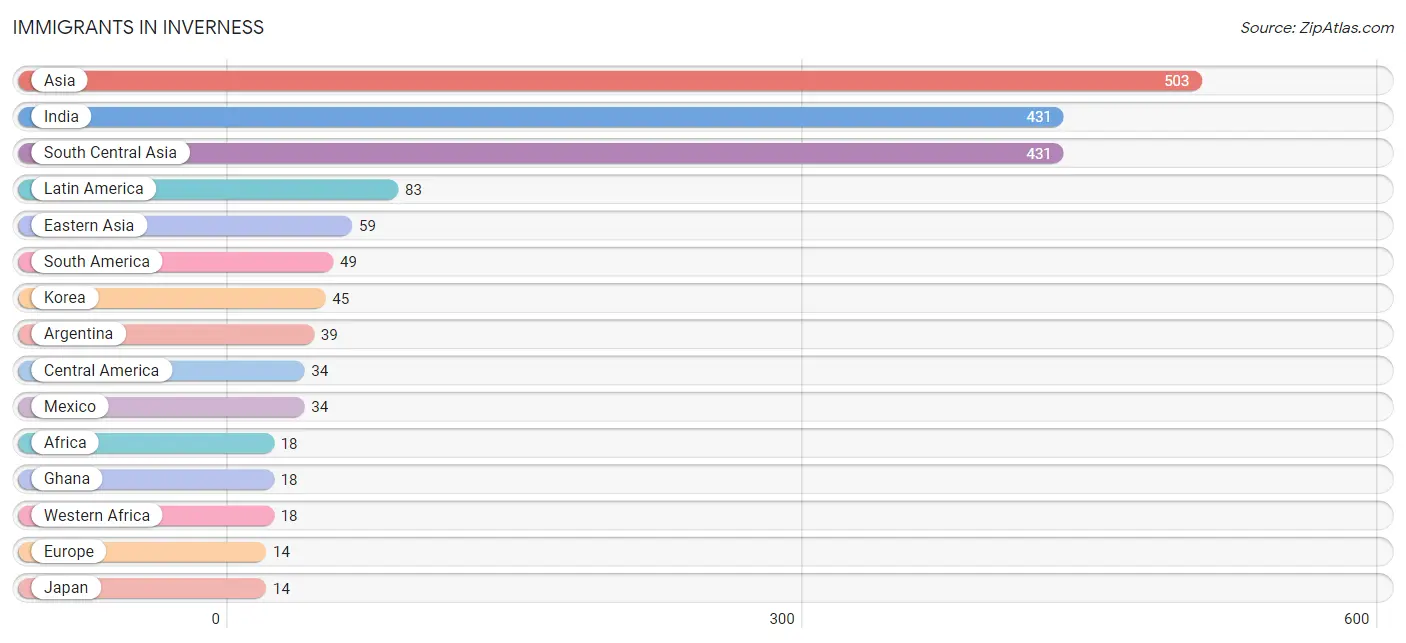
| Immigration Origin | # Population | % Population |
| Africa | 18 | 0.6% |
| Argentina | 39 | 1.4% |
| Asia | 503 | 18.1% |
| Central America | 34 | 1.2% |
| Eastern Asia | 59 | 2.1% |
| Europe | 14 | 0.5% |
| Ghana | 18 | 0.6% |
| Guyana | 10 | 0.4% |
| India | 431 | 15.5% |
| Japan | 14 | 0.5% |
| Korea | 45 | 1.6% |
| Laos | 13 | 0.5% |
| Latin America | 83 | 3.0% |
| Mexico | 34 | 1.2% |
| Northern Europe | 14 | 0.5% |
| South America | 49 | 1.8% |
| South Central Asia | 431 | 15.5% |
| South Eastern Asia | 13 | 0.5% |
| Western Africa | 18 | 0.6% | View All 19 Rows |
Sex and Age in Inverness
Sex and Age in Inverness
The most populous age groups in Inverness are 25 to 29 Years (388 | 23.9%) for men and 25 to 29 Years (274 | 23.9%) for women.
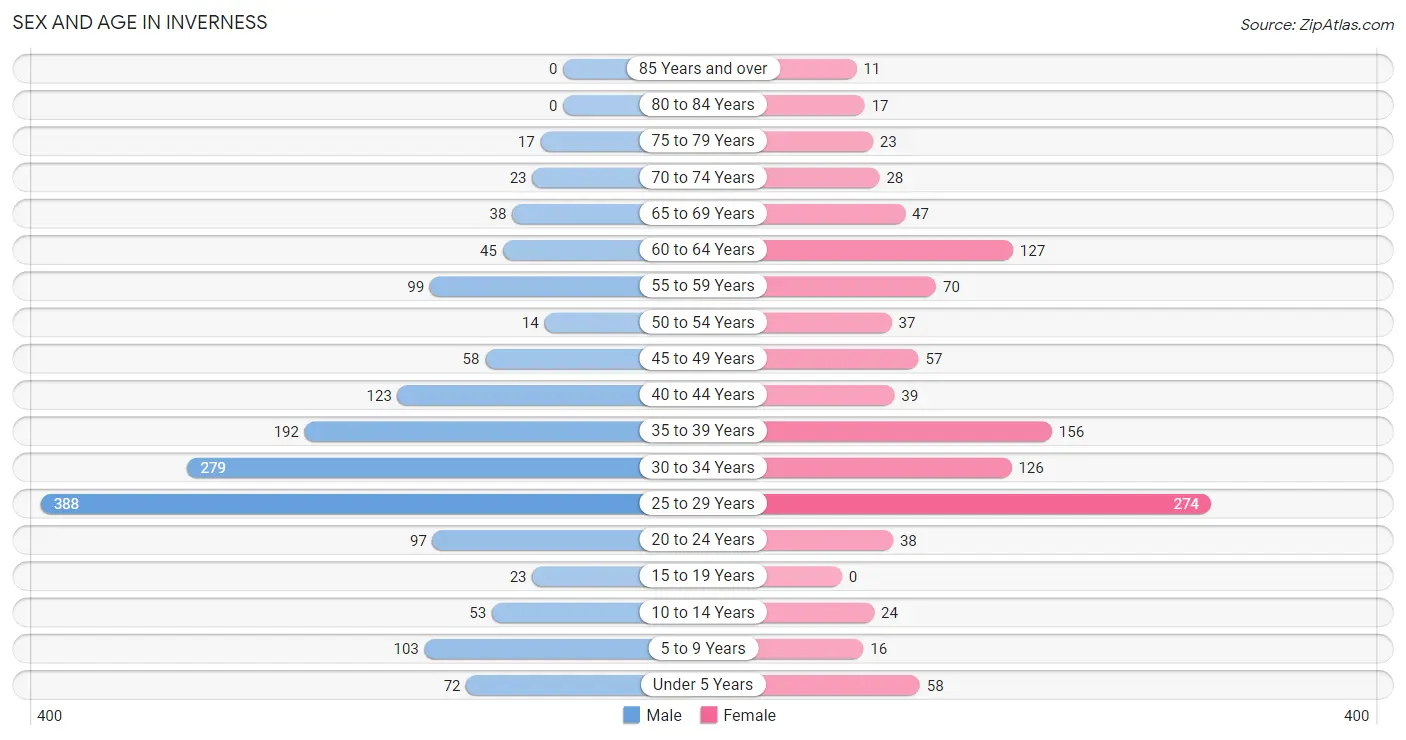
| Age Bracket | Male | Female |
| Under 5 Years | 72 (4.4%) | 58 (5.1%) |
| 5 to 9 Years | 103 (6.3%) | 16 (1.4%) |
| 10 to 14 Years | 53 (3.3%) | 24 (2.1%) |
| 15 to 19 Years | 23 (1.4%) | 0 (0.0%) |
| 20 to 24 Years | 97 (6.0%) | 38 (3.3%) |
| 25 to 29 Years | 388 (23.9%) | 274 (23.9%) |
| 30 to 34 Years | 279 (17.2%) | 126 (11.0%) |
| 35 to 39 Years | 192 (11.8%) | 156 (13.6%) |
| 40 to 44 Years | 123 (7.6%) | 39 (3.4%) |
| 45 to 49 Years | 58 (3.6%) | 57 (5.0%) |
| 50 to 54 Years | 14 (0.9%) | 37 (3.2%) |
| 55 to 59 Years | 99 (6.1%) | 70 (6.1%) |
| 60 to 64 Years | 45 (2.8%) | 127 (11.1%) |
| 65 to 69 Years | 38 (2.3%) | 47 (4.1%) |
| 70 to 74 Years | 23 (1.4%) | 28 (2.4%) |
| 75 to 79 Years | 17 (1.1%) | 23 (2.0%) |
| 80 to 84 Years | 0 (0.0%) | 17 (1.5%) |
| 85 Years and over | 0 (0.0%) | 11 (1.0%) |
| Total | 1,624 (100.0%) | 1,148 (100.0%) |
Families and Households in Inverness
Median Family Size in Inverness
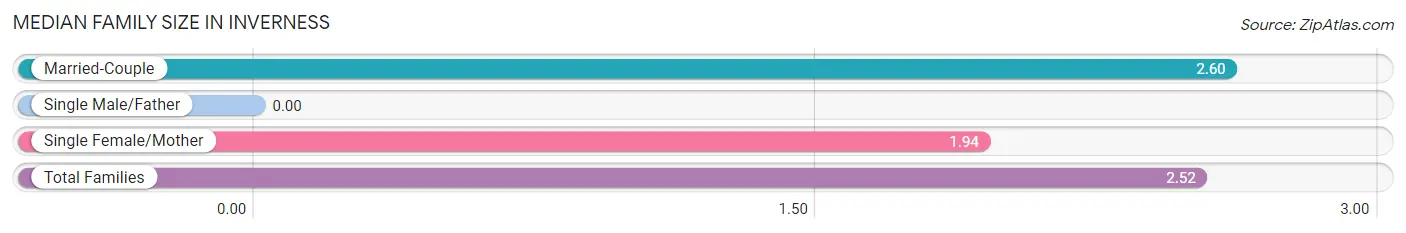
| Family Type | # Families | Family Size |
| Married-Couple | 519 (88.1%) | 2.60 |
| Single Male/Father | 0 (0.0%) | - |
| Single Female/Mother | 70 (11.9%) | 1.94 |
| Total Families | 589 (100.0%) | 2.52 |
Median Household Size in Inverness
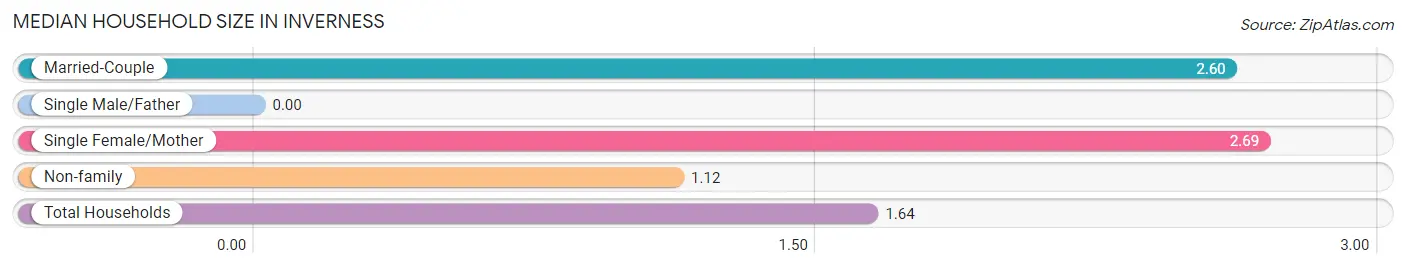
| Household Type | # Households | Household Size |
| Married-Couple | 519 (30.6%) | 2.60 |
| Single Male/Father | 0 (0.0%) | - |
| Single Female/Mother | 70 (4.1%) | 2.69 |
| Non-family | 1,105 (65.2%) | 1.12 |
| Total Households | 1,694 (100.0%) | 1.64 |
Household Size by Marriage Status in Inverness
Out of a total of 1,694 households in Inverness, 589 (34.8%) are family households, while 1,105 (65.2%) are nonfamily households. The most numerous type of family households are 2-person households, comprising 341, and the most common type of nonfamily households are 1-person households, comprising 981.
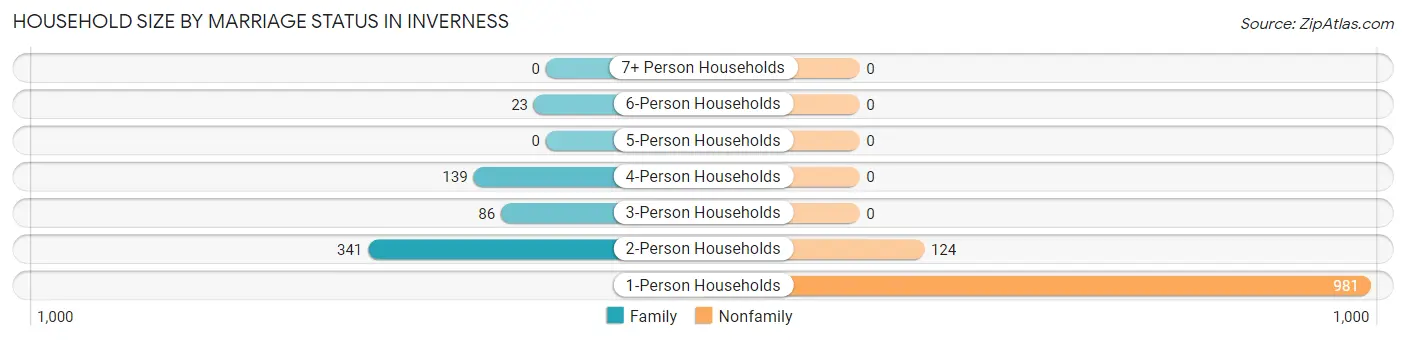
| Household Size | Family Households | Nonfamily Households |
| 1-Person Households | - | 981 (57.9%) |
| 2-Person Households | 341 (20.1%) | 124 (7.3%) |
| 3-Person Households | 86 (5.1%) | 0 (0.0%) |
| 4-Person Households | 139 (8.2%) | 0 (0.0%) |
| 5-Person Households | 0 (0.0%) | 0 (0.0%) |
| 6-Person Households | 23 (1.4%) | 0 (0.0%) |
| 7+ Person Households | 0 (0.0%) | 0 (0.0%) |
| Total | 589 (34.8%) | 1,105 (65.2%) |
Female Fertility in Inverness
Fertility by Age in Inverness
Average fertility rate in Inverness is 81.0 births per 1,000 women. Women in the age bracket of 35 to 50 years have the highest fertility rate with 142.0 births per 1,000 women. Women in the age bracket of 35 to 50 years acount for 69.5% of all women with births.
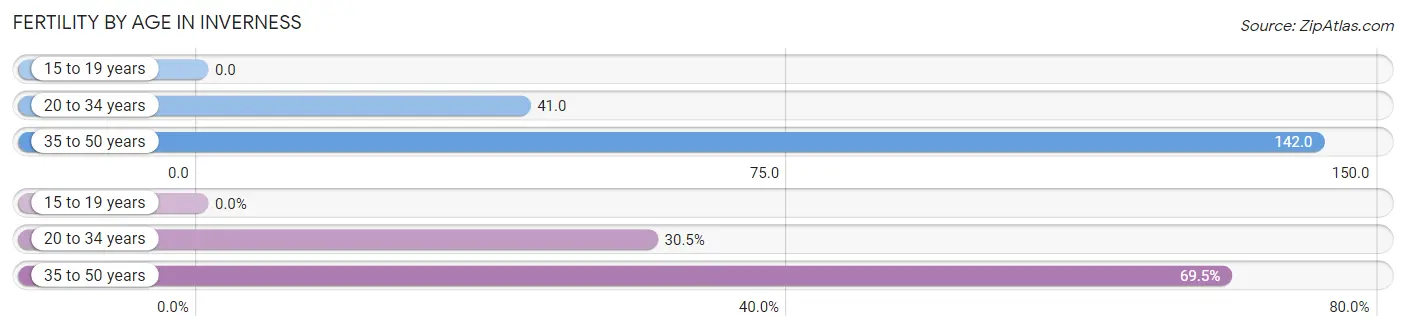
| Age Bracket | Women with Births | Births / 1,000 Women |
| 15 to 19 years | 0 (0.0%) | 0.0 |
| 20 to 34 years | 18 (30.5%) | 41.0 |
| 35 to 50 years | 41 (69.5%) | 142.0 |
| Total | 59 (100.0%) | 81.0 |
Fertility by Age by Marriage Status in Inverness
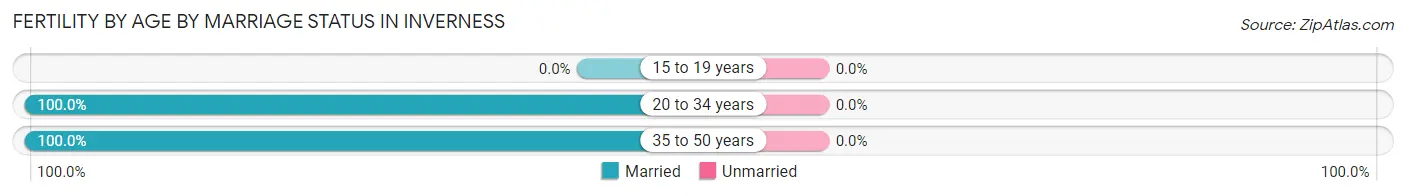
| Age Bracket | Married | Unmarried |
| 15 to 19 years | 0 (0.0%) | 0 (0.0%) |
| 20 to 34 years | 18 (100.0%) | 0 (0.0%) |
| 35 to 50 years | 41 (100.0%) | 0 (0.0%) |
| Total | 59 (100.0%) | 0 (0.0%) |
Fertility by Education in Inverness
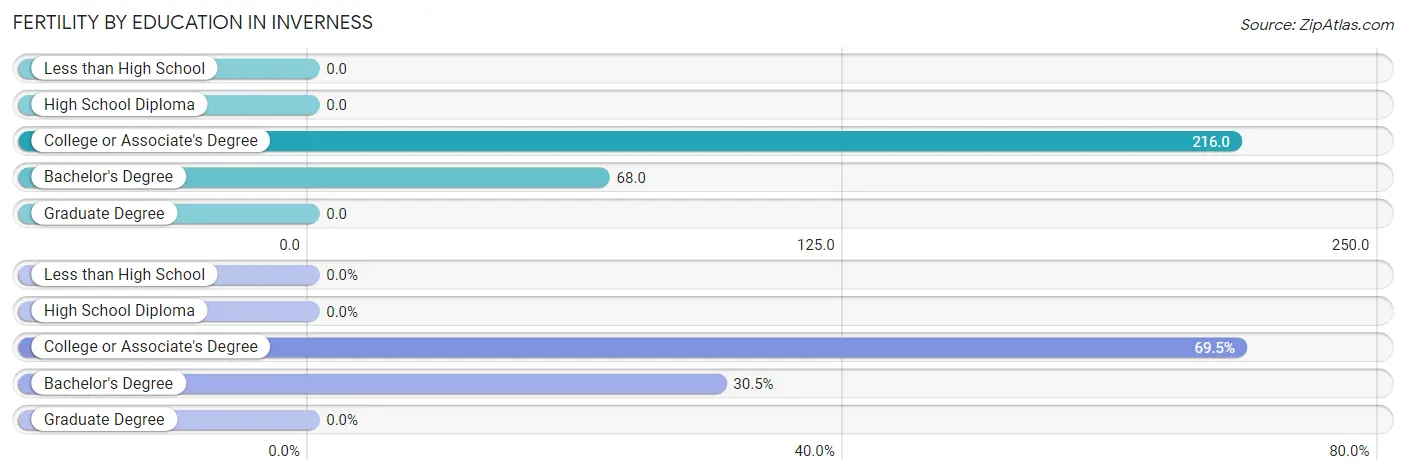
| Educational Attainment | Women with Births | Births / 1,000 Women |
| Less than High School | 0 (0.0%) | 0.0 |
| High School Diploma | 0 (0.0%) | 0.0 |
| College or Associate's Degree | 41 (69.5%) | 216.0 |
| Bachelor's Degree | 18 (30.5%) | 68.0 |
| Graduate Degree | 0 (0.0%) | 0.0 |
| Total | 59 (100.0%) | 81.0 |
Fertility by Education by Marriage Status in Inverness
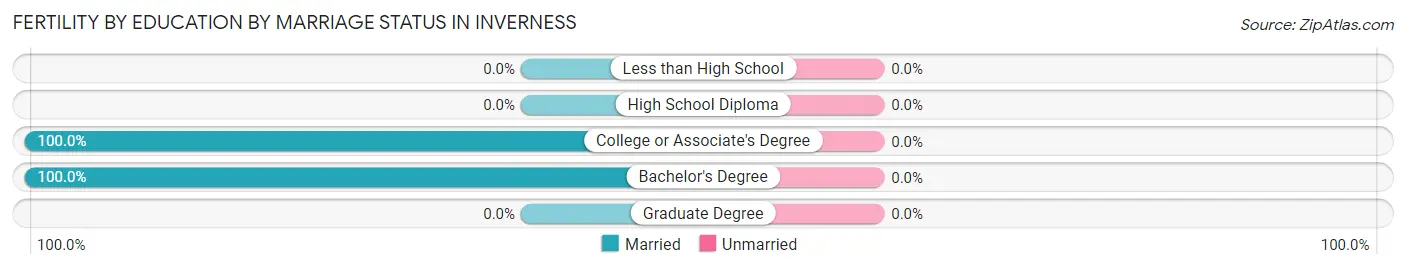
| Educational Attainment | Married | Unmarried |
| Less than High School | 0 (0.0%) | 0 (0.0%) |
| High School Diploma | 0 (0.0%) | 0 (0.0%) |
| College or Associate's Degree | 41 (100.0%) | 0 (0.0%) |
| Bachelor's Degree | 18 (100.0%) | 0 (0.0%) |
| Graduate Degree | 0 (0.0%) | 0 (0.0%) |
| Total | 59 (100.0%) | 0 (0.0%) |
Employment Characteristics in Inverness
Employment by Class of Employer in Inverness
Among the 2,101 employed individuals in Inverness, private company employees (1,474 | 70.2%), local government employees (161 | 7.7%), and state government employees (140 | 6.7%) make up the most common classes of employment.
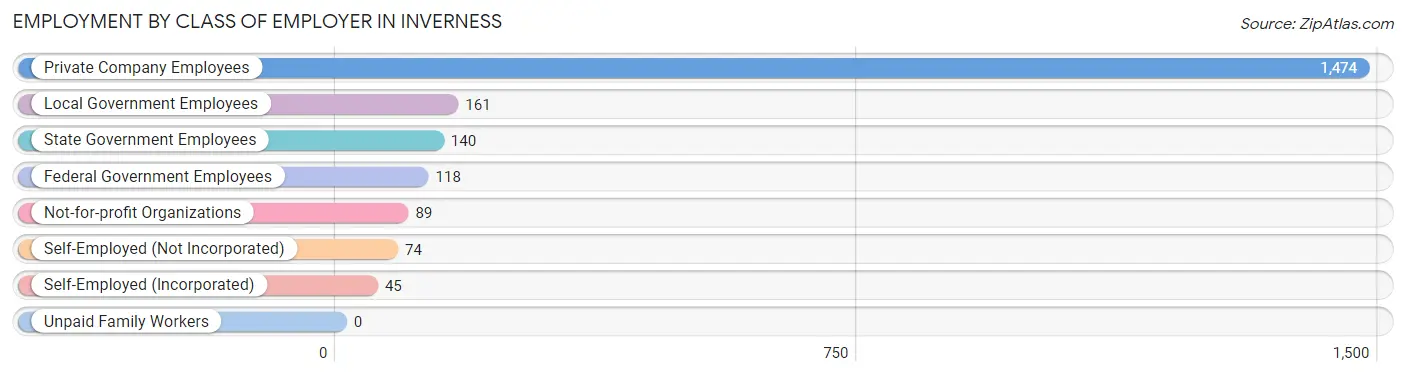
| Employer Class | # Employees | % Employees |
| Private Company Employees | 1,474 | 70.2% |
| Self-Employed (Incorporated) | 45 | 2.1% |
| Self-Employed (Not Incorporated) | 74 | 3.5% |
| Not-for-profit Organizations | 89 | 4.2% |
| Local Government Employees | 161 | 7.7% |
| State Government Employees | 140 | 6.7% |
| Federal Government Employees | 118 | 5.6% |
| Unpaid Family Workers | 0 | 0.0% |
| Total | 2,101 | 100.0% |
Employment Status by Age in Inverness
According to the labor force statistics for Inverness, out of the total population over 16 years of age (2,446), 90.9% or 2,223 individuals are in the labor force, with 3.3% or 73 of them unemployed. The age group with the highest labor force participation rate is 35 to 44 years, with 98.0% or 500 individuals in the labor force. Within the labor force, the 55 to 59 years age range has the highest percentage of unemployed individuals, with 15.0% or 20 of them being unemployed.
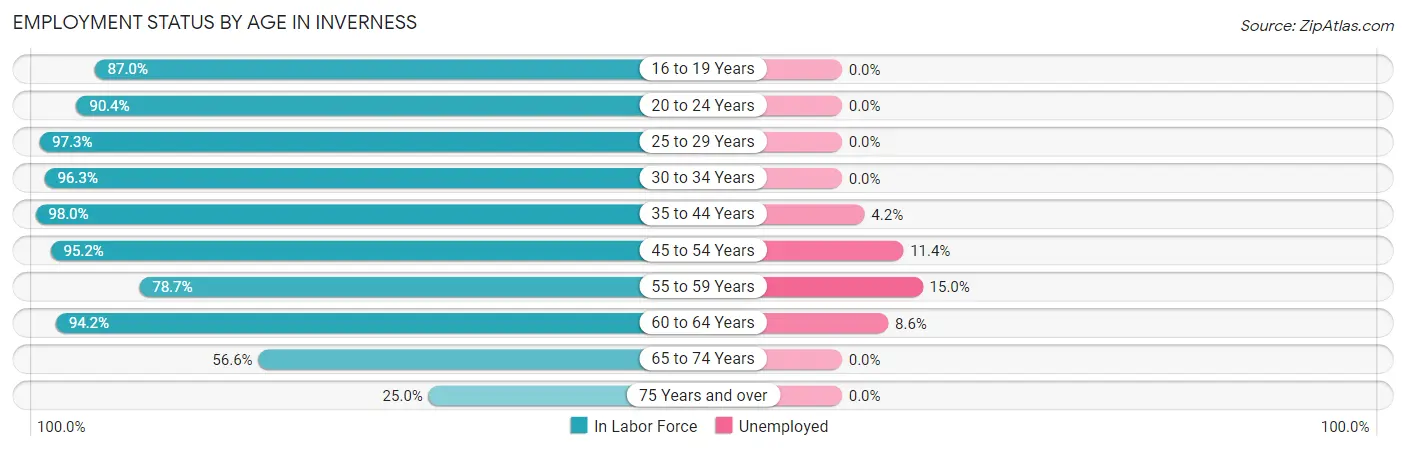
| Age Bracket | In Labor Force | Unemployed |
| 16 to 19 Years | 20 (87.0%) | 0 (0.0%) |
| 20 to 24 Years | 122 (90.4%) | 0 (0.0%) |
| 25 to 29 Years | 644 (97.3%) | 0 (0.0%) |
| 30 to 34 Years | 390 (96.3%) | 0 (0.0%) |
| 35 to 44 Years | 500 (98.0%) | 21 (4.2%) |
| 45 to 54 Years | 158 (95.2%) | 18 (11.4%) |
| 55 to 59 Years | 133 (78.7%) | 20 (15.0%) |
| 60 to 64 Years | 162 (94.2%) | 14 (8.6%) |
| 65 to 74 Years | 77 (56.6%) | 0 (0.0%) |
| 75 Years and over | 17 (25.0%) | 0 (0.0%) |
| Total | 2,223 (90.9%) | 73 (3.3%) |
Employment Status by Educational Attainment in Inverness
According to labor force statistics for Inverness, 95.3% of individuals (1,986) out of the total population between 25 and 64 years of age (2,084) are in the labor force, with 3.7% or 73 of them being unemployed. The group with the highest labor force participation rate are those with the educational attainment of less than high school, with 100.0% or 45 individuals in the labor force. Within the labor force, individuals with college / associate degree education have the highest percentage of unemployment, with 4.7% or 21 of them being unemployed.
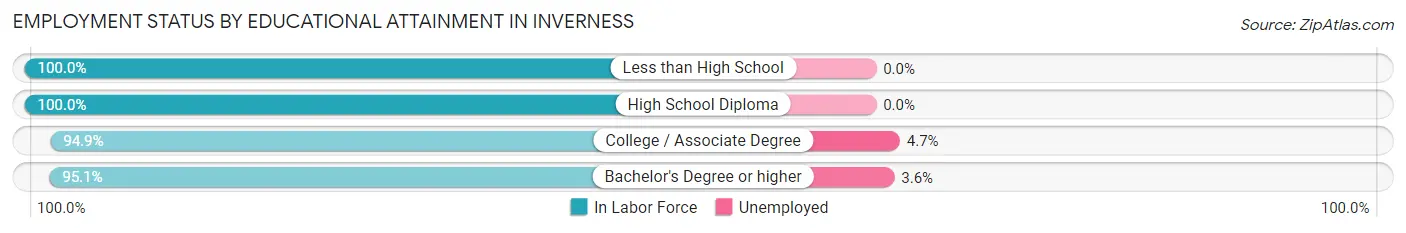
| Educational Attainment | In Labor Force | Unemployed |
| Less than High School | 45 (100.0%) | 0 (0.0%) |
| High School Diploma | 70 (100.0%) | 0 (0.0%) |
| College / Associate Degree | 447 (94.9%) | 22 (4.7%) |
| Bachelor's Degree or higher | 1,425 (95.1%) | 54 (3.6%) |
| Total | 1,986 (95.3%) | 77 (3.7%) |
Employment Occupations by Sex in Inverness
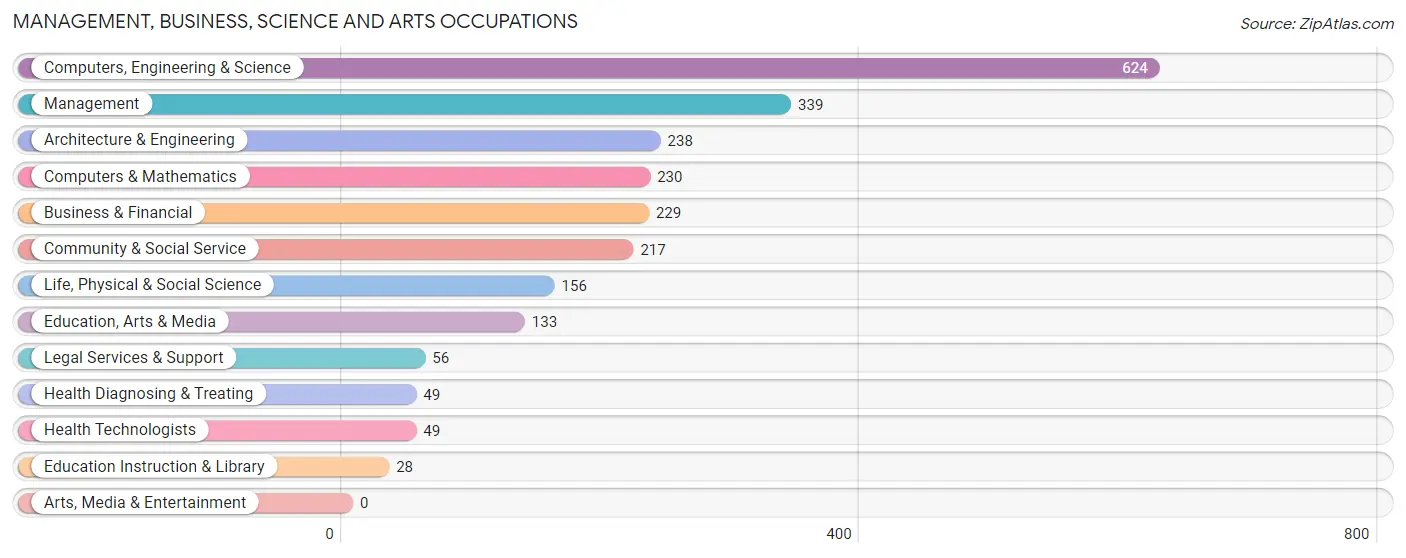
Management, Business, Science and Arts Occupations
The most common Management, Business, Science and Arts occupations in Inverness are Computers, Engineering & Science (624 | 29.0%), Management (339 | 15.8%), Architecture & Engineering (238 | 11.1%), Computers & Mathematics (230 | 10.7%), and Business & Financial (229 | 10.6%).
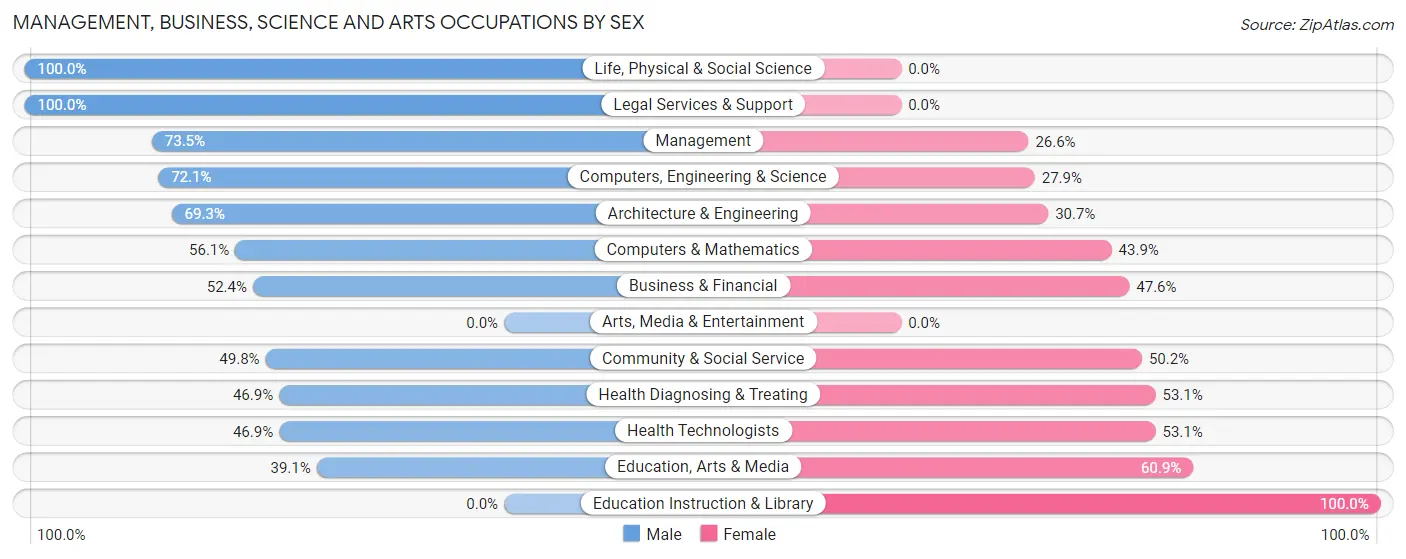
Management, Business, Science and Arts Occupations by Sex
Within the Management, Business, Science and Arts occupations in Inverness, the most male-oriented occupations are Life, Physical & Social Science (100.0%), Legal Services & Support (100.0%), and Management (73.5%), while the most female-oriented occupations are Education Instruction & Library (100.0%), Education, Arts & Media (60.9%), and Health Diagnosing & Treating (53.1%).
| Occupation | Male | Female |
| Management | 249 (73.5%) | 90 (26.6%) |
| Business & Financial | 120 (52.4%) | 109 (47.6%) |
| Computers, Engineering & Science | 450 (72.1%) | 174 (27.9%) |
| Computers & Mathematics | 129 (56.1%) | 101 (43.9%) |
| Architecture & Engineering | 165 (69.3%) | 73 (30.7%) |
| Life, Physical & Social Science | 156 (100.0%) | 0 (0.0%) |
| Community & Social Service | 108 (49.8%) | 109 (50.2%) |
| Education, Arts & Media | 52 (39.1%) | 81 (60.9%) |
| Legal Services & Support | 56 (100.0%) | 0 (0.0%) |
| Education Instruction & Library | 0 (0.0%) | 28 (100.0%) |
| Arts, Media & Entertainment | 0 (0.0%) | 0 (0.0%) |
| Health Diagnosing & Treating | 23 (46.9%) | 26 (53.1%) |
| Health Technologists | 23 (46.9%) | 26 (53.1%) |
| Total (Category) | 950 (65.2%) | 508 (34.8%) |
| Total (Overall) | 1,345 (62.6%) | 805 (37.4%) |
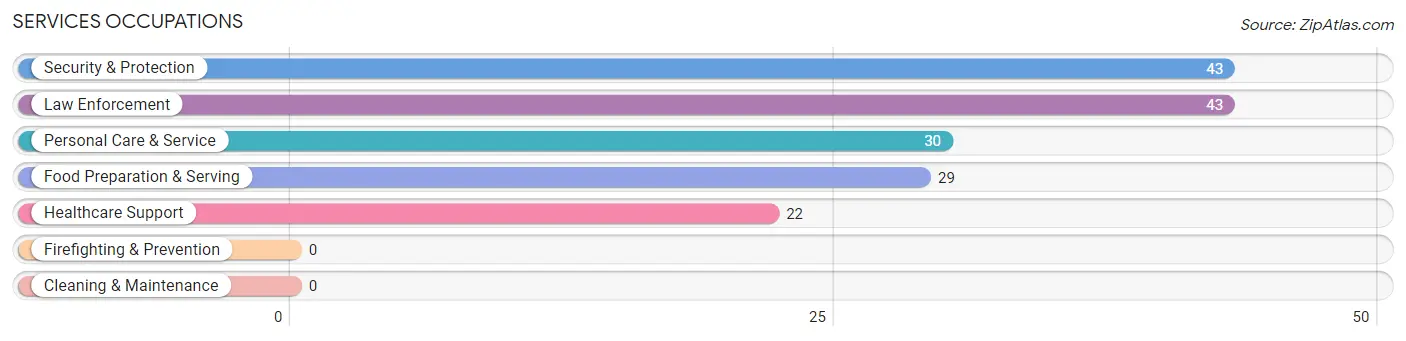
Services Occupations
The most common Services occupations in Inverness are Security & Protection (43 | 2.0%), Law Enforcement (43 | 2.0%), Personal Care & Service (30 | 1.4%), Food Preparation & Serving (29 | 1.3%), and Healthcare Support (22 | 1.0%).
Services Occupations by Sex
Within the Services occupations in Inverness, the most male-oriented occupations are Security & Protection (51.2%), Law Enforcement (51.2%), and Healthcare Support (50.0%), while the most female-oriented occupations are Food Preparation & Serving (100.0%), Personal Care & Service (100.0%), and Healthcare Support (50.0%).

| Occupation | Male | Female |
| Healthcare Support | 11 (50.0%) | 11 (50.0%) |
| Security & Protection | 22 (51.2%) | 21 (48.8%) |
| Firefighting & Prevention | 0 (0.0%) | 0 (0.0%) |
| Law Enforcement | 22 (51.2%) | 21 (48.8%) |
| Food Preparation & Serving | 0 (0.0%) | 29 (100.0%) |
| Cleaning & Maintenance | 0 (0.0%) | 0 (0.0%) |
| Personal Care & Service | 0 (0.0%) | 30 (100.0%) |
| Total (Category) | 33 (26.6%) | 91 (73.4%) |
| Total (Overall) | 1,345 (62.6%) | 805 (37.4%) |
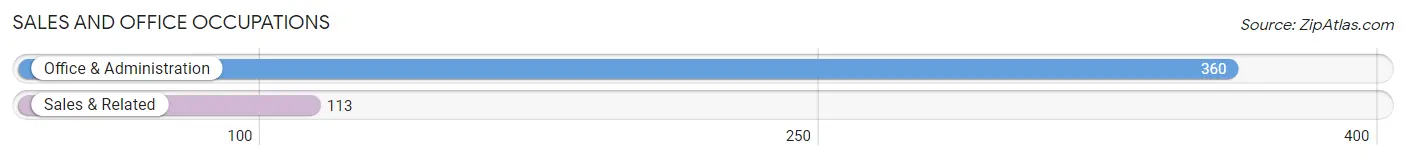
Sales and Office Occupations
The most common Sales and Office occupations in Inverness are Office & Administration (360 | 16.7%), and Sales & Related (113 | 5.3%).
Sales and Office Occupations by Sex
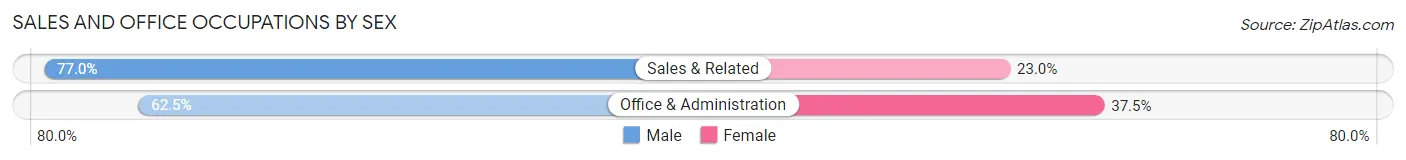
| Occupation | Male | Female |
| Sales & Related | 87 (77.0%) | 26 (23.0%) |
| Office & Administration | 225 (62.5%) | 135 (37.5%) |
| Total (Category) | 312 (66.0%) | 161 (34.0%) |
| Total (Overall) | 1,345 (62.6%) | 805 (37.4%) |
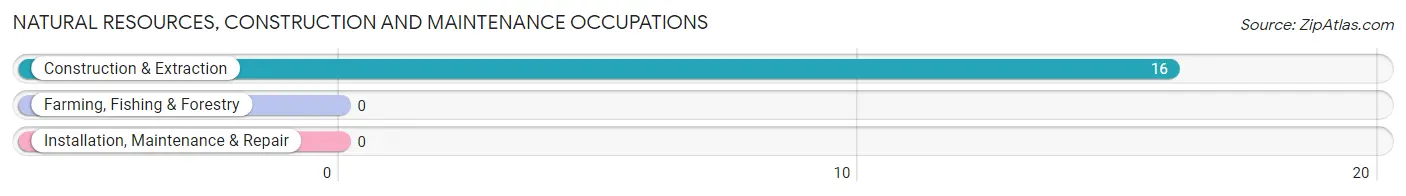
Natural Resources, Construction and Maintenance Occupations
The most common Natural Resources, Construction and Maintenance occupations in Inverness are , and Construction & Extraction (16 | 0.7%).
Natural Resources, Construction and Maintenance Occupations by Sex
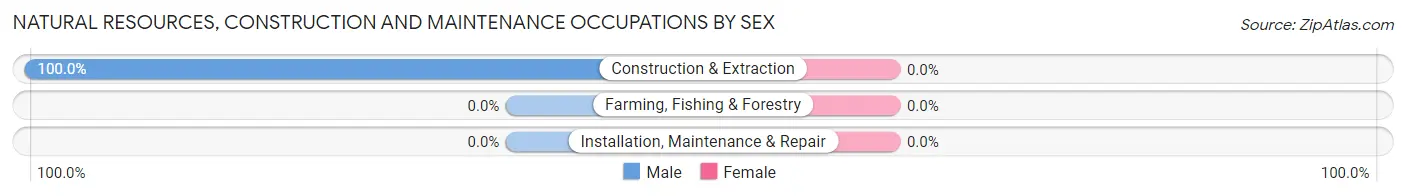
| Occupation | Male | Female |
| Farming, Fishing & Forestry | 0 (0.0%) | 0 (0.0%) |
| Construction & Extraction | 16 (100.0%) | 0 (0.0%) |
| Installation, Maintenance & Repair | 0 (0.0%) | 0 (0.0%) |
| Total (Category) | 16 (100.0%) | 0 (0.0%) |
| Total (Overall) | 1,345 (62.6%) | 805 (37.4%) |
Production, Transportation and Moving Occupations
The most common Production, Transportation and Moving occupations in Inverness are Material Moving (65 | 3.0%), and Transportation (14 | 0.6%).
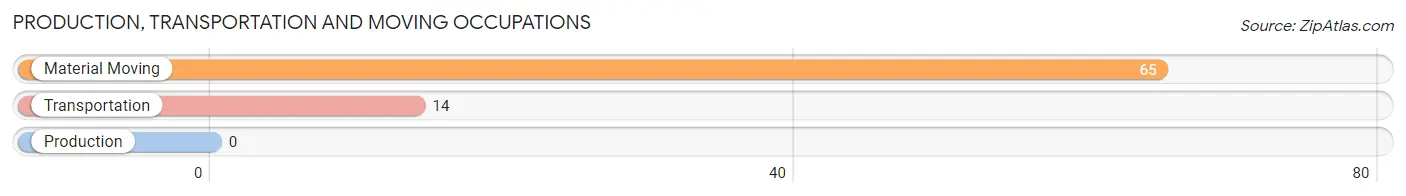
Production, Transportation and Moving Occupations by Sex
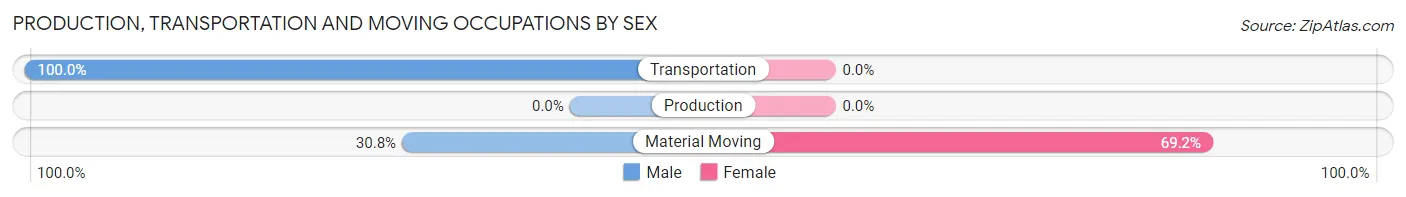
| Occupation | Male | Female |
| Production | 0 (0.0%) | 0 (0.0%) |
| Transportation | 14 (100.0%) | 0 (0.0%) |
| Material Moving | 20 (30.8%) | 45 (69.2%) |
| Total (Category) | 34 (43.0%) | 45 (57.0%) |
| Total (Overall) | 1,345 (62.6%) | 805 (37.4%) |
Employment Industries by Sex in Inverness
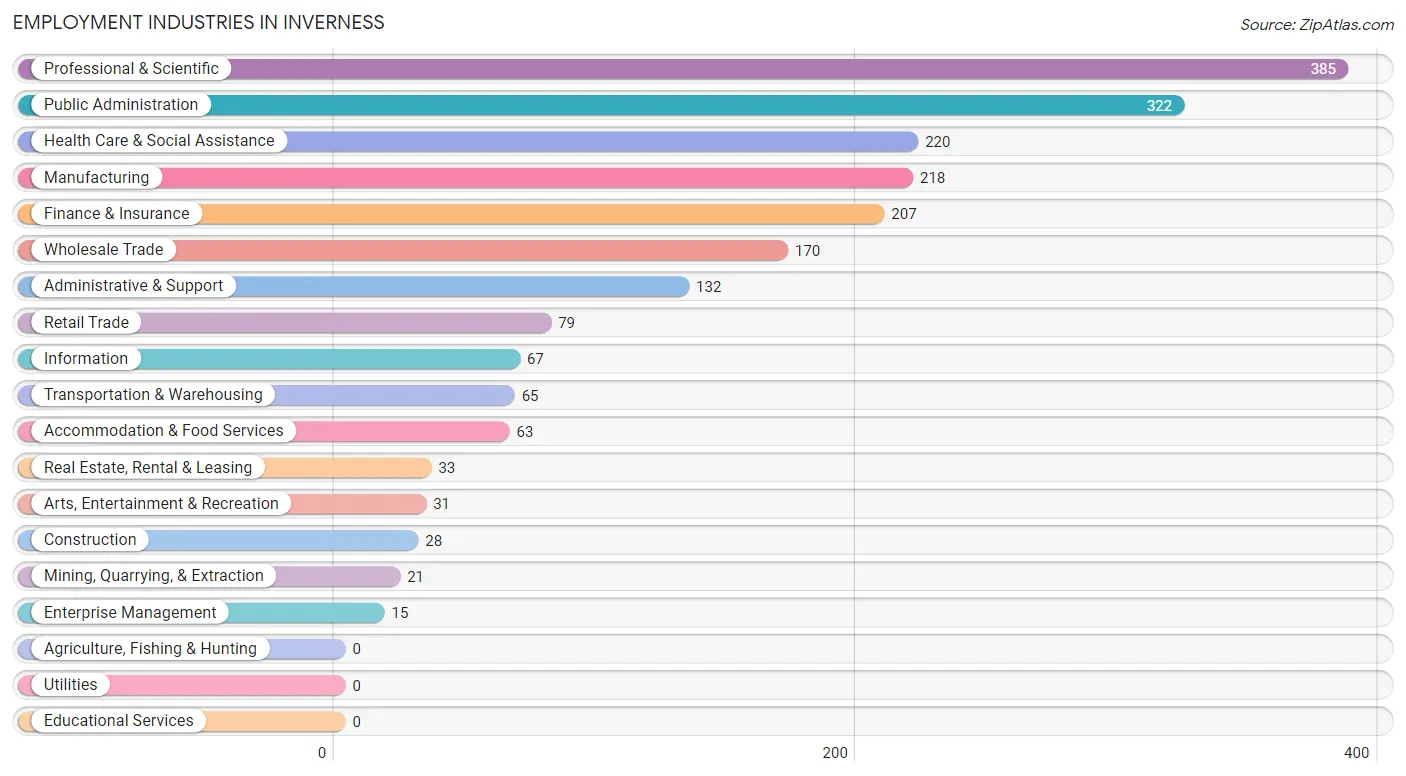
Employment Industries in Inverness
The major employment industries in Inverness include Professional & Scientific (385 | 17.9%), Public Administration (322 | 15.0%), Health Care & Social Assistance (220 | 10.2%), Manufacturing (218 | 10.1%), and Finance & Insurance (207 | 9.6%).
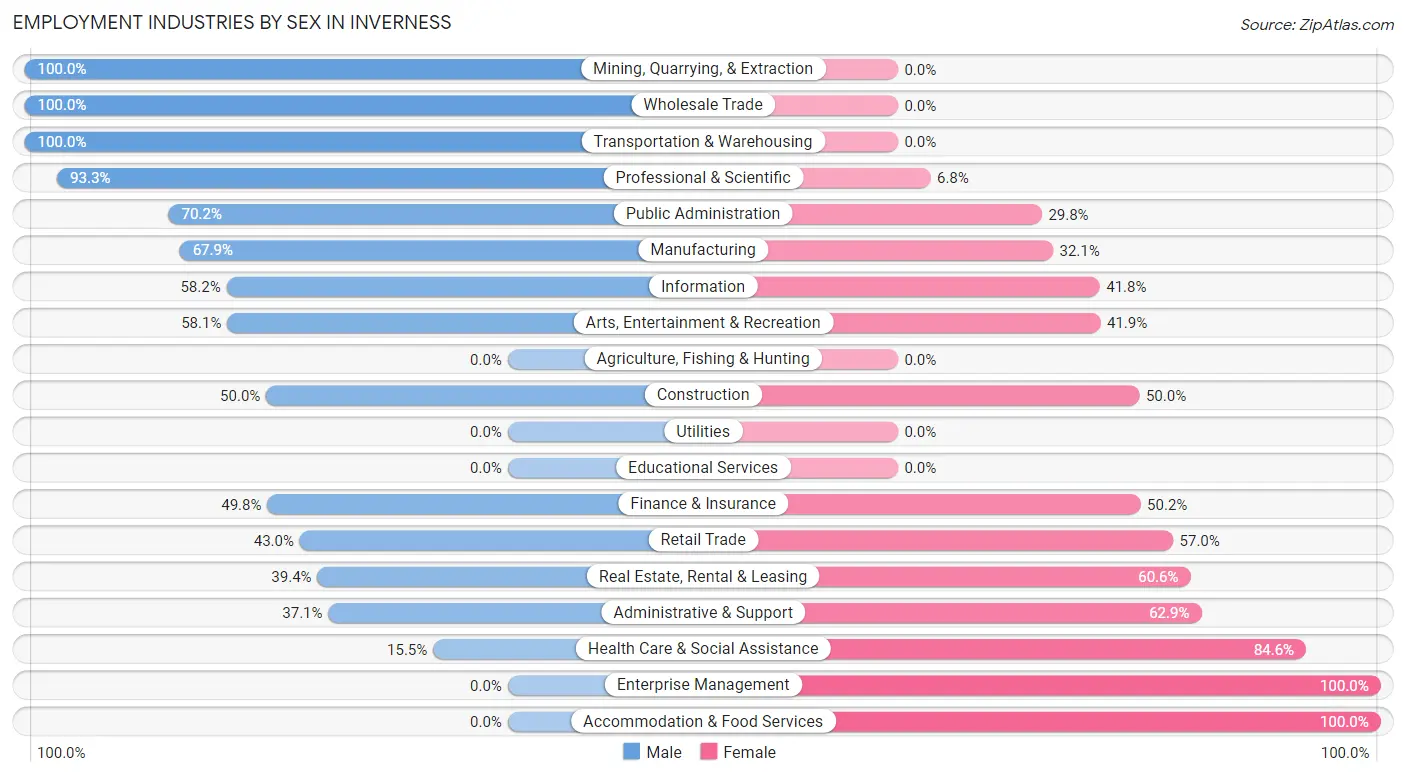
Employment Industries by Sex in Inverness
The Inverness industries that see more men than women are Mining, Quarrying, & Extraction (100.0%), Wholesale Trade (100.0%), and Transportation & Warehousing (100.0%), whereas the industries that tend to have a higher number of women are Enterprise Management (100.0%), Accommodation & Food Services (100.0%), and Health Care & Social Assistance (84.6%).
| Industry | Male | Female |
| Agriculture, Fishing & Hunting | 0 (0.0%) | 0 (0.0%) |
| Mining, Quarrying, & Extraction | 21 (100.0%) | 0 (0.0%) |
| Construction | 14 (50.0%) | 14 (50.0%) |
| Manufacturing | 148 (67.9%) | 70 (32.1%) |
| Wholesale Trade | 170 (100.0%) | 0 (0.0%) |
| Retail Trade | 34 (43.0%) | 45 (57.0%) |
| Transportation & Warehousing | 65 (100.0%) | 0 (0.0%) |
| Utilities | 0 (0.0%) | 0 (0.0%) |
| Information | 39 (58.2%) | 28 (41.8%) |
| Finance & Insurance | 103 (49.8%) | 104 (50.2%) |
| Real Estate, Rental & Leasing | 13 (39.4%) | 20 (60.6%) |
| Professional & Scientific | 359 (93.2%) | 26 (6.8%) |
| Enterprise Management | 0 (0.0%) | 15 (100.0%) |
| Administrative & Support | 49 (37.1%) | 83 (62.9%) |
| Educational Services | 0 (0.0%) | 0 (0.0%) |
| Health Care & Social Assistance | 34 (15.4%) | 186 (84.6%) |
| Arts, Entertainment & Recreation | 18 (58.1%) | 13 (41.9%) |
| Accommodation & Food Services | 0 (0.0%) | 63 (100.0%) |
| Public Administration | 226 (70.2%) | 96 (29.8%) |
| Total | 1,345 (62.6%) | 805 (37.4%) |
Education in Inverness
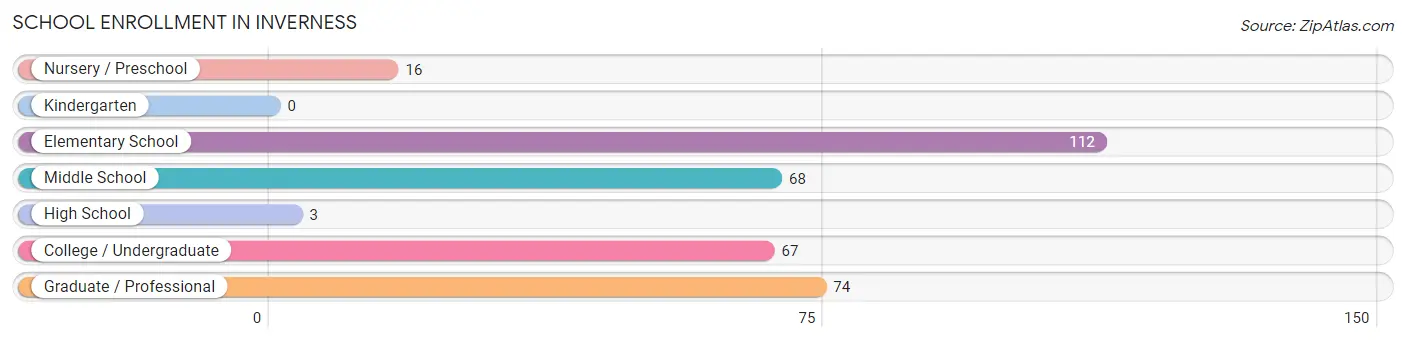
School Enrollment in Inverness
The most common levels of schooling among the 340 students in Inverness are elementary school (112 | 32.9%), graduate / professional (74 | 21.8%), and middle school (68 | 20.0%).
| School Level | # Students | % Students |
| Nursery / Preschool | 16 | 4.7% |
| Kindergarten | 0 | 0.0% |
| Elementary School | 112 | 32.9% |
| Middle School | 68 | 20.0% |
| High School | 3 | 0.9% |
| College / Undergraduate | 67 | 19.7% |
| Graduate / Professional | 74 | 21.8% |
| Total | 340 | 100.0% |
School Enrollment by Age by Funding Source in Inverness
Out of a total of 340 students who are enrolled in schools in Inverness, 32 (9.4%) attend a private institution, while the remaining 308 (90.6%) are enrolled in public schools. The age group of 20 to 24 year olds has the highest likelihood of being enrolled in private schools, with 14 (26.4% in the age bracket) enrolled. Conversely, the age group of 10 to 14 year olds has the lowest likelihood of being enrolled in a private school, with 77 (100.0% in the age bracket) attending a public institution.
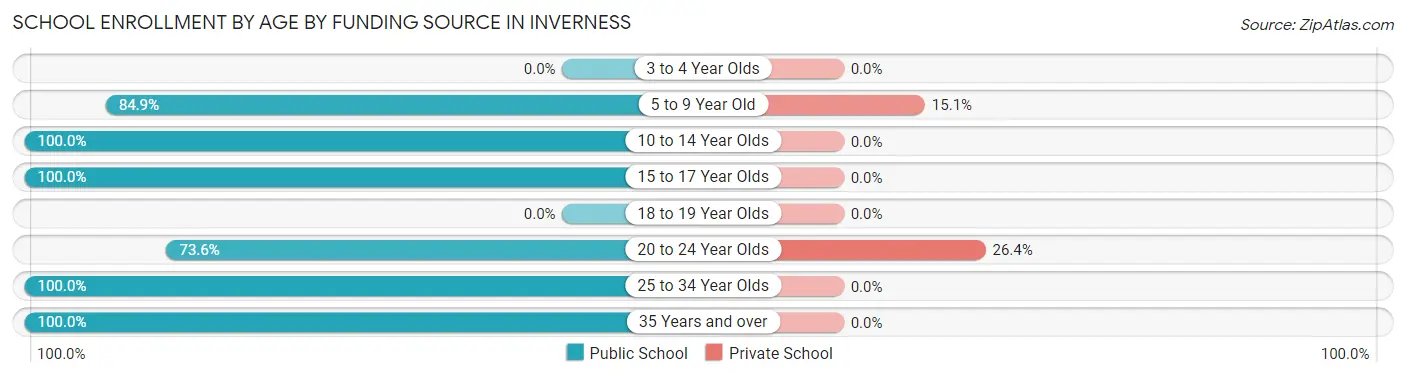
| Age Bracket | Public School | Private School |
| 3 to 4 Year Olds | 0 (0.0%) | 0 (0.0%) |
| 5 to 9 Year Old | 101 (84.9%) | 18 (15.1%) |
| 10 to 14 Year Olds | 77 (100.0%) | 0 (0.0%) |
| 15 to 17 Year Olds | 3 (100.0%) | 0 (0.0%) |
| 18 to 19 Year Olds | 0 (0.0%) | 0 (0.0%) |
| 20 to 24 Year Olds | 39 (73.6%) | 14 (26.4%) |
| 25 to 34 Year Olds | 55 (100.0%) | 0 (0.0%) |
| 35 Years and over | 33 (100.0%) | 0 (0.0%) |
| Total | 308 (90.6%) | 32 (9.4%) |
Educational Attainment by Field of Study in Inverness
Business (525 | 30.1%), social sciences (209 | 12.0%), engineering (165 | 9.5%), communications (161 | 9.2%), and visual & performing arts (133 | 7.6%) are the most common fields of study among 1,746 individuals in Inverness who have obtained a bachelor's degree or higher.
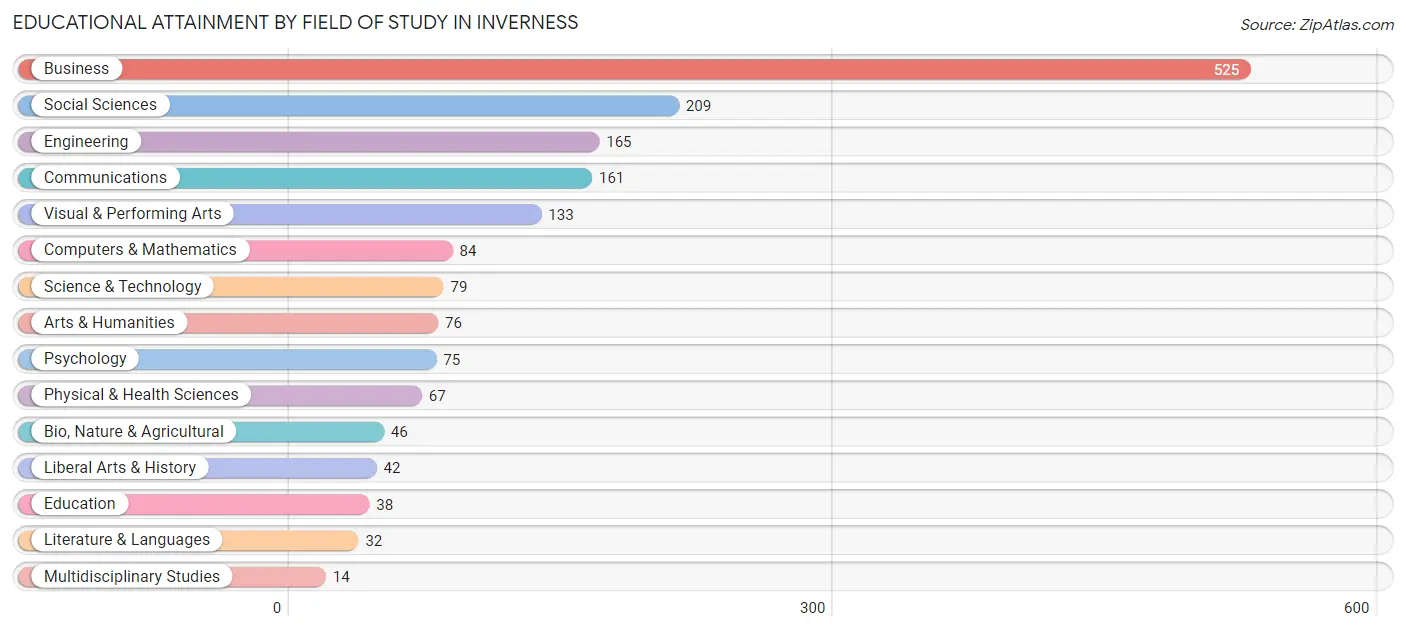
| Field of Study | # Graduates | % Graduates |
| Computers & Mathematics | 84 | 4.8% |
| Bio, Nature & Agricultural | 46 | 2.6% |
| Physical & Health Sciences | 67 | 3.8% |
| Psychology | 75 | 4.3% |
| Social Sciences | 209 | 12.0% |
| Engineering | 165 | 9.5% |
| Multidisciplinary Studies | 14 | 0.8% |
| Science & Technology | 79 | 4.5% |
| Business | 525 | 30.1% |
| Education | 38 | 2.2% |
| Literature & Languages | 32 | 1.8% |
| Liberal Arts & History | 42 | 2.4% |
| Visual & Performing Arts | 133 | 7.6% |
| Communications | 161 | 9.2% |
| Arts & Humanities | 76 | 4.3% |
| Total | 1,746 | 100.0% |
Transportation & Commute in Inverness
Vehicle Availability by Sex in Inverness
The most prevalent vehicle ownership categories in Inverness are males with 1 vehicle (643, accounting for 47.8%) and females with 1 vehicle (313, making up 85.1%).
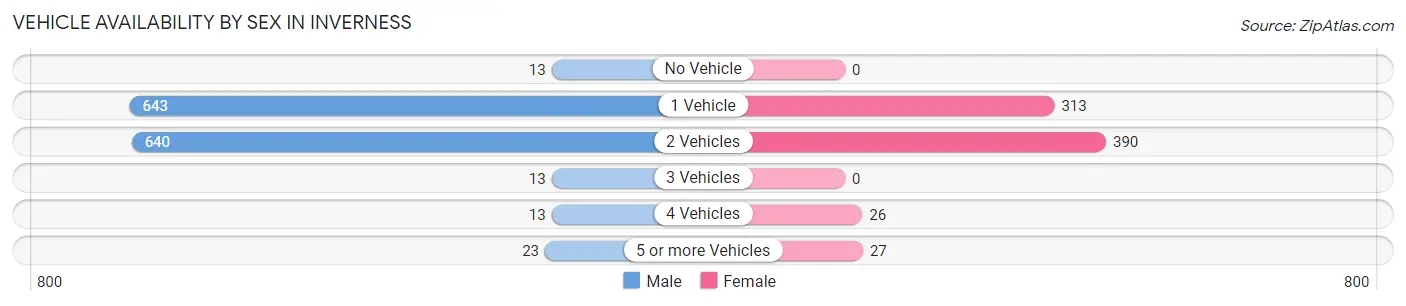
| Vehicles Available | Male | Female |
| No Vehicle | 13 (1.0%) | 0 (0.0%) |
| 1 Vehicle | 643 (47.8%) | 313 (41.4%) |
| 2 Vehicles | 640 (47.6%) | 390 (51.6%) |
| 3 Vehicles | 13 (1.0%) | 0 (0.0%) |
| 4 Vehicles | 13 (1.0%) | 26 (3.4%) |
| 5 or more Vehicles | 23 (1.7%) | 27 (3.6%) |
| Total | 1,345 (100.0%) | 756 (100.0%) |
Commute Time in Inverness
The most frequently occuring commute durations in Inverness are 10 to 14 minutes (478 commuters, 31.2%), 5 to 9 minutes (325 commuters, 21.2%), and 15 to 19 minutes (255 commuters, 16.6%).
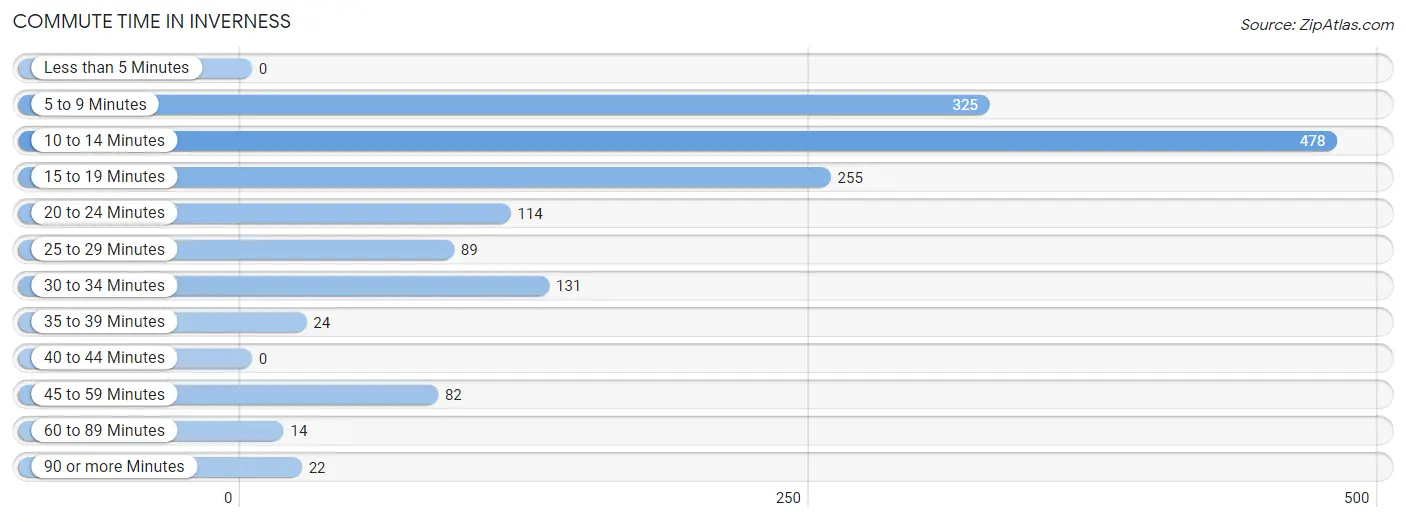
| Commute Time | # Commuters | % Commuters |
| Less than 5 Minutes | 0 | 0.0% |
| 5 to 9 Minutes | 325 | 21.2% |
| 10 to 14 Minutes | 478 | 31.2% |
| 15 to 19 Minutes | 255 | 16.6% |
| 20 to 24 Minutes | 114 | 7.4% |
| 25 to 29 Minutes | 89 | 5.8% |
| 30 to 34 Minutes | 131 | 8.5% |
| 35 to 39 Minutes | 24 | 1.6% |
| 40 to 44 Minutes | 0 | 0.0% |
| 45 to 59 Minutes | 82 | 5.3% |
| 60 to 89 Minutes | 14 | 0.9% |
| 90 or more Minutes | 22 | 1.4% |
Commute Time by Sex in Inverness
The most common commute times in Inverness are 10 to 14 minutes (292 commuters, 30.8%) for males and 10 to 14 minutes (186 commuters, 31.7%) for females.
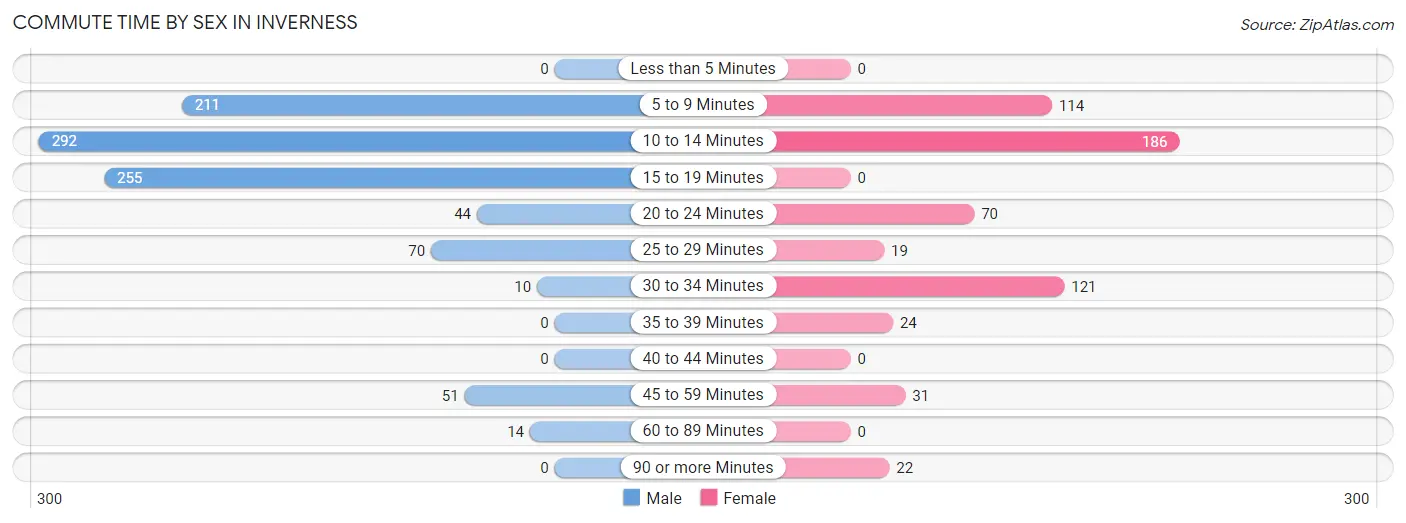
| Commute Time | Male | Female |
| Less than 5 Minutes | 0 (0.0%) | 0 (0.0%) |
| 5 to 9 Minutes | 211 (22.3%) | 114 (19.4%) |
| 10 to 14 Minutes | 292 (30.8%) | 186 (31.7%) |
| 15 to 19 Minutes | 255 (26.9%) | 0 (0.0%) |
| 20 to 24 Minutes | 44 (4.6%) | 70 (11.9%) |
| 25 to 29 Minutes | 70 (7.4%) | 19 (3.2%) |
| 30 to 34 Minutes | 10 (1.1%) | 121 (20.6%) |
| 35 to 39 Minutes | 0 (0.0%) | 24 (4.1%) |
| 40 to 44 Minutes | 0 (0.0%) | 0 (0.0%) |
| 45 to 59 Minutes | 51 (5.4%) | 31 (5.3%) |
| 60 to 89 Minutes | 14 (1.5%) | 0 (0.0%) |
| 90 or more Minutes | 0 (0.0%) | 22 (3.7%) |
Time of Departure to Work by Sex in Inverness
The most frequent times of departure to work in Inverness are 9:00 AM to 9:59 AM (186, 19.6%) for males and 7:00 AM to 7:29 AM (196, 33.4%) for females.
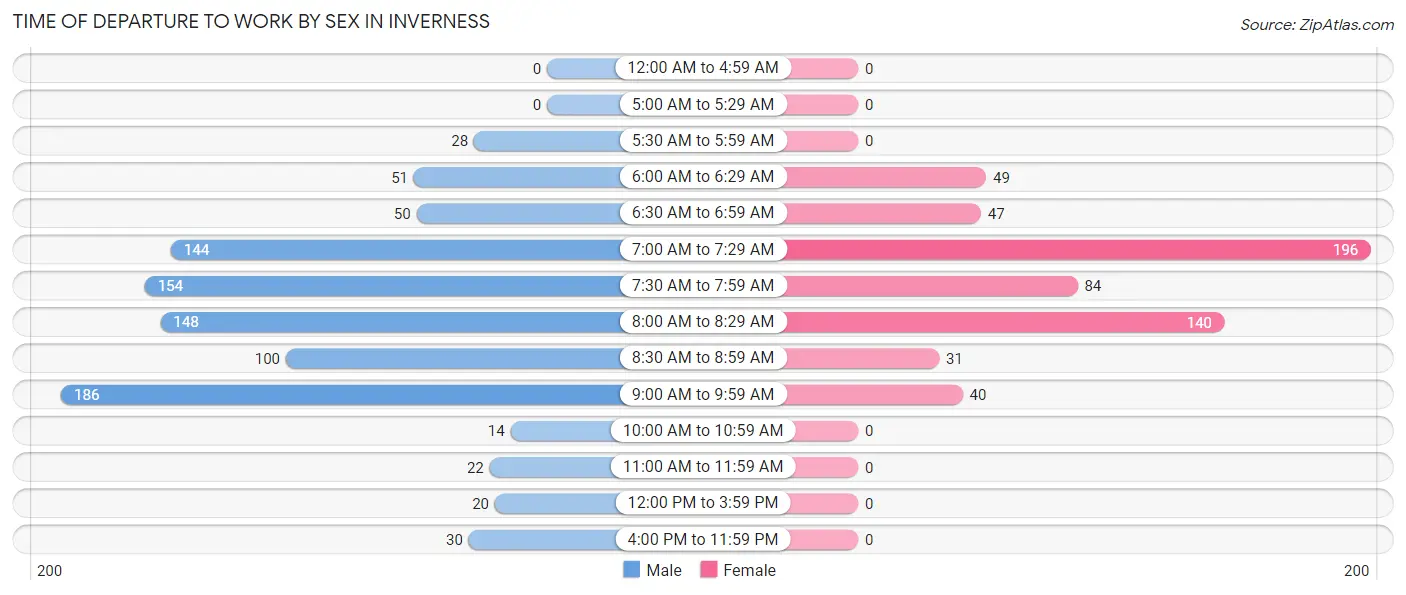
| Time of Departure | Male | Female |
| 12:00 AM to 4:59 AM | 0 (0.0%) | 0 (0.0%) |
| 5:00 AM to 5:29 AM | 0 (0.0%) | 0 (0.0%) |
| 5:30 AM to 5:59 AM | 28 (3.0%) | 0 (0.0%) |
| 6:00 AM to 6:29 AM | 51 (5.4%) | 49 (8.4%) |
| 6:30 AM to 6:59 AM | 50 (5.3%) | 47 (8.0%) |
| 7:00 AM to 7:29 AM | 144 (15.2%) | 196 (33.4%) |
| 7:30 AM to 7:59 AM | 154 (16.3%) | 84 (14.3%) |
| 8:00 AM to 8:29 AM | 148 (15.6%) | 140 (23.8%) |
| 8:30 AM to 8:59 AM | 100 (10.6%) | 31 (5.3%) |
| 9:00 AM to 9:59 AM | 186 (19.6%) | 40 (6.8%) |
| 10:00 AM to 10:59 AM | 14 (1.5%) | 0 (0.0%) |
| 11:00 AM to 11:59 AM | 22 (2.3%) | 0 (0.0%) |
| 12:00 PM to 3:59 PM | 20 (2.1%) | 0 (0.0%) |
| 4:00 PM to 11:59 PM | 30 (3.2%) | 0 (0.0%) |
| Total | 947 (100.0%) | 587 (100.0%) |
Housing Occupancy in Inverness
Occupancy by Ownership in Inverness
Of the total 1,694 dwellings in Inverness, owner-occupied units account for 247 (14.6%), while renter-occupied units make up 1,447 (85.4%).
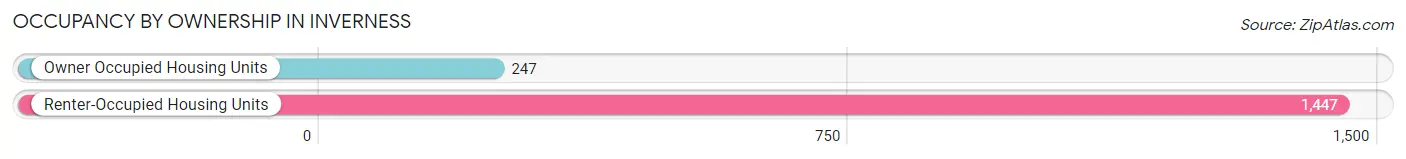
| Occupancy | # Housing Units | % Housing Units |
| Owner Occupied Housing Units | 247 | 14.6% |
| Renter-Occupied Housing Units | 1,447 | 85.4% |
| Total Occupied Housing Units | 1,694 | 100.0% |
Occupancy by Household Size in Inverness
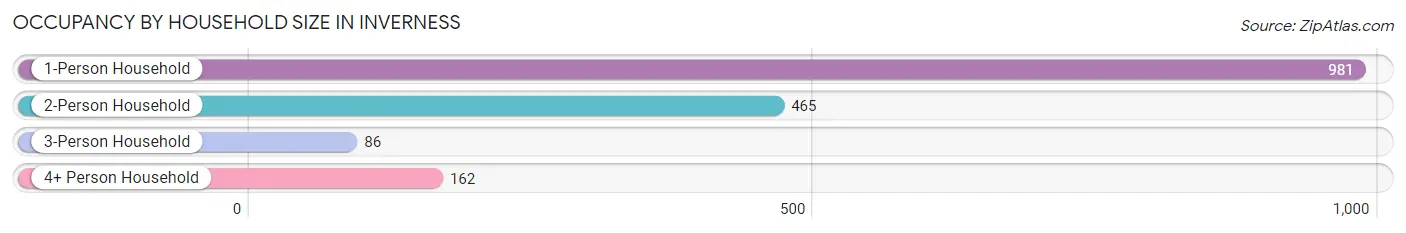
| Household Size | # Housing Units | % Housing Units |
| 1-Person Household | 981 | 57.9% |
| 2-Person Household | 465 | 27.5% |
| 3-Person Household | 86 | 5.1% |
| 4+ Person Household | 162 | 9.6% |
| Total Housing Units | 1,694 | 100.0% |
Occupancy by Ownership by Household Size in Inverness
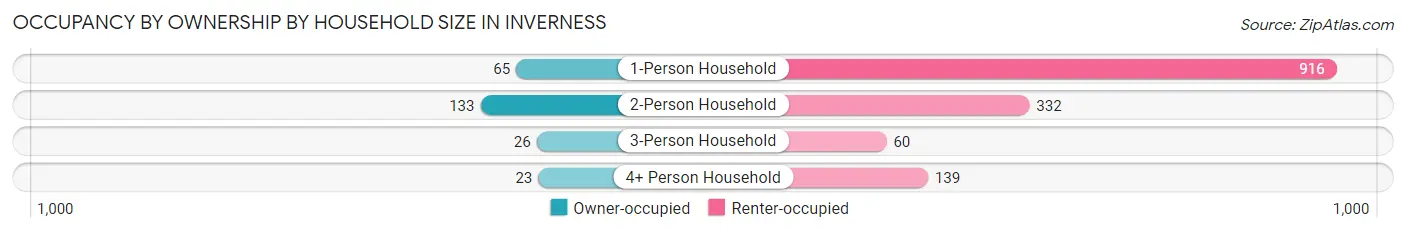
| Household Size | Owner-occupied | Renter-occupied |
| 1-Person Household | 65 (6.6%) | 916 (93.4%) |
| 2-Person Household | 133 (28.6%) | 332 (71.4%) |
| 3-Person Household | 26 (30.2%) | 60 (69.8%) |
| 4+ Person Household | 23 (14.2%) | 139 (85.8%) |
| Total Housing Units | 247 (14.6%) | 1,447 (85.4%) |
Occupancy by Educational Attainment in Inverness
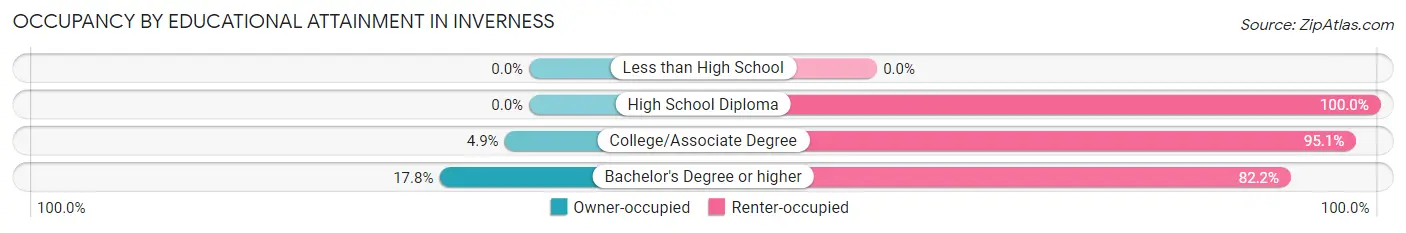
| Household Size | Owner-occupied | Renter-occupied |
| Less than High School | 0 (0.0%) | 0 (0.0%) |
| High School Diploma | 0 (0.0%) | 37 (100.0%) |
| College/Associate Degree | 18 (4.9%) | 352 (95.1%) |
| Bachelor's Degree or higher | 229 (17.8%) | 1,058 (82.2%) |
Occupancy by Age of Householder in Inverness
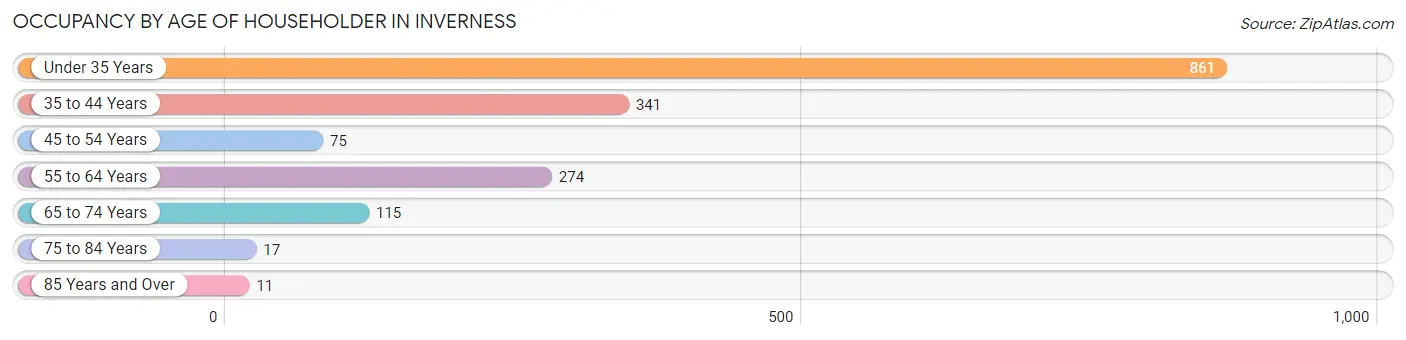
| Age Bracket | # Households | % Households |
| Under 35 Years | 861 | 50.8% |
| 35 to 44 Years | 341 | 20.1% |
| 45 to 54 Years | 75 | 4.4% |
| 55 to 64 Years | 274 | 16.2% |
| 65 to 74 Years | 115 | 6.8% |
| 75 to 84 Years | 17 | 1.0% |
| 85 Years and Over | 11 | 0.6% |
| Total | 1,694 | 100.0% |
Housing Finances in Inverness
Median Income by Occupancy in Inverness
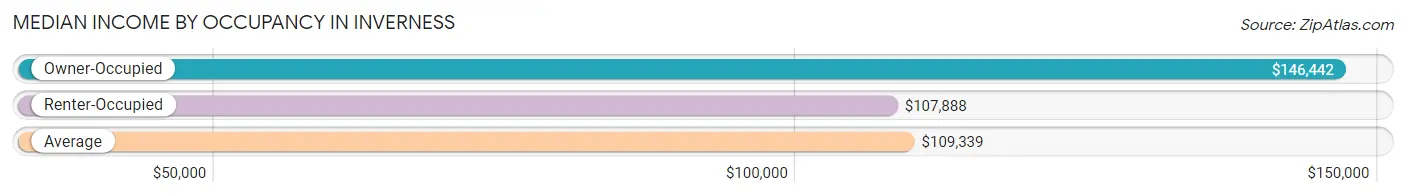
| Occupancy Type | # Households | Median Income |
| Owner-Occupied | 247 (14.6%) | $146,442 |
| Renter-Occupied | 1,447 (85.4%) | $107,888 |
| Average | 1,694 (100.0%) | $109,339 |
Occupancy by Householder Income Bracket in Inverness
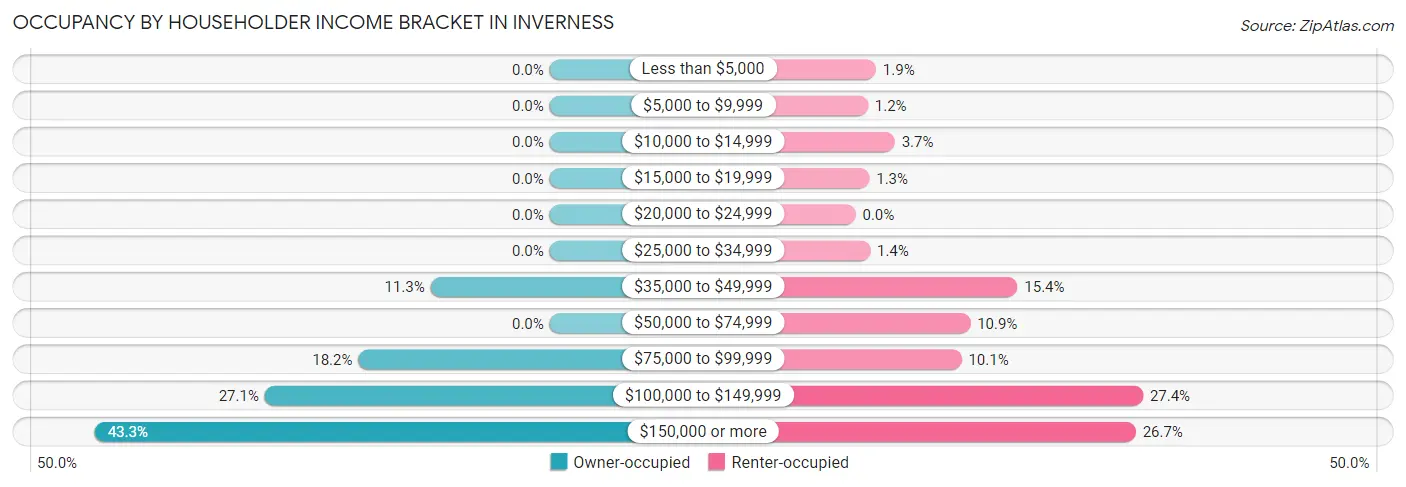
| Income Bracket | Owner-occupied | Renter-occupied |
| Less than $5,000 | 0 (0.0%) | 28 (1.9%) |
| $5,000 to $9,999 | 0 (0.0%) | 17 (1.2%) |
| $10,000 to $14,999 | 0 (0.0%) | 54 (3.7%) |
| $15,000 to $19,999 | 0 (0.0%) | 19 (1.3%) |
| $20,000 to $24,999 | 0 (0.0%) | 0 (0.0%) |
| $25,000 to $34,999 | 0 (0.0%) | 20 (1.4%) |
| $35,000 to $49,999 | 28 (11.3%) | 223 (15.4%) |
| $50,000 to $74,999 | 0 (0.0%) | 158 (10.9%) |
| $75,000 to $99,999 | 45 (18.2%) | 146 (10.1%) |
| $100,000 to $149,999 | 67 (27.1%) | 396 (27.4%) |
| $150,000 or more | 107 (43.3%) | 386 (26.7%) |
| Total | 247 (100.0%) | 1,447 (100.0%) |
Monthly Housing Cost Tiers in Inverness
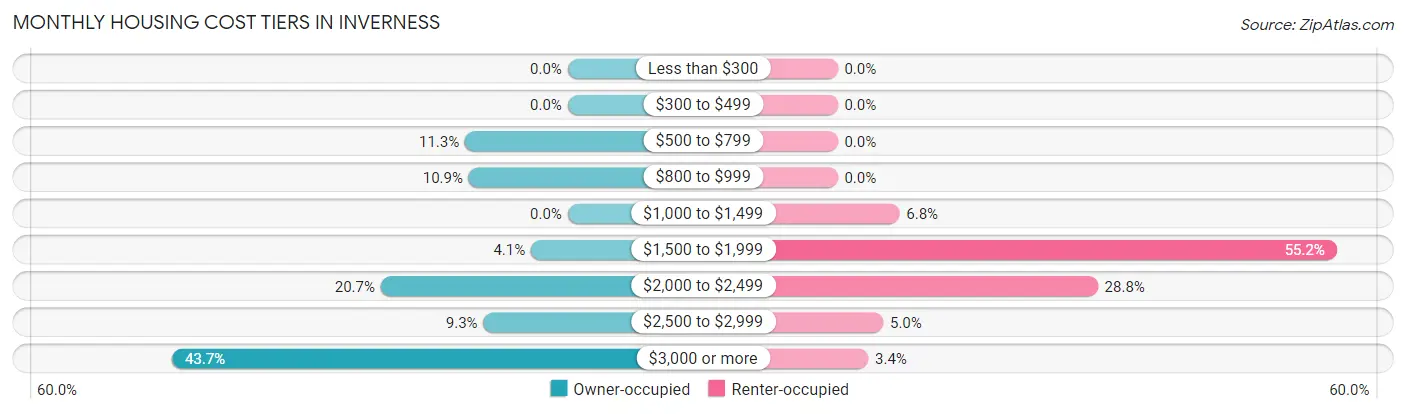
| Monthly Cost | Owner-occupied | Renter-occupied |
| Less than $300 | 0 (0.0%) | 0 (0.0%) |
| $300 to $499 | 0 (0.0%) | 0 (0.0%) |
| $500 to $799 | 28 (11.3%) | 0 (0.0%) |
| $800 to $999 | 27 (10.9%) | 0 (0.0%) |
| $1,000 to $1,499 | 0 (0.0%) | 99 (6.8%) |
| $1,500 to $1,999 | 10 (4.1%) | 798 (55.1%) |
| $2,000 to $2,499 | 51 (20.6%) | 416 (28.7%) |
| $2,500 to $2,999 | 23 (9.3%) | 73 (5.0%) |
| $3,000 or more | 108 (43.7%) | 49 (3.4%) |
| Total | 247 (100.0%) | 1,447 (100.0%) |
Physical Housing Characteristics in Inverness
Housing Structures in Inverness
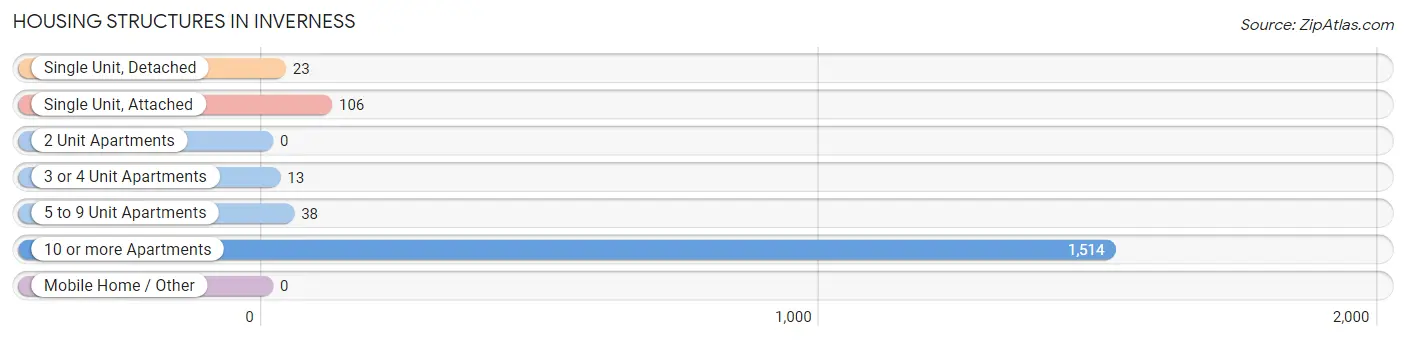
| Structure Type | # Housing Units | % Housing Units |
| Single Unit, Detached | 23 | 1.4% |
| Single Unit, Attached | 106 | 6.3% |
| 2 Unit Apartments | 0 | 0.0% |
| 3 or 4 Unit Apartments | 13 | 0.8% |
| 5 to 9 Unit Apartments | 38 | 2.2% |
| 10 or more Apartments | 1,514 | 89.4% |
| Mobile Home / Other | 0 | 0.0% |
| Total | 1,694 | 100.0% |
Housing Structures by Occupancy in Inverness
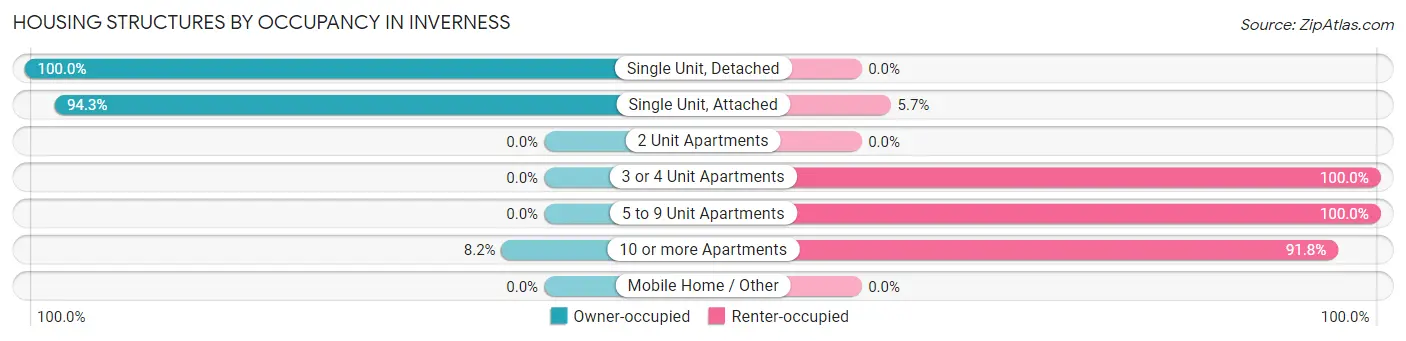
| Structure Type | Owner-occupied | Renter-occupied |
| Single Unit, Detached | 23 (100.0%) | 0 (0.0%) |
| Single Unit, Attached | 100 (94.3%) | 6 (5.7%) |
| 2 Unit Apartments | 0 (0.0%) | 0 (0.0%) |
| 3 or 4 Unit Apartments | 0 (0.0%) | 13 (100.0%) |
| 5 to 9 Unit Apartments | 0 (0.0%) | 38 (100.0%) |
| 10 or more Apartments | 124 (8.2%) | 1,390 (91.8%) |
| Mobile Home / Other | 0 (0.0%) | 0 (0.0%) |
| Total | 247 (14.6%) | 1,447 (85.4%) |
Housing Structures by Number of Rooms in Inverness
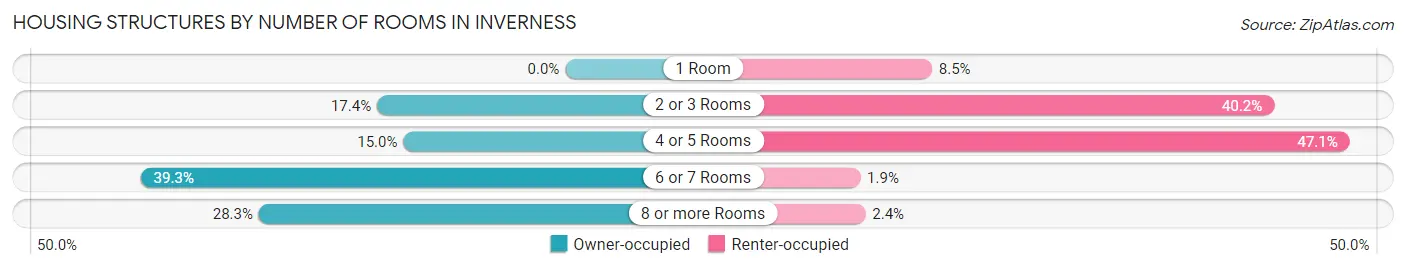
| Number of Rooms | Owner-occupied | Renter-occupied |
| 1 Room | 0 (0.0%) | 123 (8.5%) |
| 2 or 3 Rooms | 43 (17.4%) | 581 (40.2%) |
| 4 or 5 Rooms | 37 (15.0%) | 682 (47.1%) |
| 6 or 7 Rooms | 97 (39.3%) | 27 (1.9%) |
| 8 or more Rooms | 70 (28.3%) | 34 (2.4%) |
| Total | 247 (100.0%) | 1,447 (100.0%) |
Housing Structure by Heating Type in Inverness
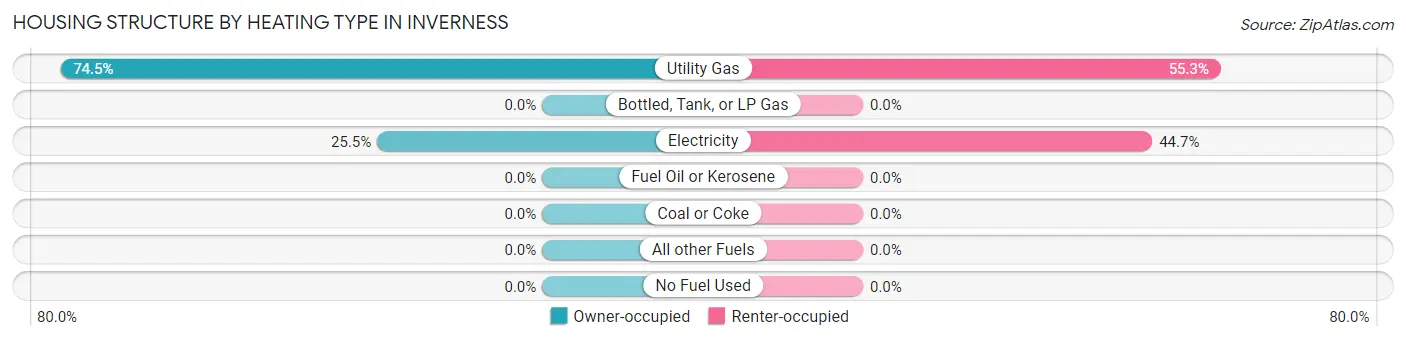
| Heating Type | Owner-occupied | Renter-occupied |
| Utility Gas | 184 (74.5%) | 800 (55.3%) |
| Bottled, Tank, or LP Gas | 0 (0.0%) | 0 (0.0%) |
| Electricity | 63 (25.5%) | 647 (44.7%) |
| Fuel Oil or Kerosene | 0 (0.0%) | 0 (0.0%) |
| Coal or Coke | 0 (0.0%) | 0 (0.0%) |
| All other Fuels | 0 (0.0%) | 0 (0.0%) |
| No Fuel Used | 0 (0.0%) | 0 (0.0%) |
| Total | 247 (100.0%) | 1,447 (100.0%) |
Household Vehicle Usage in Inverness
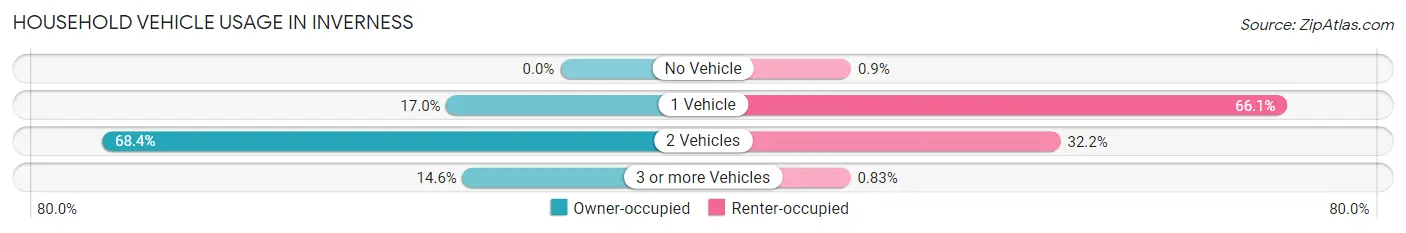
| Vehicles per Household | Owner-occupied | Renter-occupied |
| No Vehicle | 0 (0.0%) | 13 (0.9%) |
| 1 Vehicle | 42 (17.0%) | 956 (66.1%) |
| 2 Vehicles | 169 (68.4%) | 466 (32.2%) |
| 3 or more Vehicles | 36 (14.6%) | 12 (0.8%) |
| Total | 247 (100.0%) | 1,447 (100.0%) |
Real Estate & Mortgages in Inverness
Real Estate and Mortgage Overview in Inverness
| Characteristic | Without Mortgage | With Mortgage |
| Housing Units | 55 | 192 |
| Median Property Value | $564,200 | $733,600 |
| Median Household Income | $135,125 | $107 |
| Monthly Housing Costs | $798 | $108 |
| Real Estate Taxes | $2,982 | $13 |
Property Value by Mortgage Status in Inverness
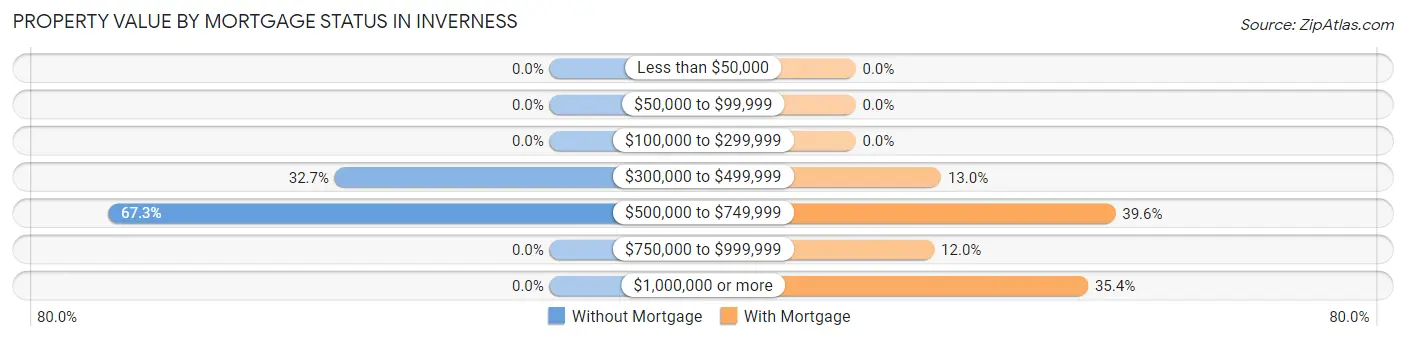
| Property Value | Without Mortgage | With Mortgage |
| Less than $50,000 | 0 (0.0%) | 0 (0.0%) |
| $50,000 to $99,999 | 0 (0.0%) | 0 (0.0%) |
| $100,000 to $299,999 | 0 (0.0%) | 0 (0.0%) |
| $300,000 to $499,999 | 18 (32.7%) | 25 (13.0%) |
| $500,000 to $749,999 | 37 (67.3%) | 76 (39.6%) |
| $750,000 to $999,999 | 0 (0.0%) | 23 (12.0%) |
| $1,000,000 or more | 0 (0.0%) | 68 (35.4%) |
| Total | 55 (100.0%) | 192 (100.0%) |
Household Income by Mortgage Status in Inverness
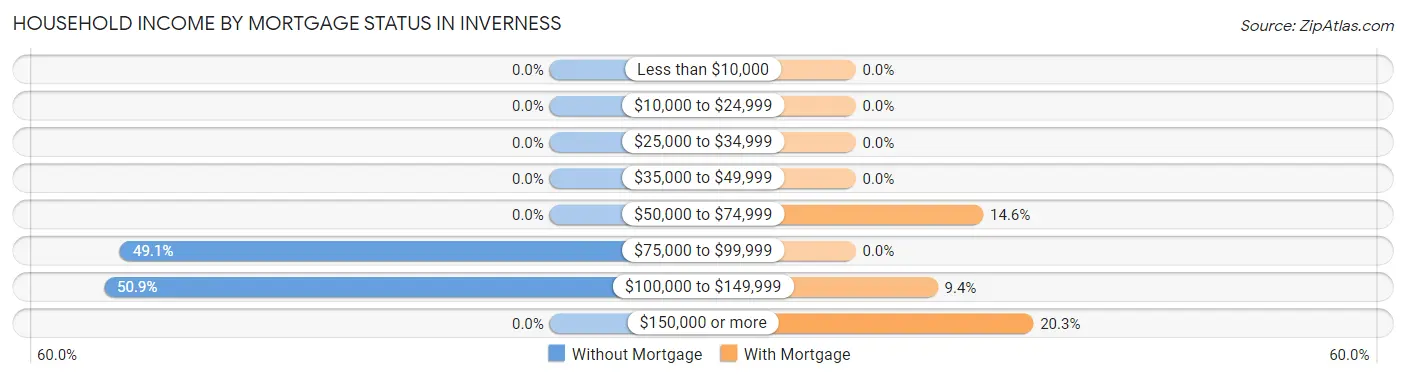
| Household Income | Without Mortgage | With Mortgage |
| Less than $10,000 | 0 (0.0%) | 0 (0.0%) |
| $10,000 to $24,999 | 0 (0.0%) | 0 (0.0%) |
| $25,000 to $34,999 | 0 (0.0%) | 0 (0.0%) |
| $35,000 to $49,999 | 0 (0.0%) | 0 (0.0%) |
| $50,000 to $74,999 | 0 (0.0%) | 28 (14.6%) |
| $75,000 to $99,999 | 27 (49.1%) | 0 (0.0%) |
| $100,000 to $149,999 | 28 (50.9%) | 18 (9.4%) |
| $150,000 or more | 0 (0.0%) | 39 (20.3%) |
| Total | 55 (100.0%) | 192 (100.0%) |
Property Value to Household Income Ratio in Inverness
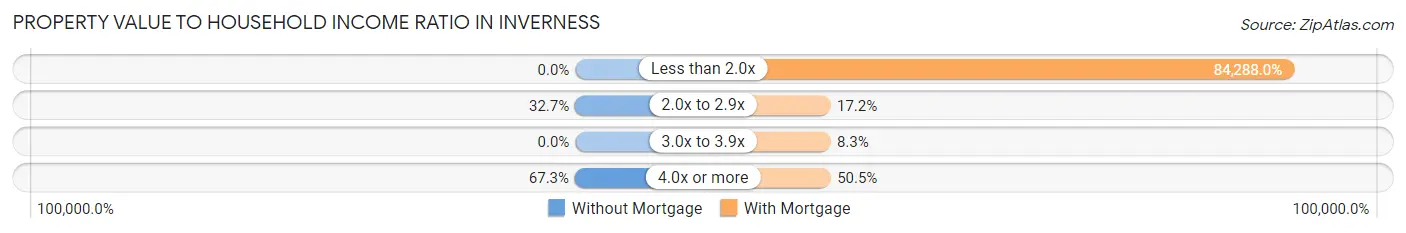
| Value-to-Income Ratio | Without Mortgage | With Mortgage |
| Less than 2.0x | 0 (0.0%) | 161,833 (84,288.0%) |
| 2.0x to 2.9x | 18 (32.7%) | 33 (17.2%) |
| 3.0x to 3.9x | 0 (0.0%) | 16 (8.3%) |
| 4.0x or more | 37 (67.3%) | 97 (50.5%) |
| Total | 55 (100.0%) | 192 (100.0%) |
Real Estate Taxes by Mortgage Status in Inverness
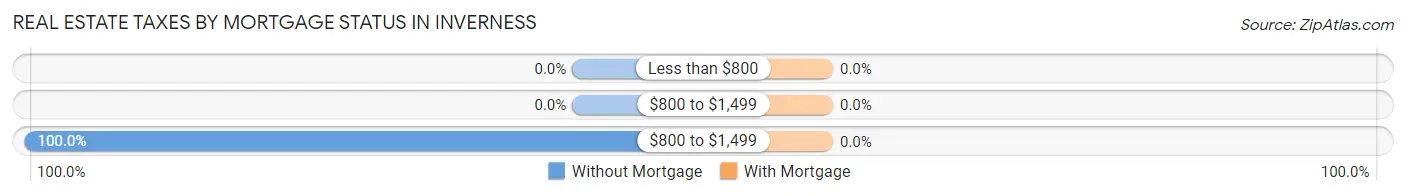
| Property Taxes | Without Mortgage | With Mortgage |
| Less than $800 | 0 (0.0%) | 0 (0.0%) |
| $800 to $1,499 | 0 (0.0%) | 0 (0.0%) |
| $800 to $1,499 | 55 (100.0%) | 0 (0.0%) |
| Total | 55 (100.0%) | 192 (100.0%) |
Health & Disability in Inverness
Health Insurance Coverage by Age in Inverness
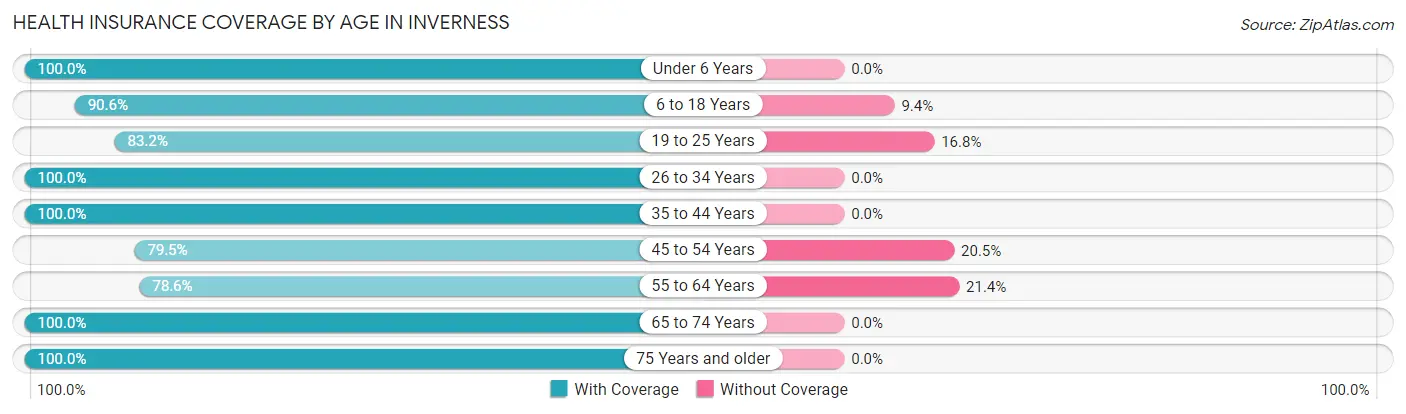
| Age Bracket | With Coverage | Without Coverage |
| Under 6 Years | 146 (100.0%) | 0 (0.0%) |
| 6 to 18 Years | 184 (90.6%) | 19 (9.4%) |
| 19 to 25 Years | 268 (83.2%) | 54 (16.8%) |
| 26 to 34 Years | 880 (100.0%) | 0 (0.0%) |
| 35 to 44 Years | 510 (100.0%) | 0 (0.0%) |
| 45 to 54 Years | 132 (79.5%) | 34 (20.5%) |
| 55 to 64 Years | 268 (78.6%) | 73 (21.4%) |
| 65 to 74 Years | 136 (100.0%) | 0 (0.0%) |
| 75 Years and older | 68 (100.0%) | 0 (0.0%) |
| Total | 2,592 (93.5%) | 180 (6.5%) |
Health Insurance Coverage by Citizenship Status in Inverness
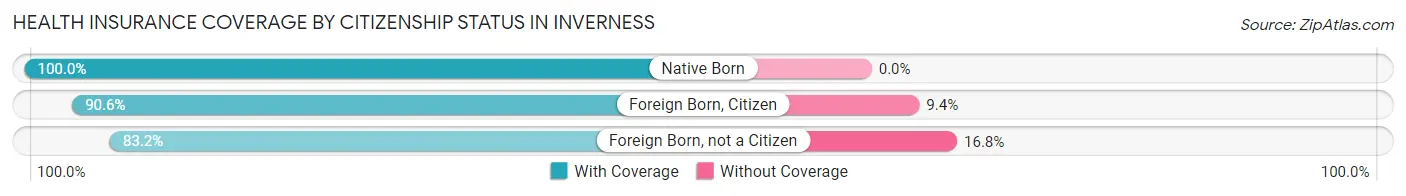
| Citizenship Status | With Coverage | Without Coverage |
| Native Born | 146 (100.0%) | 0 (0.0%) |
| Foreign Born, Citizen | 184 (90.6%) | 19 (9.4%) |
| Foreign Born, not a Citizen | 268 (83.2%) | 54 (16.8%) |
Health Insurance Coverage by Household Income in Inverness
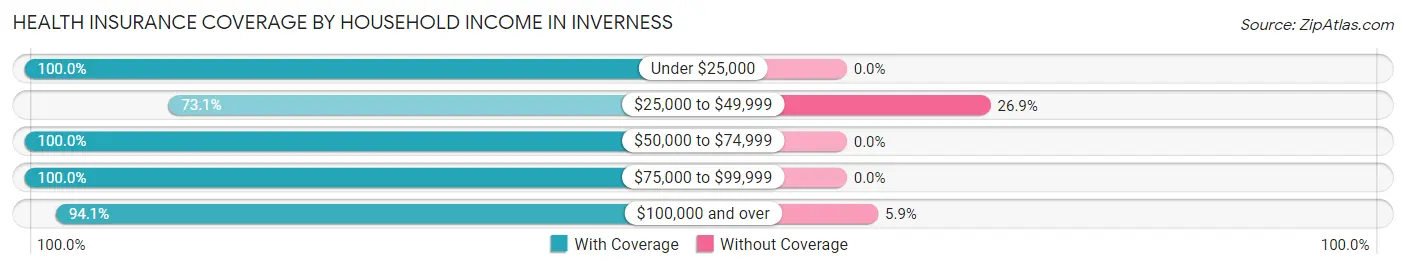
| Household Income | With Coverage | Without Coverage |
| Under $25,000 | 132 (100.0%) | 0 (0.0%) |
| $25,000 to $49,999 | 198 (73.1%) | 73 (26.9%) |
| $50,000 to $74,999 | 321 (100.0%) | 0 (0.0%) |
| $75,000 to $99,999 | 221 (100.0%) | 0 (0.0%) |
| $100,000 and over | 1,720 (94.1%) | 107 (5.9%) |
Public vs Private Health Insurance Coverage by Age in Inverness
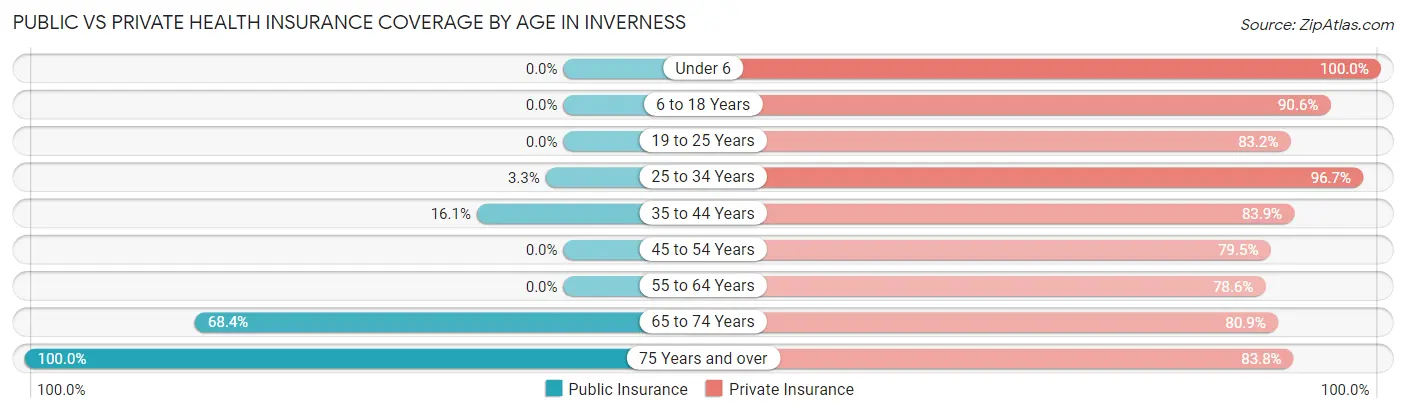
| Age Bracket | Public Insurance | Private Insurance |
| Under 6 | 0 (0.0%) | 146 (100.0%) |
| 6 to 18 Years | 0 (0.0%) | 184 (90.6%) |
| 19 to 25 Years | 0 (0.0%) | 268 (83.2%) |
| 25 to 34 Years | 29 (3.3%) | 851 (96.7%) |
| 35 to 44 Years | 82 (16.1%) | 428 (83.9%) |
| 45 to 54 Years | 0 (0.0%) | 132 (79.5%) |
| 55 to 64 Years | 0 (0.0%) | 268 (78.6%) |
| 65 to 74 Years | 93 (68.4%) | 110 (80.9%) |
| 75 Years and over | 68 (100.0%) | 57 (83.8%) |
| Total | 272 (9.8%) | 2,444 (88.2%) |
Disability Status by Sex by Age in Inverness
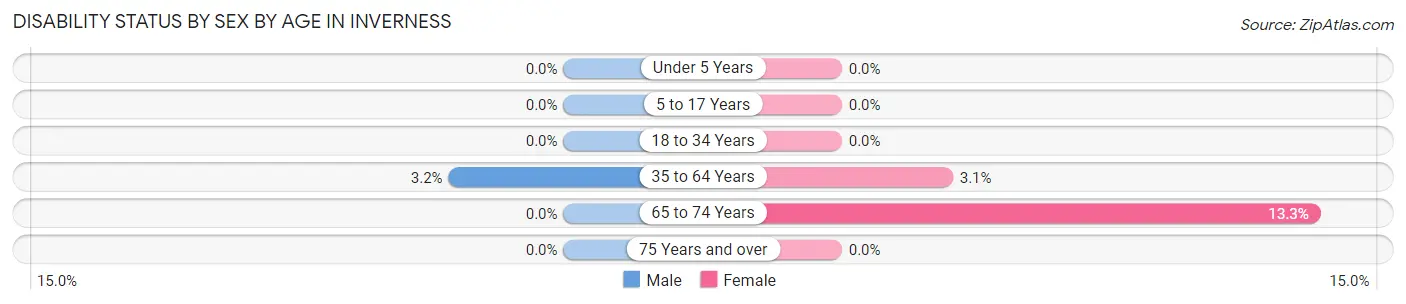
| Age Bracket | Male | Female |
| Under 5 Years | 0 (0.0%) | 0 (0.0%) |
| 5 to 17 Years | 0 (0.0%) | 0 (0.0%) |
| 18 to 34 Years | 0 (0.0%) | 0 (0.0%) |
| 35 to 64 Years | 17 (3.2%) | 15 (3.1%) |
| 65 to 74 Years | 0 (0.0%) | 10 (13.3%) |
| 75 Years and over | 0 (0.0%) | 0 (0.0%) |
Disability Class by Sex by Age in Inverness
Disability Class: Hearing Difficulty
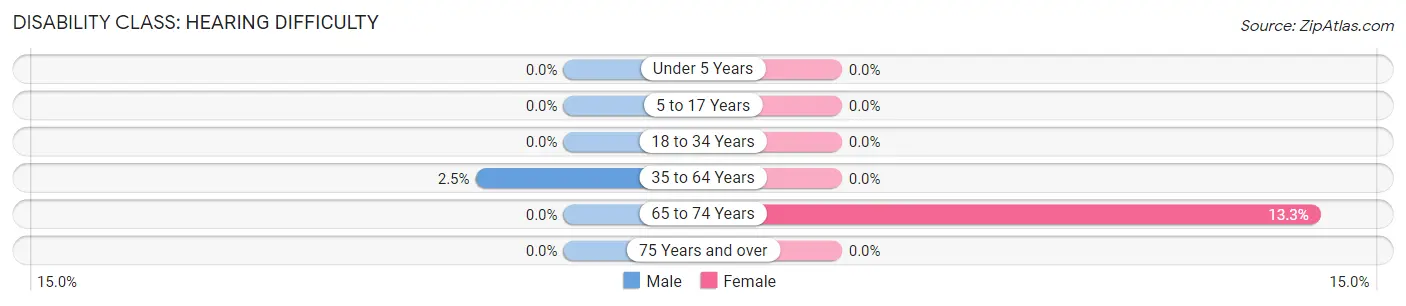
| Age Bracket | Male | Female |
| Under 5 Years | 0 (0.0%) | 0 (0.0%) |
| 5 to 17 Years | 0 (0.0%) | 0 (0.0%) |
| 18 to 34 Years | 0 (0.0%) | 0 (0.0%) |
| 35 to 64 Years | 13 (2.5%) | 0 (0.0%) |
| 65 to 74 Years | 0 (0.0%) | 10 (13.3%) |
| 75 Years and over | 0 (0.0%) | 0 (0.0%) |
Disability Class: Vision Difficulty
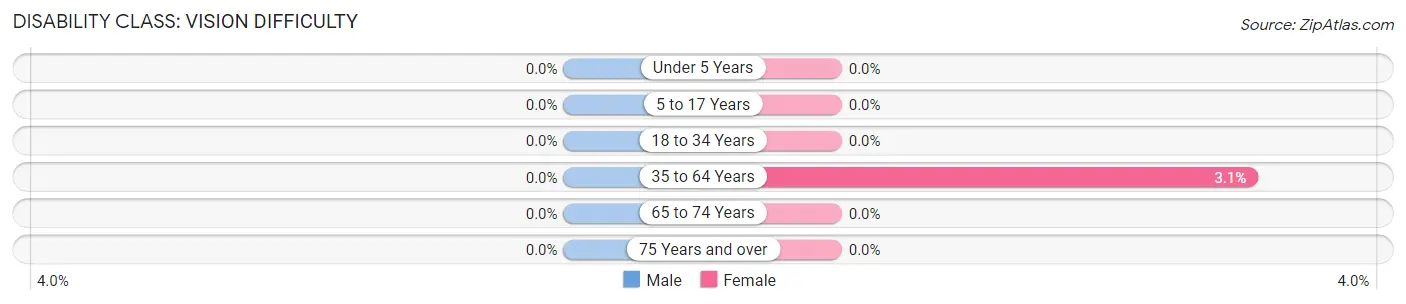
| Age Bracket | Male | Female |
| Under 5 Years | 0 (0.0%) | 0 (0.0%) |
| 5 to 17 Years | 0 (0.0%) | 0 (0.0%) |
| 18 to 34 Years | 0 (0.0%) | 0 (0.0%) |
| 35 to 64 Years | 0 (0.0%) | 15 (3.1%) |
| 65 to 74 Years | 0 (0.0%) | 0 (0.0%) |
| 75 Years and over | 0 (0.0%) | 0 (0.0%) |
Disability Class: Cognitive Difficulty
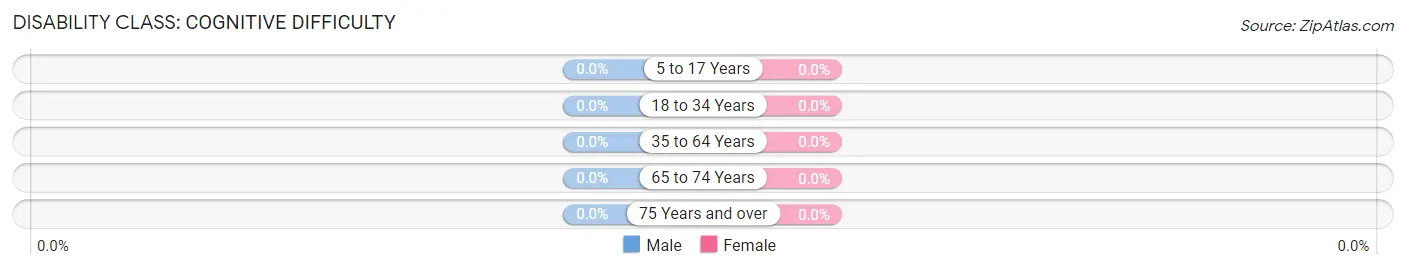
| Age Bracket | Male | Female |
| 5 to 17 Years | 0 (0.0%) | 0 (0.0%) |
| 18 to 34 Years | 0 (0.0%) | 0 (0.0%) |
| 35 to 64 Years | 0 (0.0%) | 0 (0.0%) |
| 65 to 74 Years | 0 (0.0%) | 0 (0.0%) |
| 75 Years and over | 0 (0.0%) | 0 (0.0%) |
Disability Class: Ambulatory Difficulty
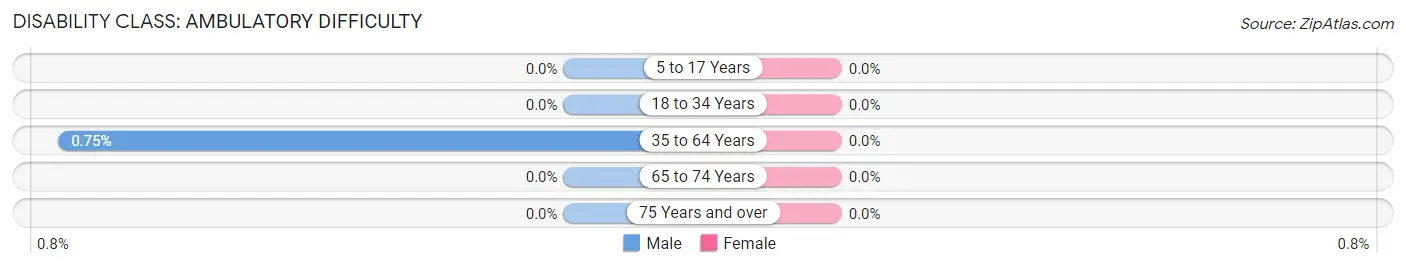
| Age Bracket | Male | Female |
| 5 to 17 Years | 0 (0.0%) | 0 (0.0%) |
| 18 to 34 Years | 0 (0.0%) | 0 (0.0%) |
| 35 to 64 Years | 4 (0.7%) | 0 (0.0%) |
| 65 to 74 Years | 0 (0.0%) | 0 (0.0%) |
| 75 Years and over | 0 (0.0%) | 0 (0.0%) |
Disability Class: Self-Care Difficulty
| Age Bracket | Male | Female |
| 5 to 17 Years | 0 (0.0%) | 0 (0.0%) |
| 18 to 34 Years | 0 (0.0%) | 0 (0.0%) |
| 35 to 64 Years | 0 (0.0%) | 0 (0.0%) |
| 65 to 74 Years | 0 (0.0%) | 0 (0.0%) |
| 75 Years and over | 0 (0.0%) | 0 (0.0%) |
Technology Access in Inverness
Computing Device Access in Inverness
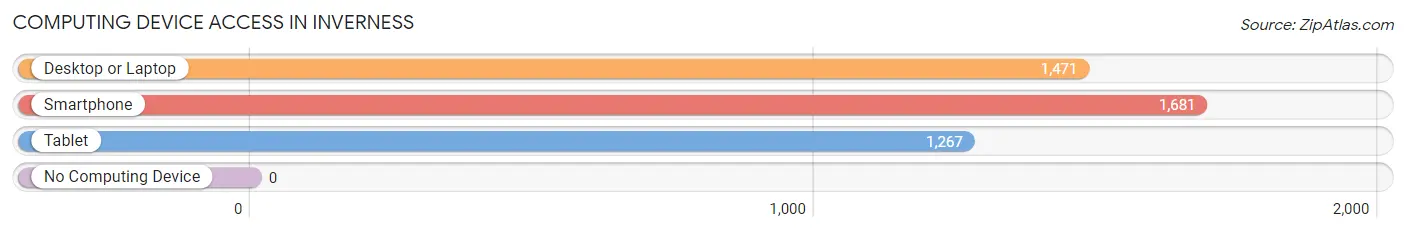
| Device Type | # Households | % Households |
| Desktop or Laptop | 1,471 | 86.8% |
| Smartphone | 1,681 | 99.2% |
| Tablet | 1,267 | 74.8% |
| No Computing Device | 0 | 0.0% |
| Total | 1,694 | 100.0% |
Internet Access in Inverness
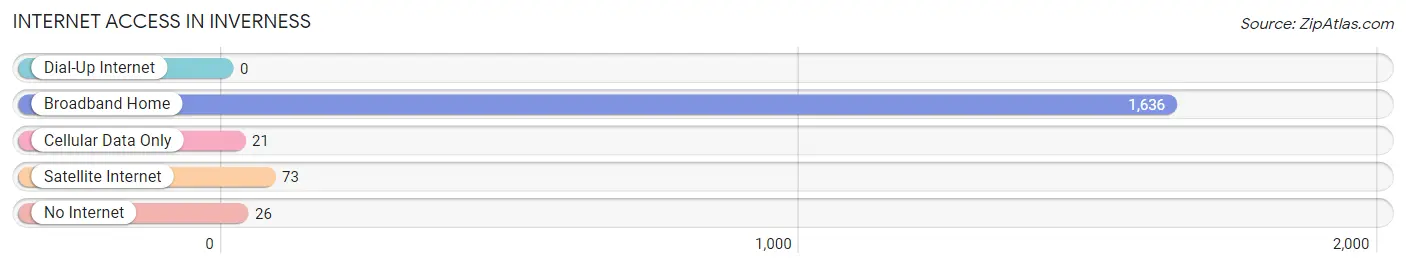
| Internet Type | # Households | % Households |
| Dial-Up Internet | 0 | 0.0% |
| Broadband Home | 1,636 | 96.6% |
| Cellular Data Only | 21 | 1.2% |
| Satellite Internet | 73 | 4.3% |
| No Internet | 26 | 1.5% |
| Total | 1,694 | 100.0% |
Inverness Summary
Inverness is a small town located in the Rocky Mountains of Colorado, United States. It is situated in the Arapahoe National Forest, approximately 30 miles west of Denver. The town was founded in 1881 and has a population of approximately 1,000 people.
Geography
Inverness is located in the foothills of the Rocky Mountains, at an elevation of 8,000 feet. The town is surrounded by the Arapahoe National Forest, which provides a variety of outdoor activities such as hiking, camping, fishing, and skiing. The town is also close to several ski resorts, including Loveland Ski Area, Arapahoe Basin, and Copper Mountain.
The town is situated on the South Platte River, which is a major tributary of the Colorado River. The river provides a variety of recreational activities, including rafting, kayaking, and fishing.
Economy
Inverness is a small, rural town with a limited economy. The town’s main industry is tourism, as it is a popular destination for outdoor enthusiasts. The town also has a few small businesses, including restaurants, shops, and a few bed and breakfasts.
Demographics
Inverness has a population of approximately 1,000 people. The town is predominantly white, with a small Hispanic population. The median household income is $50,000, and the median home value is $250,000.
History
Inverness was founded in 1881 by a group of settlers from Scotland. The town was named after the Scottish town of Inverness, and the settlers brought with them many of the traditions and customs of their homeland.
The town grew slowly over the years, and by the early 1900s, it had become a popular destination for outdoor enthusiasts. The town was also home to a number of small businesses, including a sawmill, a general store, and a hotel.
In the 1950s, the town began to decline as the population moved away to larger cities. However, in the 1970s, the town began to experience a resurgence as outdoor enthusiasts rediscovered the area. Today, Inverness is a popular destination for outdoor enthusiasts, and the town has experienced a steady growth in population over the past few decades.
Common Questions
What is Per Capita Income in Inverness?
Per Capita income in Inverness is $76,343.
What is the Median Family Income in Inverness?
Median Family Income in Inverness is $155,221.
What is the Median Household income in Inverness?
Median Household Income in Inverness is $109,339.
What is Income or Wage Gap in Inverness?
Income or Wage Gap in Inverness is 41.1%.
Women in Inverness earn 58.9 cents for every dollar earned by a man.
What is Inequality or Gini Index in Inverness?
Inequality or Gini Index in Inverness is 0.38.
What is the Total Population of Inverness?
Total Population of Inverness is 2,772.
What is the Total Male Population of Inverness?
Total Male Population of Inverness is 1,624.
What is the Total Female Population of Inverness?
Total Female Population of Inverness is 1,148.
What is the Ratio of Males per 100 Females in Inverness?
There are 141.46 Males per 100 Females in Inverness.
What is the Ratio of Females per 100 Males in Inverness?
There are 70.69 Females per 100 Males in Inverness.
What is the Median Population Age in Inverness?
Median Population Age in Inverness is 32.8 Years.
What is the Average Family Size in Inverness
Average Family Size in Inverness is 2.5 People.
What is the Average Household Size in Inverness
Average Household Size in Inverness is 1.6 People.
How Large is the Labor Force in Inverness?
There are 2,223 People in the Labor Forcein in Inverness.
What is the Percentage of People in the Labor Force in Inverness?
90.9% of People are in the Labor Force in Inverness.
What is the Unemployment Rate in Inverness?
Unemployment Rate in Inverness is 3.3%.