Lost Creek, TX Map & Demographics
Lost Creek Map
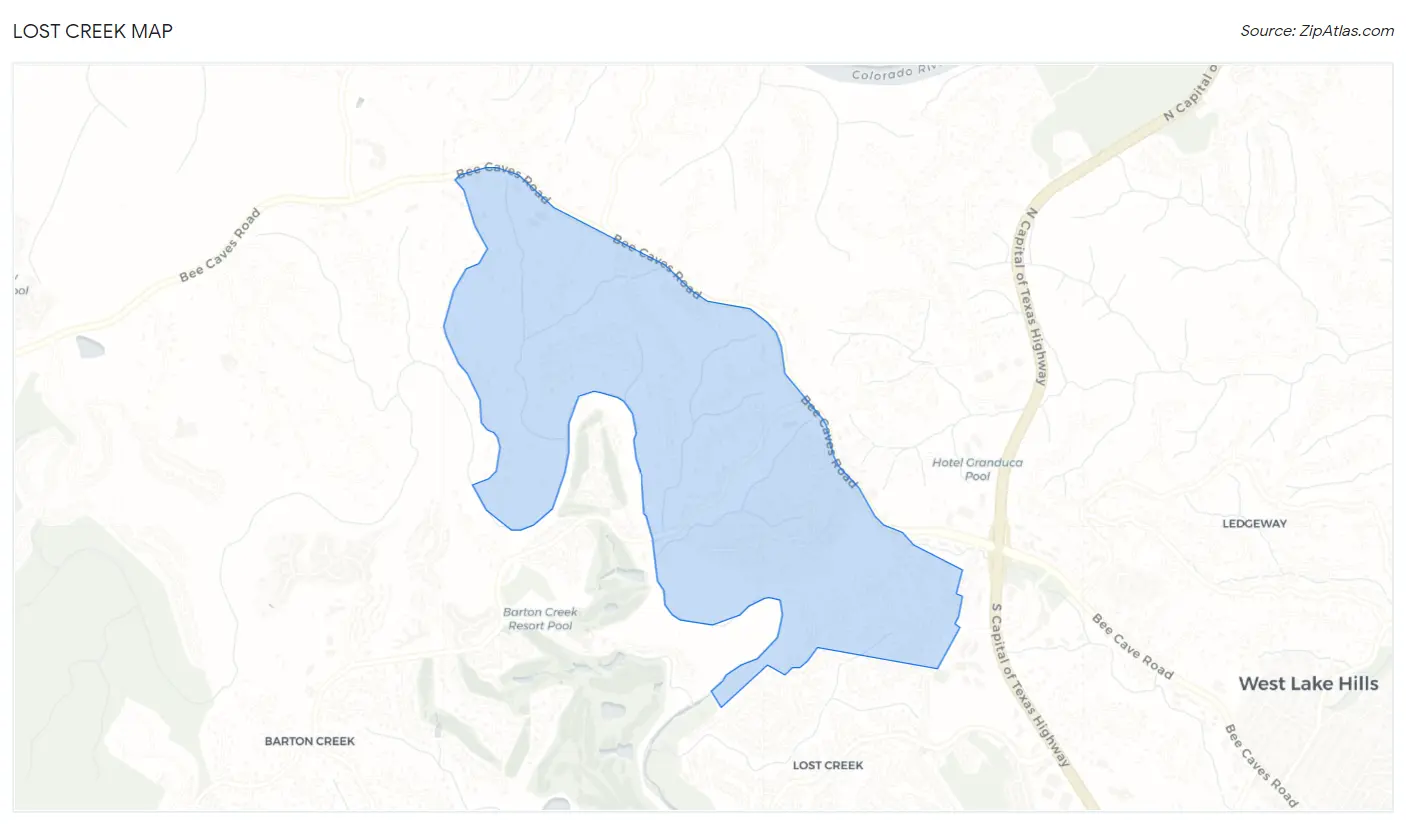
Lost Creek Overview
$79,466
PER CAPITA INCOME
$148,355
AVG FAMILY INCOME
$149,868
AVG HOUSEHOLD INCOME
0.56
INEQUALITY / GINI INDEX
1,159
TOTAL POPULATION
579
MALE POPULATION
580
FEMALE POPULATION
99.83
MALES / 100 FEMALES
100.17
FEMALES / 100 MALES
44.8
MEDIAN AGE
3.0
AVG FAMILY SIZE
2.8
AVG HOUSEHOLD SIZE
519
LABOR FORCE [ PEOPLE ]
57.4%
PERCENT IN LABOR FORCE
6.2%
UNEMPLOYMENT RATE
Income in Lost Creek
Income Overview in Lost Creek
Per Capita Income in Lost Creek is $79,466, while median incomes of families and households are $148,355 and $149,868 respectively.
| Characteristic | Number | Measure |
| Per Capita Income | 1,159 | $79,466 |
| Median Family Income | 361 | $148,355 |
| Mean Family Income | 361 | $234,885 |
| Median Household Income | 420 | $149,868 |
| Mean Household Income | 420 | $220,440 |
| Income Deficit | 361 | $0 |
| Wage / Income Gap (%) | 1,159 | 0.00% |
| Wage / Income Gap ($) | 1,159 | 100.00¢ per $1 |
| Gini / Inequality Index | 1,159 | 0.56 |
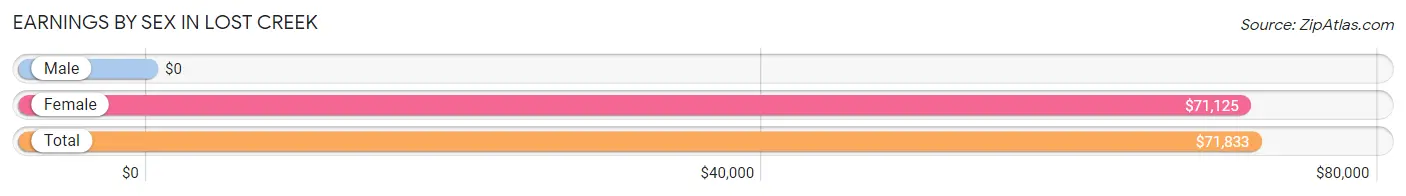
Earnings by Sex in Lost Creek
| Sex | Number | Average Earnings |
| Male | 311 (56.1%) | $0 |
| Female | 243 (43.9%) | $71,125 |
| Total | 554 (100.0%) | $71,833 |
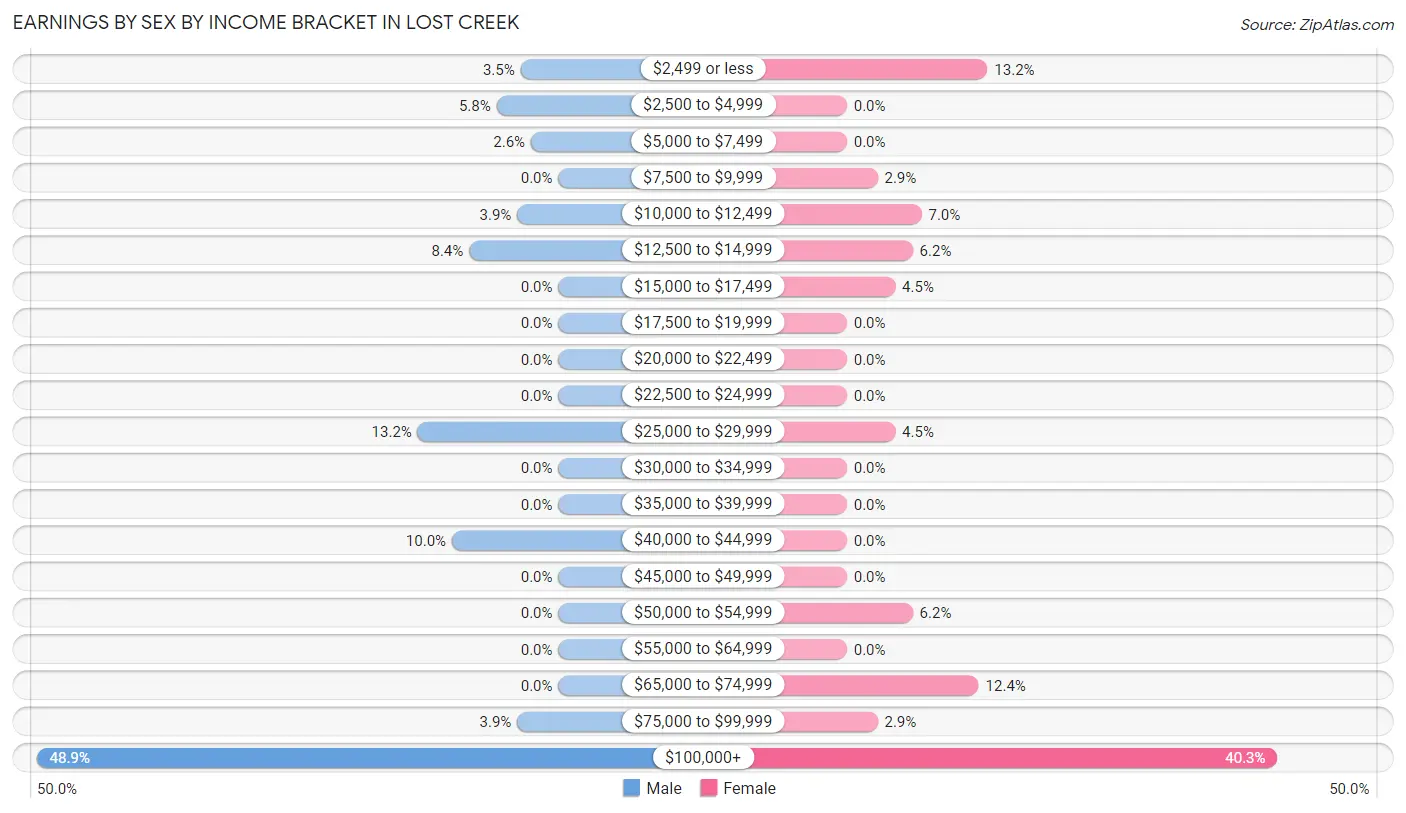
Earnings by Sex by Income Bracket in Lost Creek
The most common earnings brackets in Lost Creek are $100,000+ for men (152 | 48.9%) and $100,000+ for women (98 | 40.3%).
| Income | Male | Female |
| $2,499 or less | 11 (3.5%) | 32 (13.2%) |
| $2,500 to $4,999 | 18 (5.8%) | 0 (0.0%) |
| $5,000 to $7,499 | 8 (2.6%) | 0 (0.0%) |
| $7,500 to $9,999 | 0 (0.0%) | 7 (2.9%) |
| $10,000 to $12,499 | 12 (3.9%) | 17 (7.0%) |
| $12,500 to $14,999 | 26 (8.4%) | 15 (6.2%) |
| $15,000 to $17,499 | 0 (0.0%) | 11 (4.5%) |
| $17,500 to $19,999 | 0 (0.0%) | 0 (0.0%) |
| $20,000 to $22,499 | 0 (0.0%) | 0 (0.0%) |
| $22,500 to $24,999 | 0 (0.0%) | 0 (0.0%) |
| $25,000 to $29,999 | 41 (13.2%) | 11 (4.5%) |
| $30,000 to $34,999 | 0 (0.0%) | 0 (0.0%) |
| $35,000 to $39,999 | 0 (0.0%) | 0 (0.0%) |
| $40,000 to $44,999 | 31 (10.0%) | 0 (0.0%) |
| $45,000 to $49,999 | 0 (0.0%) | 0 (0.0%) |
| $50,000 to $54,999 | 0 (0.0%) | 15 (6.2%) |
| $55,000 to $64,999 | 0 (0.0%) | 0 (0.0%) |
| $65,000 to $74,999 | 0 (0.0%) | 30 (12.3%) |
| $75,000 to $99,999 | 12 (3.9%) | 7 (2.9%) |
| $100,000+ | 152 (48.9%) | 98 (40.3%) |
| Total | 311 (100.0%) | 243 (100.0%) |
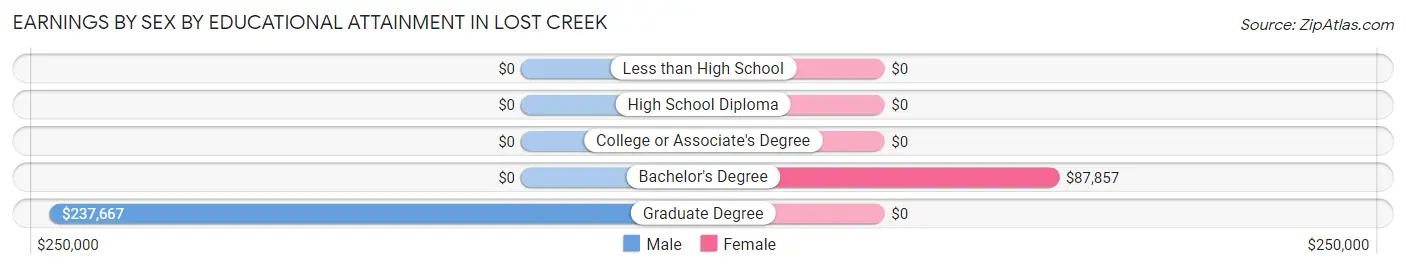
Earnings by Sex by Educational Attainment in Lost Creek
| Educational Attainment | Male Income | Female Income |
| Less than High School | - | - |
| High School Diploma | - | - |
| College or Associate's Degree | - | - |
| Bachelor's Degree | - | - |
| Graduate Degree | $237,667 | $0 |
| Total | - | - |
Family Income in Lost Creek
Family Income Brackets in Lost Creek
According to the Lost Creek family income data, there are 131 families falling into the $200,000+ income range, which is the most common income bracket and makes up 36.3% of all families.
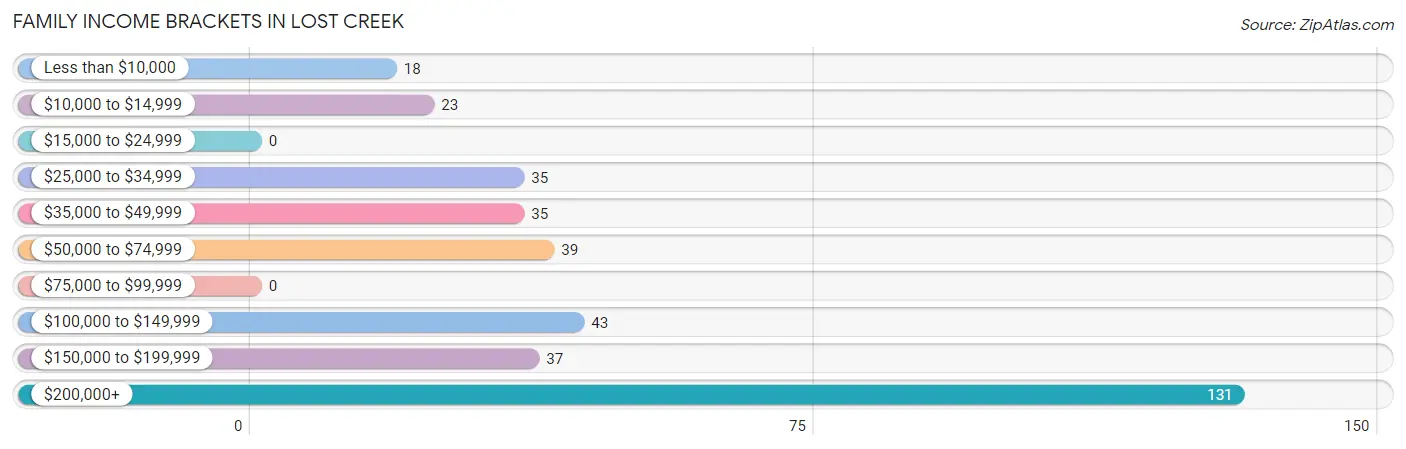
| Income Bracket | # Families | % Families |
| Less than $10,000 | 18 | 5.0% |
| $10,000 to $14,999 | 23 | 6.4% |
| $15,000 to $24,999 | 0 | 0.0% |
| $25,000 to $34,999 | 35 | 9.7% |
| $35,000 to $49,999 | 35 | 9.7% |
| $50,000 to $74,999 | 39 | 10.8% |
| $75,000 to $99,999 | 0 | 0.0% |
| $100,000 to $149,999 | 43 | 11.9% |
| $150,000 to $199,999 | 37 | 10.2% |
| $200,000+ | 131 | 36.3% |
Family Income by Famaliy Size in Lost Creek
3-person families (81 | 22.4%) account for the highest median family income in Lost Creek with $183,047 per family, while 3-person families (81 | 22.4%) have the highest median income of $61,016 per family member.
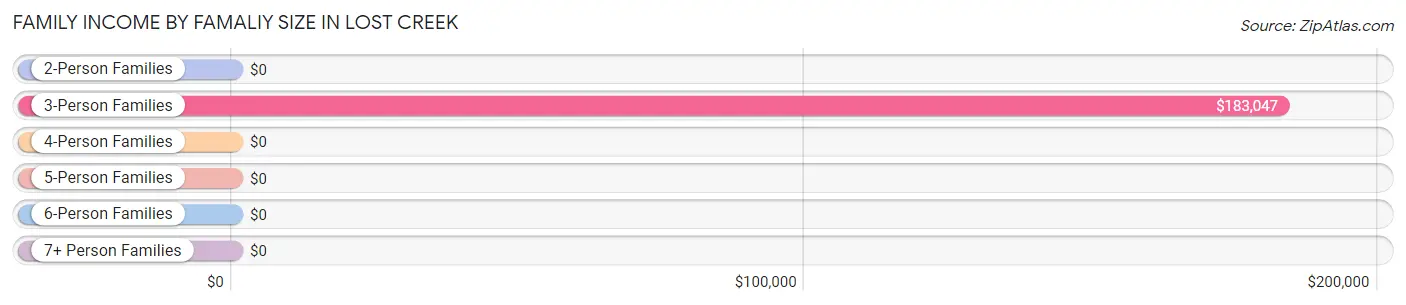
| Income Bracket | # Families | Median Income |
| 2-Person Families | 160 (44.3%) | $0 |
| 3-Person Families | 81 (22.4%) | $183,047 |
| 4-Person Families | 55 (15.2%) | $0 |
| 5-Person Families | 54 (15.0%) | $0 |
| 6-Person Families | 0 (0.0%) | $0 |
| 7+ Person Families | 11 (3.0%) | $0 |
| Total | 361 (100.0%) | $148,355 |
Family Income by Number of Earners in Lost Creek
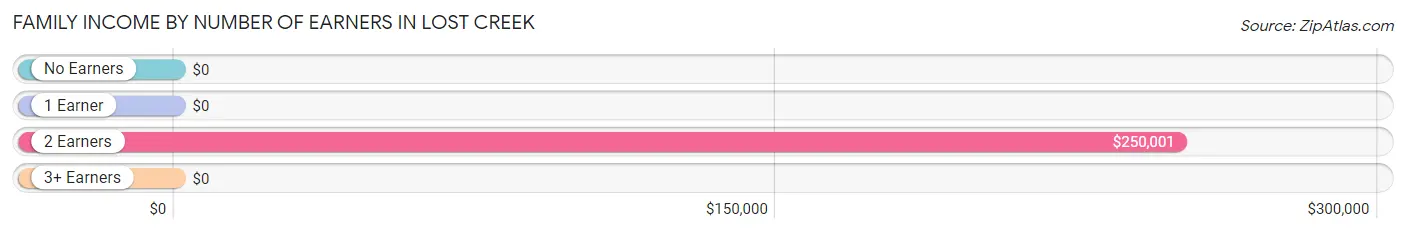
| Number of Earners | # Families | Median Income |
| No Earners | 24 (6.7%) | $0 |
| 1 Earner | 184 (51.0%) | $0 |
| 2 Earners | 143 (39.6%) | $250,001 |
| 3+ Earners | 10 (2.8%) | $0 |
| Total | 361 (100.0%) | $148,355 |
Household Income in Lost Creek
Household Income Brackets in Lost Creek
With 131 households falling in the category, the $200,000+ income range is the most frequent in Lost Creek, accounting for 31.2% of all households.
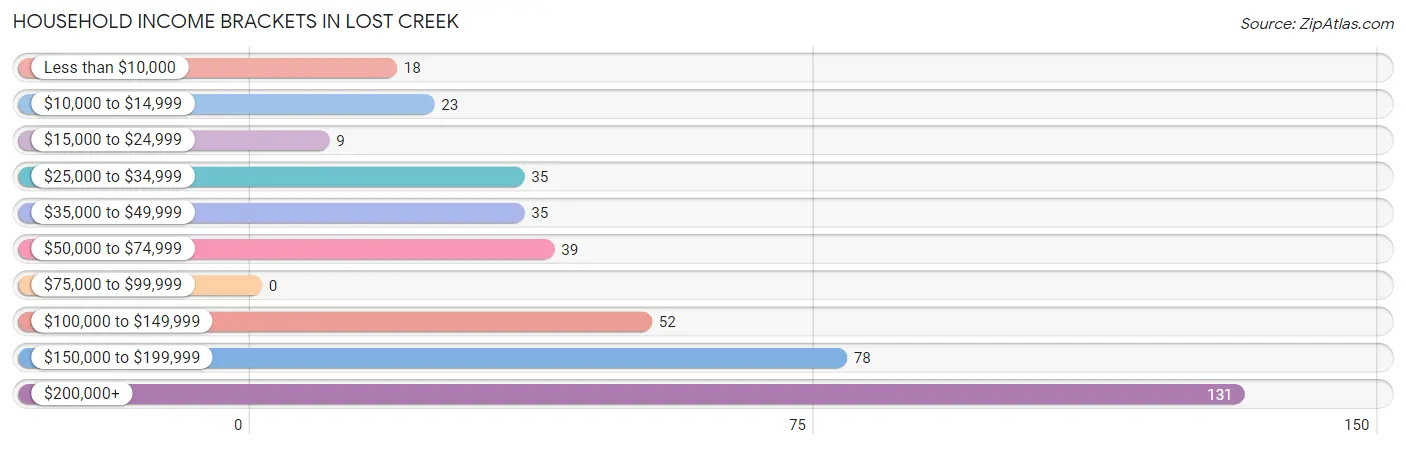
| Income Bracket | # Households | % Households |
| Less than $10,000 | 18 | 4.3% |
| $10,000 to $14,999 | 23 | 5.5% |
| $15,000 to $24,999 | 9 | 2.1% |
| $25,000 to $34,999 | 35 | 8.3% |
| $35,000 to $49,999 | 35 | 8.3% |
| $50,000 to $74,999 | 39 | 9.3% |
| $75,000 to $99,999 | 0 | 0.0% |
| $100,000 to $149,999 | 52 | 12.4% |
| $150,000 to $199,999 | 78 | 18.6% |
| $200,000+ | 131 | 31.2% |
Household Income by Householder Age in Lost Creek
The median household income in Lost Creek is $149,868, with the highest median household income of $210,833 found in the 45 to 64 years age bracket for the primary householder. A total of 208 households (49.5%) fall into this category.
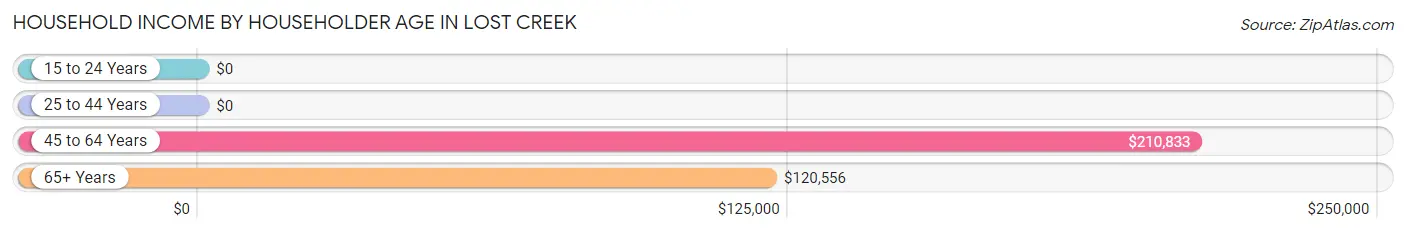
| Income Bracket | # Households | Median Income |
| 15 to 24 Years | 0 (0.0%) | $0 |
| 25 to 44 Years | 108 (25.7%) | $0 |
| 45 to 64 Years | 208 (49.5%) | $210,833 |
| 65+ Years | 104 (24.8%) | $120,556 |
| Total | 420 (100.0%) | $149,868 |
Poverty in Lost Creek
Income Below Poverty by Sex and Age in Lost Creek
With 14.3% poverty level for males and 17.9% for females among the residents of Lost Creek, 15 year old males and 18 to 24 year old females are the most vulnerable to poverty, with 35 males (100.0%) and 35 females (63.6%) in their respective age groups living below the poverty level.
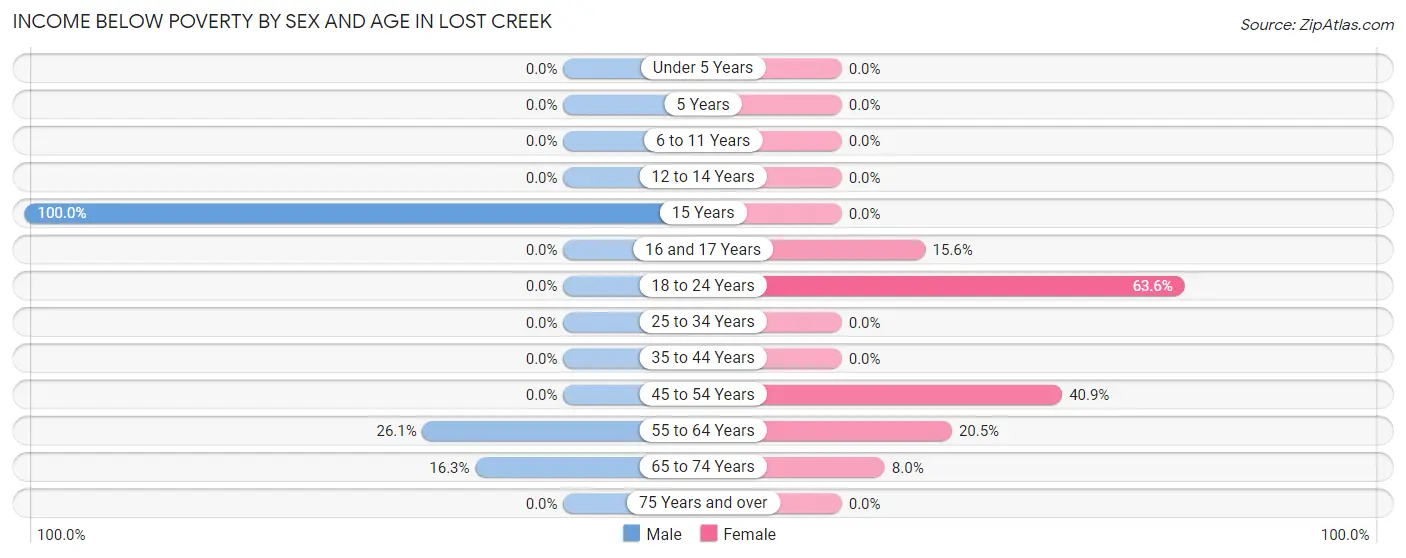
| Age Bracket | Male | Female |
| Under 5 Years | 0 (0.0%) | 0 (0.0%) |
| 5 Years | 0 (0.0%) | 0 (0.0%) |
| 6 to 11 Years | 0 (0.0%) | 0 (0.0%) |
| 12 to 14 Years | 0 (0.0%) | 0 (0.0%) |
| 15 Years | 35 (100.0%) | 0 (0.0%) |
| 16 and 17 Years | 0 (0.0%) | 7 (15.6%) |
| 18 to 24 Years | 0 (0.0%) | 35 (63.6%) |
| 25 to 34 Years | 0 (0.0%) | 0 (0.0%) |
| 35 to 44 Years | 0 (0.0%) | 0 (0.0%) |
| 45 to 54 Years | 0 (0.0%) | 36 (40.9%) |
| 55 to 64 Years | 40 (26.1%) | 18 (20.4%) |
| 65 to 74 Years | 8 (16.3%) | 8 (8.0%) |
| 75 Years and over | 0 (0.0%) | 0 (0.0%) |
| Total | 83 (14.3%) | 104 (17.9%) |
Income Above Poverty by Sex and Age in Lost Creek
According to the poverty statistics in Lost Creek, males aged under 5 years and females aged under 5 years are the age groups that are most secure financially, with 100.0% of males and 100.0% of females in these age groups living above the poverty line.
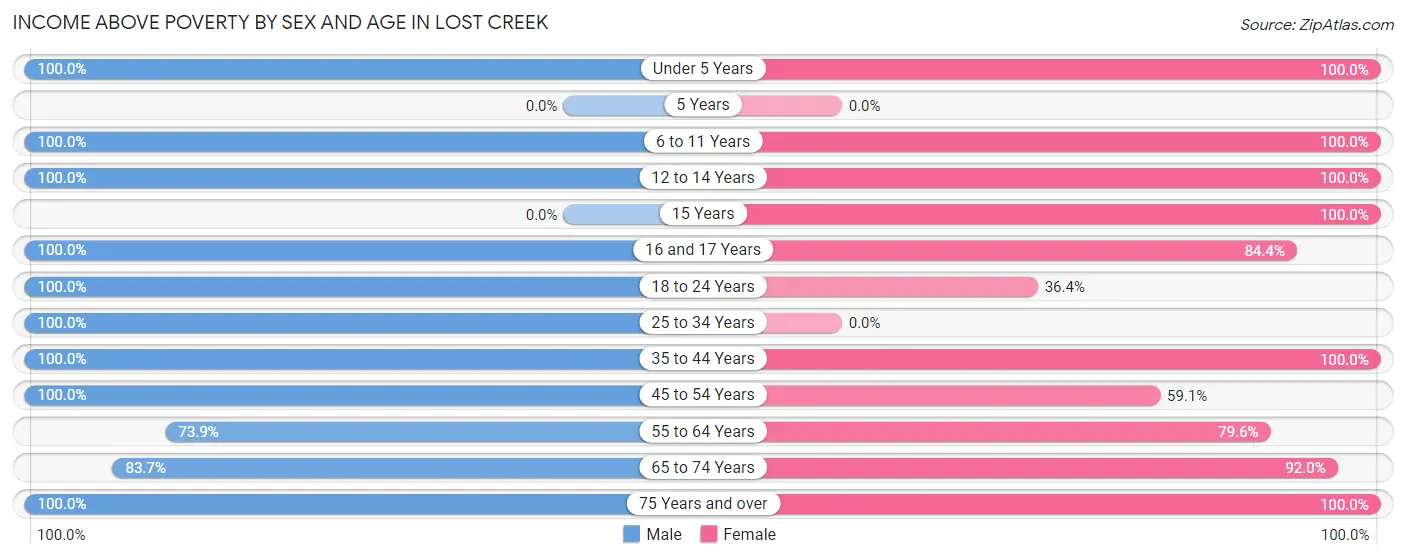
| Age Bracket | Male | Female |
| Under 5 Years | 12 (100.0%) | 31 (100.0%) |
| 5 Years | 0 (0.0%) | 0 (0.0%) |
| 6 to 11 Years | 86 (100.0%) | 20 (100.0%) |
| 12 to 14 Years | 51 (100.0%) | 16 (100.0%) |
| 15 Years | 0 (0.0%) | 4 (100.0%) |
| 16 and 17 Years | 15 (100.0%) | 38 (84.4%) |
| 18 to 24 Years | 22 (100.0%) | 20 (36.4%) |
| 25 to 34 Years | 42 (100.0%) | 0 (0.0%) |
| 35 to 44 Years | 40 (100.0%) | 115 (100.0%) |
| 45 to 54 Years | 56 (100.0%) | 52 (59.1%) |
| 55 to 64 Years | 113 (73.9%) | 70 (79.5%) |
| 65 to 74 Years | 41 (83.7%) | 92 (92.0%) |
| 75 Years and over | 18 (100.0%) | 18 (100.0%) |
| Total | 496 (85.7%) | 476 (82.1%) |
Income Below Poverty Among Married-Couple Families in Lost Creek
The poverty statistics for married-couple families in Lost Creek show that 16.0% or 47 of the total 293 families live below the poverty line. Families with 1 or 2 children have the highest poverty rate of 31.5%, comprising of 28 families. On the other hand, families with 3 or 4 children have the lowest poverty rate of 0.0%, which includes 0 families.
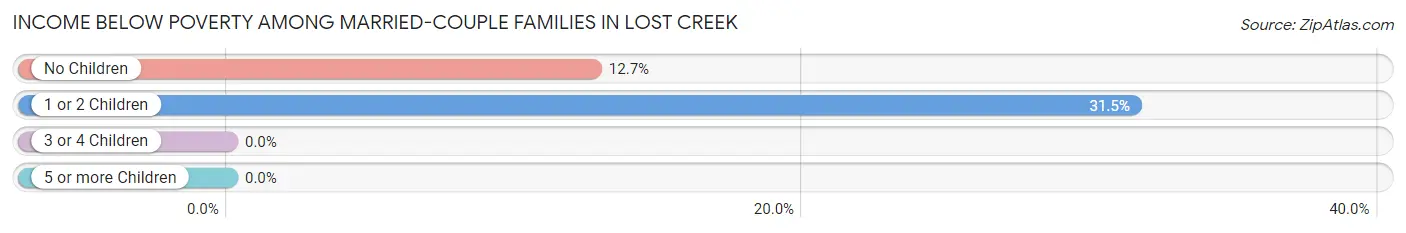
| Children | Above Poverty | Below Poverty |
| No Children | 131 (87.3%) | 19 (12.7%) |
| 1 or 2 Children | 61 (68.5%) | 28 (31.5%) |
| 3 or 4 Children | 43 (100.0%) | 0 (0.0%) |
| 5 or more Children | 11 (100.0%) | 0 (0.0%) |
| Total | 246 (84.0%) | 47 (16.0%) |
Income Below Poverty Among Single-Parent Households in Lost Creek
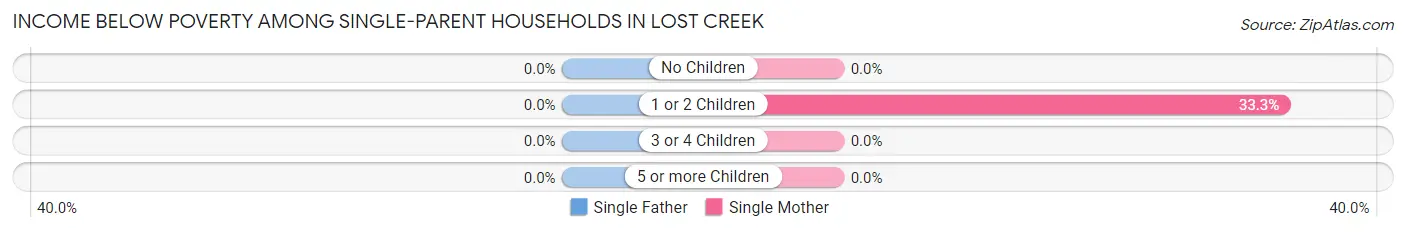
| Children | Single Father | Single Mother |
| No Children | 0 (0.0%) | 0 (0.0%) |
| 1 or 2 Children | 0 (0.0%) | 15 (33.3%) |
| 3 or 4 Children | 0 (0.0%) | 0 (0.0%) |
| 5 or more Children | 0 (0.0%) | 0 (0.0%) |
| Total | 0 (0.0%) | 15 (27.8%) |
Income Below Poverty Among Married-Couple vs Single-Parent Households in Lost Creek
The poverty data for Lost Creek shows that 47 of the married-couple family households (16.0%) and 15 of the single-parent households (22.1%) are living below the poverty level. Within the married-couple family households, those with 1 or 2 children have the highest poverty rate, with 28 households (31.5%) falling below the poverty line. Among the single-parent households, those with 1 or 2 children have the highest poverty rate, with 15 household (33.3%) living below poverty.
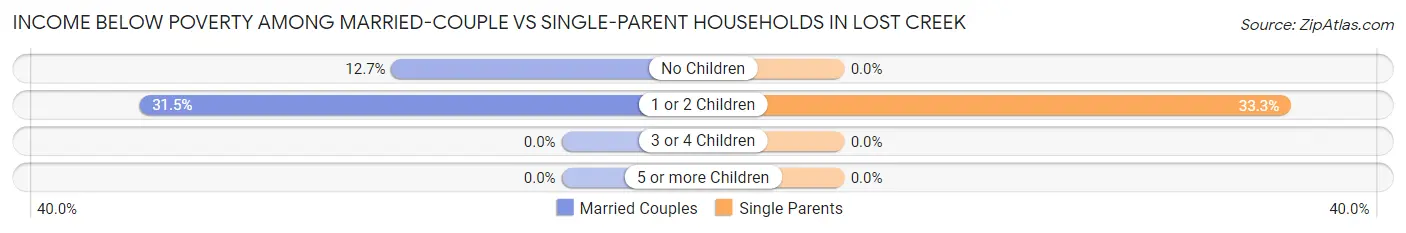
| Children | Married-Couple Families | Single-Parent Households |
| No Children | 19 (12.7%) | 0 (0.0%) |
| 1 or 2 Children | 28 (31.5%) | 15 (33.3%) |
| 3 or 4 Children | 0 (0.0%) | 0 (0.0%) |
| 5 or more Children | 0 (0.0%) | 0 (0.0%) |
| Total | 47 (16.0%) | 15 (22.1%) |
Race in Lost Creek
The most populous races in Lost Creek are White / Caucasian (944 | 81.5%), Hispanic or Latino (216 | 18.6%), and Two or more Races (74 | 6.4%).
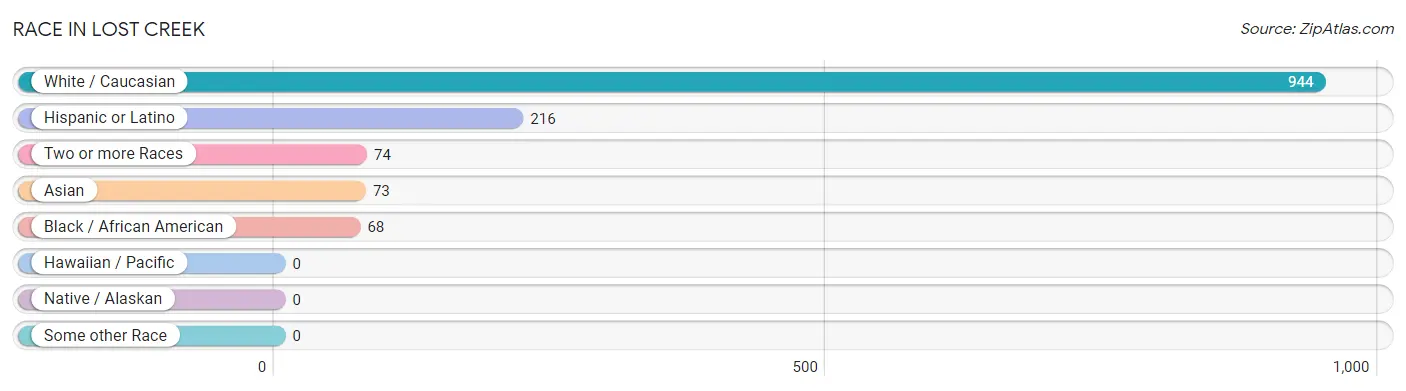
| Race | # Population | % Population |
| Asian | 73 | 6.3% |
| Black / African American | 68 | 5.9% |
| Hawaiian / Pacific | 0 | 0.0% |
| Hispanic or Latino | 216 | 18.6% |
| Native / Alaskan | 0 | 0.0% |
| White / Caucasian | 944 | 81.5% |
| Two or more Races | 74 | 6.4% |
| Some other Race | 0 | 0.0% |
| Total | 1,159 | 100.0% |
Ancestry in Lost Creek
The most populous ancestries reported in Lost Creek are Mexican (173 | 14.9%), Irish (120 | 10.3%), German (114 | 9.8%), European (85 | 7.3%), and English (69 | 5.9%), together accounting for 48.4% of all Lost Creek residents.
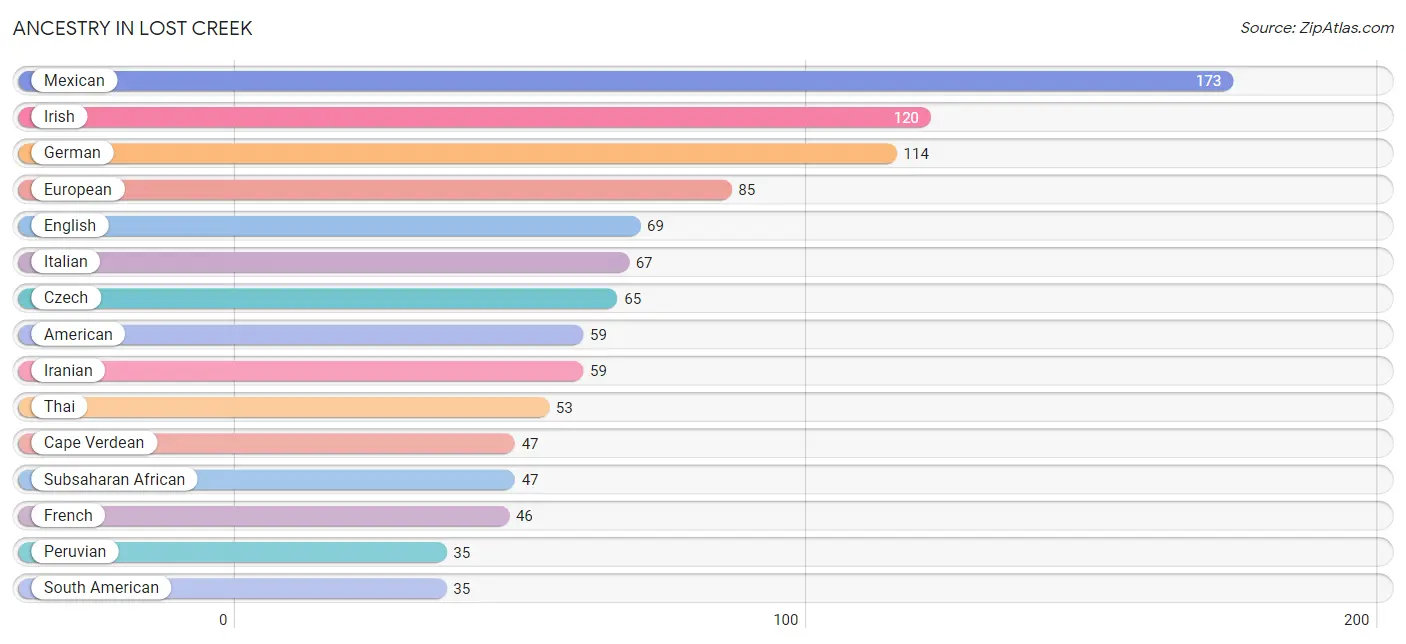
| Ancestry | # Population | % Population |
| American | 59 | 5.1% |
| Austrian | 8 | 0.7% |
| British | 8 | 0.7% |
| Burmese | 20 | 1.7% |
| Cape Verdean | 47 | 4.1% |
| Czech | 65 | 5.6% |
| Czechoslovakian | 11 | 0.9% |
| Eastern European | 8 | 0.7% |
| English | 69 | 5.9% |
| European | 85 | 7.3% |
| Finnish | 11 | 0.9% |
| French | 46 | 4.0% |
| German | 114 | 9.8% |
| Iranian | 59 | 5.1% |
| Irish | 120 | 10.3% |
| Italian | 67 | 5.8% |
| Mexican | 173 | 14.9% |
| Peruvian | 35 | 3.0% |
| Russian | 9 | 0.8% |
| Scotch-Irish | 23 | 2.0% |
| Scottish | 33 | 2.9% |
| South American | 35 | 3.0% |
| Spaniard | 8 | 0.7% |
| Subsaharan African | 47 | 4.1% |
| Swiss | 12 | 1.0% |
| Thai | 53 | 4.6% |
| Welsh | 10 | 0.9% | View All 27 Rows |
Immigrants in Lost Creek
The most numerous immigrant groups reported in Lost Creek came from Asia (64 | 5.5%), South Central Asia (44 | 3.8%), India (23 | 2.0%), Eastern Asia (20 | 1.7%), and Korea (20 | 1.7%), together accounting for 14.8% of all Lost Creek residents.
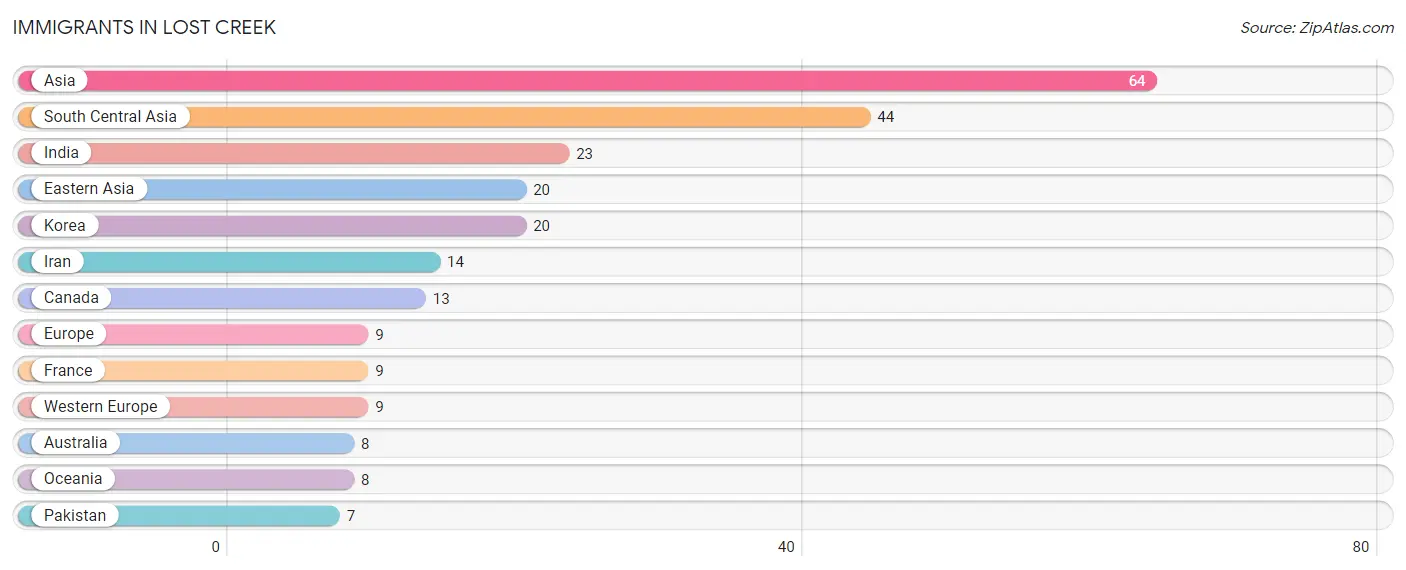
| Immigration Origin | # Population | % Population |
| Asia | 64 | 5.5% |
| Australia | 8 | 0.7% |
| Canada | 13 | 1.1% |
| Eastern Asia | 20 | 1.7% |
| Europe | 9 | 0.8% |
| France | 9 | 0.8% |
| India | 23 | 2.0% |
| Iran | 14 | 1.2% |
| Korea | 20 | 1.7% |
| Oceania | 8 | 0.7% |
| Pakistan | 7 | 0.6% |
| South Central Asia | 44 | 3.8% |
| Western Europe | 9 | 0.8% | View All 13 Rows |
Sex and Age in Lost Creek
Sex and Age in Lost Creek
The most populous age groups in Lost Creek are 10 to 14 Years (102 | 17.6%) for men and 15 to 19 Years (91 | 15.7%) for women.
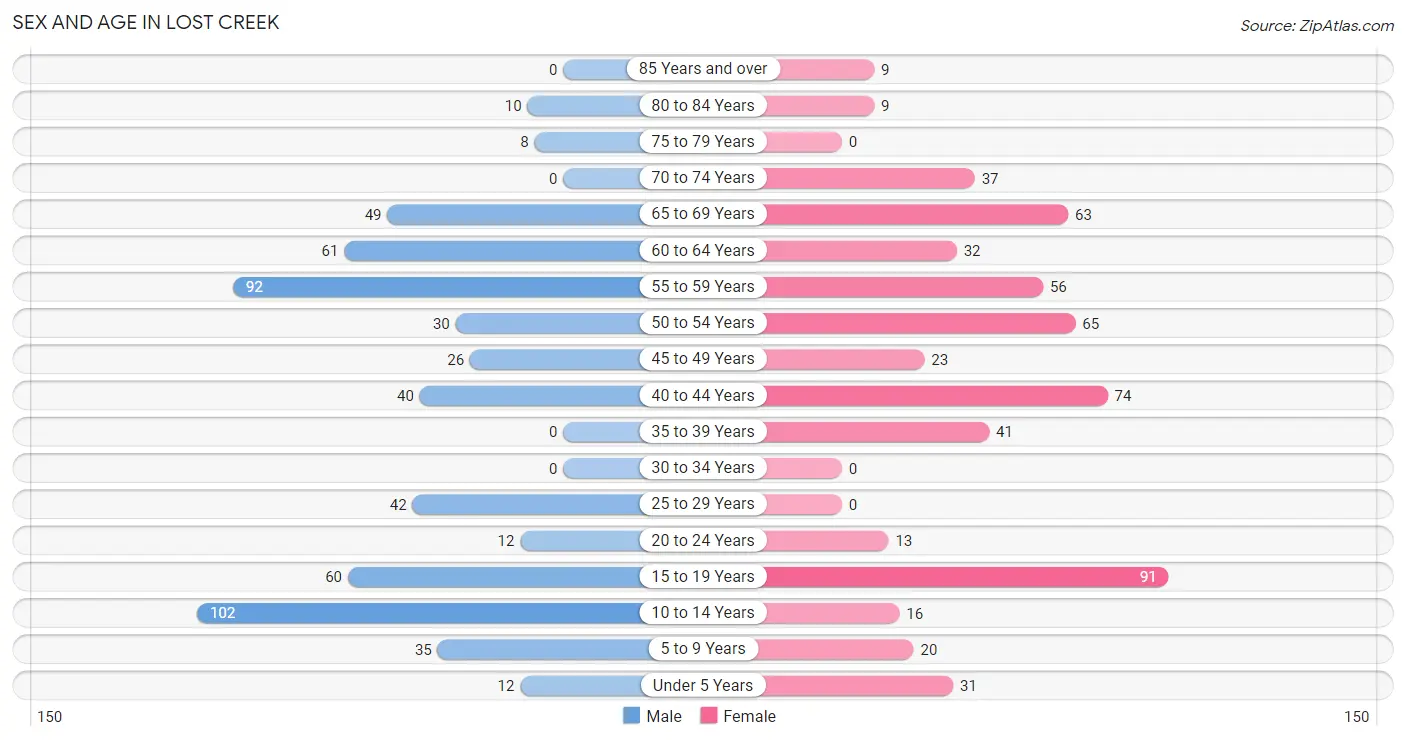
| Age Bracket | Male | Female |
| Under 5 Years | 12 (2.1%) | 31 (5.3%) |
| 5 to 9 Years | 35 (6.0%) | 20 (3.5%) |
| 10 to 14 Years | 102 (17.6%) | 16 (2.8%) |
| 15 to 19 Years | 60 (10.4%) | 91 (15.7%) |
| 20 to 24 Years | 12 (2.1%) | 13 (2.2%) |
| 25 to 29 Years | 42 (7.2%) | 0 (0.0%) |
| 30 to 34 Years | 0 (0.0%) | 0 (0.0%) |
| 35 to 39 Years | 0 (0.0%) | 41 (7.1%) |
| 40 to 44 Years | 40 (6.9%) | 74 (12.8%) |
| 45 to 49 Years | 26 (4.5%) | 23 (4.0%) |
| 50 to 54 Years | 30 (5.2%) | 65 (11.2%) |
| 55 to 59 Years | 92 (15.9%) | 56 (9.7%) |
| 60 to 64 Years | 61 (10.5%) | 32 (5.5%) |
| 65 to 69 Years | 49 (8.5%) | 63 (10.9%) |
| 70 to 74 Years | 0 (0.0%) | 37 (6.4%) |
| 75 to 79 Years | 8 (1.4%) | 0 (0.0%) |
| 80 to 84 Years | 10 (1.7%) | 9 (1.5%) |
| 85 Years and over | 0 (0.0%) | 9 (1.5%) |
| Total | 579 (100.0%) | 580 (100.0%) |
Families and Households in Lost Creek
Median Family Size in Lost Creek
The median family size in Lost Creek is 3.02 persons per family, with married-couple families (293 | 81.2%) accounting for the largest median family size of 3.21 persons per family. On the other hand, single male/father families (14 | 3.9%) represent the smallest median family size with 1.86 persons per family.
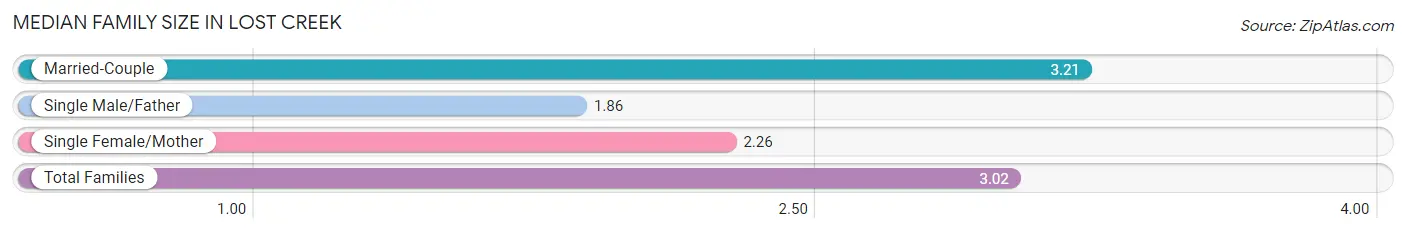
| Family Type | # Families | Family Size |
| Married-Couple | 293 (81.2%) | 3.21 |
| Single Male/Father | 14 (3.9%) | 1.86 |
| Single Female/Mother | 54 (15.0%) | 2.26 |
| Total Families | 361 (100.0%) | 3.02 |
Median Household Size in Lost Creek
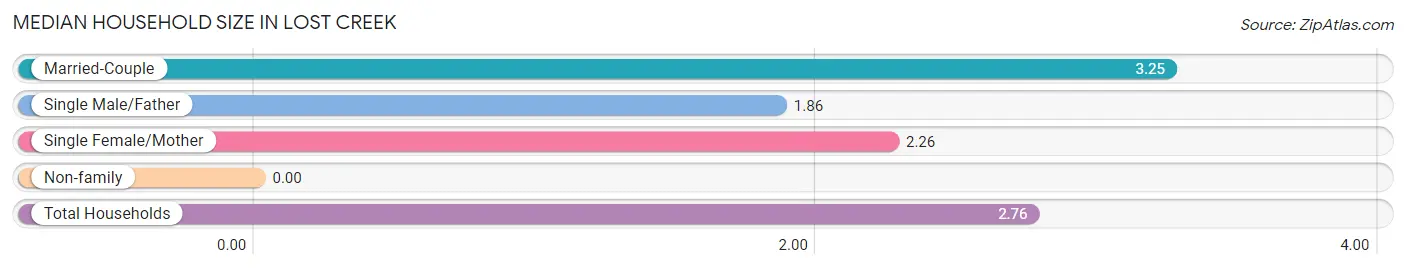
| Household Type | # Households | Household Size |
| Married-Couple | 293 (69.8%) | 3.25 |
| Single Male/Father | 14 (3.3%) | 1.86 |
| Single Female/Mother | 54 (12.9%) | 2.26 |
| Non-family | 59 (14.1%) | - |
| Total Households | 420 (100.0%) | 2.76 |
Household Size by Marriage Status in Lost Creek
Out of a total of 420 households in Lost Creek, 361 (86.0%) are family households, while 59 (14.1%) are nonfamily households. The most numerous type of family households are 2-person households, comprising 160, and the most common type of nonfamily households are 1-person households, comprising 59.
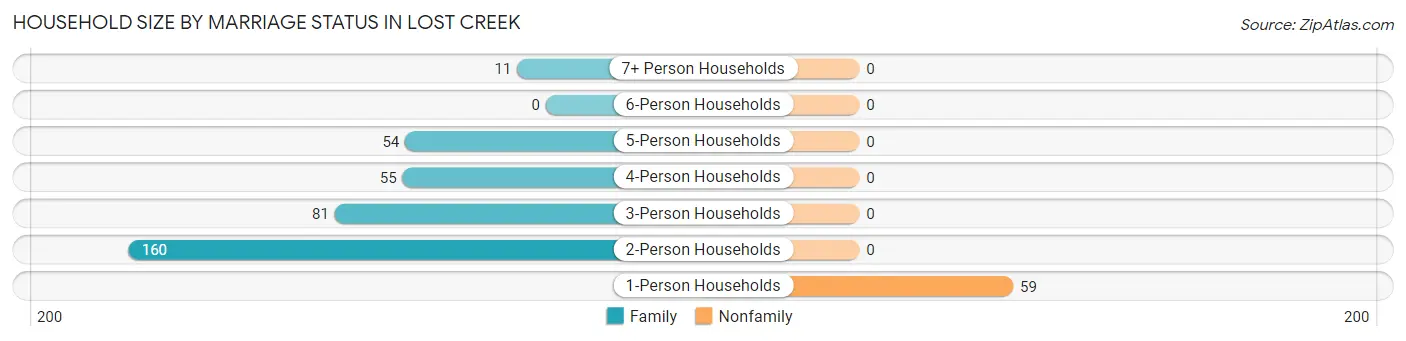
| Household Size | Family Households | Nonfamily Households |
| 1-Person Households | - | 59 (14.1%) |
| 2-Person Households | 160 (38.1%) | 0 (0.0%) |
| 3-Person Households | 81 (19.3%) | 0 (0.0%) |
| 4-Person Households | 55 (13.1%) | 0 (0.0%) |
| 5-Person Households | 54 (12.9%) | 0 (0.0%) |
| 6-Person Households | 0 (0.0%) | 0 (0.0%) |
| 7+ Person Households | 11 (2.6%) | 0 (0.0%) |
| Total | 361 (86.0%) | 59 (14.1%) |
Female Fertility in Lost Creek
Fertility by Age in Lost Creek
| Age Bracket | Women with Births | Births / 1,000 Women |
| 15 to 19 years | 0 (0.0%) | 0.0 |
| 20 to 34 years | 0 (0.0%) | 0.0 |
| 35 to 50 years | 0 (0.0%) | 0.0 |
| Total | 0 (0.0%) | 0.0 |
Fertility by Age by Marriage Status in Lost Creek
| Age Bracket | Married | Unmarried |
| 15 to 19 years | 0 (0.0%) | 0 (0.0%) |
| 20 to 34 years | 0 (0.0%) | 0 (0.0%) |
| 35 to 50 years | 0 (0.0%) | 0 (0.0%) |
| Total | 0 (0.0%) | 0 (0.0%) |
Fertility by Education in Lost Creek
| Educational Attainment | Women with Births | Births / 1,000 Women |
| Less than High School | 0 (0.0%) | 0.0 |
| High School Diploma | 0 (0.0%) | 0.0 |
| College or Associate's Degree | 0 (0.0%) | 0.0 |
| Bachelor's Degree | 0 (0.0%) | 0.0 |
| Graduate Degree | 0 (0.0%) | 0.0 |
| Total | 0 (0.0%) | 0.0 |
Fertility by Education by Marriage Status in Lost Creek
| Educational Attainment | Married | Unmarried |
| Less than High School | 0 (0.0%) | 0 (0.0%) |
| High School Diploma | 0 (0.0%) | 0 (0.0%) |
| College or Associate's Degree | 0 (0.0%) | 0 (0.0%) |
| Bachelor's Degree | 0 (0.0%) | 0 (0.0%) |
| Graduate Degree | 0 (0.0%) | 0 (0.0%) |
| Total | 0 (0.0%) | 0 (0.0%) |
Employment Characteristics in Lost Creek
Employment by Class of Employer in Lost Creek
Among the 487 employed individuals in Lost Creek, private company employees (254 | 52.2%), self-employed (not incorporated) (136 | 27.9%), and local government employees (50 | 10.3%) make up the most common classes of employment.
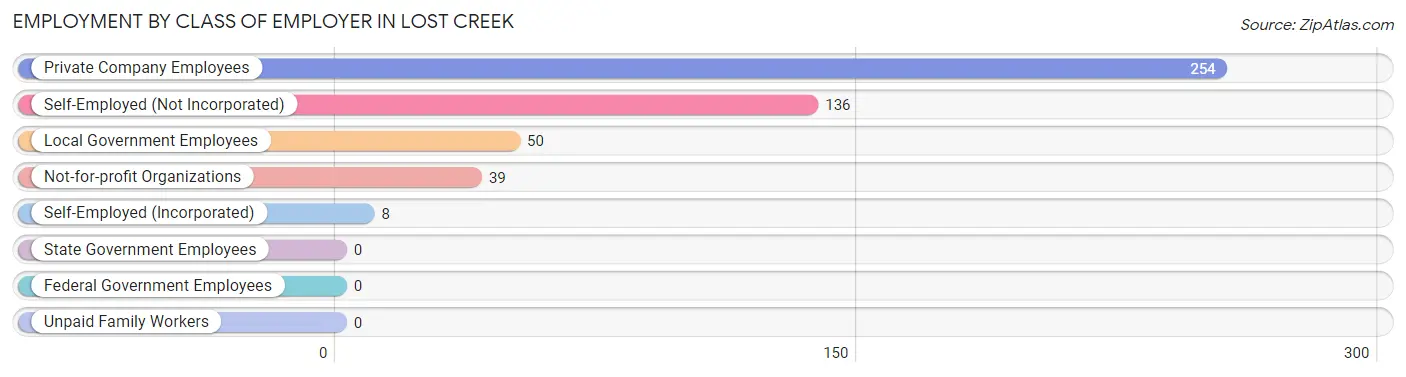
| Employer Class | # Employees | % Employees |
| Private Company Employees | 254 | 52.2% |
| Self-Employed (Incorporated) | 8 | 1.6% |
| Self-Employed (Not Incorporated) | 136 | 27.9% |
| Not-for-profit Organizations | 39 | 8.0% |
| Local Government Employees | 50 | 10.3% |
| State Government Employees | 0 | 0.0% |
| Federal Government Employees | 0 | 0.0% |
| Unpaid Family Workers | 0 | 0.0% |
| Total | 487 | 100.0% |
Employment Status by Age in Lost Creek
According to the labor force statistics for Lost Creek, out of the total population over 16 years of age (904), 57.4% or 519 individuals are in the labor force, with 6.2% or 32 of them unemployed. The age group with the highest labor force participation rate is 20 to 24 years, with 92.0% or 23 individuals in the labor force. Within the labor force, the 35 to 44 years age range has the highest percentage of unemployed individuals, with 29.4% or 32 of them being unemployed.
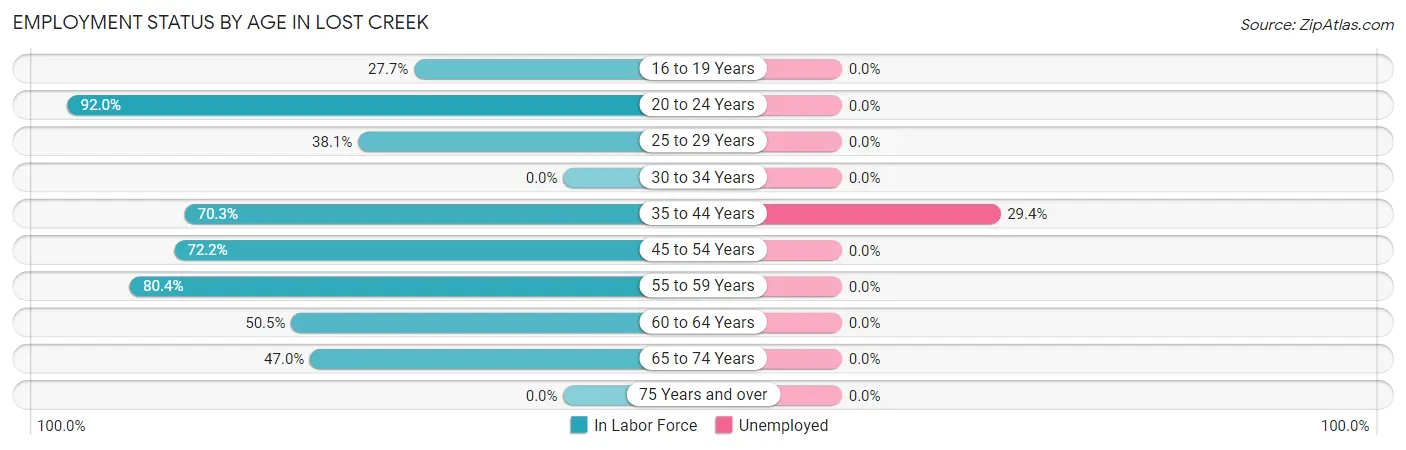
| Age Bracket | In Labor Force | Unemployed |
| 16 to 19 Years | 31 (27.7%) | 0 (0.0%) |
| 20 to 24 Years | 23 (92.0%) | 0 (0.0%) |
| 25 to 29 Years | 16 (38.1%) | 0 (0.0%) |
| 30 to 34 Years | 0 (0.0%) | 0 (0.0%) |
| 35 to 44 Years | 109 (70.3%) | 32 (29.4%) |
| 45 to 54 Years | 104 (72.2%) | 0 (0.0%) |
| 55 to 59 Years | 119 (80.4%) | 0 (0.0%) |
| 60 to 64 Years | 47 (50.5%) | 0 (0.0%) |
| 65 to 74 Years | 70 (47.0%) | 0 (0.0%) |
| 75 Years and over | 0 (0.0%) | 0 (0.0%) |
| Total | 519 (57.4%) | 32 (6.2%) |
Employment Status by Educational Attainment in Lost Creek
According to labor force statistics for Lost Creek, 67.9% of individuals (395) out of the total population between 25 and 64 years of age (582) are in the labor force, with 8.1% or 32 of them being unemployed. The group with the highest labor force participation rate are those with the educational attainment of high school diploma, with 100.0% or 16 individuals in the labor force. Within the labor force, individuals with bachelor's degree or higher education have the highest percentage of unemployment, with 9.0% or 32 of them being unemployed.
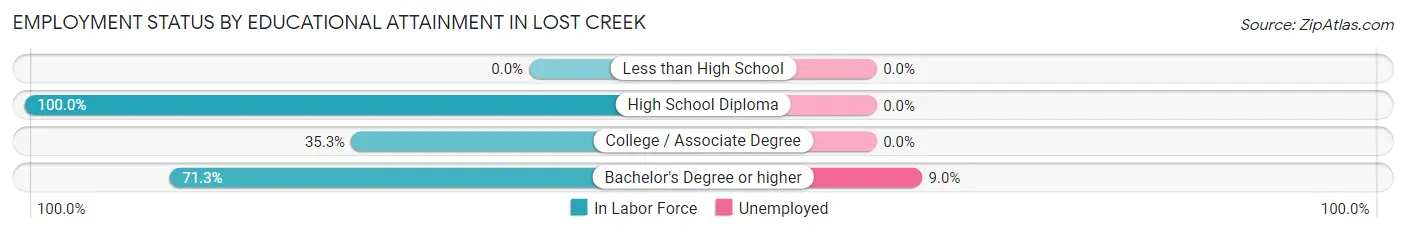
| Educational Attainment | In Labor Force | Unemployed |
| Less than High School | 0 (0.0%) | 0 (0.0%) |
| High School Diploma | 16 (100.0%) | 0 (0.0%) |
| College / Associate Degree | 24 (35.3%) | 0 (0.0%) |
| Bachelor's Degree or higher | 355 (71.3%) | 45 (9.0%) |
| Total | 395 (67.9%) | 47 (8.1%) |
Employment Occupations by Sex in Lost Creek
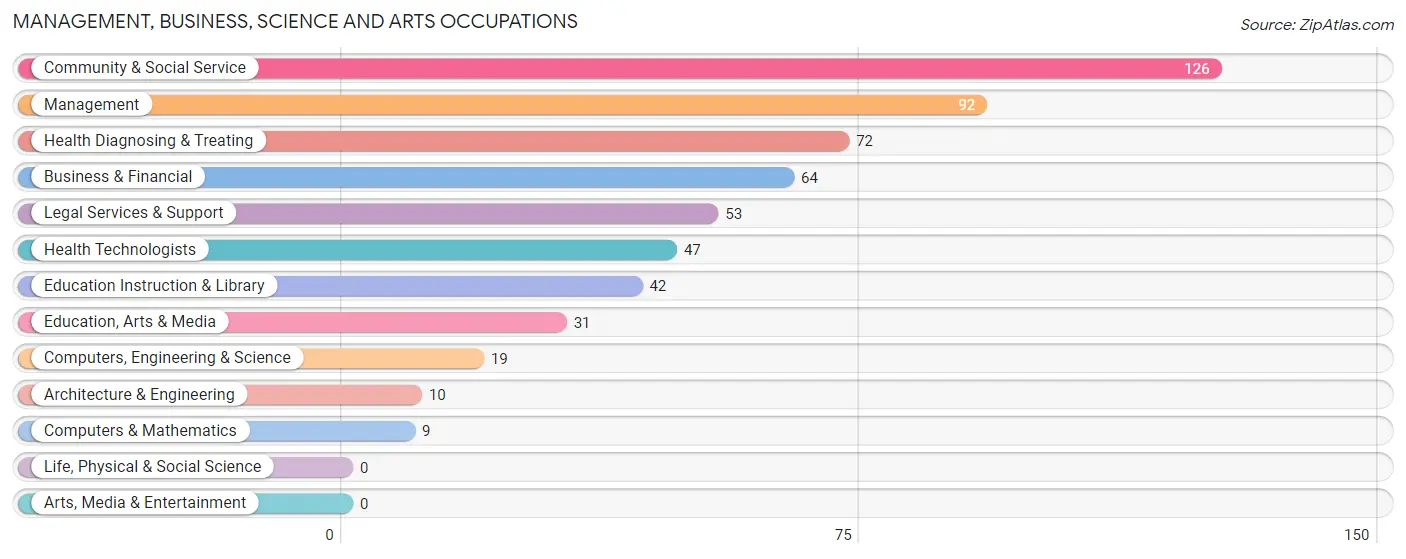
Management, Business, Science and Arts Occupations
The most common Management, Business, Science and Arts occupations in Lost Creek are Community & Social Service (126 | 25.9%), Management (92 | 18.9%), Health Diagnosing & Treating (72 | 14.8%), Business & Financial (64 | 13.1%), and Legal Services & Support (53 | 10.9%).
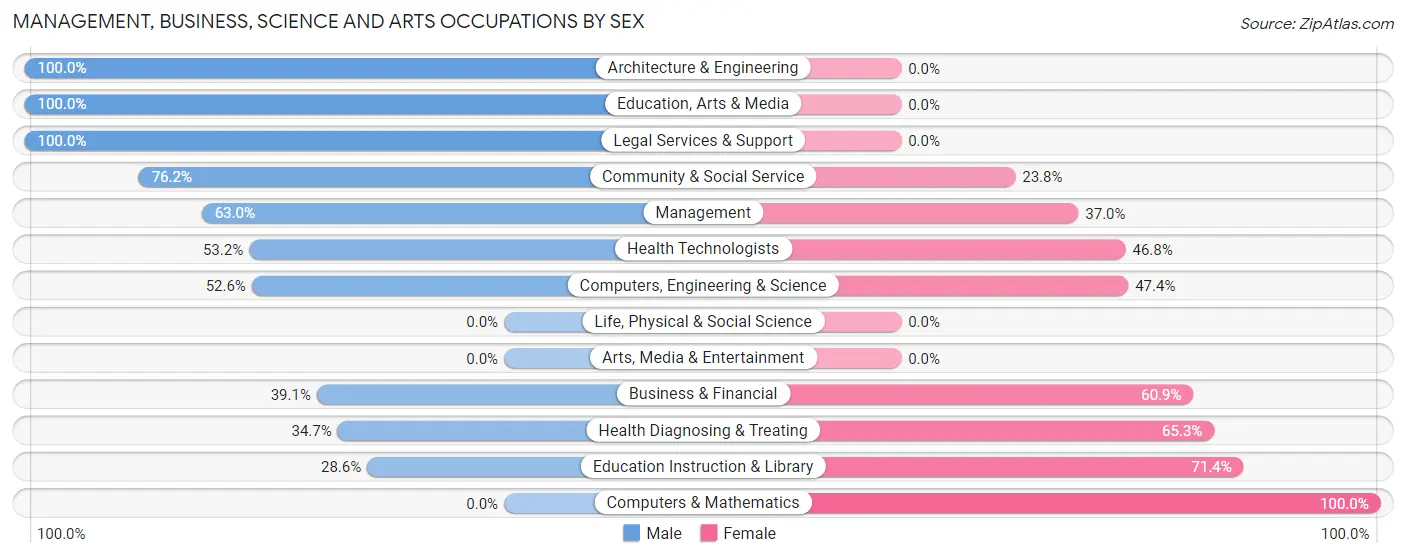
Management, Business, Science and Arts Occupations by Sex
Within the Management, Business, Science and Arts occupations in Lost Creek, the most male-oriented occupations are Architecture & Engineering (100.0%), Education, Arts & Media (100.0%), and Legal Services & Support (100.0%), while the most female-oriented occupations are Computers & Mathematics (100.0%), Education Instruction & Library (71.4%), and Health Diagnosing & Treating (65.3%).
| Occupation | Male | Female |
| Management | 58 (63.0%) | 34 (37.0%) |
| Business & Financial | 25 (39.1%) | 39 (60.9%) |
| Computers, Engineering & Science | 10 (52.6%) | 9 (47.4%) |
| Computers & Mathematics | 0 (0.0%) | 9 (100.0%) |
| Architecture & Engineering | 10 (100.0%) | 0 (0.0%) |
| Life, Physical & Social Science | 0 (0.0%) | 0 (0.0%) |
| Community & Social Service | 96 (76.2%) | 30 (23.8%) |
| Education, Arts & Media | 31 (100.0%) | 0 (0.0%) |
| Legal Services & Support | 53 (100.0%) | 0 (0.0%) |
| Education Instruction & Library | 12 (28.6%) | 30 (71.4%) |
| Arts, Media & Entertainment | 0 (0.0%) | 0 (0.0%) |
| Health Diagnosing & Treating | 25 (34.7%) | 47 (65.3%) |
| Health Technologists | 25 (53.2%) | 22 (46.8%) |
| Total (Category) | 214 (57.4%) | 159 (42.6%) |
| Total (Overall) | 285 (58.5%) | 202 (41.5%) |
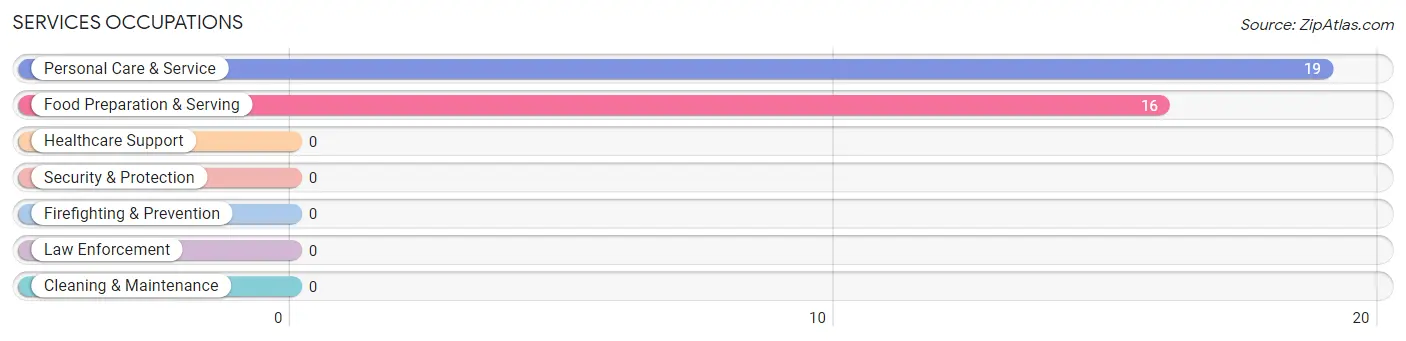
Services Occupations
The most common Services occupations in Lost Creek are Personal Care & Service (19 | 3.9%), and Food Preparation & Serving (16 | 3.3%).
Services Occupations by Sex
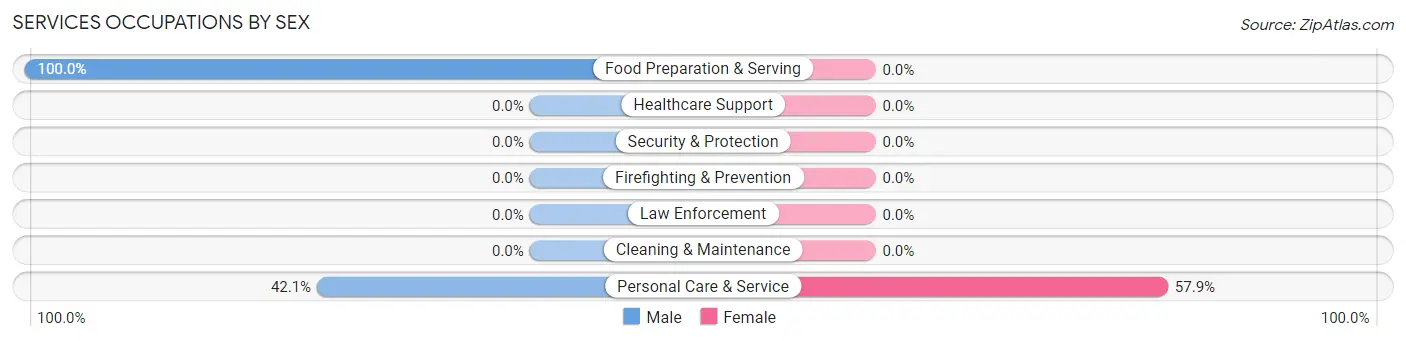
| Occupation | Male | Female |
| Healthcare Support | 0 (0.0%) | 0 (0.0%) |
| Security & Protection | 0 (0.0%) | 0 (0.0%) |
| Firefighting & Prevention | 0 (0.0%) | 0 (0.0%) |
| Law Enforcement | 0 (0.0%) | 0 (0.0%) |
| Food Preparation & Serving | 16 (100.0%) | 0 (0.0%) |
| Cleaning & Maintenance | 0 (0.0%) | 0 (0.0%) |
| Personal Care & Service | 8 (42.1%) | 11 (57.9%) |
| Total (Category) | 24 (68.6%) | 11 (31.4%) |
| Total (Overall) | 285 (58.5%) | 202 (41.5%) |
Sales and Office Occupations
The most common Sales and Office occupations in Lost Creek are Office & Administration (21 | 4.3%), and Sales & Related (9 | 1.8%).

Sales and Office Occupations by Sex

| Occupation | Male | Female |
| Sales & Related | 9 (100.0%) | 0 (0.0%) |
| Office & Administration | 0 (0.0%) | 21 (100.0%) |
| Total (Category) | 9 (30.0%) | 21 (70.0%) |
| Total (Overall) | 285 (58.5%) | 202 (41.5%) |
Natural Resources, Construction and Maintenance Occupations
The most common Natural Resources, Construction and Maintenance occupations in Lost Creek are , and Construction & Extraction (16 | 3.3%).
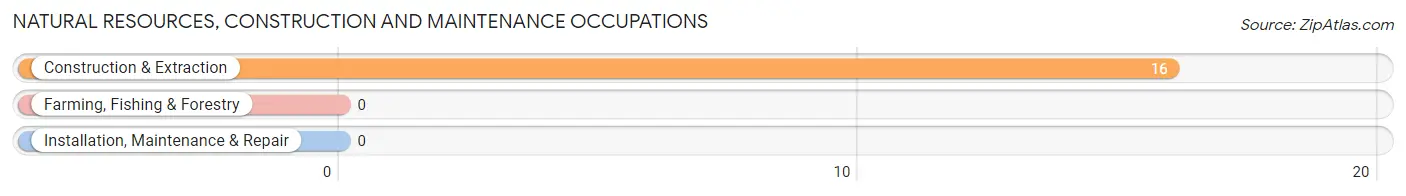
Natural Resources, Construction and Maintenance Occupations by Sex

| Occupation | Male | Female |
| Farming, Fishing & Forestry | 0 (0.0%) | 0 (0.0%) |
| Construction & Extraction | 16 (100.0%) | 0 (0.0%) |
| Installation, Maintenance & Repair | 0 (0.0%) | 0 (0.0%) |
| Total (Category) | 16 (100.0%) | 0 (0.0%) |
| Total (Overall) | 285 (58.5%) | 202 (41.5%) |
Production, Transportation and Moving Occupations
The most common Production, Transportation and Moving occupations in Lost Creek are , and Production (33 | 6.8%).
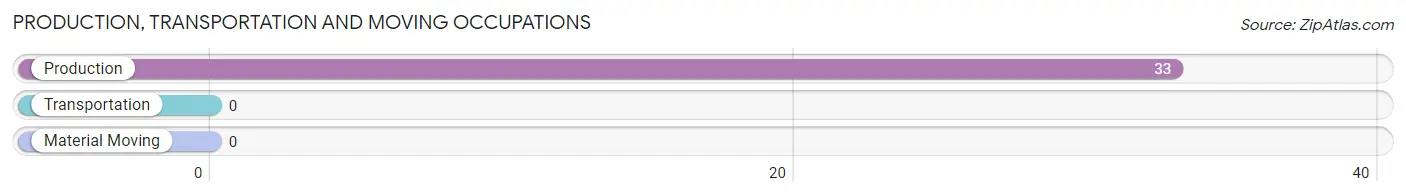
Production, Transportation and Moving Occupations by Sex
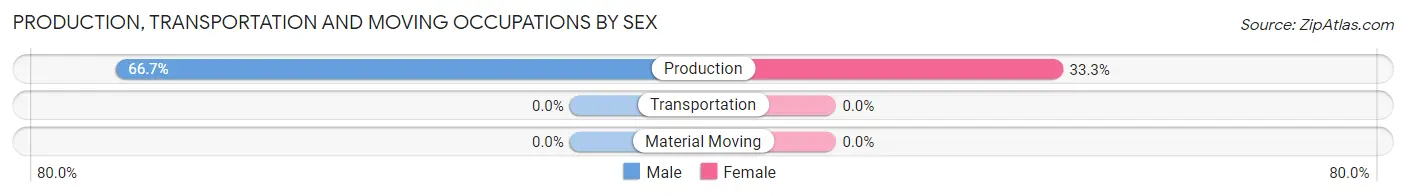
| Occupation | Male | Female |
| Production | 22 (66.7%) | 11 (33.3%) |
| Transportation | 0 (0.0%) | 0 (0.0%) |
| Material Moving | 0 (0.0%) | 0 (0.0%) |
| Total (Category) | 22 (66.7%) | 11 (33.3%) |
| Total (Overall) | 285 (58.5%) | 202 (41.5%) |
Employment Industries by Sex in Lost Creek
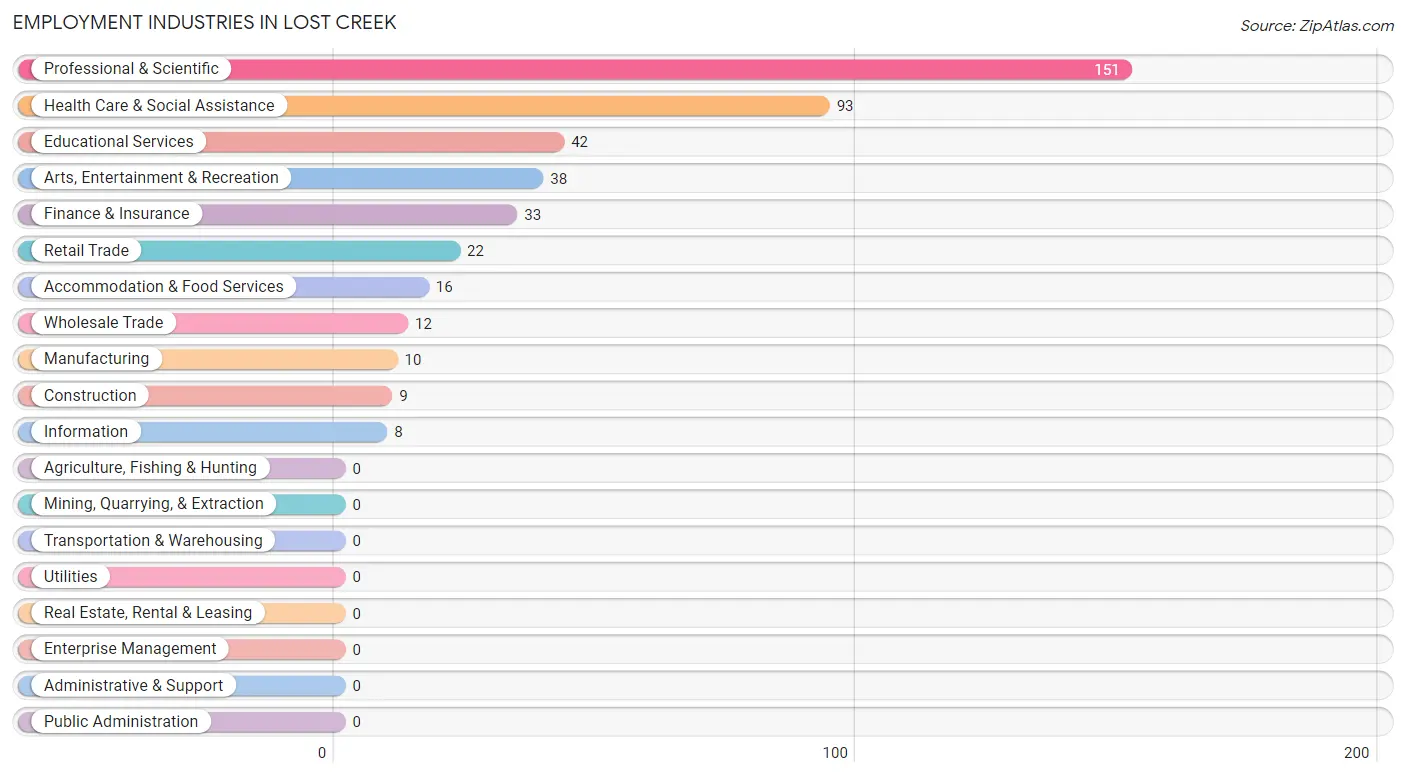
Employment Industries in Lost Creek
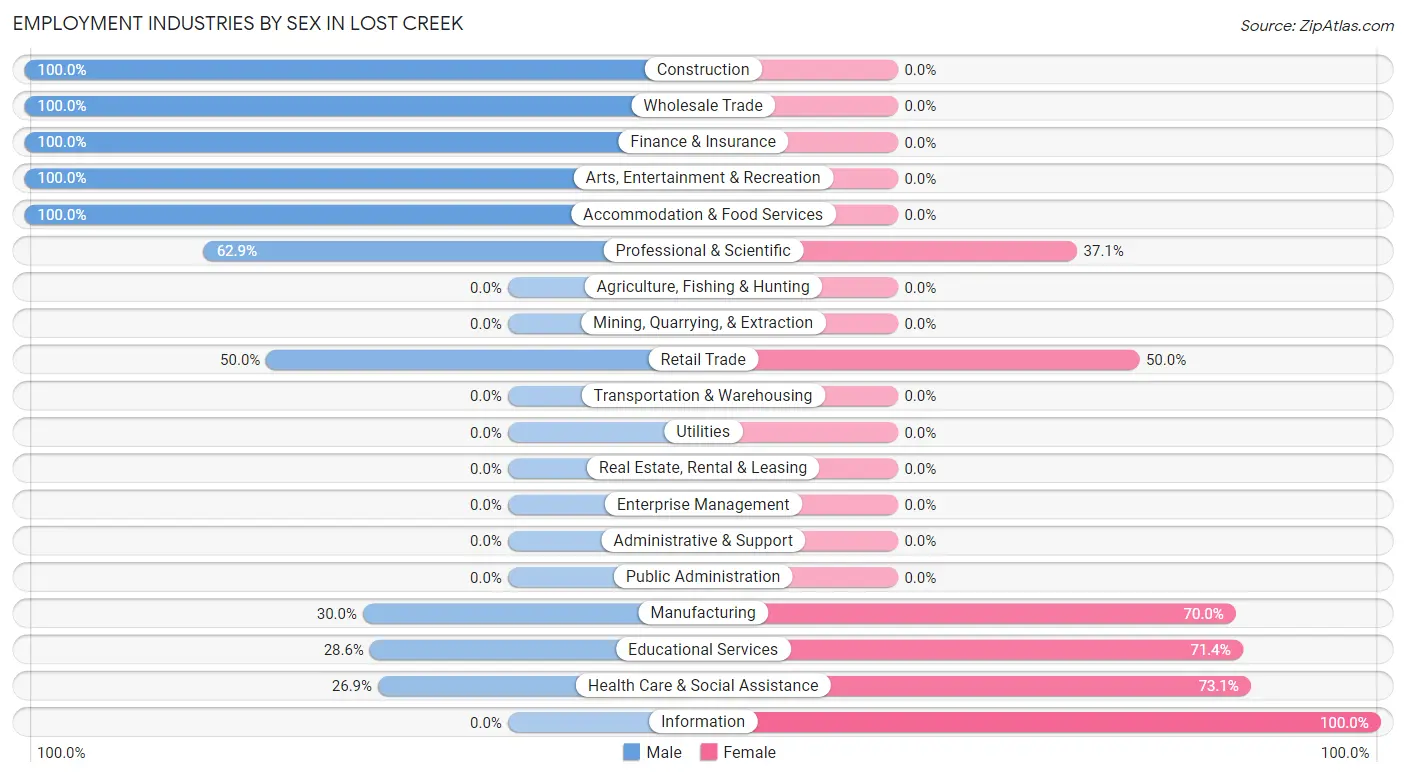
The major employment industries in Lost Creek include Professional & Scientific (151 | 31.0%), Health Care & Social Assistance (93 | 19.1%), Educational Services (42 | 8.6%), Arts, Entertainment & Recreation (38 | 7.8%), and Finance & Insurance (33 | 6.8%).
Employment Industries by Sex in Lost Creek
The Lost Creek industries that see more men than women are Construction (100.0%), Wholesale Trade (100.0%), and Finance & Insurance (100.0%), whereas the industries that tend to have a higher number of women are Information (100.0%), Health Care & Social Assistance (73.1%), and Educational Services (71.4%).
| Industry | Male | Female |
| Agriculture, Fishing & Hunting | 0 (0.0%) | 0 (0.0%) |
| Mining, Quarrying, & Extraction | 0 (0.0%) | 0 (0.0%) |
| Construction | 9 (100.0%) | 0 (0.0%) |
| Manufacturing | 3 (30.0%) | 7 (70.0%) |
| Wholesale Trade | 12 (100.0%) | 0 (0.0%) |
| Retail Trade | 11 (50.0%) | 11 (50.0%) |
| Transportation & Warehousing | 0 (0.0%) | 0 (0.0%) |
| Utilities | 0 (0.0%) | 0 (0.0%) |
| Information | 0 (0.0%) | 8 (100.0%) |
| Finance & Insurance | 33 (100.0%) | 0 (0.0%) |
| Real Estate, Rental & Leasing | 0 (0.0%) | 0 (0.0%) |
| Professional & Scientific | 95 (62.9%) | 56 (37.1%) |
| Enterprise Management | 0 (0.0%) | 0 (0.0%) |
| Administrative & Support | 0 (0.0%) | 0 (0.0%) |
| Educational Services | 12 (28.6%) | 30 (71.4%) |
| Health Care & Social Assistance | 25 (26.9%) | 68 (73.1%) |
| Arts, Entertainment & Recreation | 38 (100.0%) | 0 (0.0%) |
| Accommodation & Food Services | 16 (100.0%) | 0 (0.0%) |
| Public Administration | 0 (0.0%) | 0 (0.0%) |
| Total | 285 (58.5%) | 202 (41.5%) |
Education in Lost Creek
School Enrollment in Lost Creek
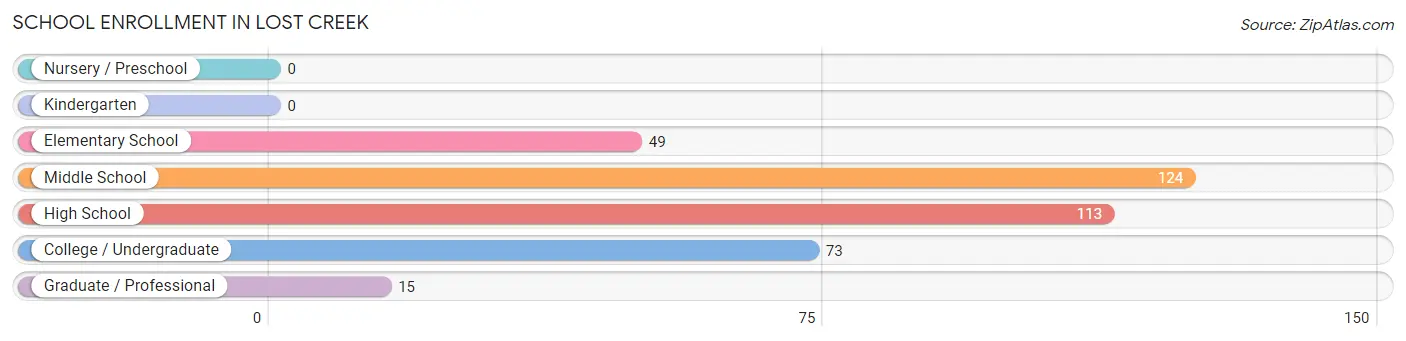
The most common levels of schooling among the 374 students in Lost Creek are middle school (124 | 33.2%), high school (113 | 30.2%), and college / undergraduate (73 | 19.5%).
| School Level | # Students | % Students |
| Nursery / Preschool | 0 | 0.0% |
| Kindergarten | 0 | 0.0% |
| Elementary School | 49 | 13.1% |
| Middle School | 124 | 33.2% |
| High School | 113 | 30.2% |
| College / Undergraduate | 73 | 19.5% |
| Graduate / Professional | 15 | 4.0% |
| Total | 374 | 100.0% |
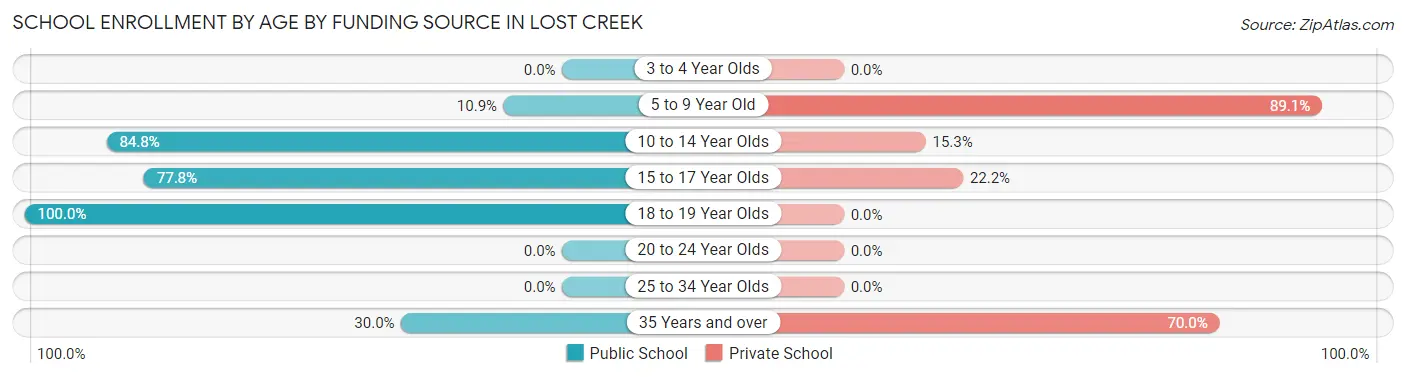
School Enrollment by Age by Funding Source in Lost Creek
Out of a total of 374 students who are enrolled in schools in Lost Creek, 124 (33.2%) attend a private institution, while the remaining 250 (66.8%) are enrolled in public schools. The age group of 5 to 9 year old has the highest likelihood of being enrolled in private schools, with 49 (89.1% in the age bracket) enrolled. Conversely, the age group of 18 to 19 year olds has the lowest likelihood of being enrolled in a private school, with 52 (100.0% in the age bracket) attending a public institution.
| Age Bracket | Public School | Private School |
| 3 to 4 Year Olds | 0 (0.0%) | 0 (0.0%) |
| 5 to 9 Year Old | 6 (10.9%) | 49 (89.1%) |
| 10 to 14 Year Olds | 100 (84.8%) | 18 (15.2%) |
| 15 to 17 Year Olds | 77 (77.8%) | 22 (22.2%) |
| 18 to 19 Year Olds | 52 (100.0%) | 0 (0.0%) |
| 20 to 24 Year Olds | 0 (0.0%) | 0 (0.0%) |
| 25 to 34 Year Olds | 0 (0.0%) | 0 (0.0%) |
| 35 Years and over | 15 (30.0%) | 35 (70.0%) |
| Total | 250 (66.8%) | 124 (33.2%) |
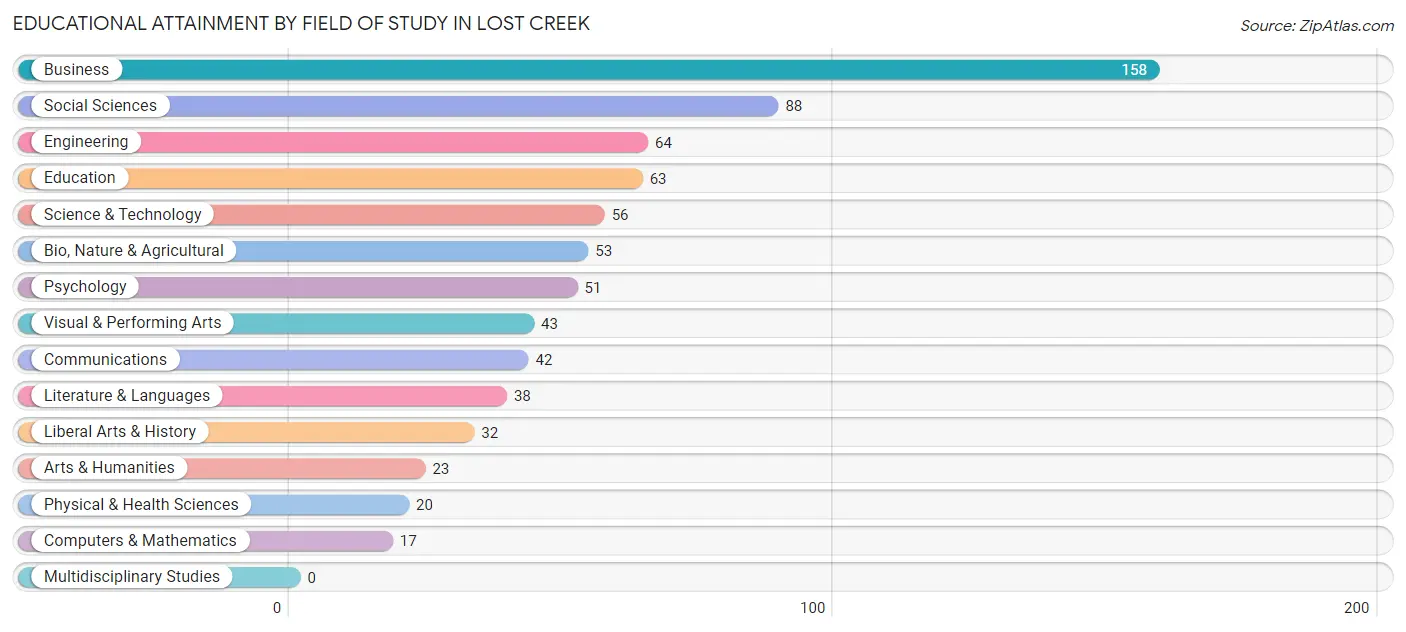
Educational Attainment by Field of Study in Lost Creek
Business (158 | 21.1%), social sciences (88 | 11.8%), engineering (64 | 8.6%), education (63 | 8.4%), and science & technology (56 | 7.5%) are the most common fields of study among 748 individuals in Lost Creek who have obtained a bachelor's degree or higher.
| Field of Study | # Graduates | % Graduates |
| Computers & Mathematics | 17 | 2.3% |
| Bio, Nature & Agricultural | 53 | 7.1% |
| Physical & Health Sciences | 20 | 2.7% |
| Psychology | 51 | 6.8% |
| Social Sciences | 88 | 11.8% |
| Engineering | 64 | 8.6% |
| Multidisciplinary Studies | 0 | 0.0% |
| Science & Technology | 56 | 7.5% |
| Business | 158 | 21.1% |
| Education | 63 | 8.4% |
| Literature & Languages | 38 | 5.1% |
| Liberal Arts & History | 32 | 4.3% |
| Visual & Performing Arts | 43 | 5.8% |
| Communications | 42 | 5.6% |
| Arts & Humanities | 23 | 3.1% |
| Total | 748 | 100.0% |
Transportation & Commute in Lost Creek
Vehicle Availability by Sex in Lost Creek
The most prevalent vehicle ownership categories in Lost Creek are males with 2 vehicles (190, accounting for 66.7%) and females with 2 vehicles (116, making up 94.1%).
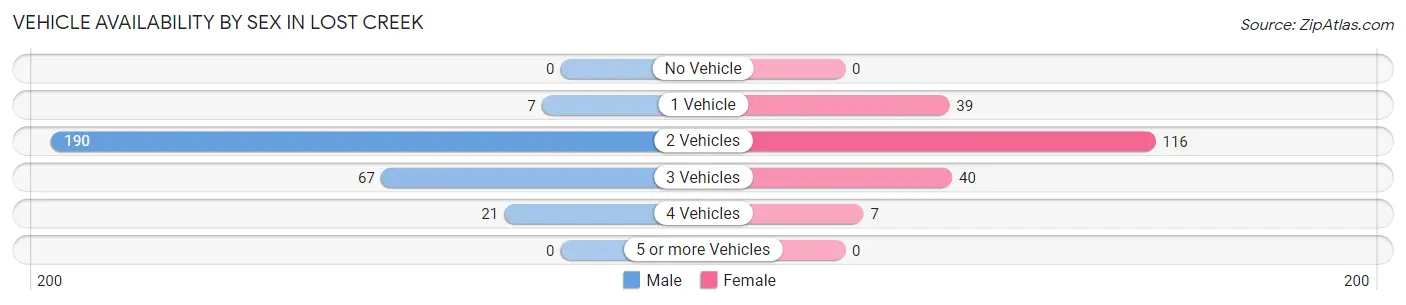
| Vehicles Available | Male | Female |
| No Vehicle | 0 (0.0%) | 0 (0.0%) |
| 1 Vehicle | 7 (2.5%) | 39 (19.3%) |
| 2 Vehicles | 190 (66.7%) | 116 (57.4%) |
| 3 Vehicles | 67 (23.5%) | 40 (19.8%) |
| 4 Vehicles | 21 (7.4%) | 7 (3.5%) |
| 5 or more Vehicles | 0 (0.0%) | 0 (0.0%) |
| Total | 285 (100.0%) | 202 (100.0%) |
Commute Time in Lost Creek
The most frequently occuring commute durations in Lost Creek are 10 to 14 minutes (118 commuters, 31.1%), 20 to 24 minutes (58 commuters, 15.3%), and 30 to 34 minutes (57 commuters, 15.0%).
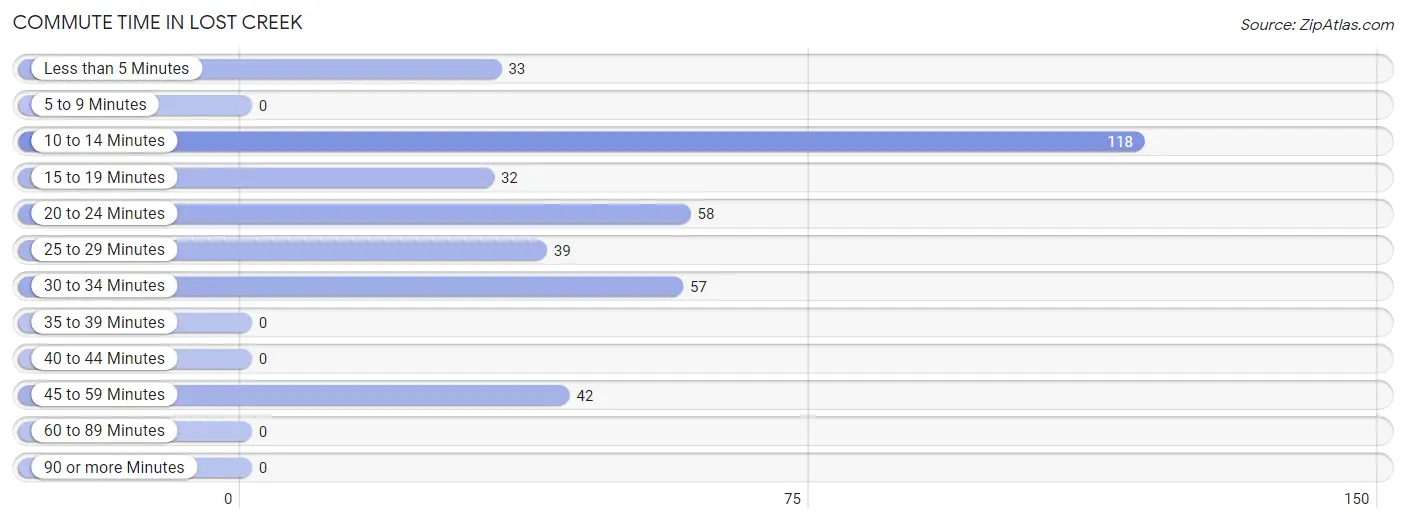
| Commute Time | # Commuters | % Commuters |
| Less than 5 Minutes | 33 | 8.7% |
| 5 to 9 Minutes | 0 | 0.0% |
| 10 to 14 Minutes | 118 | 31.1% |
| 15 to 19 Minutes | 32 | 8.4% |
| 20 to 24 Minutes | 58 | 15.3% |
| 25 to 29 Minutes | 39 | 10.3% |
| 30 to 34 Minutes | 57 | 15.0% |
| 35 to 39 Minutes | 0 | 0.0% |
| 40 to 44 Minutes | 0 | 0.0% |
| 45 to 59 Minutes | 42 | 11.1% |
| 60 to 89 Minutes | 0 | 0.0% |
| 90 or more Minutes | 0 | 0.0% |
Commute Time by Sex in Lost Creek
The most common commute times in Lost Creek are 20 to 24 minutes (58 commuters, 23.6%) for males and 10 to 14 minutes (73 commuters, 54.9%) for females.
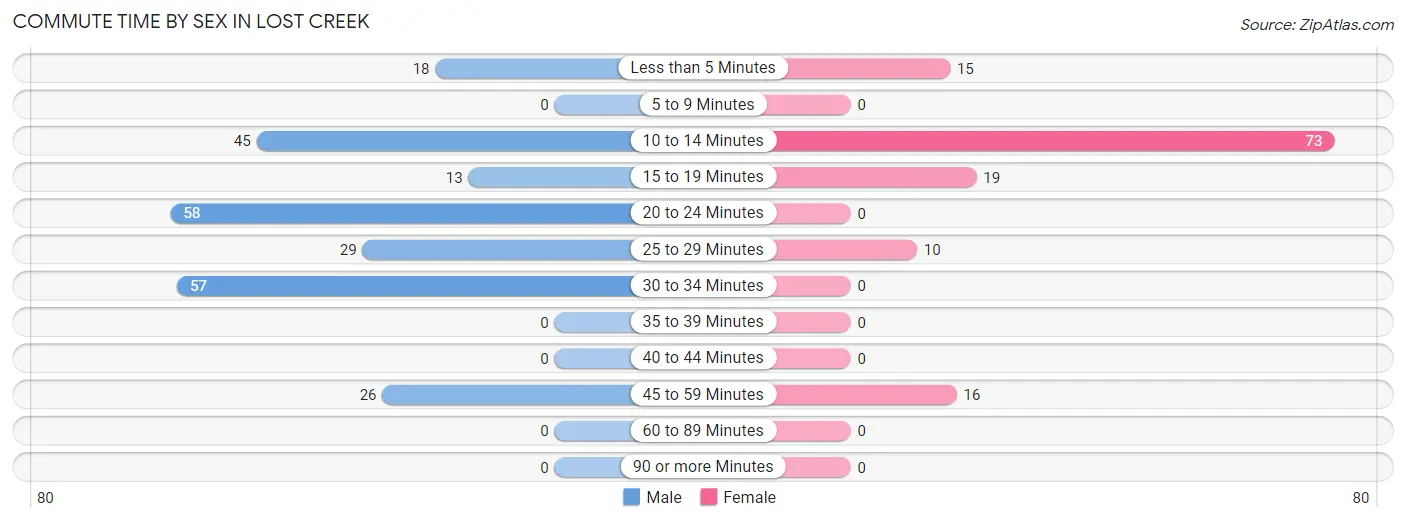
| Commute Time | Male | Female |
| Less than 5 Minutes | 18 (7.3%) | 15 (11.3%) |
| 5 to 9 Minutes | 0 (0.0%) | 0 (0.0%) |
| 10 to 14 Minutes | 45 (18.3%) | 73 (54.9%) |
| 15 to 19 Minutes | 13 (5.3%) | 19 (14.3%) |
| 20 to 24 Minutes | 58 (23.6%) | 0 (0.0%) |
| 25 to 29 Minutes | 29 (11.8%) | 10 (7.5%) |
| 30 to 34 Minutes | 57 (23.2%) | 0 (0.0%) |
| 35 to 39 Minutes | 0 (0.0%) | 0 (0.0%) |
| 40 to 44 Minutes | 0 (0.0%) | 0 (0.0%) |
| 45 to 59 Minutes | 26 (10.6%) | 16 (12.0%) |
| 60 to 89 Minutes | 0 (0.0%) | 0 (0.0%) |
| 90 or more Minutes | 0 (0.0%) | 0 (0.0%) |
Time of Departure to Work by Sex in Lost Creek
The most frequent times of departure to work in Lost Creek are 7:30 AM to 7:59 AM (79, 32.1%) for males and 7:00 AM to 7:29 AM (45, 33.8%) for females.
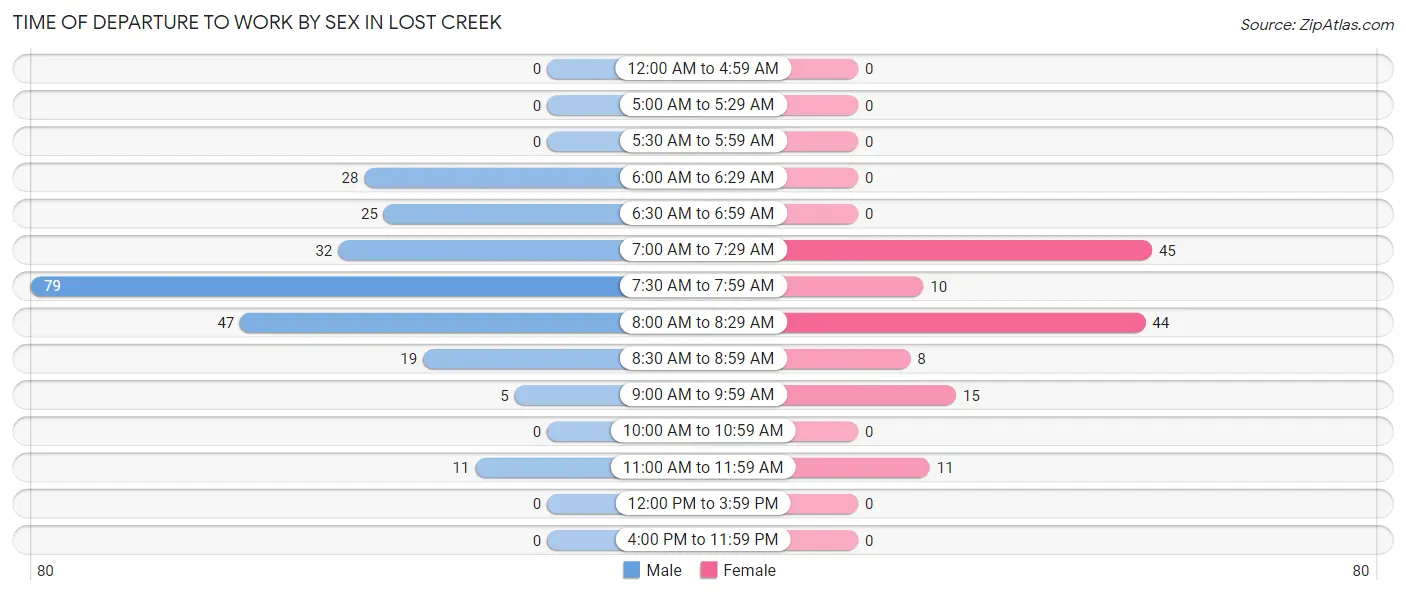
| Time of Departure | Male | Female |
| 12:00 AM to 4:59 AM | 0 (0.0%) | 0 (0.0%) |
| 5:00 AM to 5:29 AM | 0 (0.0%) | 0 (0.0%) |
| 5:30 AM to 5:59 AM | 0 (0.0%) | 0 (0.0%) |
| 6:00 AM to 6:29 AM | 28 (11.4%) | 0 (0.0%) |
| 6:30 AM to 6:59 AM | 25 (10.2%) | 0 (0.0%) |
| 7:00 AM to 7:29 AM | 32 (13.0%) | 45 (33.8%) |
| 7:30 AM to 7:59 AM | 79 (32.1%) | 10 (7.5%) |
| 8:00 AM to 8:29 AM | 47 (19.1%) | 44 (33.1%) |
| 8:30 AM to 8:59 AM | 19 (7.7%) | 8 (6.0%) |
| 9:00 AM to 9:59 AM | 5 (2.0%) | 15 (11.3%) |
| 10:00 AM to 10:59 AM | 0 (0.0%) | 0 (0.0%) |
| 11:00 AM to 11:59 AM | 11 (4.5%) | 11 (8.3%) |
| 12:00 PM to 3:59 PM | 0 (0.0%) | 0 (0.0%) |
| 4:00 PM to 11:59 PM | 0 (0.0%) | 0 (0.0%) |
| Total | 246 (100.0%) | 133 (100.0%) |
Housing Occupancy in Lost Creek
Occupancy by Ownership in Lost Creek
Of the total 420 dwellings in Lost Creek, owner-occupied units account for 379 (90.2%), while renter-occupied units make up 41 (9.8%).
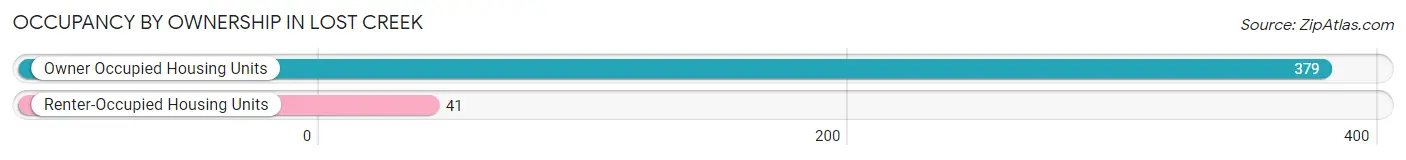
| Occupancy | # Housing Units | % Housing Units |
| Owner Occupied Housing Units | 379 | 90.2% |
| Renter-Occupied Housing Units | 41 | 9.8% |
| Total Occupied Housing Units | 420 | 100.0% |
Occupancy by Household Size in Lost Creek
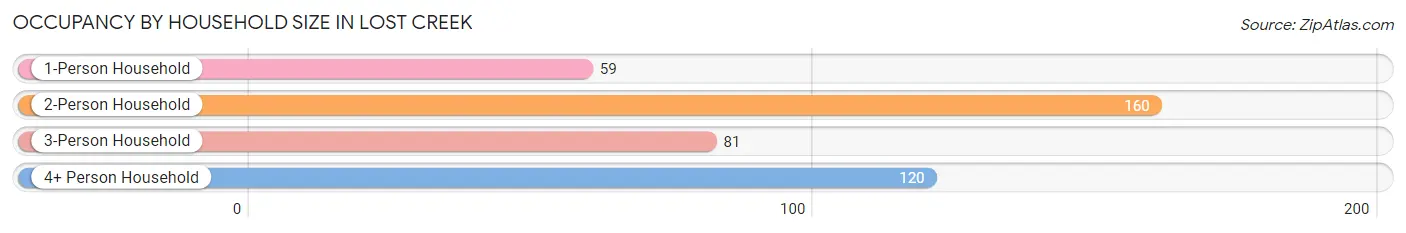
| Household Size | # Housing Units | % Housing Units |
| 1-Person Household | 59 | 14.1% |
| 2-Person Household | 160 | 38.1% |
| 3-Person Household | 81 | 19.3% |
| 4+ Person Household | 120 | 28.6% |
| Total Housing Units | 420 | 100.0% |
Occupancy by Ownership by Household Size in Lost Creek
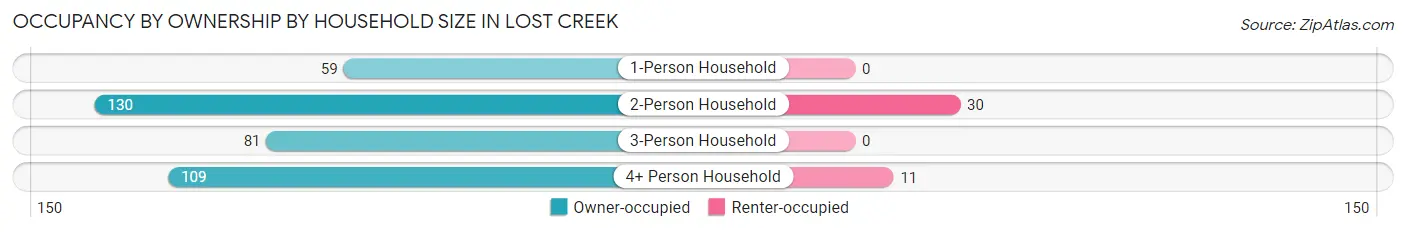
| Household Size | Owner-occupied | Renter-occupied |
| 1-Person Household | 59 (100.0%) | 0 (0.0%) |
| 2-Person Household | 130 (81.2%) | 30 (18.8%) |
| 3-Person Household | 81 (100.0%) | 0 (0.0%) |
| 4+ Person Household | 109 (90.8%) | 11 (9.2%) |
| Total Housing Units | 379 (90.2%) | 41 (9.8%) |
Occupancy by Educational Attainment in Lost Creek
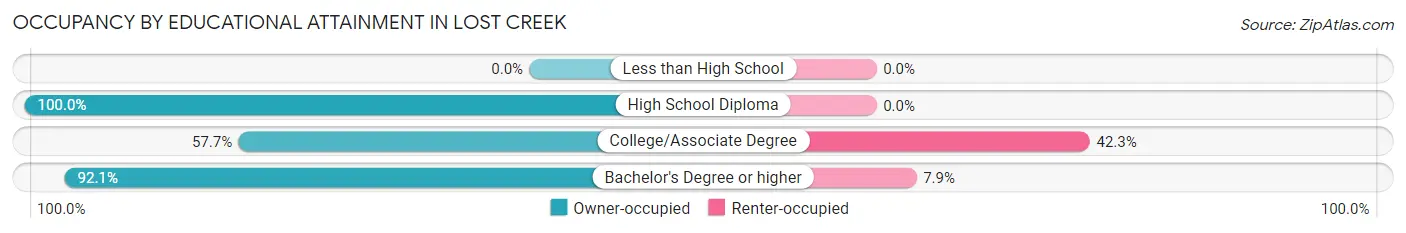
| Household Size | Owner-occupied | Renter-occupied |
| Less than High School | 0 (0.0%) | 0 (0.0%) |
| High School Diploma | 16 (100.0%) | 0 (0.0%) |
| College/Associate Degree | 15 (57.7%) | 11 (42.3%) |
| Bachelor's Degree or higher | 348 (92.1%) | 30 (7.9%) |
Occupancy by Age of Householder in Lost Creek
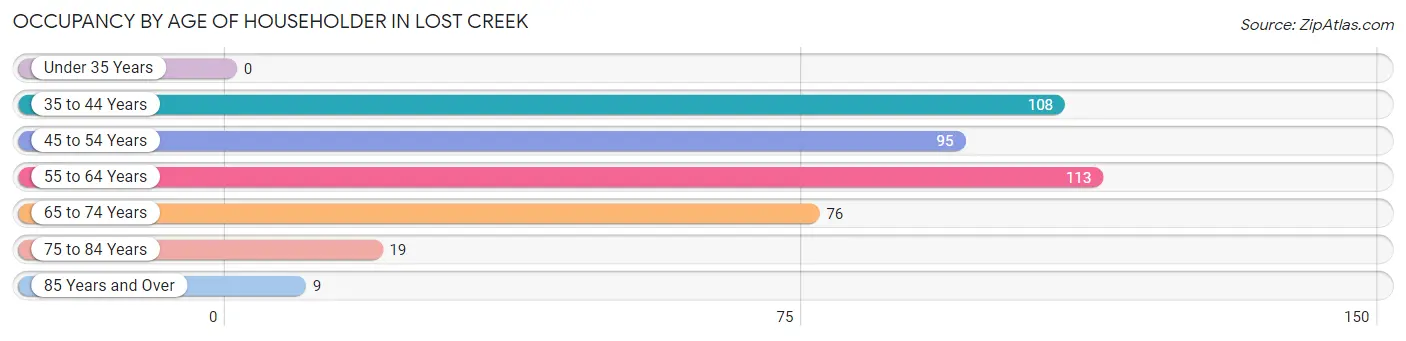
| Age Bracket | # Households | % Households |
| Under 35 Years | 0 | 0.0% |
| 35 to 44 Years | 108 | 25.7% |
| 45 to 54 Years | 95 | 22.6% |
| 55 to 64 Years | 113 | 26.9% |
| 65 to 74 Years | 76 | 18.1% |
| 75 to 84 Years | 19 | 4.5% |
| 85 Years and Over | 9 | 2.1% |
| Total | 420 | 100.0% |
Housing Finances in Lost Creek
Median Income by Occupancy in Lost Creek
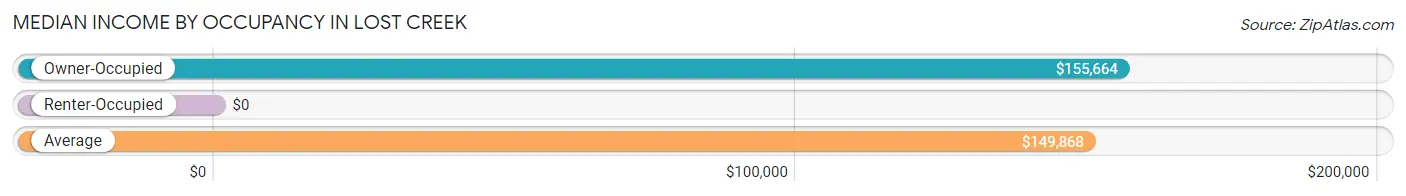
| Occupancy Type | # Households | Median Income |
| Owner-Occupied | 379 (90.2%) | $155,664 |
| Renter-Occupied | 41 (9.8%) | $0 |
| Average | 420 (100.0%) | $149,868 |
Occupancy by Householder Income Bracket in Lost Creek
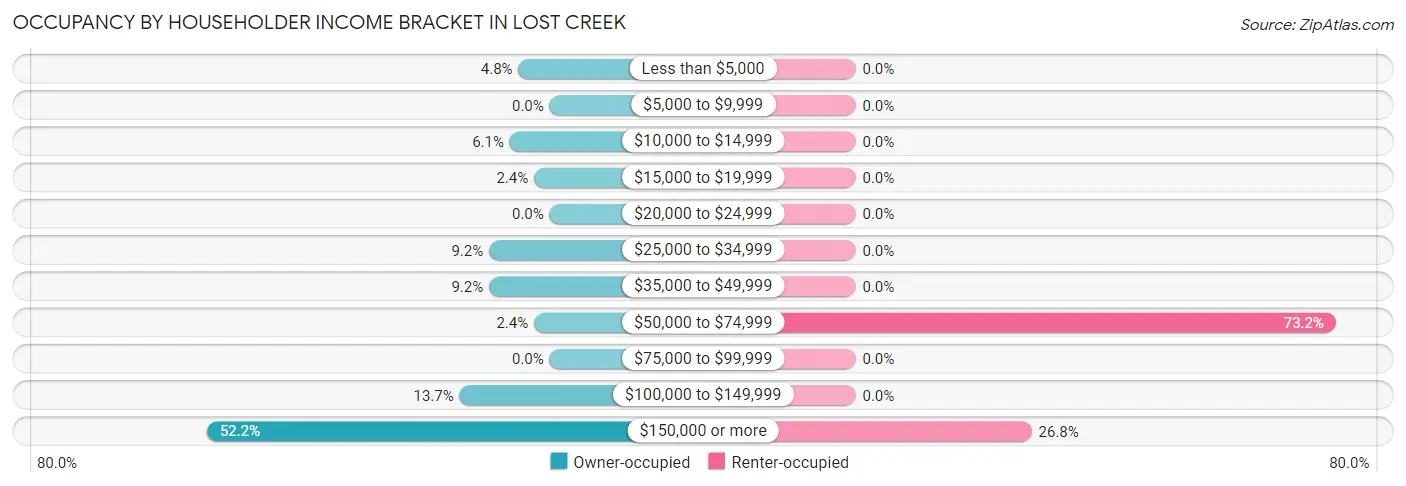
| Income Bracket | Owner-occupied | Renter-occupied |
| Less than $5,000 | 18 (4.8%) | 0 (0.0%) |
| $5,000 to $9,999 | 0 (0.0%) | 0 (0.0%) |
| $10,000 to $14,999 | 23 (6.1%) | 0 (0.0%) |
| $15,000 to $19,999 | 9 (2.4%) | 0 (0.0%) |
| $20,000 to $24,999 | 0 (0.0%) | 0 (0.0%) |
| $25,000 to $34,999 | 35 (9.2%) | 0 (0.0%) |
| $35,000 to $49,999 | 35 (9.2%) | 0 (0.0%) |
| $50,000 to $74,999 | 9 (2.4%) | 30 (73.2%) |
| $75,000 to $99,999 | 0 (0.0%) | 0 (0.0%) |
| $100,000 to $149,999 | 52 (13.7%) | 0 (0.0%) |
| $150,000 or more | 198 (52.2%) | 11 (26.8%) |
| Total | 379 (100.0%) | 41 (100.0%) |
Monthly Housing Cost Tiers in Lost Creek
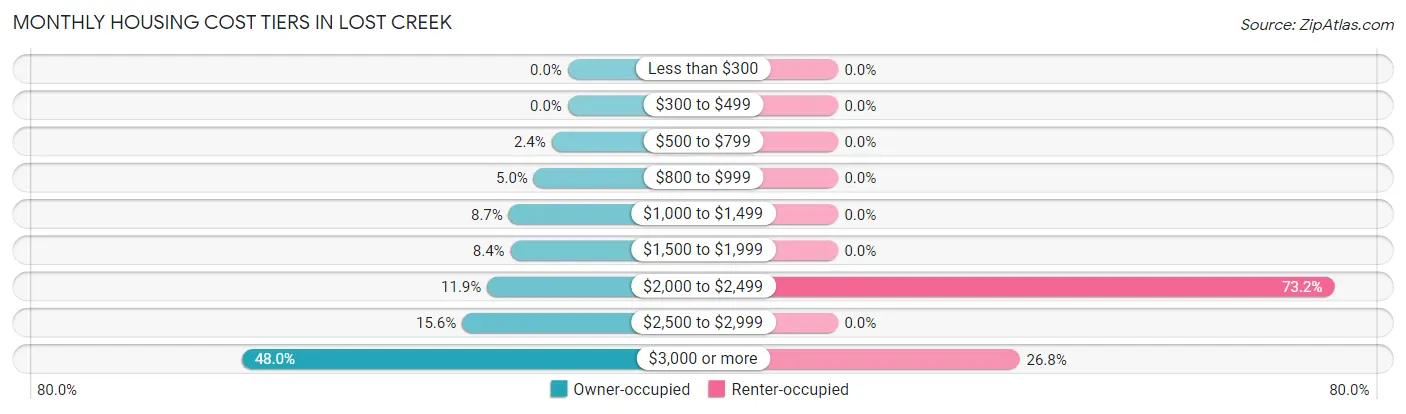
| Monthly Cost | Owner-occupied | Renter-occupied |
| Less than $300 | 0 (0.0%) | 0 (0.0%) |
| $300 to $499 | 0 (0.0%) | 0 (0.0%) |
| $500 to $799 | 9 (2.4%) | 0 (0.0%) |
| $800 to $999 | 19 (5.0%) | 0 (0.0%) |
| $1,000 to $1,499 | 33 (8.7%) | 0 (0.0%) |
| $1,500 to $1,999 | 32 (8.4%) | 0 (0.0%) |
| $2,000 to $2,499 | 45 (11.9%) | 30 (73.2%) |
| $2,500 to $2,999 | 59 (15.6%) | 0 (0.0%) |
| $3,000 or more | 182 (48.0%) | 11 (26.8%) |
| Total | 379 (100.0%) | 41 (100.0%) |
Physical Housing Characteristics in Lost Creek
Housing Structures in Lost Creek
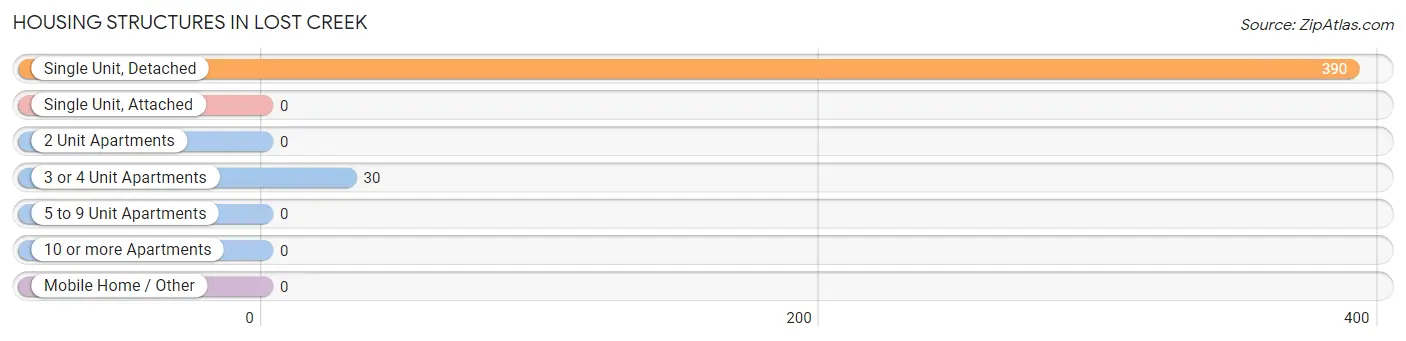
| Structure Type | # Housing Units | % Housing Units |
| Single Unit, Detached | 390 | 92.9% |
| Single Unit, Attached | 0 | 0.0% |
| 2 Unit Apartments | 0 | 0.0% |
| 3 or 4 Unit Apartments | 30 | 7.1% |
| 5 to 9 Unit Apartments | 0 | 0.0% |
| 10 or more Apartments | 0 | 0.0% |
| Mobile Home / Other | 0 | 0.0% |
| Total | 420 | 100.0% |
Housing Structures by Occupancy in Lost Creek
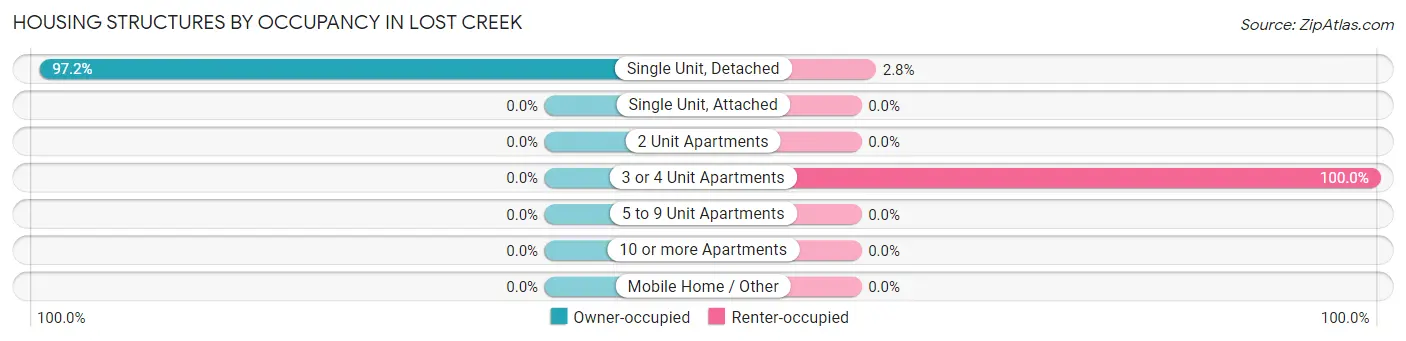
| Structure Type | Owner-occupied | Renter-occupied |
| Single Unit, Detached | 379 (97.2%) | 11 (2.8%) |
| Single Unit, Attached | 0 (0.0%) | 0 (0.0%) |
| 2 Unit Apartments | 0 (0.0%) | 0 (0.0%) |
| 3 or 4 Unit Apartments | 0 (0.0%) | 30 (100.0%) |
| 5 to 9 Unit Apartments | 0 (0.0%) | 0 (0.0%) |
| 10 or more Apartments | 0 (0.0%) | 0 (0.0%) |
| Mobile Home / Other | 0 (0.0%) | 0 (0.0%) |
| Total | 379 (90.2%) | 41 (9.8%) |
Housing Structures by Number of Rooms in Lost Creek
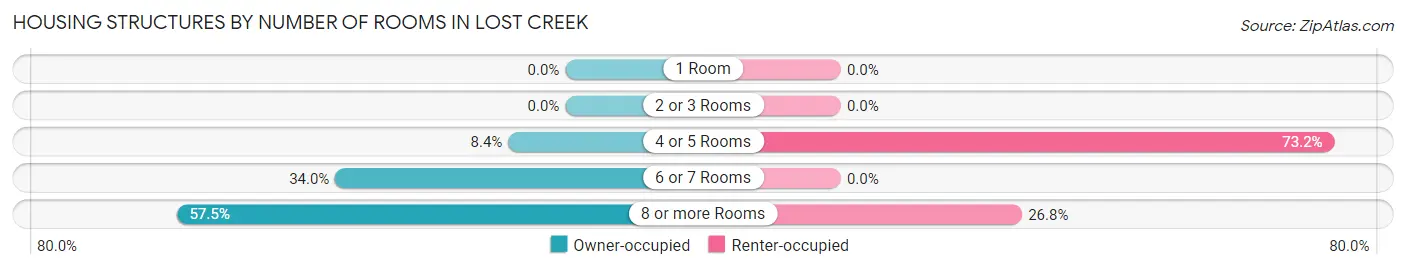
| Number of Rooms | Owner-occupied | Renter-occupied |
| 1 Room | 0 (0.0%) | 0 (0.0%) |
| 2 or 3 Rooms | 0 (0.0%) | 0 (0.0%) |
| 4 or 5 Rooms | 32 (8.4%) | 30 (73.2%) |
| 6 or 7 Rooms | 129 (34.0%) | 0 (0.0%) |
| 8 or more Rooms | 218 (57.5%) | 11 (26.8%) |
| Total | 379 (100.0%) | 41 (100.0%) |
Housing Structure by Heating Type in Lost Creek
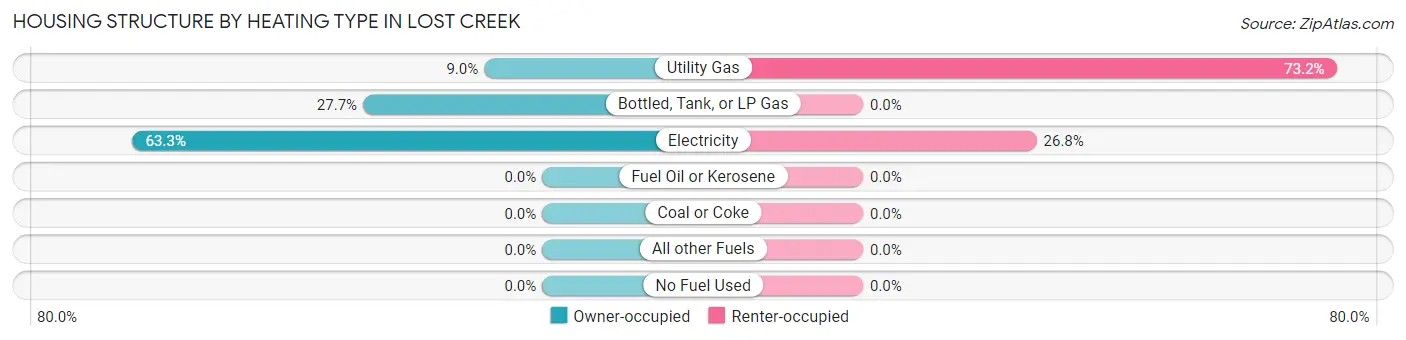
| Heating Type | Owner-occupied | Renter-occupied |
| Utility Gas | 34 (9.0%) | 30 (73.2%) |
| Bottled, Tank, or LP Gas | 105 (27.7%) | 0 (0.0%) |
| Electricity | 240 (63.3%) | 11 (26.8%) |
| Fuel Oil or Kerosene | 0 (0.0%) | 0 (0.0%) |
| Coal or Coke | 0 (0.0%) | 0 (0.0%) |
| All other Fuels | 0 (0.0%) | 0 (0.0%) |
| No Fuel Used | 0 (0.0%) | 0 (0.0%) |
| Total | 379 (100.0%) | 41 (100.0%) |
Household Vehicle Usage in Lost Creek
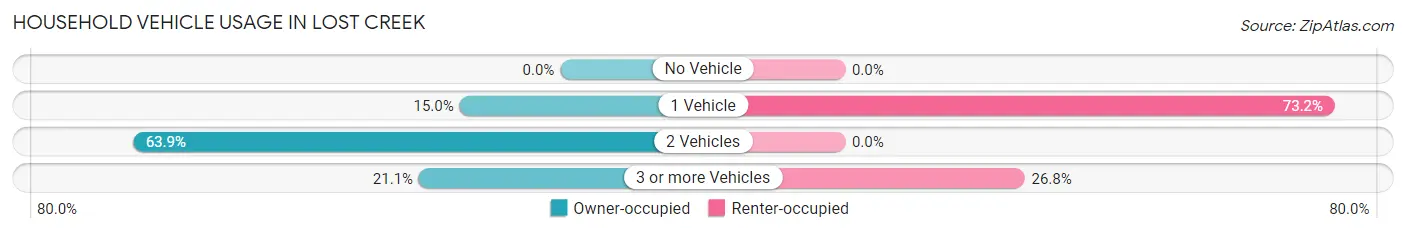
| Vehicles per Household | Owner-occupied | Renter-occupied |
| No Vehicle | 0 (0.0%) | 0 (0.0%) |
| 1 Vehicle | 57 (15.0%) | 30 (73.2%) |
| 2 Vehicles | 242 (63.8%) | 0 (0.0%) |
| 3 or more Vehicles | 80 (21.1%) | 11 (26.8%) |
| Total | 379 (100.0%) | 41 (100.0%) |
Real Estate & Mortgages in Lost Creek
Real Estate and Mortgage Overview in Lost Creek
| Characteristic | Without Mortgage | With Mortgage |
| Housing Units | 125 | 254 |
| Median Property Value | $1,122,300 | $1,250,000 |
| Median Household Income | $149,276 | $141 |
| Monthly Housing Costs | $1,501 | $182 |
| Real Estate Taxes | $10,001 | $0 |
Property Value by Mortgage Status in Lost Creek
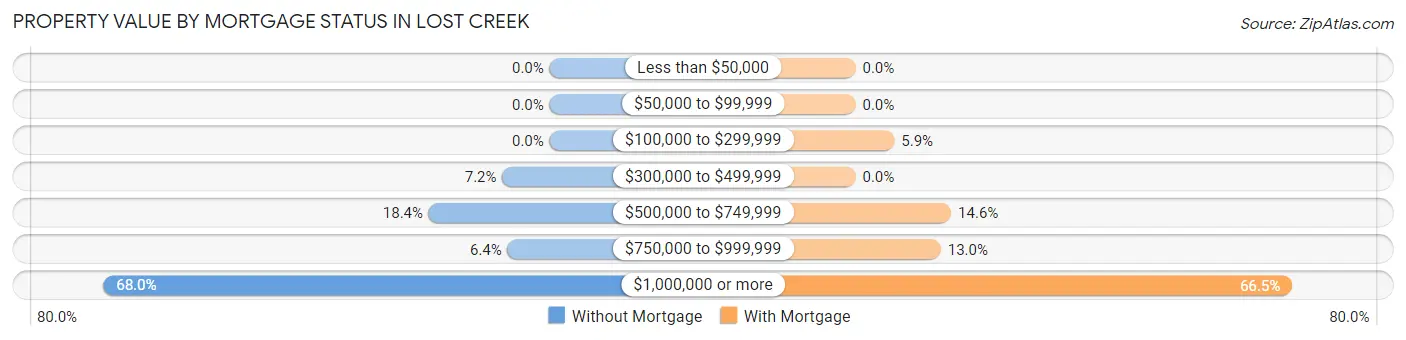
| Property Value | Without Mortgage | With Mortgage |
| Less than $50,000 | 0 (0.0%) | 0 (0.0%) |
| $50,000 to $99,999 | 0 (0.0%) | 0 (0.0%) |
| $100,000 to $299,999 | 0 (0.0%) | 15 (5.9%) |
| $300,000 to $499,999 | 9 (7.2%) | 0 (0.0%) |
| $500,000 to $749,999 | 23 (18.4%) | 37 (14.6%) |
| $750,000 to $999,999 | 8 (6.4%) | 33 (13.0%) |
| $1,000,000 or more | 85 (68.0%) | 169 (66.5%) |
| Total | 125 (100.0%) | 254 (100.0%) |
Household Income by Mortgage Status in Lost Creek
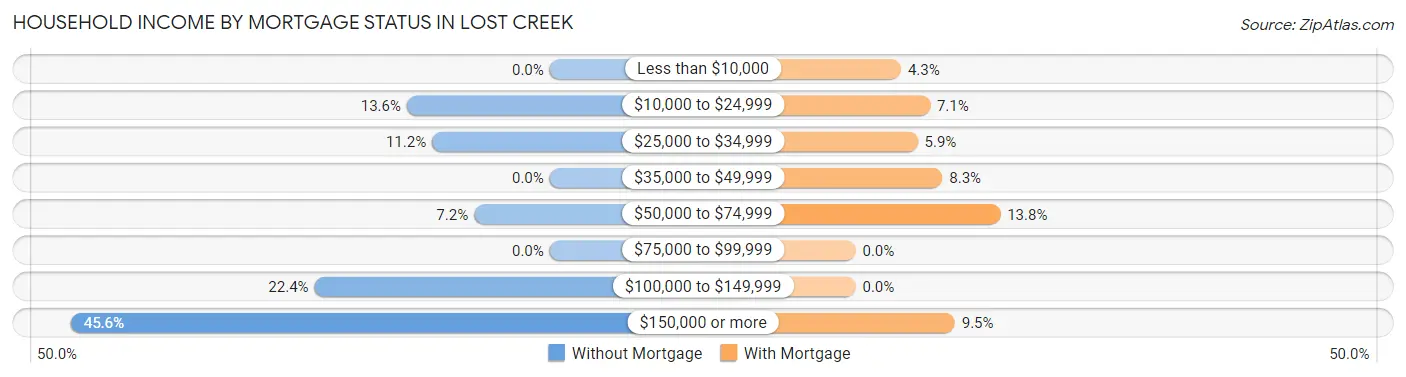
| Household Income | Without Mortgage | With Mortgage |
| Less than $10,000 | 0 (0.0%) | 11 (4.3%) |
| $10,000 to $24,999 | 17 (13.6%) | 18 (7.1%) |
| $25,000 to $34,999 | 14 (11.2%) | 15 (5.9%) |
| $35,000 to $49,999 | 0 (0.0%) | 21 (8.3%) |
| $50,000 to $74,999 | 9 (7.2%) | 35 (13.8%) |
| $75,000 to $99,999 | 0 (0.0%) | 0 (0.0%) |
| $100,000 to $149,999 | 28 (22.4%) | 0 (0.0%) |
| $150,000 or more | 57 (45.6%) | 24 (9.5%) |
| Total | 125 (100.0%) | 254 (100.0%) |
Property Value to Household Income Ratio in Lost Creek
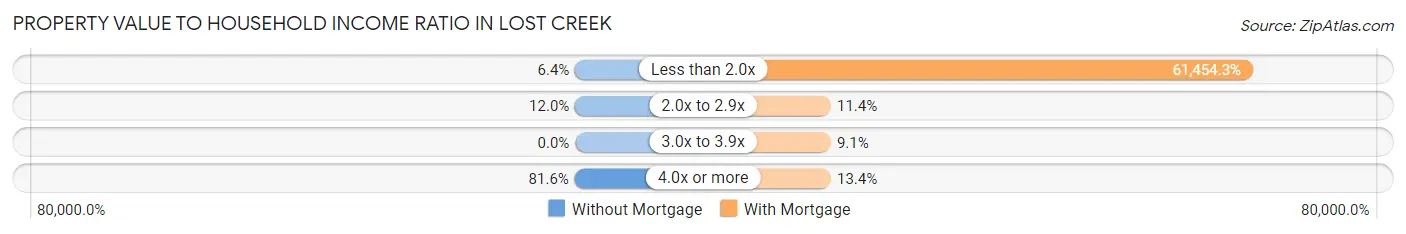
| Value-to-Income Ratio | Without Mortgage | With Mortgage |
| Less than 2.0x | 8 (6.4%) | 156,094 (61,454.3%) |
| 2.0x to 2.9x | 15 (12.0%) | 29 (11.4%) |
| 3.0x to 3.9x | 0 (0.0%) | 23 (9.1%) |
| 4.0x or more | 102 (81.6%) | 34 (13.4%) |
| Total | 125 (100.0%) | 254 (100.0%) |
Real Estate Taxes by Mortgage Status in Lost Creek
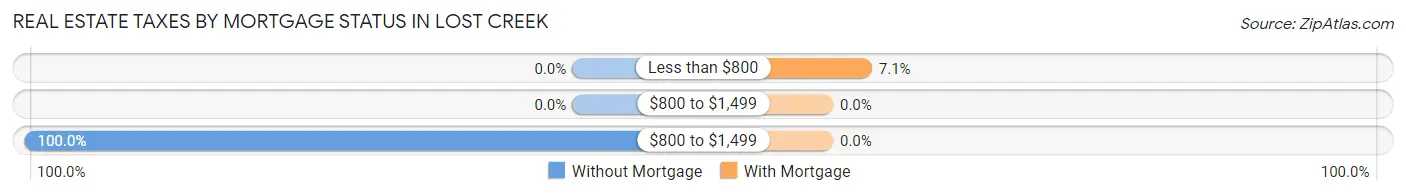
| Property Taxes | Without Mortgage | With Mortgage |
| Less than $800 | 0 (0.0%) | 18 (7.1%) |
| $800 to $1,499 | 0 (0.0%) | 0 (0.0%) |
| $800 to $1,499 | 125 (100.0%) | 0 (0.0%) |
| Total | 125 (100.0%) | 254 (100.0%) |
Health & Disability in Lost Creek
Health Insurance Coverage by Age in Lost Creek
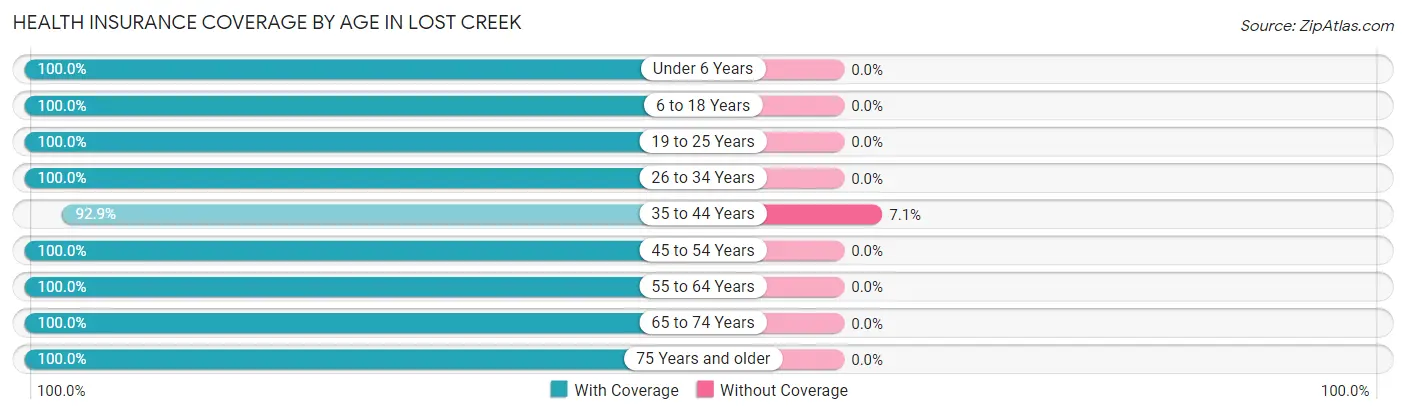
| Age Bracket | With Coverage | Without Coverage |
| Under 6 Years | 43 (100.0%) | 0 (0.0%) |
| 6 to 18 Years | 286 (100.0%) | 0 (0.0%) |
| 19 to 25 Years | 63 (100.0%) | 0 (0.0%) |
| 26 to 34 Years | 42 (100.0%) | 0 (0.0%) |
| 35 to 44 Years | 144 (92.9%) | 11 (7.1%) |
| 45 to 54 Years | 144 (100.0%) | 0 (0.0%) |
| 55 to 64 Years | 241 (100.0%) | 0 (0.0%) |
| 65 to 74 Years | 149 (100.0%) | 0 (0.0%) |
| 75 Years and older | 36 (100.0%) | 0 (0.0%) |
| Total | 1,148 (99.1%) | 11 (0.9%) |
Health Insurance Coverage by Citizenship Status in Lost Creek

| Citizenship Status | With Coverage | Without Coverage |
| Native Born | 43 (100.0%) | 0 (0.0%) |
| Foreign Born, Citizen | 286 (100.0%) | 0 (0.0%) |
| Foreign Born, not a Citizen | 63 (100.0%) | 0 (0.0%) |
Health Insurance Coverage by Household Income in Lost Creek
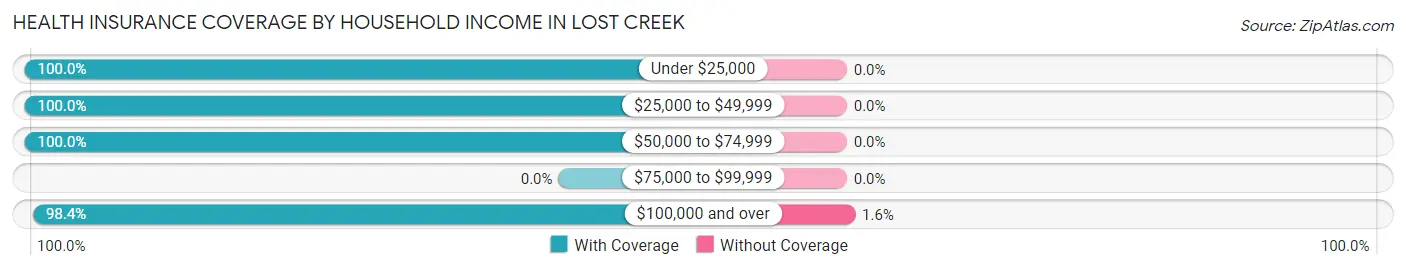
| Household Income | With Coverage | Without Coverage |
| Under $25,000 | 110 (100.0%) | 0 (0.0%) |
| $25,000 to $49,999 | 267 (100.0%) | 0 (0.0%) |
| $50,000 to $74,999 | 76 (100.0%) | 0 (0.0%) |
| $75,000 to $99,999 | 0 (0.0%) | 0 (0.0%) |
| $100,000 and over | 695 (98.4%) | 11 (1.6%) |
Public vs Private Health Insurance Coverage by Age in Lost Creek
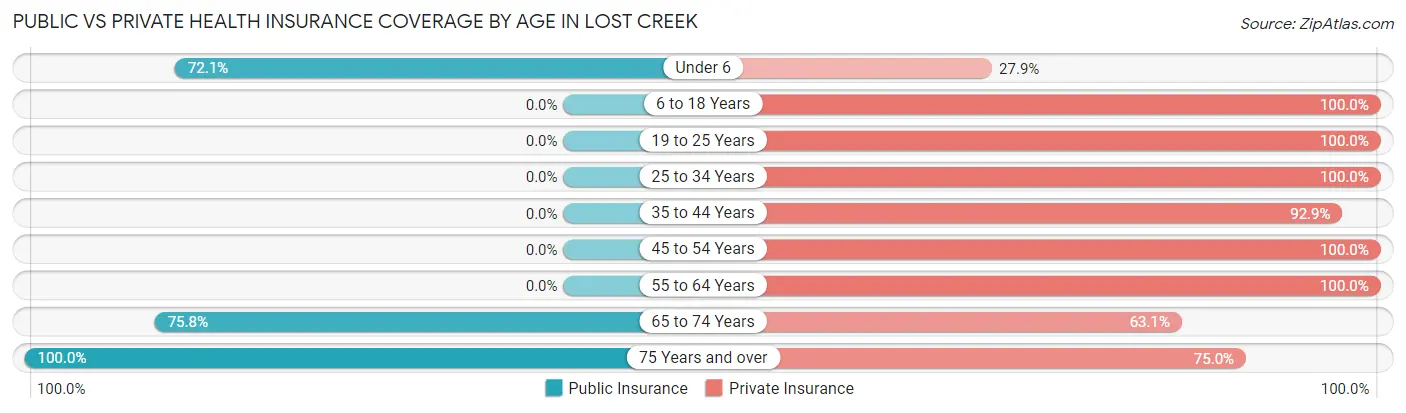
| Age Bracket | Public Insurance | Private Insurance |
| Under 6 | 31 (72.1%) | 12 (27.9%) |
| 6 to 18 Years | 0 (0.0%) | 286 (100.0%) |
| 19 to 25 Years | 0 (0.0%) | 63 (100.0%) |
| 25 to 34 Years | 0 (0.0%) | 42 (100.0%) |
| 35 to 44 Years | 0 (0.0%) | 144 (92.9%) |
| 45 to 54 Years | 0 (0.0%) | 144 (100.0%) |
| 55 to 64 Years | 0 (0.0%) | 241 (100.0%) |
| 65 to 74 Years | 113 (75.8%) | 94 (63.1%) |
| 75 Years and over | 36 (100.0%) | 27 (75.0%) |
| Total | 180 (15.5%) | 1,053 (90.8%) |
Disability Status by Sex by Age in Lost Creek
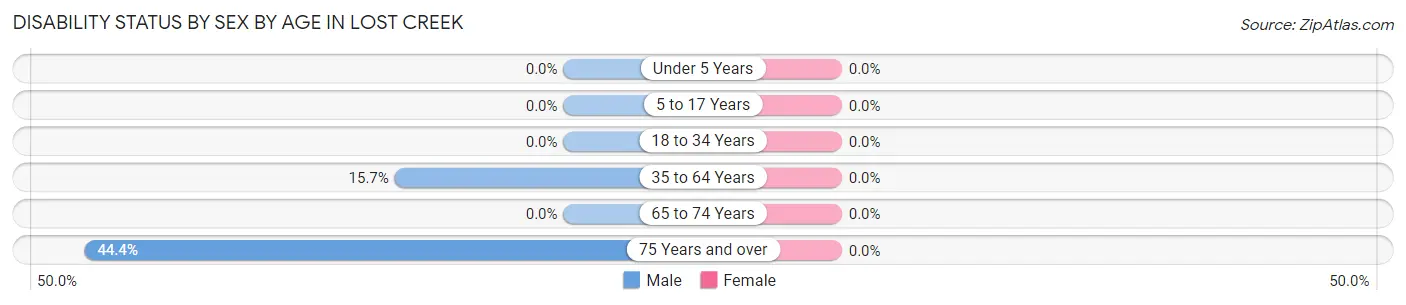
| Age Bracket | Male | Female |
| Under 5 Years | 0 (0.0%) | 0 (0.0%) |
| 5 to 17 Years | 0 (0.0%) | 0 (0.0%) |
| 18 to 34 Years | 0 (0.0%) | 0 (0.0%) |
| 35 to 64 Years | 39 (15.7%) | 0 (0.0%) |
| 65 to 74 Years | 0 (0.0%) | 0 (0.0%) |
| 75 Years and over | 8 (44.4%) | 0 (0.0%) |
Disability Class by Sex by Age in Lost Creek
Disability Class: Hearing Difficulty
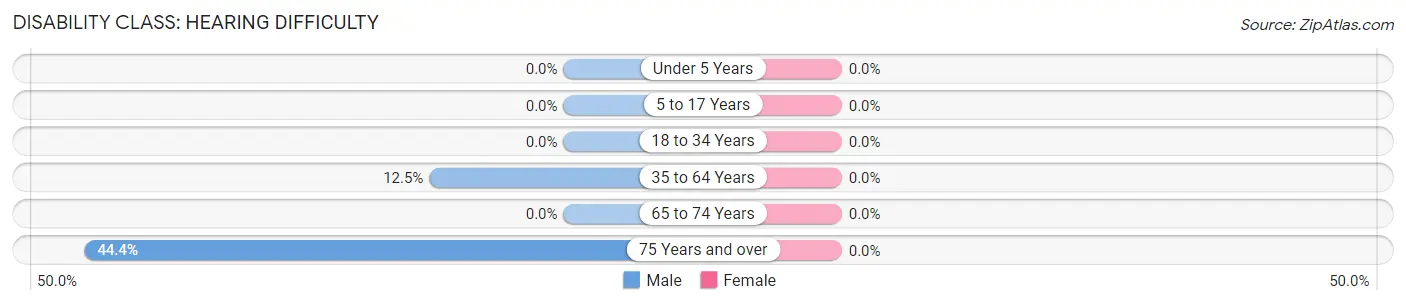
| Age Bracket | Male | Female |
| Under 5 Years | 0 (0.0%) | 0 (0.0%) |
| 5 to 17 Years | 0 (0.0%) | 0 (0.0%) |
| 18 to 34 Years | 0 (0.0%) | 0 (0.0%) |
| 35 to 64 Years | 31 (12.4%) | 0 (0.0%) |
| 65 to 74 Years | 0 (0.0%) | 0 (0.0%) |
| 75 Years and over | 8 (44.4%) | 0 (0.0%) |
Disability Class: Vision Difficulty
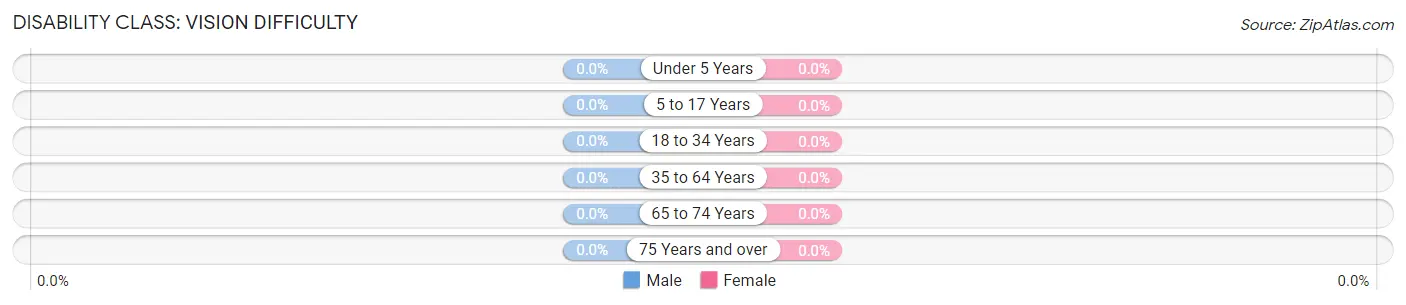
| Age Bracket | Male | Female |
| Under 5 Years | 0 (0.0%) | 0 (0.0%) |
| 5 to 17 Years | 0 (0.0%) | 0 (0.0%) |
| 18 to 34 Years | 0 (0.0%) | 0 (0.0%) |
| 35 to 64 Years | 0 (0.0%) | 0 (0.0%) |
| 65 to 74 Years | 0 (0.0%) | 0 (0.0%) |
| 75 Years and over | 0 (0.0%) | 0 (0.0%) |
Disability Class: Cognitive Difficulty
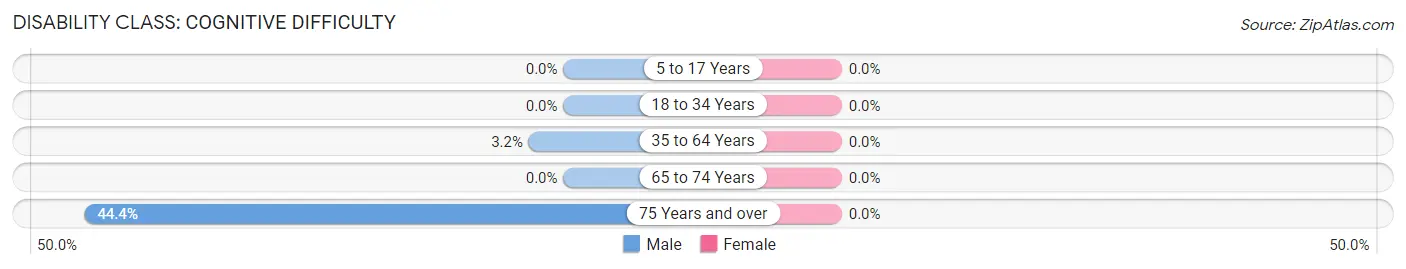
| Age Bracket | Male | Female |
| 5 to 17 Years | 0 (0.0%) | 0 (0.0%) |
| 18 to 34 Years | 0 (0.0%) | 0 (0.0%) |
| 35 to 64 Years | 8 (3.2%) | 0 (0.0%) |
| 65 to 74 Years | 0 (0.0%) | 0 (0.0%) |
| 75 Years and over | 8 (44.4%) | 0 (0.0%) |
Disability Class: Ambulatory Difficulty
| Age Bracket | Male | Female |
| 5 to 17 Years | 0 (0.0%) | 0 (0.0%) |
| 18 to 34 Years | 0 (0.0%) | 0 (0.0%) |
| 35 to 64 Years | 0 (0.0%) | 0 (0.0%) |
| 65 to 74 Years | 0 (0.0%) | 0 (0.0%) |
| 75 Years and over | 0 (0.0%) | 0 (0.0%) |
Disability Class: Self-Care Difficulty
| Age Bracket | Male | Female |
| 5 to 17 Years | 0 (0.0%) | 0 (0.0%) |
| 18 to 34 Years | 0 (0.0%) | 0 (0.0%) |
| 35 to 64 Years | 0 (0.0%) | 0 (0.0%) |
| 65 to 74 Years | 0 (0.0%) | 0 (0.0%) |
| 75 Years and over | 0 (0.0%) | 0 (0.0%) |
Technology Access in Lost Creek
Computing Device Access in Lost Creek
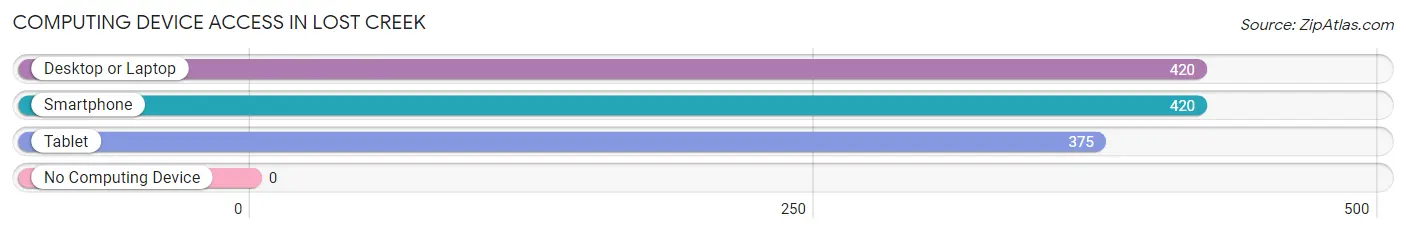
| Device Type | # Households | % Households |
| Desktop or Laptop | 420 | 100.0% |
| Smartphone | 420 | 100.0% |
| Tablet | 375 | 89.3% |
| No Computing Device | 0 | 0.0% |
| Total | 420 | 100.0% |
Internet Access in Lost Creek
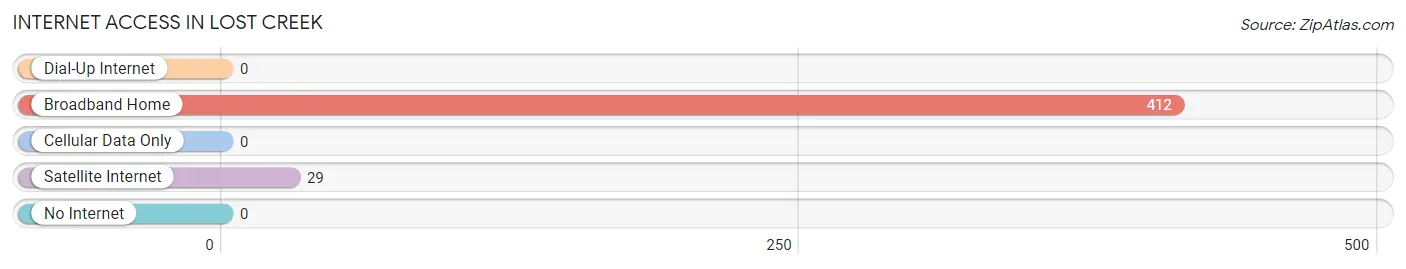
| Internet Type | # Households | % Households |
| Dial-Up Internet | 0 | 0.0% |
| Broadband Home | 412 | 98.1% |
| Cellular Data Only | 0 | 0.0% |
| Satellite Internet | 29 | 6.9% |
| No Internet | 0 | 0.0% |
| Total | 420 | 100.0% |
Lost Creek Summary
History
Lost Creek is a small unincorporated community located in Travis County, Texas. It is situated about 20 miles northwest of Austin, the state capital. The area was first settled in the late 1800s by German immigrants who were attracted to the area by its fertile soil and abundant water supply. The community was originally known as “Lost Creek Settlement” and was officially established in 1891.
The town was named after a nearby creek that had been lost in a flood. The creek was later found and the town was renamed Lost Creek. The town grew slowly but steadily over the years, and by the early 1900s it had become a thriving agricultural community. The town was home to several businesses, including a general store, a blacksmith shop, a cotton gin, and a post office.
In the early 1900s, the town was also home to a school, a church, and a cemetery. The school was eventually closed in the 1950s, but the church and cemetery remain in operation today.
Geography
Lost Creek is located in Travis County, Texas, about 20 miles northwest of Austin. The town is situated in the rolling hills of the Texas Hill Country, and is surrounded by lush green pastures and wooded areas. The town is located near the intersection of two major highways, US Highway 183 and State Highway 71.
The town is located at an elevation of 830 feet above sea level, and the average annual temperature is around 70 degrees Fahrenheit. The area receives an average of 33 inches of rain per year, and the average annual snowfall is around 1 inch.
Economy
The economy of Lost Creek is largely based on agriculture. The town is home to several farms and ranches, and the surrounding area is known for its production of beef, dairy, and poultry. The town is also home to several small businesses, including a general store, a post office, and a few restaurants.
The town is also home to a few small manufacturing companies, including a furniture manufacturer and a metal fabrication shop. The town is also home to a few small service businesses, including a plumbing and electrical contractor, a landscaping company, and a few auto repair shops.
Demographics
As of the 2010 census, the population of Lost Creek was 1,093. The racial makeup of the town was 94.3% White, 0.7% African American, 0.3% Native American, 0.2% Asian, 0.1% Pacific Islander, 2.7% from other races, and 1.9% from two or more races. Hispanic or Latino of any race were 5.3% of the population.
The median household income in Lost Creek was $45,000, and the median family income was $50,000. The per capita income for the town was $20,000. About 11.3% of families and 14.2% of the population were below the poverty line, including 18.2% of those under age 18 and 8.3% of those age 65 or over.
Common Questions
What is Per Capita Income in Lost Creek?
Per Capita income in Lost Creek is $79,466.
What is the Median Family Income in Lost Creek?
Median Family Income in Lost Creek is $148,355.
What is the Median Household income in Lost Creek?
Median Household Income in Lost Creek is $149,868.
What is Inequality or Gini Index in Lost Creek?
Inequality or Gini Index in Lost Creek is 0.56.
What is the Total Population of Lost Creek?
Total Population of Lost Creek is 1,159.
What is the Total Male Population of Lost Creek?
Total Male Population of Lost Creek is 579.
What is the Total Female Population of Lost Creek?
Total Female Population of Lost Creek is 580.
What is the Ratio of Males per 100 Females in Lost Creek?
There are 99.83 Males per 100 Females in Lost Creek.
What is the Ratio of Females per 100 Males in Lost Creek?
There are 100.17 Females per 100 Males in Lost Creek.
What is the Median Population Age in Lost Creek?
Median Population Age in Lost Creek is 44.8 Years.
What is the Average Family Size in Lost Creek
Average Family Size in Lost Creek is 3.0 People.
What is the Average Household Size in Lost Creek
Average Household Size in Lost Creek is 2.8 People.
How Large is the Labor Force in Lost Creek?
There are 519 People in the Labor Forcein in Lost Creek.
What is the Percentage of People in the Labor Force in Lost Creek?
57.4% of People are in the Labor Force in Lost Creek.
What is the Unemployment Rate in Lost Creek?
Unemployment Rate in Lost Creek is 6.2%.