St Stephens, NC Map & Demographics
St Stephens Map
St Stephens Overview
$27,026
PER CAPITA INCOME
$67,292
AVG FAMILY INCOME
$59,597
AVG HOUSEHOLD INCOME
4.7%
WAGE / INCOME GAP [ % ]
95.3¢/ $1
WAGE / INCOME GAP [ $ ]
$8,429
FAMILY INCOME DEFICIT
0.39
INEQUALITY / GINI INDEX
9,624
TOTAL POPULATION
5,161
MALE POPULATION
4,463
FEMALE POPULATION
115.64
MALES / 100 FEMALES
86.48
FEMALES / 100 MALES
43.0
MEDIAN AGE
2.9
AVG FAMILY SIZE
2.5
AVG HOUSEHOLD SIZE
4,856
LABOR FORCE [ PEOPLE ]
63.0%
PERCENT IN LABOR FORCE
4.2%
UNEMPLOYMENT RATE
Income in St Stephens
Income Overview in St Stephens
Per Capita Income in St Stephens is $27,026, while median incomes of families and households are $67,292 and $59,597 respectively.
| Characteristic | Number | Measure |
| Per Capita Income | 9,624 | $27,026 |
| Median Family Income | 2,863 | $67,292 |
| Mean Family Income | 2,863 | $74,149 |
| Median Household Income | 3,893 | $59,597 |
| Mean Household Income | 3,893 | $66,834 |
| Income Deficit | 2,863 | $8,429 |
| Wage / Income Gap (%) | 9,624 | 4.68% |
| Wage / Income Gap ($) | 9,624 | 95.32¢ per $1 |
| Gini / Inequality Index | 9,624 | 0.39 |
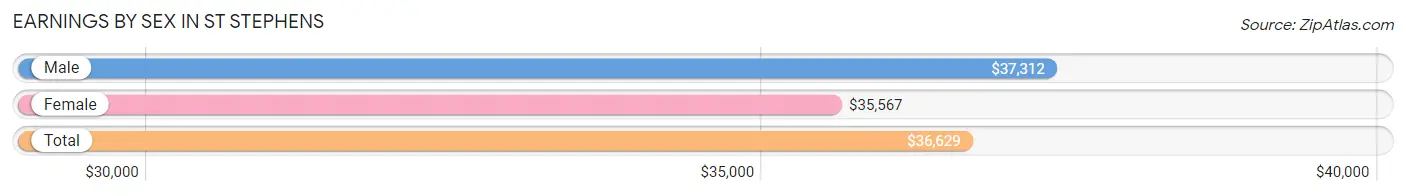
Earnings by Sex in St Stephens
Average Earnings in St Stephens are $36,629, $37,312 for men and $35,567 for women, a difference of 4.7%.
| Sex | Number | Average Earnings |
| Male | 2,873 (56.6%) | $37,312 |
| Female | 2,200 (43.4%) | $35,567 |
| Total | 5,073 (100.0%) | $36,629 |
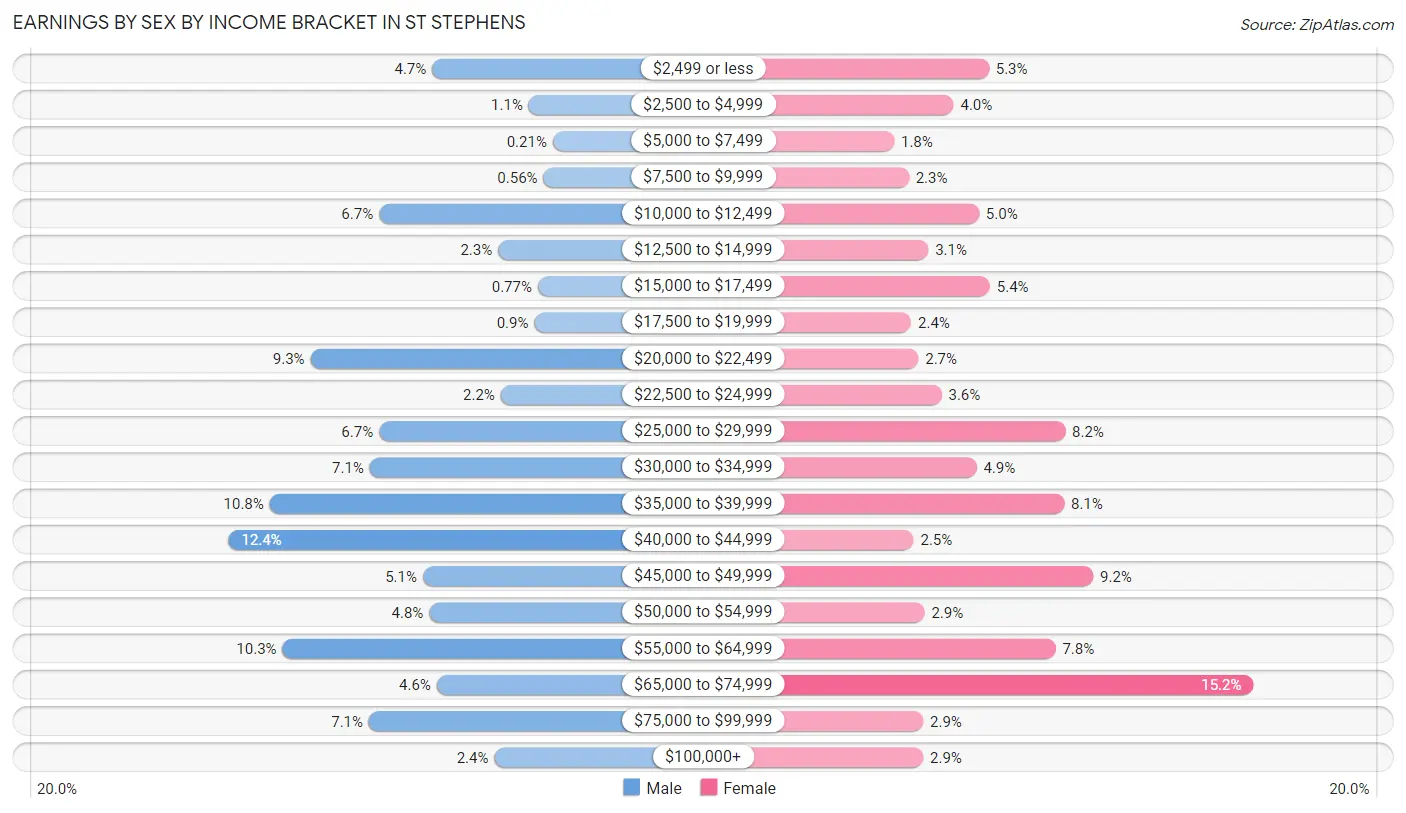
Earnings by Sex by Income Bracket in St Stephens
The most common earnings brackets in St Stephens are $40,000 to $44,999 for men (355 | 12.4%) and $65,000 to $74,999 for women (335 | 15.2%).
| Income | Male | Female |
| $2,499 or less | 136 (4.7%) | 117 (5.3%) |
| $2,500 to $4,999 | 32 (1.1%) | 88 (4.0%) |
| $5,000 to $7,499 | 6 (0.2%) | 39 (1.8%) |
| $7,500 to $9,999 | 16 (0.6%) | 51 (2.3%) |
| $10,000 to $12,499 | 193 (6.7%) | 109 (5.0%) |
| $12,500 to $14,999 | 65 (2.3%) | 67 (3.0%) |
| $15,000 to $17,499 | 22 (0.8%) | 118 (5.4%) |
| $17,500 to $19,999 | 26 (0.9%) | 53 (2.4%) |
| $20,000 to $22,499 | 267 (9.3%) | 59 (2.7%) |
| $22,500 to $24,999 | 62 (2.2%) | 78 (3.5%) |
| $25,000 to $29,999 | 193 (6.7%) | 180 (8.2%) |
| $30,000 to $34,999 | 203 (7.1%) | 107 (4.9%) |
| $35,000 to $39,999 | 311 (10.8%) | 179 (8.1%) |
| $40,000 to $44,999 | 355 (12.4%) | 55 (2.5%) |
| $45,000 to $49,999 | 146 (5.1%) | 203 (9.2%) |
| $50,000 to $54,999 | 139 (4.8%) | 64 (2.9%) |
| $55,000 to $64,999 | 297 (10.3%) | 172 (7.8%) |
| $65,000 to $74,999 | 131 (4.6%) | 335 (15.2%) |
| $75,000 to $99,999 | 204 (7.1%) | 63 (2.9%) |
| $100,000+ | 69 (2.4%) | 63 (2.9%) |
| Total | 2,873 (100.0%) | 2,200 (100.0%) |
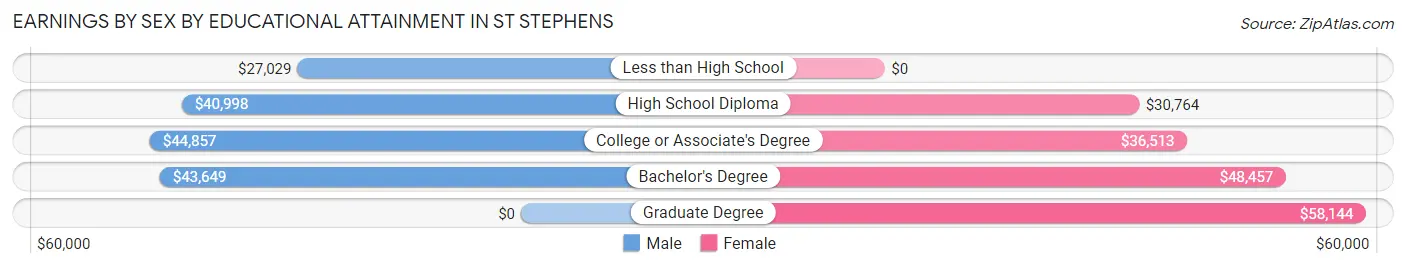
Earnings by Sex by Educational Attainment in St Stephens
Average earnings in St Stephens are $41,707 for men and $36,983 for women, a difference of 11.3%. Men with an educational attainment of college or associate's degree enjoy the highest average annual earnings of $44,857, while those with less than high school education earn the least with $27,029. Women with an educational attainment of graduate degree earn the most with the average annual earnings of $58,144, while those with high school diploma education have the smallest earnings of $30,764.
| Educational Attainment | Male Income | Female Income |
| Less than High School | $27,029 | $0 |
| High School Diploma | $40,998 | $30,764 |
| College or Associate's Degree | $44,857 | $36,513 |
| Bachelor's Degree | $43,649 | $48,457 |
| Graduate Degree | - | - |
| Total | $41,707 | $36,983 |
Family Income in St Stephens
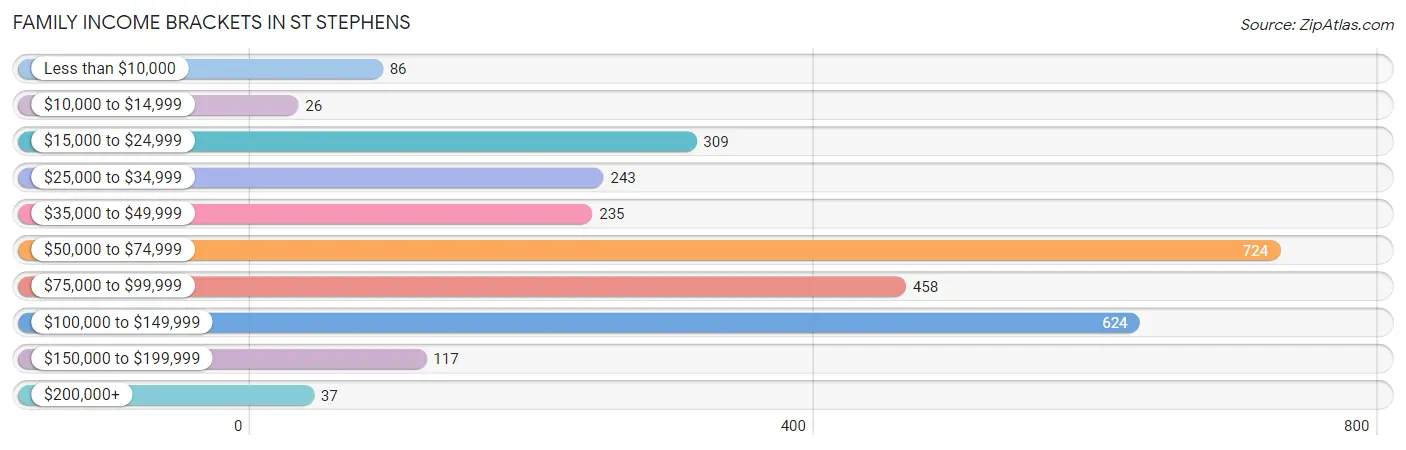
Family Income Brackets in St Stephens
According to the St Stephens family income data, there are 724 families falling into the $50,000 to $74,999 income range, which is the most common income bracket and makes up 25.3% of all families. Conversely, the $10,000 to $14,999 income bracket is the least frequent group with only 26 families (0.9%) belonging to this category.
| Income Bracket | # Families | % Families |
| Less than $10,000 | 86 | 3.0% |
| $10,000 to $14,999 | 26 | 0.9% |
| $15,000 to $24,999 | 309 | 10.8% |
| $25,000 to $34,999 | 243 | 8.5% |
| $35,000 to $49,999 | 235 | 8.2% |
| $50,000 to $74,999 | 724 | 25.3% |
| $75,000 to $99,999 | 458 | 16.0% |
| $100,000 to $149,999 | 624 | 21.8% |
| $150,000 to $199,999 | 117 | 4.1% |
| $200,000+ | 37 | 1.3% |
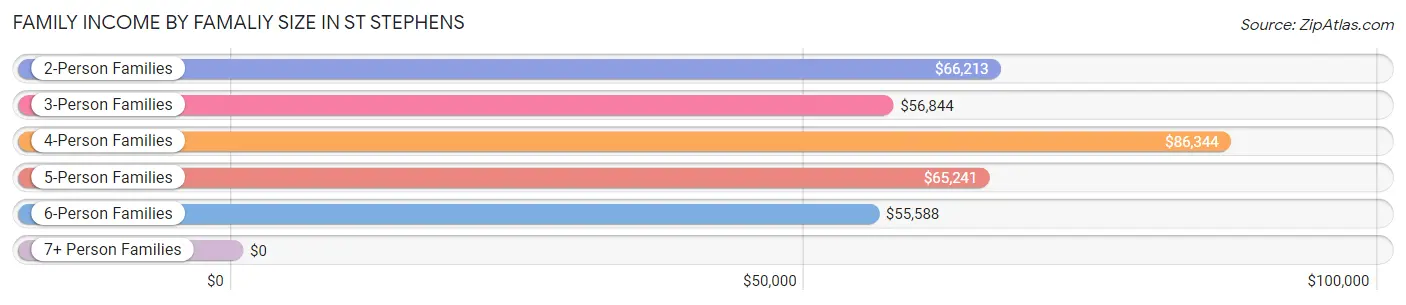
Family Income by Famaliy Size in St Stephens
4-person families (586 | 20.5%) account for the highest median family income in St Stephens with $86,344 per family, while 2-person families (1,427 | 49.8%) have the highest median income of $33,106 per family member.
| Income Bracket | # Families | Median Income |
| 2-Person Families | 1,427 (49.8%) | $66,213 |
| 3-Person Families | 545 (19.0%) | $56,844 |
| 4-Person Families | 586 (20.5%) | $86,344 |
| 5-Person Families | 249 (8.7%) | $65,241 |
| 6-Person Families | 42 (1.5%) | $55,588 |
| 7+ Person Families | 14 (0.5%) | $0 |
| Total | 2,863 (100.0%) | $67,292 |
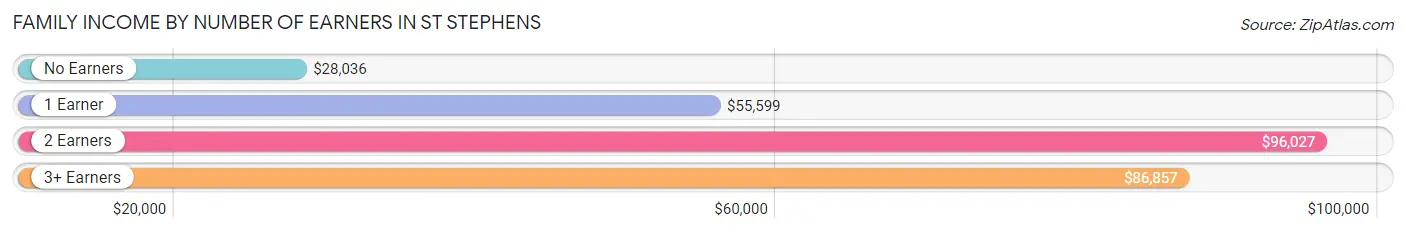
Family Income by Number of Earners in St Stephens
The median family income in St Stephens is $67,292, with families comprising 2 earners (1,195) having the highest median family income of $96,027, while families with no earners (515) have the lowest median family income of $28,036, accounting for 41.7% and 18.0% of families, respectively.
| Number of Earners | # Families | Median Income |
| No Earners | 515 (18.0%) | $28,036 |
| 1 Earner | 873 (30.5%) | $55,599 |
| 2 Earners | 1,195 (41.7%) | $96,027 |
| 3+ Earners | 280 (9.8%) | $86,857 |
| Total | 2,863 (100.0%) | $67,292 |
Household Income in St Stephens
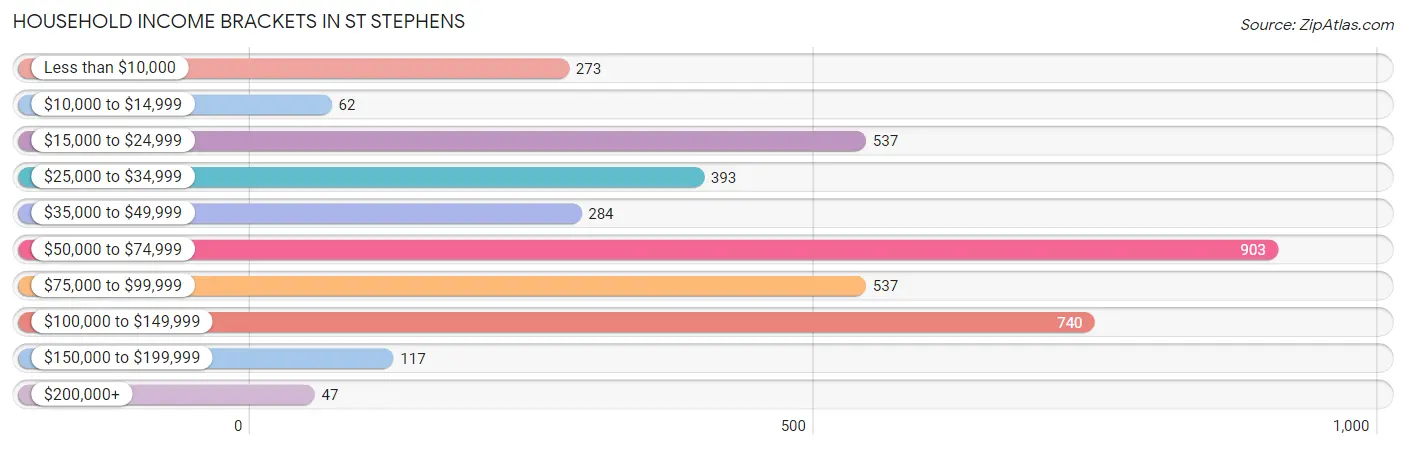
Household Income Brackets in St Stephens
With 903 households falling in the category, the $50,000 to $74,999 income range is the most frequent in St Stephens, accounting for 23.2% of all households. In contrast, only 47 households (1.2%) fall into the $200,000+ income bracket, making it the least populous group.
| Income Bracket | # Households | % Households |
| Less than $10,000 | 273 | 7.0% |
| $10,000 to $14,999 | 62 | 1.6% |
| $15,000 to $24,999 | 537 | 13.8% |
| $25,000 to $34,999 | 393 | 10.1% |
| $35,000 to $49,999 | 284 | 7.3% |
| $50,000 to $74,999 | 903 | 23.2% |
| $75,000 to $99,999 | 537 | 13.8% |
| $100,000 to $149,999 | 740 | 19.0% |
| $150,000 to $199,999 | 117 | 3.0% |
| $200,000+ | 47 | 1.2% |
Household Income by Householder Age in St Stephens
The median household income in St Stephens is $59,597, with the highest median household income of $84,130 found in the 25 to 44 years age bracket for the primary householder. A total of 1,226 households (31.5%) fall into this category. Meanwhile, the 15 to 24 years age bracket for the primary householder has the lowest median household income of $0, with 67 households (1.7%) in this group.
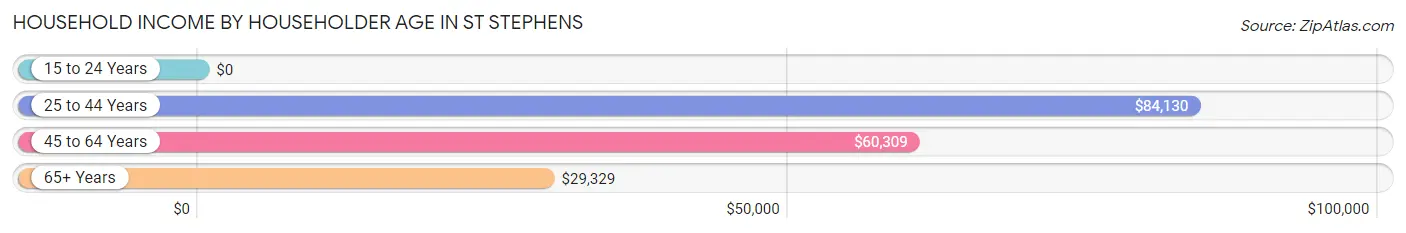
| Income Bracket | # Households | Median Income |
| 15 to 24 Years | 67 (1.7%) | $0 |
| 25 to 44 Years | 1,226 (31.5%) | $84,130 |
| 45 to 64 Years | 1,427 (36.7%) | $60,309 |
| 65+ Years | 1,173 (30.1%) | $29,329 |
| Total | 3,893 (100.0%) | $59,597 |
Poverty in St Stephens
Income Below Poverty by Sex and Age in St Stephens
With 13.8% poverty level for males and 15.8% for females among the residents of St Stephens, 12 to 14 year old males and 18 to 24 year old females are the most vulnerable to poverty, with 124 males (40.7%) and 69 females (35.9%) in their respective age groups living below the poverty level.
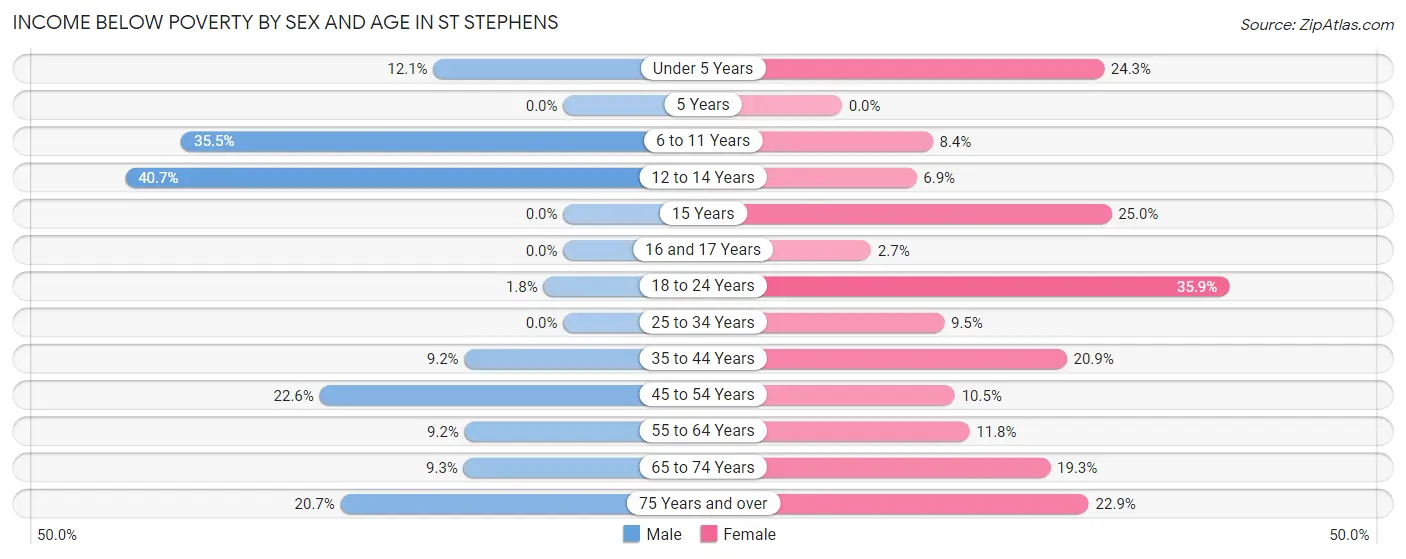
| Age Bracket | Male | Female |
| Under 5 Years | 41 (12.1%) | 63 (24.3%) |
| 5 Years | 0 (0.0%) | 0 (0.0%) |
| 6 to 11 Years | 143 (35.5%) | 23 (8.4%) |
| 12 to 14 Years | 124 (40.7%) | 9 (6.9%) |
| 15 Years | 0 (0.0%) | 12 (25.0%) |
| 16 and 17 Years | 0 (0.0%) | 4 (2.7%) |
| 18 to 24 Years | 12 (1.8%) | 69 (35.9%) |
| 25 to 34 Years | 0 (0.0%) | 52 (9.5%) |
| 35 to 44 Years | 67 (9.2%) | 136 (20.9%) |
| 45 to 54 Years | 150 (22.6%) | 59 (10.5%) |
| 55 to 64 Years | 61 (9.2%) | 72 (11.8%) |
| 65 to 74 Years | 48 (9.2%) | 93 (19.3%) |
| 75 Years and over | 68 (20.7%) | 115 (22.9%) |
| Total | 714 (13.8%) | 707 (15.8%) |
Income Above Poverty by Sex and Age in St Stephens
According to the poverty statistics in St Stephens, males aged 5 years and females aged 5 years are the age groups that are most secure financially, with 100.0% of males and 100.0% of females in these age groups living above the poverty line.
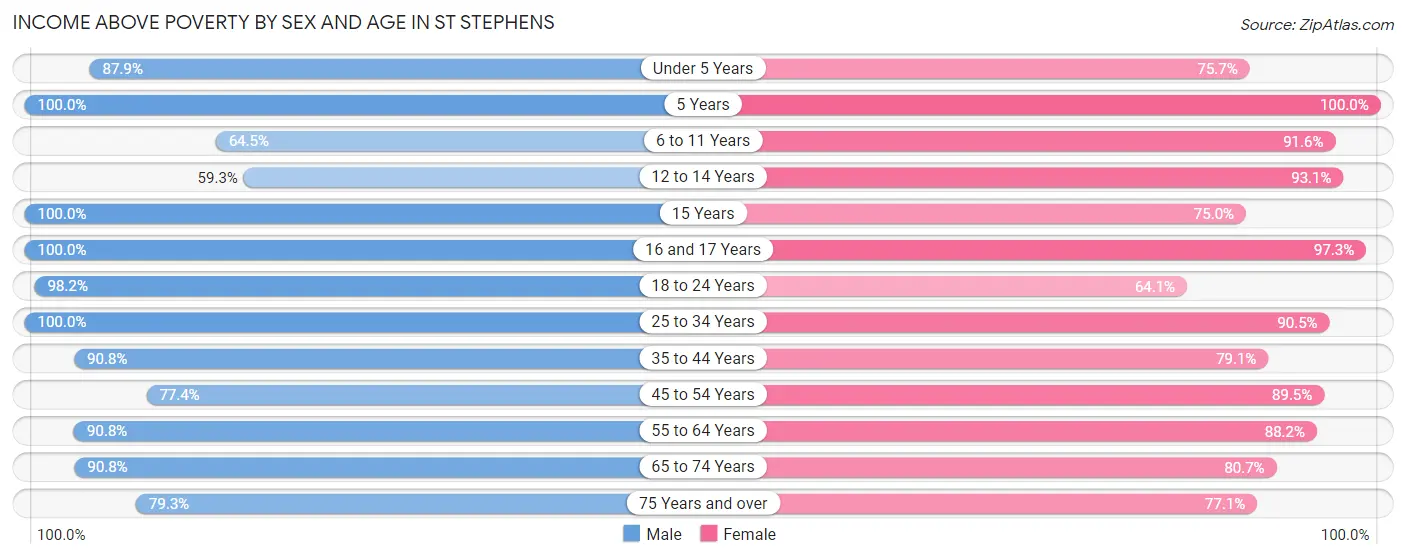
| Age Bracket | Male | Female |
| Under 5 Years | 299 (87.9%) | 196 (75.7%) |
| 5 Years | 63 (100.0%) | 59 (100.0%) |
| 6 to 11 Years | 260 (64.5%) | 250 (91.6%) |
| 12 to 14 Years | 181 (59.3%) | 121 (93.1%) |
| 15 Years | 35 (100.0%) | 36 (75.0%) |
| 16 and 17 Years | 75 (100.0%) | 144 (97.3%) |
| 18 to 24 Years | 640 (98.2%) | 123 (64.1%) |
| 25 to 34 Years | 380 (100.0%) | 496 (90.5%) |
| 35 to 44 Years | 663 (90.8%) | 516 (79.1%) |
| 45 to 54 Years | 513 (77.4%) | 504 (89.5%) |
| 55 to 64 Years | 605 (90.8%) | 536 (88.2%) |
| 65 to 74 Years | 471 (90.7%) | 388 (80.7%) |
| 75 Years and over | 261 (79.3%) | 387 (77.1%) |
| Total | 4,446 (86.2%) | 3,756 (84.2%) |
Income Below Poverty Among Married-Couple Families in St Stephens
The poverty statistics for married-couple families in St Stephens show that 11.5% or 252 of the total 2,187 families live below the poverty line. Families with 1 or 2 children have the highest poverty rate of 26.6%, comprising of 199 families. On the other hand, families with 3 or 4 children have the lowest poverty rate of 0.0%, which includes 0 families.
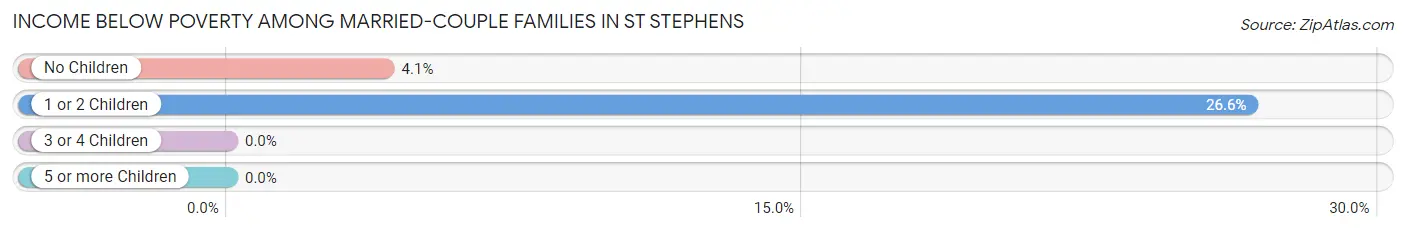
| Children | Above Poverty | Below Poverty |
| No Children | 1,244 (95.9%) | 53 (4.1%) |
| 1 or 2 Children | 548 (73.4%) | 199 (26.6%) |
| 3 or 4 Children | 143 (100.0%) | 0 (0.0%) |
| 5 or more Children | 0 (0.0%) | 0 (0.0%) |
| Total | 1,935 (88.5%) | 252 (11.5%) |
Income Below Poverty Among Single-Parent Households in St Stephens
According to the poverty data in St Stephens, 14.5% or 35 single-father households and 20.0% or 87 single-mother households are living below the poverty line. Among single-father households, those with 1 or 2 children have the highest poverty rate, with 26 households (17.8%) experiencing poverty. Likewise, among single-mother households, those with 1 or 2 children have the highest poverty rate, with 80 households (30.3%) falling below the poverty line.
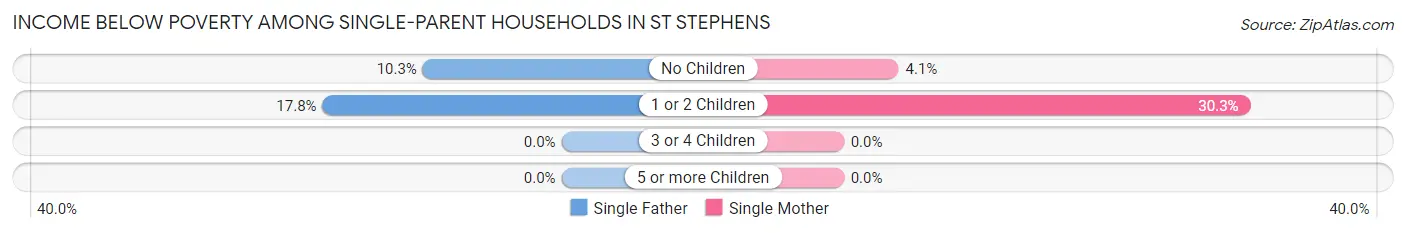
| Children | Single Father | Single Mother |
| No Children | 9 (10.3%) | 7 (4.1%) |
| 1 or 2 Children | 26 (17.8%) | 80 (30.3%) |
| 3 or 4 Children | 0 (0.0%) | 0 (0.0%) |
| 5 or more Children | 0 (0.0%) | 0 (0.0%) |
| Total | 35 (14.5%) | 87 (20.0%) |
Income Below Poverty Among Married-Couple vs Single-Parent Households in St Stephens
The poverty data for St Stephens shows that 252 of the married-couple family households (11.5%) and 122 of the single-parent households (18.0%) are living below the poverty level. Within the married-couple family households, those with 1 or 2 children have the highest poverty rate, with 199 households (26.6%) falling below the poverty line. Among the single-parent households, those with 1 or 2 children have the highest poverty rate, with 106 household (25.9%) living below poverty.
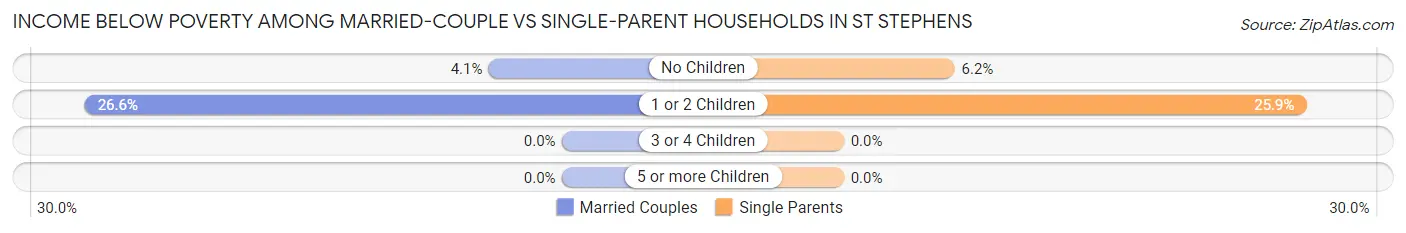
| Children | Married-Couple Families | Single-Parent Households |
| No Children | 53 (4.1%) | 16 (6.2%) |
| 1 or 2 Children | 199 (26.6%) | 106 (25.9%) |
| 3 or 4 Children | 0 (0.0%) | 0 (0.0%) |
| 5 or more Children | 0 (0.0%) | 0 (0.0%) |
| Total | 252 (11.5%) | 122 (18.0%) |
Race in St Stephens
The most populous races in St Stephens are White / Caucasian (7,215 | 75.0%), Hispanic or Latino (1,426 | 14.8%), and Two or more Races (950 | 9.9%).
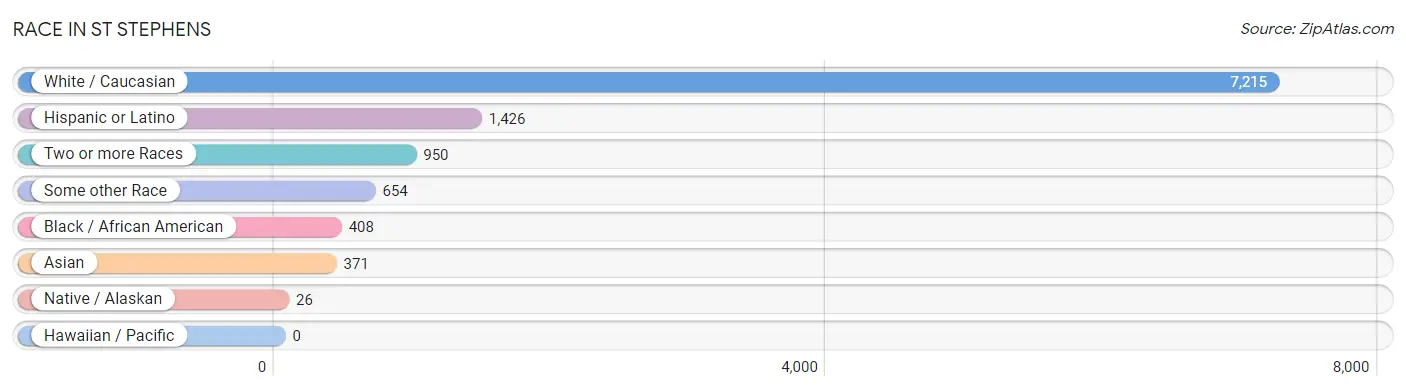
| Race | # Population | % Population |
| Asian | 371 | 3.8% |
| Black / African American | 408 | 4.2% |
| Hawaiian / Pacific | 0 | 0.0% |
| Hispanic or Latino | 1,426 | 14.8% |
| Native / Alaskan | 26 | 0.3% |
| White / Caucasian | 7,215 | 75.0% |
| Two or more Races | 950 | 9.9% |
| Some other Race | 654 | 6.8% |
| Total | 9,624 | 100.0% |
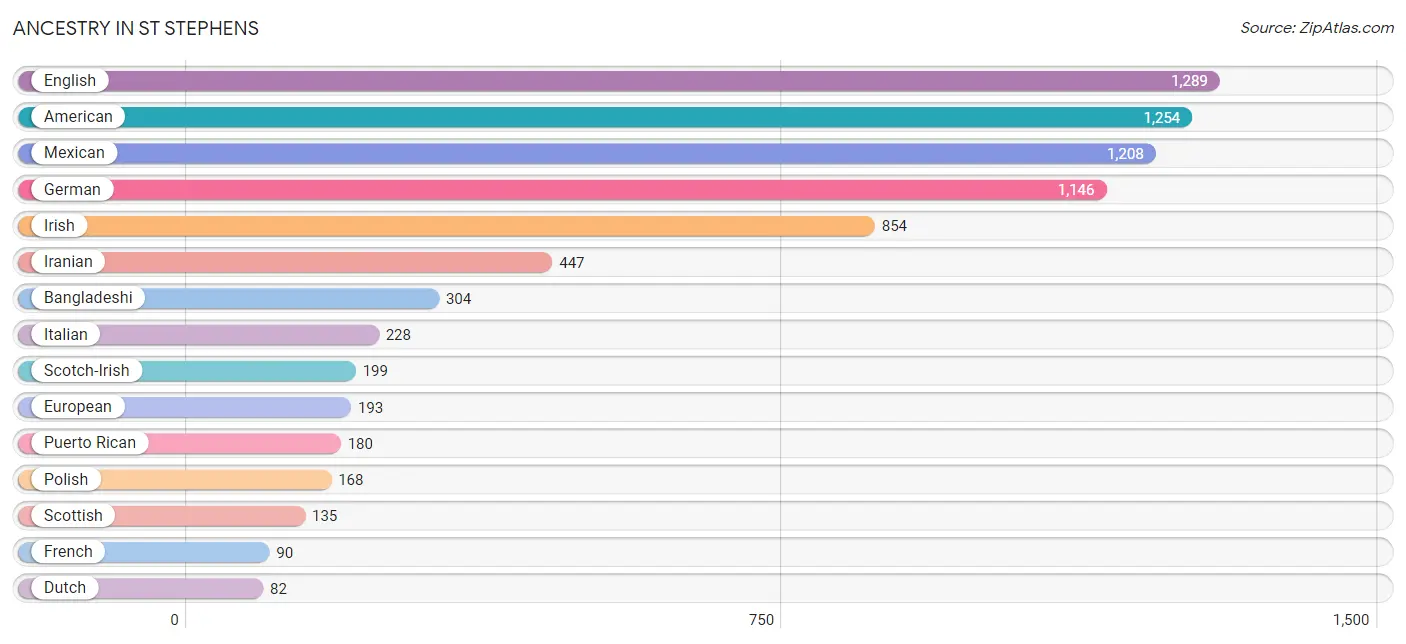
Ancestry in St Stephens
The most populous ancestries reported in St Stephens are English (1,289 | 13.4%), American (1,254 | 13.0%), Mexican (1,208 | 12.6%), German (1,146 | 11.9%), and Irish (854 | 8.9%), together accounting for 59.8% of all St Stephens residents.
| Ancestry | # Population | % Population |
| African | 46 | 0.5% |
| American | 1,254 | 13.0% |
| Bangladeshi | 304 | 3.2% |
| British | 55 | 0.6% |
| British West Indian | 16 | 0.2% |
| Cherokee | 1 | 0.0% |
| Colombian | 23 | 0.2% |
| Danish | 13 | 0.1% |
| Dutch | 82 | 0.9% |
| Eastern European | 29 | 0.3% |
| English | 1,289 | 13.4% |
| European | 193 | 2.0% |
| Finnish | 31 | 0.3% |
| French | 90 | 0.9% |
| French Canadian | 44 | 0.5% |
| German | 1,146 | 11.9% |
| Haitian | 41 | 0.4% |
| Indian (Asian) | 20 | 0.2% |
| Iranian | 447 | 4.6% |
| Irish | 854 | 8.9% |
| Italian | 228 | 2.4% |
| Malaysian | 21 | 0.2% |
| Mexican | 1,208 | 12.6% |
| Mexican American Indian | 43 | 0.4% |
| Northern European | 14 | 0.2% |
| Norwegian | 22 | 0.2% |
| Peruvian | 15 | 0.2% |
| Polish | 168 | 1.8% |
| Puerto Rican | 180 | 1.9% |
| Russian | 23 | 0.2% |
| Scandinavian | 12 | 0.1% |
| Scotch-Irish | 199 | 2.1% |
| Scottish | 135 | 1.4% |
| Slovak | 10 | 0.1% |
| South American | 38 | 0.4% |
| Sri Lankan | 26 | 0.3% |
| Subsaharan African | 46 | 0.5% |
| Swedish | 15 | 0.2% |
| Welsh | 35 | 0.4% | View All 39 Rows |
Immigrants in St Stephens
The most numerous immigrant groups reported in St Stephens came from Latin America (674 | 7.0%), Central America (636 | 6.6%), Mexico (636 | 6.6%), Asia (468 | 4.9%), and Iran (349 | 3.6%), together accounting for 28.7% of all St Stephens residents.
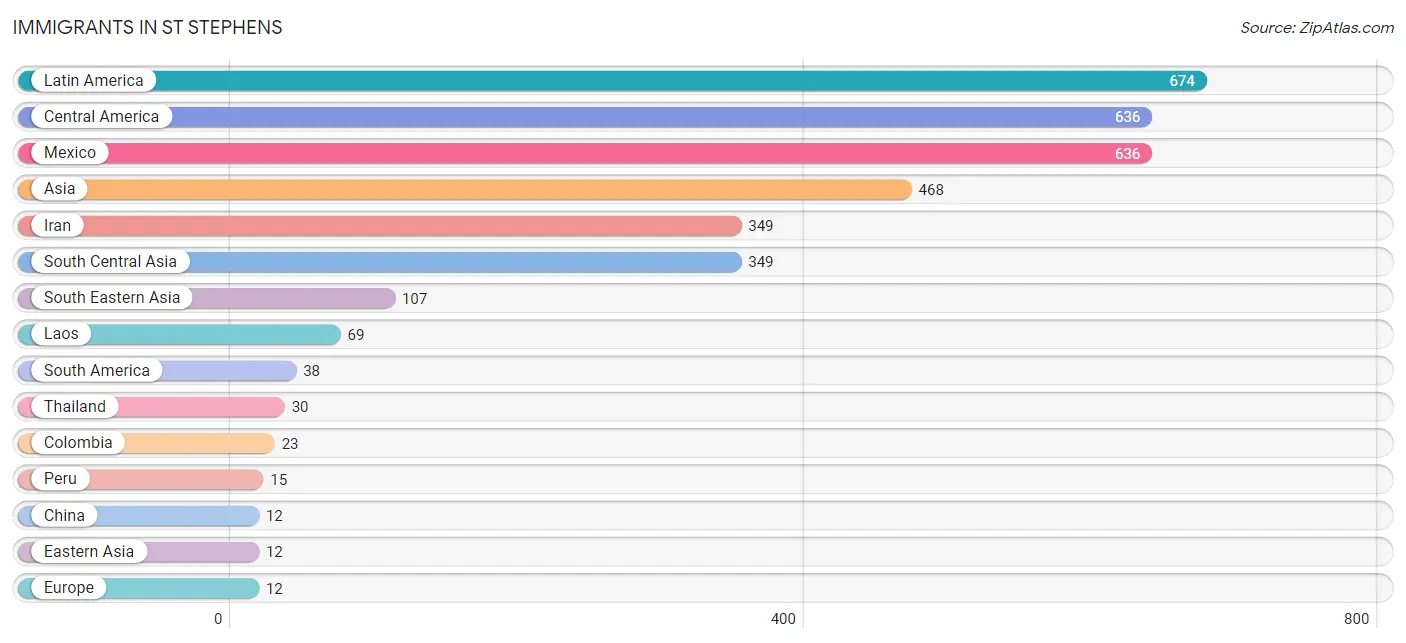
| Immigration Origin | # Population | % Population |
| Asia | 468 | 4.9% |
| Central America | 636 | 6.6% |
| China | 12 | 0.1% |
| Colombia | 23 | 0.2% |
| Eastern Asia | 12 | 0.1% |
| Europe | 12 | 0.1% |
| Iran | 349 | 3.6% |
| Laos | 69 | 0.7% |
| Latin America | 674 | 7.0% |
| Mexico | 636 | 6.6% |
| Northern Europe | 12 | 0.1% |
| Peru | 15 | 0.2% |
| Scotland | 10 | 0.1% |
| South America | 38 | 0.4% |
| South Central Asia | 349 | 3.6% |
| South Eastern Asia | 107 | 1.1% |
| Sweden | 2 | 0.0% |
| Taiwan | 12 | 0.1% |
| Thailand | 30 | 0.3% |
| Vietnam | 8 | 0.1% | View All 20 Rows |
Sex and Age in St Stephens
Sex and Age in St Stephens
The most populous age groups in St Stephens are 10 to 14 Years (526 | 10.2%) for men and 45 to 49 Years (399 | 8.9%) for women.
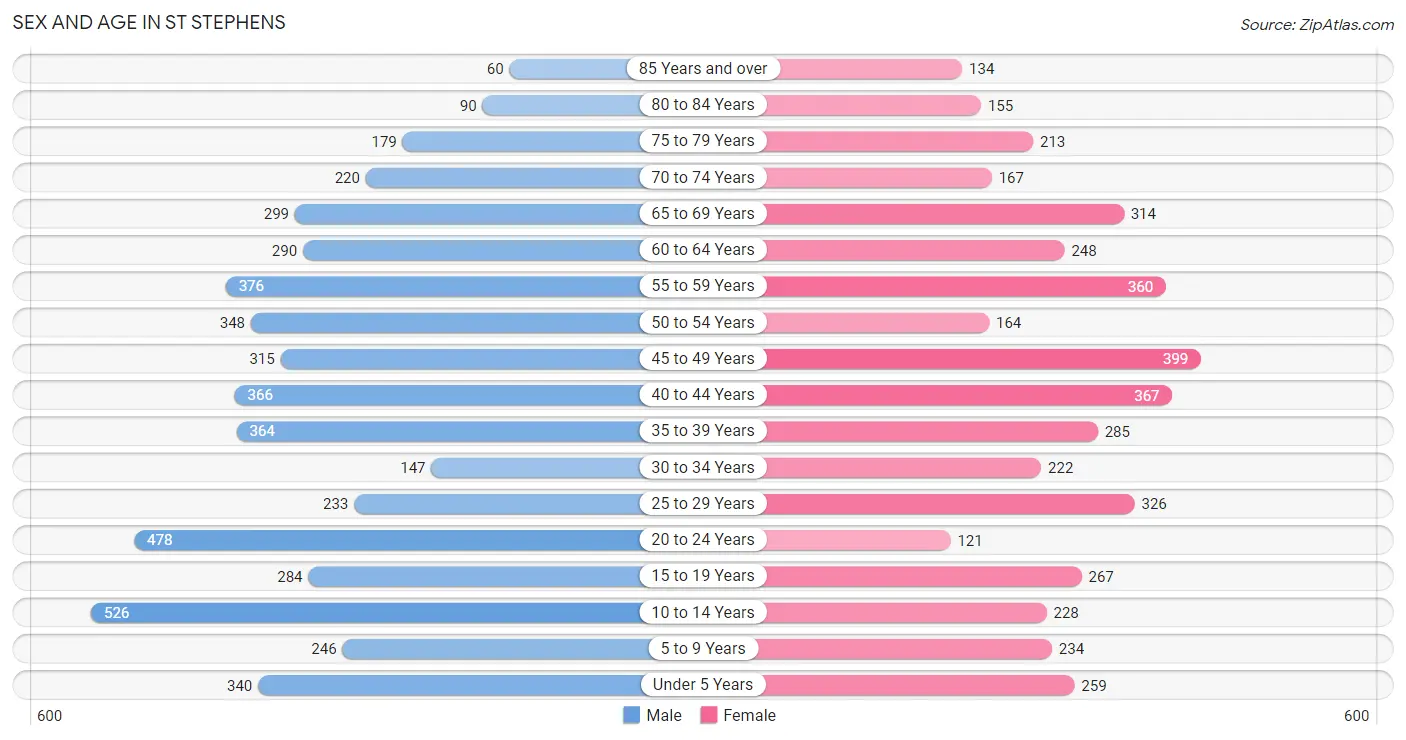
| Age Bracket | Male | Female |
| Under 5 Years | 340 (6.6%) | 259 (5.8%) |
| 5 to 9 Years | 246 (4.8%) | 234 (5.2%) |
| 10 to 14 Years | 526 (10.2%) | 228 (5.1%) |
| 15 to 19 Years | 284 (5.5%) | 267 (6.0%) |
| 20 to 24 Years | 478 (9.3%) | 121 (2.7%) |
| 25 to 29 Years | 233 (4.5%) | 326 (7.3%) |
| 30 to 34 Years | 147 (2.9%) | 222 (5.0%) |
| 35 to 39 Years | 364 (7.0%) | 285 (6.4%) |
| 40 to 44 Years | 366 (7.1%) | 367 (8.2%) |
| 45 to 49 Years | 315 (6.1%) | 399 (8.9%) |
| 50 to 54 Years | 348 (6.7%) | 164 (3.7%) |
| 55 to 59 Years | 376 (7.3%) | 360 (8.1%) |
| 60 to 64 Years | 290 (5.6%) | 248 (5.6%) |
| 65 to 69 Years | 299 (5.8%) | 314 (7.0%) |
| 70 to 74 Years | 220 (4.3%) | 167 (3.7%) |
| 75 to 79 Years | 179 (3.5%) | 213 (4.8%) |
| 80 to 84 Years | 90 (1.7%) | 155 (3.5%) |
| 85 Years and over | 60 (1.2%) | 134 (3.0%) |
| Total | 5,161 (100.0%) | 4,463 (100.0%) |
Families and Households in St Stephens
Median Family Size in St Stephens
The median family size in St Stephens is 2.88 persons per family, with single female/mother families (435 | 15.2%) accounting for the largest median family size of 3.12 persons per family. On the other hand, single male/father families (241 | 8.4%) represent the smallest median family size with 2.64 persons per family.
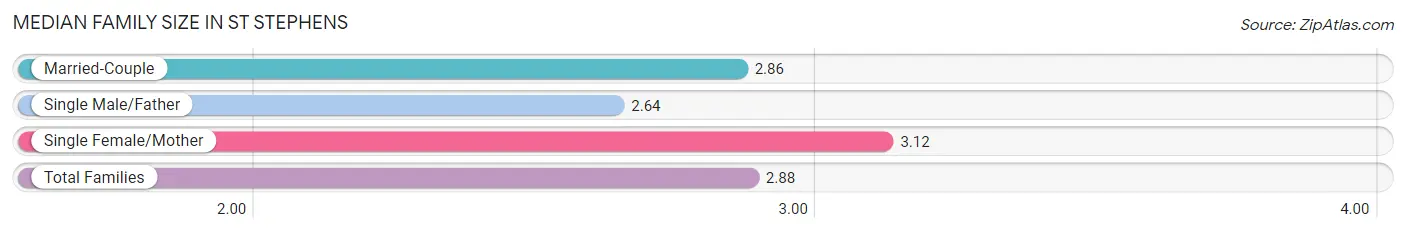
| Family Type | # Families | Family Size |
| Married-Couple | 2,187 (76.4%) | 2.86 |
| Single Male/Father | 241 (8.4%) | 2.64 |
| Single Female/Mother | 435 (15.2%) | 3.12 |
| Total Families | 2,863 (100.0%) | 2.88 |
Median Household Size in St Stephens
The median household size in St Stephens is 2.47 persons per household, with single female/mother households (435 | 11.2%) accounting for the largest median household size of 3.4 persons per household. non-family households (1,030 | 26.5%) represent the smallest median household size with 1.13 persons per household.
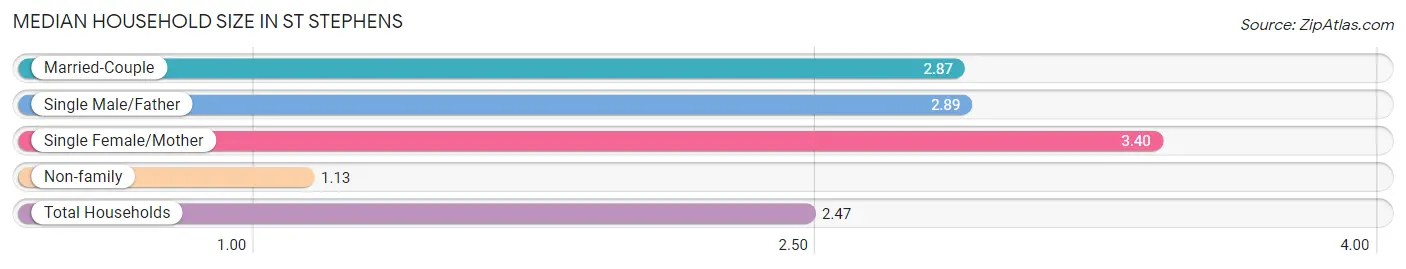
| Household Type | # Households | Household Size |
| Married-Couple | 2,187 (56.2%) | 2.87 |
| Single Male/Father | 241 (6.2%) | 2.89 |
| Single Female/Mother | 435 (11.2%) | 3.40 |
| Non-family | 1,030 (26.5%) | 1.13 |
| Total Households | 3,893 (100.0%) | 2.47 |
Household Size by Marriage Status in St Stephens
Out of a total of 3,893 households in St Stephens, 2,863 (73.5%) are family households, while 1,030 (26.5%) are nonfamily households. The most numerous type of family households are 2-person households, comprising 1,420, and the most common type of nonfamily households are 1-person households, comprising 892.
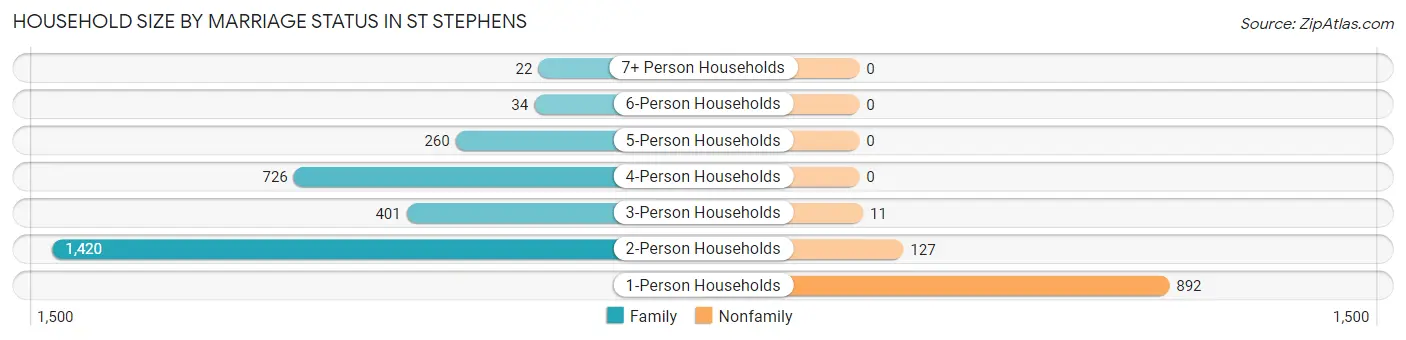
| Household Size | Family Households | Nonfamily Households |
| 1-Person Households | - | 892 (22.9%) |
| 2-Person Households | 1,420 (36.5%) | 127 (3.3%) |
| 3-Person Households | 401 (10.3%) | 11 (0.3%) |
| 4-Person Households | 726 (18.6%) | 0 (0.0%) |
| 5-Person Households | 260 (6.7%) | 0 (0.0%) |
| 6-Person Households | 34 (0.9%) | 0 (0.0%) |
| 7+ Person Households | 22 (0.6%) | 0 (0.0%) |
| Total | 2,863 (73.5%) | 1,030 (26.5%) |
Female Fertility in St Stephens
Fertility by Age in St Stephens
Average fertility rate in St Stephens is 51.0 births per 1,000 women. Women in the age bracket of 20 to 34 years have the highest fertility rate with 93.0 births per 1,000 women. Women in the age bracket of 20 to 34 years acount for 60.2% of all women with births.
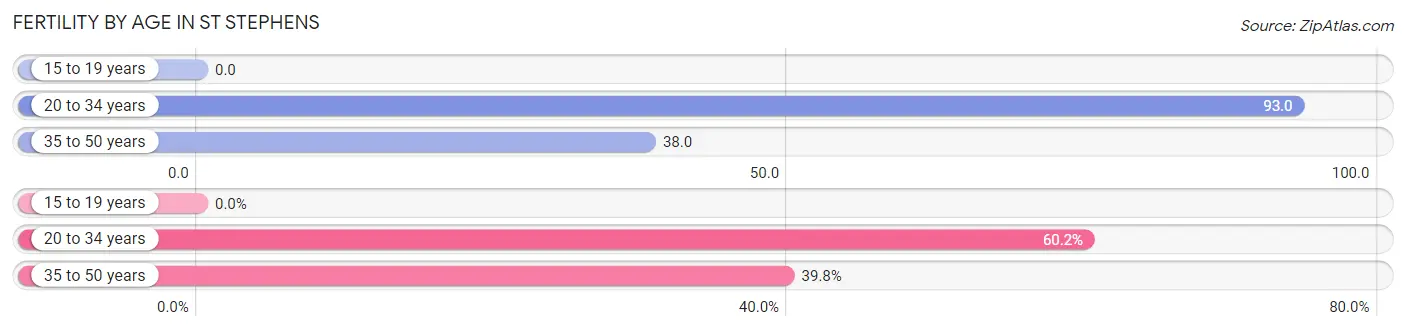
| Age Bracket | Women with Births | Births / 1,000 Women |
| 15 to 19 years | 0 (0.0%) | 0.0 |
| 20 to 34 years | 62 (60.2%) | 93.0 |
| 35 to 50 years | 41 (39.8%) | 38.0 |
| Total | 103 (100.0%) | 51.0 |
Fertility by Age by Marriage Status in St Stephens
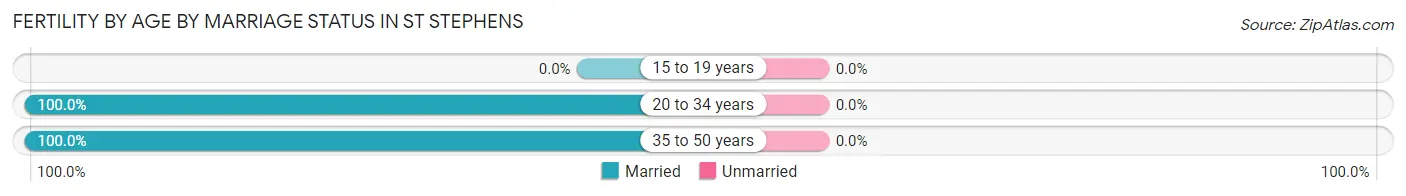
| Age Bracket | Married | Unmarried |
| 15 to 19 years | 0 (0.0%) | 0 (0.0%) |
| 20 to 34 years | 62 (100.0%) | 0 (0.0%) |
| 35 to 50 years | 41 (100.0%) | 0 (0.0%) |
| Total | 103 (100.0%) | 0 (0.0%) |
Fertility by Education in St Stephens
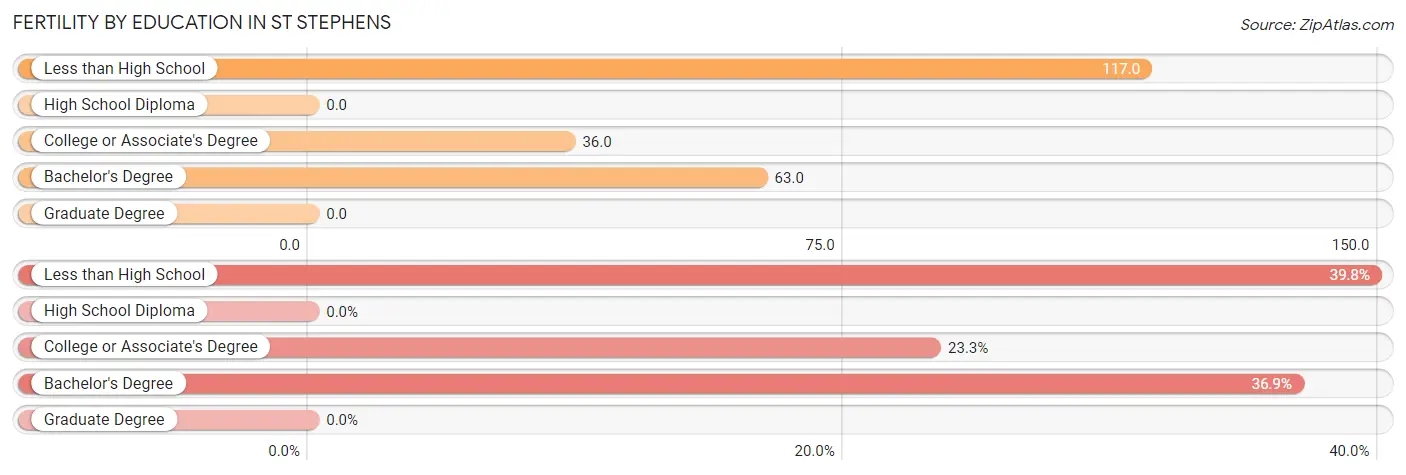
| Educational Attainment | Women with Births | Births / 1,000 Women |
| Less than High School | 41 (39.8%) | 117.0 |
| High School Diploma | 0 (0.0%) | 0.0 |
| College or Associate's Degree | 24 (23.3%) | 36.0 |
| Bachelor's Degree | 38 (36.9%) | 63.0 |
| Graduate Degree | 0 (0.0%) | 0.0 |
| Total | 103 (100.0%) | 51.0 |
Fertility by Education by Marriage Status in St Stephens
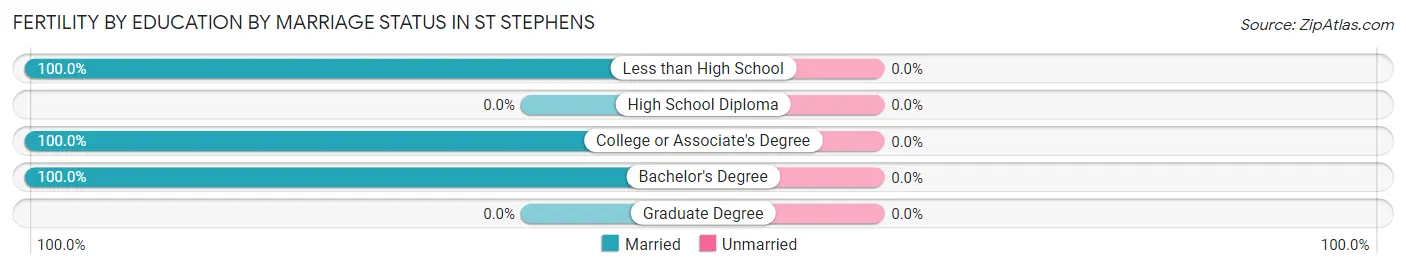
| Educational Attainment | Married | Unmarried |
| Less than High School | 41 (100.0%) | 0 (0.0%) |
| High School Diploma | 0 (0.0%) | 0 (0.0%) |
| College or Associate's Degree | 24 (100.0%) | 0 (0.0%) |
| Bachelor's Degree | 38 (100.0%) | 0 (0.0%) |
| Graduate Degree | 0 (0.0%) | 0 (0.0%) |
| Total | 103 (100.0%) | 0 (0.0%) |
Employment Characteristics in St Stephens
Employment by Class of Employer in St Stephens
Among the 4,496 employed individuals in St Stephens, private company employees (3,347 | 74.4%), self-employed (not incorporated) (332 | 7.4%), and not-for-profit organizations (285 | 6.3%) make up the most common classes of employment.
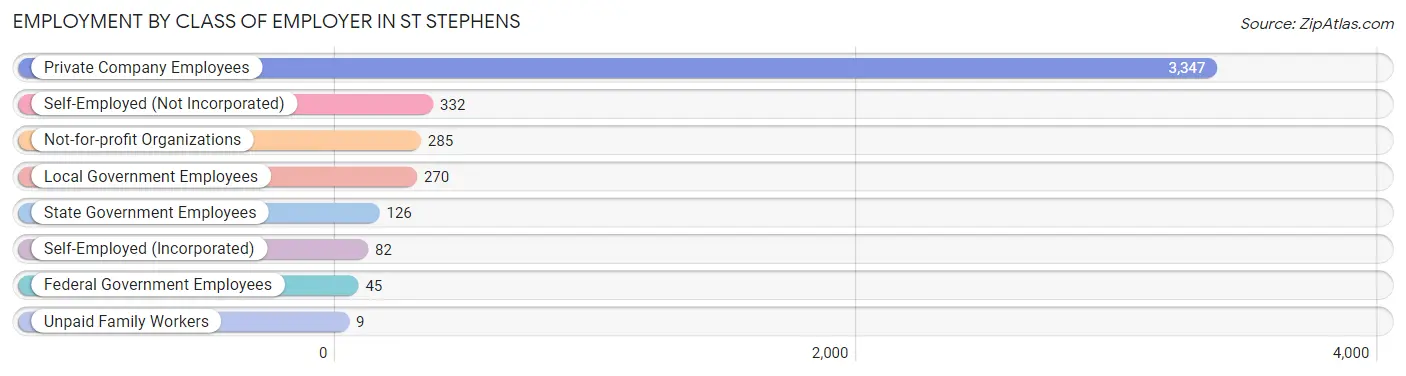
| Employer Class | # Employees | % Employees |
| Private Company Employees | 3,347 | 74.4% |
| Self-Employed (Incorporated) | 82 | 1.8% |
| Self-Employed (Not Incorporated) | 332 | 7.4% |
| Not-for-profit Organizations | 285 | 6.3% |
| Local Government Employees | 270 | 6.0% |
| State Government Employees | 126 | 2.8% |
| Federal Government Employees | 45 | 1.0% |
| Unpaid Family Workers | 9 | 0.2% |
| Total | 4,496 | 100.0% |
Employment Status by Age in St Stephens
According to the labor force statistics for St Stephens, out of the total population over 16 years of age (7,708), 63.0% or 4,856 individuals are in the labor force, with 4.2% or 204 of them unemployed. The age group with the highest labor force participation rate is 45 to 54 years, with 85.6% or 1,049 individuals in the labor force. Within the labor force, the 20 to 24 years age range has the highest percentage of unemployed individuals, with 12.8% or 47 of them being unemployed.
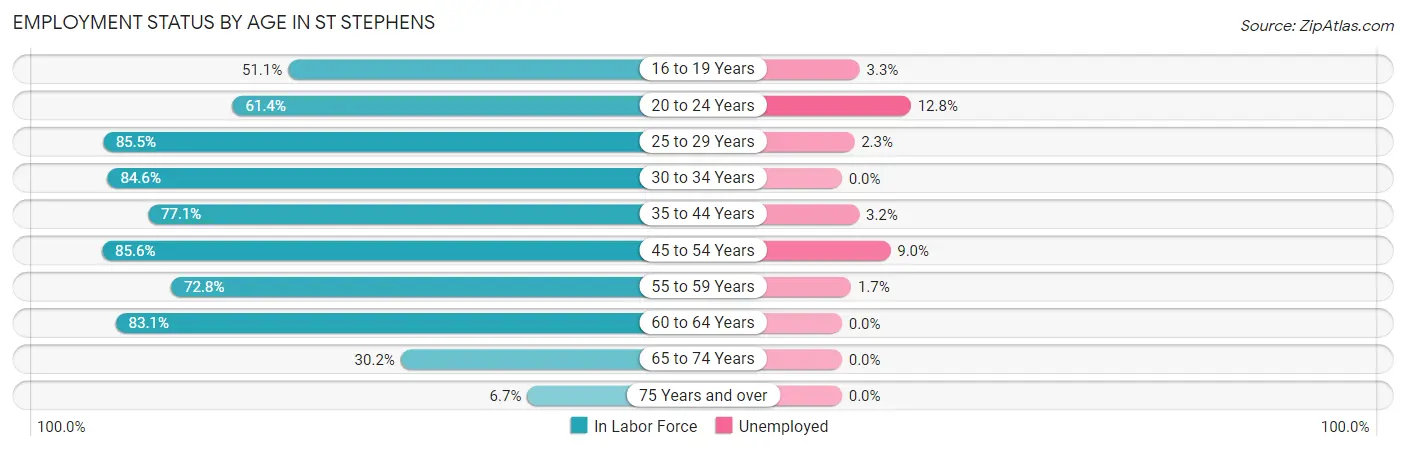
| Age Bracket | In Labor Force | Unemployed |
| 16 to 19 Years | 239 (51.1%) | 8 (3.3%) |
| 20 to 24 Years | 368 (61.4%) | 47 (12.8%) |
| 25 to 29 Years | 478 (85.5%) | 11 (2.3%) |
| 30 to 34 Years | 312 (84.6%) | 0 (0.0%) |
| 35 to 44 Years | 1,066 (77.1%) | 34 (3.2%) |
| 45 to 54 Years | 1,049 (85.6%) | 94 (9.0%) |
| 55 to 59 Years | 536 (72.8%) | 9 (1.7%) |
| 60 to 64 Years | 447 (83.1%) | 0 (0.0%) |
| 65 to 74 Years | 302 (30.2%) | 0 (0.0%) |
| 75 Years and over | 56 (6.7%) | 0 (0.0%) |
| Total | 4,856 (63.0%) | 204 (4.2%) |
Employment Status by Educational Attainment in St Stephens
According to labor force statistics for St Stephens, 80.8% of individuals (3,886) out of the total population between 25 and 64 years of age (4,810) are in the labor force, with 3.8% or 148 of them being unemployed. The group with the highest labor force participation rate are those with the educational attainment of bachelor's degree or higher, with 93.4% or 1,143 individuals in the labor force. Within the labor force, individuals with less than high school education have the highest percentage of unemployment, with 10.9% or 49 of them being unemployed.
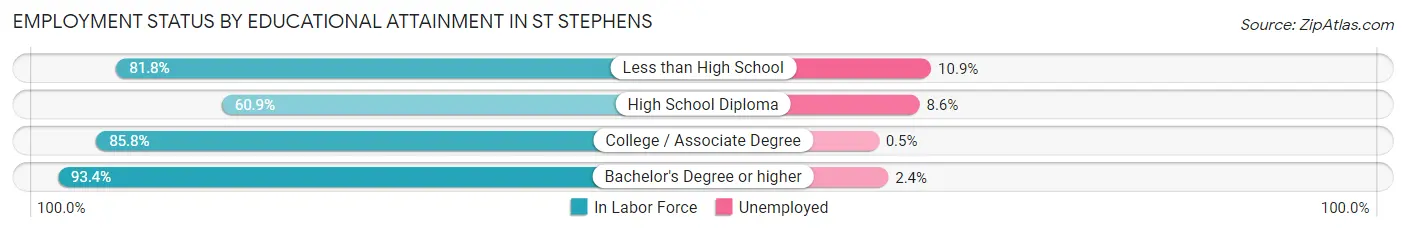
| Educational Attainment | In Labor Force | Unemployed |
| Less than High School | 448 (81.8%) | 60 (10.9%) |
| High School Diploma | 758 (60.9%) | 107 (8.6%) |
| College / Associate Degree | 1,538 (85.8%) | 9 (0.5%) |
| Bachelor's Degree or higher | 1,143 (93.4%) | 29 (2.4%) |
| Total | 3,886 (80.8%) | 183 (3.8%) |
Employment Occupations by Sex in St Stephens
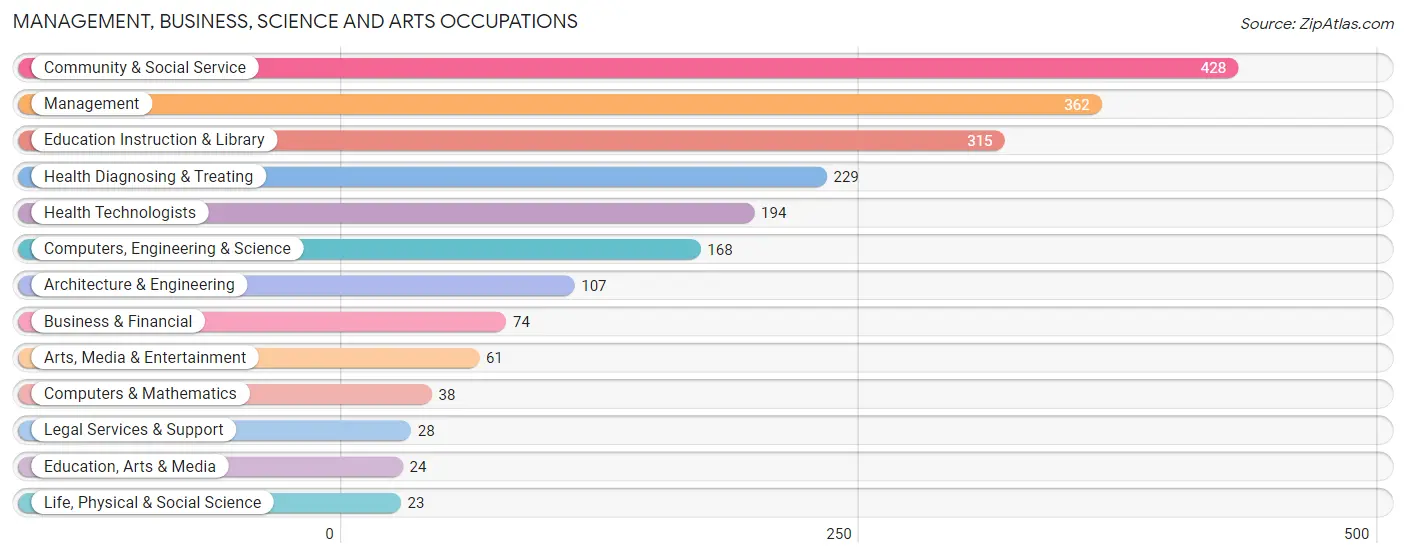
Management, Business, Science and Arts Occupations
The most common Management, Business, Science and Arts occupations in St Stephens are Community & Social Service (428 | 9.2%), Management (362 | 7.8%), Education Instruction & Library (315 | 6.8%), Health Diagnosing & Treating (229 | 4.9%), and Health Technologists (194 | 4.2%).
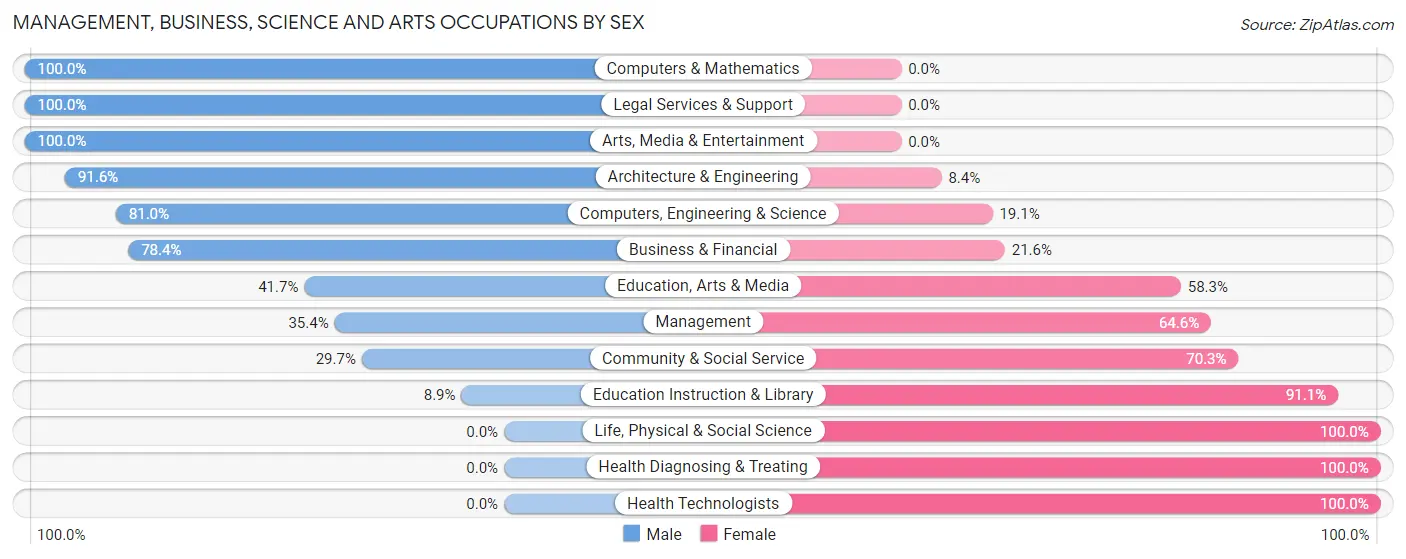
Management, Business, Science and Arts Occupations by Sex
Within the Management, Business, Science and Arts occupations in St Stephens, the most male-oriented occupations are Computers & Mathematics (100.0%), Legal Services & Support (100.0%), and Arts, Media & Entertainment (100.0%), while the most female-oriented occupations are Life, Physical & Social Science (100.0%), Health Diagnosing & Treating (100.0%), and Health Technologists (100.0%).
| Occupation | Male | Female |
| Management | 128 (35.4%) | 234 (64.6%) |
| Business & Financial | 58 (78.4%) | 16 (21.6%) |
| Computers, Engineering & Science | 136 (80.9%) | 32 (19.1%) |
| Computers & Mathematics | 38 (100.0%) | 0 (0.0%) |
| Architecture & Engineering | 98 (91.6%) | 9 (8.4%) |
| Life, Physical & Social Science | 0 (0.0%) | 23 (100.0%) |
| Community & Social Service | 127 (29.7%) | 301 (70.3%) |
| Education, Arts & Media | 10 (41.7%) | 14 (58.3%) |
| Legal Services & Support | 28 (100.0%) | 0 (0.0%) |
| Education Instruction & Library | 28 (8.9%) | 287 (91.1%) |
| Arts, Media & Entertainment | 61 (100.0%) | 0 (0.0%) |
| Health Diagnosing & Treating | 0 (0.0%) | 229 (100.0%) |
| Health Technologists | 0 (0.0%) | 194 (100.0%) |
| Total (Category) | 449 (35.6%) | 812 (64.4%) |
| Total (Overall) | 2,759 (59.3%) | 1,891 (40.7%) |
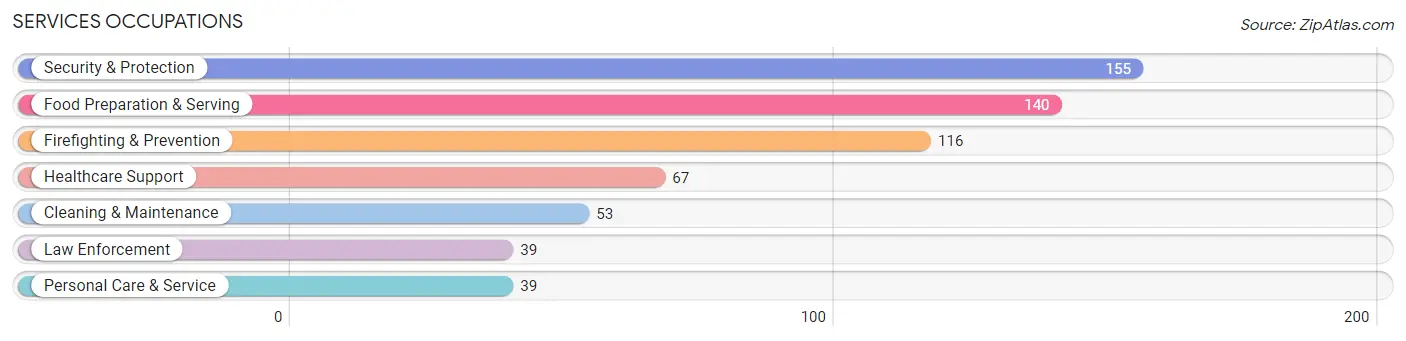
Services Occupations
The most common Services occupations in St Stephens are Security & Protection (155 | 3.3%), Food Preparation & Serving (140 | 3.0%), Firefighting & Prevention (116 | 2.5%), Healthcare Support (67 | 1.4%), and Cleaning & Maintenance (53 | 1.1%).
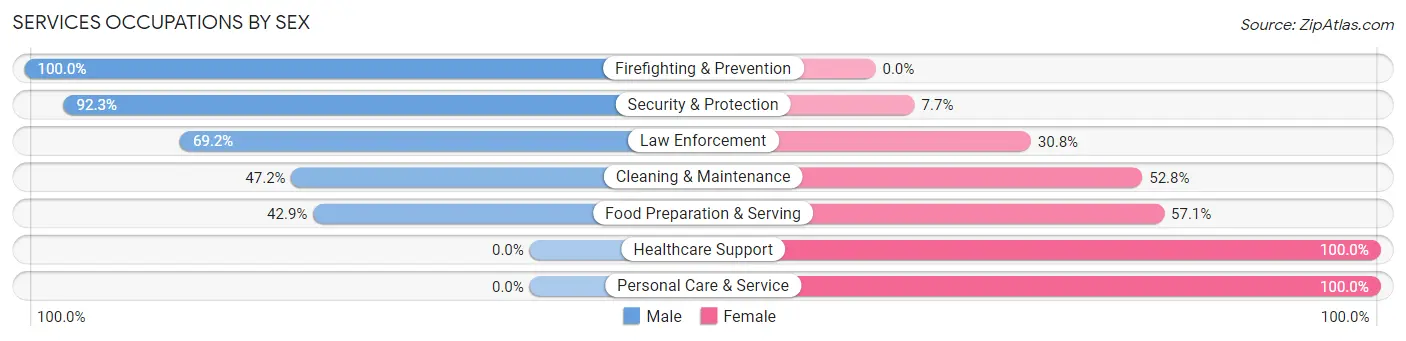
Services Occupations by Sex
Within the Services occupations in St Stephens, the most male-oriented occupations are Firefighting & Prevention (100.0%), Security & Protection (92.3%), and Law Enforcement (69.2%), while the most female-oriented occupations are Healthcare Support (100.0%), Personal Care & Service (100.0%), and Food Preparation & Serving (57.1%).
| Occupation | Male | Female |
| Healthcare Support | 0 (0.0%) | 67 (100.0%) |
| Security & Protection | 143 (92.3%) | 12 (7.7%) |
| Firefighting & Prevention | 116 (100.0%) | 0 (0.0%) |
| Law Enforcement | 27 (69.2%) | 12 (30.8%) |
| Food Preparation & Serving | 60 (42.9%) | 80 (57.1%) |
| Cleaning & Maintenance | 25 (47.2%) | 28 (52.8%) |
| Personal Care & Service | 0 (0.0%) | 39 (100.0%) |
| Total (Category) | 228 (50.2%) | 226 (49.8%) |
| Total (Overall) | 2,759 (59.3%) | 1,891 (40.7%) |
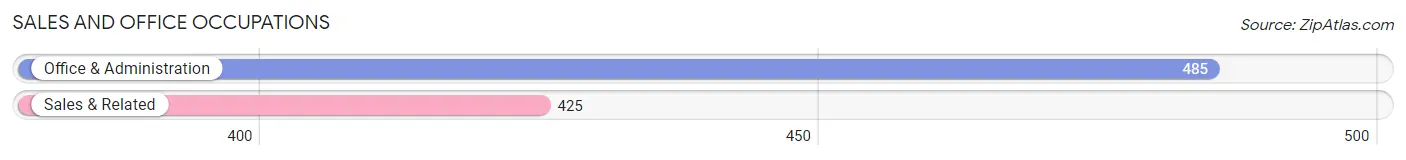
Sales and Office Occupations
The most common Sales and Office occupations in St Stephens are Office & Administration (485 | 10.4%), and Sales & Related (425 | 9.1%).
Sales and Office Occupations by Sex
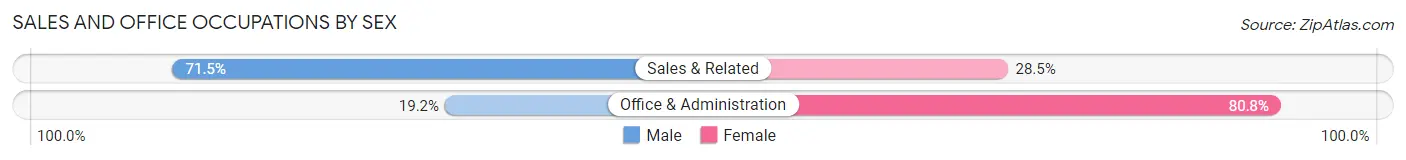
| Occupation | Male | Female |
| Sales & Related | 304 (71.5%) | 121 (28.5%) |
| Office & Administration | 93 (19.2%) | 392 (80.8%) |
| Total (Category) | 397 (43.6%) | 513 (56.4%) |
| Total (Overall) | 2,759 (59.3%) | 1,891 (40.7%) |
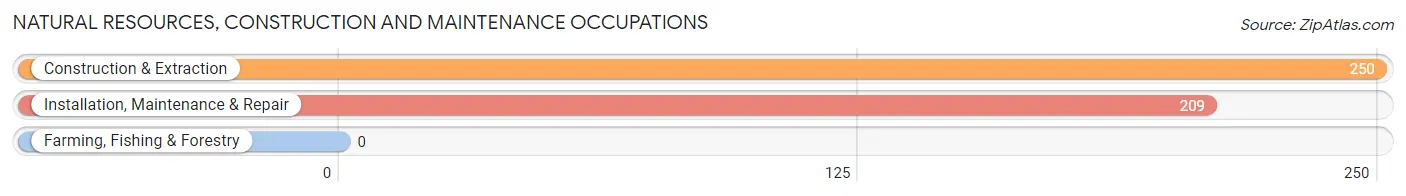
Natural Resources, Construction and Maintenance Occupations
The most common Natural Resources, Construction and Maintenance occupations in St Stephens are Construction & Extraction (250 | 5.4%), and Installation, Maintenance & Repair (209 | 4.5%).
Natural Resources, Construction and Maintenance Occupations by Sex
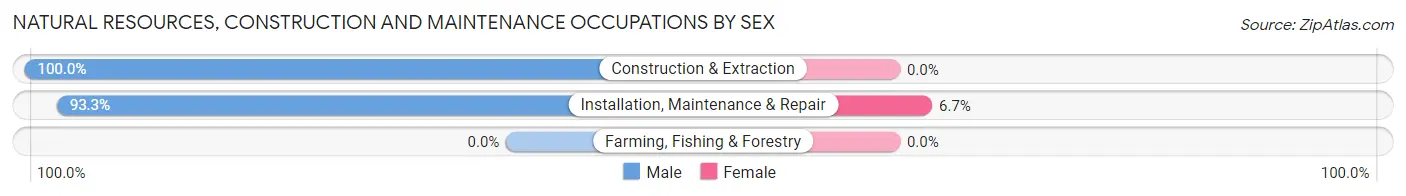
| Occupation | Male | Female |
| Farming, Fishing & Forestry | 0 (0.0%) | 0 (0.0%) |
| Construction & Extraction | 250 (100.0%) | 0 (0.0%) |
| Installation, Maintenance & Repair | 195 (93.3%) | 14 (6.7%) |
| Total (Category) | 445 (97.0%) | 14 (3.0%) |
| Total (Overall) | 2,759 (59.3%) | 1,891 (40.7%) |
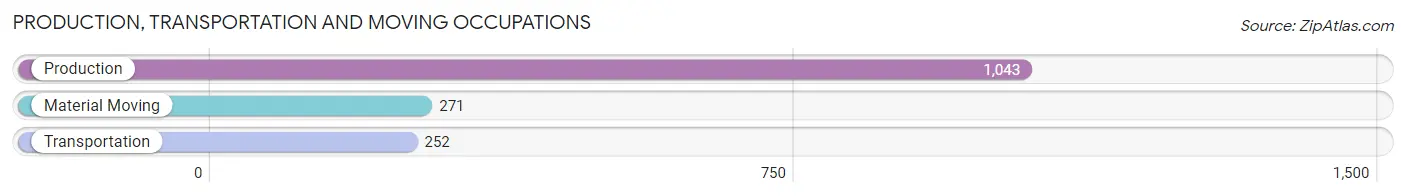
Production, Transportation and Moving Occupations
The most common Production, Transportation and Moving occupations in St Stephens are Production (1,043 | 22.4%), Material Moving (271 | 5.8%), and Transportation (252 | 5.4%).
Production, Transportation and Moving Occupations by Sex
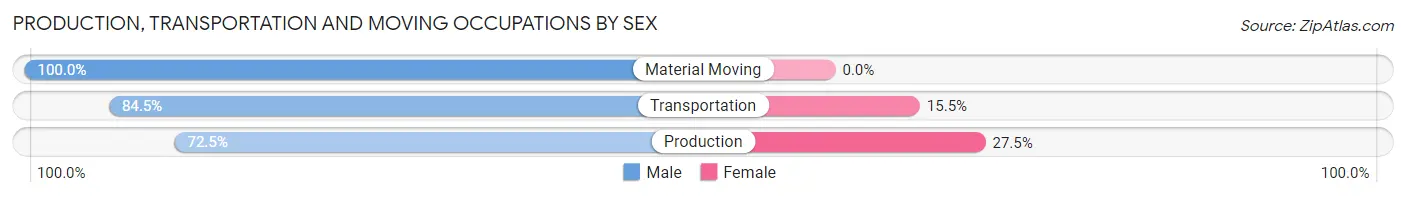
| Occupation | Male | Female |
| Production | 756 (72.5%) | 287 (27.5%) |
| Transportation | 213 (84.5%) | 39 (15.5%) |
| Material Moving | 271 (100.0%) | 0 (0.0%) |
| Total (Category) | 1,240 (79.2%) | 326 (20.8%) |
| Total (Overall) | 2,759 (59.3%) | 1,891 (40.7%) |
Employment Industries by Sex in St Stephens
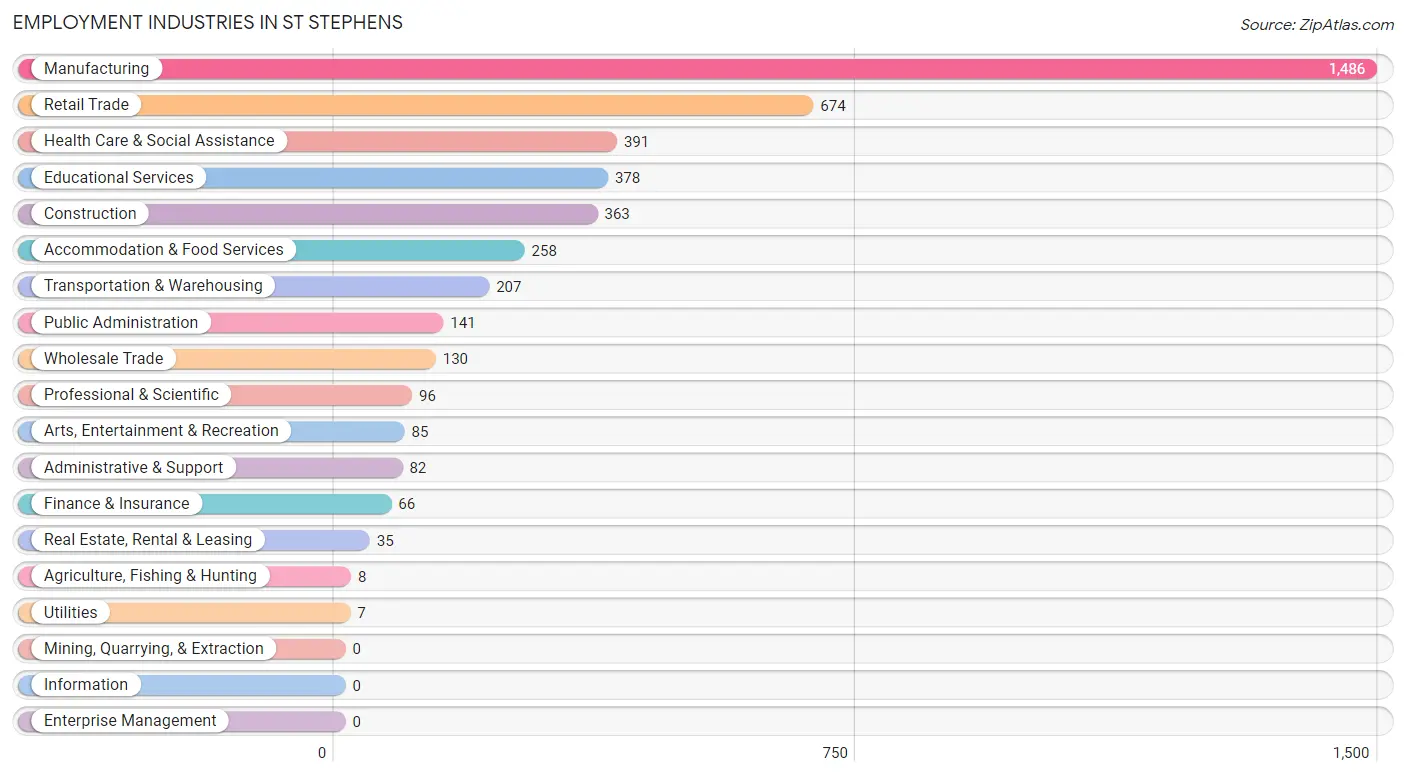
Employment Industries in St Stephens
The major employment industries in St Stephens include Manufacturing (1,486 | 32.0%), Retail Trade (674 | 14.5%), Health Care & Social Assistance (391 | 8.4%), Educational Services (378 | 8.1%), and Construction (363 | 7.8%).
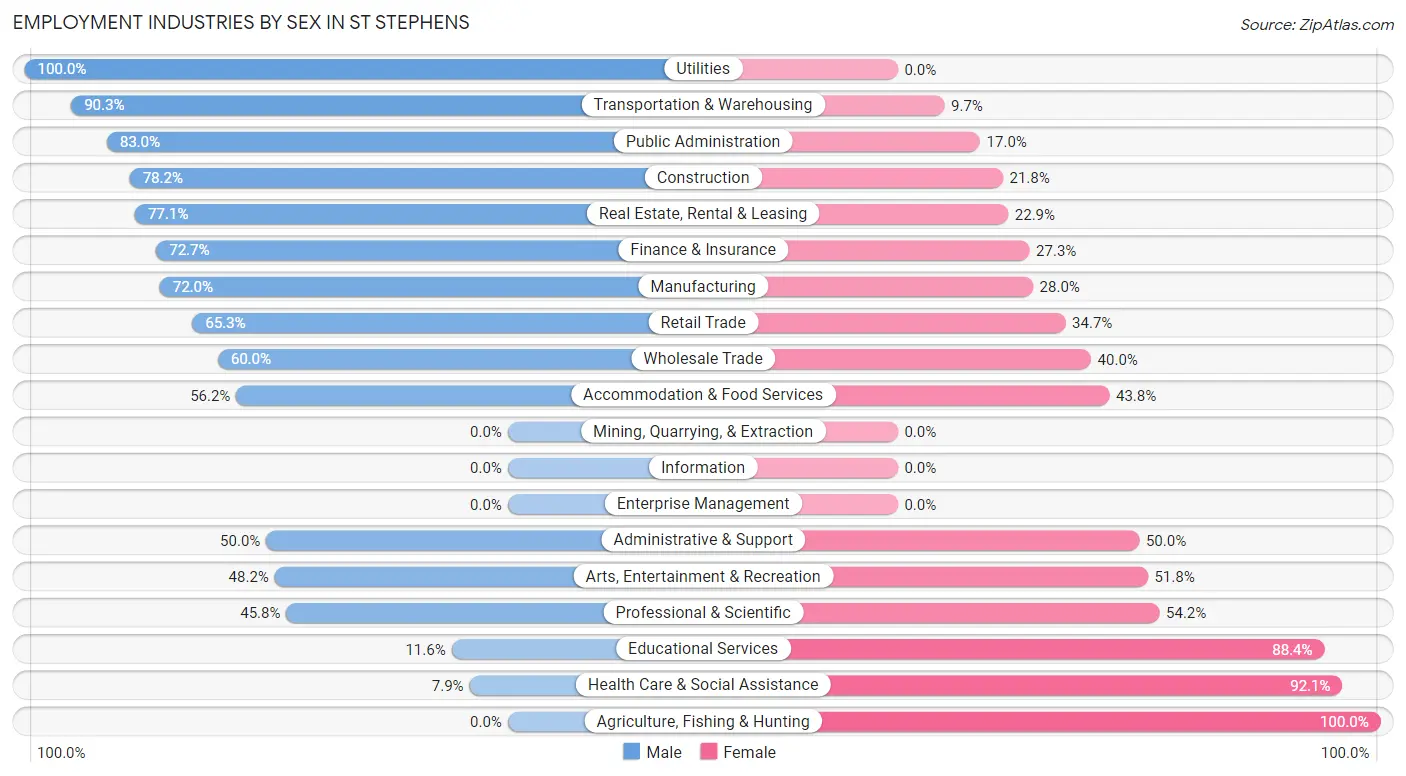
Employment Industries by Sex in St Stephens
The St Stephens industries that see more men than women are Utilities (100.0%), Transportation & Warehousing (90.3%), and Public Administration (83.0%), whereas the industries that tend to have a higher number of women are Agriculture, Fishing & Hunting (100.0%), Health Care & Social Assistance (92.1%), and Educational Services (88.4%).
| Industry | Male | Female |
| Agriculture, Fishing & Hunting | 0 (0.0%) | 8 (100.0%) |
| Mining, Quarrying, & Extraction | 0 (0.0%) | 0 (0.0%) |
| Construction | 284 (78.2%) | 79 (21.8%) |
| Manufacturing | 1,070 (72.0%) | 416 (28.0%) |
| Wholesale Trade | 78 (60.0%) | 52 (40.0%) |
| Retail Trade | 440 (65.3%) | 234 (34.7%) |
| Transportation & Warehousing | 187 (90.3%) | 20 (9.7%) |
| Utilities | 7 (100.0%) | 0 (0.0%) |
| Information | 0 (0.0%) | 0 (0.0%) |
| Finance & Insurance | 48 (72.7%) | 18 (27.3%) |
| Real Estate, Rental & Leasing | 27 (77.1%) | 8 (22.9%) |
| Professional & Scientific | 44 (45.8%) | 52 (54.2%) |
| Enterprise Management | 0 (0.0%) | 0 (0.0%) |
| Administrative & Support | 41 (50.0%) | 41 (50.0%) |
| Educational Services | 44 (11.6%) | 334 (88.4%) |
| Health Care & Social Assistance | 31 (7.9%) | 360 (92.1%) |
| Arts, Entertainment & Recreation | 41 (48.2%) | 44 (51.8%) |
| Accommodation & Food Services | 145 (56.2%) | 113 (43.8%) |
| Public Administration | 117 (83.0%) | 24 (17.0%) |
| Total | 2,759 (59.3%) | 1,891 (40.7%) |
Education in St Stephens
School Enrollment in St Stephens
The most common levels of schooling among the 2,076 students in St Stephens are middle school (504 | 24.3%), high school (480 | 23.1%), and college / undergraduate (415 | 20.0%).
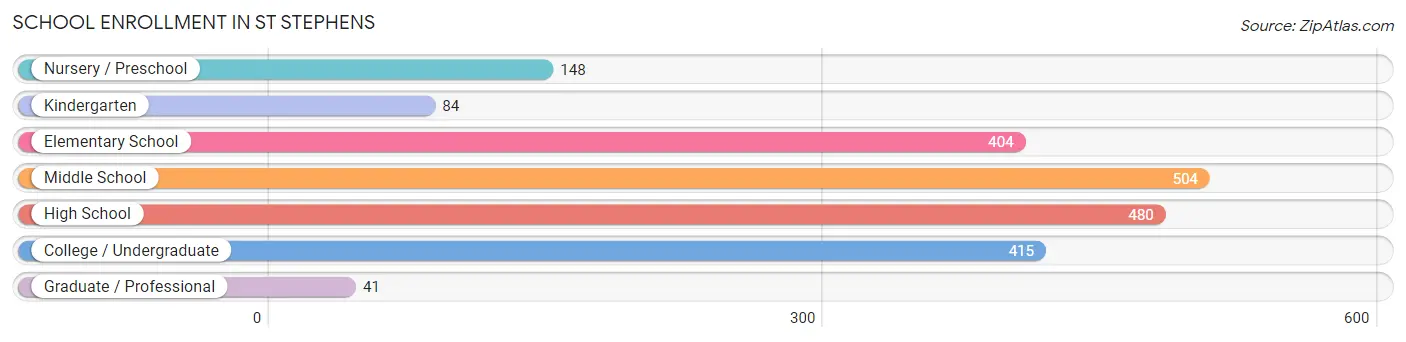
| School Level | # Students | % Students |
| Nursery / Preschool | 148 | 7.1% |
| Kindergarten | 84 | 4.1% |
| Elementary School | 404 | 19.5% |
| Middle School | 504 | 24.3% |
| High School | 480 | 23.1% |
| College / Undergraduate | 415 | 20.0% |
| Graduate / Professional | 41 | 2.0% |
| Total | 2,076 | 100.0% |
School Enrollment by Age by Funding Source in St Stephens
Out of a total of 2,076 students who are enrolled in schools in St Stephens, 309 (14.9%) attend a private institution, while the remaining 1,767 (85.1%) are enrolled in public schools. The age group of 3 to 4 year olds has the highest likelihood of being enrolled in private schools, with 110 (100.0% in the age bracket) enrolled. Conversely, the age group of 15 to 17 year olds has the lowest likelihood of being enrolled in a private school, with 292 (100.0% in the age bracket) attending a public institution.
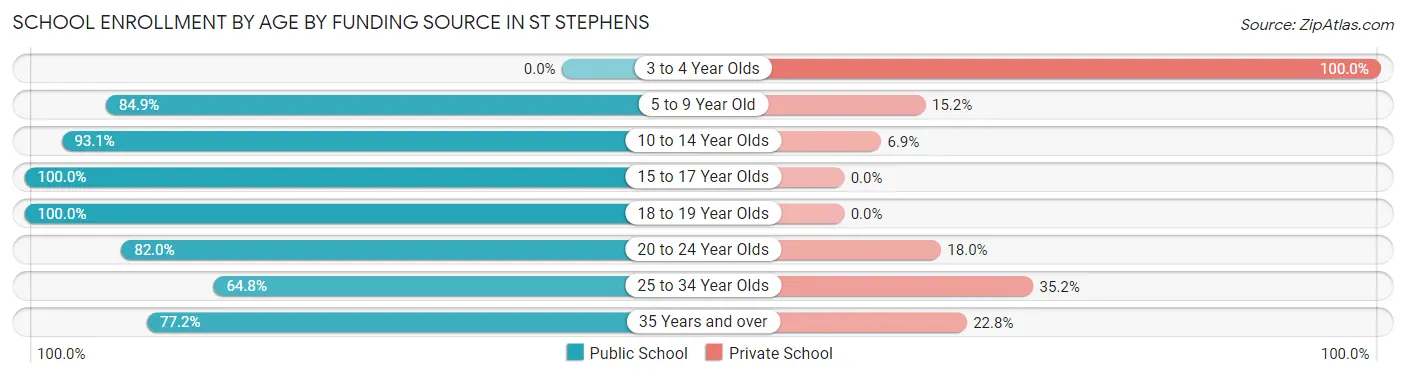
| Age Bracket | Public School | Private School |
| 3 to 4 Year Olds | 0 (0.0%) | 110 (100.0%) |
| 5 to 9 Year Old | 392 (84.9%) | 70 (15.1%) |
| 10 to 14 Year Olds | 691 (93.1%) | 51 (6.9%) |
| 15 to 17 Year Olds | 292 (100.0%) | 0 (0.0%) |
| 18 to 19 Year Olds | 159 (100.0%) | 0 (0.0%) |
| 20 to 24 Year Olds | 91 (82.0%) | 20 (18.0%) |
| 25 to 34 Year Olds | 70 (64.8%) | 38 (35.2%) |
| 35 Years and over | 71 (77.2%) | 21 (22.8%) |
| Total | 1,767 (85.1%) | 309 (14.9%) |
Educational Attainment by Field of Study in St Stephens
Science & technology (344 | 19.6%), education (319 | 18.2%), arts & humanities (262 | 14.9%), business (200 | 11.4%), and psychology (194 | 11.1%) are the most common fields of study among 1,753 individuals in St Stephens who have obtained a bachelor's degree or higher.
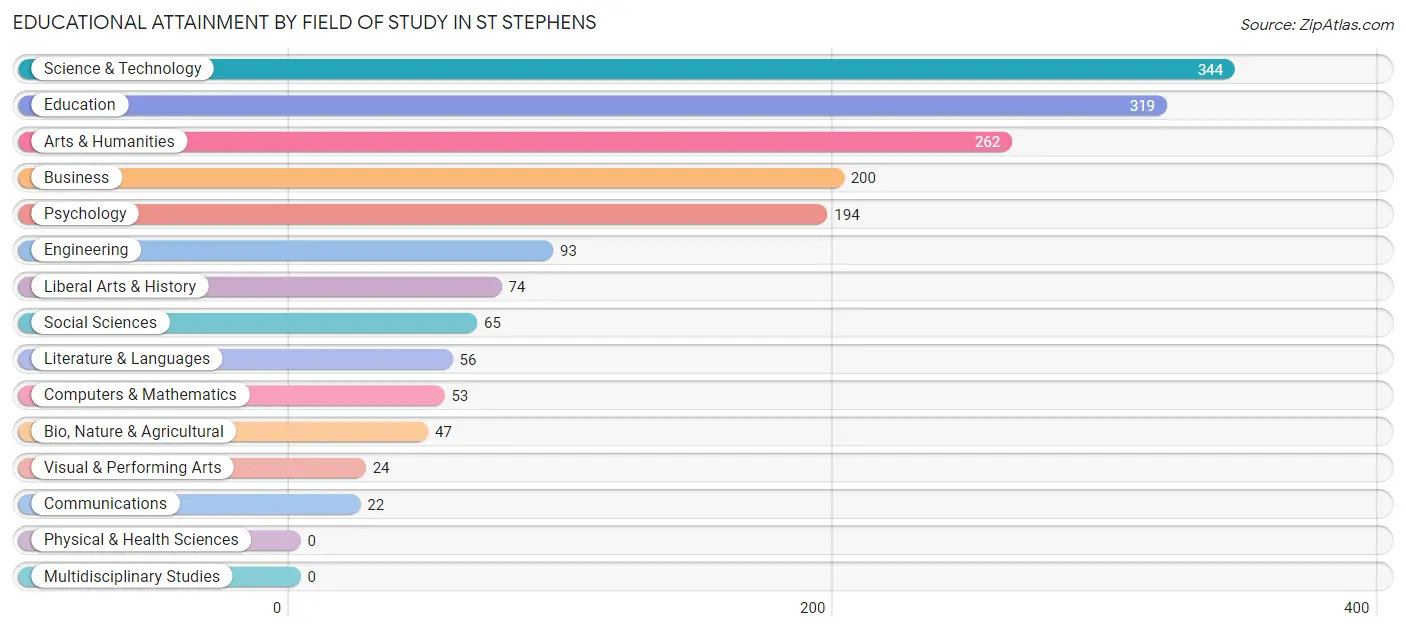
| Field of Study | # Graduates | % Graduates |
| Computers & Mathematics | 53 | 3.0% |
| Bio, Nature & Agricultural | 47 | 2.7% |
| Physical & Health Sciences | 0 | 0.0% |
| Psychology | 194 | 11.1% |
| Social Sciences | 65 | 3.7% |
| Engineering | 93 | 5.3% |
| Multidisciplinary Studies | 0 | 0.0% |
| Science & Technology | 344 | 19.6% |
| Business | 200 | 11.4% |
| Education | 319 | 18.2% |
| Literature & Languages | 56 | 3.2% |
| Liberal Arts & History | 74 | 4.2% |
| Visual & Performing Arts | 24 | 1.4% |
| Communications | 22 | 1.3% |
| Arts & Humanities | 262 | 14.9% |
| Total | 1,753 | 100.0% |
Transportation & Commute in St Stephens
Vehicle Availability by Sex in St Stephens
The most prevalent vehicle ownership categories in St Stephens are males with 3 vehicles (968, accounting for 36.6%) and females with 3 vehicles (705, making up 52.2%).
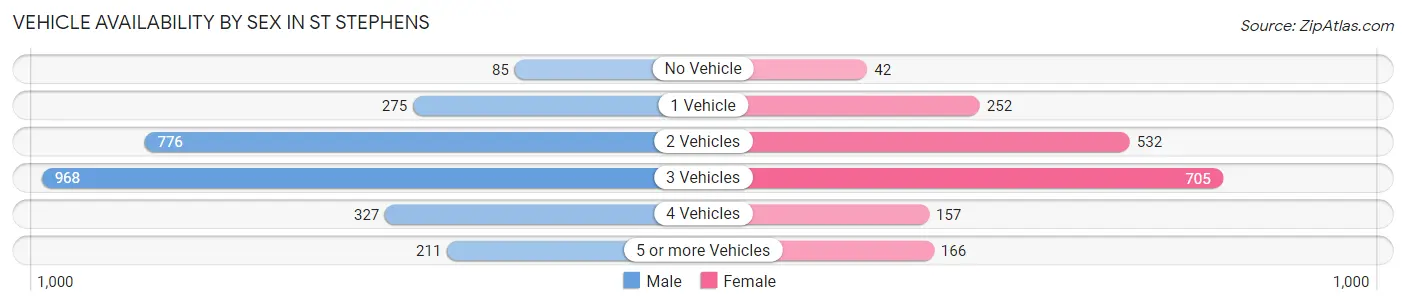
| Vehicles Available | Male | Female |
| No Vehicle | 85 (3.2%) | 42 (2.3%) |
| 1 Vehicle | 275 (10.4%) | 252 (13.6%) |
| 2 Vehicles | 776 (29.4%) | 532 (28.7%) |
| 3 Vehicles | 968 (36.6%) | 705 (38.0%) |
| 4 Vehicles | 327 (12.4%) | 157 (8.5%) |
| 5 or more Vehicles | 211 (8.0%) | 166 (8.9%) |
| Total | 2,642 (100.0%) | 1,854 (100.0%) |
Commute Time in St Stephens
The most frequently occuring commute durations in St Stephens are 15 to 19 minutes (1,236 commuters, 28.4%), 10 to 14 minutes (884 commuters, 20.3%), and 20 to 24 minutes (727 commuters, 16.7%).
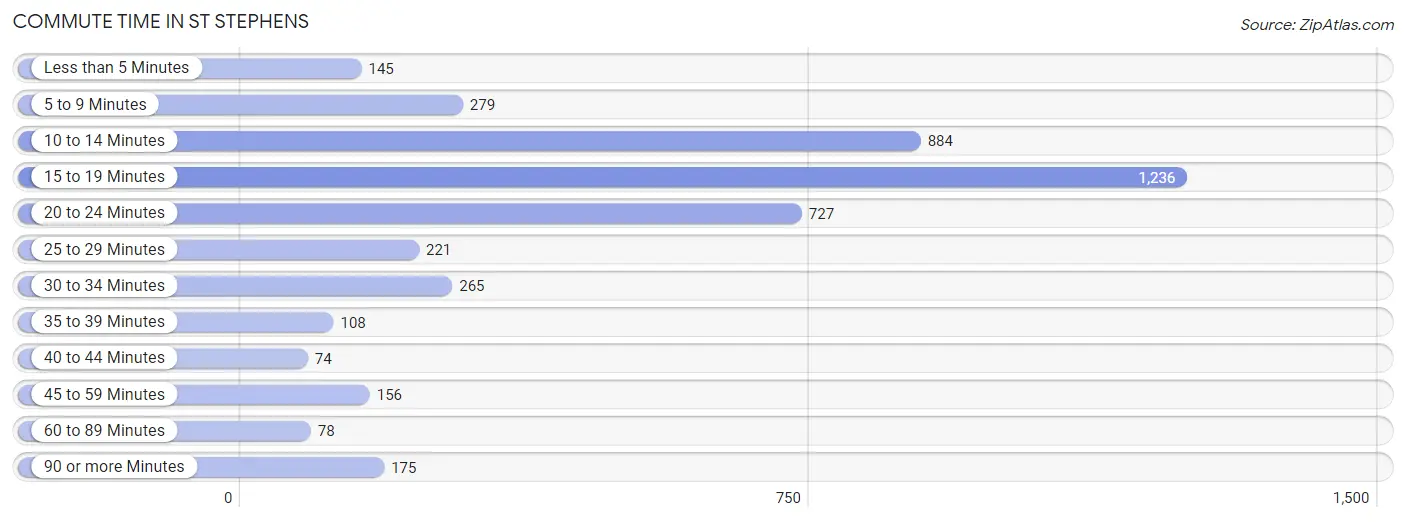
| Commute Time | # Commuters | % Commuters |
| Less than 5 Minutes | 145 | 3.3% |
| 5 to 9 Minutes | 279 | 6.4% |
| 10 to 14 Minutes | 884 | 20.3% |
| 15 to 19 Minutes | 1,236 | 28.4% |
| 20 to 24 Minutes | 727 | 16.7% |
| 25 to 29 Minutes | 221 | 5.1% |
| 30 to 34 Minutes | 265 | 6.1% |
| 35 to 39 Minutes | 108 | 2.5% |
| 40 to 44 Minutes | 74 | 1.7% |
| 45 to 59 Minutes | 156 | 3.6% |
| 60 to 89 Minutes | 78 | 1.8% |
| 90 or more Minutes | 175 | 4.0% |
Commute Time by Sex in St Stephens
The most common commute times in St Stephens are 15 to 19 minutes (545 commuters, 21.6%) for males and 15 to 19 minutes (691 commuters, 38.0%) for females.
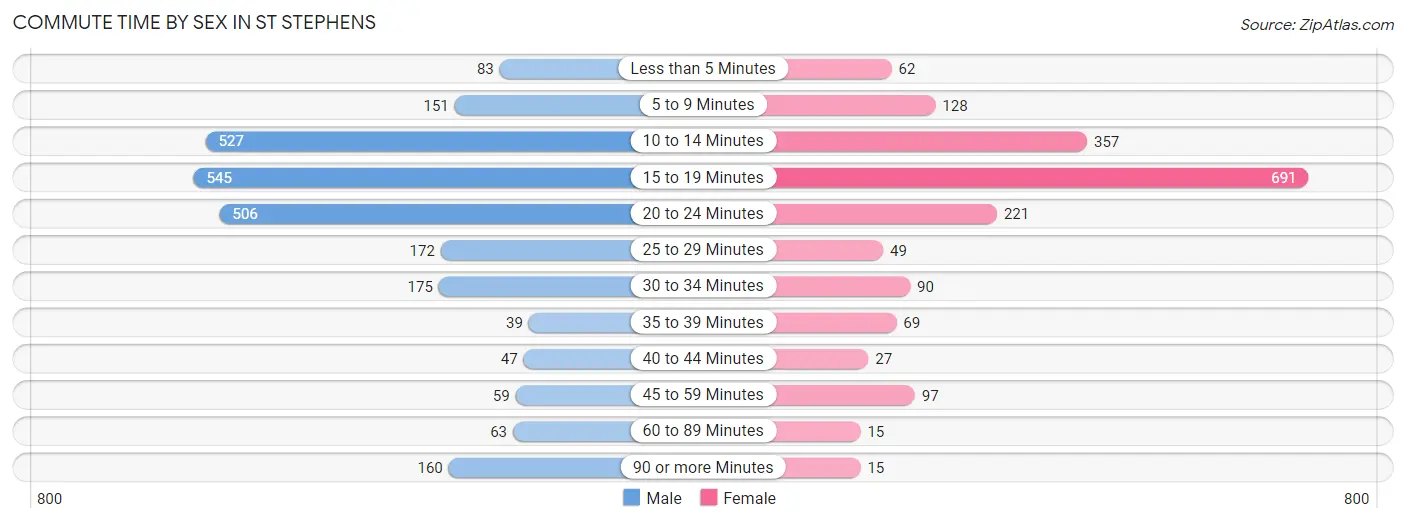
| Commute Time | Male | Female |
| Less than 5 Minutes | 83 (3.3%) | 62 (3.4%) |
| 5 to 9 Minutes | 151 (6.0%) | 128 (7.0%) |
| 10 to 14 Minutes | 527 (20.8%) | 357 (19.6%) |
| 15 to 19 Minutes | 545 (21.6%) | 691 (38.0%) |
| 20 to 24 Minutes | 506 (20.0%) | 221 (12.1%) |
| 25 to 29 Minutes | 172 (6.8%) | 49 (2.7%) |
| 30 to 34 Minutes | 175 (6.9%) | 90 (4.9%) |
| 35 to 39 Minutes | 39 (1.5%) | 69 (3.8%) |
| 40 to 44 Minutes | 47 (1.9%) | 27 (1.5%) |
| 45 to 59 Minutes | 59 (2.3%) | 97 (5.3%) |
| 60 to 89 Minutes | 63 (2.5%) | 15 (0.8%) |
| 90 or more Minutes | 160 (6.3%) | 15 (0.8%) |
Time of Departure to Work by Sex in St Stephens
The most frequent times of departure to work in St Stephens are 6:00 AM to 6:29 AM (462, 18.3%) for males and 7:30 AM to 7:59 AM (374, 20.5%) for females.
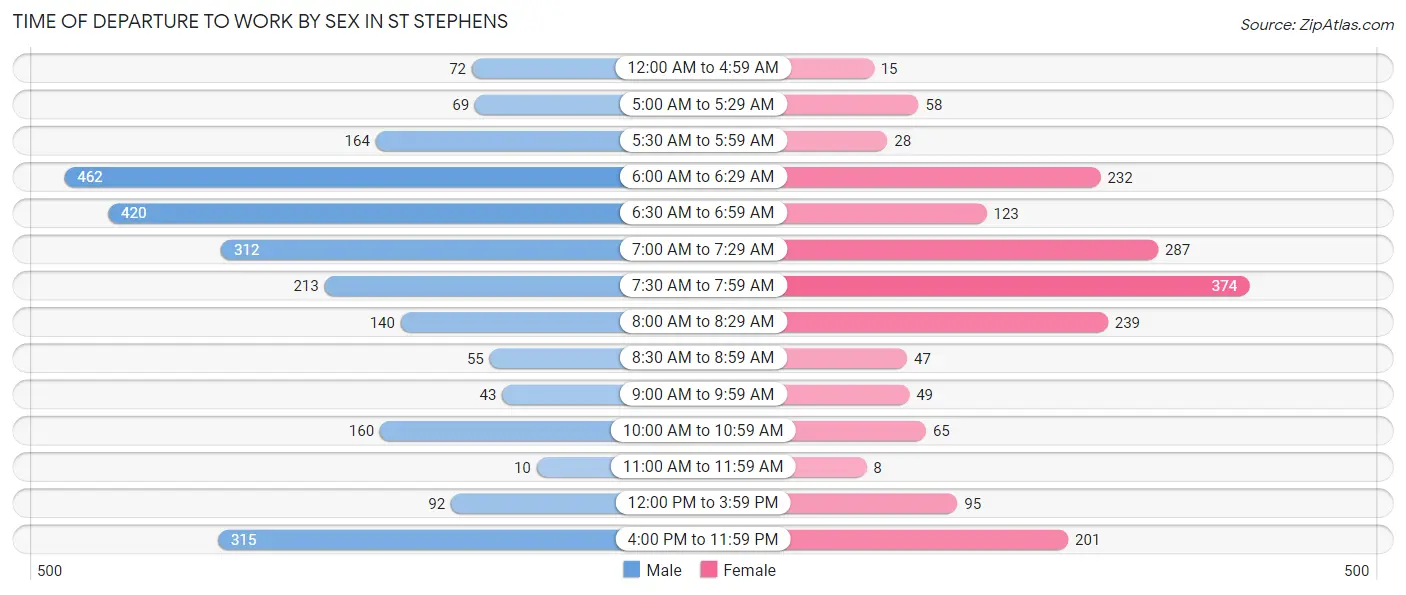
| Time of Departure | Male | Female |
| 12:00 AM to 4:59 AM | 72 (2.9%) | 15 (0.8%) |
| 5:00 AM to 5:29 AM | 69 (2.7%) | 58 (3.2%) |
| 5:30 AM to 5:59 AM | 164 (6.5%) | 28 (1.5%) |
| 6:00 AM to 6:29 AM | 462 (18.3%) | 232 (12.7%) |
| 6:30 AM to 6:59 AM | 420 (16.6%) | 123 (6.8%) |
| 7:00 AM to 7:29 AM | 312 (12.3%) | 287 (15.8%) |
| 7:30 AM to 7:59 AM | 213 (8.4%) | 374 (20.5%) |
| 8:00 AM to 8:29 AM | 140 (5.5%) | 239 (13.1%) |
| 8:30 AM to 8:59 AM | 55 (2.2%) | 47 (2.6%) |
| 9:00 AM to 9:59 AM | 43 (1.7%) | 49 (2.7%) |
| 10:00 AM to 10:59 AM | 160 (6.3%) | 65 (3.6%) |
| 11:00 AM to 11:59 AM | 10 (0.4%) | 8 (0.4%) |
| 12:00 PM to 3:59 PM | 92 (3.6%) | 95 (5.2%) |
| 4:00 PM to 11:59 PM | 315 (12.5%) | 201 (11.0%) |
| Total | 2,527 (100.0%) | 1,821 (100.0%) |
Housing Occupancy in St Stephens
Occupancy by Ownership in St Stephens
Of the total 3,893 dwellings in St Stephens, owner-occupied units account for 3,063 (78.7%), while renter-occupied units make up 830 (21.3%).
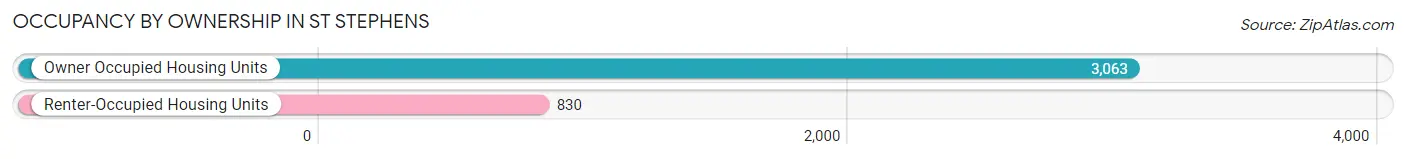
| Occupancy | # Housing Units | % Housing Units |
| Owner Occupied Housing Units | 3,063 | 78.7% |
| Renter-Occupied Housing Units | 830 | 21.3% |
| Total Occupied Housing Units | 3,893 | 100.0% |
Occupancy by Household Size in St Stephens
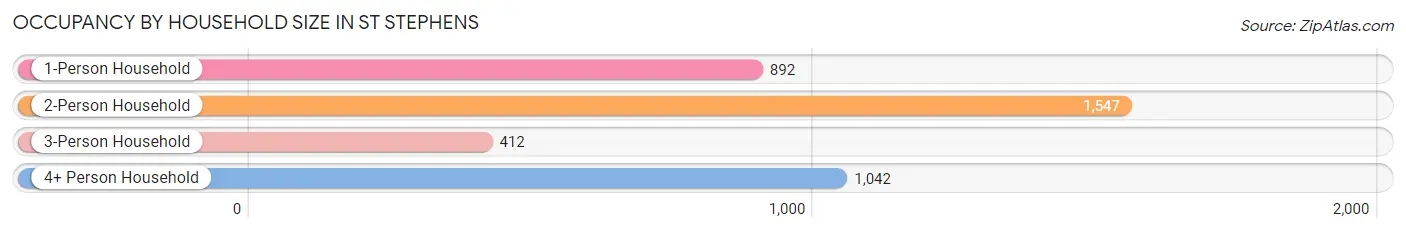
| Household Size | # Housing Units | % Housing Units |
| 1-Person Household | 892 | 22.9% |
| 2-Person Household | 1,547 | 39.7% |
| 3-Person Household | 412 | 10.6% |
| 4+ Person Household | 1,042 | 26.8% |
| Total Housing Units | 3,893 | 100.0% |
Occupancy by Ownership by Household Size in St Stephens
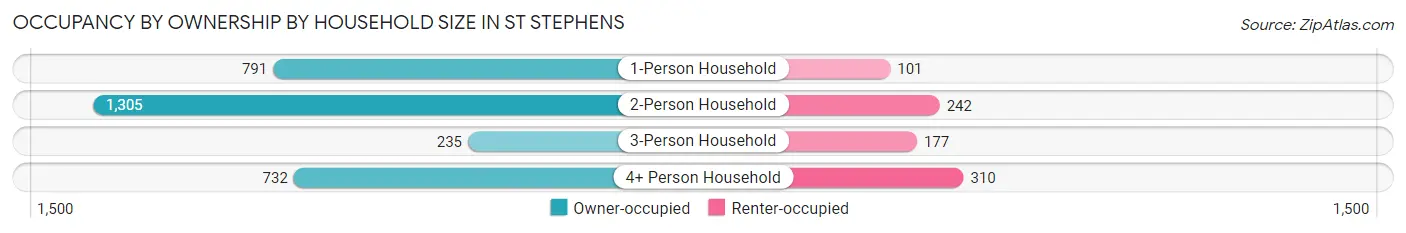
| Household Size | Owner-occupied | Renter-occupied |
| 1-Person Household | 791 (88.7%) | 101 (11.3%) |
| 2-Person Household | 1,305 (84.4%) | 242 (15.6%) |
| 3-Person Household | 235 (57.0%) | 177 (43.0%) |
| 4+ Person Household | 732 (70.3%) | 310 (29.7%) |
| Total Housing Units | 3,063 (78.7%) | 830 (21.3%) |
Occupancy by Educational Attainment in St Stephens
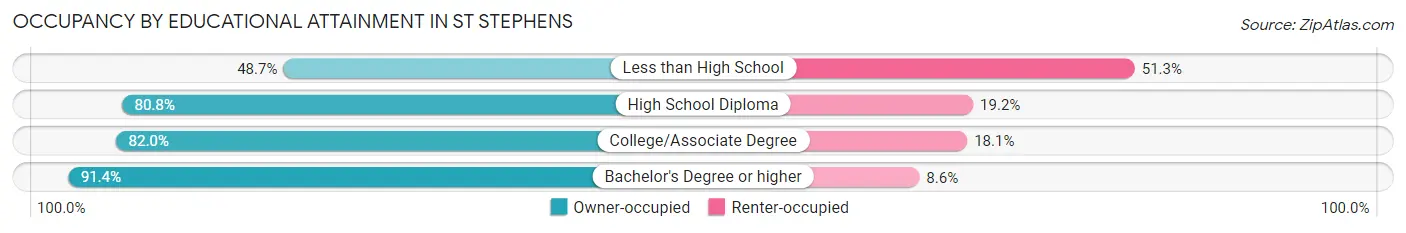
| Household Size | Owner-occupied | Renter-occupied |
| Less than High School | 304 (48.7%) | 320 (51.3%) |
| High School Diploma | 798 (80.8%) | 190 (19.2%) |
| College/Associate Degree | 1,076 (82.0%) | 237 (18.0%) |
| Bachelor's Degree or higher | 885 (91.4%) | 83 (8.6%) |
Occupancy by Age of Householder in St Stephens
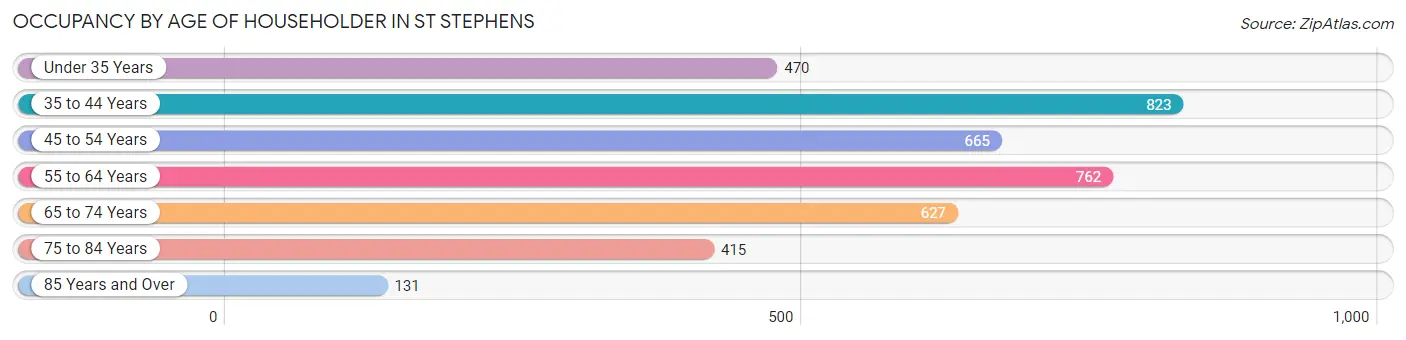
| Age Bracket | # Households | % Households |
| Under 35 Years | 470 | 12.1% |
| 35 to 44 Years | 823 | 21.1% |
| 45 to 54 Years | 665 | 17.1% |
| 55 to 64 Years | 762 | 19.6% |
| 65 to 74 Years | 627 | 16.1% |
| 75 to 84 Years | 415 | 10.7% |
| 85 Years and Over | 131 | 3.4% |
| Total | 3,893 | 100.0% |
Housing Finances in St Stephens
Median Income by Occupancy in St Stephens
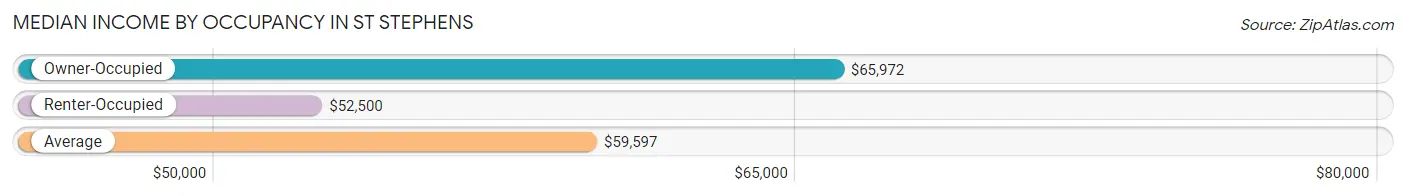
| Occupancy Type | # Households | Median Income |
| Owner-Occupied | 3,063 (78.7%) | $65,972 |
| Renter-Occupied | 830 (21.3%) | $52,500 |
| Average | 3,893 (100.0%) | $59,597 |
Occupancy by Householder Income Bracket in St Stephens
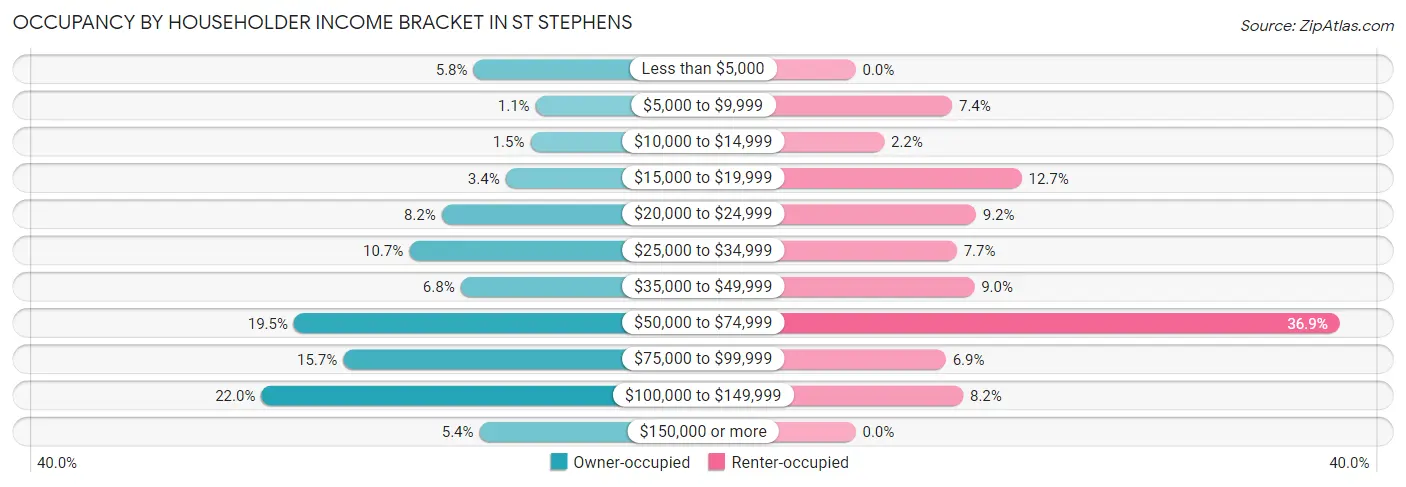
| Income Bracket | Owner-occupied | Renter-occupied |
| Less than $5,000 | 178 (5.8%) | 0 (0.0%) |
| $5,000 to $9,999 | 33 (1.1%) | 61 (7.3%) |
| $10,000 to $14,999 | 45 (1.5%) | 18 (2.2%) |
| $15,000 to $19,999 | 103 (3.4%) | 105 (12.7%) |
| $20,000 to $24,999 | 252 (8.2%) | 76 (9.2%) |
| $25,000 to $34,999 | 328 (10.7%) | 64 (7.7%) |
| $35,000 to $49,999 | 208 (6.8%) | 75 (9.0%) |
| $50,000 to $74,999 | 597 (19.5%) | 306 (36.9%) |
| $75,000 to $99,999 | 482 (15.7%) | 57 (6.9%) |
| $100,000 to $149,999 | 673 (22.0%) | 68 (8.2%) |
| $150,000 or more | 164 (5.3%) | 0 (0.0%) |
| Total | 3,063 (100.0%) | 830 (100.0%) |
Monthly Housing Cost Tiers in St Stephens
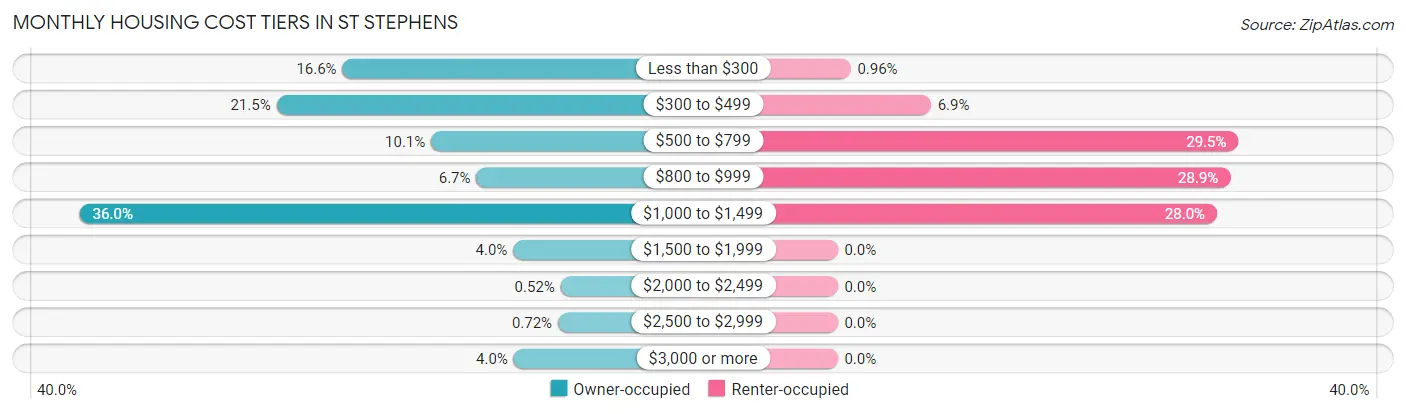
| Monthly Cost | Owner-occupied | Renter-occupied |
| Less than $300 | 508 (16.6%) | 8 (1.0%) |
| $300 to $499 | 657 (21.4%) | 57 (6.9%) |
| $500 to $799 | 308 (10.1%) | 245 (29.5%) |
| $800 to $999 | 206 (6.7%) | 240 (28.9%) |
| $1,000 to $1,499 | 1,101 (35.9%) | 232 (28.0%) |
| $1,500 to $1,999 | 123 (4.0%) | 0 (0.0%) |
| $2,000 to $2,499 | 16 (0.5%) | 0 (0.0%) |
| $2,500 to $2,999 | 22 (0.7%) | 0 (0.0%) |
| $3,000 or more | 122 (4.0%) | 0 (0.0%) |
| Total | 3,063 (100.0%) | 830 (100.0%) |
Physical Housing Characteristics in St Stephens
Housing Structures in St Stephens
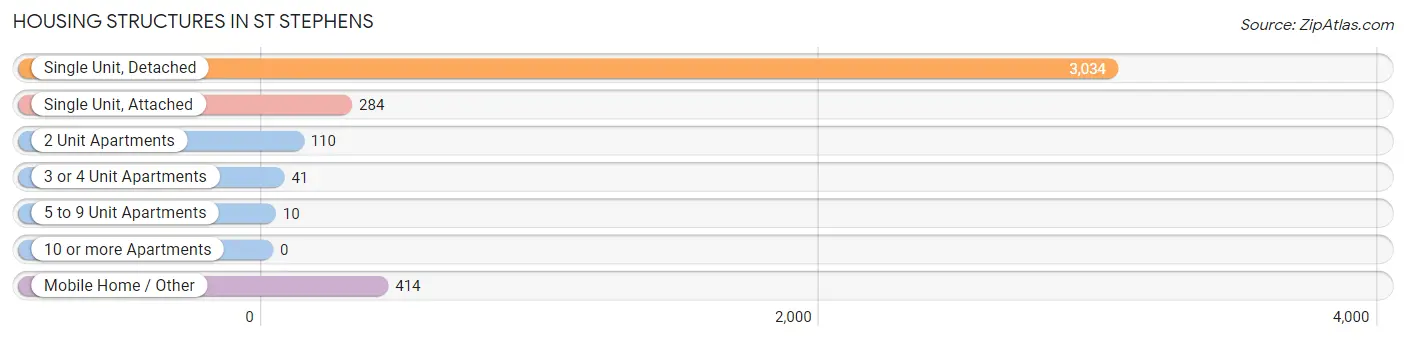
| Structure Type | # Housing Units | % Housing Units |
| Single Unit, Detached | 3,034 | 77.9% |
| Single Unit, Attached | 284 | 7.3% |
| 2 Unit Apartments | 110 | 2.8% |
| 3 or 4 Unit Apartments | 41 | 1.1% |
| 5 to 9 Unit Apartments | 10 | 0.3% |
| 10 or more Apartments | 0 | 0.0% |
| Mobile Home / Other | 414 | 10.6% |
| Total | 3,893 | 100.0% |
Housing Structures by Occupancy in St Stephens
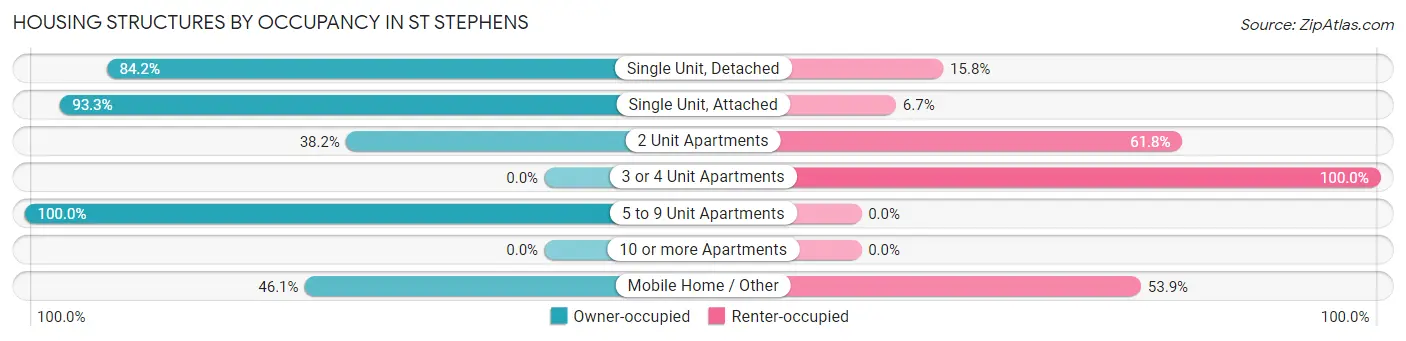
| Structure Type | Owner-occupied | Renter-occupied |
| Single Unit, Detached | 2,555 (84.2%) | 479 (15.8%) |
| Single Unit, Attached | 265 (93.3%) | 19 (6.7%) |
| 2 Unit Apartments | 42 (38.2%) | 68 (61.8%) |
| 3 or 4 Unit Apartments | 0 (0.0%) | 41 (100.0%) |
| 5 to 9 Unit Apartments | 10 (100.0%) | 0 (0.0%) |
| 10 or more Apartments | 0 (0.0%) | 0 (0.0%) |
| Mobile Home / Other | 191 (46.1%) | 223 (53.9%) |
| Total | 3,063 (78.7%) | 830 (21.3%) |
Housing Structures by Number of Rooms in St Stephens
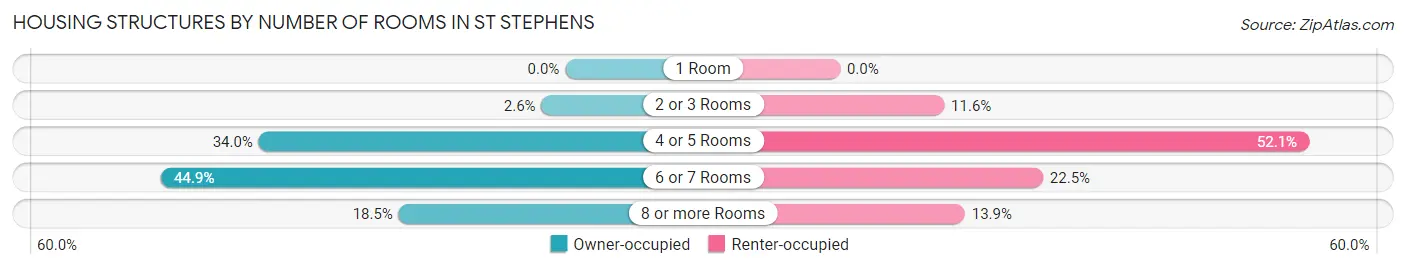
| Number of Rooms | Owner-occupied | Renter-occupied |
| 1 Room | 0 (0.0%) | 0 (0.0%) |
| 2 or 3 Rooms | 81 (2.6%) | 96 (11.6%) |
| 4 or 5 Rooms | 1,042 (34.0%) | 432 (52.0%) |
| 6 or 7 Rooms | 1,374 (44.9%) | 187 (22.5%) |
| 8 or more Rooms | 566 (18.5%) | 115 (13.9%) |
| Total | 3,063 (100.0%) | 830 (100.0%) |
Housing Structure by Heating Type in St Stephens
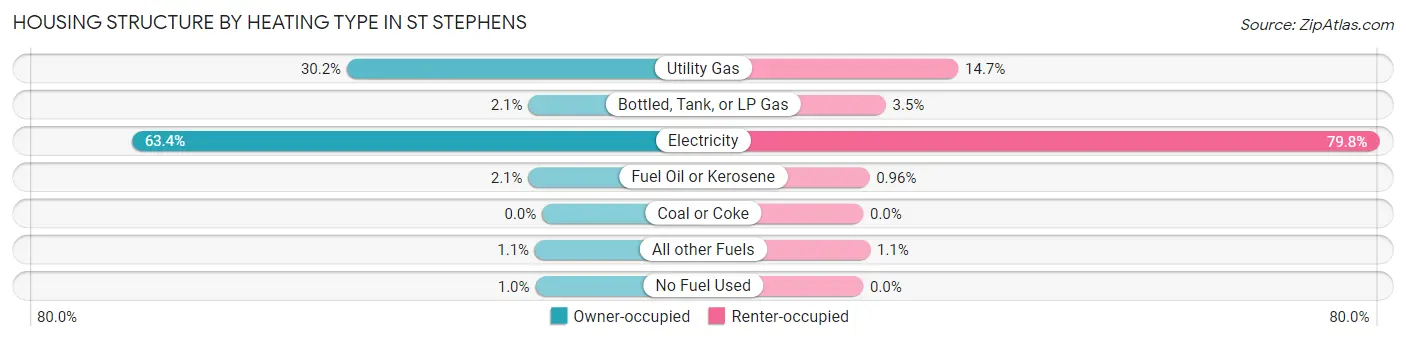
| Heating Type | Owner-occupied | Renter-occupied |
| Utility Gas | 924 (30.2%) | 122 (14.7%) |
| Bottled, Tank, or LP Gas | 65 (2.1%) | 29 (3.5%) |
| Electricity | 1,943 (63.4%) | 662 (79.8%) |
| Fuel Oil or Kerosene | 65 (2.1%) | 8 (1.0%) |
| Coal or Coke | 0 (0.0%) | 0 (0.0%) |
| All other Fuels | 34 (1.1%) | 9 (1.1%) |
| No Fuel Used | 32 (1.0%) | 0 (0.0%) |
| Total | 3,063 (100.0%) | 830 (100.0%) |
Household Vehicle Usage in St Stephens
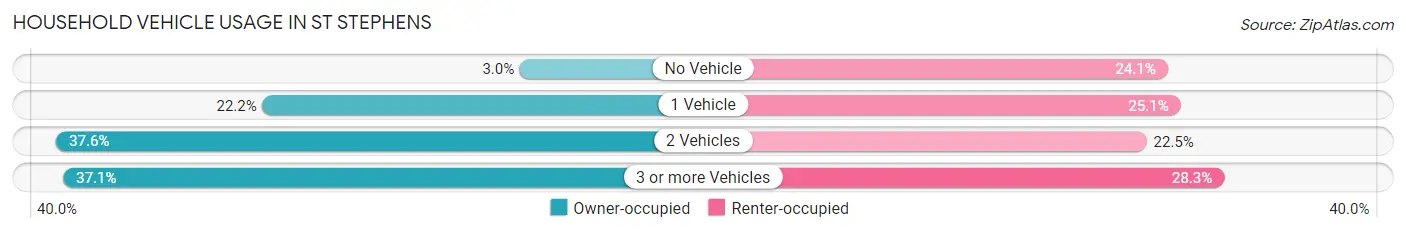
| Vehicles per Household | Owner-occupied | Renter-occupied |
| No Vehicle | 92 (3.0%) | 200 (24.1%) |
| 1 Vehicle | 681 (22.2%) | 208 (25.1%) |
| 2 Vehicles | 1,153 (37.6%) | 187 (22.5%) |
| 3 or more Vehicles | 1,137 (37.1%) | 235 (28.3%) |
| Total | 3,063 (100.0%) | 830 (100.0%) |
Real Estate & Mortgages in St Stephens
Real Estate and Mortgage Overview in St Stephens
| Characteristic | Without Mortgage | With Mortgage |
| Housing Units | 1,262 | 1,801 |
| Median Property Value | $125,000 | $189,500 |
| Median Household Income | $40,208 | $129 |
| Monthly Housing Costs | $318 | $122 |
| Real Estate Taxes | $843 | $11 |
Property Value by Mortgage Status in St Stephens
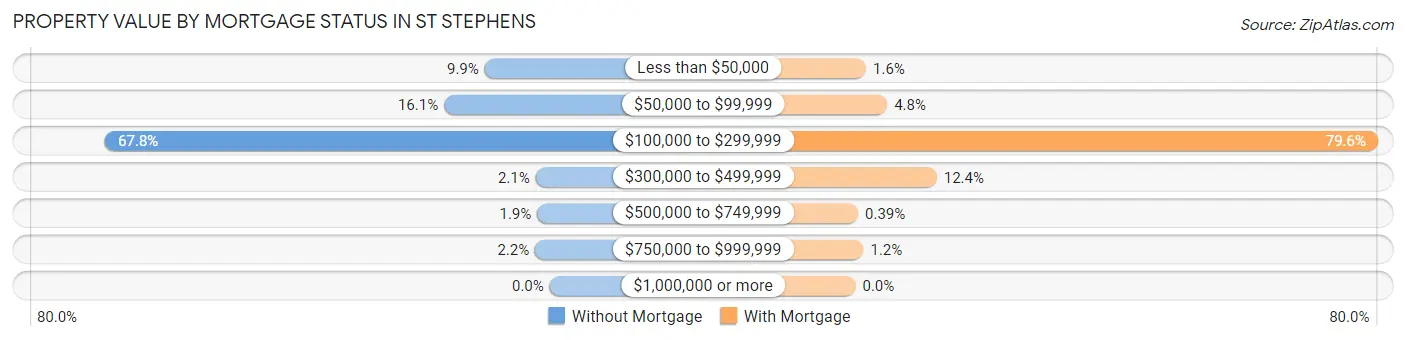
| Property Value | Without Mortgage | With Mortgage |
| Less than $50,000 | 125 (9.9%) | 29 (1.6%) |
| $50,000 to $99,999 | 203 (16.1%) | 87 (4.8%) |
| $100,000 to $299,999 | 855 (67.7%) | 1,433 (79.6%) |
| $300,000 to $499,999 | 27 (2.1%) | 223 (12.4%) |
| $500,000 to $749,999 | 24 (1.9%) | 7 (0.4%) |
| $750,000 to $999,999 | 28 (2.2%) | 22 (1.2%) |
| $1,000,000 or more | 0 (0.0%) | 0 (0.0%) |
| Total | 1,262 (100.0%) | 1,801 (100.0%) |
Household Income by Mortgage Status in St Stephens
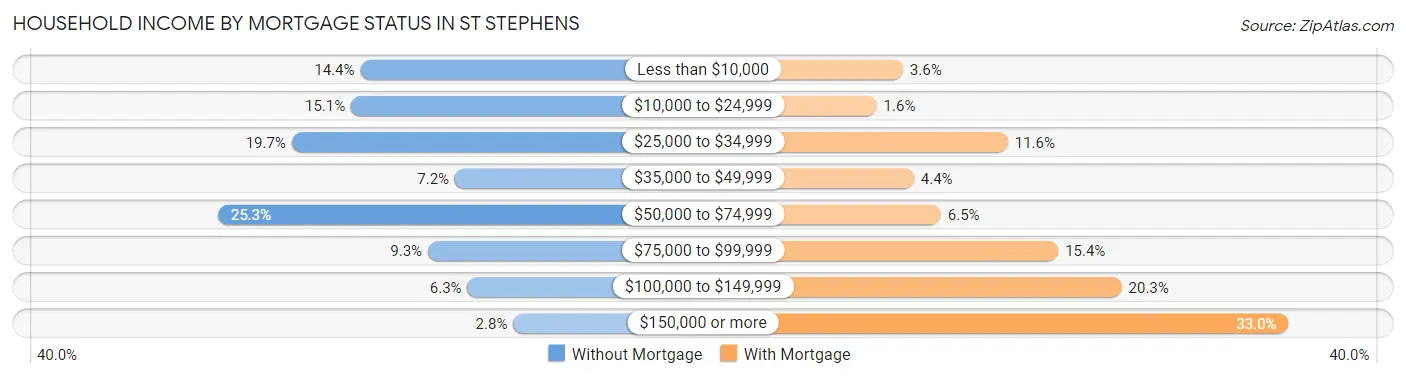
| Household Income | Without Mortgage | With Mortgage |
| Less than $10,000 | 182 (14.4%) | 65 (3.6%) |
| $10,000 to $24,999 | 191 (15.1%) | 29 (1.6%) |
| $25,000 to $34,999 | 248 (19.7%) | 209 (11.6%) |
| $35,000 to $49,999 | 91 (7.2%) | 80 (4.4%) |
| $50,000 to $74,999 | 319 (25.3%) | 117 (6.5%) |
| $75,000 to $99,999 | 117 (9.3%) | 278 (15.4%) |
| $100,000 to $149,999 | 79 (6.3%) | 365 (20.3%) |
| $150,000 or more | 35 (2.8%) | 594 (33.0%) |
| Total | 1,262 (100.0%) | 1,801 (100.0%) |
Property Value to Household Income Ratio in St Stephens
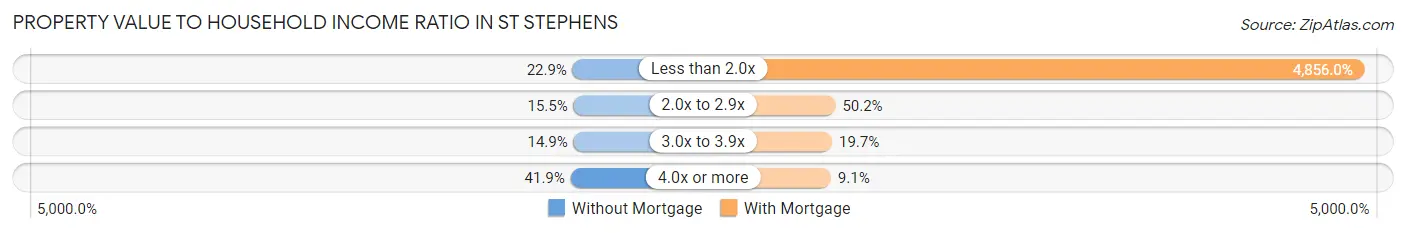
| Value-to-Income Ratio | Without Mortgage | With Mortgage |
| Less than 2.0x | 289 (22.9%) | 87,457 (4,856.0%) |
| 2.0x to 2.9x | 196 (15.5%) | 904 (50.2%) |
| 3.0x to 3.9x | 188 (14.9%) | 354 (19.7%) |
| 4.0x or more | 529 (41.9%) | 164 (9.1%) |
| Total | 1,262 (100.0%) | 1,801 (100.0%) |
Real Estate Taxes by Mortgage Status in St Stephens
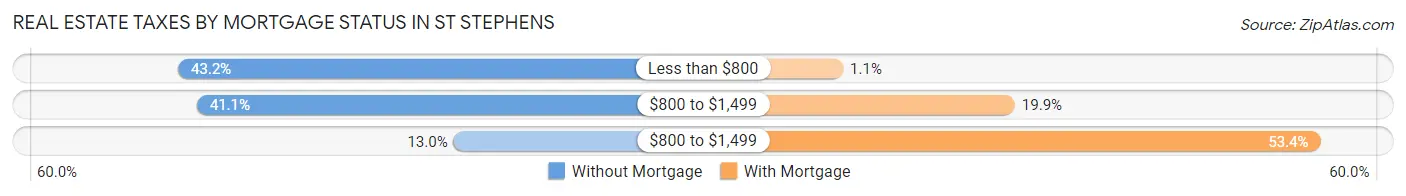
| Property Taxes | Without Mortgage | With Mortgage |
| Less than $800 | 545 (43.2%) | 20 (1.1%) |
| $800 to $1,499 | 519 (41.1%) | 359 (19.9%) |
| $800 to $1,499 | 164 (13.0%) | 962 (53.4%) |
| Total | 1,262 (100.0%) | 1,801 (100.0%) |
Health & Disability in St Stephens
Health Insurance Coverage by Age in St Stephens
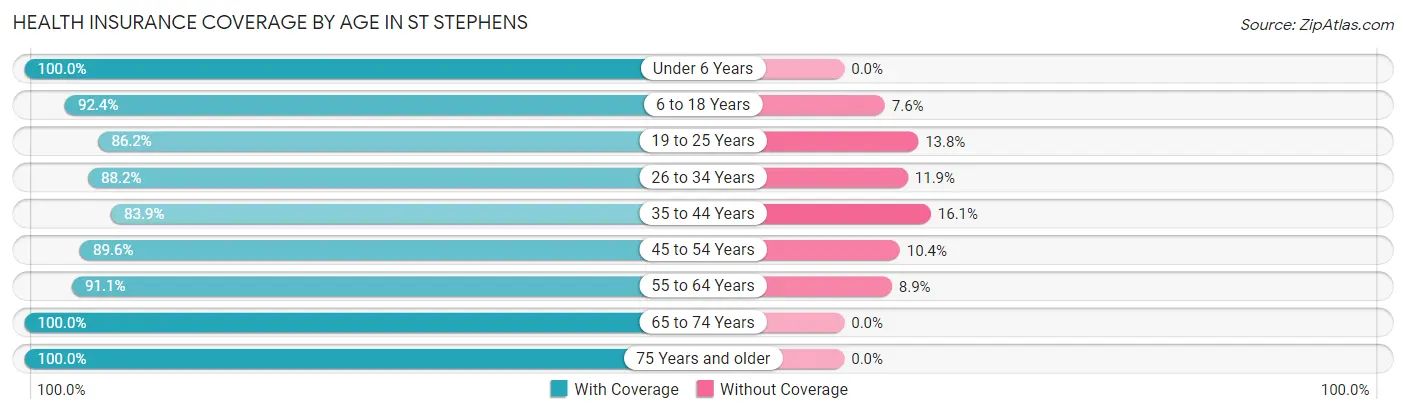
| Age Bracket | With Coverage | Without Coverage |
| Under 6 Years | 721 (100.0%) | 0 (0.0%) |
| 6 to 18 Years | 1,528 (92.4%) | 125 (7.6%) |
| 19 to 25 Years | 757 (86.2%) | 121 (13.8%) |
| 26 to 34 Years | 580 (88.1%) | 78 (11.8%) |
| 35 to 44 Years | 1,159 (83.9%) | 223 (16.1%) |
| 45 to 54 Years | 1,099 (89.6%) | 127 (10.4%) |
| 55 to 64 Years | 1,161 (91.1%) | 113 (8.9%) |
| 65 to 74 Years | 1,000 (100.0%) | 0 (0.0%) |
| 75 Years and older | 831 (100.0%) | 0 (0.0%) |
| Total | 8,836 (91.8%) | 787 (8.2%) |
Health Insurance Coverage by Citizenship Status in St Stephens
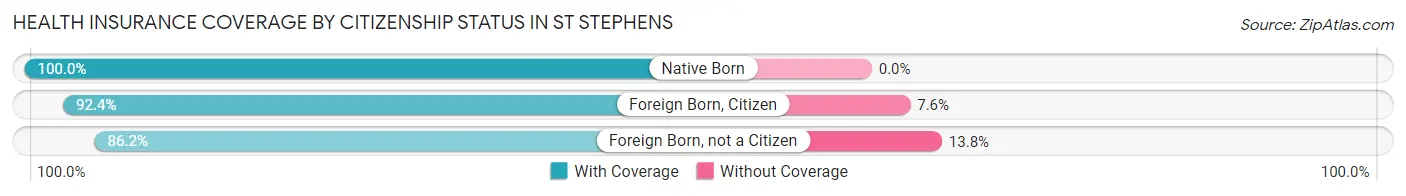
| Citizenship Status | With Coverage | Without Coverage |
| Native Born | 721 (100.0%) | 0 (0.0%) |
| Foreign Born, Citizen | 1,528 (92.4%) | 125 (7.6%) |
| Foreign Born, not a Citizen | 757 (86.2%) | 121 (13.8%) |
Health Insurance Coverage by Household Income in St Stephens
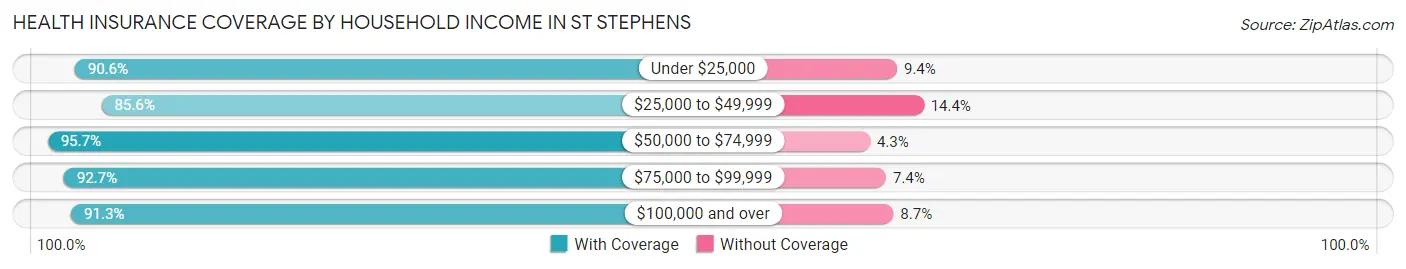
| Household Income | With Coverage | Without Coverage |
| Under $25,000 | 1,444 (90.6%) | 150 (9.4%) |
| $25,000 to $49,999 | 1,111 (85.6%) | 187 (14.4%) |
| $50,000 to $74,999 | 2,554 (95.7%) | 116 (4.3%) |
| $75,000 to $99,999 | 1,374 (92.6%) | 109 (7.3%) |
| $100,000 and over | 2,353 (91.3%) | 225 (8.7%) |
Public vs Private Health Insurance Coverage by Age in St Stephens
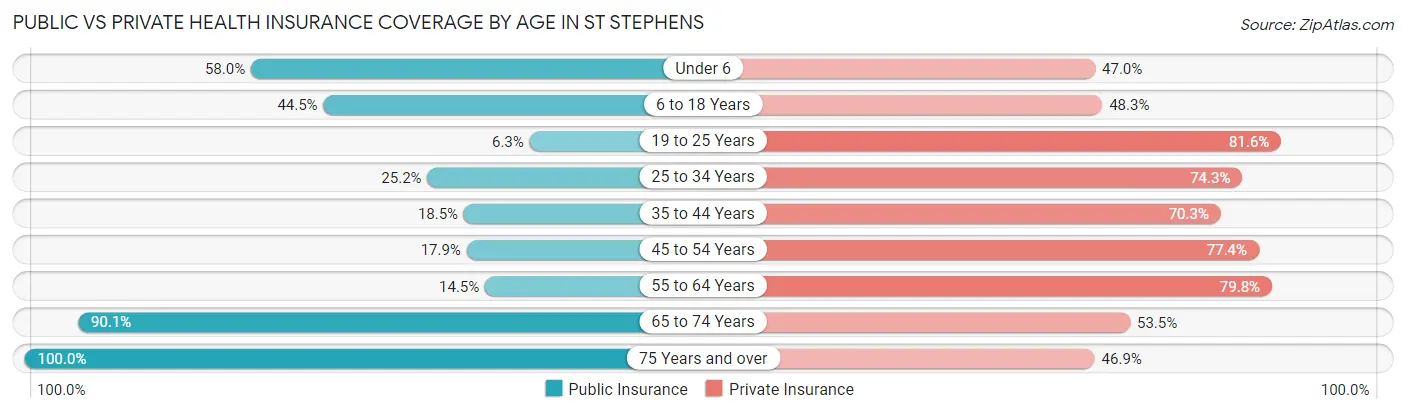
| Age Bracket | Public Insurance | Private Insurance |
| Under 6 | 418 (58.0%) | 339 (47.0%) |
| 6 to 18 Years | 736 (44.5%) | 799 (48.3%) |
| 19 to 25 Years | 55 (6.3%) | 716 (81.6%) |
| 25 to 34 Years | 166 (25.2%) | 489 (74.3%) |
| 35 to 44 Years | 255 (18.4%) | 972 (70.3%) |
| 45 to 54 Years | 220 (17.9%) | 949 (77.4%) |
| 55 to 64 Years | 185 (14.5%) | 1,017 (79.8%) |
| 65 to 74 Years | 901 (90.1%) | 535 (53.5%) |
| 75 Years and over | 831 (100.0%) | 390 (46.9%) |
| Total | 3,767 (39.2%) | 6,206 (64.5%) |
Disability Status by Sex by Age in St Stephens
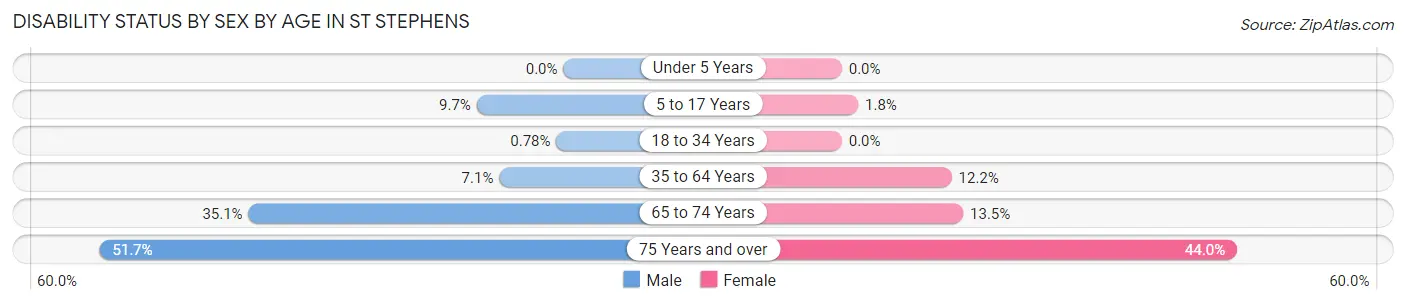
| Age Bracket | Male | Female |
| Under 5 Years | 0 (0.0%) | 0 (0.0%) |
| 5 to 17 Years | 85 (9.7%) | 12 (1.8%) |
| 18 to 34 Years | 8 (0.8%) | 0 (0.0%) |
| 35 to 64 Years | 147 (7.1%) | 223 (12.2%) |
| 65 to 74 Years | 182 (35.1%) | 65 (13.5%) |
| 75 Years and over | 170 (51.7%) | 221 (44.0%) |
Disability Class by Sex by Age in St Stephens
Disability Class: Hearing Difficulty
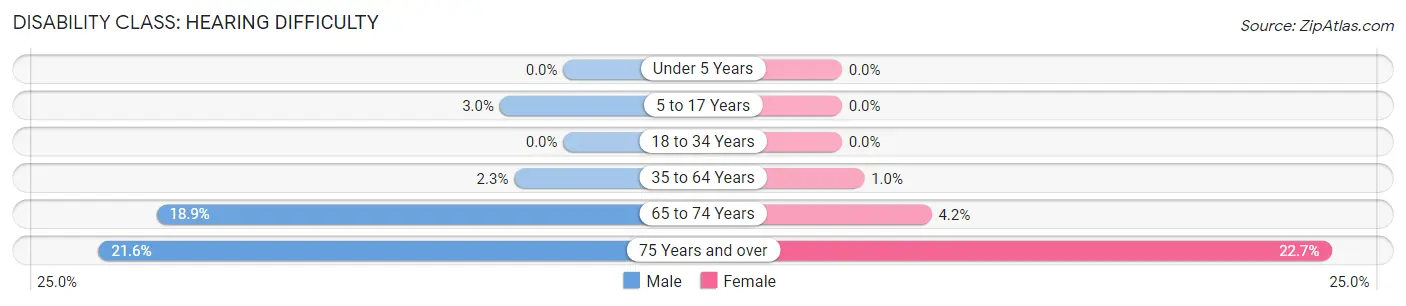
| Age Bracket | Male | Female |
| Under 5 Years | 0 (0.0%) | 0 (0.0%) |
| 5 to 17 Years | 26 (2.9%) | 0 (0.0%) |
| 18 to 34 Years | 0 (0.0%) | 0 (0.0%) |
| 35 to 64 Years | 47 (2.3%) | 19 (1.0%) |
| 65 to 74 Years | 98 (18.9%) | 20 (4.2%) |
| 75 Years and over | 71 (21.6%) | 114 (22.7%) |
Disability Class: Vision Difficulty
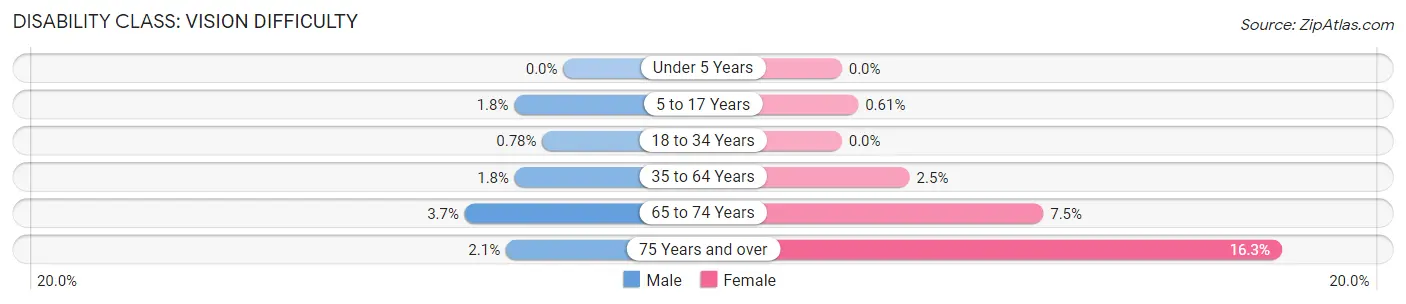
| Age Bracket | Male | Female |
| Under 5 Years | 0 (0.0%) | 0 (0.0%) |
| 5 to 17 Years | 16 (1.8%) | 4 (0.6%) |
| 18 to 34 Years | 8 (0.8%) | 0 (0.0%) |
| 35 to 64 Years | 37 (1.8%) | 46 (2.5%) |
| 65 to 74 Years | 19 (3.7%) | 36 (7.5%) |
| 75 Years and over | 7 (2.1%) | 82 (16.3%) |
Disability Class: Cognitive Difficulty
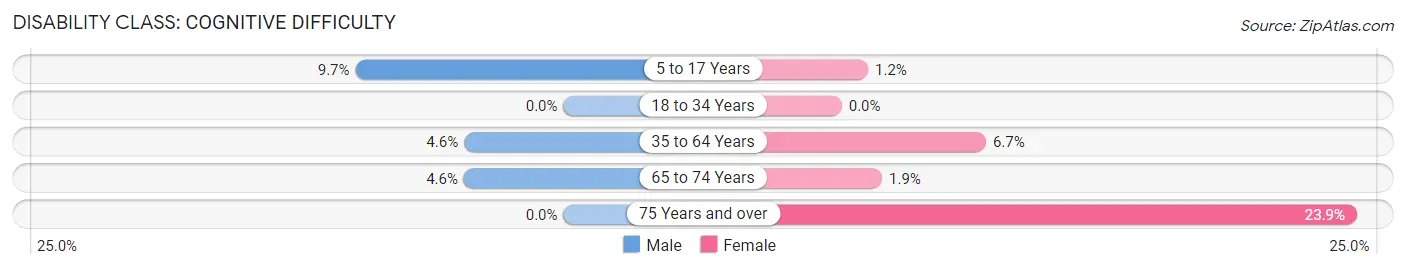
| Age Bracket | Male | Female |
| 5 to 17 Years | 85 (9.7%) | 8 (1.2%) |
| 18 to 34 Years | 0 (0.0%) | 0 (0.0%) |
| 35 to 64 Years | 95 (4.6%) | 122 (6.7%) |
| 65 to 74 Years | 24 (4.6%) | 9 (1.9%) |
| 75 Years and over | 0 (0.0%) | 120 (23.9%) |
Disability Class: Ambulatory Difficulty
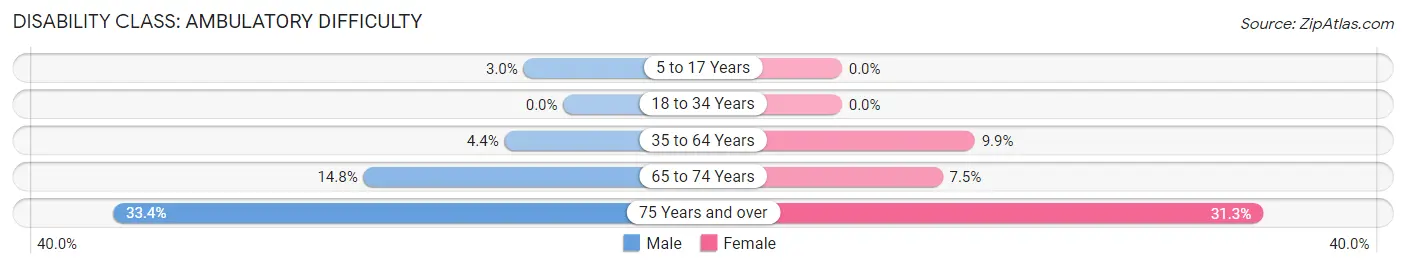
| Age Bracket | Male | Female |
| 5 to 17 Years | 26 (2.9%) | 0 (0.0%) |
| 18 to 34 Years | 0 (0.0%) | 0 (0.0%) |
| 35 to 64 Years | 90 (4.4%) | 180 (9.9%) |
| 65 to 74 Years | 77 (14.8%) | 36 (7.5%) |
| 75 Years and over | 110 (33.4%) | 157 (31.3%) |
Disability Class: Self-Care Difficulty
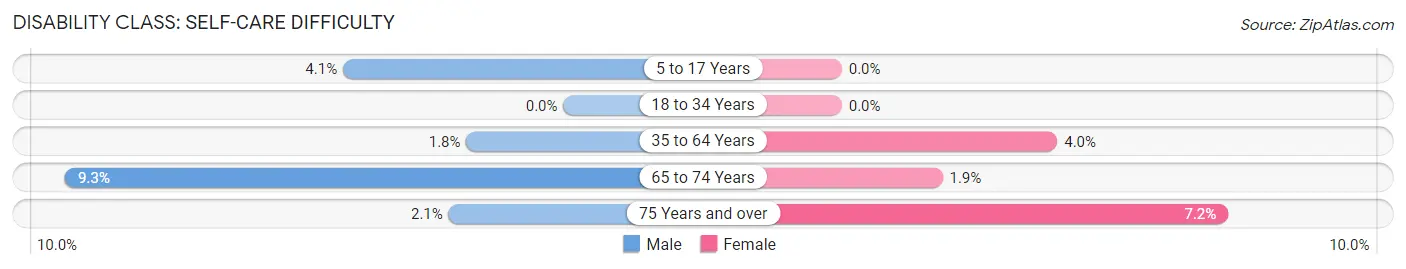
| Age Bracket | Male | Female |
| 5 to 17 Years | 36 (4.1%) | 0 (0.0%) |
| 18 to 34 Years | 0 (0.0%) | 0 (0.0%) |
| 35 to 64 Years | 37 (1.8%) | 73 (4.0%) |
| 65 to 74 Years | 48 (9.2%) | 9 (1.9%) |
| 75 Years and over | 7 (2.1%) | 36 (7.2%) |
Technology Access in St Stephens
Computing Device Access in St Stephens
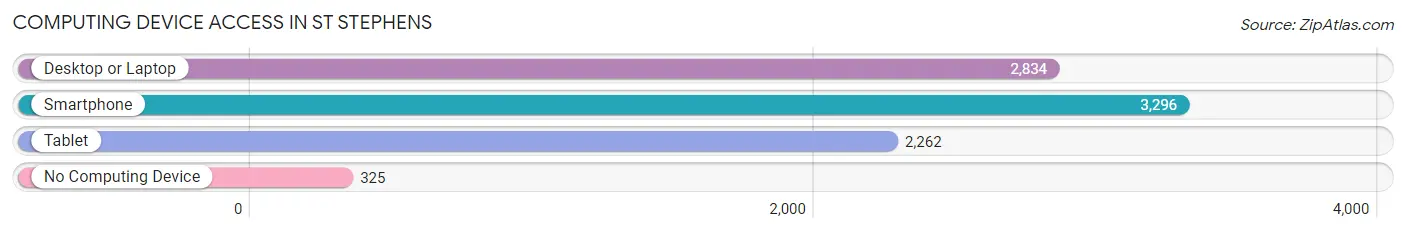
| Device Type | # Households | % Households |
| Desktop or Laptop | 2,834 | 72.8% |
| Smartphone | 3,296 | 84.7% |
| Tablet | 2,262 | 58.1% |
| No Computing Device | 325 | 8.4% |
| Total | 3,893 | 100.0% |
Internet Access in St Stephens
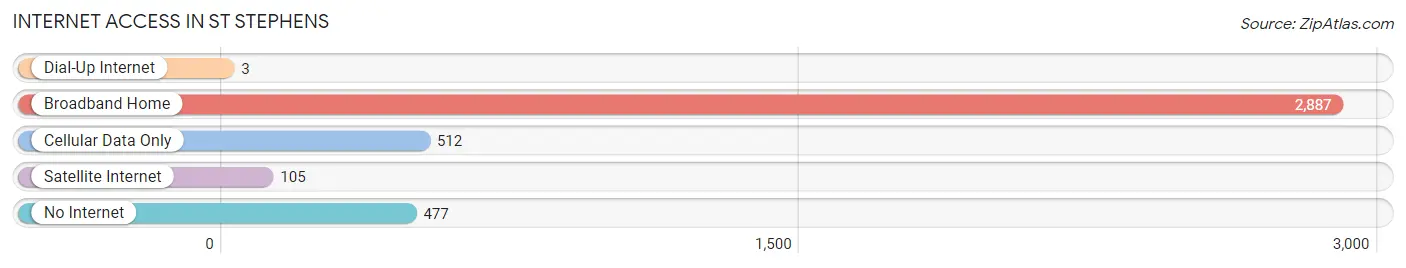
| Internet Type | # Households | % Households |
| Dial-Up Internet | 3 | 0.1% |
| Broadband Home | 2,887 | 74.2% |
| Cellular Data Only | 512 | 13.2% |
| Satellite Internet | 105 | 2.7% |
| No Internet | 477 | 12.2% |
| Total | 3,893 | 100.0% |
St Stephens Summary
St. Stephens is a small unincorporated community located in Tyrrell County, North Carolina. It is situated on the banks of the Alligator River, near the town of Columbia. The population of St. Stephens was estimated to be around 200 people in 2020.
History
St. Stephens was first settled in the late 1700s by a group of settlers from Virginia. The settlement was named after the nearby St. Stephens Church, which was built in 1790. The church was the first of its kind in the area and served as a place of worship for the local community.
In the early 1800s, St. Stephens became a thriving port town. It was a major hub for the lumber and fishing industries, as well as a popular destination for travelers. The town was also home to a number of businesses, including a general store, a blacksmith shop, and a post office.
In the late 1800s, St. Stephens began to decline in population as the lumber and fishing industries moved elsewhere. The town was eventually abandoned in the early 1900s.
Geography
St. Stephens is located in the northeastern corner of Tyrrell County, North Carolina. It is situated on the banks of the Alligator River, near the town of Columbia. The town is surrounded by a number of small lakes and ponds, as well as the Alligator River.
The climate in St. Stephens is humid subtropical, with hot, humid summers and mild winters. The average annual temperature is around 70 degrees Fahrenheit.
Economy
The economy of St. Stephens is largely based on agriculture and tourism. The town is home to a number of farms, which produce a variety of crops, including corn, soybeans, and cotton.
Tourism is also an important part of the local economy. The town is home to a number of historic sites, including the St. Stephens Church, which was built in 1790. The town also hosts a number of festivals and events throughout the year, including the St. Stephens Day Festival and the Alligator River Festival.
Demographics
The population of St. Stephens was estimated to be around 200 people in 2020. The town is predominantly white, with a small African American population. The median household income in St. Stephens is around $30,000. The town has a high poverty rate, with around 25% of the population living below the poverty line.
Common Questions
What is Per Capita Income in St Stephens?
Per Capita income in St Stephens is $27,026.
What is the Median Family Income in St Stephens?
Median Family Income in St Stephens is $67,292.
What is the Median Household income in St Stephens?
Median Household Income in St Stephens is $59,597.
What is Income or Wage Gap in St Stephens?
Income or Wage Gap in St Stephens is 4.7%.
Women in St Stephens earn 95.3 cents for every dollar earned by a man.
What is Family Income Deficit in St Stephens?
Family Income Deficit in St Stephens is $8,429.
Families that are below poverty line in St Stephens earn $8,429 less on average than the poverty threshold level.
What is Inequality or Gini Index in St Stephens?
Inequality or Gini Index in St Stephens is 0.39.
What is the Total Population of St Stephens?
Total Population of St Stephens is 9,624.
What is the Total Male Population of St Stephens?
Total Male Population of St Stephens is 5,161.
What is the Total Female Population of St Stephens?
Total Female Population of St Stephens is 4,463.
What is the Ratio of Males per 100 Females in St Stephens?
There are 115.64 Males per 100 Females in St Stephens.
What is the Ratio of Females per 100 Males in St Stephens?
There are 86.48 Females per 100 Males in St Stephens.
What is the Median Population Age in St Stephens?
Median Population Age in St Stephens is 43.0 Years.
What is the Average Family Size in St Stephens
Average Family Size in St Stephens is 2.9 People.
What is the Average Household Size in St Stephens
Average Household Size in St Stephens is 2.5 People.
How Large is the Labor Force in St Stephens?
There are 4,856 People in the Labor Forcein in St Stephens.
What is the Percentage of People in the Labor Force in St Stephens?
63.0% of People are in the Labor Force in St Stephens.
What is the Unemployment Rate in St Stephens?
Unemployment Rate in St Stephens is 4.2%.