City View, SC Map & Demographics
City View Map
City View Overview
$16,895
PER CAPITA INCOME
$44,517
AVG FAMILY INCOME
0.51
INEQUALITY / GINI INDEX
1,696
TOTAL POPULATION
861
MALE POPULATION
835
FEMALE POPULATION
103.11
MALES / 100 FEMALES
96.98
FEMALES / 100 MALES
33.7
MEDIAN AGE
3.8
AVG FAMILY SIZE
3.4
AVG HOUSEHOLD SIZE
543
LABOR FORCE [ PEOPLE ]
42.9%
PERCENT IN LABOR FORCE
6.6%
UNEMPLOYMENT RATE
Income in City View
Income Overview in City View
| Characteristic | Number | Measure |
| Per Capita Income | 1,696 | $16,895 |
| Median Family Income | 357 | $44,517 |
| Mean Family Income | 357 | $63,749 |
| Median Household Income | 498 | $0 |
| Mean Household Income | 498 | $54,718 |
| Income Deficit | 357 | $0 |
| Wage / Income Gap (%) | 1,696 | 0.00% |
| Wage / Income Gap ($) | 1,696 | 100.00¢ per $1 |
| Gini / Inequality Index | 1,696 | 0.51 |
Earnings by Sex in City View
| Sex | Number | Average Earnings |
| Male | 420 (63.4%) | $0 |
| Female | 242 (36.6%) | $0 |
| Total | 662 (100.0%) | $0 |
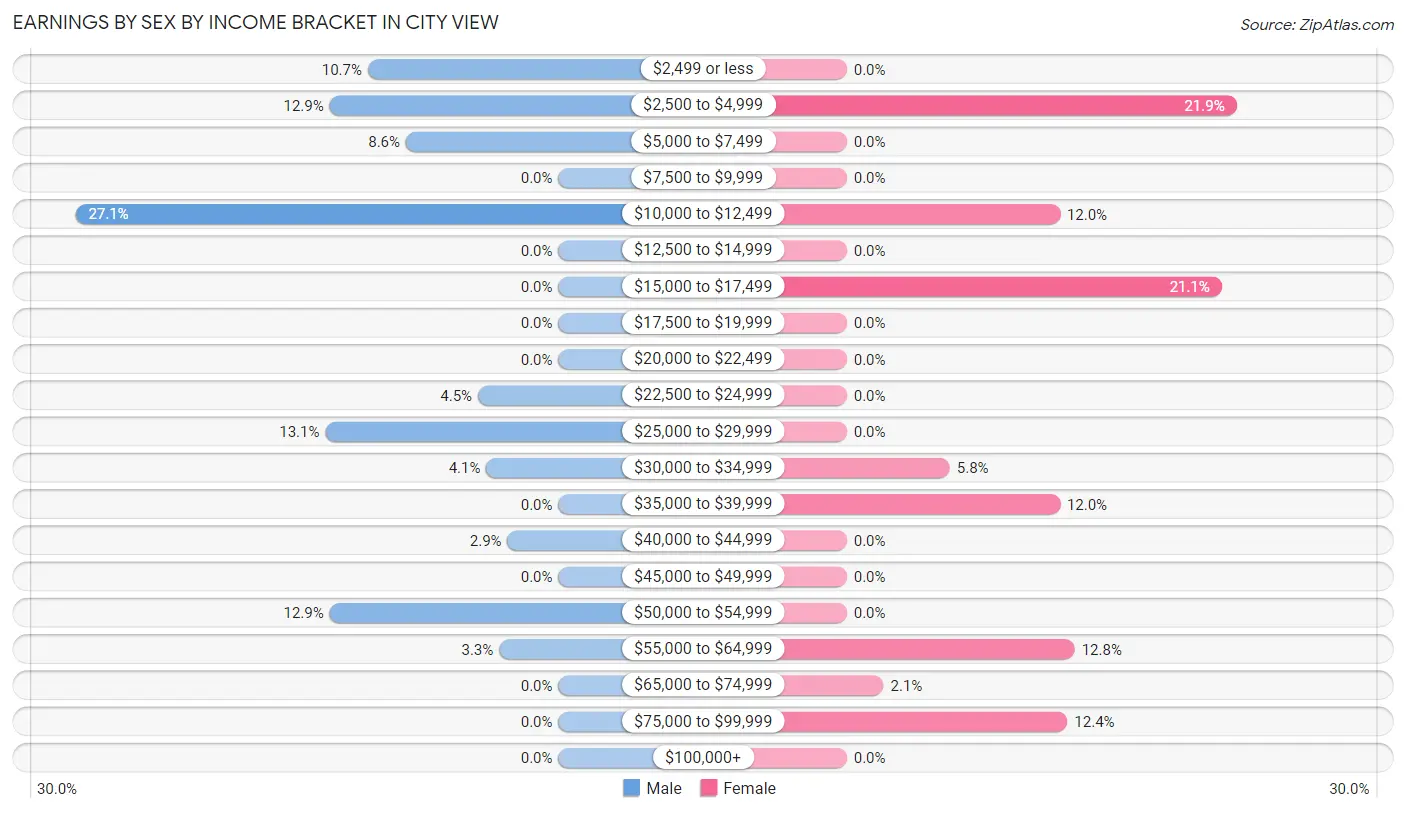
Earnings by Sex by Income Bracket in City View
The most common earnings brackets in City View are $10,000 to $12,499 for men (114 | 27.1%) and $2,500 to $4,999 for women (53 | 21.9%).
| Income | Male | Female |
| $2,499 or less | 45 (10.7%) | 0 (0.0%) |
| $2,500 to $4,999 | 54 (12.9%) | 53 (21.9%) |
| $5,000 to $7,499 | 36 (8.6%) | 0 (0.0%) |
| $7,500 to $9,999 | 0 (0.0%) | 0 (0.0%) |
| $10,000 to $12,499 | 114 (27.1%) | 29 (12.0%) |
| $12,500 to $14,999 | 0 (0.0%) | 0 (0.0%) |
| $15,000 to $17,499 | 0 (0.0%) | 51 (21.1%) |
| $17,500 to $19,999 | 0 (0.0%) | 0 (0.0%) |
| $20,000 to $22,499 | 0 (0.0%) | 0 (0.0%) |
| $22,500 to $24,999 | 19 (4.5%) | 0 (0.0%) |
| $25,000 to $29,999 | 55 (13.1%) | 0 (0.0%) |
| $30,000 to $34,999 | 17 (4.1%) | 14 (5.8%) |
| $35,000 to $39,999 | 0 (0.0%) | 29 (12.0%) |
| $40,000 to $44,999 | 12 (2.9%) | 0 (0.0%) |
| $45,000 to $49,999 | 0 (0.0%) | 0 (0.0%) |
| $50,000 to $54,999 | 54 (12.9%) | 0 (0.0%) |
| $55,000 to $64,999 | 14 (3.3%) | 31 (12.8%) |
| $65,000 to $74,999 | 0 (0.0%) | 5 (2.1%) |
| $75,000 to $99,999 | 0 (0.0%) | 30 (12.4%) |
| $100,000+ | 0 (0.0%) | 0 (0.0%) |
| Total | 420 (100.0%) | 242 (100.0%) |
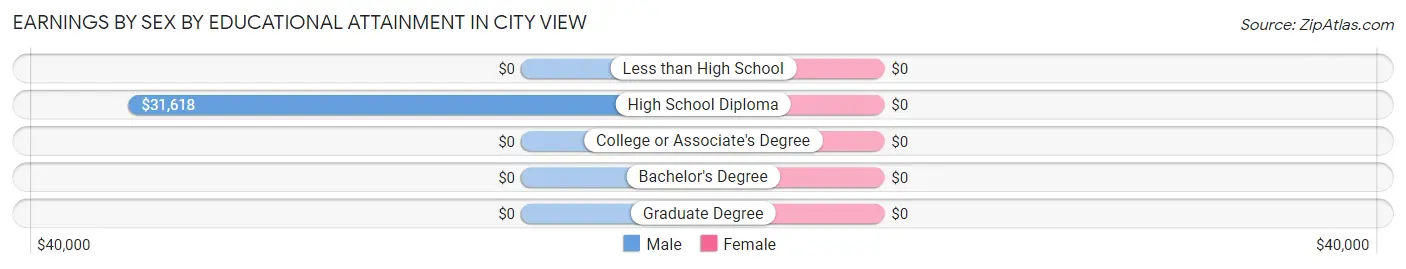
Earnings by Sex by Educational Attainment in City View
| Educational Attainment | Male Income | Female Income |
| Less than High School | - | - |
| High School Diploma | $31,618 | $0 |
| College or Associate's Degree | - | - |
| Bachelor's Degree | - | - |
| Graduate Degree | - | - |
| Total | - | - |
Family Income in City View
Family Income Brackets in City View
According to the City View family income data, there are 95 families falling into the $50,000 to $74,999 income range, which is the most common income bracket and makes up 26.6% of all families.
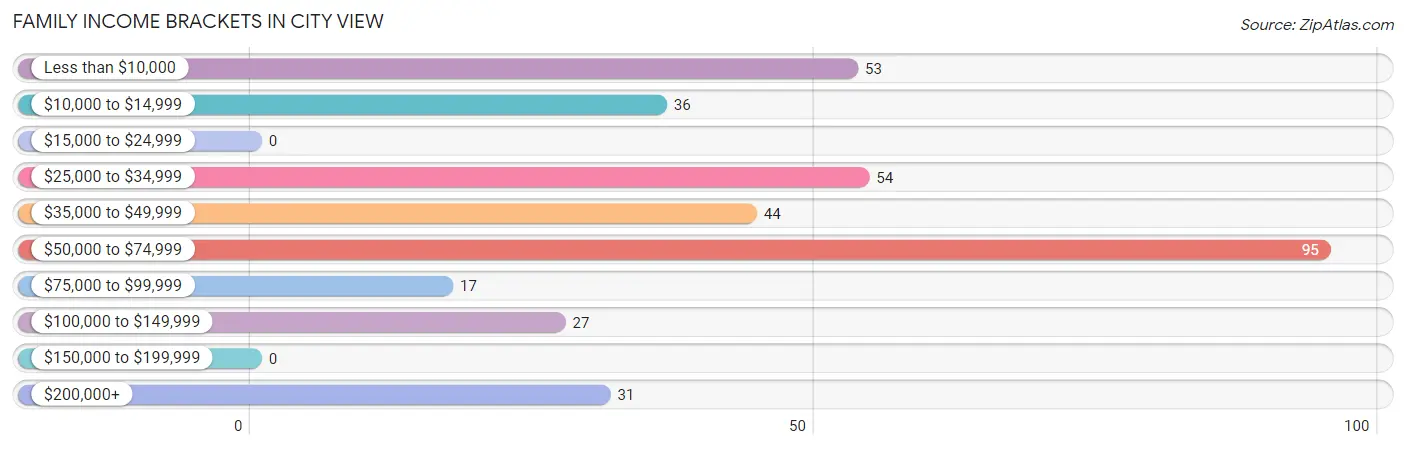
| Income Bracket | # Families | % Families |
| Less than $10,000 | 53 | 14.8% |
| $10,000 to $14,999 | 36 | 10.1% |
| $15,000 to $24,999 | 0 | 0.0% |
| $25,000 to $34,999 | 54 | 15.1% |
| $35,000 to $49,999 | 44 | 12.3% |
| $50,000 to $74,999 | 95 | 26.6% |
| $75,000 to $99,999 | 17 | 4.8% |
| $100,000 to $149,999 | 27 | 7.6% |
| $150,000 to $199,999 | 0 | 0.0% |
| $200,000+ | 31 | 8.7% |
Family Income by Famaliy Size in City View
| Income Bracket | # Families | Median Income |
| 2-Person Families | 145 (40.6%) | $0 |
| 3-Person Families | 44 (12.3%) | $0 |
| 4-Person Families | 14 (3.9%) | $0 |
| 5-Person Families | 154 (43.1%) | $0 |
| 6-Person Families | 0 (0.0%) | $0 |
| 7+ Person Families | 0 (0.0%) | $0 |
| Total | 357 (100.0%) | $44,517 |
Family Income by Number of Earners in City View
| Number of Earners | # Families | Median Income |
| No Earners | 0 (0.0%) | $0 |
| 1 Earner | 272 (76.2%) | $0 |
| 2 Earners | 85 (23.8%) | $0 |
| 3+ Earners | 0 (0.0%) | $0 |
| Total | 357 (100.0%) | $44,517 |
Household Income in City View
Household Income Brackets in City View
With 153 households falling in the category, the $50,000 to $74,999 income range is the most frequent in City View, accounting for 30.7% of all households.
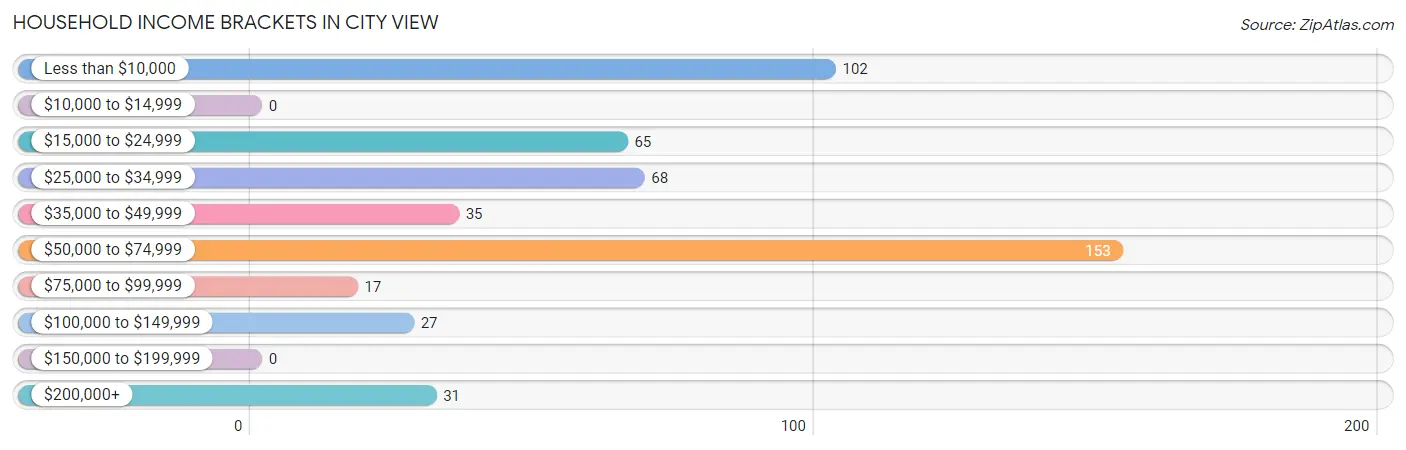
| Income Bracket | # Households | % Households |
| Less than $10,000 | 102 | 20.5% |
| $10,000 to $14,999 | 0 | 0.0% |
| $15,000 to $24,999 | 65 | 13.1% |
| $25,000 to $34,999 | 68 | 13.7% |
| $35,000 to $49,999 | 35 | 7.0% |
| $50,000 to $74,999 | 153 | 30.7% |
| $75,000 to $99,999 | 17 | 3.4% |
| $100,000 to $149,999 | 27 | 5.4% |
| $150,000 to $199,999 | 0 | 0.0% |
| $200,000+ | 31 | 6.2% |
Household Income by Householder Age in City View
The median household income in City View is $0, with the highest median household income of $61,875 found in the 65+ years age bracket for the primary householder. A total of 132 households (26.5%) fall into this category. Meanwhile, the 15 to 24 years age bracket for the primary householder has the lowest median household income of $0, with 57 households (11.5%) in this group.
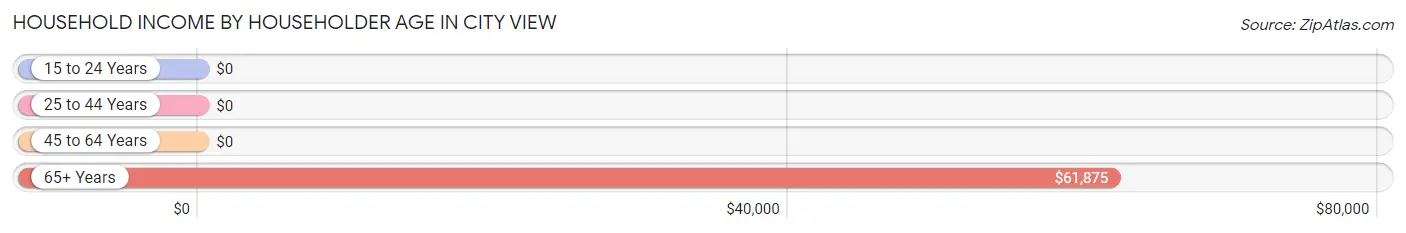
| Income Bracket | # Households | Median Income |
| 15 to 24 Years | 57 (11.5%) | $0 |
| 25 to 44 Years | 204 (41.0%) | $0 |
| 45 to 64 Years | 105 (21.1%) | $0 |
| 65+ Years | 132 (26.5%) | $61,875 |
| Total | 498 (100.0%) | $0 |
Poverty in City View
Income Below Poverty by Sex and Age in City View
With 49.6% poverty level for males and 45.4% for females among the residents of City View, 12 to 14 year old males and 15 year old females are the most vulnerable to poverty, with 76 males (100.0%) and 54 females (100.0%) in their respective age groups living below the poverty level.
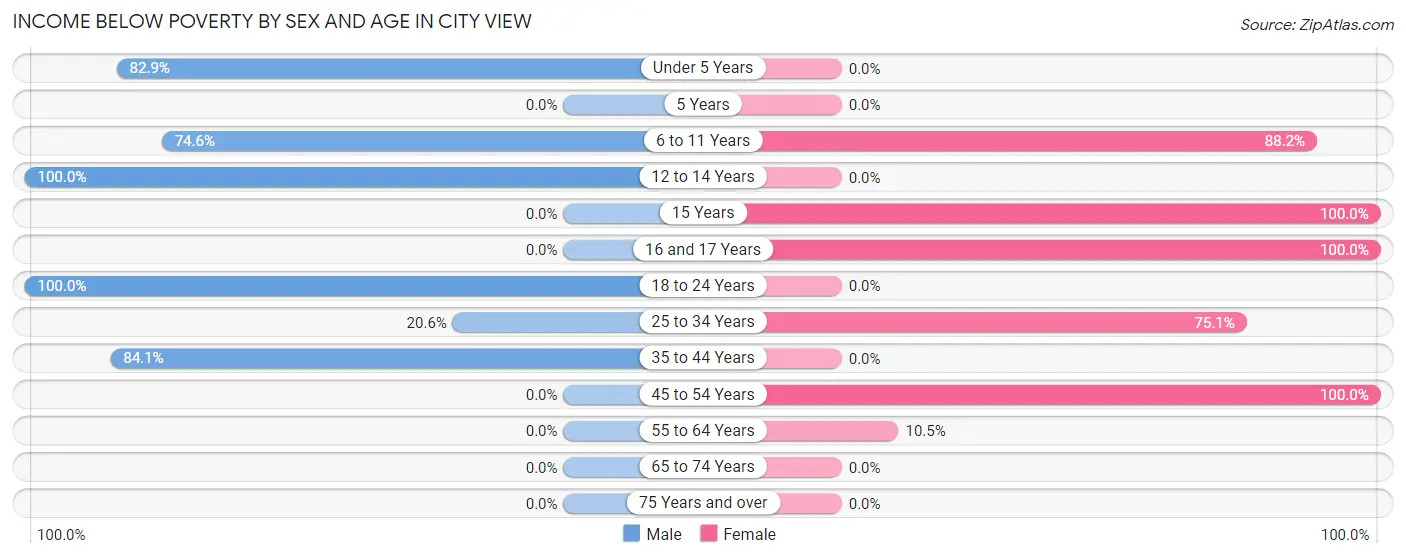
| Age Bracket | Male | Female |
| Under 5 Years | 97 (82.9%) | 0 (0.0%) |
| 5 Years | 0 (0.0%) | 0 (0.0%) |
| 6 to 11 Years | 41 (74.6%) | 97 (88.2%) |
| 12 to 14 Years | 76 (100.0%) | 0 (0.0%) |
| 15 Years | 0 (0.0%) | 54 (100.0%) |
| 16 and 17 Years | 0 (0.0%) | 35 (100.0%) |
| 18 to 24 Years | 57 (100.0%) | 0 (0.0%) |
| 25 to 34 Years | 45 (20.5%) | 136 (75.1%) |
| 35 to 44 Years | 111 (84.1%) | 0 (0.0%) |
| 45 to 54 Years | 0 (0.0%) | 53 (100.0%) |
| 55 to 64 Years | 0 (0.0%) | 4 (10.5%) |
| 65 to 74 Years | 0 (0.0%) | 0 (0.0%) |
| 75 Years and over | 0 (0.0%) | 0 (0.0%) |
| Total | 427 (49.6%) | 379 (45.4%) |
Income Above Poverty by Sex and Age in City View
According to the poverty statistics in City View, males aged 16 and 17 years and females aged under 5 years are the age groups that are most secure financially, with 100.0% of males and 100.0% of females in these age groups living above the poverty line.
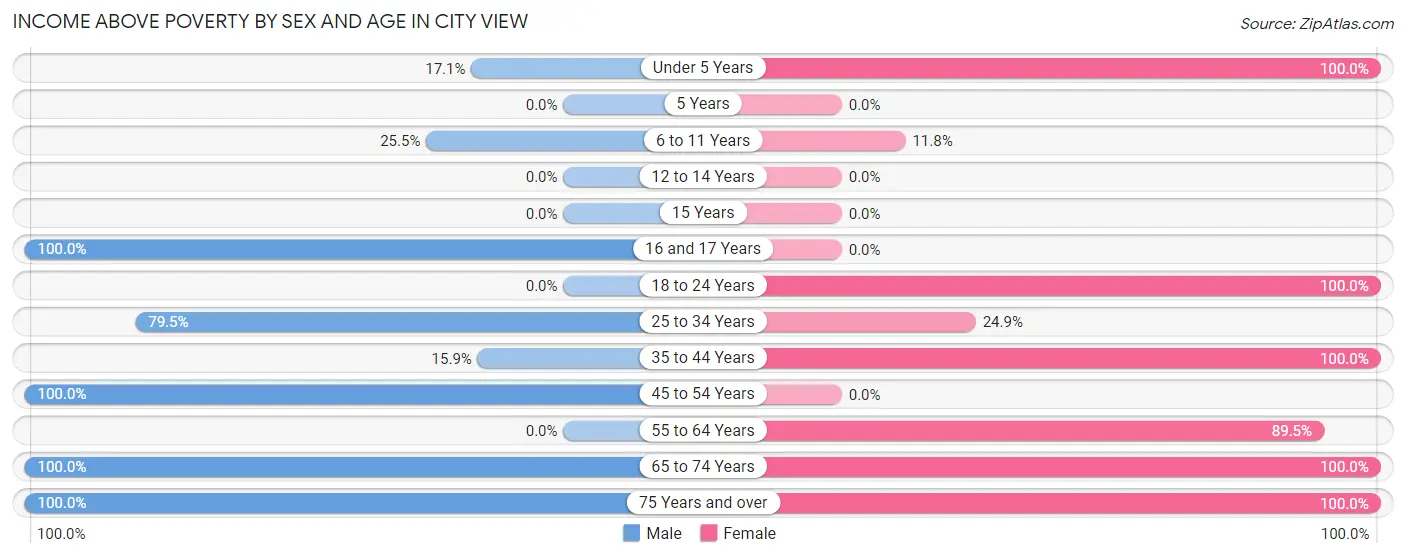
| Age Bracket | Male | Female |
| Under 5 Years | 20 (17.1%) | 19 (100.0%) |
| 5 Years | 0 (0.0%) | 0 (0.0%) |
| 6 to 11 Years | 14 (25.5%) | 13 (11.8%) |
| 12 to 14 Years | 0 (0.0%) | 0 (0.0%) |
| 15 Years | 0 (0.0%) | 0 (0.0%) |
| 16 and 17 Years | 15 (100.0%) | 0 (0.0%) |
| 18 to 24 Years | 0 (0.0%) | 15 (100.0%) |
| 25 to 34 Years | 174 (79.4%) | 45 (24.9%) |
| 35 to 44 Years | 21 (15.9%) | 92 (100.0%) |
| 45 to 54 Years | 48 (100.0%) | 0 (0.0%) |
| 55 to 64 Years | 0 (0.0%) | 34 (89.5%) |
| 65 to 74 Years | 71 (100.0%) | 211 (100.0%) |
| 75 Years and over | 71 (100.0%) | 27 (100.0%) |
| Total | 434 (50.4%) | 456 (54.6%) |
Income Below Poverty Among Married-Couple Families in City View
The poverty statistics for married-couple families in City View show that 42.6% or 90 of the total 211 families live below the poverty line. Families with 3 or 4 children have the highest poverty rate of 81.8%, comprising of 90 families. On the other hand, families with no children have the lowest poverty rate of 0.0%, which includes 0 families.
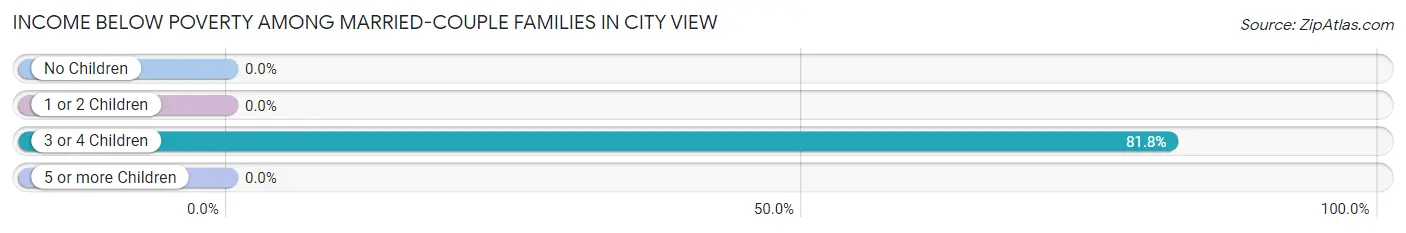
| Children | Above Poverty | Below Poverty |
| No Children | 87 (100.0%) | 0 (0.0%) |
| 1 or 2 Children | 14 (100.0%) | 0 (0.0%) |
| 3 or 4 Children | 20 (18.2%) | 90 (81.8%) |
| 5 or more Children | 0 (0.0%) | 0 (0.0%) |
| Total | 121 (57.4%) | 90 (42.6%) |
Income Below Poverty Among Single-Parent Households in City View
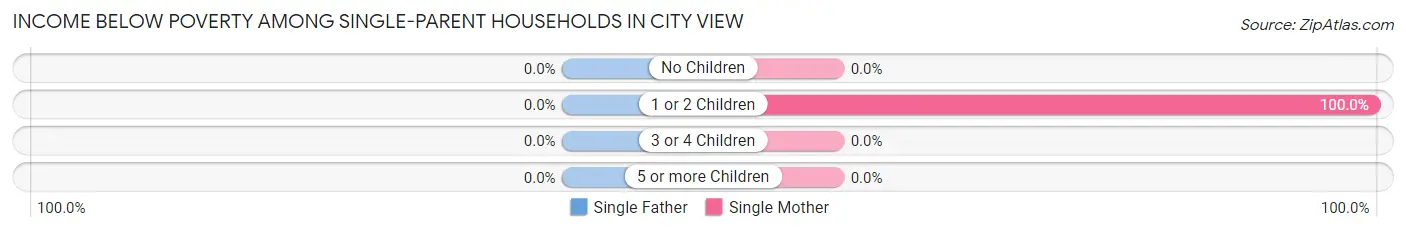
| Children | Single Father | Single Mother |
| No Children | 0 (0.0%) | 0 (0.0%) |
| 1 or 2 Children | 0 (0.0%) | 53 (100.0%) |
| 3 or 4 Children | 0 (0.0%) | 0 (0.0%) |
| 5 or more Children | 0 (0.0%) | 0 (0.0%) |
| Total | 0 (0.0%) | 53 (52.0%) |
Income Below Poverty Among Married-Couple vs Single-Parent Households in City View
The poverty data for City View shows that 90 of the married-couple family households (42.6%) and 53 of the single-parent households (36.3%) are living below the poverty level. Within the married-couple family households, those with 3 or 4 children have the highest poverty rate, with 90 households (81.8%) falling below the poverty line. Among the single-parent households, those with 1 or 2 children have the highest poverty rate, with 53 household (100.0%) living below poverty.
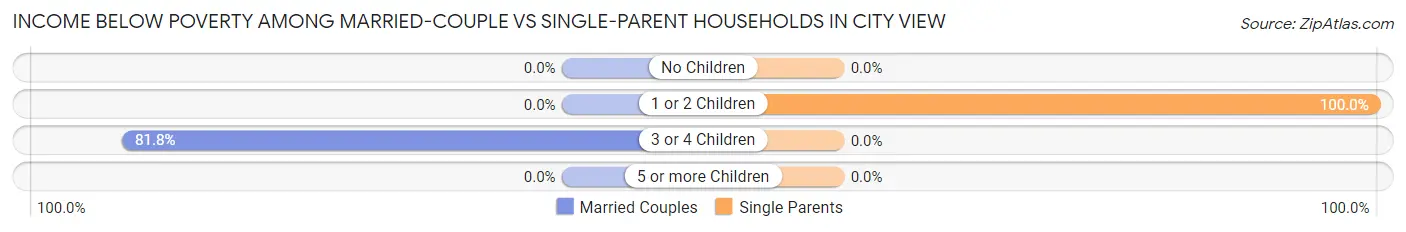
| Children | Married-Couple Families | Single-Parent Households |
| No Children | 0 (0.0%) | 0 (0.0%) |
| 1 or 2 Children | 0 (0.0%) | 53 (100.0%) |
| 3 or 4 Children | 90 (81.8%) | 0 (0.0%) |
| 5 or more Children | 0 (0.0%) | 0 (0.0%) |
| Total | 90 (42.6%) | 53 (36.3%) |
Race in City View
The most populous races in City View are White / Caucasian (1,407 | 83.0%), Hispanic or Latino (409 | 24.1%), and Black / African American (289 | 17.0%).
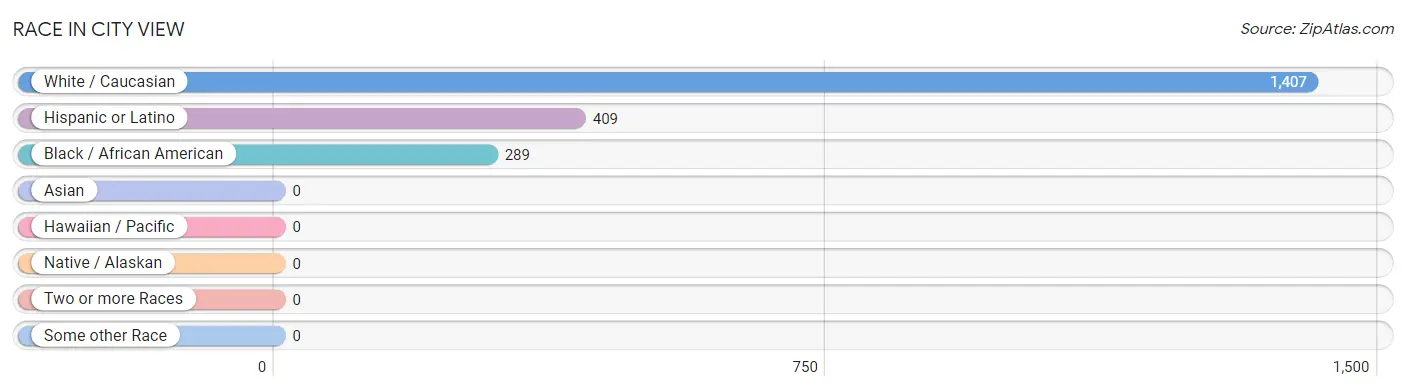
| Race | # Population | % Population |
| Asian | 0 | 0.0% |
| Black / African American | 289 | 17.0% |
| Hawaiian / Pacific | 0 | 0.0% |
| Hispanic or Latino | 409 | 24.1% |
| Native / Alaskan | 0 | 0.0% |
| White / Caucasian | 1,407 | 83.0% |
| Two or more Races | 0 | 0.0% |
| Some other Race | 0 | 0.0% |
| Total | 1,696 | 100.0% |
Ancestry in City View
The most populous ancestries reported in City View are Central American (342 | 20.2%), Guatemalan (342 | 20.2%), Scotch-Irish (316 | 18.6%), German (143 | 8.4%), and Irish (85 | 5.0%), together accounting for 72.4% of all City View residents.
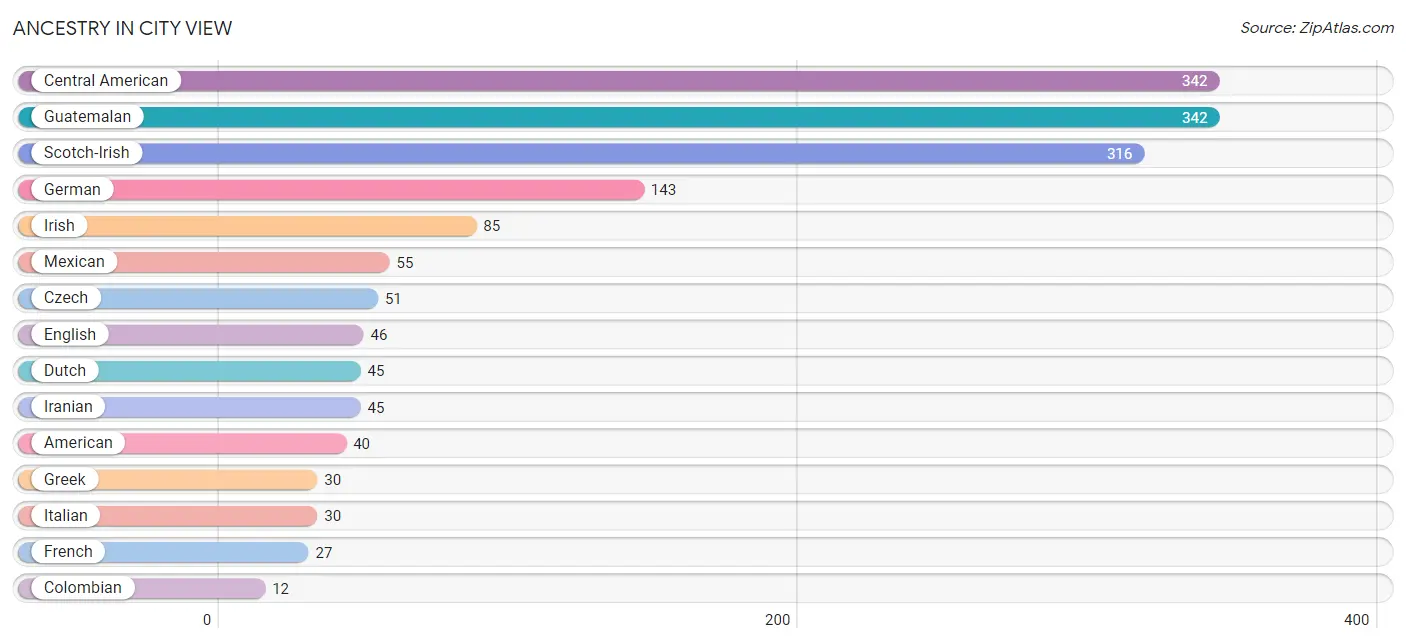
| Ancestry | # Population | % Population |
| American | 40 | 2.4% |
| Central American | 342 | 20.2% |
| Colombian | 12 | 0.7% |
| Czech | 51 | 3.0% |
| Dutch | 45 | 2.6% |
| English | 46 | 2.7% |
| French | 27 | 1.6% |
| German | 143 | 8.4% |
| Greek | 30 | 1.8% |
| Guatemalan | 342 | 20.2% |
| Iranian | 45 | 2.6% |
| Irish | 85 | 5.0% |
| Italian | 30 | 1.8% |
| Mexican | 55 | 3.2% |
| Scotch-Irish | 316 | 18.6% |
| South American | 12 | 0.7% | View All 16 Rows |
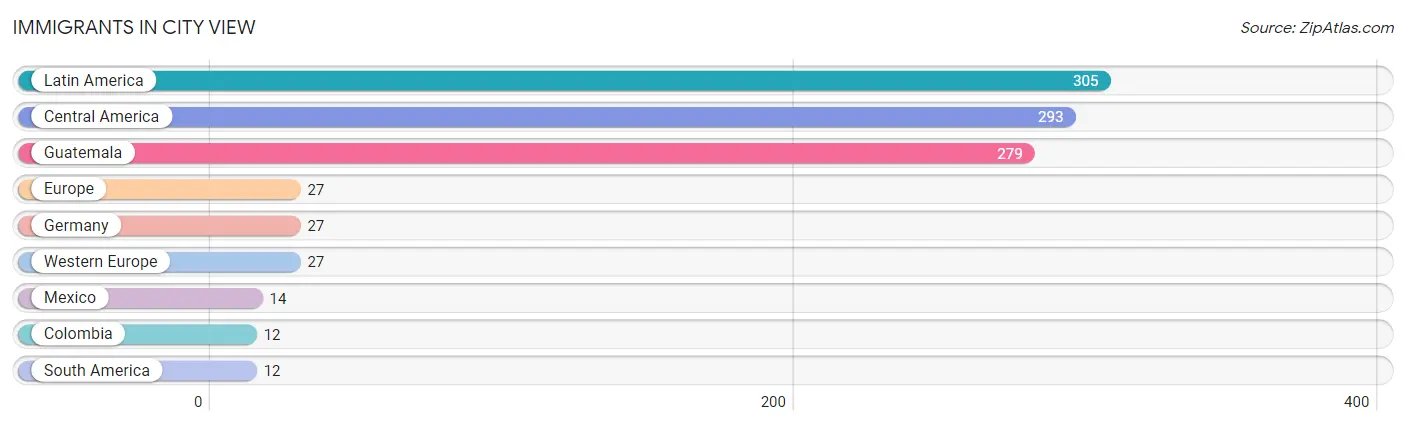
Immigrants in City View
The most numerous immigrant groups reported in City View came from Latin America (305 | 18.0%), Central America (293 | 17.3%), Guatemala (279 | 16.5%), Europe (27 | 1.6%), and Germany (27 | 1.6%), together accounting for 54.9% of all City View residents.
| Immigration Origin | # Population | % Population |
| Central America | 293 | 17.3% |
| Colombia | 12 | 0.7% |
| Europe | 27 | 1.6% |
| Germany | 27 | 1.6% |
| Guatemala | 279 | 16.5% |
| Latin America | 305 | 18.0% |
| Mexico | 14 | 0.8% |
| South America | 12 | 0.7% |
| Western Europe | 27 | 1.6% | View All 9 Rows |
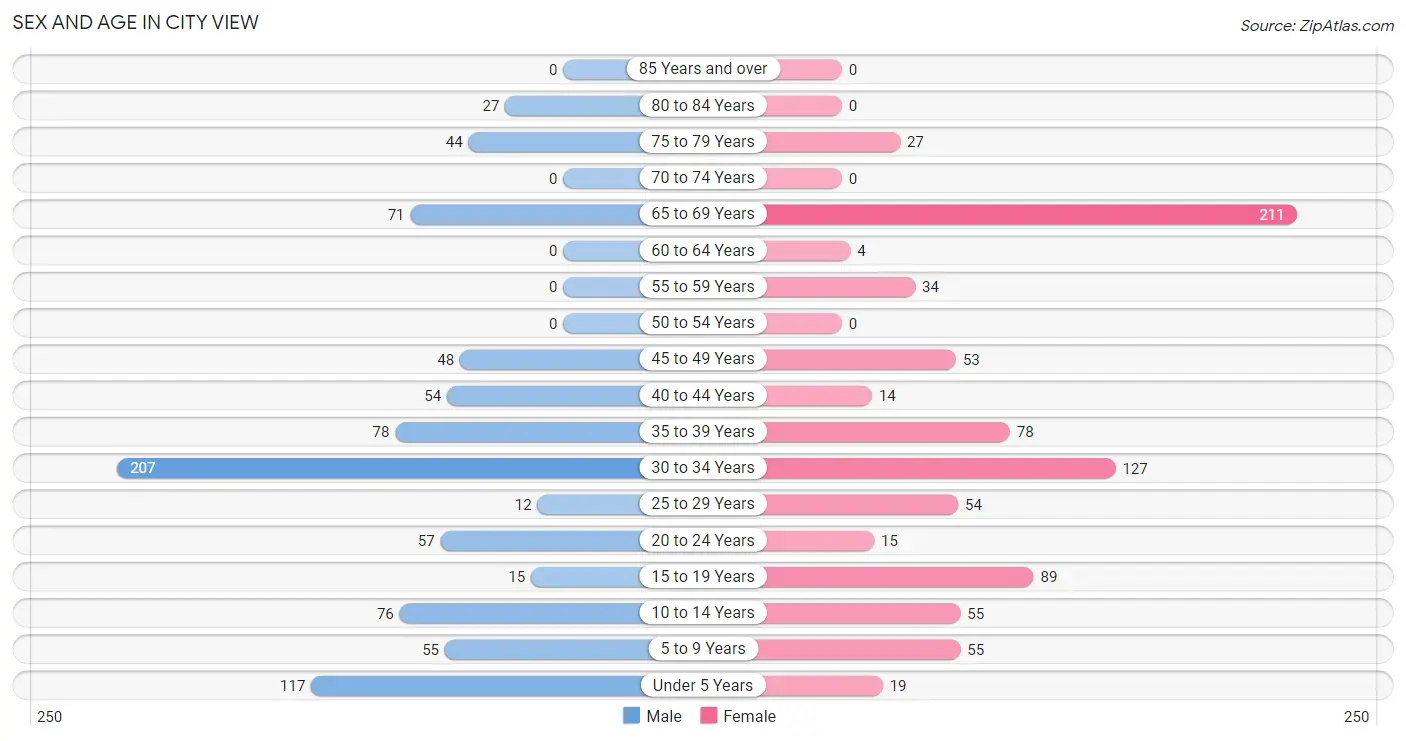
Sex and Age in City View
Sex and Age in City View
The most populous age groups in City View are 30 to 34 Years (207 | 24.0%) for men and 65 to 69 Years (211 | 25.3%) for women.
| Age Bracket | Male | Female |
| Under 5 Years | 117 (13.6%) | 19 (2.3%) |
| 5 to 9 Years | 55 (6.4%) | 55 (6.6%) |
| 10 to 14 Years | 76 (8.8%) | 55 (6.6%) |
| 15 to 19 Years | 15 (1.7%) | 89 (10.7%) |
| 20 to 24 Years | 57 (6.6%) | 15 (1.8%) |
| 25 to 29 Years | 12 (1.4%) | 54 (6.5%) |
| 30 to 34 Years | 207 (24.0%) | 127 (15.2%) |
| 35 to 39 Years | 78 (9.1%) | 78 (9.3%) |
| 40 to 44 Years | 54 (6.3%) | 14 (1.7%) |
| 45 to 49 Years | 48 (5.6%) | 53 (6.4%) |
| 50 to 54 Years | 0 (0.0%) | 0 (0.0%) |
| 55 to 59 Years | 0 (0.0%) | 34 (4.1%) |
| 60 to 64 Years | 0 (0.0%) | 4 (0.5%) |
| 65 to 69 Years | 71 (8.3%) | 211 (25.3%) |
| 70 to 74 Years | 0 (0.0%) | 0 (0.0%) |
| 75 to 79 Years | 44 (5.1%) | 27 (3.2%) |
| 80 to 84 Years | 27 (3.1%) | 0 (0.0%) |
| 85 Years and over | 0 (0.0%) | 0 (0.0%) |
| Total | 861 (100.0%) | 835 (100.0%) |
Families and Households in City View
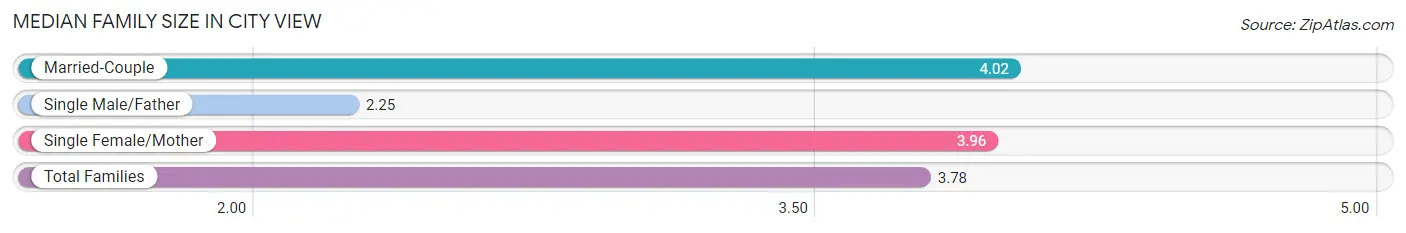
Median Family Size in City View
The median family size in City View is 3.78 persons per family, with married-couple families (211 | 59.1%) accounting for the largest median family size of 4.02 persons per family. On the other hand, single male/father families (44 | 12.3%) represent the smallest median family size with 2.25 persons per family.
| Family Type | # Families | Family Size |
| Married-Couple | 211 (59.1%) | 4.02 |
| Single Male/Father | 44 (12.3%) | 2.25 |
| Single Female/Mother | 102 (28.6%) | 3.96 |
| Total Families | 357 (100.0%) | 3.78 |
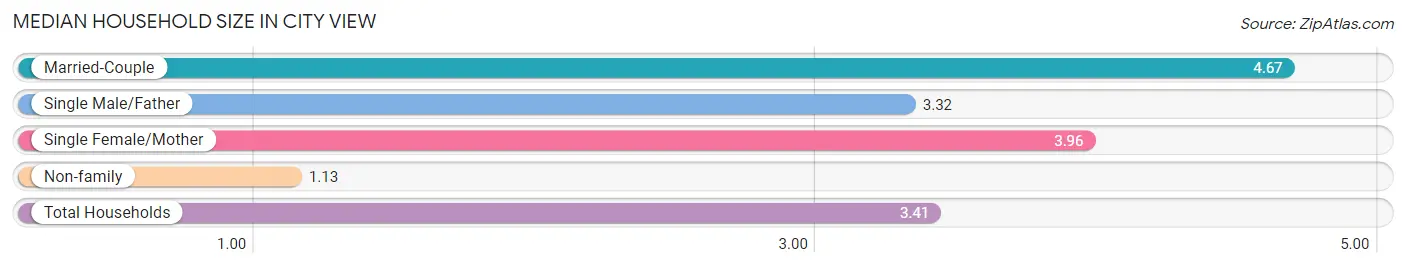
Median Household Size in City View
The median household size in City View is 3.41 persons per household, with married-couple households (211 | 42.4%) accounting for the largest median household size of 4.67 persons per household. non-family households (141 | 28.3%) represent the smallest median household size with 1.13 persons per household.
| Household Type | # Households | Household Size |
| Married-Couple | 211 (42.4%) | 4.67 |
| Single Male/Father | 44 (8.8%) | 3.32 |
| Single Female/Mother | 102 (20.5%) | 3.96 |
| Non-family | 141 (28.3%) | 1.13 |
| Total Households | 498 (100.0%) | 3.41 |
Household Size by Marriage Status in City View
Out of a total of 498 households in City View, 357 (71.7%) are family households, while 141 (28.3%) are nonfamily households. The most numerous type of family households are 5-person households, comprising 118, and the most common type of nonfamily households are 1-person households, comprising 120.
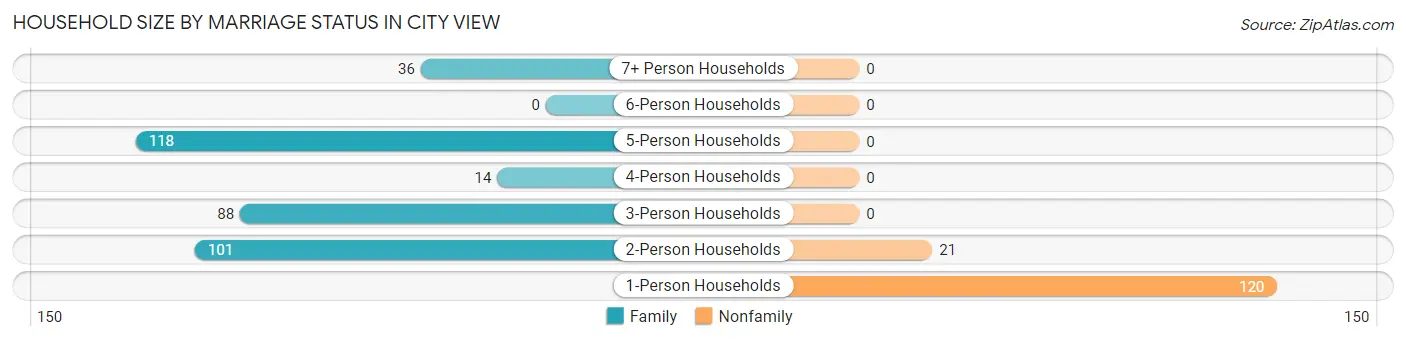
| Household Size | Family Households | Nonfamily Households |
| 1-Person Households | - | 120 (24.1%) |
| 2-Person Households | 101 (20.3%) | 21 (4.2%) |
| 3-Person Households | 88 (17.7%) | 0 (0.0%) |
| 4-Person Households | 14 (2.8%) | 0 (0.0%) |
| 5-Person Households | 118 (23.7%) | 0 (0.0%) |
| 6-Person Households | 0 (0.0%) | 0 (0.0%) |
| 7+ Person Households | 36 (7.2%) | 0 (0.0%) |
| Total | 357 (71.7%) | 141 (28.3%) |
Female Fertility in City View
Fertility by Age in City View
| Age Bracket | Women with Births | Births / 1,000 Women |
| 15 to 19 years | 0 (0.0%) | 0.0 |
| 20 to 34 years | 0 (0.0%) | 0.0 |
| 35 to 50 years | 0 (0.0%) | 0.0 |
| Total | 0 (0.0%) | 0.0 |
Fertility by Age by Marriage Status in City View
| Age Bracket | Married | Unmarried |
| 15 to 19 years | 0 (0.0%) | 0 (0.0%) |
| 20 to 34 years | 0 (0.0%) | 0 (0.0%) |
| 35 to 50 years | 0 (0.0%) | 0 (0.0%) |
| Total | 0 (0.0%) | 0 (0.0%) |
Fertility by Education in City View
| Educational Attainment | Women with Births | Births / 1,000 Women |
| Less than High School | 0 (0.0%) | 0.0 |
| High School Diploma | 0 (0.0%) | 0.0 |
| College or Associate's Degree | 0 (0.0%) | 0.0 |
| Bachelor's Degree | 0 (0.0%) | 0.0 |
| Graduate Degree | 0 (0.0%) | 0.0 |
| Total | 0 (0.0%) | 0.0 |
Fertility by Education by Marriage Status in City View
| Educational Attainment | Married | Unmarried |
| Less than High School | 0 (0.0%) | 0 (0.0%) |
| High School Diploma | 0 (0.0%) | 0 (0.0%) |
| College or Associate's Degree | 0 (0.0%) | 0 (0.0%) |
| Bachelor's Degree | 0 (0.0%) | 0 (0.0%) |
| Graduate Degree | 0 (0.0%) | 0 (0.0%) |
| Total | 0 (0.0%) | 0 (0.0%) |
Employment Characteristics in City View
Employment by Class of Employer in City View
Among the 507 employed individuals in City View, private company employees (389 | 76.7%), self-employed (not incorporated) (45 | 8.9%), and local government employees (42 | 8.3%) make up the most common classes of employment.
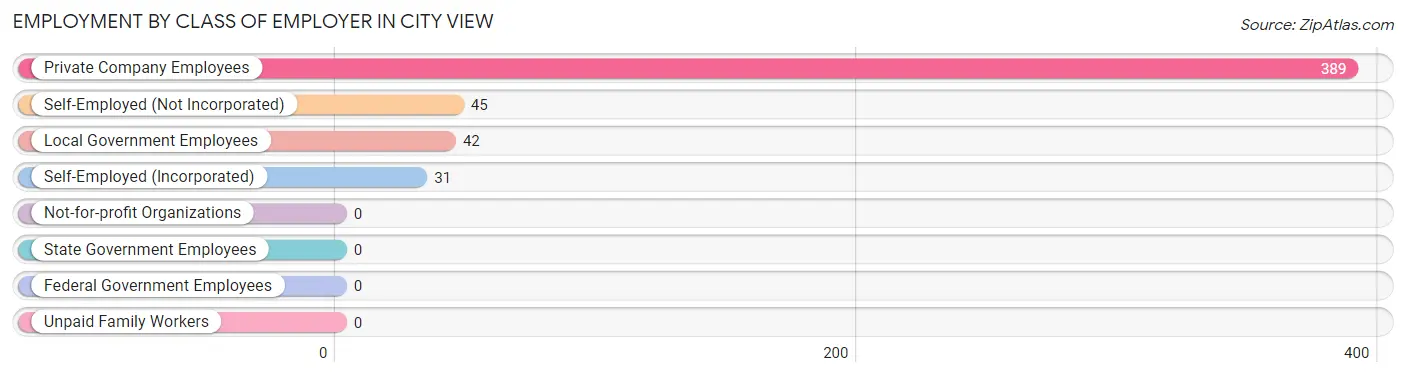
| Employer Class | # Employees | % Employees |
| Private Company Employees | 389 | 76.7% |
| Self-Employed (Incorporated) | 31 | 6.1% |
| Self-Employed (Not Incorporated) | 45 | 8.9% |
| Not-for-profit Organizations | 0 | 0.0% |
| Local Government Employees | 42 | 8.3% |
| State Government Employees | 0 | 0.0% |
| Federal Government Employees | 0 | 0.0% |
| Unpaid Family Workers | 0 | 0.0% |
| Total | 507 | 100.0% |
Employment Status by Age in City View
According to the labor force statistics for City View, out of the total population over 16 years of age (1,265), 42.9% or 543 individuals are in the labor force, with 6.6% or 36 of them unemployed. The age group with the highest labor force participation rate is 20 to 24 years, with 100.0% or 72 individuals in the labor force. Within the labor force, the 16 to 19 years age range has the highest percentage of unemployed individuals, with 100.0% or 15 of them being unemployed.
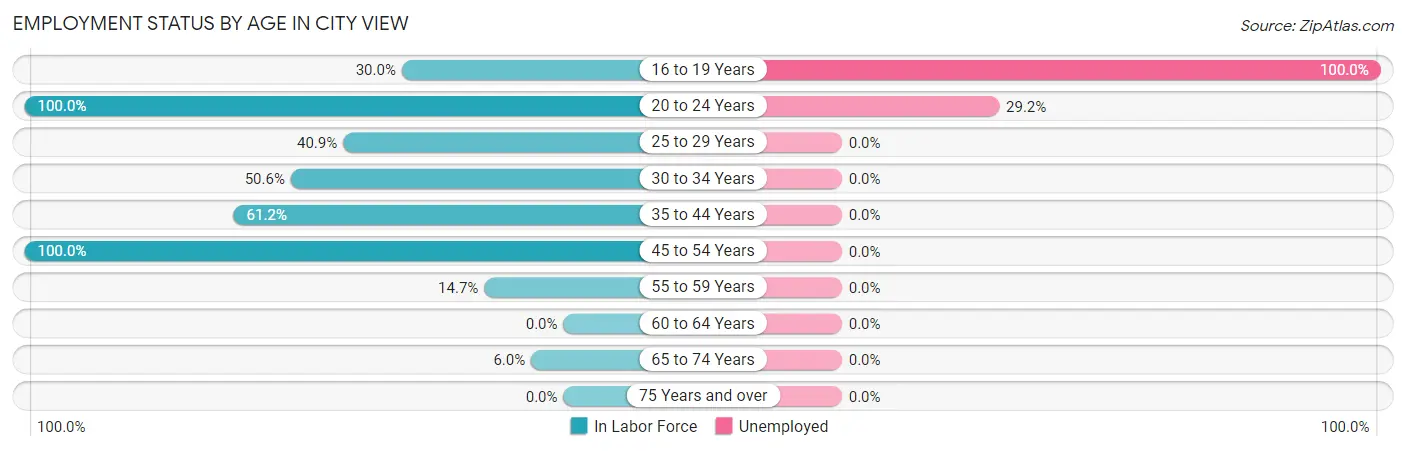
| Age Bracket | In Labor Force | Unemployed |
| 16 to 19 Years | 15 (30.0%) | 15 (100.0%) |
| 20 to 24 Years | 72 (100.0%) | 21 (29.2%) |
| 25 to 29 Years | 27 (40.9%) | 0 (0.0%) |
| 30 to 34 Years | 169 (50.6%) | 0 (0.0%) |
| 35 to 44 Years | 137 (61.2%) | 0 (0.0%) |
| 45 to 54 Years | 101 (100.0%) | 0 (0.0%) |
| 55 to 59 Years | 5 (14.7%) | 0 (0.0%) |
| 60 to 64 Years | 0 (0.0%) | 0 (0.0%) |
| 65 to 74 Years | 17 (6.0%) | 0 (0.0%) |
| 75 Years and over | 0 (0.0%) | 0 (0.0%) |
| Total | 543 (42.9%) | 36 (6.6%) |
Employment Status by Educational Attainment in City View
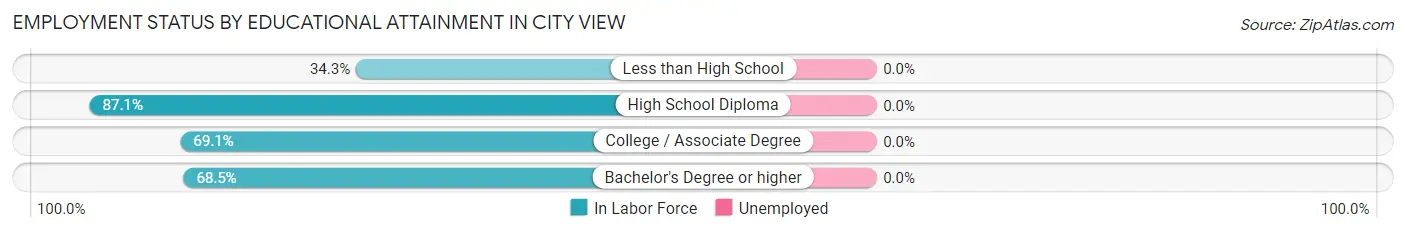
| Educational Attainment | In Labor Force | Unemployed |
| Less than High School | 112 (34.3%) | 0 (0.0%) |
| High School Diploma | 128 (87.1%) | 0 (0.0%) |
| College / Associate Degree | 114 (69.1%) | 0 (0.0%) |
| Bachelor's Degree or higher | 85 (68.5%) | 0 (0.0%) |
| Total | 439 (57.5%) | 0 (0.0%) |
Employment Occupations by Sex in City View
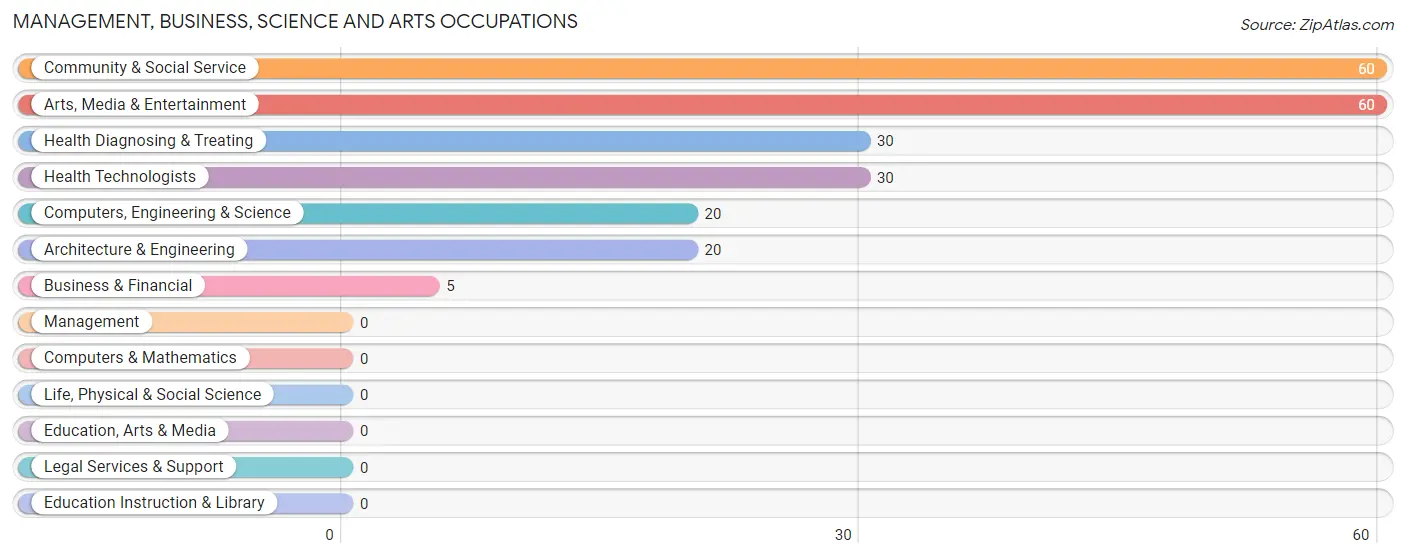
Management, Business, Science and Arts Occupations
The most common Management, Business, Science and Arts occupations in City View are Community & Social Service (60 | 11.8%), Arts, Media & Entertainment (60 | 11.8%), Health Diagnosing & Treating (30 | 5.9%), Health Technologists (30 | 5.9%), and Computers, Engineering & Science (20 | 3.9%).
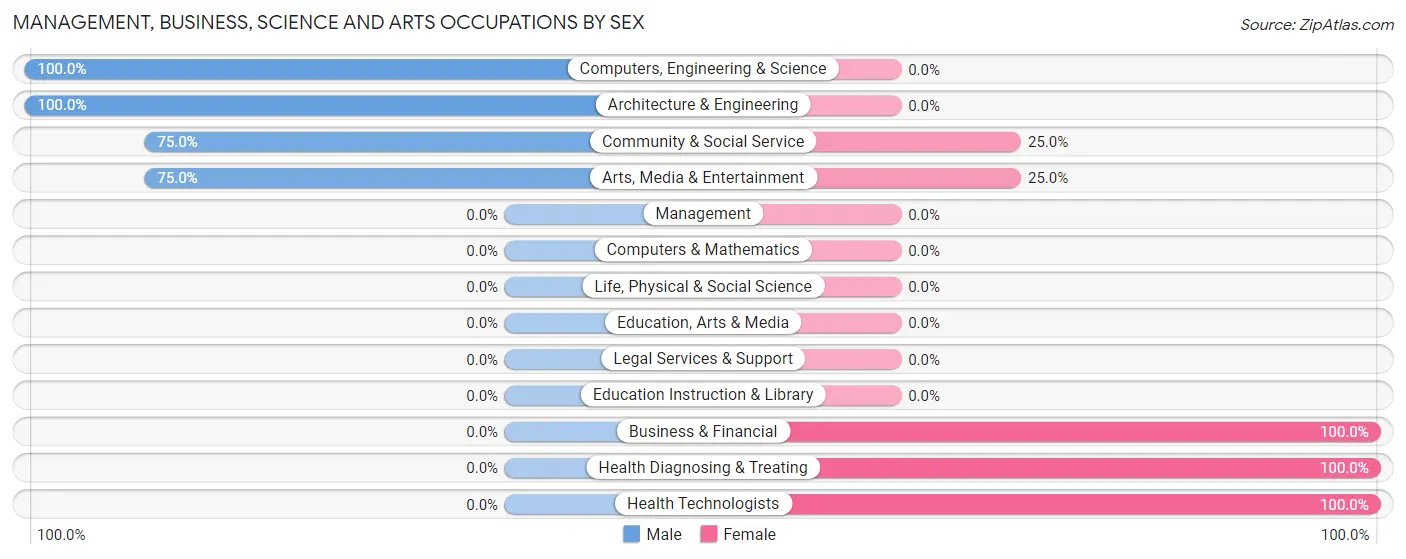
Management, Business, Science and Arts Occupations by Sex
Within the Management, Business, Science and Arts occupations in City View, the most male-oriented occupations are Computers, Engineering & Science (100.0%), Architecture & Engineering (100.0%), and Community & Social Service (75.0%), while the most female-oriented occupations are Business & Financial (100.0%), Health Diagnosing & Treating (100.0%), and Health Technologists (100.0%).
| Occupation | Male | Female |
| Management | 0 (0.0%) | 0 (0.0%) |
| Business & Financial | 0 (0.0%) | 5 (100.0%) |
| Computers, Engineering & Science | 20 (100.0%) | 0 (0.0%) |
| Computers & Mathematics | 0 (0.0%) | 0 (0.0%) |
| Architecture & Engineering | 20 (100.0%) | 0 (0.0%) |
| Life, Physical & Social Science | 0 (0.0%) | 0 (0.0%) |
| Community & Social Service | 45 (75.0%) | 15 (25.0%) |
| Education, Arts & Media | 0 (0.0%) | 0 (0.0%) |
| Legal Services & Support | 0 (0.0%) | 0 (0.0%) |
| Education Instruction & Library | 0 (0.0%) | 0 (0.0%) |
| Arts, Media & Entertainment | 45 (75.0%) | 15 (25.0%) |
| Health Diagnosing & Treating | 0 (0.0%) | 30 (100.0%) |
| Health Technologists | 0 (0.0%) | 30 (100.0%) |
| Total (Category) | 65 (56.5%) | 50 (43.5%) |
| Total (Overall) | 330 (65.1%) | 177 (34.9%) |
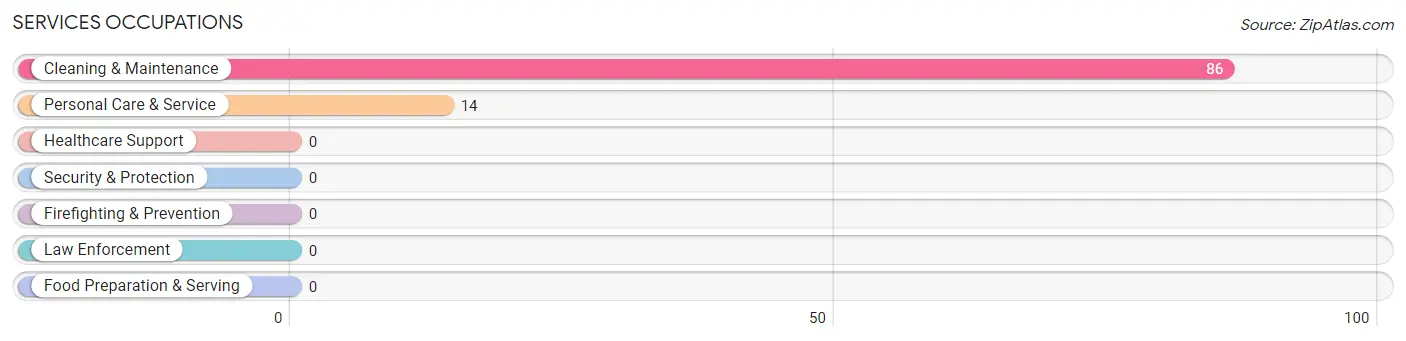
Services Occupations
The most common Services occupations in City View are Cleaning & Maintenance (86 | 17.0%), and Personal Care & Service (14 | 2.8%).
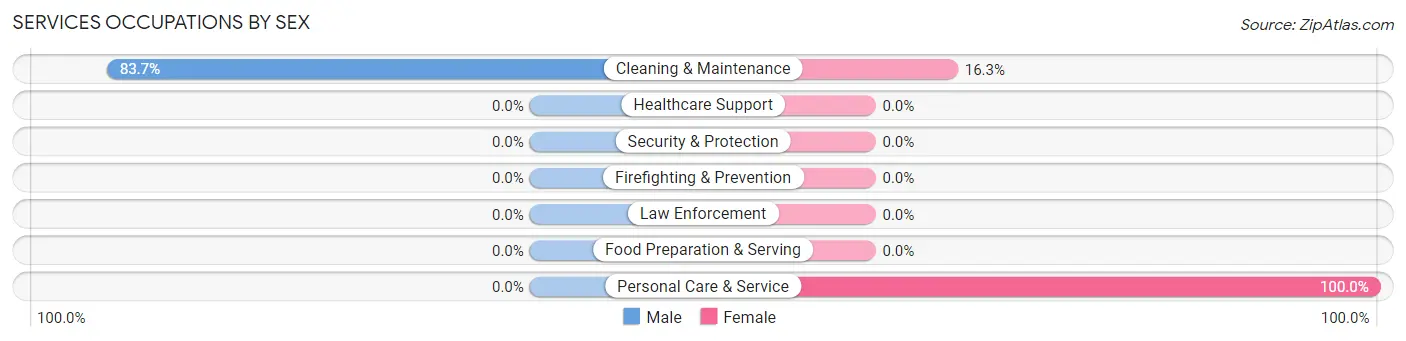
Services Occupations by Sex
| Occupation | Male | Female |
| Healthcare Support | 0 (0.0%) | 0 (0.0%) |
| Security & Protection | 0 (0.0%) | 0 (0.0%) |
| Firefighting & Prevention | 0 (0.0%) | 0 (0.0%) |
| Law Enforcement | 0 (0.0%) | 0 (0.0%) |
| Food Preparation & Serving | 0 (0.0%) | 0 (0.0%) |
| Cleaning & Maintenance | 72 (83.7%) | 14 (16.3%) |
| Personal Care & Service | 0 (0.0%) | 14 (100.0%) |
| Total (Category) | 72 (72.0%) | 28 (28.0%) |
| Total (Overall) | 330 (65.1%) | 177 (34.9%) |
Sales and Office Occupations
The most common Sales and Office occupations in City View are Sales & Related (103 | 20.3%), and Office & Administration (15 | 3.0%).
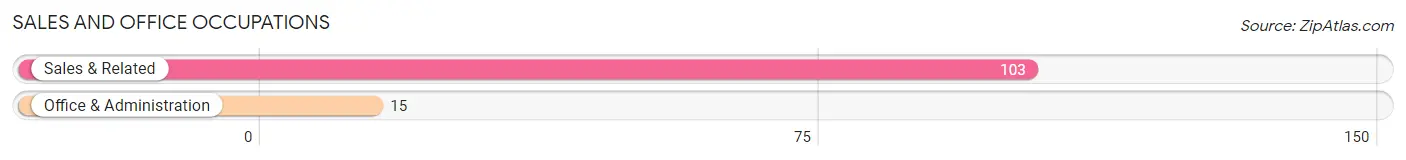
Sales and Office Occupations by Sex

| Occupation | Male | Female |
| Sales & Related | 19 (18.4%) | 84 (81.6%) |
| Office & Administration | 0 (0.0%) | 15 (100.0%) |
| Total (Category) | 19 (16.1%) | 99 (83.9%) |
| Total (Overall) | 330 (65.1%) | 177 (34.9%) |
Natural Resources, Construction and Maintenance Occupations
The most common Natural Resources, Construction and Maintenance occupations in City View are Construction & Extraction (93 | 18.3%), and Installation, Maintenance & Repair (55 | 10.8%).
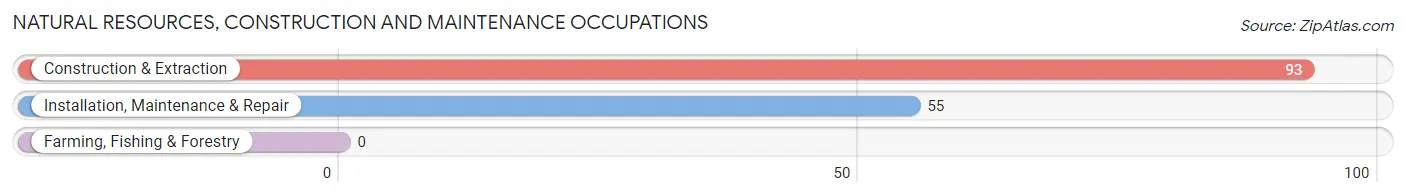
Natural Resources, Construction and Maintenance Occupations by Sex

| Occupation | Male | Female |
| Farming, Fishing & Forestry | 0 (0.0%) | 0 (0.0%) |
| Construction & Extraction | 93 (100.0%) | 0 (0.0%) |
| Installation, Maintenance & Repair | 55 (100.0%) | 0 (0.0%) |
| Total (Category) | 148 (100.0%) | 0 (0.0%) |
| Total (Overall) | 330 (65.1%) | 177 (34.9%) |
Production, Transportation and Moving Occupations
The most common Production, Transportation and Moving occupations in City View are , and Production (26 | 5.1%).
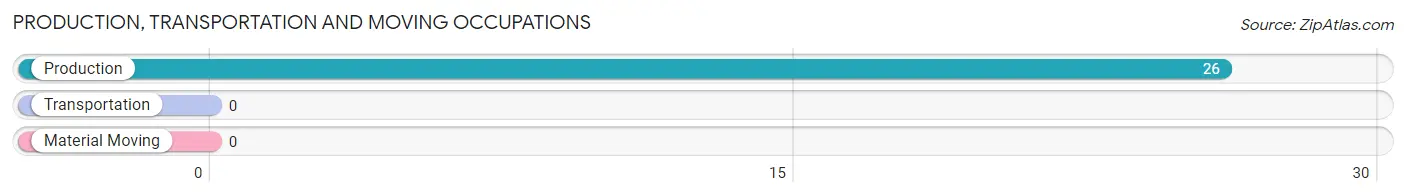
Production, Transportation and Moving Occupations by Sex
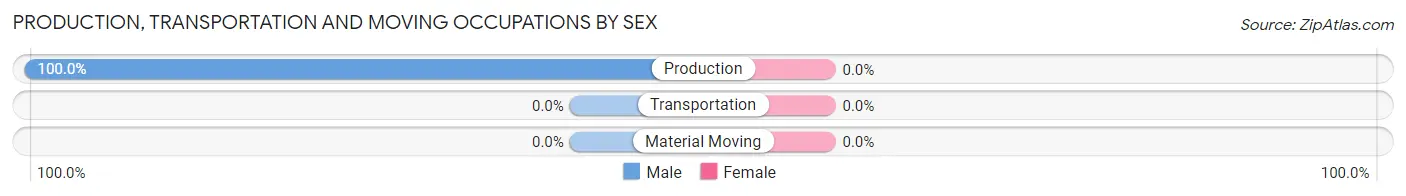
| Occupation | Male | Female |
| Production | 26 (100.0%) | 0 (0.0%) |
| Transportation | 0 (0.0%) | 0 (0.0%) |
| Material Moving | 0 (0.0%) | 0 (0.0%) |
| Total (Category) | 26 (100.0%) | 0 (0.0%) |
| Total (Overall) | 330 (65.1%) | 177 (34.9%) |
Employment Industries by Sex in City View
Employment Industries in City View
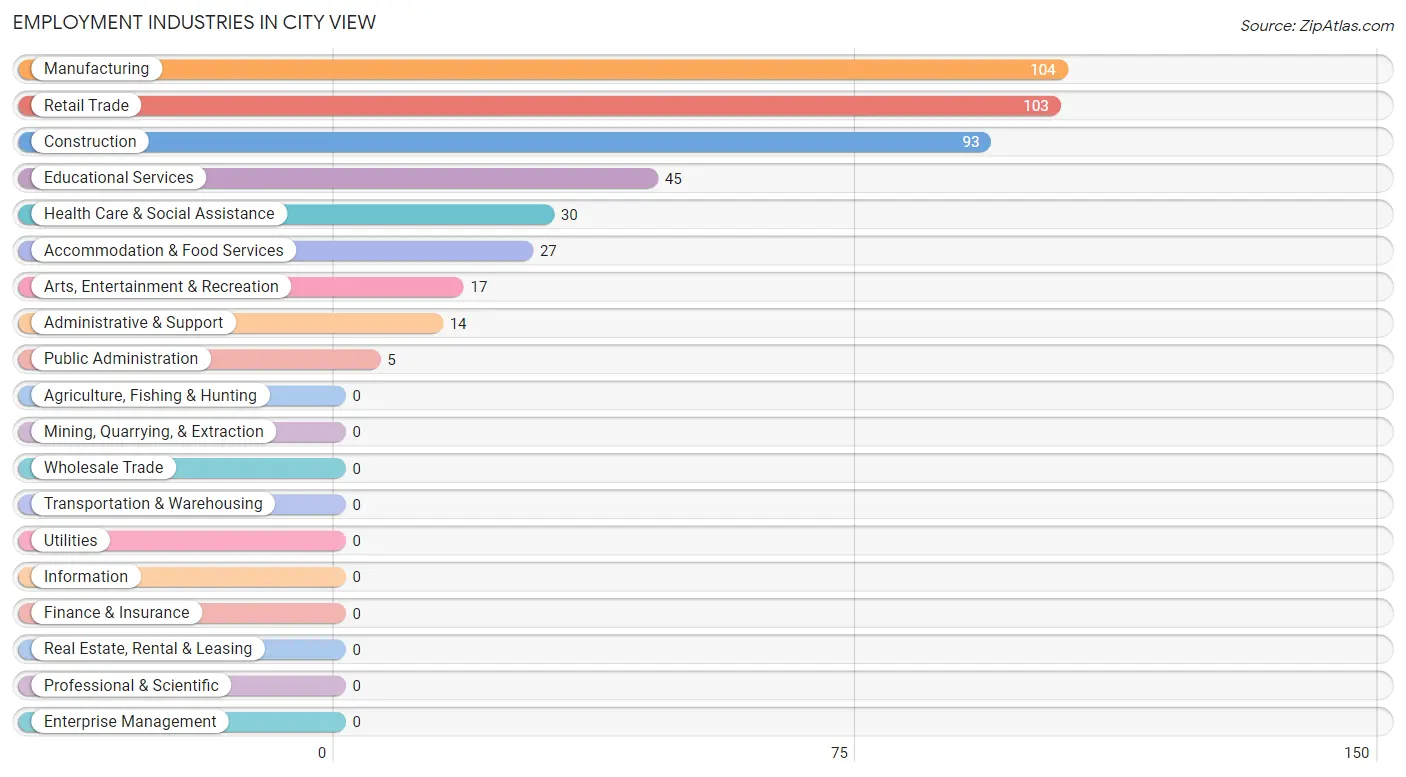
The major employment industries in City View include Manufacturing (104 | 20.5%), Retail Trade (103 | 20.3%), Construction (93 | 18.3%), Educational Services (45 | 8.9%), and Health Care & Social Assistance (30 | 5.9%).
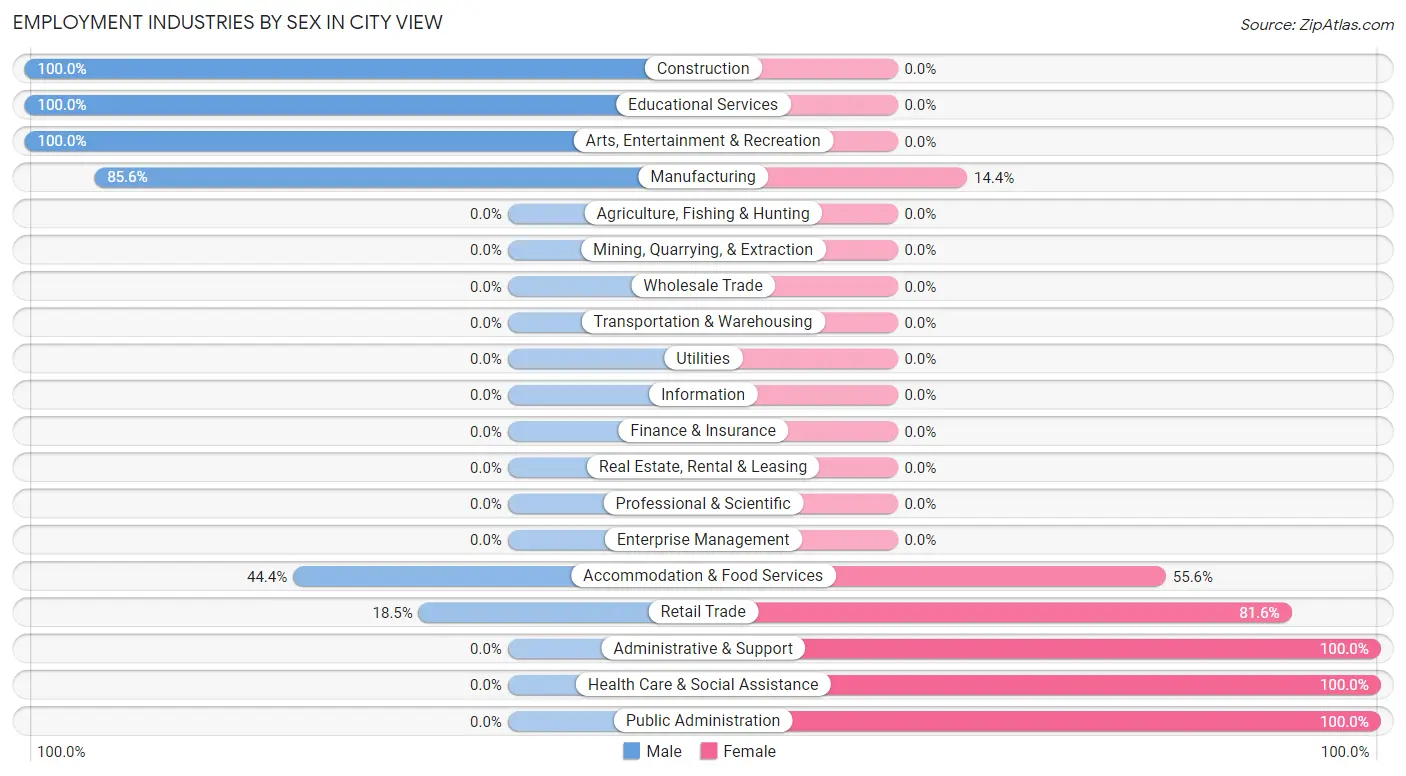
Employment Industries by Sex in City View
The City View industries that see more men than women are Construction (100.0%), Educational Services (100.0%), and Arts, Entertainment & Recreation (100.0%), whereas the industries that tend to have a higher number of women are Administrative & Support (100.0%), Health Care & Social Assistance (100.0%), and Public Administration (100.0%).
| Industry | Male | Female |
| Agriculture, Fishing & Hunting | 0 (0.0%) | 0 (0.0%) |
| Mining, Quarrying, & Extraction | 0 (0.0%) | 0 (0.0%) |
| Construction | 93 (100.0%) | 0 (0.0%) |
| Manufacturing | 89 (85.6%) | 15 (14.4%) |
| Wholesale Trade | 0 (0.0%) | 0 (0.0%) |
| Retail Trade | 19 (18.4%) | 84 (81.6%) |
| Transportation & Warehousing | 0 (0.0%) | 0 (0.0%) |
| Utilities | 0 (0.0%) | 0 (0.0%) |
| Information | 0 (0.0%) | 0 (0.0%) |
| Finance & Insurance | 0 (0.0%) | 0 (0.0%) |
| Real Estate, Rental & Leasing | 0 (0.0%) | 0 (0.0%) |
| Professional & Scientific | 0 (0.0%) | 0 (0.0%) |
| Enterprise Management | 0 (0.0%) | 0 (0.0%) |
| Administrative & Support | 0 (0.0%) | 14 (100.0%) |
| Educational Services | 45 (100.0%) | 0 (0.0%) |
| Health Care & Social Assistance | 0 (0.0%) | 30 (100.0%) |
| Arts, Entertainment & Recreation | 17 (100.0%) | 0 (0.0%) |
| Accommodation & Food Services | 12 (44.4%) | 15 (55.6%) |
| Public Administration | 0 (0.0%) | 5 (100.0%) |
| Total | 330 (65.1%) | 177 (34.9%) |
Education in City View
School Enrollment in City View
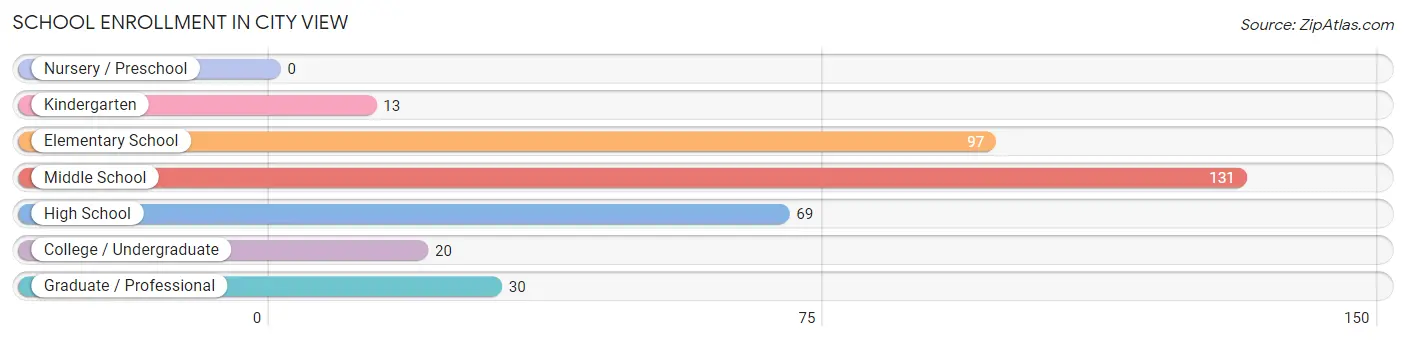
The most common levels of schooling among the 360 students in City View are middle school (131 | 36.4%), elementary school (97 | 26.9%), and high school (69 | 19.2%).
| School Level | # Students | % Students |
| Nursery / Preschool | 0 | 0.0% |
| Kindergarten | 13 | 3.6% |
| Elementary School | 97 | 26.9% |
| Middle School | 131 | 36.4% |
| High School | 69 | 19.2% |
| College / Undergraduate | 20 | 5.6% |
| Graduate / Professional | 30 | 8.3% |
| Total | 360 | 100.0% |
School Enrollment by Age by Funding Source in City View
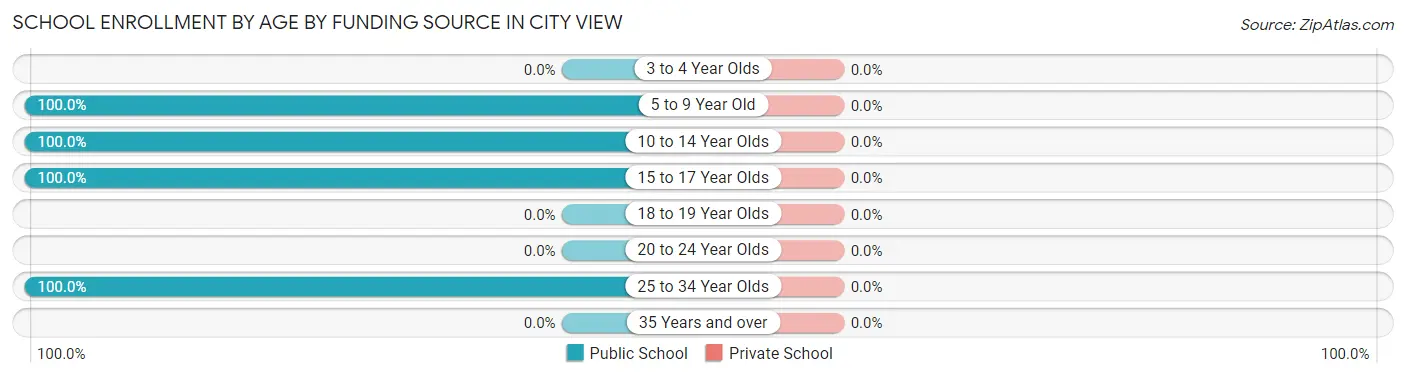
| Age Bracket | Public School | Private School |
| 3 to 4 Year Olds | 0 (0.0%) | 0 (0.0%) |
| 5 to 9 Year Old | 110 (100.0%) | 0 (0.0%) |
| 10 to 14 Year Olds | 131 (100.0%) | 0 (0.0%) |
| 15 to 17 Year Olds | 69 (100.0%) | 0 (0.0%) |
| 18 to 19 Year Olds | 0 (0.0%) | 0 (0.0%) |
| 20 to 24 Year Olds | 0 (0.0%) | 0 (0.0%) |
| 25 to 34 Year Olds | 50 (100.0%) | 0 (0.0%) |
| 35 Years and over | 0 (0.0%) | 0 (0.0%) |
| Total | 360 (100.0%) | 0 (0.0%) |
Educational Attainment by Field of Study in City View
Business (50 | 40.3%), bio, nature & agricultural (39 | 31.5%), arts & humanities (30 | 24.2%), and social sciences (5 | 4.0%) are the most common fields of study among 124 individuals in City View who have obtained a bachelor's degree or higher.
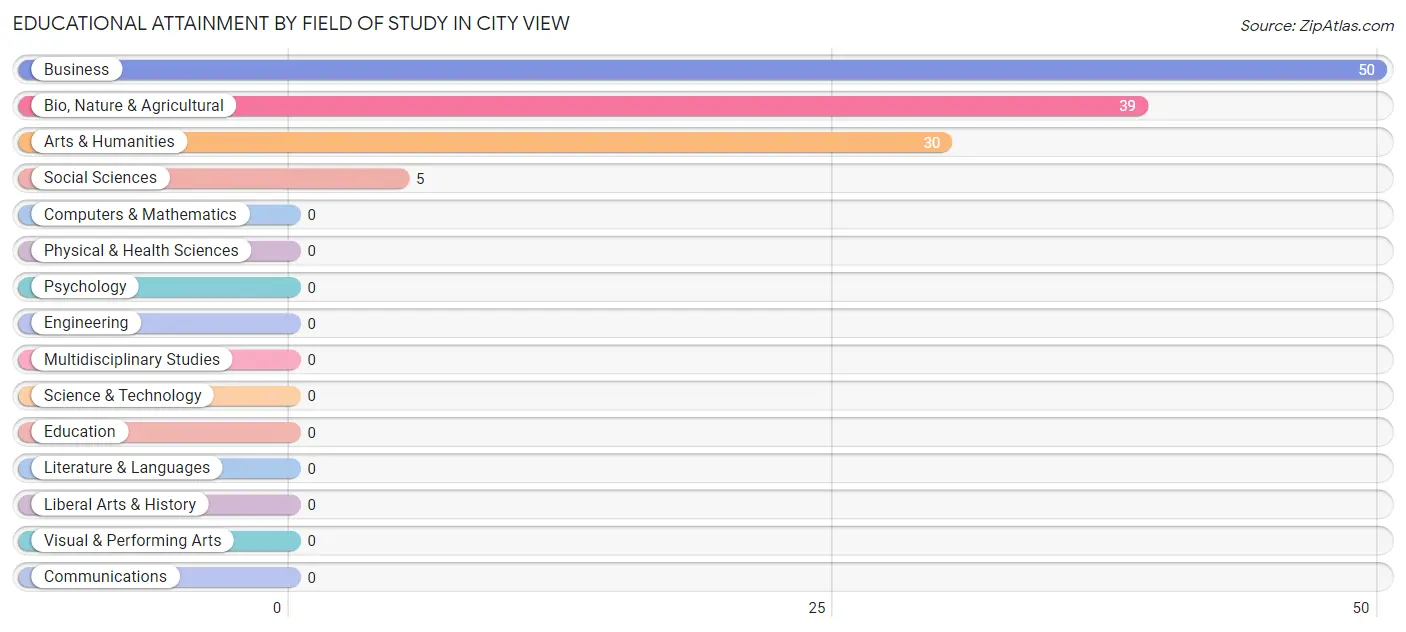
| Field of Study | # Graduates | % Graduates |
| Computers & Mathematics | 0 | 0.0% |
| Bio, Nature & Agricultural | 39 | 31.5% |
| Physical & Health Sciences | 0 | 0.0% |
| Psychology | 0 | 0.0% |
| Social Sciences | 5 | 4.0% |
| Engineering | 0 | 0.0% |
| Multidisciplinary Studies | 0 | 0.0% |
| Science & Technology | 0 | 0.0% |
| Business | 50 | 40.3% |
| Education | 0 | 0.0% |
| Literature & Languages | 0 | 0.0% |
| Liberal Arts & History | 0 | 0.0% |
| Visual & Performing Arts | 0 | 0.0% |
| Communications | 0 | 0.0% |
| Arts & Humanities | 30 | 24.2% |
| Total | 124 | 100.0% |
Transportation & Commute in City View
Vehicle Availability by Sex in City View
The most prevalent vehicle ownership categories in City View are males with 2 vehicles (166, accounting for 50.3%) and females with 2 vehicles (81, making up 93.8%).
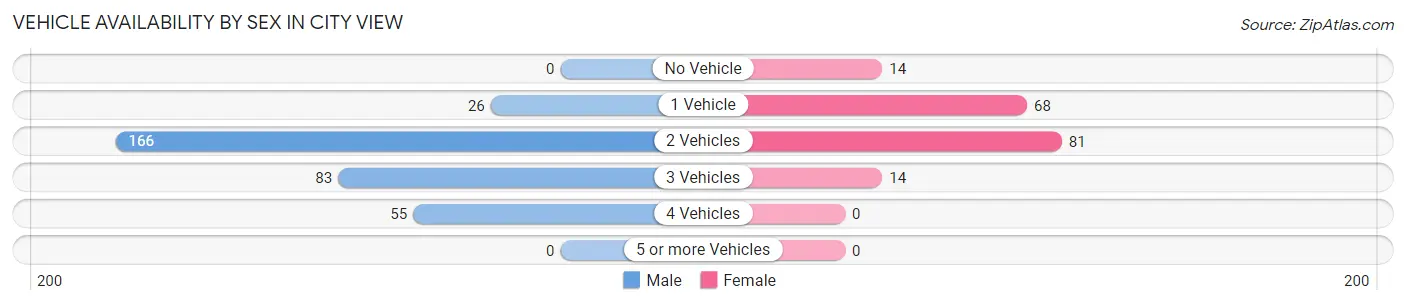
| Vehicles Available | Male | Female |
| No Vehicle | 0 (0.0%) | 14 (7.9%) |
| 1 Vehicle | 26 (7.9%) | 68 (38.4%) |
| 2 Vehicles | 166 (50.3%) | 81 (45.8%) |
| 3 Vehicles | 83 (25.2%) | 14 (7.9%) |
| 4 Vehicles | 55 (16.7%) | 0 (0.0%) |
| 5 or more Vehicles | 0 (0.0%) | 0 (0.0%) |
| Total | 330 (100.0%) | 177 (100.0%) |
Commute Time in City View
The most frequently occuring commute durations in City View are 15 to 19 minutes (252 commuters, 49.7%), 30 to 34 minutes (96 commuters, 18.9%), and 5 to 9 minutes (77 commuters, 15.2%).
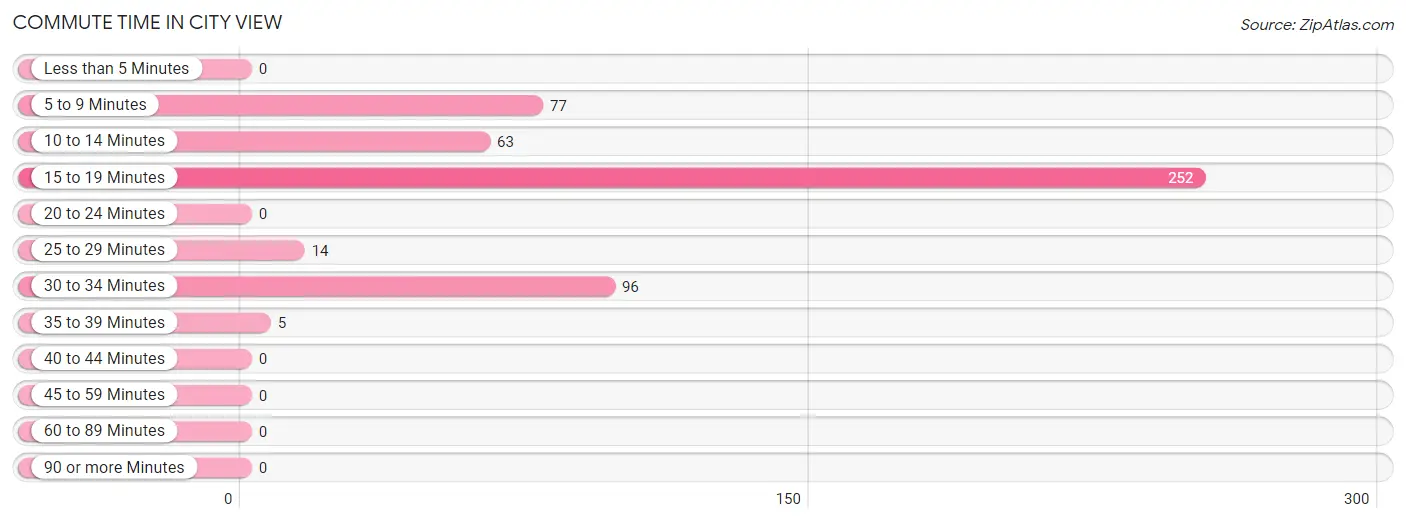
| Commute Time | # Commuters | % Commuters |
| Less than 5 Minutes | 0 | 0.0% |
| 5 to 9 Minutes | 77 | 15.2% |
| 10 to 14 Minutes | 63 | 12.4% |
| 15 to 19 Minutes | 252 | 49.7% |
| 20 to 24 Minutes | 0 | 0.0% |
| 25 to 29 Minutes | 14 | 2.8% |
| 30 to 34 Minutes | 96 | 18.9% |
| 35 to 39 Minutes | 5 | 1.0% |
| 40 to 44 Minutes | 0 | 0.0% |
| 45 to 59 Minutes | 0 | 0.0% |
| 60 to 89 Minutes | 0 | 0.0% |
| 90 or more Minutes | 0 | 0.0% |
Commute Time by Sex in City View
The most common commute times in City View are 15 to 19 minutes (138 commuters, 41.8%) for males and 15 to 19 minutes (114 commuters, 64.4%) for females.
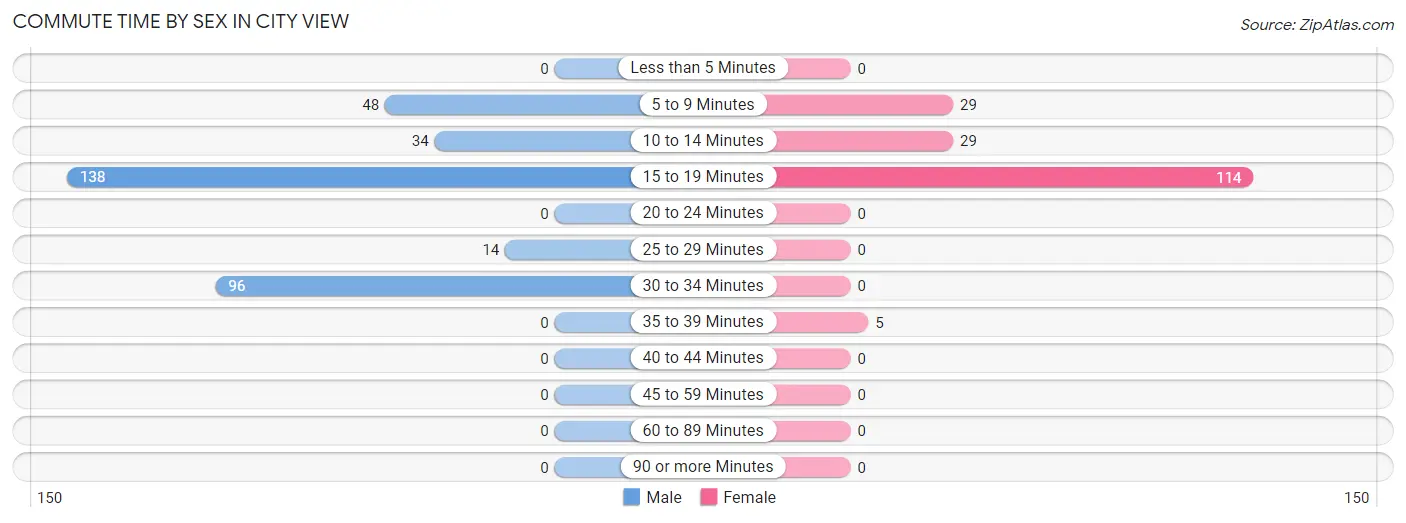
| Commute Time | Male | Female |
| Less than 5 Minutes | 0 (0.0%) | 0 (0.0%) |
| 5 to 9 Minutes | 48 (14.5%) | 29 (16.4%) |
| 10 to 14 Minutes | 34 (10.3%) | 29 (16.4%) |
| 15 to 19 Minutes | 138 (41.8%) | 114 (64.4%) |
| 20 to 24 Minutes | 0 (0.0%) | 0 (0.0%) |
| 25 to 29 Minutes | 14 (4.2%) | 0 (0.0%) |
| 30 to 34 Minutes | 96 (29.1%) | 0 (0.0%) |
| 35 to 39 Minutes | 0 (0.0%) | 5 (2.8%) |
| 40 to 44 Minutes | 0 (0.0%) | 0 (0.0%) |
| 45 to 59 Minutes | 0 (0.0%) | 0 (0.0%) |
| 60 to 89 Minutes | 0 (0.0%) | 0 (0.0%) |
| 90 or more Minutes | 0 (0.0%) | 0 (0.0%) |
Time of Departure to Work by Sex in City View
The most frequent times of departure to work in City View are 7:00 AM to 7:29 AM (212, 64.2%) for males and 12:00 AM to 4:59 AM (61, 34.5%) for females.
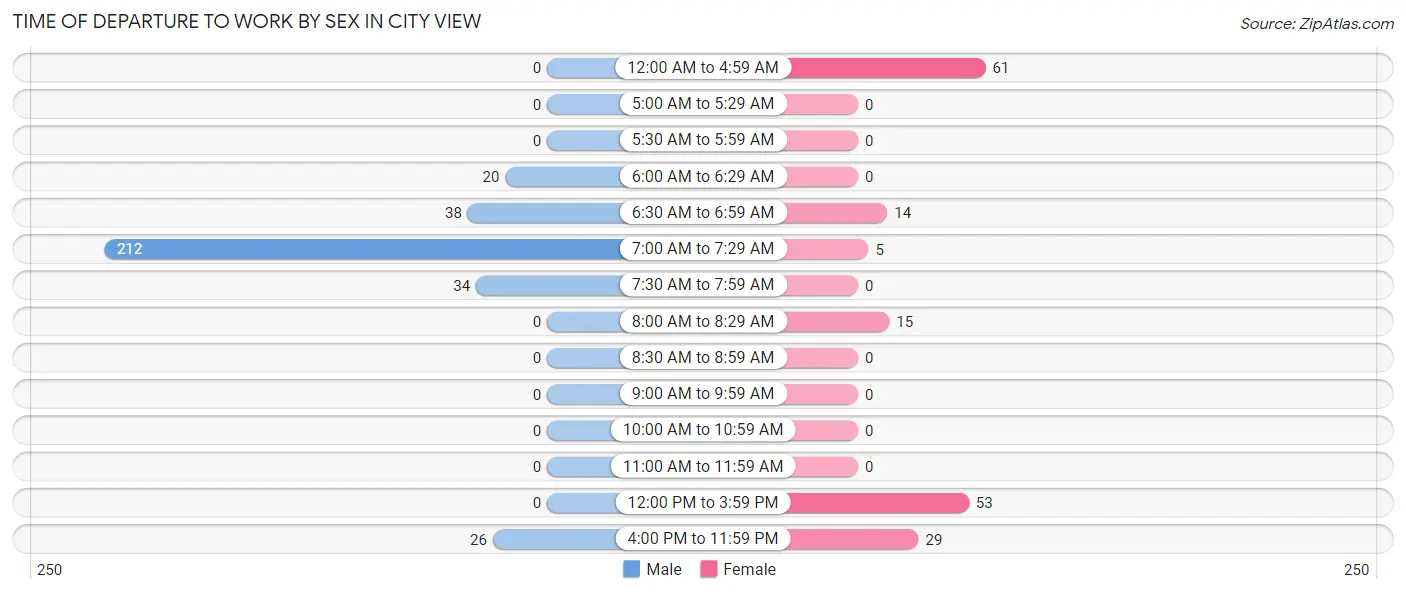
| Time of Departure | Male | Female |
| 12:00 AM to 4:59 AM | 0 (0.0%) | 61 (34.5%) |
| 5:00 AM to 5:29 AM | 0 (0.0%) | 0 (0.0%) |
| 5:30 AM to 5:59 AM | 0 (0.0%) | 0 (0.0%) |
| 6:00 AM to 6:29 AM | 20 (6.1%) | 0 (0.0%) |
| 6:30 AM to 6:59 AM | 38 (11.5%) | 14 (7.9%) |
| 7:00 AM to 7:29 AM | 212 (64.2%) | 5 (2.8%) |
| 7:30 AM to 7:59 AM | 34 (10.3%) | 0 (0.0%) |
| 8:00 AM to 8:29 AM | 0 (0.0%) | 15 (8.5%) |
| 8:30 AM to 8:59 AM | 0 (0.0%) | 0 (0.0%) |
| 9:00 AM to 9:59 AM | 0 (0.0%) | 0 (0.0%) |
| 10:00 AM to 10:59 AM | 0 (0.0%) | 0 (0.0%) |
| 11:00 AM to 11:59 AM | 0 (0.0%) | 0 (0.0%) |
| 12:00 PM to 3:59 PM | 0 (0.0%) | 53 (29.9%) |
| 4:00 PM to 11:59 PM | 26 (7.9%) | 29 (16.4%) |
| Total | 330 (100.0%) | 177 (100.0%) |
Housing Occupancy in City View
Occupancy by Ownership in City View
Of the total 498 dwellings in City View, owner-occupied units account for 267 (53.6%), while renter-occupied units make up 231 (46.4%).
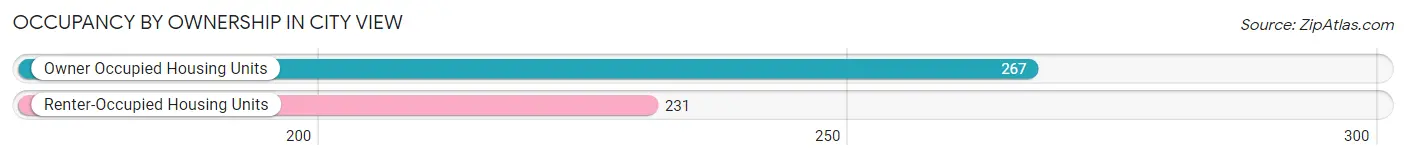
| Occupancy | # Housing Units | % Housing Units |
| Owner Occupied Housing Units | 267 | 53.6% |
| Renter-Occupied Housing Units | 231 | 46.4% |
| Total Occupied Housing Units | 498 | 100.0% |
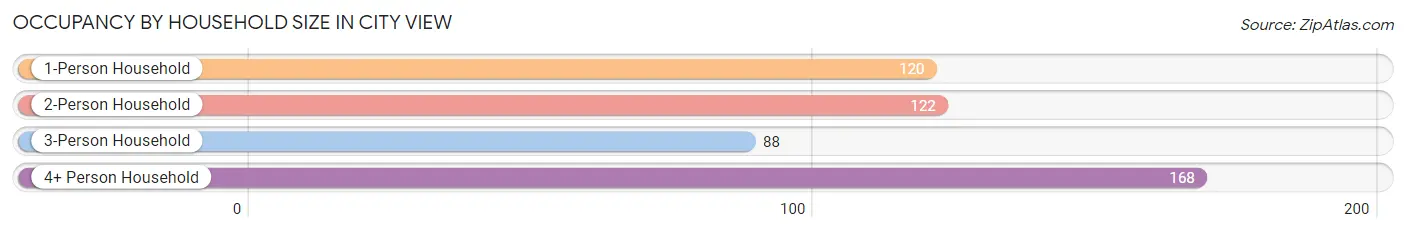
Occupancy by Household Size in City View
| Household Size | # Housing Units | % Housing Units |
| 1-Person Household | 120 | 24.1% |
| 2-Person Household | 122 | 24.5% |
| 3-Person Household | 88 | 17.7% |
| 4+ Person Household | 168 | 33.7% |
| Total Housing Units | 498 | 100.0% |
Occupancy by Ownership by Household Size in City View
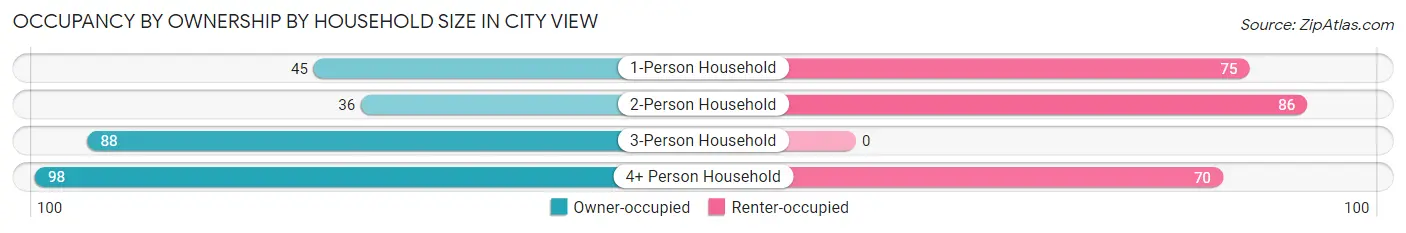
| Household Size | Owner-occupied | Renter-occupied |
| 1-Person Household | 45 (37.5%) | 75 (62.5%) |
| 2-Person Household | 36 (29.5%) | 86 (70.5%) |
| 3-Person Household | 88 (100.0%) | 0 (0.0%) |
| 4+ Person Household | 98 (58.3%) | 70 (41.7%) |
| Total Housing Units | 267 (53.6%) | 231 (46.4%) |
Occupancy by Educational Attainment in City View
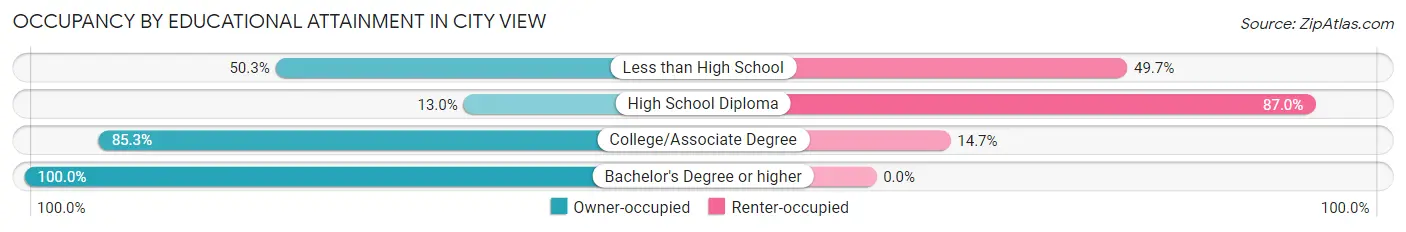
| Household Size | Owner-occupied | Renter-occupied |
| Less than High School | 98 (50.3%) | 97 (49.7%) |
| High School Diploma | 17 (13.0%) | 114 (87.0%) |
| College/Associate Degree | 116 (85.3%) | 20 (14.7%) |
| Bachelor's Degree or higher | 36 (100.0%) | 0 (0.0%) |
Occupancy by Age of Householder in City View
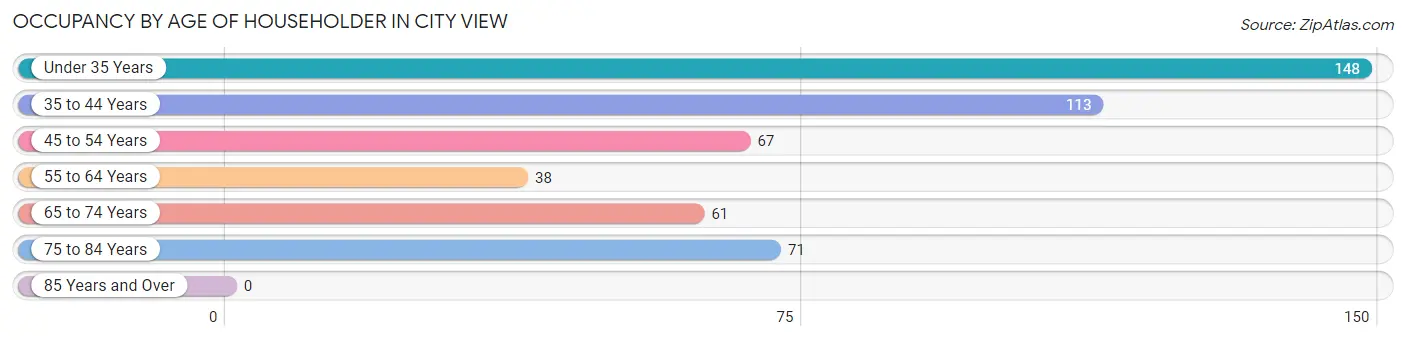
| Age Bracket | # Households | % Households |
| Under 35 Years | 148 | 29.7% |
| 35 to 44 Years | 113 | 22.7% |
| 45 to 54 Years | 67 | 13.5% |
| 55 to 64 Years | 38 | 7.6% |
| 65 to 74 Years | 61 | 12.2% |
| 75 to 84 Years | 71 | 14.3% |
| 85 Years and Over | 0 | 0.0% |
| Total | 498 | 100.0% |
Housing Finances in City View
Median Income by Occupancy in City View
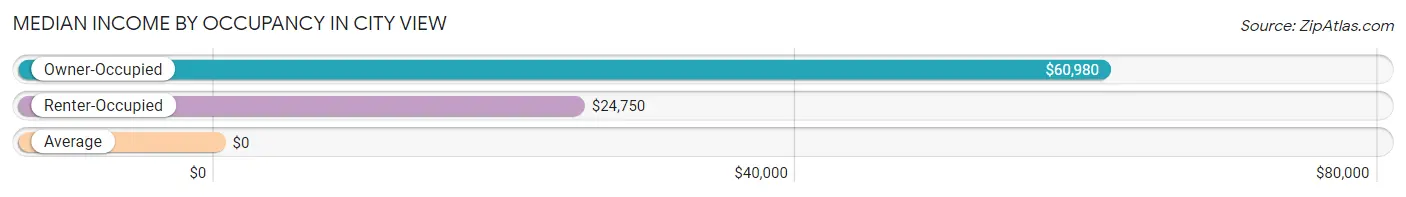
| Occupancy Type | # Households | Median Income |
| Owner-Occupied | 267 (53.6%) | $60,980 |
| Renter-Occupied | 231 (46.4%) | $24,750 |
| Average | 498 (100.0%) | $0 |
Occupancy by Householder Income Bracket in City View
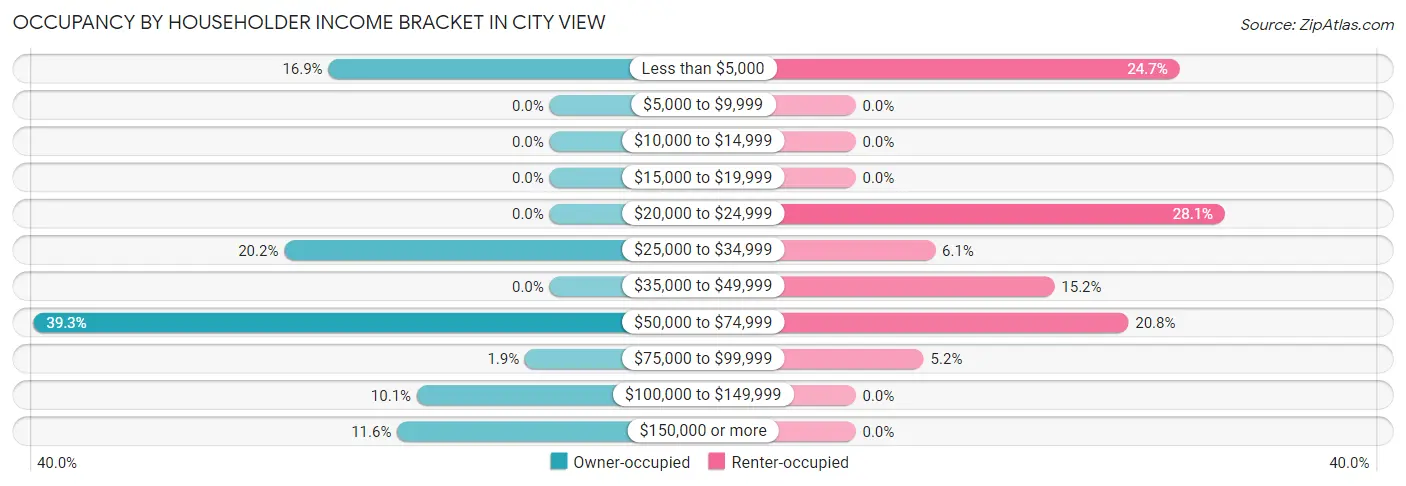
| Income Bracket | Owner-occupied | Renter-occupied |
| Less than $5,000 | 45 (16.9%) | 57 (24.7%) |
| $5,000 to $9,999 | 0 (0.0%) | 0 (0.0%) |
| $10,000 to $14,999 | 0 (0.0%) | 0 (0.0%) |
| $15,000 to $19,999 | 0 (0.0%) | 0 (0.0%) |
| $20,000 to $24,999 | 0 (0.0%) | 65 (28.1%) |
| $25,000 to $34,999 | 54 (20.2%) | 14 (6.1%) |
| $35,000 to $49,999 | 0 (0.0%) | 35 (15.1%) |
| $50,000 to $74,999 | 105 (39.3%) | 48 (20.8%) |
| $75,000 to $99,999 | 5 (1.9%) | 12 (5.2%) |
| $100,000 to $149,999 | 27 (10.1%) | 0 (0.0%) |
| $150,000 or more | 31 (11.6%) | 0 (0.0%) |
| Total | 267 (100.0%) | 231 (100.0%) |
Monthly Housing Cost Tiers in City View
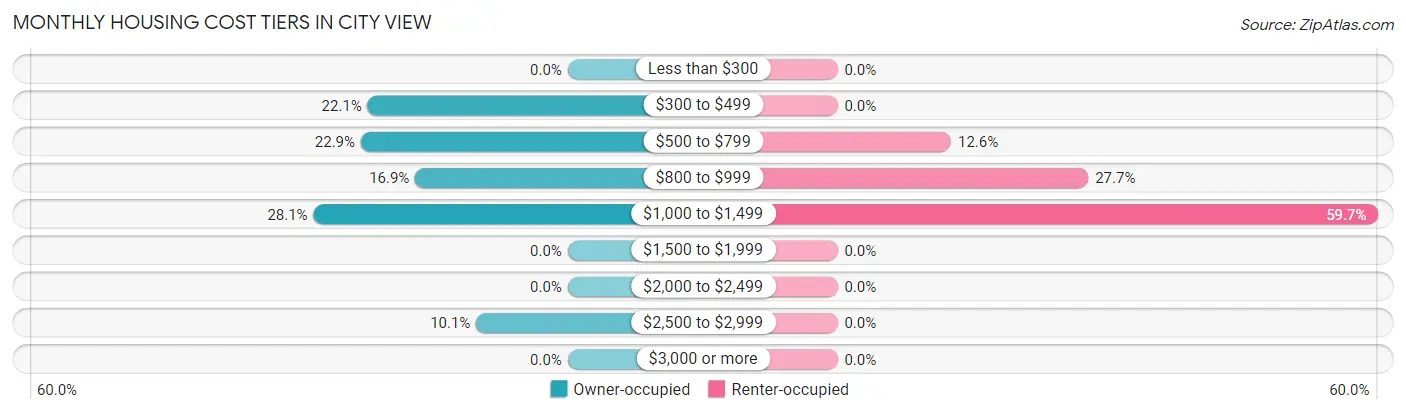
| Monthly Cost | Owner-occupied | Renter-occupied |
| Less than $300 | 0 (0.0%) | 0 (0.0%) |
| $300 to $499 | 59 (22.1%) | 0 (0.0%) |
| $500 to $799 | 61 (22.9%) | 29 (12.6%) |
| $800 to $999 | 45 (16.9%) | 64 (27.7%) |
| $1,000 to $1,499 | 75 (28.1%) | 138 (59.7%) |
| $1,500 to $1,999 | 0 (0.0%) | 0 (0.0%) |
| $2,000 to $2,499 | 0 (0.0%) | 0 (0.0%) |
| $2,500 to $2,999 | 27 (10.1%) | 0 (0.0%) |
| $3,000 or more | 0 (0.0%) | 0 (0.0%) |
| Total | 267 (100.0%) | 231 (100.0%) |
Physical Housing Characteristics in City View
Housing Structures in City View
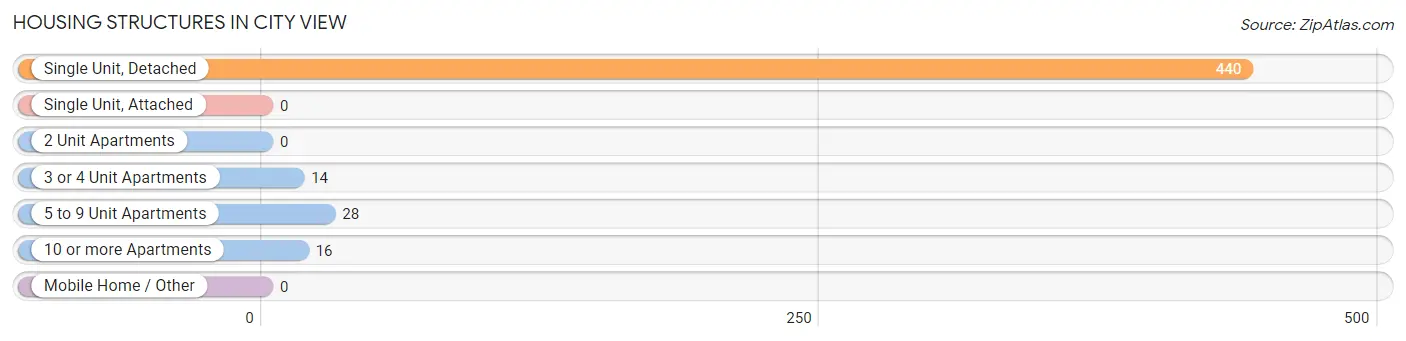
| Structure Type | # Housing Units | % Housing Units |
| Single Unit, Detached | 440 | 88.3% |
| Single Unit, Attached | 0 | 0.0% |
| 2 Unit Apartments | 0 | 0.0% |
| 3 or 4 Unit Apartments | 14 | 2.8% |
| 5 to 9 Unit Apartments | 28 | 5.6% |
| 10 or more Apartments | 16 | 3.2% |
| Mobile Home / Other | 0 | 0.0% |
| Total | 498 | 100.0% |
Housing Structures by Occupancy in City View
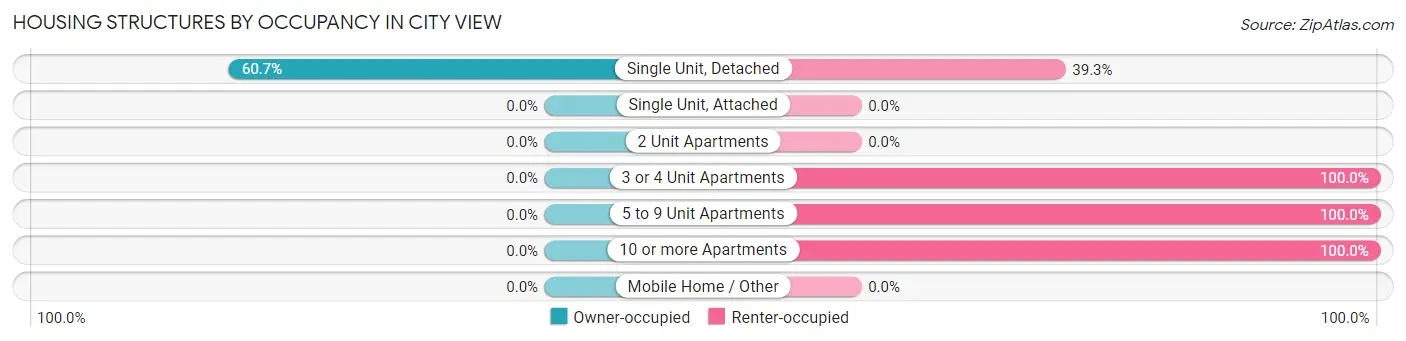
| Structure Type | Owner-occupied | Renter-occupied |
| Single Unit, Detached | 267 (60.7%) | 173 (39.3%) |
| Single Unit, Attached | 0 (0.0%) | 0 (0.0%) |
| 2 Unit Apartments | 0 (0.0%) | 0 (0.0%) |
| 3 or 4 Unit Apartments | 0 (0.0%) | 14 (100.0%) |
| 5 to 9 Unit Apartments | 0 (0.0%) | 28 (100.0%) |
| 10 or more Apartments | 0 (0.0%) | 16 (100.0%) |
| Mobile Home / Other | 0 (0.0%) | 0 (0.0%) |
| Total | 267 (53.6%) | 231 (46.4%) |
Housing Structures by Number of Rooms in City View
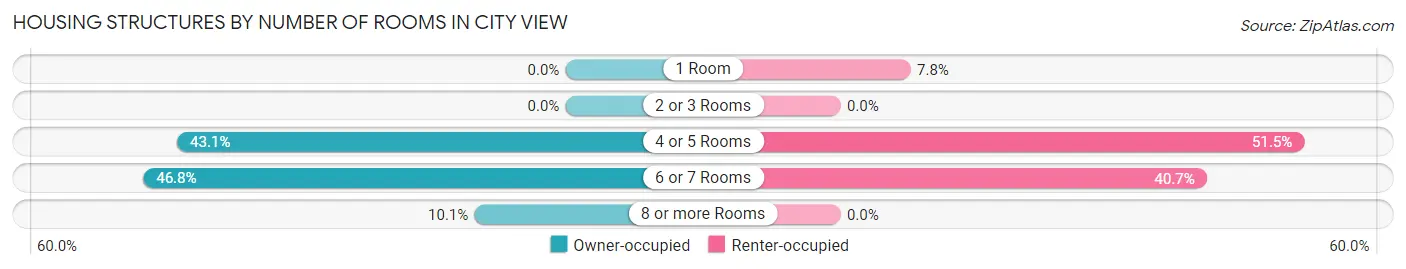
| Number of Rooms | Owner-occupied | Renter-occupied |
| 1 Room | 0 (0.0%) | 18 (7.8%) |
| 2 or 3 Rooms | 0 (0.0%) | 0 (0.0%) |
| 4 or 5 Rooms | 115 (43.1%) | 119 (51.5%) |
| 6 or 7 Rooms | 125 (46.8%) | 94 (40.7%) |
| 8 or more Rooms | 27 (10.1%) | 0 (0.0%) |
| Total | 267 (100.0%) | 231 (100.0%) |
Housing Structure by Heating Type in City View
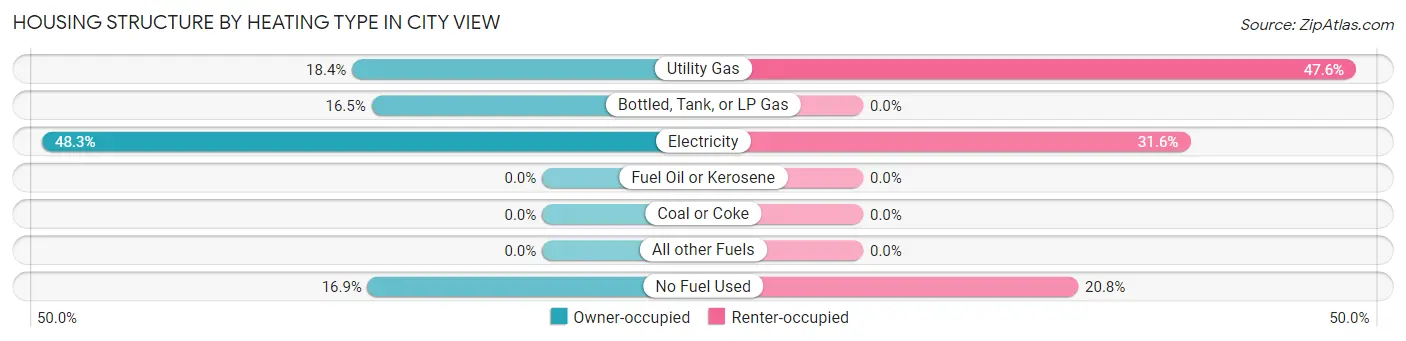
| Heating Type | Owner-occupied | Renter-occupied |
| Utility Gas | 49 (18.3%) | 110 (47.6%) |
| Bottled, Tank, or LP Gas | 44 (16.5%) | 0 (0.0%) |
| Electricity | 129 (48.3%) | 73 (31.6%) |
| Fuel Oil or Kerosene | 0 (0.0%) | 0 (0.0%) |
| Coal or Coke | 0 (0.0%) | 0 (0.0%) |
| All other Fuels | 0 (0.0%) | 0 (0.0%) |
| No Fuel Used | 45 (16.9%) | 48 (20.8%) |
| Total | 267 (100.0%) | 231 (100.0%) |
Household Vehicle Usage in City View
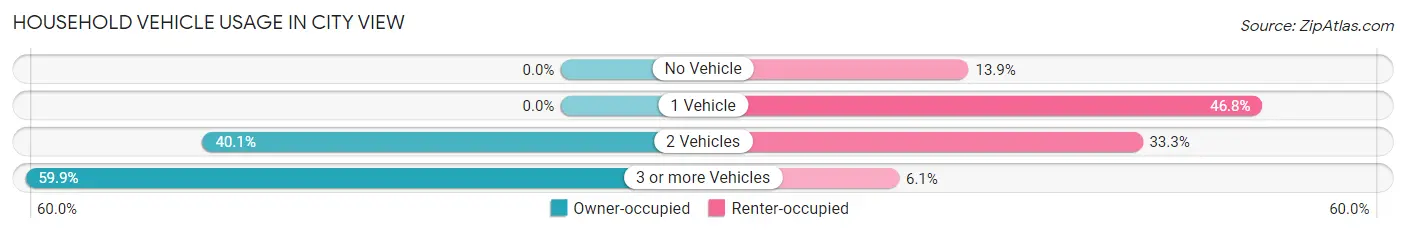
| Vehicles per Household | Owner-occupied | Renter-occupied |
| No Vehicle | 0 (0.0%) | 32 (13.9%) |
| 1 Vehicle | 0 (0.0%) | 108 (46.8%) |
| 2 Vehicles | 107 (40.1%) | 77 (33.3%) |
| 3 or more Vehicles | 160 (59.9%) | 14 (6.1%) |
| Total | 267 (100.0%) | 231 (100.0%) |
Real Estate & Mortgages in City View
Real Estate and Mortgage Overview in City View
| Characteristic | Without Mortgage | With Mortgage |
| Housing Units | 103 | 164 |
| Median Property Value | $101,200 | $0 |
| Median Household Income | - | - |
| Monthly Housing Costs | $487 | $0 |
| Real Estate Taxes | - | - |
Property Value by Mortgage Status in City View
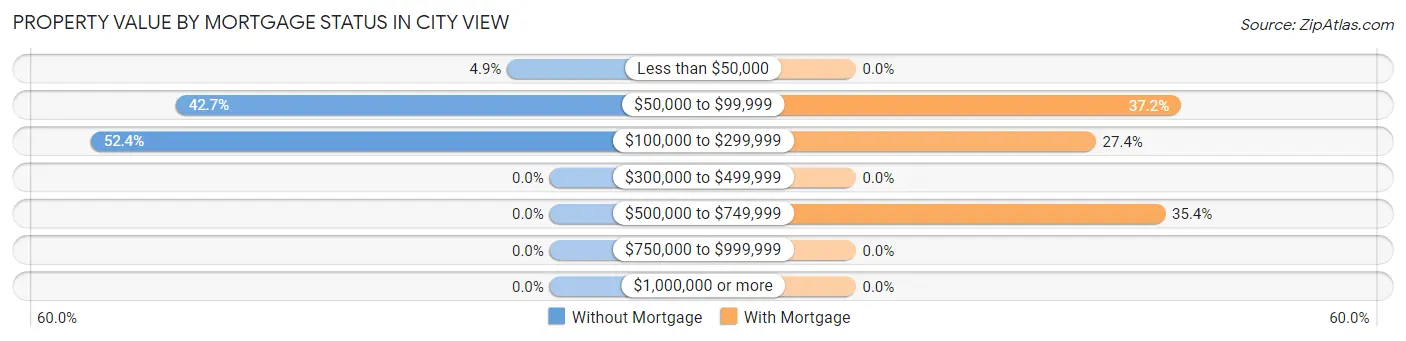
| Property Value | Without Mortgage | With Mortgage |
| Less than $50,000 | 5 (4.9%) | 0 (0.0%) |
| $50,000 to $99,999 | 44 (42.7%) | 61 (37.2%) |
| $100,000 to $299,999 | 54 (52.4%) | 45 (27.4%) |
| $300,000 to $499,999 | 0 (0.0%) | 0 (0.0%) |
| $500,000 to $749,999 | 0 (0.0%) | 58 (35.4%) |
| $750,000 to $999,999 | 0 (0.0%) | 0 (0.0%) |
| $1,000,000 or more | 0 (0.0%) | 0 (0.0%) |
| Total | 103 (100.0%) | 164 (100.0%) |
Household Income by Mortgage Status in City View
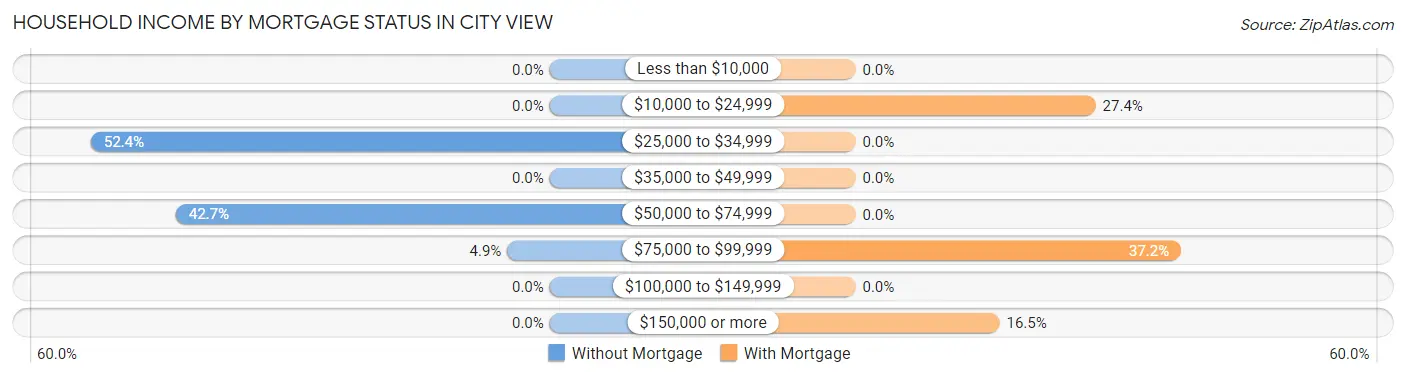
| Household Income | Without Mortgage | With Mortgage |
| Less than $10,000 | 0 (0.0%) | 0 (0.0%) |
| $10,000 to $24,999 | 0 (0.0%) | 45 (27.4%) |
| $25,000 to $34,999 | 54 (52.4%) | 0 (0.0%) |
| $35,000 to $49,999 | 0 (0.0%) | 0 (0.0%) |
| $50,000 to $74,999 | 44 (42.7%) | 0 (0.0%) |
| $75,000 to $99,999 | 5 (4.9%) | 61 (37.2%) |
| $100,000 to $149,999 | 0 (0.0%) | 0 (0.0%) |
| $150,000 or more | 0 (0.0%) | 27 (16.5%) |
| Total | 103 (100.0%) | 164 (100.0%) |
Property Value to Household Income Ratio in City View
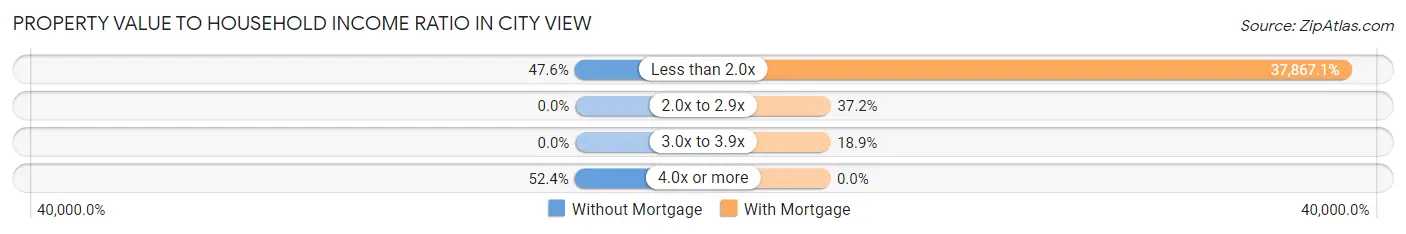
| Value-to-Income Ratio | Without Mortgage | With Mortgage |
| Less than 2.0x | 49 (47.6%) | 62,102 (37,867.1%) |
| 2.0x to 2.9x | 0 (0.0%) | 61 (37.2%) |
| 3.0x to 3.9x | 0 (0.0%) | 31 (18.9%) |
| 4.0x or more | 54 (52.4%) | 0 (0.0%) |
| Total | 103 (100.0%) | 164 (100.0%) |
Real Estate Taxes by Mortgage Status in City View
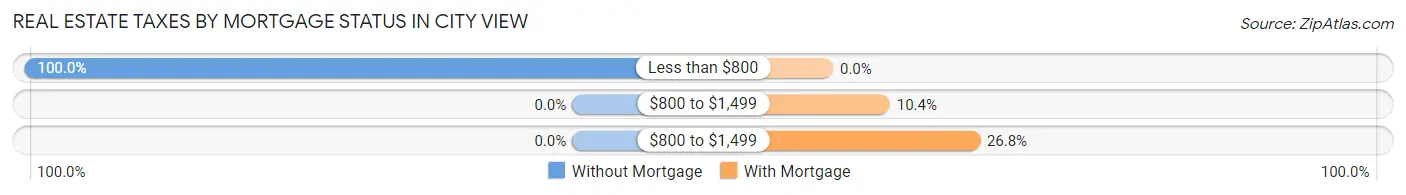
| Property Taxes | Without Mortgage | With Mortgage |
| Less than $800 | 103 (100.0%) | 0 (0.0%) |
| $800 to $1,499 | 0 (0.0%) | 17 (10.4%) |
| $800 to $1,499 | 0 (0.0%) | 44 (26.8%) |
| Total | 103 (100.0%) | 164 (100.0%) |
Health & Disability in City View
Health Insurance Coverage by Age in City View
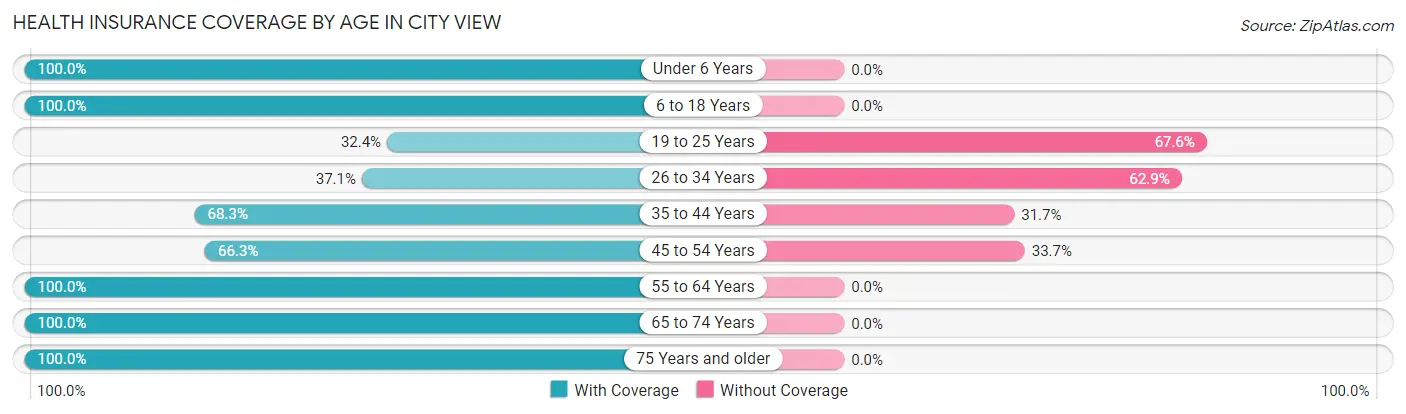
| Age Bracket | With Coverage | Without Coverage |
| Under 6 Years | 136 (100.0%) | 0 (0.0%) |
| 6 to 18 Years | 345 (100.0%) | 0 (0.0%) |
| 19 to 25 Years | 36 (32.4%) | 75 (67.6%) |
| 26 to 34 Years | 134 (37.1%) | 227 (62.9%) |
| 35 to 44 Years | 153 (68.3%) | 71 (31.7%) |
| 45 to 54 Years | 67 (66.3%) | 34 (33.7%) |
| 55 to 64 Years | 38 (100.0%) | 0 (0.0%) |
| 65 to 74 Years | 282 (100.0%) | 0 (0.0%) |
| 75 Years and older | 98 (100.0%) | 0 (0.0%) |
| Total | 1,289 (76.0%) | 407 (24.0%) |
Health Insurance Coverage by Citizenship Status in City View
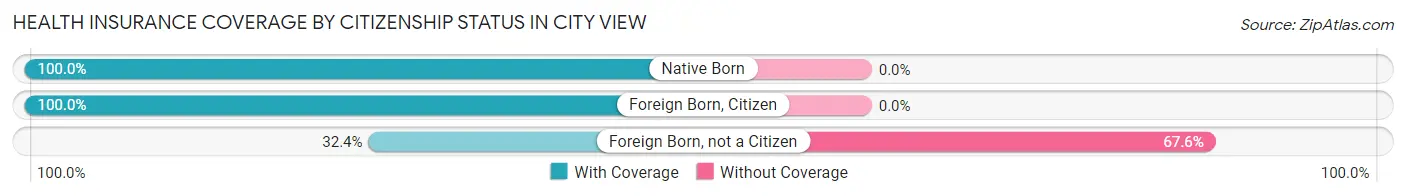
| Citizenship Status | With Coverage | Without Coverage |
| Native Born | 136 (100.0%) | 0 (0.0%) |
| Foreign Born, Citizen | 345 (100.0%) | 0 (0.0%) |
| Foreign Born, not a Citizen | 36 (32.4%) | 75 (67.6%) |
Health Insurance Coverage by Household Income in City View
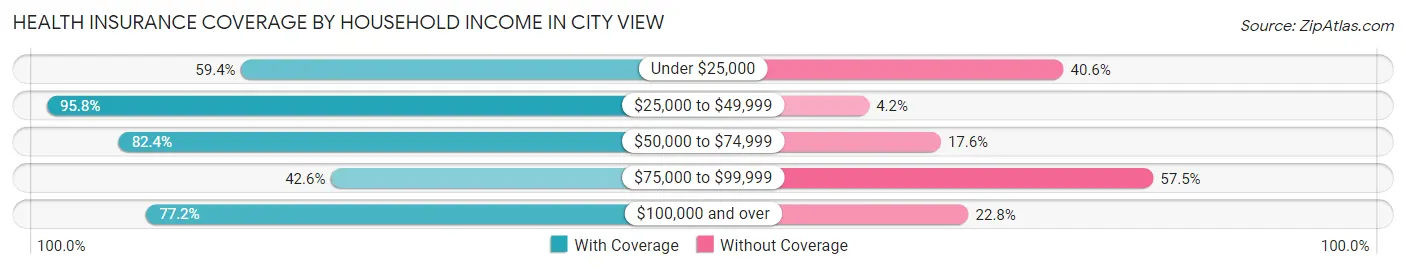
| Household Income | With Coverage | Without Coverage |
| Under $25,000 | 326 (59.4%) | 223 (40.6%) |
| $25,000 to $49,999 | 319 (95.8%) | 14 (4.2%) |
| $50,000 to $74,999 | 509 (82.4%) | 109 (17.6%) |
| $75,000 to $99,999 | 20 (42.5%) | 27 (57.5%) |
| $100,000 and over | 115 (77.2%) | 34 (22.8%) |
Public vs Private Health Insurance Coverage by Age in City View
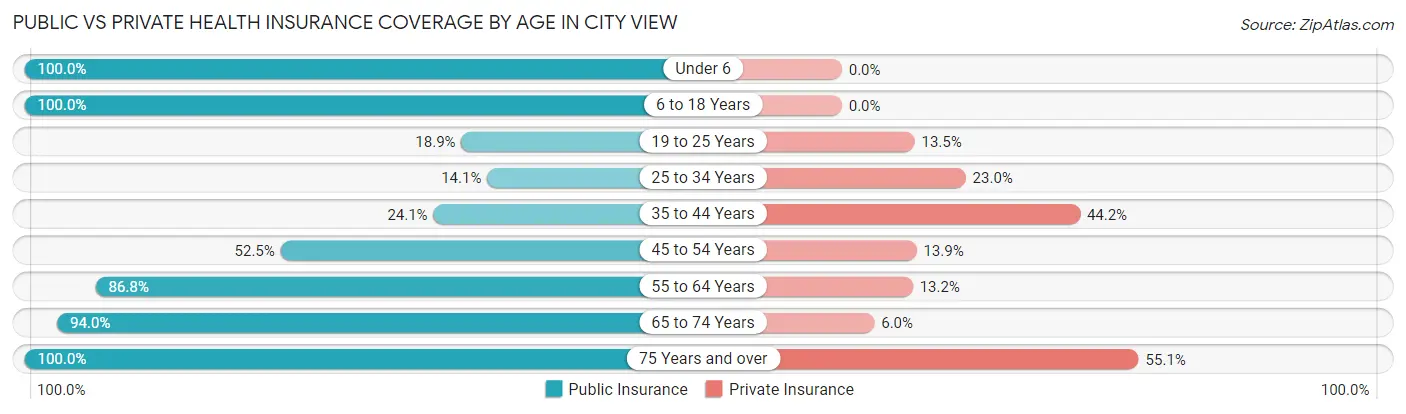
| Age Bracket | Public Insurance | Private Insurance |
| Under 6 | 136 (100.0%) | 0 (0.0%) |
| 6 to 18 Years | 345 (100.0%) | 0 (0.0%) |
| 19 to 25 Years | 21 (18.9%) | 15 (13.5%) |
| 25 to 34 Years | 51 (14.1%) | 83 (23.0%) |
| 35 to 44 Years | 54 (24.1%) | 99 (44.2%) |
| 45 to 54 Years | 53 (52.5%) | 14 (13.9%) |
| 55 to 64 Years | 33 (86.8%) | 5 (13.2%) |
| 65 to 74 Years | 265 (94.0%) | 17 (6.0%) |
| 75 Years and over | 98 (100.0%) | 54 (55.1%) |
| Total | 1,056 (62.3%) | 287 (16.9%) |
Disability Status by Sex by Age in City View
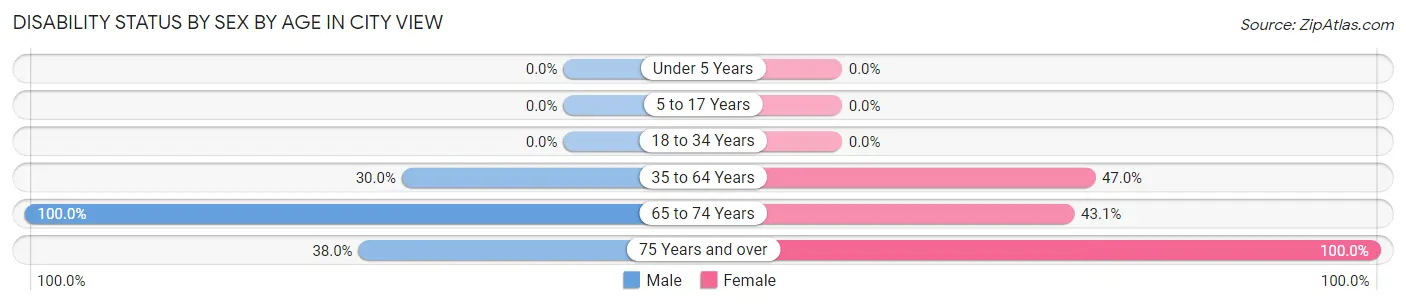
| Age Bracket | Male | Female |
| Under 5 Years | 0 (0.0%) | 0 (0.0%) |
| 5 to 17 Years | 0 (0.0%) | 0 (0.0%) |
| 18 to 34 Years | 0 (0.0%) | 0 (0.0%) |
| 35 to 64 Years | 54 (30.0%) | 86 (47.0%) |
| 65 to 74 Years | 71 (100.0%) | 91 (43.1%) |
| 75 Years and over | 27 (38.0%) | 27 (100.0%) |
Disability Class by Sex by Age in City View
Disability Class: Hearing Difficulty
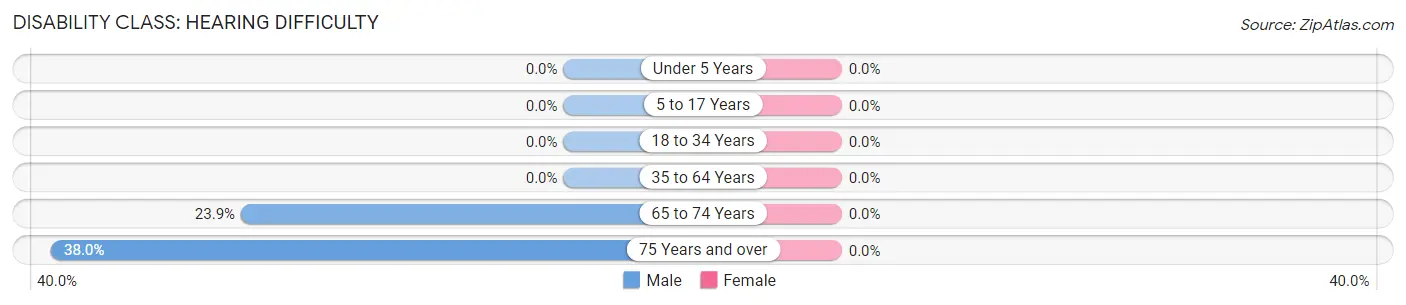
| Age Bracket | Male | Female |
| Under 5 Years | 0 (0.0%) | 0 (0.0%) |
| 5 to 17 Years | 0 (0.0%) | 0 (0.0%) |
| 18 to 34 Years | 0 (0.0%) | 0 (0.0%) |
| 35 to 64 Years | 0 (0.0%) | 0 (0.0%) |
| 65 to 74 Years | 17 (23.9%) | 0 (0.0%) |
| 75 Years and over | 27 (38.0%) | 0 (0.0%) |
Disability Class: Vision Difficulty
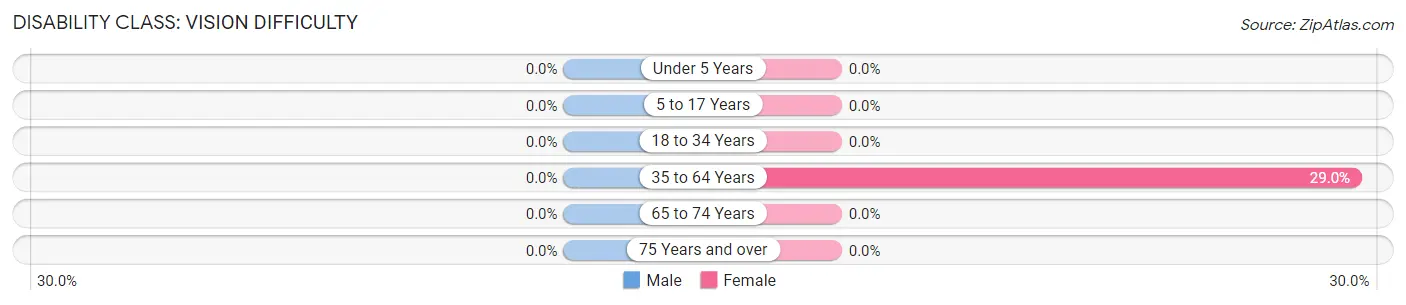
| Age Bracket | Male | Female |
| Under 5 Years | 0 (0.0%) | 0 (0.0%) |
| 5 to 17 Years | 0 (0.0%) | 0 (0.0%) |
| 18 to 34 Years | 0 (0.0%) | 0 (0.0%) |
| 35 to 64 Years | 0 (0.0%) | 53 (29.0%) |
| 65 to 74 Years | 0 (0.0%) | 0 (0.0%) |
| 75 Years and over | 0 (0.0%) | 0 (0.0%) |
Disability Class: Cognitive Difficulty
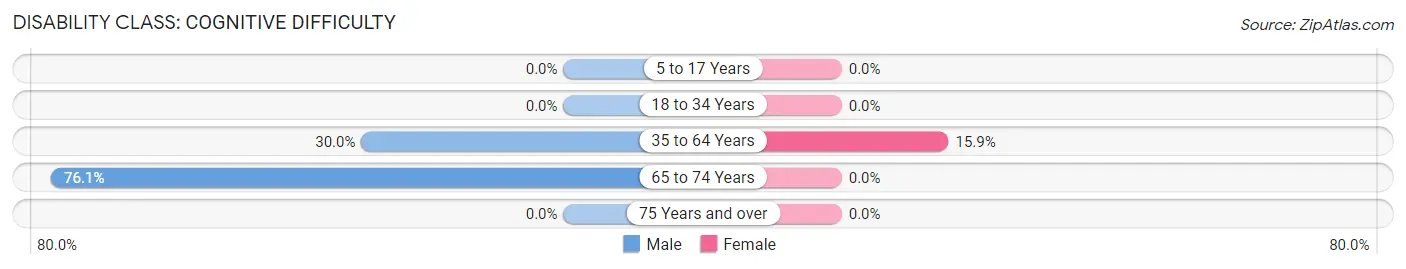
| Age Bracket | Male | Female |
| 5 to 17 Years | 0 (0.0%) | 0 (0.0%) |
| 18 to 34 Years | 0 (0.0%) | 0 (0.0%) |
| 35 to 64 Years | 54 (30.0%) | 29 (15.9%) |
| 65 to 74 Years | 54 (76.1%) | 0 (0.0%) |
| 75 Years and over | 0 (0.0%) | 0 (0.0%) |
Disability Class: Ambulatory Difficulty
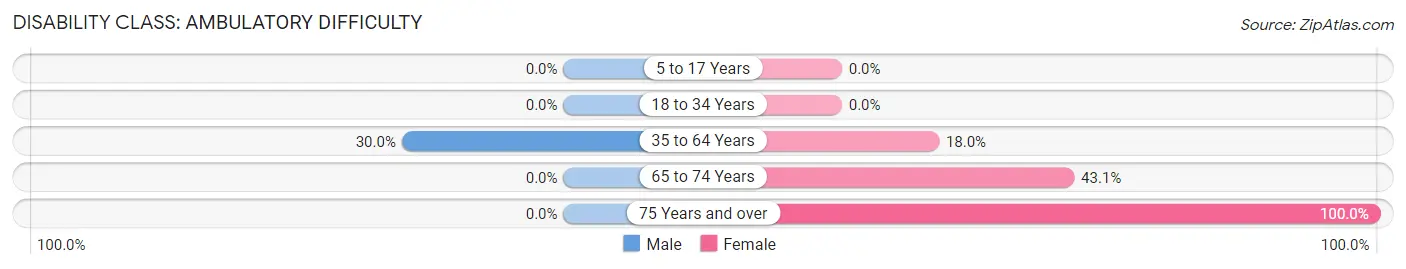
| Age Bracket | Male | Female |
| 5 to 17 Years | 0 (0.0%) | 0 (0.0%) |
| 18 to 34 Years | 0 (0.0%) | 0 (0.0%) |
| 35 to 64 Years | 54 (30.0%) | 33 (18.0%) |
| 65 to 74 Years | 0 (0.0%) | 91 (43.1%) |
| 75 Years and over | 0 (0.0%) | 27 (100.0%) |
Disability Class: Self-Care Difficulty
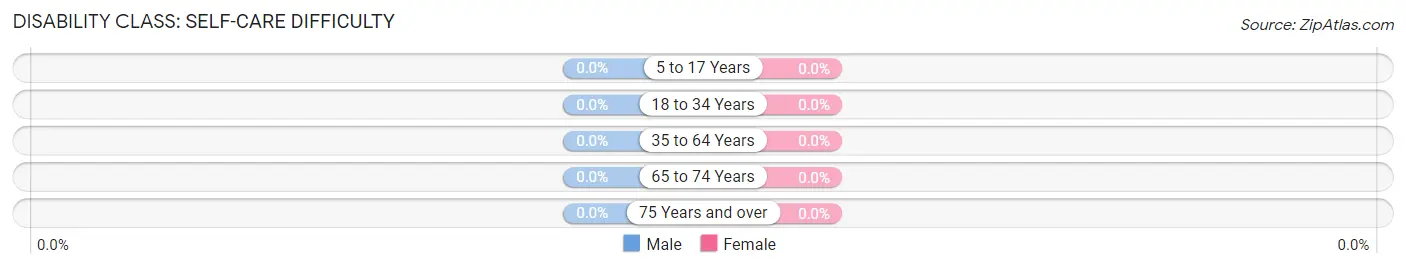
| Age Bracket | Male | Female |
| 5 to 17 Years | 0 (0.0%) | 0 (0.0%) |
| 18 to 34 Years | 0 (0.0%) | 0 (0.0%) |
| 35 to 64 Years | 0 (0.0%) | 0 (0.0%) |
| 65 to 74 Years | 0 (0.0%) | 0 (0.0%) |
| 75 Years and over | 0 (0.0%) | 0 (0.0%) |
Technology Access in City View
Computing Device Access in City View
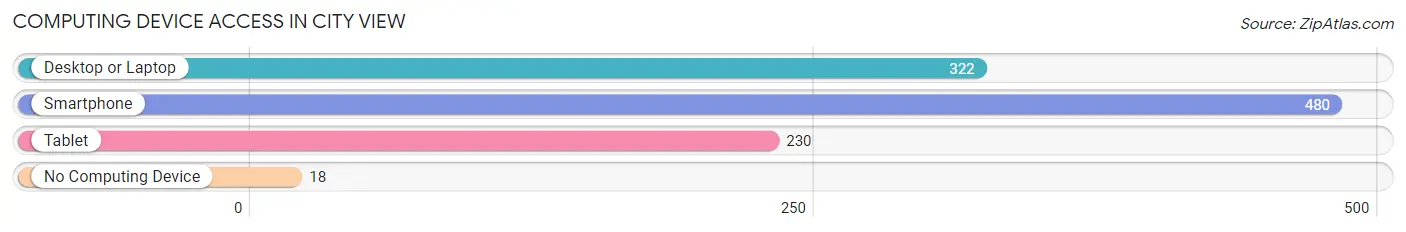
| Device Type | # Households | % Households |
| Desktop or Laptop | 322 | 64.7% |
| Smartphone | 480 | 96.4% |
| Tablet | 230 | 46.2% |
| No Computing Device | 18 | 3.6% |
| Total | 498 | 100.0% |
Internet Access in City View
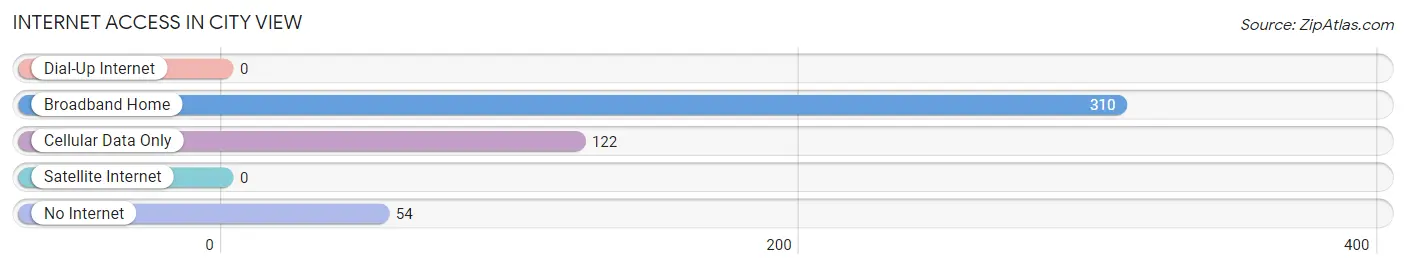
| Internet Type | # Households | % Households |
| Dial-Up Internet | 0 | 0.0% |
| Broadband Home | 310 | 62.3% |
| Cellular Data Only | 122 | 24.5% |
| Satellite Internet | 0 | 0.0% |
| No Internet | 54 | 10.8% |
| Total | 498 | 100.0% |
City View Summary
City View, SC is a small town located in the Upstate region of South Carolina. It is situated in the foothills of the Blue Ridge Mountains and is part of the Greenville-Spartanburg-Anderson Combined Statistical Area. The town has a population of approximately 2,000 people and is located in Spartanburg County.
Geography
City View is located in the foothills of the Blue Ridge Mountains in the Upstate region of South Carolina. The town is situated in the Piedmont region of the state, which is characterized by rolling hills and valleys. The town is located in the Piedmont Plateau, which is a region of low-lying hills and valleys. The town is located in the Piedmont Plateau, which is a region of low-lying hills and valleys. The town is located in the Piedmont Plateau, which is a region of low-lying hills and valleys. The town is located in the Piedmont Plateau, which is a region of low-lying hills and valleys. The town is located in the Piedmont Plateau, which is a region of low-lying hills and valleys. The town is located in the Piedmont Plateau, which is a region of low-lying hills and valleys. The town is located in the Piedmont Plateau, which is a region of low-lying hills and valleys. The town is located in the Piedmont Plateau, which is a region of low-lying hills and valleys. The town is located in the Piedmont Plateau, which is a region of low-lying hills and valleys. The town is located in the Piedmont Plateau, which is a region of low-lying hills and valleys.
The town is located in the Piedmont Plateau, which is a region of low-lying hills and valleys. The town is located in the Piedmont Plateau, which is a region of low-lying hills and valleys. The town is located in the Piedmont Plateau, which is a region of low-lying hills and valleys. The town is located in the Piedmont Plateau, which is a region of low-lying hills and valleys. The town is located in the Piedmont Plateau, which is a region of low-lying hills and valleys. The town is located in the Piedmont Plateau, which is a region of low-lying hills and valleys. The town is located in the Piedmont Plateau, which is a region of low-lying hills and valleys. The town is located in the Piedmont Plateau, which is a region of low-lying hills and valleys.
The town is located in the Piedmont Plateau, which is a region of low-lying hills and valleys. The town is located in the Piedmont Plateau, which is a region of low-lying hills and valleys. The town is located in the Piedmont Plateau, which is a region of low-lying hills and valleys. The town is located in the Piedmont Plateau, which is a region of low-lying hills and valleys. The town is located in the Piedmont Plateau, which is a region of low-lying hills and valleys. The town is located in the Piedmont Plateau, which is a region of low-lying hills and valleys. The town is located in the Piedmont Plateau, which is a region of low-lying hills and valleys. The town is located in the Piedmont Plateau, which is a region of low-lying hills and valleys.
The town is located in the Piedmont Plateau, which is a region of low-lying hills and valleys. The town is located in the Piedmont Plateau, which is a region of low-lying hills and valleys. The town is located in the Piedmont Plateau, which is a region of low-lying hills and valleys. The town is located in the Piedmont Plateau, which is a region of low-lying hills and valleys. The town is located in the Piedmont Plateau, which is a region of low-lying hills and valleys. The town is located in the Piedmont Plateau, which is a region of low-lying hills and valleys. The town is located in the Piedmont Plateau, which is a region of low-lying hills and valleys. The town is located in the Piedmont Plateau, which is a region of low-lying hills and valleys.
History
City View was founded in 1883 by a group of settlers from the nearby town of Spartanburg. The town was originally known as “City View” due to its location on a hill overlooking the city of Spartanburg. The town was incorporated in 1887 and was named after the nearby city of Spartanburg.
The town was originally a farming community, but in the early 1900s, the town began to develop into a manufacturing center. The town was home to several textile mills, which provided employment for many of the town’s residents. The town also had a thriving furniture industry, which provided employment for many of the town’s residents.
The town was also home to several churches, including the First Baptist Church, which was founded in 1883. The town also had a school, which was established in 1887.
Economy
The economy of City View is largely based on manufacturing and agriculture. The town is home to several textile mills, which provide employment for many of the town’s residents. The town also has a thriving furniture industry, which provides employment for many of the town’s residents.
The town is also home to several small businesses, including restaurants, retail stores, and service providers. The town is also home to several small businesses, including restaurants, retail stores, and service providers.
Demographics
As of the 2010 census, the population of City View was 2,000. The town has a population that is predominantly white (90.2%), with African Americans making up 6.2% of the population. The town also has a small Hispanic population (2.2%). The median household income in the town is $37,500, and the median age is 40.
Conclusion
City View, SC is a small town located in the Upstate region of South Carolina. It is situated in the foothills of the Blue Ridge Mountains and is part of the Greenville-Spartanburg-Anderson Combined Statistical Area. The town has a population of approximately 2,000 people and is located in Spartanburg County. The town has a predominantly white population, with African Americans and Hispanics making up a small portion of the population. The town’s economy is largely based on manufacturing and agriculture, with several textile mills and furniture factories providing employment for many of the town’s residents. The town also has several small businesses, including restaurants, retail stores, and service providers.
Common Questions
What is Per Capita Income in City View?
Per Capita income in City View is $16,895.
What is the Median Family Income in City View?
Median Family Income in City View is $44,517.
What is Inequality or Gini Index in City View?
Inequality or Gini Index in City View is 0.51.
What is the Total Population of City View?
Total Population of City View is 1,696.
What is the Total Male Population of City View?
Total Male Population of City View is 861.
What is the Total Female Population of City View?
Total Female Population of City View is 835.
What is the Ratio of Males per 100 Females in City View?
There are 103.11 Males per 100 Females in City View.
What is the Ratio of Females per 100 Males in City View?
There are 96.98 Females per 100 Males in City View.
What is the Median Population Age in City View?
Median Population Age in City View is 33.7 Years.
What is the Average Family Size in City View
Average Family Size in City View is 3.8 People.
What is the Average Household Size in City View
Average Household Size in City View is 3.4 People.
How Large is the Labor Force in City View?
There are 543 People in the Labor Forcein in City View.
What is the Percentage of People in the Labor Force in City View?
42.9% of People are in the Labor Force in City View.
What is the Unemployment Rate in City View?
Unemployment Rate in City View is 6.6%.