Castle Pines, CO Map & Demographics
Castle Pines Map
Castle Pines Overview
$76,842
PER CAPITA INCOME
$192,500
AVG FAMILY INCOME
$189,280
AVG HOUSEHOLD INCOME
46.0%
WAGE / INCOME GAP [ % ]
54.0¢/ $1
WAGE / INCOME GAP [ $ ]
$12,432
FAMILY INCOME DEFICIT
0.40
INEQUALITY / GINI INDEX
11,811
TOTAL POPULATION
5,960
MALE POPULATION
5,851
FEMALE POPULATION
101.86
MALES / 100 FEMALES
98.17
FEMALES / 100 MALES
44.6
MEDIAN AGE
3.0
AVG FAMILY SIZE
2.8
AVG HOUSEHOLD SIZE
6,651
LABOR FORCE [ PEOPLE ]
69.1%
PERCENT IN LABOR FORCE
3.6%
UNEMPLOYMENT RATE
Castle Pines Area Codes
Income in Castle Pines
Income Overview in Castle Pines
Per Capita Income in Castle Pines is $76,842, while median incomes of families and households are $192,500 and $189,280 respectively.
| Characteristic | Number | Measure |
| Per Capita Income | 11,811 | $76,842 |
| Median Family Income | 3,548 | $192,500 |
| Mean Family Income | 3,548 | $230,345 |
| Median Household Income | 4,154 | $189,280 |
| Mean Household Income | 4,154 | $216,166 |
| Income Deficit | 3,548 | $12,432 |
| Wage / Income Gap (%) | 11,811 | 45.99% |
| Wage / Income Gap ($) | 11,811 | 54.01¢ per $1 |
| Gini / Inequality Index | 11,811 | 0.40 |
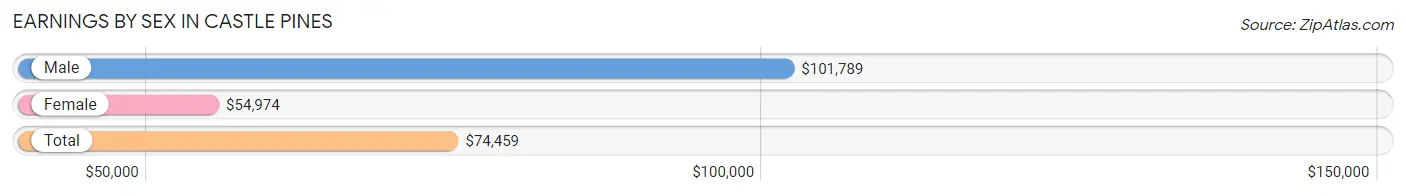
Earnings by Sex in Castle Pines
Average Earnings in Castle Pines are $74,459, $101,789 for men and $54,974 for women, a difference of 46.0%.
| Sex | Number | Average Earnings |
| Male | 3,714 (51.9%) | $101,789 |
| Female | 3,448 (48.1%) | $54,974 |
| Total | 7,162 (100.0%) | $74,459 |
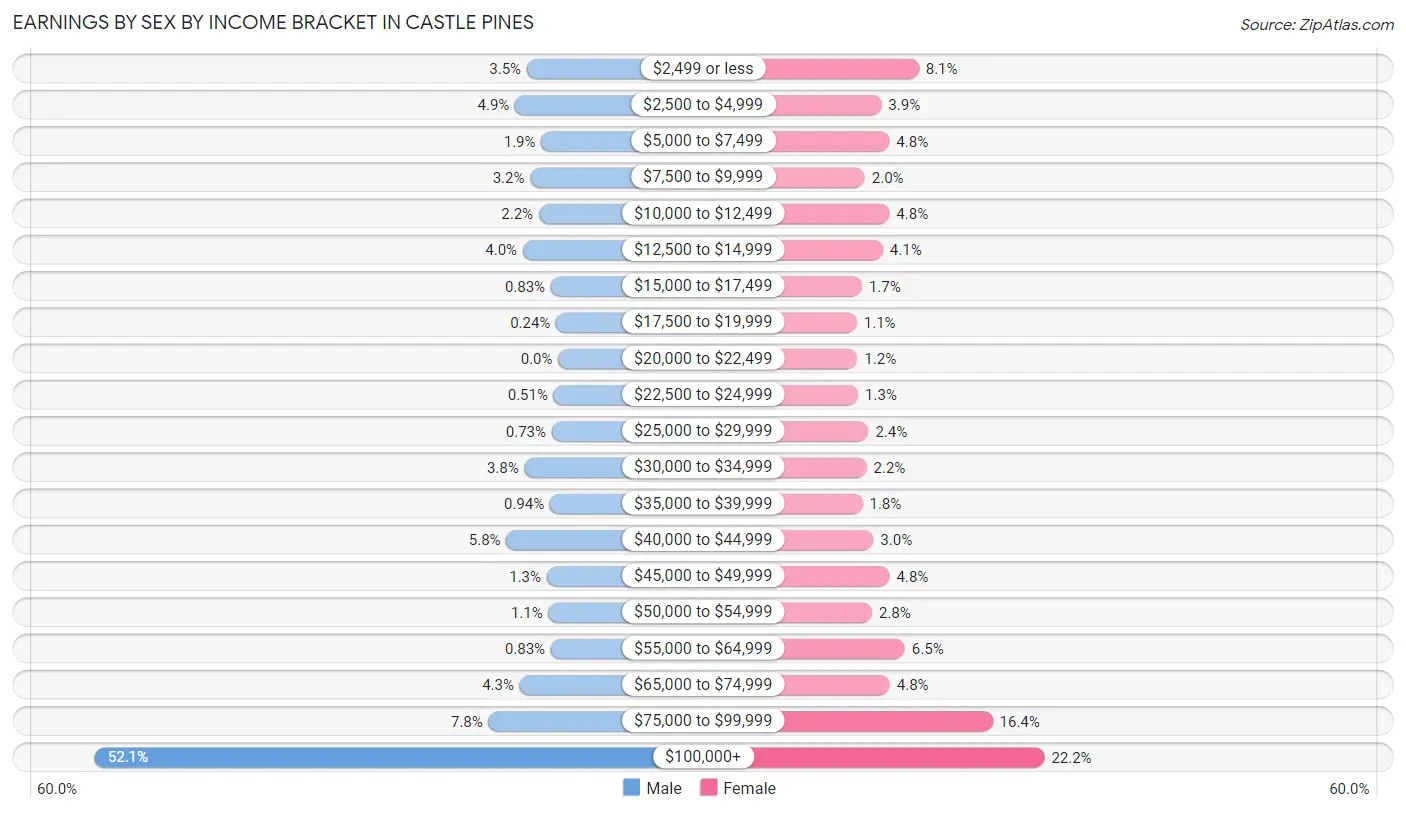
Earnings by Sex by Income Bracket in Castle Pines
The most common earnings brackets in Castle Pines are $100,000+ for men (1,935 | 52.1%) and $100,000+ for women (766 | 22.2%).
| Income | Male | Female |
| $2,499 or less | 131 (3.5%) | 279 (8.1%) |
| $2,500 to $4,999 | 180 (4.9%) | 134 (3.9%) |
| $5,000 to $7,499 | 71 (1.9%) | 165 (4.8%) |
| $7,500 to $9,999 | 117 (3.2%) | 70 (2.0%) |
| $10,000 to $12,499 | 81 (2.2%) | 165 (4.8%) |
| $12,500 to $14,999 | 148 (4.0%) | 140 (4.1%) |
| $15,000 to $17,499 | 31 (0.8%) | 59 (1.7%) |
| $17,500 to $19,999 | 9 (0.2%) | 39 (1.1%) |
| $20,000 to $22,499 | 0 (0.0%) | 41 (1.2%) |
| $22,500 to $24,999 | 19 (0.5%) | 44 (1.3%) |
| $25,000 to $29,999 | 27 (0.7%) | 84 (2.4%) |
| $30,000 to $34,999 | 141 (3.8%) | 77 (2.2%) |
| $35,000 to $39,999 | 35 (0.9%) | 61 (1.8%) |
| $40,000 to $44,999 | 217 (5.8%) | 103 (3.0%) |
| $45,000 to $49,999 | 48 (1.3%) | 166 (4.8%) |
| $50,000 to $54,999 | 41 (1.1%) | 98 (2.8%) |
| $55,000 to $64,999 | 31 (0.8%) | 225 (6.5%) |
| $65,000 to $74,999 | 161 (4.3%) | 167 (4.8%) |
| $75,000 to $99,999 | 291 (7.8%) | 565 (16.4%) |
| $100,000+ | 1,935 (52.1%) | 766 (22.2%) |
| Total | 3,714 (100.0%) | 3,448 (100.0%) |
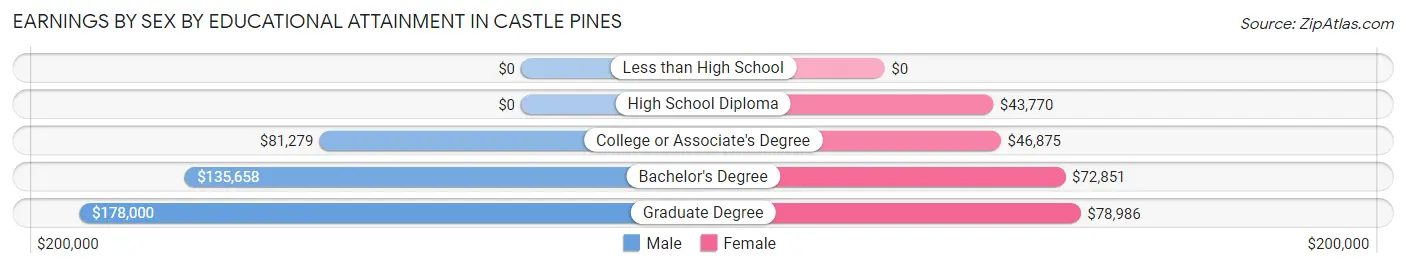
Earnings by Sex by Educational Attainment in Castle Pines
Average earnings in Castle Pines are $125,859 for men and $66,908 for women, a difference of 46.8%. Men with an educational attainment of graduate degree enjoy the highest average annual earnings of $178,000, while those with college or associate's degree education earn the least with $81,279. Women with an educational attainment of graduate degree earn the most with the average annual earnings of $78,986, while those with high school diploma education have the smallest earnings of $43,770.
| Educational Attainment | Male Income | Female Income |
| Less than High School | - | - |
| High School Diploma | - | - |
| College or Associate's Degree | $81,279 | $46,875 |
| Bachelor's Degree | $135,658 | $72,851 |
| Graduate Degree | $178,000 | $78,986 |
| Total | $125,859 | $66,908 |
Family Income in Castle Pines
Family Income Brackets in Castle Pines
According to the Castle Pines family income data, there are 1,717 families falling into the $200,000+ income range, which is the most common income bracket and makes up 48.4% of all families.
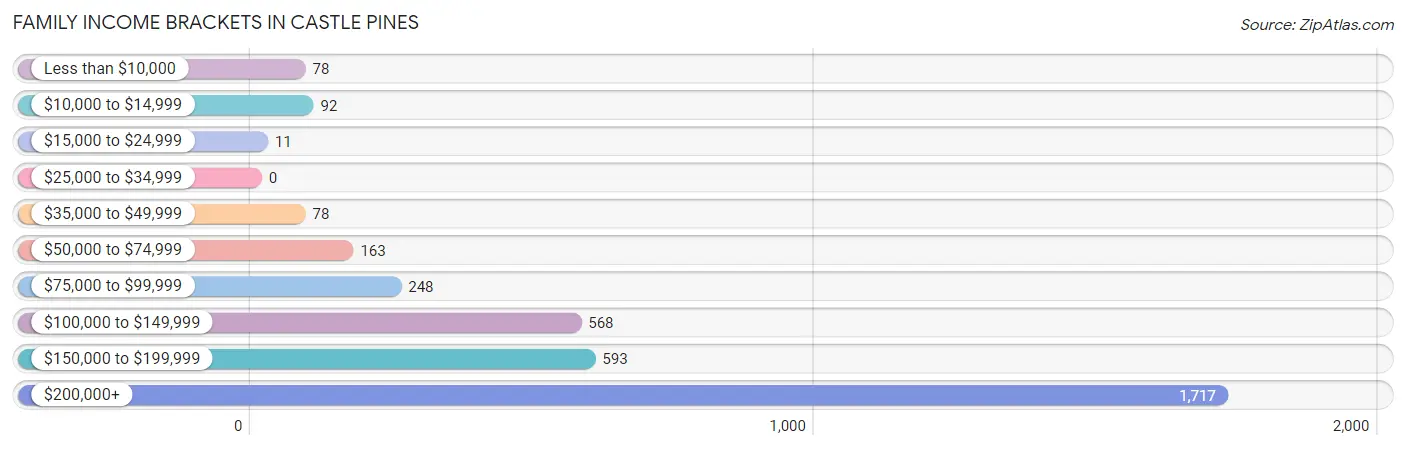
| Income Bracket | # Families | % Families |
| Less than $10,000 | 78 | 2.2% |
| $10,000 to $14,999 | 92 | 2.6% |
| $15,000 to $24,999 | 11 | 0.3% |
| $25,000 to $34,999 | 0 | 0.0% |
| $35,000 to $49,999 | 78 | 2.2% |
| $50,000 to $74,999 | 163 | 4.6% |
| $75,000 to $99,999 | 248 | 7.0% |
| $100,000 to $149,999 | 568 | 16.0% |
| $150,000 to $199,999 | 593 | 16.7% |
| $200,000+ | 1,717 | 48.4% |
Family Income by Famaliy Size in Castle Pines
3-person families (894 | 25.2%) account for the highest median family income in Castle Pines with $250,001 per family, while 2-person families (1,495 | 42.1%) have the highest median income of $86,509 per family member.
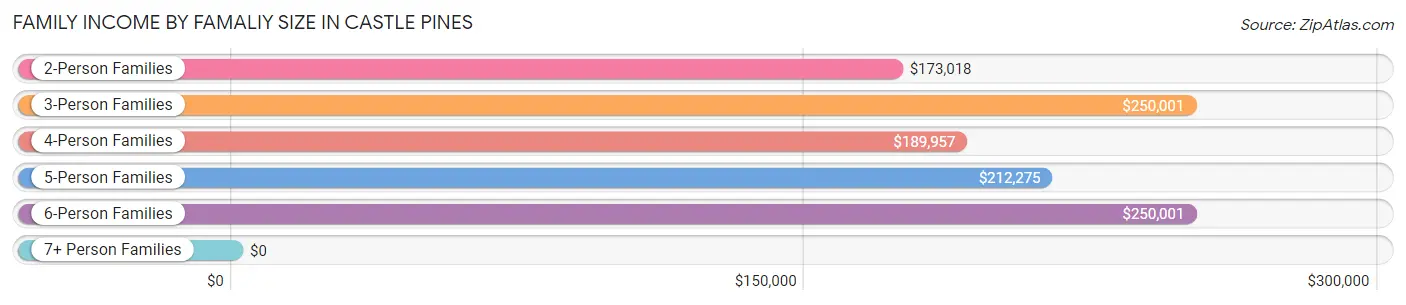
| Income Bracket | # Families | Median Income |
| 2-Person Families | 1,495 (42.1%) | $173,018 |
| 3-Person Families | 894 (25.2%) | $250,001 |
| 4-Person Families | 899 (25.3%) | $189,957 |
| 5-Person Families | 163 (4.6%) | $212,275 |
| 6-Person Families | 89 (2.5%) | $250,001 |
| 7+ Person Families | 8 (0.2%) | $0 |
| Total | 3,548 (100.0%) | $192,500 |
Family Income by Number of Earners in Castle Pines
The median family income in Castle Pines is $192,500, with families comprising 2 earners (1,852) having the highest median family income of $227,386, while families with no earners (404) have the lowest median family income of $108,750, accounting for 52.2% and 11.4% of families, respectively.
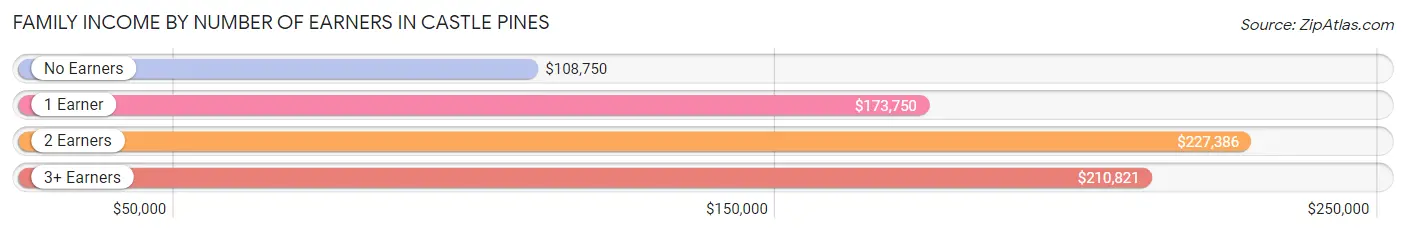
| Number of Earners | # Families | Median Income |
| No Earners | 404 (11.4%) | $108,750 |
| 1 Earner | 763 (21.5%) | $173,750 |
| 2 Earners | 1,852 (52.2%) | $227,386 |
| 3+ Earners | 529 (14.9%) | $210,821 |
| Total | 3,548 (100.0%) | $192,500 |
Household Income in Castle Pines
Household Income Brackets in Castle Pines
With 1,865 households falling in the category, the $200,000+ income range is the most frequent in Castle Pines, accounting for 44.9% of all households. In contrast, only 17 households (0.4%) fall into the $25,000 to $34,999 income bracket, making it the least populous group.
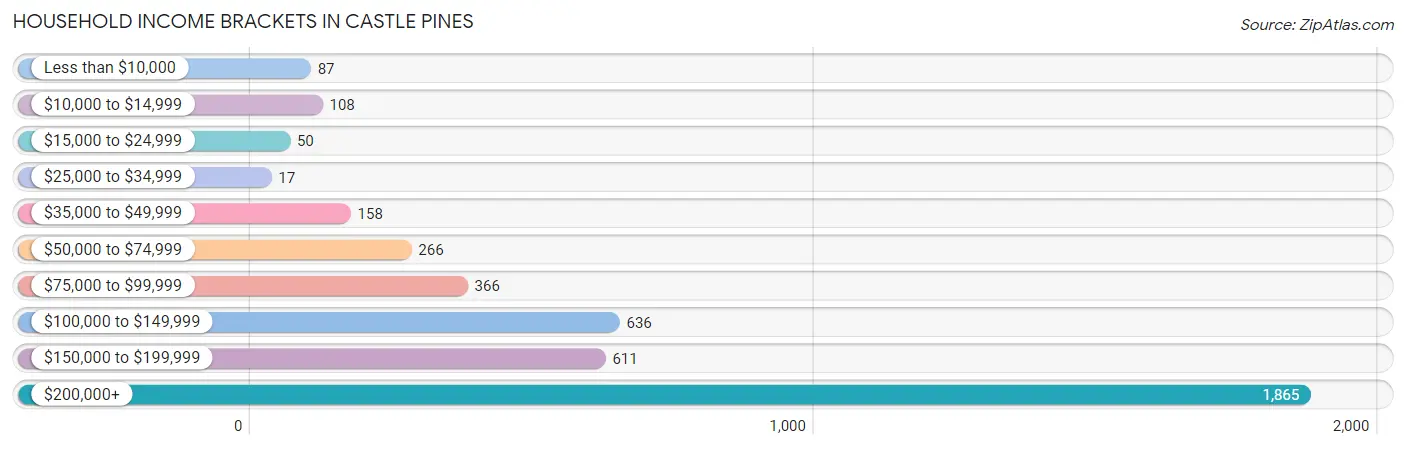
| Income Bracket | # Households | % Households |
| Less than $10,000 | 87 | 2.1% |
| $10,000 to $14,999 | 108 | 2.6% |
| $15,000 to $24,999 | 50 | 1.2% |
| $25,000 to $34,999 | 17 | 0.4% |
| $35,000 to $49,999 | 158 | 3.8% |
| $50,000 to $74,999 | 266 | 6.4% |
| $75,000 to $99,999 | 366 | 8.8% |
| $100,000 to $149,999 | 636 | 15.3% |
| $150,000 to $199,999 | 611 | 14.7% |
| $200,000+ | 1,865 | 44.9% |
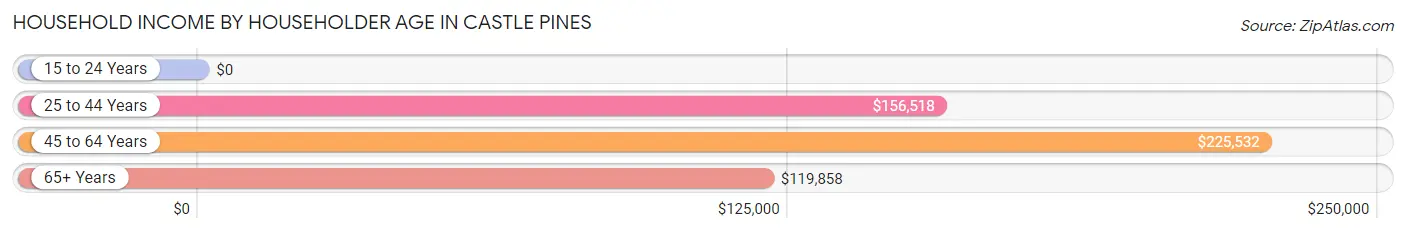
Household Income by Householder Age in Castle Pines
The median household income in Castle Pines is $189,280, with the highest median household income of $225,532 found in the 45 to 64 years age bracket for the primary householder. A total of 2,029 households (48.8%) fall into this category. Meanwhile, the 15 to 24 years age bracket for the primary householder has the lowest median household income of $0, with 38 households (0.9%) in this group.
| Income Bracket | # Households | Median Income |
| 15 to 24 Years | 38 (0.9%) | $0 |
| 25 to 44 Years | 1,025 (24.7%) | $156,518 |
| 45 to 64 Years | 2,029 (48.8%) | $225,532 |
| 65+ Years | 1,062 (25.6%) | $119,858 |
| Total | 4,154 (100.0%) | $189,280 |
Poverty in Castle Pines
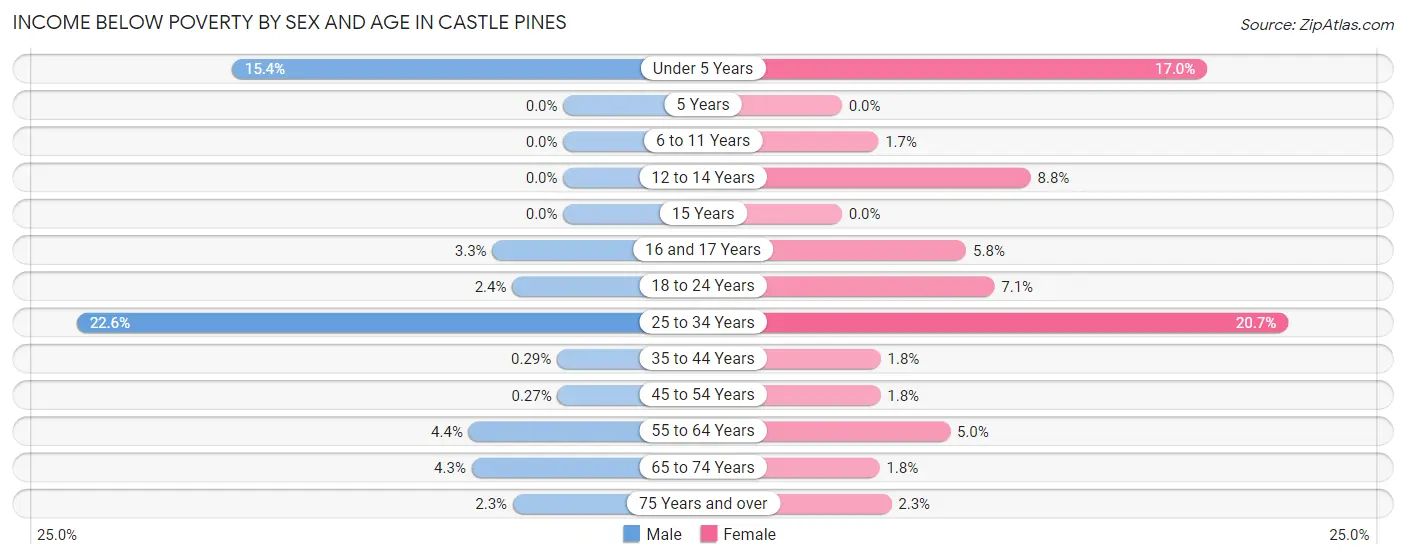
Income Below Poverty by Sex and Age in Castle Pines
With 3.8% poverty level for males and 5.1% for females among the residents of Castle Pines, 25 to 34 year old males and 25 to 34 year old females are the most vulnerable to poverty, with 105 males (22.6%) and 87 females (20.7%) in their respective age groups living below the poverty level.
| Age Bracket | Male | Female |
| Under 5 Years | 24 (15.4%) | 40 (17.0%) |
| 5 Years | 0 (0.0%) | 0 (0.0%) |
| 6 to 11 Years | 0 (0.0%) | 9 (1.7%) |
| 12 to 14 Years | 0 (0.0%) | 19 (8.8%) |
| 15 Years | 0 (0.0%) | 0 (0.0%) |
| 16 and 17 Years | 10 (3.3%) | 9 (5.8%) |
| 18 to 24 Years | 12 (2.4%) | 34 (7.1%) |
| 25 to 34 Years | 105 (22.6%) | 87 (20.7%) |
| 35 to 44 Years | 2 (0.3%) | 14 (1.8%) |
| 45 to 54 Years | 3 (0.3%) | 17 (1.8%) |
| 55 to 64 Years | 37 (4.4%) | 50 (5.0%) |
| 65 to 74 Years | 26 (4.3%) | 10 (1.8%) |
| 75 Years and over | 7 (2.3%) | 10 (2.3%) |
| Total | 226 (3.8%) | 299 (5.1%) |
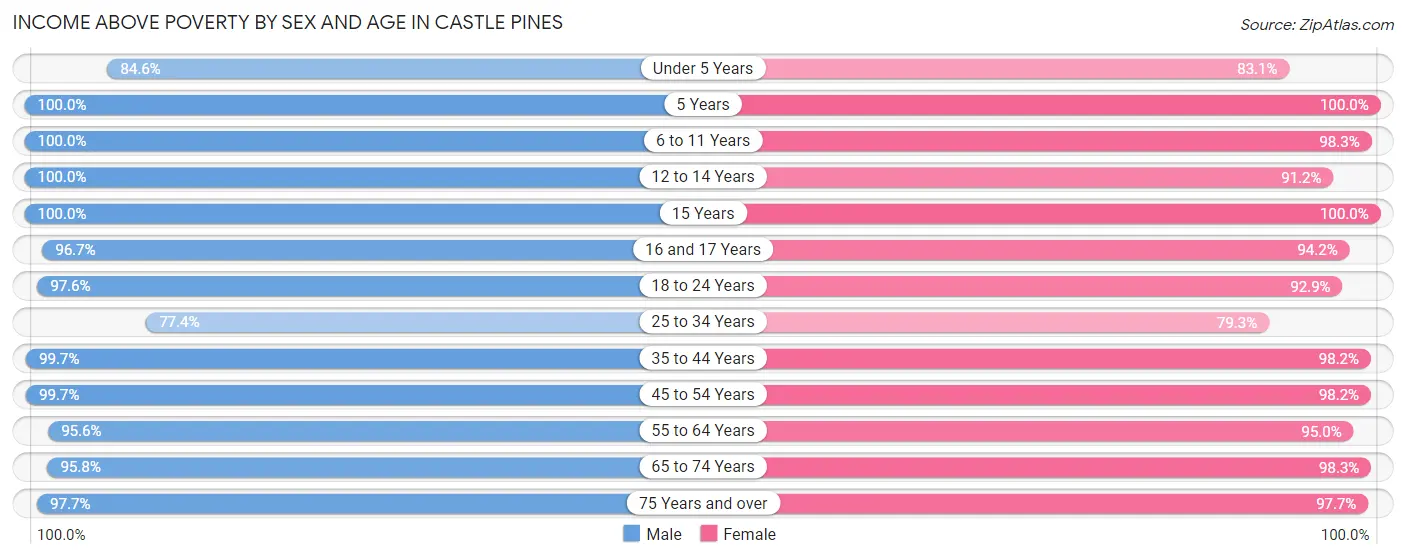
Income Above Poverty by Sex and Age in Castle Pines
According to the poverty statistics in Castle Pines, males aged 5 years and females aged 5 years are the age groups that are most secure financially, with 100.0% of males and 100.0% of females in these age groups living above the poverty line.
| Age Bracket | Male | Female |
| Under 5 Years | 132 (84.6%) | 196 (83.1%) |
| 5 Years | 33 (100.0%) | 51 (100.0%) |
| 6 to 11 Years | 496 (100.0%) | 522 (98.3%) |
| 12 to 14 Years | 300 (100.0%) | 198 (91.2%) |
| 15 Years | 119 (100.0%) | 30 (100.0%) |
| 16 and 17 Years | 294 (96.7%) | 147 (94.2%) |
| 18 to 24 Years | 495 (97.6%) | 446 (92.9%) |
| 25 to 34 Years | 360 (77.4%) | 333 (79.3%) |
| 35 to 44 Years | 699 (99.7%) | 764 (98.2%) |
| 45 to 54 Years | 1,102 (99.7%) | 933 (98.2%) |
| 55 to 64 Years | 806 (95.6%) | 946 (95.0%) |
| 65 to 74 Years | 586 (95.8%) | 561 (98.3%) |
| 75 Years and over | 292 (97.7%) | 424 (97.7%) |
| Total | 5,714 (96.2%) | 5,551 (94.9%) |
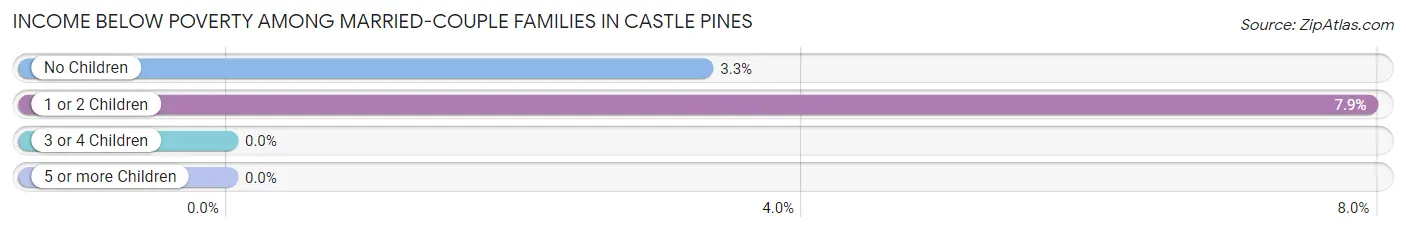
Income Below Poverty Among Married-Couple Families in Castle Pines
The poverty statistics for married-couple families in Castle Pines show that 4.8% or 152 of the total 3,159 families live below the poverty line. Families with 1 or 2 children have the highest poverty rate of 7.9%, comprising of 92 families. On the other hand, families with 3 or 4 children have the lowest poverty rate of 0.0%, which includes 0 families.
| Children | Above Poverty | Below Poverty |
| No Children | 1,750 (96.7%) | 60 (3.3%) |
| 1 or 2 Children | 1,067 (92.1%) | 92 (7.9%) |
| 3 or 4 Children | 182 (100.0%) | 0 (0.0%) |
| 5 or more Children | 8 (100.0%) | 0 (0.0%) |
| Total | 3,007 (95.2%) | 152 (4.8%) |
Income Below Poverty Among Single-Parent Households in Castle Pines
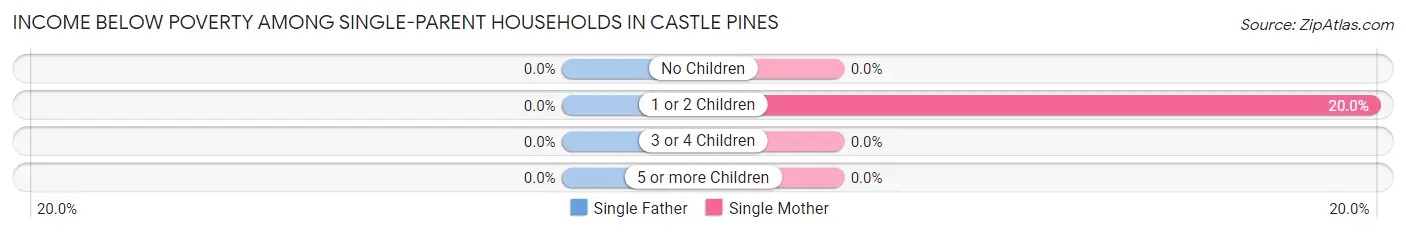
| Children | Single Father | Single Mother |
| No Children | 0 (0.0%) | 0 (0.0%) |
| 1 or 2 Children | 0 (0.0%) | 27 (20.0%) |
| 3 or 4 Children | 0 (0.0%) | 0 (0.0%) |
| 5 or more Children | 0 (0.0%) | 0 (0.0%) |
| Total | 0 (0.0%) | 27 (13.6%) |
Income Below Poverty Among Married-Couple vs Single-Parent Households in Castle Pines
The poverty data for Castle Pines shows that 152 of the married-couple family households (4.8%) and 27 of the single-parent households (6.9%) are living below the poverty level. Within the married-couple family households, those with 1 or 2 children have the highest poverty rate, with 92 households (7.9%) falling below the poverty line. Among the single-parent households, those with 1 or 2 children have the highest poverty rate, with 27 household (13.0%) living below poverty.
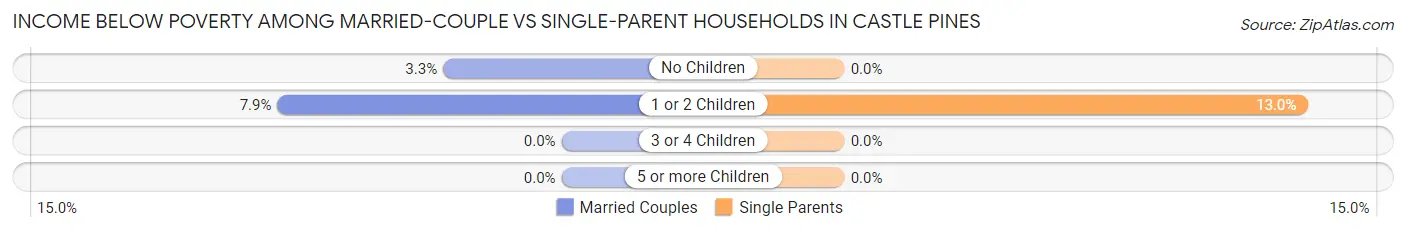
| Children | Married-Couple Families | Single-Parent Households |
| No Children | 60 (3.3%) | 0 (0.0%) |
| 1 or 2 Children | 92 (7.9%) | 27 (13.0%) |
| 3 or 4 Children | 0 (0.0%) | 0 (0.0%) |
| 5 or more Children | 0 (0.0%) | 0 (0.0%) |
| Total | 152 (4.8%) | 27 (6.9%) |
Race in Castle Pines
The most populous races in Castle Pines are White / Caucasian (9,577 | 81.1%), Hispanic or Latino (927 | 7.9%), and Two or more Races (780 | 6.6%).
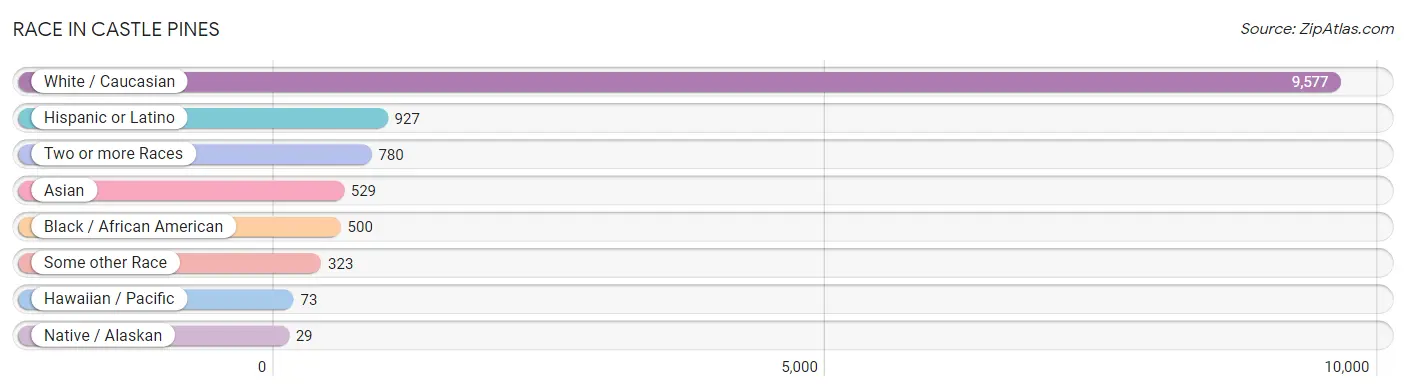
| Race | # Population | % Population |
| Asian | 529 | 4.5% |
| Black / African American | 500 | 4.2% |
| Hawaiian / Pacific | 73 | 0.6% |
| Hispanic or Latino | 927 | 7.9% |
| Native / Alaskan | 29 | 0.3% |
| White / Caucasian | 9,577 | 81.1% |
| Two or more Races | 780 | 6.6% |
| Some other Race | 323 | 2.7% |
| Total | 11,811 | 100.0% |
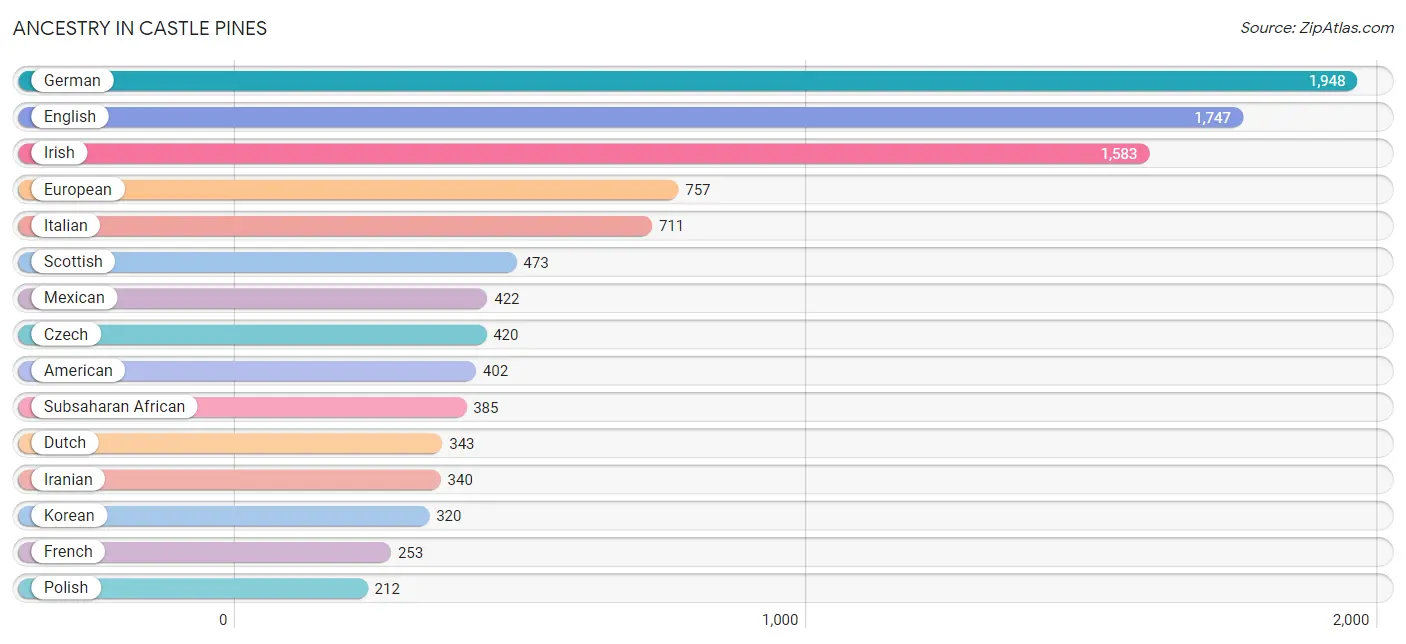
Ancestry in Castle Pines
The most populous ancestries reported in Castle Pines are German (1,948 | 16.5%), English (1,747 | 14.8%), Irish (1,583 | 13.4%), European (757 | 6.4%), and Italian (711 | 6.0%), together accounting for 57.1% of all Castle Pines residents.
| Ancestry | # Population | % Population |
| African | 92 | 0.8% |
| American | 402 | 3.4% |
| Austrian | 79 | 0.7% |
| Brazilian | 9 | 0.1% |
| British | 68 | 0.6% |
| Canadian | 70 | 0.6% |
| Cherokee | 14 | 0.1% |
| Chippewa | 7 | 0.1% |
| Choctaw | 20 | 0.2% |
| Colombian | 25 | 0.2% |
| Creek | 9 | 0.1% |
| Croatian | 57 | 0.5% |
| Cuban | 58 | 0.5% |
| Czech | 420 | 3.6% |
| Czechoslovakian | 18 | 0.2% |
| Danish | 88 | 0.7% |
| Dutch | 343 | 2.9% |
| Eastern European | 117 | 1.0% |
| English | 1,747 | 14.8% |
| Ethiopian | 21 | 0.2% |
| European | 757 | 6.4% |
| Finnish | 120 | 1.0% |
| French | 253 | 2.1% |
| French Canadian | 69 | 0.6% |
| German | 1,948 | 16.5% |
| Hungarian | 128 | 1.1% |
| Indian (Asian) | 82 | 0.7% |
| Iranian | 340 | 2.9% |
| Irish | 1,583 | 13.4% |
| Italian | 711 | 6.0% |
| Korean | 320 | 2.7% |
| Lithuanian | 109 | 0.9% |
| Luxembourger | 26 | 0.2% |
| Mexican | 422 | 3.6% |
| Native Hawaiian | 73 | 0.6% |
| Northern European | 10 | 0.1% |
| Norwegian | 134 | 1.1% |
| Pakistani | 7 | 0.1% |
| Polish | 212 | 1.8% |
| Portuguese | 12 | 0.1% |
| Russian | 49 | 0.4% |
| Scandinavian | 129 | 1.1% |
| Scotch-Irish | 113 | 1.0% |
| Scottish | 473 | 4.0% |
| Slovak | 24 | 0.2% |
| Slovene | 12 | 0.1% |
| South American | 198 | 1.7% |
| Spaniard | 125 | 1.1% |
| Spanish | 92 | 0.8% |
| Sri Lankan | 5 | 0.0% |
| Subsaharan African | 385 | 3.3% |
| Sudanese | 156 | 1.3% |
| Swedish | 211 | 1.8% |
| Swiss | 20 | 0.2% |
| Thai | 170 | 1.4% |
| Venezuelan | 173 | 1.5% |
| Welsh | 28 | 0.2% |
| Yugoslavian | 8 | 0.1% | View All 58 Rows |
Immigrants in Castle Pines
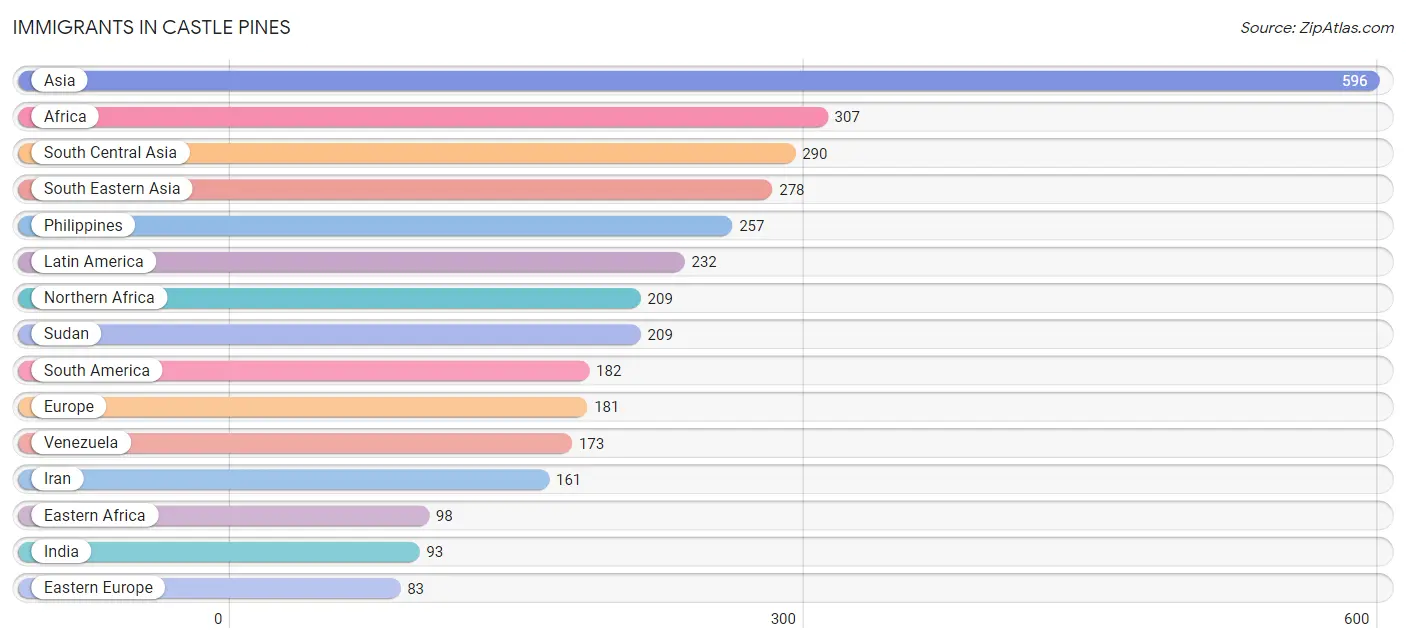
The most numerous immigrant groups reported in Castle Pines came from Asia (596 | 5.1%), Africa (307 | 2.6%), South Central Asia (290 | 2.5%), South Eastern Asia (278 | 2.4%), and Philippines (257 | 2.2%), together accounting for 14.6% of all Castle Pines residents.
| Immigration Origin | # Population | % Population |
| Africa | 307 | 2.6% |
| Asia | 596 | 5.1% |
| Brazil | 9 | 0.1% |
| Canada | 45 | 0.4% |
| Central America | 50 | 0.4% |
| China | 18 | 0.2% |
| Czechoslovakia | 16 | 0.1% |
| Eastern Africa | 98 | 0.8% |
| Eastern Asia | 28 | 0.2% |
| Eastern Europe | 83 | 0.7% |
| England | 32 | 0.3% |
| Ethiopia | 21 | 0.2% |
| Europe | 181 | 1.5% |
| Hungary | 10 | 0.1% |
| India | 93 | 0.8% |
| Indonesia | 9 | 0.1% |
| Iran | 161 | 1.4% |
| Japan | 10 | 0.1% |
| Kazakhstan | 6 | 0.1% |
| Kenya | 38 | 0.3% |
| Latin America | 232 | 2.0% |
| Mexico | 50 | 0.4% |
| Northern Africa | 209 | 1.8% |
| Northern Europe | 32 | 0.3% |
| Philippines | 257 | 2.2% |
| Poland | 22 | 0.2% |
| Russia | 35 | 0.3% |
| South America | 182 | 1.5% |
| South Central Asia | 290 | 2.5% |
| South Eastern Asia | 278 | 2.4% |
| Southern Europe | 66 | 0.6% |
| Spain | 66 | 0.6% |
| Sri Lanka | 30 | 0.3% |
| Sudan | 209 | 1.8% |
| Thailand | 7 | 0.1% |
| Venezuela | 173 | 1.5% |
| Vietnam | 5 | 0.0% | View All 37 Rows |
Sex and Age in Castle Pines
Sex and Age in Castle Pines
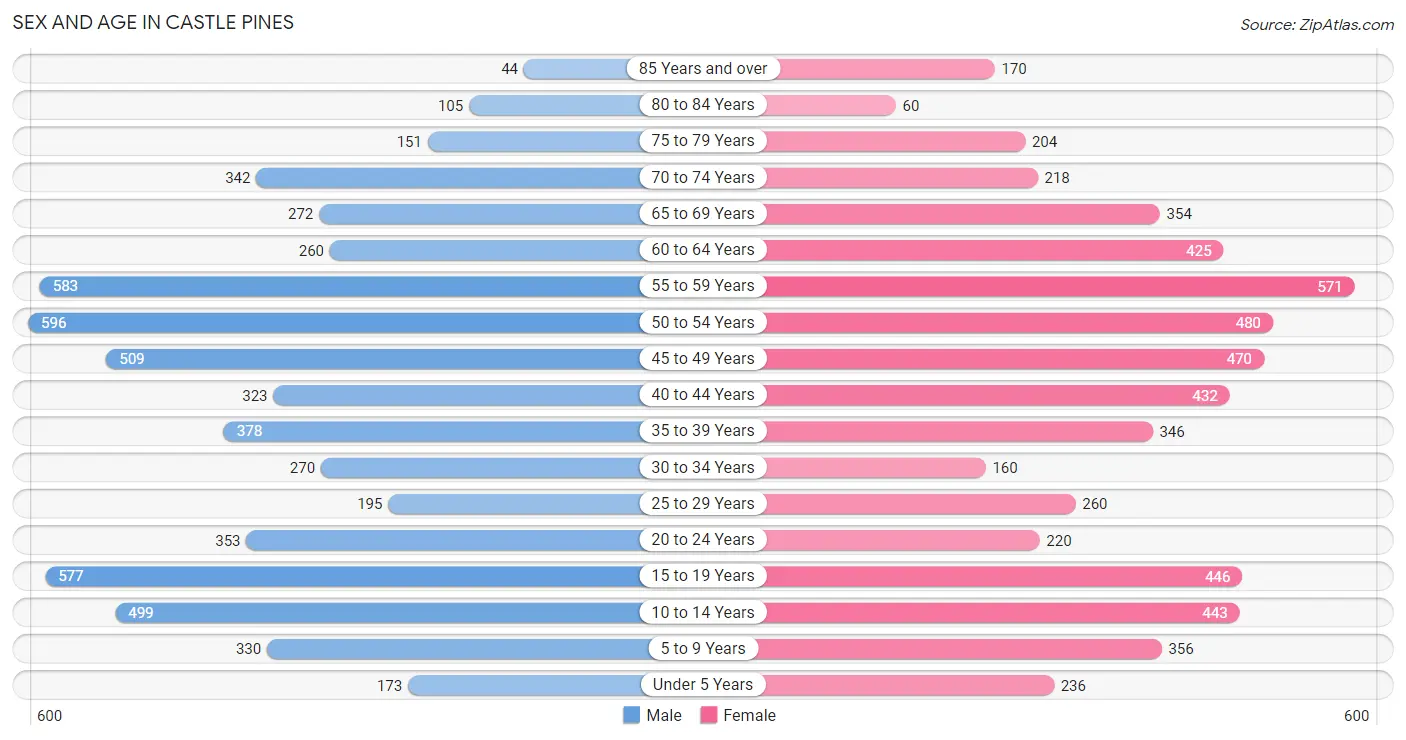
The most populous age groups in Castle Pines are 50 to 54 Years (596 | 10.0%) for men and 55 to 59 Years (571 | 9.8%) for women.
| Age Bracket | Male | Female |
| Under 5 Years | 173 (2.9%) | 236 (4.0%) |
| 5 to 9 Years | 330 (5.5%) | 356 (6.1%) |
| 10 to 14 Years | 499 (8.4%) | 443 (7.6%) |
| 15 to 19 Years | 577 (9.7%) | 446 (7.6%) |
| 20 to 24 Years | 353 (5.9%) | 220 (3.8%) |
| 25 to 29 Years | 195 (3.3%) | 260 (4.4%) |
| 30 to 34 Years | 270 (4.5%) | 160 (2.7%) |
| 35 to 39 Years | 378 (6.3%) | 346 (5.9%) |
| 40 to 44 Years | 323 (5.4%) | 432 (7.4%) |
| 45 to 49 Years | 509 (8.5%) | 470 (8.0%) |
| 50 to 54 Years | 596 (10.0%) | 480 (8.2%) |
| 55 to 59 Years | 583 (9.8%) | 571 (9.8%) |
| 60 to 64 Years | 260 (4.4%) | 425 (7.3%) |
| 65 to 69 Years | 272 (4.6%) | 354 (6.0%) |
| 70 to 74 Years | 342 (5.7%) | 218 (3.7%) |
| 75 to 79 Years | 151 (2.5%) | 204 (3.5%) |
| 80 to 84 Years | 105 (1.8%) | 60 (1.0%) |
| 85 Years and over | 44 (0.7%) | 170 (2.9%) |
| Total | 5,960 (100.0%) | 5,851 (100.0%) |
Families and Households in Castle Pines
Median Family Size in Castle Pines
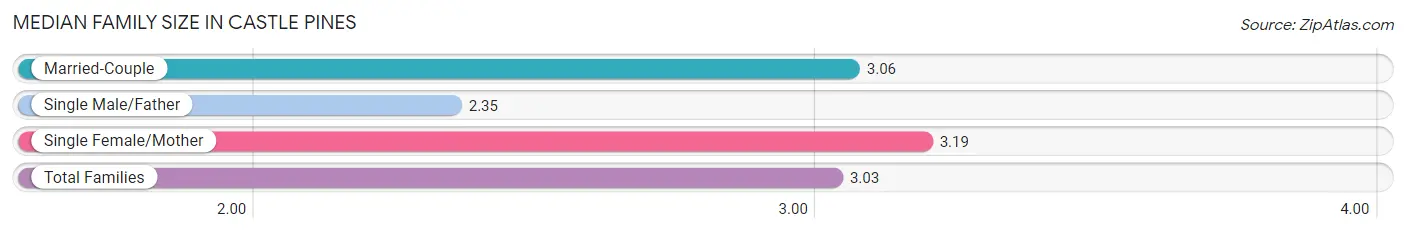
The median family size in Castle Pines is 3.03 persons per family, with single female/mother families (199 | 5.6%) accounting for the largest median family size of 3.19 persons per family. On the other hand, single male/father families (190 | 5.4%) represent the smallest median family size with 2.35 persons per family.
| Family Type | # Families | Family Size |
| Married-Couple | 3,159 (89.0%) | 3.06 |
| Single Male/Father | 190 (5.4%) | 2.35 |
| Single Female/Mother | 199 (5.6%) | 3.19 |
| Total Families | 3,548 (100.0%) | 3.03 |
Median Household Size in Castle Pines
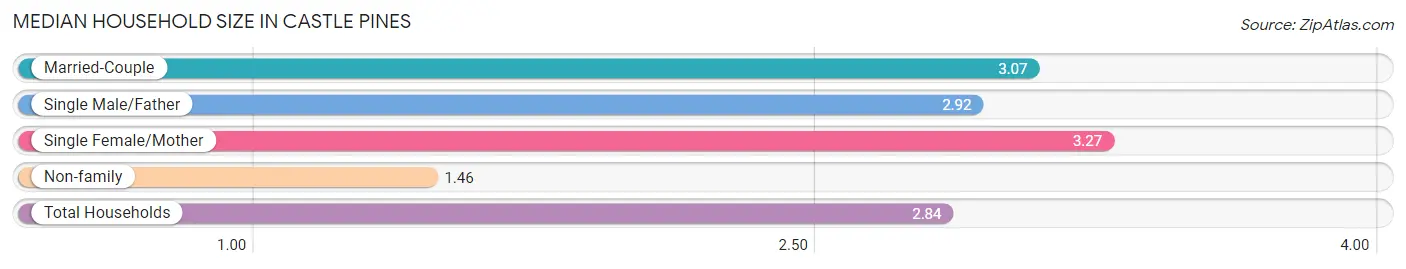
The median household size in Castle Pines is 2.84 persons per household, with single female/mother households (199 | 4.8%) accounting for the largest median household size of 3.27 persons per household. non-family households (606 | 14.6%) represent the smallest median household size with 1.46 persons per household.
| Household Type | # Households | Household Size |
| Married-Couple | 3,159 (76.0%) | 3.07 |
| Single Male/Father | 190 (4.6%) | 2.92 |
| Single Female/Mother | 199 (4.8%) | 3.27 |
| Non-family | 606 (14.6%) | 1.46 |
| Total Households | 4,154 (100.0%) | 2.84 |
Household Size by Marriage Status in Castle Pines
Out of a total of 4,154 households in Castle Pines, 3,548 (85.4%) are family households, while 606 (14.6%) are nonfamily households. The most numerous type of family households are 2-person households, comprising 1,388, and the most common type of nonfamily households are 1-person households, comprising 399.
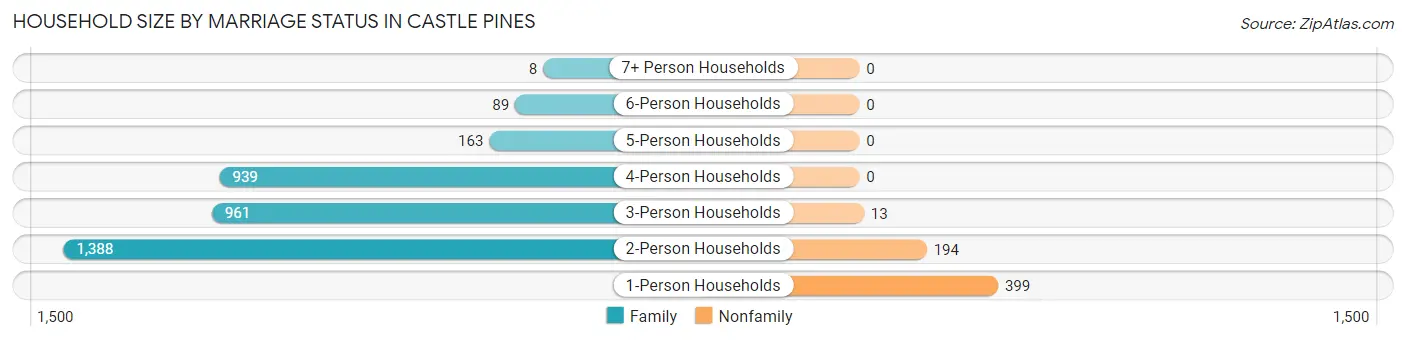
| Household Size | Family Households | Nonfamily Households |
| 1-Person Households | - | 399 (9.6%) |
| 2-Person Households | 1,388 (33.4%) | 194 (4.7%) |
| 3-Person Households | 961 (23.1%) | 13 (0.3%) |
| 4-Person Households | 939 (22.6%) | 0 (0.0%) |
| 5-Person Households | 163 (3.9%) | 0 (0.0%) |
| 6-Person Households | 89 (2.1%) | 0 (0.0%) |
| 7+ Person Households | 8 (0.2%) | 0 (0.0%) |
| Total | 3,548 (85.4%) | 606 (14.6%) |
Female Fertility in Castle Pines
Fertility by Age in Castle Pines
Average fertility rate in Castle Pines is 47.0 births per 1,000 women. Women in the age bracket of 35 to 50 years have the highest fertility rate with 76.0 births per 1,000 women. Women in the age bracket of 35 to 50 years acount for 90.6% of all women with births.
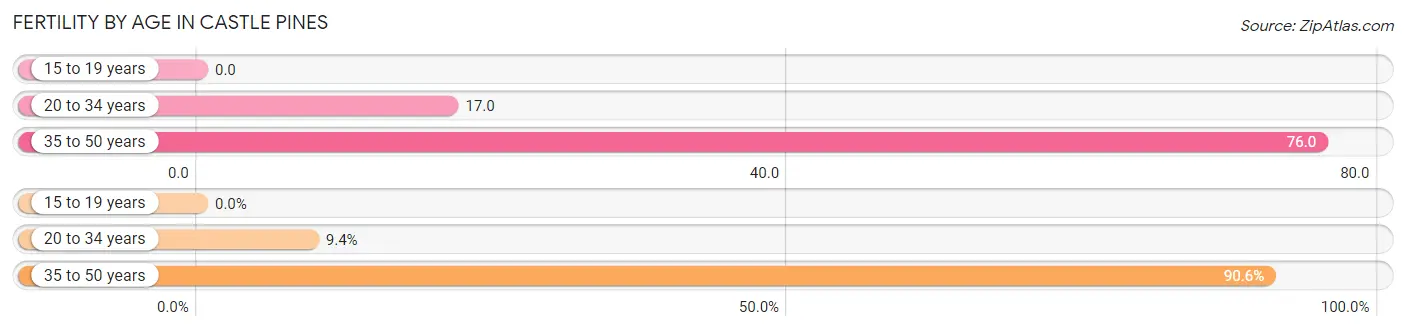
| Age Bracket | Women with Births | Births / 1,000 Women |
| 15 to 19 years | 0 (0.0%) | 0.0 |
| 20 to 34 years | 11 (9.4%) | 17.0 |
| 35 to 50 years | 106 (90.6%) | 76.0 |
| Total | 117 (100.0%) | 47.0 |
Fertility by Age by Marriage Status in Castle Pines
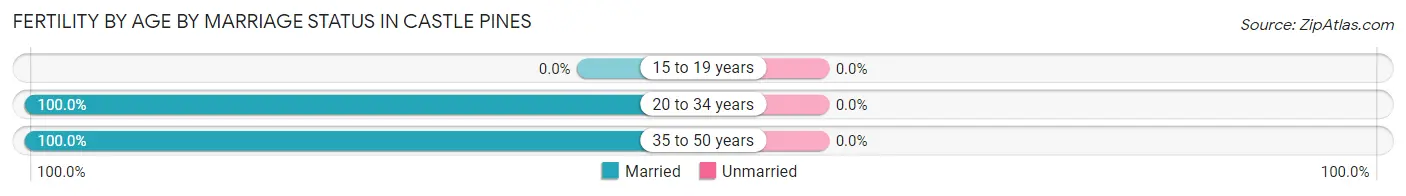
| Age Bracket | Married | Unmarried |
| 15 to 19 years | 0 (0.0%) | 0 (0.0%) |
| 20 to 34 years | 11 (100.0%) | 0 (0.0%) |
| 35 to 50 years | 106 (100.0%) | 0 (0.0%) |
| Total | 117 (100.0%) | 0 (0.0%) |
Fertility by Education in Castle Pines
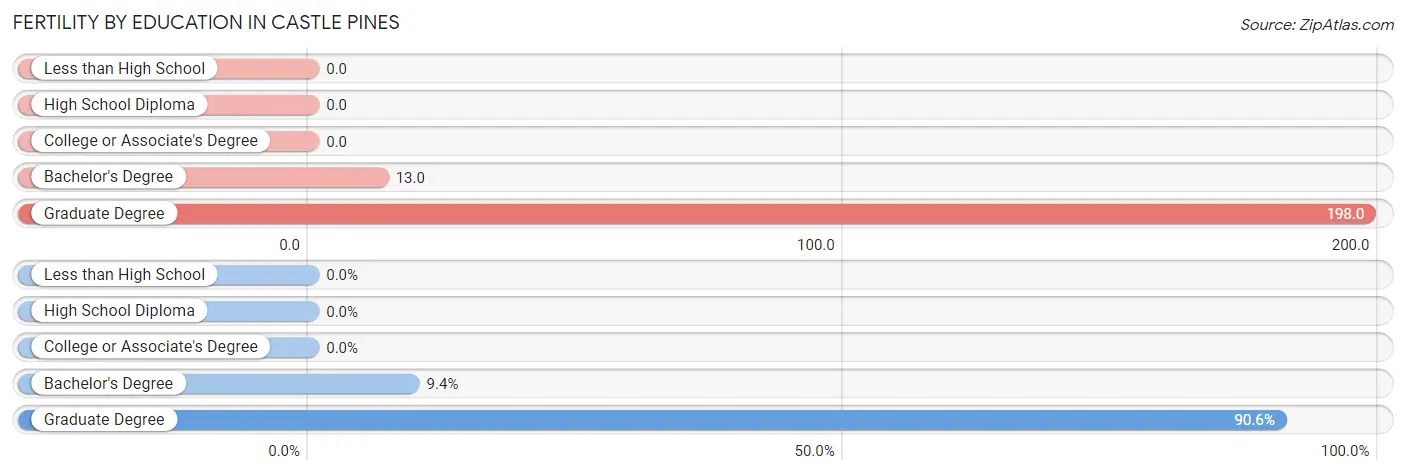
| Educational Attainment | Women with Births | Births / 1,000 Women |
| Less than High School | 0 (0.0%) | 0.0 |
| High School Diploma | 0 (0.0%) | 0.0 |
| College or Associate's Degree | 0 (0.0%) | 0.0 |
| Bachelor's Degree | 11 (9.4%) | 13.0 |
| Graduate Degree | 106 (90.6%) | 198.0 |
| Total | 117 (100.0%) | 47.0 |
Fertility by Education by Marriage Status in Castle Pines
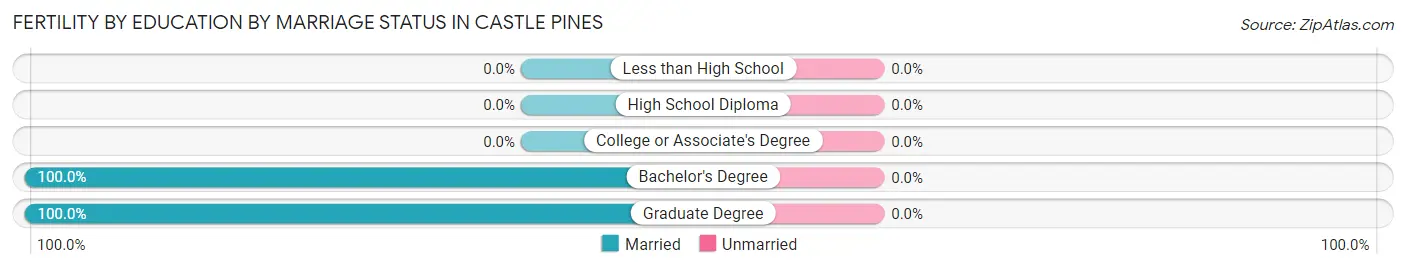
| Educational Attainment | Married | Unmarried |
| Less than High School | 0 (0.0%) | 0 (0.0%) |
| High School Diploma | 0 (0.0%) | 0 (0.0%) |
| College or Associate's Degree | 0 (0.0%) | 0 (0.0%) |
| Bachelor's Degree | 11 (100.0%) | 0 (0.0%) |
| Graduate Degree | 106 (100.0%) | 0 (0.0%) |
| Total | 117 (100.0%) | 0 (0.0%) |
Employment Characteristics in Castle Pines
Employment by Class of Employer in Castle Pines
Among the 6,333 employed individuals in Castle Pines, private company employees (4,180 | 66.0%), not-for-profit organizations (534 | 8.4%), and local government employees (529 | 8.4%) make up the most common classes of employment.
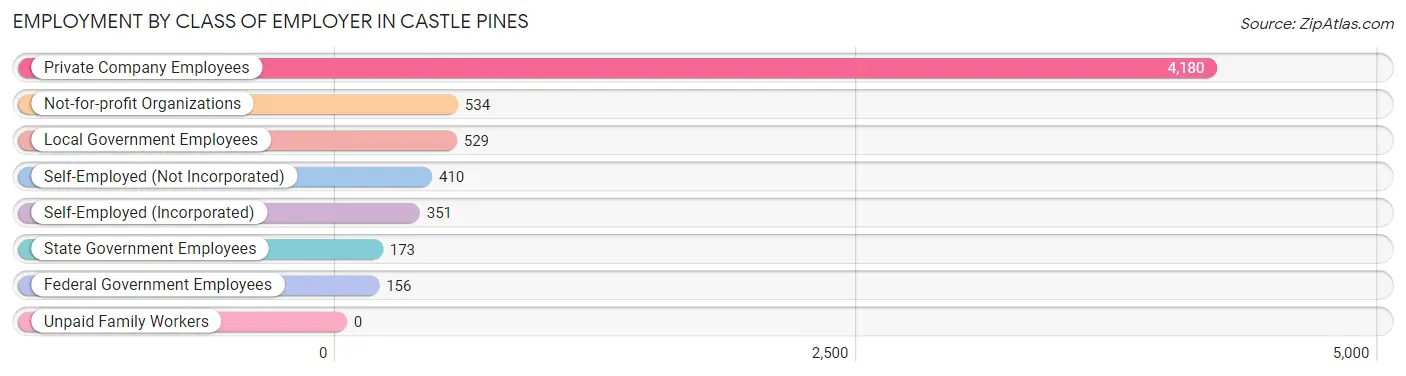
| Employer Class | # Employees | % Employees |
| Private Company Employees | 4,180 | 66.0% |
| Self-Employed (Incorporated) | 351 | 5.5% |
| Self-Employed (Not Incorporated) | 410 | 6.5% |
| Not-for-profit Organizations | 534 | 8.4% |
| Local Government Employees | 529 | 8.4% |
| State Government Employees | 173 | 2.7% |
| Federal Government Employees | 156 | 2.5% |
| Unpaid Family Workers | 0 | 0.0% |
| Total | 6,333 | 100.0% |
Employment Status by Age in Castle Pines
According to the labor force statistics for Castle Pines, out of the total population over 16 years of age (9,625), 69.1% or 6,651 individuals are in the labor force, with 3.6% or 239 of them unemployed. The age group with the highest labor force participation rate is 25 to 29 years, with 96.5% or 439 individuals in the labor force. Within the labor force, the 20 to 24 years age range has the highest percentage of unemployed individuals, with 16.0% or 57 of them being unemployed.
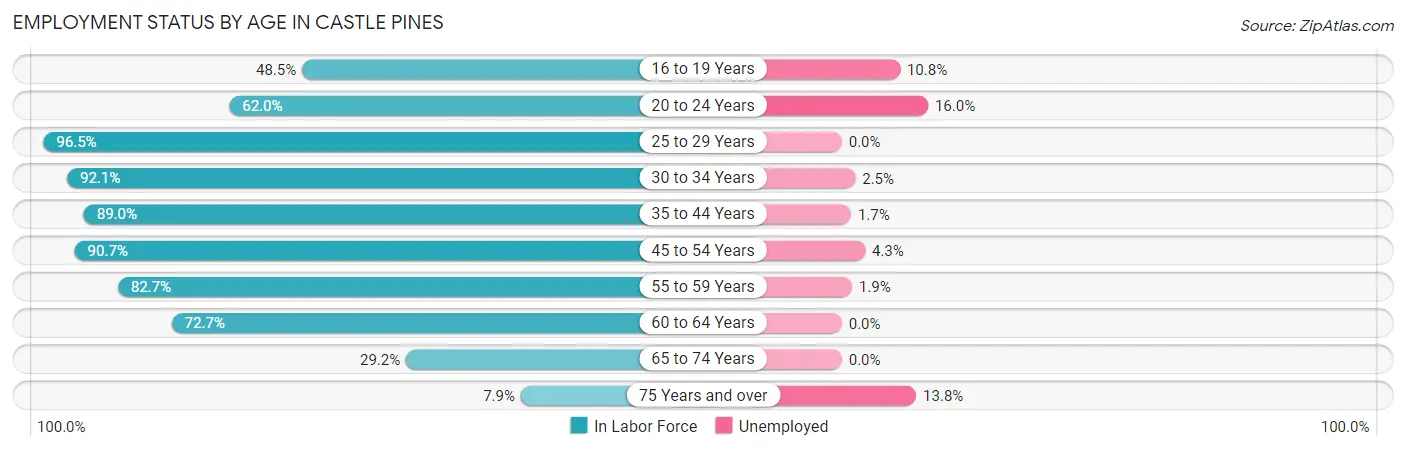
| Age Bracket | In Labor Force | Unemployed |
| 16 to 19 Years | 424 (48.5%) | 46 (10.8%) |
| 20 to 24 Years | 355 (62.0%) | 57 (16.0%) |
| 25 to 29 Years | 439 (96.5%) | 0 (0.0%) |
| 30 to 34 Years | 396 (92.1%) | 10 (2.5%) |
| 35 to 44 Years | 1,316 (89.0%) | 22 (1.7%) |
| 45 to 54 Years | 1,864 (90.7%) | 80 (4.3%) |
| 55 to 59 Years | 954 (82.7%) | 18 (1.9%) |
| 60 to 64 Years | 498 (72.7%) | 0 (0.0%) |
| 65 to 74 Years | 346 (29.2%) | 0 (0.0%) |
| 75 Years and over | 58 (7.9%) | 8 (13.8%) |
| Total | 6,651 (69.1%) | 239 (3.6%) |
Employment Status by Educational Attainment in Castle Pines
According to labor force statistics for Castle Pines, 87.4% of individuals (5,469) out of the total population between 25 and 64 years of age (6,258) are in the labor force, with 2.4% or 131 of them being unemployed. The group with the highest labor force participation rate are those with the educational attainment of bachelor's degree or higher, with 90.2% or 3,953 individuals in the labor force. Within the labor force, individuals with bachelor's degree or higher education have the highest percentage of unemployment, with 2.8% or 111 of them being unemployed.
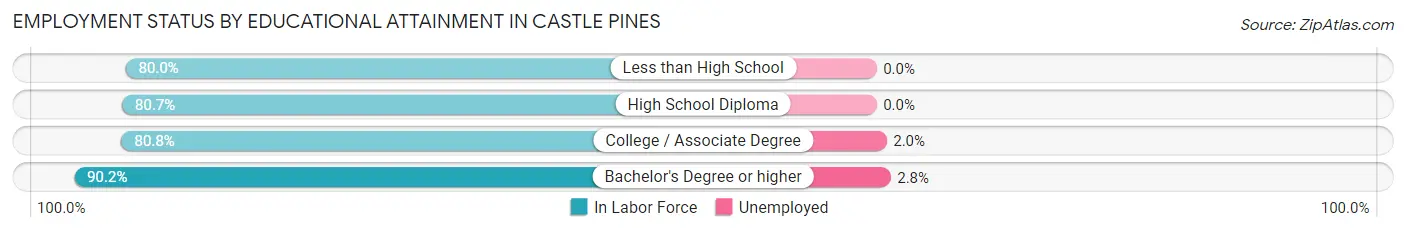
| Educational Attainment | In Labor Force | Unemployed |
| Less than High School | 28 (80.0%) | 0 (0.0%) |
| High School Diploma | 415 (80.7%) | 0 (0.0%) |
| College / Associate Degree | 1,072 (80.8%) | 27 (2.0%) |
| Bachelor's Degree or higher | 3,953 (90.2%) | 123 (2.8%) |
| Total | 5,469 (87.4%) | 150 (2.4%) |
Employment Occupations by Sex in Castle Pines
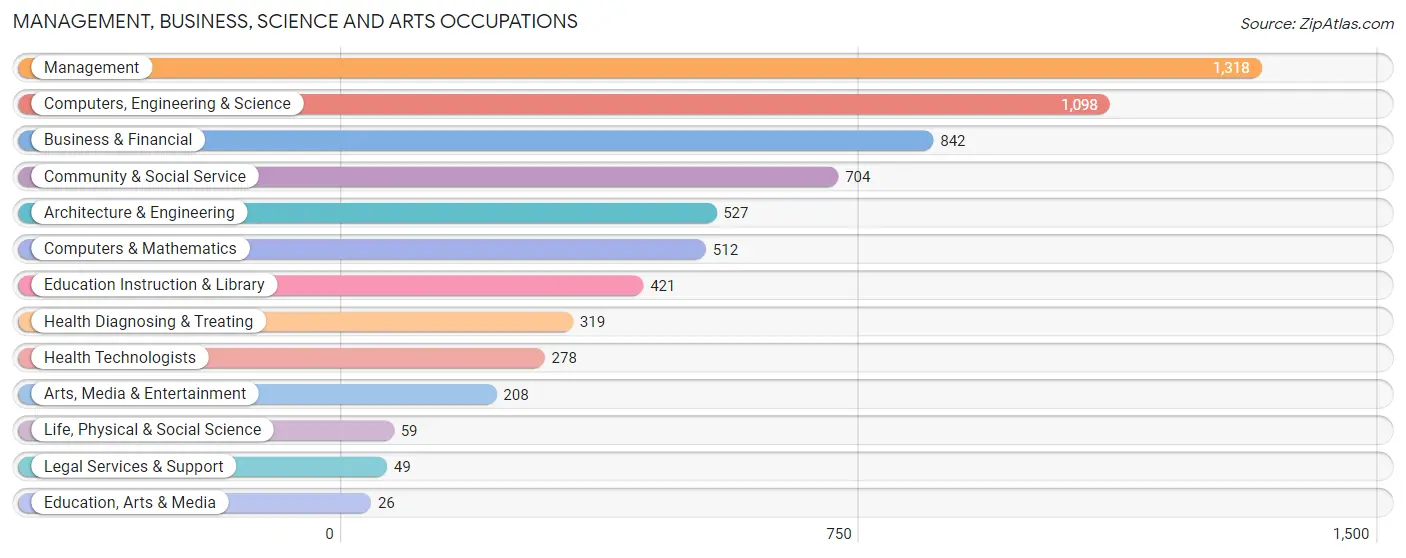
Management, Business, Science and Arts Occupations
The most common Management, Business, Science and Arts occupations in Castle Pines are Management (1,318 | 20.6%), Computers, Engineering & Science (1,098 | 17.2%), Business & Financial (842 | 13.2%), Community & Social Service (704 | 11.0%), and Architecture & Engineering (527 | 8.2%).
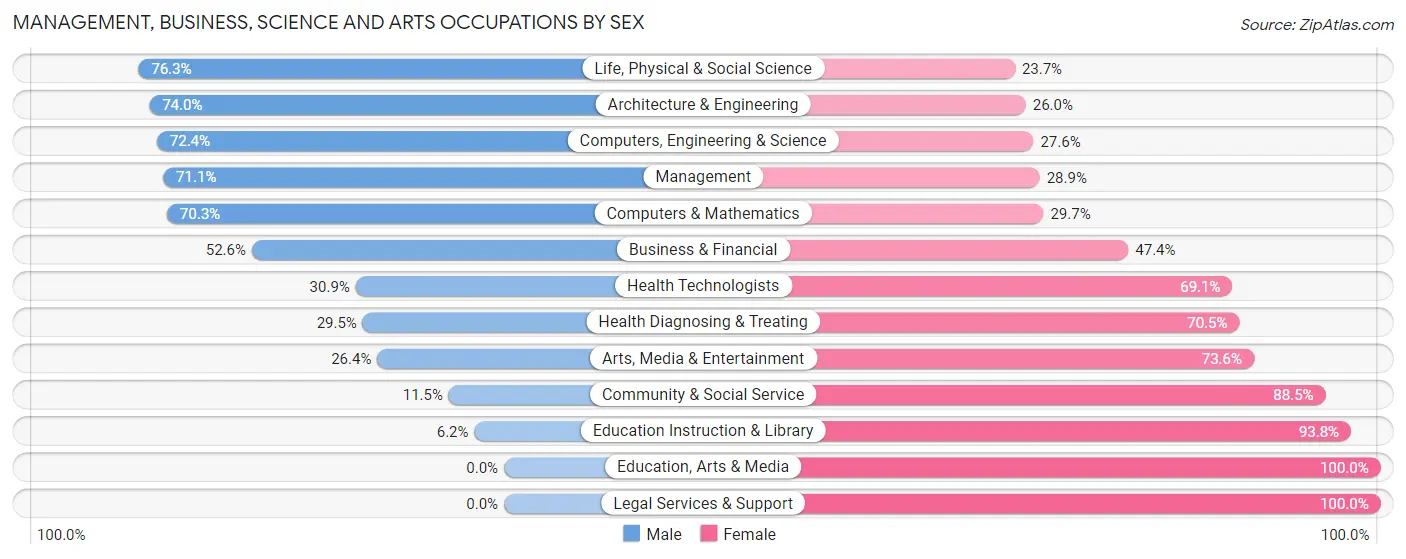
Management, Business, Science and Arts Occupations by Sex
Within the Management, Business, Science and Arts occupations in Castle Pines, the most male-oriented occupations are Life, Physical & Social Science (76.3%), Architecture & Engineering (74.0%), and Computers, Engineering & Science (72.4%), while the most female-oriented occupations are Education, Arts & Media (100.0%), Legal Services & Support (100.0%), and Education Instruction & Library (93.8%).
| Occupation | Male | Female |
| Management | 937 (71.1%) | 381 (28.9%) |
| Business & Financial | 443 (52.6%) | 399 (47.4%) |
| Computers, Engineering & Science | 795 (72.4%) | 303 (27.6%) |
| Computers & Mathematics | 360 (70.3%) | 152 (29.7%) |
| Architecture & Engineering | 390 (74.0%) | 137 (26.0%) |
| Life, Physical & Social Science | 45 (76.3%) | 14 (23.7%) |
| Community & Social Service | 81 (11.5%) | 623 (88.5%) |
| Education, Arts & Media | 0 (0.0%) | 26 (100.0%) |
| Legal Services & Support | 0 (0.0%) | 49 (100.0%) |
| Education Instruction & Library | 26 (6.2%) | 395 (93.8%) |
| Arts, Media & Entertainment | 55 (26.4%) | 153 (73.6%) |
| Health Diagnosing & Treating | 94 (29.5%) | 225 (70.5%) |
| Health Technologists | 86 (30.9%) | 192 (69.1%) |
| Total (Category) | 2,350 (54.9%) | 1,931 (45.1%) |
| Total (Overall) | 3,353 (52.4%) | 3,048 (47.6%) |
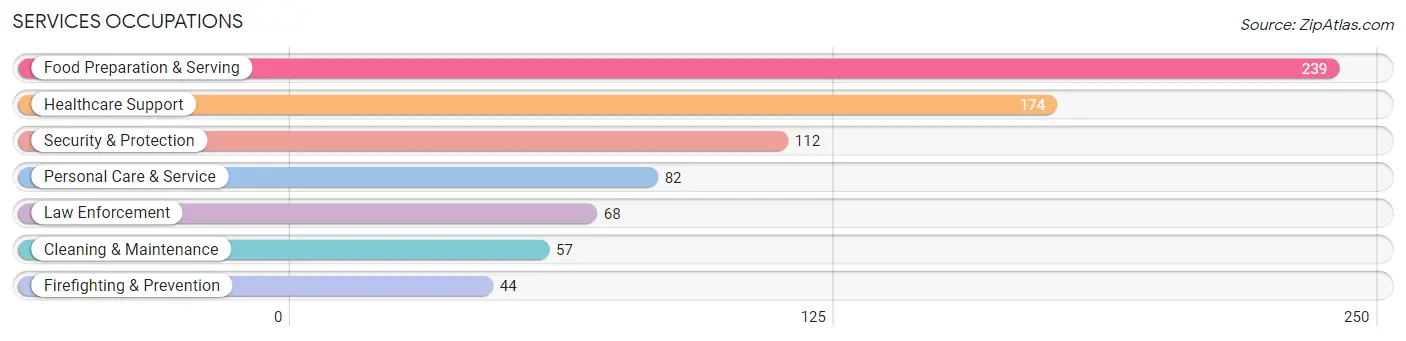
Services Occupations
The most common Services occupations in Castle Pines are Food Preparation & Serving (239 | 3.7%), Healthcare Support (174 | 2.7%), Security & Protection (112 | 1.8%), Personal Care & Service (82 | 1.3%), and Law Enforcement (68 | 1.1%).
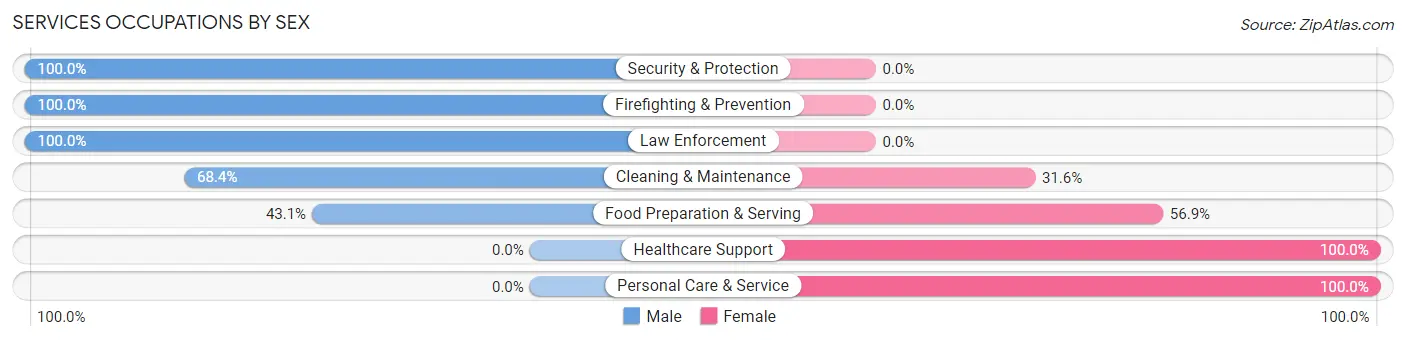
Services Occupations by Sex
Within the Services occupations in Castle Pines, the most male-oriented occupations are Security & Protection (100.0%), Firefighting & Prevention (100.0%), and Law Enforcement (100.0%), while the most female-oriented occupations are Healthcare Support (100.0%), Personal Care & Service (100.0%), and Food Preparation & Serving (56.9%).
| Occupation | Male | Female |
| Healthcare Support | 0 (0.0%) | 174 (100.0%) |
| Security & Protection | 112 (100.0%) | 0 (0.0%) |
| Firefighting & Prevention | 44 (100.0%) | 0 (0.0%) |
| Law Enforcement | 68 (100.0%) | 0 (0.0%) |
| Food Preparation & Serving | 103 (43.1%) | 136 (56.9%) |
| Cleaning & Maintenance | 39 (68.4%) | 18 (31.6%) |
| Personal Care & Service | 0 (0.0%) | 82 (100.0%) |
| Total (Category) | 254 (38.3%) | 410 (61.8%) |
| Total (Overall) | 3,353 (52.4%) | 3,048 (47.6%) |
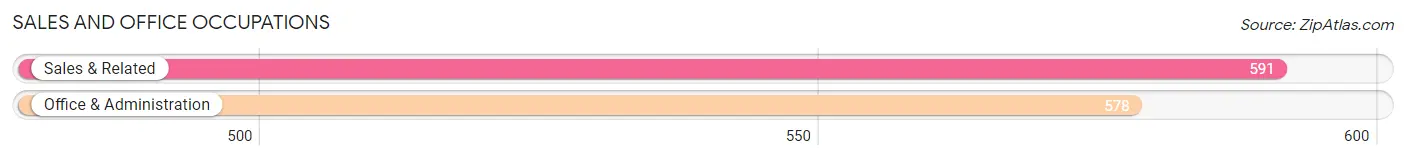
Sales and Office Occupations
The most common Sales and Office occupations in Castle Pines are Sales & Related (591 | 9.2%), and Office & Administration (578 | 9.0%).
Sales and Office Occupations by Sex
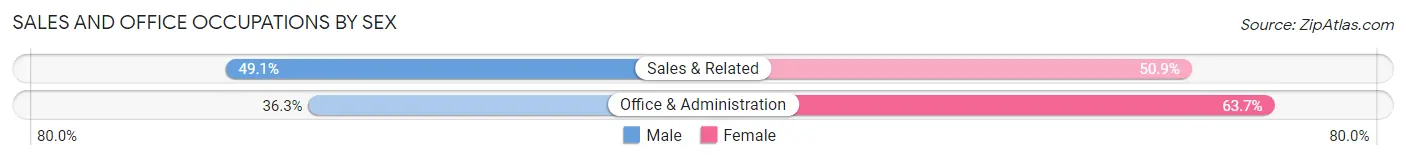
| Occupation | Male | Female |
| Sales & Related | 290 (49.1%) | 301 (50.9%) |
| Office & Administration | 210 (36.3%) | 368 (63.7%) |
| Total (Category) | 500 (42.8%) | 669 (57.2%) |
| Total (Overall) | 3,353 (52.4%) | 3,048 (47.6%) |
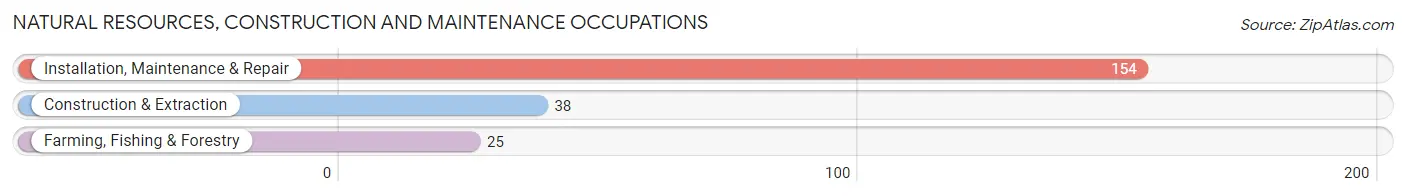
Natural Resources, Construction and Maintenance Occupations
The most common Natural Resources, Construction and Maintenance occupations in Castle Pines are Installation, Maintenance & Repair (154 | 2.4%), Construction & Extraction (38 | 0.6%), and Farming, Fishing & Forestry (25 | 0.4%).
Natural Resources, Construction and Maintenance Occupations by Sex
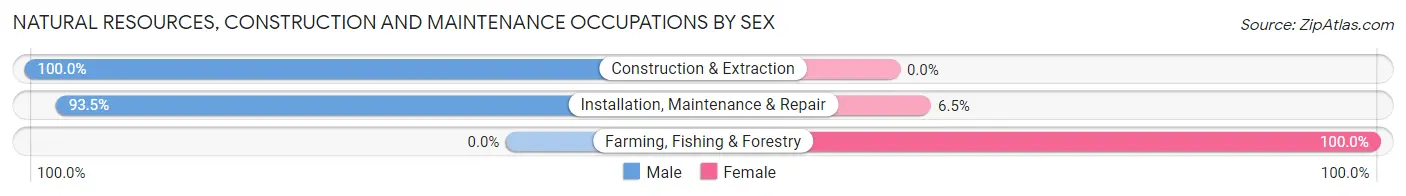
| Occupation | Male | Female |
| Farming, Fishing & Forestry | 0 (0.0%) | 25 (100.0%) |
| Construction & Extraction | 38 (100.0%) | 0 (0.0%) |
| Installation, Maintenance & Repair | 144 (93.5%) | 10 (6.5%) |
| Total (Category) | 182 (83.9%) | 35 (16.1%) |
| Total (Overall) | 3,353 (52.4%) | 3,048 (47.6%) |
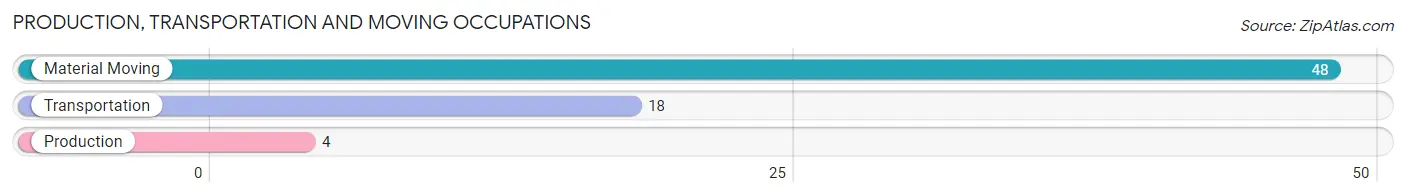
Production, Transportation and Moving Occupations
The most common Production, Transportation and Moving occupations in Castle Pines are Material Moving (48 | 0.7%), Transportation (18 | 0.3%), and Production (4 | 0.1%).
Production, Transportation and Moving Occupations by Sex
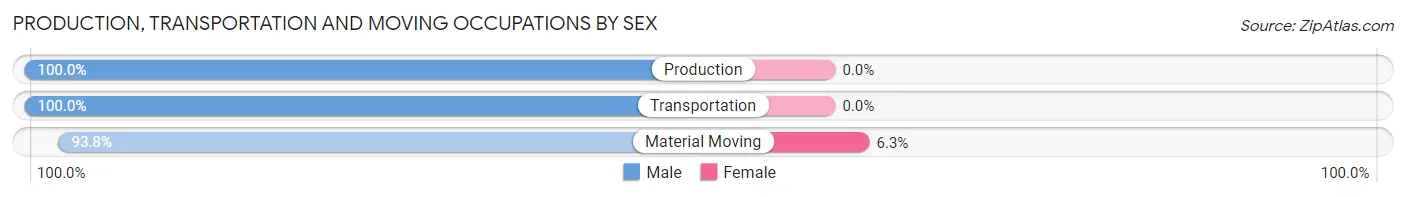
| Occupation | Male | Female |
| Production | 4 (100.0%) | 0 (0.0%) |
| Transportation | 18 (100.0%) | 0 (0.0%) |
| Material Moving | 45 (93.8%) | 3 (6.2%) |
| Total (Category) | 67 (95.7%) | 3 (4.3%) |
| Total (Overall) | 3,353 (52.4%) | 3,048 (47.6%) |
Employment Industries by Sex in Castle Pines
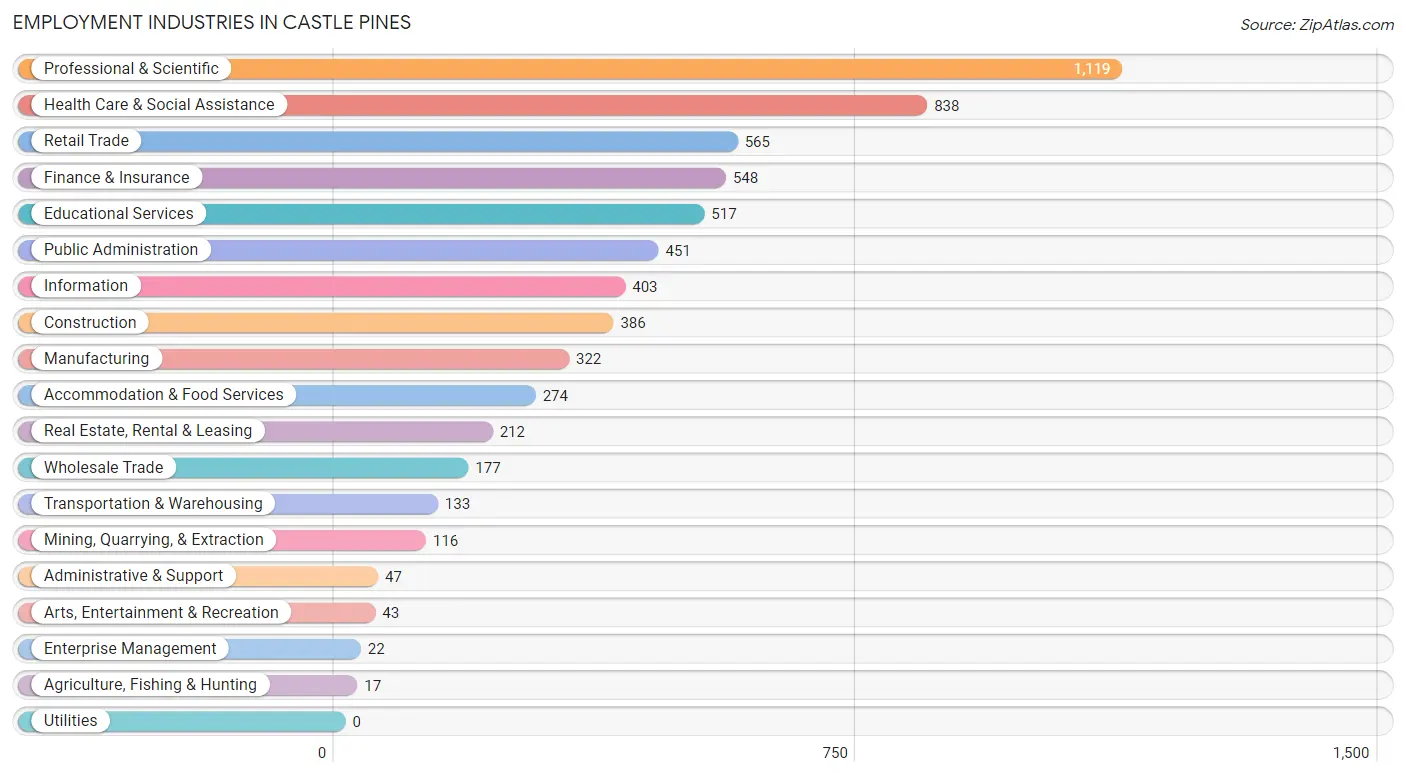
Employment Industries in Castle Pines
The major employment industries in Castle Pines include Professional & Scientific (1,119 | 17.5%), Health Care & Social Assistance (838 | 13.1%), Retail Trade (565 | 8.8%), Finance & Insurance (548 | 8.6%), and Educational Services (517 | 8.1%).
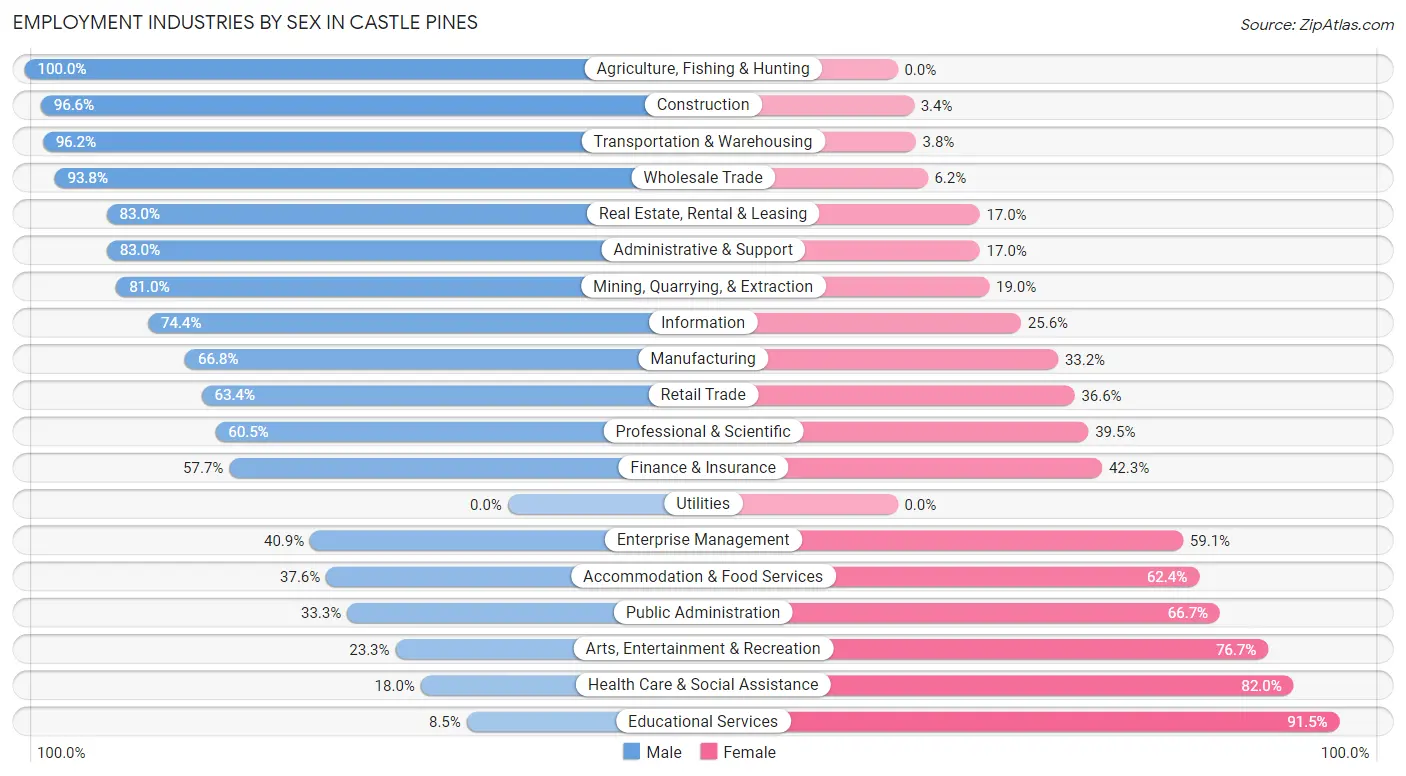
Employment Industries by Sex in Castle Pines
The Castle Pines industries that see more men than women are Agriculture, Fishing & Hunting (100.0%), Construction (96.6%), and Transportation & Warehousing (96.2%), whereas the industries that tend to have a higher number of women are Educational Services (91.5%), Health Care & Social Assistance (82.0%), and Arts, Entertainment & Recreation (76.7%).
| Industry | Male | Female |
| Agriculture, Fishing & Hunting | 17 (100.0%) | 0 (0.0%) |
| Mining, Quarrying, & Extraction | 94 (81.0%) | 22 (19.0%) |
| Construction | 373 (96.6%) | 13 (3.4%) |
| Manufacturing | 215 (66.8%) | 107 (33.2%) |
| Wholesale Trade | 166 (93.8%) | 11 (6.2%) |
| Retail Trade | 358 (63.4%) | 207 (36.6%) |
| Transportation & Warehousing | 128 (96.2%) | 5 (3.8%) |
| Utilities | 0 (0.0%) | 0 (0.0%) |
| Information | 300 (74.4%) | 103 (25.6%) |
| Finance & Insurance | 316 (57.7%) | 232 (42.3%) |
| Real Estate, Rental & Leasing | 176 (83.0%) | 36 (17.0%) |
| Professional & Scientific | 677 (60.5%) | 442 (39.5%) |
| Enterprise Management | 9 (40.9%) | 13 (59.1%) |
| Administrative & Support | 39 (83.0%) | 8 (17.0%) |
| Educational Services | 44 (8.5%) | 473 (91.5%) |
| Health Care & Social Assistance | 151 (18.0%) | 687 (82.0%) |
| Arts, Entertainment & Recreation | 10 (23.3%) | 33 (76.7%) |
| Accommodation & Food Services | 103 (37.6%) | 171 (62.4%) |
| Public Administration | 150 (33.3%) | 301 (66.7%) |
| Total | 3,353 (52.4%) | 3,048 (47.6%) |
Education in Castle Pines
School Enrollment in Castle Pines
The most common levels of schooling among the 3,292 students in Castle Pines are high school (871 | 26.5%), middle school (716 | 21.7%), and elementary school (665 | 20.2%).
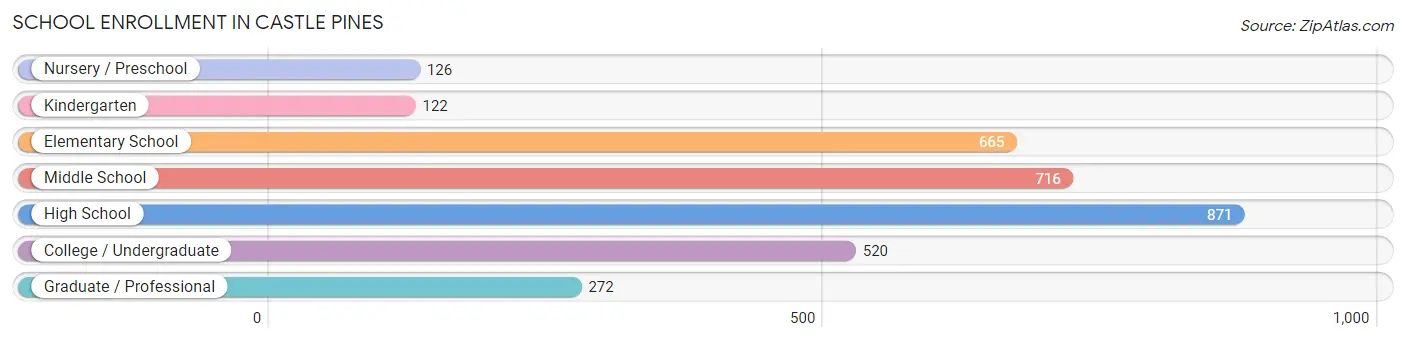
| School Level | # Students | % Students |
| Nursery / Preschool | 126 | 3.8% |
| Kindergarten | 122 | 3.7% |
| Elementary School | 665 | 20.2% |
| Middle School | 716 | 21.7% |
| High School | 871 | 26.5% |
| College / Undergraduate | 520 | 15.8% |
| Graduate / Professional | 272 | 8.3% |
| Total | 3,292 | 100.0% |
School Enrollment by Age by Funding Source in Castle Pines
Out of a total of 3,292 students who are enrolled in schools in Castle Pines, 602 (18.3%) attend a private institution, while the remaining 2,690 (81.7%) are enrolled in public schools. The age group of 3 to 4 year olds has the highest likelihood of being enrolled in private schools, with 97 (85.8% in the age bracket) enrolled. Conversely, the age group of 25 to 34 year olds has the lowest likelihood of being enrolled in a private school, with 202 (100.0% in the age bracket) attending a public institution.
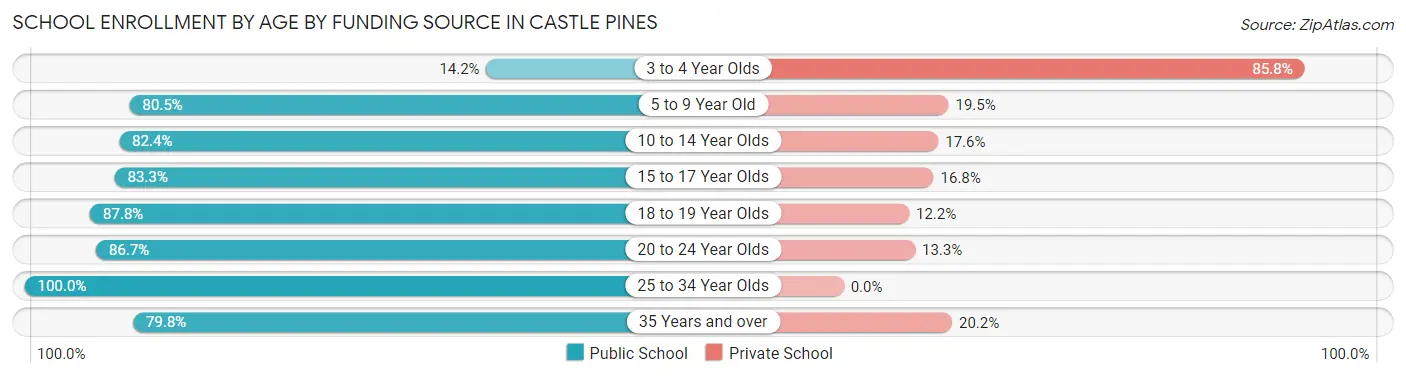
| Age Bracket | Public School | Private School |
| 3 to 4 Year Olds | 16 (14.2%) | 97 (85.8%) |
| 5 to 9 Year Old | 552 (80.5%) | 134 (19.5%) |
| 10 to 14 Year Olds | 776 (82.4%) | 166 (17.6%) |
| 15 to 17 Year Olds | 507 (83.3%) | 102 (16.8%) |
| 18 to 19 Year Olds | 303 (87.8%) | 42 (12.2%) |
| 20 to 24 Year Olds | 248 (86.7%) | 38 (13.3%) |
| 25 to 34 Year Olds | 202 (100.0%) | 0 (0.0%) |
| 35 Years and over | 87 (79.8%) | 22 (20.2%) |
| Total | 2,690 (81.7%) | 602 (18.3%) |
Educational Attainment by Field of Study in Castle Pines
Business (1,698 | 27.6%), engineering (726 | 11.8%), science & technology (643 | 10.5%), education (552 | 9.0%), and arts & humanities (337 | 5.5%) are the most common fields of study among 6,148 individuals in Castle Pines who have obtained a bachelor's degree or higher.
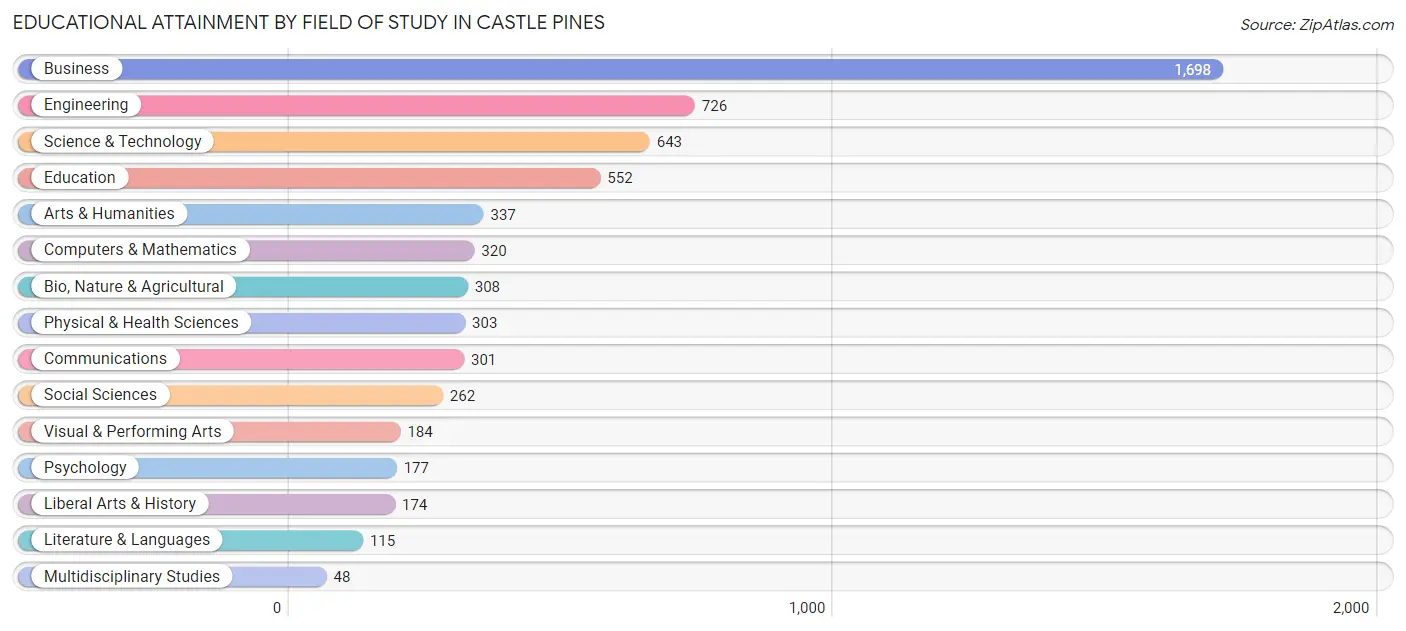
| Field of Study | # Graduates | % Graduates |
| Computers & Mathematics | 320 | 5.2% |
| Bio, Nature & Agricultural | 308 | 5.0% |
| Physical & Health Sciences | 303 | 4.9% |
| Psychology | 177 | 2.9% |
| Social Sciences | 262 | 4.3% |
| Engineering | 726 | 11.8% |
| Multidisciplinary Studies | 48 | 0.8% |
| Science & Technology | 643 | 10.5% |
| Business | 1,698 | 27.6% |
| Education | 552 | 9.0% |
| Literature & Languages | 115 | 1.9% |
| Liberal Arts & History | 174 | 2.8% |
| Visual & Performing Arts | 184 | 3.0% |
| Communications | 301 | 4.9% |
| Arts & Humanities | 337 | 5.5% |
| Total | 6,148 | 100.0% |
Transportation & Commute in Castle Pines
Vehicle Availability by Sex in Castle Pines
The most prevalent vehicle ownership categories in Castle Pines are males with 2 vehicles (1,418, accounting for 42.5%) and females with 2 vehicles (1,276, making up 47.4%).
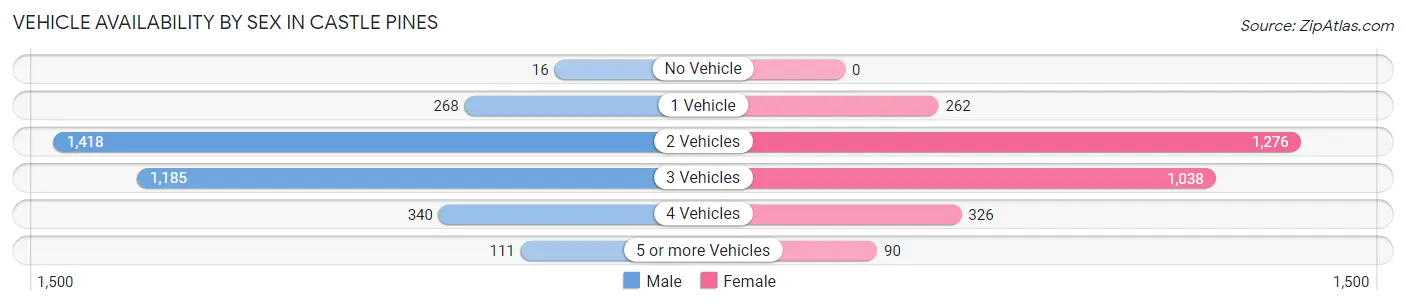
| Vehicles Available | Male | Female |
| No Vehicle | 16 (0.5%) | 0 (0.0%) |
| 1 Vehicle | 268 (8.0%) | 262 (8.8%) |
| 2 Vehicles | 1,418 (42.5%) | 1,276 (42.6%) |
| 3 Vehicles | 1,185 (35.5%) | 1,038 (34.7%) |
| 4 Vehicles | 340 (10.2%) | 326 (10.9%) |
| 5 or more Vehicles | 111 (3.3%) | 90 (3.0%) |
| Total | 3,338 (100.0%) | 2,992 (100.0%) |
Commute Time in Castle Pines
The most frequently occuring commute durations in Castle Pines are 15 to 19 minutes (1,011 commuters, 21.9%), 20 to 24 minutes (666 commuters, 14.4%), and 30 to 34 minutes (523 commuters, 11.3%).
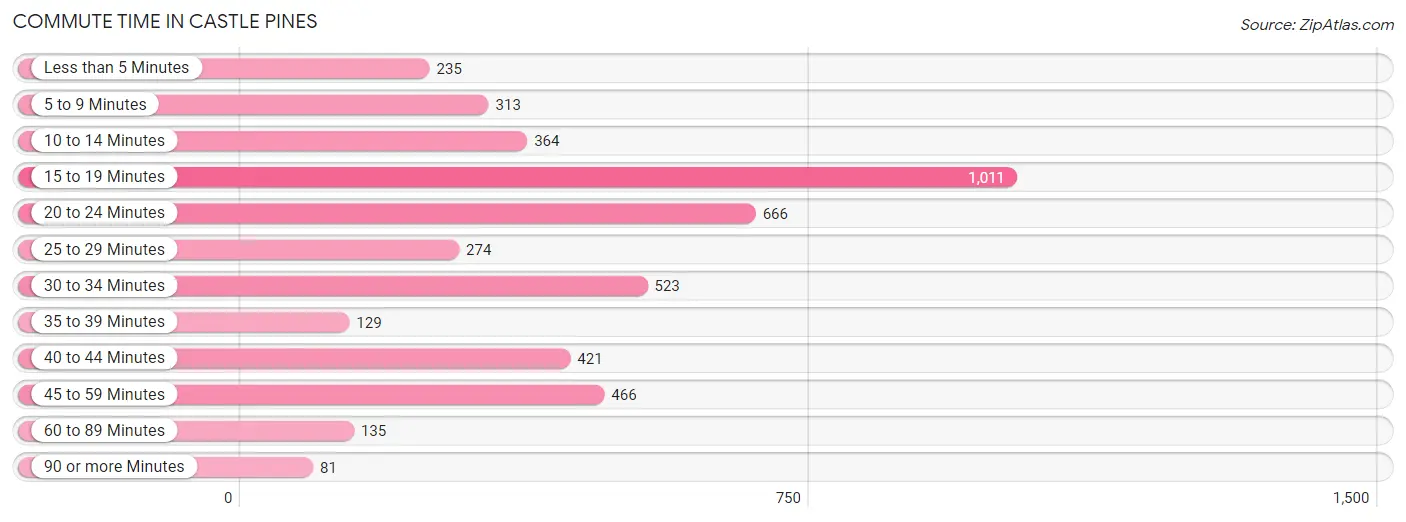
| Commute Time | # Commuters | % Commuters |
| Less than 5 Minutes | 235 | 5.1% |
| 5 to 9 Minutes | 313 | 6.8% |
| 10 to 14 Minutes | 364 | 7.9% |
| 15 to 19 Minutes | 1,011 | 21.9% |
| 20 to 24 Minutes | 666 | 14.4% |
| 25 to 29 Minutes | 274 | 5.9% |
| 30 to 34 Minutes | 523 | 11.3% |
| 35 to 39 Minutes | 129 | 2.8% |
| 40 to 44 Minutes | 421 | 9.1% |
| 45 to 59 Minutes | 466 | 10.1% |
| 60 to 89 Minutes | 135 | 2.9% |
| 90 or more Minutes | 81 | 1.8% |
Commute Time by Sex in Castle Pines
The most common commute times in Castle Pines are 15 to 19 minutes (537 commuters, 21.9%) for males and 15 to 19 minutes (474 commuters, 21.9%) for females.
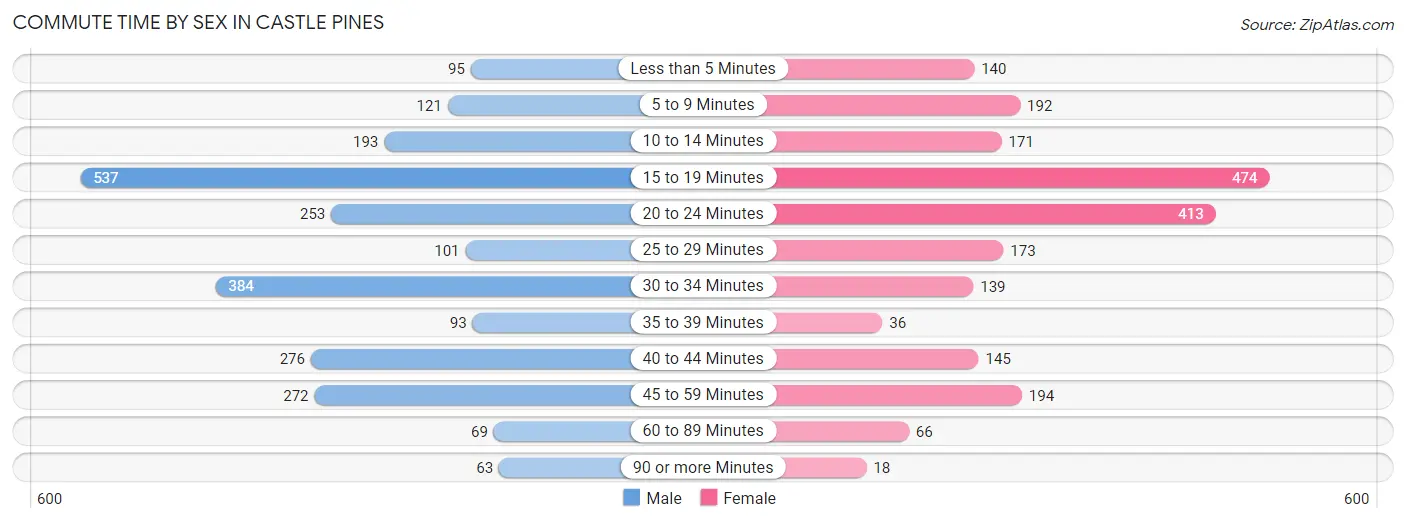
| Commute Time | Male | Female |
| Less than 5 Minutes | 95 (3.9%) | 140 (6.5%) |
| 5 to 9 Minutes | 121 (4.9%) | 192 (8.9%) |
| 10 to 14 Minutes | 193 (7.9%) | 171 (7.9%) |
| 15 to 19 Minutes | 537 (21.9%) | 474 (21.9%) |
| 20 to 24 Minutes | 253 (10.3%) | 413 (19.1%) |
| 25 to 29 Minutes | 101 (4.1%) | 173 (8.0%) |
| 30 to 34 Minutes | 384 (15.6%) | 139 (6.4%) |
| 35 to 39 Minutes | 93 (3.8%) | 36 (1.7%) |
| 40 to 44 Minutes | 276 (11.2%) | 145 (6.7%) |
| 45 to 59 Minutes | 272 (11.1%) | 194 (9.0%) |
| 60 to 89 Minutes | 69 (2.8%) | 66 (3.0%) |
| 90 or more Minutes | 63 (2.6%) | 18 (0.8%) |
Time of Departure to Work by Sex in Castle Pines
The most frequent times of departure to work in Castle Pines are 7:00 AM to 7:29 AM (541, 22.0%) for males and 7:30 AM to 7:59 AM (414, 19.2%) for females.
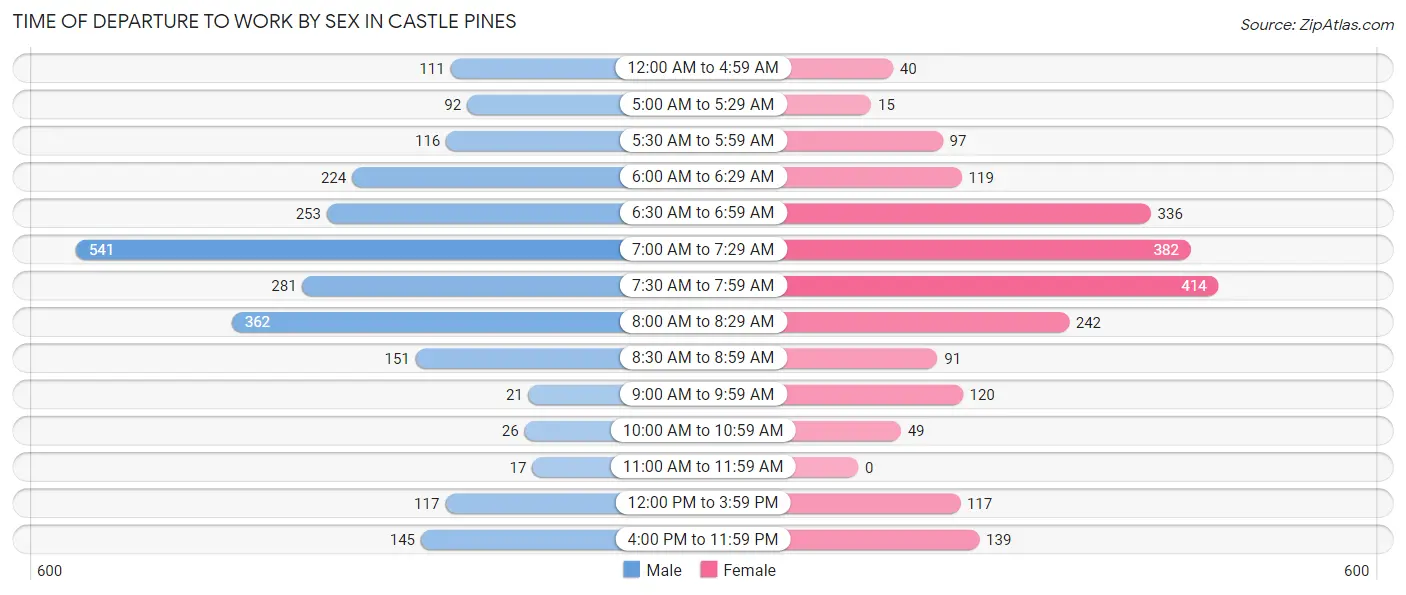
| Time of Departure | Male | Female |
| 12:00 AM to 4:59 AM | 111 (4.5%) | 40 (1.8%) |
| 5:00 AM to 5:29 AM | 92 (3.7%) | 15 (0.7%) |
| 5:30 AM to 5:59 AM | 116 (4.7%) | 97 (4.5%) |
| 6:00 AM to 6:29 AM | 224 (9.1%) | 119 (5.5%) |
| 6:30 AM to 6:59 AM | 253 (10.3%) | 336 (15.5%) |
| 7:00 AM to 7:29 AM | 541 (22.0%) | 382 (17.7%) |
| 7:30 AM to 7:59 AM | 281 (11.4%) | 414 (19.2%) |
| 8:00 AM to 8:29 AM | 362 (14.7%) | 242 (11.2%) |
| 8:30 AM to 8:59 AM | 151 (6.1%) | 91 (4.2%) |
| 9:00 AM to 9:59 AM | 21 (0.9%) | 120 (5.6%) |
| 10:00 AM to 10:59 AM | 26 (1.1%) | 49 (2.3%) |
| 11:00 AM to 11:59 AM | 17 (0.7%) | 0 (0.0%) |
| 12:00 PM to 3:59 PM | 117 (4.8%) | 117 (5.4%) |
| 4:00 PM to 11:59 PM | 145 (5.9%) | 139 (6.4%) |
| Total | 2,457 (100.0%) | 2,161 (100.0%) |
Housing Occupancy in Castle Pines
Occupancy by Ownership in Castle Pines
Of the total 4,154 dwellings in Castle Pines, owner-occupied units account for 3,565 (85.8%), while renter-occupied units make up 589 (14.2%).
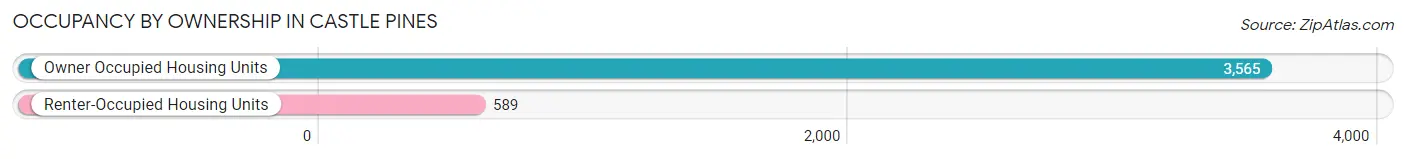
| Occupancy | # Housing Units | % Housing Units |
| Owner Occupied Housing Units | 3,565 | 85.8% |
| Renter-Occupied Housing Units | 589 | 14.2% |
| Total Occupied Housing Units | 4,154 | 100.0% |
Occupancy by Household Size in Castle Pines
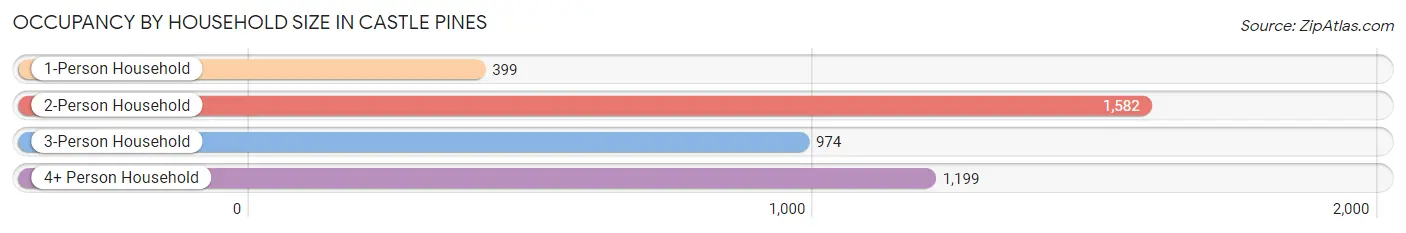
| Household Size | # Housing Units | % Housing Units |
| 1-Person Household | 399 | 9.6% |
| 2-Person Household | 1,582 | 38.1% |
| 3-Person Household | 974 | 23.4% |
| 4+ Person Household | 1,199 | 28.9% |
| Total Housing Units | 4,154 | 100.0% |
Occupancy by Ownership by Household Size in Castle Pines
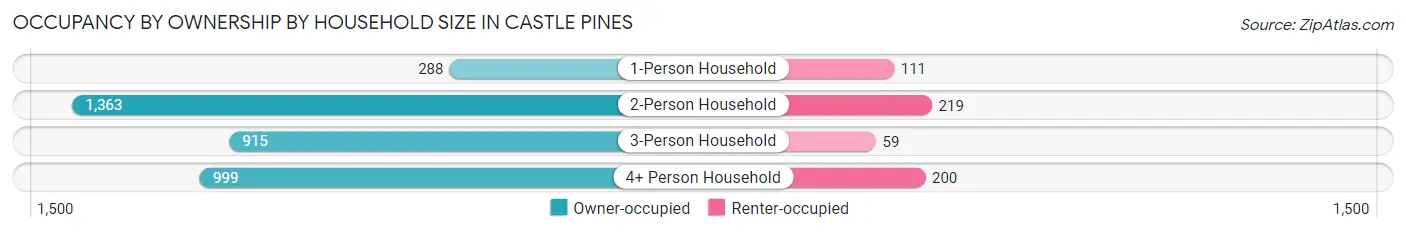
| Household Size | Owner-occupied | Renter-occupied |
| 1-Person Household | 288 (72.2%) | 111 (27.8%) |
| 2-Person Household | 1,363 (86.2%) | 219 (13.8%) |
| 3-Person Household | 915 (93.9%) | 59 (6.1%) |
| 4+ Person Household | 999 (83.3%) | 200 (16.7%) |
| Total Housing Units | 3,565 (85.8%) | 589 (14.2%) |
Occupancy by Educational Attainment in Castle Pines
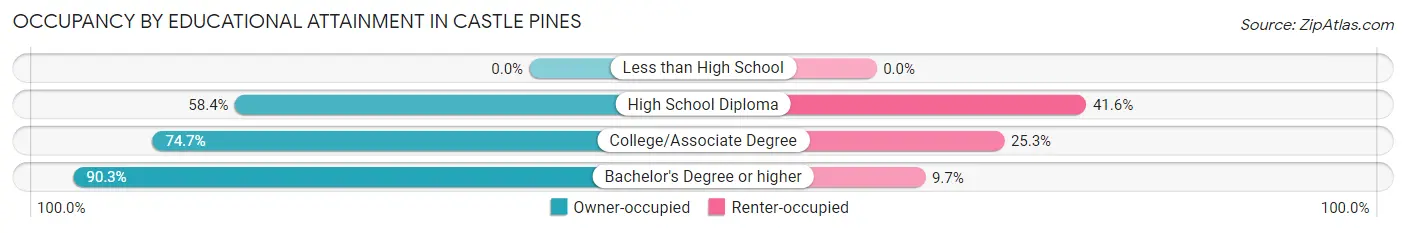
| Household Size | Owner-occupied | Renter-occupied |
| Less than High School | 0 (0.0%) | 0 (0.0%) |
| High School Diploma | 146 (58.4%) | 104 (41.6%) |
| College/Associate Degree | 513 (74.7%) | 174 (25.3%) |
| Bachelor's Degree or higher | 2,906 (90.3%) | 311 (9.7%) |
Occupancy by Age of Householder in Castle Pines
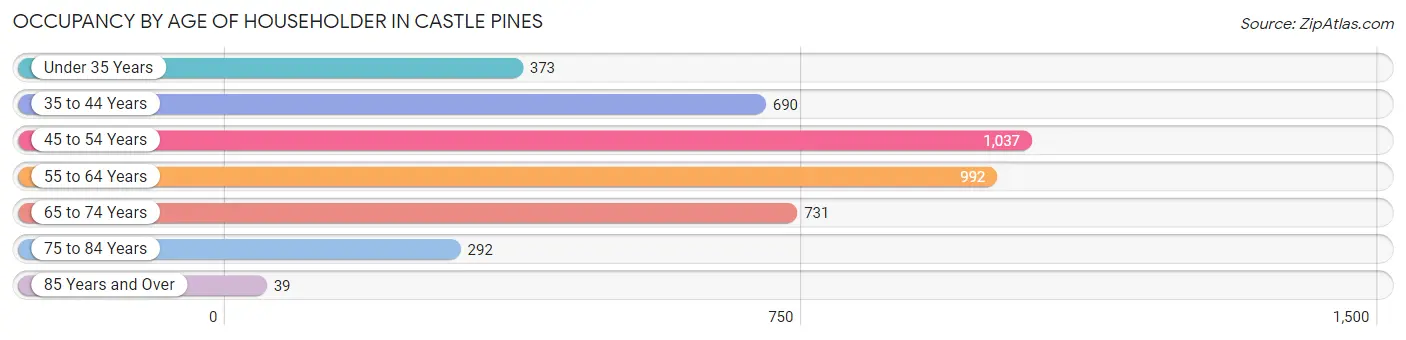
| Age Bracket | # Households | % Households |
| Under 35 Years | 373 | 9.0% |
| 35 to 44 Years | 690 | 16.6% |
| 45 to 54 Years | 1,037 | 25.0% |
| 55 to 64 Years | 992 | 23.9% |
| 65 to 74 Years | 731 | 17.6% |
| 75 to 84 Years | 292 | 7.0% |
| 85 Years and Over | 39 | 0.9% |
| Total | 4,154 | 100.0% |
Housing Finances in Castle Pines
Median Income by Occupancy in Castle Pines
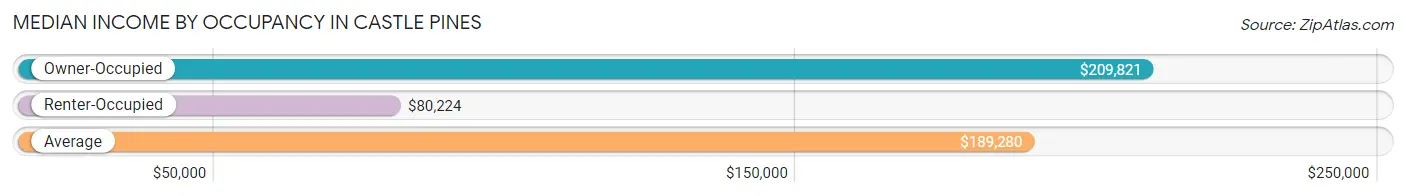
| Occupancy Type | # Households | Median Income |
| Owner-Occupied | 3,565 (85.8%) | $209,821 |
| Renter-Occupied | 589 (14.2%) | $80,224 |
| Average | 4,154 (100.0%) | $189,280 |
Occupancy by Householder Income Bracket in Castle Pines
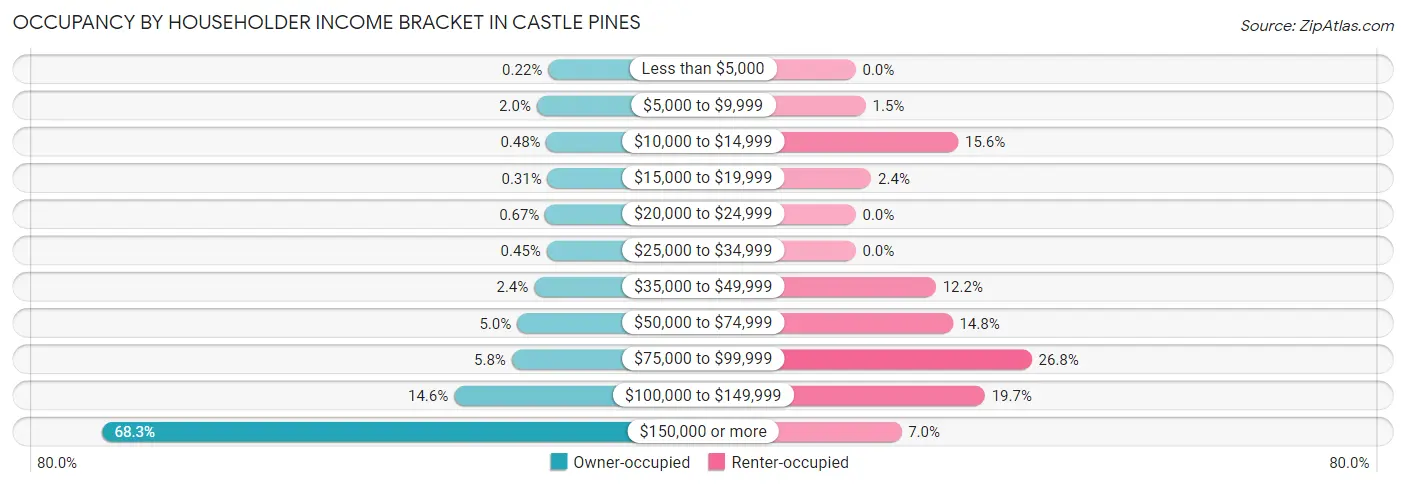
| Income Bracket | Owner-occupied | Renter-occupied |
| Less than $5,000 | 8 (0.2%) | 0 (0.0%) |
| $5,000 to $9,999 | 70 (2.0%) | 9 (1.5%) |
| $10,000 to $14,999 | 17 (0.5%) | 92 (15.6%) |
| $15,000 to $19,999 | 11 (0.3%) | 14 (2.4%) |
| $20,000 to $24,999 | 24 (0.7%) | 0 (0.0%) |
| $25,000 to $34,999 | 16 (0.4%) | 0 (0.0%) |
| $35,000 to $49,999 | 84 (2.4%) | 72 (12.2%) |
| $50,000 to $74,999 | 177 (5.0%) | 87 (14.8%) |
| $75,000 to $99,999 | 206 (5.8%) | 158 (26.8%) |
| $100,000 to $149,999 | 519 (14.6%) | 116 (19.7%) |
| $150,000 or more | 2,433 (68.2%) | 41 (7.0%) |
| Total | 3,565 (100.0%) | 589 (100.0%) |
Monthly Housing Cost Tiers in Castle Pines
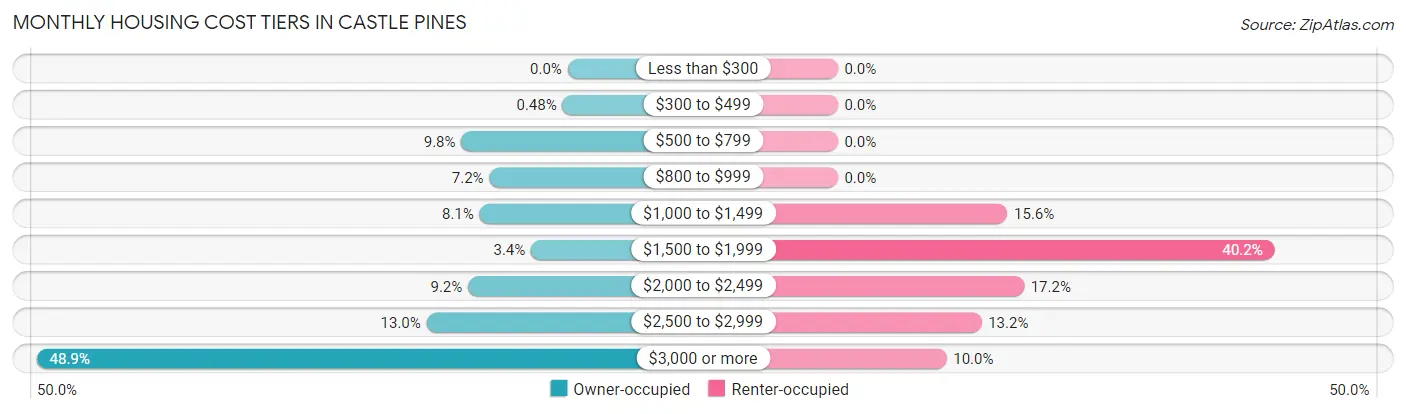
| Monthly Cost | Owner-occupied | Renter-occupied |
| Less than $300 | 0 (0.0%) | 0 (0.0%) |
| $300 to $499 | 17 (0.5%) | 0 (0.0%) |
| $500 to $799 | 349 (9.8%) | 0 (0.0%) |
| $800 to $999 | 257 (7.2%) | 0 (0.0%) |
| $1,000 to $1,499 | 289 (8.1%) | 92 (15.6%) |
| $1,500 to $1,999 | 120 (3.4%) | 237 (40.2%) |
| $2,000 to $2,499 | 327 (9.2%) | 101 (17.2%) |
| $2,500 to $2,999 | 463 (13.0%) | 78 (13.2%) |
| $3,000 or more | 1,743 (48.9%) | 59 (10.0%) |
| Total | 3,565 (100.0%) | 589 (100.0%) |
Physical Housing Characteristics in Castle Pines
Housing Structures in Castle Pines
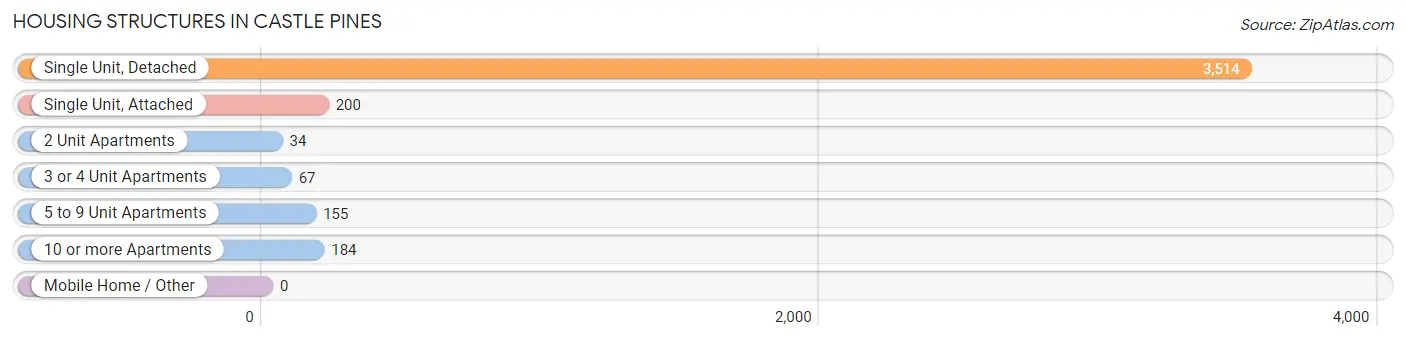
| Structure Type | # Housing Units | % Housing Units |
| Single Unit, Detached | 3,514 | 84.6% |
| Single Unit, Attached | 200 | 4.8% |
| 2 Unit Apartments | 34 | 0.8% |
| 3 or 4 Unit Apartments | 67 | 1.6% |
| 5 to 9 Unit Apartments | 155 | 3.7% |
| 10 or more Apartments | 184 | 4.4% |
| Mobile Home / Other | 0 | 0.0% |
| Total | 4,154 | 100.0% |
Housing Structures by Occupancy in Castle Pines
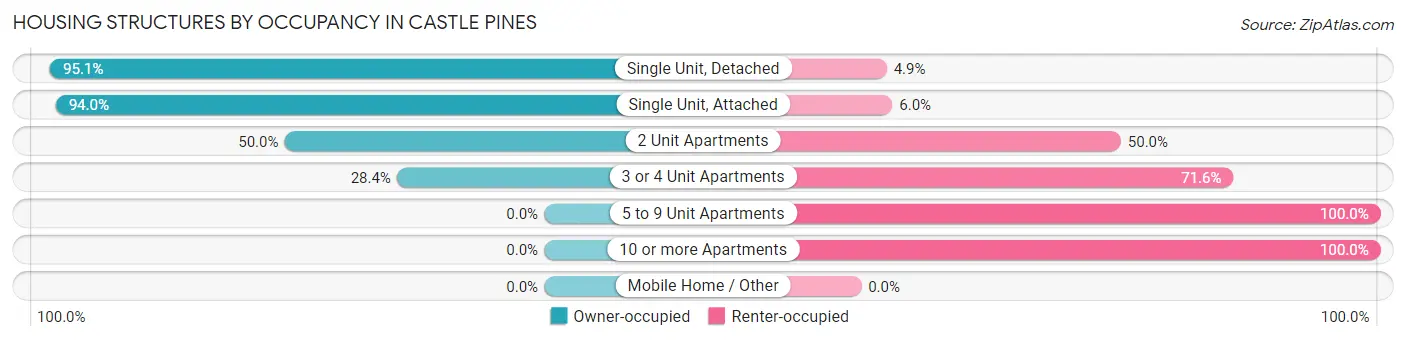
| Structure Type | Owner-occupied | Renter-occupied |
| Single Unit, Detached | 3,341 (95.1%) | 173 (4.9%) |
| Single Unit, Attached | 188 (94.0%) | 12 (6.0%) |
| 2 Unit Apartments | 17 (50.0%) | 17 (50.0%) |
| 3 or 4 Unit Apartments | 19 (28.4%) | 48 (71.6%) |
| 5 to 9 Unit Apartments | 0 (0.0%) | 155 (100.0%) |
| 10 or more Apartments | 0 (0.0%) | 184 (100.0%) |
| Mobile Home / Other | 0 (0.0%) | 0 (0.0%) |
| Total | 3,565 (85.8%) | 589 (14.2%) |
Housing Structures by Number of Rooms in Castle Pines
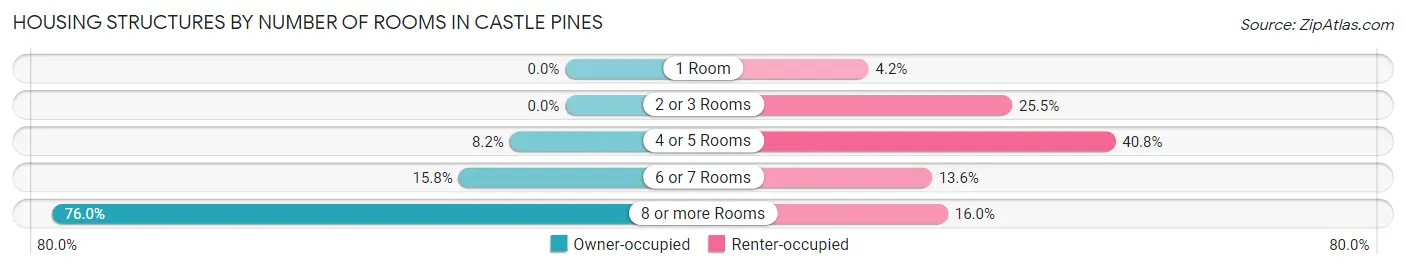
| Number of Rooms | Owner-occupied | Renter-occupied |
| 1 Room | 0 (0.0%) | 25 (4.2%) |
| 2 or 3 Rooms | 0 (0.0%) | 150 (25.5%) |
| 4 or 5 Rooms | 293 (8.2%) | 240 (40.7%) |
| 6 or 7 Rooms | 563 (15.8%) | 80 (13.6%) |
| 8 or more Rooms | 2,709 (76.0%) | 94 (16.0%) |
| Total | 3,565 (100.0%) | 589 (100.0%) |
Housing Structure by Heating Type in Castle Pines
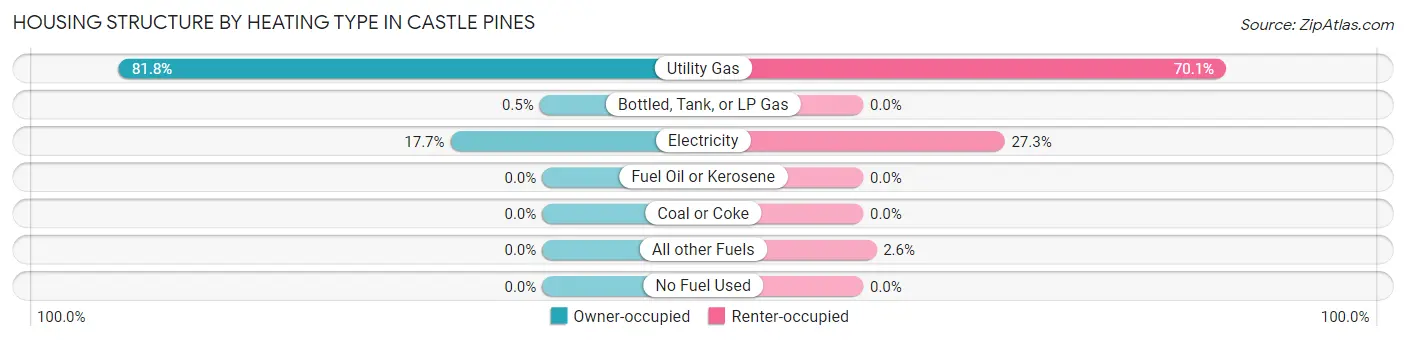
| Heating Type | Owner-occupied | Renter-occupied |
| Utility Gas | 2,915 (81.8%) | 413 (70.1%) |
| Bottled, Tank, or LP Gas | 18 (0.5%) | 0 (0.0%) |
| Electricity | 632 (17.7%) | 161 (27.3%) |
| Fuel Oil or Kerosene | 0 (0.0%) | 0 (0.0%) |
| Coal or Coke | 0 (0.0%) | 0 (0.0%) |
| All other Fuels | 0 (0.0%) | 15 (2.5%) |
| No Fuel Used | 0 (0.0%) | 0 (0.0%) |
| Total | 3,565 (100.0%) | 589 (100.0%) |
Household Vehicle Usage in Castle Pines
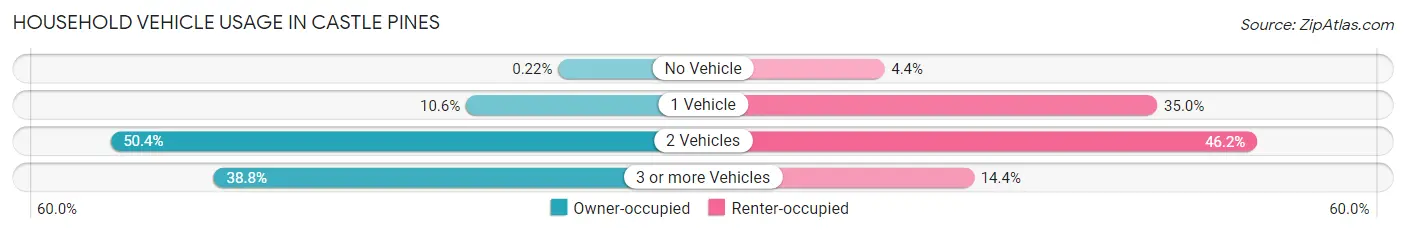
| Vehicles per Household | Owner-occupied | Renter-occupied |
| No Vehicle | 8 (0.2%) | 26 (4.4%) |
| 1 Vehicle | 376 (10.5%) | 206 (35.0%) |
| 2 Vehicles | 1,797 (50.4%) | 272 (46.2%) |
| 3 or more Vehicles | 1,384 (38.8%) | 85 (14.4%) |
| Total | 3,565 (100.0%) | 589 (100.0%) |
Real Estate & Mortgages in Castle Pines
Real Estate and Mortgage Overview in Castle Pines
| Characteristic | Without Mortgage | With Mortgage |
| Housing Units | 851 | 2,714 |
| Median Property Value | $695,300 | $805,500 |
| Median Household Income | $190,503 | $1,908 |
| Monthly Housing Costs | $867 | $1,743 |
| Real Estate Taxes | $4,264 | $56 |
Property Value by Mortgage Status in Castle Pines
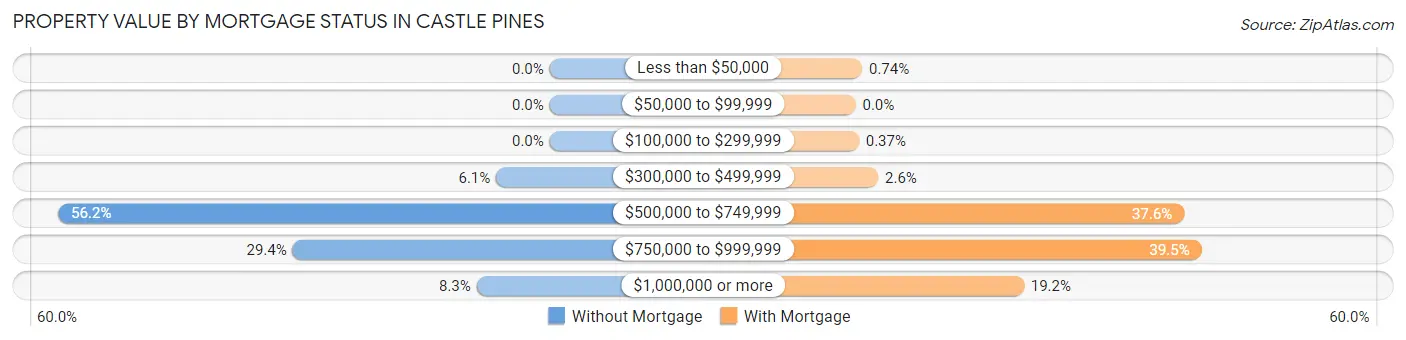
| Property Value | Without Mortgage | With Mortgage |
| Less than $50,000 | 0 (0.0%) | 20 (0.7%) |
| $50,000 to $99,999 | 0 (0.0%) | 0 (0.0%) |
| $100,000 to $299,999 | 0 (0.0%) | 10 (0.4%) |
| $300,000 to $499,999 | 52 (6.1%) | 70 (2.6%) |
| $500,000 to $749,999 | 478 (56.2%) | 1,019 (37.6%) |
| $750,000 to $999,999 | 250 (29.4%) | 1,073 (39.5%) |
| $1,000,000 or more | 71 (8.3%) | 522 (19.2%) |
| Total | 851 (100.0%) | 2,714 (100.0%) |
Household Income by Mortgage Status in Castle Pines
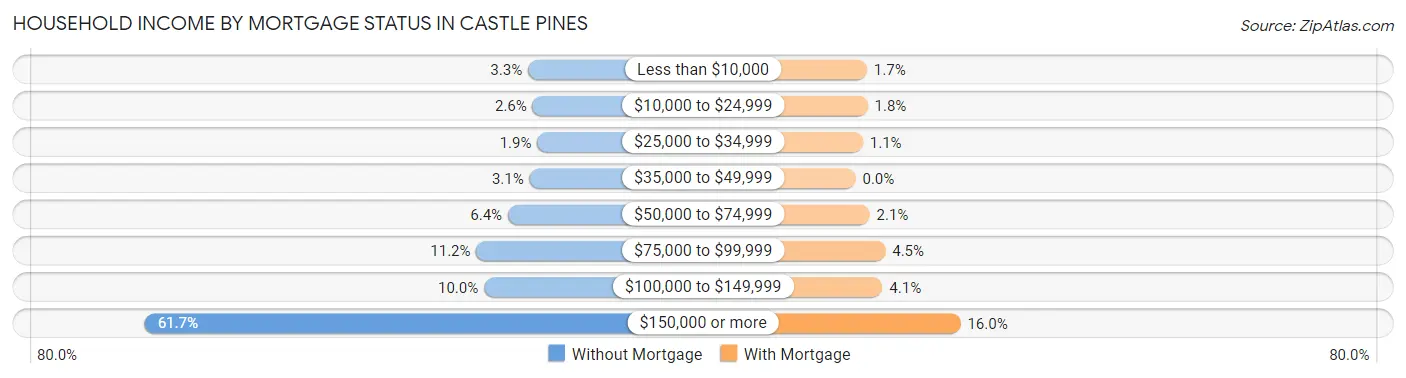
| Household Income | Without Mortgage | With Mortgage |
| Less than $10,000 | 28 (3.3%) | 47 (1.7%) |
| $10,000 to $24,999 | 22 (2.6%) | 50 (1.8%) |
| $25,000 to $34,999 | 16 (1.9%) | 30 (1.1%) |
| $35,000 to $49,999 | 26 (3.1%) | 0 (0.0%) |
| $50,000 to $74,999 | 54 (6.4%) | 58 (2.1%) |
| $75,000 to $99,999 | 95 (11.2%) | 123 (4.5%) |
| $100,000 to $149,999 | 85 (10.0%) | 111 (4.1%) |
| $150,000 or more | 525 (61.7%) | 434 (16.0%) |
| Total | 851 (100.0%) | 2,714 (100.0%) |
Property Value to Household Income Ratio in Castle Pines
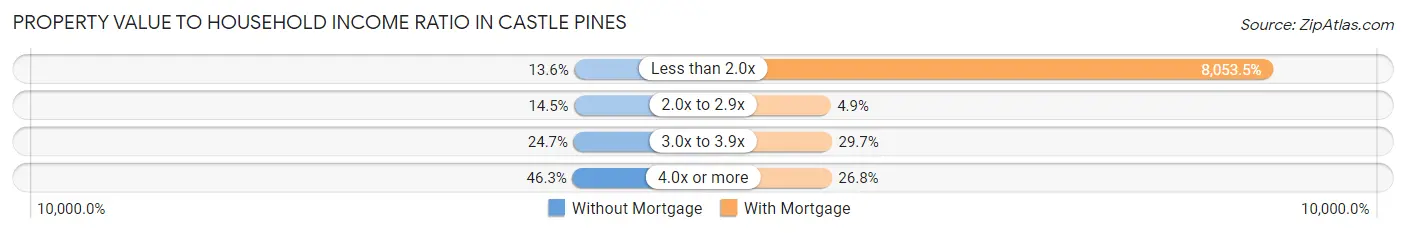
| Value-to-Income Ratio | Without Mortgage | With Mortgage |
| Less than 2.0x | 116 (13.6%) | 218,571 (8,053.5%) |
| 2.0x to 2.9x | 123 (14.4%) | 133 (4.9%) |
| 3.0x to 3.9x | 210 (24.7%) | 805 (29.7%) |
| 4.0x or more | 394 (46.3%) | 728 (26.8%) |
| Total | 851 (100.0%) | 2,714 (100.0%) |
Real Estate Taxes by Mortgage Status in Castle Pines
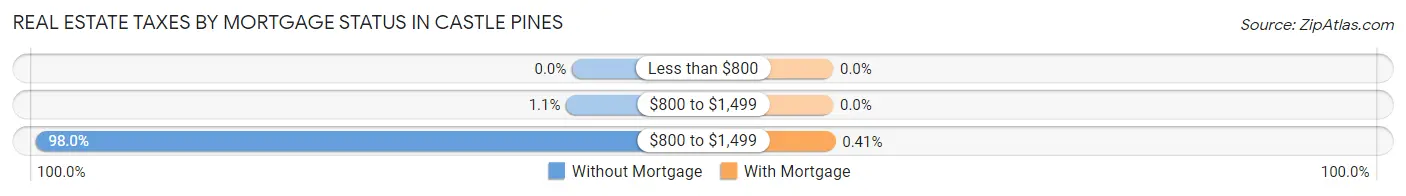
| Property Taxes | Without Mortgage | With Mortgage |
| Less than $800 | 0 (0.0%) | 0 (0.0%) |
| $800 to $1,499 | 9 (1.1%) | 0 (0.0%) |
| $800 to $1,499 | 834 (98.0%) | 11 (0.4%) |
| Total | 851 (100.0%) | 2,714 (100.0%) |
Health & Disability in Castle Pines
Health Insurance Coverage by Age in Castle Pines
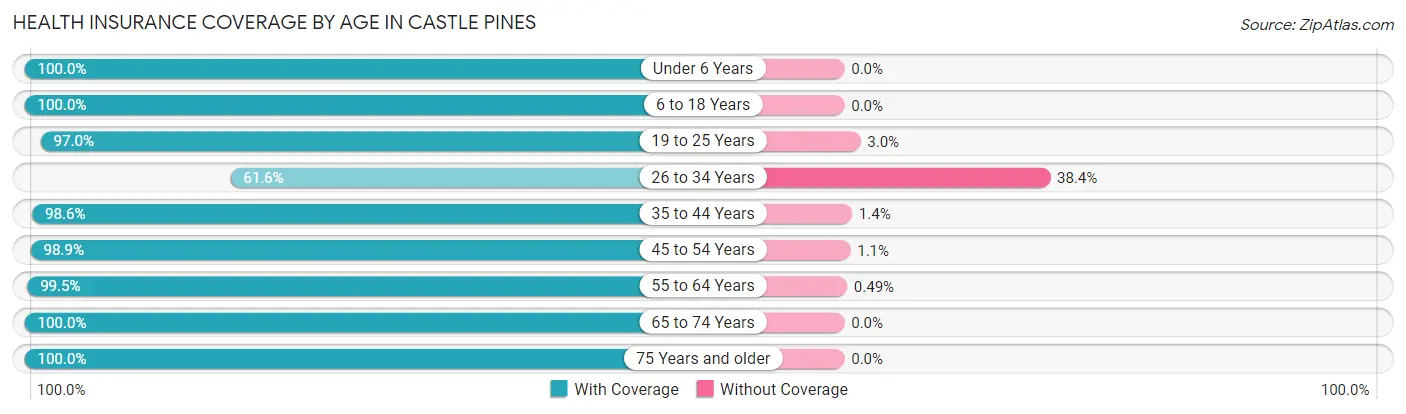
| Age Bracket | With Coverage | Without Coverage |
| Under 6 Years | 493 (100.0%) | 0 (0.0%) |
| 6 to 18 Years | 2,421 (100.0%) | 0 (0.0%) |
| 19 to 25 Years | 744 (97.0%) | 23 (3.0%) |
| 26 to 34 Years | 509 (61.6%) | 317 (38.4%) |
| 35 to 44 Years | 1,458 (98.6%) | 21 (1.4%) |
| 45 to 54 Years | 2,032 (98.9%) | 23 (1.1%) |
| 55 to 64 Years | 1,830 (99.5%) | 9 (0.5%) |
| 65 to 74 Years | 1,183 (100.0%) | 0 (0.0%) |
| 75 Years and older | 733 (100.0%) | 0 (0.0%) |
| Total | 11,403 (96.7%) | 393 (3.3%) |
Health Insurance Coverage by Citizenship Status in Castle Pines
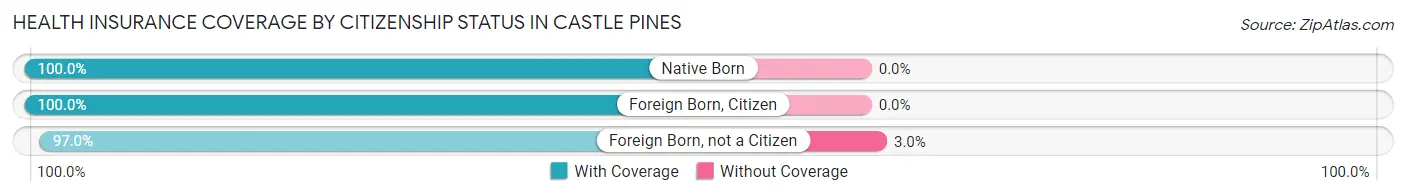
| Citizenship Status | With Coverage | Without Coverage |
| Native Born | 493 (100.0%) | 0 (0.0%) |
| Foreign Born, Citizen | 2,421 (100.0%) | 0 (0.0%) |
| Foreign Born, not a Citizen | 744 (97.0%) | 23 (3.0%) |
Health Insurance Coverage by Household Income in Castle Pines
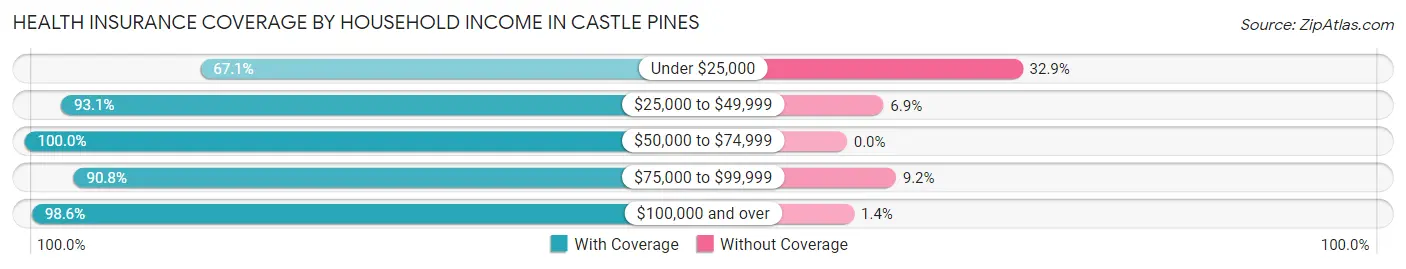
| Household Income | With Coverage | Without Coverage |
| Under $25,000 | 344 (67.1%) | 169 (32.9%) |
| $25,000 to $49,999 | 258 (93.1%) | 19 (6.9%) |
| $50,000 to $74,999 | 625 (100.0%) | 0 (0.0%) |
| $75,000 to $99,999 | 732 (90.8%) | 74 (9.2%) |
| $100,000 and over | 9,427 (98.6%) | 131 (1.4%) |
Public vs Private Health Insurance Coverage by Age in Castle Pines
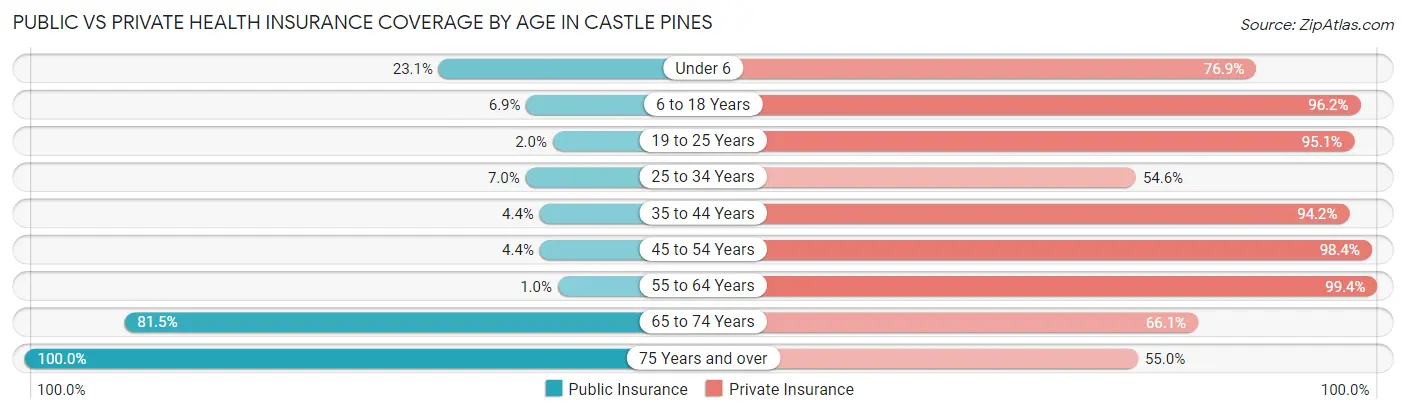
| Age Bracket | Public Insurance | Private Insurance |
| Under 6 | 114 (23.1%) | 379 (76.9%) |
| 6 to 18 Years | 166 (6.9%) | 2,330 (96.2%) |
| 19 to 25 Years | 15 (2.0%) | 729 (95.1%) |
| 25 to 34 Years | 58 (7.0%) | 451 (54.6%) |
| 35 to 44 Years | 65 (4.4%) | 1,393 (94.2%) |
| 45 to 54 Years | 90 (4.4%) | 2,021 (98.4%) |
| 55 to 64 Years | 19 (1.0%) | 1,828 (99.4%) |
| 65 to 74 Years | 964 (81.5%) | 782 (66.1%) |
| 75 Years and over | 733 (100.0%) | 403 (55.0%) |
| Total | 2,224 (18.9%) | 10,316 (87.5%) |
Disability Status by Sex by Age in Castle Pines
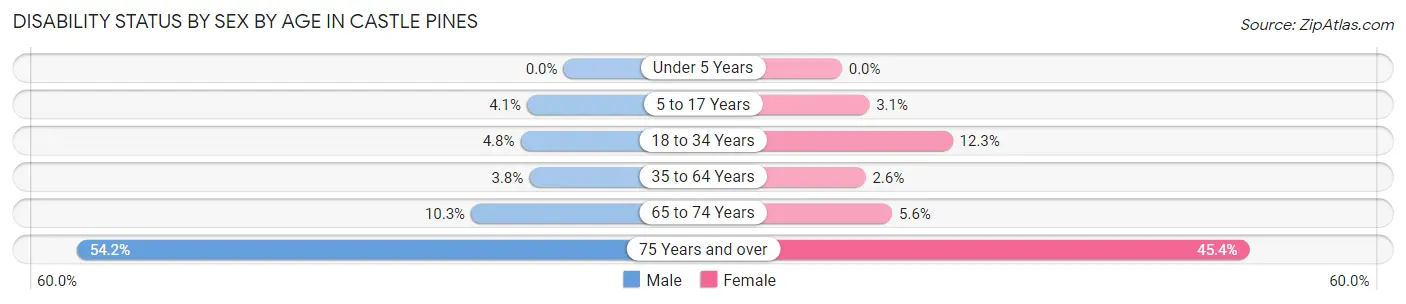
| Age Bracket | Male | Female |
| Under 5 Years | 0 (0.0%) | 0 (0.0%) |
| 5 to 17 Years | 51 (4.1%) | 30 (3.0%) |
| 18 to 34 Years | 46 (4.8%) | 111 (12.3%) |
| 35 to 64 Years | 101 (3.8%) | 72 (2.6%) |
| 65 to 74 Years | 63 (10.3%) | 32 (5.6%) |
| 75 Years and over | 162 (54.2%) | 197 (45.4%) |
Disability Class by Sex by Age in Castle Pines
Disability Class: Hearing Difficulty
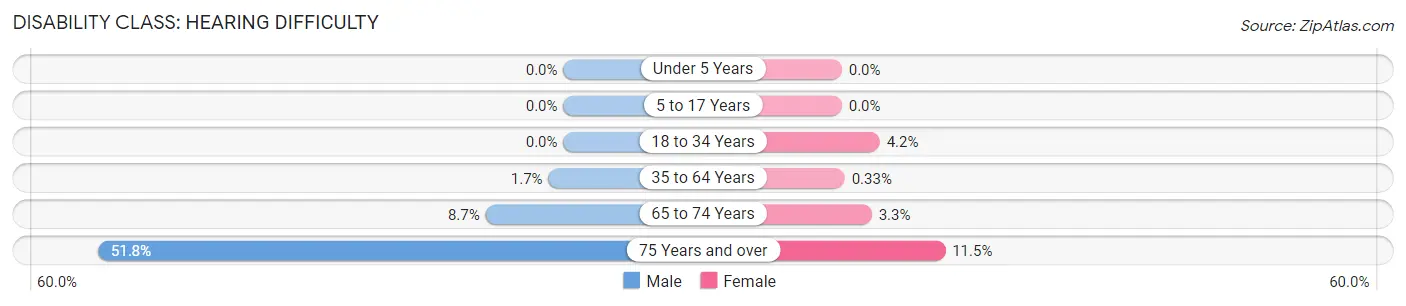
| Age Bracket | Male | Female |
| Under 5 Years | 0 (0.0%) | 0 (0.0%) |
| 5 to 17 Years | 0 (0.0%) | 0 (0.0%) |
| 18 to 34 Years | 0 (0.0%) | 38 (4.2%) |
| 35 to 64 Years | 44 (1.7%) | 9 (0.3%) |
| 65 to 74 Years | 53 (8.7%) | 19 (3.3%) |
| 75 Years and over | 155 (51.8%) | 50 (11.5%) |
Disability Class: Vision Difficulty
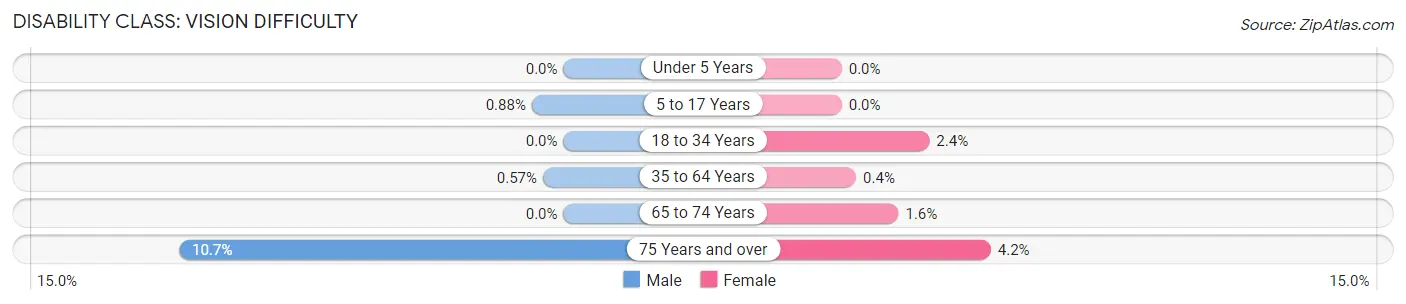
| Age Bracket | Male | Female |
| Under 5 Years | 0 (0.0%) | 0 (0.0%) |
| 5 to 17 Years | 11 (0.9%) | 0 (0.0%) |
| 18 to 34 Years | 0 (0.0%) | 22 (2.4%) |
| 35 to 64 Years | 15 (0.6%) | 11 (0.4%) |
| 65 to 74 Years | 0 (0.0%) | 9 (1.6%) |
| 75 Years and over | 32 (10.7%) | 18 (4.2%) |
Disability Class: Cognitive Difficulty
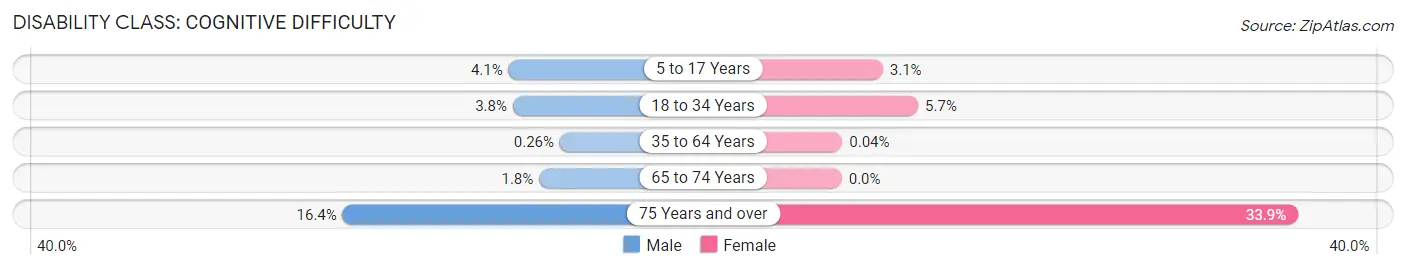
| Age Bracket | Male | Female |
| 5 to 17 Years | 51 (4.1%) | 30 (3.0%) |
| 18 to 34 Years | 36 (3.7%) | 51 (5.7%) |
| 35 to 64 Years | 7 (0.3%) | 1 (0.0%) |
| 65 to 74 Years | 11 (1.8%) | 0 (0.0%) |
| 75 Years and over | 49 (16.4%) | 147 (33.9%) |
Disability Class: Ambulatory Difficulty
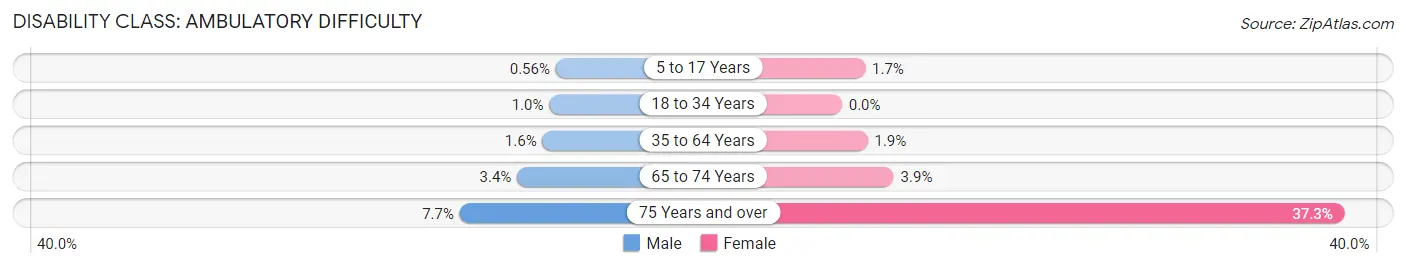
| Age Bracket | Male | Female |
| 5 to 17 Years | 7 (0.6%) | 17 (1.7%) |
| 18 to 34 Years | 10 (1.0%) | 0 (0.0%) |
| 35 to 64 Years | 41 (1.5%) | 52 (1.9%) |
| 65 to 74 Years | 21 (3.4%) | 22 (3.8%) |
| 75 Years and over | 23 (7.7%) | 162 (37.3%) |
Disability Class: Self-Care Difficulty
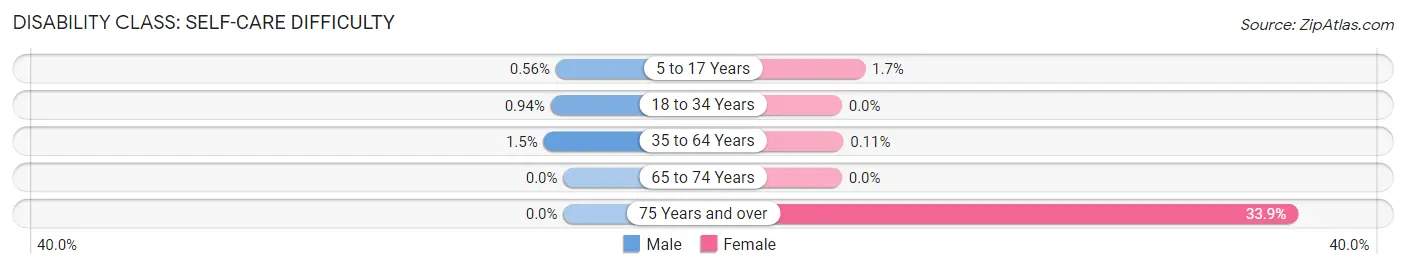
| Age Bracket | Male | Female |
| 5 to 17 Years | 7 (0.6%) | 17 (1.7%) |
| 18 to 34 Years | 9 (0.9%) | 0 (0.0%) |
| 35 to 64 Years | 39 (1.5%) | 3 (0.1%) |
| 65 to 74 Years | 0 (0.0%) | 0 (0.0%) |
| 75 Years and over | 0 (0.0%) | 147 (33.9%) |
Technology Access in Castle Pines
Computing Device Access in Castle Pines
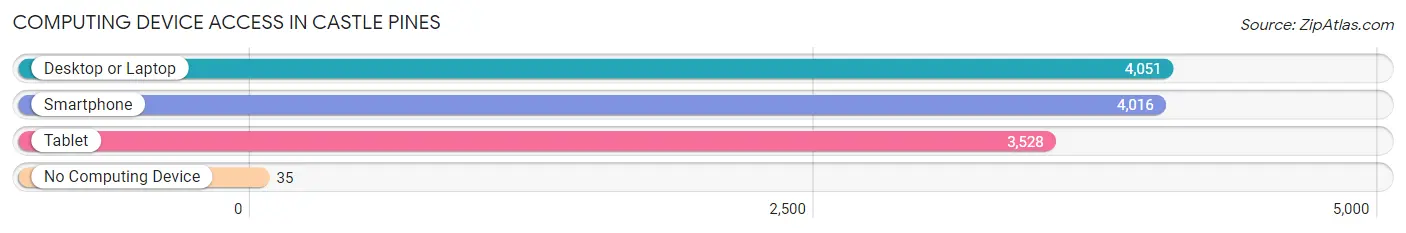
| Device Type | # Households | % Households |
| Desktop or Laptop | 4,051 | 97.5% |
| Smartphone | 4,016 | 96.7% |
| Tablet | 3,528 | 84.9% |
| No Computing Device | 35 | 0.8% |
| Total | 4,154 | 100.0% |
Internet Access in Castle Pines
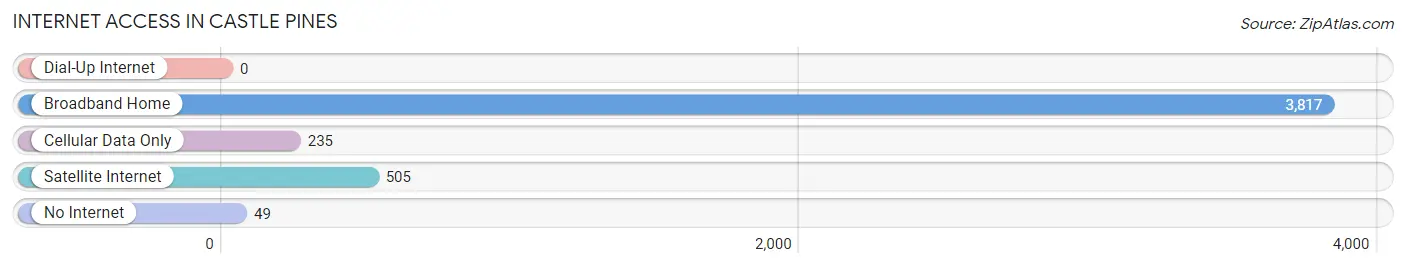
| Internet Type | # Households | % Households |
| Dial-Up Internet | 0 | 0.0% |
| Broadband Home | 3,817 | 91.9% |
| Cellular Data Only | 235 | 5.7% |
| Satellite Internet | 505 | 12.2% |
| No Internet | 49 | 1.2% |
| Total | 4,154 | 100.0% |
Castle Pines Summary
Castle Pines, Colorado is a small city located in Douglas County, Colorado, United States. It is situated about 20 miles south of Denver and is part of the Denver-Aurora-Lakewood Metropolitan Statistical Area. The city was incorporated in 2008 and has a population of approximately 10,360 people as of the 2020 census.
History
Castle Pines was originally part of the Castlewood Ranch, which was established in the late 1800s by the Castlewood Land and Cattle Company. The ranch was owned by the prominent Denver family, the Guggenheims, and was used for cattle grazing and farming. In the early 1970s, the ranch was sold to developers who began to subdivide the land and create the city of Castle Pines. The city was officially incorporated in 2008 and has since grown to become a thriving community.
Geography
Castle Pines is located in Douglas County, Colorado, about 20 miles south of Denver. It is situated at an elevation of 6,000 feet and is surrounded by the Rocky Mountains. The city is located in the foothills of the Rocky Mountains and is home to several parks and trails. The city is also home to the Castle Pines Golf Club, which is one of the most prestigious golf courses in the state.
Economy
Castle Pines is home to a variety of businesses and industries. The city is home to several technology companies, including Oracle, IBM, and Microsoft. The city is also home to several retail stores, restaurants, and other businesses. The city is also home to several medical facilities, including the Castle Pines Medical Center and the Castle Pines Surgery Center.
Demographics
As of the 2020 census, Castle Pines had a population of 10,360 people. The median age of the population is 40.7 years, and the median household income is $118,845. The city is predominantly white, with 87.3% of the population identifying as white. The city is also home to a large Hispanic population, with 11.3% of the population identifying as Hispanic or Latino. The city is also home to a small Asian population, with 1.2% of the population identifying as Asian.
Conclusion
Castle Pines, Colorado is a small city located in Douglas County, Colorado, United States. It is situated about 20 miles south of Denver and is part of the Denver-Aurora-Lakewood Metropolitan Statistical Area. The city was originally part of the Castlewood Ranch, which was established in the late 1800s by the Castlewood Land and Cattle Company. The city was officially incorporated in 2008 and has since grown to become a thriving community. Castle Pines is home to a variety of businesses and industries, and the city is predominantly white, with 87.3% of the population identifying as white. The city is also home to a large Hispanic population, with 11.3% of the population identifying as Hispanic or Latino. The city is also home to a small Asian population, with 1.2% of the population identifying as Asian.
Common Questions
What is Per Capita Income in Castle Pines?
Per Capita income in Castle Pines is $76,842.
What is the Median Family Income in Castle Pines?
Median Family Income in Castle Pines is $192,500.
What is the Median Household income in Castle Pines?
Median Household Income in Castle Pines is $189,280.
What is Income or Wage Gap in Castle Pines?
Income or Wage Gap in Castle Pines is 46.0%.
Women in Castle Pines earn 54.0 cents for every dollar earned by a man.
What is Family Income Deficit in Castle Pines?
Family Income Deficit in Castle Pines is $12,432.
Families that are below poverty line in Castle Pines earn $12,432 less on average than the poverty threshold level.
What is Inequality or Gini Index in Castle Pines?
Inequality or Gini Index in Castle Pines is 0.40.
What is the Total Population of Castle Pines?
Total Population of Castle Pines is 11,811.
What is the Total Male Population of Castle Pines?
Total Male Population of Castle Pines is 5,960.
What is the Total Female Population of Castle Pines?
Total Female Population of Castle Pines is 5,851.
What is the Ratio of Males per 100 Females in Castle Pines?
There are 101.86 Males per 100 Females in Castle Pines.
What is the Ratio of Females per 100 Males in Castle Pines?
There are 98.17 Females per 100 Males in Castle Pines.
What is the Median Population Age in Castle Pines?
Median Population Age in Castle Pines is 44.6 Years.
What is the Average Family Size in Castle Pines
Average Family Size in Castle Pines is 3.0 People.
What is the Average Household Size in Castle Pines
Average Household Size in Castle Pines is 2.8 People.
How Large is the Labor Force in Castle Pines?
There are 6,651 People in the Labor Forcein in Castle Pines.
What is the Percentage of People in the Labor Force in Castle Pines?
69.1% of People are in the Labor Force in Castle Pines.
What is the Unemployment Rate in Castle Pines?
Unemployment Rate in Castle Pines is 3.6%.