Danville, VT Map & Demographics
Danville Map
Danville Overview
$49,318
PER CAPITA INCOME
$64,167
AVG HOUSEHOLD INCOME
47.7%
WAGE / INCOME GAP [ % ]
52.3¢/ $1
WAGE / INCOME GAP [ $ ]
0.51
INEQUALITY / GINI INDEX
450
TOTAL POPULATION
189
MALE POPULATION
261
FEMALE POPULATION
72.41
MALES / 100 FEMALES
138.10
FEMALES / 100 MALES
57.6
MEDIAN AGE
2.5
AVG FAMILY SIZE
1.7
AVG HOUSEHOLD SIZE
256
LABOR FORCE [ PEOPLE ]
62.9%
PERCENT IN LABOR FORCE
Danville Zip Codes
Danville Area Codes
Income in Danville
Income Overview in Danville
| Characteristic | Number | Measure |
| Per Capita Income | 450 | $49,318 |
| Median Family Income | 109 | $0 |
| Mean Family Income | 109 | $147,739 |
| Median Household Income | 258 | $64,167 |
| Mean Household Income | 258 | $85,521 |
| Income Deficit | 109 | $0 |
| Wage / Income Gap (%) | 450 | 47.67% |
| Wage / Income Gap ($) | 450 | 52.33¢ per $1 |
| Gini / Inequality Index | 450 | 0.51 |
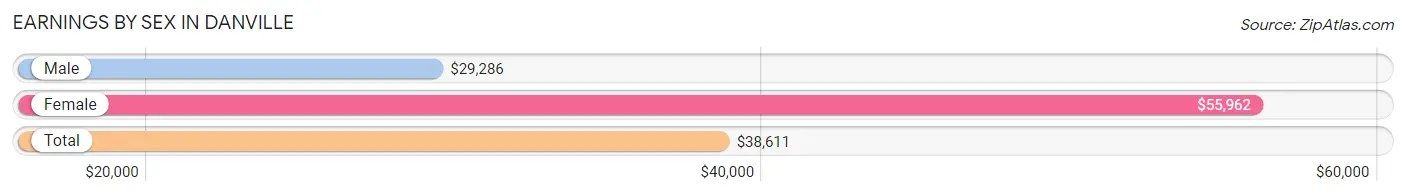
Earnings by Sex in Danville
Average Earnings in Danville are $38,611, $29,286 for men and $55,962 for women, a difference of 47.7%.
| Sex | Number | Average Earnings |
| Male | 138 (51.5%) | $29,286 |
| Female | 130 (48.5%) | $55,962 |
| Total | 268 (100.0%) | $38,611 |
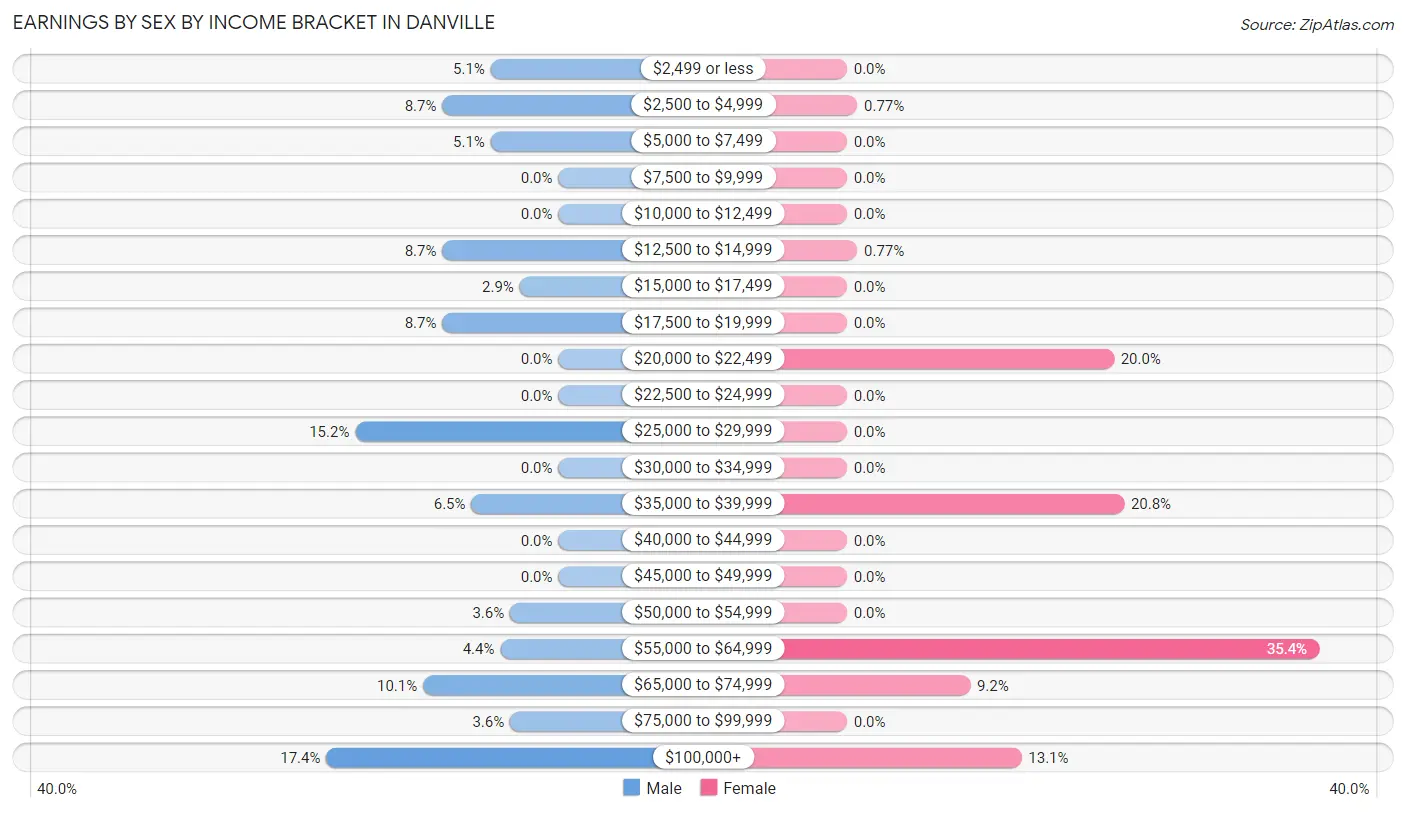
Earnings by Sex by Income Bracket in Danville
The most common earnings brackets in Danville are $100,000+ for men (24 | 17.4%) and $55,000 to $64,999 for women (46 | 35.4%).
| Income | Male | Female |
| $2,499 or less | 7 (5.1%) | 0 (0.0%) |
| $2,500 to $4,999 | 12 (8.7%) | 1 (0.8%) |
| $5,000 to $7,499 | 7 (5.1%) | 0 (0.0%) |
| $7,500 to $9,999 | 0 (0.0%) | 0 (0.0%) |
| $10,000 to $12,499 | 0 (0.0%) | 0 (0.0%) |
| $12,500 to $14,999 | 12 (8.7%) | 1 (0.8%) |
| $15,000 to $17,499 | 4 (2.9%) | 0 (0.0%) |
| $17,500 to $19,999 | 12 (8.7%) | 0 (0.0%) |
| $20,000 to $22,499 | 0 (0.0%) | 26 (20.0%) |
| $22,500 to $24,999 | 0 (0.0%) | 0 (0.0%) |
| $25,000 to $29,999 | 21 (15.2%) | 0 (0.0%) |
| $30,000 to $34,999 | 0 (0.0%) | 0 (0.0%) |
| $35,000 to $39,999 | 9 (6.5%) | 27 (20.8%) |
| $40,000 to $44,999 | 0 (0.0%) | 0 (0.0%) |
| $45,000 to $49,999 | 0 (0.0%) | 0 (0.0%) |
| $50,000 to $54,999 | 5 (3.6%) | 0 (0.0%) |
| $55,000 to $64,999 | 6 (4.3%) | 46 (35.4%) |
| $65,000 to $74,999 | 14 (10.1%) | 12 (9.2%) |
| $75,000 to $99,999 | 5 (3.6%) | 0 (0.0%) |
| $100,000+ | 24 (17.4%) | 17 (13.1%) |
| Total | 138 (100.0%) | 130 (100.0%) |
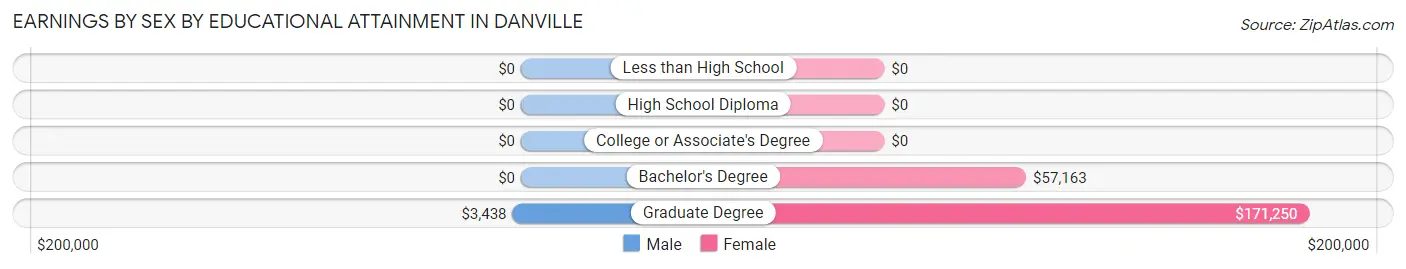
Earnings by Sex by Educational Attainment in Danville
Average earnings in Danville are $29,762 for men and $56,971 for women, a difference of 47.8%. Men with an educational attainment of graduate degree enjoy the highest average annual earnings of $3,438, while those with graduate degree education earn the least with $3,438. Women with an educational attainment of graduate degree earn the most with the average annual earnings of $171,250, while those with bachelor's degree education have the smallest earnings of $57,163.
| Educational Attainment | Male Income | Female Income |
| Less than High School | - | - |
| High School Diploma | - | - |
| College or Associate's Degree | - | - |
| Bachelor's Degree | - | - |
| Graduate Degree | $3,438 | $171,250 |
| Total | $29,762 | $56,971 |
Family Income in Danville
Family Income Brackets in Danville
According to the Danville family income data, there are 34 families falling into the $75,000 to $99,999 income range, which is the most common income bracket and makes up 31.2% of all families.
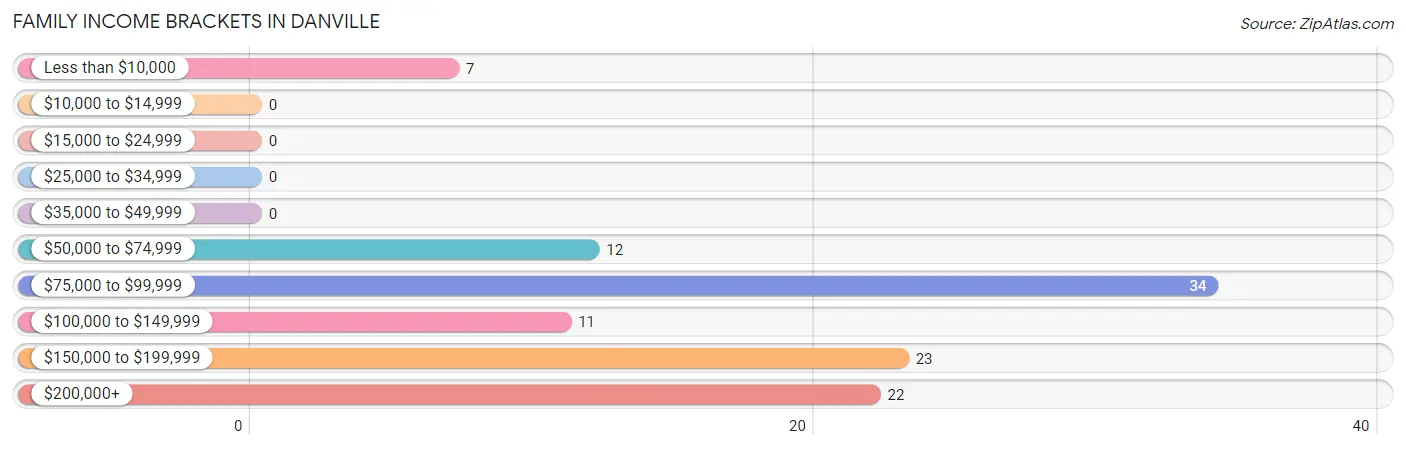
| Income Bracket | # Families | % Families |
| Less than $10,000 | 7 | 6.4% |
| $10,000 to $14,999 | 0 | 0.0% |
| $15,000 to $24,999 | 0 | 0.0% |
| $25,000 to $34,999 | 0 | 0.0% |
| $35,000 to $49,999 | 0 | 0.0% |
| $50,000 to $74,999 | 12 | 11.0% |
| $75,000 to $99,999 | 34 | 31.2% |
| $100,000 to $149,999 | 11 | 10.1% |
| $150,000 to $199,999 | 23 | 21.1% |
| $200,000+ | 22 | 20.2% |
Family Income by Famaliy Size in Danville
3-person families (35 | 32.1%) account for the highest median family income in Danville with $197,396 per family, while 3-person families (35 | 32.1%) have the highest median income of $65,799 per family member.
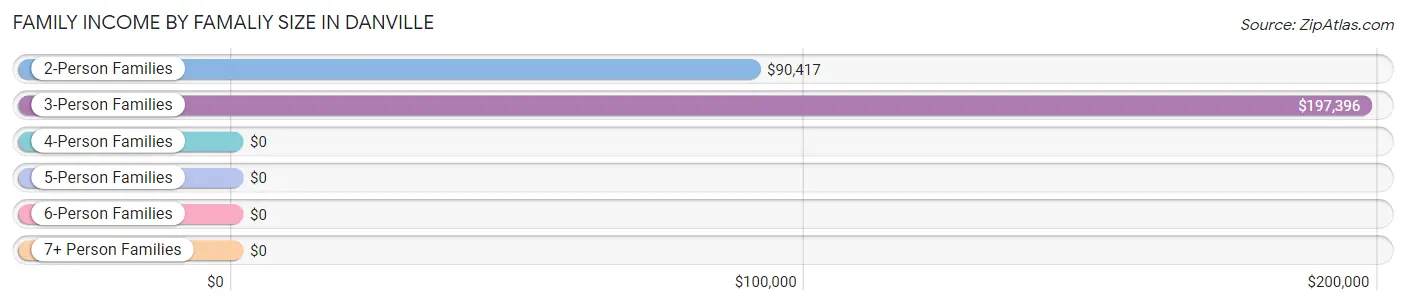
| Income Bracket | # Families | Median Income |
| 2-Person Families | 68 (62.4%) | $90,417 |
| 3-Person Families | 35 (32.1%) | $197,396 |
| 4-Person Families | 6 (5.5%) | $0 |
| 5-Person Families | 0 (0.0%) | $0 |
| 6-Person Families | 0 (0.0%) | $0 |
| 7+ Person Families | 0 (0.0%) | $0 |
| Total | 109 (100.0%) | $0 |
Family Income by Number of Earners in Danville
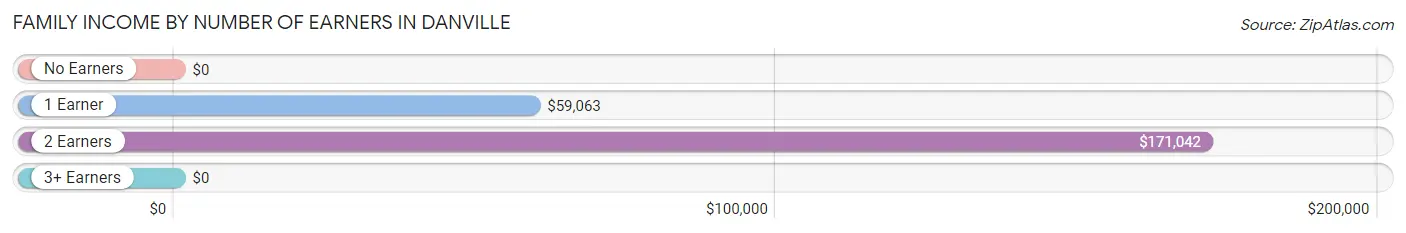
| Number of Earners | # Families | Median Income |
| No Earners | 5 (4.6%) | $0 |
| 1 Earner | 29 (26.6%) | $59,063 |
| 2 Earners | 75 (68.8%) | $171,042 |
| 3+ Earners | 0 (0.0%) | $0 |
| Total | 109 (100.0%) | $0 |
Household Income in Danville
Household Income Brackets in Danville
With 106 households falling in the category, the $15,000 to $24,999 income range is the most frequent in Danville, accounting for 41.1% of all households.
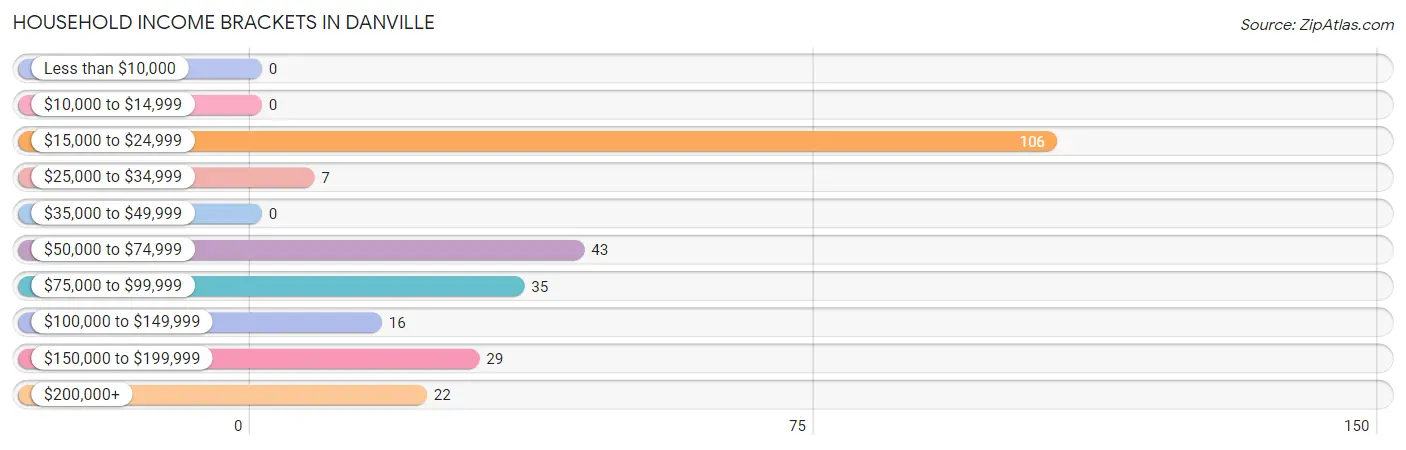
| Income Bracket | # Households | % Households |
| Less than $10,000 | 0 | 0.0% |
| $10,000 to $14,999 | 0 | 0.0% |
| $15,000 to $24,999 | 106 | 41.1% |
| $25,000 to $34,999 | 7 | 2.7% |
| $35,000 to $49,999 | 0 | 0.0% |
| $50,000 to $74,999 | 43 | 16.7% |
| $75,000 to $99,999 | 35 | 13.6% |
| $100,000 to $149,999 | 16 | 6.2% |
| $150,000 to $199,999 | 29 | 11.2% |
| $200,000+ | 22 | 8.5% |
Household Income by Householder Age in Danville
The median household income in Danville is $64,167, with the highest median household income of $69,688 found in the 65+ years age bracket for the primary householder. A total of 67 households (26.0%) fall into this category.
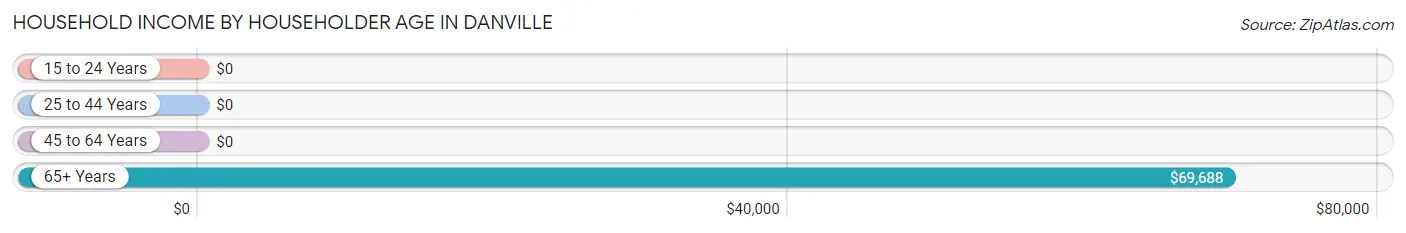
| Income Bracket | # Households | Median Income |
| 15 to 24 Years | 0 (0.0%) | $0 |
| 25 to 44 Years | 65 (25.2%) | $0 |
| 45 to 64 Years | 126 (48.8%) | $0 |
| 65+ Years | 67 (26.0%) | $69,688 |
| Total | 258 (100.0%) | $64,167 |
Poverty in Danville
Income Below Poverty by Sex and Age in Danville
With 3.7% poverty level for males and 2.3% for females among the residents of Danville, 35 to 44 year old males and 6 to 11 year old females are the most vulnerable to poverty, with 7 males (18.4%) and 6 females (50.0%) in their respective age groups living below the poverty level.
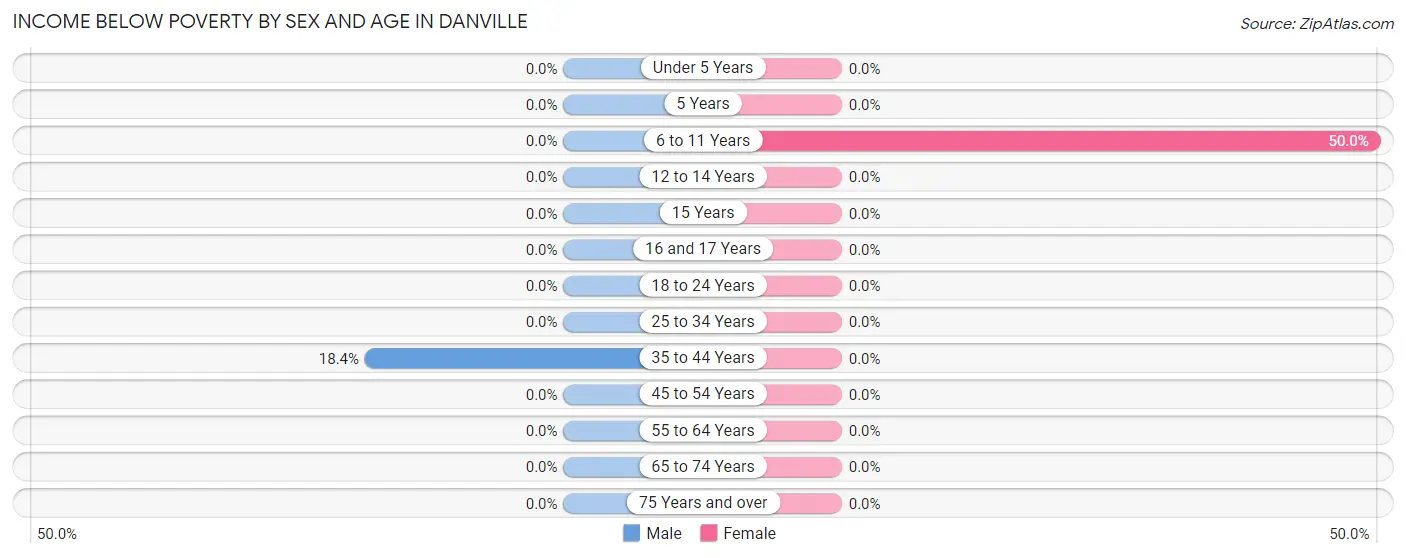
| Age Bracket | Male | Female |
| Under 5 Years | 0 (0.0%) | 0 (0.0%) |
| 5 Years | 0 (0.0%) | 0 (0.0%) |
| 6 to 11 Years | 0 (0.0%) | 6 (50.0%) |
| 12 to 14 Years | 0 (0.0%) | 0 (0.0%) |
| 15 Years | 0 (0.0%) | 0 (0.0%) |
| 16 and 17 Years | 0 (0.0%) | 0 (0.0%) |
| 18 to 24 Years | 0 (0.0%) | 0 (0.0%) |
| 25 to 34 Years | 0 (0.0%) | 0 (0.0%) |
| 35 to 44 Years | 7 (18.4%) | 0 (0.0%) |
| 45 to 54 Years | 0 (0.0%) | 0 (0.0%) |
| 55 to 64 Years | 0 (0.0%) | 0 (0.0%) |
| 65 to 74 Years | 0 (0.0%) | 0 (0.0%) |
| 75 Years and over | 0 (0.0%) | 0 (0.0%) |
| Total | 7 (3.7%) | 6 (2.3%) |
Income Above Poverty by Sex and Age in Danville
According to the poverty statistics in Danville, males aged under 5 years and females aged 5 years are the age groups that are most secure financially, with 100.0% of males and 100.0% of females in these age groups living above the poverty line.
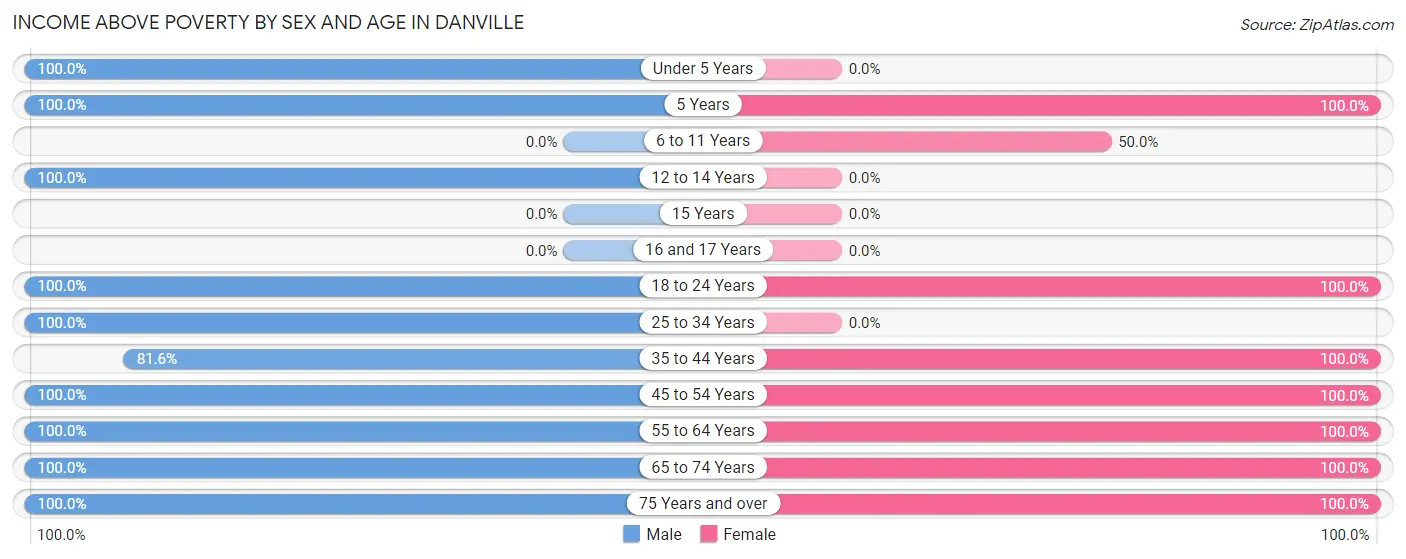
| Age Bracket | Male | Female |
| Under 5 Years | 7 (100.0%) | 0 (0.0%) |
| 5 Years | 18 (100.0%) | 4 (100.0%) |
| 6 to 11 Years | 0 (0.0%) | 6 (50.0%) |
| 12 to 14 Years | 2 (100.0%) | 0 (0.0%) |
| 15 Years | 0 (0.0%) | 0 (0.0%) |
| 16 and 17 Years | 0 (0.0%) | 0 (0.0%) |
| 18 to 24 Years | 8 (100.0%) | 21 (100.0%) |
| 25 to 34 Years | 21 (100.0%) | 0 (0.0%) |
| 35 to 44 Years | 31 (81.6%) | 45 (100.0%) |
| 45 to 54 Years | 29 (100.0%) | 1 (100.0%) |
| 55 to 64 Years | 5 (100.0%) | 132 (100.0%) |
| 65 to 74 Years | 49 (100.0%) | 20 (100.0%) |
| 75 Years and over | 12 (100.0%) | 26 (100.0%) |
| Total | 182 (96.3%) | 255 (97.7%) |
Income Below Poverty Among Married-Couple Families in Danville
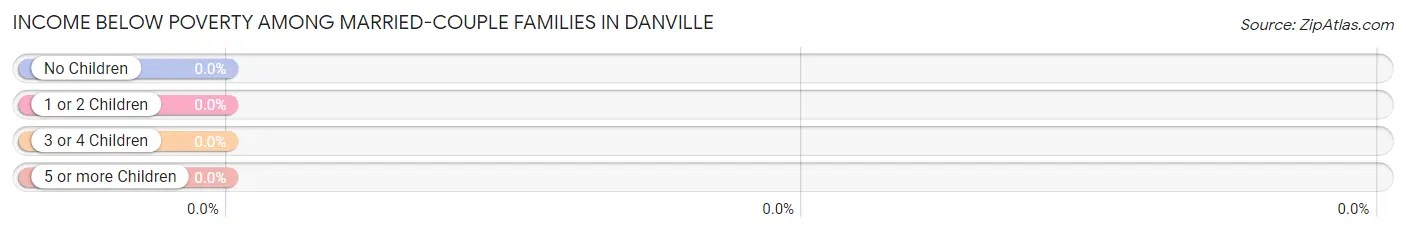
| Children | Above Poverty | Below Poverty |
| No Children | 66 (100.0%) | 0 (0.0%) |
| 1 or 2 Children | 29 (100.0%) | 0 (0.0%) |
| 3 or 4 Children | 0 (0.0%) | 0 (0.0%) |
| 5 or more Children | 0 (0.0%) | 0 (0.0%) |
| Total | 95 (100.0%) | 0 (0.0%) |
Income Below Poverty Among Single-Parent Households in Danville
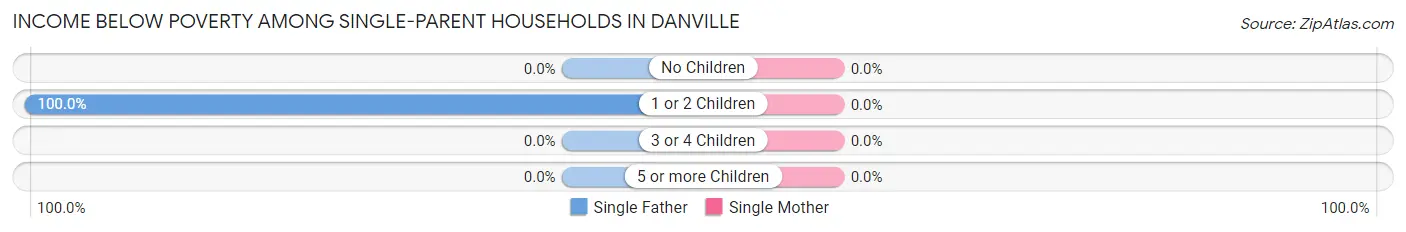
| Children | Single Father | Single Mother |
| No Children | 0 (0.0%) | 0 (0.0%) |
| 1 or 2 Children | 7 (100.0%) | 0 (0.0%) |
| 3 or 4 Children | 0 (0.0%) | 0 (0.0%) |
| 5 or more Children | 0 (0.0%) | 0 (0.0%) |
| Total | 7 (100.0%) | 0 (0.0%) |
Income Below Poverty Among Married-Couple vs Single-Parent Households in Danville
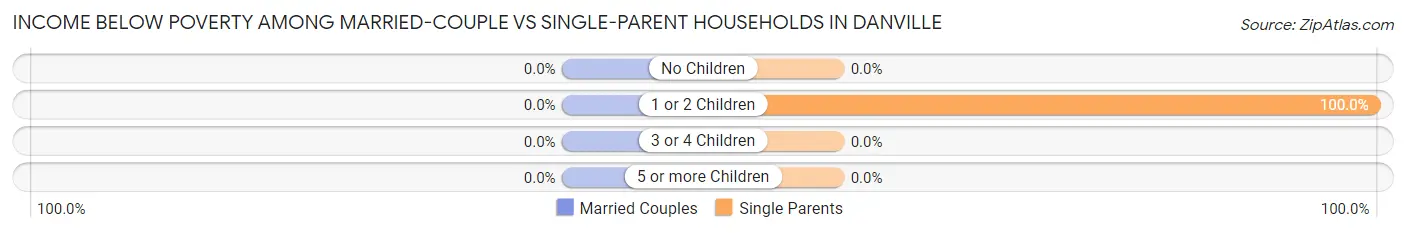
| Children | Married-Couple Families | Single-Parent Households |
| No Children | 0 (0.0%) | 0 (0.0%) |
| 1 or 2 Children | 0 (0.0%) | 7 (100.0%) |
| 3 or 4 Children | 0 (0.0%) | 0 (0.0%) |
| 5 or more Children | 0 (0.0%) | 0 (0.0%) |
| Total | 0 (0.0%) | 7 (50.0%) |
Race in Danville
The most populous races in Danville are White / Caucasian (449 | 99.8%), and Two or more Races (1 | 0.2%).
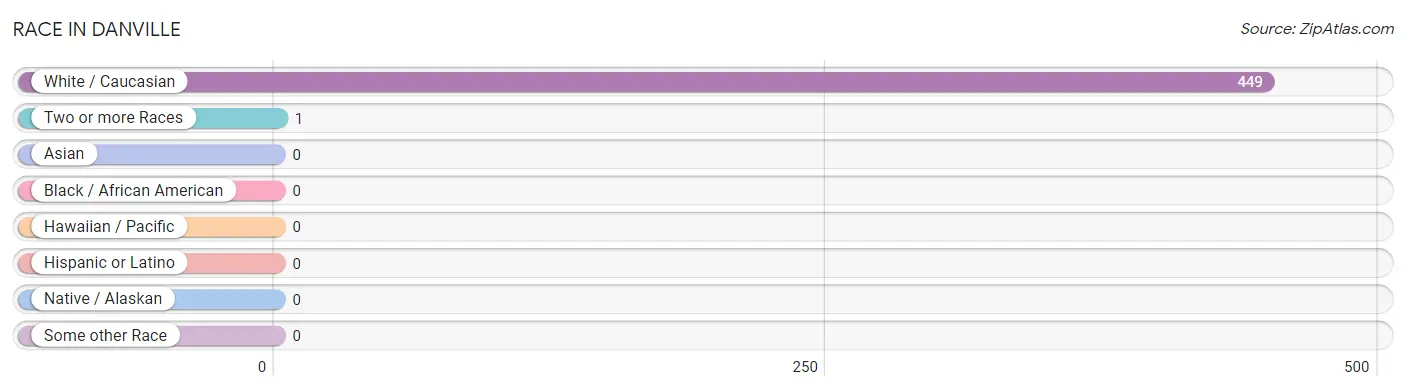
| Race | # Population | % Population |
| Asian | 0 | 0.0% |
| Black / African American | 0 | 0.0% |
| Hawaiian / Pacific | 0 | 0.0% |
| Hispanic or Latino | 0 | 0.0% |
| Native / Alaskan | 0 | 0.0% |
| White / Caucasian | 449 | 99.8% |
| Two or more Races | 1 | 0.2% |
| Some other Race | 0 | 0.0% |
| Total | 450 | 100.0% |
Ancestry in Danville
The most populous ancestries reported in Danville are Scottish (142 | 31.6%), English (84 | 18.7%), French (72 | 16.0%), Irish (58 | 12.9%), and European (35 | 7.8%), together accounting for 86.9% of all Danville residents.
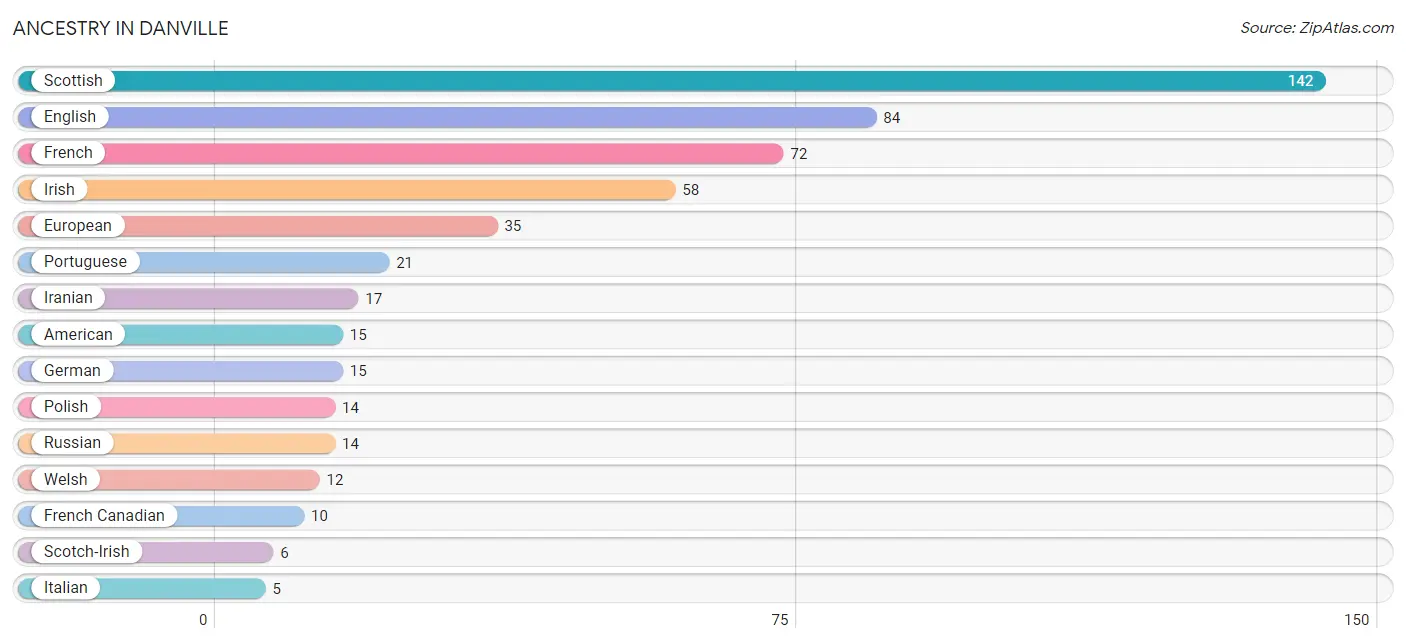
| Ancestry | # Population | % Population |
| Alsatian | 1 | 0.2% |
| American | 15 | 3.3% |
| English | 84 | 18.7% |
| European | 35 | 7.8% |
| French | 72 | 16.0% |
| French Canadian | 10 | 2.2% |
| German | 15 | 3.3% |
| Iranian | 17 | 3.8% |
| Irish | 58 | 12.9% |
| Italian | 5 | 1.1% |
| Polish | 14 | 3.1% |
| Portuguese | 21 | 4.7% |
| Russian | 14 | 3.1% |
| Scotch-Irish | 6 | 1.3% |
| Scottish | 142 | 31.6% |
| Welsh | 12 | 2.7% | View All 16 Rows |
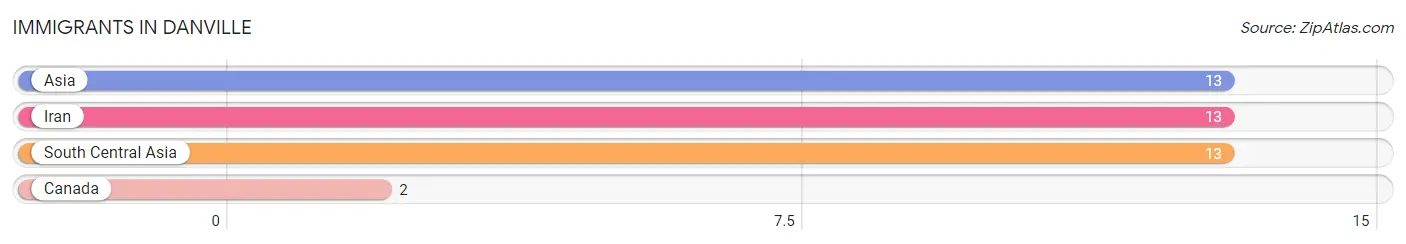
Immigrants in Danville
The most numerous immigrant groups reported in Danville came from Asia (13 | 2.9%), Iran (13 | 2.9%), South Central Asia (13 | 2.9%), and Canada (2 | 0.4%), together accounting for 9.1% of all Danville residents.
| Immigration Origin | # Population | % Population |
| Asia | 13 | 2.9% |
| Canada | 2 | 0.4% |
| Iran | 13 | 2.9% |
| South Central Asia | 13 | 2.9% | View All 4 Rows |
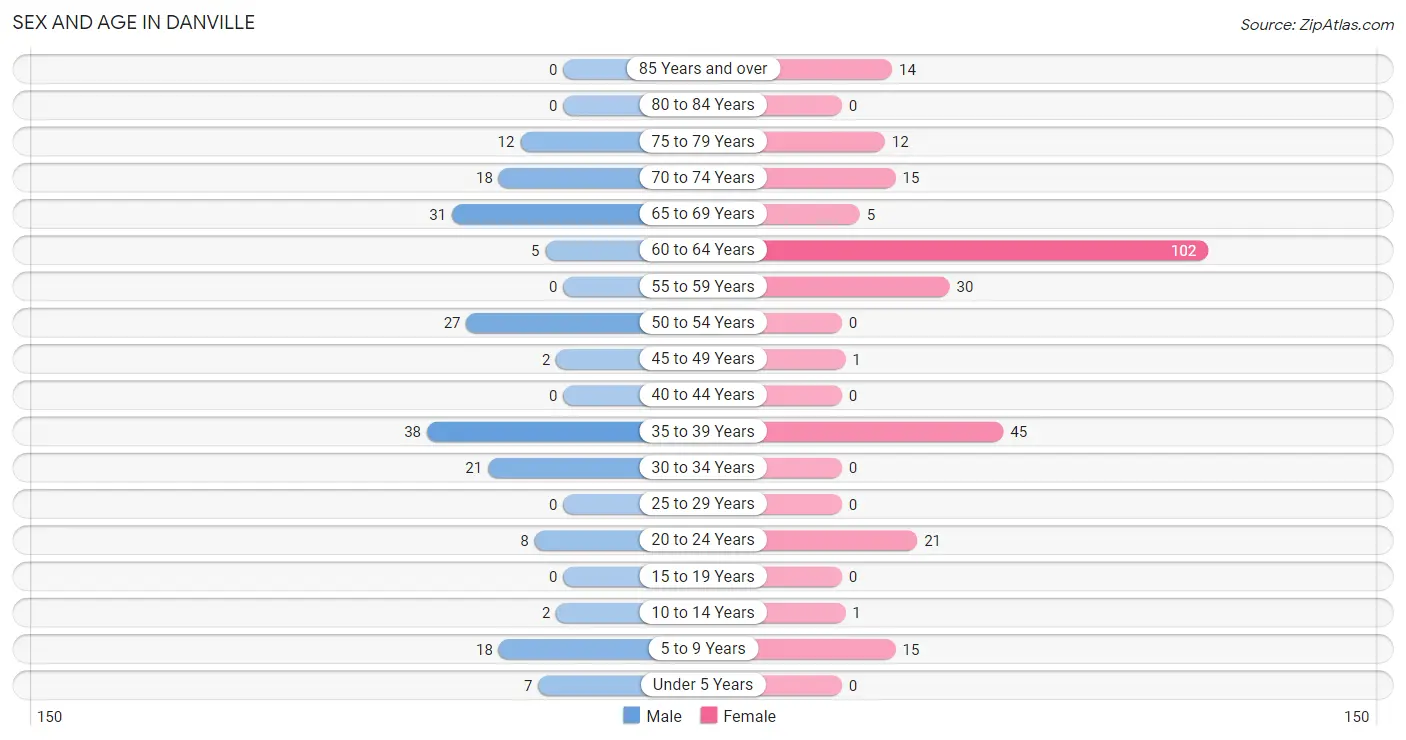
Sex and Age in Danville
Sex and Age in Danville
The most populous age groups in Danville are 35 to 39 Years (38 | 20.1%) for men and 60 to 64 Years (102 | 39.1%) for women.
| Age Bracket | Male | Female |
| Under 5 Years | 7 (3.7%) | 0 (0.0%) |
| 5 to 9 Years | 18 (9.5%) | 15 (5.8%) |
| 10 to 14 Years | 2 (1.1%) | 1 (0.4%) |
| 15 to 19 Years | 0 (0.0%) | 0 (0.0%) |
| 20 to 24 Years | 8 (4.2%) | 21 (8.1%) |
| 25 to 29 Years | 0 (0.0%) | 0 (0.0%) |
| 30 to 34 Years | 21 (11.1%) | 0 (0.0%) |
| 35 to 39 Years | 38 (20.1%) | 45 (17.2%) |
| 40 to 44 Years | 0 (0.0%) | 0 (0.0%) |
| 45 to 49 Years | 2 (1.1%) | 1 (0.4%) |
| 50 to 54 Years | 27 (14.3%) | 0 (0.0%) |
| 55 to 59 Years | 0 (0.0%) | 30 (11.5%) |
| 60 to 64 Years | 5 (2.6%) | 102 (39.1%) |
| 65 to 69 Years | 31 (16.4%) | 5 (1.9%) |
| 70 to 74 Years | 18 (9.5%) | 15 (5.8%) |
| 75 to 79 Years | 12 (6.4%) | 12 (4.6%) |
| 80 to 84 Years | 0 (0.0%) | 0 (0.0%) |
| 85 Years and over | 0 (0.0%) | 14 (5.4%) |
| Total | 189 (100.0%) | 261 (100.0%) |
Families and Households in Danville
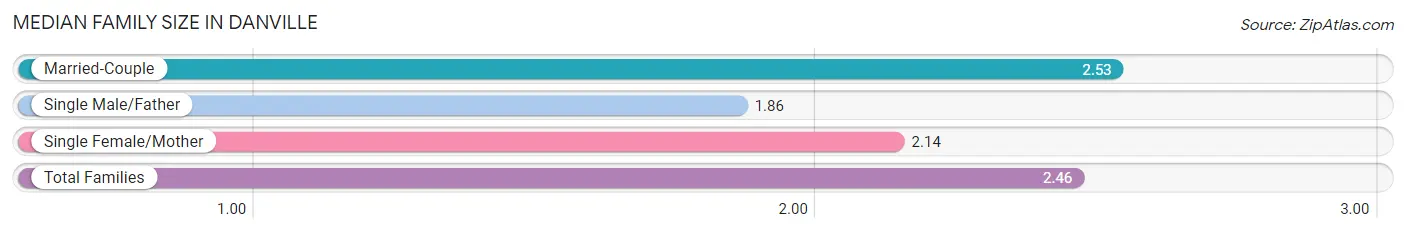
Median Family Size in Danville
The median family size in Danville is 2.46 persons per family, with married-couple families (95 | 87.2%) accounting for the largest median family size of 2.53 persons per family. On the other hand, single male/father families (7 | 6.4%) represent the smallest median family size with 1.86 persons per family.
| Family Type | # Families | Family Size |
| Married-Couple | 95 (87.2%) | 2.53 |
| Single Male/Father | 7 (6.4%) | 1.86 |
| Single Female/Mother | 7 (6.4%) | 2.14 |
| Total Families | 109 (100.0%) | 2.46 |
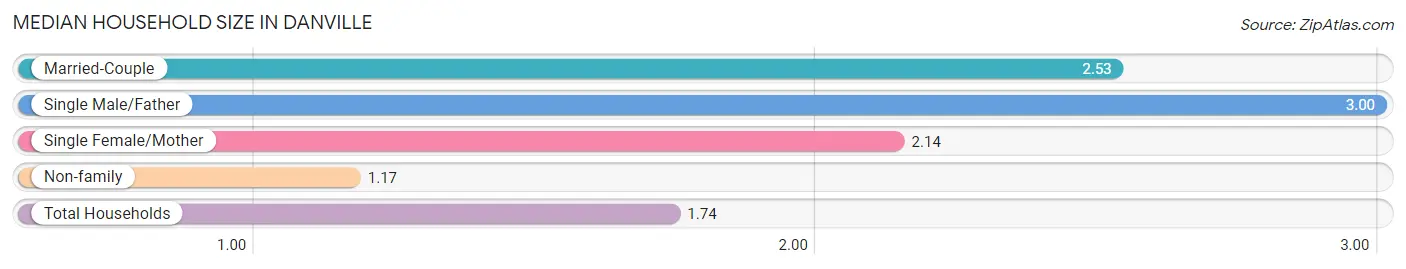
Median Household Size in Danville
The median household size in Danville is 1.74 persons per household, with single male/father households (7 | 2.7%) accounting for the largest median household size of 3 persons per household. non-family households (149 | 57.8%) represent the smallest median household size with 1.17 persons per household.
| Household Type | # Households | Household Size |
| Married-Couple | 95 (36.8%) | 2.53 |
| Single Male/Father | 7 (2.7%) | 3.00 |
| Single Female/Mother | 7 (2.7%) | 2.14 |
| Non-family | 149 (57.8%) | 1.17 |
| Total Households | 258 (100.0%) | 1.74 |
Household Size by Marriage Status in Danville
Out of a total of 258 households in Danville, 109 (42.2%) are family households, while 149 (57.8%) are nonfamily households. The most numerous type of family households are 2-person households, comprising 61, and the most common type of nonfamily households are 1-person households, comprising 124.
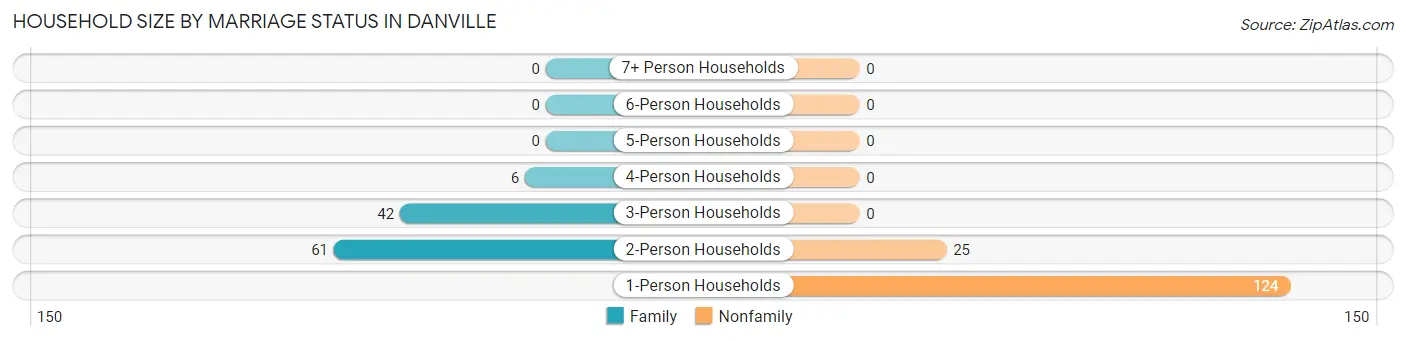
| Household Size | Family Households | Nonfamily Households |
| 1-Person Households | - | 124 (48.1%) |
| 2-Person Households | 61 (23.6%) | 25 (9.7%) |
| 3-Person Households | 42 (16.3%) | 0 (0.0%) |
| 4-Person Households | 6 (2.3%) | 0 (0.0%) |
| 5-Person Households | 0 (0.0%) | 0 (0.0%) |
| 6-Person Households | 0 (0.0%) | 0 (0.0%) |
| 7+ Person Households | 0 (0.0%) | 0 (0.0%) |
| Total | 109 (42.2%) | 149 (57.8%) |
Female Fertility in Danville
Fertility by Age in Danville
Average fertility rate in Danville is 134.0 births per 1,000 women. Women in the age bracket of 35 to 50 years have the highest fertility rate with 196.0 births per 1,000 women. Women in the age bracket of 35 to 50 years acount for 100.0% of all women with births.
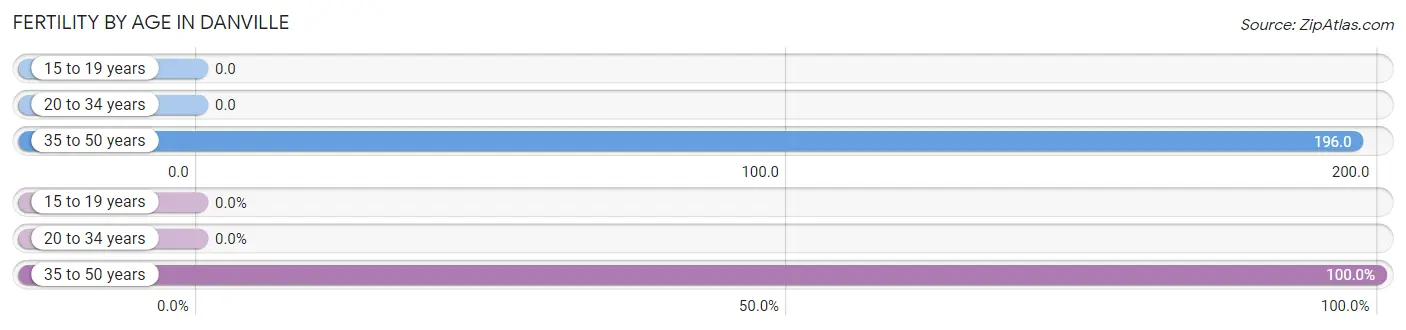
| Age Bracket | Women with Births | Births / 1,000 Women |
| 15 to 19 years | 0 (0.0%) | 0.0 |
| 20 to 34 years | 0 (0.0%) | 0.0 |
| 35 to 50 years | 9 (100.0%) | 196.0 |
| Total | 9 (100.0%) | 134.0 |
Fertility by Age by Marriage Status in Danville
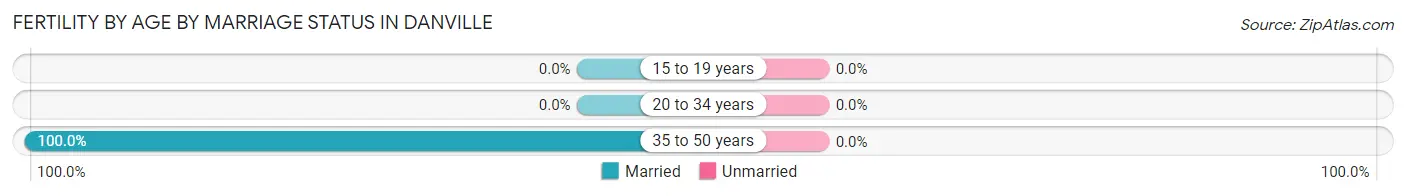
| Age Bracket | Married | Unmarried |
| 15 to 19 years | 0 (0.0%) | 0 (0.0%) |
| 20 to 34 years | 0 (0.0%) | 0 (0.0%) |
| 35 to 50 years | 9 (100.0%) | 0 (0.0%) |
| Total | 9 (100.0%) | 0 (0.0%) |
Fertility by Education in Danville
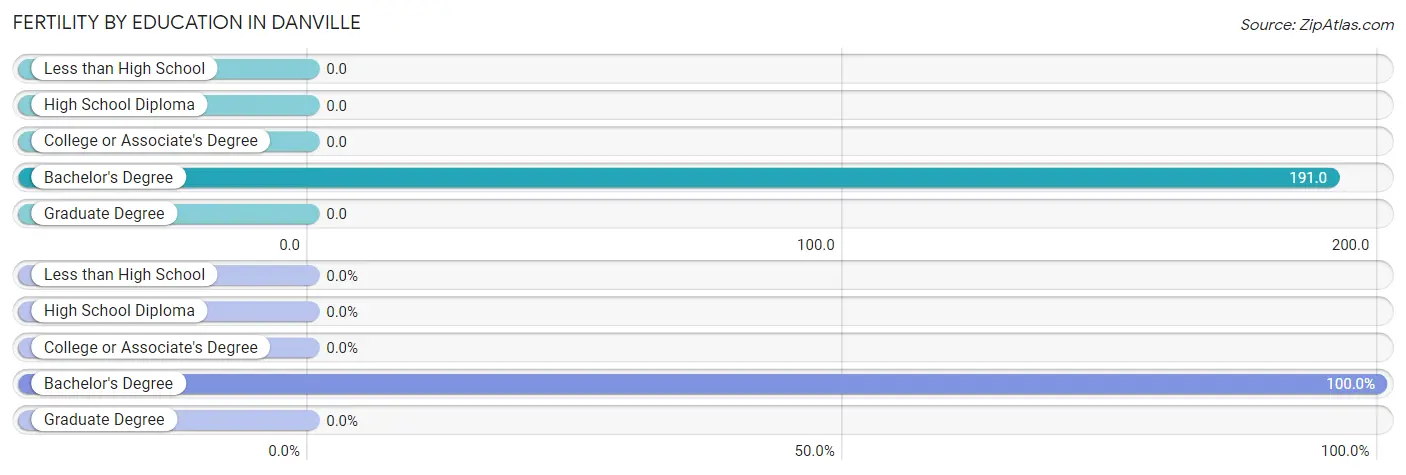
| Educational Attainment | Women with Births | Births / 1,000 Women |
| Less than High School | 0 (0.0%) | 0.0 |
| High School Diploma | 0 (0.0%) | 0.0 |
| College or Associate's Degree | 0 (0.0%) | 0.0 |
| Bachelor's Degree | 9 (100.0%) | 191.0 |
| Graduate Degree | 0 (0.0%) | 0.0 |
| Total | 9 (100.0%) | 134.0 |
Fertility by Education by Marriage Status in Danville
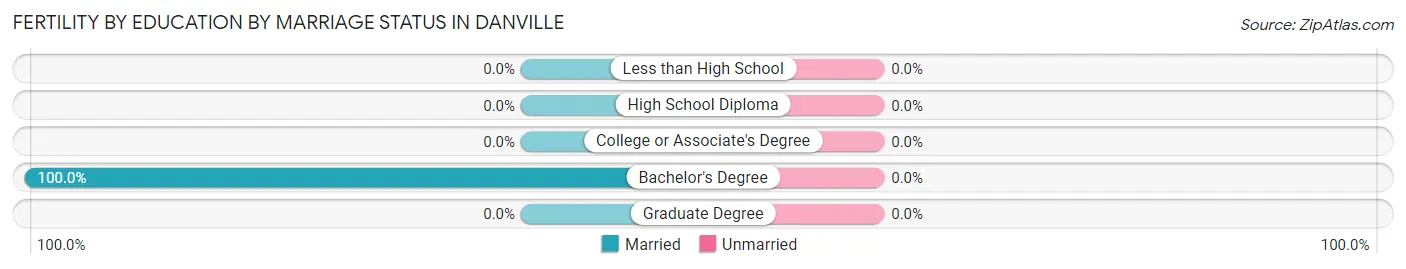
| Educational Attainment | Married | Unmarried |
| Less than High School | 0 (0.0%) | 0 (0.0%) |
| High School Diploma | 0 (0.0%) | 0 (0.0%) |
| College or Associate's Degree | 0 (0.0%) | 0 (0.0%) |
| Bachelor's Degree | 9 (100.0%) | 0 (0.0%) |
| Graduate Degree | 0 (0.0%) | 0 (0.0%) |
| Total | 9 (100.0%) | 0 (0.0%) |
Employment Characteristics in Danville
Employment by Class of Employer in Danville
Among the 226 employed individuals in Danville, private company employees (145 | 64.2%), not-for-profit organizations (28 | 12.4%), and self-employed (not incorporated) (27 | 11.9%) make up the most common classes of employment.
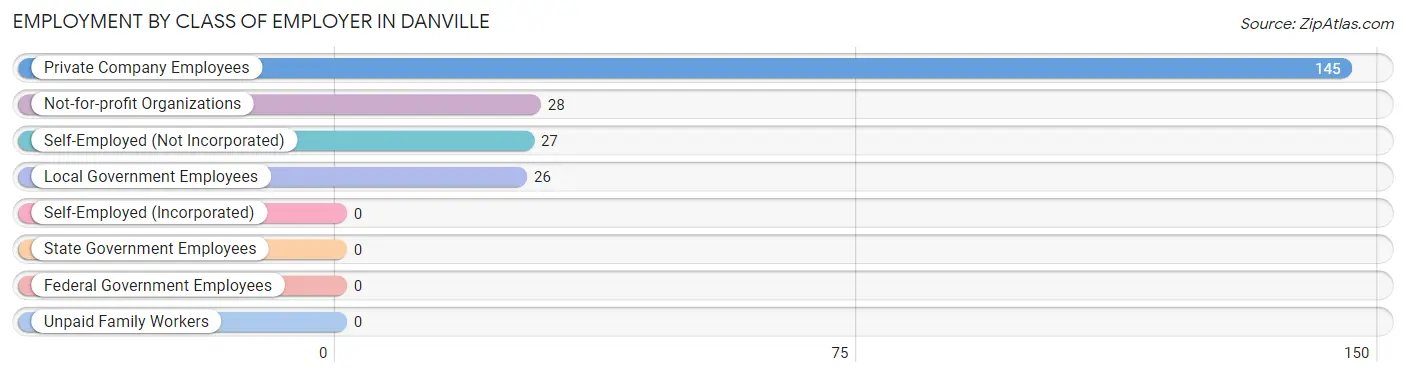
| Employer Class | # Employees | % Employees |
| Private Company Employees | 145 | 64.2% |
| Self-Employed (Incorporated) | 0 | 0.0% |
| Self-Employed (Not Incorporated) | 27 | 11.9% |
| Not-for-profit Organizations | 28 | 12.4% |
| Local Government Employees | 26 | 11.5% |
| State Government Employees | 0 | 0.0% |
| Federal Government Employees | 0 | 0.0% |
| Unpaid Family Workers | 0 | 0.0% |
| Total | 226 | 100.0% |
Employment Status by Age in Danville
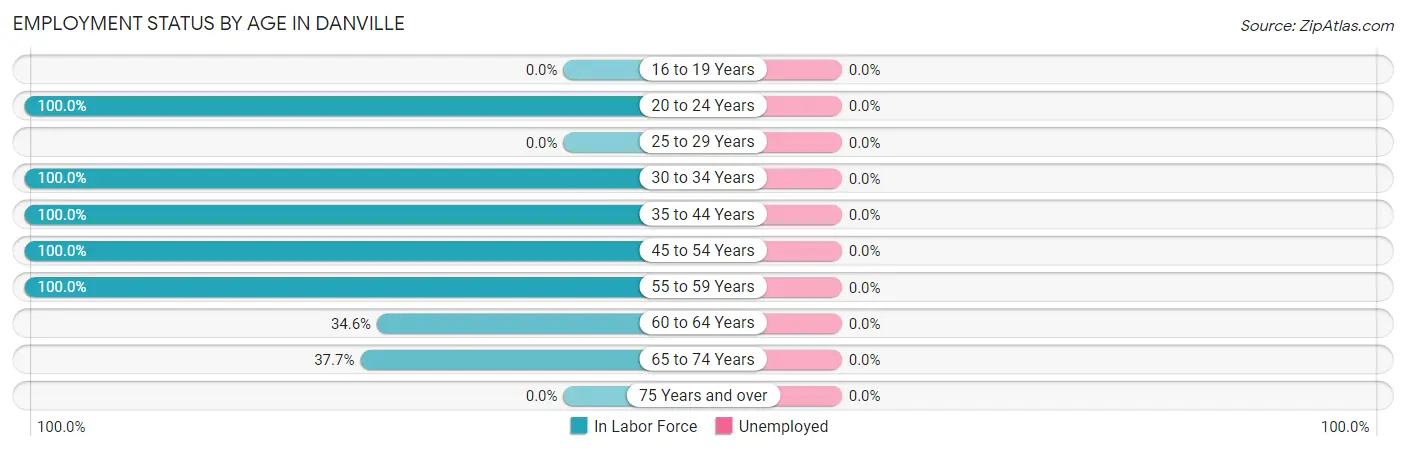
| Age Bracket | In Labor Force | Unemployed |
| 16 to 19 Years | 0 (0.0%) | 0 (0.0%) |
| 20 to 24 Years | 29 (100.0%) | 0 (0.0%) |
| 25 to 29 Years | 0 (0.0%) | 0 (0.0%) |
| 30 to 34 Years | 21 (100.0%) | 0 (0.0%) |
| 35 to 44 Years | 83 (100.0%) | 0 (0.0%) |
| 45 to 54 Years | 30 (100.0%) | 0 (0.0%) |
| 55 to 59 Years | 30 (100.0%) | 0 (0.0%) |
| 60 to 64 Years | 37 (34.6%) | 0 (0.0%) |
| 65 to 74 Years | 26 (37.7%) | 0 (0.0%) |
| 75 Years and over | 0 (0.0%) | 0 (0.0%) |
| Total | 256 (62.9%) | 0 (0.0%) |
Employment Status by Educational Attainment in Danville
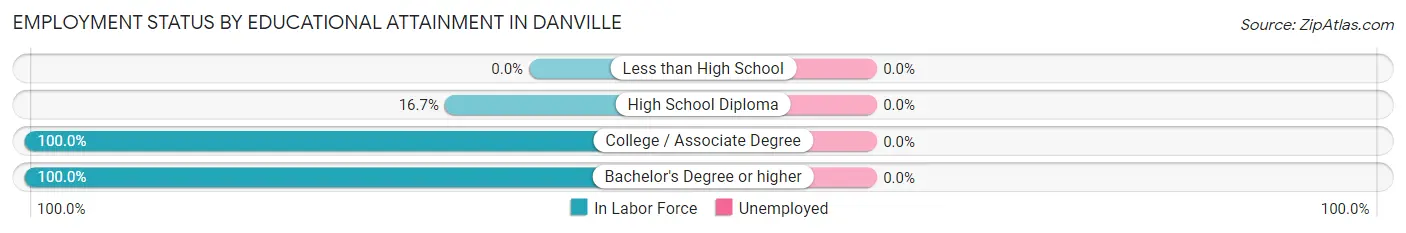
| Educational Attainment | In Labor Force | Unemployed |
| Less than High School | 0 (0.0%) | 0 (0.0%) |
| High School Diploma | 14 (16.7%) | 0 (0.0%) |
| College / Associate Degree | 90 (100.0%) | 0 (0.0%) |
| Bachelor's Degree or higher | 97 (100.0%) | 0 (0.0%) |
| Total | 201 (74.2%) | 0 (0.0%) |
Employment Occupations by Sex in Danville
Management, Business, Science and Arts Occupations
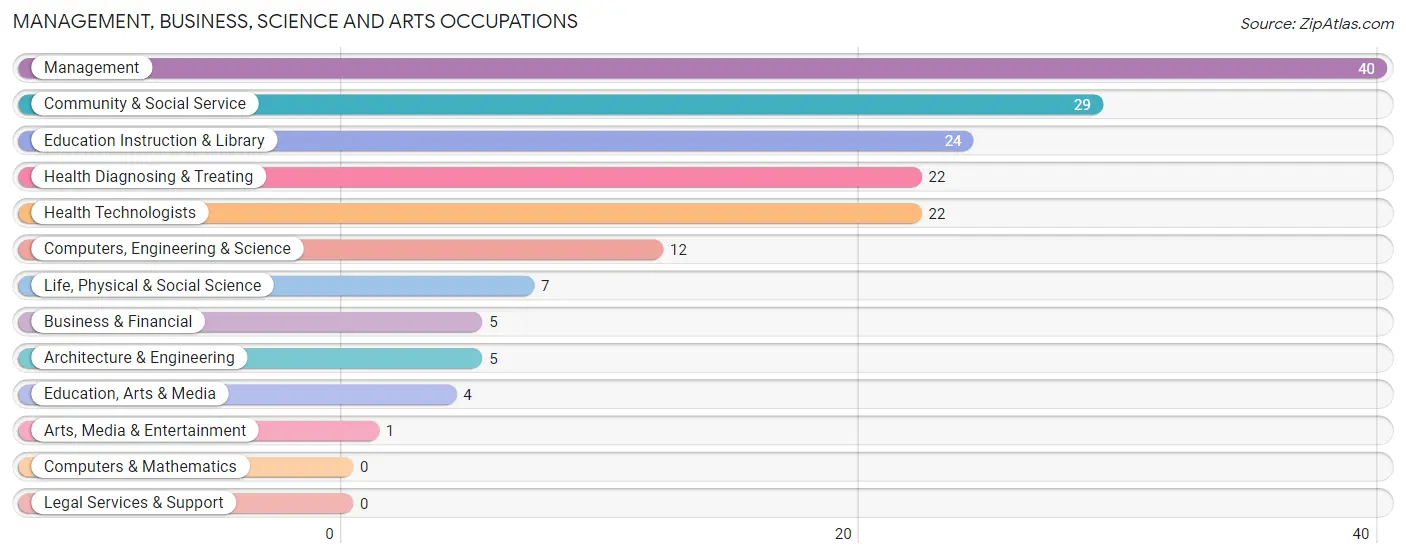
The most common Management, Business, Science and Arts occupations in Danville are Management (40 | 15.6%), Community & Social Service (29 | 11.3%), Education Instruction & Library (24 | 9.4%), Health Diagnosing & Treating (22 | 8.6%), and Health Technologists (22 | 8.6%).
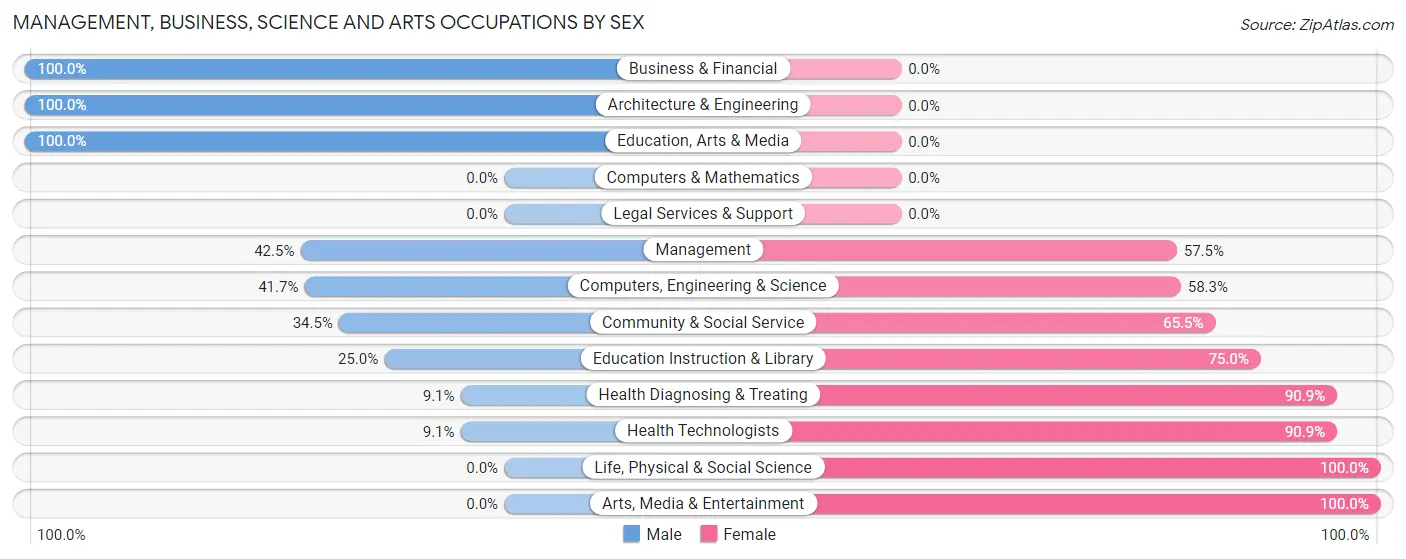
Management, Business, Science and Arts Occupations by Sex
Within the Management, Business, Science and Arts occupations in Danville, the most male-oriented occupations are Business & Financial (100.0%), Architecture & Engineering (100.0%), and Education, Arts & Media (100.0%), while the most female-oriented occupations are Life, Physical & Social Science (100.0%), Arts, Media & Entertainment (100.0%), and Health Diagnosing & Treating (90.9%).
| Occupation | Male | Female |
| Management | 17 (42.5%) | 23 (57.5%) |
| Business & Financial | 5 (100.0%) | 0 (0.0%) |
| Computers, Engineering & Science | 5 (41.7%) | 7 (58.3%) |
| Computers & Mathematics | 0 (0.0%) | 0 (0.0%) |
| Architecture & Engineering | 5 (100.0%) | 0 (0.0%) |
| Life, Physical & Social Science | 0 (0.0%) | 7 (100.0%) |
| Community & Social Service | 10 (34.5%) | 19 (65.5%) |
| Education, Arts & Media | 4 (100.0%) | 0 (0.0%) |
| Legal Services & Support | 0 (0.0%) | 0 (0.0%) |
| Education Instruction & Library | 6 (25.0%) | 18 (75.0%) |
| Arts, Media & Entertainment | 0 (0.0%) | 1 (100.0%) |
| Health Diagnosing & Treating | 2 (9.1%) | 20 (90.9%) |
| Health Technologists | 2 (9.1%) | 20 (90.9%) |
| Total (Category) | 39 (36.1%) | 69 (63.9%) |
| Total (Overall) | 126 (49.2%) | 130 (50.8%) |
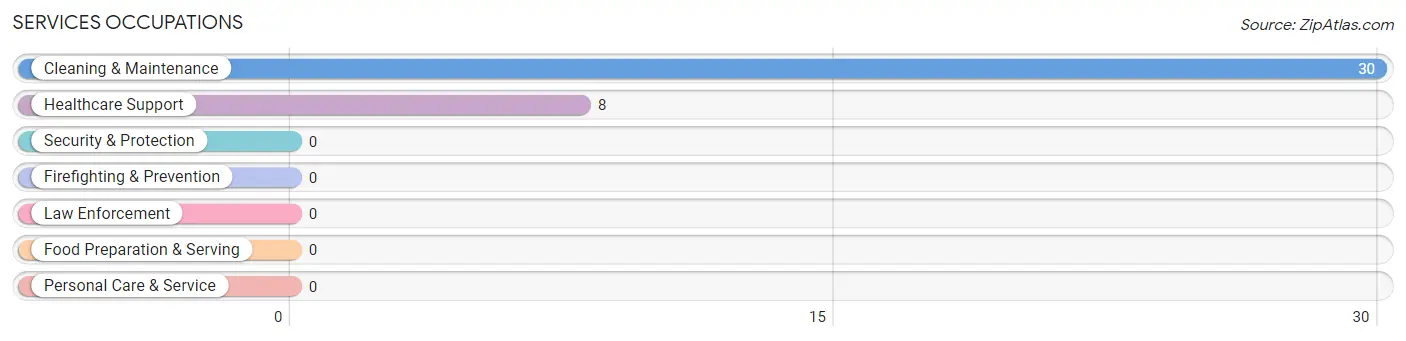
Services Occupations
The most common Services occupations in Danville are Cleaning & Maintenance (30 | 11.7%), and Healthcare Support (8 | 3.1%).
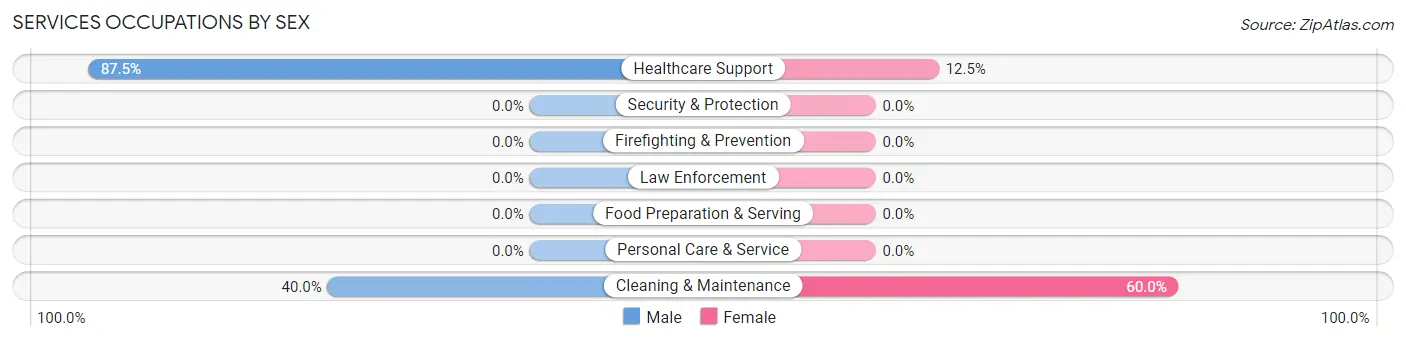
Services Occupations by Sex
Within the Services occupations in Danville, the most male-oriented occupations are Healthcare Support (87.5%), and Cleaning & Maintenance (40.0%), while the most female-oriented occupations are Cleaning & Maintenance (60.0%), and Healthcare Support (12.5%).
| Occupation | Male | Female |
| Healthcare Support | 7 (87.5%) | 1 (12.5%) |
| Security & Protection | 0 (0.0%) | 0 (0.0%) |
| Firefighting & Prevention | 0 (0.0%) | 0 (0.0%) |
| Law Enforcement | 0 (0.0%) | 0 (0.0%) |
| Food Preparation & Serving | 0 (0.0%) | 0 (0.0%) |
| Cleaning & Maintenance | 12 (40.0%) | 18 (60.0%) |
| Personal Care & Service | 0 (0.0%) | 0 (0.0%) |
| Total (Category) | 19 (50.0%) | 19 (50.0%) |
| Total (Overall) | 126 (49.2%) | 130 (50.8%) |
Sales and Office Occupations
The most common Sales and Office occupations in Danville are Office & Administration (34 | 13.3%), and Sales & Related (7 | 2.7%).
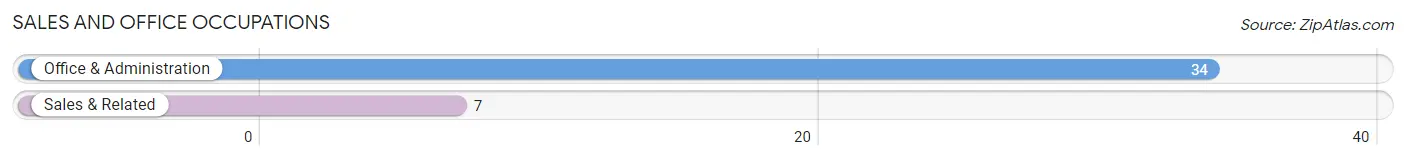
Sales and Office Occupations by Sex
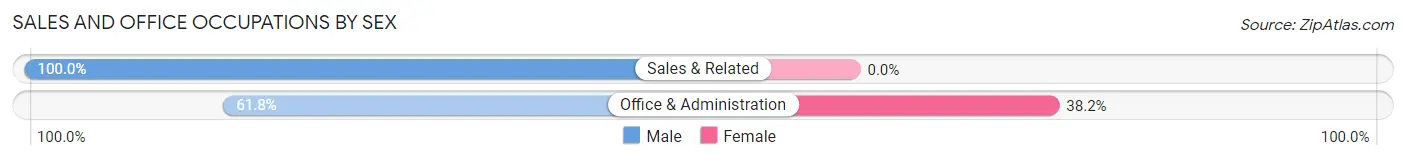
| Occupation | Male | Female |
| Sales & Related | 7 (100.0%) | 0 (0.0%) |
| Office & Administration | 21 (61.8%) | 13 (38.2%) |
| Total (Category) | 28 (68.3%) | 13 (31.7%) |
| Total (Overall) | 126 (49.2%) | 130 (50.8%) |
Natural Resources, Construction and Maintenance Occupations
The most common Natural Resources, Construction and Maintenance occupations in Danville are , and Construction & Extraction (21 | 8.2%).
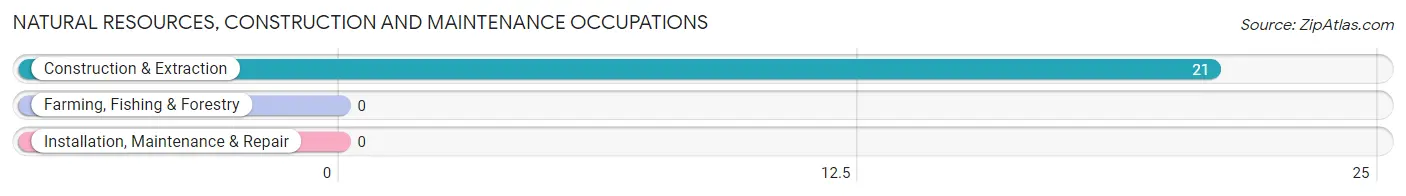
Natural Resources, Construction and Maintenance Occupations by Sex
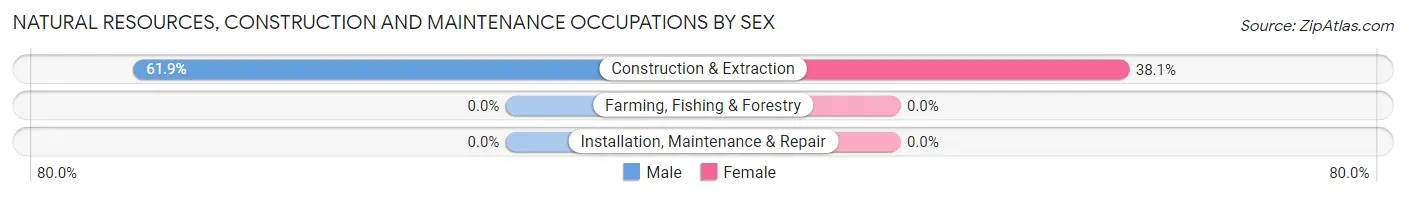
| Occupation | Male | Female |
| Farming, Fishing & Forestry | 0 (0.0%) | 0 (0.0%) |
| Construction & Extraction | 13 (61.9%) | 8 (38.1%) |
| Installation, Maintenance & Repair | 0 (0.0%) | 0 (0.0%) |
| Total (Category) | 13 (61.9%) | 8 (38.1%) |
| Total (Overall) | 126 (49.2%) | 130 (50.8%) |
Production, Transportation and Moving Occupations
The most common Production, Transportation and Moving occupations in Danville are Transportation (23 | 9.0%), Production (21 | 8.2%), and Material Moving (4 | 1.6%).
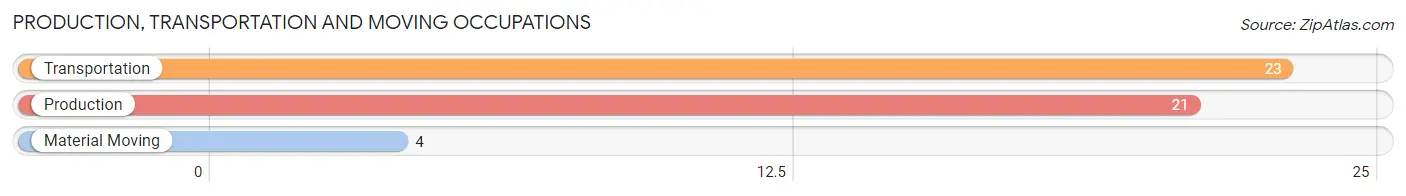
Production, Transportation and Moving Occupations by Sex
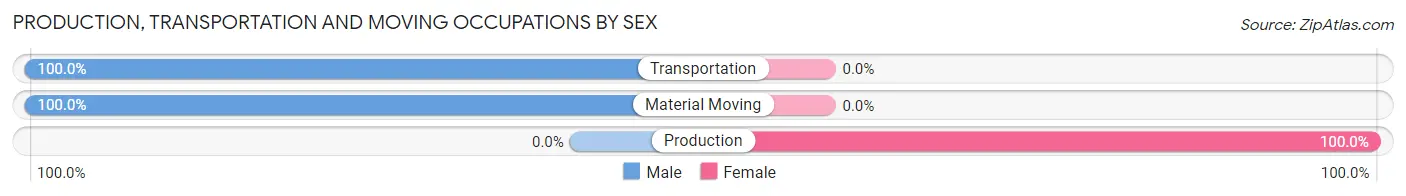
| Occupation | Male | Female |
| Production | 0 (0.0%) | 21 (100.0%) |
| Transportation | 23 (100.0%) | 0 (0.0%) |
| Material Moving | 4 (100.0%) | 0 (0.0%) |
| Total (Category) | 27 (56.2%) | 21 (43.8%) |
| Total (Overall) | 126 (49.2%) | 130 (50.8%) |
Employment Industries by Sex in Danville
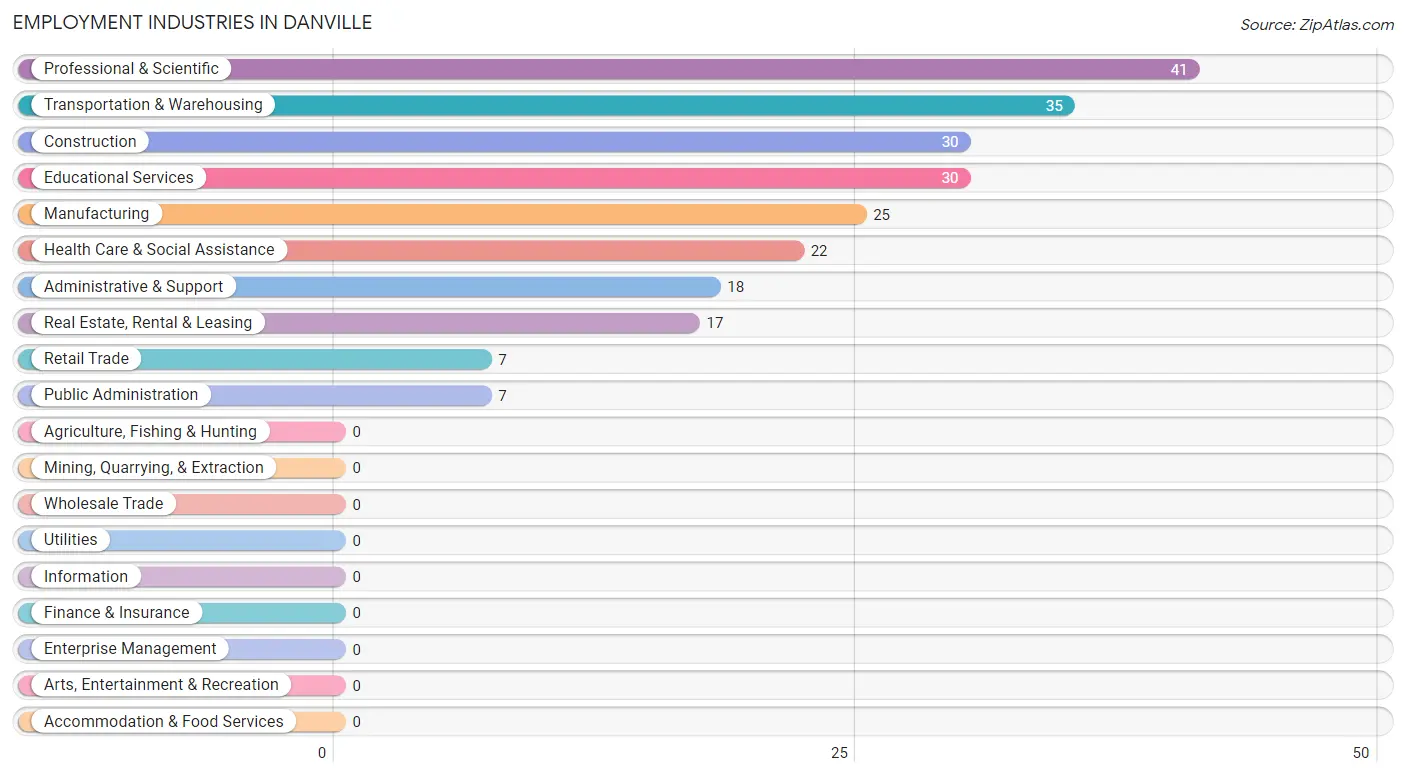
Employment Industries in Danville
The major employment industries in Danville include Professional & Scientific (41 | 16.0%), Transportation & Warehousing (35 | 13.7%), Construction (30 | 11.7%), Educational Services (30 | 11.7%), and Manufacturing (25 | 9.8%).
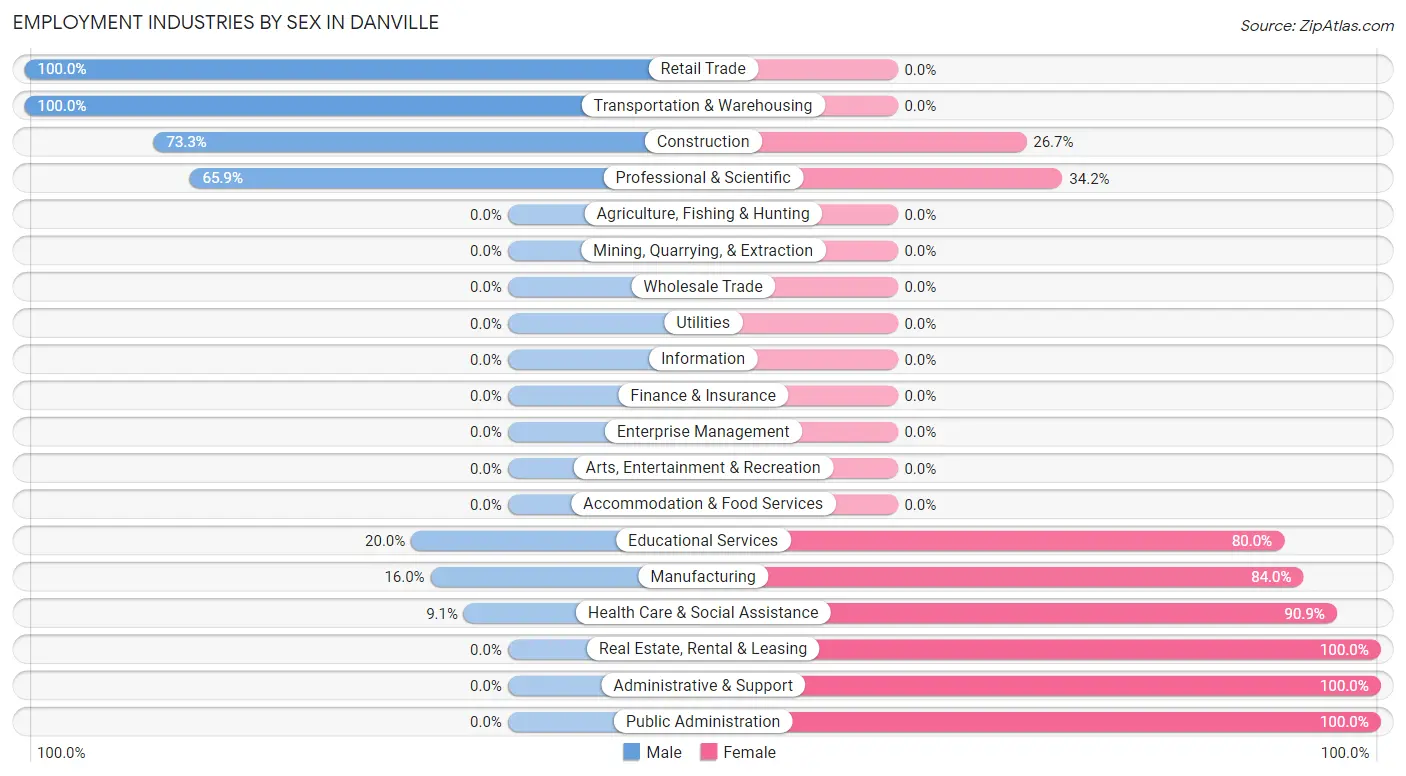
Employment Industries by Sex in Danville
The Danville industries that see more men than women are Retail Trade (100.0%), Transportation & Warehousing (100.0%), and Construction (73.3%), whereas the industries that tend to have a higher number of women are Real Estate, Rental & Leasing (100.0%), Administrative & Support (100.0%), and Public Administration (100.0%).
| Industry | Male | Female |
| Agriculture, Fishing & Hunting | 0 (0.0%) | 0 (0.0%) |
| Mining, Quarrying, & Extraction | 0 (0.0%) | 0 (0.0%) |
| Construction | 22 (73.3%) | 8 (26.7%) |
| Manufacturing | 4 (16.0%) | 21 (84.0%) |
| Wholesale Trade | 0 (0.0%) | 0 (0.0%) |
| Retail Trade | 7 (100.0%) | 0 (0.0%) |
| Transportation & Warehousing | 35 (100.0%) | 0 (0.0%) |
| Utilities | 0 (0.0%) | 0 (0.0%) |
| Information | 0 (0.0%) | 0 (0.0%) |
| Finance & Insurance | 0 (0.0%) | 0 (0.0%) |
| Real Estate, Rental & Leasing | 0 (0.0%) | 17 (100.0%) |
| Professional & Scientific | 27 (65.8%) | 14 (34.2%) |
| Enterprise Management | 0 (0.0%) | 0 (0.0%) |
| Administrative & Support | 0 (0.0%) | 18 (100.0%) |
| Educational Services | 6 (20.0%) | 24 (80.0%) |
| Health Care & Social Assistance | 2 (9.1%) | 20 (90.9%) |
| Arts, Entertainment & Recreation | 0 (0.0%) | 0 (0.0%) |
| Accommodation & Food Services | 0 (0.0%) | 0 (0.0%) |
| Public Administration | 0 (0.0%) | 7 (100.0%) |
| Total | 126 (49.2%) | 130 (50.8%) |
Education in Danville
School Enrollment in Danville
The most common levels of schooling among the 43 students in Danville are kindergarten (18 | 41.9%), nursery / preschool (11 | 25.6%), and elementary school (11 | 25.6%).
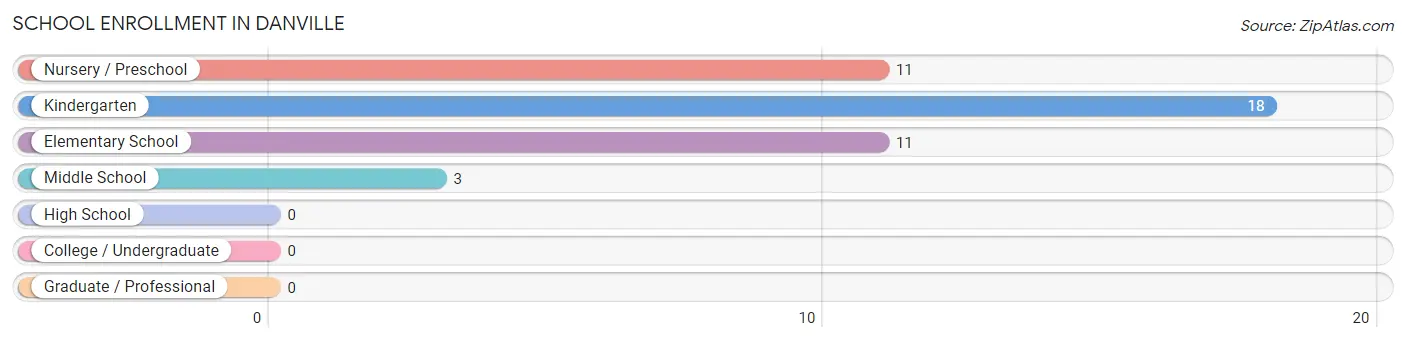
| School Level | # Students | % Students |
| Nursery / Preschool | 11 | 25.6% |
| Kindergarten | 18 | 41.9% |
| Elementary School | 11 | 25.6% |
| Middle School | 3 | 7.0% |
| High School | 0 | 0.0% |
| College / Undergraduate | 0 | 0.0% |
| Graduate / Professional | 0 | 0.0% |
| Total | 43 | 100.0% |
School Enrollment by Age by Funding Source in Danville
Out of a total of 43 students who are enrolled in schools in Danville, 6 (14.0%) attend a private institution, while the remaining 37 (86.0%) are enrolled in public schools. The age group of 5 to 9 year old has the highest likelihood of being enrolled in private schools, with 6 (18.2% in the age bracket) enrolled. Conversely, the age group of 3 to 4 year olds has the lowest likelihood of being enrolled in a private school, with 7 (100.0% in the age bracket) attending a public institution.
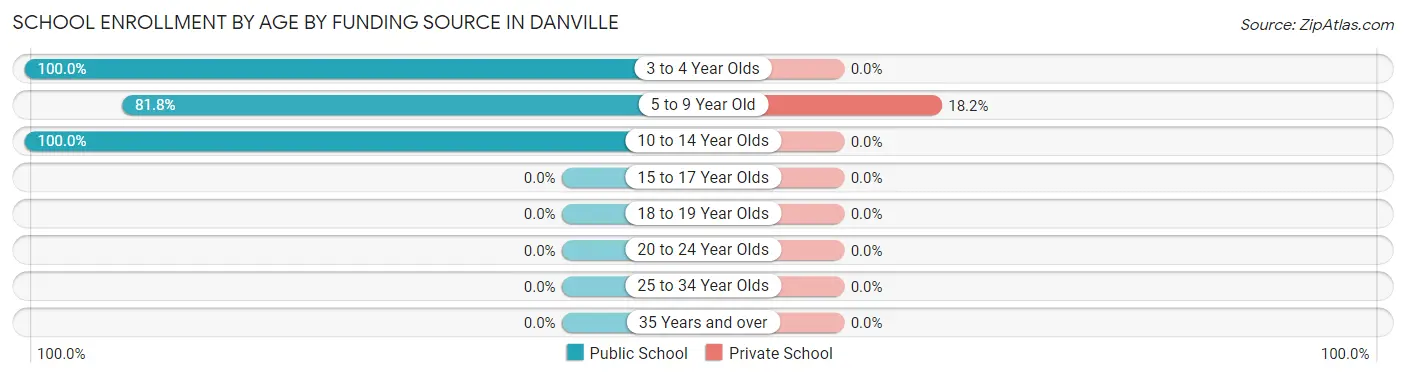
| Age Bracket | Public School | Private School |
| 3 to 4 Year Olds | 7 (100.0%) | 0 (0.0%) |
| 5 to 9 Year Old | 27 (81.8%) | 6 (18.2%) |
| 10 to 14 Year Olds | 3 (100.0%) | 0 (0.0%) |
| 15 to 17 Year Olds | 0 (0.0%) | 0 (0.0%) |
| 18 to 19 Year Olds | 0 (0.0%) | 0 (0.0%) |
| 20 to 24 Year Olds | 0 (0.0%) | 0 (0.0%) |
| 25 to 34 Year Olds | 0 (0.0%) | 0 (0.0%) |
| 35 Years and over | 0 (0.0%) | 0 (0.0%) |
| Total | 37 (86.0%) | 6 (14.0%) |
Educational Attainment by Field of Study in Danville
Business (40 | 22.6%), social sciences (33 | 18.6%), visual & performing arts (31 | 17.5%), education (20 | 11.3%), and literature & languages (12 | 6.8%) are the most common fields of study among 177 individuals in Danville who have obtained a bachelor's degree or higher.
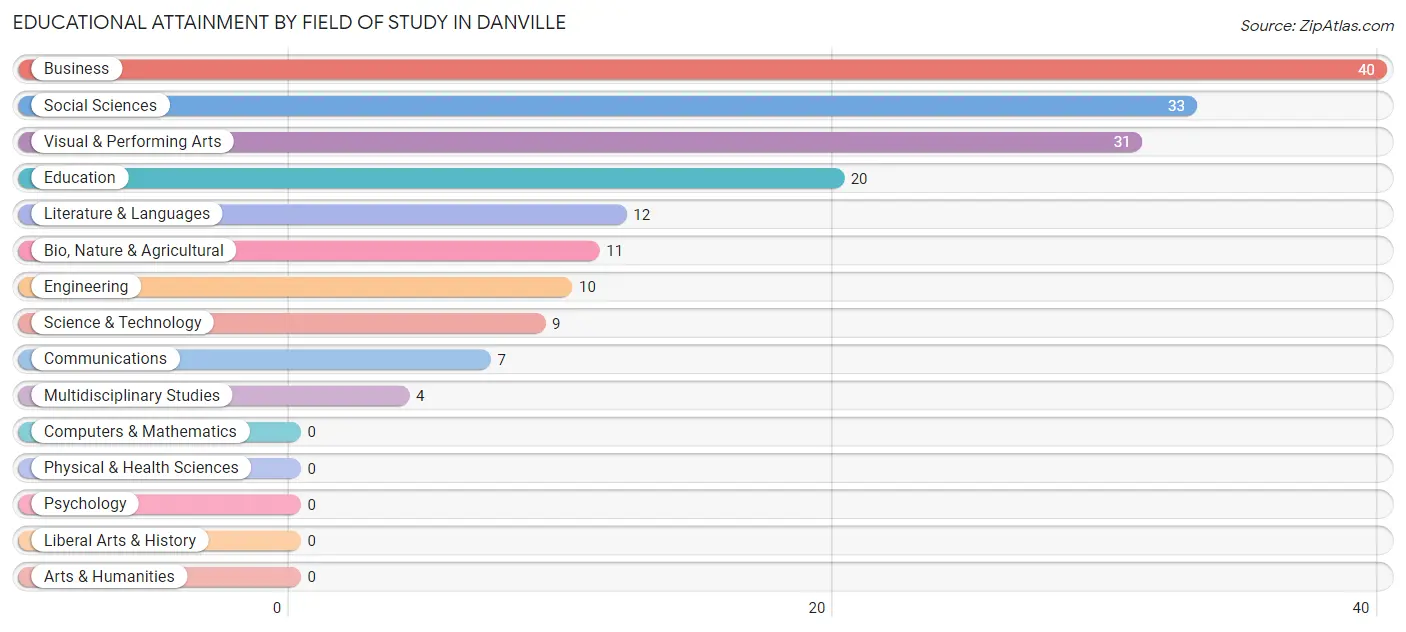
| Field of Study | # Graduates | % Graduates |
| Computers & Mathematics | 0 | 0.0% |
| Bio, Nature & Agricultural | 11 | 6.2% |
| Physical & Health Sciences | 0 | 0.0% |
| Psychology | 0 | 0.0% |
| Social Sciences | 33 | 18.6% |
| Engineering | 10 | 5.7% |
| Multidisciplinary Studies | 4 | 2.3% |
| Science & Technology | 9 | 5.1% |
| Business | 40 | 22.6% |
| Education | 20 | 11.3% |
| Literature & Languages | 12 | 6.8% |
| Liberal Arts & History | 0 | 0.0% |
| Visual & Performing Arts | 31 | 17.5% |
| Communications | 7 | 4.0% |
| Arts & Humanities | 0 | 0.0% |
| Total | 177 | 100.0% |
Transportation & Commute in Danville
Vehicle Availability by Sex in Danville
The most prevalent vehicle ownership categories in Danville are males with 2 vehicles (80, accounting for 76.2%) and females with 2 vehicles (78, making up 66.1%).
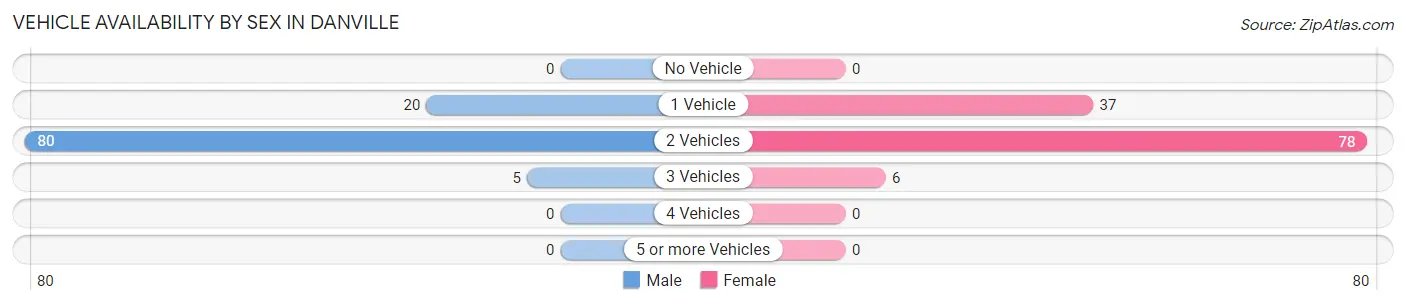
| Vehicles Available | Male | Female |
| No Vehicle | 0 (0.0%) | 0 (0.0%) |
| 1 Vehicle | 20 (19.1%) | 37 (30.6%) |
| 2 Vehicles | 80 (76.2%) | 78 (64.5%) |
| 3 Vehicles | 5 (4.8%) | 6 (5.0%) |
| 4 Vehicles | 0 (0.0%) | 0 (0.0%) |
| 5 or more Vehicles | 0 (0.0%) | 0 (0.0%) |
| Total | 105 (100.0%) | 121 (100.0%) |
Commute Time in Danville
The most frequently occuring commute durations in Danville are 10 to 14 minutes (52 commuters, 31.5%), 90 or more minutes (29 commuters, 17.6%), and less than 5 minutes (26 commuters, 15.8%).
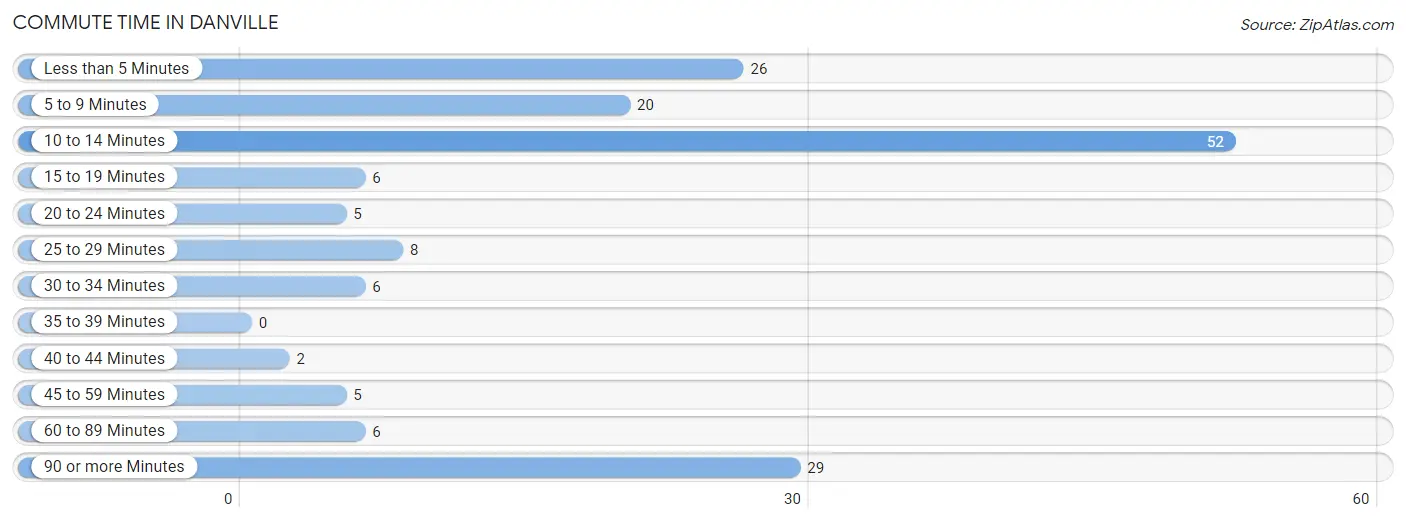
| Commute Time | # Commuters | % Commuters |
| Less than 5 Minutes | 26 | 15.8% |
| 5 to 9 Minutes | 20 | 12.1% |
| 10 to 14 Minutes | 52 | 31.5% |
| 15 to 19 Minutes | 6 | 3.6% |
| 20 to 24 Minutes | 5 | 3.0% |
| 25 to 29 Minutes | 8 | 4.9% |
| 30 to 34 Minutes | 6 | 3.6% |
| 35 to 39 Minutes | 0 | 0.0% |
| 40 to 44 Minutes | 2 | 1.2% |
| 45 to 59 Minutes | 5 | 3.0% |
| 60 to 89 Minutes | 6 | 3.6% |
| 90 or more Minutes | 29 | 17.6% |
Commute Time by Sex in Danville
The most common commute times in Danville are 90 or more minutes (29 commuters, 33.0%) for males and 10 to 14 minutes (33 commuters, 42.9%) for females.
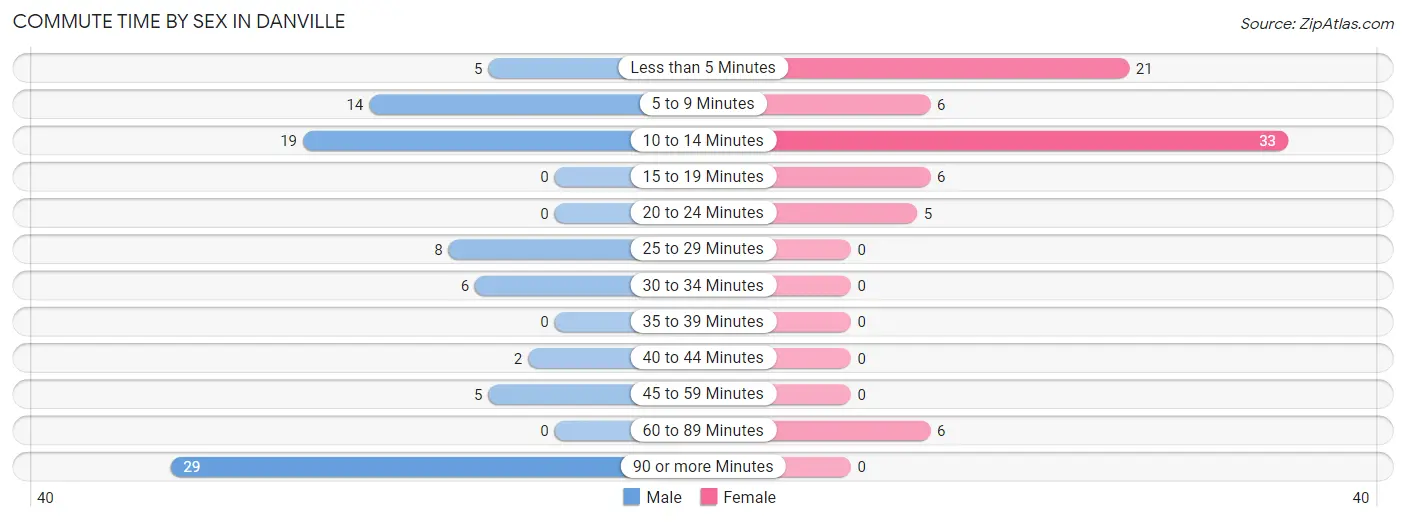
| Commute Time | Male | Female |
| Less than 5 Minutes | 5 (5.7%) | 21 (27.3%) |
| 5 to 9 Minutes | 14 (15.9%) | 6 (7.8%) |
| 10 to 14 Minutes | 19 (21.6%) | 33 (42.9%) |
| 15 to 19 Minutes | 0 (0.0%) | 6 (7.8%) |
| 20 to 24 Minutes | 0 (0.0%) | 5 (6.5%) |
| 25 to 29 Minutes | 8 (9.1%) | 0 (0.0%) |
| 30 to 34 Minutes | 6 (6.8%) | 0 (0.0%) |
| 35 to 39 Minutes | 0 (0.0%) | 0 (0.0%) |
| 40 to 44 Minutes | 2 (2.3%) | 0 (0.0%) |
| 45 to 59 Minutes | 5 (5.7%) | 0 (0.0%) |
| 60 to 89 Minutes | 0 (0.0%) | 6 (7.8%) |
| 90 or more Minutes | 29 (33.0%) | 0 (0.0%) |
Time of Departure to Work by Sex in Danville
The most frequent times of departure to work in Danville are 12:00 AM to 4:59 AM (21, 23.9%) for males and 12:00 AM to 4:59 AM (21, 27.3%) for females.
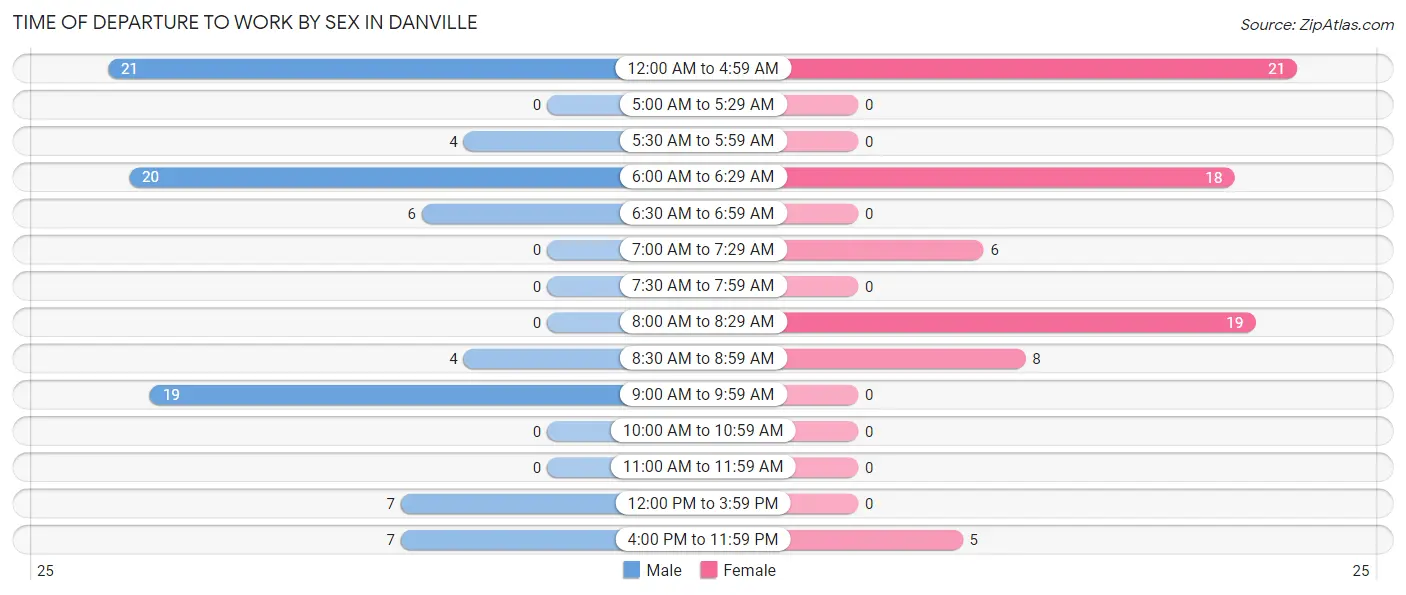
| Time of Departure | Male | Female |
| 12:00 AM to 4:59 AM | 21 (23.9%) | 21 (27.3%) |
| 5:00 AM to 5:29 AM | 0 (0.0%) | 0 (0.0%) |
| 5:30 AM to 5:59 AM | 4 (4.5%) | 0 (0.0%) |
| 6:00 AM to 6:29 AM | 20 (22.7%) | 18 (23.4%) |
| 6:30 AM to 6:59 AM | 6 (6.8%) | 0 (0.0%) |
| 7:00 AM to 7:29 AM | 0 (0.0%) | 6 (7.8%) |
| 7:30 AM to 7:59 AM | 0 (0.0%) | 0 (0.0%) |
| 8:00 AM to 8:29 AM | 0 (0.0%) | 19 (24.7%) |
| 8:30 AM to 8:59 AM | 4 (4.5%) | 8 (10.4%) |
| 9:00 AM to 9:59 AM | 19 (21.6%) | 0 (0.0%) |
| 10:00 AM to 10:59 AM | 0 (0.0%) | 0 (0.0%) |
| 11:00 AM to 11:59 AM | 0 (0.0%) | 0 (0.0%) |
| 12:00 PM to 3:59 PM | 7 (8.0%) | 0 (0.0%) |
| 4:00 PM to 11:59 PM | 7 (8.0%) | 5 (6.5%) |
| Total | 88 (100.0%) | 77 (100.0%) |
Housing Occupancy in Danville
Occupancy by Ownership in Danville
Of the total 258 dwellings in Danville, owner-occupied units account for 142 (55.0%), while renter-occupied units make up 116 (45.0%).
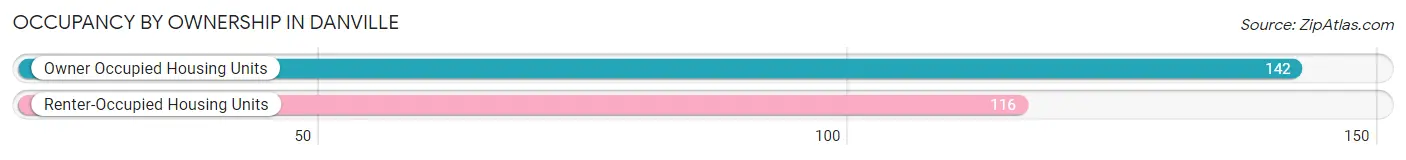
| Occupancy | # Housing Units | % Housing Units |
| Owner Occupied Housing Units | 142 | 55.0% |
| Renter-Occupied Housing Units | 116 | 45.0% |
| Total Occupied Housing Units | 258 | 100.0% |
Occupancy by Household Size in Danville
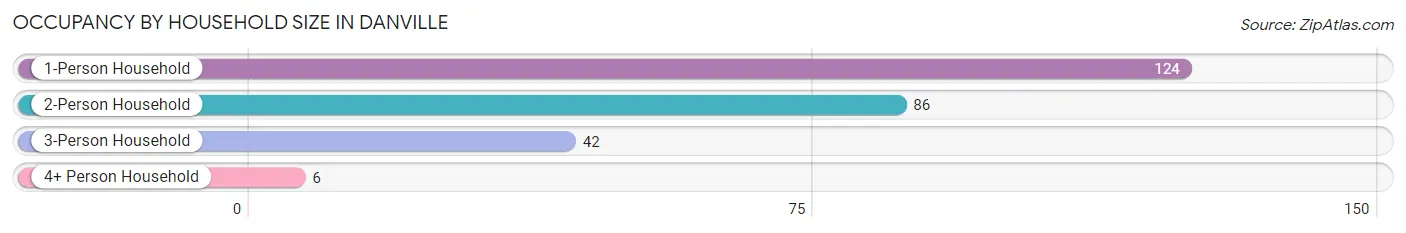
| Household Size | # Housing Units | % Housing Units |
| 1-Person Household | 124 | 48.1% |
| 2-Person Household | 86 | 33.3% |
| 3-Person Household | 42 | 16.3% |
| 4+ Person Household | 6 | 2.3% |
| Total Housing Units | 258 | 100.0% |
Occupancy by Ownership by Household Size in Danville
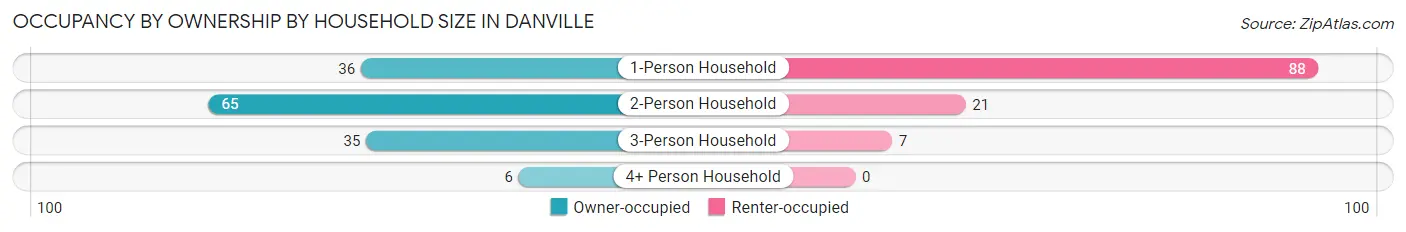
| Household Size | Owner-occupied | Renter-occupied |
| 1-Person Household | 36 (29.0%) | 88 (71.0%) |
| 2-Person Household | 65 (75.6%) | 21 (24.4%) |
| 3-Person Household | 35 (83.3%) | 7 (16.7%) |
| 4+ Person Household | 6 (100.0%) | 0 (0.0%) |
| Total Housing Units | 142 (55.0%) | 116 (45.0%) |
Occupancy by Educational Attainment in Danville
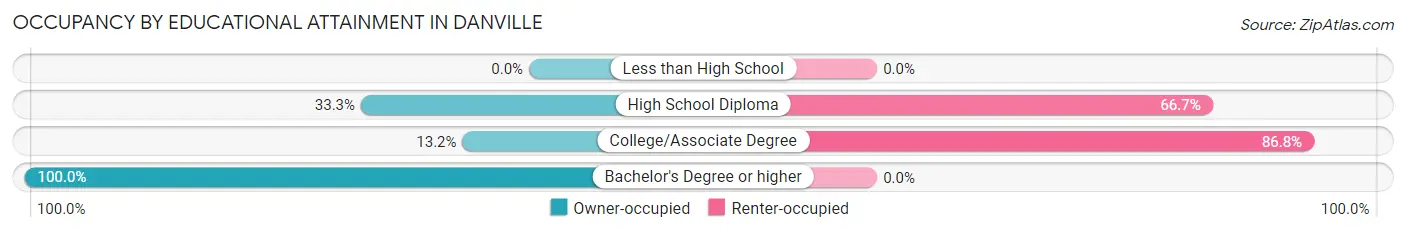
| Household Size | Owner-occupied | Renter-occupied |
| Less than High School | 0 (0.0%) | 0 (0.0%) |
| High School Diploma | 35 (33.3%) | 70 (66.7%) |
| College/Associate Degree | 7 (13.2%) | 46 (86.8%) |
| Bachelor's Degree or higher | 100 (100.0%) | 0 (0.0%) |
Occupancy by Age of Householder in Danville
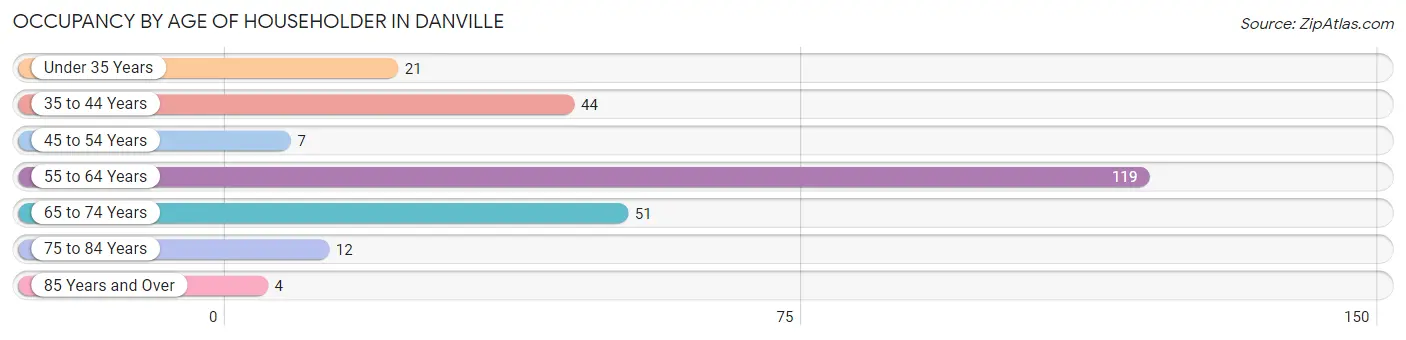
| Age Bracket | # Households | % Households |
| Under 35 Years | 21 | 8.1% |
| 35 to 44 Years | 44 | 17.1% |
| 45 to 54 Years | 7 | 2.7% |
| 55 to 64 Years | 119 | 46.1% |
| 65 to 74 Years | 51 | 19.8% |
| 75 to 84 Years | 12 | 4.6% |
| 85 Years and Over | 4 | 1.5% |
| Total | 258 | 100.0% |
Housing Finances in Danville
Median Income by Occupancy in Danville
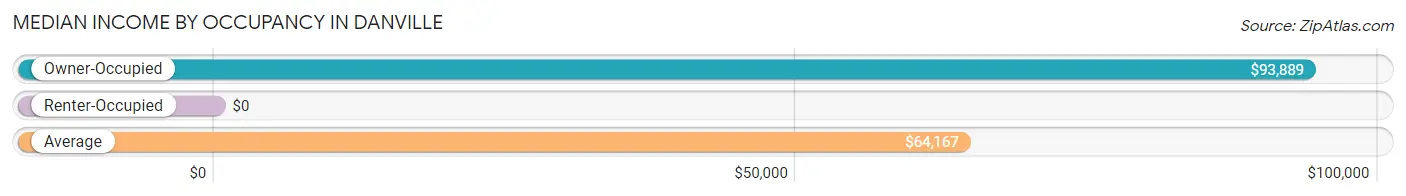
| Occupancy Type | # Households | Median Income |
| Owner-Occupied | 142 (55.0%) | $93,889 |
| Renter-Occupied | 116 (45.0%) | $0 |
| Average | 258 (100.0%) | $64,167 |
Occupancy by Householder Income Bracket in Danville
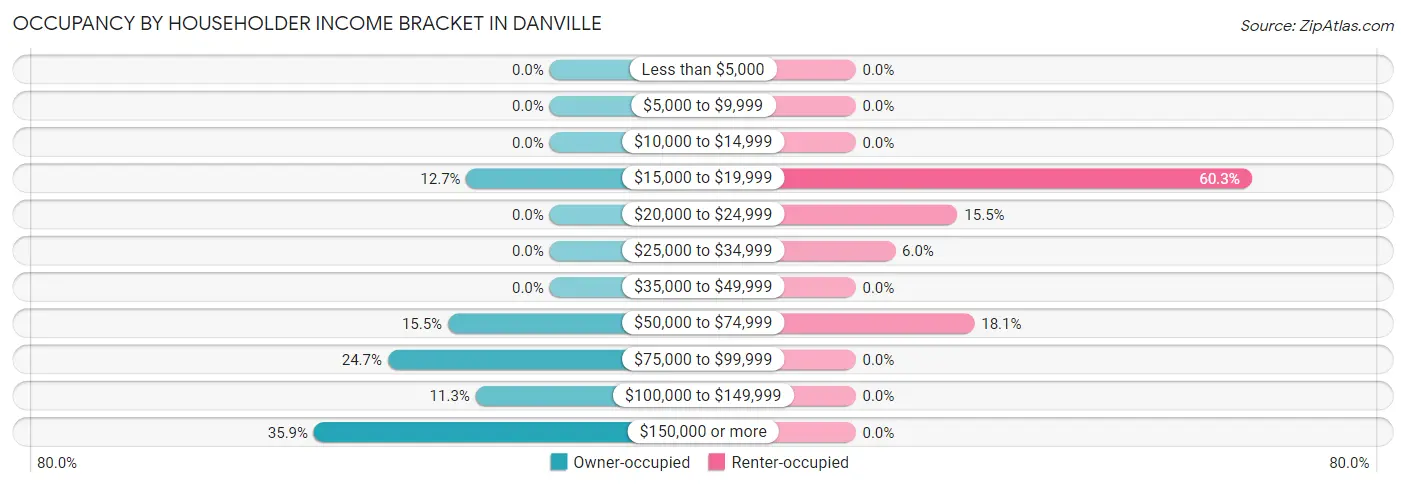
| Income Bracket | Owner-occupied | Renter-occupied |
| Less than $5,000 | 0 (0.0%) | 0 (0.0%) |
| $5,000 to $9,999 | 0 (0.0%) | 0 (0.0%) |
| $10,000 to $14,999 | 0 (0.0%) | 0 (0.0%) |
| $15,000 to $19,999 | 18 (12.7%) | 70 (60.3%) |
| $20,000 to $24,999 | 0 (0.0%) | 18 (15.5%) |
| $25,000 to $34,999 | 0 (0.0%) | 7 (6.0%) |
| $35,000 to $49,999 | 0 (0.0%) | 0 (0.0%) |
| $50,000 to $74,999 | 22 (15.5%) | 21 (18.1%) |
| $75,000 to $99,999 | 35 (24.6%) | 0 (0.0%) |
| $100,000 to $149,999 | 16 (11.3%) | 0 (0.0%) |
| $150,000 or more | 51 (35.9%) | 0 (0.0%) |
| Total | 142 (100.0%) | 116 (100.0%) |
Monthly Housing Cost Tiers in Danville
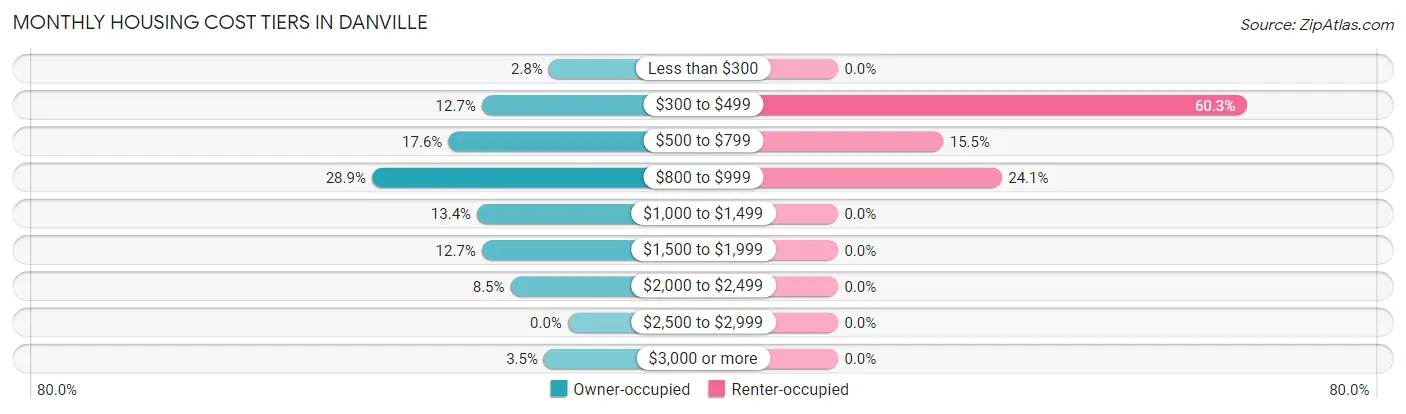
| Monthly Cost | Owner-occupied | Renter-occupied |
| Less than $300 | 4 (2.8%) | 0 (0.0%) |
| $300 to $499 | 18 (12.7%) | 70 (60.3%) |
| $500 to $799 | 25 (17.6%) | 18 (15.5%) |
| $800 to $999 | 41 (28.9%) | 28 (24.1%) |
| $1,000 to $1,499 | 19 (13.4%) | 0 (0.0%) |
| $1,500 to $1,999 | 18 (12.7%) | 0 (0.0%) |
| $2,000 to $2,499 | 12 (8.5%) | 0 (0.0%) |
| $2,500 to $2,999 | 0 (0.0%) | 0 (0.0%) |
| $3,000 or more | 5 (3.5%) | 0 (0.0%) |
| Total | 142 (100.0%) | 116 (100.0%) |
Physical Housing Characteristics in Danville
Housing Structures in Danville
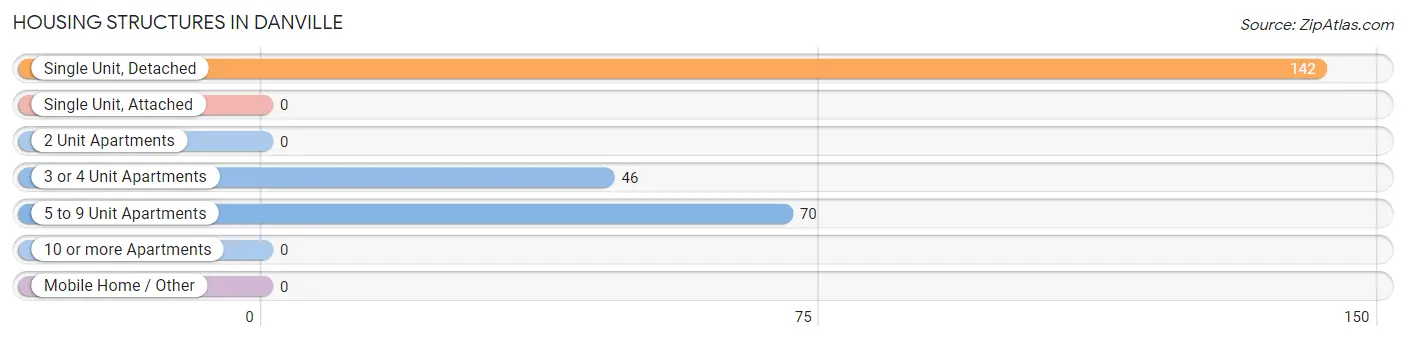
| Structure Type | # Housing Units | % Housing Units |
| Single Unit, Detached | 142 | 55.0% |
| Single Unit, Attached | 0 | 0.0% |
| 2 Unit Apartments | 0 | 0.0% |
| 3 or 4 Unit Apartments | 46 | 17.8% |
| 5 to 9 Unit Apartments | 70 | 27.1% |
| 10 or more Apartments | 0 | 0.0% |
| Mobile Home / Other | 0 | 0.0% |
| Total | 258 | 100.0% |
Housing Structures by Occupancy in Danville
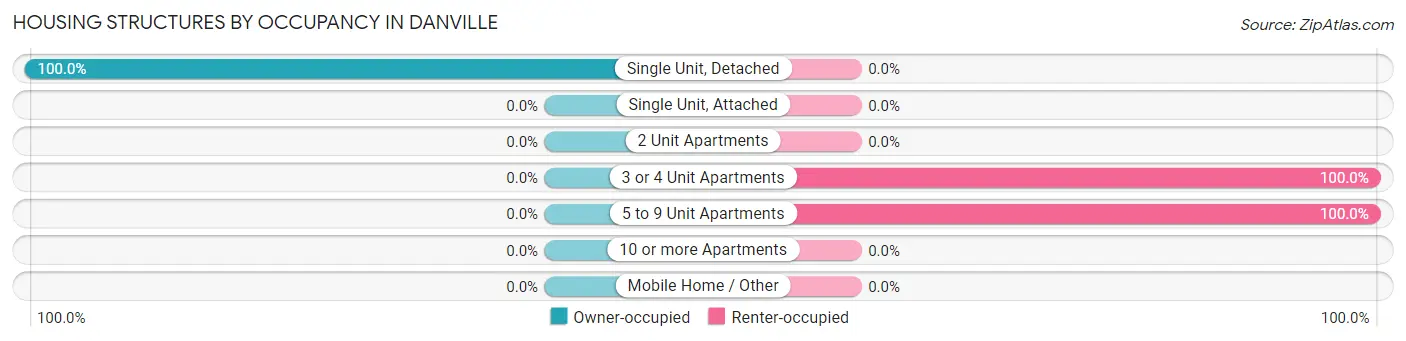
| Structure Type | Owner-occupied | Renter-occupied |
| Single Unit, Detached | 142 (100.0%) | 0 (0.0%) |
| Single Unit, Attached | 0 (0.0%) | 0 (0.0%) |
| 2 Unit Apartments | 0 (0.0%) | 0 (0.0%) |
| 3 or 4 Unit Apartments | 0 (0.0%) | 46 (100.0%) |
| 5 to 9 Unit Apartments | 0 (0.0%) | 70 (100.0%) |
| 10 or more Apartments | 0 (0.0%) | 0 (0.0%) |
| Mobile Home / Other | 0 (0.0%) | 0 (0.0%) |
| Total | 142 (55.0%) | 116 (45.0%) |
Housing Structures by Number of Rooms in Danville
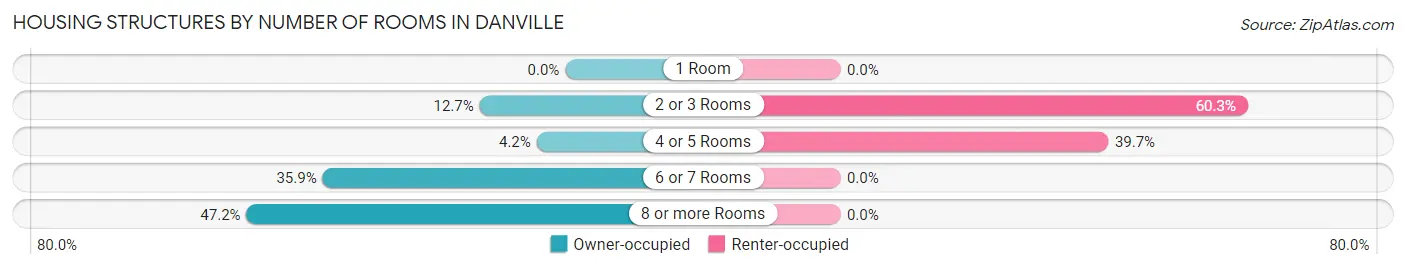
| Number of Rooms | Owner-occupied | Renter-occupied |
| 1 Room | 0 (0.0%) | 0 (0.0%) |
| 2 or 3 Rooms | 18 (12.7%) | 70 (60.3%) |
| 4 or 5 Rooms | 6 (4.2%) | 46 (39.7%) |
| 6 or 7 Rooms | 51 (35.9%) | 0 (0.0%) |
| 8 or more Rooms | 67 (47.2%) | 0 (0.0%) |
| Total | 142 (100.0%) | 116 (100.0%) |
Housing Structure by Heating Type in Danville
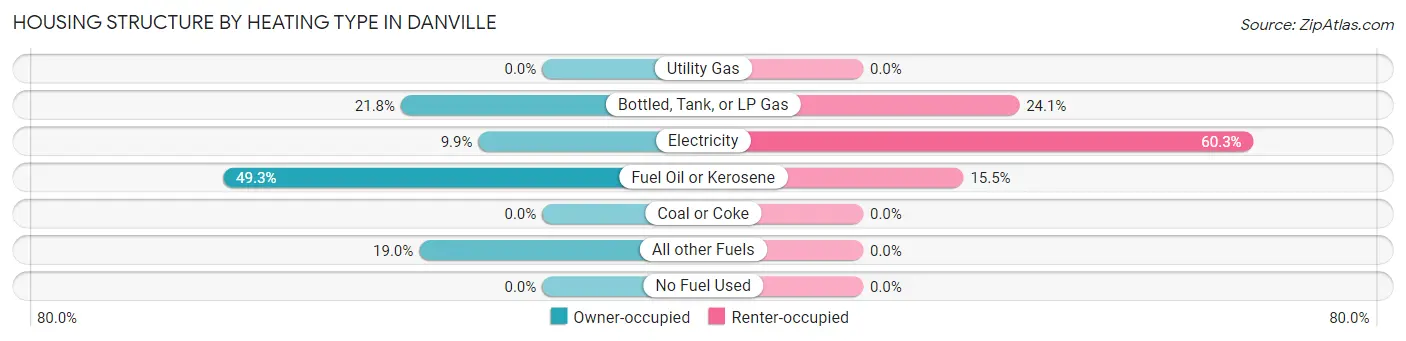
| Heating Type | Owner-occupied | Renter-occupied |
| Utility Gas | 0 (0.0%) | 0 (0.0%) |
| Bottled, Tank, or LP Gas | 31 (21.8%) | 28 (24.1%) |
| Electricity | 14 (9.9%) | 70 (60.3%) |
| Fuel Oil or Kerosene | 70 (49.3%) | 18 (15.5%) |
| Coal or Coke | 0 (0.0%) | 0 (0.0%) |
| All other Fuels | 27 (19.0%) | 0 (0.0%) |
| No Fuel Used | 0 (0.0%) | 0 (0.0%) |
| Total | 142 (100.0%) | 116 (100.0%) |
Household Vehicle Usage in Danville
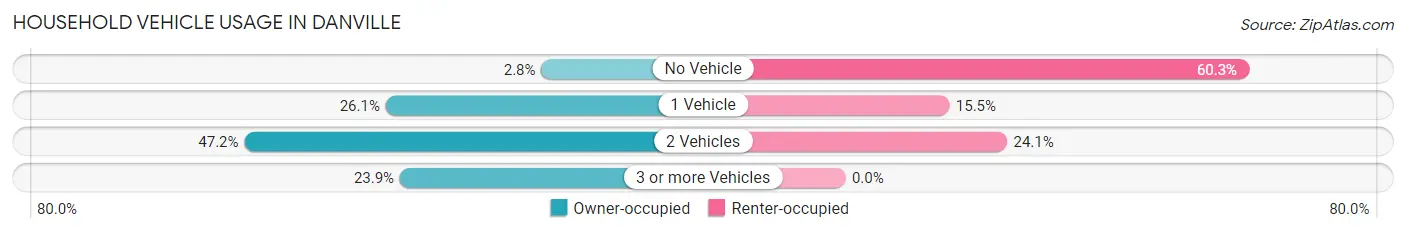
| Vehicles per Household | Owner-occupied | Renter-occupied |
| No Vehicle | 4 (2.8%) | 70 (60.3%) |
| 1 Vehicle | 37 (26.1%) | 18 (15.5%) |
| 2 Vehicles | 67 (47.2%) | 28 (24.1%) |
| 3 or more Vehicles | 34 (23.9%) | 0 (0.0%) |
| Total | 142 (100.0%) | 116 (100.0%) |
Real Estate & Mortgages in Danville
Real Estate and Mortgage Overview in Danville
| Characteristic | Without Mortgage | With Mortgage |
| Housing Units | 88 | 54 |
| Median Property Value | $223,500 | $263,000 |
| Median Household Income | - | - |
| Monthly Housing Costs | $685 | $5 |
| Real Estate Taxes | $3,050 | $0 |
Property Value by Mortgage Status in Danville
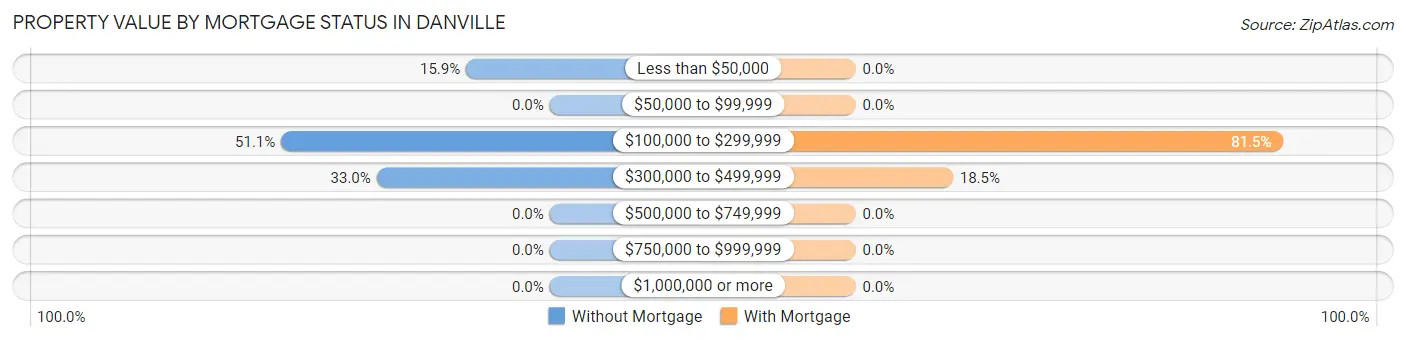
| Property Value | Without Mortgage | With Mortgage |
| Less than $50,000 | 14 (15.9%) | 0 (0.0%) |
| $50,000 to $99,999 | 0 (0.0%) | 0 (0.0%) |
| $100,000 to $299,999 | 45 (51.1%) | 44 (81.5%) |
| $300,000 to $499,999 | 29 (33.0%) | 10 (18.5%) |
| $500,000 to $749,999 | 0 (0.0%) | 0 (0.0%) |
| $750,000 to $999,999 | 0 (0.0%) | 0 (0.0%) |
| $1,000,000 or more | 0 (0.0%) | 0 (0.0%) |
| Total | 88 (100.0%) | 54 (100.0%) |
Household Income by Mortgage Status in Danville
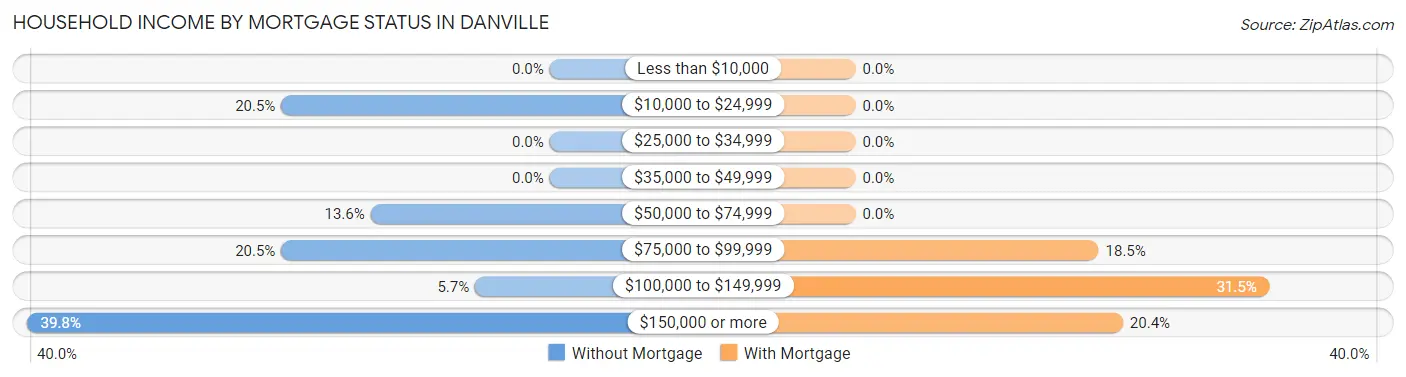
| Household Income | Without Mortgage | With Mortgage |
| Less than $10,000 | 0 (0.0%) | 0 (0.0%) |
| $10,000 to $24,999 | 18 (20.4%) | 0 (0.0%) |
| $25,000 to $34,999 | 0 (0.0%) | 0 (0.0%) |
| $35,000 to $49,999 | 0 (0.0%) | 0 (0.0%) |
| $50,000 to $74,999 | 12 (13.6%) | 0 (0.0%) |
| $75,000 to $99,999 | 18 (20.4%) | 10 (18.5%) |
| $100,000 to $149,999 | 5 (5.7%) | 17 (31.5%) |
| $150,000 or more | 35 (39.8%) | 11 (20.4%) |
| Total | 88 (100.0%) | 54 (100.0%) |
Property Value to Household Income Ratio in Danville
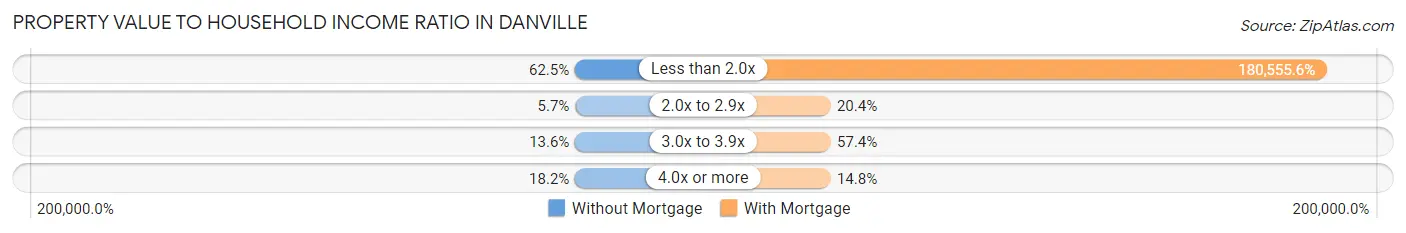
| Value-to-Income Ratio | Without Mortgage | With Mortgage |
| Less than 2.0x | 55 (62.5%) | 97,500 (180,555.6%) |
| 2.0x to 2.9x | 5 (5.7%) | 11 (20.4%) |
| 3.0x to 3.9x | 12 (13.6%) | 31 (57.4%) |
| 4.0x or more | 16 (18.2%) | 8 (14.8%) |
| Total | 88 (100.0%) | 54 (100.0%) |
Real Estate Taxes by Mortgage Status in Danville
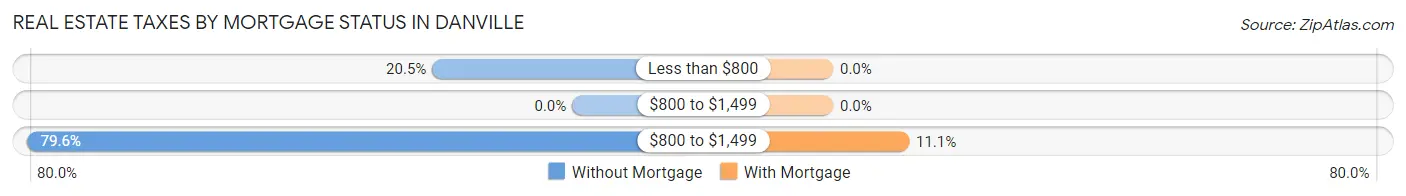
| Property Taxes | Without Mortgage | With Mortgage |
| Less than $800 | 18 (20.4%) | 0 (0.0%) |
| $800 to $1,499 | 0 (0.0%) | 0 (0.0%) |
| $800 to $1,499 | 70 (79.5%) | 6 (11.1%) |
| Total | 88 (100.0%) | 54 (100.0%) |
Health & Disability in Danville
Health Insurance Coverage by Age in Danville
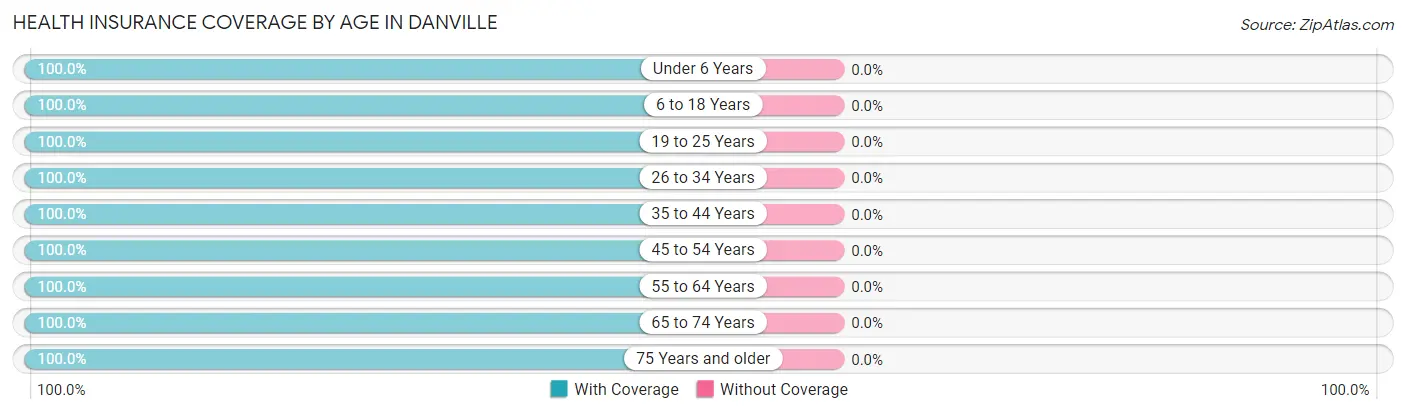
| Age Bracket | With Coverage | Without Coverage |
| Under 6 Years | 29 (100.0%) | 0 (0.0%) |
| 6 to 18 Years | 14 (100.0%) | 0 (0.0%) |
| 19 to 25 Years | 29 (100.0%) | 0 (0.0%) |
| 26 to 34 Years | 21 (100.0%) | 0 (0.0%) |
| 35 to 44 Years | 83 (100.0%) | 0 (0.0%) |
| 45 to 54 Years | 30 (100.0%) | 0 (0.0%) |
| 55 to 64 Years | 137 (100.0%) | 0 (0.0%) |
| 65 to 74 Years | 69 (100.0%) | 0 (0.0%) |
| 75 Years and older | 38 (100.0%) | 0 (0.0%) |
| Total | 450 (100.0%) | 0 (0.0%) |
Health Insurance Coverage by Citizenship Status in Danville
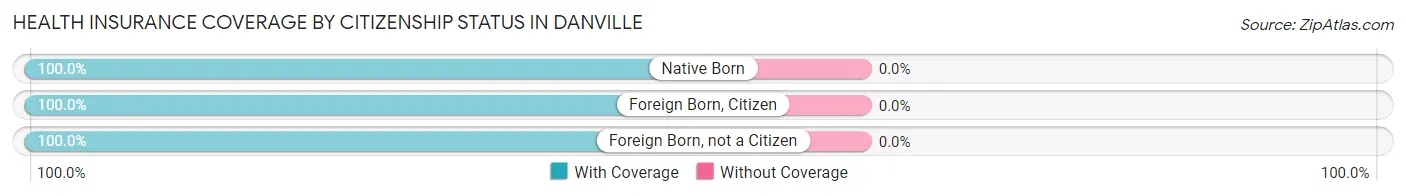
| Citizenship Status | With Coverage | Without Coverage |
| Native Born | 29 (100.0%) | 0 (0.0%) |
| Foreign Born, Citizen | 14 (100.0%) | 0 (0.0%) |
| Foreign Born, not a Citizen | 29 (100.0%) | 0 (0.0%) |
Health Insurance Coverage by Household Income in Danville
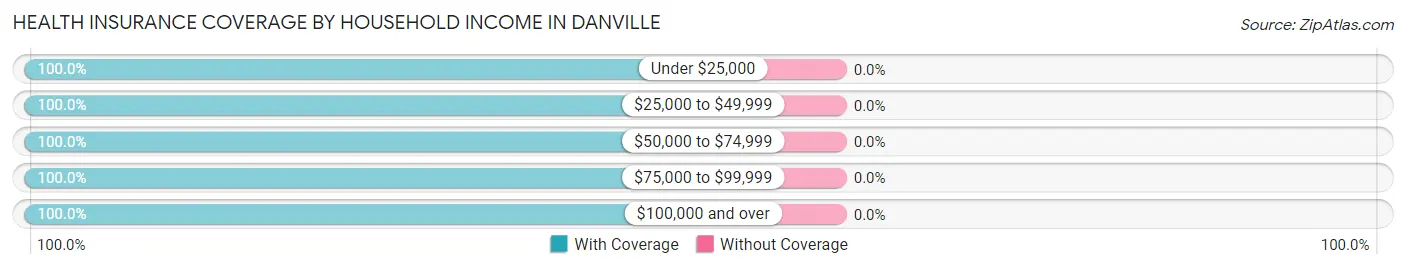
| Household Income | With Coverage | Without Coverage |
| Under $25,000 | 106 (100.0%) | 0 (0.0%) |
| $25,000 to $49,999 | 21 (100.0%) | 0 (0.0%) |
| $50,000 to $74,999 | 80 (100.0%) | 0 (0.0%) |
| $75,000 to $99,999 | 70 (100.0%) | 0 (0.0%) |
| $100,000 and over | 173 (100.0%) | 0 (0.0%) |
Public vs Private Health Insurance Coverage by Age in Danville
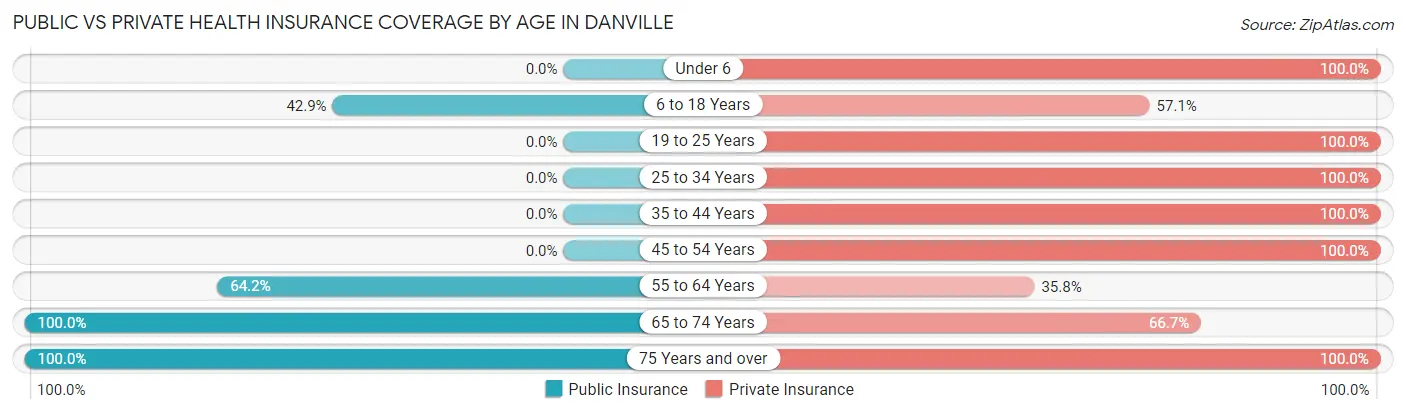
| Age Bracket | Public Insurance | Private Insurance |
| Under 6 | 0 (0.0%) | 29 (100.0%) |
| 6 to 18 Years | 6 (42.9%) | 8 (57.1%) |
| 19 to 25 Years | 0 (0.0%) | 29 (100.0%) |
| 25 to 34 Years | 0 (0.0%) | 21 (100.0%) |
| 35 to 44 Years | 0 (0.0%) | 83 (100.0%) |
| 45 to 54 Years | 0 (0.0%) | 30 (100.0%) |
| 55 to 64 Years | 88 (64.2%) | 49 (35.8%) |
| 65 to 74 Years | 69 (100.0%) | 46 (66.7%) |
| 75 Years and over | 38 (100.0%) | 38 (100.0%) |
| Total | 201 (44.7%) | 333 (74.0%) |
Disability Status by Sex by Age in Danville
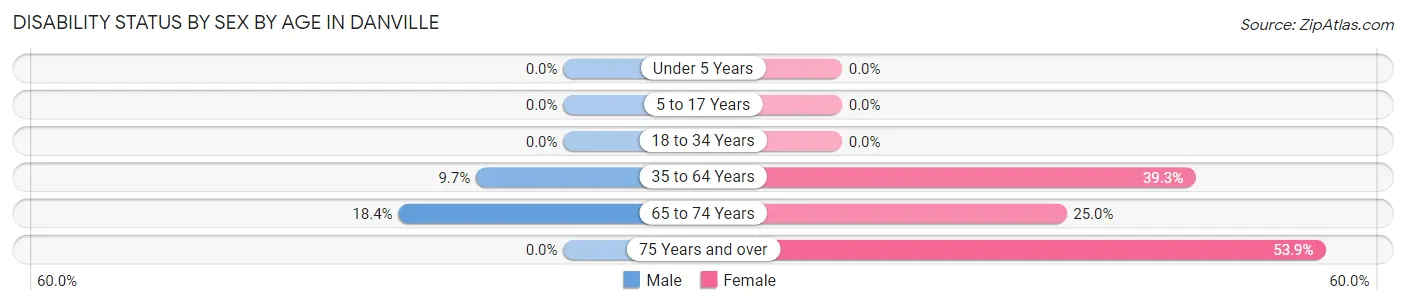
| Age Bracket | Male | Female |
| Under 5 Years | 0 (0.0%) | 0 (0.0%) |
| 5 to 17 Years | 0 (0.0%) | 0 (0.0%) |
| 18 to 34 Years | 0 (0.0%) | 0 (0.0%) |
| 35 to 64 Years | 7 (9.7%) | 70 (39.3%) |
| 65 to 74 Years | 9 (18.4%) | 5 (25.0%) |
| 75 Years and over | 0 (0.0%) | 14 (53.8%) |
Disability Class by Sex by Age in Danville
Disability Class: Hearing Difficulty
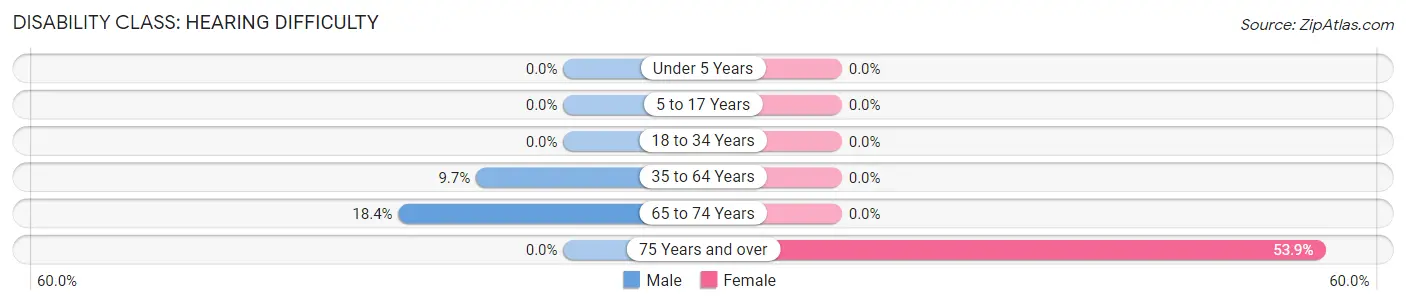
| Age Bracket | Male | Female |
| Under 5 Years | 0 (0.0%) | 0 (0.0%) |
| 5 to 17 Years | 0 (0.0%) | 0 (0.0%) |
| 18 to 34 Years | 0 (0.0%) | 0 (0.0%) |
| 35 to 64 Years | 7 (9.7%) | 0 (0.0%) |
| 65 to 74 Years | 9 (18.4%) | 0 (0.0%) |
| 75 Years and over | 0 (0.0%) | 14 (53.8%) |
Disability Class: Vision Difficulty
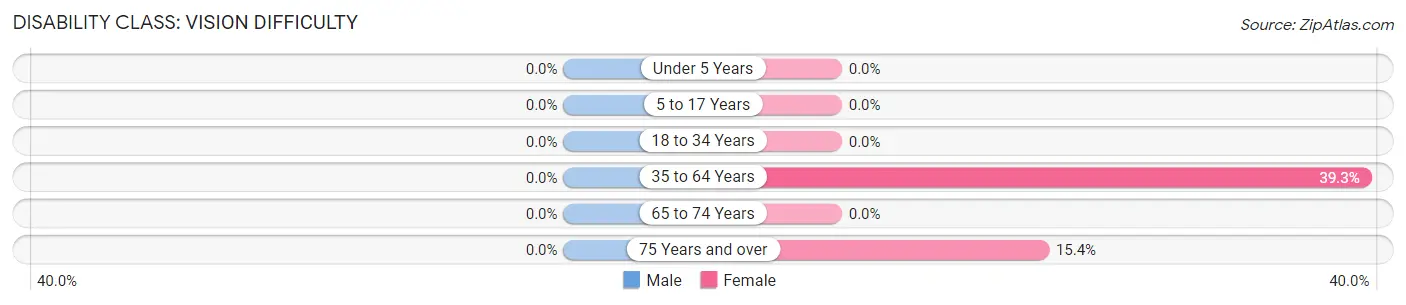
| Age Bracket | Male | Female |
| Under 5 Years | 0 (0.0%) | 0 (0.0%) |
| 5 to 17 Years | 0 (0.0%) | 0 (0.0%) |
| 18 to 34 Years | 0 (0.0%) | 0 (0.0%) |
| 35 to 64 Years | 0 (0.0%) | 70 (39.3%) |
| 65 to 74 Years | 0 (0.0%) | 0 (0.0%) |
| 75 Years and over | 0 (0.0%) | 4 (15.4%) |
Disability Class: Cognitive Difficulty
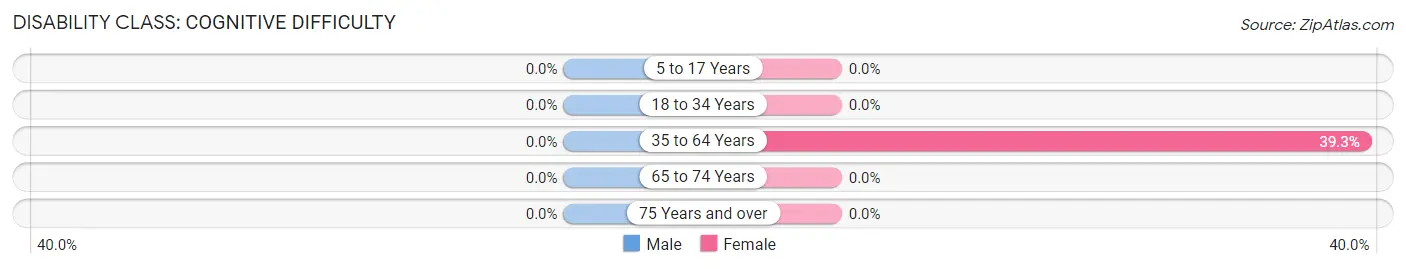
| Age Bracket | Male | Female |
| 5 to 17 Years | 0 (0.0%) | 0 (0.0%) |
| 18 to 34 Years | 0 (0.0%) | 0 (0.0%) |
| 35 to 64 Years | 0 (0.0%) | 70 (39.3%) |
| 65 to 74 Years | 0 (0.0%) | 0 (0.0%) |
| 75 Years and over | 0 (0.0%) | 0 (0.0%) |
Disability Class: Ambulatory Difficulty
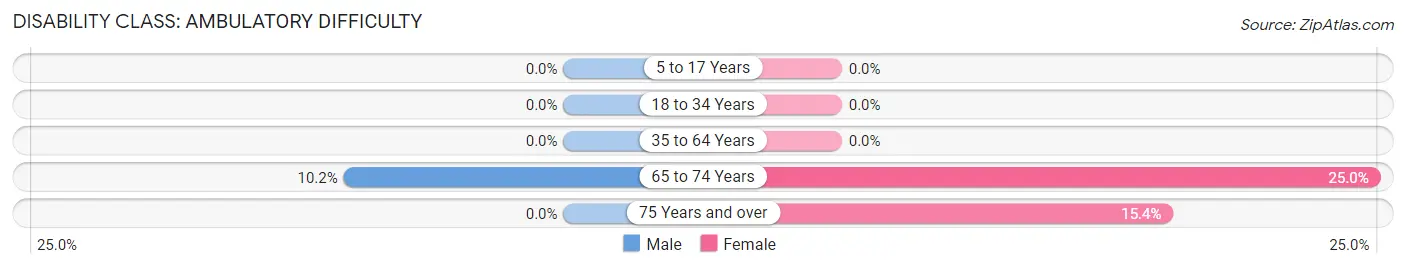
| Age Bracket | Male | Female |
| 5 to 17 Years | 0 (0.0%) | 0 (0.0%) |
| 18 to 34 Years | 0 (0.0%) | 0 (0.0%) |
| 35 to 64 Years | 0 (0.0%) | 0 (0.0%) |
| 65 to 74 Years | 5 (10.2%) | 5 (25.0%) |
| 75 Years and over | 0 (0.0%) | 4 (15.4%) |
Disability Class: Self-Care Difficulty
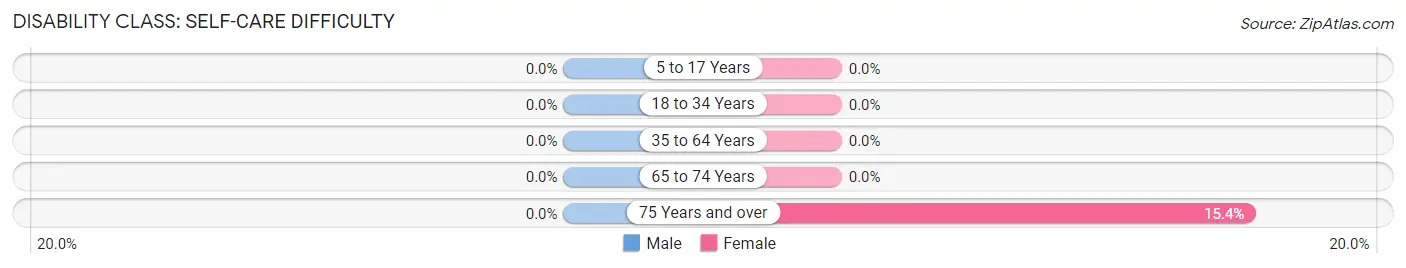
| Age Bracket | Male | Female |
| 5 to 17 Years | 0 (0.0%) | 0 (0.0%) |
| 18 to 34 Years | 0 (0.0%) | 0 (0.0%) |
| 35 to 64 Years | 0 (0.0%) | 0 (0.0%) |
| 65 to 74 Years | 0 (0.0%) | 0 (0.0%) |
| 75 Years and over | 0 (0.0%) | 4 (15.4%) |
Technology Access in Danville
Computing Device Access in Danville
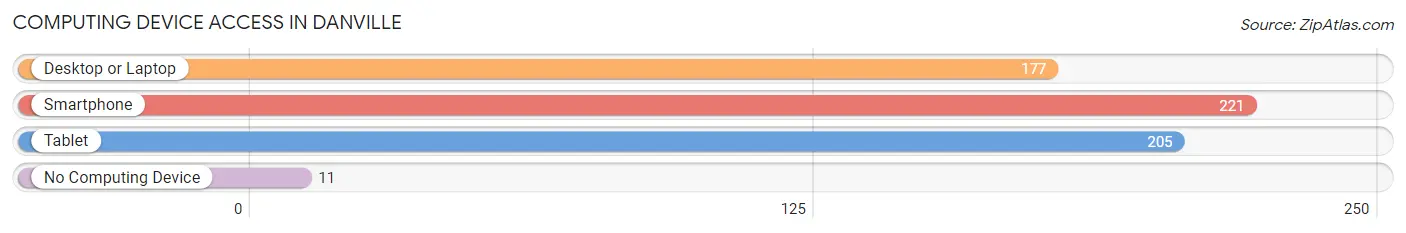
| Device Type | # Households | % Households |
| Desktop or Laptop | 177 | 68.6% |
| Smartphone | 221 | 85.7% |
| Tablet | 205 | 79.5% |
| No Computing Device | 11 | 4.3% |
| Total | 258 | 100.0% |
Internet Access in Danville
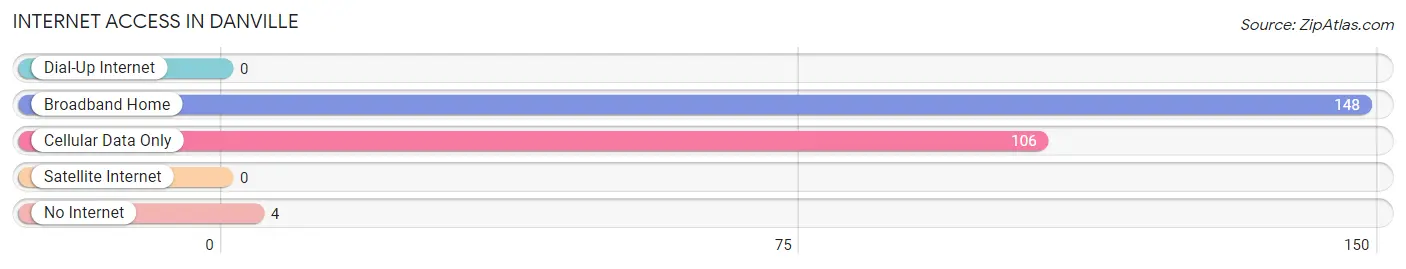
| Internet Type | # Households | % Households |
| Dial-Up Internet | 0 | 0.0% |
| Broadband Home | 148 | 57.4% |
| Cellular Data Only | 106 | 41.1% |
| Satellite Internet | 0 | 0.0% |
| No Internet | 4 | 1.5% |
| Total | 258 | 100.0% |
Danville Summary
Danville, Vermont is a small town located in Caledonia County in the northeastern part of the state. It is situated on the banks of the Passumpsic River and is bordered by the towns of Walden, St. Johnsbury, and Peacham. The town has a population of 1,845 people, according to the 2010 census.
History
The area that is now Danville was first settled in 1783 by a group of settlers from Massachusetts. The town was originally known as “Newbury” and was part of the town of St. Johnsbury. In 1820, the town was renamed “Danville” after Daniel Webster, a prominent statesman and lawyer from Massachusetts.
The town was an important center of commerce and industry in the 19th century. It was home to several mills, including a woolen mill, a sawmill, and a gristmill. The town also had a tannery, a blacksmith shop, and a general store.
Geography
Danville is located in the northeastern part of Vermont, in Caledonia County. It is situated on the banks of the Passumpsic River and is bordered by the towns of Walden, St. Johnsbury, and Peacham. The town has a total area of 24.2 square miles, of which 24.1 square miles is land and 0.1 square miles is water.
The town is located in a rural area and is surrounded by rolling hills and forests. The highest point in the town is the summit of Bald Hill, which has an elevation of 1,845 feet.
Economy
The economy of Danville is largely based on agriculture and tourism. The town is home to several farms, which produce a variety of crops, including corn, hay, and apples. The town is also home to several small businesses, including a general store, a hardware store, and a restaurant.
Tourism is an important part of the economy of Danville. The town is home to several attractions, including the Danville Historical Society Museum, the Danville Town Hall, and the Danville Congregational Church. The town also hosts several annual events, including the Danville Fair and the Danville Harvest Festival.
Demographics
According to the 2010 census, the population of Danville was 1,845 people. The racial makeup of the town was 97.3% White, 0.3% African American, 0.2% Native American, 0.3% Asian, 0.1% Pacific Islander, 0.3% from other races, and 1.4% from two or more races. Hispanic or Latino of any race were 1.2% of the population.
The median household income in Danville was $45,938, and the median family income was $51,250. The per capita income for the town was $20,945. About 8.3% of families and 10.7% of the population were below the poverty line, including 14.2% of those under age 18 and 8.2% of those age 65 or over.
Common Questions
What is Per Capita Income in Danville?
Per Capita income in Danville is $49,318.
What is the Median Household income in Danville?
Median Household Income in Danville is $64,167.
What is Income or Wage Gap in Danville?
Income or Wage Gap in Danville is 47.7%.
Women in Danville earn 52.3 cents for every dollar earned by a man.
What is Inequality or Gini Index in Danville?
Inequality or Gini Index in Danville is 0.51.
What is the Total Population of Danville?
Total Population of Danville is 450.
What is the Total Male Population of Danville?
Total Male Population of Danville is 189.
What is the Total Female Population of Danville?
Total Female Population of Danville is 261.
What is the Ratio of Males per 100 Females in Danville?
There are 72.41 Males per 100 Females in Danville.
What is the Ratio of Females per 100 Males in Danville?
There are 138.10 Females per 100 Males in Danville.
What is the Median Population Age in Danville?
Median Population Age in Danville is 57.6 Years.
What is the Average Family Size in Danville
Average Family Size in Danville is 2.5 People.
What is the Average Household Size in Danville
Average Household Size in Danville is 1.7 People.
How Large is the Labor Force in Danville?
There are 256 People in the Labor Forcein in Danville.
What is the Percentage of People in the Labor Force in Danville?
62.9% of People are in the Labor Force in Danville.