King City, OR Map & Demographics
King City Map
King City Overview
$44,090
PER CAPITA INCOME
$94,536
AVG FAMILY INCOME
$57,763
AVG HOUSEHOLD INCOME
34.0%
WAGE / INCOME GAP [ % ]
66.0¢/ $1
WAGE / INCOME GAP [ $ ]
$18,531
FAMILY INCOME DEFICIT
0.52
INEQUALITY / GINI INDEX
5,063
TOTAL POPULATION
1,991
MALE POPULATION
3,072
FEMALE POPULATION
64.81
MALES / 100 FEMALES
154.29
FEMALES / 100 MALES
63.1
MEDIAN AGE
2.7
AVG FAMILY SIZE
1.9
AVG HOUSEHOLD SIZE
1,821
LABOR FORCE [ PEOPLE ]
40.1%
PERCENT IN LABOR FORCE
4.0%
UNEMPLOYMENT RATE
Income in King City
Income Overview in King City
Per Capita Income in King City is $44,090, while median incomes of families and households are $94,536 and $57,763 respectively.
| Characteristic | Number | Measure |
| Per Capita Income | 5,063 | $44,090 |
| Median Family Income | 1,221 | $94,536 |
| Mean Family Income | 1,221 | $123,724 |
| Median Household Income | 2,696 | $57,763 |
| Mean Household Income | 2,696 | $82,947 |
| Income Deficit | 1,221 | $18,531 |
| Wage / Income Gap (%) | 5,063 | 33.95% |
| Wage / Income Gap ($) | 5,063 | 66.05¢ per $1 |
| Gini / Inequality Index | 5,063 | 0.52 |
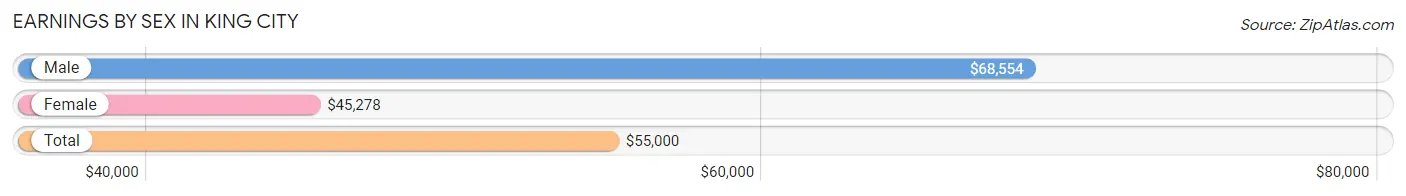
Earnings by Sex in King City
Average Earnings in King City are $55,000, $68,554 for men and $45,278 for women, a difference of 34.0%.
| Sex | Number | Average Earnings |
| Male | 906 (46.3%) | $68,554 |
| Female | 1,050 (53.7%) | $45,278 |
| Total | 1,956 (100.0%) | $55,000 |
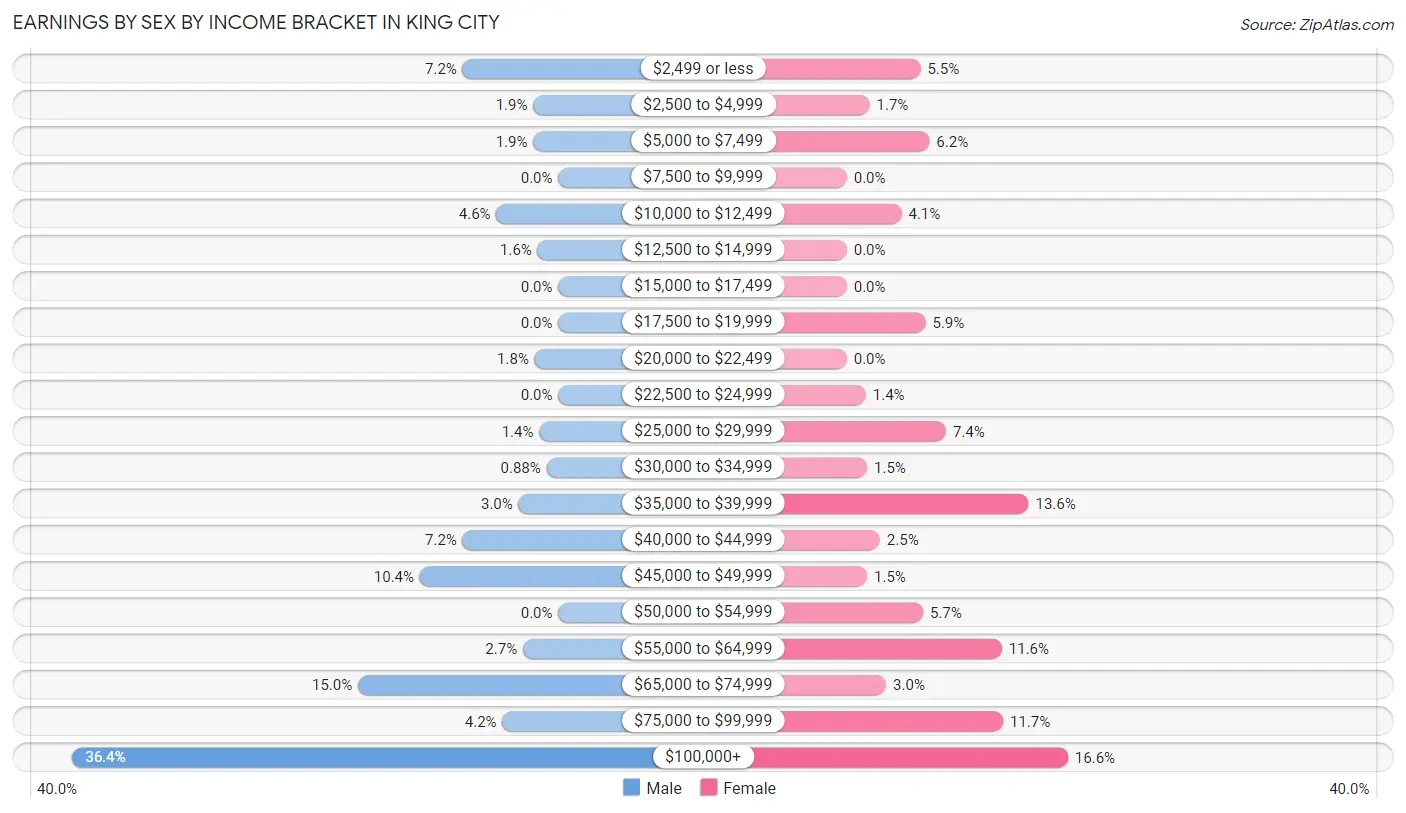
Earnings by Sex by Income Bracket in King City
The most common earnings brackets in King City are $100,000+ for men (330 | 36.4%) and $100,000+ for women (174 | 16.6%).
| Income | Male | Female |
| $2,499 or less | 65 (7.2%) | 58 (5.5%) |
| $2,500 to $4,999 | 17 (1.9%) | 18 (1.7%) |
| $5,000 to $7,499 | 17 (1.9%) | 65 (6.2%) |
| $7,500 to $9,999 | 0 (0.0%) | 0 (0.0%) |
| $10,000 to $12,499 | 42 (4.6%) | 43 (4.1%) |
| $12,500 to $14,999 | 14 (1.5%) | 0 (0.0%) |
| $15,000 to $17,499 | 0 (0.0%) | 0 (0.0%) |
| $17,500 to $19,999 | 0 (0.0%) | 62 (5.9%) |
| $20,000 to $22,499 | 16 (1.8%) | 0 (0.0%) |
| $22,500 to $24,999 | 0 (0.0%) | 15 (1.4%) |
| $25,000 to $29,999 | 13 (1.4%) | 78 (7.4%) |
| $30,000 to $34,999 | 8 (0.9%) | 16 (1.5%) |
| $35,000 to $39,999 | 27 (3.0%) | 143 (13.6%) |
| $40,000 to $44,999 | 65 (7.2%) | 26 (2.5%) |
| $45,000 to $49,999 | 94 (10.4%) | 16 (1.5%) |
| $50,000 to $54,999 | 0 (0.0%) | 60 (5.7%) |
| $55,000 to $64,999 | 24 (2.6%) | 122 (11.6%) |
| $65,000 to $74,999 | 136 (15.0%) | 31 (2.9%) |
| $75,000 to $99,999 | 38 (4.2%) | 123 (11.7%) |
| $100,000+ | 330 (36.4%) | 174 (16.6%) |
| Total | 906 (100.0%) | 1,050 (100.0%) |
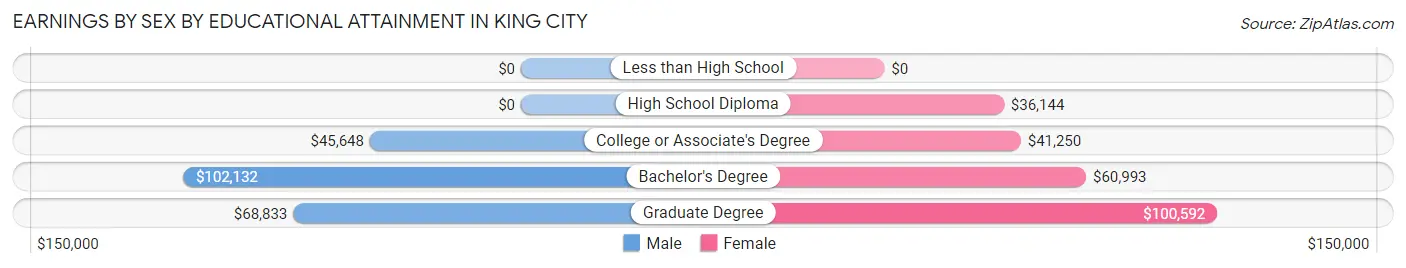
Earnings by Sex by Educational Attainment in King City
Average earnings in King City are $68,678 for men and $53,198 for women, a difference of 22.5%. Men with an educational attainment of bachelor's degree enjoy the highest average annual earnings of $102,132, while those with college or associate's degree education earn the least with $45,648. Women with an educational attainment of graduate degree earn the most with the average annual earnings of $100,592, while those with high school diploma education have the smallest earnings of $36,144.
| Educational Attainment | Male Income | Female Income |
| Less than High School | - | - |
| High School Diploma | - | - |
| College or Associate's Degree | $45,648 | $41,250 |
| Bachelor's Degree | $102,132 | $60,993 |
| Graduate Degree | $68,833 | $100,592 |
| Total | $68,678 | $53,198 |
Family Income in King City
Family Income Brackets in King City
According to the King City family income data, there are 259 families falling into the $50,000 to $74,999 income range, which is the most common income bracket and makes up 21.2% of all families.
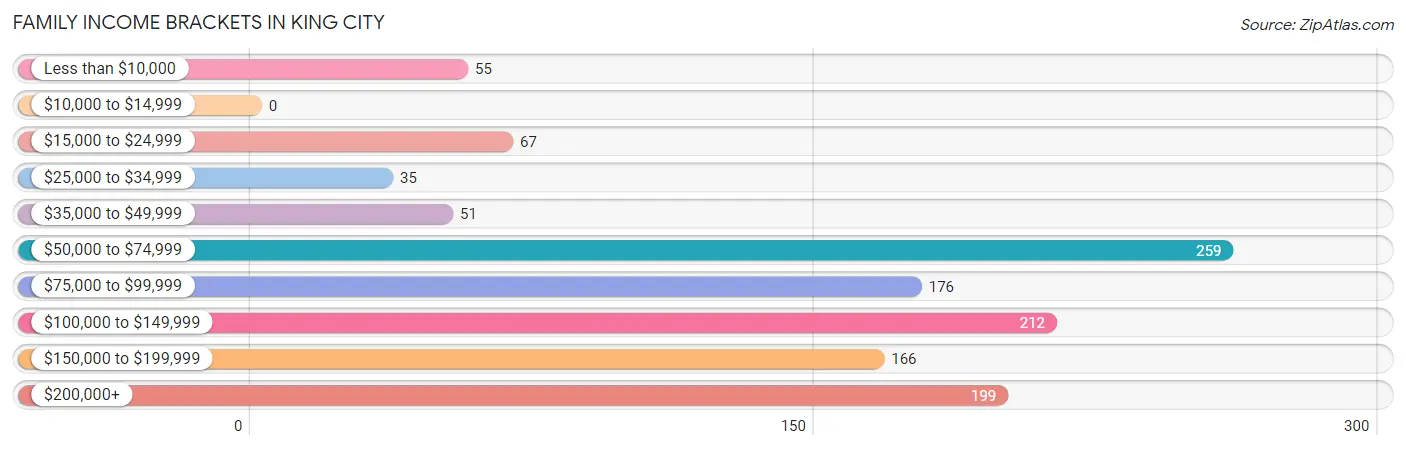
| Income Bracket | # Families | % Families |
| Less than $10,000 | 55 | 4.5% |
| $10,000 to $14,999 | 0 | 0.0% |
| $15,000 to $24,999 | 67 | 5.5% |
| $25,000 to $34,999 | 35 | 2.9% |
| $35,000 to $49,999 | 51 | 4.2% |
| $50,000 to $74,999 | 259 | 21.2% |
| $75,000 to $99,999 | 176 | 14.4% |
| $100,000 to $149,999 | 212 | 17.4% |
| $150,000 to $199,999 | 166 | 13.6% |
| $200,000+ | 199 | 16.3% |
Family Income by Famaliy Size in King City
5-person families (129 | 10.6%) account for the highest median family income in King City with $177,112 per family, while 4-person families (99 | 8.1%) have the highest median income of $36,312 per family member.
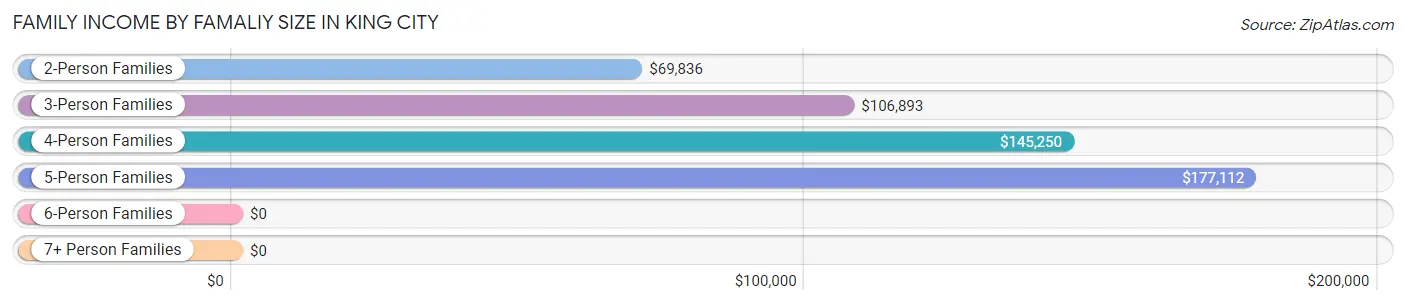
| Income Bracket | # Families | Median Income |
| 2-Person Families | 741 (60.7%) | $69,836 |
| 3-Person Families | 213 (17.4%) | $106,893 |
| 4-Person Families | 99 (8.1%) | $145,250 |
| 5-Person Families | 129 (10.6%) | $177,112 |
| 6-Person Families | 39 (3.2%) | $0 |
| 7+ Person Families | 0 (0.0%) | $0 |
| Total | 1,221 (100.0%) | $94,536 |
Family Income by Number of Earners in King City
The median family income in King City is $94,536, with families comprising 2 earners (319) having the highest median family income of $179,271, while families with no earners (386) have the lowest median family income of $50,313, accounting for 26.1% and 31.6% of families, respectively.
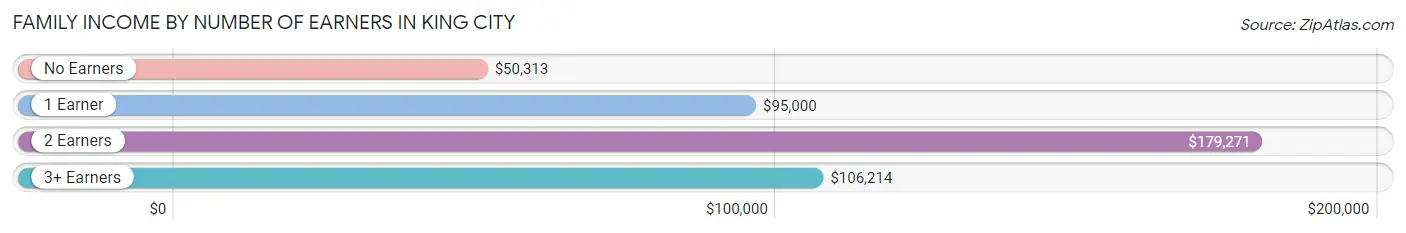
| Number of Earners | # Families | Median Income |
| No Earners | 386 (31.6%) | $50,313 |
| 1 Earner | 320 (26.2%) | $95,000 |
| 2 Earners | 319 (26.1%) | $179,271 |
| 3+ Earners | 196 (16.1%) | $106,214 |
| Total | 1,221 (100.0%) | $94,536 |
Household Income in King City
Household Income Brackets in King City
With 501 households falling in the category, the $50,000 to $74,999 income range is the most frequent in King City, accounting for 18.6% of all households. In contrast, only 181 households (6.7%) fall into the $35,000 to $49,999 income bracket, making it the least populous group.
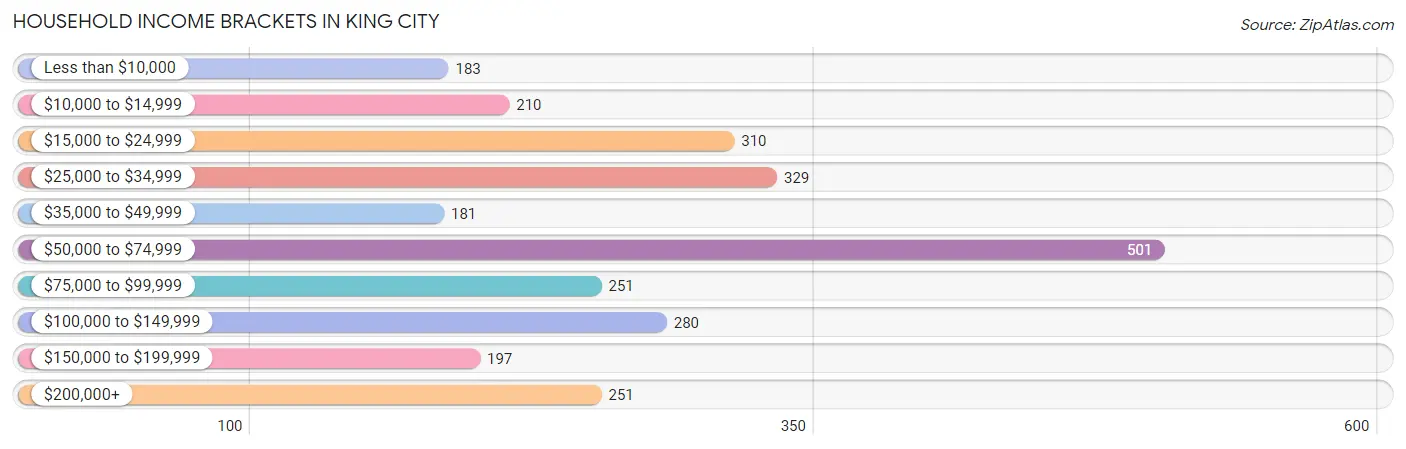
| Income Bracket | # Households | % Households |
| Less than $10,000 | 183 | 6.8% |
| $10,000 to $14,999 | 210 | 7.8% |
| $15,000 to $24,999 | 310 | 11.5% |
| $25,000 to $34,999 | 329 | 12.2% |
| $35,000 to $49,999 | 181 | 6.7% |
| $50,000 to $74,999 | 501 | 18.6% |
| $75,000 to $99,999 | 251 | 9.3% |
| $100,000 to $149,999 | 280 | 10.4% |
| $150,000 to $199,999 | 197 | 7.3% |
| $200,000+ | 251 | 9.3% |
Household Income by Householder Age in King City
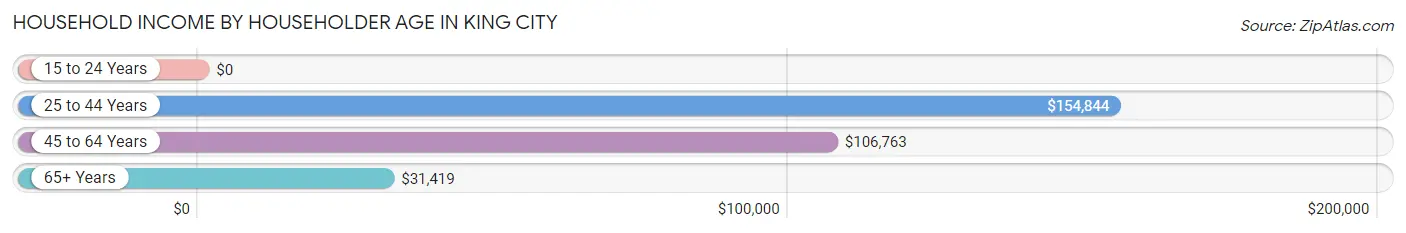
The median household income in King City is $57,763, with the highest median household income of $154,844 found in the 25 to 44 years age bracket for the primary householder. A total of 290 households (10.8%) fall into this category. Meanwhile, the 15 to 24 years age bracket for the primary householder has the lowest median household income of $0, with 5 households (0.2%) in this group.
| Income Bracket | # Households | Median Income |
| 15 to 24 Years | 5 (0.2%) | $0 |
| 25 to 44 Years | 290 (10.8%) | $154,844 |
| 45 to 64 Years | 654 (24.3%) | $106,763 |
| 65+ Years | 1,747 (64.8%) | $31,419 |
| Total | 2,696 (100.0%) | $57,763 |
Poverty in King City
Income Below Poverty by Sex and Age in King City
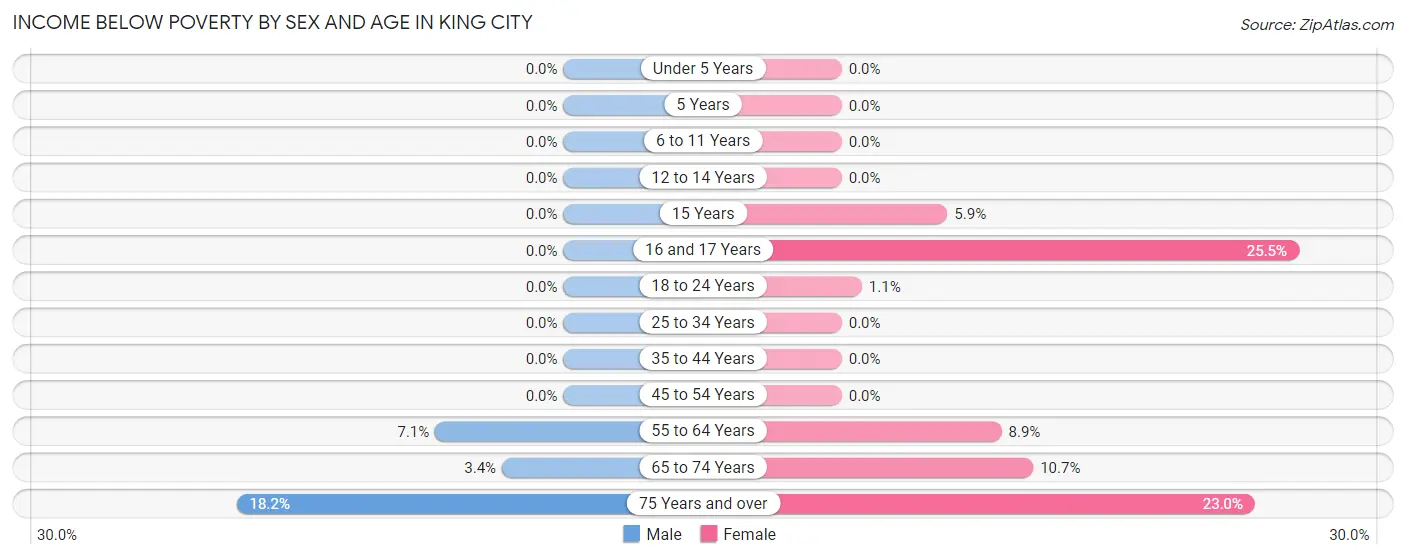
With 5.6% poverty level for males and 11.7% for females among the residents of King City, 75 year old and over males and 16 and 17 year old females are the most vulnerable to poverty, with 73 males (18.2%) and 14 females (25.5%) in their respective age groups living below the poverty level.
| Age Bracket | Male | Female |
| Under 5 Years | 0 (0.0%) | 0 (0.0%) |
| 5 Years | 0 (0.0%) | 0 (0.0%) |
| 6 to 11 Years | 0 (0.0%) | 0 (0.0%) |
| 12 to 14 Years | 0 (0.0%) | 0 (0.0%) |
| 15 Years | 0 (0.0%) | 1 (5.9%) |
| 16 and 17 Years | 0 (0.0%) | 14 (25.5%) |
| 18 to 24 Years | 0 (0.0%) | 1 (1.1%) |
| 25 to 34 Years | 0 (0.0%) | 0 (0.0%) |
| 35 to 44 Years | 0 (0.0%) | 0 (0.0%) |
| 45 to 54 Years | 0 (0.0%) | 0 (0.0%) |
| 55 to 64 Years | 27 (7.1%) | 30 (8.9%) |
| 65 to 74 Years | 9 (3.4%) | 63 (10.7%) |
| 75 Years and over | 73 (18.2%) | 245 (23.0%) |
| Total | 109 (5.6%) | 354 (11.7%) |
Income Above Poverty by Sex and Age in King City
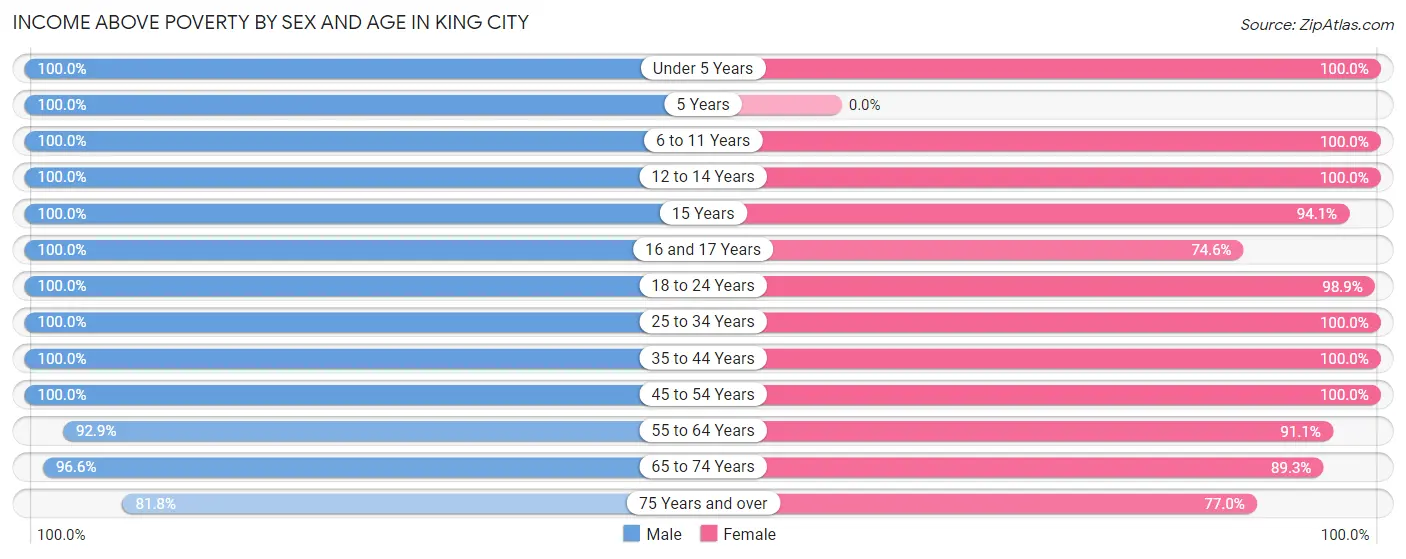
According to the poverty statistics in King City, males aged under 5 years and females aged under 5 years are the age groups that are most secure financially, with 100.0% of males and 100.0% of females in these age groups living above the poverty line.
| Age Bracket | Male | Female |
| Under 5 Years | 75 (100.0%) | 121 (100.0%) |
| 5 Years | 17 (100.0%) | 0 (0.0%) |
| 6 to 11 Years | 78 (100.0%) | 42 (100.0%) |
| 12 to 14 Years | 64 (100.0%) | 81 (100.0%) |
| 15 Years | 12 (100.0%) | 16 (94.1%) |
| 16 and 17 Years | 27 (100.0%) | 41 (74.6%) |
| 18 to 24 Years | 42 (100.0%) | 88 (98.9%) |
| 25 to 34 Years | 254 (100.0%) | 219 (100.0%) |
| 35 to 44 Years | 137 (100.0%) | 127 (100.0%) |
| 45 to 54 Years | 190 (100.0%) | 288 (100.0%) |
| 55 to 64 Years | 351 (92.9%) | 307 (91.1%) |
| 65 to 74 Years | 254 (96.6%) | 528 (89.3%) |
| 75 Years and over | 328 (81.8%) | 820 (77.0%) |
| Total | 1,829 (94.4%) | 2,678 (88.3%) |
Income Below Poverty Among Married-Couple Families in King City
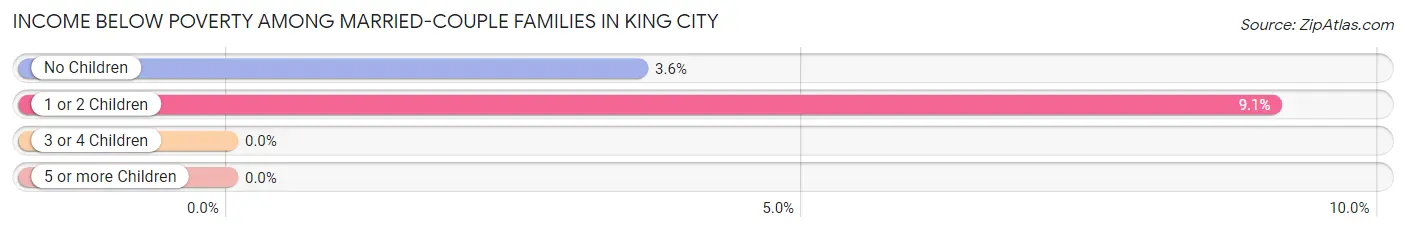
The poverty statistics for married-couple families in King City show that 5.0% or 55 of the total 1,111 families live below the poverty line. Families with 1 or 2 children have the highest poverty rate of 9.1%, comprising of 27 families. On the other hand, families with 3 or 4 children have the lowest poverty rate of 0.0%, which includes 0 families.
| Children | Above Poverty | Below Poverty |
| No Children | 757 (96.4%) | 28 (3.6%) |
| 1 or 2 Children | 270 (90.9%) | 27 (9.1%) |
| 3 or 4 Children | 29 (100.0%) | 0 (0.0%) |
| 5 or more Children | 0 (0.0%) | 0 (0.0%) |
| Total | 1,056 (95.1%) | 55 (5.0%) |
Income Below Poverty Among Single-Parent Households in King City
| Children | Single Father | Single Mother |
| No Children | 0 (0.0%) | 0 (0.0%) |
| 1 or 2 Children | 0 (0.0%) | 0 (0.0%) |
| 3 or 4 Children | 0 (0.0%) | 0 (0.0%) |
| 5 or more Children | 0 (0.0%) | 0 (0.0%) |
| Total | 0 (0.0%) | 0 (0.0%) |
Income Below Poverty Among Married-Couple vs Single-Parent Households in King City
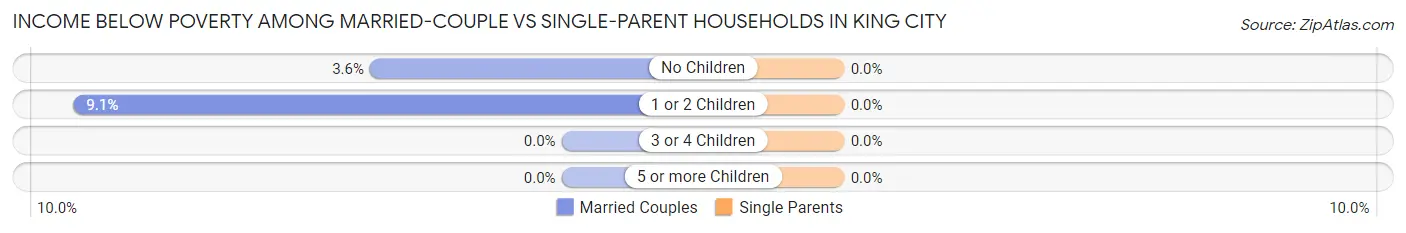
| Children | Married-Couple Families | Single-Parent Households |
| No Children | 28 (3.6%) | 0 (0.0%) |
| 1 or 2 Children | 27 (9.1%) | 0 (0.0%) |
| 3 or 4 Children | 0 (0.0%) | 0 (0.0%) |
| 5 or more Children | 0 (0.0%) | 0 (0.0%) |
| Total | 55 (5.0%) | 0 (0.0%) |
Race in King City
The most populous races in King City are White / Caucasian (4,120 | 81.4%), Hispanic or Latino (410 | 8.1%), and Two or more Races (405 | 8.0%).
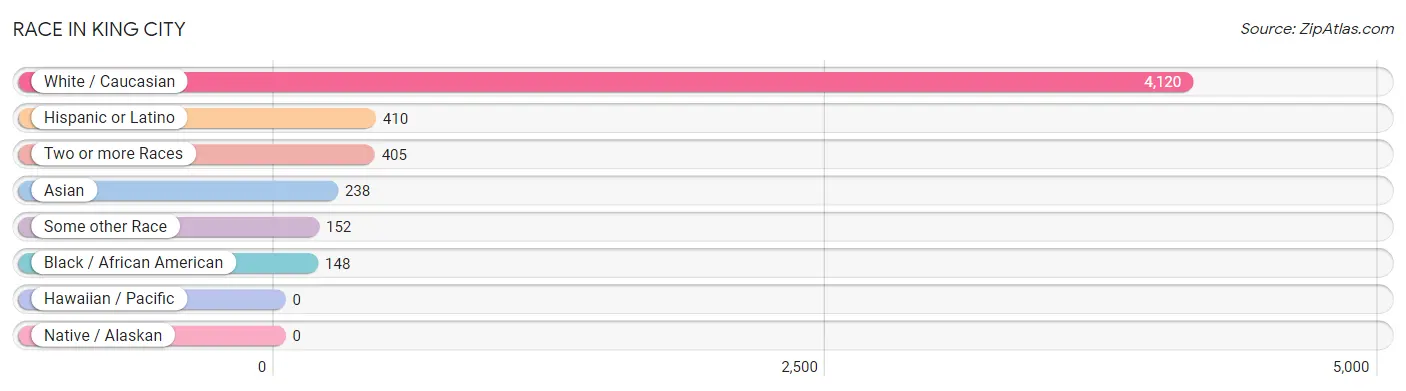
| Race | # Population | % Population |
| Asian | 238 | 4.7% |
| Black / African American | 148 | 2.9% |
| Hawaiian / Pacific | 0 | 0.0% |
| Hispanic or Latino | 410 | 8.1% |
| Native / Alaskan | 0 | 0.0% |
| White / Caucasian | 4,120 | 81.4% |
| Two or more Races | 405 | 8.0% |
| Some other Race | 152 | 3.0% |
| Total | 5,063 | 100.0% |
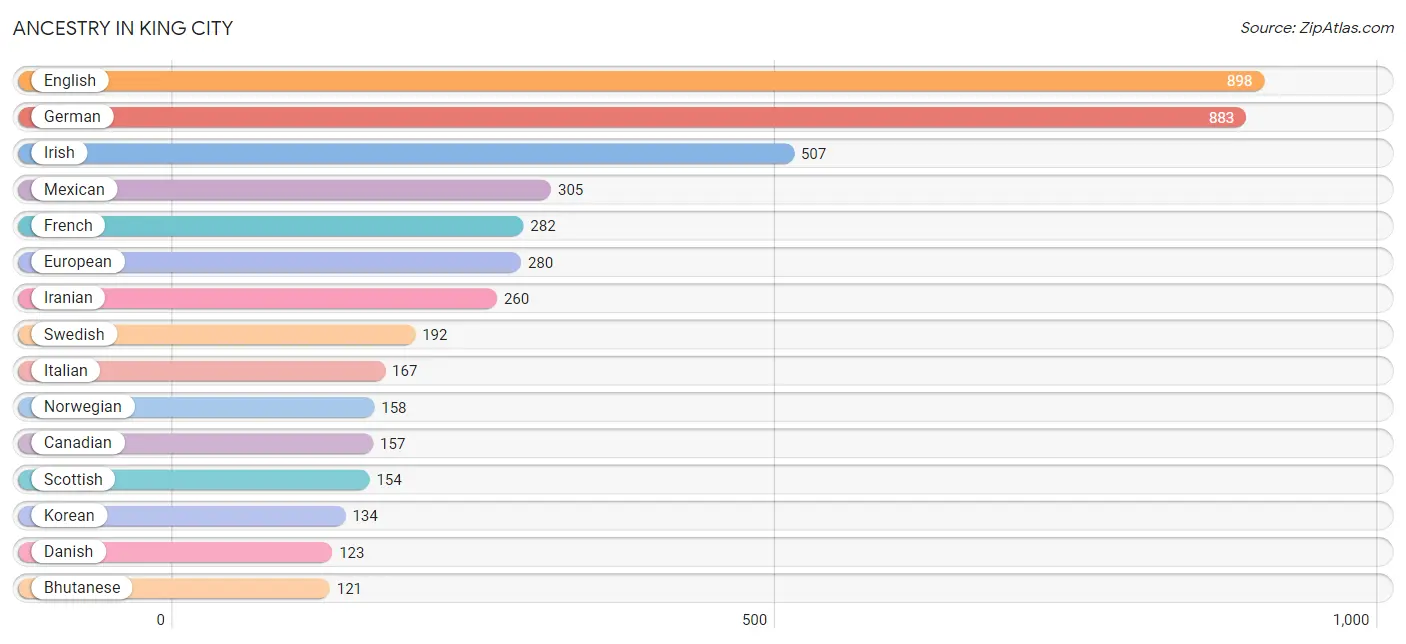
Ancestry in King City
The most populous ancestries reported in King City are English (898 | 17.7%), German (883 | 17.4%), Irish (507 | 10.0%), Mexican (305 | 6.0%), and French (282 | 5.6%), together accounting for 56.8% of all King City residents.
| Ancestry | # Population | % Population |
| American | 97 | 1.9% |
| Arab | 29 | 0.6% |
| Austrian | 20 | 0.4% |
| Belgian | 28 | 0.5% |
| Bhutanese | 121 | 2.4% |
| Brazilian | 11 | 0.2% |
| British | 38 | 0.7% |
| Bulgarian | 37 | 0.7% |
| Burmese | 52 | 1.0% |
| Canadian | 157 | 3.1% |
| Chilean | 14 | 0.3% |
| Chippewa | 7 | 0.1% |
| Croatian | 17 | 0.3% |
| Czech | 72 | 1.4% |
| Danish | 123 | 2.4% |
| Dominican | 35 | 0.7% |
| Dutch | 89 | 1.8% |
| Eastern European | 17 | 0.3% |
| English | 898 | 17.7% |
| European | 280 | 5.5% |
| Finnish | 17 | 0.3% |
| French | 282 | 5.6% |
| French Canadian | 29 | 0.6% |
| German | 883 | 17.4% |
| Greek | 13 | 0.3% |
| Guamanian / Chamorro | 56 | 1.1% |
| Indian (Asian) | 27 | 0.5% |
| Iranian | 260 | 5.1% |
| Irish | 507 | 10.0% |
| Italian | 167 | 3.3% |
| Korean | 134 | 2.6% |
| Lithuanian | 6 | 0.1% |
| Mexican | 305 | 6.0% |
| Nigerian | 25 | 0.5% |
| Northern European | 23 | 0.4% |
| Norwegian | 158 | 3.1% |
| Osage | 10 | 0.2% |
| Pakistani | 20 | 0.4% |
| Polish | 101 | 2.0% |
| Portuguese | 20 | 0.4% |
| Potawatomi | 17 | 0.3% |
| Romanian | 34 | 0.7% |
| Russian | 68 | 1.3% |
| Scandinavian | 32 | 0.6% |
| Scotch-Irish | 93 | 1.8% |
| Scottish | 154 | 3.0% |
| Sioux | 24 | 0.5% |
| South American | 14 | 0.3% |
| Sri Lankan | 71 | 1.4% |
| Subsaharan African | 25 | 0.5% |
| Swedish | 192 | 3.8% |
| Swiss | 84 | 1.7% |
| Syrian | 29 | 0.6% |
| Welsh | 48 | 0.9% | View All 54 Rows |
Immigrants in King City
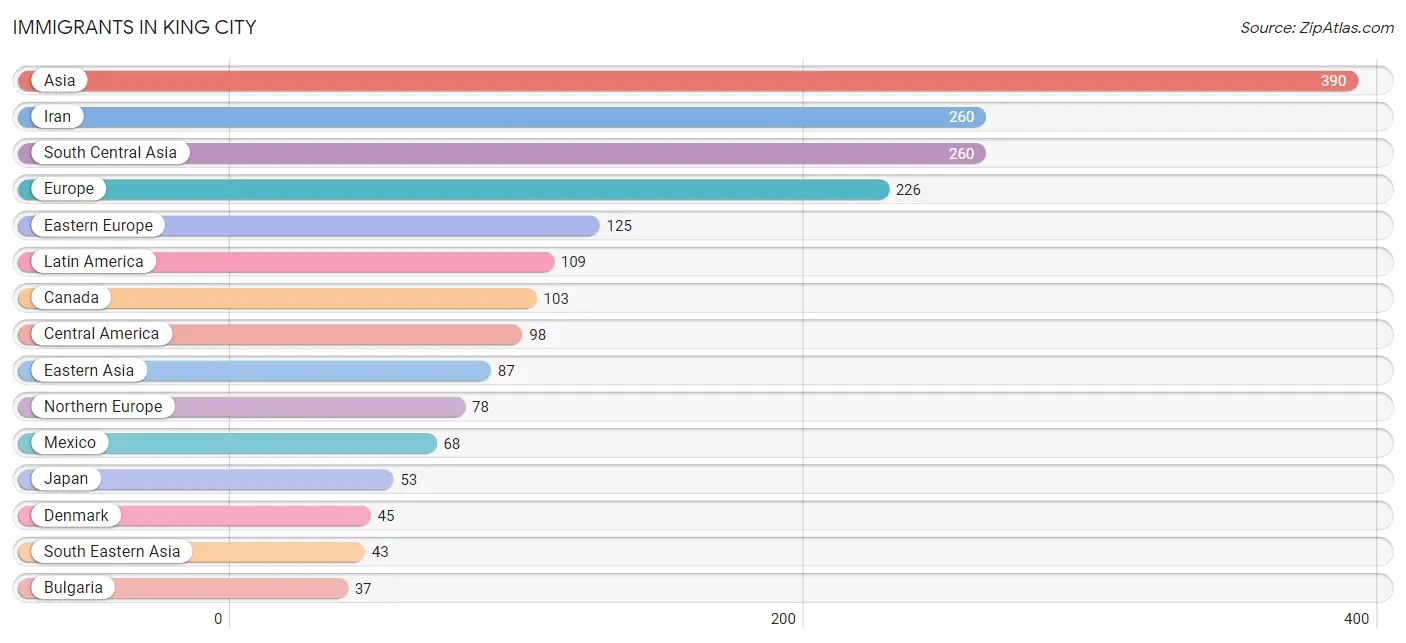
The most numerous immigrant groups reported in King City came from Asia (390 | 7.7%), Iran (260 | 5.1%), South Central Asia (260 | 5.1%), Europe (226 | 4.5%), and Eastern Europe (125 | 2.5%), together accounting for 24.9% of all King City residents.
| Immigration Origin | # Population | % Population |
| Asia | 390 | 7.7% |
| Australia | 18 | 0.4% |
| Brazil | 11 | 0.2% |
| Bulgaria | 37 | 0.7% |
| Canada | 103 | 2.0% |
| Central America | 98 | 1.9% |
| China | 16 | 0.3% |
| Czechoslovakia | 23 | 0.4% |
| Denmark | 45 | 0.9% |
| Eastern Asia | 87 | 1.7% |
| Eastern Europe | 125 | 2.5% |
| Europe | 226 | 4.5% |
| Germany | 11 | 0.2% |
| Guatemala | 30 | 0.6% |
| Hong Kong | 16 | 0.3% |
| Iran | 260 | 5.1% |
| Italy | 12 | 0.2% |
| Japan | 53 | 1.1% |
| Korea | 18 | 0.4% |
| Latin America | 109 | 2.1% |
| Mexico | 68 | 1.3% |
| Northern Europe | 78 | 1.5% |
| Oceania | 18 | 0.4% |
| Philippines | 27 | 0.5% |
| Romania | 34 | 0.7% |
| Russia | 31 | 0.6% |
| South America | 11 | 0.2% |
| South Central Asia | 260 | 5.1% |
| South Eastern Asia | 43 | 0.9% |
| Southern Europe | 12 | 0.2% |
| Vietnam | 16 | 0.3% |
| Western Europe | 11 | 0.2% | View All 32 Rows |
Sex and Age in King City
Sex and Age in King City
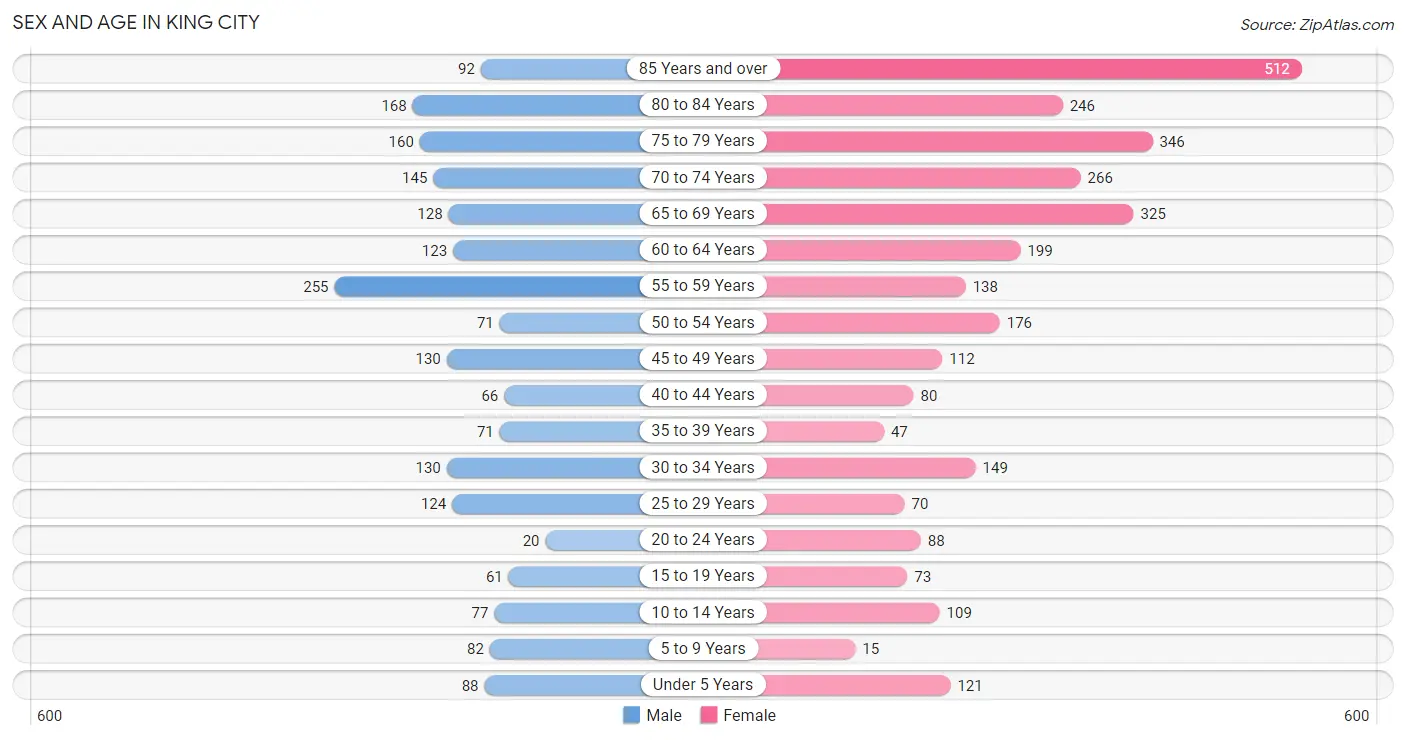
The most populous age groups in King City are 55 to 59 Years (255 | 12.8%) for men and 85 Years and over (512 | 16.7%) for women.
| Age Bracket | Male | Female |
| Under 5 Years | 88 (4.4%) | 121 (3.9%) |
| 5 to 9 Years | 82 (4.1%) | 15 (0.5%) |
| 10 to 14 Years | 77 (3.9%) | 109 (3.5%) |
| 15 to 19 Years | 61 (3.1%) | 73 (2.4%) |
| 20 to 24 Years | 20 (1.0%) | 88 (2.9%) |
| 25 to 29 Years | 124 (6.2%) | 70 (2.3%) |
| 30 to 34 Years | 130 (6.5%) | 149 (4.9%) |
| 35 to 39 Years | 71 (3.6%) | 47 (1.5%) |
| 40 to 44 Years | 66 (3.3%) | 80 (2.6%) |
| 45 to 49 Years | 130 (6.5%) | 112 (3.6%) |
| 50 to 54 Years | 71 (3.6%) | 176 (5.7%) |
| 55 to 59 Years | 255 (12.8%) | 138 (4.5%) |
| 60 to 64 Years | 123 (6.2%) | 199 (6.5%) |
| 65 to 69 Years | 128 (6.4%) | 325 (10.6%) |
| 70 to 74 Years | 145 (7.3%) | 266 (8.7%) |
| 75 to 79 Years | 160 (8.0%) | 346 (11.3%) |
| 80 to 84 Years | 168 (8.4%) | 246 (8.0%) |
| 85 Years and over | 92 (4.6%) | 512 (16.7%) |
| Total | 1,991 (100.0%) | 3,072 (100.0%) |
Families and Households in King City
Median Family Size in King City
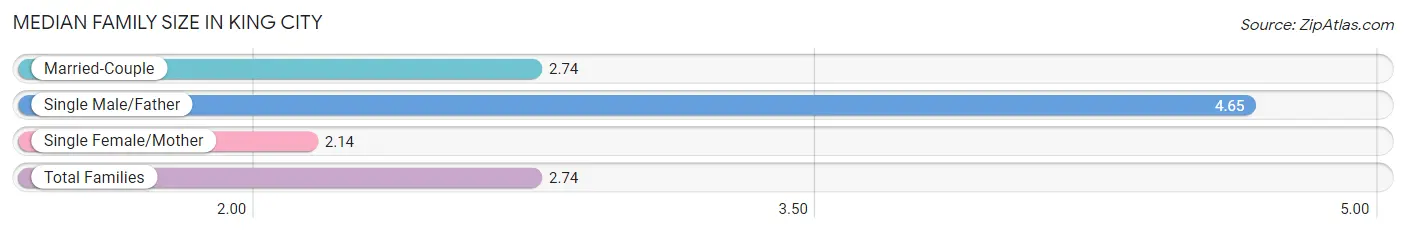
The median family size in King City is 2.74 persons per family, with single male/father families (26 | 2.1%) accounting for the largest median family size of 4.65 persons per family. On the other hand, single female/mother families (84 | 6.9%) represent the smallest median family size with 2.14 persons per family.
| Family Type | # Families | Family Size |
| Married-Couple | 1,111 (91.0%) | 2.74 |
| Single Male/Father | 26 (2.1%) | 4.65 |
| Single Female/Mother | 84 (6.9%) | 2.14 |
| Total Families | 1,221 (100.0%) | 2.74 |
Median Household Size in King City
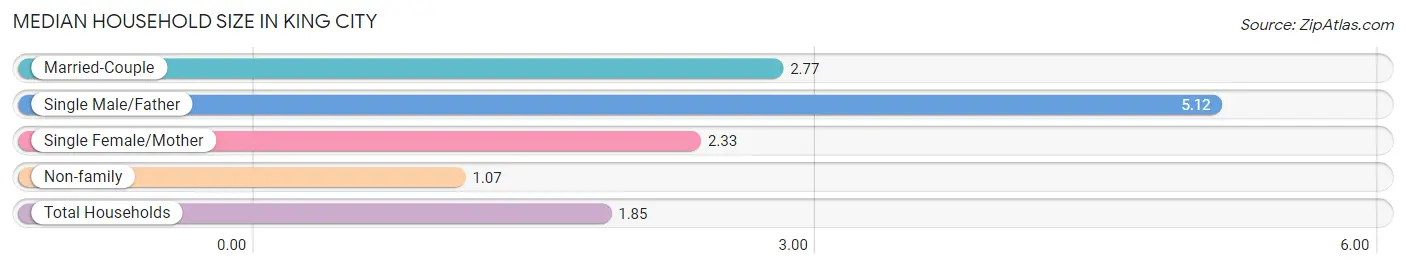
The median household size in King City is 1.85 persons per household, with single male/father households (26 | 1.0%) accounting for the largest median household size of 5.12 persons per household. non-family households (1,475 | 54.7%) represent the smallest median household size with 1.07 persons per household.
| Household Type | # Households | Household Size |
| Married-Couple | 1,111 (41.2%) | 2.77 |
| Single Male/Father | 26 (1.0%) | 5.12 |
| Single Female/Mother | 84 (3.1%) | 2.33 |
| Non-family | 1,475 (54.7%) | 1.07 |
| Total Households | 2,696 (100.0%) | 1.85 |
Household Size by Marriage Status in King City
Out of a total of 2,696 households in King City, 1,221 (45.3%) are family households, while 1,475 (54.7%) are nonfamily households. The most numerous type of family households are 2-person households, comprising 722, and the most common type of nonfamily households are 1-person households, comprising 1,370.
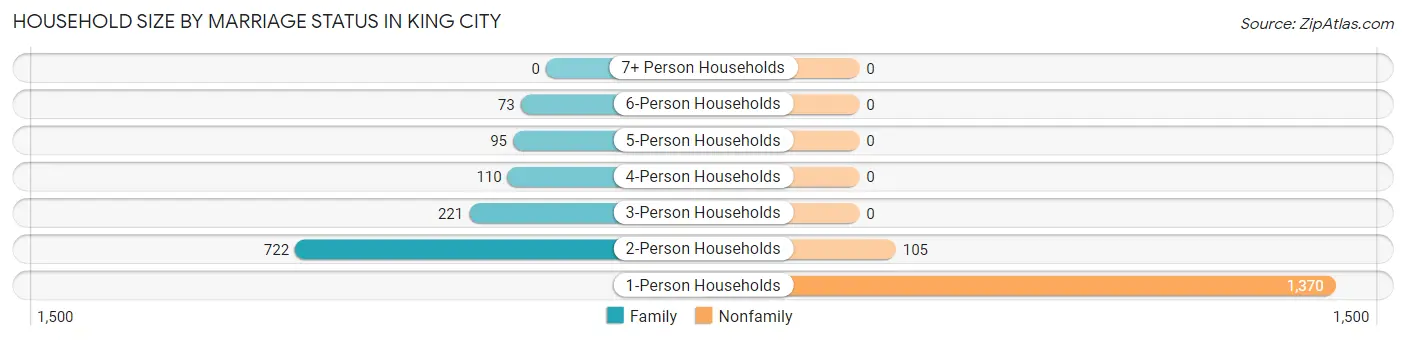
| Household Size | Family Households | Nonfamily Households |
| 1-Person Households | - | 1,370 (50.8%) |
| 2-Person Households | 722 (26.8%) | 105 (3.9%) |
| 3-Person Households | 221 (8.2%) | 0 (0.0%) |
| 4-Person Households | 110 (4.1%) | 0 (0.0%) |
| 5-Person Households | 95 (3.5%) | 0 (0.0%) |
| 6-Person Households | 73 (2.7%) | 0 (0.0%) |
| 7+ Person Households | 0 (0.0%) | 0 (0.0%) |
| Total | 1,221 (45.3%) | 1,475 (54.7%) |
Female Fertility in King City
Fertility by Age in King City
Average fertility rate in King City is 102.0 births per 1,000 women. Women in the age bracket of 35 to 50 years have the highest fertility rate with 138.0 births per 1,000 women. Women in the age bracket of 35 to 50 years acount for 52.4% of all women with births.
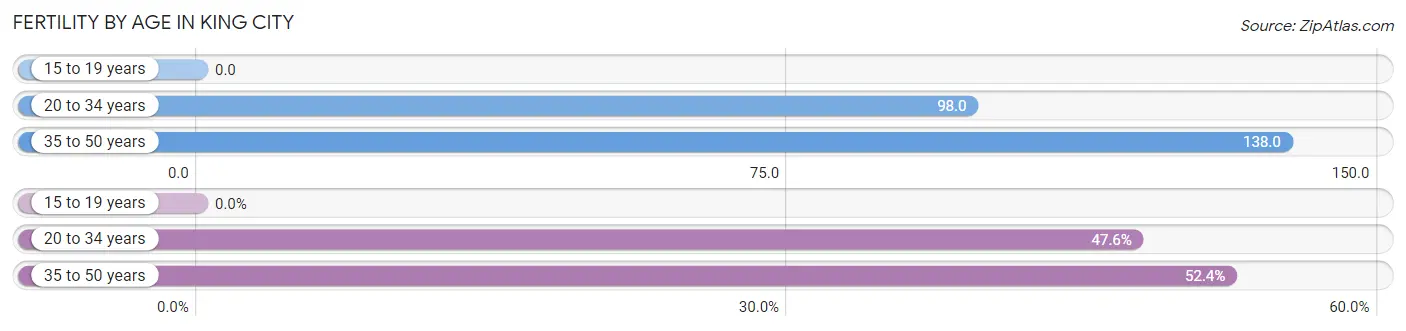
| Age Bracket | Women with Births | Births / 1,000 Women |
| 15 to 19 years | 0 (0.0%) | 0.0 |
| 20 to 34 years | 30 (47.6%) | 98.0 |
| 35 to 50 years | 33 (52.4%) | 138.0 |
| Total | 63 (100.0%) | 102.0 |
Fertility by Age by Marriage Status in King City
69.8% of women with births (63) in King City are married. The highest percentage of unmarried women with births falls into 35 to 50 years age bracket with 57.6% of them unmarried at the time of birth, while the lowest percentage of unmarried women with births belong to 20 to 34 years age bracket with 0.0% of them unmarried.
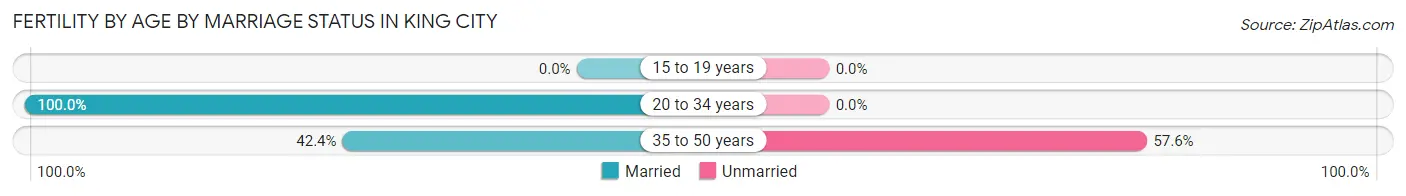
| Age Bracket | Married | Unmarried |
| 15 to 19 years | 0 (0.0%) | 0 (0.0%) |
| 20 to 34 years | 30 (100.0%) | 0 (0.0%) |
| 35 to 50 years | 14 (42.4%) | 19 (57.6%) |
| Total | 44 (69.8%) | 19 (30.2%) |
Fertility by Education in King City
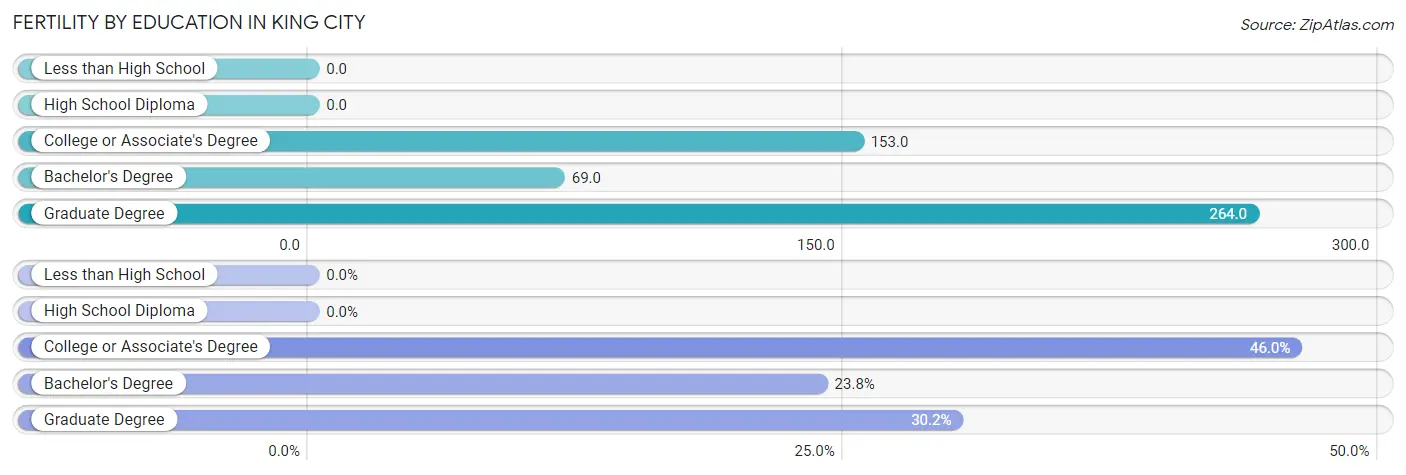
| Educational Attainment | Women with Births | Births / 1,000 Women |
| Less than High School | 0 (0.0%) | 0.0 |
| High School Diploma | 0 (0.0%) | 0.0 |
| College or Associate's Degree | 29 (46.0%) | 153.0 |
| Bachelor's Degree | 15 (23.8%) | 69.0 |
| Graduate Degree | 19 (30.2%) | 264.0 |
| Total | 63 (100.0%) | 102.0 |
Fertility by Education by Marriage Status in King City
30.2% of women with births in King City are unmarried. Women with the educational attainment of college or associate's degree are most likely to be married with 100.0% of them married at childbirth, while women with the educational attainment of graduate degree are least likely to be married with 100.0% of them unmarried at childbirth.
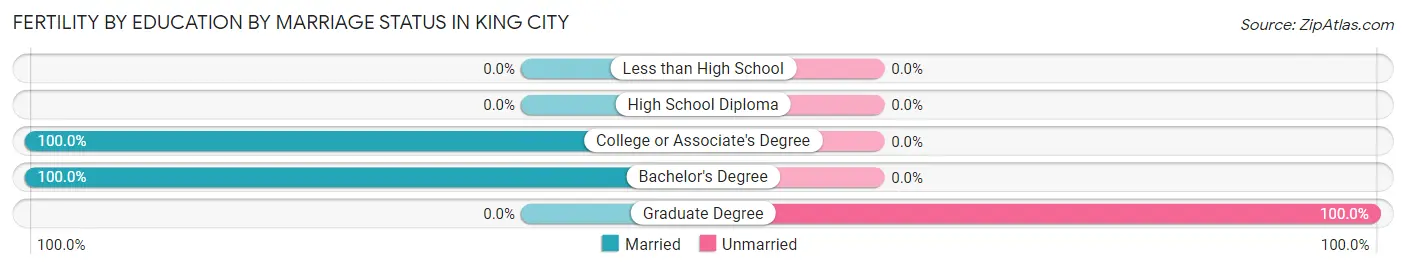
| Educational Attainment | Married | Unmarried |
| Less than High School | 0 (0.0%) | 0 (0.0%) |
| High School Diploma | 0 (0.0%) | 0 (0.0%) |
| College or Associate's Degree | 29 (100.0%) | 0 (0.0%) |
| Bachelor's Degree | 15 (100.0%) | 0 (0.0%) |
| Graduate Degree | 0 (0.0%) | 19 (100.0%) |
| Total | 44 (69.8%) | 19 (30.2%) |
Employment Characteristics in King City
Employment by Class of Employer in King City
Among the 1,734 employed individuals in King City, private company employees (1,175 | 67.8%), local government employees (213 | 12.3%), and self-employed (not incorporated) (141 | 8.1%) make up the most common classes of employment.
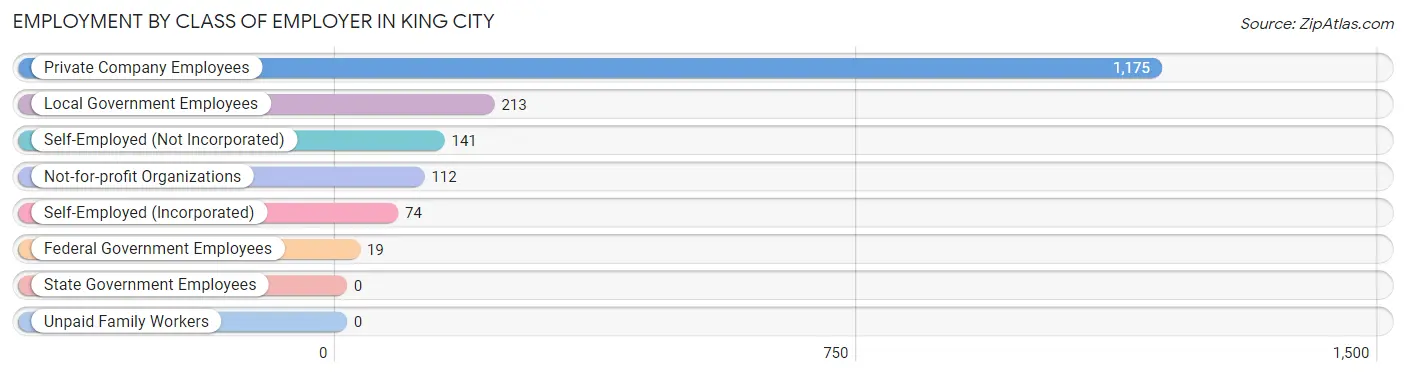
| Employer Class | # Employees | % Employees |
| Private Company Employees | 1,175 | 67.8% |
| Self-Employed (Incorporated) | 74 | 4.3% |
| Self-Employed (Not Incorporated) | 141 | 8.1% |
| Not-for-profit Organizations | 112 | 6.5% |
| Local Government Employees | 213 | 12.3% |
| State Government Employees | 0 | 0.0% |
| Federal Government Employees | 19 | 1.1% |
| Unpaid Family Workers | 0 | 0.0% |
| Total | 1,734 | 100.0% |
Employment Status by Age in King City
According to the labor force statistics for King City, out of the total population over 16 years of age (4,542), 40.1% or 1,821 individuals are in the labor force, with 4.0% or 73 of them unemployed. The age group with the highest labor force participation rate is 45 to 54 years, with 86.7% or 424 individuals in the labor force. Within the labor force, the 75 years and over age range has the highest percentage of unemployed individuals, with 100.0% or 11 of them being unemployed.
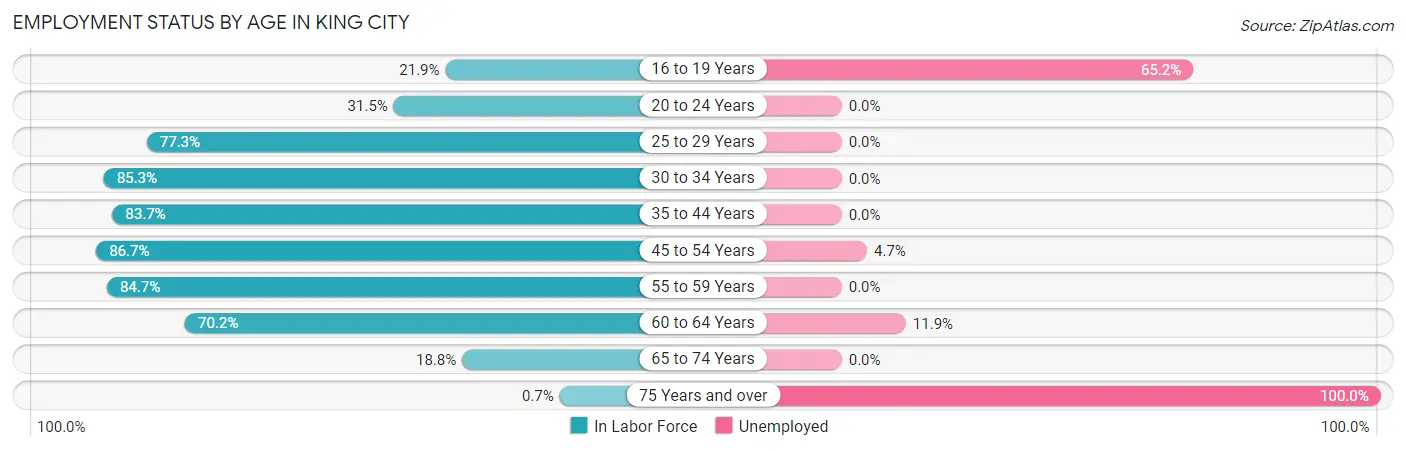
| Age Bracket | In Labor Force | Unemployed |
| 16 to 19 Years | 23 (21.9%) | 15 (65.2%) |
| 20 to 24 Years | 34 (31.5%) | 0 (0.0%) |
| 25 to 29 Years | 150 (77.3%) | 0 (0.0%) |
| 30 to 34 Years | 238 (85.3%) | 0 (0.0%) |
| 35 to 44 Years | 221 (83.7%) | 0 (0.0%) |
| 45 to 54 Years | 424 (86.7%) | 20 (4.7%) |
| 55 to 59 Years | 333 (84.7%) | 0 (0.0%) |
| 60 to 64 Years | 226 (70.2%) | 27 (11.9%) |
| 65 to 74 Years | 162 (18.8%) | 0 (0.0%) |
| 75 Years and over | 11 (0.7%) | 11 (100.0%) |
| Total | 1,821 (40.1%) | 73 (4.0%) |
Employment Status by Educational Attainment in King City
According to labor force statistics for King City, 82.0% of individuals (1,592) out of the total population between 25 and 64 years of age (1,941) are in the labor force, with 3.0% or 48 of them being unemployed. The group with the highest labor force participation rate are those with the educational attainment of bachelor's degree or higher, with 96.6% or 835 individuals in the labor force. Within the labor force, individuals with college / associate degree education have the highest percentage of unemployment, with 3.9% or 18 of them being unemployed.
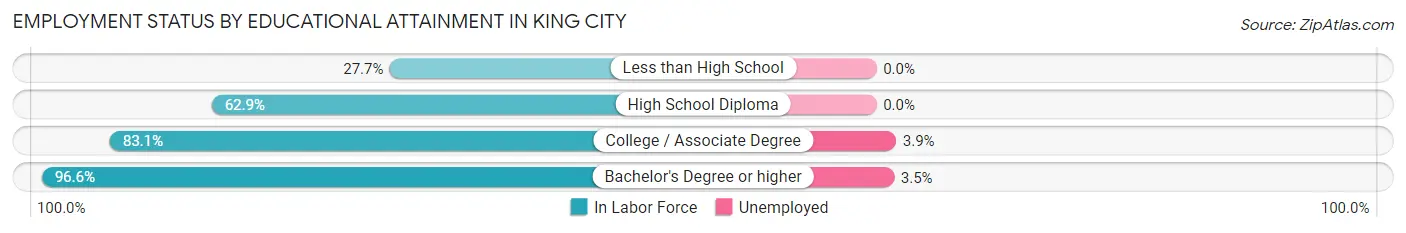
| Educational Attainment | In Labor Force | Unemployed |
| Less than High School | 26 (27.7%) | 0 (0.0%) |
| High School Diploma | 268 (62.9%) | 0 (0.0%) |
| College / Associate Degree | 463 (83.1%) | 22 (3.9%) |
| Bachelor's Degree or higher | 835 (96.6%) | 30 (3.5%) |
| Total | 1,592 (82.0%) | 58 (3.0%) |
Employment Occupations by Sex in King City
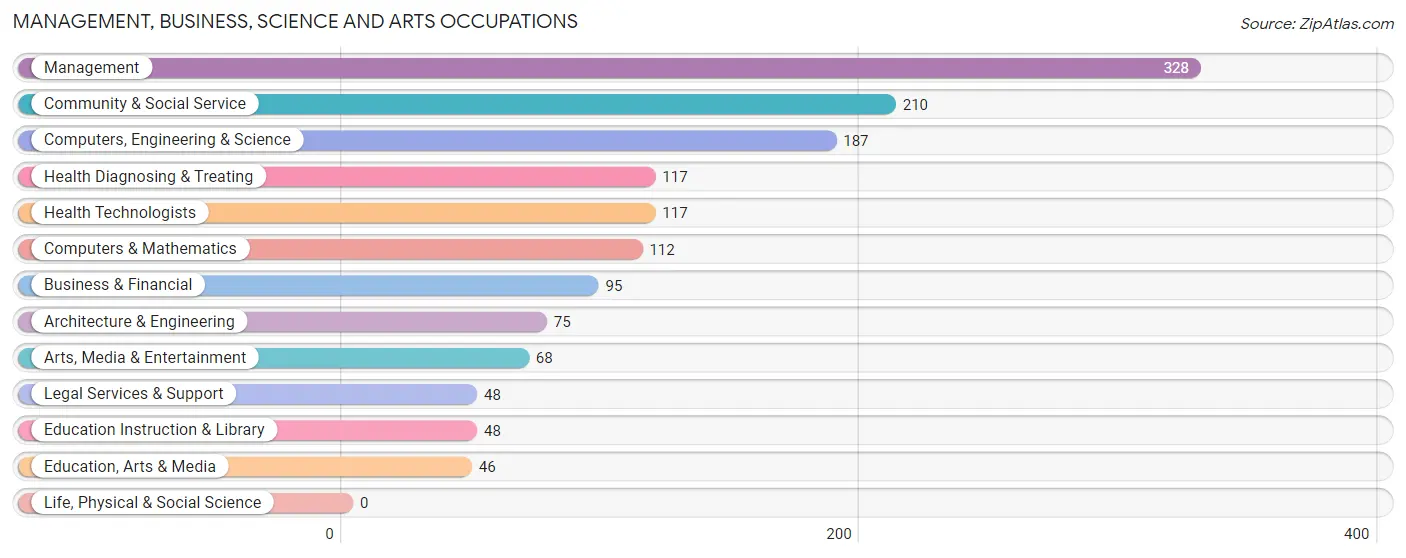
Management, Business, Science and Arts Occupations
The most common Management, Business, Science and Arts occupations in King City are Management (328 | 18.8%), Community & Social Service (210 | 12.0%), Computers, Engineering & Science (187 | 10.7%), Health Diagnosing & Treating (117 | 6.7%), and Health Technologists (117 | 6.7%).
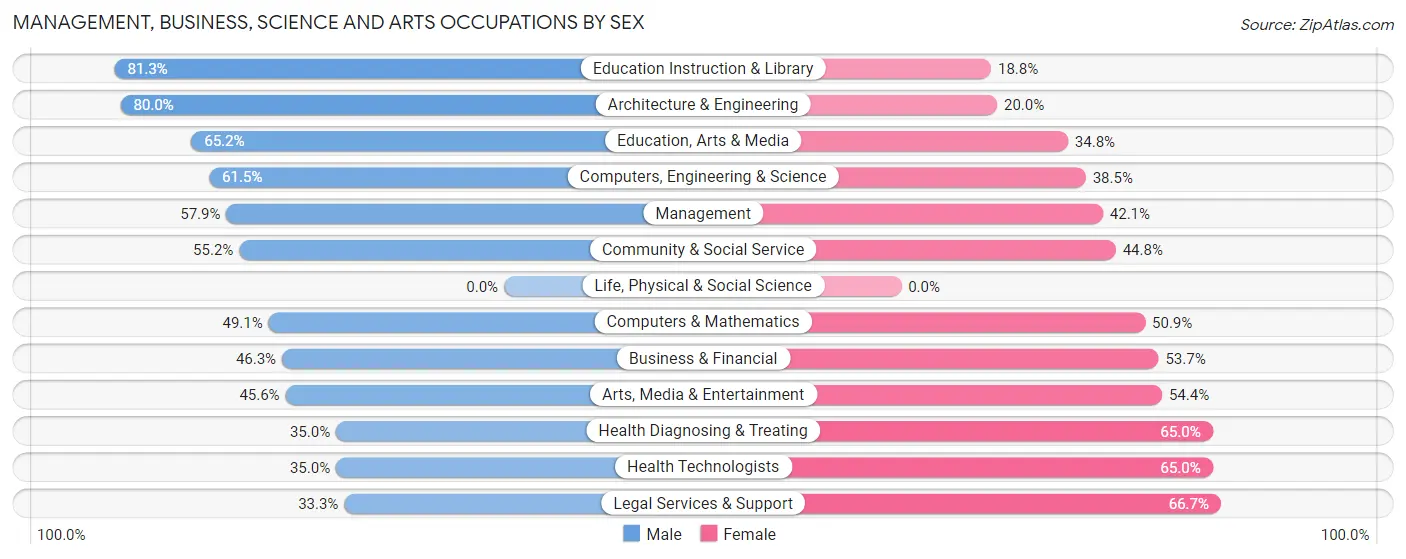
Management, Business, Science and Arts Occupations by Sex
Within the Management, Business, Science and Arts occupations in King City, the most male-oriented occupations are Education Instruction & Library (81.2%), Architecture & Engineering (80.0%), and Education, Arts & Media (65.2%), while the most female-oriented occupations are Legal Services & Support (66.7%), Health Diagnosing & Treating (65.0%), and Health Technologists (65.0%).
| Occupation | Male | Female |
| Management | 190 (57.9%) | 138 (42.1%) |
| Business & Financial | 44 (46.3%) | 51 (53.7%) |
| Computers, Engineering & Science | 115 (61.5%) | 72 (38.5%) |
| Computers & Mathematics | 55 (49.1%) | 57 (50.9%) |
| Architecture & Engineering | 60 (80.0%) | 15 (20.0%) |
| Life, Physical & Social Science | 0 (0.0%) | 0 (0.0%) |
| Community & Social Service | 116 (55.2%) | 94 (44.8%) |
| Education, Arts & Media | 30 (65.2%) | 16 (34.8%) |
| Legal Services & Support | 16 (33.3%) | 32 (66.7%) |
| Education Instruction & Library | 39 (81.2%) | 9 (18.8%) |
| Arts, Media & Entertainment | 31 (45.6%) | 37 (54.4%) |
| Health Diagnosing & Treating | 41 (35.0%) | 76 (65.0%) |
| Health Technologists | 41 (35.0%) | 76 (65.0%) |
| Total (Category) | 506 (54.0%) | 431 (46.0%) |
| Total (Overall) | 853 (48.8%) | 896 (51.2%) |
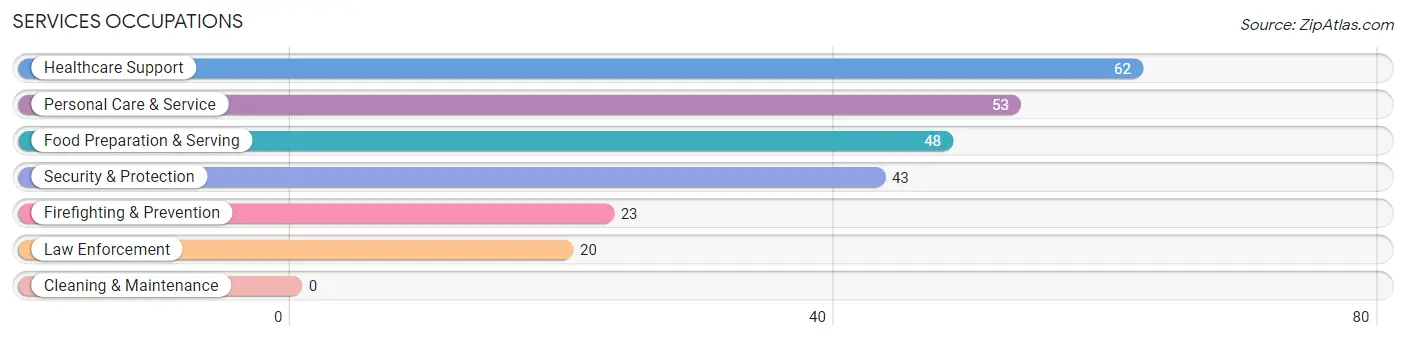
Services Occupations
The most common Services occupations in King City are Healthcare Support (62 | 3.5%), Personal Care & Service (53 | 3.0%), Food Preparation & Serving (48 | 2.7%), Security & Protection (43 | 2.5%), and Firefighting & Prevention (23 | 1.3%).
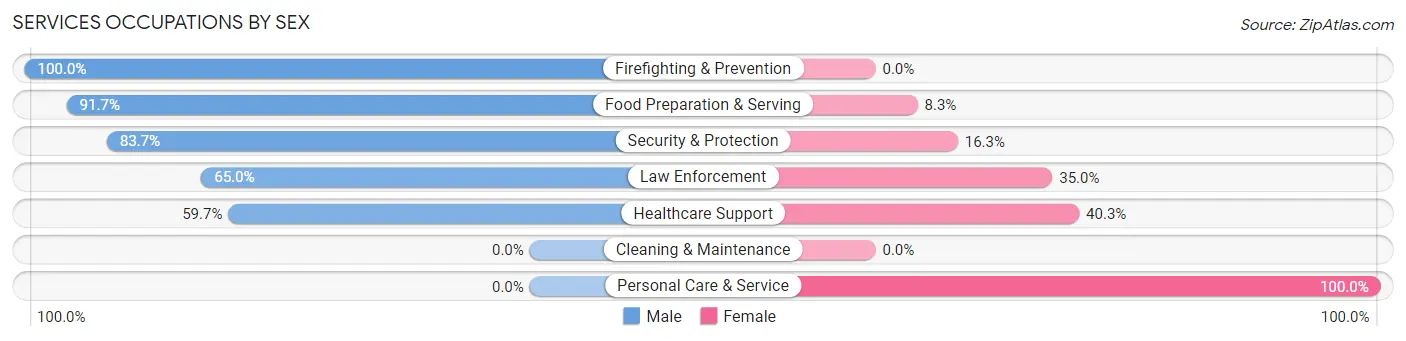
Services Occupations by Sex
Within the Services occupations in King City, the most male-oriented occupations are Firefighting & Prevention (100.0%), Food Preparation & Serving (91.7%), and Security & Protection (83.7%), while the most female-oriented occupations are Personal Care & Service (100.0%), Healthcare Support (40.3%), and Law Enforcement (35.0%).
| Occupation | Male | Female |
| Healthcare Support | 37 (59.7%) | 25 (40.3%) |
| Security & Protection | 36 (83.7%) | 7 (16.3%) |
| Firefighting & Prevention | 23 (100.0%) | 0 (0.0%) |
| Law Enforcement | 13 (65.0%) | 7 (35.0%) |
| Food Preparation & Serving | 44 (91.7%) | 4 (8.3%) |
| Cleaning & Maintenance | 0 (0.0%) | 0 (0.0%) |
| Personal Care & Service | 0 (0.0%) | 53 (100.0%) |
| Total (Category) | 117 (56.8%) | 89 (43.2%) |
| Total (Overall) | 853 (48.8%) | 896 (51.2%) |
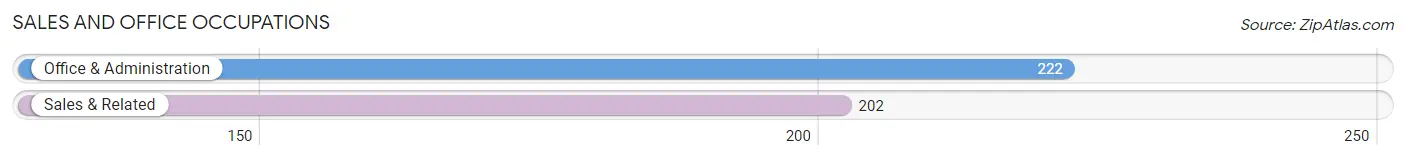
Sales and Office Occupations
The most common Sales and Office occupations in King City are Office & Administration (222 | 12.7%), and Sales & Related (202 | 11.6%).
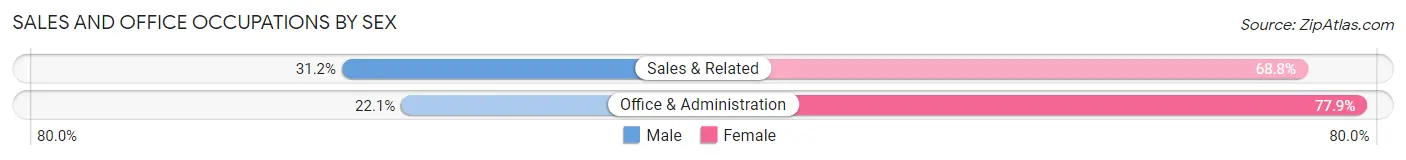
Sales and Office Occupations by Sex
| Occupation | Male | Female |
| Sales & Related | 63 (31.2%) | 139 (68.8%) |
| Office & Administration | 49 (22.1%) | 173 (77.9%) |
| Total (Category) | 112 (26.4%) | 312 (73.6%) |
| Total (Overall) | 853 (48.8%) | 896 (51.2%) |
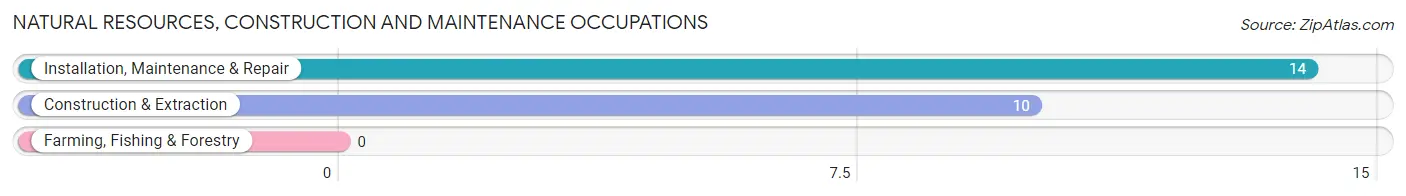
Natural Resources, Construction and Maintenance Occupations
The most common Natural Resources, Construction and Maintenance occupations in King City are Installation, Maintenance & Repair (14 | 0.8%), and Construction & Extraction (10 | 0.6%).
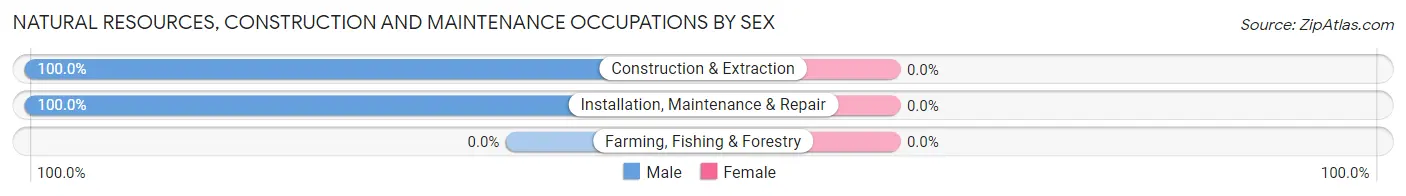
Natural Resources, Construction and Maintenance Occupations by Sex
| Occupation | Male | Female |
| Farming, Fishing & Forestry | 0 (0.0%) | 0 (0.0%) |
| Construction & Extraction | 10 (100.0%) | 0 (0.0%) |
| Installation, Maintenance & Repair | 14 (100.0%) | 0 (0.0%) |
| Total (Category) | 24 (100.0%) | 0 (0.0%) |
| Total (Overall) | 853 (48.8%) | 896 (51.2%) |
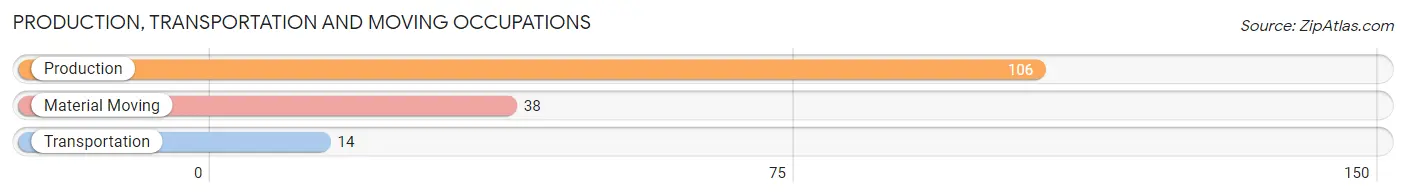
Production, Transportation and Moving Occupations
The most common Production, Transportation and Moving occupations in King City are Production (106 | 6.1%), Material Moving (38 | 2.2%), and Transportation (14 | 0.8%).
Production, Transportation and Moving Occupations by Sex
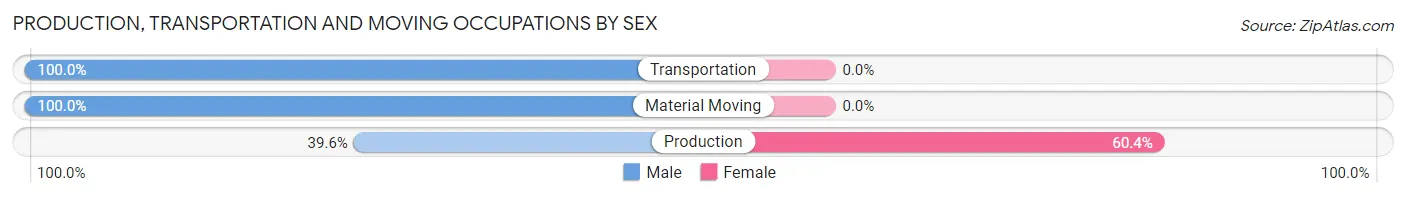
| Occupation | Male | Female |
| Production | 42 (39.6%) | 64 (60.4%) |
| Transportation | 14 (100.0%) | 0 (0.0%) |
| Material Moving | 38 (100.0%) | 0 (0.0%) |
| Total (Category) | 94 (59.5%) | 64 (40.5%) |
| Total (Overall) | 853 (48.8%) | 896 (51.2%) |
Employment Industries by Sex in King City
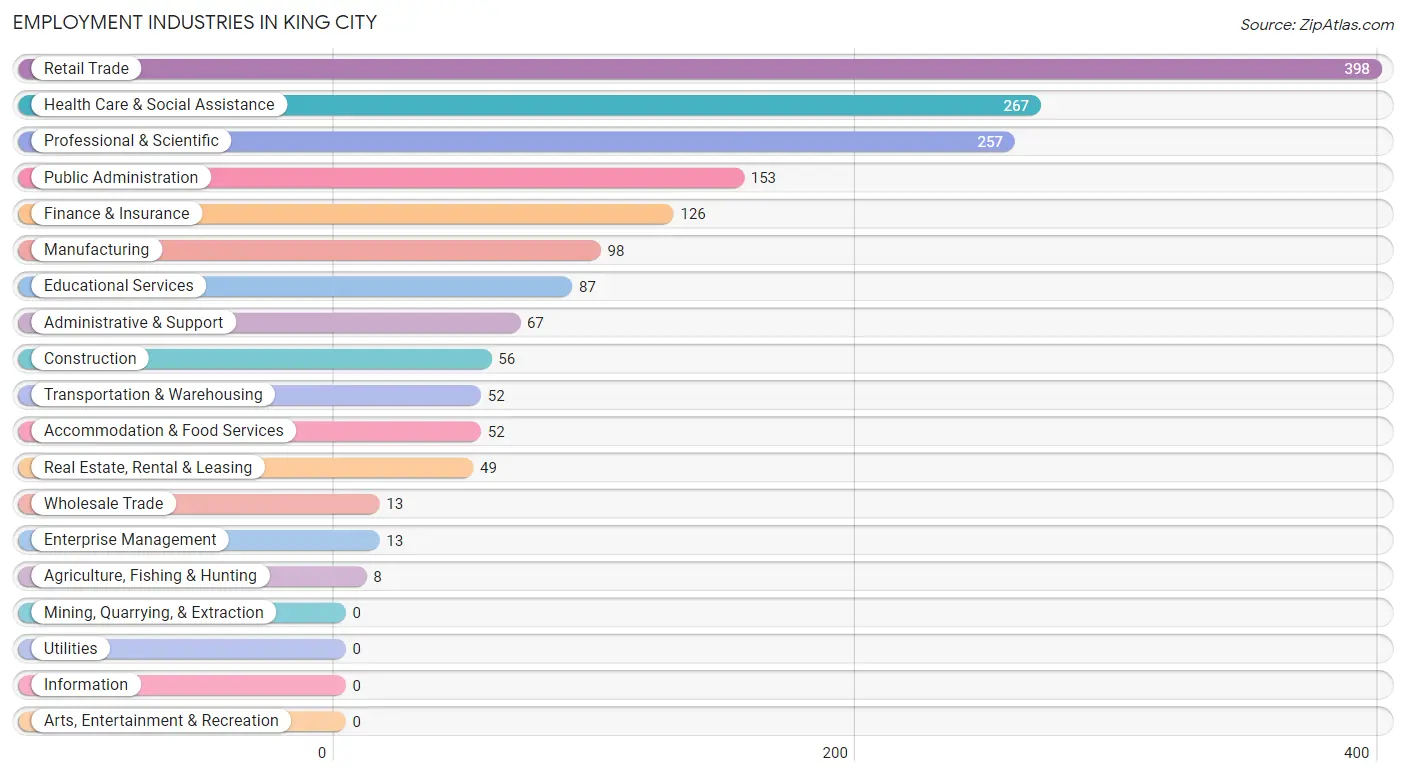
Employment Industries in King City
The major employment industries in King City include Retail Trade (398 | 22.8%), Health Care & Social Assistance (267 | 15.3%), Professional & Scientific (257 | 14.7%), Public Administration (153 | 8.7%), and Finance & Insurance (126 | 7.2%).
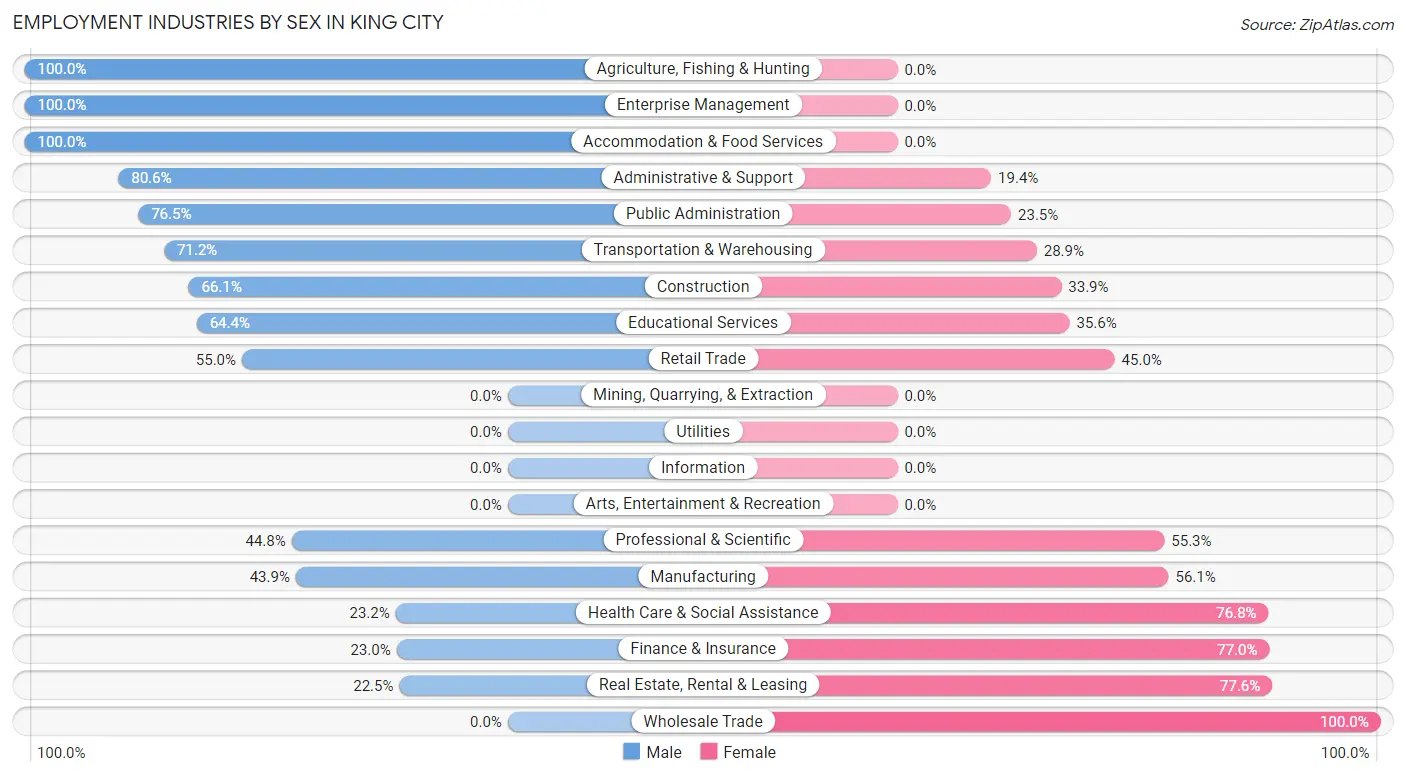
Employment Industries by Sex in King City
The King City industries that see more men than women are Agriculture, Fishing & Hunting (100.0%), Enterprise Management (100.0%), and Accommodation & Food Services (100.0%), whereas the industries that tend to have a higher number of women are Wholesale Trade (100.0%), Real Estate, Rental & Leasing (77.5%), and Finance & Insurance (77.0%).
| Industry | Male | Female |
| Agriculture, Fishing & Hunting | 8 (100.0%) | 0 (0.0%) |
| Mining, Quarrying, & Extraction | 0 (0.0%) | 0 (0.0%) |
| Construction | 37 (66.1%) | 19 (33.9%) |
| Manufacturing | 43 (43.9%) | 55 (56.1%) |
| Wholesale Trade | 0 (0.0%) | 13 (100.0%) |
| Retail Trade | 219 (55.0%) | 179 (45.0%) |
| Transportation & Warehousing | 37 (71.2%) | 15 (28.8%) |
| Utilities | 0 (0.0%) | 0 (0.0%) |
| Information | 0 (0.0%) | 0 (0.0%) |
| Finance & Insurance | 29 (23.0%) | 97 (77.0%) |
| Real Estate, Rental & Leasing | 11 (22.5%) | 38 (77.5%) |
| Professional & Scientific | 115 (44.8%) | 142 (55.2%) |
| Enterprise Management | 13 (100.0%) | 0 (0.0%) |
| Administrative & Support | 54 (80.6%) | 13 (19.4%) |
| Educational Services | 56 (64.4%) | 31 (35.6%) |
| Health Care & Social Assistance | 62 (23.2%) | 205 (76.8%) |
| Arts, Entertainment & Recreation | 0 (0.0%) | 0 (0.0%) |
| Accommodation & Food Services | 52 (100.0%) | 0 (0.0%) |
| Public Administration | 117 (76.5%) | 36 (23.5%) |
| Total | 853 (48.8%) | 896 (51.2%) |
Education in King City
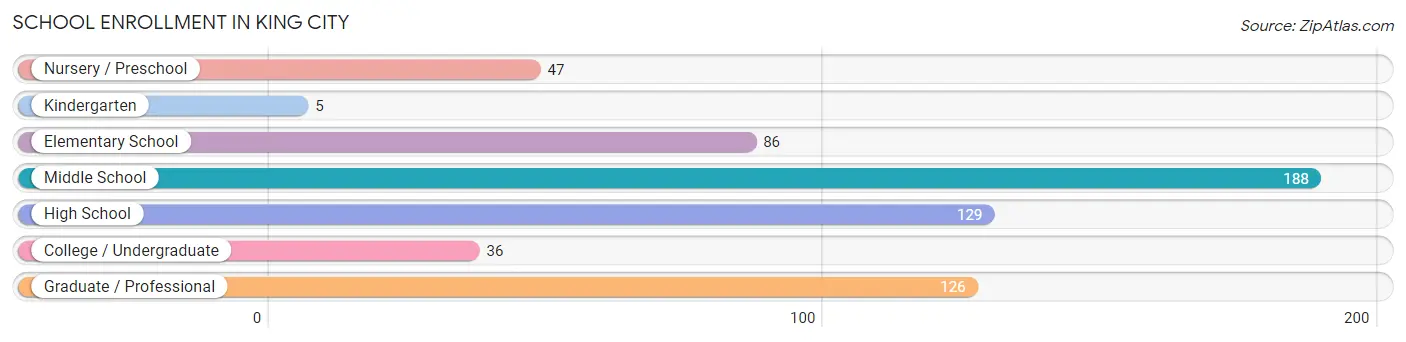
School Enrollment in King City
The most common levels of schooling among the 617 students in King City are middle school (188 | 30.5%), high school (129 | 20.9%), and graduate / professional (126 | 20.4%).
| School Level | # Students | % Students |
| Nursery / Preschool | 47 | 7.6% |
| Kindergarten | 5 | 0.8% |
| Elementary School | 86 | 13.9% |
| Middle School | 188 | 30.5% |
| High School | 129 | 20.9% |
| College / Undergraduate | 36 | 5.8% |
| Graduate / Professional | 126 | 20.4% |
| Total | 617 | 100.0% |
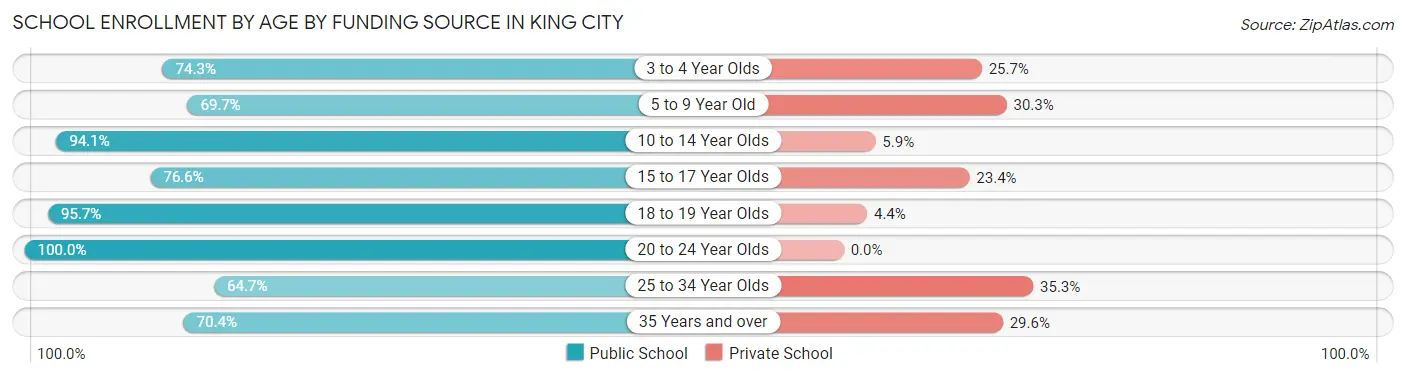
School Enrollment by Age by Funding Source in King City
Out of a total of 617 students who are enrolled in schools in King City, 110 (17.8%) attend a private institution, while the remaining 507 (82.2%) are enrolled in public schools. The age group of 25 to 34 year olds has the highest likelihood of being enrolled in private schools, with 12 (35.3% in the age bracket) enrolled. Conversely, the age group of 20 to 24 year olds has the lowest likelihood of being enrolled in a private school, with 58 (100.0% in the age bracket) attending a public institution.
| Age Bracket | Public School | Private School |
| 3 to 4 Year Olds | 26 (74.3%) | 9 (25.7%) |
| 5 to 9 Year Old | 62 (69.7%) | 27 (30.3%) |
| 10 to 14 Year Olds | 175 (94.1%) | 11 (5.9%) |
| 15 to 17 Year Olds | 85 (76.6%) | 26 (23.4%) |
| 18 to 19 Year Olds | 22 (95.7%) | 1 (4.3%) |
| 20 to 24 Year Olds | 58 (100.0%) | 0 (0.0%) |
| 25 to 34 Year Olds | 22 (64.7%) | 12 (35.3%) |
| 35 Years and over | 57 (70.4%) | 24 (29.6%) |
| Total | 507 (82.2%) | 110 (17.8%) |
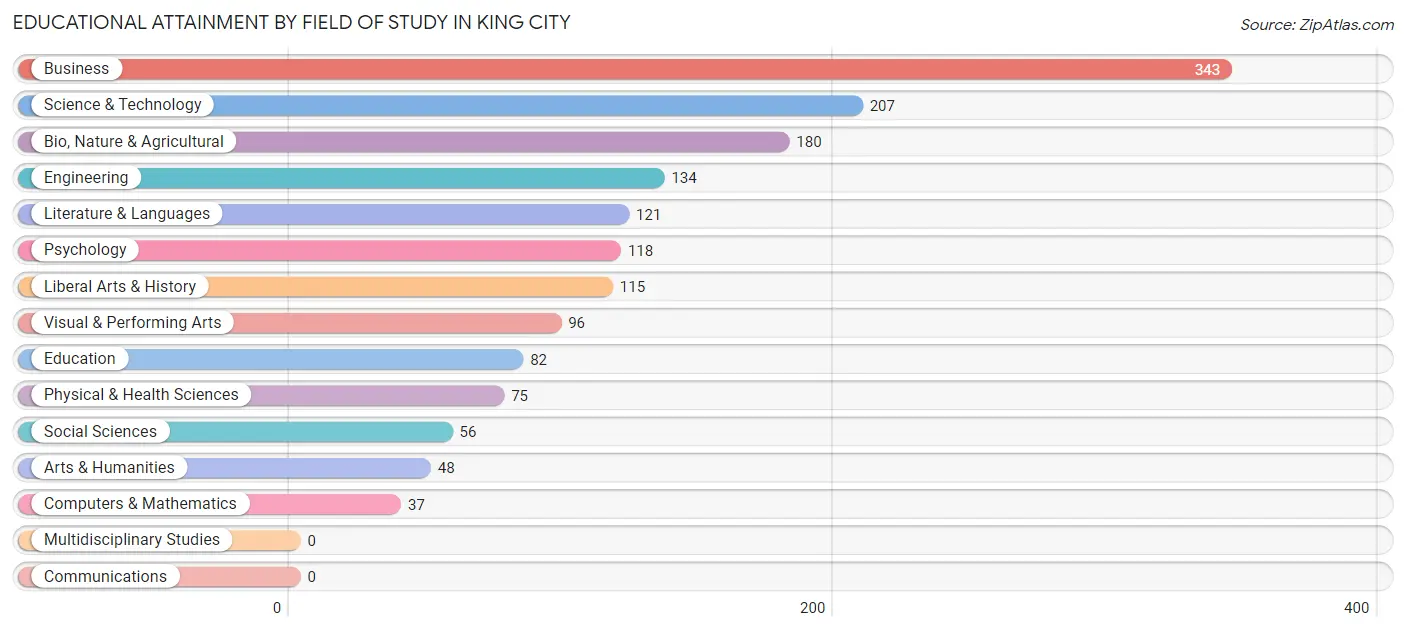
Educational Attainment by Field of Study in King City
Business (343 | 21.3%), science & technology (207 | 12.8%), bio, nature & agricultural (180 | 11.2%), engineering (134 | 8.3%), and literature & languages (121 | 7.5%) are the most common fields of study among 1,612 individuals in King City who have obtained a bachelor's degree or higher.
| Field of Study | # Graduates | % Graduates |
| Computers & Mathematics | 37 | 2.3% |
| Bio, Nature & Agricultural | 180 | 11.2% |
| Physical & Health Sciences | 75 | 4.6% |
| Psychology | 118 | 7.3% |
| Social Sciences | 56 | 3.5% |
| Engineering | 134 | 8.3% |
| Multidisciplinary Studies | 0 | 0.0% |
| Science & Technology | 207 | 12.8% |
| Business | 343 | 21.3% |
| Education | 82 | 5.1% |
| Literature & Languages | 121 | 7.5% |
| Liberal Arts & History | 115 | 7.1% |
| Visual & Performing Arts | 96 | 6.0% |
| Communications | 0 | 0.0% |
| Arts & Humanities | 48 | 3.0% |
| Total | 1,612 | 100.0% |
Transportation & Commute in King City
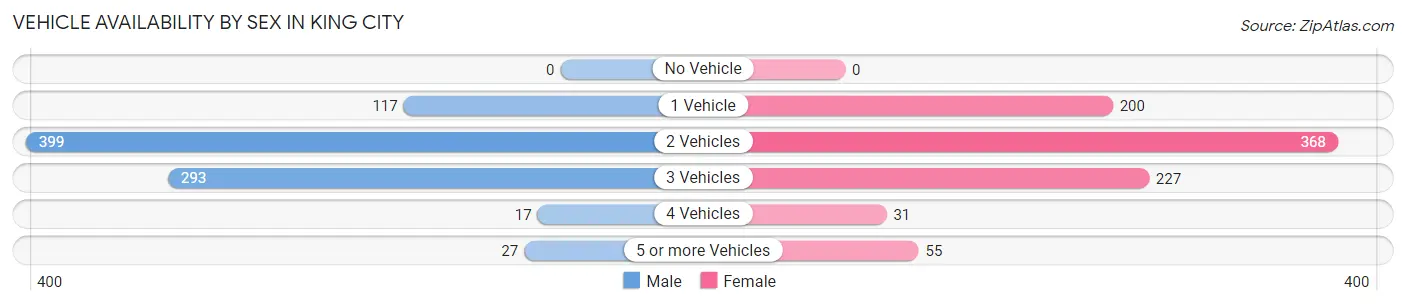
Vehicle Availability by Sex in King City
The most prevalent vehicle ownership categories in King City are males with 2 vehicles (399, accounting for 46.8%) and females with 2 vehicles (368, making up 45.3%).
| Vehicles Available | Male | Female |
| No Vehicle | 0 (0.0%) | 0 (0.0%) |
| 1 Vehicle | 117 (13.7%) | 200 (22.7%) |
| 2 Vehicles | 399 (46.8%) | 368 (41.8%) |
| 3 Vehicles | 293 (34.4%) | 227 (25.8%) |
| 4 Vehicles | 17 (2.0%) | 31 (3.5%) |
| 5 or more Vehicles | 27 (3.2%) | 55 (6.2%) |
| Total | 853 (100.0%) | 881 (100.0%) |
Commute Time in King City
The most frequently occuring commute durations in King City are 30 to 34 minutes (269 commuters, 20.4%), 15 to 19 minutes (213 commuters, 16.2%), and 5 to 9 minutes (192 commuters, 14.6%).
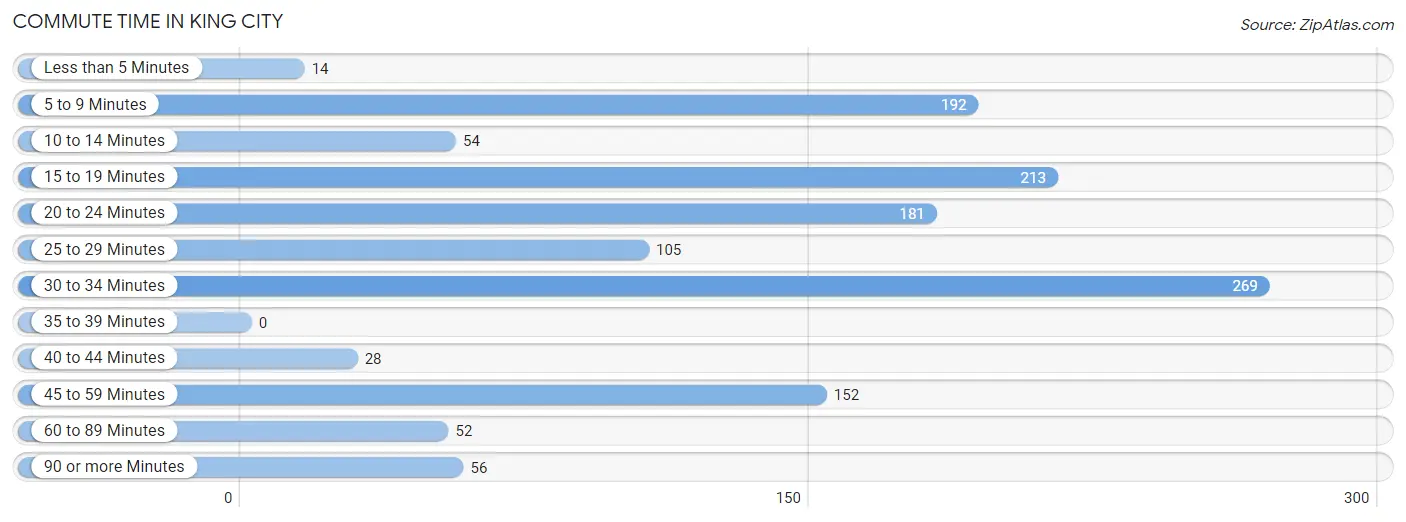
| Commute Time | # Commuters | % Commuters |
| Less than 5 Minutes | 14 | 1.1% |
| 5 to 9 Minutes | 192 | 14.6% |
| 10 to 14 Minutes | 54 | 4.1% |
| 15 to 19 Minutes | 213 | 16.2% |
| 20 to 24 Minutes | 181 | 13.8% |
| 25 to 29 Minutes | 105 | 8.0% |
| 30 to 34 Minutes | 269 | 20.4% |
| 35 to 39 Minutes | 0 | 0.0% |
| 40 to 44 Minutes | 28 | 2.1% |
| 45 to 59 Minutes | 152 | 11.6% |
| 60 to 89 Minutes | 52 | 4.0% |
| 90 or more Minutes | 56 | 4.3% |
Commute Time by Sex in King City
The most common commute times in King City are 30 to 34 minutes (179 commuters, 28.3%) for males and 5 to 9 minutes (173 commuters, 25.3%) for females.
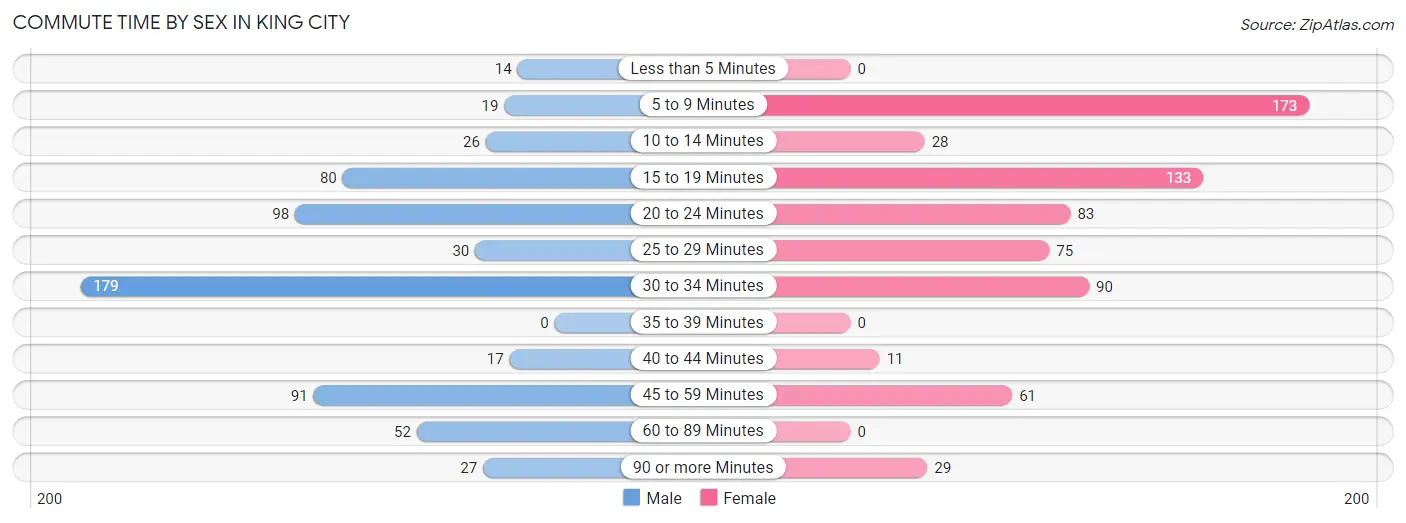
| Commute Time | Male | Female |
| Less than 5 Minutes | 14 (2.2%) | 0 (0.0%) |
| 5 to 9 Minutes | 19 (3.0%) | 173 (25.3%) |
| 10 to 14 Minutes | 26 (4.1%) | 28 (4.1%) |
| 15 to 19 Minutes | 80 (12.6%) | 133 (19.5%) |
| 20 to 24 Minutes | 98 (15.5%) | 83 (12.1%) |
| 25 to 29 Minutes | 30 (4.7%) | 75 (11.0%) |
| 30 to 34 Minutes | 179 (28.3%) | 90 (13.2%) |
| 35 to 39 Minutes | 0 (0.0%) | 0 (0.0%) |
| 40 to 44 Minutes | 17 (2.7%) | 11 (1.6%) |
| 45 to 59 Minutes | 91 (14.4%) | 61 (8.9%) |
| 60 to 89 Minutes | 52 (8.2%) | 0 (0.0%) |
| 90 or more Minutes | 27 (4.3%) | 29 (4.3%) |
Time of Departure to Work by Sex in King City
The most frequent times of departure to work in King City are 12:00 PM to 3:59 PM (109, 17.2%) for males and 7:30 AM to 7:59 AM (124, 18.2%) for females.
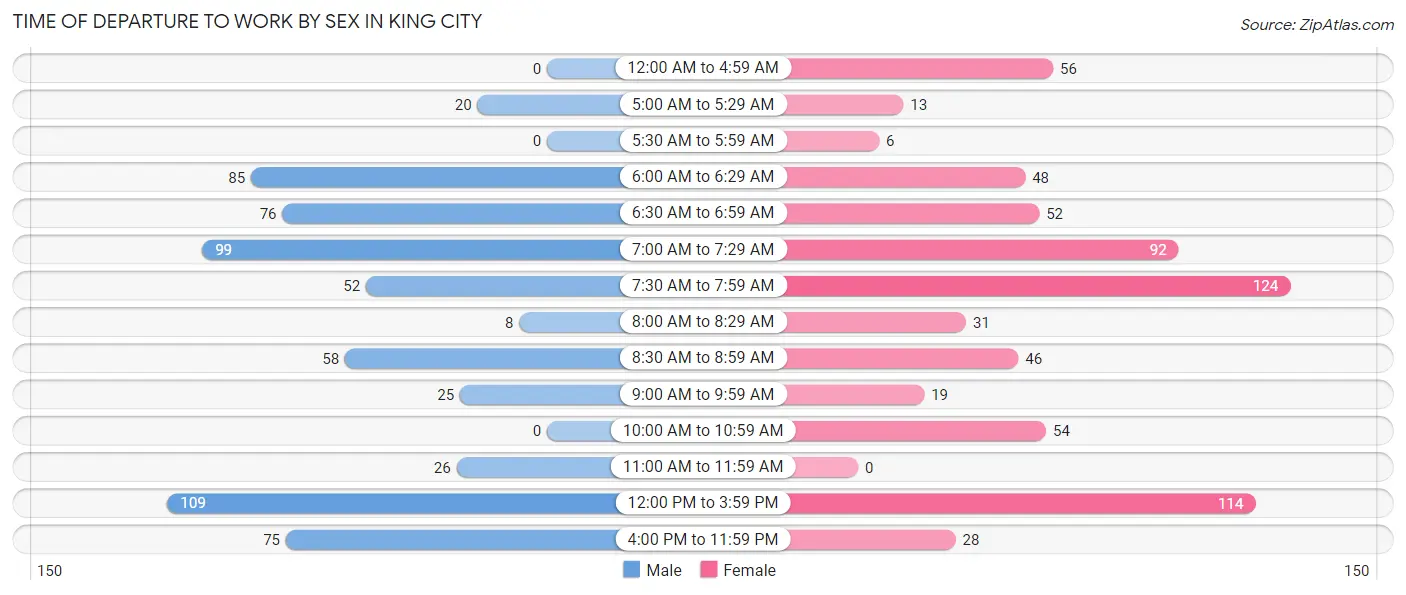
| Time of Departure | Male | Female |
| 12:00 AM to 4:59 AM | 0 (0.0%) | 56 (8.2%) |
| 5:00 AM to 5:29 AM | 20 (3.2%) | 13 (1.9%) |
| 5:30 AM to 5:59 AM | 0 (0.0%) | 6 (0.9%) |
| 6:00 AM to 6:29 AM | 85 (13.4%) | 48 (7.0%) |
| 6:30 AM to 6:59 AM | 76 (12.0%) | 52 (7.6%) |
| 7:00 AM to 7:29 AM | 99 (15.6%) | 92 (13.5%) |
| 7:30 AM to 7:59 AM | 52 (8.2%) | 124 (18.2%) |
| 8:00 AM to 8:29 AM | 8 (1.3%) | 31 (4.5%) |
| 8:30 AM to 8:59 AM | 58 (9.2%) | 46 (6.7%) |
| 9:00 AM to 9:59 AM | 25 (4.0%) | 19 (2.8%) |
| 10:00 AM to 10:59 AM | 0 (0.0%) | 54 (7.9%) |
| 11:00 AM to 11:59 AM | 26 (4.1%) | 0 (0.0%) |
| 12:00 PM to 3:59 PM | 109 (17.2%) | 114 (16.7%) |
| 4:00 PM to 11:59 PM | 75 (11.8%) | 28 (4.1%) |
| Total | 633 (100.0%) | 683 (100.0%) |
Housing Occupancy in King City
Occupancy by Ownership in King City
Of the total 2,696 dwellings in King City, owner-occupied units account for 2,117 (78.5%), while renter-occupied units make up 579 (21.5%).
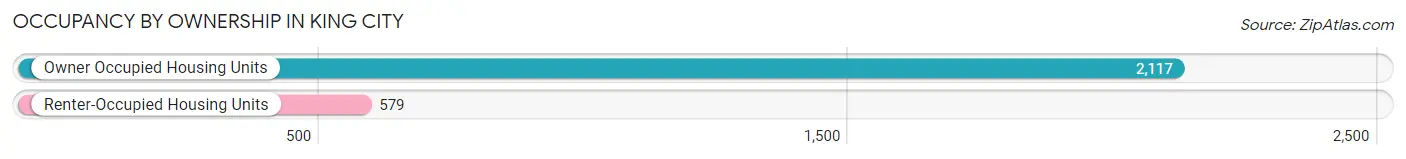
| Occupancy | # Housing Units | % Housing Units |
| Owner Occupied Housing Units | 2,117 | 78.5% |
| Renter-Occupied Housing Units | 579 | 21.5% |
| Total Occupied Housing Units | 2,696 | 100.0% |
Occupancy by Household Size in King City
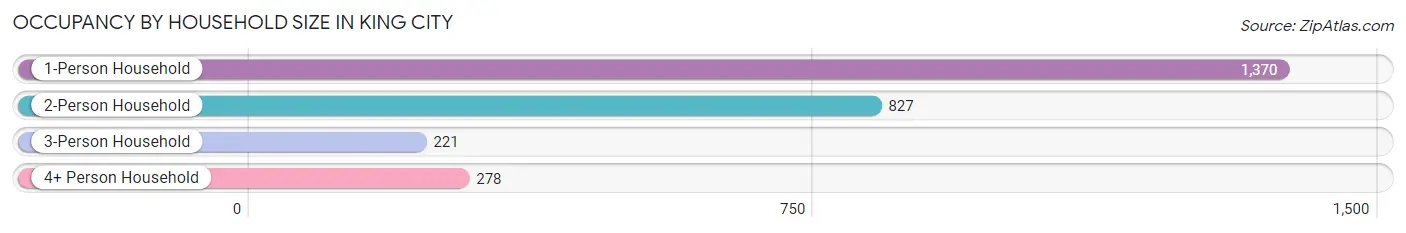
| Household Size | # Housing Units | % Housing Units |
| 1-Person Household | 1,370 | 50.8% |
| 2-Person Household | 827 | 30.7% |
| 3-Person Household | 221 | 8.2% |
| 4+ Person Household | 278 | 10.3% |
| Total Housing Units | 2,696 | 100.0% |
Occupancy by Ownership by Household Size in King City
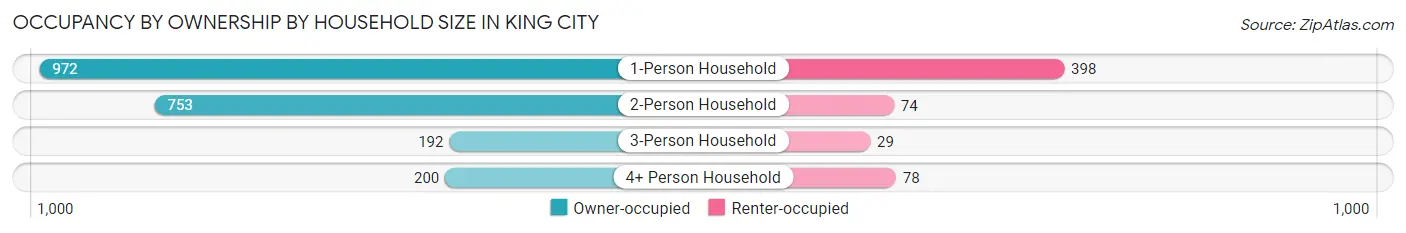
| Household Size | Owner-occupied | Renter-occupied |
| 1-Person Household | 972 (71.0%) | 398 (29.0%) |
| 2-Person Household | 753 (91.0%) | 74 (8.9%) |
| 3-Person Household | 192 (86.9%) | 29 (13.1%) |
| 4+ Person Household | 200 (71.9%) | 78 (28.1%) |
| Total Housing Units | 2,117 (78.5%) | 579 (21.5%) |
Occupancy by Educational Attainment in King City
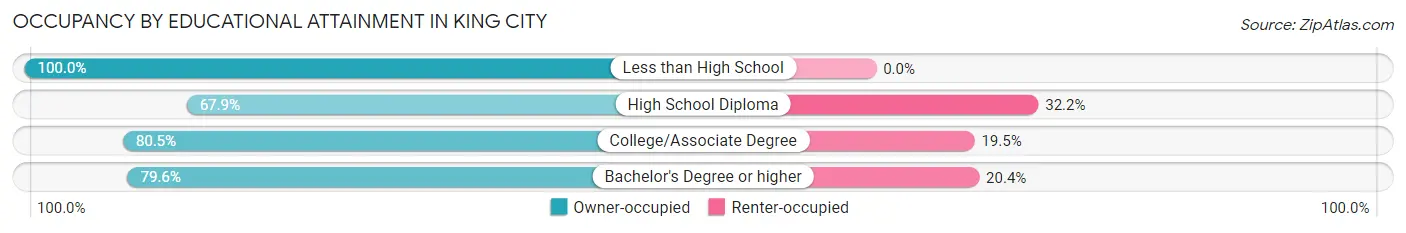
| Household Size | Owner-occupied | Renter-occupied |
| Less than High School | 91 (100.0%) | 0 (0.0%) |
| High School Diploma | 325 (67.8%) | 154 (32.2%) |
| College/Associate Degree | 789 (80.5%) | 191 (19.5%) |
| Bachelor's Degree or higher | 912 (79.6%) | 234 (20.4%) |
Occupancy by Age of Householder in King City
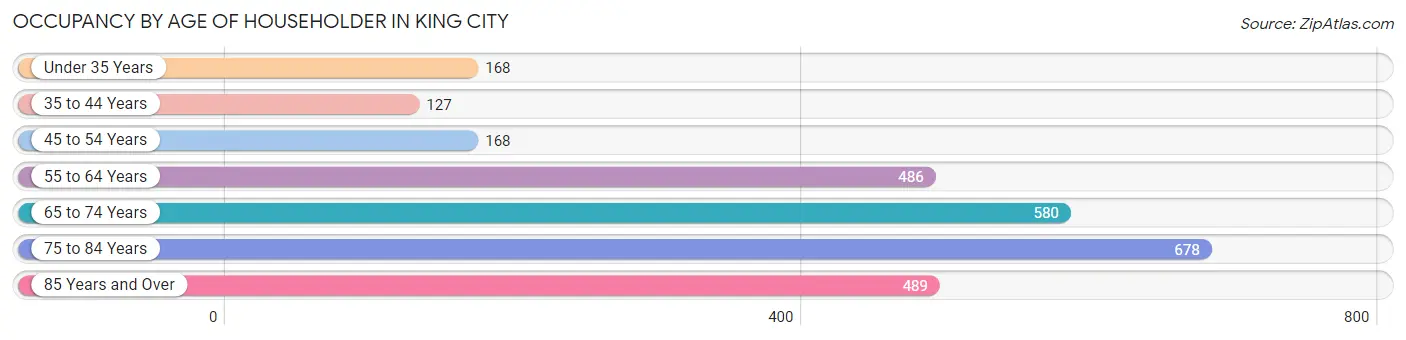
| Age Bracket | # Households | % Households |
| Under 35 Years | 168 | 6.2% |
| 35 to 44 Years | 127 | 4.7% |
| 45 to 54 Years | 168 | 6.2% |
| 55 to 64 Years | 486 | 18.0% |
| 65 to 74 Years | 580 | 21.5% |
| 75 to 84 Years | 678 | 25.2% |
| 85 Years and Over | 489 | 18.1% |
| Total | 2,696 | 100.0% |
Housing Finances in King City
Median Income by Occupancy in King City
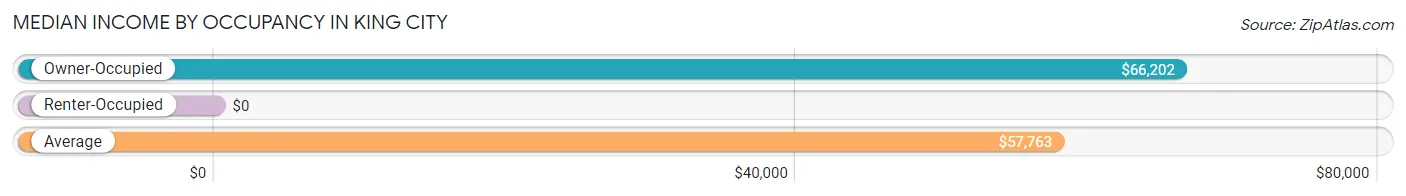
| Occupancy Type | # Households | Median Income |
| Owner-Occupied | 2,117 (78.5%) | $66,202 |
| Renter-Occupied | 579 (21.5%) | $0 |
| Average | 2,696 (100.0%) | $57,763 |
Occupancy by Householder Income Bracket in King City
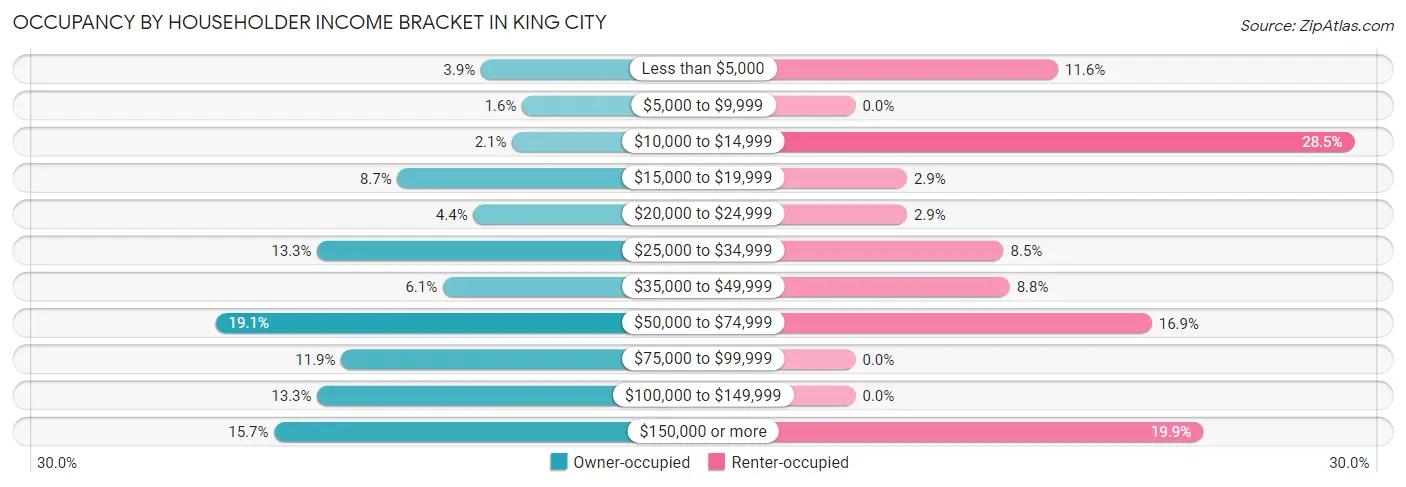
| Income Bracket | Owner-occupied | Renter-occupied |
| Less than $5,000 | 83 (3.9%) | 67 (11.6%) |
| $5,000 to $9,999 | 33 (1.6%) | 0 (0.0%) |
| $10,000 to $14,999 | 45 (2.1%) | 165 (28.5%) |
| $15,000 to $19,999 | 184 (8.7%) | 17 (2.9%) |
| $20,000 to $24,999 | 92 (4.3%) | 17 (2.9%) |
| $25,000 to $34,999 | 281 (13.3%) | 49 (8.5%) |
| $35,000 to $49,999 | 129 (6.1%) | 51 (8.8%) |
| $50,000 to $74,999 | 404 (19.1%) | 98 (16.9%) |
| $75,000 to $99,999 | 252 (11.9%) | 0 (0.0%) |
| $100,000 to $149,999 | 281 (13.3%) | 0 (0.0%) |
| $150,000 or more | 333 (15.7%) | 115 (19.9%) |
| Total | 2,117 (100.0%) | 579 (100.0%) |
Monthly Housing Cost Tiers in King City
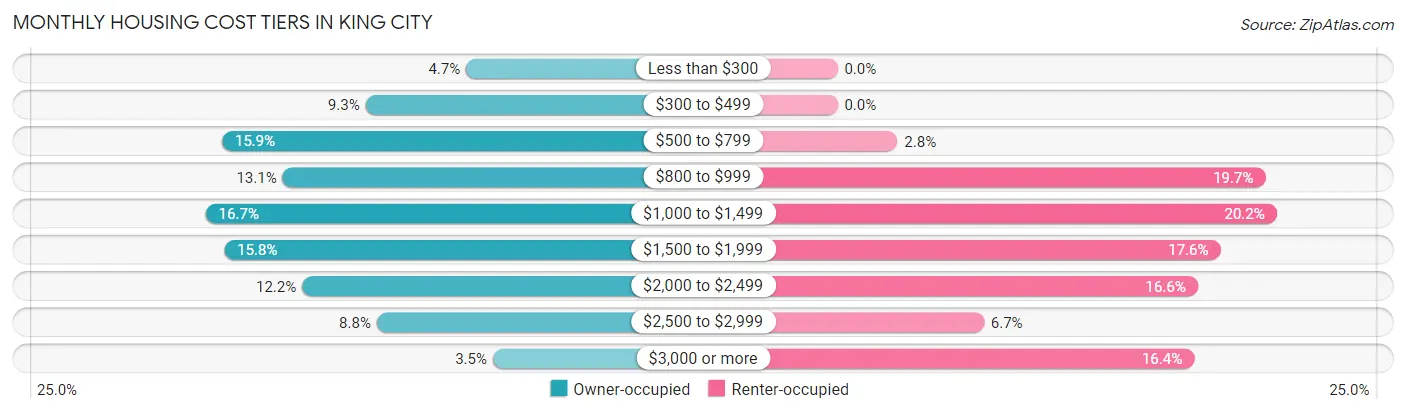
| Monthly Cost | Owner-occupied | Renter-occupied |
| Less than $300 | 99 (4.7%) | 0 (0.0%) |
| $300 to $499 | 197 (9.3%) | 0 (0.0%) |
| $500 to $799 | 337 (15.9%) | 16 (2.8%) |
| $800 to $999 | 278 (13.1%) | 114 (19.7%) |
| $1,000 to $1,499 | 353 (16.7%) | 117 (20.2%) |
| $1,500 to $1,999 | 335 (15.8%) | 102 (17.6%) |
| $2,000 to $2,499 | 259 (12.2%) | 96 (16.6%) |
| $2,500 to $2,999 | 186 (8.8%) | 39 (6.7%) |
| $3,000 or more | 73 (3.5%) | 95 (16.4%) |
| Total | 2,117 (100.0%) | 579 (100.0%) |
Physical Housing Characteristics in King City
Housing Structures in King City
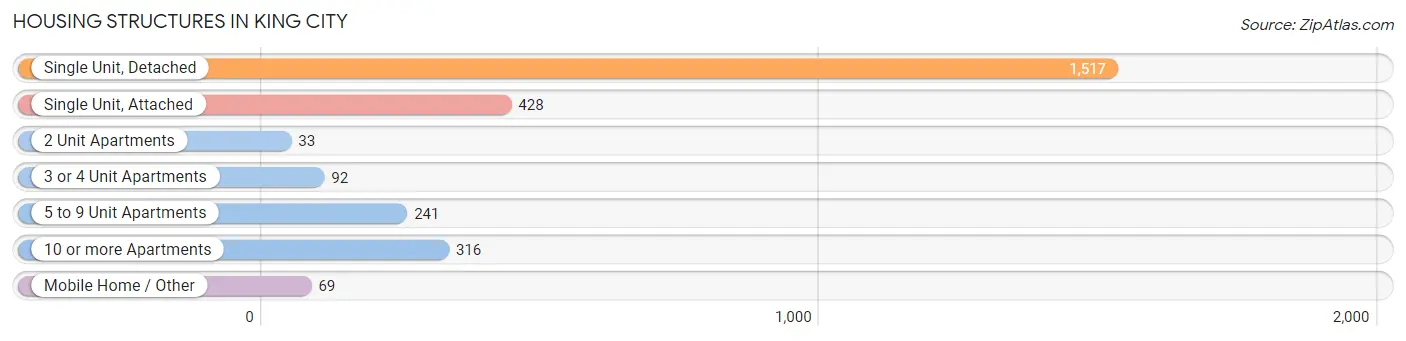
| Structure Type | # Housing Units | % Housing Units |
| Single Unit, Detached | 1,517 | 56.3% |
| Single Unit, Attached | 428 | 15.9% |
| 2 Unit Apartments | 33 | 1.2% |
| 3 or 4 Unit Apartments | 92 | 3.4% |
| 5 to 9 Unit Apartments | 241 | 8.9% |
| 10 or more Apartments | 316 | 11.7% |
| Mobile Home / Other | 69 | 2.6% |
| Total | 2,696 | 100.0% |
Housing Structures by Occupancy in King City
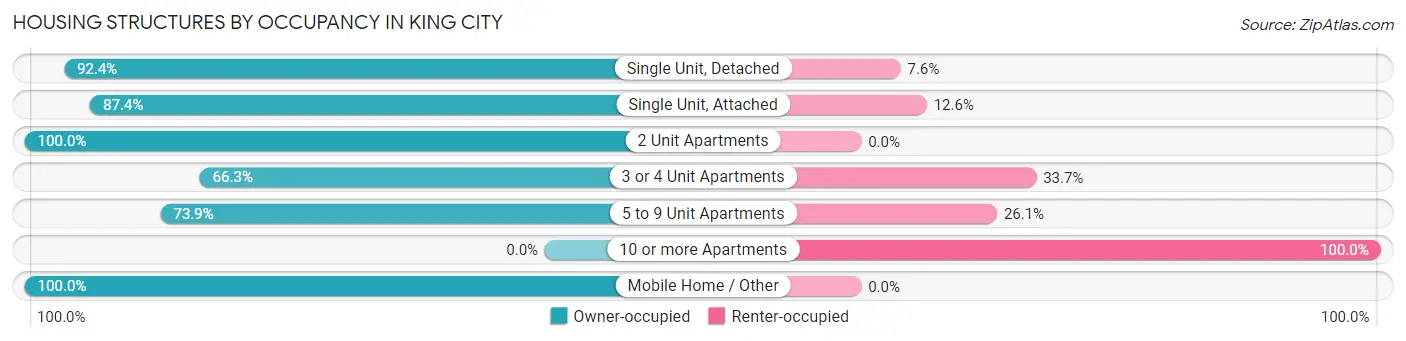
| Structure Type | Owner-occupied | Renter-occupied |
| Single Unit, Detached | 1,402 (92.4%) | 115 (7.6%) |
| Single Unit, Attached | 374 (87.4%) | 54 (12.6%) |
| 2 Unit Apartments | 33 (100.0%) | 0 (0.0%) |
| 3 or 4 Unit Apartments | 61 (66.3%) | 31 (33.7%) |
| 5 to 9 Unit Apartments | 178 (73.9%) | 63 (26.1%) |
| 10 or more Apartments | 0 (0.0%) | 316 (100.0%) |
| Mobile Home / Other | 69 (100.0%) | 0 (0.0%) |
| Total | 2,117 (78.5%) | 579 (21.5%) |
Housing Structures by Number of Rooms in King City
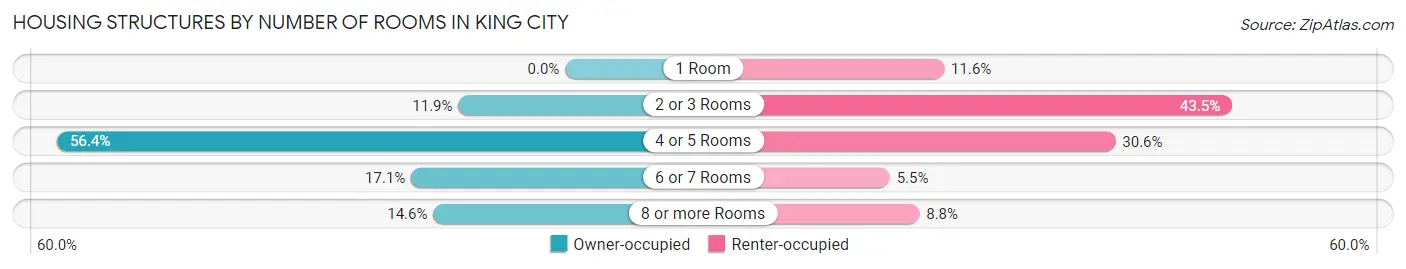
| Number of Rooms | Owner-occupied | Renter-occupied |
| 1 Room | 0 (0.0%) | 67 (11.6%) |
| 2 or 3 Rooms | 251 (11.9%) | 252 (43.5%) |
| 4 or 5 Rooms | 1,194 (56.4%) | 177 (30.6%) |
| 6 or 7 Rooms | 362 (17.1%) | 32 (5.5%) |
| 8 or more Rooms | 310 (14.6%) | 51 (8.8%) |
| Total | 2,117 (100.0%) | 579 (100.0%) |
Housing Structure by Heating Type in King City
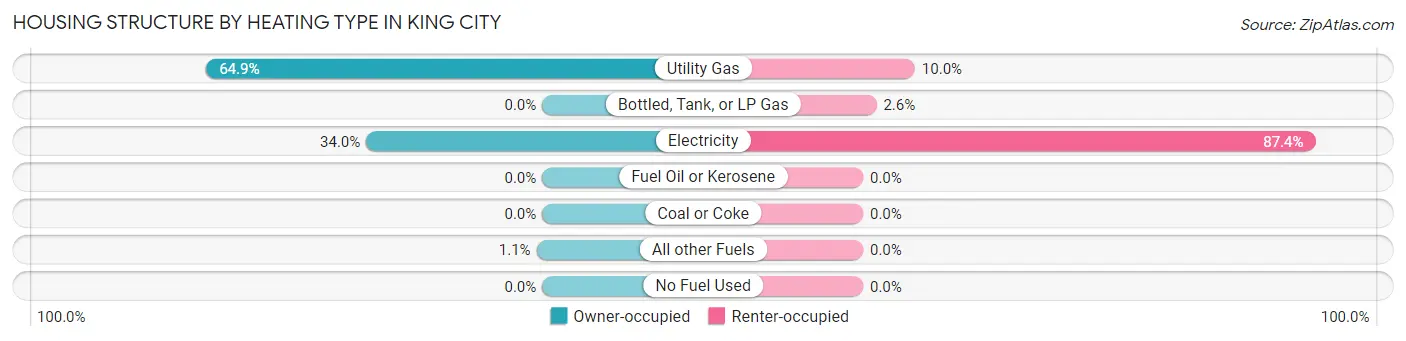
| Heating Type | Owner-occupied | Renter-occupied |
| Utility Gas | 1,374 (64.9%) | 58 (10.0%) |
| Bottled, Tank, or LP Gas | 0 (0.0%) | 15 (2.6%) |
| Electricity | 720 (34.0%) | 506 (87.4%) |
| Fuel Oil or Kerosene | 0 (0.0%) | 0 (0.0%) |
| Coal or Coke | 0 (0.0%) | 0 (0.0%) |
| All other Fuels | 23 (1.1%) | 0 (0.0%) |
| No Fuel Used | 0 (0.0%) | 0 (0.0%) |
| Total | 2,117 (100.0%) | 579 (100.0%) |
Household Vehicle Usage in King City
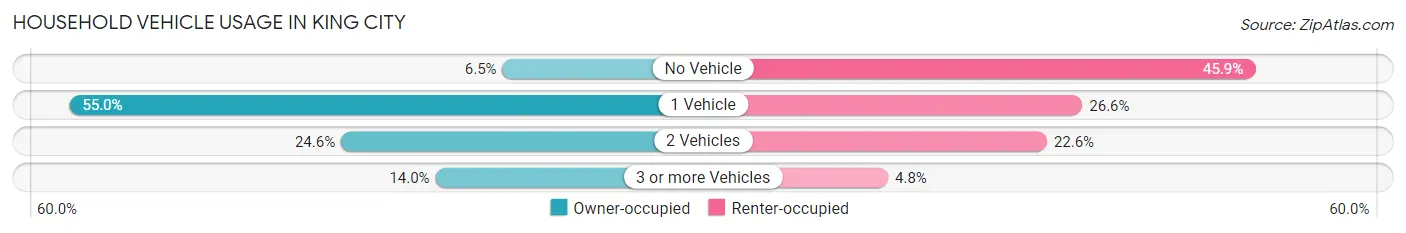
| Vehicles per Household | Owner-occupied | Renter-occupied |
| No Vehicle | 137 (6.5%) | 266 (45.9%) |
| 1 Vehicle | 1,164 (55.0%) | 154 (26.6%) |
| 2 Vehicles | 520 (24.6%) | 131 (22.6%) |
| 3 or more Vehicles | 296 (14.0%) | 28 (4.8%) |
| Total | 2,117 (100.0%) | 579 (100.0%) |
Real Estate & Mortgages in King City
Real Estate and Mortgage Overview in King City
| Characteristic | Without Mortgage | With Mortgage |
| Housing Units | 706 | 1,411 |
| Median Property Value | $356,800 | $384,400 |
| Median Household Income | $50,486 | $232 |
| Monthly Housing Costs | $572 | $73 |
| Real Estate Taxes | $2,945 | $56 |
Property Value by Mortgage Status in King City
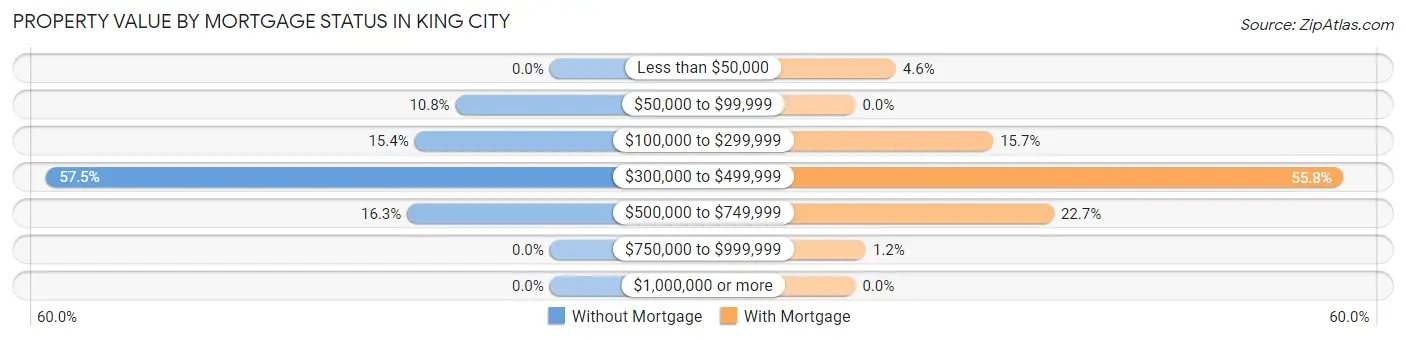
| Property Value | Without Mortgage | With Mortgage |
| Less than $50,000 | 0 (0.0%) | 65 (4.6%) |
| $50,000 to $99,999 | 76 (10.8%) | 0 (0.0%) |
| $100,000 to $299,999 | 109 (15.4%) | 222 (15.7%) |
| $300,000 to $499,999 | 406 (57.5%) | 787 (55.8%) |
| $500,000 to $749,999 | 115 (16.3%) | 320 (22.7%) |
| $750,000 to $999,999 | 0 (0.0%) | 17 (1.2%) |
| $1,000,000 or more | 0 (0.0%) | 0 (0.0%) |
| Total | 706 (100.0%) | 1,411 (100.0%) |
Household Income by Mortgage Status in King City
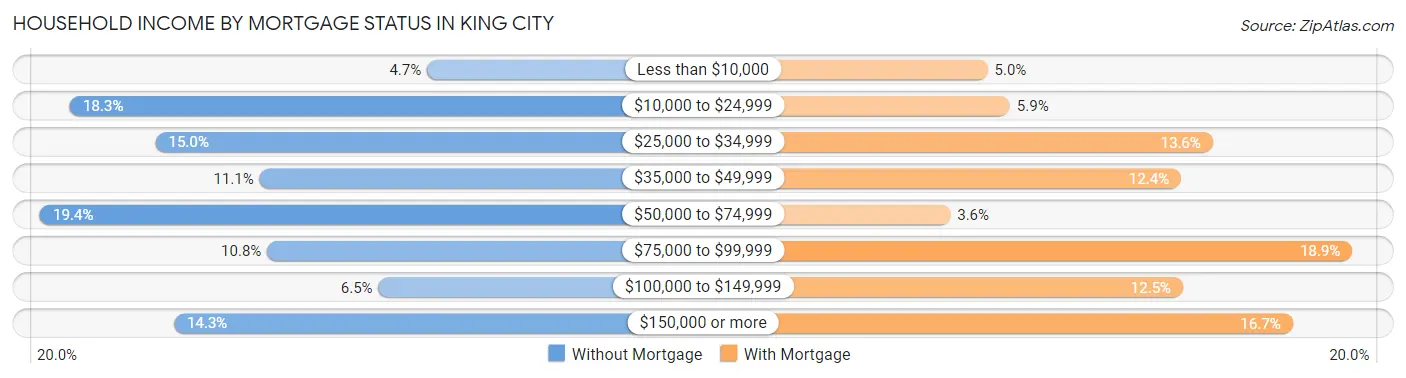
| Household Income | Without Mortgage | With Mortgage |
| Less than $10,000 | 33 (4.7%) | 71 (5.0%) |
| $10,000 to $24,999 | 129 (18.3%) | 83 (5.9%) |
| $25,000 to $34,999 | 106 (15.0%) | 192 (13.6%) |
| $35,000 to $49,999 | 78 (11.1%) | 175 (12.4%) |
| $50,000 to $74,999 | 137 (19.4%) | 51 (3.6%) |
| $75,000 to $99,999 | 76 (10.8%) | 267 (18.9%) |
| $100,000 to $149,999 | 46 (6.5%) | 176 (12.5%) |
| $150,000 or more | 101 (14.3%) | 235 (16.7%) |
| Total | 706 (100.0%) | 1,411 (100.0%) |
Property Value to Household Income Ratio in King City
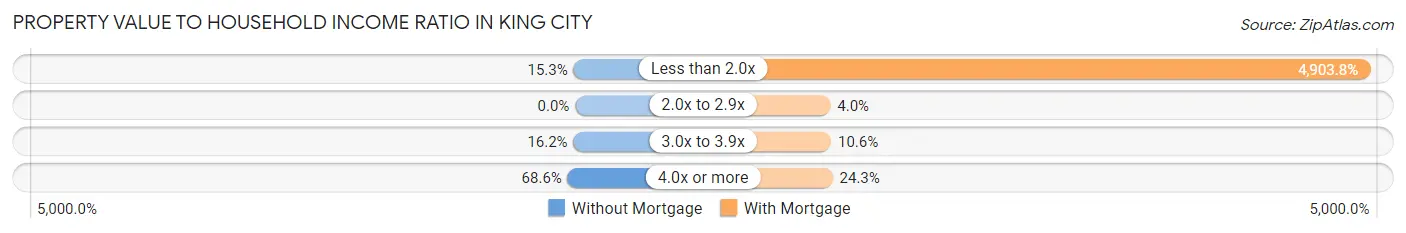
| Value-to-Income Ratio | Without Mortgage | With Mortgage |
| Less than 2.0x | 108 (15.3%) | 69,193 (4,903.8%) |
| 2.0x to 2.9x | 0 (0.0%) | 56 (4.0%) |
| 3.0x to 3.9x | 114 (16.2%) | 150 (10.6%) |
| 4.0x or more | 484 (68.6%) | 343 (24.3%) |
| Total | 706 (100.0%) | 1,411 (100.0%) |
Real Estate Taxes by Mortgage Status in King City
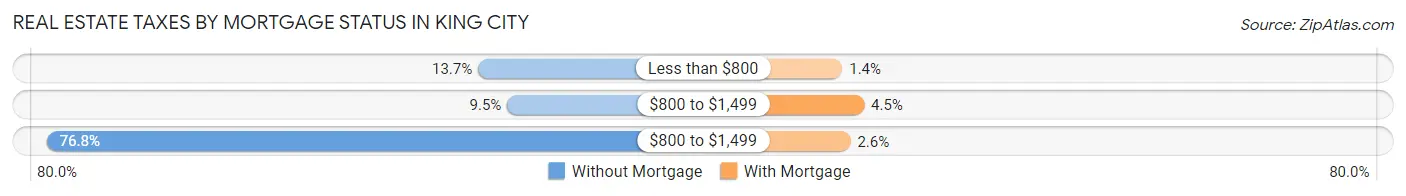
| Property Taxes | Without Mortgage | With Mortgage |
| Less than $800 | 97 (13.7%) | 19 (1.3%) |
| $800 to $1,499 | 67 (9.5%) | 64 (4.5%) |
| $800 to $1,499 | 542 (76.8%) | 36 (2.5%) |
| Total | 706 (100.0%) | 1,411 (100.0%) |
Health & Disability in King City
Health Insurance Coverage by Age in King City
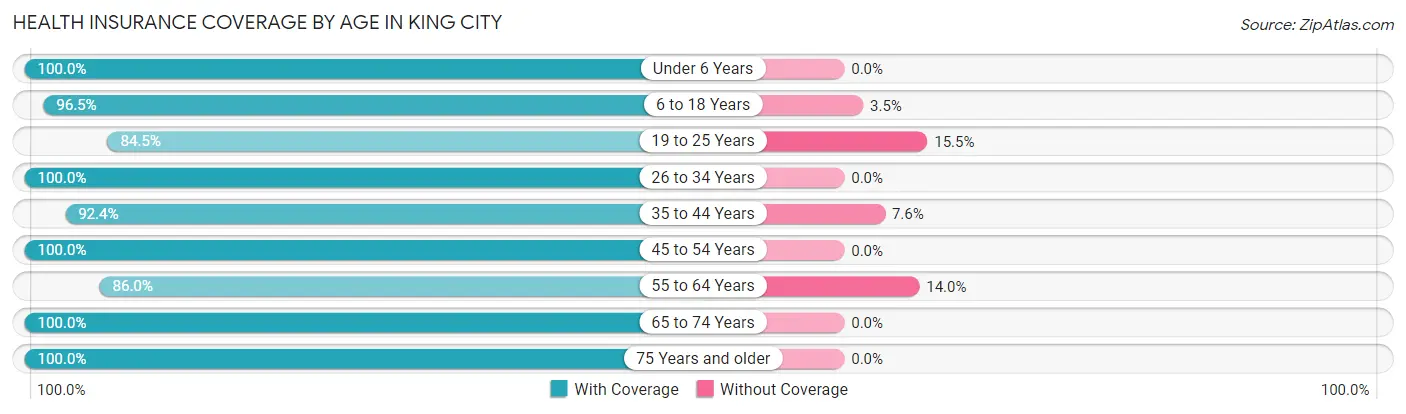
| Age Bracket | With Coverage | Without Coverage |
| Under 6 Years | 226 (100.0%) | 0 (0.0%) |
| 6 to 18 Years | 385 (96.5%) | 14 (3.5%) |
| 19 to 25 Years | 142 (84.5%) | 26 (15.5%) |
| 26 to 34 Years | 414 (100.0%) | 0 (0.0%) |
| 35 to 44 Years | 244 (92.4%) | 20 (7.6%) |
| 45 to 54 Years | 478 (100.0%) | 0 (0.0%) |
| 55 to 64 Years | 615 (86.0%) | 100 (14.0%) |
| 65 to 74 Years | 854 (100.0%) | 0 (0.0%) |
| 75 Years and older | 1,466 (100.0%) | 0 (0.0%) |
| Total | 4,824 (96.8%) | 160 (3.2%) |
Health Insurance Coverage by Citizenship Status in King City
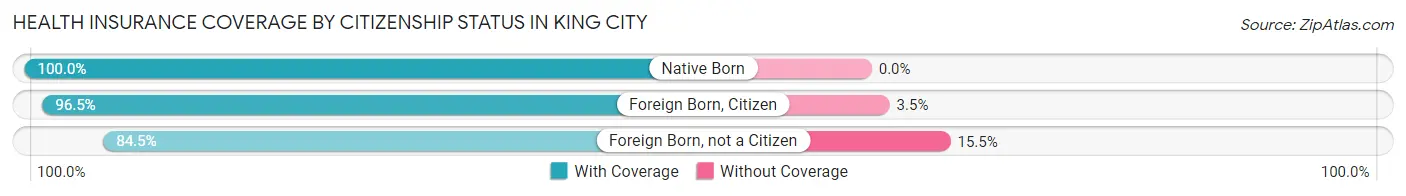
| Citizenship Status | With Coverage | Without Coverage |
| Native Born | 226 (100.0%) | 0 (0.0%) |
| Foreign Born, Citizen | 385 (96.5%) | 14 (3.5%) |
| Foreign Born, not a Citizen | 142 (84.5%) | 26 (15.5%) |
Health Insurance Coverage by Household Income in King City
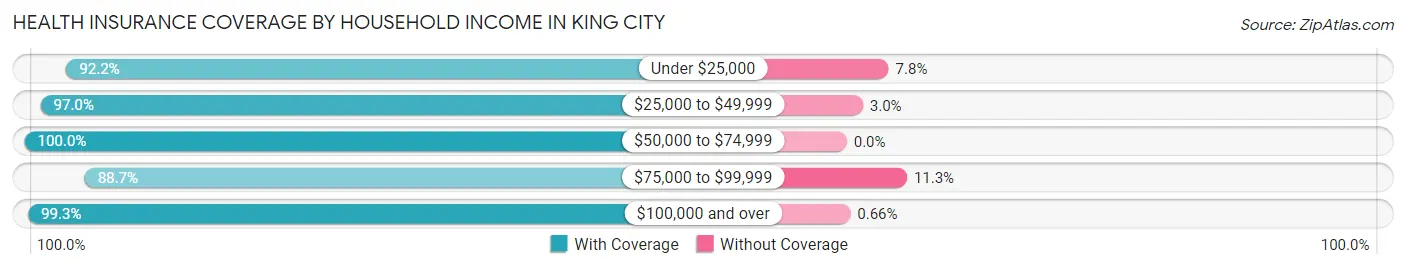
| Household Income | With Coverage | Without Coverage |
| Under $25,000 | 752 (92.2%) | 64 (7.8%) |
| $25,000 to $49,999 | 581 (97.0%) | 18 (3.0%) |
| $50,000 to $74,999 | 871 (100.0%) | 0 (0.0%) |
| $75,000 to $99,999 | 496 (88.7%) | 63 (11.3%) |
| $100,000 and over | 2,122 (99.3%) | 14 (0.7%) |
Public vs Private Health Insurance Coverage by Age in King City
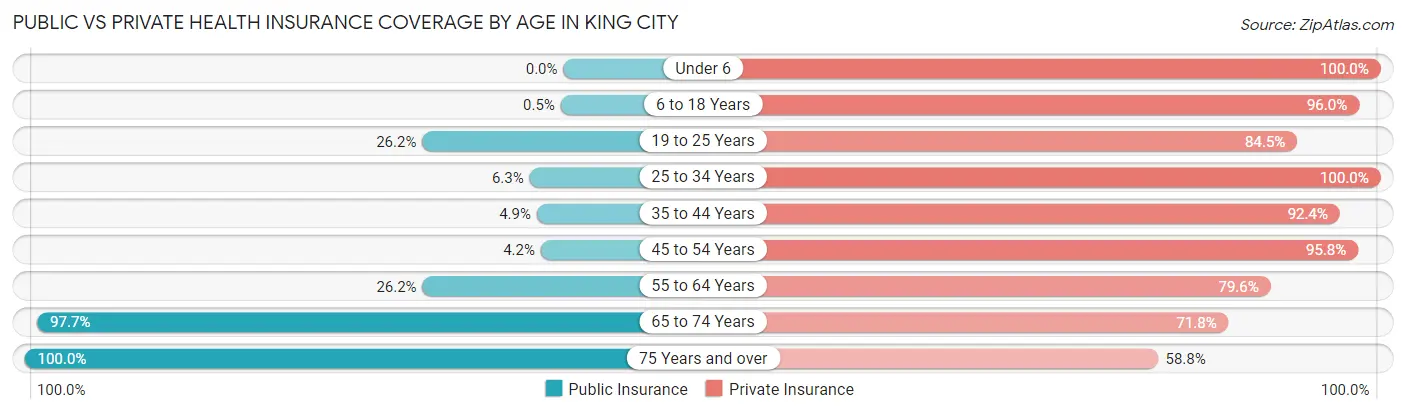
| Age Bracket | Public Insurance | Private Insurance |
| Under 6 | 0 (0.0%) | 226 (100.0%) |
| 6 to 18 Years | 2 (0.5%) | 383 (96.0%) |
| 19 to 25 Years | 44 (26.2%) | 142 (84.5%) |
| 25 to 34 Years | 26 (6.3%) | 414 (100.0%) |
| 35 to 44 Years | 13 (4.9%) | 244 (92.4%) |
| 45 to 54 Years | 20 (4.2%) | 458 (95.8%) |
| 55 to 64 Years | 187 (26.2%) | 569 (79.6%) |
| 65 to 74 Years | 834 (97.7%) | 613 (71.8%) |
| 75 Years and over | 1,466 (100.0%) | 862 (58.8%) |
| Total | 2,592 (52.0%) | 3,911 (78.5%) |
Disability Status by Sex by Age in King City
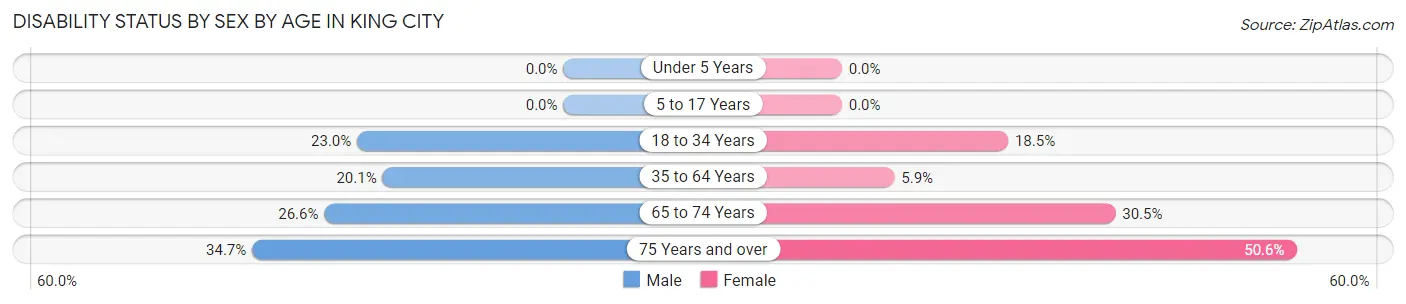
| Age Bracket | Male | Female |
| Under 5 Years | 0 (0.0%) | 0 (0.0%) |
| 5 to 17 Years | 0 (0.0%) | 0 (0.0%) |
| 18 to 34 Years | 68 (23.0%) | 57 (18.5%) |
| 35 to 64 Years | 142 (20.1%) | 44 (5.9%) |
| 65 to 74 Years | 70 (26.6%) | 180 (30.5%) |
| 75 Years and over | 139 (34.7%) | 539 (50.6%) |
Disability Class by Sex by Age in King City
Disability Class: Hearing Difficulty
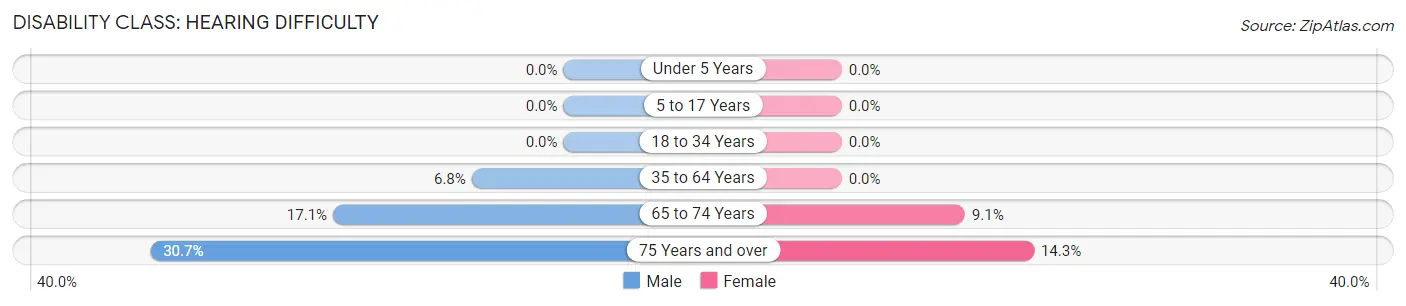
| Age Bracket | Male | Female |
| Under 5 Years | 0 (0.0%) | 0 (0.0%) |
| 5 to 17 Years | 0 (0.0%) | 0 (0.0%) |
| 18 to 34 Years | 0 (0.0%) | 0 (0.0%) |
| 35 to 64 Years | 48 (6.8%) | 0 (0.0%) |
| 65 to 74 Years | 45 (17.1%) | 54 (9.1%) |
| 75 Years and over | 123 (30.7%) | 152 (14.3%) |
Disability Class: Vision Difficulty
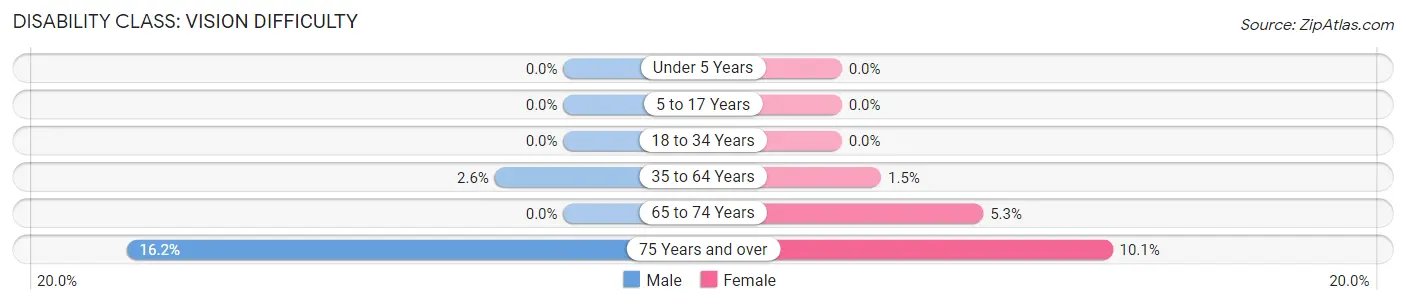
| Age Bracket | Male | Female |
| Under 5 Years | 0 (0.0%) | 0 (0.0%) |
| 5 to 17 Years | 0 (0.0%) | 0 (0.0%) |
| 18 to 34 Years | 0 (0.0%) | 0 (0.0%) |
| 35 to 64 Years | 18 (2.5%) | 11 (1.5%) |
| 65 to 74 Years | 0 (0.0%) | 31 (5.2%) |
| 75 Years and over | 65 (16.2%) | 107 (10.1%) |
Disability Class: Cognitive Difficulty
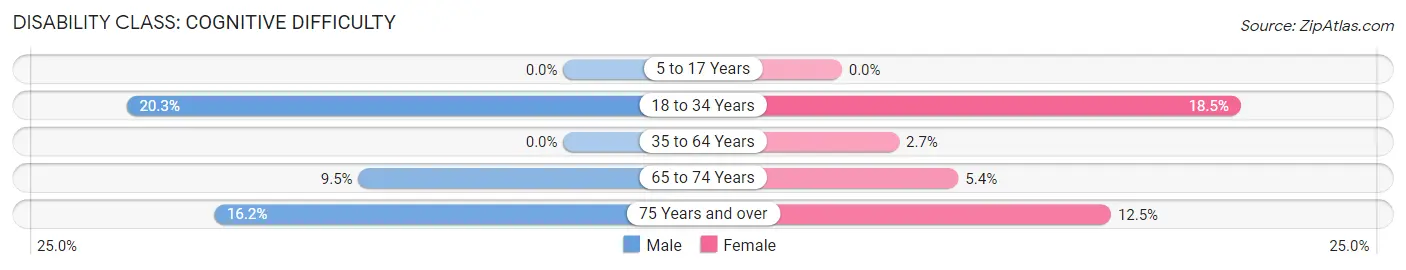
| Age Bracket | Male | Female |
| 5 to 17 Years | 0 (0.0%) | 0 (0.0%) |
| 18 to 34 Years | 60 (20.3%) | 57 (18.5%) |
| 35 to 64 Years | 0 (0.0%) | 20 (2.7%) |
| 65 to 74 Years | 25 (9.5%) | 32 (5.4%) |
| 75 Years and over | 65 (16.2%) | 133 (12.5%) |
Disability Class: Ambulatory Difficulty
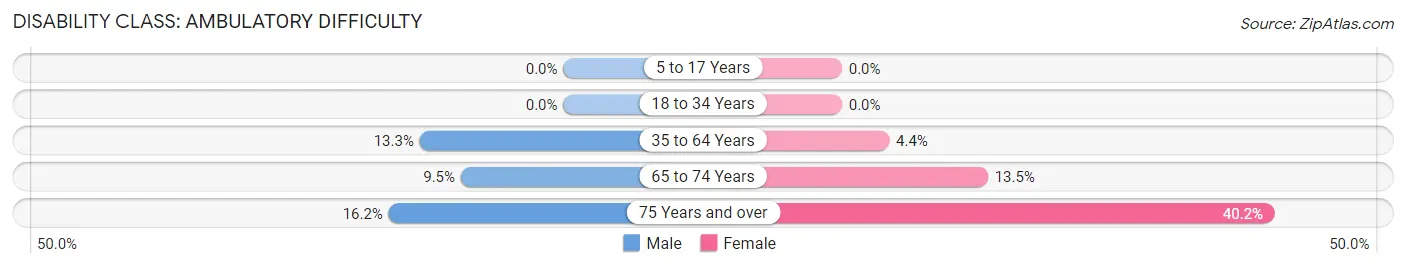
| Age Bracket | Male | Female |
| 5 to 17 Years | 0 (0.0%) | 0 (0.0%) |
| 18 to 34 Years | 0 (0.0%) | 0 (0.0%) |
| 35 to 64 Years | 94 (13.3%) | 33 (4.4%) |
| 65 to 74 Years | 25 (9.5%) | 80 (13.5%) |
| 75 Years and over | 65 (16.2%) | 428 (40.2%) |
Disability Class: Self-Care Difficulty
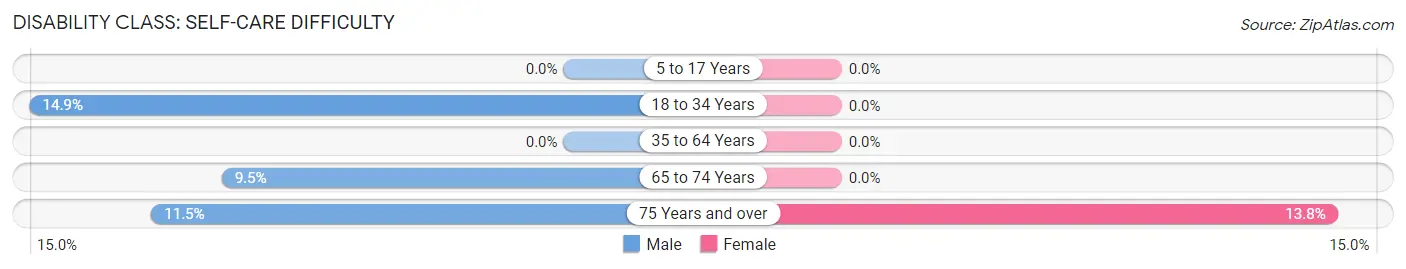
| Age Bracket | Male | Female |
| 5 to 17 Years | 0 (0.0%) | 0 (0.0%) |
| 18 to 34 Years | 44 (14.9%) | 0 (0.0%) |
| 35 to 64 Years | 0 (0.0%) | 0 (0.0%) |
| 65 to 74 Years | 25 (9.5%) | 0 (0.0%) |
| 75 Years and over | 46 (11.5%) | 147 (13.8%) |
Technology Access in King City
Computing Device Access in King City
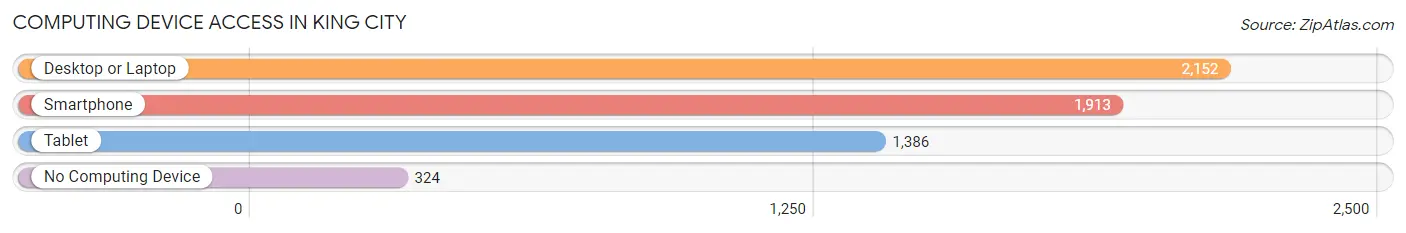
| Device Type | # Households | % Households |
| Desktop or Laptop | 2,152 | 79.8% |
| Smartphone | 1,913 | 71.0% |
| Tablet | 1,386 | 51.4% |
| No Computing Device | 324 | 12.0% |
| Total | 2,696 | 100.0% |
Internet Access in King City
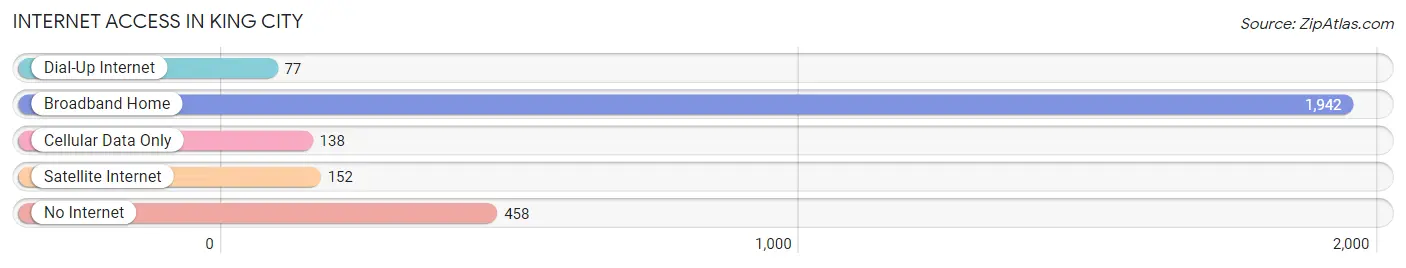
| Internet Type | # Households | % Households |
| Dial-Up Internet | 77 | 2.9% |
| Broadband Home | 1,942 | 72.0% |
| Cellular Data Only | 138 | 5.1% |
| Satellite Internet | 152 | 5.6% |
| No Internet | 458 | 17.0% |
| Total | 2,696 | 100.0% |
King City Summary
King City is a small unincorporated community located in Washington County, Oregon, United States. It is situated in the Tualatin Valley, approximately 20 miles southwest of Portland. The population of King City was estimated to be 1,945 in 2019.
History
The area that is now King City was first settled in the late 1800s by a group of German immigrants. The town was originally called German Town, but was later renamed King City in honor of the first postmaster, William King. The town was officially incorporated in 1951.
Geography
King City is located in the Tualatin Valley, approximately 20 miles southwest of Portland. The city is situated on the banks of the Tualatin River, which flows through the city. The city is surrounded by rolling hills and is home to several parks and recreational areas.
Climate
King City has a temperate climate, with mild winters and warm summers. The average annual temperature is around 50°F (10°C). The average annual precipitation is around 40 inches (101 cm).
Economy
King City’s economy is largely based on agriculture and light manufacturing. The city is home to several small businesses, including a winery, a brewery, and a distillery. The city is also home to several large employers, including Intel, Nike, and Tektronix.
Demographics
As of 2019, the population of King City was estimated to be 1,945. The racial makeup of the city was 87.3% White, 4.2% Hispanic or Latino, 2.2% Asian, and 1.2% African American. The median household income was $63,917, and the median home value was $360,000.
Conclusion
King City is a small unincorporated community located in Washington County, Oregon. It is situated in the Tualatin Valley, approximately 20 miles southwest of Portland. The population of King City was estimated to be 1,945 in 2019. The city’s economy is largely based on agriculture and light manufacturing, and it is home to several large employers. The racial makeup of the city was 87.3% White, 4.2% Hispanic or Latino, 2.2% Asian, and 1.2% African American. The median household income was $63,917, and the median home value was $360,000.
Common Questions
What is Per Capita Income in King City?
Per Capita income in King City is $44,090.
What is the Median Family Income in King City?
Median Family Income in King City is $94,536.
What is the Median Household income in King City?
Median Household Income in King City is $57,763.
What is Income or Wage Gap in King City?
Income or Wage Gap in King City is 34.0%.
Women in King City earn 66.0 cents for every dollar earned by a man.
What is Family Income Deficit in King City?
Family Income Deficit in King City is $18,531.
Families that are below poverty line in King City earn $18,531 less on average than the poverty threshold level.
What is Inequality or Gini Index in King City?
Inequality or Gini Index in King City is 0.52.
What is the Total Population of King City?
Total Population of King City is 5,063.
What is the Total Male Population of King City?
Total Male Population of King City is 1,991.
What is the Total Female Population of King City?
Total Female Population of King City is 3,072.
What is the Ratio of Males per 100 Females in King City?
There are 64.81 Males per 100 Females in King City.
What is the Ratio of Females per 100 Males in King City?
There are 154.29 Females per 100 Males in King City.
What is the Median Population Age in King City?
Median Population Age in King City is 63.1 Years.
What is the Average Family Size in King City
Average Family Size in King City is 2.7 People.
What is the Average Household Size in King City
Average Household Size in King City is 1.9 People.
How Large is the Labor Force in King City?
There are 1,821 People in the Labor Forcein in King City.
What is the Percentage of People in the Labor Force in King City?
40.1% of People are in the Labor Force in King City.
What is the Unemployment Rate in King City?
Unemployment Rate in King City is 4.0%.