Herriman, UT Map & Demographics
Herriman Map
Herriman Overview
$37,331
PER CAPITA INCOME
$124,052
AVG FAMILY INCOME
$115,198
AVG HOUSEHOLD INCOME
51.8%
WAGE / INCOME GAP [ % ]
48.2¢/ $1
WAGE / INCOME GAP [ $ ]
$11,849
FAMILY INCOME DEFICIT
0.34
INEQUALITY / GINI INDEX
55,301
TOTAL POPULATION
27,246
MALE POPULATION
28,055
FEMALE POPULATION
97.12
MALES / 100 FEMALES
102.97
FEMALES / 100 MALES
28.4
MEDIAN AGE
3.8
AVG FAMILY SIZE
3.4
AVG HOUSEHOLD SIZE
28,263
LABOR FORCE [ PEOPLE ]
75.9%
PERCENT IN LABOR FORCE
3.2%
UNEMPLOYMENT RATE
Herriman Zip Codes
Income in Herriman
Income Overview in Herriman
Per Capita Income in Herriman is $37,331, while median incomes of families and households are $124,052 and $115,198 respectively.
| Characteristic | Number | Measure |
| Per Capita Income | 55,301 | $37,331 |
| Median Family Income | 13,324 | $124,052 |
| Mean Family Income | 13,324 | $136,008 |
| Median Household Income | 16,075 | $115,198 |
| Mean Household Income | 16,075 | $126,420 |
| Income Deficit | 13,324 | $11,849 |
| Wage / Income Gap (%) | 55,301 | 51.84% |
| Wage / Income Gap ($) | 55,301 | 48.16¢ per $1 |
| Gini / Inequality Index | 55,301 | 0.34 |
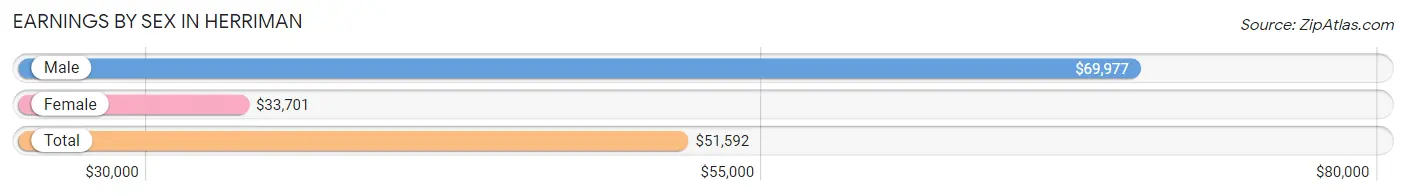
Earnings by Sex in Herriman
Average Earnings in Herriman are $51,592, $69,977 for men and $33,701 for women, a difference of 51.8%.
| Sex | Number | Average Earnings |
| Male | 15,587 (52.6%) | $69,977 |
| Female | 14,061 (47.4%) | $33,701 |
| Total | 29,648 (100.0%) | $51,592 |
Earnings by Sex by Income Bracket in Herriman
The most common earnings brackets in Herriman are $100,000+ for men (4,631 | 29.7%) and $50,000 to $54,999 for women (1,121 | 8.0%).
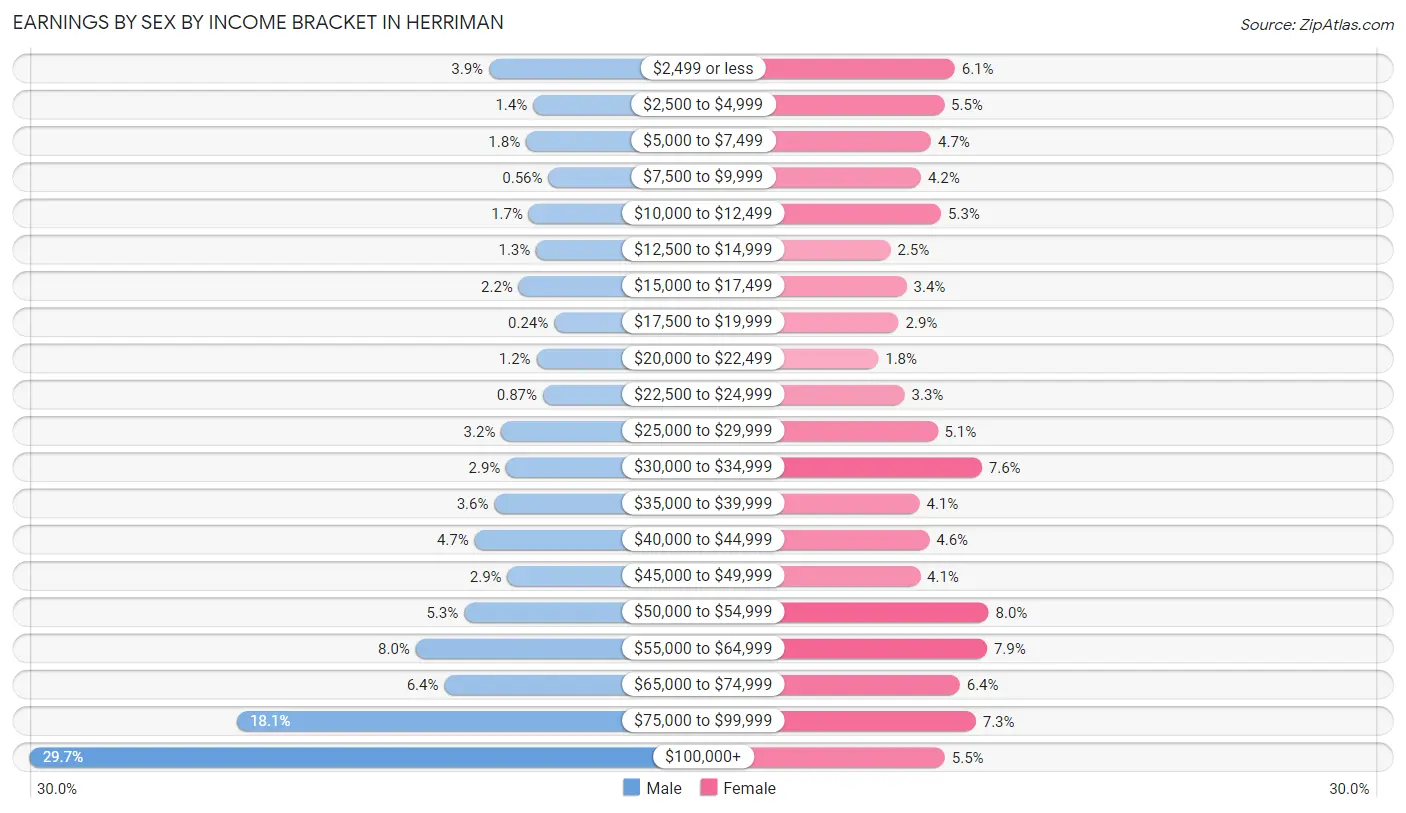
| Income | Male | Female |
| $2,499 or less | 608 (3.9%) | 853 (6.1%) |
| $2,500 to $4,999 | 222 (1.4%) | 769 (5.5%) |
| $5,000 to $7,499 | 284 (1.8%) | 666 (4.7%) |
| $7,500 to $9,999 | 88 (0.6%) | 586 (4.2%) |
| $10,000 to $12,499 | 258 (1.7%) | 745 (5.3%) |
| $12,500 to $14,999 | 195 (1.3%) | 346 (2.5%) |
| $15,000 to $17,499 | 348 (2.2%) | 472 (3.4%) |
| $17,500 to $19,999 | 38 (0.2%) | 409 (2.9%) |
| $20,000 to $22,499 | 192 (1.2%) | 249 (1.8%) |
| $22,500 to $24,999 | 135 (0.9%) | 457 (3.3%) |
| $25,000 to $29,999 | 500 (3.2%) | 717 (5.1%) |
| $30,000 to $34,999 | 457 (2.9%) | 1,067 (7.6%) |
| $35,000 to $39,999 | 561 (3.6%) | 575 (4.1%) |
| $40,000 to $44,999 | 734 (4.7%) | 653 (4.6%) |
| $45,000 to $49,999 | 446 (2.9%) | 580 (4.1%) |
| $50,000 to $54,999 | 826 (5.3%) | 1,121 (8.0%) |
| $55,000 to $64,999 | 1,250 (8.0%) | 1,108 (7.9%) |
| $65,000 to $74,999 | 999 (6.4%) | 893 (6.4%) |
| $75,000 to $99,999 | 2,815 (18.1%) | 1,020 (7.2%) |
| $100,000+ | 4,631 (29.7%) | 775 (5.5%) |
| Total | 15,587 (100.0%) | 14,061 (100.0%) |
Earnings by Sex by Educational Attainment in Herriman
Average earnings in Herriman are $82,007 for men and $40,741 for women, a difference of 50.3%. Men with an educational attainment of bachelor's degree enjoy the highest average annual earnings of $107,692, while those with less than high school education earn the least with $36,127. Women with an educational attainment of graduate degree earn the most with the average annual earnings of $70,077, while those with college or associate's degree education have the smallest earnings of $33,236.
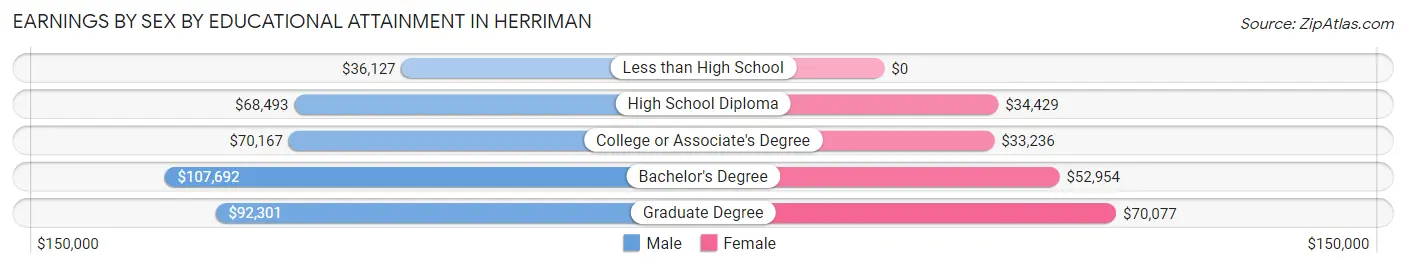
| Educational Attainment | Male Income | Female Income |
| Less than High School | $36,127 | $0 |
| High School Diploma | $68,493 | $34,429 |
| College or Associate's Degree | $70,167 | $33,236 |
| Bachelor's Degree | $107,692 | $52,954 |
| Graduate Degree | $92,301 | $70,077 |
| Total | $82,007 | $40,741 |
Family Income in Herriman
Family Income Brackets in Herriman
According to the Herriman family income data, there are 4,077 families falling into the $100,000 to $149,999 income range, which is the most common income bracket and makes up 30.6% of all families. Conversely, the $10,000 to $14,999 income bracket is the least frequent group with only 40 families (0.3%) belonging to this category.
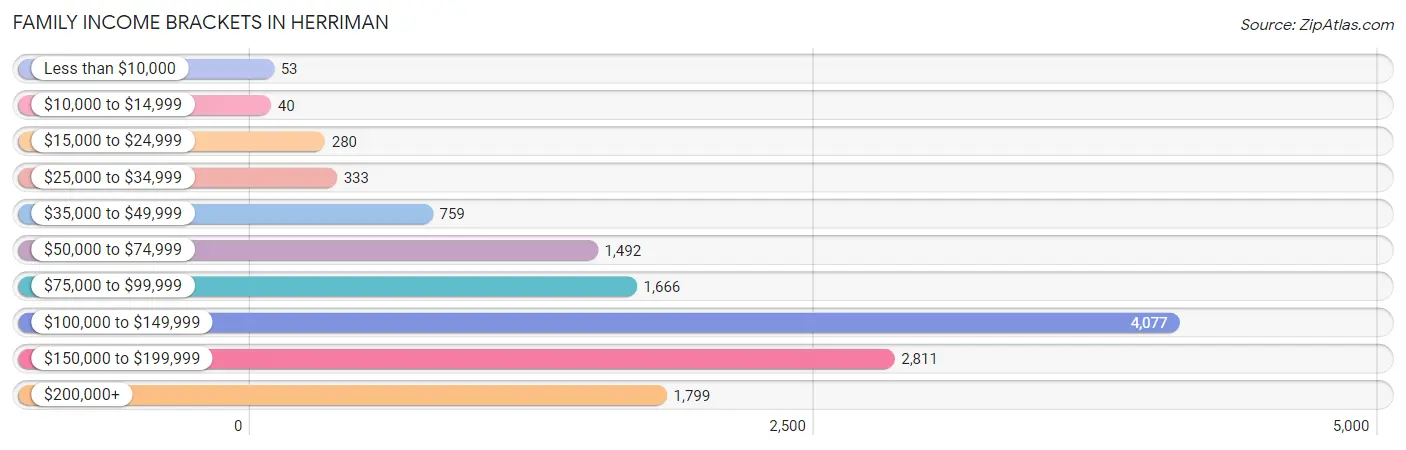
| Income Bracket | # Families | % Families |
| Less than $10,000 | 53 | 0.4% |
| $10,000 to $14,999 | 40 | 0.3% |
| $15,000 to $24,999 | 280 | 2.1% |
| $25,000 to $34,999 | 333 | 2.5% |
| $35,000 to $49,999 | 759 | 5.7% |
| $50,000 to $74,999 | 1,492 | 11.2% |
| $75,000 to $99,999 | 1,666 | 12.5% |
| $100,000 to $149,999 | 4,077 | 30.6% |
| $150,000 to $199,999 | 2,811 | 21.1% |
| $200,000+ | 1,799 | 13.5% |
Family Income by Famaliy Size in Herriman
7+ person families (779 | 5.9%) account for the highest median family income in Herriman with $167,745 per family, while 2-person families (3,603 | 27.0%) have the highest median income of $50,822 per family member.
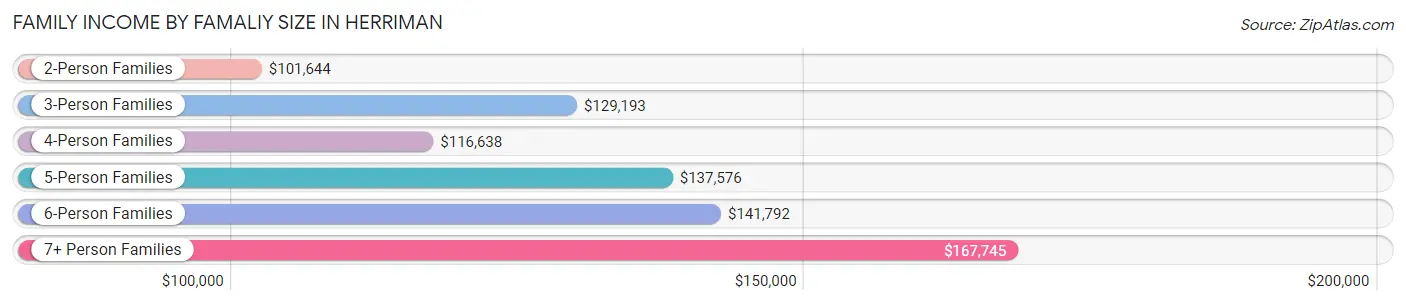
| Income Bracket | # Families | Median Income |
| 2-Person Families | 3,603 (27.0%) | $101,644 |
| 3-Person Families | 3,104 (23.3%) | $129,193 |
| 4-Person Families | 2,465 (18.5%) | $116,638 |
| 5-Person Families | 2,039 (15.3%) | $137,576 |
| 6-Person Families | 1,334 (10.0%) | $141,792 |
| 7+ Person Families | 779 (5.9%) | $167,745 |
| Total | 13,324 (100.0%) | $124,052 |
Family Income by Number of Earners in Herriman
The median family income in Herriman is $124,052, with families comprising 3+ earners (2,342) having the highest median family income of $165,351, while families with no earners (440) have the lowest median family income of $60,658, accounting for 17.6% and 3.3% of families, respectively.
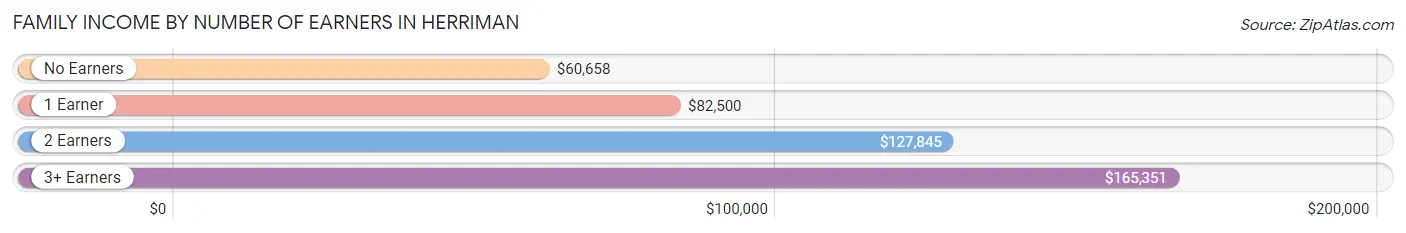
| Number of Earners | # Families | Median Income |
| No Earners | 440 (3.3%) | $60,658 |
| 1 Earner | 3,298 (24.7%) | $82,500 |
| 2 Earners | 7,244 (54.4%) | $127,845 |
| 3+ Earners | 2,342 (17.6%) | $165,351 |
| Total | 13,324 (100.0%) | $124,052 |
Household Income in Herriman
Household Income Brackets in Herriman
With 4,726 households falling in the category, the $100,000 to $149,999 income range is the most frequent in Herriman, accounting for 29.4% of all households. In contrast, only 48 households (0.3%) fall into the $10,000 to $14,999 income bracket, making it the least populous group.
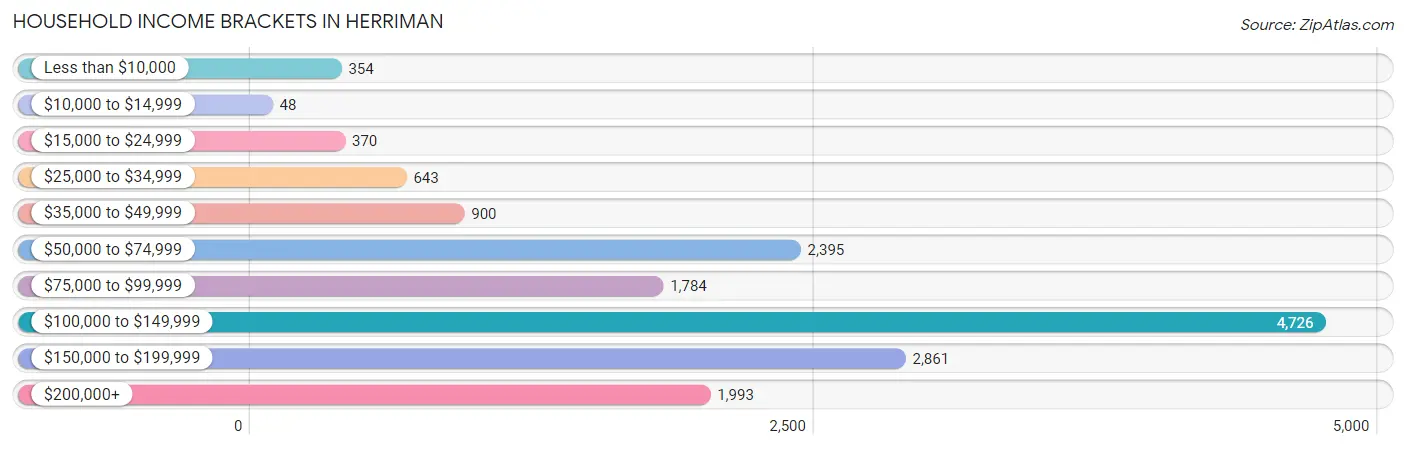
| Income Bracket | # Households | % Households |
| Less than $10,000 | 354 | 2.2% |
| $10,000 to $14,999 | 48 | 0.3% |
| $15,000 to $24,999 | 370 | 2.3% |
| $25,000 to $34,999 | 643 | 4.0% |
| $35,000 to $49,999 | 900 | 5.6% |
| $50,000 to $74,999 | 2,395 | 14.9% |
| $75,000 to $99,999 | 1,784 | 11.1% |
| $100,000 to $149,999 | 4,726 | 29.4% |
| $150,000 to $199,999 | 2,861 | 17.8% |
| $200,000+ | 1,993 | 12.4% |
Household Income by Householder Age in Herriman
The median household income in Herriman is $115,198, with the highest median household income of $145,483 found in the 45 to 64 years age bracket for the primary householder. A total of 5,037 households (31.3%) fall into this category. Meanwhile, the 15 to 24 years age bracket for the primary householder has the lowest median household income of $45,549, with 562 households (3.5%) in this group.
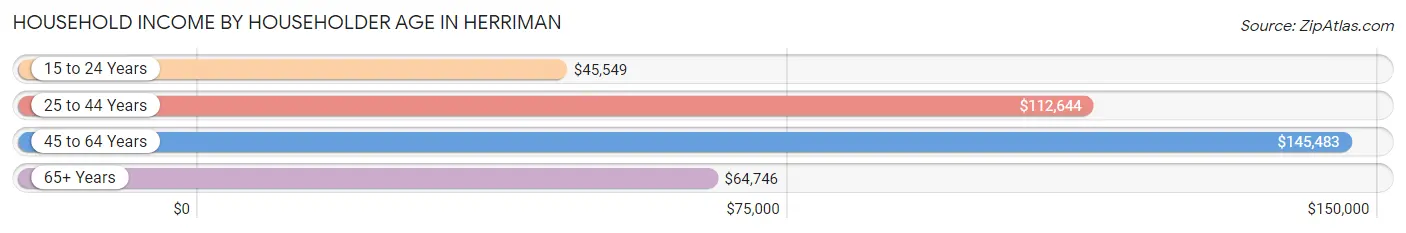
| Income Bracket | # Households | Median Income |
| 15 to 24 Years | 562 (3.5%) | $45,549 |
| 25 to 44 Years | 9,122 (56.8%) | $112,644 |
| 45 to 64 Years | 5,037 (31.3%) | $145,483 |
| 65+ Years | 1,354 (8.4%) | $64,746 |
| Total | 16,075 (100.0%) | $115,198 |
Poverty in Herriman
Income Below Poverty by Sex and Age in Herriman
With 7.0% poverty level for males and 4.7% for females among the residents of Herriman, 18 to 24 year old males and 5 year old females are the most vulnerable to poverty, with 535 males (21.7%) and 62 females (15.0%) in their respective age groups living below the poverty level.
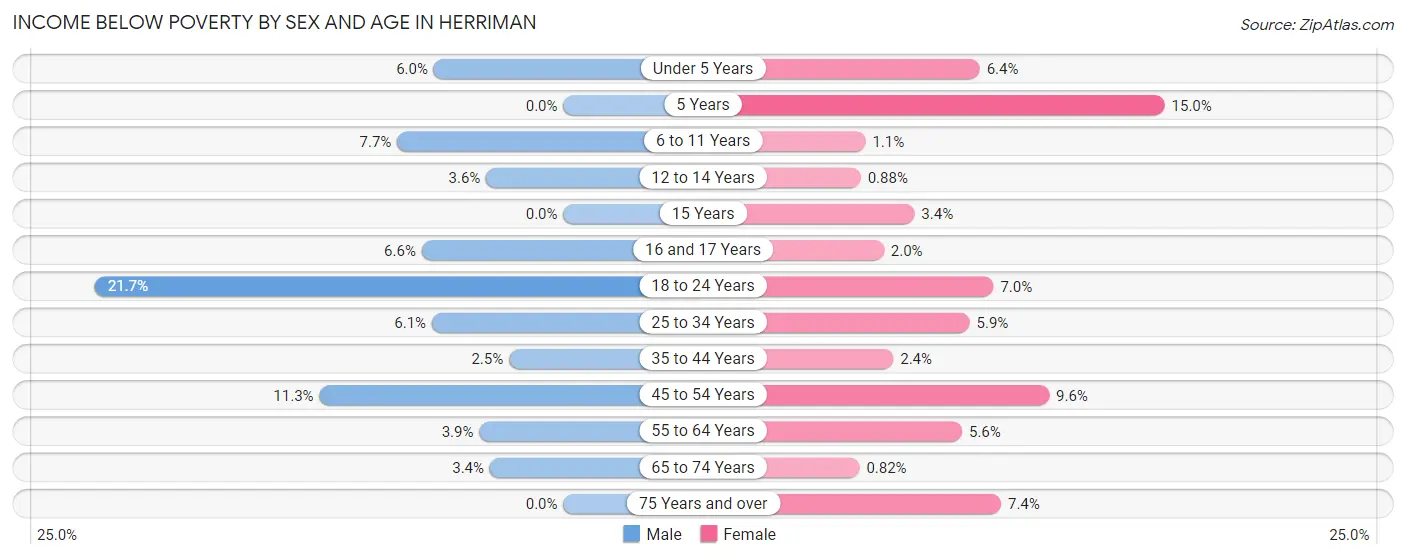
| Age Bracket | Male | Female |
| Under 5 Years | 203 (6.0%) | 138 (6.4%) |
| 5 Years | 0 (0.0%) | 62 (15.0%) |
| 6 to 11 Years | 267 (7.7%) | 42 (1.1%) |
| 12 to 14 Years | 59 (3.6%) | 14 (0.9%) |
| 15 Years | 0 (0.0%) | 14 (3.4%) |
| 16 and 17 Years | 66 (6.6%) | 23 (1.9%) |
| 18 to 24 Years | 535 (21.7%) | 138 (7.0%) |
| 25 to 34 Years | 257 (6.1%) | 321 (5.9%) |
| 35 to 44 Years | 108 (2.5%) | 115 (2.4%) |
| 45 to 54 Years | 313 (11.3%) | 321 (9.6%) |
| 55 to 64 Years | 77 (3.9%) | 84 (5.6%) |
| 65 to 74 Years | 23 (3.4%) | 8 (0.8%) |
| 75 Years and over | 0 (0.0%) | 28 (7.4%) |
| Total | 1,908 (7.0%) | 1,308 (4.7%) |
Income Above Poverty by Sex and Age in Herriman
According to the poverty statistics in Herriman, males aged 5 years and females aged 65 to 74 years are the age groups that are most secure financially, with 100.0% of males and 99.2% of females in these age groups living above the poverty line.
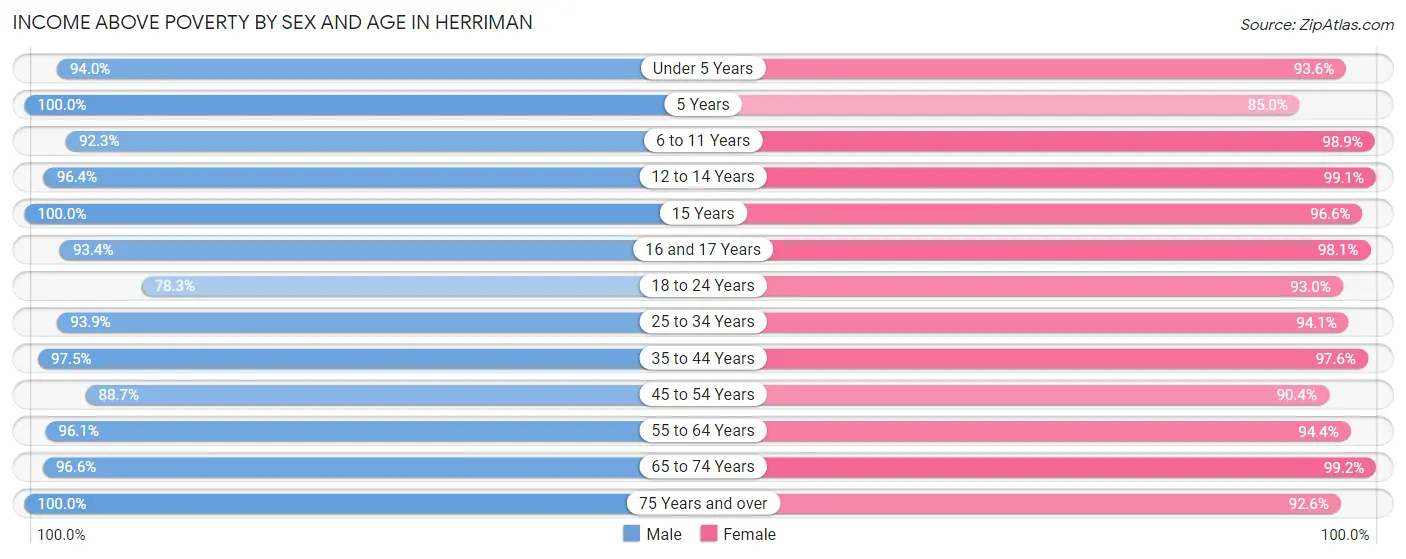
| Age Bracket | Male | Female |
| Under 5 Years | 3,172 (94.0%) | 2,018 (93.6%) |
| 5 Years | 644 (100.0%) | 352 (85.0%) |
| 6 to 11 Years | 3,194 (92.3%) | 3,778 (98.9%) |
| 12 to 14 Years | 1,589 (96.4%) | 1,572 (99.1%) |
| 15 Years | 428 (100.0%) | 402 (96.6%) |
| 16 and 17 Years | 938 (93.4%) | 1,159 (98.1%) |
| 18 to 24 Years | 1,926 (78.3%) | 1,821 (93.0%) |
| 25 to 34 Years | 3,953 (93.9%) | 5,096 (94.1%) |
| 35 to 44 Years | 4,172 (97.5%) | 4,702 (97.6%) |
| 45 to 54 Years | 2,452 (88.7%) | 3,017 (90.4%) |
| 55 to 64 Years | 1,895 (96.1%) | 1,422 (94.4%) |
| 65 to 74 Years | 652 (96.6%) | 972 (99.2%) |
| 75 Years and over | 287 (100.0%) | 351 (92.6%) |
| Total | 25,302 (93.0%) | 26,662 (95.3%) |
Income Below Poverty Among Married-Couple Families in Herriman
The poverty statistics for married-couple families in Herriman show that 4.1% or 462 of the total 11,255 families live below the poverty line. Families with 3 or 4 children have the highest poverty rate of 5.0%, comprising of 134 families. On the other hand, families with 5 or more children have the lowest poverty rate of 0.0%, which includes 0 families.
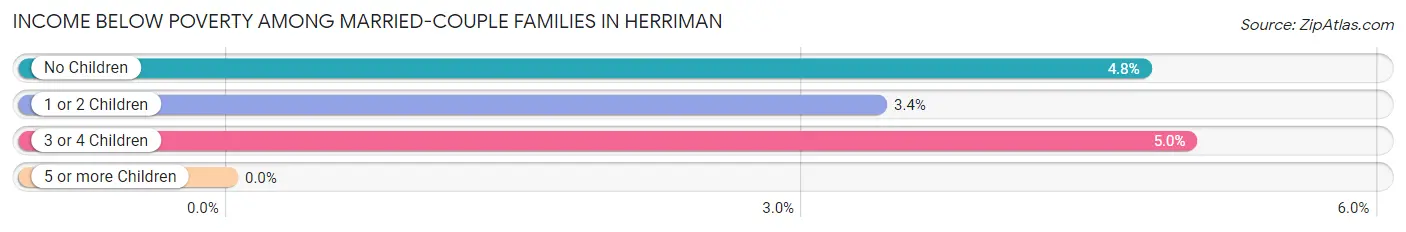
| Children | Above Poverty | Below Poverty |
| No Children | 3,475 (95.2%) | 174 (4.8%) |
| 1 or 2 Children | 4,383 (96.6%) | 154 (3.4%) |
| 3 or 4 Children | 2,542 (95.0%) | 134 (5.0%) |
| 5 or more Children | 393 (100.0%) | 0 (0.0%) |
| Total | 10,793 (95.9%) | 462 (4.1%) |
Income Below Poverty Among Single-Parent Households in Herriman
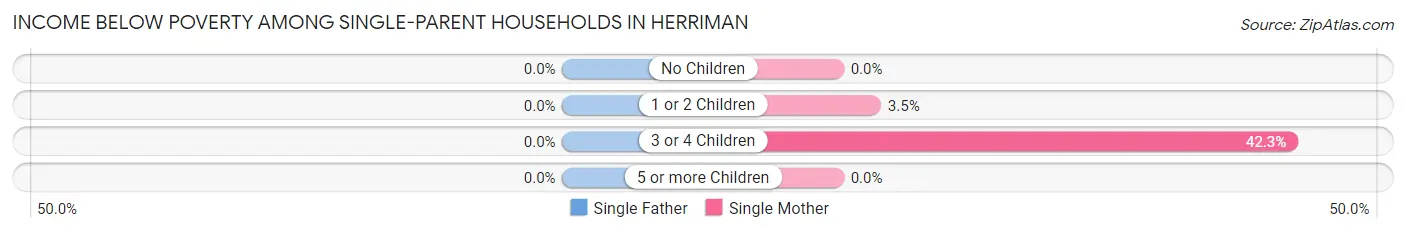
| Children | Single Father | Single Mother |
| No Children | 0 (0.0%) | 0 (0.0%) |
| 1 or 2 Children | 0 (0.0%) | 36 (3.5%) |
| 3 or 4 Children | 0 (0.0%) | 11 (42.3%) |
| 5 or more Children | 0 (0.0%) | 0 (0.0%) |
| Total | 0 (0.0%) | 47 (2.8%) |
Income Below Poverty Among Married-Couple vs Single-Parent Households in Herriman
The poverty data for Herriman shows that 462 of the married-couple family households (4.1%) and 47 of the single-parent households (2.3%) are living below the poverty level. Within the married-couple family households, those with 3 or 4 children have the highest poverty rate, with 134 households (5.0%) falling below the poverty line. Among the single-parent households, those with 3 or 4 children have the highest poverty rate, with 11 household (42.3%) living below poverty.
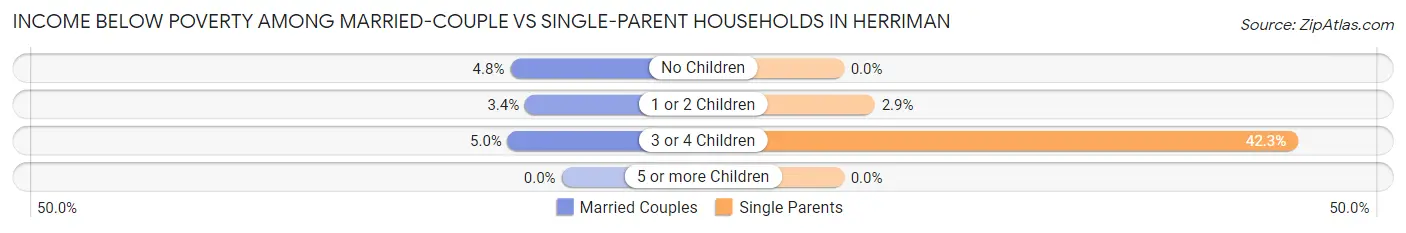
| Children | Married-Couple Families | Single-Parent Households |
| No Children | 174 (4.8%) | 0 (0.0%) |
| 1 or 2 Children | 154 (3.4%) | 36 (2.9%) |
| 3 or 4 Children | 134 (5.0%) | 11 (42.3%) |
| 5 or more Children | 0 (0.0%) | 0 (0.0%) |
| Total | 462 (4.1%) | 47 (2.3%) |
Race in Herriman
The most populous races in Herriman are White / Caucasian (46,392 | 83.9%), Two or more Races (5,637 | 10.2%), and Hispanic or Latino (5,090 | 9.2%).
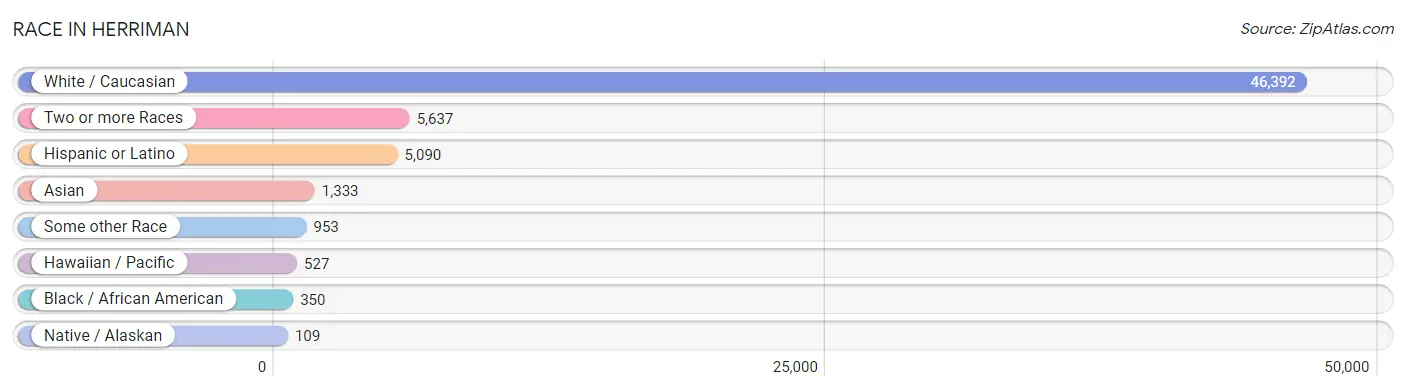
| Race | # Population | % Population |
| Asian | 1,333 | 2.4% |
| Black / African American | 350 | 0.6% |
| Hawaiian / Pacific | 527 | 0.9% |
| Hispanic or Latino | 5,090 | 9.2% |
| Native / Alaskan | 109 | 0.2% |
| White / Caucasian | 46,392 | 83.9% |
| Two or more Races | 5,637 | 10.2% |
| Some other Race | 953 | 1.7% |
| Total | 55,301 | 100.0% |
Ancestry in Herriman
The most populous ancestries reported in Herriman are English (16,138 | 29.2%), German (5,560 | 10.1%), Irish (3,554 | 6.4%), European (3,301 | 6.0%), and American (2,583 | 4.7%), together accounting for 56.3% of all Herriman residents.
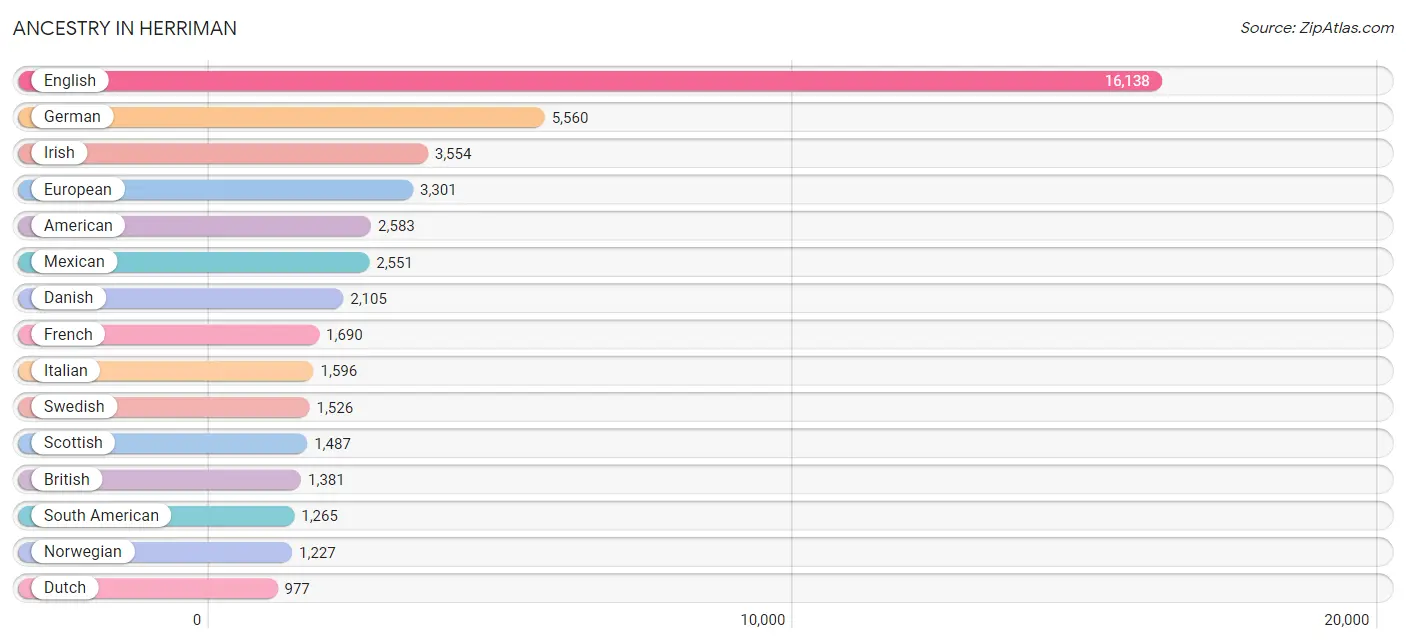
| Ancestry | # Population | % Population |
| African | 40 | 0.1% |
| American | 2,583 | 4.7% |
| Apache | 21 | 0.0% |
| Arab | 26 | 0.1% |
| Argentinean | 104 | 0.2% |
| Armenian | 10 | 0.0% |
| Austrian | 33 | 0.1% |
| Basque | 7 | 0.0% |
| Belgian | 157 | 0.3% |
| Bhutanese | 273 | 0.5% |
| Brazilian | 37 | 0.1% |
| British | 1,381 | 2.5% |
| Burmese | 567 | 1.0% |
| Cambodian | 11 | 0.0% |
| Canadian | 60 | 0.1% |
| Central American | 379 | 0.7% |
| Cherokee | 23 | 0.0% |
| Chilean | 72 | 0.1% |
| Chippewa | 109 | 0.2% |
| Colombian | 233 | 0.4% |
| Creek | 72 | 0.1% |
| Croatian | 16 | 0.0% |
| Cuban | 45 | 0.1% |
| Czech | 13 | 0.0% |
| Danish | 2,105 | 3.8% |
| Dutch | 977 | 1.8% |
| Eastern European | 65 | 0.1% |
| Ecuadorian | 59 | 0.1% |
| English | 16,138 | 29.2% |
| European | 3,301 | 6.0% |
| Fijian | 15 | 0.0% |
| Finnish | 180 | 0.3% |
| French | 1,690 | 3.1% |
| French Canadian | 158 | 0.3% |
| German | 5,560 | 10.1% |
| Greek | 92 | 0.2% |
| Guamanian / Chamorro | 219 | 0.4% |
| Guatemalan | 104 | 0.2% |
| Guyanese | 22 | 0.0% |
| Honduran | 7 | 0.0% |
| Hungarian | 156 | 0.3% |
| Indian (Asian) | 515 | 0.9% |
| Irish | 3,554 | 6.4% |
| Iroquois | 35 | 0.1% |
| Italian | 1,596 | 2.9% |
| Jamaican | 61 | 0.1% |
| Japanese | 454 | 0.8% |
| Korean | 742 | 1.3% |
| Lithuanian | 12 | 0.0% |
| Mexican | 2,551 | 4.6% |
| Mexican American Indian | 69 | 0.1% |
| Native Hawaiian | 490 | 0.9% |
| Navajo | 245 | 0.4% |
| Nicaraguan | 24 | 0.0% |
| Northern European | 185 | 0.3% |
| Norwegian | 1,227 | 2.2% |
| Pakistani | 116 | 0.2% |
| Peruvian | 143 | 0.3% |
| Polish | 549 | 1.0% |
| Portuguese | 106 | 0.2% |
| Puerto Rican | 252 | 0.5% |
| Salvadoran | 244 | 0.4% |
| Samoan | 525 | 0.9% |
| Scandinavian | 969 | 1.8% |
| Scotch-Irish | 916 | 1.7% |
| Scottish | 1,487 | 2.7% |
| Shoshone | 60 | 0.1% |
| South African | 48 | 0.1% |
| South American | 1,265 | 2.3% |
| Spaniard | 72 | 0.1% |
| Spanish | 417 | 0.7% |
| Sri Lankan | 235 | 0.4% |
| Subsaharan African | 88 | 0.2% |
| Swedish | 1,526 | 2.8% |
| Swiss | 192 | 0.4% |
| Syrian | 26 | 0.1% |
| Thai | 94 | 0.2% |
| Tongan | 235 | 0.4% |
| Venezuelan | 654 | 1.2% |
| Welsh | 848 | 1.5% |
| Yugoslavian | 11 | 0.0% | View All 81 Rows |
Immigrants in Herriman
The most numerous immigrant groups reported in Herriman came from Latin America (1,519 | 2.8%), Asia (1,158 | 2.1%), South America (848 | 1.5%), South Eastern Asia (714 | 1.3%), and Central America (616 | 1.1%), together accounting for 8.8% of all Herriman residents.
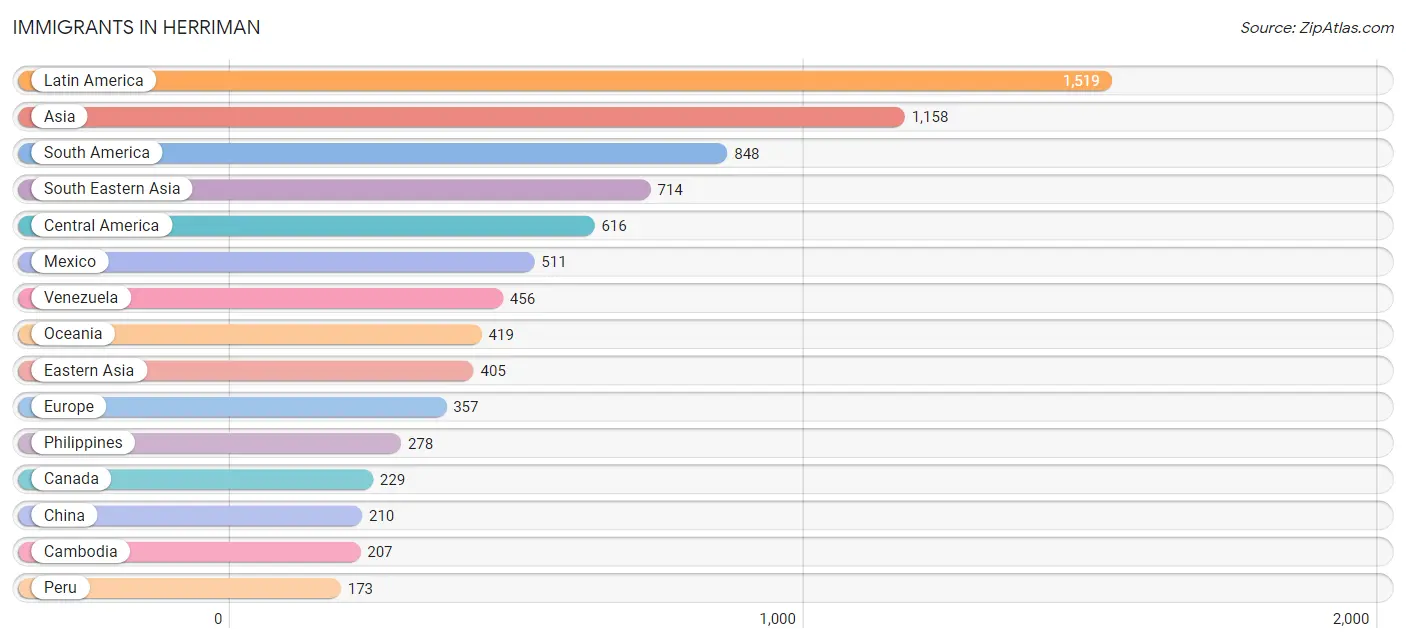
| Immigration Origin | # Population | % Population |
| Africa | 12 | 0.0% |
| Argentina | 58 | 0.1% |
| Asia | 1,158 | 2.1% |
| Australia | 23 | 0.0% |
| Bosnia and Herzegovina | 43 | 0.1% |
| Brazil | 21 | 0.0% |
| Bulgaria | 44 | 0.1% |
| Cambodia | 207 | 0.4% |
| Canada | 229 | 0.4% |
| Caribbean | 55 | 0.1% |
| Central America | 616 | 1.1% |
| China | 210 | 0.4% |
| Colombia | 105 | 0.2% |
| Cuba | 20 | 0.0% |
| Eastern Asia | 405 | 0.7% |
| Eastern Europe | 123 | 0.2% |
| Ecuador | 35 | 0.1% |
| El Salvador | 88 | 0.2% |
| England | 105 | 0.2% |
| Europe | 357 | 0.6% |
| France | 15 | 0.0% |
| Germany | 53 | 0.1% |
| Guatemala | 17 | 0.0% |
| Hungary | 25 | 0.1% |
| India | 39 | 0.1% |
| Jamaica | 35 | 0.1% |
| Japan | 36 | 0.1% |
| Korea | 148 | 0.3% |
| Latin America | 1,519 | 2.8% |
| Malaysia | 10 | 0.0% |
| Mexico | 511 | 0.9% |
| Northern Europe | 143 | 0.3% |
| Oceania | 419 | 0.8% |
| Peru | 173 | 0.3% |
| Philippines | 278 | 0.5% |
| Poland | 11 | 0.0% |
| South Africa | 12 | 0.0% |
| South America | 848 | 1.5% |
| South Central Asia | 39 | 0.1% |
| South Eastern Asia | 714 | 1.3% |
| Southern Europe | 23 | 0.0% |
| Spain | 23 | 0.0% |
| Thailand | 50 | 0.1% |
| Venezuela | 456 | 0.8% |
| Vietnam | 169 | 0.3% |
| Western Europe | 68 | 0.1% | View All 46 Rows |
Sex and Age in Herriman
Sex and Age in Herriman
The most populous age groups in Herriman are Under 5 Years (3,375 | 12.4%) for men and 10 to 14 Years (2,976 | 10.6%) for women.
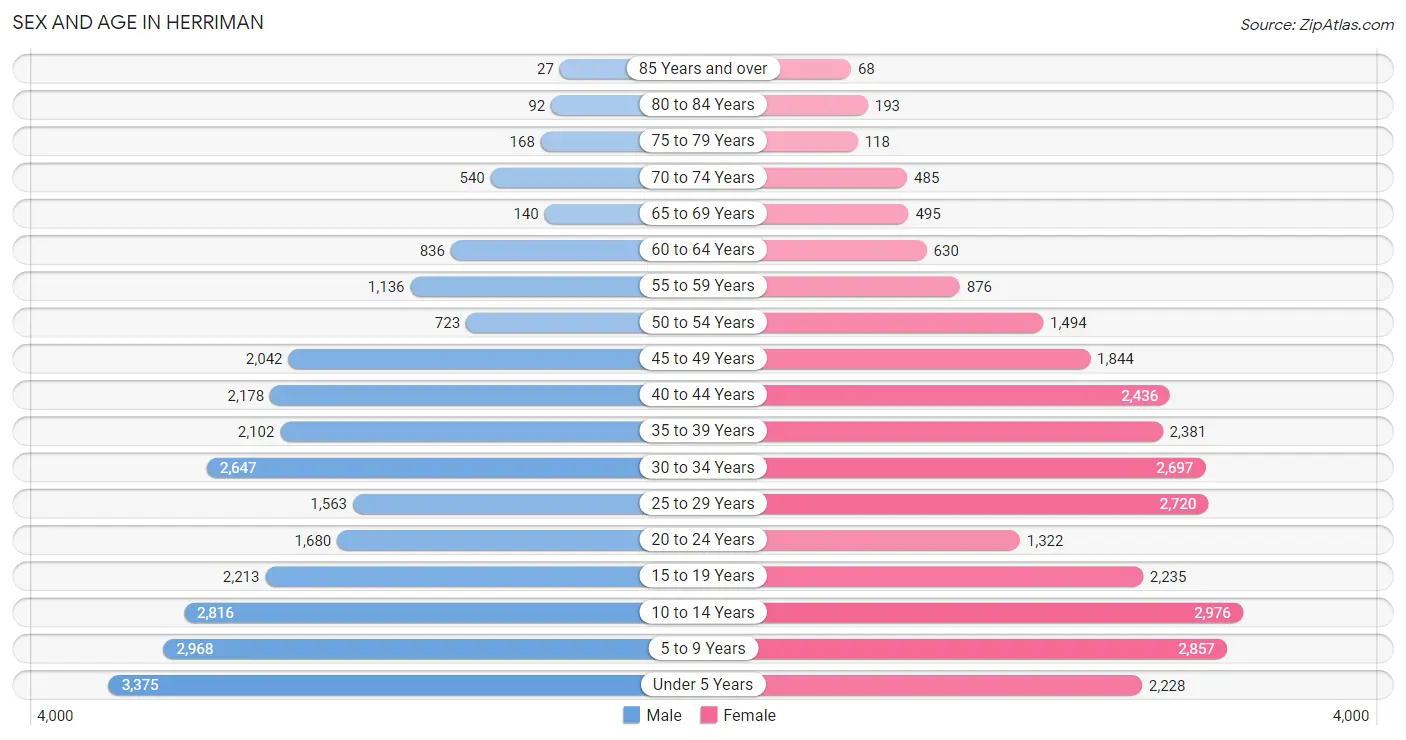
| Age Bracket | Male | Female |
| Under 5 Years | 3,375 (12.4%) | 2,228 (7.9%) |
| 5 to 9 Years | 2,968 (10.9%) | 2,857 (10.2%) |
| 10 to 14 Years | 2,816 (10.3%) | 2,976 (10.6%) |
| 15 to 19 Years | 2,213 (8.1%) | 2,235 (8.0%) |
| 20 to 24 Years | 1,680 (6.2%) | 1,322 (4.7%) |
| 25 to 29 Years | 1,563 (5.7%) | 2,720 (9.7%) |
| 30 to 34 Years | 2,647 (9.7%) | 2,697 (9.6%) |
| 35 to 39 Years | 2,102 (7.7%) | 2,381 (8.5%) |
| 40 to 44 Years | 2,178 (8.0%) | 2,436 (8.7%) |
| 45 to 49 Years | 2,042 (7.5%) | 1,844 (6.6%) |
| 50 to 54 Years | 723 (2.6%) | 1,494 (5.3%) |
| 55 to 59 Years | 1,136 (4.2%) | 876 (3.1%) |
| 60 to 64 Years | 836 (3.1%) | 630 (2.2%) |
| 65 to 69 Years | 140 (0.5%) | 495 (1.8%) |
| 70 to 74 Years | 540 (2.0%) | 485 (1.7%) |
| 75 to 79 Years | 168 (0.6%) | 118 (0.4%) |
| 80 to 84 Years | 92 (0.3%) | 193 (0.7%) |
| 85 Years and over | 27 (0.1%) | 68 (0.2%) |
| Total | 27,246 (100.0%) | 28,055 (100.0%) |
Families and Households in Herriman
Median Family Size in Herriman
The median family size in Herriman is 3.80 persons per family, with married-couple families (11,255 | 84.5%) accounting for the largest median family size of 3.96 persons per family. On the other hand, single male/father families (408 | 3.1%) represent the smallest median family size with 2.64 persons per family.
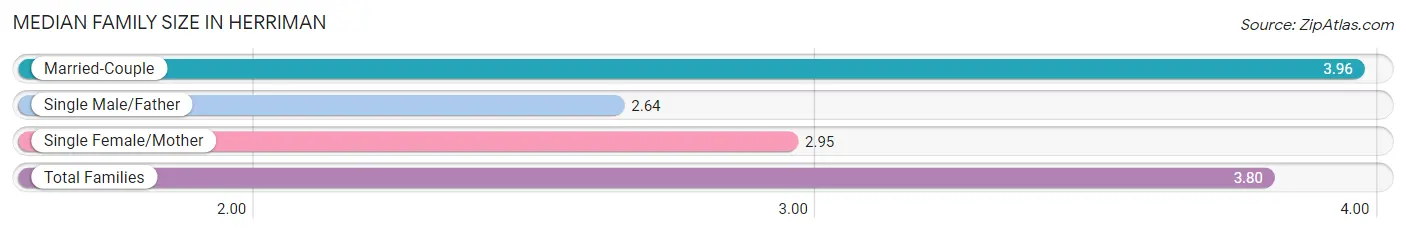
| Family Type | # Families | Family Size |
| Married-Couple | 11,255 (84.5%) | 3.96 |
| Single Male/Father | 408 (3.1%) | 2.64 |
| Single Female/Mother | 1,661 (12.5%) | 2.95 |
| Total Families | 13,324 (100.0%) | 3.80 |
Median Household Size in Herriman
The median household size in Herriman is 3.44 persons per household, with married-couple households (11,255 | 70.0%) accounting for the largest median household size of 4.01 persons per household. non-family households (2,751 | 17.1%) represent the smallest median household size with 1.37 persons per household.
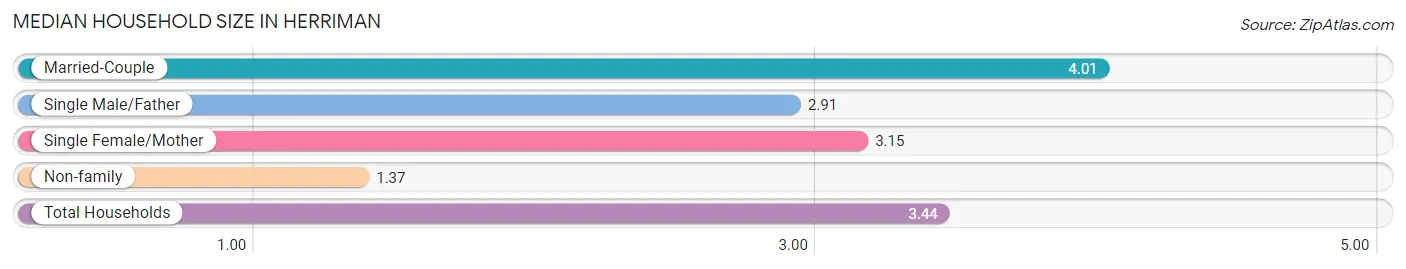
| Household Type | # Households | Household Size |
| Married-Couple | 11,255 (70.0%) | 4.01 |
| Single Male/Father | 408 (2.5%) | 2.91 |
| Single Female/Mother | 1,661 (10.3%) | 3.15 |
| Non-family | 2,751 (17.1%) | 1.37 |
| Total Households | 16,075 (100.0%) | 3.44 |
Household Size by Marriage Status in Herriman
Out of a total of 16,075 households in Herriman, 13,324 (82.9%) are family households, while 2,751 (17.1%) are nonfamily households. The most numerous type of family households are 2-person households, comprising 3,513, and the most common type of nonfamily households are 1-person households, comprising 2,122.
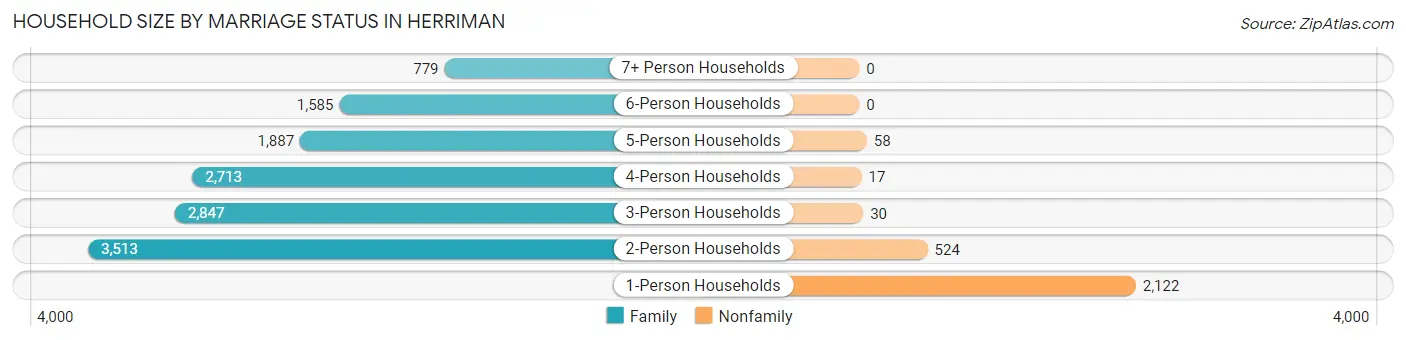
| Household Size | Family Households | Nonfamily Households |
| 1-Person Households | - | 2,122 (13.2%) |
| 2-Person Households | 3,513 (21.8%) | 524 (3.3%) |
| 3-Person Households | 2,847 (17.7%) | 30 (0.2%) |
| 4-Person Households | 2,713 (16.9%) | 17 (0.1%) |
| 5-Person Households | 1,887 (11.7%) | 58 (0.4%) |
| 6-Person Households | 1,585 (9.9%) | 0 (0.0%) |
| 7+ Person Households | 779 (4.9%) | 0 (0.0%) |
| Total | 13,324 (82.9%) | 2,751 (17.1%) |
Female Fertility in Herriman
Fertility by Age in Herriman
Average fertility rate in Herriman is 58.0 births per 1,000 women. Women in the age bracket of 20 to 34 years have the highest fertility rate with 116.0 births per 1,000 women. Women in the age bracket of 20 to 34 years acount for 84.0% of all women with births.
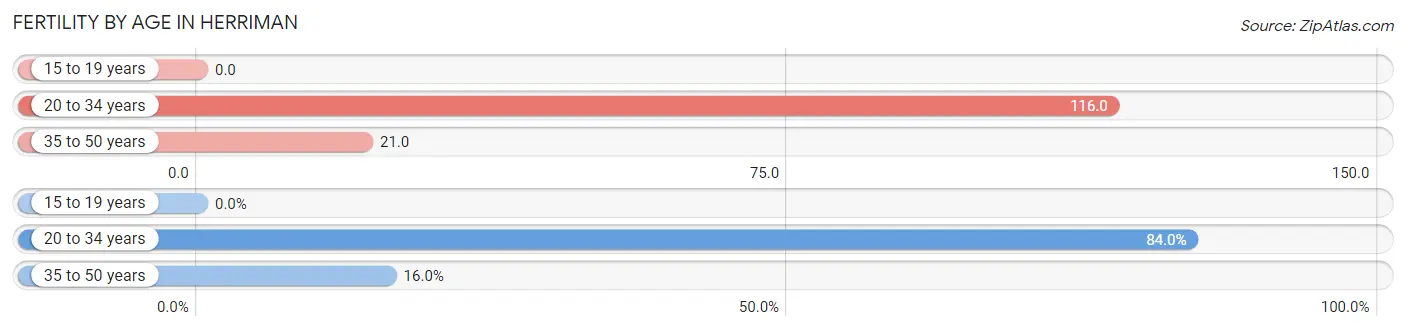
| Age Bracket | Women with Births | Births / 1,000 Women |
| 15 to 19 years | 0 (0.0%) | 0.0 |
| 20 to 34 years | 782 (84.0%) | 116.0 |
| 35 to 50 years | 149 (16.0%) | 21.0 |
| Total | 931 (100.0%) | 58.0 |
Fertility by Age by Marriage Status in Herriman
95.8% of women with births (931) in Herriman are married. The highest percentage of unmarried women with births falls into 35 to 50 years age bracket with 26.2% of them unmarried at the time of birth, while the lowest percentage of unmarried women with births belong to 20 to 34 years age bracket with 0.0% of them unmarried.
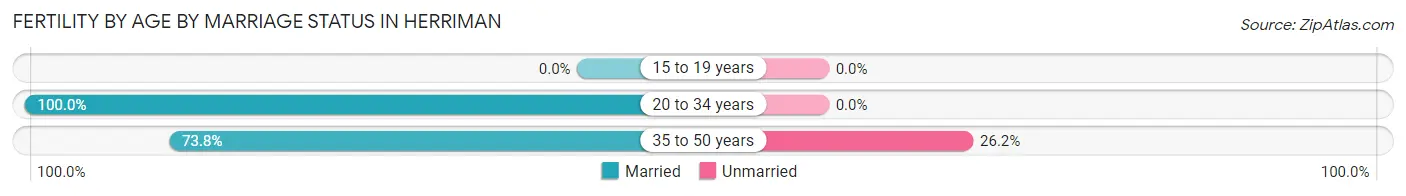
| Age Bracket | Married | Unmarried |
| 15 to 19 years | 0 (0.0%) | 0 (0.0%) |
| 20 to 34 years | 782 (100.0%) | 0 (0.0%) |
| 35 to 50 years | 110 (73.8%) | 39 (26.2%) |
| Total | 892 (95.8%) | 39 (4.2%) |
Fertility by Education in Herriman
Average fertility rate in Herriman is 58.0 births per 1,000 women. Women with the education attainment of bachelor's degree have the highest fertility rate of 85.0 births per 1,000 women, while women with the education attainment of less than high school have the lowest fertility at 9.0 births per 1,000 women. Women with the education attainment of college or associate's degree represent 38.6% of all women with births.
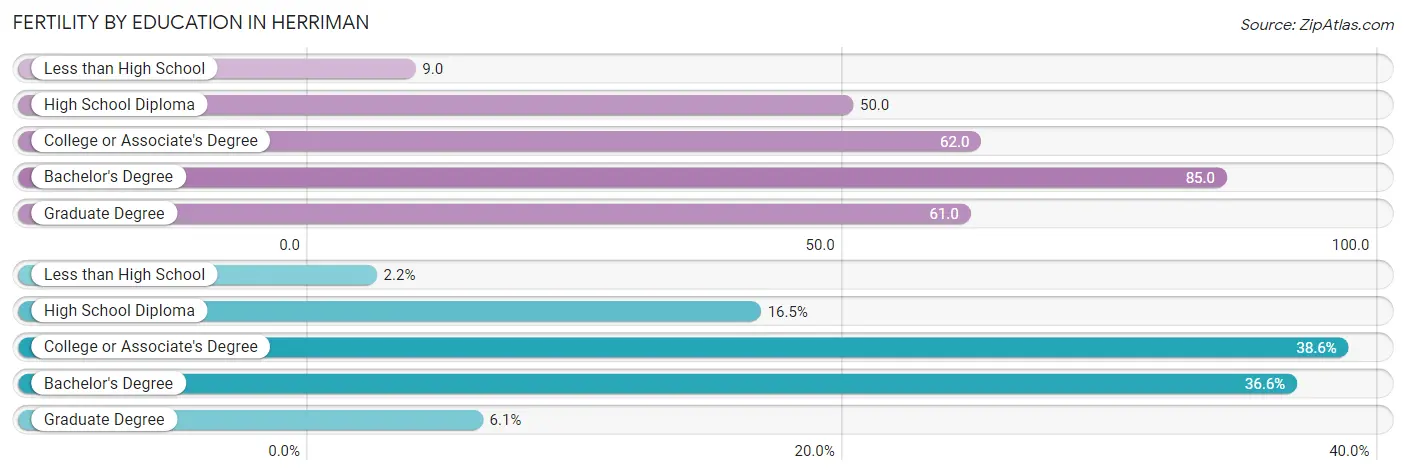
| Educational Attainment | Women with Births | Births / 1,000 Women |
| Less than High School | 20 (2.1%) | 9.0 |
| High School Diploma | 154 (16.5%) | 50.0 |
| College or Associate's Degree | 359 (38.6%) | 62.0 |
| Bachelor's Degree | 341 (36.6%) | 85.0 |
| Graduate Degree | 57 (6.1%) | 61.0 |
| Total | 931 (100.0%) | 58.0 |
Fertility by Education by Marriage Status in Herriman
4.2% of women with births in Herriman are unmarried. Women with the educational attainment of less than high school are most likely to be married with 100.0% of them married at childbirth, while women with the educational attainment of high school diploma are least likely to be married with 25.3% of them unmarried at childbirth.
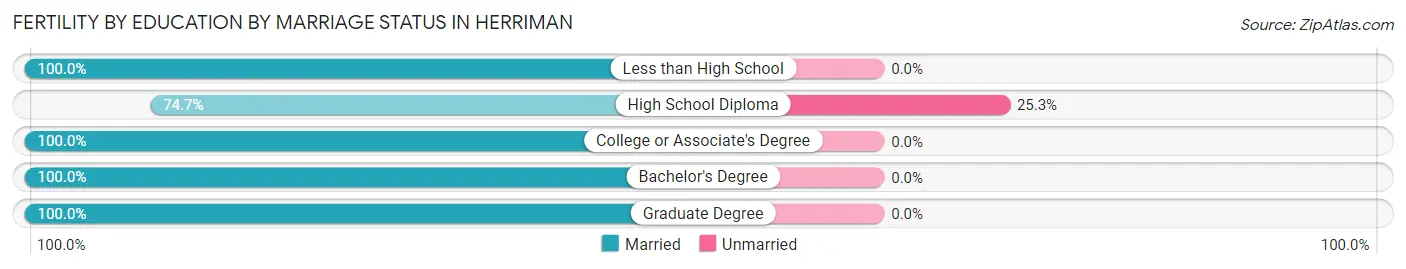
| Educational Attainment | Married | Unmarried |
| Less than High School | 20 (100.0%) | 0 (0.0%) |
| High School Diploma | 115 (74.7%) | 39 (25.3%) |
| College or Associate's Degree | 359 (100.0%) | 0 (0.0%) |
| Bachelor's Degree | 341 (100.0%) | 0 (0.0%) |
| Graduate Degree | 57 (100.0%) | 0 (0.0%) |
| Total | 892 (95.8%) | 39 (4.2%) |
Employment Characteristics in Herriman
Employment by Class of Employer in Herriman
Among the 27,230 employed individuals in Herriman, private company employees (18,930 | 69.5%), local government employees (2,291 | 8.4%), and not-for-profit organizations (1,898 | 7.0%) make up the most common classes of employment.
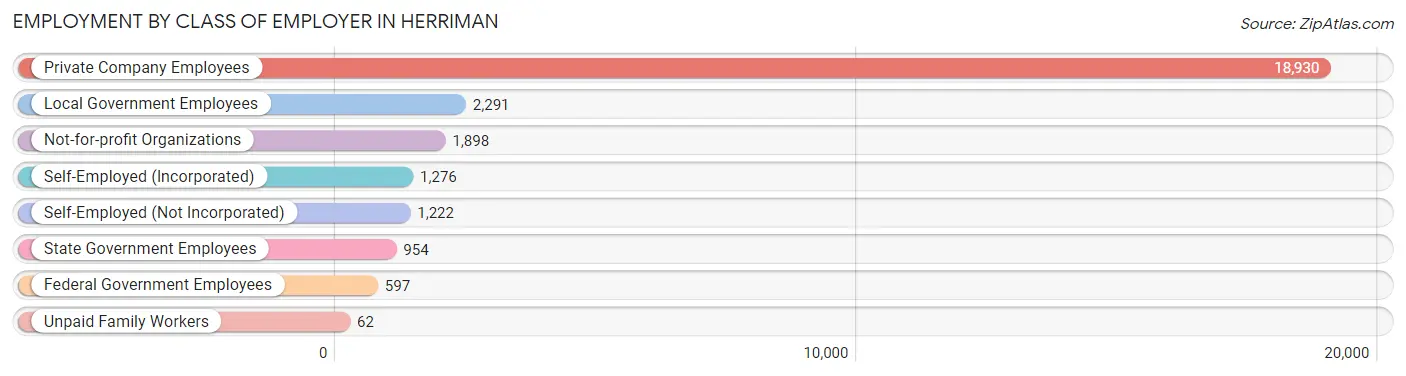
| Employer Class | # Employees | % Employees |
| Private Company Employees | 18,930 | 69.5% |
| Self-Employed (Incorporated) | 1,276 | 4.7% |
| Self-Employed (Not Incorporated) | 1,222 | 4.5% |
| Not-for-profit Organizations | 1,898 | 7.0% |
| Local Government Employees | 2,291 | 8.4% |
| State Government Employees | 954 | 3.5% |
| Federal Government Employees | 597 | 2.2% |
| Unpaid Family Workers | 62 | 0.2% |
| Total | 27,230 | 100.0% |
Employment Status by Age in Herriman
According to the labor force statistics for Herriman, out of the total population over 16 years of age (37,237), 75.9% or 28,263 individuals are in the labor force, with 3.2% or 904 of them unemployed. The age group with the highest labor force participation rate is 55 to 59 years, with 87.6% or 1,763 individuals in the labor force. Within the labor force, the 65 to 74 years age range has the highest percentage of unemployed individuals, with 35.4% or 157 of them being unemployed.
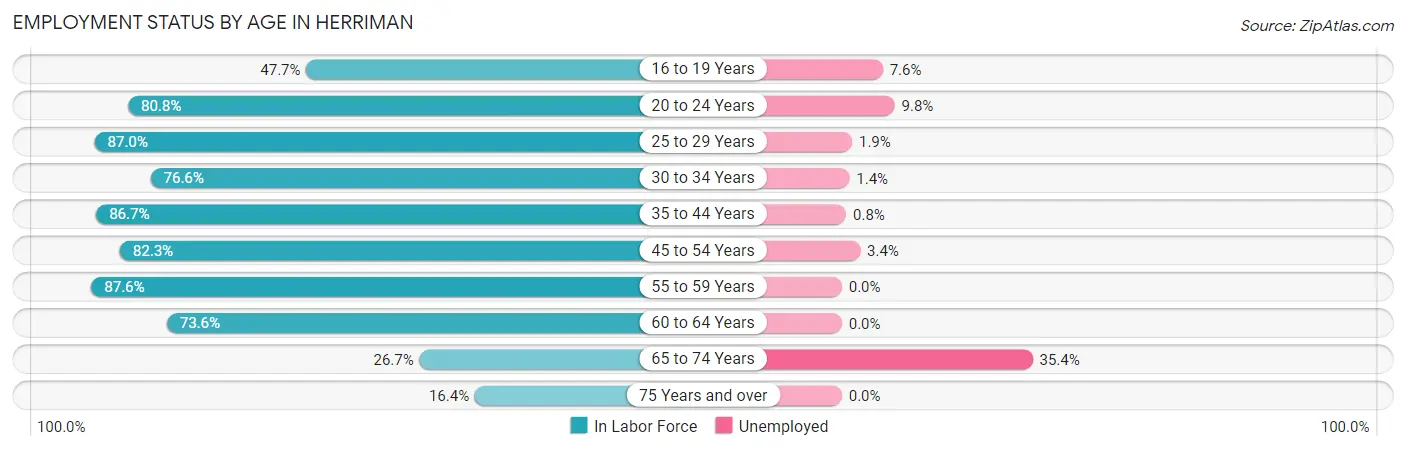
| Age Bracket | In Labor Force | Unemployed |
| 16 to 19 Years | 1,719 (47.7%) | 131 (7.6%) |
| 20 to 24 Years | 2,426 (80.8%) | 238 (9.8%) |
| 25 to 29 Years | 3,726 (87.0%) | 71 (1.9%) |
| 30 to 34 Years | 4,094 (76.6%) | 57 (1.4%) |
| 35 to 44 Years | 7,887 (86.7%) | 63 (0.8%) |
| 45 to 54 Years | 5,023 (82.3%) | 171 (3.4%) |
| 55 to 59 Years | 1,763 (87.6%) | 0 (0.0%) |
| 60 to 64 Years | 1,079 (73.6%) | 0 (0.0%) |
| 65 to 74 Years | 443 (26.7%) | 157 (35.4%) |
| 75 Years and over | 109 (16.4%) | 0 (0.0%) |
| Total | 28,263 (75.9%) | 904 (3.2%) |
Employment Status by Educational Attainment in Herriman
According to labor force statistics for Herriman, 83.3% of individuals (23,578) out of the total population between 25 and 64 years of age (28,305) are in the labor force, with 1.6% or 377 of them being unemployed. The group with the highest labor force participation rate are those with the educational attainment of bachelor's degree or higher, with 88.3% or 10,117 individuals in the labor force. Within the labor force, individuals with less than high school education have the highest percentage of unemployment, with 7.1% or 53 of them being unemployed.
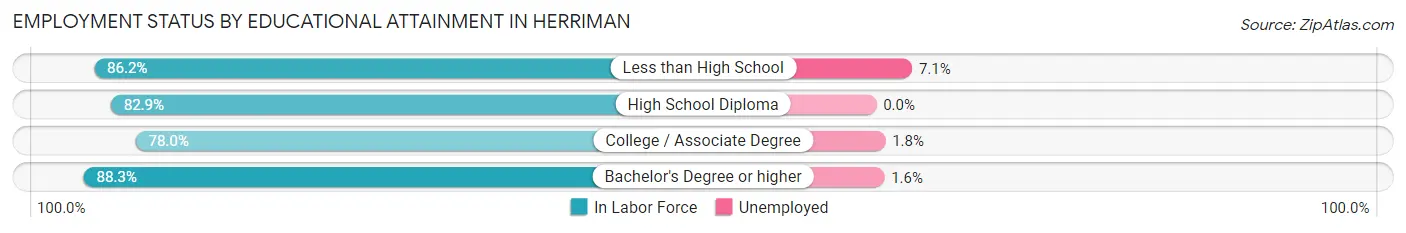
| Educational Attainment | In Labor Force | Unemployed |
| Less than High School | 746 (86.2%) | 61 (7.1%) |
| High School Diploma | 3,958 (82.9%) | 0 (0.0%) |
| College / Associate Degree | 8,742 (78.0%) | 202 (1.8%) |
| Bachelor's Degree or higher | 10,117 (88.3%) | 183 (1.6%) |
| Total | 23,578 (83.3%) | 453 (1.6%) |
Employment Occupations by Sex in Herriman
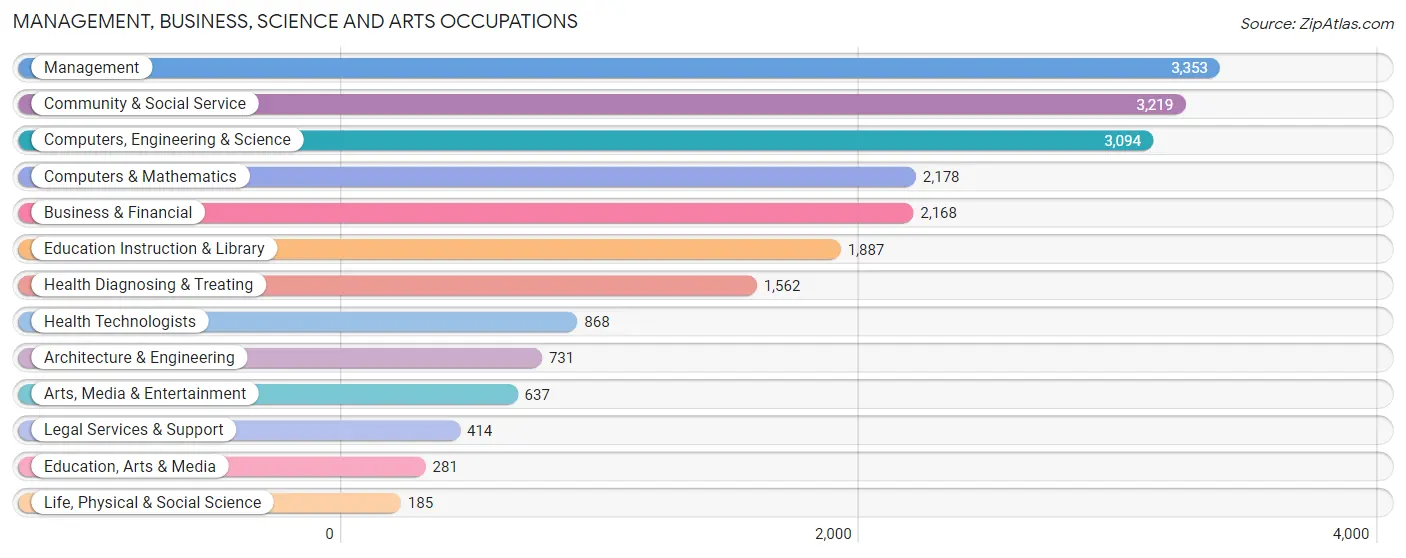
Management, Business, Science and Arts Occupations
The most common Management, Business, Science and Arts occupations in Herriman are Management (3,353 | 12.3%), Community & Social Service (3,219 | 11.8%), Computers, Engineering & Science (3,094 | 11.3%), Computers & Mathematics (2,178 | 8.0%), and Business & Financial (2,168 | 7.9%).
Management, Business, Science and Arts Occupations by Sex
Within the Management, Business, Science and Arts occupations in Herriman, the most male-oriented occupations are Architecture & Engineering (95.2%), Management (77.2%), and Computers, Engineering & Science (69.9%), while the most female-oriented occupations are Health Diagnosing & Treating (88.5%), Life, Physical & Social Science (86.0%), and Education Instruction & Library (85.1%).
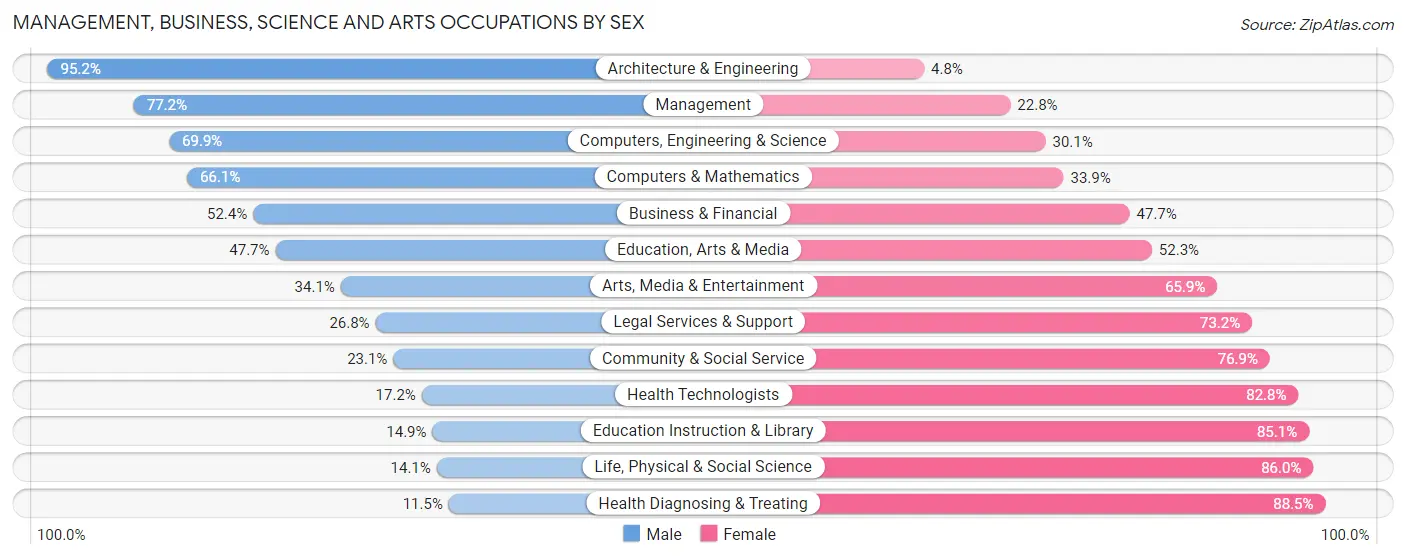
| Occupation | Male | Female |
| Management | 2,589 (77.2%) | 764 (22.8%) |
| Business & Financial | 1,135 (52.3%) | 1,033 (47.6%) |
| Computers, Engineering & Science | 2,162 (69.9%) | 932 (30.1%) |
| Computers & Mathematics | 1,440 (66.1%) | 738 (33.9%) |
| Architecture & Engineering | 696 (95.2%) | 35 (4.8%) |
| Life, Physical & Social Science | 26 (14.1%) | 159 (86.0%) |
| Community & Social Service | 744 (23.1%) | 2,475 (76.9%) |
| Education, Arts & Media | 134 (47.7%) | 147 (52.3%) |
| Legal Services & Support | 111 (26.8%) | 303 (73.2%) |
| Education Instruction & Library | 282 (14.9%) | 1,605 (85.1%) |
| Arts, Media & Entertainment | 217 (34.1%) | 420 (65.9%) |
| Health Diagnosing & Treating | 180 (11.5%) | 1,382 (88.5%) |
| Health Technologists | 149 (17.2%) | 719 (82.8%) |
| Total (Category) | 6,810 (50.8%) | 6,586 (49.2%) |
| Total (Overall) | 14,861 (54.3%) | 12,490 (45.7%) |
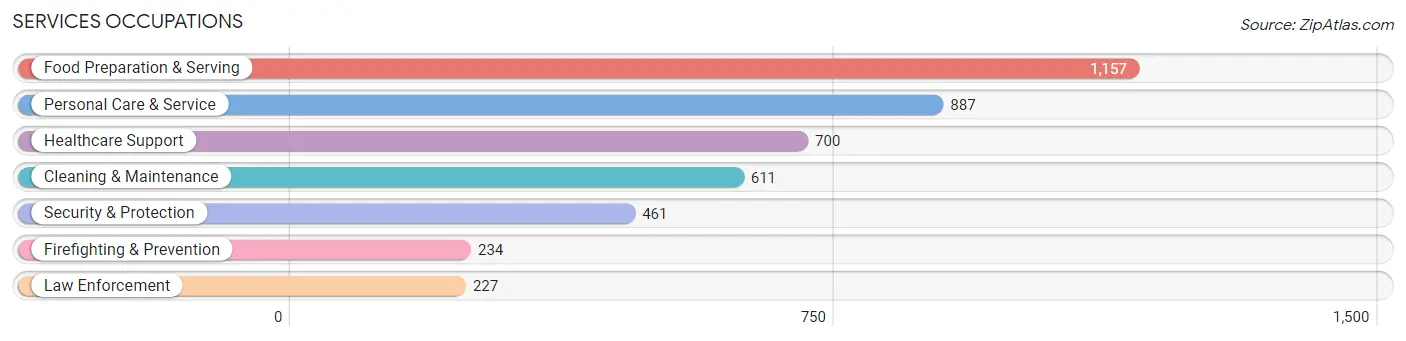
Services Occupations
The most common Services occupations in Herriman are Food Preparation & Serving (1,157 | 4.2%), Personal Care & Service (887 | 3.2%), Healthcare Support (700 | 2.6%), Cleaning & Maintenance (611 | 2.2%), and Security & Protection (461 | 1.7%).
Services Occupations by Sex
Within the Services occupations in Herriman, the most male-oriented occupations are Law Enforcement (100.0%), Security & Protection (97.4%), and Firefighting & Prevention (94.9%), while the most female-oriented occupations are Healthcare Support (100.0%), Personal Care & Service (77.8%), and Cleaning & Maintenance (45.8%).
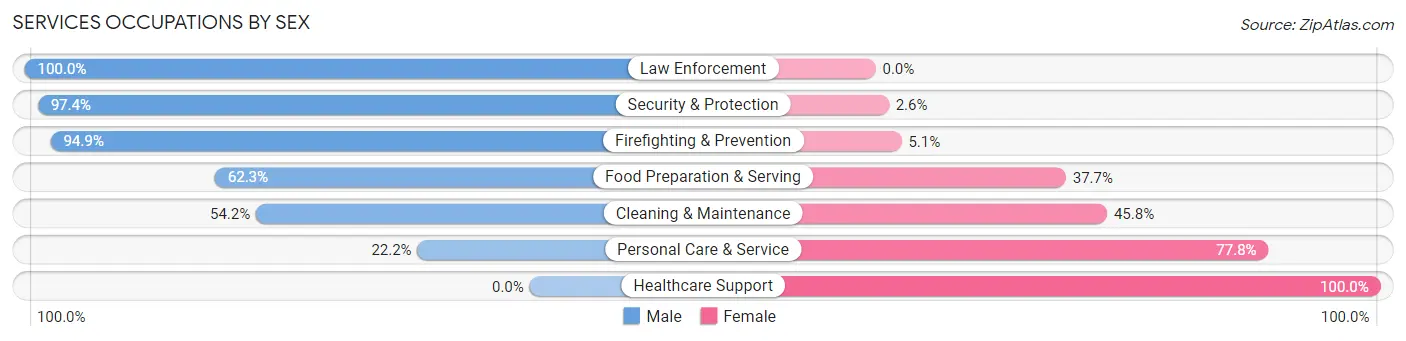
| Occupation | Male | Female |
| Healthcare Support | 0 (0.0%) | 700 (100.0%) |
| Security & Protection | 449 (97.4%) | 12 (2.6%) |
| Firefighting & Prevention | 222 (94.9%) | 12 (5.1%) |
| Law Enforcement | 227 (100.0%) | 0 (0.0%) |
| Food Preparation & Serving | 721 (62.3%) | 436 (37.7%) |
| Cleaning & Maintenance | 331 (54.2%) | 280 (45.8%) |
| Personal Care & Service | 197 (22.2%) | 690 (77.8%) |
| Total (Category) | 1,698 (44.5%) | 2,118 (55.5%) |
| Total (Overall) | 14,861 (54.3%) | 12,490 (45.7%) |
Sales and Office Occupations
The most common Sales and Office occupations in Herriman are Office & Administration (3,412 | 12.5%), and Sales & Related (2,800 | 10.2%).
Sales and Office Occupations by Sex
| Occupation | Male | Female |
| Sales & Related | 1,698 (60.6%) | 1,102 (39.4%) |
| Office & Administration | 1,042 (30.5%) | 2,370 (69.5%) |
| Total (Category) | 2,740 (44.1%) | 3,472 (55.9%) |
| Total (Overall) | 14,861 (54.3%) | 12,490 (45.7%) |
Natural Resources, Construction and Maintenance Occupations
The most common Natural Resources, Construction and Maintenance occupations in Herriman are Construction & Extraction (1,375 | 5.0%), Installation, Maintenance & Repair (600 | 2.2%), and Farming, Fishing & Forestry (23 | 0.1%).
Natural Resources, Construction and Maintenance Occupations by Sex
| Occupation | Male | Female |
| Farming, Fishing & Forestry | 23 (100.0%) | 0 (0.0%) |
| Construction & Extraction | 1,361 (99.0%) | 14 (1.0%) |
| Installation, Maintenance & Repair | 581 (96.8%) | 19 (3.2%) |
| Total (Category) | 1,965 (98.4%) | 33 (1.7%) |
| Total (Overall) | 14,861 (54.3%) | 12,490 (45.7%) |
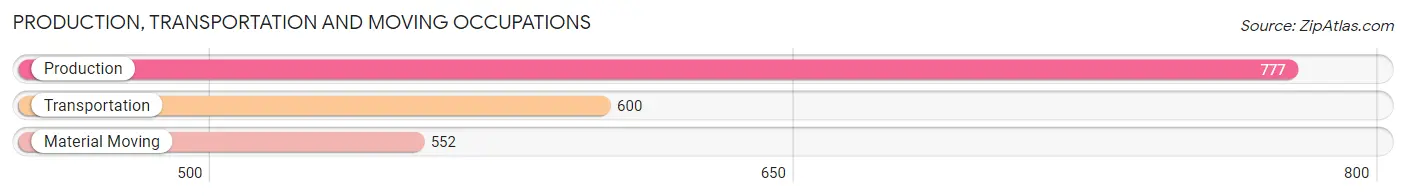
Production, Transportation and Moving Occupations
The most common Production, Transportation and Moving occupations in Herriman are Production (777 | 2.8%), Transportation (600 | 2.2%), and Material Moving (552 | 2.0%).
Production, Transportation and Moving Occupations by Sex
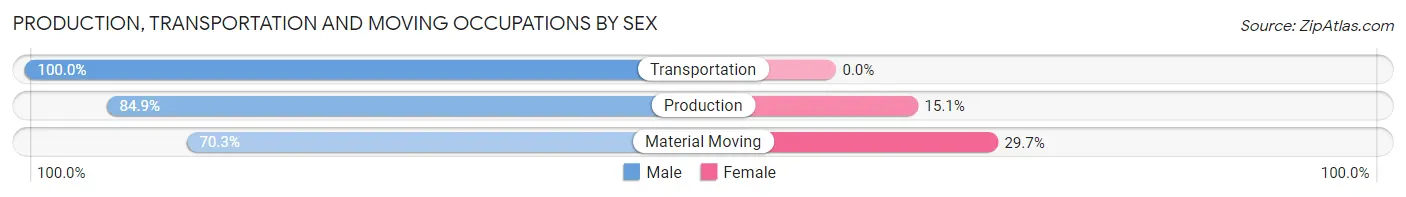
| Occupation | Male | Female |
| Production | 660 (84.9%) | 117 (15.1%) |
| Transportation | 600 (100.0%) | 0 (0.0%) |
| Material Moving | 388 (70.3%) | 164 (29.7%) |
| Total (Category) | 1,648 (85.4%) | 281 (14.6%) |
| Total (Overall) | 14,861 (54.3%) | 12,490 (45.7%) |
Employment Industries by Sex in Herriman
Employment Industries in Herriman
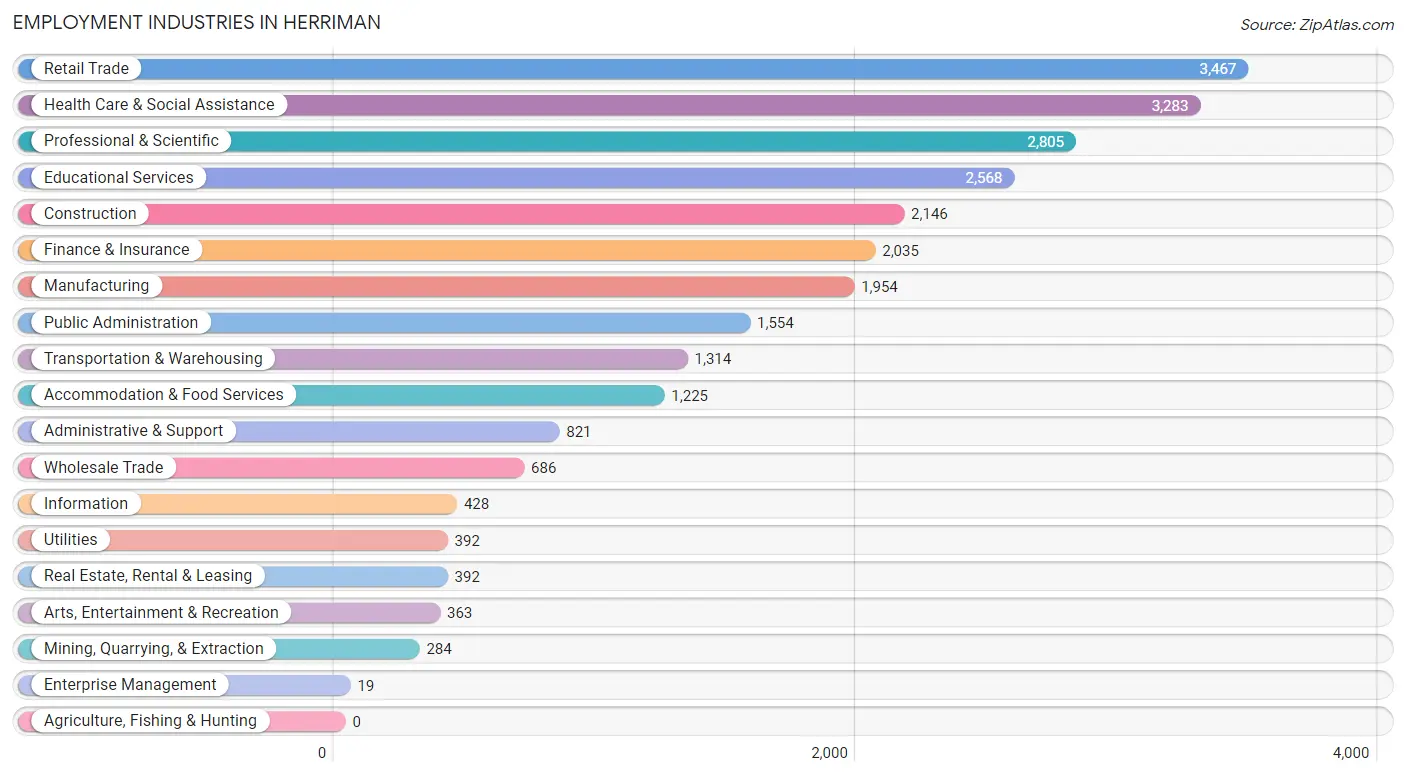
The major employment industries in Herriman include Retail Trade (3,467 | 12.7%), Health Care & Social Assistance (3,283 | 12.0%), Professional & Scientific (2,805 | 10.3%), Educational Services (2,568 | 9.4%), and Construction (2,146 | 7.9%).
Employment Industries by Sex in Herriman
The Herriman industries that see more men than women are Utilities (100.0%), Construction (93.8%), and Mining, Quarrying, & Extraction (92.2%), whereas the industries that tend to have a higher number of women are Enterprise Management (100.0%), Health Care & Social Assistance (91.6%), and Educational Services (82.5%).
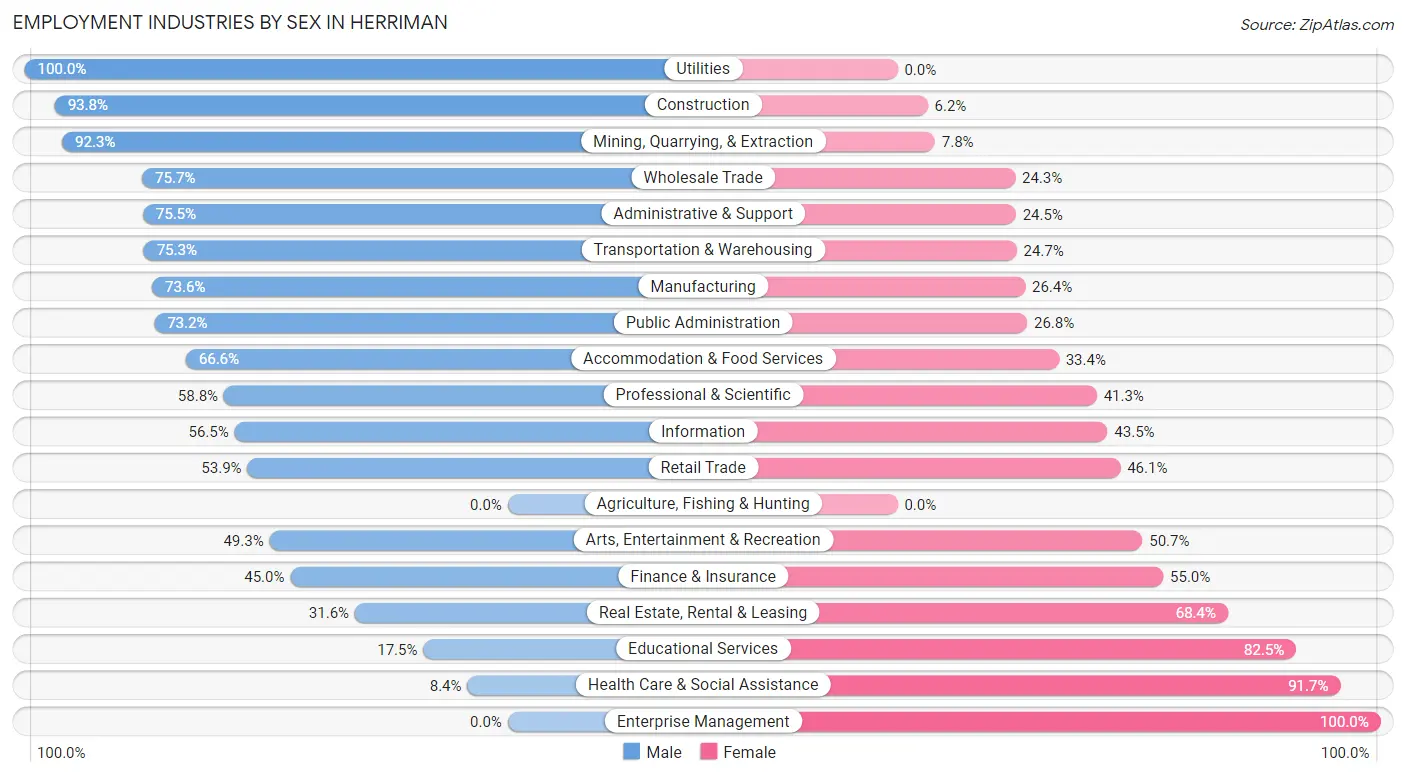
| Industry | Male | Female |
| Agriculture, Fishing & Hunting | 0 (0.0%) | 0 (0.0%) |
| Mining, Quarrying, & Extraction | 262 (92.2%) | 22 (7.7%) |
| Construction | 2,012 (93.8%) | 134 (6.2%) |
| Manufacturing | 1,438 (73.6%) | 516 (26.4%) |
| Wholesale Trade | 519 (75.7%) | 167 (24.3%) |
| Retail Trade | 1,868 (53.9%) | 1,599 (46.1%) |
| Transportation & Warehousing | 990 (75.3%) | 324 (24.7%) |
| Utilities | 392 (100.0%) | 0 (0.0%) |
| Information | 242 (56.5%) | 186 (43.5%) |
| Finance & Insurance | 916 (45.0%) | 1,119 (55.0%) |
| Real Estate, Rental & Leasing | 124 (31.6%) | 268 (68.4%) |
| Professional & Scientific | 1,648 (58.8%) | 1,157 (41.2%) |
| Enterprise Management | 0 (0.0%) | 19 (100.0%) |
| Administrative & Support | 620 (75.5%) | 201 (24.5%) |
| Educational Services | 449 (17.5%) | 2,119 (82.5%) |
| Health Care & Social Assistance | 274 (8.4%) | 3,009 (91.6%) |
| Arts, Entertainment & Recreation | 179 (49.3%) | 184 (50.7%) |
| Accommodation & Food Services | 816 (66.6%) | 409 (33.4%) |
| Public Administration | 1,137 (73.2%) | 417 (26.8%) |
| Total | 14,861 (54.3%) | 12,490 (45.7%) |
Education in Herriman
School Enrollment in Herriman
The most common levels of schooling among the 18,897 students in Herriman are elementary school (4,682 | 24.8%), middle school (4,401 | 23.3%), and high school (3,744 | 19.8%).
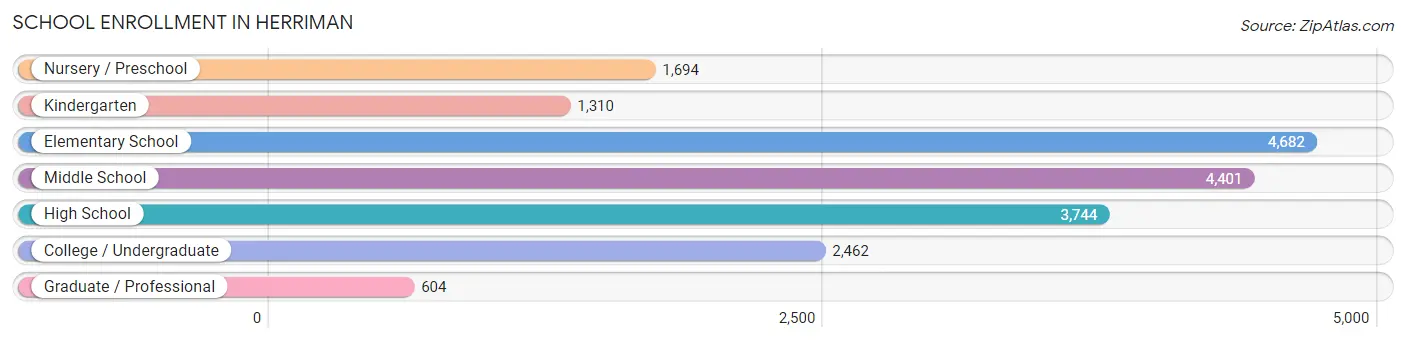
| School Level | # Students | % Students |
| Nursery / Preschool | 1,694 | 9.0% |
| Kindergarten | 1,310 | 6.9% |
| Elementary School | 4,682 | 24.8% |
| Middle School | 4,401 | 23.3% |
| High School | 3,744 | 19.8% |
| College / Undergraduate | 2,462 | 13.0% |
| Graduate / Professional | 604 | 3.2% |
| Total | 18,897 | 100.0% |
School Enrollment by Age by Funding Source in Herriman
Out of a total of 18,897 students who are enrolled in schools in Herriman, 1,965 (10.4%) attend a private institution, while the remaining 16,932 (89.6%) are enrolled in public schools. The age group of 3 to 4 year olds has the highest likelihood of being enrolled in private schools, with 500 (42.2% in the age bracket) enrolled. Conversely, the age group of 15 to 17 year olds has the lowest likelihood of being enrolled in a private school, with 2,982 (100.0% in the age bracket) attending a public institution.
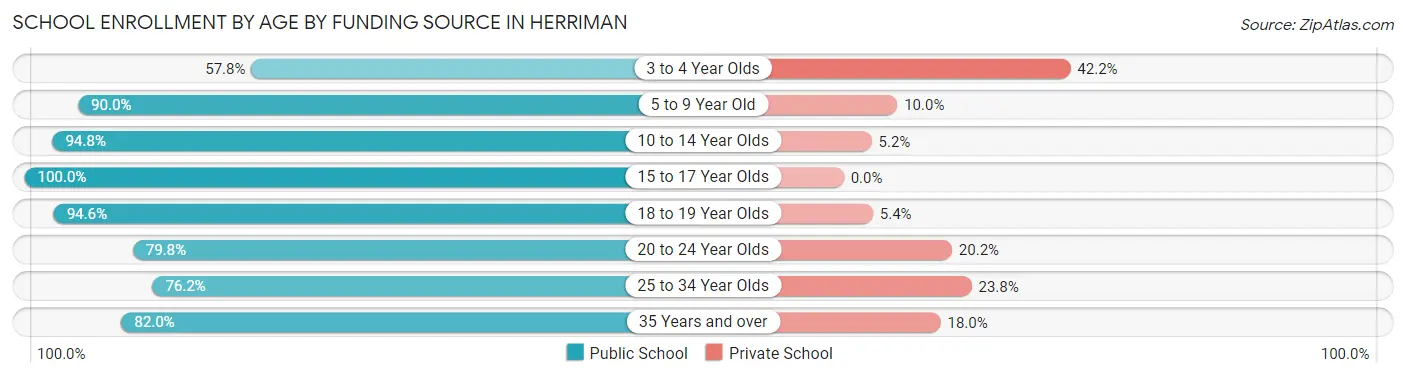
| Age Bracket | Public School | Private School |
| 3 to 4 Year Olds | 684 (57.8%) | 500 (42.2%) |
| 5 to 9 Year Old | 5,033 (90.0%) | 558 (10.0%) |
| 10 to 14 Year Olds | 5,378 (94.8%) | 295 (5.2%) |
| 15 to 17 Year Olds | 2,982 (100.0%) | 0 (0.0%) |
| 18 to 19 Year Olds | 557 (94.6%) | 32 (5.4%) |
| 20 to 24 Year Olds | 871 (79.8%) | 220 (20.2%) |
| 25 to 34 Year Olds | 614 (76.2%) | 192 (23.8%) |
| 35 Years and over | 804 (82.0%) | 177 (18.0%) |
| Total | 16,932 (89.6%) | 1,965 (10.4%) |
Educational Attainment by Field of Study in Herriman
Business (3,047 | 22.9%), education (1,962 | 14.7%), computers & mathematics (1,417 | 10.6%), arts & humanities (985 | 7.4%), and engineering (959 | 7.2%) are the most common fields of study among 13,324 individuals in Herriman who have obtained a bachelor's degree or higher.
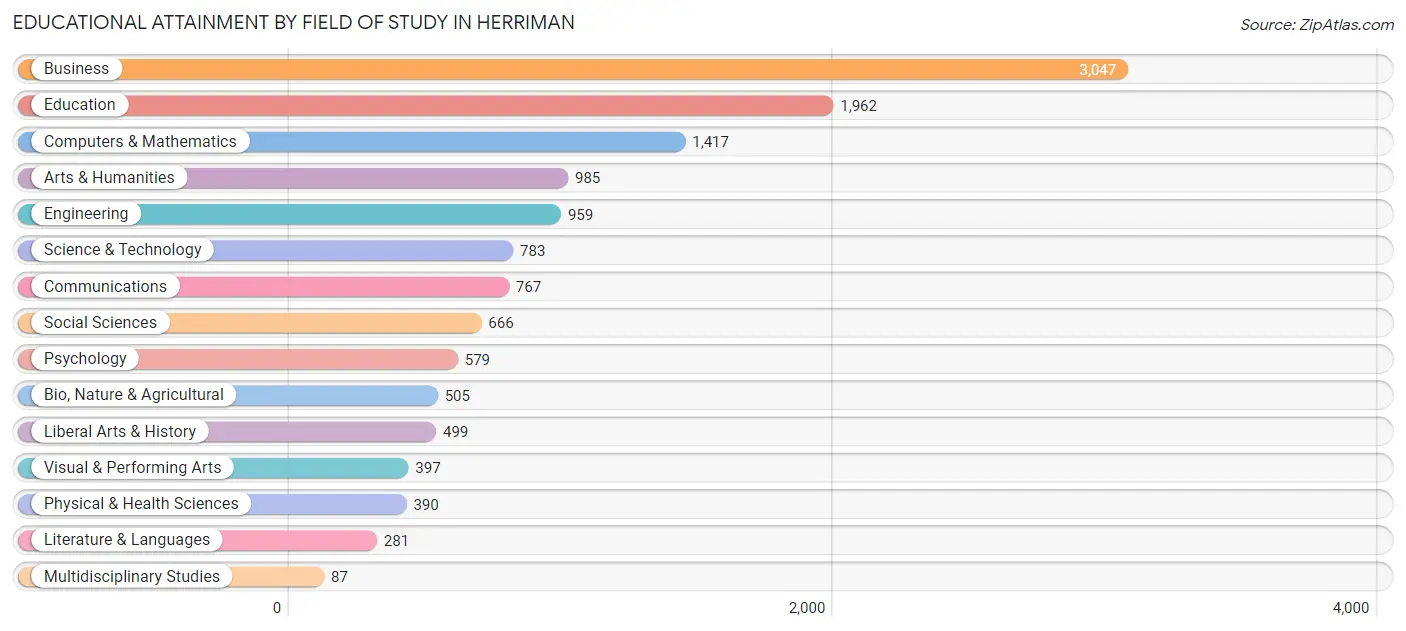
| Field of Study | # Graduates | % Graduates |
| Computers & Mathematics | 1,417 | 10.6% |
| Bio, Nature & Agricultural | 505 | 3.8% |
| Physical & Health Sciences | 390 | 2.9% |
| Psychology | 579 | 4.3% |
| Social Sciences | 666 | 5.0% |
| Engineering | 959 | 7.2% |
| Multidisciplinary Studies | 87 | 0.6% |
| Science & Technology | 783 | 5.9% |
| Business | 3,047 | 22.9% |
| Education | 1,962 | 14.7% |
| Literature & Languages | 281 | 2.1% |
| Liberal Arts & History | 499 | 3.7% |
| Visual & Performing Arts | 397 | 3.0% |
| Communications | 767 | 5.8% |
| Arts & Humanities | 985 | 7.4% |
| Total | 13,324 | 100.0% |
Transportation & Commute in Herriman
Vehicle Availability by Sex in Herriman
The most prevalent vehicle ownership categories in Herriman are males with 2 vehicles (6,777, accounting for 45.6%) and females with 2 vehicles (4,575, making up 54.8%).
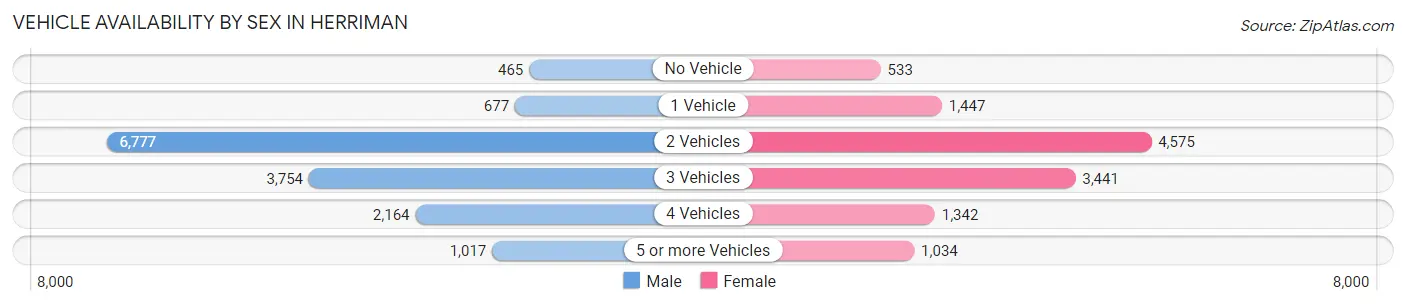
| Vehicles Available | Male | Female |
| No Vehicle | 465 (3.1%) | 533 (4.3%) |
| 1 Vehicle | 677 (4.6%) | 1,447 (11.7%) |
| 2 Vehicles | 6,777 (45.6%) | 4,575 (37.0%) |
| 3 Vehicles | 3,754 (25.3%) | 3,441 (27.8%) |
| 4 Vehicles | 2,164 (14.6%) | 1,342 (10.8%) |
| 5 or more Vehicles | 1,017 (6.9%) | 1,034 (8.4%) |
| Total | 14,854 (100.0%) | 12,372 (100.0%) |
Commute Time in Herriman
The most frequently occuring commute durations in Herriman are 20 to 24 minutes (3,535 commuters, 16.4%), 15 to 19 minutes (3,404 commuters, 15.8%), and 30 to 34 minutes (3,393 commuters, 15.7%).
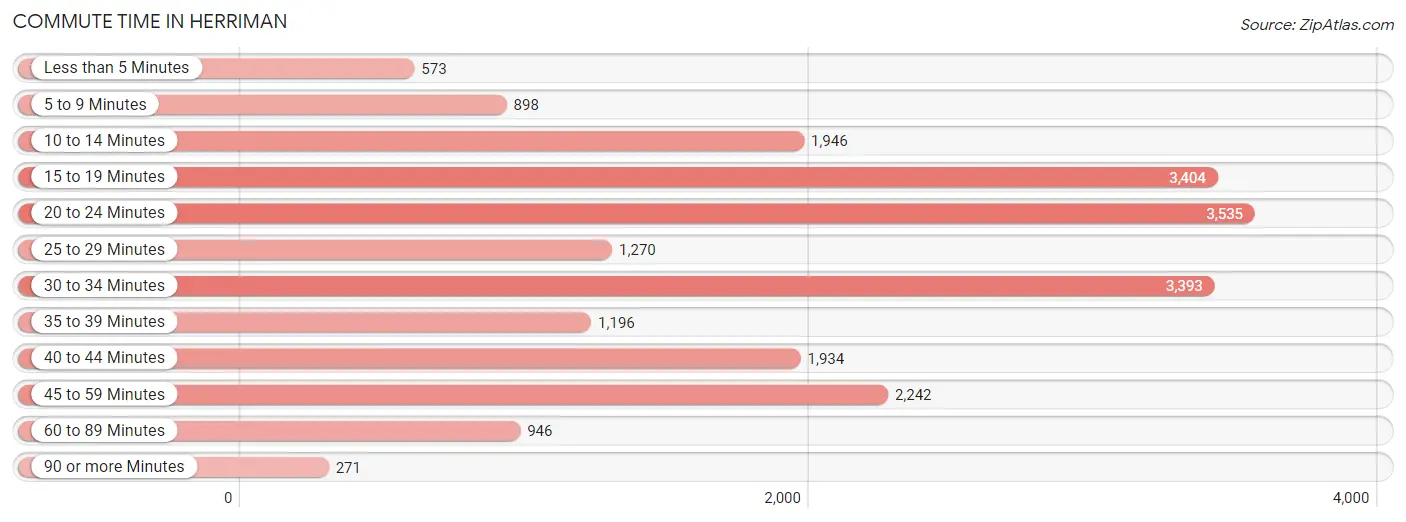
| Commute Time | # Commuters | % Commuters |
| Less than 5 Minutes | 573 | 2.6% |
| 5 to 9 Minutes | 898 | 4.2% |
| 10 to 14 Minutes | 1,946 | 9.0% |
| 15 to 19 Minutes | 3,404 | 15.8% |
| 20 to 24 Minutes | 3,535 | 16.4% |
| 25 to 29 Minutes | 1,270 | 5.9% |
| 30 to 34 Minutes | 3,393 | 15.7% |
| 35 to 39 Minutes | 1,196 | 5.5% |
| 40 to 44 Minutes | 1,934 | 8.9% |
| 45 to 59 Minutes | 2,242 | 10.4% |
| 60 to 89 Minutes | 946 | 4.4% |
| 90 or more Minutes | 271 | 1.3% |
Commute Time by Sex in Herriman
The most common commute times in Herriman are 30 to 34 minutes (2,272 commuters, 18.4%) for males and 20 to 24 minutes (1,957 commuters, 21.1%) for females.
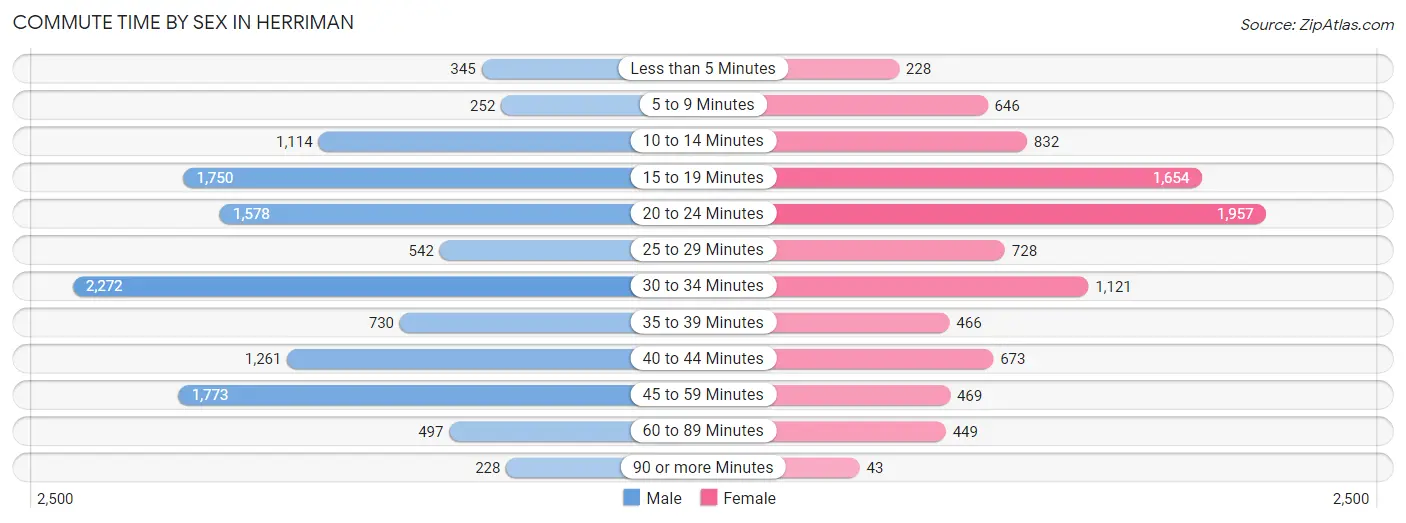
| Commute Time | Male | Female |
| Less than 5 Minutes | 345 (2.8%) | 228 (2.5%) |
| 5 to 9 Minutes | 252 (2.0%) | 646 (7.0%) |
| 10 to 14 Minutes | 1,114 (9.0%) | 832 (9.0%) |
| 15 to 19 Minutes | 1,750 (14.2%) | 1,654 (17.8%) |
| 20 to 24 Minutes | 1,578 (12.8%) | 1,957 (21.1%) |
| 25 to 29 Minutes | 542 (4.4%) | 728 (7.9%) |
| 30 to 34 Minutes | 2,272 (18.4%) | 1,121 (12.1%) |
| 35 to 39 Minutes | 730 (5.9%) | 466 (5.0%) |
| 40 to 44 Minutes | 1,261 (10.2%) | 673 (7.3%) |
| 45 to 59 Minutes | 1,773 (14.4%) | 469 (5.1%) |
| 60 to 89 Minutes | 497 (4.0%) | 449 (4.9%) |
| 90 or more Minutes | 228 (1.8%) | 43 (0.5%) |
Time of Departure to Work by Sex in Herriman
The most frequent times of departure to work in Herriman are 7:00 AM to 7:29 AM (2,131, 17.3%) for males and 7:00 AM to 7:29 AM (1,255, 13.5%) for females.
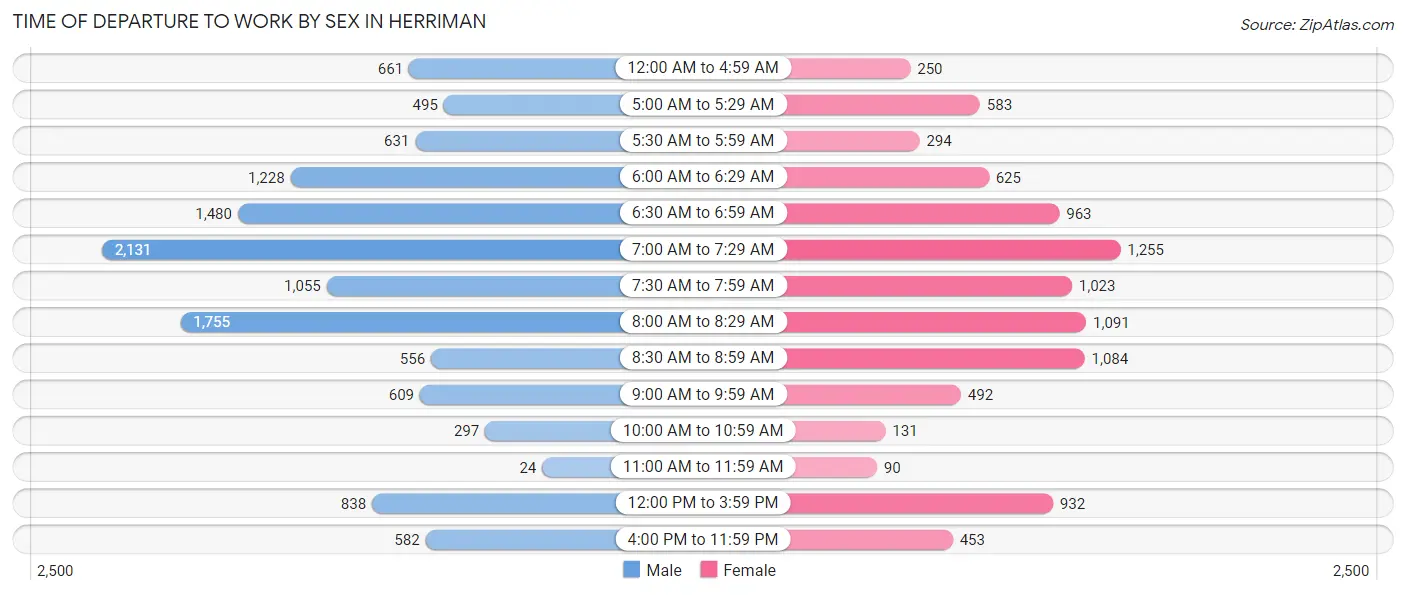
| Time of Departure | Male | Female |
| 12:00 AM to 4:59 AM | 661 (5.4%) | 250 (2.7%) |
| 5:00 AM to 5:29 AM | 495 (4.0%) | 583 (6.3%) |
| 5:30 AM to 5:59 AM | 631 (5.1%) | 294 (3.2%) |
| 6:00 AM to 6:29 AM | 1,228 (10.0%) | 625 (6.8%) |
| 6:30 AM to 6:59 AM | 1,480 (12.0%) | 963 (10.4%) |
| 7:00 AM to 7:29 AM | 2,131 (17.3%) | 1,255 (13.5%) |
| 7:30 AM to 7:59 AM | 1,055 (8.6%) | 1,023 (11.0%) |
| 8:00 AM to 8:29 AM | 1,755 (14.2%) | 1,091 (11.8%) |
| 8:30 AM to 8:59 AM | 556 (4.5%) | 1,084 (11.7%) |
| 9:00 AM to 9:59 AM | 609 (4.9%) | 492 (5.3%) |
| 10:00 AM to 10:59 AM | 297 (2.4%) | 131 (1.4%) |
| 11:00 AM to 11:59 AM | 24 (0.2%) | 90 (1.0%) |
| 12:00 PM to 3:59 PM | 838 (6.8%) | 932 (10.1%) |
| 4:00 PM to 11:59 PM | 582 (4.7%) | 453 (4.9%) |
| Total | 12,342 (100.0%) | 9,266 (100.0%) |
Housing Occupancy in Herriman
Occupancy by Ownership in Herriman
Of the total 16,075 dwellings in Herriman, owner-occupied units account for 13,080 (81.4%), while renter-occupied units make up 2,995 (18.6%).
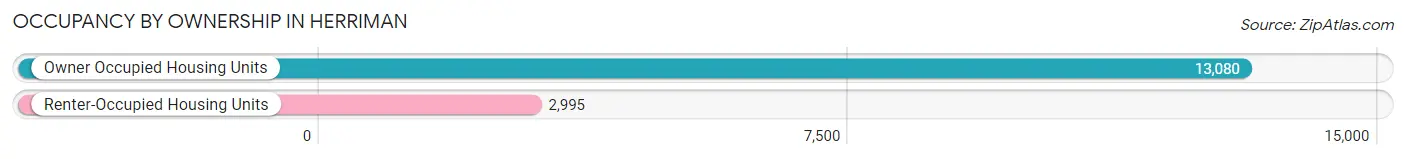
| Occupancy | # Housing Units | % Housing Units |
| Owner Occupied Housing Units | 13,080 | 81.4% |
| Renter-Occupied Housing Units | 2,995 | 18.6% |
| Total Occupied Housing Units | 16,075 | 100.0% |
Occupancy by Household Size in Herriman
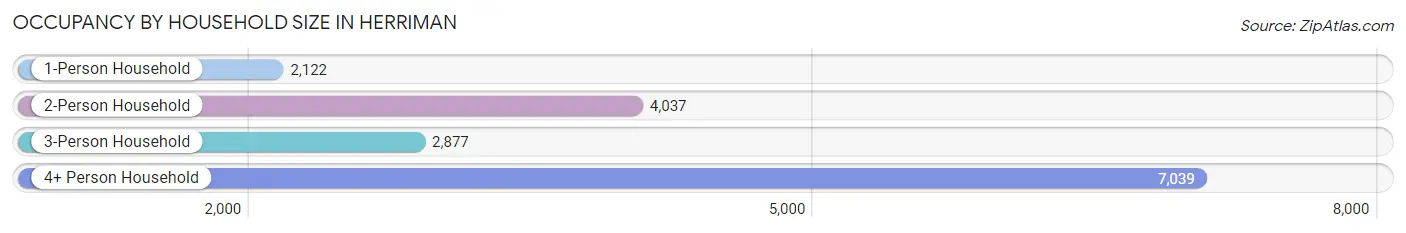
| Household Size | # Housing Units | % Housing Units |
| 1-Person Household | 2,122 | 13.2% |
| 2-Person Household | 4,037 | 25.1% |
| 3-Person Household | 2,877 | 17.9% |
| 4+ Person Household | 7,039 | 43.8% |
| Total Housing Units | 16,075 | 100.0% |
Occupancy by Ownership by Household Size in Herriman
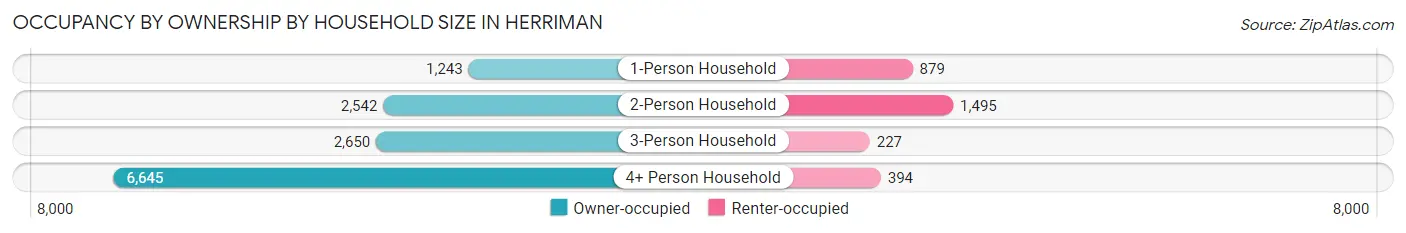
| Household Size | Owner-occupied | Renter-occupied |
| 1-Person Household | 1,243 (58.6%) | 879 (41.4%) |
| 2-Person Household | 2,542 (63.0%) | 1,495 (37.0%) |
| 3-Person Household | 2,650 (92.1%) | 227 (7.9%) |
| 4+ Person Household | 6,645 (94.4%) | 394 (5.6%) |
| Total Housing Units | 13,080 (81.4%) | 2,995 (18.6%) |
Occupancy by Educational Attainment in Herriman
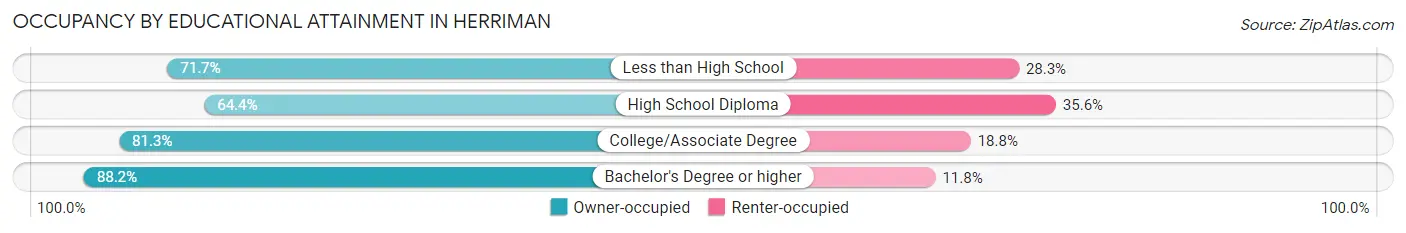
| Household Size | Owner-occupied | Renter-occupied |
| Less than High School | 352 (71.7%) | 139 (28.3%) |
| High School Diploma | 1,669 (64.4%) | 924 (35.6%) |
| College/Associate Degree | 4,696 (81.2%) | 1,084 (18.8%) |
| Bachelor's Degree or higher | 6,363 (88.2%) | 848 (11.8%) |
Occupancy by Age of Householder in Herriman
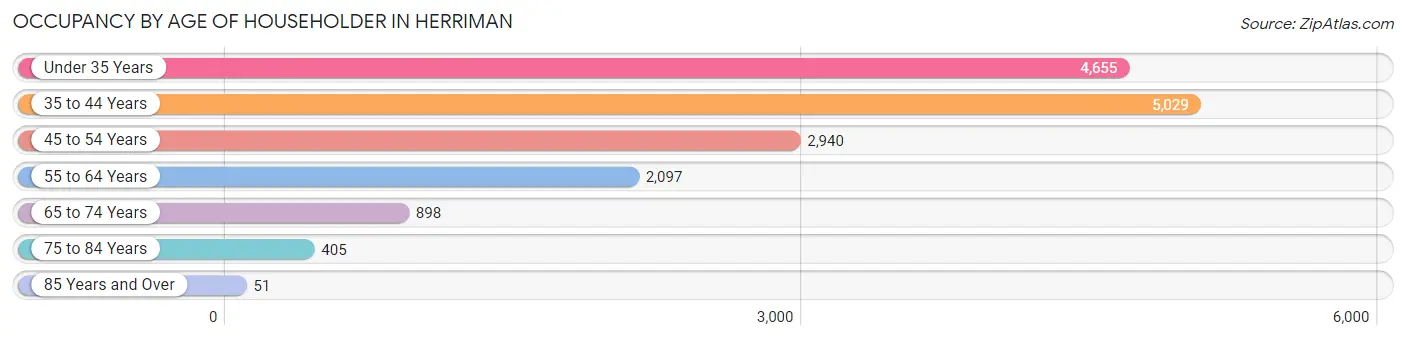
| Age Bracket | # Households | % Households |
| Under 35 Years | 4,655 | 29.0% |
| 35 to 44 Years | 5,029 | 31.3% |
| 45 to 54 Years | 2,940 | 18.3% |
| 55 to 64 Years | 2,097 | 13.1% |
| 65 to 74 Years | 898 | 5.6% |
| 75 to 84 Years | 405 | 2.5% |
| 85 Years and Over | 51 | 0.3% |
| Total | 16,075 | 100.0% |
Housing Finances in Herriman
Median Income by Occupancy in Herriman
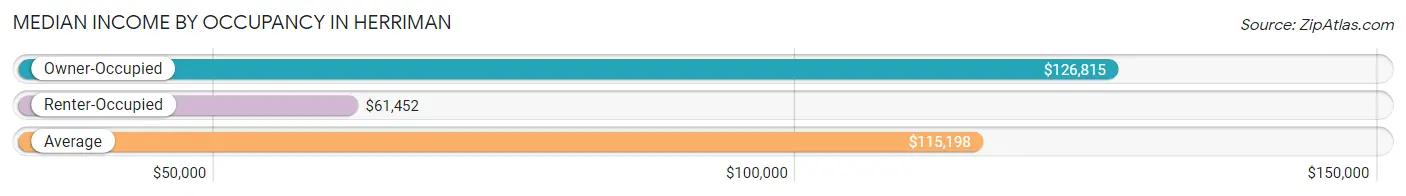
| Occupancy Type | # Households | Median Income |
| Owner-Occupied | 13,080 (81.4%) | $126,815 |
| Renter-Occupied | 2,995 (18.6%) | $61,452 |
| Average | 16,075 (100.0%) | $115,198 |
Occupancy by Householder Income Bracket in Herriman
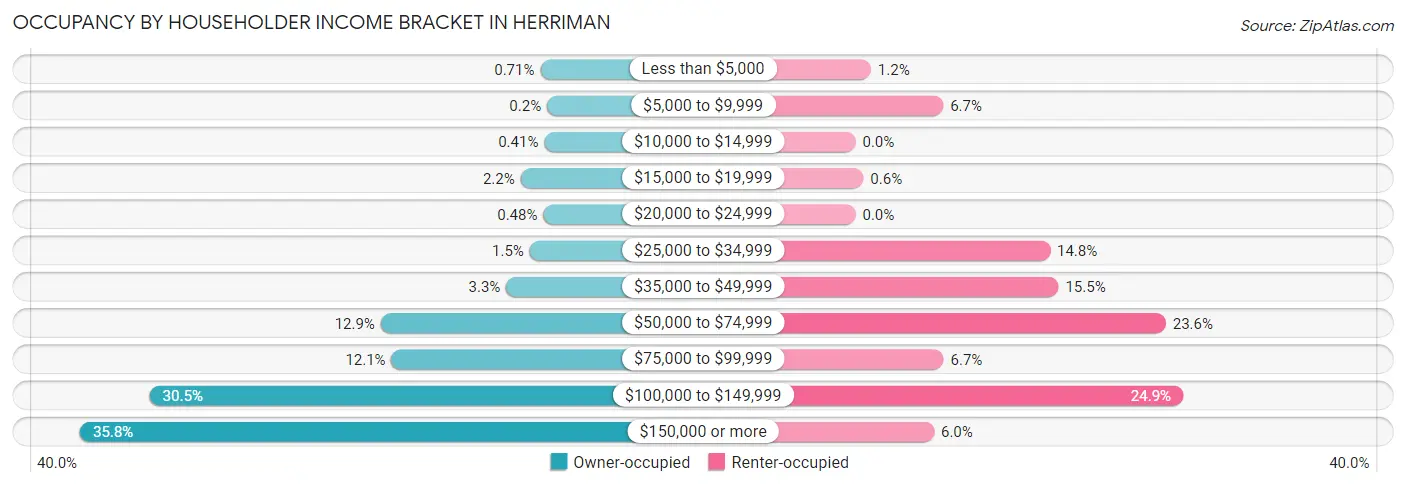
| Income Bracket | Owner-occupied | Renter-occupied |
| Less than $5,000 | 93 (0.7%) | 35 (1.2%) |
| $5,000 to $9,999 | 26 (0.2%) | 200 (6.7%) |
| $10,000 to $14,999 | 53 (0.4%) | 0 (0.0%) |
| $15,000 to $19,999 | 289 (2.2%) | 18 (0.6%) |
| $20,000 to $24,999 | 63 (0.5%) | 0 (0.0%) |
| $25,000 to $34,999 | 199 (1.5%) | 444 (14.8%) |
| $35,000 to $49,999 | 433 (3.3%) | 463 (15.5%) |
| $50,000 to $74,999 | 1,683 (12.9%) | 708 (23.6%) |
| $75,000 to $99,999 | 1,576 (12.0%) | 201 (6.7%) |
| $100,000 to $149,999 | 3,985 (30.5%) | 747 (24.9%) |
| $150,000 or more | 4,680 (35.8%) | 179 (6.0%) |
| Total | 13,080 (100.0%) | 2,995 (100.0%) |
Monthly Housing Cost Tiers in Herriman
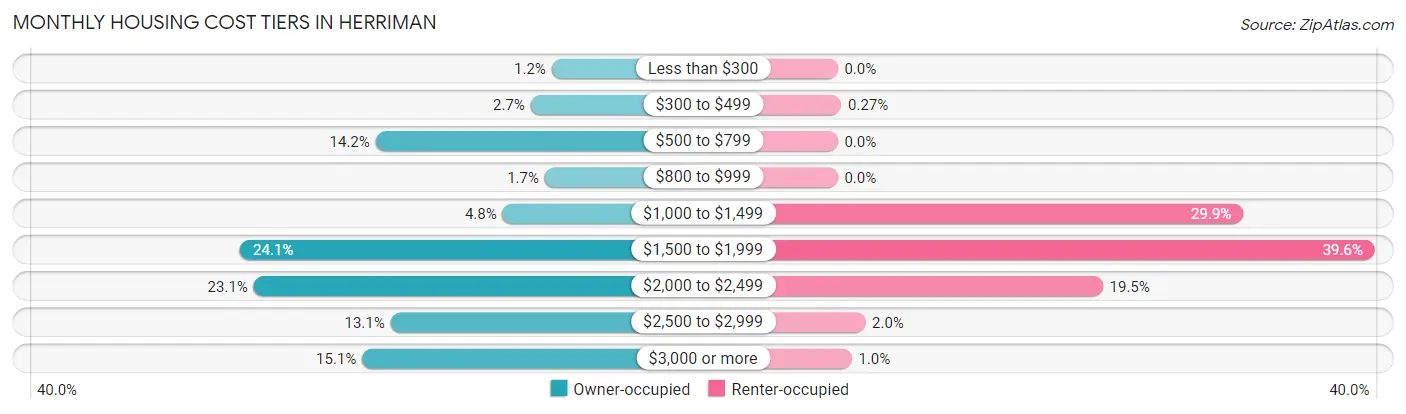
| Monthly Cost | Owner-occupied | Renter-occupied |
| Less than $300 | 154 (1.2%) | 0 (0.0%) |
| $300 to $499 | 357 (2.7%) | 8 (0.3%) |
| $500 to $799 | 1,851 (14.1%) | 0 (0.0%) |
| $800 to $999 | 221 (1.7%) | 0 (0.0%) |
| $1,000 to $1,499 | 628 (4.8%) | 895 (29.9%) |
| $1,500 to $1,999 | 3,156 (24.1%) | 1,185 (39.6%) |
| $2,000 to $2,499 | 3,026 (23.1%) | 585 (19.5%) |
| $2,500 to $2,999 | 1,707 (13.1%) | 61 (2.0%) |
| $3,000 or more | 1,980 (15.1%) | 31 (1.0%) |
| Total | 13,080 (100.0%) | 2,995 (100.0%) |
Physical Housing Characteristics in Herriman
Housing Structures in Herriman
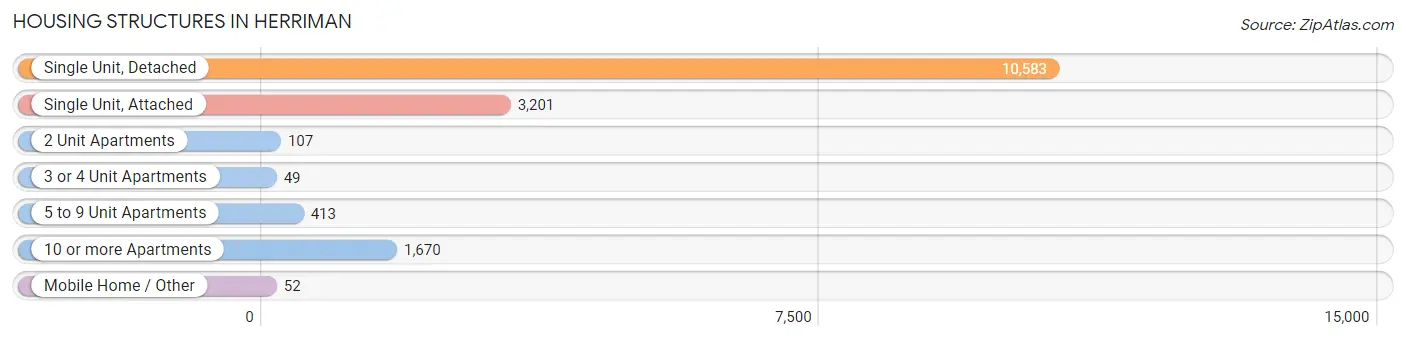
| Structure Type | # Housing Units | % Housing Units |
| Single Unit, Detached | 10,583 | 65.8% |
| Single Unit, Attached | 3,201 | 19.9% |
| 2 Unit Apartments | 107 | 0.7% |
| 3 or 4 Unit Apartments | 49 | 0.3% |
| 5 to 9 Unit Apartments | 413 | 2.6% |
| 10 or more Apartments | 1,670 | 10.4% |
| Mobile Home / Other | 52 | 0.3% |
| Total | 16,075 | 100.0% |
Housing Structures by Occupancy in Herriman
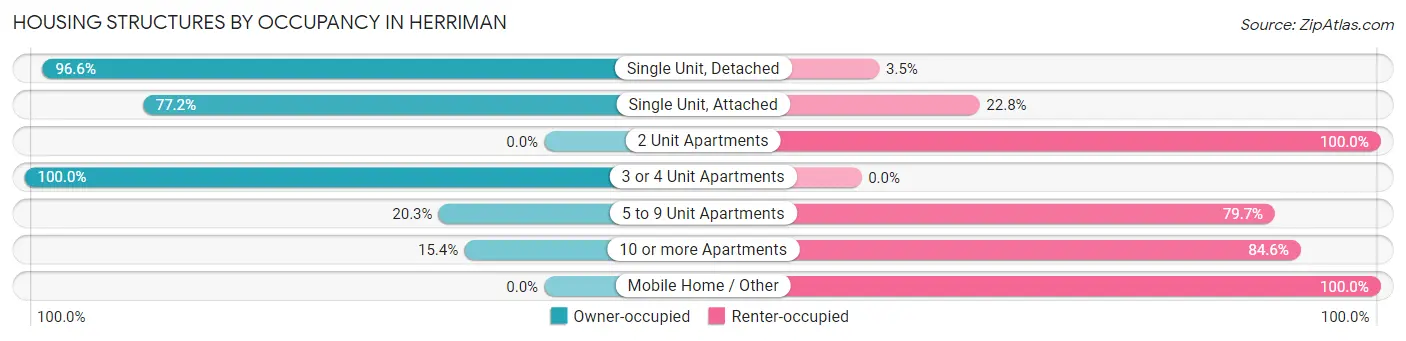
| Structure Type | Owner-occupied | Renter-occupied |
| Single Unit, Detached | 10,218 (96.6%) | 365 (3.5%) |
| Single Unit, Attached | 2,472 (77.2%) | 729 (22.8%) |
| 2 Unit Apartments | 0 (0.0%) | 107 (100.0%) |
| 3 or 4 Unit Apartments | 49 (100.0%) | 0 (0.0%) |
| 5 to 9 Unit Apartments | 84 (20.3%) | 329 (79.7%) |
| 10 or more Apartments | 257 (15.4%) | 1,413 (84.6%) |
| Mobile Home / Other | 0 (0.0%) | 52 (100.0%) |
| Total | 13,080 (81.4%) | 2,995 (18.6%) |
Housing Structures by Number of Rooms in Herriman
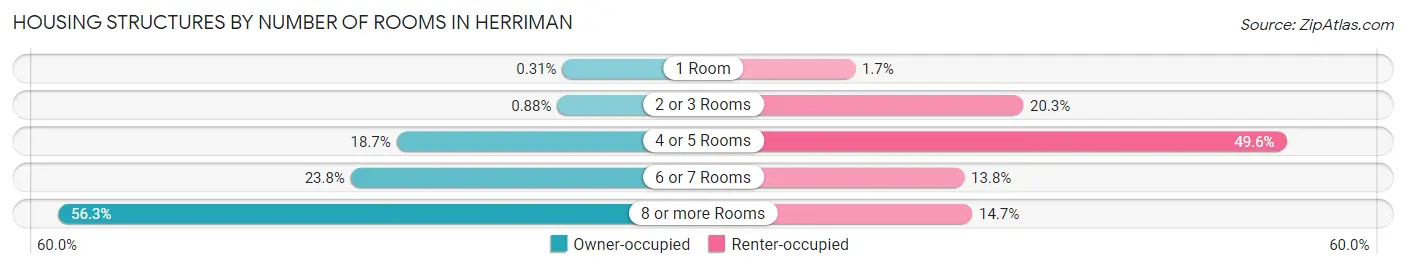
| Number of Rooms | Owner-occupied | Renter-occupied |
| 1 Room | 40 (0.3%) | 50 (1.7%) |
| 2 or 3 Rooms | 115 (0.9%) | 609 (20.3%) |
| 4 or 5 Rooms | 2,449 (18.7%) | 1,484 (49.5%) |
| 6 or 7 Rooms | 3,114 (23.8%) | 413 (13.8%) |
| 8 or more Rooms | 7,362 (56.3%) | 439 (14.7%) |
| Total | 13,080 (100.0%) | 2,995 (100.0%) |
Housing Structure by Heating Type in Herriman
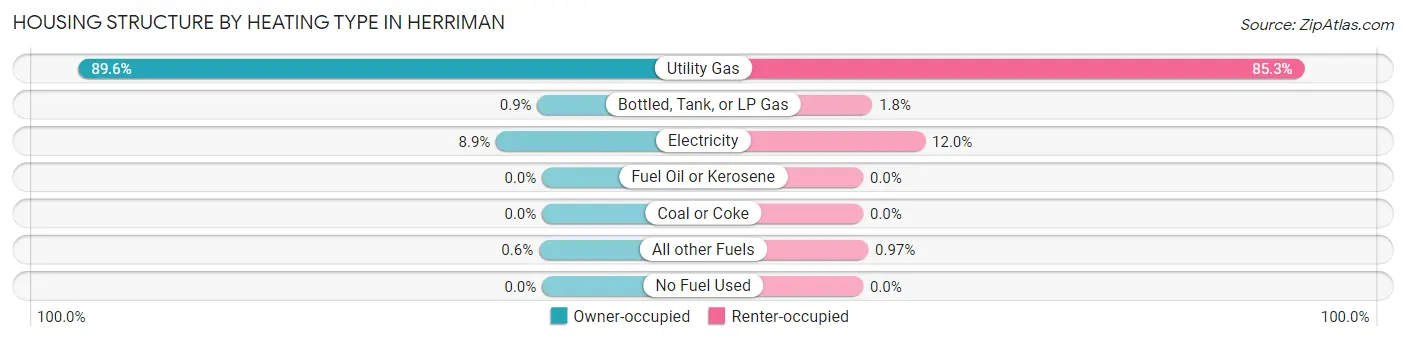
| Heating Type | Owner-occupied | Renter-occupied |
| Utility Gas | 11,722 (89.6%) | 2,554 (85.3%) |
| Bottled, Tank, or LP Gas | 118 (0.9%) | 53 (1.8%) |
| Electricity | 1,162 (8.9%) | 359 (12.0%) |
| Fuel Oil or Kerosene | 0 (0.0%) | 0 (0.0%) |
| Coal or Coke | 0 (0.0%) | 0 (0.0%) |
| All other Fuels | 78 (0.6%) | 29 (1.0%) |
| No Fuel Used | 0 (0.0%) | 0 (0.0%) |
| Total | 13,080 (100.0%) | 2,995 (100.0%) |
Household Vehicle Usage in Herriman
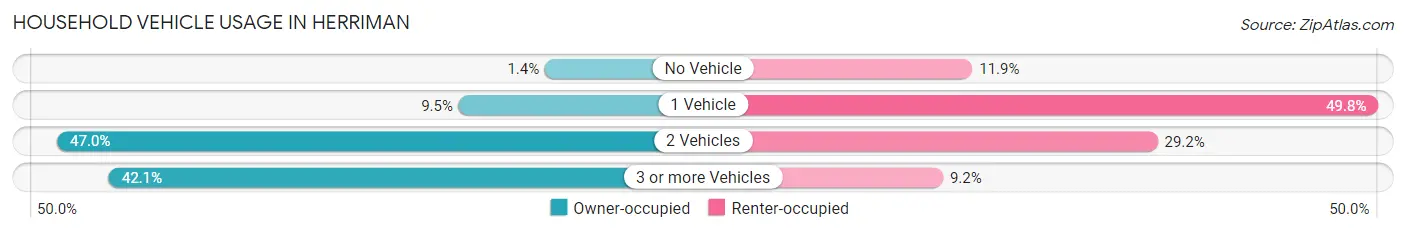
| Vehicles per Household | Owner-occupied | Renter-occupied |
| No Vehicle | 186 (1.4%) | 356 (11.9%) |
| 1 Vehicle | 1,239 (9.5%) | 1,491 (49.8%) |
| 2 Vehicles | 6,143 (47.0%) | 874 (29.2%) |
| 3 or more Vehicles | 5,512 (42.1%) | 274 (9.1%) |
| Total | 13,080 (100.0%) | 2,995 (100.0%) |
Real Estate & Mortgages in Herriman
Real Estate and Mortgage Overview in Herriman
| Characteristic | Without Mortgage | With Mortgage |
| Housing Units | 2,357 | 10,723 |
| Median Property Value | $496,400 | $484,300 |
| Median Household Income | $122,674 | $3,966 |
| Monthly Housing Costs | $610 | $1,980 |
| Real Estate Taxes | $3,554 | $203 |
Property Value by Mortgage Status in Herriman
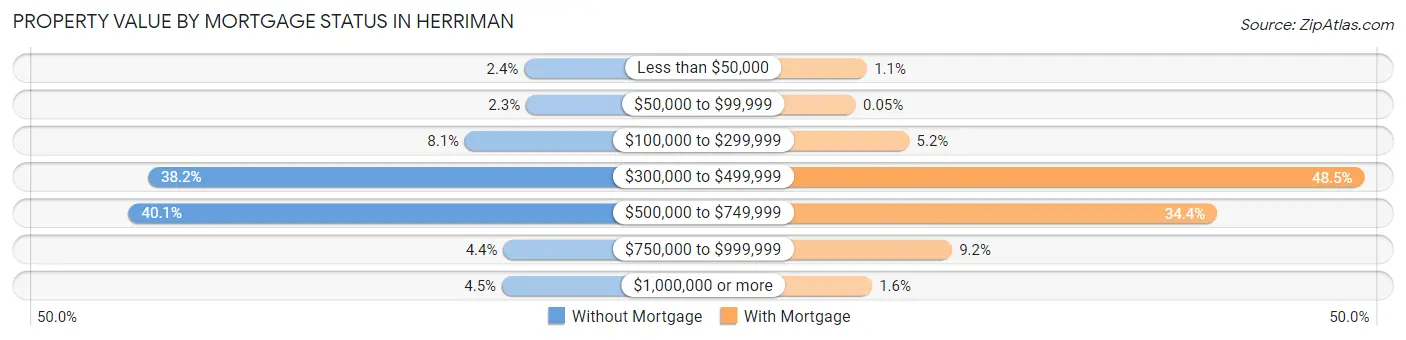
| Property Value | Without Mortgage | With Mortgage |
| Less than $50,000 | 57 (2.4%) | 119 (1.1%) |
| $50,000 to $99,999 | 53 (2.2%) | 5 (0.1%) |
| $100,000 to $299,999 | 190 (8.1%) | 552 (5.1%) |
| $300,000 to $499,999 | 901 (38.2%) | 5,196 (48.5%) |
| $500,000 to $749,999 | 945 (40.1%) | 3,692 (34.4%) |
| $750,000 to $999,999 | 104 (4.4%) | 988 (9.2%) |
| $1,000,000 or more | 107 (4.5%) | 171 (1.6%) |
| Total | 2,357 (100.0%) | 10,723 (100.0%) |
Household Income by Mortgage Status in Herriman
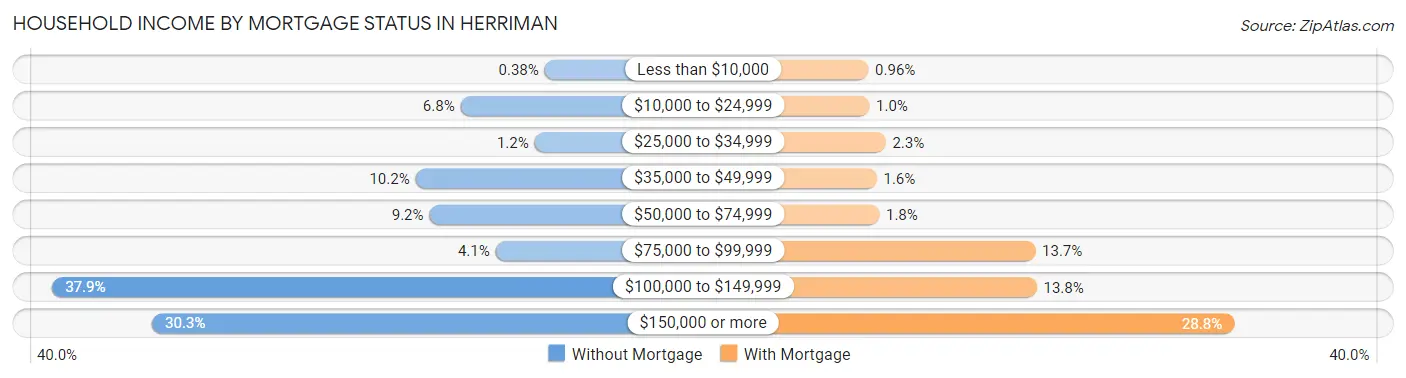
| Household Income | Without Mortgage | With Mortgage |
| Less than $10,000 | 9 (0.4%) | 103 (1.0%) |
| $10,000 to $24,999 | 160 (6.8%) | 110 (1.0%) |
| $25,000 to $34,999 | 27 (1.1%) | 245 (2.3%) |
| $35,000 to $49,999 | 241 (10.2%) | 172 (1.6%) |
| $50,000 to $74,999 | 216 (9.2%) | 192 (1.8%) |
| $75,000 to $99,999 | 97 (4.1%) | 1,467 (13.7%) |
| $100,000 to $149,999 | 893 (37.9%) | 1,479 (13.8%) |
| $150,000 or more | 714 (30.3%) | 3,092 (28.8%) |
| Total | 2,357 (100.0%) | 10,723 (100.0%) |
Property Value to Household Income Ratio in Herriman
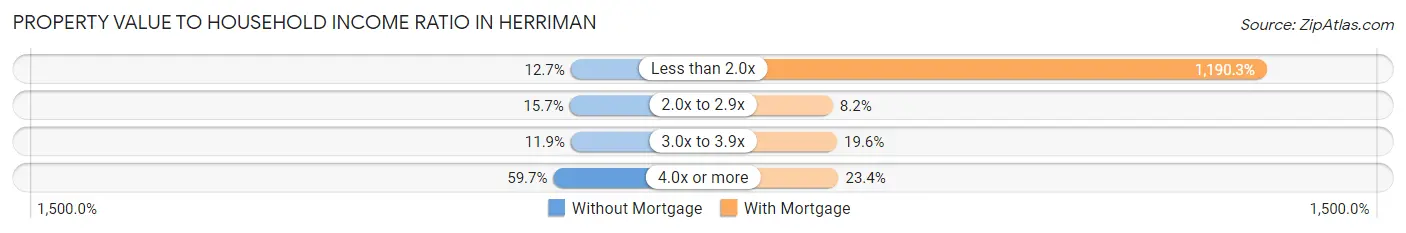
| Value-to-Income Ratio | Without Mortgage | With Mortgage |
| Less than 2.0x | 300 (12.7%) | 127,632 (1,190.3%) |
| 2.0x to 2.9x | 369 (15.7%) | 875 (8.2%) |
| 3.0x to 3.9x | 280 (11.9%) | 2,097 (19.6%) |
| 4.0x or more | 1,408 (59.7%) | 2,511 (23.4%) |
| Total | 2,357 (100.0%) | 10,723 (100.0%) |
Real Estate Taxes by Mortgage Status in Herriman
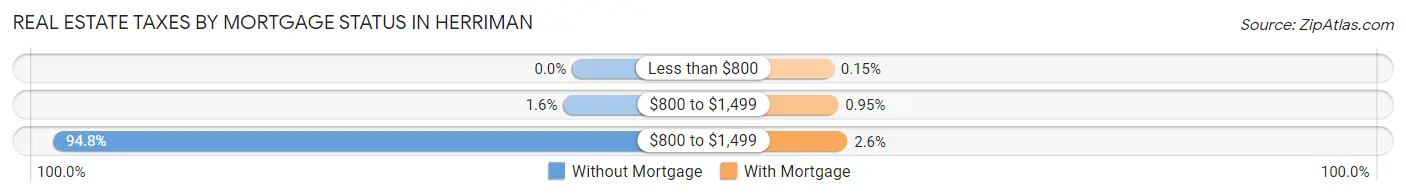
| Property Taxes | Without Mortgage | With Mortgage |
| Less than $800 | 0 (0.0%) | 16 (0.2%) |
| $800 to $1,499 | 38 (1.6%) | 102 (0.9%) |
| $800 to $1,499 | 2,234 (94.8%) | 279 (2.6%) |
| Total | 2,357 (100.0%) | 10,723 (100.0%) |
Health & Disability in Herriman
Health Insurance Coverage by Age in Herriman
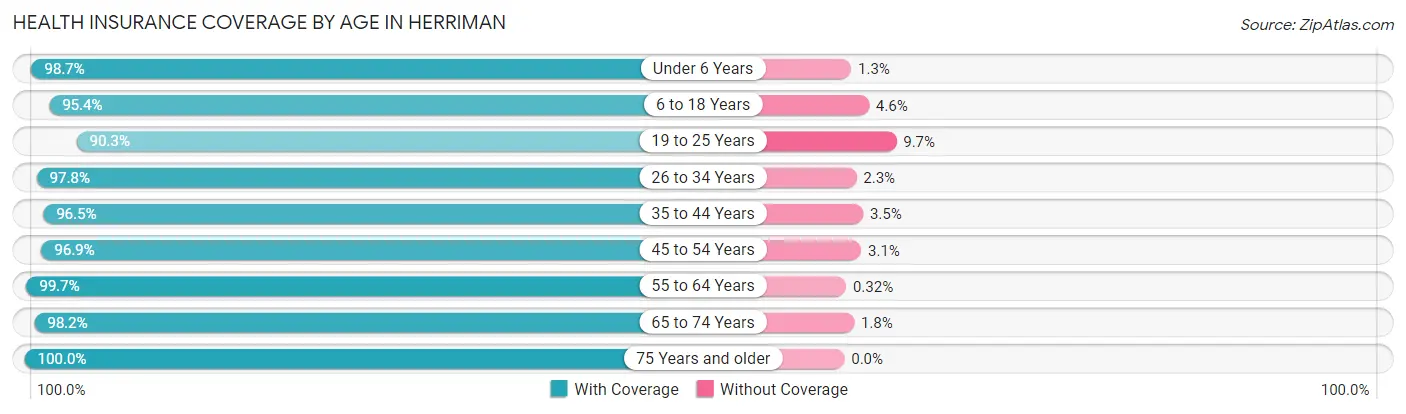
| Age Bracket | With Coverage | Without Coverage |
| Under 6 Years | 6,607 (98.7%) | 85 (1.3%) |
| 6 to 18 Years | 13,623 (95.4%) | 656 (4.6%) |
| 19 to 25 Years | 3,847 (90.3%) | 413 (9.7%) |
| 26 to 34 Years | 8,847 (97.8%) | 204 (2.2%) |
| 35 to 44 Years | 8,780 (96.5%) | 317 (3.5%) |
| 45 to 54 Years | 5,904 (96.9%) | 191 (3.1%) |
| 55 to 64 Years | 3,467 (99.7%) | 11 (0.3%) |
| 65 to 74 Years | 1,625 (98.2%) | 30 (1.8%) |
| 75 Years and older | 666 (100.0%) | 0 (0.0%) |
| Total | 53,366 (96.6%) | 1,907 (3.5%) |
Health Insurance Coverage by Citizenship Status in Herriman
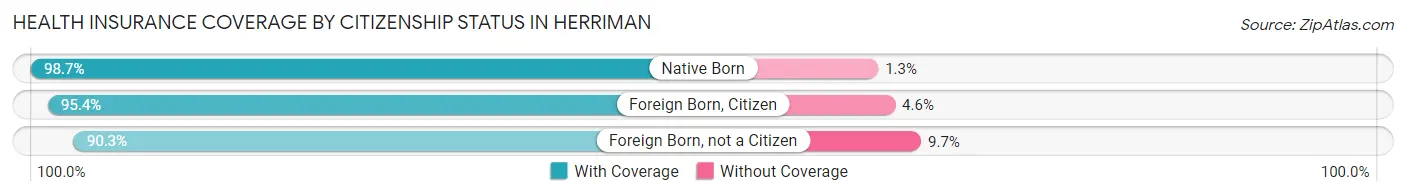
| Citizenship Status | With Coverage | Without Coverage |
| Native Born | 6,607 (98.7%) | 85 (1.3%) |
| Foreign Born, Citizen | 13,623 (95.4%) | 656 (4.6%) |
| Foreign Born, not a Citizen | 3,847 (90.3%) | 413 (9.7%) |
Health Insurance Coverage by Household Income in Herriman
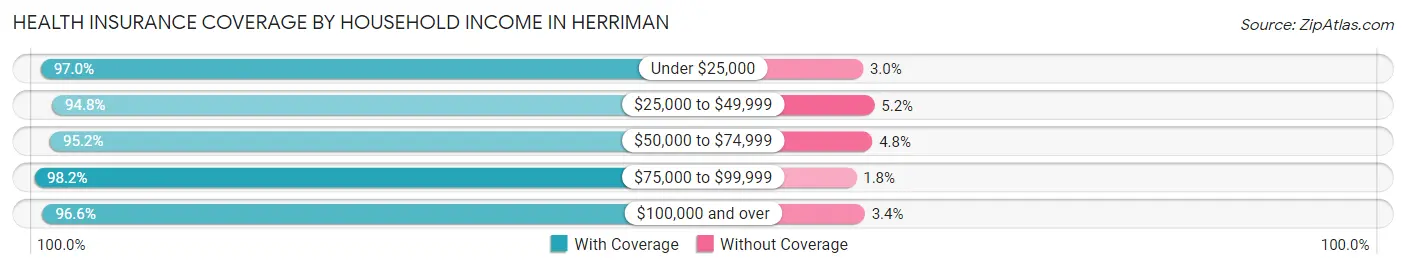
| Household Income | With Coverage | Without Coverage |
| Under $25,000 | 2,047 (97.0%) | 64 (3.0%) |
| $25,000 to $49,999 | 3,300 (94.8%) | 180 (5.2%) |
| $50,000 to $74,999 | 5,864 (95.2%) | 294 (4.8%) |
| $75,000 to $99,999 | 5,972 (98.2%) | 108 (1.8%) |
| $100,000 and over | 36,183 (96.6%) | 1,257 (3.4%) |
Public vs Private Health Insurance Coverage by Age in Herriman
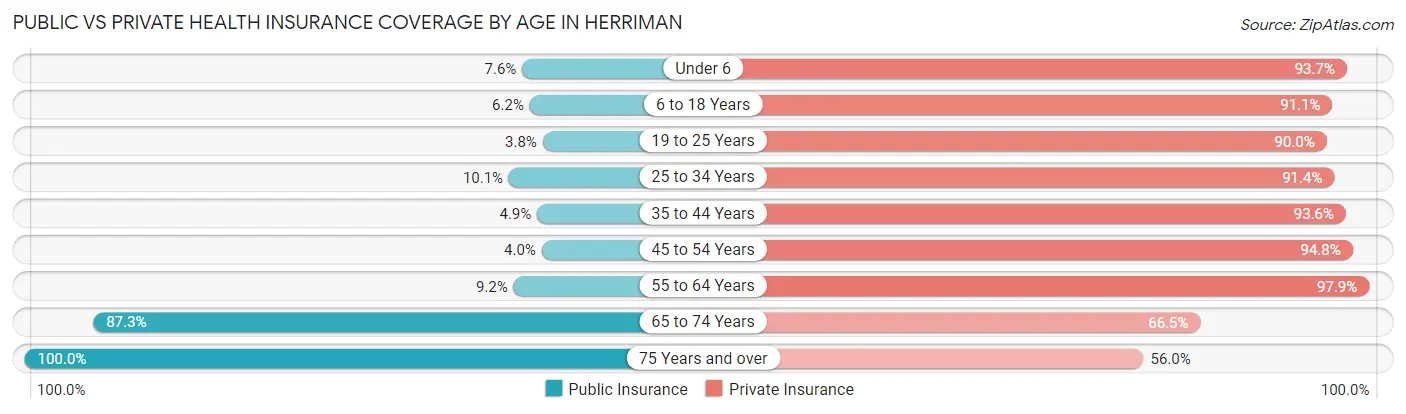
| Age Bracket | Public Insurance | Private Insurance |
| Under 6 | 511 (7.6%) | 6,272 (93.7%) |
| 6 to 18 Years | 891 (6.2%) | 13,002 (91.1%) |
| 19 to 25 Years | 163 (3.8%) | 3,833 (90.0%) |
| 25 to 34 Years | 914 (10.1%) | 8,273 (91.4%) |
| 35 to 44 Years | 443 (4.9%) | 8,511 (93.6%) |
| 45 to 54 Years | 245 (4.0%) | 5,778 (94.8%) |
| 55 to 64 Years | 321 (9.2%) | 3,404 (97.9%) |
| 65 to 74 Years | 1,444 (87.3%) | 1,101 (66.5%) |
| 75 Years and over | 666 (100.0%) | 373 (56.0%) |
| Total | 5,598 (10.1%) | 50,547 (91.4%) |
Disability Status by Sex by Age in Herriman
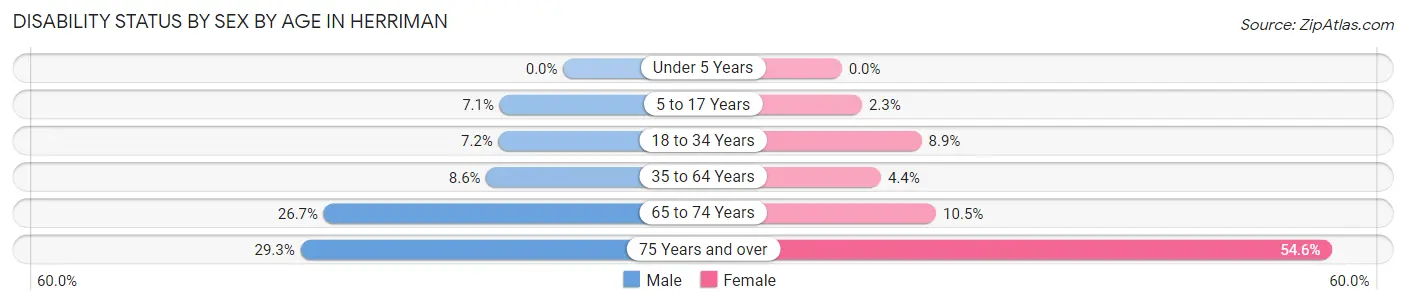
| Age Bracket | Male | Female |
| Under 5 Years | 0 (0.0%) | 0 (0.0%) |
| 5 to 17 Years | 510 (7.1%) | 167 (2.2%) |
| 18 to 34 Years | 480 (7.2%) | 656 (8.9%) |
| 35 to 64 Years | 772 (8.6%) | 422 (4.4%) |
| 65 to 74 Years | 180 (26.7%) | 103 (10.5%) |
| 75 Years and over | 84 (29.3%) | 207 (54.6%) |
Disability Class by Sex by Age in Herriman
Disability Class: Hearing Difficulty
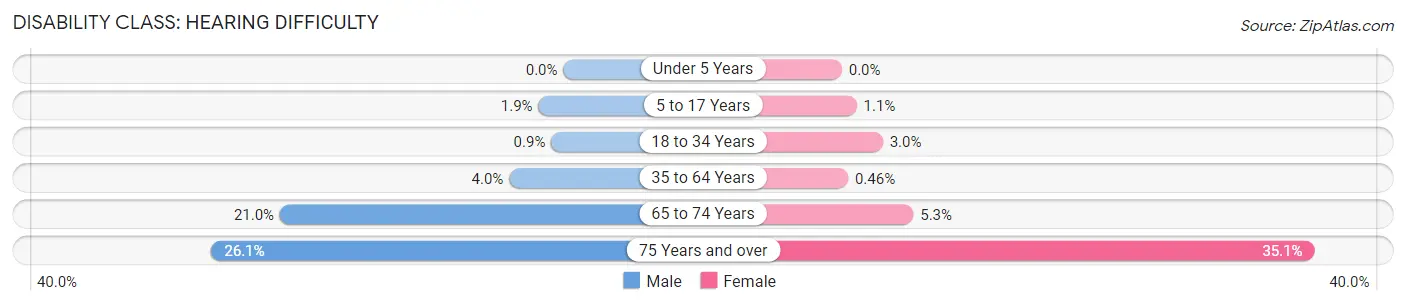
| Age Bracket | Male | Female |
| Under 5 Years | 0 (0.0%) | 0 (0.0%) |
| 5 to 17 Years | 133 (1.8%) | 82 (1.1%) |
| 18 to 34 Years | 60 (0.9%) | 224 (3.0%) |
| 35 to 64 Years | 362 (4.0%) | 44 (0.5%) |
| 65 to 74 Years | 142 (21.0%) | 52 (5.3%) |
| 75 Years and over | 75 (26.1%) | 133 (35.1%) |
Disability Class: Vision Difficulty
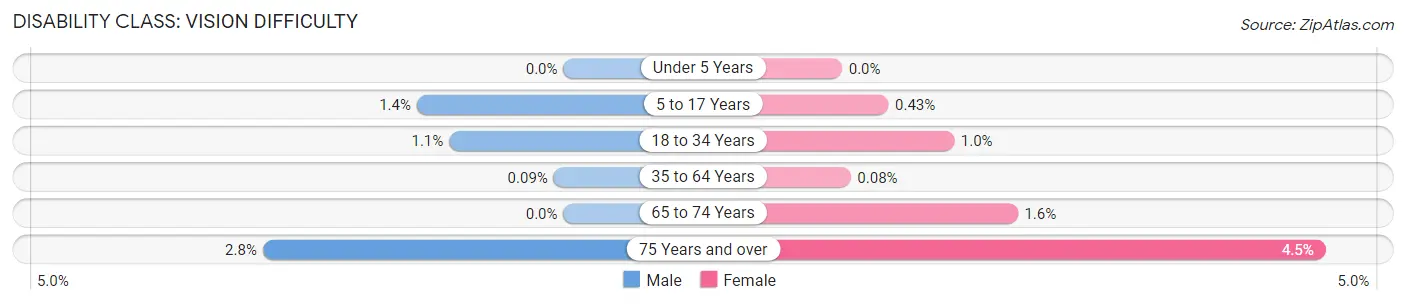
| Age Bracket | Male | Female |
| Under 5 Years | 0 (0.0%) | 0 (0.0%) |
| 5 to 17 Years | 98 (1.4%) | 32 (0.4%) |
| 18 to 34 Years | 71 (1.1%) | 77 (1.0%) |
| 35 to 64 Years | 8 (0.1%) | 8 (0.1%) |
| 65 to 74 Years | 0 (0.0%) | 16 (1.6%) |
| 75 Years and over | 8 (2.8%) | 17 (4.5%) |
Disability Class: Cognitive Difficulty
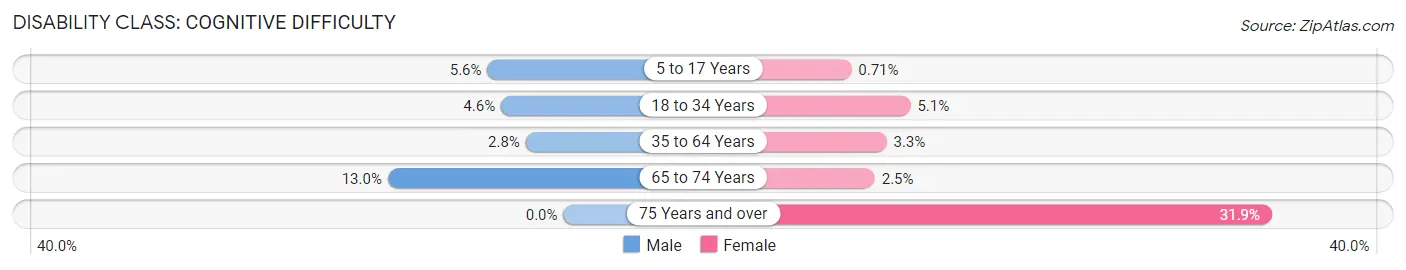
| Age Bracket | Male | Female |
| 5 to 17 Years | 406 (5.6%) | 53 (0.7%) |
| 18 to 34 Years | 309 (4.6%) | 376 (5.1%) |
| 35 to 64 Years | 252 (2.8%) | 321 (3.3%) |
| 65 to 74 Years | 88 (13.0%) | 24 (2.5%) |
| 75 Years and over | 0 (0.0%) | 121 (31.9%) |
Disability Class: Ambulatory Difficulty
| Age Bracket | Male | Female |
| 5 to 17 Years | 83 (1.1%) | 0 (0.0%) |
| 18 to 34 Years | 55 (0.8%) | 93 (1.3%) |
| 35 to 64 Years | 166 (1.8%) | 210 (2.2%) |
| 65 to 74 Years | 46 (6.8%) | 64 (6.5%) |
| 75 Years and over | 17 (5.9%) | 84 (22.2%) |
Disability Class: Self-Care Difficulty
| Age Bracket | Male | Female |
| 5 to 17 Years | 67 (0.9%) | 32 (0.4%) |
| 18 to 34 Years | 47 (0.7%) | 15 (0.2%) |
| 35 to 64 Years | 54 (0.6%) | 56 (0.6%) |
| 65 to 74 Years | 8 (1.2%) | 0 (0.0%) |
| 75 Years and over | 8 (2.8%) | 25 (6.6%) |
Technology Access in Herriman
Computing Device Access in Herriman
| Device Type | # Households | % Households |
| Desktop or Laptop | 15,295 | 95.2% |
| Smartphone | 15,600 | 97.1% |
| Tablet | 12,157 | 75.6% |
| No Computing Device | 9 | 0.1% |
| Total | 16,075 | 100.0% |
Internet Access in Herriman
| Internet Type | # Households | % Households |
| Dial-Up Internet | 38 | 0.2% |
| Broadband Home | 14,817 | 92.2% |
| Cellular Data Only | 604 | 3.8% |
| Satellite Internet | 1,404 | 8.7% |
| No Internet | 207 | 1.3% |
| Total | 16,075 | 100.0% |
Herriman Summary
Herriman, Utah is a city located in Salt Lake County, Utah, United States. It is a suburb of Salt Lake City and is part of the Salt Lake City metropolitan area. The population was 21,785 as of the 2010 census, making it the fourth-largest city in the county.
History
Herriman was first settled in 1849 by a group of Mormon pioneers led by Robert Herriman. The town was originally known as South Jordan, but was later renamed Herriman in honor of its founder. The town was incorporated in 1999, and has since grown rapidly.
Geography
Herriman is located in the southwestern corner of Salt Lake County, at the base of the Wasatch Mountains. It is bordered by the cities of Riverton and Bluffdale to the north, South Jordan to the east, and Draper to the south. The city covers an area of approximately 25 square miles.
The terrain of Herriman is mostly flat, with some rolling hills in the northern and eastern parts of the city. The city is located at an elevation of 4,400 feet above sea level.
Economy
Herriman's economy is largely based on the service industry, with many businesses providing services to the surrounding communities. The city is home to several large employers, including the University of Utah Health Care, Intermountain Healthcare, and the Salt Lake City International Airport.
The city also has a growing retail sector, with several large shopping centers located in the city. These include the Herriman Towne Center, the Herriman Commons, and the Herriman Marketplace.
Demographics
As of the 2010 census, Herriman had a population of 21,785. The racial makeup of the city was 87.3% White, 4.2% Hispanic or Latino, 2.7% Asian, 1.3% African American, 0.7% Native American, and 0.2% Pacific Islander.
The median household income in Herriman was $77,845 in 2019, and the median home value was $372,000. The city has a high rate of homeownership, with nearly 80% of residents owning their own homes.
Conclusion
Herriman, Utah is a rapidly growing city located in Salt Lake County. It is a suburb of Salt Lake City and is part of the Salt Lake City metropolitan area. The city has a diverse economy, with many businesses providing services to the surrounding communities. The population of Herriman is largely white, with a median household income of $77,845 and a median home value of $372,000. The city has a high rate of homeownership, with nearly 80% of residents owning their own homes.
Common Questions
What is Per Capita Income in Herriman?
Per Capita income in Herriman is $37,331.
What is the Median Family Income in Herriman?
Median Family Income in Herriman is $124,052.
What is the Median Household income in Herriman?
Median Household Income in Herriman is $115,198.
What is Income or Wage Gap in Herriman?
Income or Wage Gap in Herriman is 51.8%.
Women in Herriman earn 48.2 cents for every dollar earned by a man.
What is Family Income Deficit in Herriman?
Family Income Deficit in Herriman is $11,849.
Families that are below poverty line in Herriman earn $11,849 less on average than the poverty threshold level.
What is Inequality or Gini Index in Herriman?
Inequality or Gini Index in Herriman is 0.34.
What is the Total Population of Herriman?
Total Population of Herriman is 55,301.
What is the Total Male Population of Herriman?
Total Male Population of Herriman is 27,246.
What is the Total Female Population of Herriman?
Total Female Population of Herriman is 28,055.
What is the Ratio of Males per 100 Females in Herriman?
There are 97.12 Males per 100 Females in Herriman.
What is the Ratio of Females per 100 Males in Herriman?
There are 102.97 Females per 100 Males in Herriman.
What is the Median Population Age in Herriman?
Median Population Age in Herriman is 28.4 Years.
What is the Average Family Size in Herriman
Average Family Size in Herriman is 3.8 People.
What is the Average Household Size in Herriman
Average Household Size in Herriman is 3.4 People.
How Large is the Labor Force in Herriman?
There are 28,263 People in the Labor Forcein in Herriman.
What is the Percentage of People in the Labor Force in Herriman?
75.9% of People are in the Labor Force in Herriman.
What is the Unemployment Rate in Herriman?
Unemployment Rate in Herriman is 3.2%.