Juneau city and borough, AK Map & Demographics
Juneau city and borough Overview
$49,207
PER CAPITA INCOME
$113,750
AVG FAMILY INCOME
$95,711
AVG HOUSEHOLD INCOME
17.9%
WAGE / INCOME GAP [ % ]
82.1¢/ $1
WAGE / INCOME GAP [ $ ]
$9,921
FAMILY INCOME DEFICIT
0.40
INEQUALITY / GINI INDEX
32,108
TOTAL POPULATION
16,461
MALE POPULATION
15,647
FEMALE POPULATION
105.20
MALES / 100 FEMALES
95.05
FEMALES / 100 MALES
39.0
MEDIAN AGE
3.1
AVG FAMILY SIZE
2.4
AVG HOUSEHOLD SIZE
17,486
LABOR FORCE [ PEOPLE ]
66.6%
PERCENT IN LABOR FORCE
4.5%
UNEMPLOYMENT RATE
Income in Juneau city and borough
Income Overview in Juneau city and borough
Per Capita Income in Juneau city and borough is $49,207, while median incomes of families and households are $113,750 and $95,711 respectively.
| Characteristic | Number | Measure |
| Per Capita Income | 32,108 | $49,207 |
| Median Family Income | 7,467 | $113,750 |
| Mean Family Income | 7,467 | $139,520 |
| Median Household Income | 13,017 | $95,711 |
| Mean Household Income | 13,017 | $117,189 |
| Income Deficit | 7,467 | $9,921 |
| Wage / Income Gap (%) | 32,108 | 17.85% |
| Wage / Income Gap ($) | 32,108 | 82.15¢ per $1 |
| Gini / Inequality Index | 32,108 | 0.40 |
Earnings by Sex in Juneau city and borough
Average Earnings in Juneau city and borough are $52,020, $56,612 for men and $46,506 for women, a difference of 17.8%.
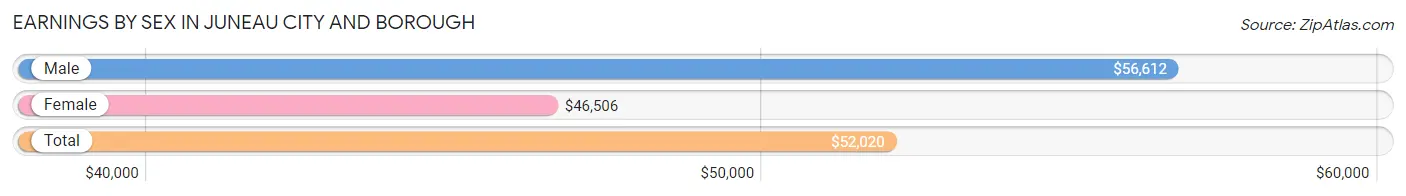
| Sex | Number | Average Earnings |
| Male | 9,858 (53.0%) | $56,612 |
| Female | 8,735 (47.0%) | $46,506 |
| Total | 18,593 (100.0%) | $52,020 |
Earnings by Sex by Income Bracket in Juneau city and borough
The most common earnings brackets in Juneau city and borough are $100,000+ for men (2,484 | 25.2%) and $100,000+ for women (1,182 | 13.5%).
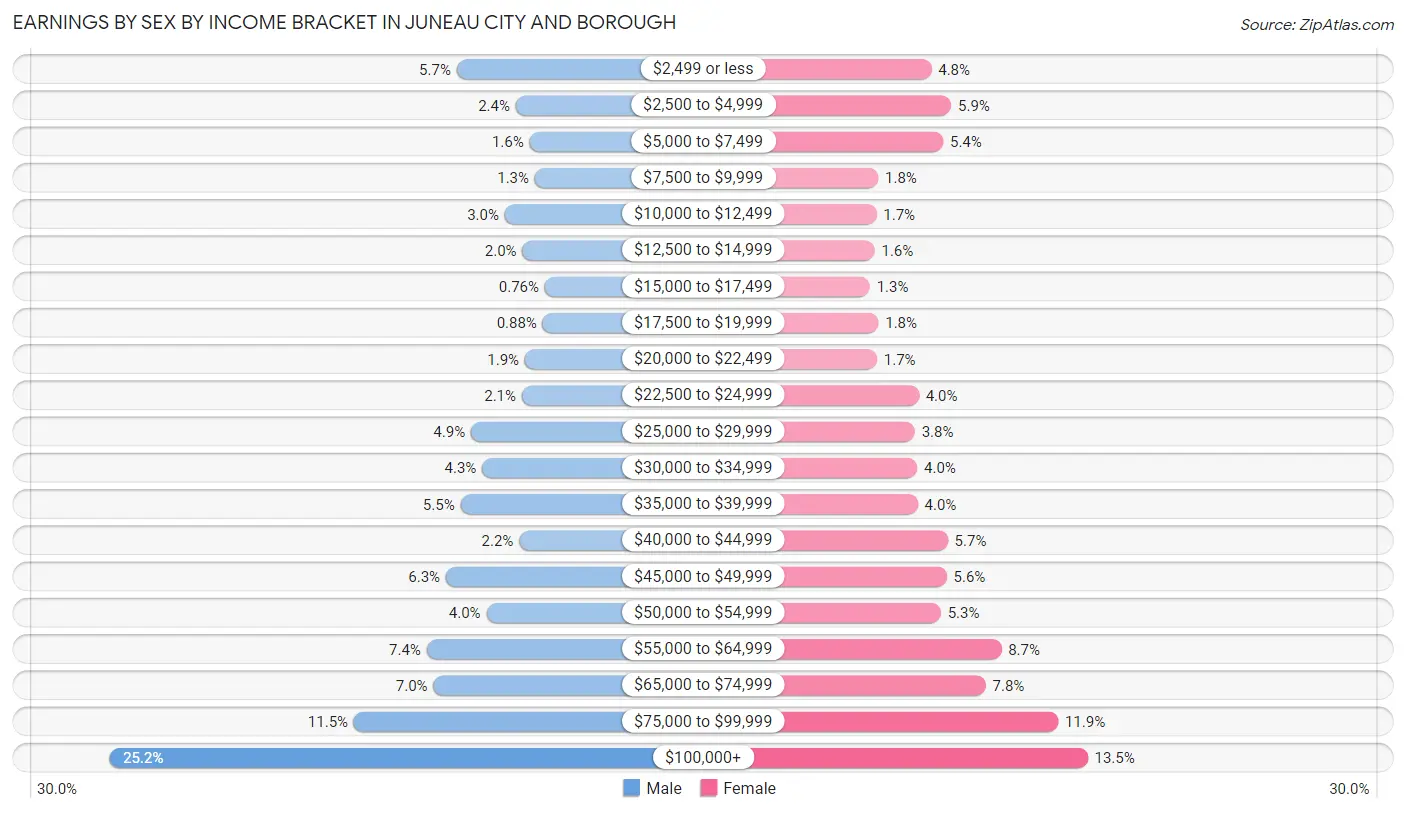
| Income | Male | Female |
| $2,499 or less | 563 (5.7%) | 415 (4.8%) |
| $2,500 to $4,999 | 236 (2.4%) | 512 (5.9%) |
| $5,000 to $7,499 | 160 (1.6%) | 473 (5.4%) |
| $7,500 to $9,999 | 130 (1.3%) | 154 (1.8%) |
| $10,000 to $12,499 | 297 (3.0%) | 145 (1.7%) |
| $12,500 to $14,999 | 199 (2.0%) | 136 (1.6%) |
| $15,000 to $17,499 | 75 (0.8%) | 113 (1.3%) |
| $17,500 to $19,999 | 87 (0.9%) | 155 (1.8%) |
| $20,000 to $22,499 | 185 (1.9%) | 148 (1.7%) |
| $22,500 to $24,999 | 202 (2.1%) | 353 (4.0%) |
| $25,000 to $29,999 | 484 (4.9%) | 334 (3.8%) |
| $30,000 to $34,999 | 422 (4.3%) | 345 (4.0%) |
| $35,000 to $39,999 | 542 (5.5%) | 348 (4.0%) |
| $40,000 to $44,999 | 217 (2.2%) | 495 (5.7%) |
| $45,000 to $49,999 | 623 (6.3%) | 490 (5.6%) |
| $50,000 to $54,999 | 398 (4.0%) | 461 (5.3%) |
| $55,000 to $64,999 | 729 (7.4%) | 758 (8.7%) |
| $65,000 to $74,999 | 692 (7.0%) | 681 (7.8%) |
| $75,000 to $99,999 | 1,133 (11.5%) | 1,037 (11.9%) |
| $100,000+ | 2,484 (25.2%) | 1,182 (13.5%) |
| Total | 9,858 (100.0%) | 8,735 (100.0%) |
Earnings by Sex by Educational Attainment in Juneau city and borough
Average earnings in Juneau city and borough are $63,837 for men and $53,421 for women, a difference of 16.3%. Men with an educational attainment of graduate degree enjoy the highest average annual earnings of $90,729, while those with high school diploma education earn the least with $45,205. Women with an educational attainment of graduate degree earn the most with the average annual earnings of $77,841, while those with less than high school education have the smallest earnings of $24,615.
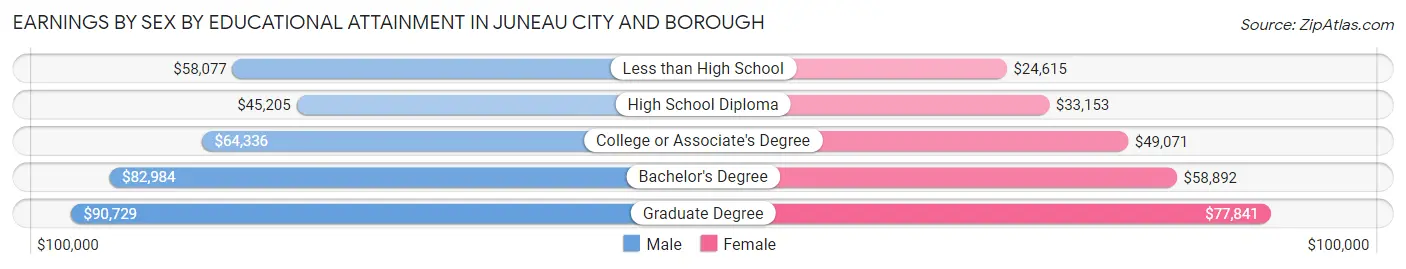
| Educational Attainment | Male Income | Female Income |
| Less than High School | $58,077 | $24,615 |
| High School Diploma | $45,205 | $33,153 |
| College or Associate's Degree | $64,336 | $49,071 |
| Bachelor's Degree | $82,984 | $58,892 |
| Graduate Degree | $90,729 | $77,841 |
| Total | $63,837 | $53,421 |
Family Income in Juneau city and borough
Family Income Brackets in Juneau city and borough
According to the Juneau city and borough family income data, there are 1,844 families falling into the $100,000 to $149,999 income range, which is the most common income bracket and makes up 24.7% of all families. Conversely, the $10,000 to $14,999 income bracket is the least frequent group with only 75 families (1.0%) belonging to this category.
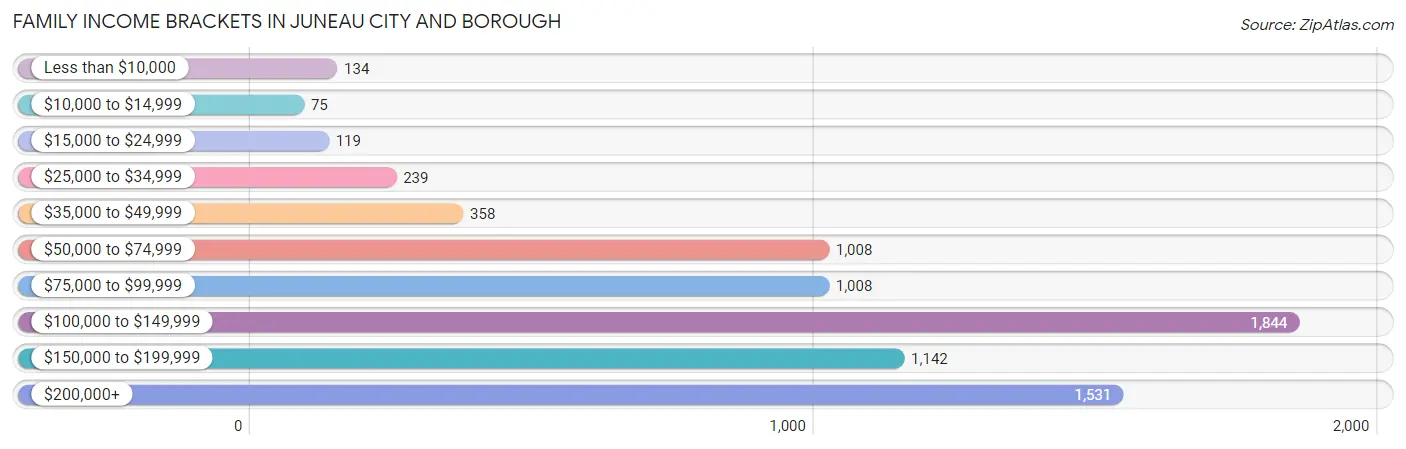
| Income Bracket | # Families | % Families |
| Less than $10,000 | 134 | 1.8% |
| $10,000 to $14,999 | 75 | 1.0% |
| $15,000 to $24,999 | 119 | 1.6% |
| $25,000 to $34,999 | 239 | 3.2% |
| $35,000 to $49,999 | 358 | 4.8% |
| $50,000 to $74,999 | 1,008 | 13.5% |
| $75,000 to $99,999 | 1,008 | 13.5% |
| $100,000 to $149,999 | 1,844 | 24.7% |
| $150,000 to $199,999 | 1,142 | 15.3% |
| $200,000+ | 1,531 | 20.5% |
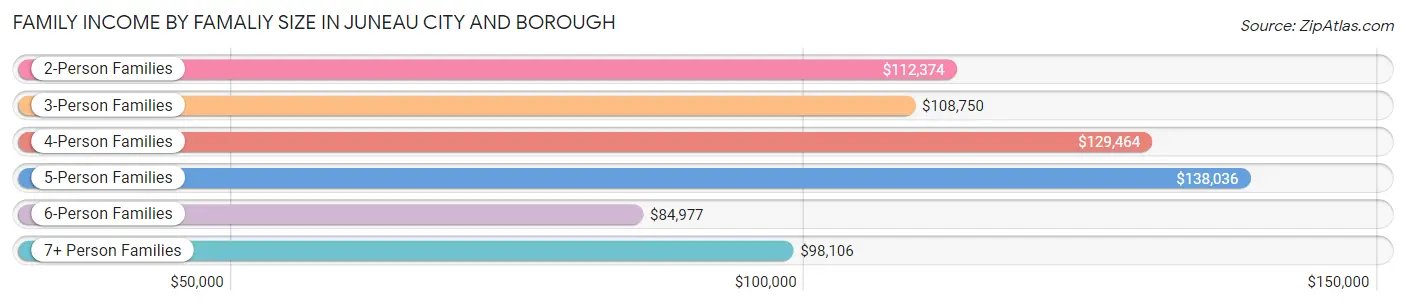
Family Income by Famaliy Size in Juneau city and borough
5-person families (509 | 6.8%) account for the highest median family income in Juneau city and borough with $138,036 per family, while 2-person families (3,640 | 48.7%) have the highest median income of $56,187 per family member.
| Income Bracket | # Families | Median Income |
| 2-Person Families | 3,640 (48.7%) | $112,374 |
| 3-Person Families | 1,656 (22.2%) | $108,750 |
| 4-Person Families | 1,211 (16.2%) | $129,464 |
| 5-Person Families | 509 (6.8%) | $138,036 |
| 6-Person Families | 361 (4.8%) | $84,977 |
| 7+ Person Families | 90 (1.2%) | $98,106 |
| Total | 7,467 (100.0%) | $113,750 |
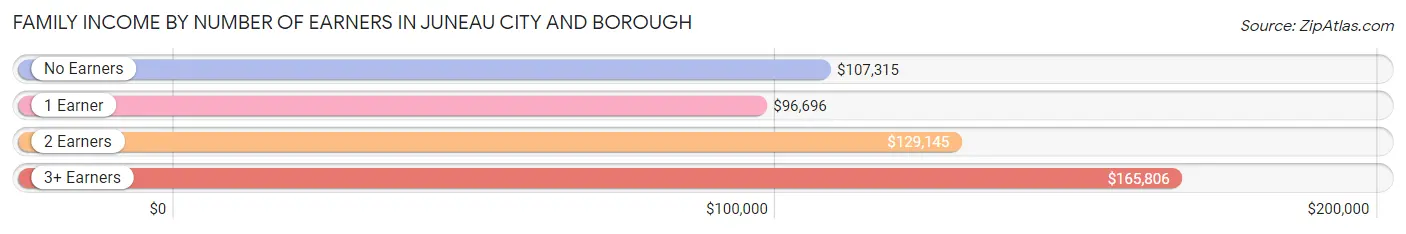
Family Income by Number of Earners in Juneau city and borough
The median family income in Juneau city and borough is $113,750, with families comprising 3+ earners (870) having the highest median family income of $165,806, while families with 1 earner (2,051) have the lowest median family income of $96,696, accounting for 11.7% and 27.5% of families, respectively.
| Number of Earners | # Families | Median Income |
| No Earners | 1,086 (14.5%) | $107,315 |
| 1 Earner | 2,051 (27.5%) | $96,696 |
| 2 Earners | 3,460 (46.3%) | $129,145 |
| 3+ Earners | 870 (11.7%) | $165,806 |
| Total | 7,467 (100.0%) | $113,750 |
Household Income in Juneau city and borough
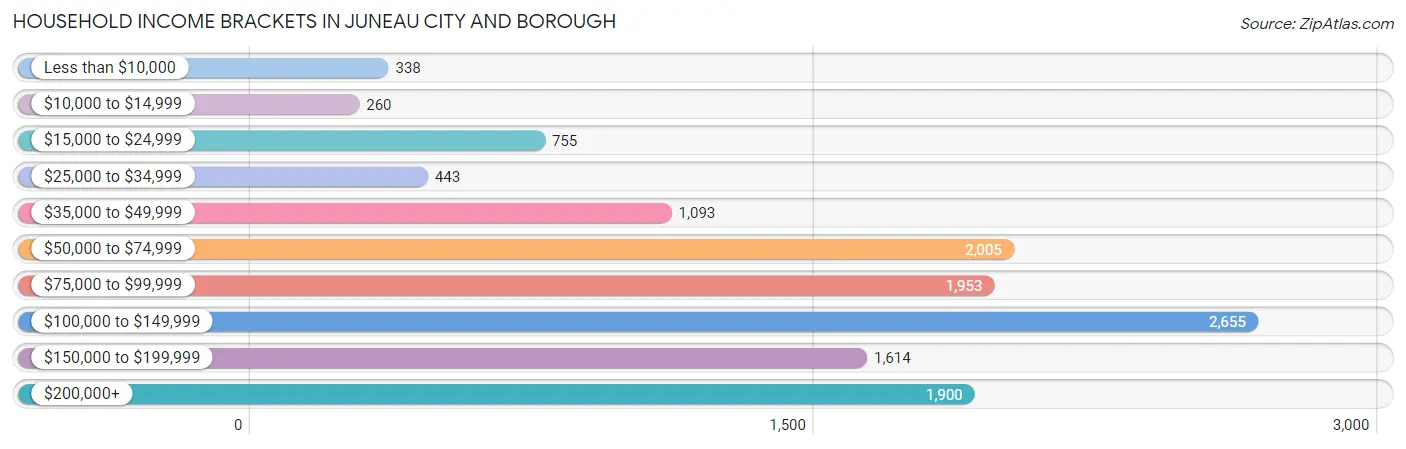
Household Income Brackets in Juneau city and borough
With 2,655 households falling in the category, the $100,000 to $149,999 income range is the most frequent in Juneau city and borough, accounting for 20.4% of all households. In contrast, only 260 households (2.0%) fall into the $10,000 to $14,999 income bracket, making it the least populous group.
| Income Bracket | # Households | % Households |
| Less than $10,000 | 338 | 2.6% |
| $10,000 to $14,999 | 260 | 2.0% |
| $15,000 to $24,999 | 755 | 5.8% |
| $25,000 to $34,999 | 443 | 3.4% |
| $35,000 to $49,999 | 1,093 | 8.4% |
| $50,000 to $74,999 | 2,005 | 15.4% |
| $75,000 to $99,999 | 1,953 | 15.0% |
| $100,000 to $149,999 | 2,655 | 20.4% |
| $150,000 to $199,999 | 1,614 | 12.4% |
| $200,000+ | 1,900 | 14.6% |
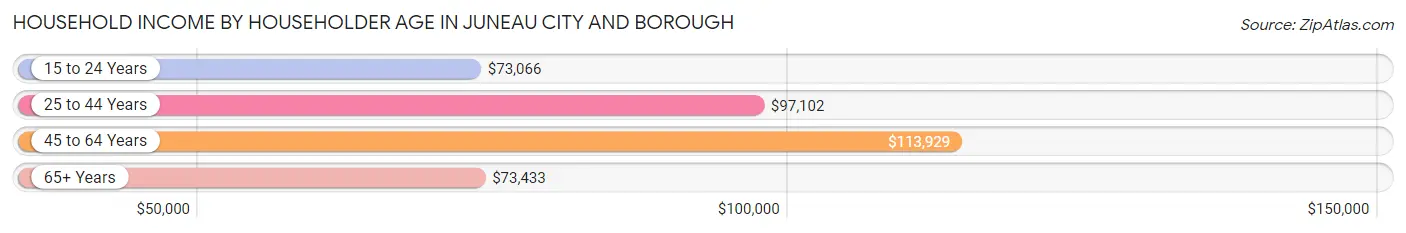
Household Income by Householder Age in Juneau city and borough
The median household income in Juneau city and borough is $95,711, with the highest median household income of $113,929 found in the 45 to 64 years age bracket for the primary householder. A total of 5,156 households (39.6%) fall into this category. Meanwhile, the 15 to 24 years age bracket for the primary householder has the lowest median household income of $73,066, with 258 households (2.0%) in this group.
| Income Bracket | # Households | Median Income |
| 15 to 24 Years | 258 (2.0%) | $73,066 |
| 25 to 44 Years | 4,573 (35.1%) | $97,102 |
| 45 to 64 Years | 5,156 (39.6%) | $113,929 |
| 65+ Years | 3,030 (23.3%) | $73,433 |
| Total | 13,017 (100.0%) | $95,711 |
Poverty in Juneau city and borough
Income Below Poverty by Sex and Age in Juneau city and borough
With 7.2% poverty level for males and 6.6% for females among the residents of Juneau city and borough, 18 to 24 year old males and 18 to 24 year old females are the most vulnerable to poverty, with 241 males (19.4%) and 245 females (20.2%) in their respective age groups living below the poverty level.
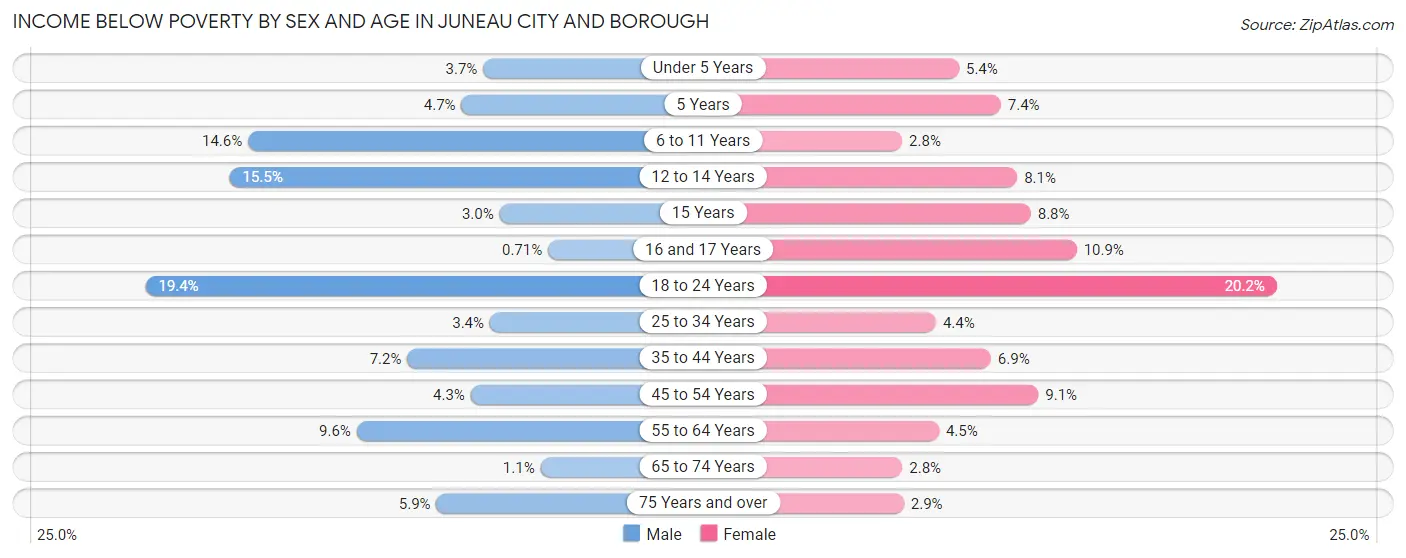
| Age Bracket | Male | Female |
| Under 5 Years | 31 (3.7%) | 44 (5.4%) |
| 5 Years | 13 (4.7%) | 9 (7.4%) |
| 6 to 11 Years | 186 (14.6%) | 33 (2.8%) |
| 12 to 14 Years | 68 (15.5%) | 35 (8.1%) |
| 15 Years | 4 (3.0%) | 15 (8.8%) |
| 16 and 17 Years | 3 (0.7%) | 35 (10.9%) |
| 18 to 24 Years | 241 (19.4%) | 245 (20.2%) |
| 25 to 34 Years | 86 (3.4%) | 102 (4.4%) |
| 35 to 44 Years | 166 (7.2%) | 154 (6.9%) |
| 45 to 54 Years | 94 (4.3%) | 177 (9.1%) |
| 55 to 64 Years | 216 (9.6%) | 100 (4.5%) |
| 65 to 74 Years | 18 (1.1%) | 46 (2.8%) |
| 75 Years and over | 32 (5.9%) | 23 (2.9%) |
| Total | 1,158 (7.2%) | 1,018 (6.6%) |
Income Above Poverty by Sex and Age in Juneau city and borough
According to the poverty statistics in Juneau city and borough, males aged 16 and 17 years and females aged 6 to 11 years are the age groups that are most secure financially, with 99.3% of males and 97.2% of females in these age groups living above the poverty line.
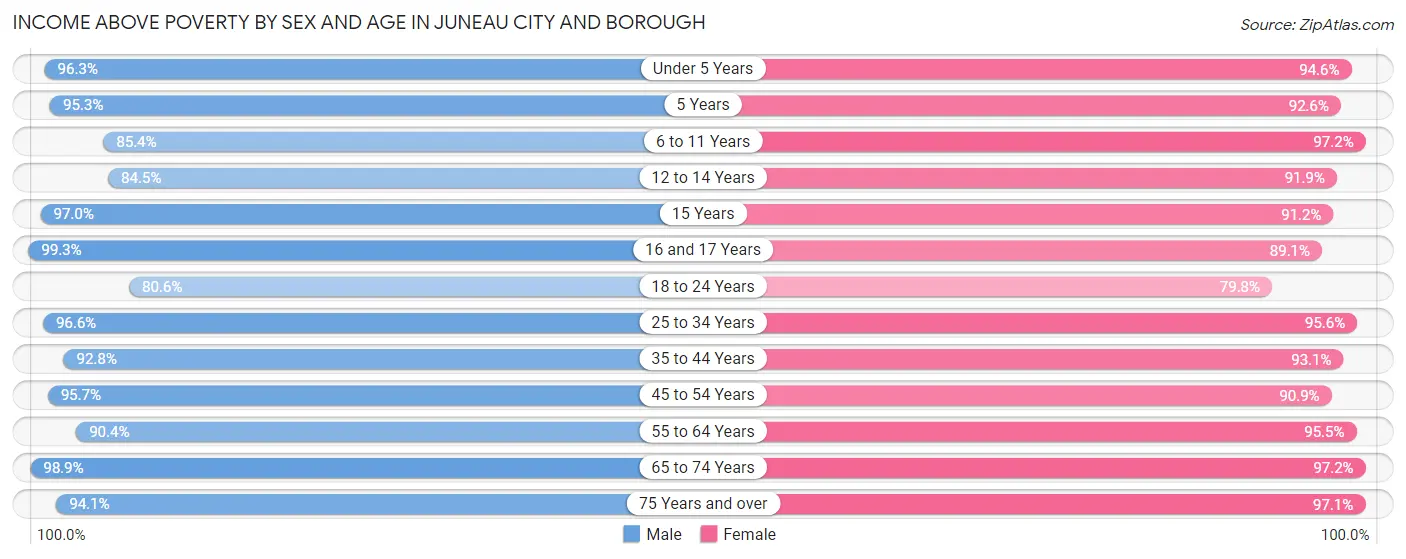
| Age Bracket | Male | Female |
| Under 5 Years | 802 (96.3%) | 765 (94.6%) |
| 5 Years | 262 (95.3%) | 113 (92.6%) |
| 6 to 11 Years | 1,085 (85.4%) | 1,145 (97.2%) |
| 12 to 14 Years | 371 (84.5%) | 395 (91.9%) |
| 15 Years | 131 (97.0%) | 156 (91.2%) |
| 16 and 17 Years | 421 (99.3%) | 286 (89.1%) |
| 18 to 24 Years | 1,002 (80.6%) | 969 (79.8%) |
| 25 to 34 Years | 2,435 (96.6%) | 2,232 (95.6%) |
| 35 to 44 Years | 2,127 (92.8%) | 2,073 (93.1%) |
| 45 to 54 Years | 2,092 (95.7%) | 1,764 (90.9%) |
| 55 to 64 Years | 2,036 (90.4%) | 2,119 (95.5%) |
| 65 to 74 Years | 1,683 (98.9%) | 1,590 (97.2%) |
| 75 Years and over | 511 (94.1%) | 776 (97.1%) |
| Total | 14,958 (92.8%) | 14,383 (93.4%) |
Income Below Poverty Among Married-Couple Families in Juneau city and borough
The poverty statistics for married-couple families in Juneau city and borough show that 1.9% or 112 of the total 5,955 families live below the poverty line. Families with 5 or more children have the highest poverty rate of 22.6%, comprising of 14 families. On the other hand, families with no children have the lowest poverty rate of 0.6%, which includes 19 families.
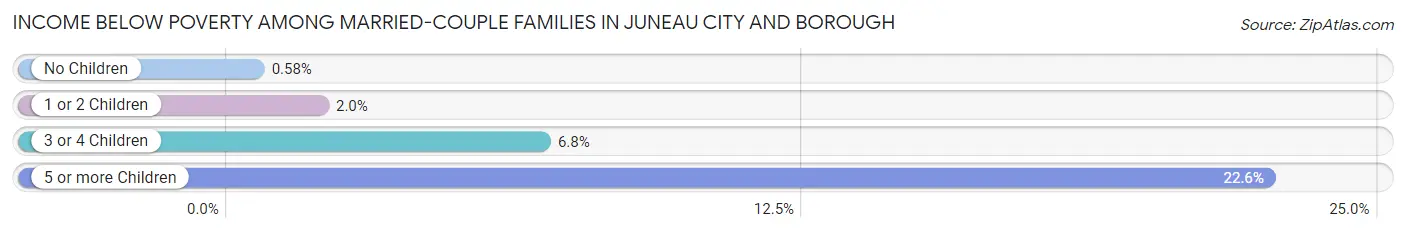
| Children | Above Poverty | Below Poverty |
| No Children | 3,246 (99.4%) | 19 (0.6%) |
| 1 or 2 Children | 2,029 (98.0%) | 41 (2.0%) |
| 3 or 4 Children | 520 (93.2%) | 38 (6.8%) |
| 5 or more Children | 48 (77.4%) | 14 (22.6%) |
| Total | 5,843 (98.1%) | 112 (1.9%) |
Income Below Poverty Among Single-Parent Households in Juneau city and borough
According to the poverty data in Juneau city and borough, 6.9% or 44 single-father households and 19.9% or 175 single-mother households are living below the poverty line. Among single-father households, those with 5 or more children have the highest poverty rate, with 3 households (100.0%) experiencing poverty. Likewise, among single-mother households, those with 1 or 2 children have the highest poverty rate, with 167 households (29.6%) falling below the poverty line.
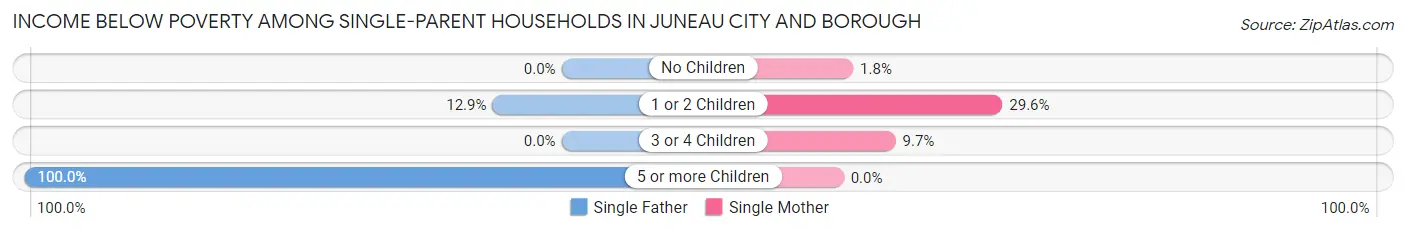
| Children | Single Father | Single Mother |
| No Children | 0 (0.0%) | 5 (1.8%) |
| 1 or 2 Children | 41 (12.9%) | 167 (29.6%) |
| 3 or 4 Children | 0 (0.0%) | 3 (9.7%) |
| 5 or more Children | 3 (100.0%) | 0 (0.0%) |
| Total | 44 (6.9%) | 175 (19.9%) |
Income Below Poverty Among Married-Couple vs Single-Parent Households in Juneau city and borough
The poverty data for Juneau city and borough shows that 112 of the married-couple family households (1.9%) and 219 of the single-parent households (14.5%) are living below the poverty level. Within the married-couple family households, those with 5 or more children have the highest poverty rate, with 14 households (22.6%) falling below the poverty line. Among the single-parent households, those with 5 or more children have the highest poverty rate, with 3 household (100.0%) living below poverty.
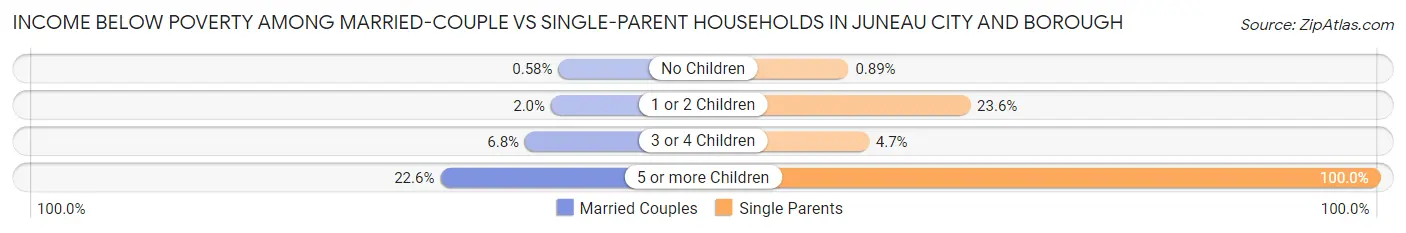
| Children | Married-Couple Families | Single-Parent Households |
| No Children | 19 (0.6%) | 5 (0.9%) |
| 1 or 2 Children | 41 (2.0%) | 208 (23.6%) |
| 3 or 4 Children | 38 (6.8%) | 3 (4.7%) |
| 5 or more Children | 14 (22.6%) | 3 (100.0%) |
| Total | 112 (1.9%) | 219 (14.5%) |
Race in Juneau city and borough
The most populous races in Juneau city and borough are White / Caucasian (20,543 | 64.0%), Two or more Races (4,828 | 15.0%), and Native / Alaskan (3,018 | 9.4%).
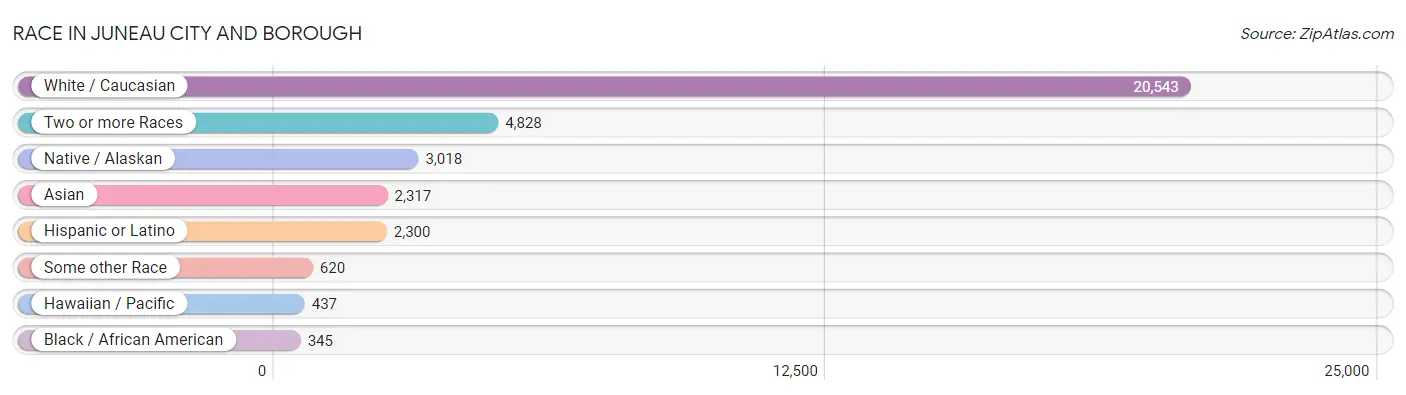
| Race | # Population | % Population |
| Asian | 2,317 | 7.2% |
| Black / African American | 345 | 1.1% |
| Hawaiian / Pacific | 437 | 1.4% |
| Hispanic or Latino | 2,300 | 7.2% |
| Native / Alaskan | 3,018 | 9.4% |
| White / Caucasian | 20,543 | 64.0% |
| Two or more Races | 4,828 | 15.0% |
| Some other Race | 620 | 1.9% |
| Total | 32,108 | 100.0% |
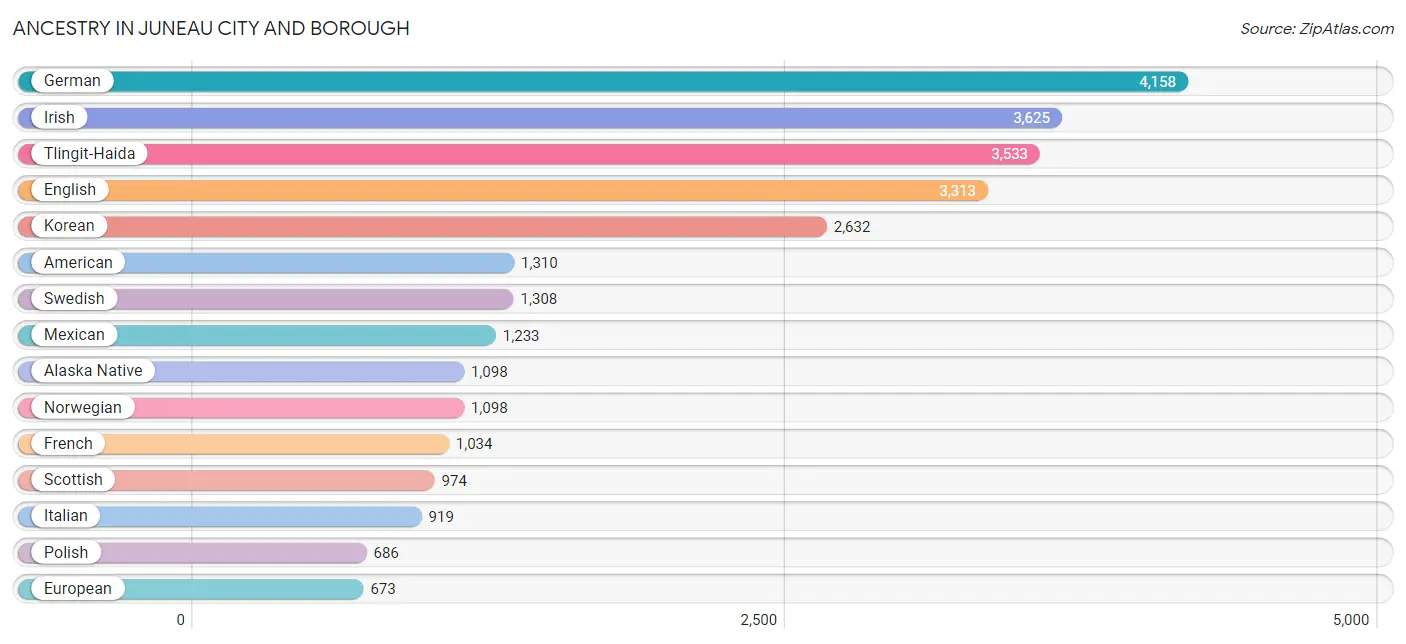
Ancestry in Juneau city and borough
The most populous ancestries reported in Juneau city and borough are German (4,158 | 13.0%), Irish (3,625 | 11.3%), Tlingit-Haida (3,533 | 11.0%), English (3,313 | 10.3%), and Korean (2,632 | 8.2%), together accounting for 53.8% of all Juneau city and borough residents.
| Ancestry | # Population | % Population |
| Afghan | 17 | 0.1% |
| African | 91 | 0.3% |
| Alaska Native | 1,098 | 3.4% |
| Alaskan Athabascan | 68 | 0.2% |
| Aleut | 126 | 0.4% |
| Alsatian | 12 | 0.0% |
| American | 1,310 | 4.1% |
| Apache | 19 | 0.1% |
| Arab | 16 | 0.1% |
| Argentinean | 20 | 0.1% |
| Armenian | 2 | 0.0% |
| Australian | 63 | 0.2% |
| Austrian | 97 | 0.3% |
| Basque | 5 | 0.0% |
| Belgian | 84 | 0.3% |
| Belizean | 51 | 0.2% |
| Bhutanese | 248 | 0.8% |
| Blackfeet | 6 | 0.0% |
| Brazilian | 4 | 0.0% |
| British | 293 | 0.9% |
| British West Indian | 16 | 0.1% |
| Burmese | 175 | 0.5% |
| Cajun | 3 | 0.0% |
| Cambodian | 6 | 0.0% |
| Canadian | 45 | 0.1% |
| Celtic | 30 | 0.1% |
| Central American | 58 | 0.2% |
| Central American Indian | 9 | 0.0% |
| Cherokee | 23 | 0.1% |
| Chilean | 15 | 0.1% |
| Chippewa | 97 | 0.3% |
| Choctaw | 14 | 0.0% |
| Colombian | 61 | 0.2% |
| Comanche | 3 | 0.0% |
| Costa Rican | 16 | 0.1% |
| Croatian | 21 | 0.1% |
| Cuban | 183 | 0.6% |
| Czech | 79 | 0.3% |
| Czechoslovakian | 43 | 0.1% |
| Danish | 178 | 0.5% |
| Delaware | 6 | 0.0% |
| Dominican | 3 | 0.0% |
| Dutch | 467 | 1.5% |
| Eastern European | 311 | 1.0% |
| Ecuadorian | 15 | 0.1% |
| English | 3,313 | 10.3% |
| European | 673 | 2.1% |
| Filipino | 4 | 0.0% |
| Finnish | 469 | 1.5% |
| French | 1,034 | 3.2% |
| French American Indian | 3 | 0.0% |
| French Canadian | 146 | 0.4% |
| German | 4,158 | 13.0% |
| Greek | 159 | 0.5% |
| Guamanian / Chamorro | 5 | 0.0% |
| Guatemalan | 4 | 0.0% |
| Haitian | 1 | 0.0% |
| Honduran | 15 | 0.1% |
| Hungarian | 169 | 0.5% |
| Icelander | 7 | 0.0% |
| Indian (Asian) | 385 | 1.2% |
| Inupiat | 206 | 0.6% |
| Iranian | 12 | 0.0% |
| Irish | 3,625 | 11.3% |
| Italian | 919 | 2.9% |
| Korean | 2,632 | 8.2% |
| Laotian | 23 | 0.1% |
| Latvian | 1 | 0.0% |
| Lebanese | 16 | 0.1% |
| Lithuanian | 47 | 0.2% |
| Macedonian | 6 | 0.0% |
| Mexican | 1,233 | 3.8% |
| Mexican American Indian | 10 | 0.0% |
| Native Hawaiian | 70 | 0.2% |
| Navajo | 60 | 0.2% |
| New Zealander | 1 | 0.0% |
| Nicaraguan | 3 | 0.0% |
| Nigerian | 51 | 0.2% |
| Northern European | 464 | 1.5% |
| Norwegian | 1,098 | 3.4% |
| Pakistani | 157 | 0.5% |
| Pennsylvania German | 3 | 0.0% |
| Peruvian | 67 | 0.2% |
| Pima | 5 | 0.0% |
| Polish | 686 | 2.1% |
| Portuguese | 69 | 0.2% |
| Puerto Rican | 185 | 0.6% |
| Romanian | 9 | 0.0% |
| Russian | 242 | 0.7% |
| Salvadoran | 20 | 0.1% |
| Samoan | 168 | 0.5% |
| Scandinavian | 319 | 1.0% |
| Scotch-Irish | 558 | 1.7% |
| Scottish | 974 | 3.0% |
| Sioux | 6 | 0.0% |
| Slavic | 18 | 0.1% |
| Slovak | 25 | 0.1% |
| Slovene | 15 | 0.1% |
| South American | 218 | 0.7% |
| South American Indian | 37 | 0.1% |
| Spaniard | 57 | 0.2% |
| Spanish | 294 | 0.9% |
| Sri Lankan | 114 | 0.4% |
| Subsaharan African | 143 | 0.4% |
| Swedish | 1,308 | 4.1% |
| Swiss | 71 | 0.2% |
| Thai | 80 | 0.3% |
| Tlingit-Haida | 3,533 | 11.0% |
| Tongan | 455 | 1.4% |
| Tsimshian | 53 | 0.2% |
| Ukrainian | 70 | 0.2% |
| Venezuelan | 3 | 0.0% |
| Welsh | 193 | 0.6% |
| Yaqui | 4 | 0.0% |
| Yugoslavian | 12 | 0.0% |
| Yup'ik | 198 | 0.6% | View All 116 Rows |
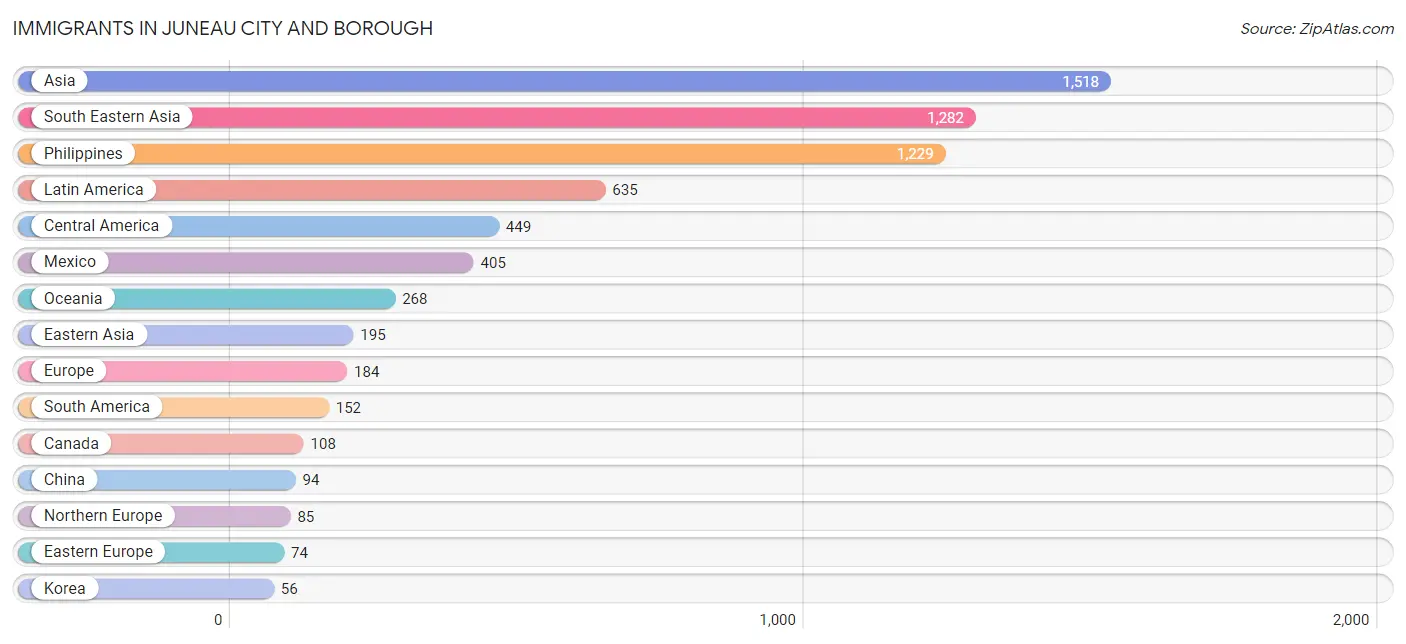
Immigrants in Juneau city and borough
The most numerous immigrant groups reported in Juneau city and borough came from Asia (1,518 | 4.7%), South Eastern Asia (1,282 | 4.0%), Philippines (1,229 | 3.8%), Latin America (635 | 2.0%), and Central America (449 | 1.4%), together accounting for 15.9% of all Juneau city and borough residents.
| Immigration Origin | # Population | % Population |
| Afghanistan | 11 | 0.0% |
| Africa | 9 | 0.0% |
| Argentina | 16 | 0.1% |
| Asia | 1,518 | 4.7% |
| Australia | 12 | 0.0% |
| Austria | 2 | 0.0% |
| Belize | 25 | 0.1% |
| Bosnia and Herzegovina | 6 | 0.0% |
| Canada | 108 | 0.3% |
| Caribbean | 34 | 0.1% |
| Central America | 449 | 1.4% |
| Chile | 15 | 0.1% |
| China | 94 | 0.3% |
| Colombia | 53 | 0.2% |
| Cuba | 14 | 0.0% |
| Czechoslovakia | 12 | 0.0% |
| Denmark | 2 | 0.0% |
| Eastern Asia | 195 | 0.6% |
| Eastern Europe | 74 | 0.2% |
| Ecuador | 11 | 0.0% |
| El Salvador | 19 | 0.1% |
| England | 20 | 0.1% |
| Europe | 184 | 0.6% |
| Germany | 10 | 0.0% |
| Grenada | 4 | 0.0% |
| Hong Kong | 6 | 0.0% |
| Hungary | 4 | 0.0% |
| India | 23 | 0.1% |
| Indonesia | 2 | 0.0% |
| Ireland | 14 | 0.0% |
| Japan | 45 | 0.1% |
| Korea | 56 | 0.2% |
| Latin America | 635 | 2.0% |
| Mexico | 405 | 1.3% |
| Netherlands | 13 | 0.0% |
| Nigeria | 4 | 0.0% |
| Northern Europe | 85 | 0.3% |
| Oceania | 268 | 0.8% |
| Peru | 20 | 0.1% |
| Philippines | 1,229 | 3.8% |
| Poland | 14 | 0.0% |
| Romania | 5 | 0.0% |
| Russia | 30 | 0.1% |
| Scotland | 23 | 0.1% |
| South Africa | 4 | 0.0% |
| South America | 152 | 0.5% |
| South Central Asia | 34 | 0.1% |
| South Eastern Asia | 1,282 | 4.0% |
| Taiwan | 4 | 0.0% |
| Thailand | 22 | 0.1% |
| Vietnam | 29 | 0.1% |
| Western Africa | 4 | 0.0% |
| Western Europe | 25 | 0.1% | View All 53 Rows |
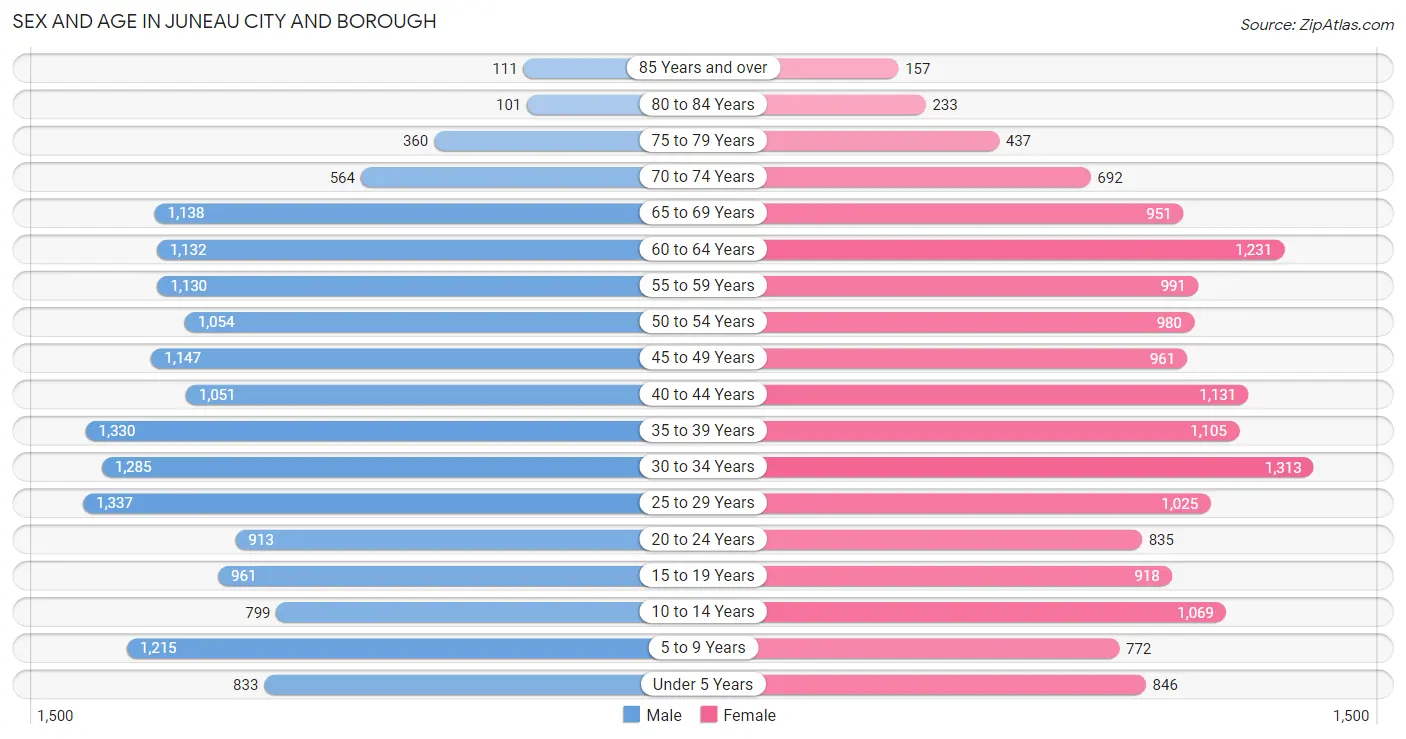
Sex and Age in Juneau city and borough
Sex and Age in Juneau city and borough
The most populous age groups in Juneau city and borough are 25 to 29 Years (1,337 | 8.1%) for men and 30 to 34 Years (1,313 | 8.4%) for women.
| Age Bracket | Male | Female |
| Under 5 Years | 833 (5.1%) | 846 (5.4%) |
| 5 to 9 Years | 1,215 (7.4%) | 772 (4.9%) |
| 10 to 14 Years | 799 (4.9%) | 1,069 (6.8%) |
| 15 to 19 Years | 961 (5.8%) | 918 (5.9%) |
| 20 to 24 Years | 913 (5.6%) | 835 (5.3%) |
| 25 to 29 Years | 1,337 (8.1%) | 1,025 (6.6%) |
| 30 to 34 Years | 1,285 (7.8%) | 1,313 (8.4%) |
| 35 to 39 Years | 1,330 (8.1%) | 1,105 (7.1%) |
| 40 to 44 Years | 1,051 (6.4%) | 1,131 (7.2%) |
| 45 to 49 Years | 1,147 (7.0%) | 961 (6.1%) |
| 50 to 54 Years | 1,054 (6.4%) | 980 (6.3%) |
| 55 to 59 Years | 1,130 (6.9%) | 991 (6.3%) |
| 60 to 64 Years | 1,132 (6.9%) | 1,231 (7.9%) |
| 65 to 69 Years | 1,138 (6.9%) | 951 (6.1%) |
| 70 to 74 Years | 564 (3.4%) | 692 (4.4%) |
| 75 to 79 Years | 360 (2.2%) | 437 (2.8%) |
| 80 to 84 Years | 101 (0.6%) | 233 (1.5%) |
| 85 Years and over | 111 (0.7%) | 157 (1.0%) |
| Total | 16,461 (100.0%) | 15,647 (100.0%) |
Families and Households in Juneau city and borough
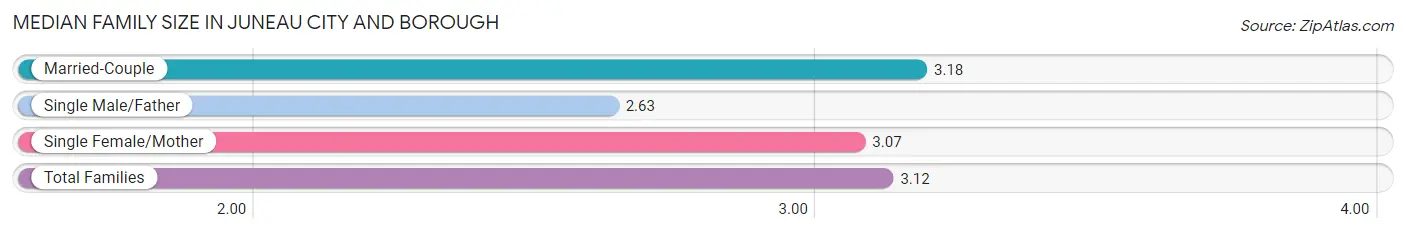
Median Family Size in Juneau city and borough
The median family size in Juneau city and borough is 3.12 persons per family, with married-couple families (5,955 | 79.7%) accounting for the largest median family size of 3.18 persons per family. On the other hand, single male/father families (634 | 8.5%) represent the smallest median family size with 2.63 persons per family.
| Family Type | # Families | Family Size |
| Married-Couple | 5,955 (79.7%) | 3.18 |
| Single Male/Father | 634 (8.5%) | 2.63 |
| Single Female/Mother | 878 (11.8%) | 3.07 |
| Total Families | 7,467 (100.0%) | 3.12 |
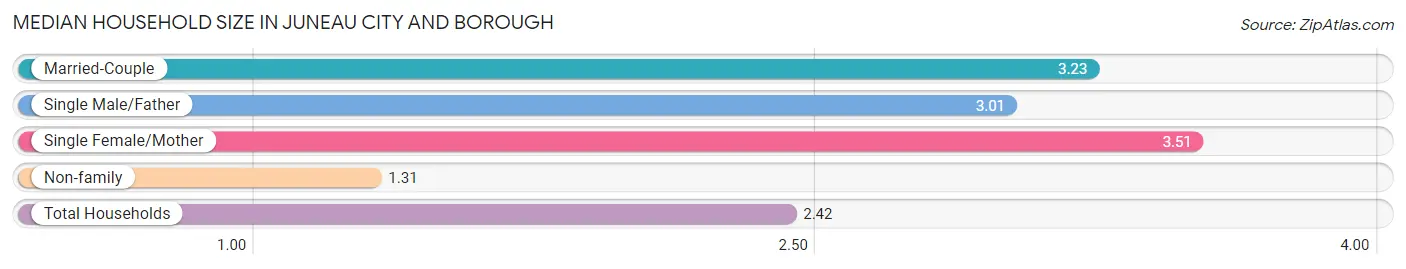
Median Household Size in Juneau city and borough
The median household size in Juneau city and borough is 2.42 persons per household, with single female/mother households (878 | 6.8%) accounting for the largest median household size of 3.51 persons per household. non-family households (5,550 | 42.6%) represent the smallest median household size with 1.31 persons per household.
| Household Type | # Households | Household Size |
| Married-Couple | 5,955 (45.8%) | 3.23 |
| Single Male/Father | 634 (4.9%) | 3.01 |
| Single Female/Mother | 878 (6.8%) | 3.51 |
| Non-family | 5,550 (42.6%) | 1.31 |
| Total Households | 13,017 (100.0%) | 2.42 |
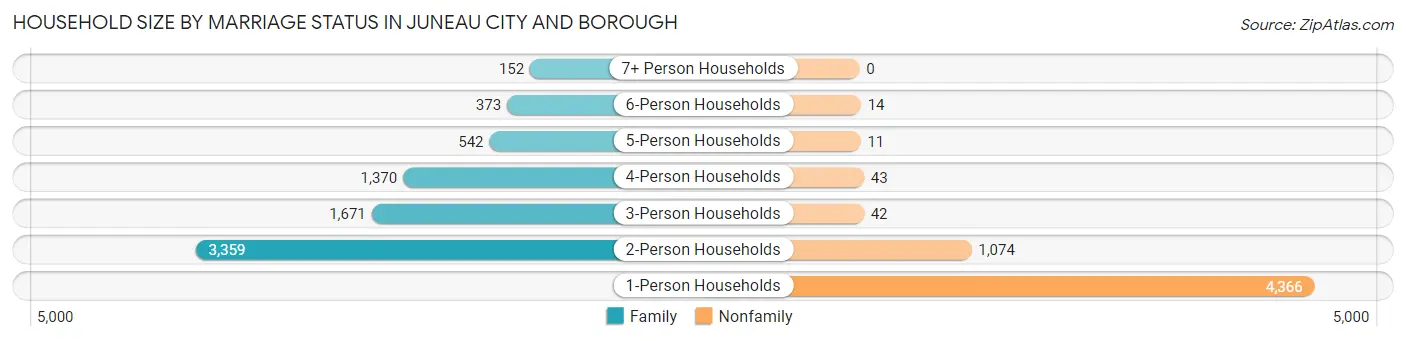
Household Size by Marriage Status in Juneau city and borough
Out of a total of 13,017 households in Juneau city and borough, 7,467 (57.4%) are family households, while 5,550 (42.6%) are nonfamily households. The most numerous type of family households are 2-person households, comprising 3,359, and the most common type of nonfamily households are 1-person households, comprising 4,366.
| Household Size | Family Households | Nonfamily Households |
| 1-Person Households | - | 4,366 (33.5%) |
| 2-Person Households | 3,359 (25.8%) | 1,074 (8.3%) |
| 3-Person Households | 1,671 (12.8%) | 42 (0.3%) |
| 4-Person Households | 1,370 (10.5%) | 43 (0.3%) |
| 5-Person Households | 542 (4.2%) | 11 (0.1%) |
| 6-Person Households | 373 (2.9%) | 14 (0.1%) |
| 7+ Person Households | 152 (1.2%) | 0 (0.0%) |
| Total | 7,467 (57.4%) | 5,550 (42.6%) |
Female Fertility in Juneau city and borough
Fertility by Age in Juneau city and borough
Average fertility rate in Juneau city and borough is 37.0 births per 1,000 women. Women in the age bracket of 20 to 34 years have the highest fertility rate with 51.0 births per 1,000 women. Women in the age bracket of 20 to 34 years acount for 59.1% of all women with births.
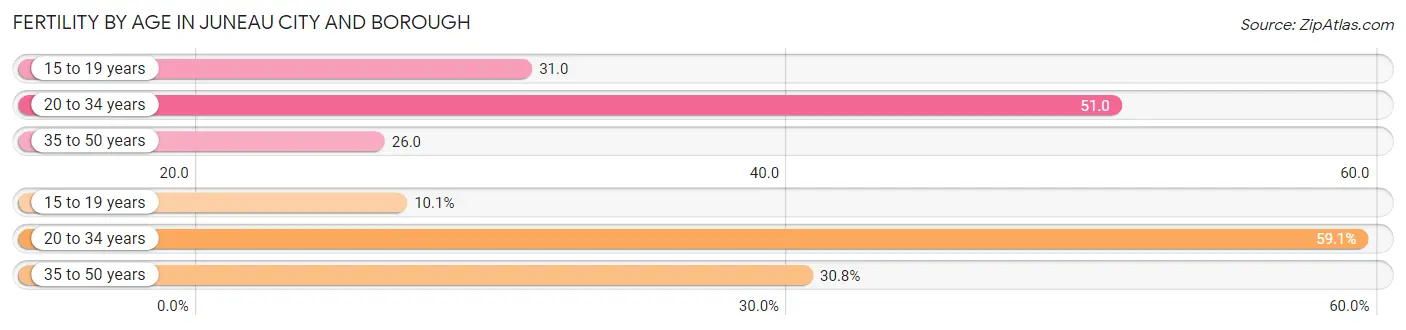
| Age Bracket | Women with Births | Births / 1,000 Women |
| 15 to 19 years | 28 (10.1%) | 31.0 |
| 20 to 34 years | 163 (59.1%) | 51.0 |
| 35 to 50 years | 85 (30.8%) | 26.0 |
| Total | 276 (100.0%) | 37.0 |
Fertility by Age by Marriage Status in Juneau city and borough
83.7% of women with births (276) in Juneau city and borough are married. The highest percentage of unmarried women with births falls into 15 to 19 years age bracket with 100.0% of them unmarried at the time of birth, while the lowest percentage of unmarried women with births belong to 35 to 50 years age bracket with 0.0% of them unmarried.
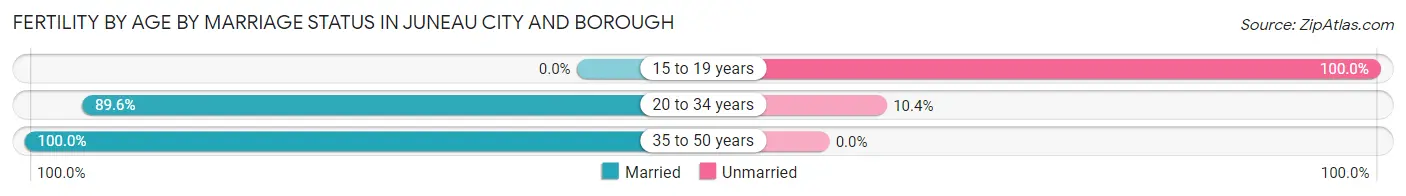
| Age Bracket | Married | Unmarried |
| 15 to 19 years | 0 (0.0%) | 28 (100.0%) |
| 20 to 34 years | 146 (89.6%) | 17 (10.4%) |
| 35 to 50 years | 85 (100.0%) | 0 (0.0%) |
| Total | 231 (83.7%) | 45 (16.3%) |
Fertility by Education in Juneau city and borough
Average fertility rate in Juneau city and borough is 37.0 births per 1,000 women. Women with the education attainment of high school diploma have the highest fertility rate of 59.0 births per 1,000 women, while women with the education attainment of bachelor's degree have the lowest fertility at 22.0 births per 1,000 women. Women with the education attainment of high school diploma represent 33.3% of all women with births.
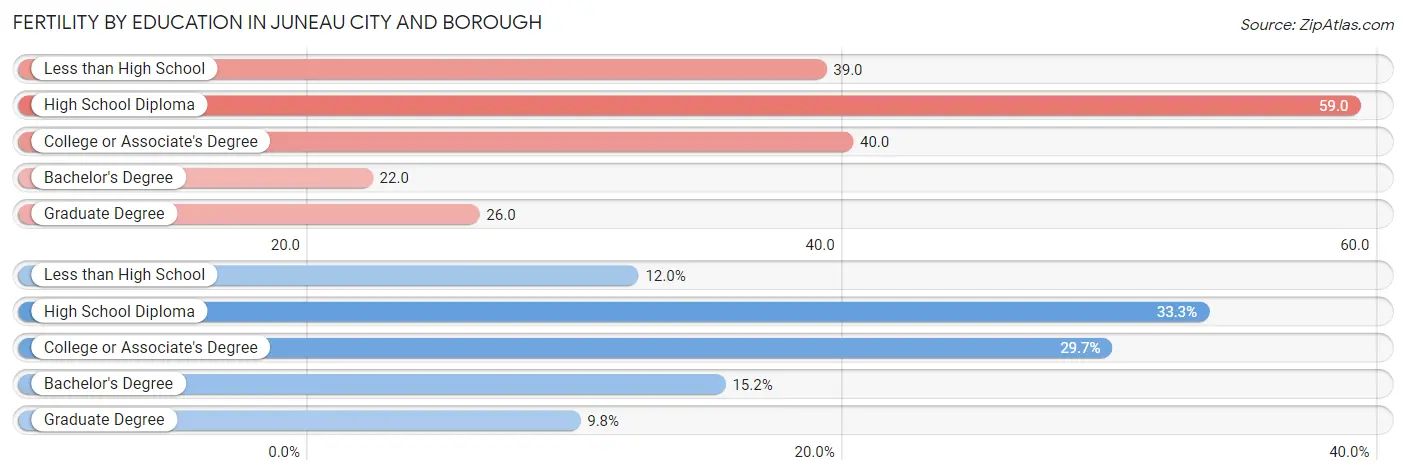
| Educational Attainment | Women with Births | Births / 1,000 Women |
| Less than High School | 33 (12.0%) | 39.0 |
| High School Diploma | 92 (33.3%) | 59.0 |
| College or Associate's Degree | 82 (29.7%) | 40.0 |
| Bachelor's Degree | 42 (15.2%) | 22.0 |
| Graduate Degree | 27 (9.8%) | 26.0 |
| Total | 276 (100.0%) | 37.0 |
Fertility by Education by Marriage Status in Juneau city and borough
16.3% of women with births in Juneau city and borough are unmarried. Women with the educational attainment of graduate degree are most likely to be married with 100.0% of them married at childbirth, while women with the educational attainment of less than high school are least likely to be married with 84.9% of them unmarried at childbirth.
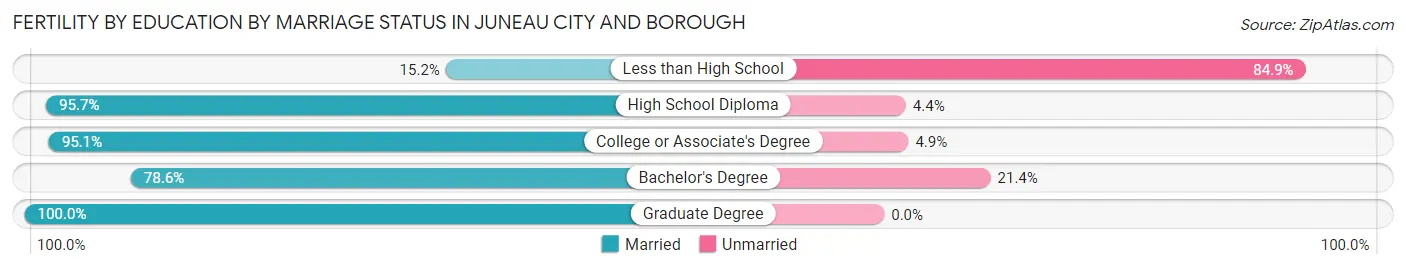
| Educational Attainment | Married | Unmarried |
| Less than High School | 5 (15.1%) | 28 (84.9%) |
| High School Diploma | 88 (95.7%) | 4 (4.3%) |
| College or Associate's Degree | 78 (95.1%) | 4 (4.9%) |
| Bachelor's Degree | 33 (78.6%) | 9 (21.4%) |
| Graduate Degree | 27 (100.0%) | 0 (0.0%) |
| Total | 231 (83.7%) | 45 (16.3%) |
Employment Characteristics in Juneau city and borough
Employment by Class of Employer in Juneau city and borough
Among the 16,370 employed individuals in Juneau city and borough, private company employees (6,361 | 38.9%), state government employees (3,539 | 21.6%), and local government employees (1,907 | 11.7%) make up the most common classes of employment.
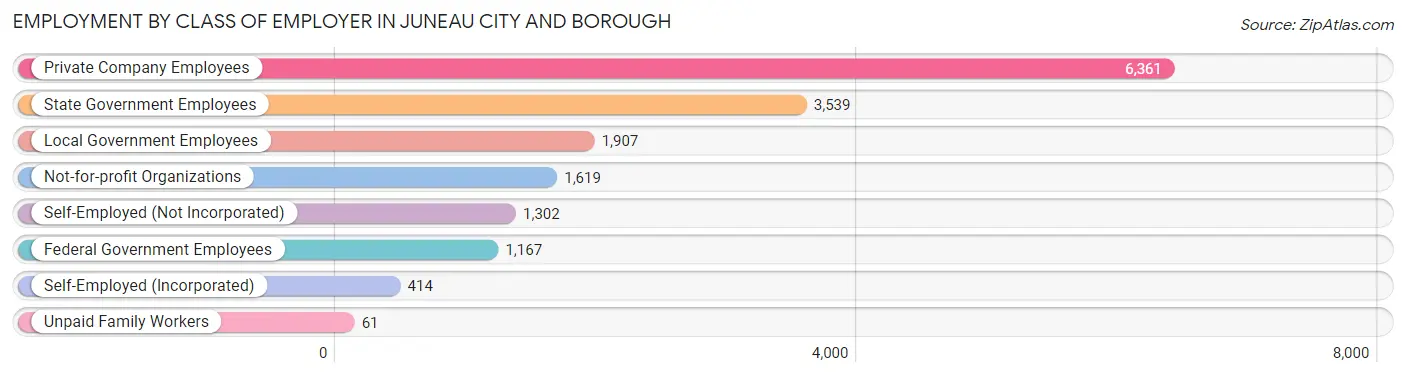
| Employer Class | # Employees | % Employees |
| Private Company Employees | 6,361 | 38.9% |
| Self-Employed (Incorporated) | 414 | 2.5% |
| Self-Employed (Not Incorporated) | 1,302 | 8.0% |
| Not-for-profit Organizations | 1,619 | 9.9% |
| Local Government Employees | 1,907 | 11.7% |
| State Government Employees | 3,539 | 21.6% |
| Federal Government Employees | 1,167 | 7.1% |
| Unpaid Family Workers | 61 | 0.4% |
| Total | 16,370 | 100.0% |
Employment Status by Age in Juneau city and borough
According to the labor force statistics for Juneau city and borough, out of the total population over 16 years of age (26,255), 66.6% or 17,486 individuals are in the labor force, with 4.5% or 787 of them unemployed. The age group with the highest labor force participation rate is 45 to 54 years, with 91.9% or 3,806 individuals in the labor force. Within the labor force, the 75 years and over age range has the highest percentage of unemployed individuals, with 49.1% or 26 of them being unemployed.
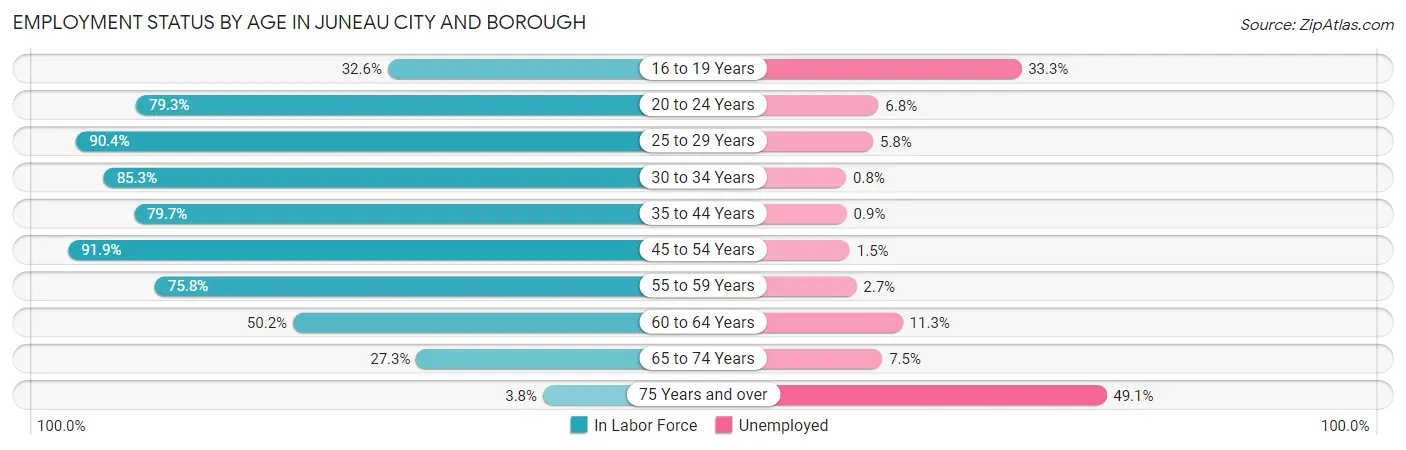
| Age Bracket | In Labor Force | Unemployed |
| 16 to 19 Years | 509 (32.6%) | 169 (33.3%) |
| 20 to 24 Years | 1,386 (79.3%) | 94 (6.8%) |
| 25 to 29 Years | 2,135 (90.4%) | 124 (5.8%) |
| 30 to 34 Years | 2,216 (85.3%) | 18 (0.8%) |
| 35 to 44 Years | 3,680 (79.7%) | 33 (0.9%) |
| 45 to 54 Years | 3,806 (91.9%) | 57 (1.5%) |
| 55 to 59 Years | 1,608 (75.8%) | 43 (2.7%) |
| 60 to 64 Years | 1,186 (50.2%) | 134 (11.3%) |
| 65 to 74 Years | 913 (27.3%) | 68 (7.5%) |
| 75 Years and over | 53 (3.8%) | 26 (49.1%) |
| Total | 17,486 (66.6%) | 787 (4.5%) |
Employment Status by Educational Attainment in Juneau city and borough
According to labor force statistics for Juneau city and borough, 80.4% of individuals (14,635) out of the total population between 25 and 64 years of age (18,203) are in the labor force, with 2.8% or 410 of them being unemployed. The group with the highest labor force participation rate are those with the educational attainment of bachelor's degree or higher, with 86.3% or 6,283 individuals in the labor force. Within the labor force, individuals with less than high school education have the highest percentage of unemployment, with 13.7% or 68 of them being unemployed.
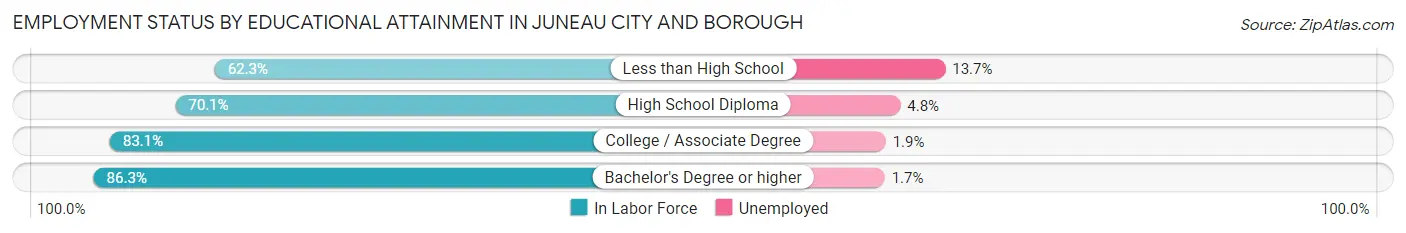
| Educational Attainment | In Labor Force | Unemployed |
| Less than High School | 498 (62.3%) | 110 (13.7%) |
| High School Diploma | 3,009 (70.1%) | 206 (4.8%) |
| College / Associate Degree | 4,845 (83.1%) | 111 (1.9%) |
| Bachelor's Degree or higher | 6,283 (86.3%) | 124 (1.7%) |
| Total | 14,635 (80.4%) | 510 (2.8%) |
Employment Occupations by Sex in Juneau city and borough
Management, Business, Science and Arts Occupations
The most common Management, Business, Science and Arts occupations in Juneau city and borough are Community & Social Service (2,093 | 12.8%), Management (1,762 | 10.8%), Computers, Engineering & Science (1,395 | 8.5%), Education Instruction & Library (1,104 | 6.8%), and Business & Financial (1,004 | 6.1%).
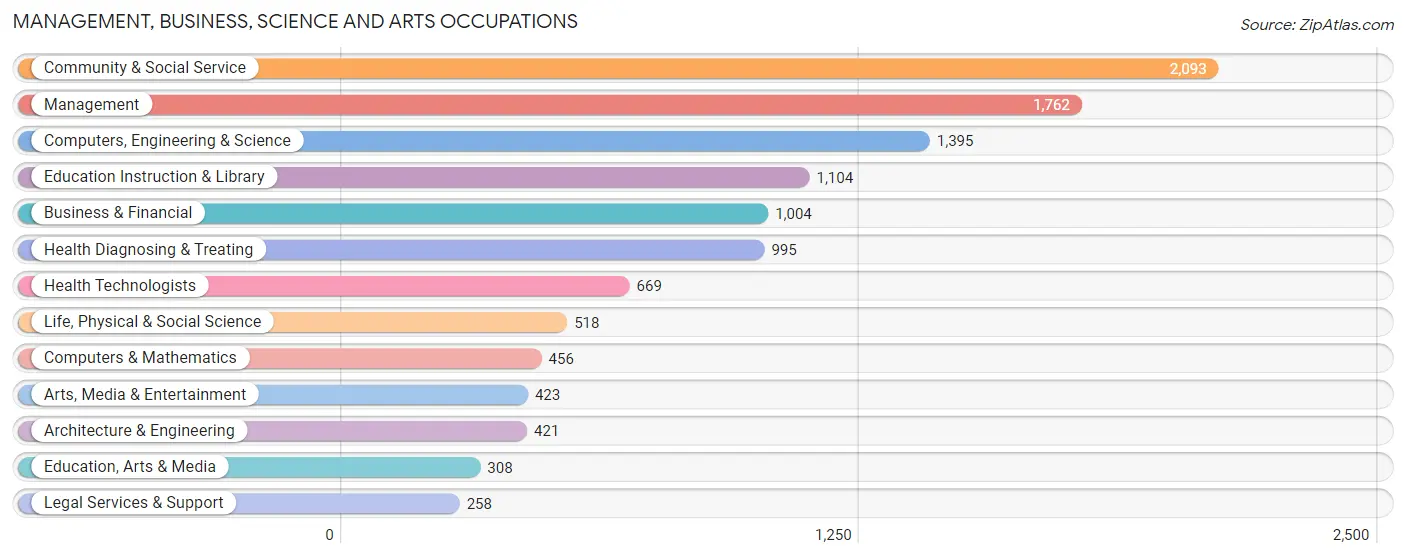
Management, Business, Science and Arts Occupations by Sex
Within the Management, Business, Science and Arts occupations in Juneau city and borough, the most male-oriented occupations are Architecture & Engineering (86.5%), Computers & Mathematics (77.6%), and Computers, Engineering & Science (68.8%), while the most female-oriented occupations are Education Instruction & Library (79.5%), Health Technologists (76.8%), and Health Diagnosing & Treating (74.9%).
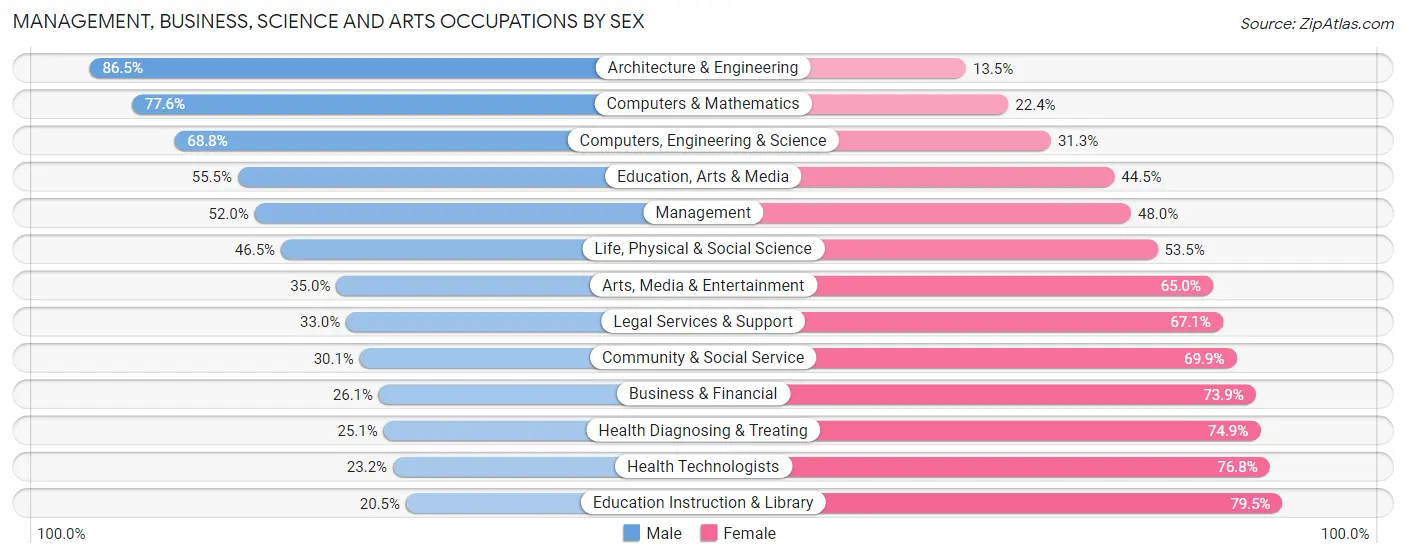
| Occupation | Male | Female |
| Management | 917 (52.0%) | 845 (48.0%) |
| Business & Financial | 262 (26.1%) | 742 (73.9%) |
| Computers, Engineering & Science | 959 (68.8%) | 436 (31.2%) |
| Computers & Mathematics | 354 (77.6%) | 102 (22.4%) |
| Architecture & Engineering | 364 (86.5%) | 57 (13.5%) |
| Life, Physical & Social Science | 241 (46.5%) | 277 (53.5%) |
| Community & Social Service | 630 (30.1%) | 1,463 (69.9%) |
| Education, Arts & Media | 171 (55.5%) | 137 (44.5%) |
| Legal Services & Support | 85 (33.0%) | 173 (67.0%) |
| Education Instruction & Library | 226 (20.5%) | 878 (79.5%) |
| Arts, Media & Entertainment | 148 (35.0%) | 275 (65.0%) |
| Health Diagnosing & Treating | 250 (25.1%) | 745 (74.9%) |
| Health Technologists | 155 (23.2%) | 514 (76.8%) |
| Total (Category) | 3,018 (41.6%) | 4,231 (58.4%) |
| Total (Overall) | 8,645 (52.9%) | 7,700 (47.1%) |
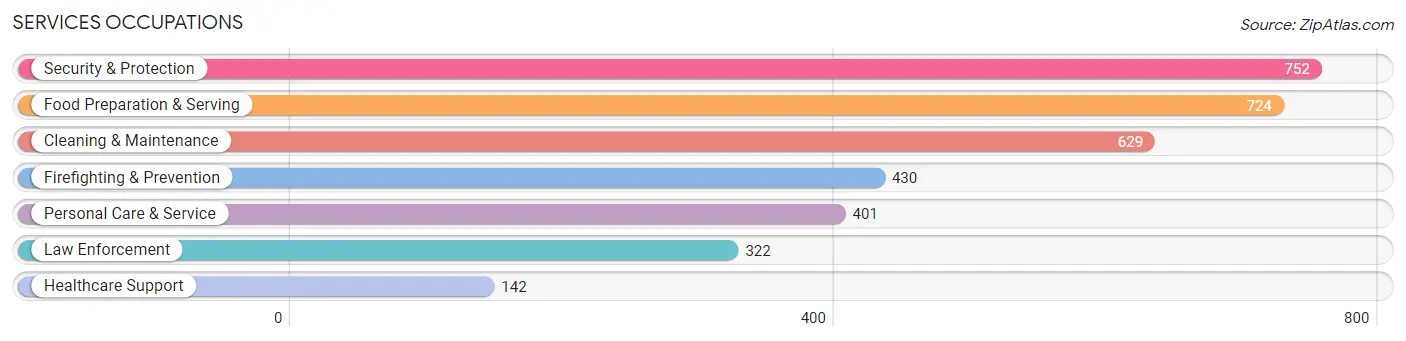
Services Occupations
The most common Services occupations in Juneau city and borough are Security & Protection (752 | 4.6%), Food Preparation & Serving (724 | 4.4%), Cleaning & Maintenance (629 | 3.8%), Firefighting & Prevention (430 | 2.6%), and Personal Care & Service (401 | 2.5%).
Services Occupations by Sex
Within the Services occupations in Juneau city and borough, the most male-oriented occupations are Firefighting & Prevention (91.9%), Security & Protection (91.2%), and Law Enforcement (90.4%), while the most female-oriented occupations are Healthcare Support (76.8%), Personal Care & Service (73.1%), and Food Preparation & Serving (66.4%).
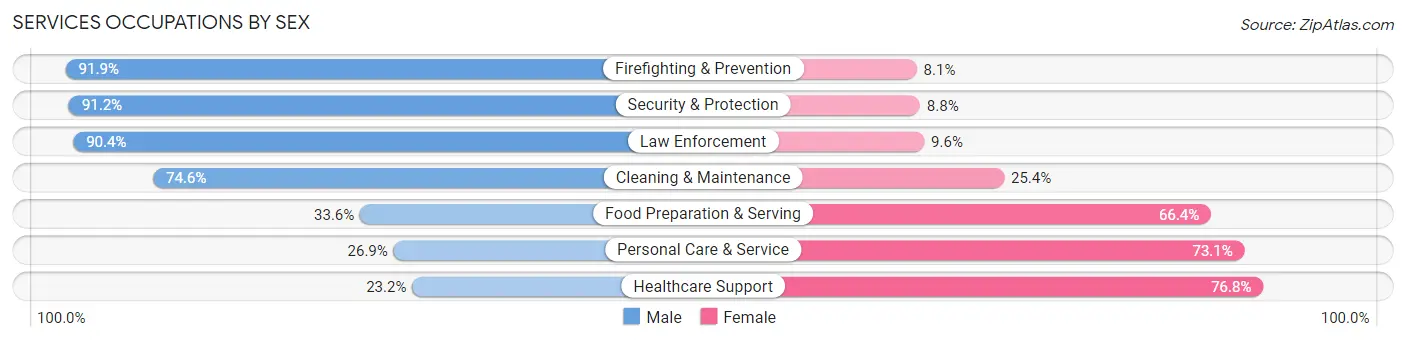
| Occupation | Male | Female |
| Healthcare Support | 33 (23.2%) | 109 (76.8%) |
| Security & Protection | 686 (91.2%) | 66 (8.8%) |
| Firefighting & Prevention | 395 (91.9%) | 35 (8.1%) |
| Law Enforcement | 291 (90.4%) | 31 (9.6%) |
| Food Preparation & Serving | 243 (33.6%) | 481 (66.4%) |
| Cleaning & Maintenance | 469 (74.6%) | 160 (25.4%) |
| Personal Care & Service | 108 (26.9%) | 293 (73.1%) |
| Total (Category) | 1,539 (58.1%) | 1,109 (41.9%) |
| Total (Overall) | 8,645 (52.9%) | 7,700 (47.1%) |
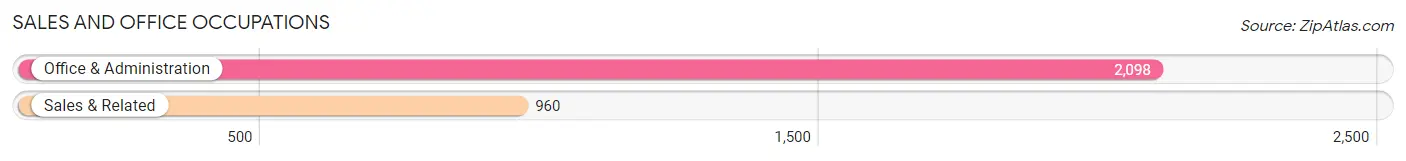
Sales and Office Occupations
The most common Sales and Office occupations in Juneau city and borough are Office & Administration (2,098 | 12.8%), and Sales & Related (960 | 5.9%).
Sales and Office Occupations by Sex
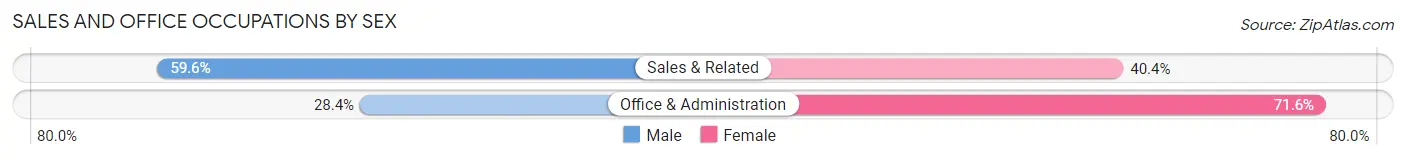
| Occupation | Male | Female |
| Sales & Related | 572 (59.6%) | 388 (40.4%) |
| Office & Administration | 596 (28.4%) | 1,502 (71.6%) |
| Total (Category) | 1,168 (38.2%) | 1,890 (61.8%) |
| Total (Overall) | 8,645 (52.9%) | 7,700 (47.1%) |
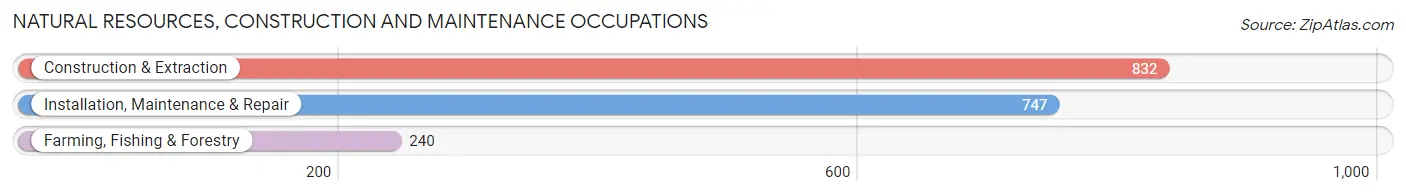
Natural Resources, Construction and Maintenance Occupations
The most common Natural Resources, Construction and Maintenance occupations in Juneau city and borough are Construction & Extraction (832 | 5.1%), Installation, Maintenance & Repair (747 | 4.6%), and Farming, Fishing & Forestry (240 | 1.5%).
Natural Resources, Construction and Maintenance Occupations by Sex
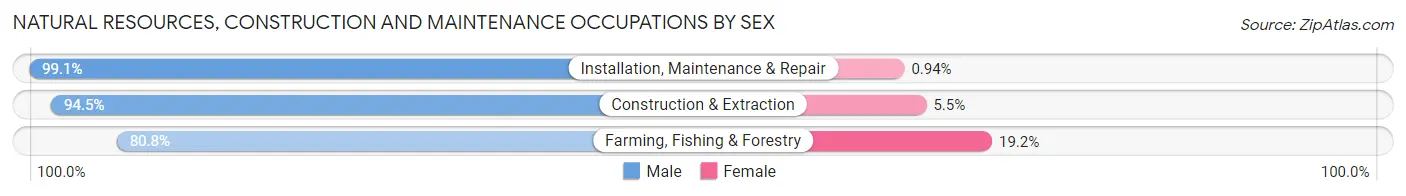
| Occupation | Male | Female |
| Farming, Fishing & Forestry | 194 (80.8%) | 46 (19.2%) |
| Construction & Extraction | 786 (94.5%) | 46 (5.5%) |
| Installation, Maintenance & Repair | 740 (99.1%) | 7 (0.9%) |
| Total (Category) | 1,720 (94.6%) | 99 (5.4%) |
| Total (Overall) | 8,645 (52.9%) | 7,700 (47.1%) |
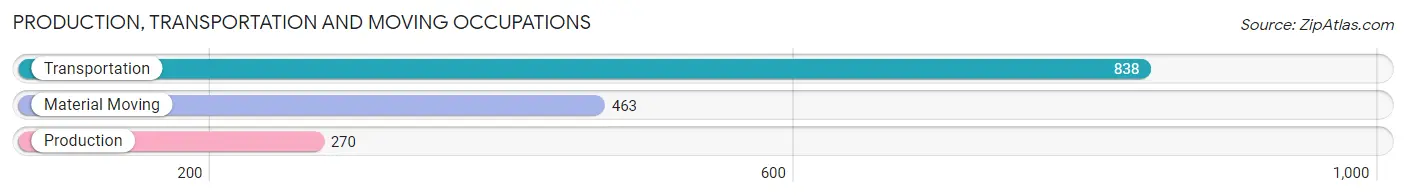
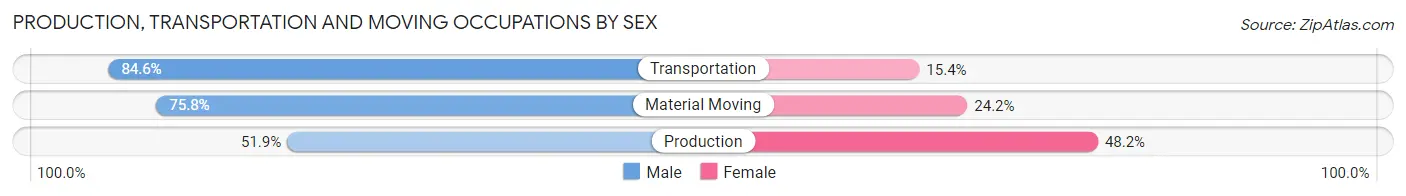
Production, Transportation and Moving Occupations
The most common Production, Transportation and Moving occupations in Juneau city and borough are Transportation (838 | 5.1%), Material Moving (463 | 2.8%), and Production (270 | 1.7%).
Production, Transportation and Moving Occupations by Sex
| Occupation | Male | Female |
| Production | 140 (51.8%) | 130 (48.1%) |
| Transportation | 709 (84.6%) | 129 (15.4%) |
| Material Moving | 351 (75.8%) | 112 (24.2%) |
| Total (Category) | 1,200 (76.4%) | 371 (23.6%) |
| Total (Overall) | 8,645 (52.9%) | 7,700 (47.1%) |
Employment Industries by Sex in Juneau city and borough
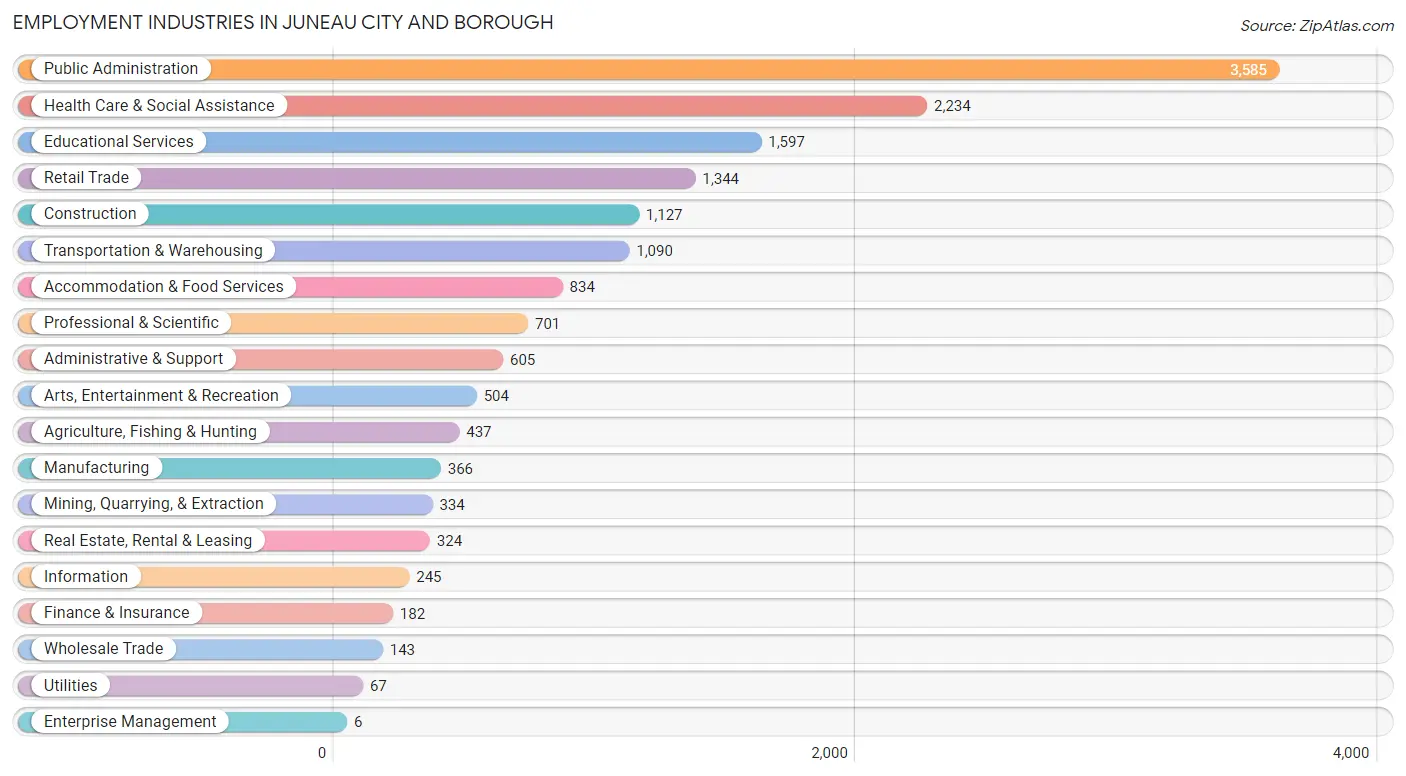
Employment Industries in Juneau city and borough
The major employment industries in Juneau city and borough include Public Administration (3,585 | 21.9%), Health Care & Social Assistance (2,234 | 13.7%), Educational Services (1,597 | 9.8%), Retail Trade (1,344 | 8.2%), and Construction (1,127 | 6.9%).
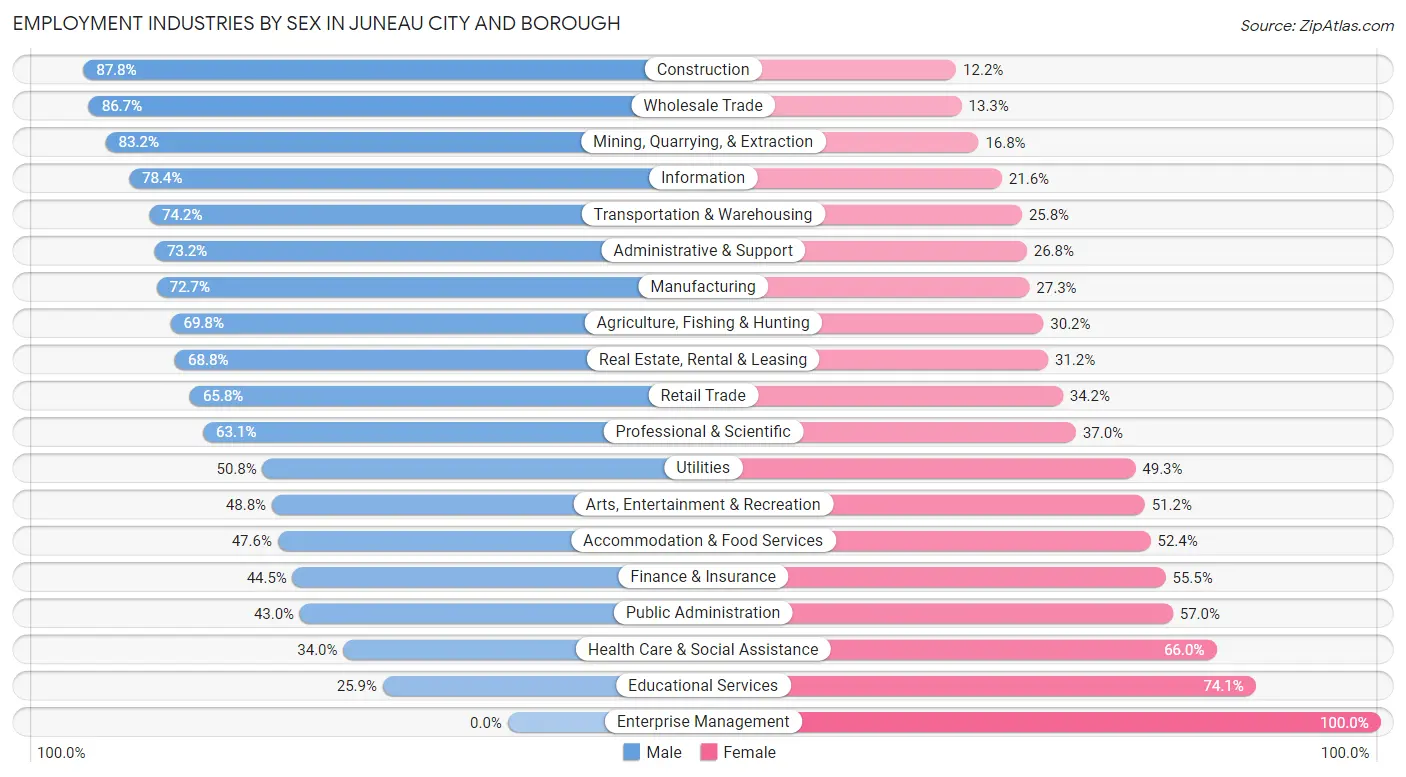
Employment Industries by Sex in Juneau city and borough
The Juneau city and borough industries that see more men than women are Construction (87.8%), Wholesale Trade (86.7%), and Mining, Quarrying, & Extraction (83.2%), whereas the industries that tend to have a higher number of women are Enterprise Management (100.0%), Educational Services (74.1%), and Health Care & Social Assistance (66.0%).
| Industry | Male | Female |
| Agriculture, Fishing & Hunting | 305 (69.8%) | 132 (30.2%) |
| Mining, Quarrying, & Extraction | 278 (83.2%) | 56 (16.8%) |
| Construction | 990 (87.8%) | 137 (12.2%) |
| Manufacturing | 266 (72.7%) | 100 (27.3%) |
| Wholesale Trade | 124 (86.7%) | 19 (13.3%) |
| Retail Trade | 884 (65.8%) | 460 (34.2%) |
| Transportation & Warehousing | 809 (74.2%) | 281 (25.8%) |
| Utilities | 34 (50.7%) | 33 (49.2%) |
| Information | 192 (78.4%) | 53 (21.6%) |
| Finance & Insurance | 81 (44.5%) | 101 (55.5%) |
| Real Estate, Rental & Leasing | 223 (68.8%) | 101 (31.2%) |
| Professional & Scientific | 442 (63.0%) | 259 (36.9%) |
| Enterprise Management | 0 (0.0%) | 6 (100.0%) |
| Administrative & Support | 443 (73.2%) | 162 (26.8%) |
| Educational Services | 413 (25.9%) | 1,184 (74.1%) |
| Health Care & Social Assistance | 760 (34.0%) | 1,474 (66.0%) |
| Arts, Entertainment & Recreation | 246 (48.8%) | 258 (51.2%) |
| Accommodation & Food Services | 397 (47.6%) | 437 (52.4%) |
| Public Administration | 1,542 (43.0%) | 2,043 (57.0%) |
| Total | 8,645 (52.9%) | 7,700 (47.1%) |
Education in Juneau city and borough
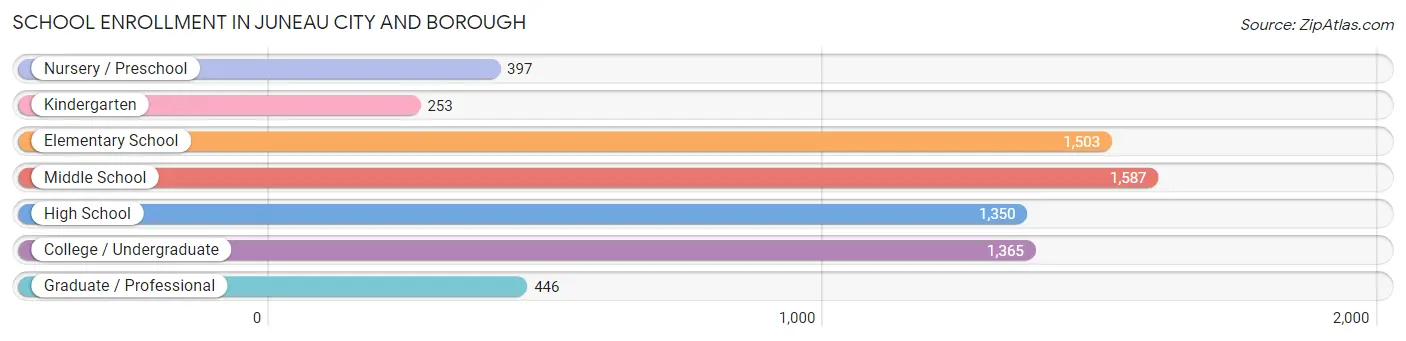
School Enrollment in Juneau city and borough
The most common levels of schooling among the 6,901 students in Juneau city and borough are middle school (1,587 | 23.0%), elementary school (1,503 | 21.8%), and college / undergraduate (1,365 | 19.8%).
| School Level | # Students | % Students |
| Nursery / Preschool | 397 | 5.8% |
| Kindergarten | 253 | 3.7% |
| Elementary School | 1,503 | 21.8% |
| Middle School | 1,587 | 23.0% |
| High School | 1,350 | 19.6% |
| College / Undergraduate | 1,365 | 19.8% |
| Graduate / Professional | 446 | 6.5% |
| Total | 6,901 | 100.0% |
School Enrollment by Age by Funding Source in Juneau city and borough
Out of a total of 6,901 students who are enrolled in schools in Juneau city and borough, 925 (13.4%) attend a private institution, while the remaining 5,976 (86.6%) are enrolled in public schools. The age group of 3 to 4 year olds has the highest likelihood of being enrolled in private schools, with 144 (43.1% in the age bracket) enrolled. Conversely, the age group of 18 to 19 year olds has the lowest likelihood of being enrolled in a private school, with 436 (96.5% in the age bracket) attending a public institution.
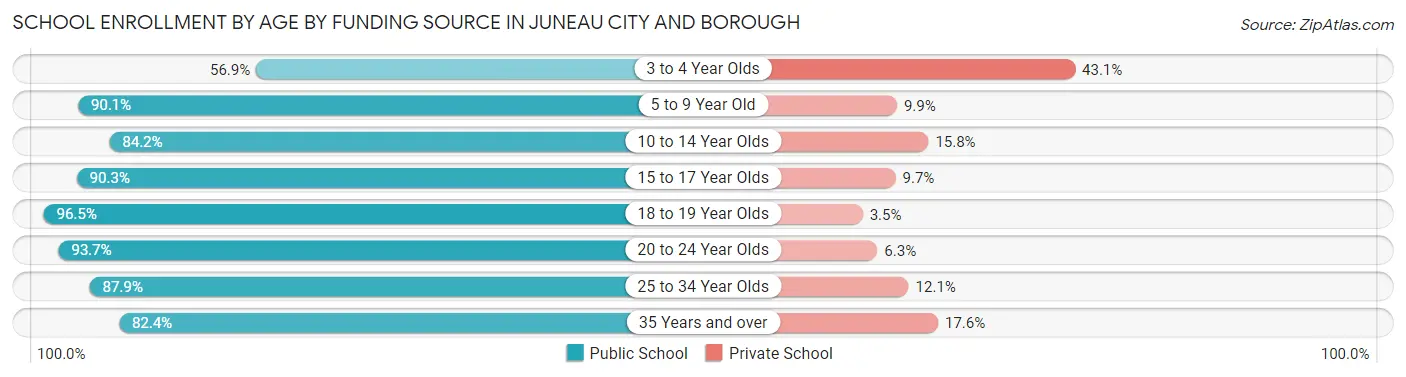
| Age Bracket | Public School | Private School |
| 3 to 4 Year Olds | 190 (56.9%) | 144 (43.1%) |
| 5 to 9 Year Old | 1,496 (90.1%) | 165 (9.9%) |
| 10 to 14 Year Olds | 1,563 (84.2%) | 293 (15.8%) |
| 15 to 17 Year Olds | 952 (90.3%) | 102 (9.7%) |
| 18 to 19 Year Olds | 436 (96.5%) | 16 (3.5%) |
| 20 to 24 Year Olds | 448 (93.7%) | 30 (6.3%) |
| 25 to 34 Year Olds | 247 (87.9%) | 34 (12.1%) |
| 35 Years and over | 647 (82.4%) | 138 (17.6%) |
| Total | 5,976 (86.6%) | 925 (13.4%) |
Educational Attainment by Field of Study in Juneau city and borough
Social sciences (1,388 | 13.2%), bio, nature & agricultural (1,343 | 12.8%), business (1,267 | 12.1%), education (1,051 | 10.0%), and science & technology (919 | 8.8%) are the most common fields of study among 10,482 individuals in Juneau city and borough who have obtained a bachelor's degree or higher.
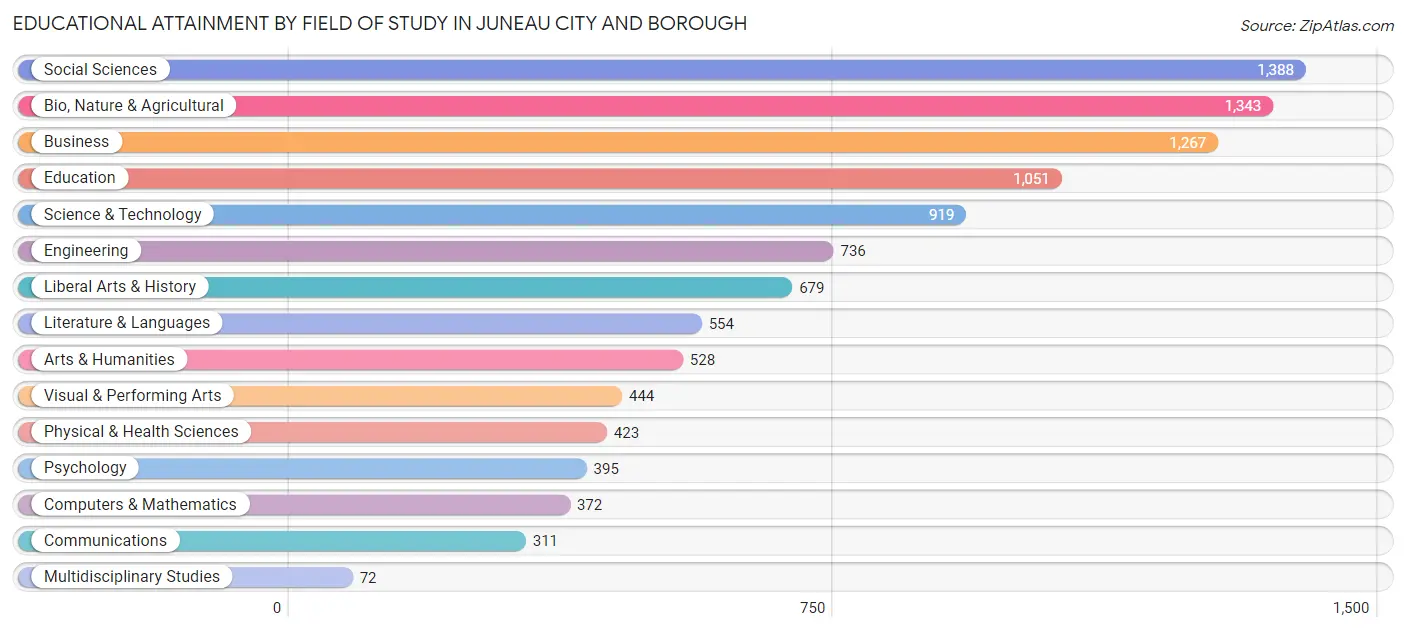
| Field of Study | # Graduates | % Graduates |
| Computers & Mathematics | 372 | 3.5% |
| Bio, Nature & Agricultural | 1,343 | 12.8% |
| Physical & Health Sciences | 423 | 4.0% |
| Psychology | 395 | 3.8% |
| Social Sciences | 1,388 | 13.2% |
| Engineering | 736 | 7.0% |
| Multidisciplinary Studies | 72 | 0.7% |
| Science & Technology | 919 | 8.8% |
| Business | 1,267 | 12.1% |
| Education | 1,051 | 10.0% |
| Literature & Languages | 554 | 5.3% |
| Liberal Arts & History | 679 | 6.5% |
| Visual & Performing Arts | 444 | 4.2% |
| Communications | 311 | 3.0% |
| Arts & Humanities | 528 | 5.0% |
| Total | 10,482 | 100.0% |
Transportation & Commute in Juneau city and borough
Vehicle Availability by Sex in Juneau city and borough
The most prevalent vehicle ownership categories in Juneau city and borough are males with 2 vehicles (3,844, accounting for 44.2%) and females with 2 vehicles (3,145, making up 50.8%).
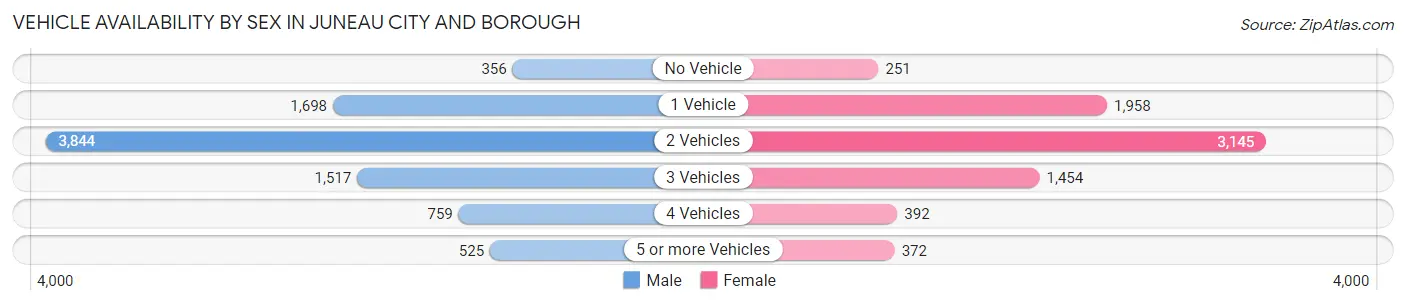
| Vehicles Available | Male | Female |
| No Vehicle | 356 (4.1%) | 251 (3.3%) |
| 1 Vehicle | 1,698 (19.5%) | 1,958 (25.9%) |
| 2 Vehicles | 3,844 (44.2%) | 3,145 (41.5%) |
| 3 Vehicles | 1,517 (17.4%) | 1,454 (19.2%) |
| 4 Vehicles | 759 (8.7%) | 392 (5.2%) |
| 5 or more Vehicles | 525 (6.0%) | 372 (4.9%) |
| Total | 8,699 (100.0%) | 7,572 (100.0%) |
Commute Time in Juneau city and borough
The most frequently occuring commute durations in Juneau city and borough are 10 to 14 minutes (4,427 commuters, 30.2%), 15 to 19 minutes (2,953 commuters, 20.1%), and 5 to 9 minutes (2,578 commuters, 17.6%).
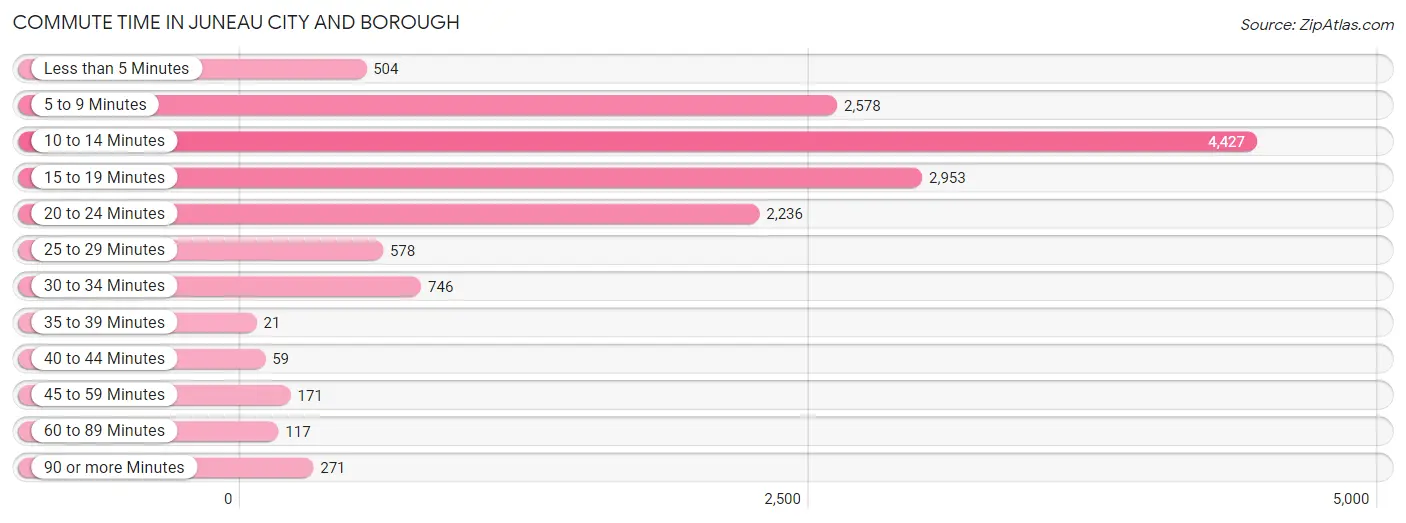
| Commute Time | # Commuters | % Commuters |
| Less than 5 Minutes | 504 | 3.4% |
| 5 to 9 Minutes | 2,578 | 17.6% |
| 10 to 14 Minutes | 4,427 | 30.2% |
| 15 to 19 Minutes | 2,953 | 20.1% |
| 20 to 24 Minutes | 2,236 | 15.2% |
| 25 to 29 Minutes | 578 | 3.9% |
| 30 to 34 Minutes | 746 | 5.1% |
| 35 to 39 Minutes | 21 | 0.1% |
| 40 to 44 Minutes | 59 | 0.4% |
| 45 to 59 Minutes | 171 | 1.2% |
| 60 to 89 Minutes | 117 | 0.8% |
| 90 or more Minutes | 271 | 1.8% |
Commute Time by Sex in Juneau city and borough
The most common commute times in Juneau city and borough are 10 to 14 minutes (2,413 commuters, 29.9%) for males and 10 to 14 minutes (2,014 commuters, 30.5%) for females.
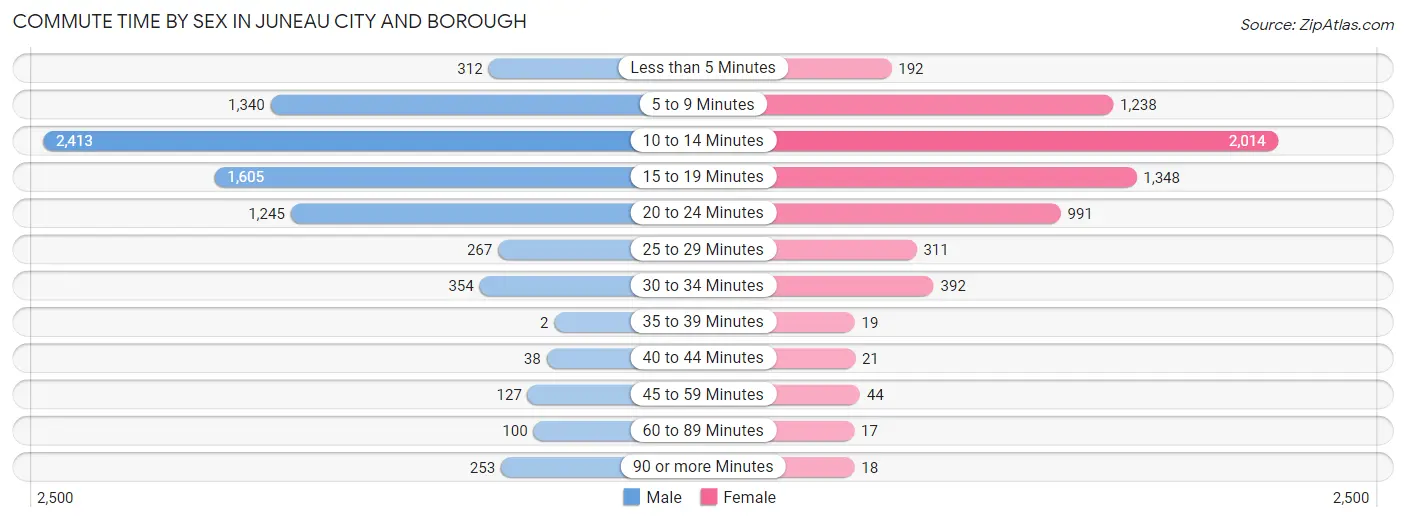
| Commute Time | Male | Female |
| Less than 5 Minutes | 312 (3.9%) | 192 (2.9%) |
| 5 to 9 Minutes | 1,340 (16.6%) | 1,238 (18.7%) |
| 10 to 14 Minutes | 2,413 (29.9%) | 2,014 (30.5%) |
| 15 to 19 Minutes | 1,605 (19.9%) | 1,348 (20.4%) |
| 20 to 24 Minutes | 1,245 (15.4%) | 991 (15.0%) |
| 25 to 29 Minutes | 267 (3.3%) | 311 (4.7%) |
| 30 to 34 Minutes | 354 (4.4%) | 392 (5.9%) |
| 35 to 39 Minutes | 2 (0.0%) | 19 (0.3%) |
| 40 to 44 Minutes | 38 (0.5%) | 21 (0.3%) |
| 45 to 59 Minutes | 127 (1.6%) | 44 (0.7%) |
| 60 to 89 Minutes | 100 (1.2%) | 17 (0.3%) |
| 90 or more Minutes | 253 (3.1%) | 18 (0.3%) |
Time of Departure to Work by Sex in Juneau city and borough
The most frequent times of departure to work in Juneau city and borough are 7:00 AM to 7:29 AM (1,838, 22.8%) for males and 7:30 AM to 7:59 AM (2,030, 30.7%) for females.
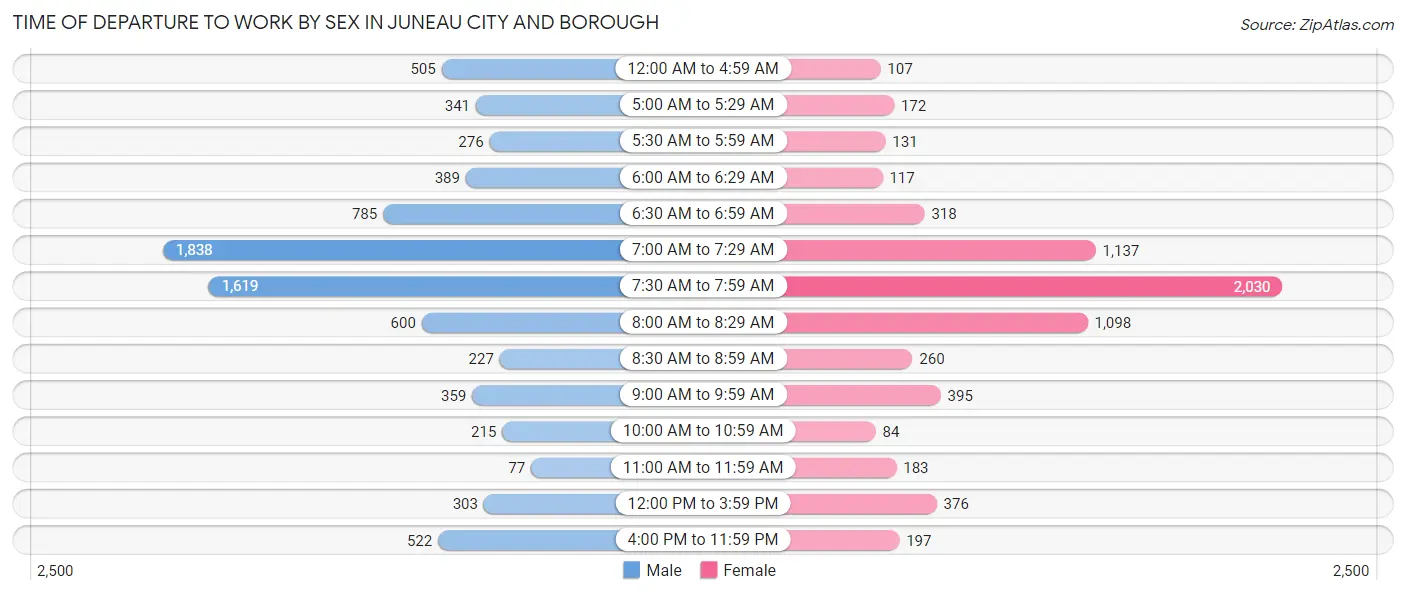
| Time of Departure | Male | Female |
| 12:00 AM to 4:59 AM | 505 (6.3%) | 107 (1.6%) |
| 5:00 AM to 5:29 AM | 341 (4.2%) | 172 (2.6%) |
| 5:30 AM to 5:59 AM | 276 (3.4%) | 131 (2.0%) |
| 6:00 AM to 6:29 AM | 389 (4.8%) | 117 (1.8%) |
| 6:30 AM to 6:59 AM | 785 (9.7%) | 318 (4.8%) |
| 7:00 AM to 7:29 AM | 1,838 (22.8%) | 1,137 (17.2%) |
| 7:30 AM to 7:59 AM | 1,619 (20.1%) | 2,030 (30.7%) |
| 8:00 AM to 8:29 AM | 600 (7.4%) | 1,098 (16.6%) |
| 8:30 AM to 8:59 AM | 227 (2.8%) | 260 (3.9%) |
| 9:00 AM to 9:59 AM | 359 (4.5%) | 395 (6.0%) |
| 10:00 AM to 10:59 AM | 215 (2.7%) | 84 (1.3%) |
| 11:00 AM to 11:59 AM | 77 (1.0%) | 183 (2.8%) |
| 12:00 PM to 3:59 PM | 303 (3.8%) | 376 (5.7%) |
| 4:00 PM to 11:59 PM | 522 (6.5%) | 197 (3.0%) |
| Total | 8,056 (100.0%) | 6,605 (100.0%) |
Housing Occupancy in Juneau city and borough
Occupancy by Ownership in Juneau city and borough
Of the total 13,017 dwellings in Juneau city and borough, owner-occupied units account for 8,365 (64.3%), while renter-occupied units make up 4,652 (35.7%).
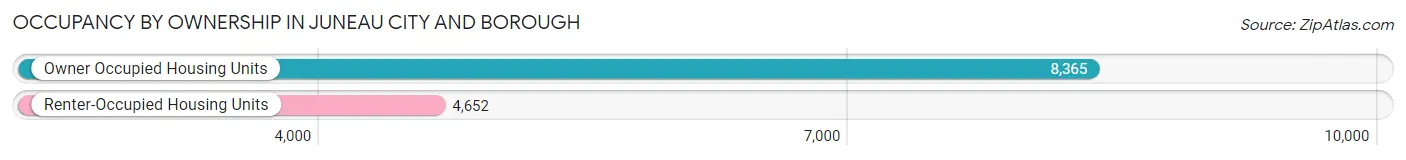
| Occupancy | # Housing Units | % Housing Units |
| Owner Occupied Housing Units | 8,365 | 64.3% |
| Renter-Occupied Housing Units | 4,652 | 35.7% |
| Total Occupied Housing Units | 13,017 | 100.0% |
Occupancy by Household Size in Juneau city and borough
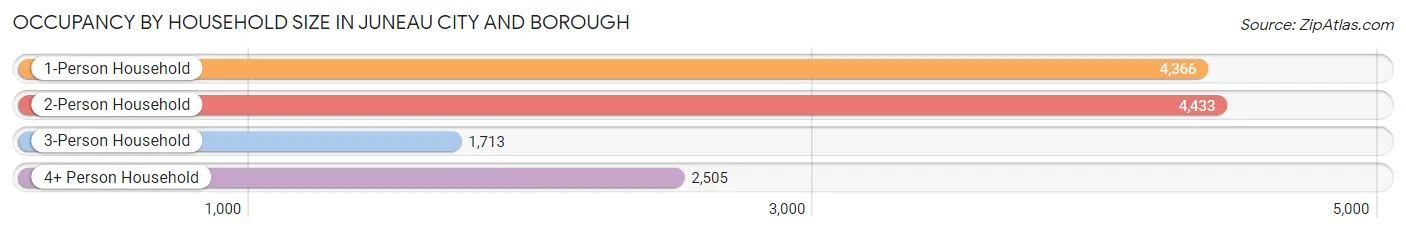
| Household Size | # Housing Units | % Housing Units |
| 1-Person Household | 4,366 | 33.5% |
| 2-Person Household | 4,433 | 34.1% |
| 3-Person Household | 1,713 | 13.2% |
| 4+ Person Household | 2,505 | 19.2% |
| Total Housing Units | 13,017 | 100.0% |
Occupancy by Ownership by Household Size in Juneau city and borough
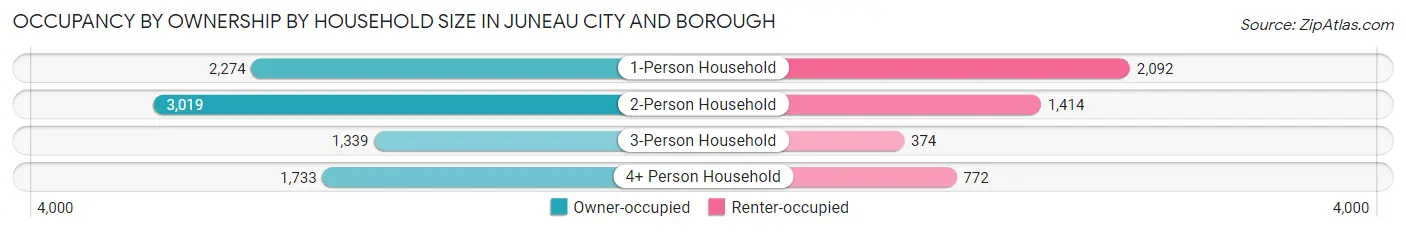
| Household Size | Owner-occupied | Renter-occupied |
| 1-Person Household | 2,274 (52.1%) | 2,092 (47.9%) |
| 2-Person Household | 3,019 (68.1%) | 1,414 (31.9%) |
| 3-Person Household | 1,339 (78.2%) | 374 (21.8%) |
| 4+ Person Household | 1,733 (69.2%) | 772 (30.8%) |
| Total Housing Units | 8,365 (64.3%) | 4,652 (35.7%) |
Occupancy by Educational Attainment in Juneau city and borough
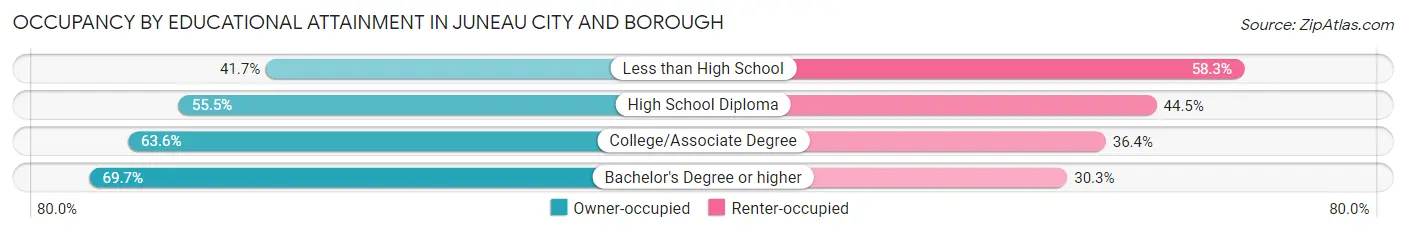
| Household Size | Owner-occupied | Renter-occupied |
| Less than High School | 151 (41.7%) | 211 (58.3%) |
| High School Diploma | 1,343 (55.5%) | 1,076 (44.5%) |
| College/Associate Degree | 2,723 (63.6%) | 1,560 (36.4%) |
| Bachelor's Degree or higher | 4,148 (69.7%) | 1,805 (30.3%) |
Occupancy by Age of Householder in Juneau city and borough
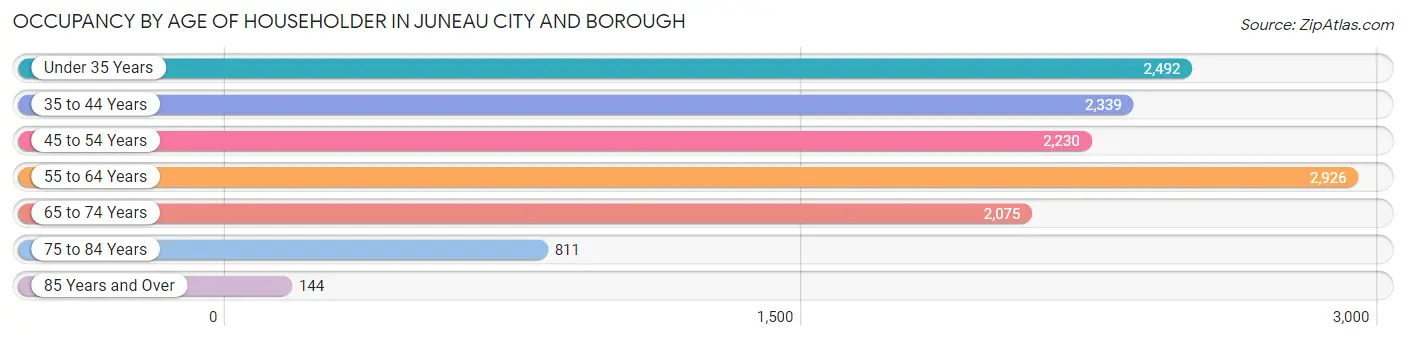
| Age Bracket | # Households | % Households |
| Under 35 Years | 2,492 | 19.1% |
| 35 to 44 Years | 2,339 | 18.0% |
| 45 to 54 Years | 2,230 | 17.1% |
| 55 to 64 Years | 2,926 | 22.5% |
| 65 to 74 Years | 2,075 | 15.9% |
| 75 to 84 Years | 811 | 6.2% |
| 85 Years and Over | 144 | 1.1% |
| Total | 13,017 | 100.0% |
Housing Finances in Juneau city and borough
Median Income by Occupancy in Juneau city and borough
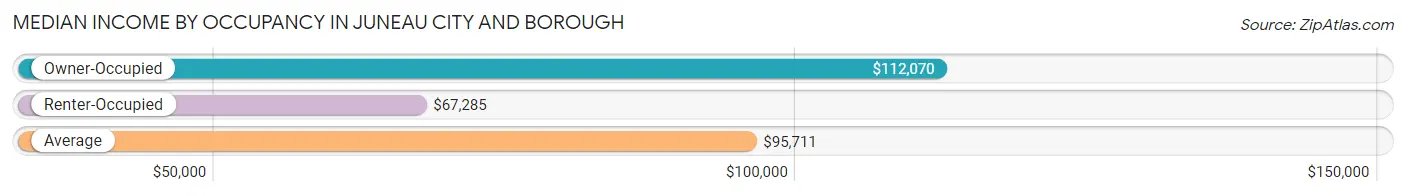
| Occupancy Type | # Households | Median Income |
| Owner-Occupied | 8,365 (64.3%) | $112,070 |
| Renter-Occupied | 4,652 (35.7%) | $67,285 |
| Average | 13,017 (100.0%) | $95,711 |
Occupancy by Householder Income Bracket in Juneau city and borough
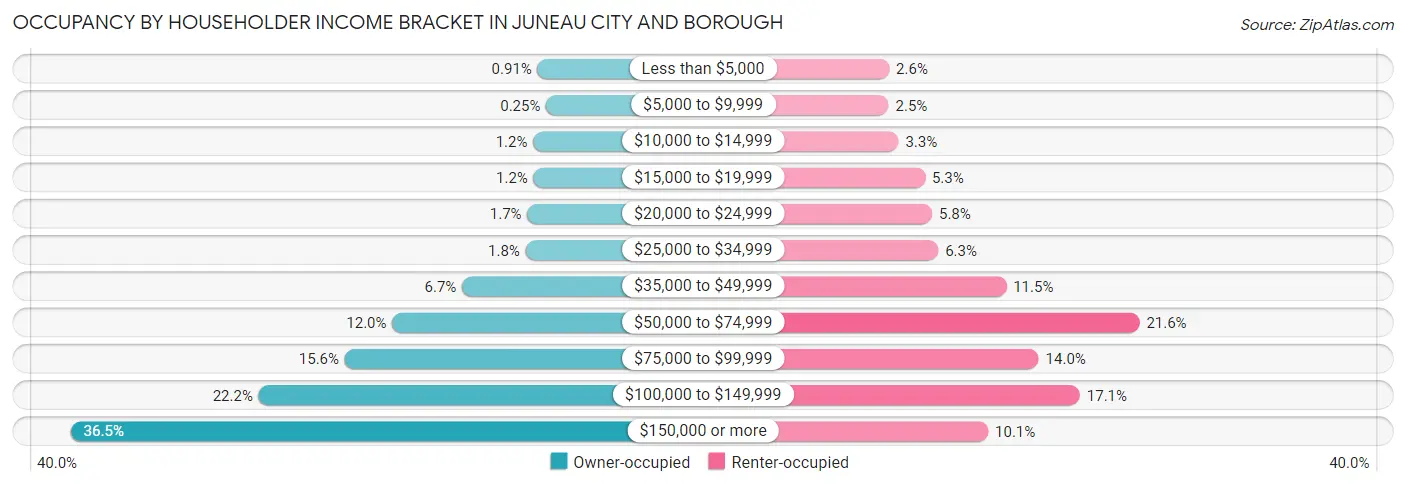
| Income Bracket | Owner-occupied | Renter-occupied |
| Less than $5,000 | 76 (0.9%) | 119 (2.6%) |
| $5,000 to $9,999 | 21 (0.3%) | 117 (2.5%) |
| $10,000 to $14,999 | 104 (1.2%) | 152 (3.3%) |
| $15,000 to $19,999 | 101 (1.2%) | 246 (5.3%) |
| $20,000 to $24,999 | 141 (1.7%) | 271 (5.8%) |
| $25,000 to $34,999 | 152 (1.8%) | 293 (6.3%) |
| $35,000 to $49,999 | 557 (6.7%) | 534 (11.5%) |
| $50,000 to $74,999 | 1,002 (12.0%) | 1,006 (21.6%) |
| $75,000 to $99,999 | 1,305 (15.6%) | 649 (14.0%) |
| $100,000 to $149,999 | 1,854 (22.2%) | 795 (17.1%) |
| $150,000 or more | 3,052 (36.5%) | 470 (10.1%) |
| Total | 8,365 (100.0%) | 4,652 (100.0%) |
Monthly Housing Cost Tiers in Juneau city and borough
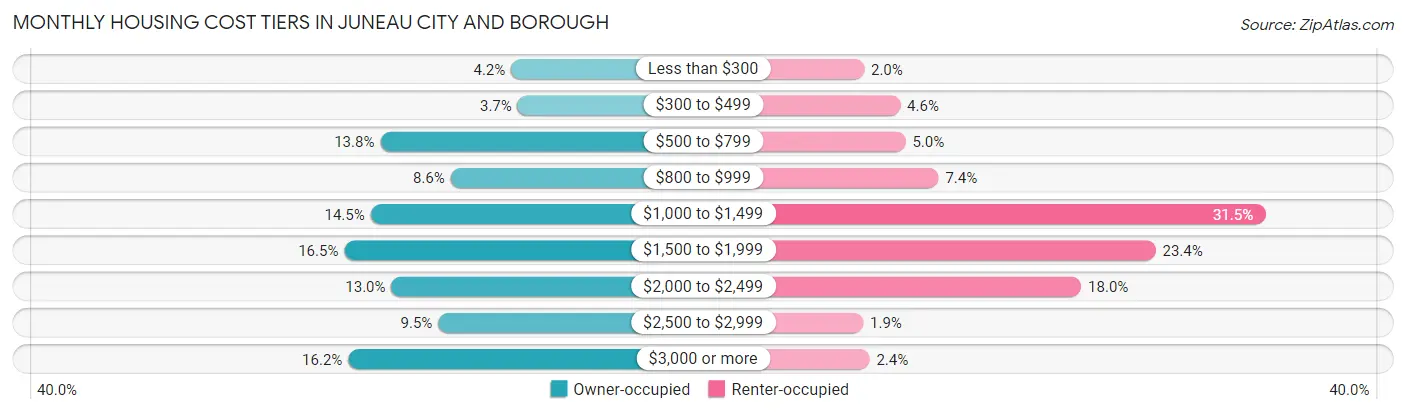
| Monthly Cost | Owner-occupied | Renter-occupied |
| Less than $300 | 349 (4.2%) | 91 (2.0%) |
| $300 to $499 | 309 (3.7%) | 215 (4.6%) |
| $500 to $799 | 1,155 (13.8%) | 233 (5.0%) |
| $800 to $999 | 722 (8.6%) | 346 (7.4%) |
| $1,000 to $1,499 | 1,215 (14.5%) | 1,465 (31.5%) |
| $1,500 to $1,999 | 1,377 (16.5%) | 1,090 (23.4%) |
| $2,000 to $2,499 | 1,087 (13.0%) | 835 (17.9%) |
| $2,500 to $2,999 | 798 (9.5%) | 88 (1.9%) |
| $3,000 or more | 1,353 (16.2%) | 110 (2.4%) |
| Total | 8,365 (100.0%) | 4,652 (100.0%) |
Physical Housing Characteristics in Juneau city and borough
Housing Structures in Juneau city and borough
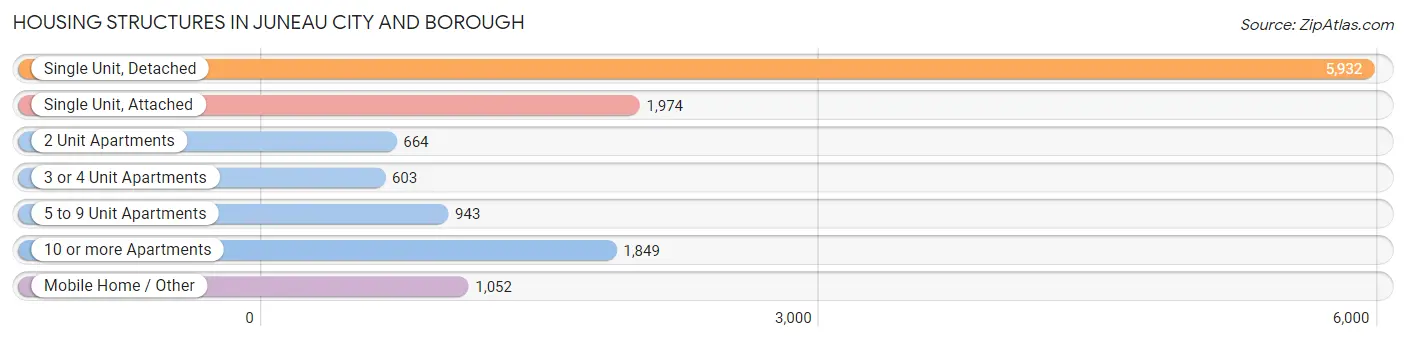
| Structure Type | # Housing Units | % Housing Units |
| Single Unit, Detached | 5,932 | 45.6% |
| Single Unit, Attached | 1,974 | 15.2% |
| 2 Unit Apartments | 664 | 5.1% |
| 3 or 4 Unit Apartments | 603 | 4.6% |
| 5 to 9 Unit Apartments | 943 | 7.2% |
| 10 or more Apartments | 1,849 | 14.2% |
| Mobile Home / Other | 1,052 | 8.1% |
| Total | 13,017 | 100.0% |
Housing Structures by Occupancy in Juneau city and borough
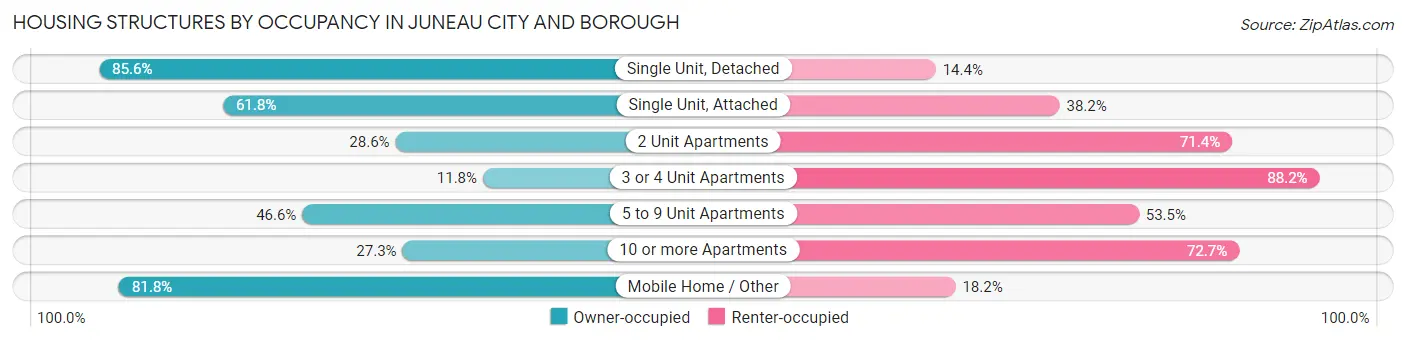
| Structure Type | Owner-occupied | Renter-occupied |
| Single Unit, Detached | 5,080 (85.6%) | 852 (14.4%) |
| Single Unit, Attached | 1,220 (61.8%) | 754 (38.2%) |
| 2 Unit Apartments | 190 (28.6%) | 474 (71.4%) |
| 3 or 4 Unit Apartments | 71 (11.8%) | 532 (88.2%) |
| 5 to 9 Unit Apartments | 439 (46.6%) | 504 (53.4%) |
| 10 or more Apartments | 504 (27.3%) | 1,345 (72.7%) |
| Mobile Home / Other | 861 (81.8%) | 191 (18.2%) |
| Total | 8,365 (64.3%) | 4,652 (35.7%) |
Housing Structures by Number of Rooms in Juneau city and borough
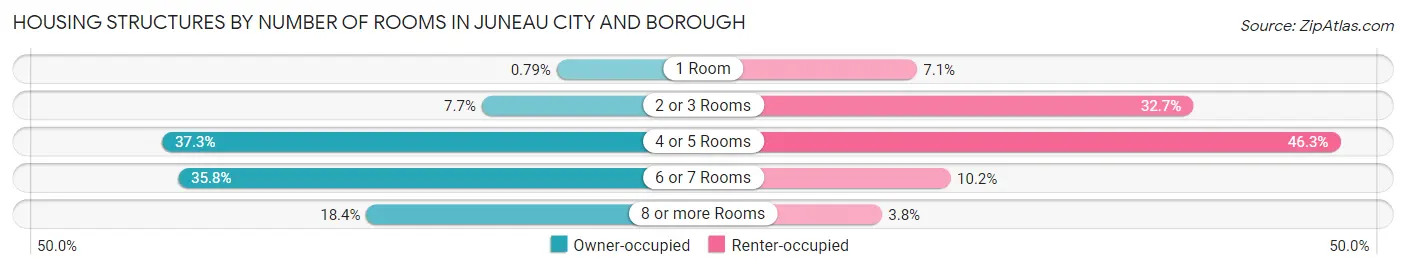
| Number of Rooms | Owner-occupied | Renter-occupied |
| 1 Room | 66 (0.8%) | 329 (7.1%) |
| 2 or 3 Rooms | 646 (7.7%) | 1,519 (32.7%) |
| 4 or 5 Rooms | 3,119 (37.3%) | 2,152 (46.3%) |
| 6 or 7 Rooms | 2,995 (35.8%) | 474 (10.2%) |
| 8 or more Rooms | 1,539 (18.4%) | 178 (3.8%) |
| Total | 8,365 (100.0%) | 4,652 (100.0%) |
Housing Structure by Heating Type in Juneau city and borough
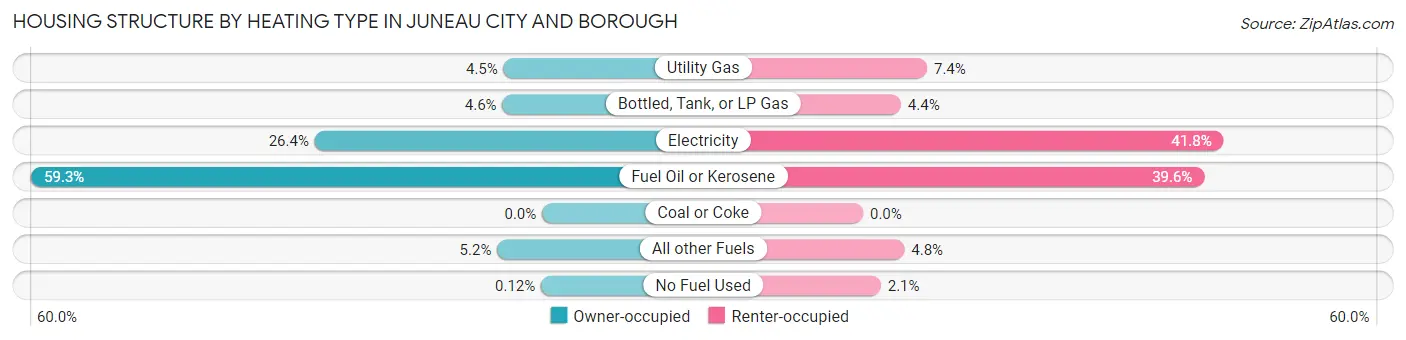
| Heating Type | Owner-occupied | Renter-occupied |
| Utility Gas | 373 (4.5%) | 345 (7.4%) |
| Bottled, Tank, or LP Gas | 385 (4.6%) | 204 (4.4%) |
| Electricity | 2,205 (26.4%) | 1,944 (41.8%) |
| Fuel Oil or Kerosene | 4,957 (59.3%) | 1,840 (39.6%) |
| Coal or Coke | 0 (0.0%) | 0 (0.0%) |
| All other Fuels | 435 (5.2%) | 223 (4.8%) |
| No Fuel Used | 10 (0.1%) | 96 (2.1%) |
| Total | 8,365 (100.0%) | 4,652 (100.0%) |
Household Vehicle Usage in Juneau city and borough
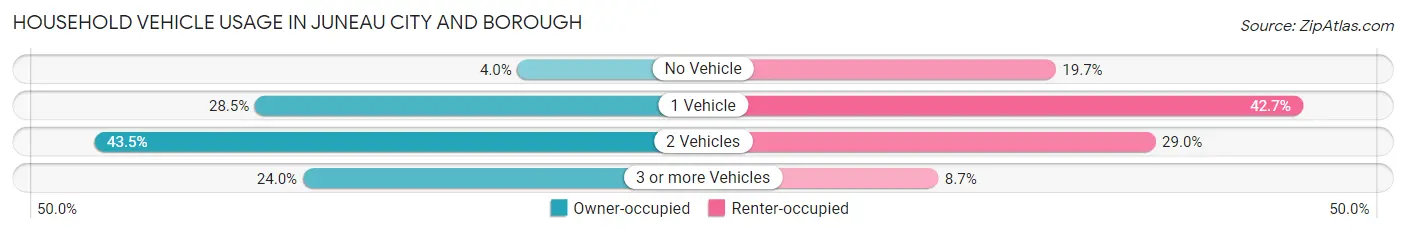
| Vehicles per Household | Owner-occupied | Renter-occupied |
| No Vehicle | 333 (4.0%) | 914 (19.7%) |
| 1 Vehicle | 2,383 (28.5%) | 1,987 (42.7%) |
| 2 Vehicles | 3,640 (43.5%) | 1,347 (29.0%) |
| 3 or more Vehicles | 2,009 (24.0%) | 404 (8.7%) |
| Total | 8,365 (100.0%) | 4,652 (100.0%) |
Real Estate & Mortgages in Juneau city and borough
Real Estate and Mortgage Overview in Juneau city and borough
| Characteristic | Without Mortgage | With Mortgage |
| Housing Units | 3,078 | 5,287 |
| Median Property Value | $399,500 | $407,300 |
| Median Household Income | $88,672 | $2,195 |
| Monthly Housing Costs | $750 | $1,345 |
| Real Estate Taxes | $3,296 | $156 |
Property Value by Mortgage Status in Juneau city and borough
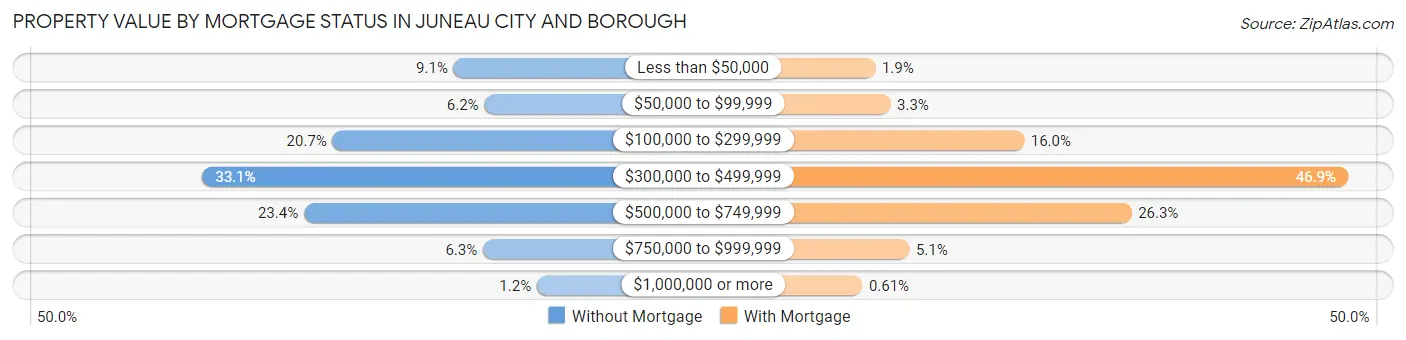
| Property Value | Without Mortgage | With Mortgage |
| Less than $50,000 | 281 (9.1%) | 98 (1.8%) |
| $50,000 to $99,999 | 191 (6.2%) | 174 (3.3%) |
| $100,000 to $299,999 | 636 (20.7%) | 847 (16.0%) |
| $300,000 to $499,999 | 1,018 (33.1%) | 2,479 (46.9%) |
| $500,000 to $749,999 | 720 (23.4%) | 1,388 (26.3%) |
| $750,000 to $999,999 | 195 (6.3%) | 269 (5.1%) |
| $1,000,000 or more | 37 (1.2%) | 32 (0.6%) |
| Total | 3,078 (100.0%) | 5,287 (100.0%) |
Household Income by Mortgage Status in Juneau city and borough
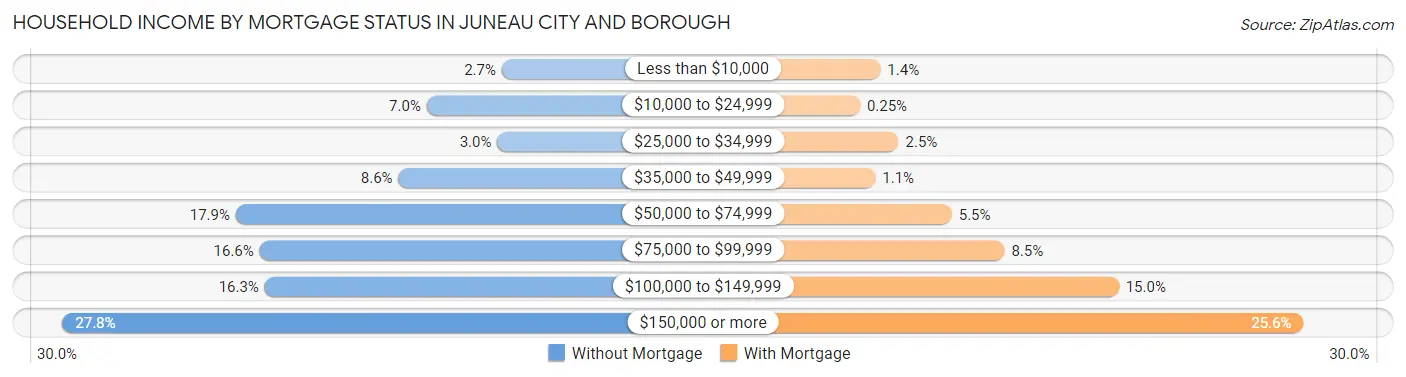
| Household Income | Without Mortgage | With Mortgage |
| Less than $10,000 | 84 (2.7%) | 75 (1.4%) |
| $10,000 to $24,999 | 216 (7.0%) | 13 (0.3%) |
| $25,000 to $34,999 | 92 (3.0%) | 130 (2.5%) |
| $35,000 to $49,999 | 266 (8.6%) | 60 (1.1%) |
| $50,000 to $74,999 | 552 (17.9%) | 291 (5.5%) |
| $75,000 to $99,999 | 510 (16.6%) | 450 (8.5%) |
| $100,000 to $149,999 | 501 (16.3%) | 795 (15.0%) |
| $150,000 or more | 857 (27.8%) | 1,353 (25.6%) |
| Total | 3,078 (100.0%) | 5,287 (100.0%) |
Property Value to Household Income Ratio in Juneau city and borough
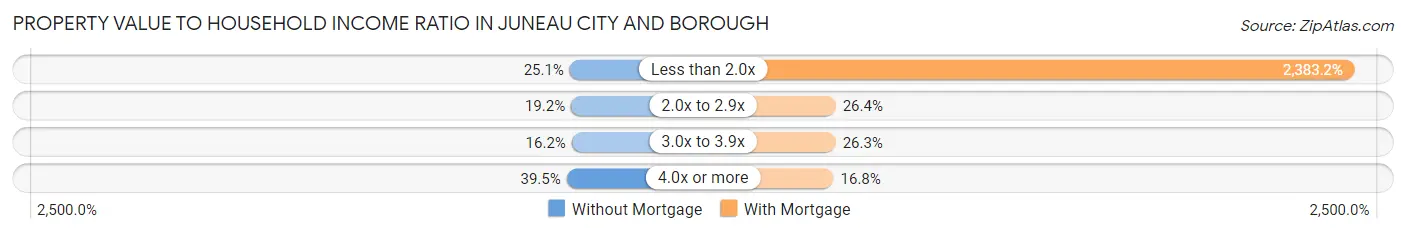
| Value-to-Income Ratio | Without Mortgage | With Mortgage |
| Less than 2.0x | 773 (25.1%) | 126,002 (2,383.2%) |
| 2.0x to 2.9x | 592 (19.2%) | 1,396 (26.4%) |
| 3.0x to 3.9x | 497 (16.2%) | 1,392 (26.3%) |
| 4.0x or more | 1,216 (39.5%) | 888 (16.8%) |
| Total | 3,078 (100.0%) | 5,287 (100.0%) |
Real Estate Taxes by Mortgage Status in Juneau city and borough
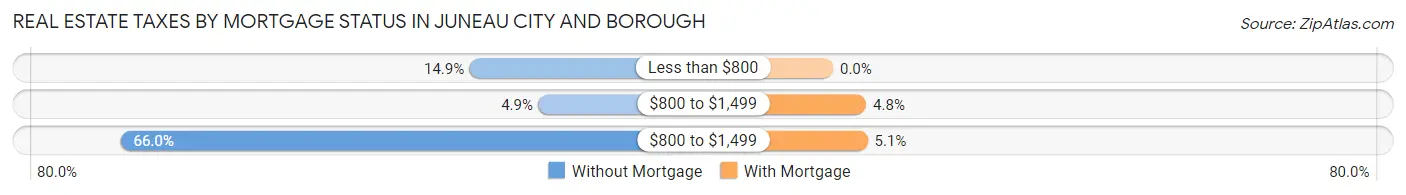
| Property Taxes | Without Mortgage | With Mortgage |
| Less than $800 | 459 (14.9%) | 0 (0.0%) |
| $800 to $1,499 | 150 (4.9%) | 256 (4.8%) |
| $800 to $1,499 | 2,031 (66.0%) | 267 (5.1%) |
| Total | 3,078 (100.0%) | 5,287 (100.0%) |
Health & Disability in Juneau city and borough
Health Insurance Coverage by Age in Juneau city and borough
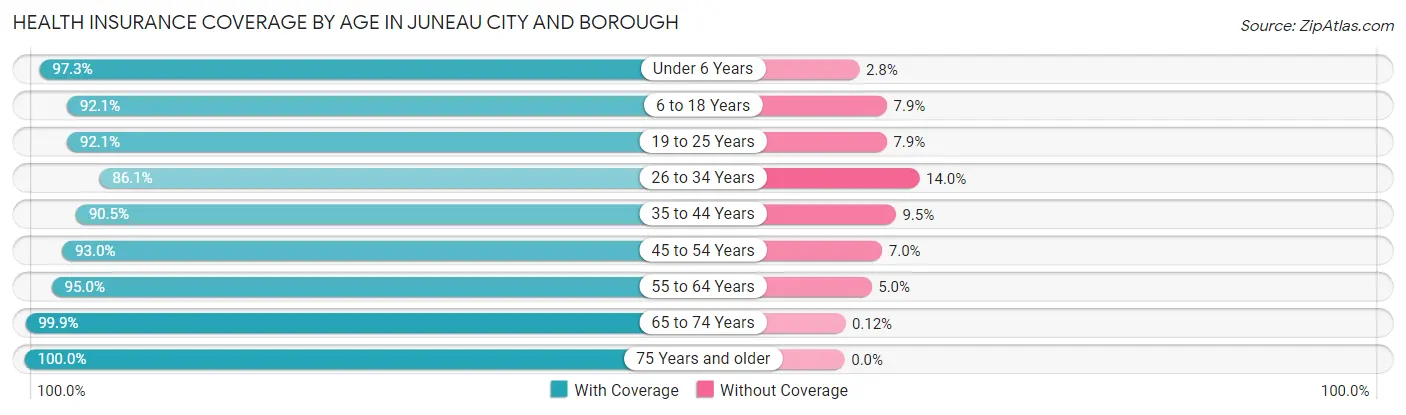
| Age Bracket | With Coverage | Without Coverage |
| Under 6 Years | 2,019 (97.3%) | 57 (2.8%) |
| 6 to 18 Years | 4,496 (92.1%) | 385 (7.9%) |
| 19 to 25 Years | 2,529 (92.1%) | 216 (7.9%) |
| 26 to 34 Years | 3,453 (86.1%) | 560 (14.0%) |
| 35 to 44 Years | 4,003 (90.5%) | 422 (9.5%) |
| 45 to 54 Years | 3,794 (93.0%) | 286 (7.0%) |
| 55 to 64 Years | 4,246 (95.0%) | 225 (5.0%) |
| 65 to 74 Years | 3,333 (99.9%) | 4 (0.1%) |
| 75 Years and older | 1,342 (100.0%) | 0 (0.0%) |
| Total | 29,215 (93.1%) | 2,155 (6.9%) |
Health Insurance Coverage by Citizenship Status in Juneau city and borough
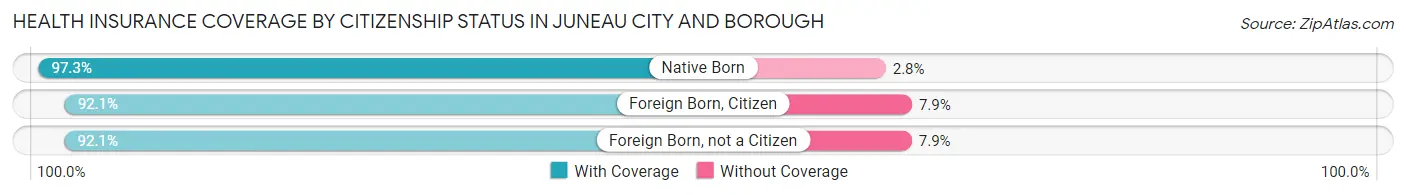
| Citizenship Status | With Coverage | Without Coverage |
| Native Born | 2,019 (97.3%) | 57 (2.8%) |
| Foreign Born, Citizen | 4,496 (92.1%) | 385 (7.9%) |
| Foreign Born, not a Citizen | 2,529 (92.1%) | 216 (7.9%) |
Health Insurance Coverage by Household Income in Juneau city and borough
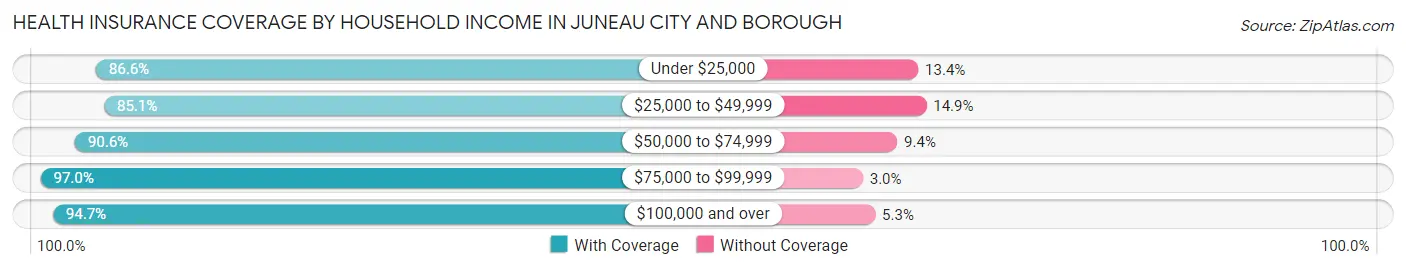
| Household Income | With Coverage | Without Coverage |
| Under $25,000 | 1,640 (86.6%) | 253 (13.4%) |
| $25,000 to $49,999 | 2,069 (85.1%) | 362 (14.9%) |
| $50,000 to $74,999 | 4,292 (90.6%) | 447 (9.4%) |
| $75,000 to $99,999 | 4,252 (97.0%) | 131 (3.0%) |
| $100,000 and over | 16,732 (94.7%) | 938 (5.3%) |
Public vs Private Health Insurance Coverage by Age in Juneau city and borough
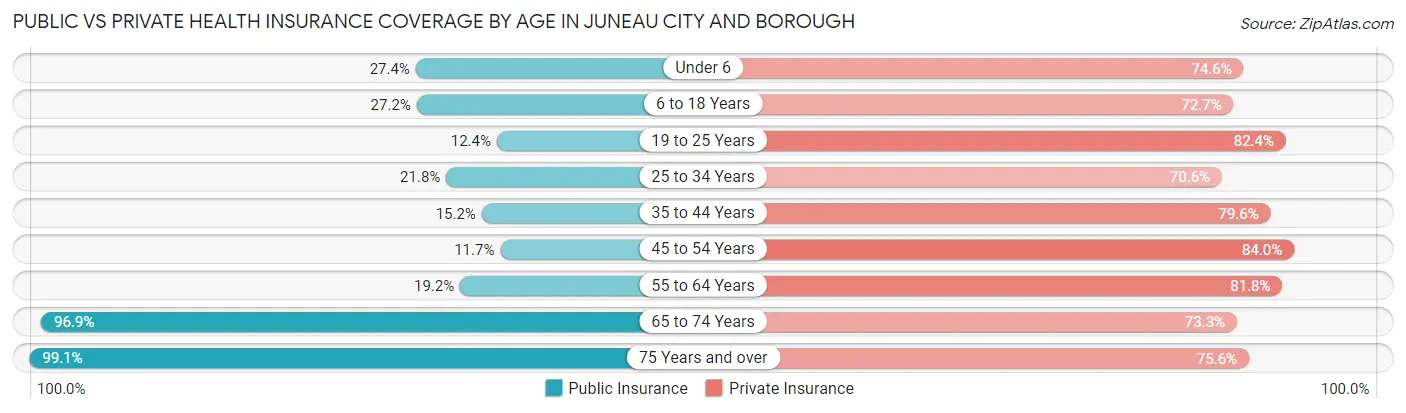
| Age Bracket | Public Insurance | Private Insurance |
| Under 6 | 569 (27.4%) | 1,548 (74.6%) |
| 6 to 18 Years | 1,329 (27.2%) | 3,549 (72.7%) |
| 19 to 25 Years | 339 (12.3%) | 2,262 (82.4%) |
| 25 to 34 Years | 873 (21.7%) | 2,831 (70.6%) |
| 35 to 44 Years | 671 (15.2%) | 3,521 (79.6%) |
| 45 to 54 Years | 478 (11.7%) | 3,425 (84.0%) |
| 55 to 64 Years | 857 (19.2%) | 3,656 (81.8%) |
| 65 to 74 Years | 3,235 (96.9%) | 2,447 (73.3%) |
| 75 Years and over | 1,330 (99.1%) | 1,014 (75.6%) |
| Total | 9,681 (30.9%) | 24,253 (77.3%) |
Disability Status by Sex by Age in Juneau city and borough
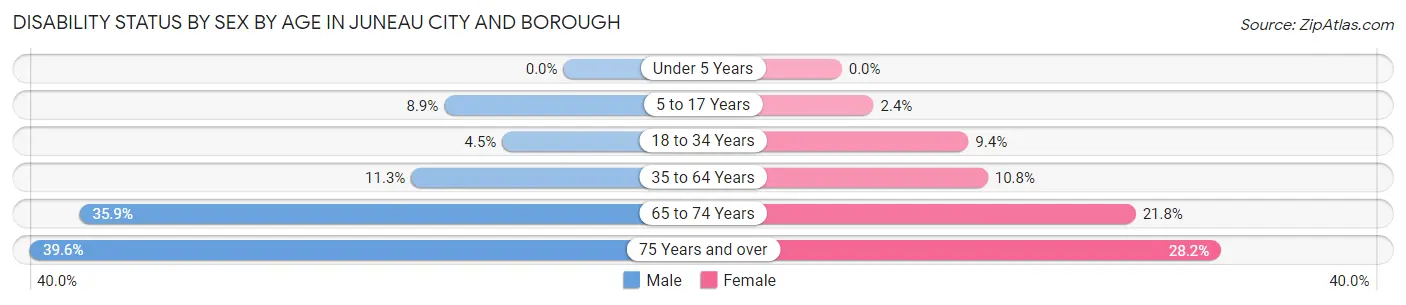
| Age Bracket | Male | Female |
| Under 5 Years | 0 (0.0%) | 0 (0.0%) |
| 5 to 17 Years | 228 (8.9%) | 55 (2.4%) |
| 18 to 34 Years | 164 (4.5%) | 331 (9.4%) |
| 35 to 64 Years | 748 (11.3%) | 689 (10.8%) |
| 65 to 74 Years | 611 (35.9%) | 357 (21.8%) |
| 75 Years and over | 215 (39.6%) | 225 (28.2%) |
Disability Class by Sex by Age in Juneau city and borough
Disability Class: Hearing Difficulty
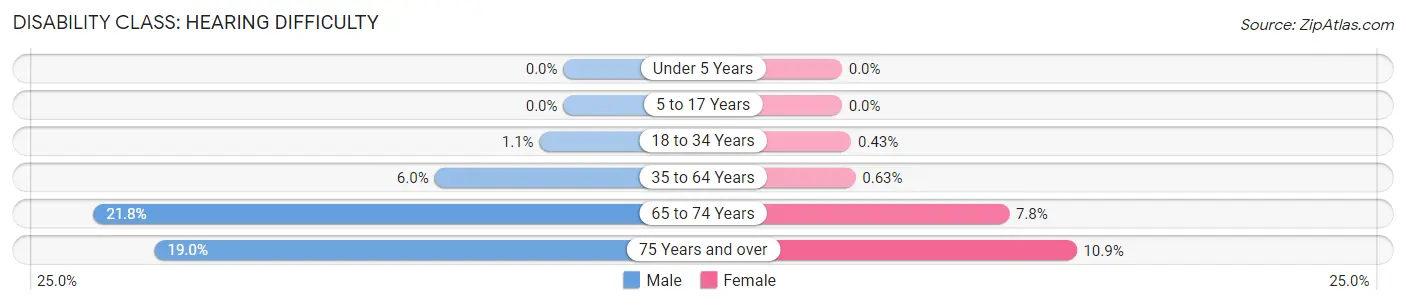
| Age Bracket | Male | Female |
| Under 5 Years | 0 (0.0%) | 0 (0.0%) |
| 5 to 17 Years | 0 (0.0%) | 0 (0.0%) |
| 18 to 34 Years | 40 (1.1%) | 15 (0.4%) |
| 35 to 64 Years | 396 (6.0%) | 40 (0.6%) |
| 65 to 74 Years | 371 (21.8%) | 127 (7.8%) |
| 75 Years and over | 103 (19.0%) | 87 (10.9%) |
Disability Class: Vision Difficulty
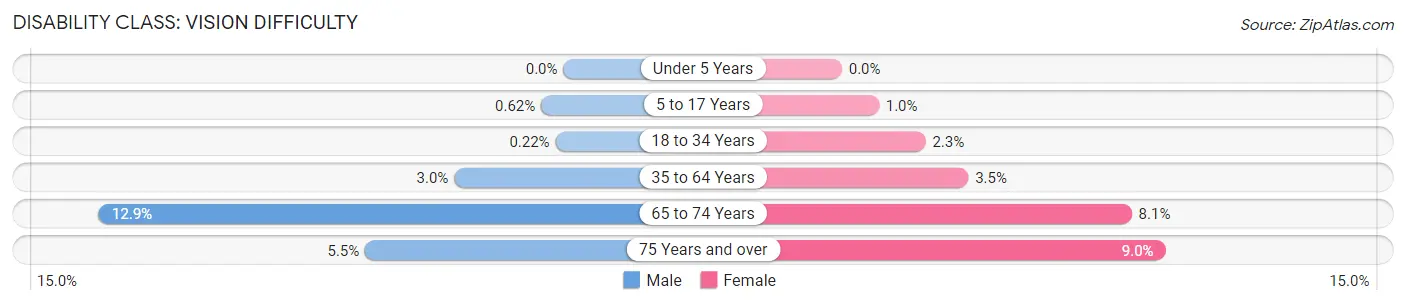
| Age Bracket | Male | Female |
| Under 5 Years | 0 (0.0%) | 0 (0.0%) |
| 5 to 17 Years | 16 (0.6%) | 24 (1.0%) |
| 18 to 34 Years | 8 (0.2%) | 82 (2.3%) |
| 35 to 64 Years | 201 (3.0%) | 224 (3.5%) |
| 65 to 74 Years | 220 (12.9%) | 132 (8.1%) |
| 75 Years and over | 30 (5.5%) | 72 (9.0%) |
Disability Class: Cognitive Difficulty
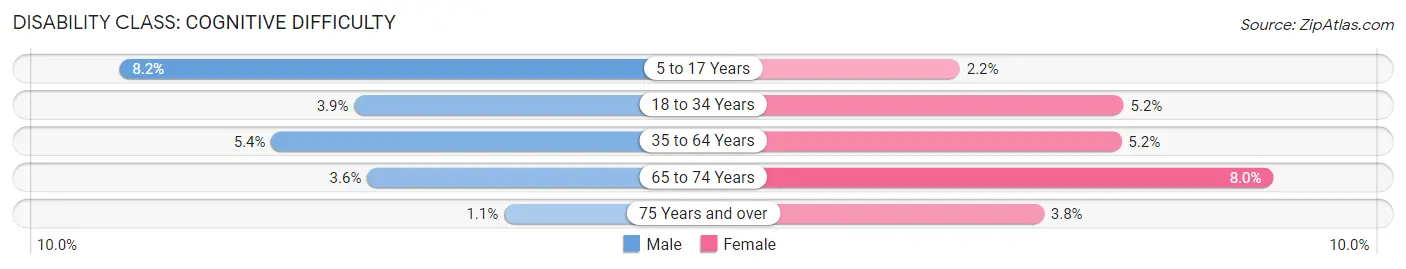
| Age Bracket | Male | Female |
| 5 to 17 Years | 212 (8.2%) | 51 (2.2%) |
| 18 to 34 Years | 140 (3.9%) | 184 (5.2%) |
| 35 to 64 Years | 359 (5.4%) | 330 (5.2%) |
| 65 to 74 Years | 62 (3.6%) | 131 (8.0%) |
| 75 Years and over | 6 (1.1%) | 30 (3.7%) |
Disability Class: Ambulatory Difficulty
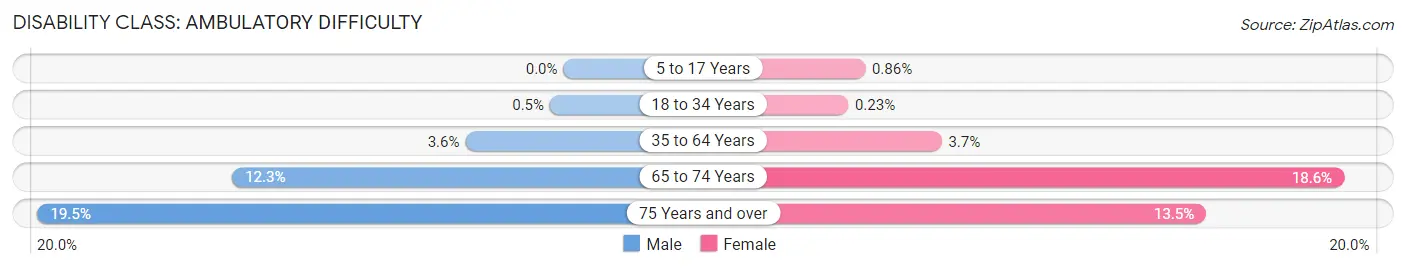
| Age Bracket | Male | Female |
| 5 to 17 Years | 0 (0.0%) | 20 (0.9%) |
| 18 to 34 Years | 18 (0.5%) | 8 (0.2%) |
| 35 to 64 Years | 241 (3.6%) | 235 (3.7%) |
| 65 to 74 Years | 209 (12.3%) | 305 (18.6%) |
| 75 Years and over | 106 (19.5%) | 108 (13.5%) |
Disability Class: Self-Care Difficulty
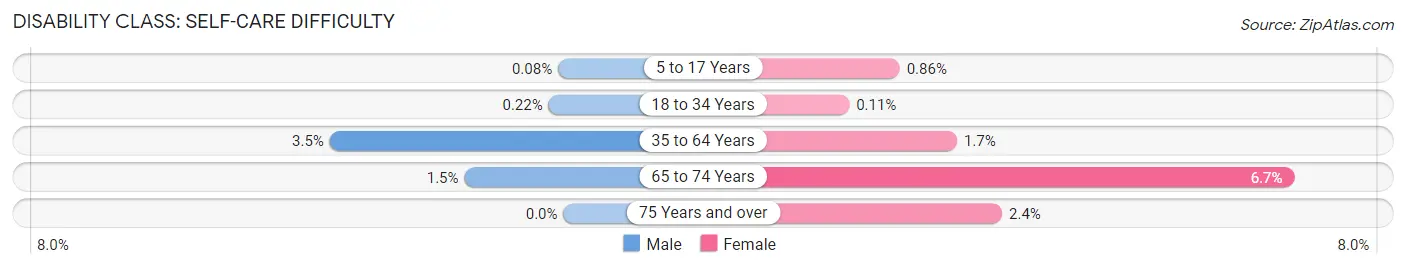
| Age Bracket | Male | Female |
| 5 to 17 Years | 2 (0.1%) | 20 (0.9%) |
| 18 to 34 Years | 8 (0.2%) | 4 (0.1%) |
| 35 to 64 Years | 230 (3.5%) | 109 (1.7%) |
| 65 to 74 Years | 25 (1.5%) | 110 (6.7%) |
| 75 Years and over | 0 (0.0%) | 19 (2.4%) |
Technology Access in Juneau city and borough
Computing Device Access in Juneau city and borough
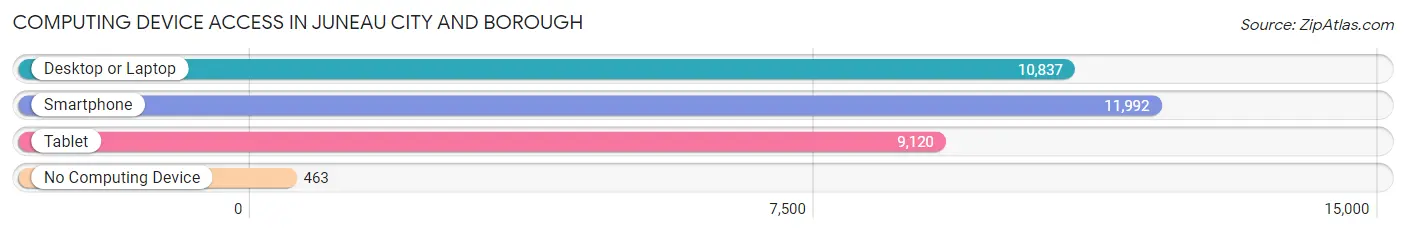
| Device Type | # Households | % Households |
| Desktop or Laptop | 10,837 | 83.3% |
| Smartphone | 11,992 | 92.1% |
| Tablet | 9,120 | 70.1% |
| No Computing Device | 463 | 3.6% |
| Total | 13,017 | 100.0% |
Internet Access in Juneau city and borough
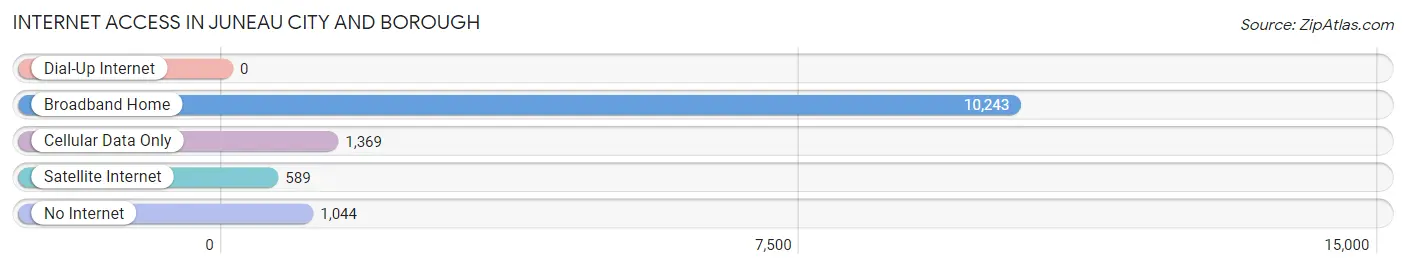
| Internet Type | # Households | % Households |
| Dial-Up Internet | 0 | 0.0% |
| Broadband Home | 10,243 | 78.7% |
| Cellular Data Only | 1,369 | 10.5% |
| Satellite Internet | 589 | 4.5% |
| No Internet | 1,044 | 8.0% |
| Total | 13,017 | 100.0% |
Juneau city and borough Summary
Juneau City and Borough is the capital of Alaska and the second largest city in the state. It is located in the panhandle of Alaska, on the Gastineau Channel, and is surrounded by the Tongass National Forest. The city and borough covers an area of 3,255 square miles, making it the second largest city in the United States by area.
Geography
Juneau City and Borough is located in the panhandle of Alaska, on the Gastineau Channel. It is surrounded by the Tongass National Forest, which is the largest national forest in the United States. The city and borough covers an area of 3,255 square miles, making it the second largest city in the United States by area. The city is located on the mainland, but is accessible only by boat or plane. The city is located in the temperate rainforest climate zone, and has an average annual precipitation of over 100 inches.
The city is divided into two parts, the City of Juneau and the Borough of Juneau. The City of Juneau is located on the mainland, and is the seat of government for the borough. The Borough of Juneau is located on the islands of Admiralty, Chichagof, and Baranof, and includes the communities of Douglas, Haines, Skagway, and Hoonah.
History
Juneau City and Borough was founded in 1880 by Joe Juneau and Richard Harris. The two men discovered gold in the area, and the city quickly grew as prospectors flocked to the area. The city was incorporated in 1900, and was named the capital of Alaska in 1906.
The city experienced a period of rapid growth in the early 20th century, as the gold rush brought thousands of people to the area. The city was also the site of the Alaska-Juneau Gold Mine, which was the largest gold mine in the world at the time. The mine closed in 1944, but the city continued to grow as a center of government and commerce.
Economy
Juneau City and Borough has a diverse economy, with a mix of government, tourism, fishing, and mining. The city is the seat of government for the state of Alaska, and is home to the Alaska State Capitol. The city is also a major tourist destination, with cruise ships and other vessels visiting the city throughout the year.
The city is also home to several fishing fleets, and is a major center for commercial fishing in Alaska. The city is also home to several mining operations, including the Alaska-Juneau Gold Mine, which is now a tourist attraction.
Demographics
As of the 2010 census, the population of Juneau City and Borough was 31,275. The population is predominantly white, with a small Native American population. The median household income is $76,843, and the median home value is $310,000. The city has a high rate of homeownership, with over 70% of residents owning their own homes.
Conclusion
Juneau City and Borough is the capital of Alaska and the second largest city in the state. It is located in the panhandle of Alaska, on the Gastineau Channel, and is surrounded by the Tongass National Forest. The city and borough covers an area of 3,255 square miles, making it the second largest city in the United States by area. The city has a diverse economy, with a mix of government, tourism, fishing, and mining. The population of Juneau City and Borough is predominantly white, with a small Native American population. The median household income is $76,843, and the median home value is $310,000. The city has a high rate of homeownership, with over 70% of residents owning their own homes.
Common Questions
What is Per Capita Income in Juneau city and borough?
Per Capita income in Juneau city and borough is $49,207.
What is the Median Family Income in Juneau city and borough?
Median Family Income in Juneau city and borough is $113,750.
What is the Median Household income in Juneau city and borough?
Median Household Income in Juneau city and borough is $95,711.
What is Income or Wage Gap in Juneau city and borough?
Income or Wage Gap in Juneau city and borough is 17.9%.
Women in Juneau city and borough earn 82.1 cents for every dollar earned by a man.
What is Family Income Deficit in Juneau city and borough?
Family Income Deficit in Juneau city and borough is $9,921.
Families that are below poverty line in Juneau city and borough earn $9,921 less on average than the poverty threshold level.
What is Inequality or Gini Index in Juneau city and borough?
Inequality or Gini Index in Juneau city and borough is 0.40.
What is the Total Population of Juneau city and borough?
Total Population of Juneau city and borough is 32,108.
What is the Total Male Population of Juneau city and borough?
Total Male Population of Juneau city and borough is 16,461.
What is the Total Female Population of Juneau city and borough?
Total Female Population of Juneau city and borough is 15,647.
What is the Ratio of Males per 100 Females in Juneau city and borough?
There are 105.20 Males per 100 Females in Juneau city and borough.
What is the Ratio of Females per 100 Males in Juneau city and borough?
There are 95.05 Females per 100 Males in Juneau city and borough.
What is the Median Population Age in Juneau city and borough?
Median Population Age in Juneau city and borough is 39.0 Years.
What is the Average Family Size in Juneau city and borough
Average Family Size in Juneau city and borough is 3.1 People.
What is the Average Household Size in Juneau city and borough
Average Household Size in Juneau city and borough is 2.4 People.
How Large is the Labor Force in Juneau city and borough?
There are 17,486 People in the Labor Forcein in Juneau city and borough.
What is the Percentage of People in the Labor Force in Juneau city and borough?
66.6% of People are in the Labor Force in Juneau city and borough.
What is the Unemployment Rate in Juneau city and borough?
Unemployment Rate in Juneau city and borough is 4.5%.