Lahaina, HI Map & Demographics
Lahaina Map
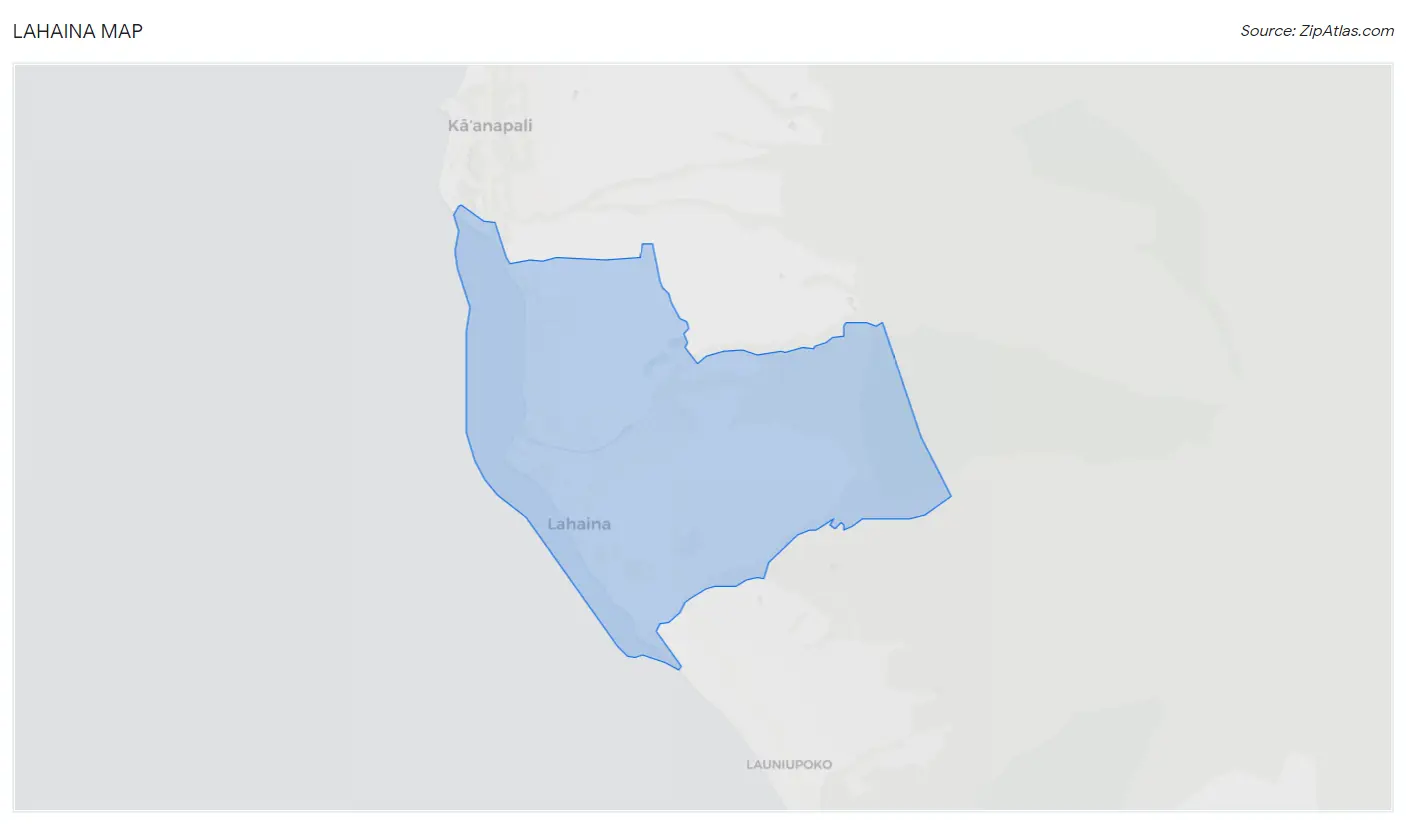
Lahaina Overview
$34,615
PER CAPITA INCOME
$86,000
AVG FAMILY INCOME
$83,443
AVG HOUSEHOLD INCOME
17.3%
WAGE / INCOME GAP [ % ]
82.7¢/ $1
WAGE / INCOME GAP [ $ ]
0.42
INEQUALITY / GINI INDEX
12,906
TOTAL POPULATION
6,550
MALE POPULATION
6,356
FEMALE POPULATION
103.05
MALES / 100 FEMALES
97.04
FEMALES / 100 MALES
38.7
MEDIAN AGE
3.8
AVG FAMILY SIZE
3.5
AVG HOUSEHOLD SIZE
7,581
LABOR FORCE [ PEOPLE ]
73.2%
PERCENT IN LABOR FORCE
5.7%
UNEMPLOYMENT RATE
Lahaina Zip Codes
Lahaina Area Codes
Income in Lahaina
Income Overview in Lahaina
Per Capita Income in Lahaina is $34,615, while median incomes of families and households are $86,000 and $83,443 respectively.
| Characteristic | Number | Measure |
| Per Capita Income | 12,906 | $34,615 |
| Median Family Income | 2,546 | $86,000 |
| Mean Family Income | 2,546 | $115,014 |
| Median Household Income | 3,562 | $83,443 |
| Mean Household Income | 3,562 | $115,708 |
| Income Deficit | 2,546 | $0 |
| Wage / Income Gap (%) | 12,906 | 17.27% |
| Wage / Income Gap ($) | 12,906 | 82.73¢ per $1 |
| Gini / Inequality Index | 12,906 | 0.42 |
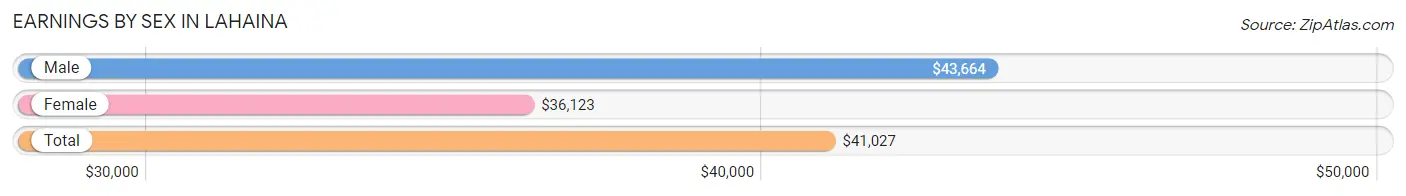
Earnings by Sex in Lahaina
Average Earnings in Lahaina are $41,027, $43,664 for men and $36,123 for women, a difference of 17.3%.
| Sex | Number | Average Earnings |
| Male | 4,094 (53.4%) | $43,664 |
| Female | 3,579 (46.6%) | $36,123 |
| Total | 7,673 (100.0%) | $41,027 |
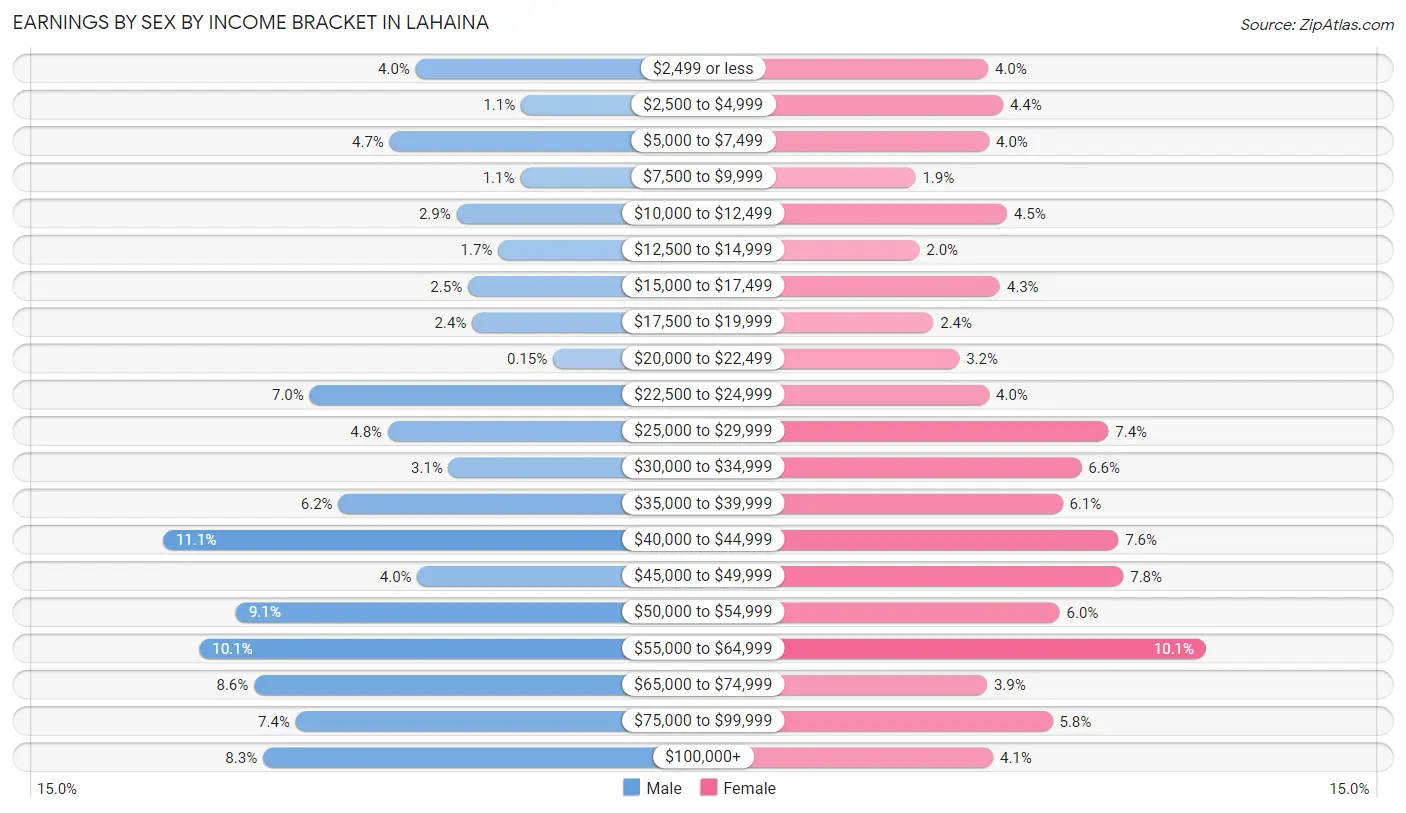
Earnings by Sex by Income Bracket in Lahaina
The most common earnings brackets in Lahaina are $40,000 to $44,999 for men (455 | 11.1%) and $55,000 to $64,999 for women (361 | 10.1%).
| Income | Male | Female |
| $2,499 or less | 164 (4.0%) | 142 (4.0%) |
| $2,500 to $4,999 | 43 (1.1%) | 157 (4.4%) |
| $5,000 to $7,499 | 194 (4.7%) | 143 (4.0%) |
| $7,500 to $9,999 | 44 (1.1%) | 69 (1.9%) |
| $10,000 to $12,499 | 117 (2.9%) | 161 (4.5%) |
| $12,500 to $14,999 | 69 (1.7%) | 73 (2.0%) |
| $15,000 to $17,499 | 104 (2.5%) | 154 (4.3%) |
| $17,500 to $19,999 | 99 (2.4%) | 87 (2.4%) |
| $20,000 to $22,499 | 6 (0.2%) | 113 (3.2%) |
| $22,500 to $24,999 | 286 (7.0%) | 143 (4.0%) |
| $25,000 to $29,999 | 196 (4.8%) | 263 (7.3%) |
| $30,000 to $34,999 | 126 (3.1%) | 236 (6.6%) |
| $35,000 to $39,999 | 253 (6.2%) | 217 (6.1%) |
| $40,000 to $44,999 | 455 (11.1%) | 273 (7.6%) |
| $45,000 to $49,999 | 162 (4.0%) | 278 (7.8%) |
| $50,000 to $54,999 | 371 (9.1%) | 214 (6.0%) |
| $55,000 to $64,999 | 413 (10.1%) | 361 (10.1%) |
| $65,000 to $74,999 | 350 (8.6%) | 141 (3.9%) |
| $75,000 to $99,999 | 302 (7.4%) | 207 (5.8%) |
| $100,000+ | 340 (8.3%) | 147 (4.1%) |
| Total | 4,094 (100.0%) | 3,579 (100.0%) |
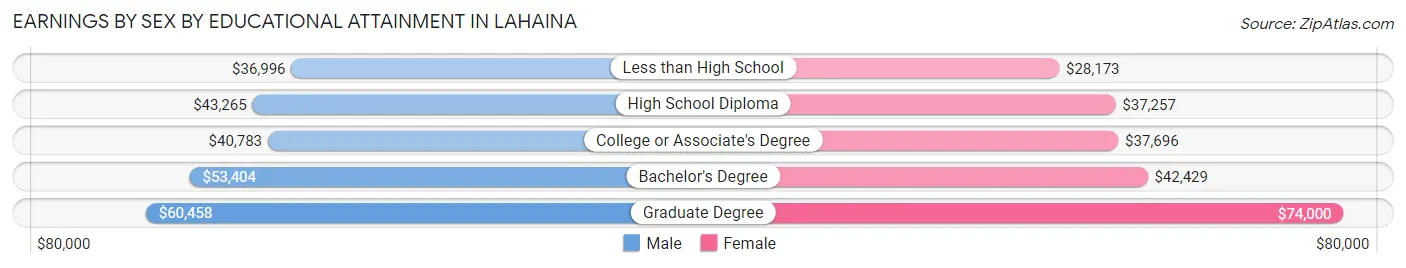
Earnings by Sex by Educational Attainment in Lahaina
Average earnings in Lahaina are $45,011 for men and $39,885 for women, a difference of 11.4%. Men with an educational attainment of graduate degree enjoy the highest average annual earnings of $60,458, while those with less than high school education earn the least with $36,996. Women with an educational attainment of graduate degree earn the most with the average annual earnings of $74,000, while those with less than high school education have the smallest earnings of $28,173.
| Educational Attainment | Male Income | Female Income |
| Less than High School | $36,996 | $28,173 |
| High School Diploma | $43,265 | $37,257 |
| College or Associate's Degree | $40,783 | $37,696 |
| Bachelor's Degree | $53,404 | $42,429 |
| Graduate Degree | $60,458 | $74,000 |
| Total | $45,011 | $39,885 |
Family Income in Lahaina
Family Income Brackets in Lahaina
According to the Lahaina family income data, there are 486 families falling into the $50,000 to $74,999 income range, which is the most common income bracket and makes up 19.1% of all families. Conversely, the $10,000 to $14,999 income bracket is the least frequent group with only 13 families (0.5%) belonging to this category.
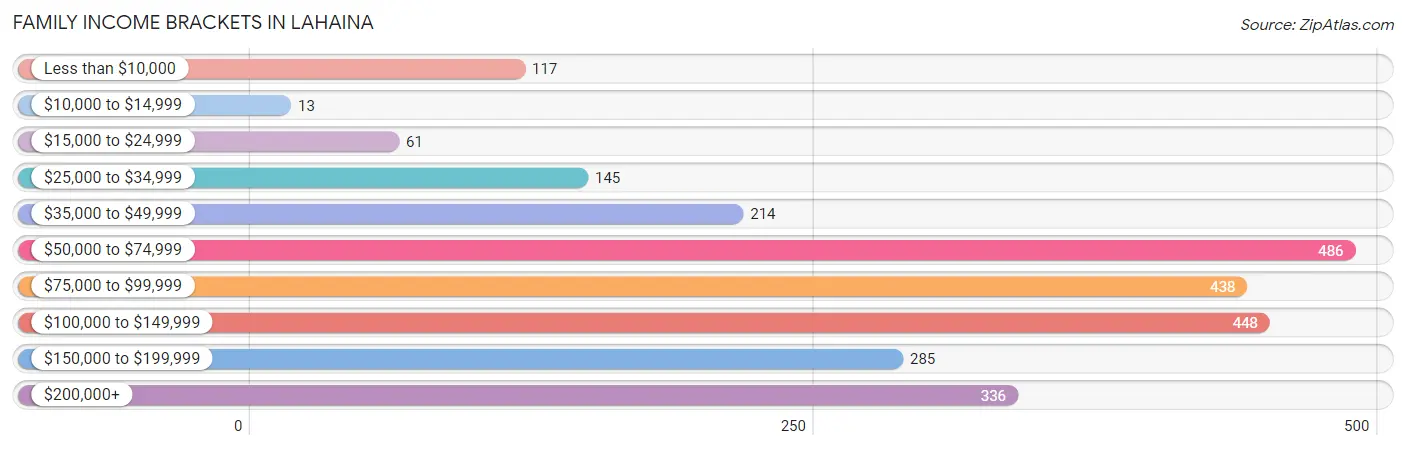
| Income Bracket | # Families | % Families |
| Less than $10,000 | 117 | 4.6% |
| $10,000 to $14,999 | 13 | 0.5% |
| $15,000 to $24,999 | 61 | 2.4% |
| $25,000 to $34,999 | 145 | 5.7% |
| $35,000 to $49,999 | 214 | 8.4% |
| $50,000 to $74,999 | 486 | 19.1% |
| $75,000 to $99,999 | 438 | 17.2% |
| $100,000 to $149,999 | 448 | 17.6% |
| $150,000 to $199,999 | 285 | 11.2% |
| $200,000+ | 336 | 13.2% |
Family Income by Famaliy Size in Lahaina
7+ person families (174 | 6.8%) account for the highest median family income in Lahaina with $250,001 per family, while 2-person families (1,051 | 41.3%) have the highest median income of $38,422 per family member.
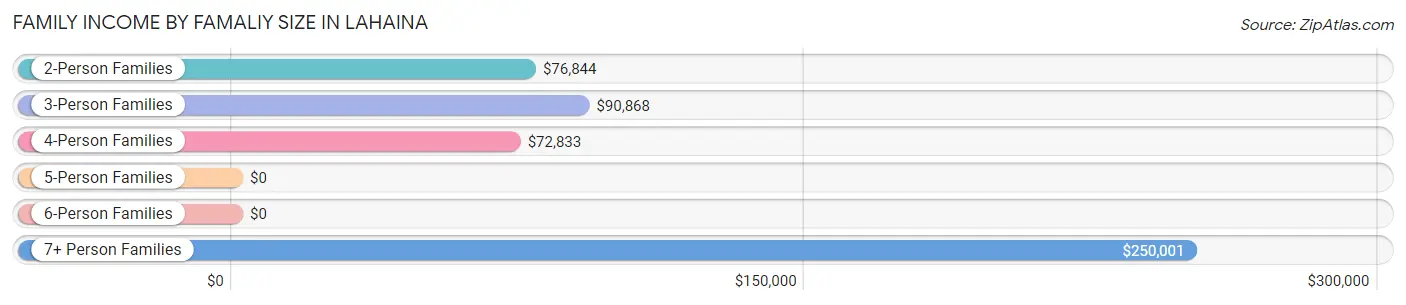
| Income Bracket | # Families | Median Income |
| 2-Person Families | 1,051 (41.3%) | $76,844 |
| 3-Person Families | 571 (22.4%) | $90,868 |
| 4-Person Families | 446 (17.5%) | $72,833 |
| 5-Person Families | 241 (9.5%) | $0 |
| 6-Person Families | 63 (2.5%) | $0 |
| 7+ Person Families | 174 (6.8%) | $250,001 |
| Total | 2,546 (100.0%) | $86,000 |
Family Income by Number of Earners in Lahaina
The median family income in Lahaina is $86,000, with families comprising 3+ earners (456) having the highest median family income of $177,931, while families with no earners (199) have the lowest median family income of $35,439, accounting for 17.9% and 7.8% of families, respectively.
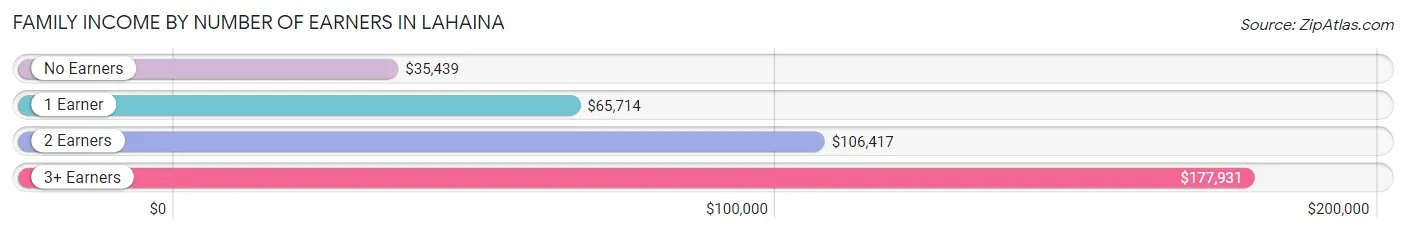
| Number of Earners | # Families | Median Income |
| No Earners | 199 (7.8%) | $35,439 |
| 1 Earner | 936 (36.8%) | $65,714 |
| 2 Earners | 955 (37.5%) | $106,417 |
| 3+ Earners | 456 (17.9%) | $177,931 |
| Total | 2,546 (100.0%) | $86,000 |
Household Income in Lahaina
Household Income Brackets in Lahaina
With 752 households falling in the category, the $50,000 to $74,999 income range is the most frequent in Lahaina, accounting for 21.1% of all households. In contrast, only 18 households (0.5%) fall into the $10,000 to $14,999 income bracket, making it the least populous group.
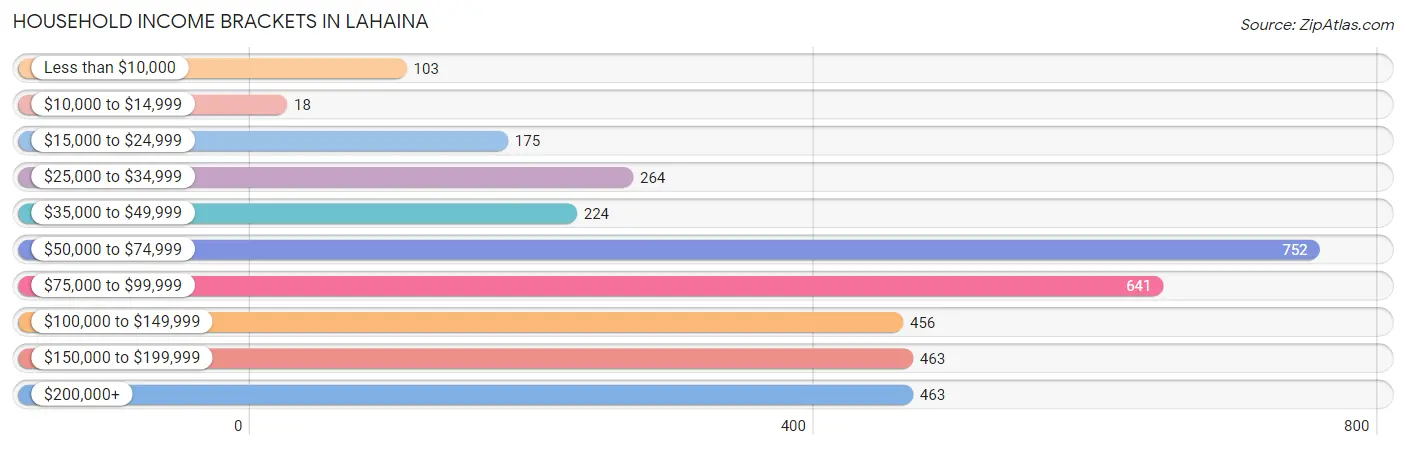
| Income Bracket | # Households | % Households |
| Less than $10,000 | 103 | 2.9% |
| $10,000 to $14,999 | 18 | 0.5% |
| $15,000 to $24,999 | 175 | 4.9% |
| $25,000 to $34,999 | 264 | 7.4% |
| $35,000 to $49,999 | 224 | 6.3% |
| $50,000 to $74,999 | 752 | 21.1% |
| $75,000 to $99,999 | 641 | 18.0% |
| $100,000 to $149,999 | 456 | 12.8% |
| $150,000 to $199,999 | 463 | 13.0% |
| $200,000+ | 463 | 13.0% |
Household Income by Householder Age in Lahaina
The median household income in Lahaina is $83,443, with the highest median household income of $101,964 found in the 45 to 64 years age bracket for the primary householder. A total of 1,357 households (38.1%) fall into this category. Meanwhile, the 15 to 24 years age bracket for the primary householder has the lowest median household income of $46,000, with 74 households (2.1%) in this group.
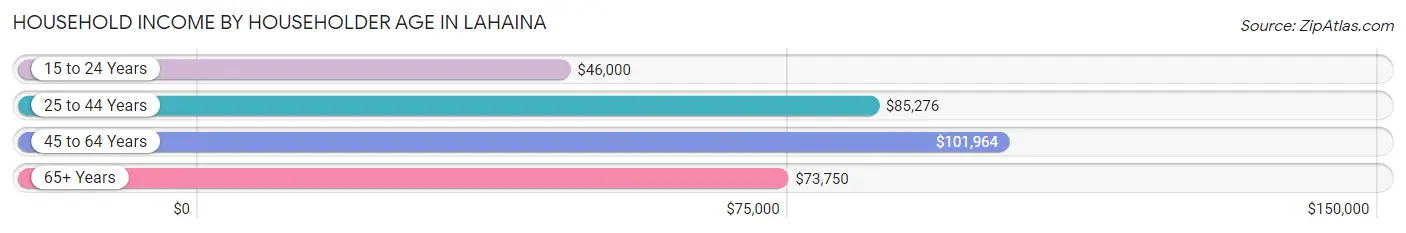
| Income Bracket | # Households | Median Income |
| 15 to 24 Years | 74 (2.1%) | $46,000 |
| 25 to 44 Years | 1,049 (29.4%) | $85,276 |
| 45 to 64 Years | 1,357 (38.1%) | $101,964 |
| 65+ Years | 1,082 (30.4%) | $73,750 |
| Total | 3,562 (100.0%) | $83,443 |
Poverty in Lahaina
Income Below Poverty by Sex and Age in Lahaina
With 11.2% poverty level for males and 12.3% for females among the residents of Lahaina, 15 year old males and 16 and 17 year old females are the most vulnerable to poverty, with 13 males (43.3%) and 79 females (52.0%) in their respective age groups living below the poverty level.
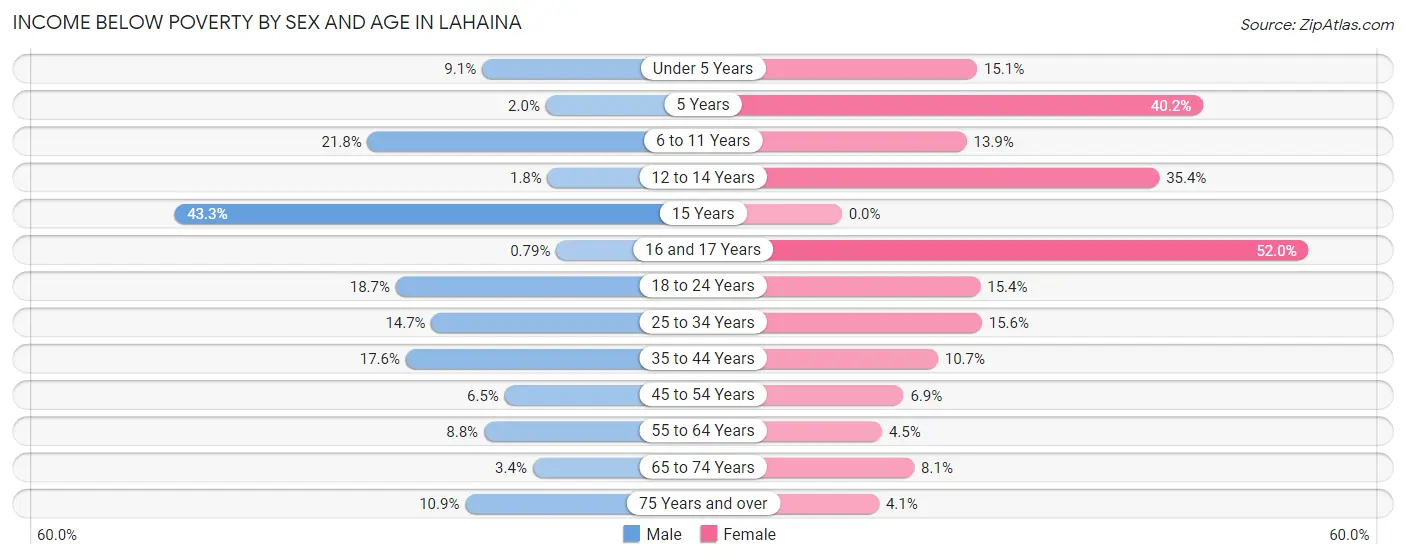
| Age Bracket | Male | Female |
| Under 5 Years | 47 (9.1%) | 67 (15.1%) |
| 5 Years | 2 (2.0%) | 33 (40.2%) |
| 6 to 11 Years | 94 (21.8%) | 50 (13.9%) |
| 12 to 14 Years | 4 (1.8%) | 76 (35.3%) |
| 15 Years | 13 (43.3%) | 0 (0.0%) |
| 16 and 17 Years | 2 (0.8%) | 79 (52.0%) |
| 18 to 24 Years | 67 (18.7%) | 64 (15.4%) |
| 25 to 34 Years | 145 (14.7%) | 140 (15.6%) |
| 35 to 44 Years | 169 (17.5%) | 105 (10.7%) |
| 45 to 54 Years | 48 (6.5%) | 50 (6.9%) |
| 55 to 64 Years | 87 (8.8%) | 33 (4.5%) |
| 65 to 74 Years | 23 (3.4%) | 59 (8.1%) |
| 75 Years and over | 27 (10.9%) | 21 (4.1%) |
| Total | 728 (11.2%) | 777 (12.3%) |
Income Above Poverty by Sex and Age in Lahaina
According to the poverty statistics in Lahaina, males aged 16 and 17 years and females aged 15 years are the age groups that are most secure financially, with 99.2% of males and 100.0% of females in these age groups living above the poverty line.
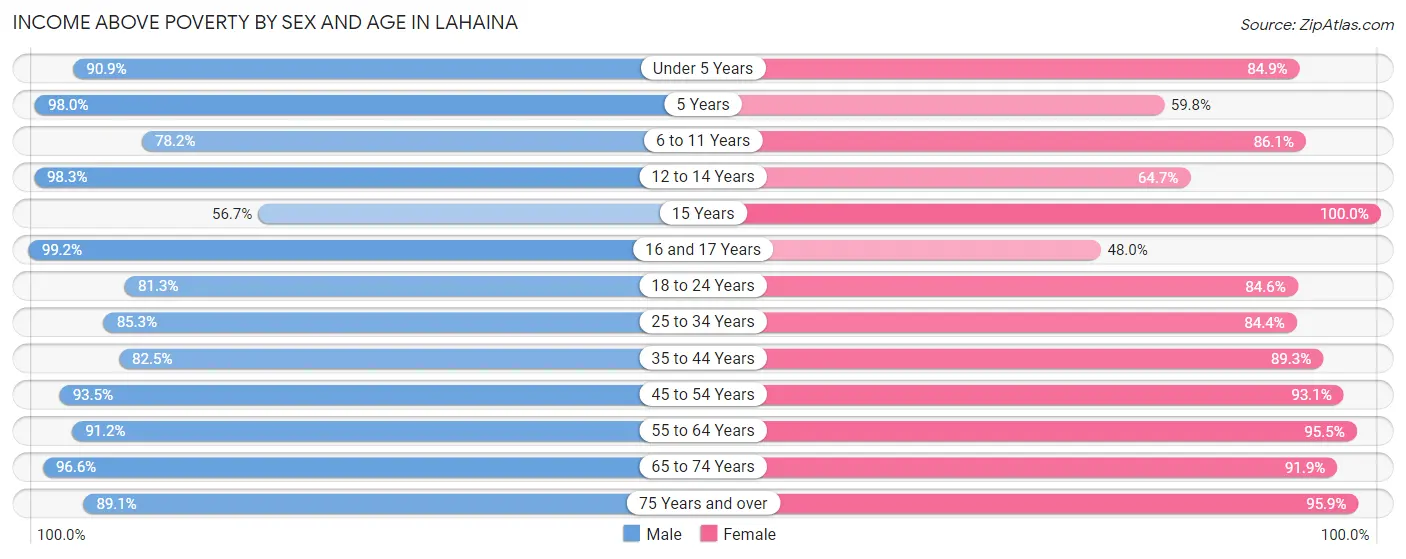
| Age Bracket | Male | Female |
| Under 5 Years | 472 (90.9%) | 378 (84.9%) |
| 5 Years | 100 (98.0%) | 49 (59.8%) |
| 6 to 11 Years | 337 (78.2%) | 310 (86.1%) |
| 12 to 14 Years | 224 (98.3%) | 139 (64.6%) |
| 15 Years | 17 (56.7%) | 62 (100.0%) |
| 16 and 17 Years | 252 (99.2%) | 73 (48.0%) |
| 18 to 24 Years | 292 (81.3%) | 351 (84.6%) |
| 25 to 34 Years | 842 (85.3%) | 758 (84.4%) |
| 35 to 44 Years | 794 (82.5%) | 877 (89.3%) |
| 45 to 54 Years | 687 (93.5%) | 678 (93.1%) |
| 55 to 64 Years | 897 (91.2%) | 705 (95.5%) |
| 65 to 74 Years | 652 (96.6%) | 673 (91.9%) |
| 75 Years and over | 220 (89.1%) | 486 (95.9%) |
| Total | 5,786 (88.8%) | 5,539 (87.7%) |
Income Below Poverty Among Married-Couple Families in Lahaina
The poverty statistics for married-couple families in Lahaina show that 7.3% or 133 of the total 1,816 families live below the poverty line. Families with 3 or 4 children have the highest poverty rate of 7.5%, comprising of 15 families. On the other hand, families with 5 or more children have the lowest poverty rate of 4.5%, which includes 1 families.
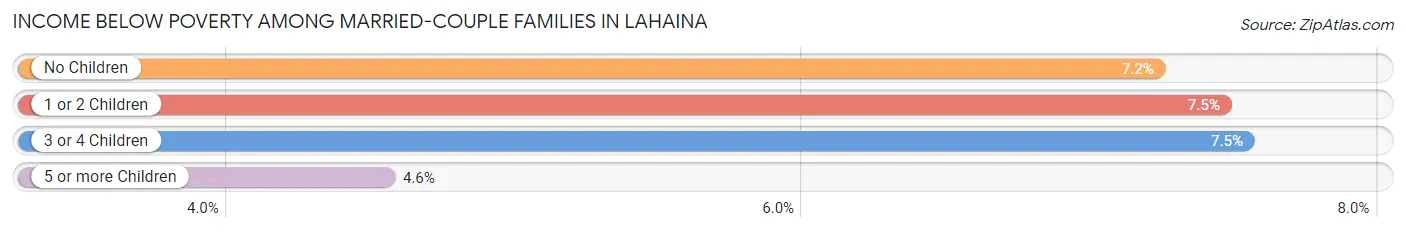
| Children | Above Poverty | Below Poverty |
| No Children | 808 (92.8%) | 63 (7.2%) |
| 1 or 2 Children | 670 (92.5%) | 54 (7.5%) |
| 3 or 4 Children | 184 (92.5%) | 15 (7.5%) |
| 5 or more Children | 21 (95.5%) | 1 (4.5%) |
| Total | 1,683 (92.7%) | 133 (7.3%) |
Income Below Poverty Among Single-Parent Households in Lahaina
According to the poverty data in Lahaina, 17.4% or 45 single-father households and 19.5% or 92 single-mother households are living below the poverty line. Among single-father households, those with 3 or 4 children have the highest poverty rate, with 17 households (94.4%) experiencing poverty. Likewise, among single-mother households, those with 3 or 4 children have the highest poverty rate, with 14 households (60.9%) falling below the poverty line.
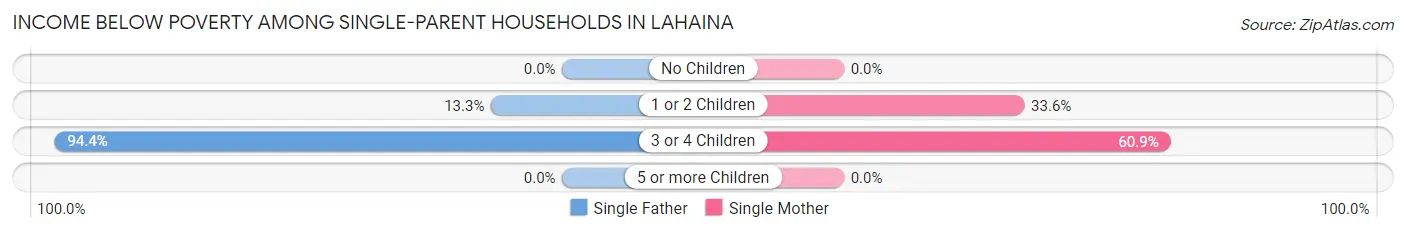
| Children | Single Father | Single Mother |
| No Children | 0 (0.0%) | 0 (0.0%) |
| 1 or 2 Children | 28 (13.3%) | 78 (33.6%) |
| 3 or 4 Children | 17 (94.4%) | 14 (60.9%) |
| 5 or more Children | 0 (0.0%) | 0 (0.0%) |
| Total | 45 (17.4%) | 92 (19.5%) |
Income Below Poverty Among Married-Couple vs Single-Parent Households in Lahaina
The poverty data for Lahaina shows that 133 of the married-couple family households (7.3%) and 137 of the single-parent households (18.8%) are living below the poverty level. Within the married-couple family households, those with 3 or 4 children have the highest poverty rate, with 15 households (7.5%) falling below the poverty line. Among the single-parent households, those with 3 or 4 children have the highest poverty rate, with 31 household (75.6%) living below poverty.
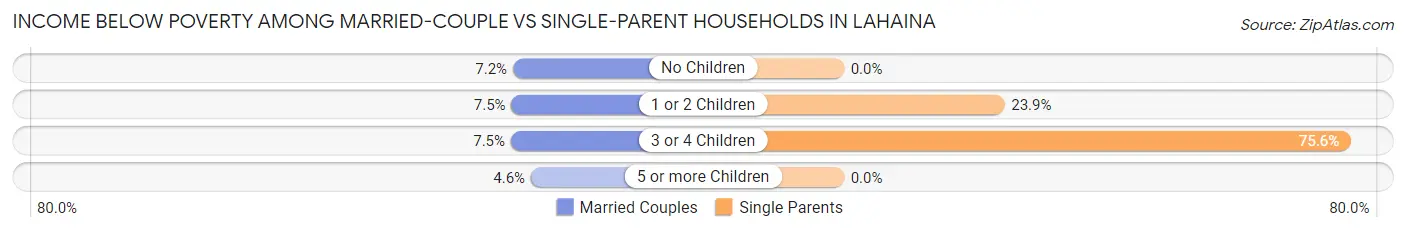
| Children | Married-Couple Families | Single-Parent Households |
| No Children | 63 (7.2%) | 0 (0.0%) |
| 1 or 2 Children | 54 (7.5%) | 106 (23.9%) |
| 3 or 4 Children | 15 (7.5%) | 31 (75.6%) |
| 5 or more Children | 1 (4.5%) | 0 (0.0%) |
| Total | 133 (7.3%) | 137 (18.8%) |
Race in Lahaina
The most populous races in Lahaina are Asian (4,891 | 37.9%), White / Caucasian (3,455 | 26.8%), and Two or more Races (3,138 | 24.3%).
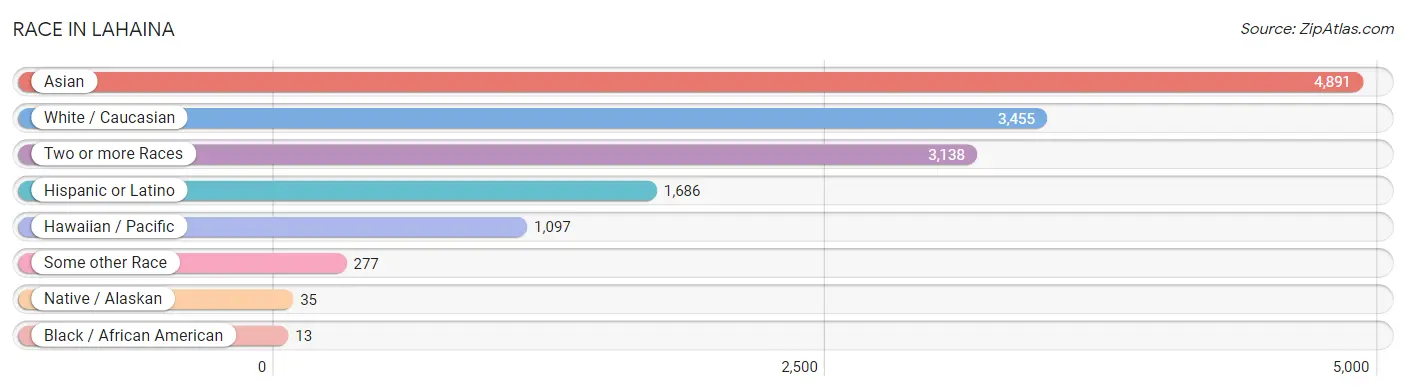
| Race | # Population | % Population |
| Asian | 4,891 | 37.9% |
| Black / African American | 13 | 0.1% |
| Hawaiian / Pacific | 1,097 | 8.5% |
| Hispanic or Latino | 1,686 | 13.1% |
| Native / Alaskan | 35 | 0.3% |
| White / Caucasian | 3,455 | 26.8% |
| Two or more Races | 3,138 | 24.3% |
| Some other Race | 277 | 2.1% |
| Total | 12,906 | 100.0% |
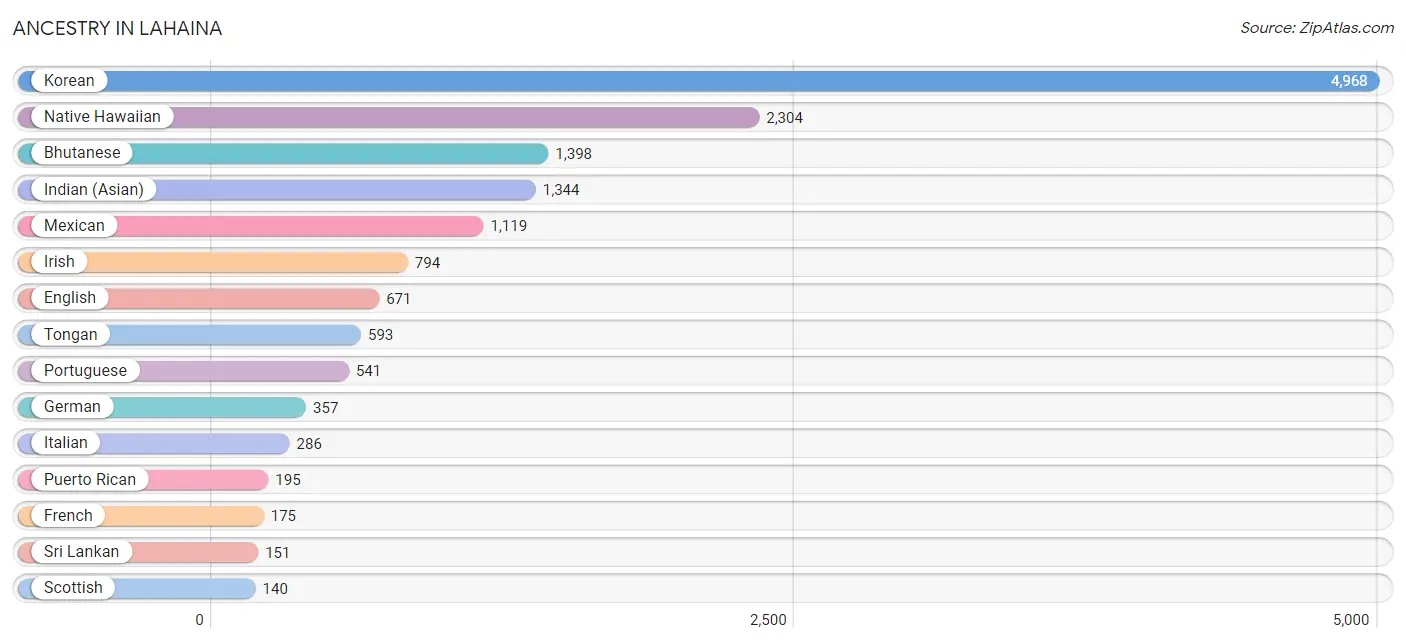
Ancestry in Lahaina
The most populous ancestries reported in Lahaina are Korean (4,968 | 38.5%), Native Hawaiian (2,304 | 17.8%), Bhutanese (1,398 | 10.8%), Indian (Asian) (1,344 | 10.4%), and Mexican (1,119 | 8.7%), together accounting for 86.2% of all Lahaina residents.
| Ancestry | # Population | % Population |
| American | 88 | 0.7% |
| Arab | 22 | 0.2% |
| Argentinean | 20 | 0.2% |
| Austrian | 4 | 0.0% |
| Bhutanese | 1,398 | 10.8% |
| British | 17 | 0.1% |
| Burmese | 55 | 0.4% |
| Central American | 47 | 0.4% |
| Central American Indian | 4 | 0.0% |
| Cherokee | 64 | 0.5% |
| Chickasaw | 2 | 0.0% |
| Chilean | 22 | 0.2% |
| Chinese | 21 | 0.2% |
| Chippewa | 30 | 0.2% |
| Colombian | 33 | 0.3% |
| Cuban | 11 | 0.1% |
| Czech | 24 | 0.2% |
| Danish | 15 | 0.1% |
| Dutch | 75 | 0.6% |
| Eastern European | 48 | 0.4% |
| English | 671 | 5.2% |
| European | 62 | 0.5% |
| Fijian | 34 | 0.3% |
| French | 175 | 1.4% |
| German | 357 | 2.8% |
| Guatemalan | 34 | 0.3% |
| Hungarian | 15 | 0.1% |
| Icelander | 5 | 0.0% |
| Indian (Asian) | 1,344 | 10.4% |
| Irish | 794 | 6.1% |
| Israeli | 7 | 0.1% |
| Italian | 286 | 2.2% |
| Korean | 4,968 | 38.5% |
| Laotian | 14 | 0.1% |
| Lithuanian | 13 | 0.1% |
| Malaysian | 4 | 0.0% |
| Mexican | 1,119 | 8.7% |
| Mexican American Indian | 54 | 0.4% |
| Moroccan | 22 | 0.2% |
| Native Hawaiian | 2,304 | 17.8% |
| Norwegian | 65 | 0.5% |
| Pakistani | 45 | 0.4% |
| Polish | 99 | 0.8% |
| Portuguese | 541 | 4.2% |
| Pueblo | 31 | 0.2% |
| Puerto Rican | 195 | 1.5% |
| Russian | 1 | 0.0% |
| Salvadoran | 13 | 0.1% |
| Samoan | 63 | 0.5% |
| Scandinavian | 5 | 0.0% |
| Scotch-Irish | 36 | 0.3% |
| Scottish | 140 | 1.1% |
| South American | 132 | 1.0% |
| Spaniard | 49 | 0.4% |
| Spanish | 120 | 0.9% |
| Sri Lankan | 151 | 1.2% |
| Swedish | 125 | 1.0% |
| Swiss | 4 | 0.0% |
| Thai | 18 | 0.1% |
| Tohono O'Odham | 6 | 0.1% |
| Tongan | 593 | 4.6% |
| Ukrainian | 1 | 0.0% |
| Uruguayan | 50 | 0.4% |
| Venezuelan | 7 | 0.1% |
| Welsh | 53 | 0.4% | View All 65 Rows |
Immigrants in Lahaina
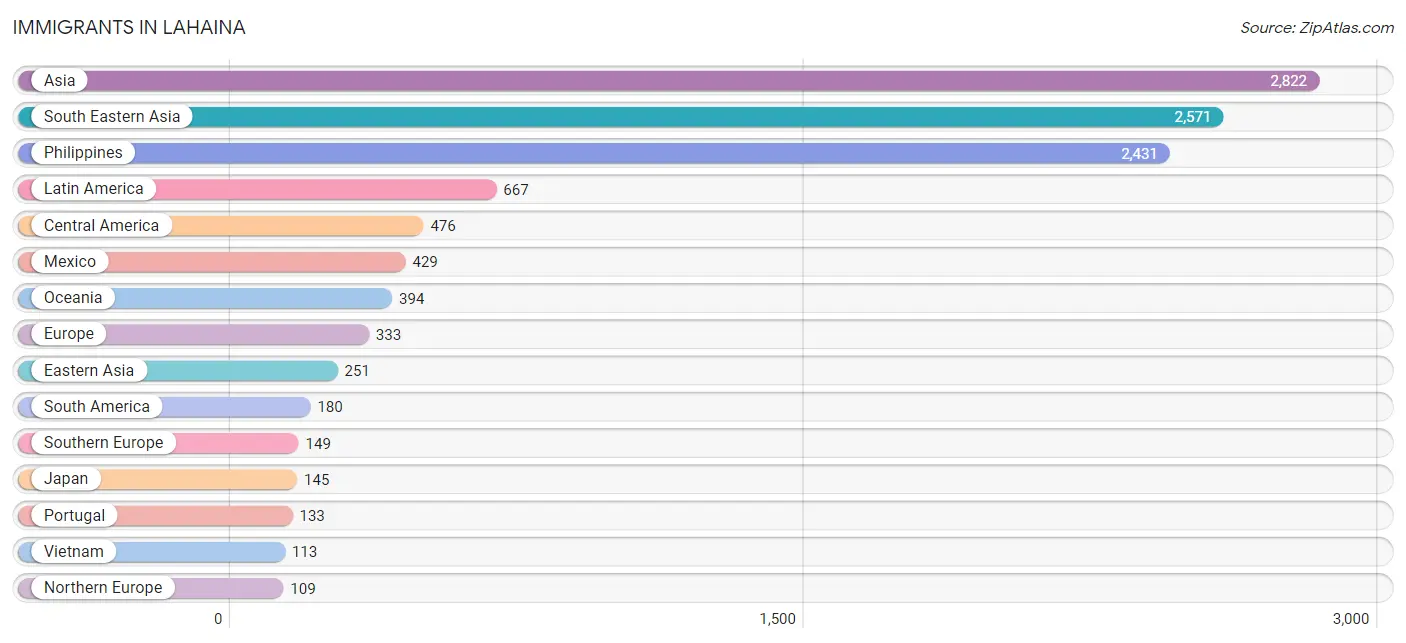
The most numerous immigrant groups reported in Lahaina came from Asia (2,822 | 21.9%), South Eastern Asia (2,571 | 19.9%), Philippines (2,431 | 18.8%), Latin America (667 | 5.2%), and Central America (476 | 3.7%), together accounting for 69.5% of all Lahaina residents.
| Immigration Origin | # Population | % Population |
| Argentina | 20 | 0.2% |
| Asia | 2,822 | 21.9% |
| Brazil | 75 | 0.6% |
| Canada | 35 | 0.3% |
| Caribbean | 11 | 0.1% |
| Central America | 476 | 3.7% |
| China | 68 | 0.5% |
| Colombia | 6 | 0.1% |
| Cuba | 11 | 0.1% |
| Czechoslovakia | 14 | 0.1% |
| Eastern Asia | 251 | 1.9% |
| Eastern Europe | 14 | 0.1% |
| El Salvador | 13 | 0.1% |
| England | 48 | 0.4% |
| Europe | 333 | 2.6% |
| France | 53 | 0.4% |
| Germany | 8 | 0.1% |
| Guatemala | 34 | 0.3% |
| Hong Kong | 65 | 0.5% |
| Indonesia | 9 | 0.1% |
| Ireland | 40 | 0.3% |
| Italy | 16 | 0.1% |
| Japan | 145 | 1.1% |
| Korea | 38 | 0.3% |
| Latin America | 667 | 5.2% |
| Mexico | 429 | 3.3% |
| Micronesia | 51 | 0.4% |
| Northern Europe | 109 | 0.8% |
| Oceania | 394 | 3.0% |
| Philippines | 2,431 | 18.8% |
| Portugal | 133 | 1.0% |
| South America | 180 | 1.4% |
| South Eastern Asia | 2,571 | 19.9% |
| Southern Europe | 149 | 1.1% |
| Taiwan | 3 | 0.0% |
| Thailand | 18 | 0.1% |
| Uruguay | 72 | 0.6% |
| Venezuela | 7 | 0.1% |
| Vietnam | 113 | 0.9% |
| Western Europe | 61 | 0.5% | View All 40 Rows |
Sex and Age in Lahaina
Sex and Age in Lahaina
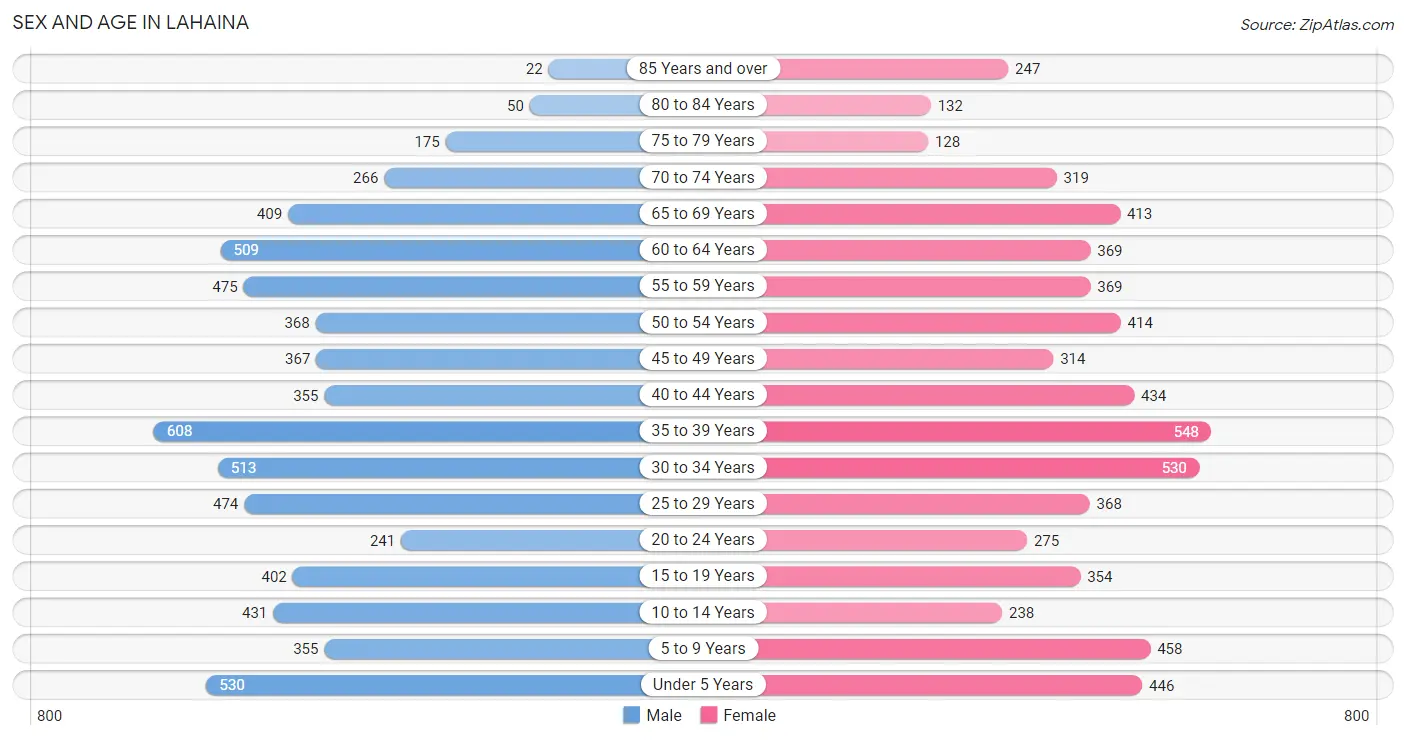
The most populous age groups in Lahaina are 35 to 39 Years (608 | 9.3%) for men and 35 to 39 Years (548 | 8.6%) for women.
| Age Bracket | Male | Female |
| Under 5 Years | 530 (8.1%) | 446 (7.0%) |
| 5 to 9 Years | 355 (5.4%) | 458 (7.2%) |
| 10 to 14 Years | 431 (6.6%) | 238 (3.7%) |
| 15 to 19 Years | 402 (6.1%) | 354 (5.6%) |
| 20 to 24 Years | 241 (3.7%) | 275 (4.3%) |
| 25 to 29 Years | 474 (7.2%) | 368 (5.8%) |
| 30 to 34 Years | 513 (7.8%) | 530 (8.3%) |
| 35 to 39 Years | 608 (9.3%) | 548 (8.6%) |
| 40 to 44 Years | 355 (5.4%) | 434 (6.8%) |
| 45 to 49 Years | 367 (5.6%) | 314 (4.9%) |
| 50 to 54 Years | 368 (5.6%) | 414 (6.5%) |
| 55 to 59 Years | 475 (7.2%) | 369 (5.8%) |
| 60 to 64 Years | 509 (7.8%) | 369 (5.8%) |
| 65 to 69 Years | 409 (6.2%) | 413 (6.5%) |
| 70 to 74 Years | 266 (4.1%) | 319 (5.0%) |
| 75 to 79 Years | 175 (2.7%) | 128 (2.0%) |
| 80 to 84 Years | 50 (0.8%) | 132 (2.1%) |
| 85 Years and over | 22 (0.3%) | 247 (3.9%) |
| Total | 6,550 (100.0%) | 6,356 (100.0%) |
Families and Households in Lahaina
Median Family Size in Lahaina
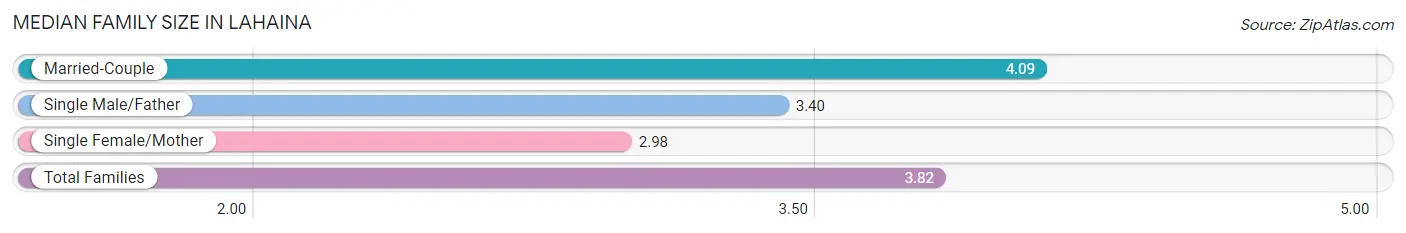
The median family size in Lahaina is 3.82 persons per family, with married-couple families (1,816 | 71.3%) accounting for the largest median family size of 4.09 persons per family. On the other hand, single female/mother families (472 | 18.5%) represent the smallest median family size with 2.98 persons per family.
| Family Type | # Families | Family Size |
| Married-Couple | 1,816 (71.3%) | 4.09 |
| Single Male/Father | 258 (10.1%) | 3.40 |
| Single Female/Mother | 472 (18.5%) | 2.98 |
| Total Families | 2,546 (100.0%) | 3.82 |
Median Household Size in Lahaina
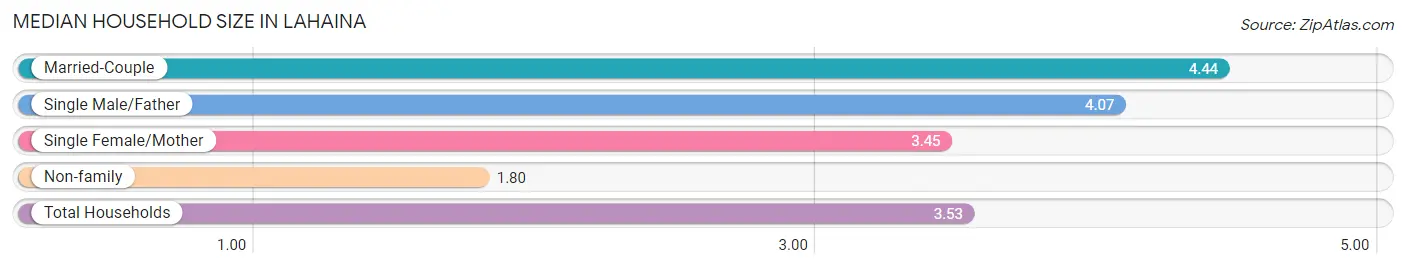
The median household size in Lahaina is 3.53 persons per household, with married-couple households (1,816 | 51.0%) accounting for the largest median household size of 4.44 persons per household. non-family households (1,016 | 28.5%) represent the smallest median household size with 1.80 persons per household.
| Household Type | # Households | Household Size |
| Married-Couple | 1,816 (51.0%) | 4.44 |
| Single Male/Father | 258 (7.2%) | 4.07 |
| Single Female/Mother | 472 (13.3%) | 3.45 |
| Non-family | 1,016 (28.5%) | 1.80 |
| Total Households | 3,562 (100.0%) | 3.53 |
Household Size by Marriage Status in Lahaina
Out of a total of 3,562 households in Lahaina, 2,546 (71.5%) are family households, while 1,016 (28.5%) are nonfamily households. The most numerous type of family households are 2-person households, comprising 841, and the most common type of nonfamily households are 1-person households, comprising 498.
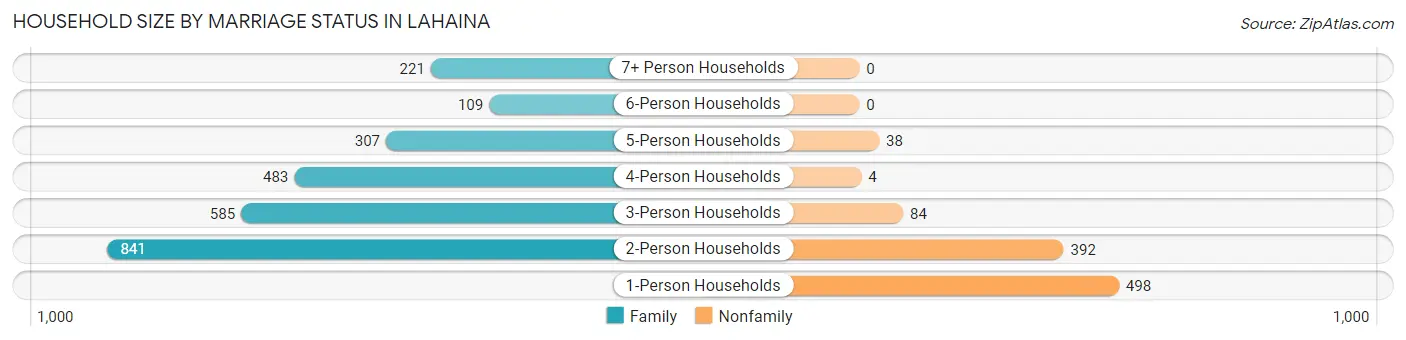
| Household Size | Family Households | Nonfamily Households |
| 1-Person Households | - | 498 (14.0%) |
| 2-Person Households | 841 (23.6%) | 392 (11.0%) |
| 3-Person Households | 585 (16.4%) | 84 (2.4%) |
| 4-Person Households | 483 (13.6%) | 4 (0.1%) |
| 5-Person Households | 307 (8.6%) | 38 (1.1%) |
| 6-Person Households | 109 (3.1%) | 0 (0.0%) |
| 7+ Person Households | 221 (6.2%) | 0 (0.0%) |
| Total | 2,546 (71.5%) | 1,016 (28.5%) |
Female Fertility in Lahaina
Fertility by Age in Lahaina
Average fertility rate in Lahaina is 108.0 births per 1,000 women. Women in the age bracket of 20 to 34 years have the highest fertility rate with 212.0 births per 1,000 women. Women in the age bracket of 20 to 34 years acount for 80.1% of all women with births.
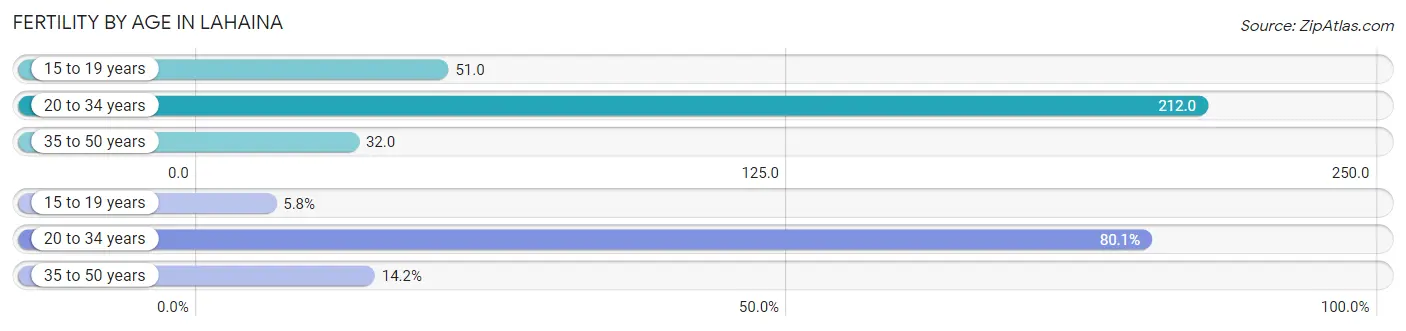
| Age Bracket | Women with Births | Births / 1,000 Women |
| 15 to 19 years | 18 (5.8%) | 51.0 |
| 20 to 34 years | 249 (80.1%) | 212.0 |
| 35 to 50 years | 44 (14.1%) | 32.0 |
| Total | 311 (100.0%) | 108.0 |
Fertility by Age by Marriage Status in Lahaina
81.7% of women with births (311) in Lahaina are married. The highest percentage of unmarried women with births falls into 15 to 19 years age bracket with 100.0% of them unmarried at the time of birth, while the lowest percentage of unmarried women with births belong to 20 to 34 years age bracket with 12.5% of them unmarried.
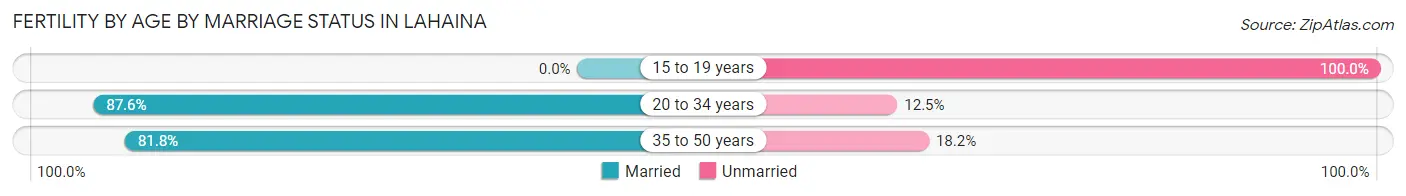
| Age Bracket | Married | Unmarried |
| 15 to 19 years | 0 (0.0%) | 18 (100.0%) |
| 20 to 34 years | 218 (87.5%) | 31 (12.4%) |
| 35 to 50 years | 36 (81.8%) | 8 (18.2%) |
| Total | 254 (81.7%) | 57 (18.3%) |
Fertility by Education in Lahaina
Average fertility rate in Lahaina is 108.0 births per 1,000 women. Women with the education attainment of graduate degree have the highest fertility rate of 398.0 births per 1,000 women, while women with the education attainment of bachelor's degree have the lowest fertility at 39.0 births per 1,000 women. Women with the education attainment of high school diploma represent 31.8% of all women with births.
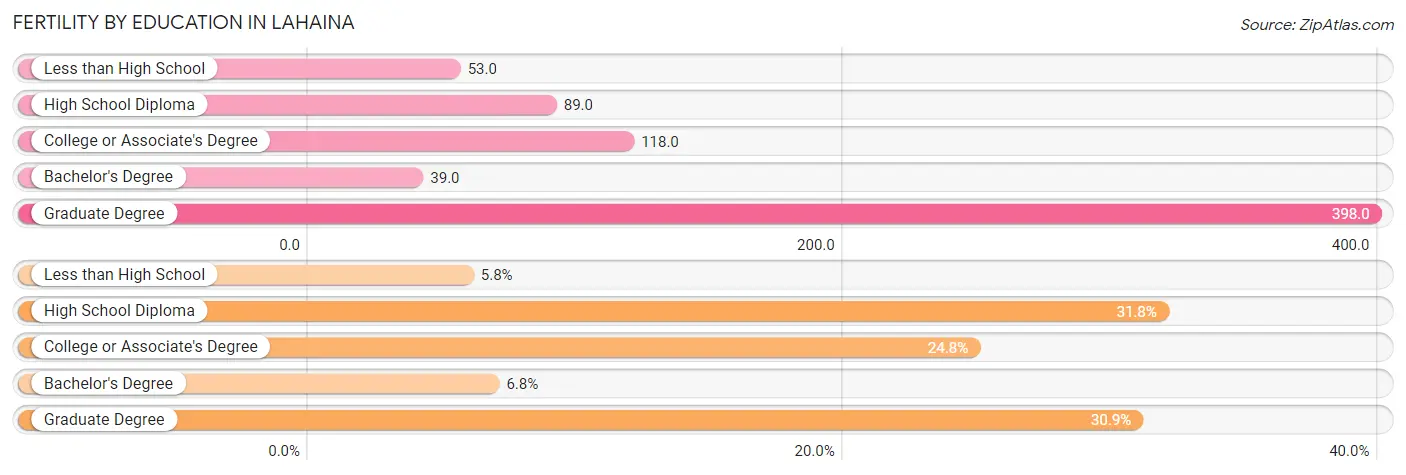
| Educational Attainment | Women with Births | Births / 1,000 Women |
| Less than High School | 18 (5.8%) | 53.0 |
| High School Diploma | 99 (31.8%) | 89.0 |
| College or Associate's Degree | 77 (24.8%) | 118.0 |
| Bachelor's Degree | 21 (6.8%) | 39.0 |
| Graduate Degree | 96 (30.9%) | 398.0 |
| Total | 311 (100.0%) | 108.0 |
Fertility by Education by Marriage Status in Lahaina
18.3% of women with births in Lahaina are unmarried. Women with the educational attainment of bachelor's degree are most likely to be married with 100.0% of them married at childbirth, while women with the educational attainment of less than high school are least likely to be married with 100.0% of them unmarried at childbirth.
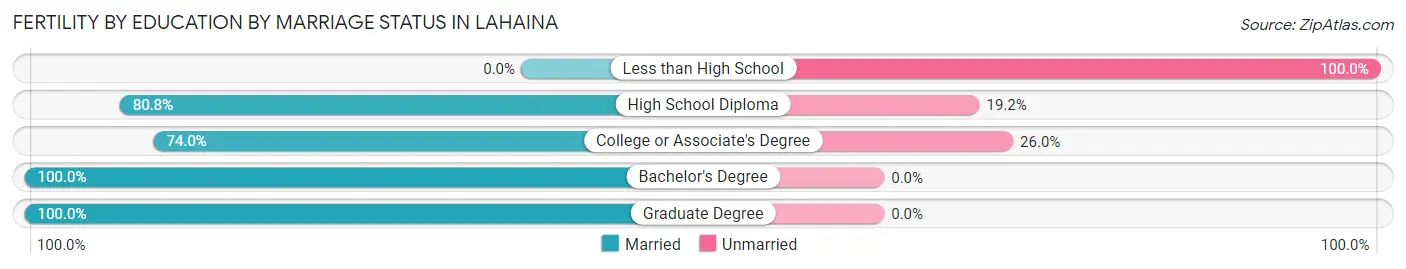
| Educational Attainment | Married | Unmarried |
| Less than High School | 0 (0.0%) | 18 (100.0%) |
| High School Diploma | 80 (80.8%) | 19 (19.2%) |
| College or Associate's Degree | 57 (74.0%) | 20 (26.0%) |
| Bachelor's Degree | 21 (100.0%) | 0 (0.0%) |
| Graduate Degree | 96 (100.0%) | 0 (0.0%) |
| Total | 254 (81.7%) | 57 (18.3%) |
Employment Characteristics in Lahaina
Employment by Class of Employer in Lahaina
Among the 6,819 employed individuals in Lahaina, private company employees (5,305 | 77.8%), self-employed (not incorporated) (336 | 4.9%), and not-for-profit organizations (322 | 4.7%) make up the most common classes of employment.
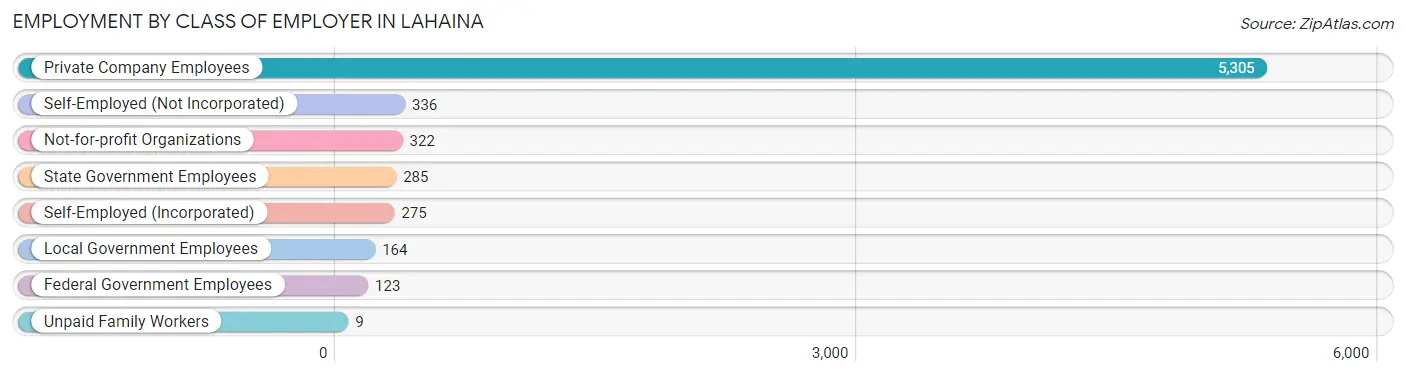
| Employer Class | # Employees | % Employees |
| Private Company Employees | 5,305 | 77.8% |
| Self-Employed (Incorporated) | 275 | 4.0% |
| Self-Employed (Not Incorporated) | 336 | 4.9% |
| Not-for-profit Organizations | 322 | 4.7% |
| Local Government Employees | 164 | 2.4% |
| State Government Employees | 285 | 4.2% |
| Federal Government Employees | 123 | 1.8% |
| Unpaid Family Workers | 9 | 0.1% |
| Total | 6,819 | 100.0% |
Employment Status by Age in Lahaina
According to the labor force statistics for Lahaina, out of the total population over 16 years of age (10,356), 73.2% or 7,581 individuals are in the labor force, with 5.7% or 432 of them unemployed. The age group with the highest labor force participation rate is 25 to 29 years, with 90.4% or 761 individuals in the labor force. Within the labor force, the 16 to 19 years age range has the highest percentage of unemployed individuals, with 17.9% or 42 of them being unemployed.
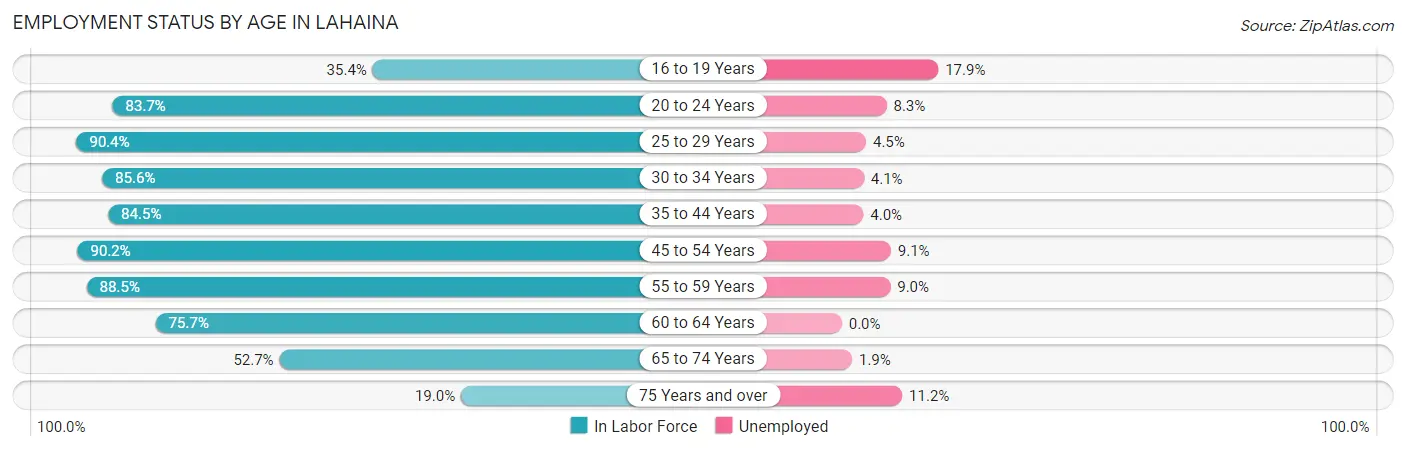
| Age Bracket | In Labor Force | Unemployed |
| 16 to 19 Years | 235 (35.4%) | 42 (17.9%) |
| 20 to 24 Years | 432 (83.7%) | 36 (8.3%) |
| 25 to 29 Years | 761 (90.4%) | 34 (4.5%) |
| 30 to 34 Years | 893 (85.6%) | 37 (4.1%) |
| 35 to 44 Years | 1,644 (84.5%) | 66 (4.0%) |
| 45 to 54 Years | 1,320 (90.2%) | 120 (9.1%) |
| 55 to 59 Years | 747 (88.5%) | 67 (9.0%) |
| 60 to 64 Years | 665 (75.7%) | 0 (0.0%) |
| 65 to 74 Years | 741 (52.7%) | 14 (1.9%) |
| 75 Years and over | 143 (19.0%) | 16 (11.2%) |
| Total | 7,581 (73.2%) | 432 (5.7%) |
Employment Status by Educational Attainment in Lahaina
According to labor force statistics for Lahaina, 85.9% of individuals (6,026) out of the total population between 25 and 64 years of age (7,015) are in the labor force, with 5.4% or 325 of them being unemployed. The group with the highest labor force participation rate are those with the educational attainment of college / associate degree, with 89.0% or 1,663 individuals in the labor force. Within the labor force, individuals with college / associate degree education have the highest percentage of unemployment, with 7.5% or 125 of them being unemployed.
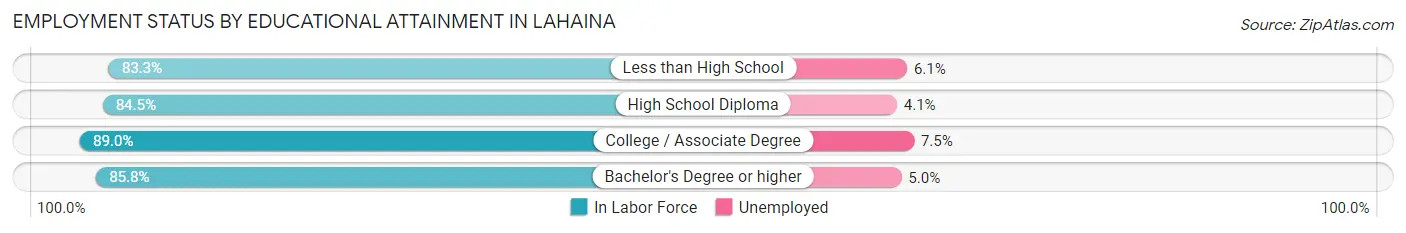
| Educational Attainment | In Labor Force | Unemployed |
| Less than High School | 395 (83.3%) | 29 (6.1%) |
| High School Diploma | 2,475 (84.5%) | 120 (4.1%) |
| College / Associate Degree | 1,663 (89.0%) | 140 (7.5%) |
| Bachelor's Degree or higher | 1,495 (85.8%) | 87 (5.0%) |
| Total | 6,026 (85.9%) | 379 (5.4%) |
Employment Occupations by Sex in Lahaina
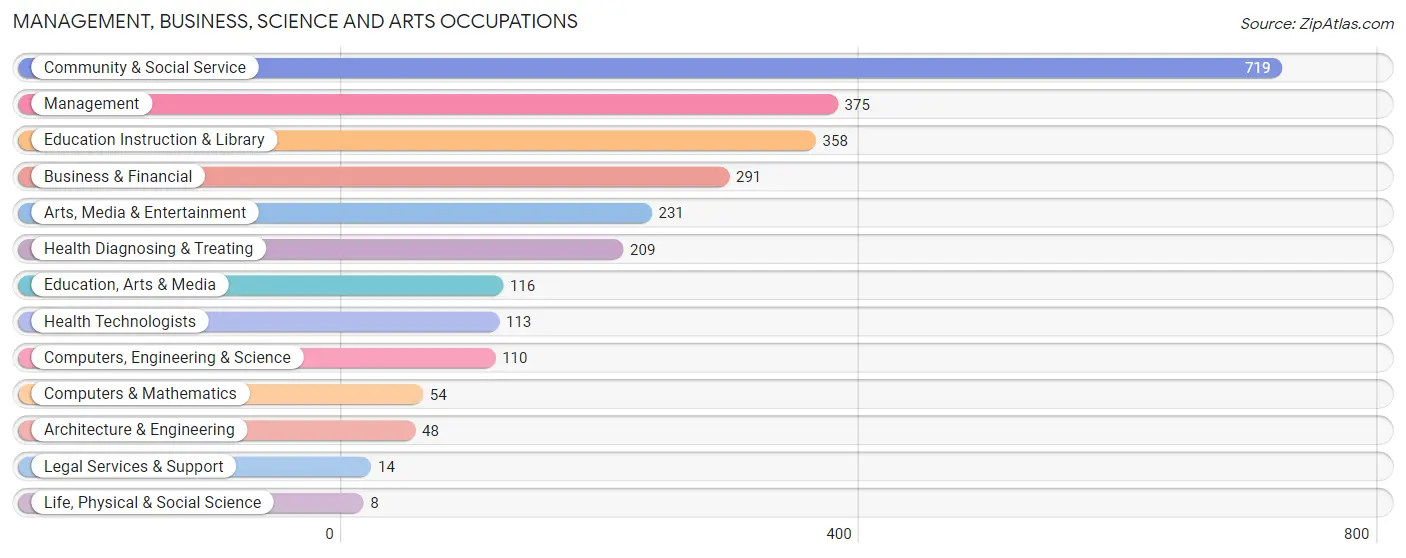
Management, Business, Science and Arts Occupations
The most common Management, Business, Science and Arts occupations in Lahaina are Community & Social Service (719 | 10.1%), Management (375 | 5.3%), Education Instruction & Library (358 | 5.0%), Business & Financial (291 | 4.1%), and Arts, Media & Entertainment (231 | 3.3%).
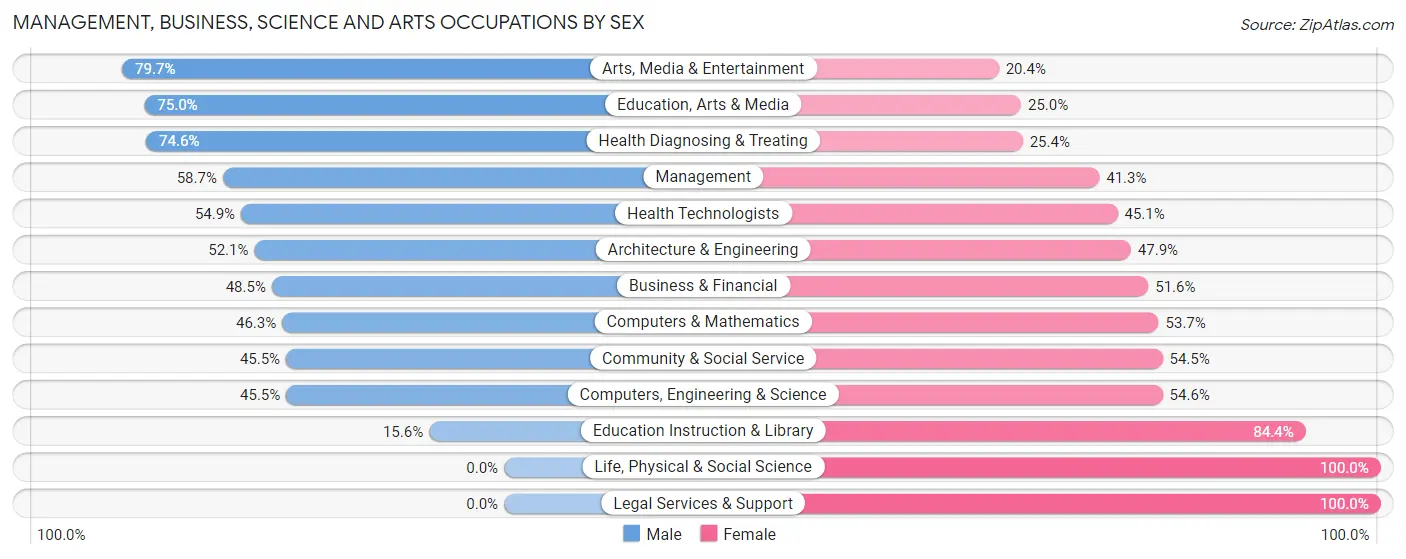
Management, Business, Science and Arts Occupations by Sex
Within the Management, Business, Science and Arts occupations in Lahaina, the most male-oriented occupations are Arts, Media & Entertainment (79.6%), Education, Arts & Media (75.0%), and Health Diagnosing & Treating (74.6%), while the most female-oriented occupations are Life, Physical & Social Science (100.0%), Legal Services & Support (100.0%), and Education Instruction & Library (84.4%).
| Occupation | Male | Female |
| Management | 220 (58.7%) | 155 (41.3%) |
| Business & Financial | 141 (48.4%) | 150 (51.5%) |
| Computers, Engineering & Science | 50 (45.5%) | 60 (54.5%) |
| Computers & Mathematics | 25 (46.3%) | 29 (53.7%) |
| Architecture & Engineering | 25 (52.1%) | 23 (47.9%) |
| Life, Physical & Social Science | 0 (0.0%) | 8 (100.0%) |
| Community & Social Service | 327 (45.5%) | 392 (54.5%) |
| Education, Arts & Media | 87 (75.0%) | 29 (25.0%) |
| Legal Services & Support | 0 (0.0%) | 14 (100.0%) |
| Education Instruction & Library | 56 (15.6%) | 302 (84.4%) |
| Arts, Media & Entertainment | 184 (79.6%) | 47 (20.3%) |
| Health Diagnosing & Treating | 156 (74.6%) | 53 (25.4%) |
| Health Technologists | 62 (54.9%) | 51 (45.1%) |
| Total (Category) | 894 (52.5%) | 810 (47.5%) |
| Total (Overall) | 3,708 (52.2%) | 3,401 (47.8%) |
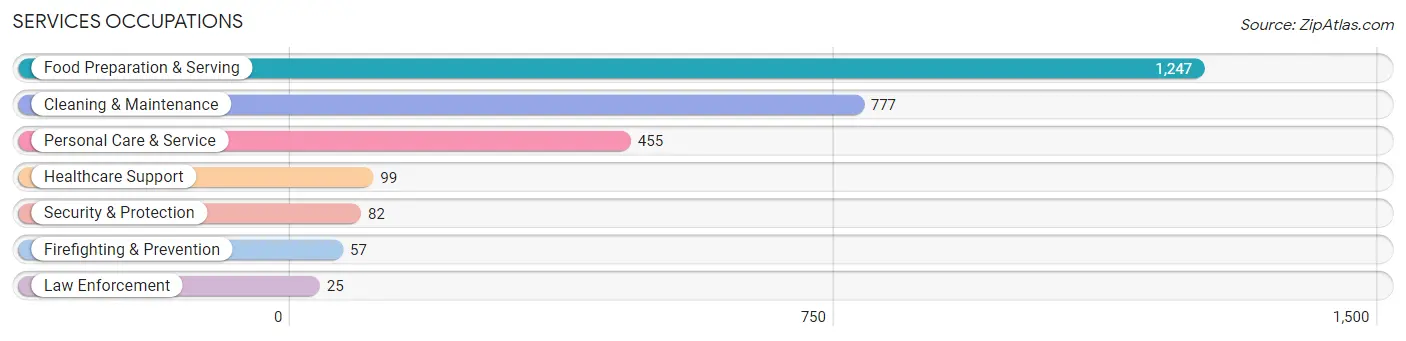
Services Occupations
The most common Services occupations in Lahaina are Food Preparation & Serving (1,247 | 17.5%), Cleaning & Maintenance (777 | 10.9%), Personal Care & Service (455 | 6.4%), Healthcare Support (99 | 1.4%), and Security & Protection (82 | 1.1%).
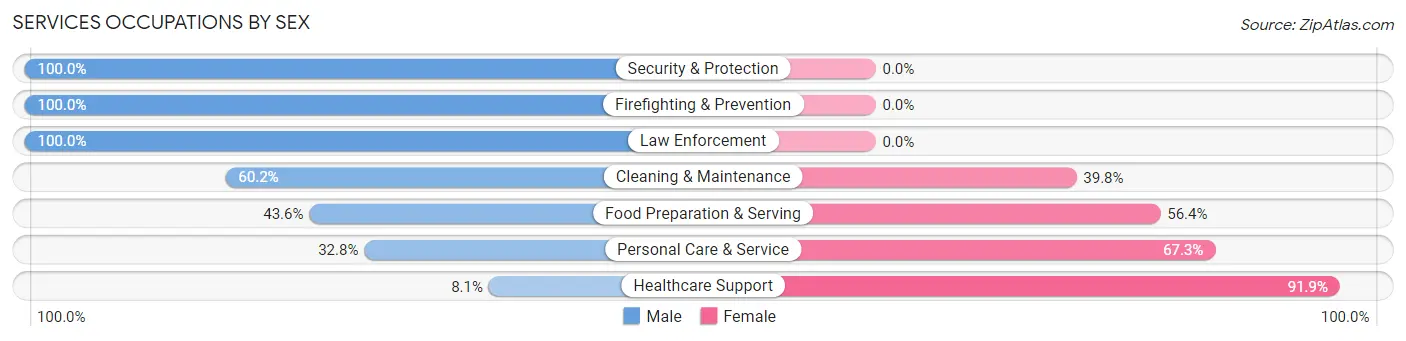
Services Occupations by Sex
Within the Services occupations in Lahaina, the most male-oriented occupations are Security & Protection (100.0%), Firefighting & Prevention (100.0%), and Law Enforcement (100.0%), while the most female-oriented occupations are Healthcare Support (91.9%), Personal Care & Service (67.2%), and Food Preparation & Serving (56.4%).
| Occupation | Male | Female |
| Healthcare Support | 8 (8.1%) | 91 (91.9%) |
| Security & Protection | 82 (100.0%) | 0 (0.0%) |
| Firefighting & Prevention | 57 (100.0%) | 0 (0.0%) |
| Law Enforcement | 25 (100.0%) | 0 (0.0%) |
| Food Preparation & Serving | 544 (43.6%) | 703 (56.4%) |
| Cleaning & Maintenance | 468 (60.2%) | 309 (39.8%) |
| Personal Care & Service | 149 (32.8%) | 306 (67.2%) |
| Total (Category) | 1,251 (47.0%) | 1,409 (53.0%) |
| Total (Overall) | 3,708 (52.2%) | 3,401 (47.8%) |
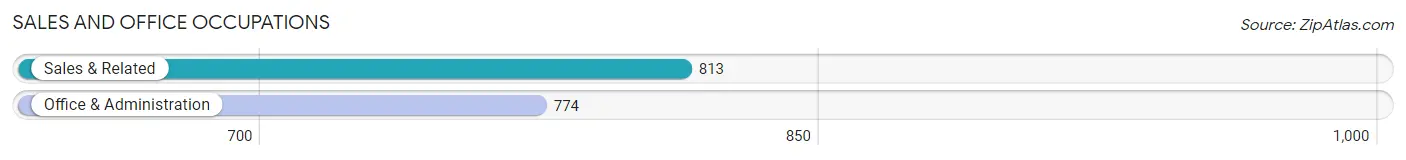
Sales and Office Occupations
The most common Sales and Office occupations in Lahaina are Sales & Related (813 | 11.4%), and Office & Administration (774 | 10.9%).
Sales and Office Occupations by Sex
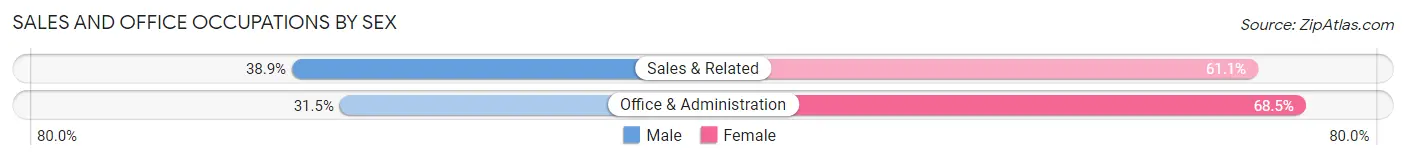
| Occupation | Male | Female |
| Sales & Related | 316 (38.9%) | 497 (61.1%) |
| Office & Administration | 244 (31.5%) | 530 (68.5%) |
| Total (Category) | 560 (35.3%) | 1,027 (64.7%) |
| Total (Overall) | 3,708 (52.2%) | 3,401 (47.8%) |
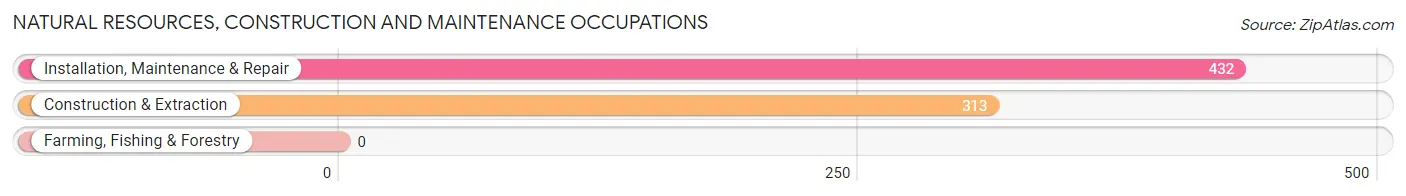
Natural Resources, Construction and Maintenance Occupations
The most common Natural Resources, Construction and Maintenance occupations in Lahaina are Installation, Maintenance & Repair (432 | 6.1%), and Construction & Extraction (313 | 4.4%).
Natural Resources, Construction and Maintenance Occupations by Sex
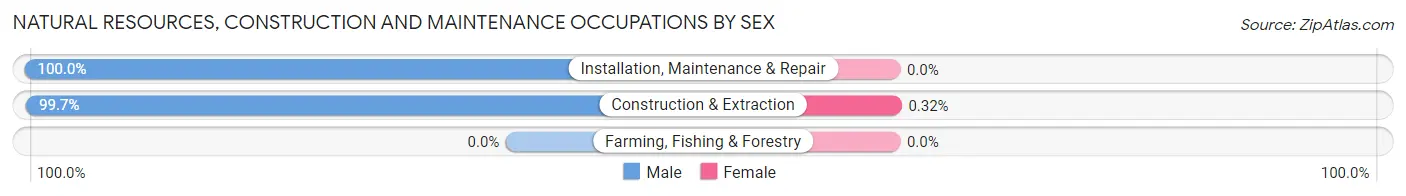
| Occupation | Male | Female |
| Farming, Fishing & Forestry | 0 (0.0%) | 0 (0.0%) |
| Construction & Extraction | 312 (99.7%) | 1 (0.3%) |
| Installation, Maintenance & Repair | 432 (100.0%) | 0 (0.0%) |
| Total (Category) | 744 (99.9%) | 1 (0.1%) |
| Total (Overall) | 3,708 (52.2%) | 3,401 (47.8%) |
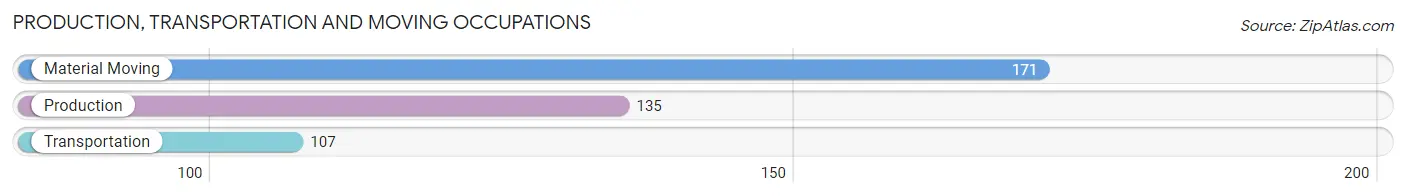
Production, Transportation and Moving Occupations
The most common Production, Transportation and Moving occupations in Lahaina are Material Moving (171 | 2.4%), Production (135 | 1.9%), and Transportation (107 | 1.5%).
Production, Transportation and Moving Occupations by Sex
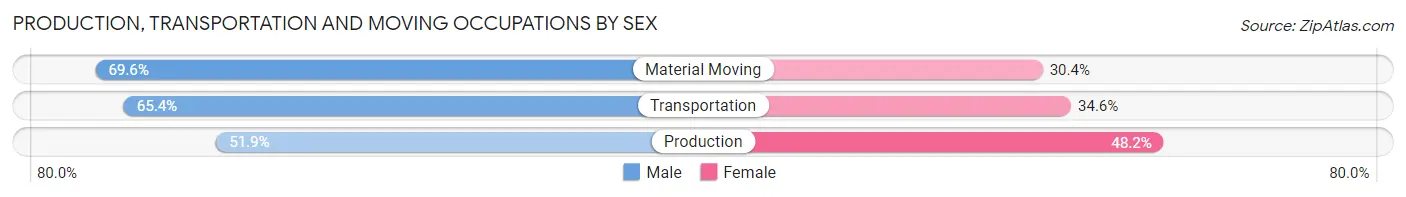
| Occupation | Male | Female |
| Production | 70 (51.8%) | 65 (48.1%) |
| Transportation | 70 (65.4%) | 37 (34.6%) |
| Material Moving | 119 (69.6%) | 52 (30.4%) |
| Total (Category) | 259 (62.7%) | 154 (37.3%) |
| Total (Overall) | 3,708 (52.2%) | 3,401 (47.8%) |
Employment Industries by Sex in Lahaina
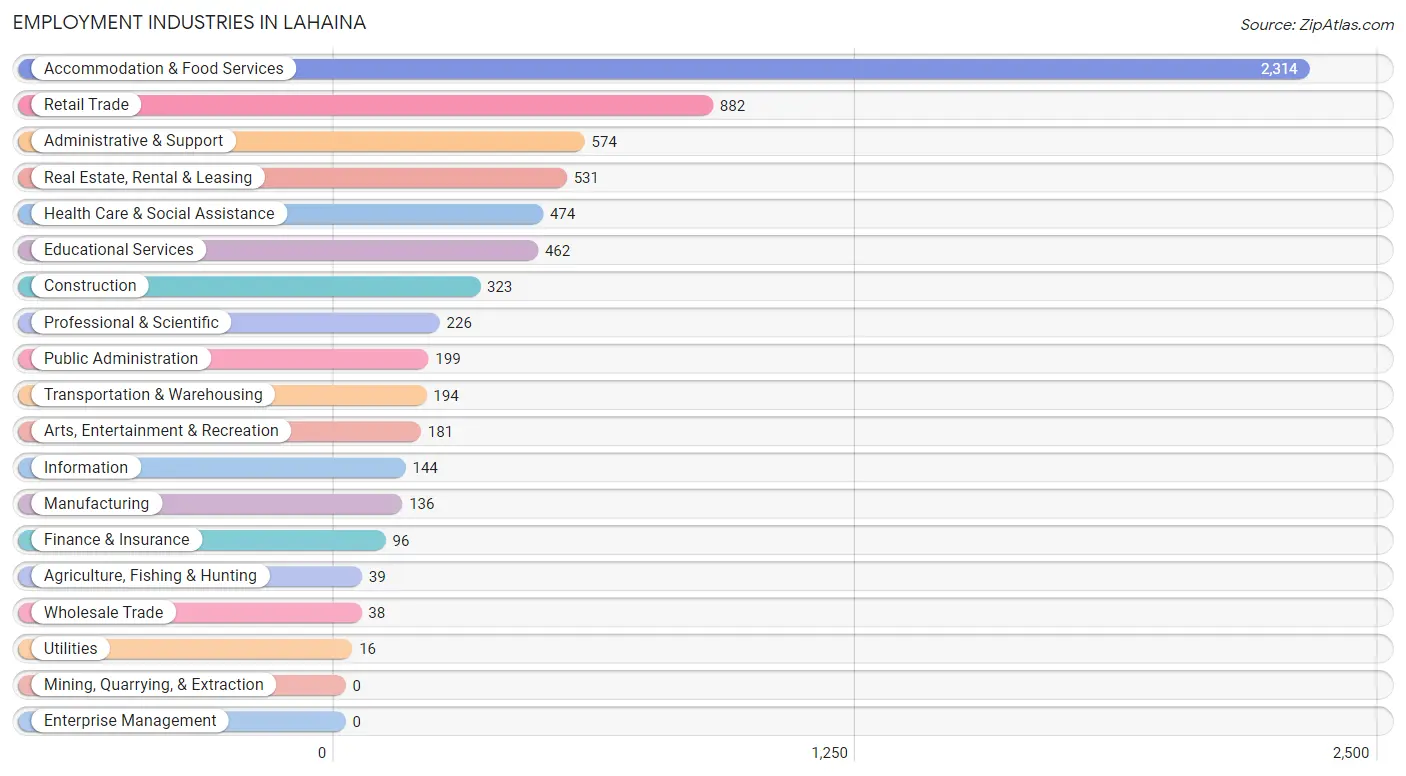
Employment Industries in Lahaina
The major employment industries in Lahaina include Accommodation & Food Services (2,314 | 32.6%), Retail Trade (882 | 12.4%), Administrative & Support (574 | 8.1%), Real Estate, Rental & Leasing (531 | 7.5%), and Health Care & Social Assistance (474 | 6.7%).
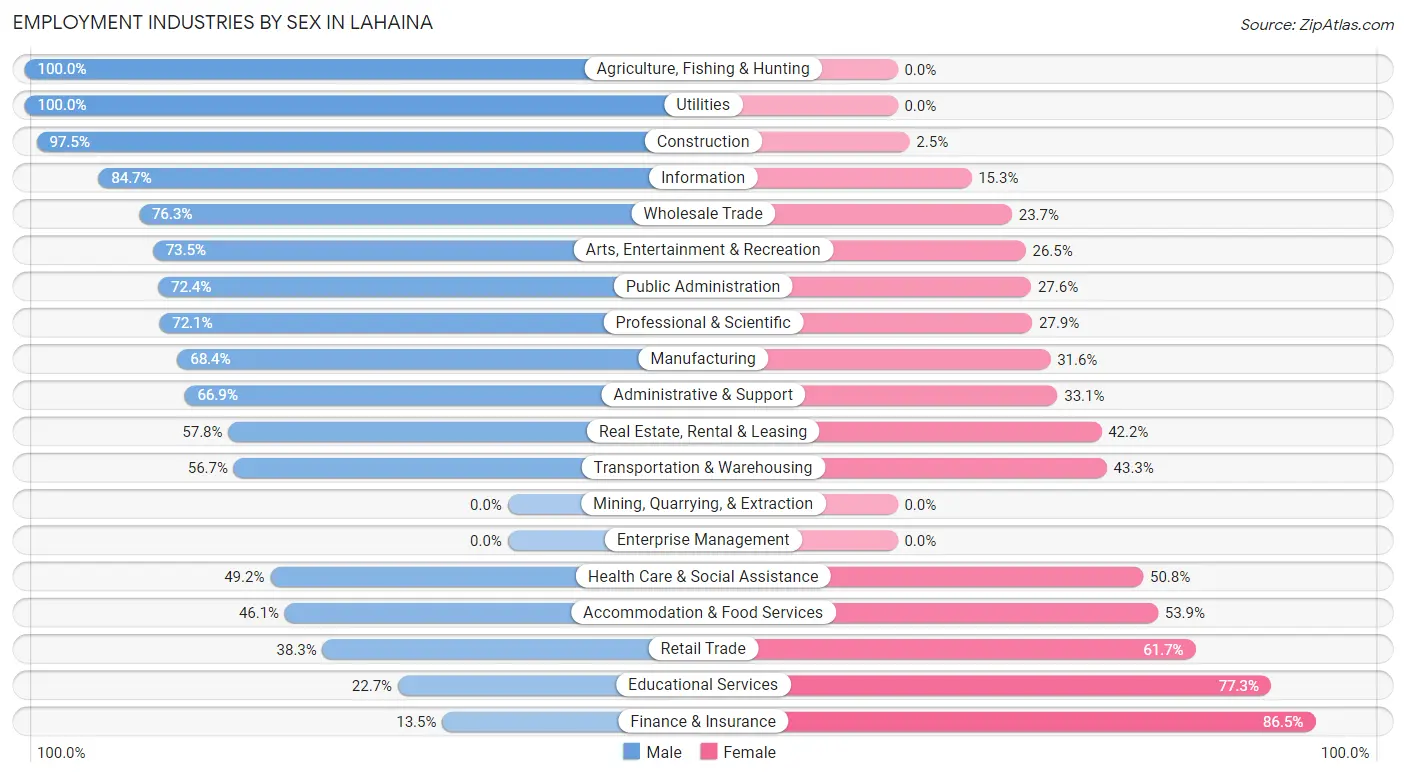
Employment Industries by Sex in Lahaina
The Lahaina industries that see more men than women are Agriculture, Fishing & Hunting (100.0%), Utilities (100.0%), and Construction (97.5%), whereas the industries that tend to have a higher number of women are Finance & Insurance (86.5%), Educational Services (77.3%), and Retail Trade (61.7%).
| Industry | Male | Female |
| Agriculture, Fishing & Hunting | 39 (100.0%) | 0 (0.0%) |
| Mining, Quarrying, & Extraction | 0 (0.0%) | 0 (0.0%) |
| Construction | 315 (97.5%) | 8 (2.5%) |
| Manufacturing | 93 (68.4%) | 43 (31.6%) |
| Wholesale Trade | 29 (76.3%) | 9 (23.7%) |
| Retail Trade | 338 (38.3%) | 544 (61.7%) |
| Transportation & Warehousing | 110 (56.7%) | 84 (43.3%) |
| Utilities | 16 (100.0%) | 0 (0.0%) |
| Information | 122 (84.7%) | 22 (15.3%) |
| Finance & Insurance | 13 (13.5%) | 83 (86.5%) |
| Real Estate, Rental & Leasing | 307 (57.8%) | 224 (42.2%) |
| Professional & Scientific | 163 (72.1%) | 63 (27.9%) |
| Enterprise Management | 0 (0.0%) | 0 (0.0%) |
| Administrative & Support | 384 (66.9%) | 190 (33.1%) |
| Educational Services | 105 (22.7%) | 357 (77.3%) |
| Health Care & Social Assistance | 233 (49.2%) | 241 (50.8%) |
| Arts, Entertainment & Recreation | 133 (73.5%) | 48 (26.5%) |
| Accommodation & Food Services | 1,067 (46.1%) | 1,247 (53.9%) |
| Public Administration | 144 (72.4%) | 55 (27.6%) |
| Total | 3,708 (52.2%) | 3,401 (47.8%) |
Education in Lahaina
School Enrollment in Lahaina
The most common levels of schooling among the 2,291 students in Lahaina are high school (637 | 27.8%), middle school (590 | 25.8%), and elementary school (565 | 24.7%).
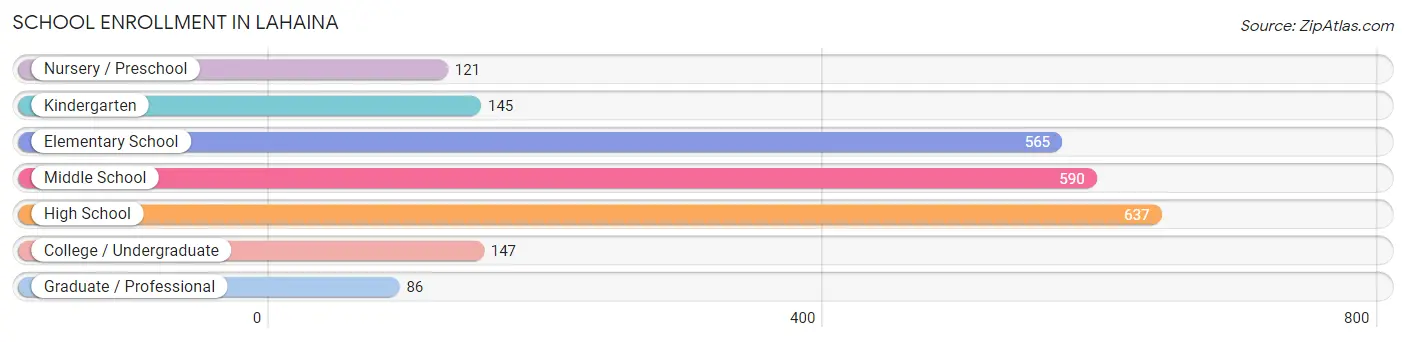
| School Level | # Students | % Students |
| Nursery / Preschool | 121 | 5.3% |
| Kindergarten | 145 | 6.3% |
| Elementary School | 565 | 24.7% |
| Middle School | 590 | 25.8% |
| High School | 637 | 27.8% |
| College / Undergraduate | 147 | 6.4% |
| Graduate / Professional | 86 | 3.7% |
| Total | 2,291 | 100.0% |
School Enrollment by Age by Funding Source in Lahaina
Out of a total of 2,291 students who are enrolled in schools in Lahaina, 513 (22.4%) attend a private institution, while the remaining 1,778 (77.6%) are enrolled in public schools. The age group of 3 to 4 year olds has the highest likelihood of being enrolled in private schools, with 45 (80.4% in the age bracket) enrolled. Conversely, the age group of 15 to 17 year olds has the lowest likelihood of being enrolled in a private school, with 481 (96.6% in the age bracket) attending a public institution.
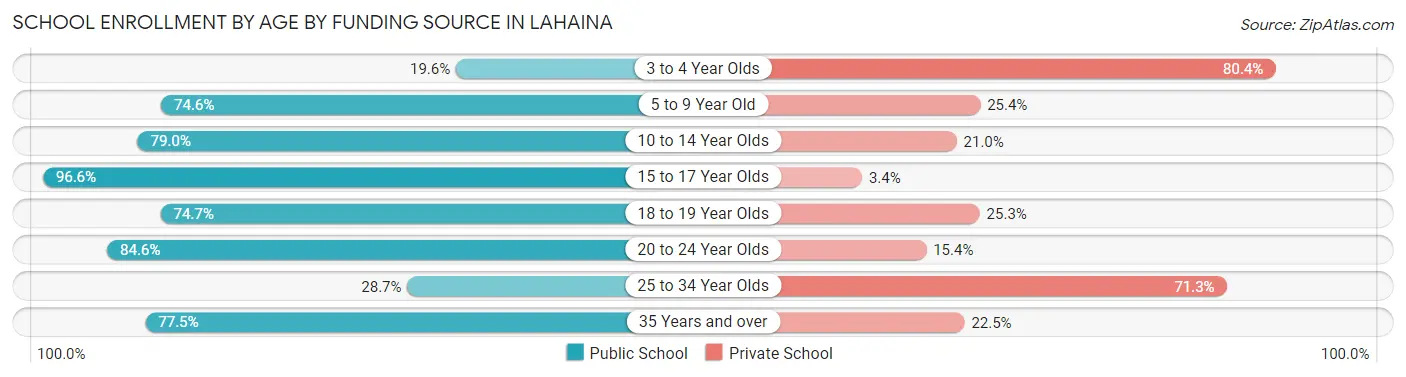
| Age Bracket | Public School | Private School |
| 3 to 4 Year Olds | 11 (19.6%) | 45 (80.4%) |
| 5 to 9 Year Old | 525 (74.6%) | 179 (25.4%) |
| 10 to 14 Year Olds | 503 (79.0%) | 134 (21.0%) |
| 15 to 17 Year Olds | 481 (96.6%) | 17 (3.4%) |
| 18 to 19 Year Olds | 112 (74.7%) | 38 (25.3%) |
| 20 to 24 Year Olds | 55 (84.6%) | 10 (15.4%) |
| 25 to 34 Year Olds | 29 (28.7%) | 72 (71.3%) |
| 35 Years and over | 62 (77.5%) | 18 (22.5%) |
| Total | 1,778 (77.6%) | 513 (22.4%) |
Educational Attainment by Field of Study in Lahaina
Business (632 | 24.6%), education (394 | 15.3%), visual & performing arts (244 | 9.5%), science & technology (217 | 8.5%), and social sciences (201 | 7.8%) are the most common fields of study among 2,569 individuals in Lahaina who have obtained a bachelor's degree or higher.
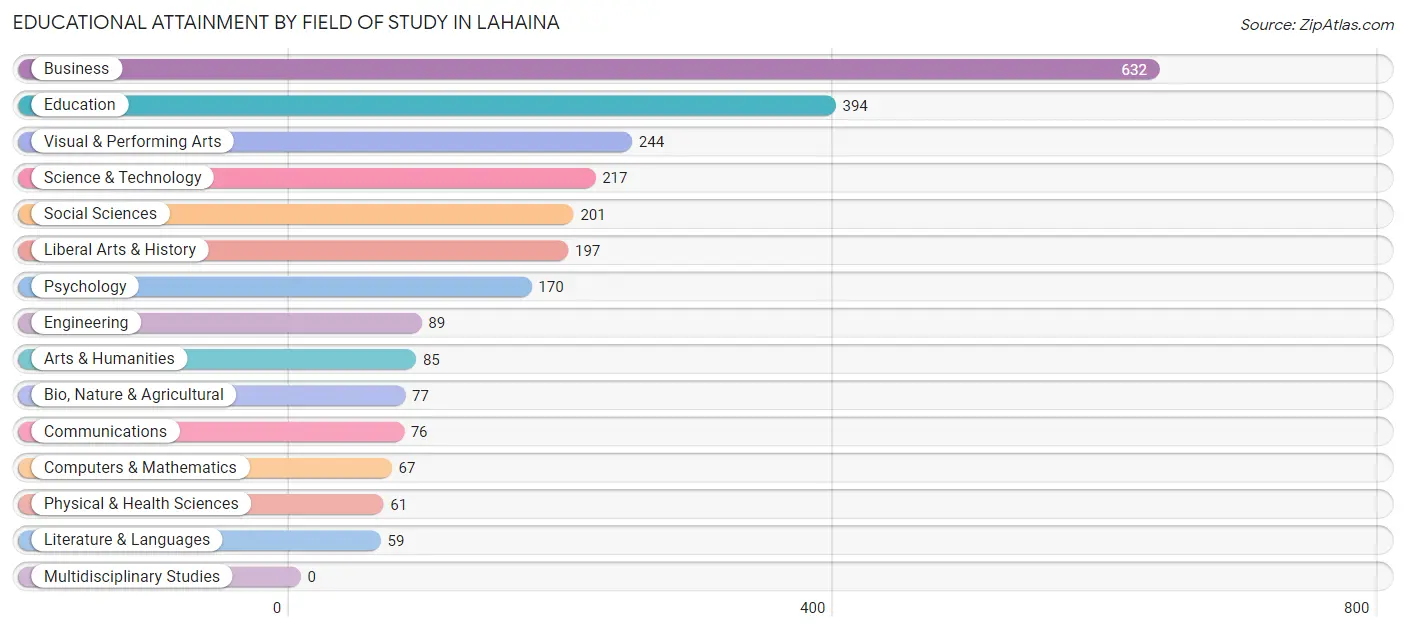
| Field of Study | # Graduates | % Graduates |
| Computers & Mathematics | 67 | 2.6% |
| Bio, Nature & Agricultural | 77 | 3.0% |
| Physical & Health Sciences | 61 | 2.4% |
| Psychology | 170 | 6.6% |
| Social Sciences | 201 | 7.8% |
| Engineering | 89 | 3.5% |
| Multidisciplinary Studies | 0 | 0.0% |
| Science & Technology | 217 | 8.5% |
| Business | 632 | 24.6% |
| Education | 394 | 15.3% |
| Literature & Languages | 59 | 2.3% |
| Liberal Arts & History | 197 | 7.7% |
| Visual & Performing Arts | 244 | 9.5% |
| Communications | 76 | 3.0% |
| Arts & Humanities | 85 | 3.3% |
| Total | 2,569 | 100.0% |
Transportation & Commute in Lahaina
Vehicle Availability by Sex in Lahaina
The most prevalent vehicle ownership categories in Lahaina are males with 2 vehicles (866, accounting for 25.0%) and females with 2 vehicles (1,131, making up 27.0%).
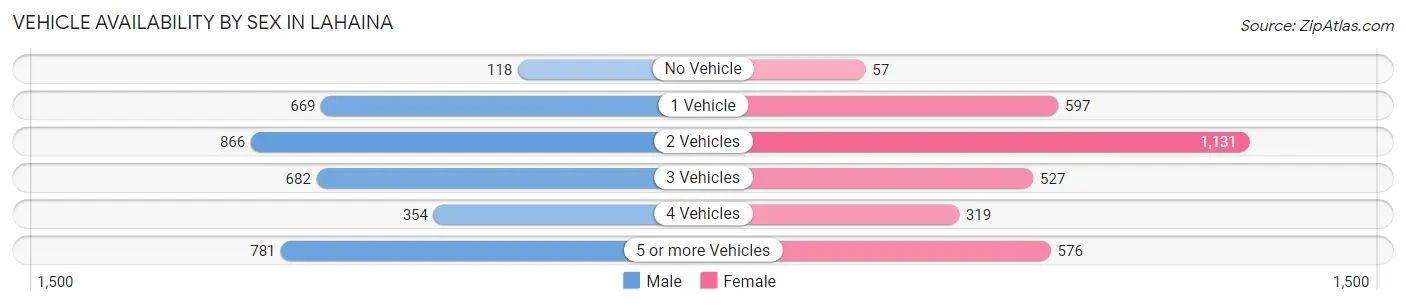
| Vehicles Available | Male | Female |
| No Vehicle | 118 (3.4%) | 57 (1.8%) |
| 1 Vehicle | 669 (19.3%) | 597 (18.6%) |
| 2 Vehicles | 866 (25.0%) | 1,131 (35.3%) |
| 3 Vehicles | 682 (19.7%) | 527 (16.4%) |
| 4 Vehicles | 354 (10.2%) | 319 (10.0%) |
| 5 or more Vehicles | 781 (22.5%) | 576 (18.0%) |
| Total | 3,470 (100.0%) | 3,207 (100.0%) |
Commute Time in Lahaina
The most frequently occuring commute durations in Lahaina are 10 to 14 minutes (1,425 commuters, 22.3%), 15 to 19 minutes (1,294 commuters, 20.3%), and 5 to 9 minutes (1,158 commuters, 18.1%).
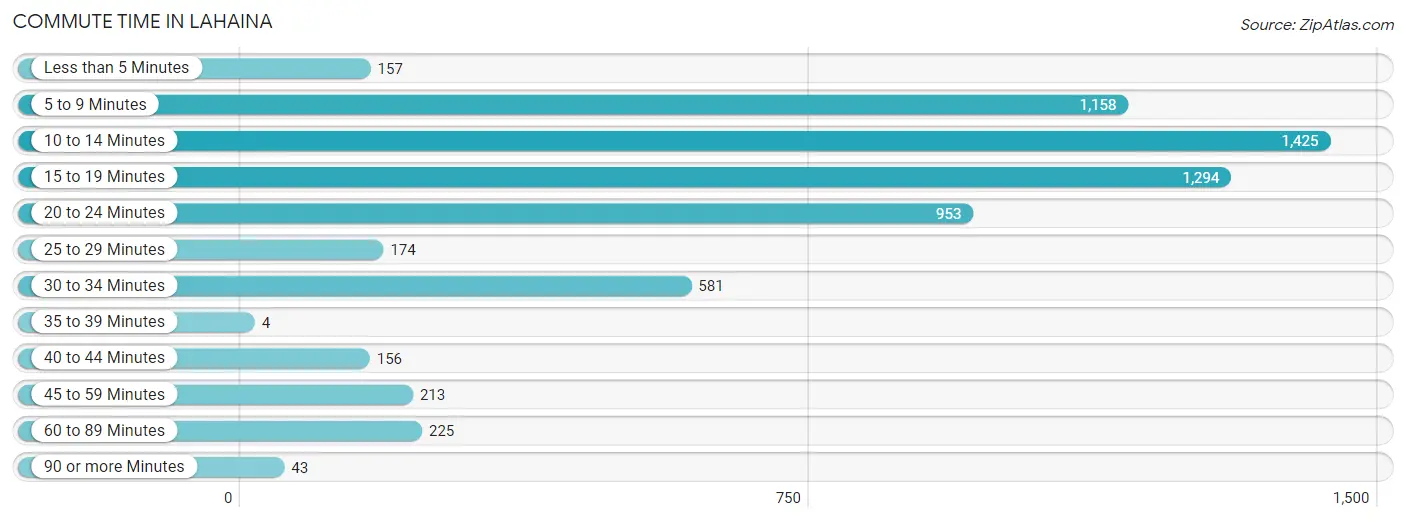
| Commute Time | # Commuters | % Commuters |
| Less than 5 Minutes | 157 | 2.5% |
| 5 to 9 Minutes | 1,158 | 18.1% |
| 10 to 14 Minutes | 1,425 | 22.3% |
| 15 to 19 Minutes | 1,294 | 20.3% |
| 20 to 24 Minutes | 953 | 14.9% |
| 25 to 29 Minutes | 174 | 2.7% |
| 30 to 34 Minutes | 581 | 9.1% |
| 35 to 39 Minutes | 4 | 0.1% |
| 40 to 44 Minutes | 156 | 2.4% |
| 45 to 59 Minutes | 213 | 3.3% |
| 60 to 89 Minutes | 225 | 3.5% |
| 90 or more Minutes | 43 | 0.7% |
Commute Time by Sex in Lahaina
The most common commute times in Lahaina are 10 to 14 minutes (672 commuters, 19.8%) for males and 10 to 14 minutes (753 commuters, 25.2%) for females.
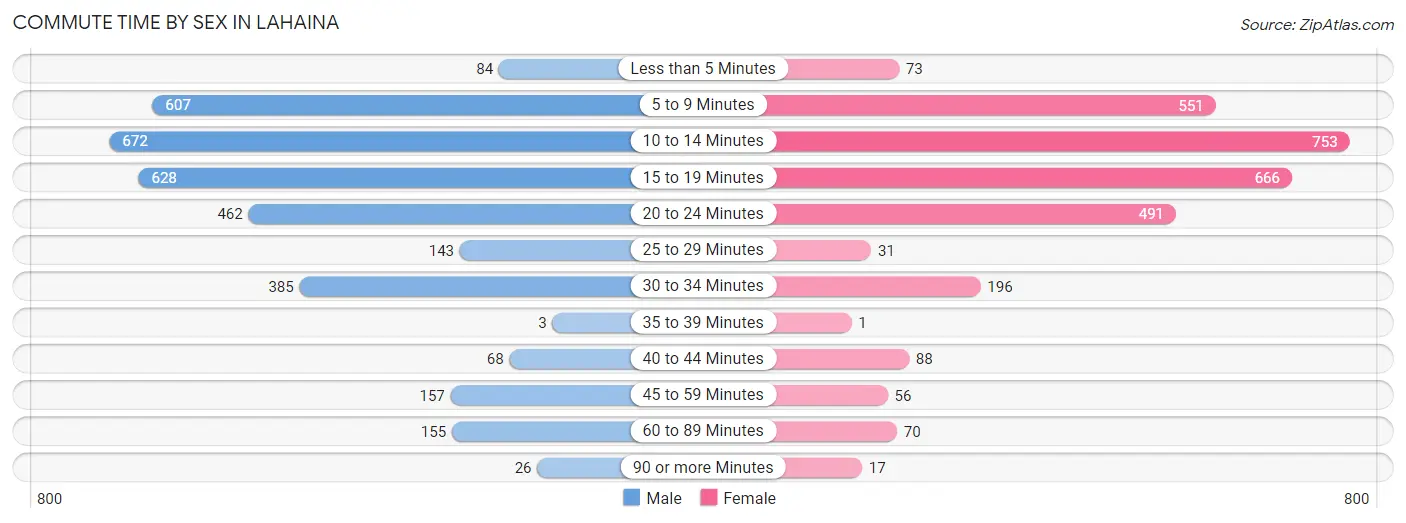
| Commute Time | Male | Female |
| Less than 5 Minutes | 84 (2.5%) | 73 (2.4%) |
| 5 to 9 Minutes | 607 (17.9%) | 551 (18.4%) |
| 10 to 14 Minutes | 672 (19.8%) | 753 (25.2%) |
| 15 to 19 Minutes | 628 (18.5%) | 666 (22.3%) |
| 20 to 24 Minutes | 462 (13.6%) | 491 (16.4%) |
| 25 to 29 Minutes | 143 (4.2%) | 31 (1.0%) |
| 30 to 34 Minutes | 385 (11.4%) | 196 (6.6%) |
| 35 to 39 Minutes | 3 (0.1%) | 1 (0.0%) |
| 40 to 44 Minutes | 68 (2.0%) | 88 (2.9%) |
| 45 to 59 Minutes | 157 (4.6%) | 56 (1.9%) |
| 60 to 89 Minutes | 155 (4.6%) | 70 (2.3%) |
| 90 or more Minutes | 26 (0.8%) | 17 (0.6%) |
Time of Departure to Work by Sex in Lahaina
The most frequent times of departure to work in Lahaina are 7:00 AM to 7:29 AM (505, 14.9%) for males and 7:00 AM to 7:29 AM (556, 18.6%) for females.
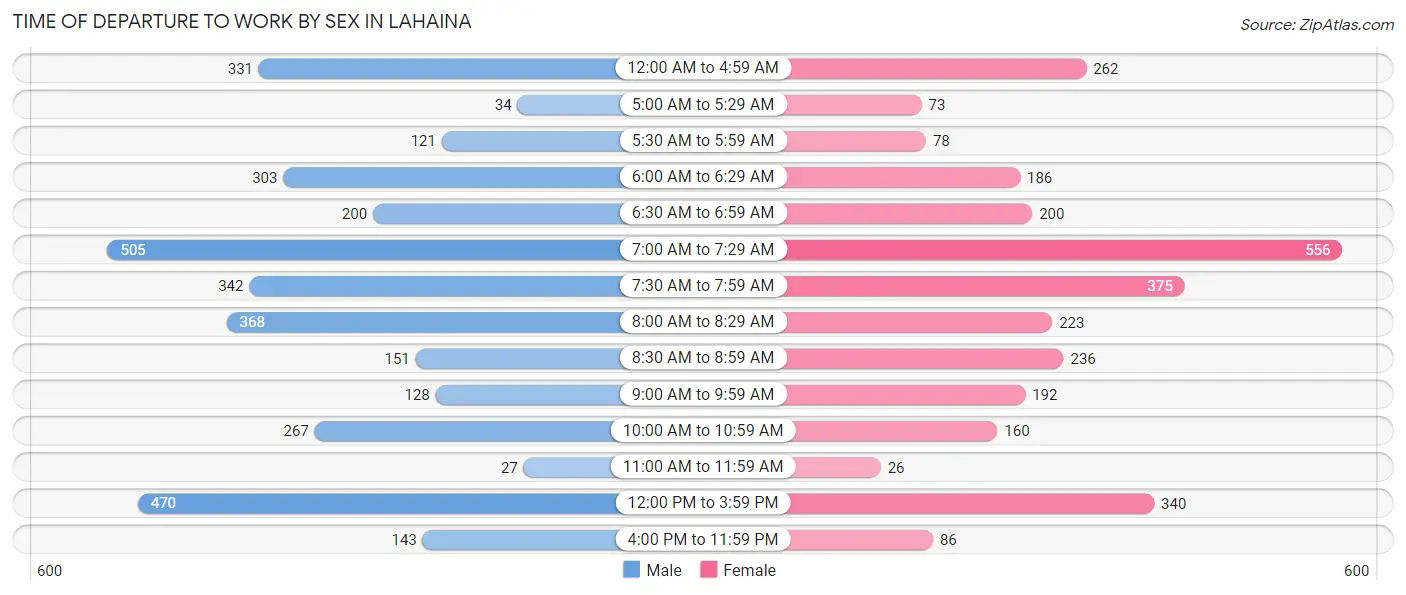
| Time of Departure | Male | Female |
| 12:00 AM to 4:59 AM | 331 (9.8%) | 262 (8.7%) |
| 5:00 AM to 5:29 AM | 34 (1.0%) | 73 (2.4%) |
| 5:30 AM to 5:59 AM | 121 (3.6%) | 78 (2.6%) |
| 6:00 AM to 6:29 AM | 303 (8.9%) | 186 (6.2%) |
| 6:30 AM to 6:59 AM | 200 (5.9%) | 200 (6.7%) |
| 7:00 AM to 7:29 AM | 505 (14.9%) | 556 (18.6%) |
| 7:30 AM to 7:59 AM | 342 (10.1%) | 375 (12.5%) |
| 8:00 AM to 8:29 AM | 368 (10.9%) | 223 (7.4%) |
| 8:30 AM to 8:59 AM | 151 (4.4%) | 236 (7.9%) |
| 9:00 AM to 9:59 AM | 128 (3.8%) | 192 (6.4%) |
| 10:00 AM to 10:59 AM | 267 (7.9%) | 160 (5.3%) |
| 11:00 AM to 11:59 AM | 27 (0.8%) | 26 (0.9%) |
| 12:00 PM to 3:59 PM | 470 (13.9%) | 340 (11.4%) |
| 4:00 PM to 11:59 PM | 143 (4.2%) | 86 (2.9%) |
| Total | 3,390 (100.0%) | 2,993 (100.0%) |
Housing Occupancy in Lahaina
Occupancy by Ownership in Lahaina
Of the total 3,562 dwellings in Lahaina, owner-occupied units account for 1,844 (51.8%), while renter-occupied units make up 1,718 (48.2%).
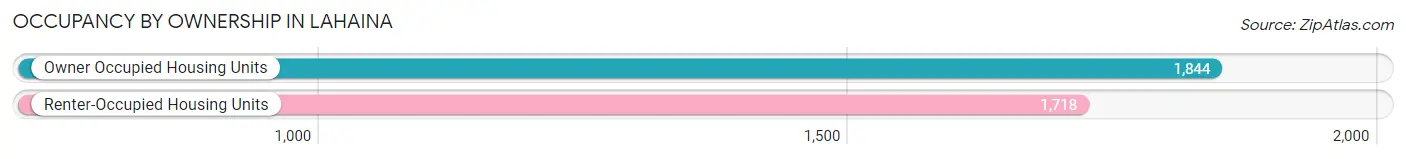
| Occupancy | # Housing Units | % Housing Units |
| Owner Occupied Housing Units | 1,844 | 51.8% |
| Renter-Occupied Housing Units | 1,718 | 48.2% |
| Total Occupied Housing Units | 3,562 | 100.0% |
Occupancy by Household Size in Lahaina
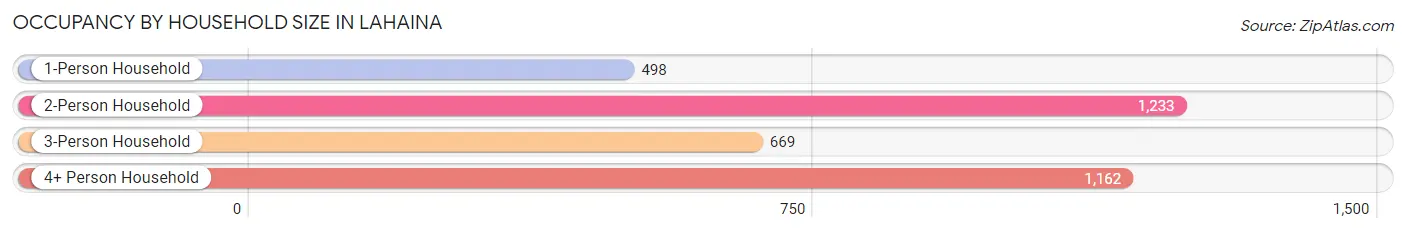
| Household Size | # Housing Units | % Housing Units |
| 1-Person Household | 498 | 14.0% |
| 2-Person Household | 1,233 | 34.6% |
| 3-Person Household | 669 | 18.8% |
| 4+ Person Household | 1,162 | 32.6% |
| Total Housing Units | 3,562 | 100.0% |
Occupancy by Ownership by Household Size in Lahaina
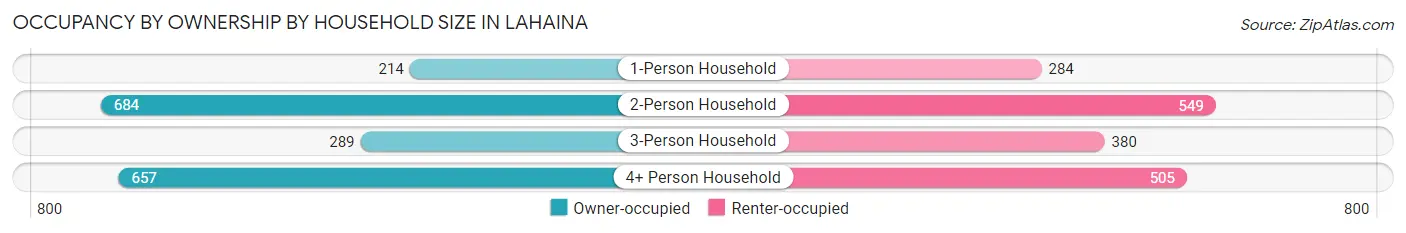
| Household Size | Owner-occupied | Renter-occupied |
| 1-Person Household | 214 (43.0%) | 284 (57.0%) |
| 2-Person Household | 684 (55.5%) | 549 (44.5%) |
| 3-Person Household | 289 (43.2%) | 380 (56.8%) |
| 4+ Person Household | 657 (56.5%) | 505 (43.5%) |
| Total Housing Units | 1,844 (51.8%) | 1,718 (48.2%) |
Occupancy by Educational Attainment in Lahaina
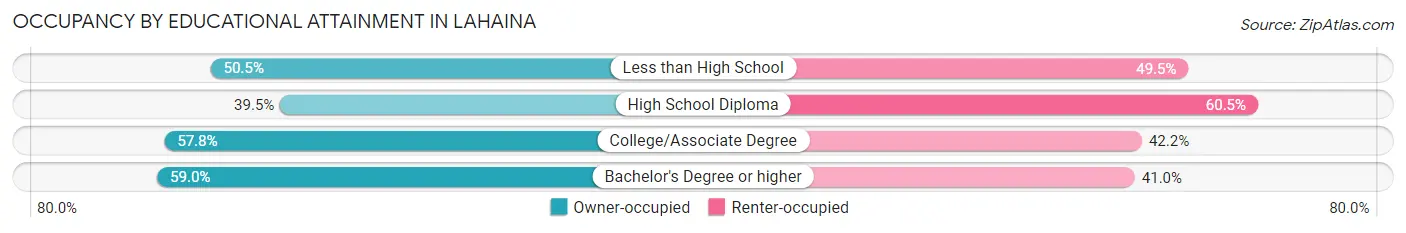
| Household Size | Owner-occupied | Renter-occupied |
| Less than High School | 151 (50.5%) | 148 (49.5%) |
| High School Diploma | 444 (39.5%) | 681 (60.5%) |
| College/Associate Degree | 605 (57.8%) | 441 (42.2%) |
| Bachelor's Degree or higher | 644 (59.0%) | 448 (41.0%) |
Occupancy by Age of Householder in Lahaina
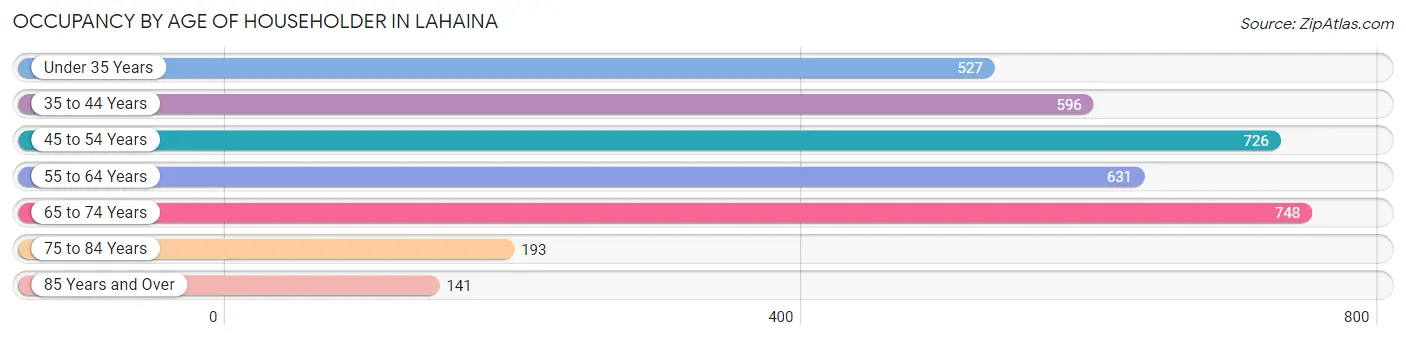
| Age Bracket | # Households | % Households |
| Under 35 Years | 527 | 14.8% |
| 35 to 44 Years | 596 | 16.7% |
| 45 to 54 Years | 726 | 20.4% |
| 55 to 64 Years | 631 | 17.7% |
| 65 to 74 Years | 748 | 21.0% |
| 75 to 84 Years | 193 | 5.4% |
| 85 Years and Over | 141 | 4.0% |
| Total | 3,562 | 100.0% |
Housing Finances in Lahaina
Median Income by Occupancy in Lahaina
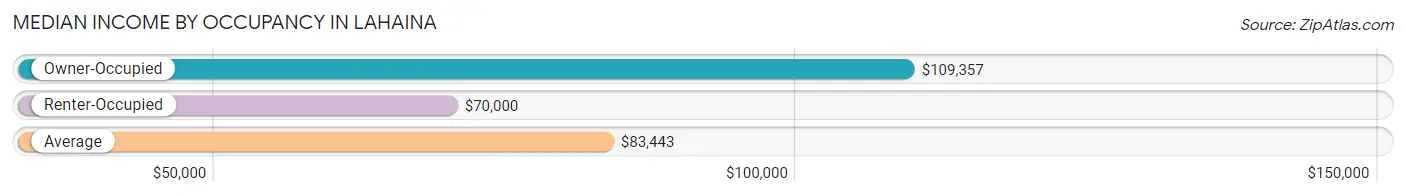
| Occupancy Type | # Households | Median Income |
| Owner-Occupied | 1,844 (51.8%) | $109,357 |
| Renter-Occupied | 1,718 (48.2%) | $70,000 |
| Average | 3,562 (100.0%) | $83,443 |
Occupancy by Householder Income Bracket in Lahaina
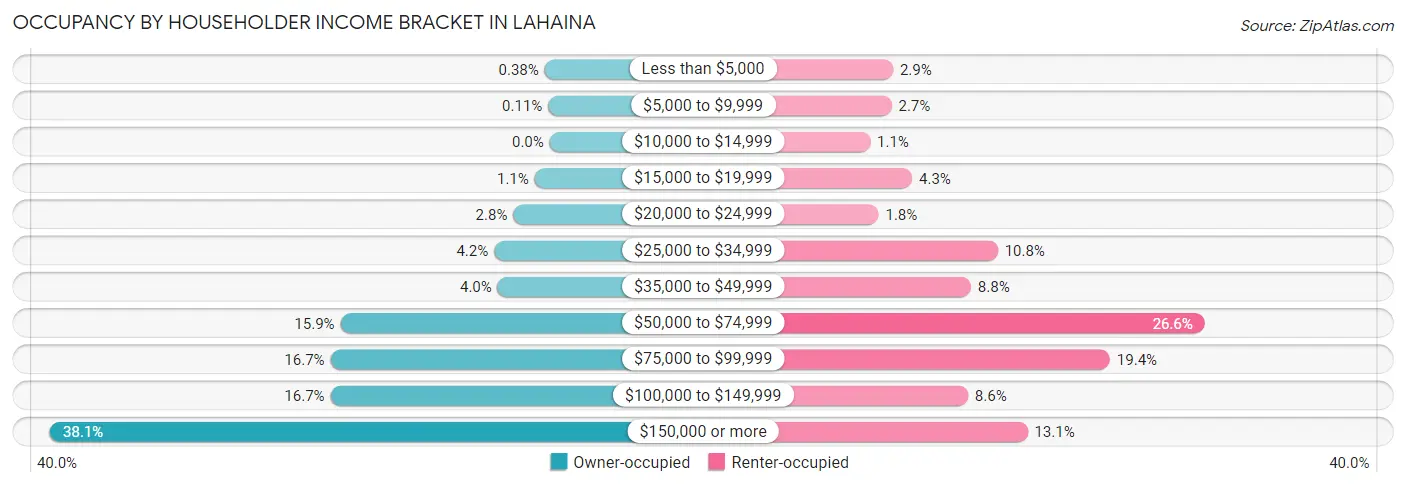
| Income Bracket | Owner-occupied | Renter-occupied |
| Less than $5,000 | 7 (0.4%) | 49 (2.9%) |
| $5,000 to $9,999 | 2 (0.1%) | 47 (2.7%) |
| $10,000 to $14,999 | 0 (0.0%) | 19 (1.1%) |
| $15,000 to $19,999 | 21 (1.1%) | 74 (4.3%) |
| $20,000 to $24,999 | 51 (2.8%) | 30 (1.8%) |
| $25,000 to $34,999 | 78 (4.2%) | 186 (10.8%) |
| $35,000 to $49,999 | 73 (4.0%) | 151 (8.8%) |
| $50,000 to $74,999 | 294 (15.9%) | 457 (26.6%) |
| $75,000 to $99,999 | 308 (16.7%) | 333 (19.4%) |
| $100,000 to $149,999 | 308 (16.7%) | 147 (8.6%) |
| $150,000 or more | 702 (38.1%) | 225 (13.1%) |
| Total | 1,844 (100.0%) | 1,718 (100.0%) |
Monthly Housing Cost Tiers in Lahaina
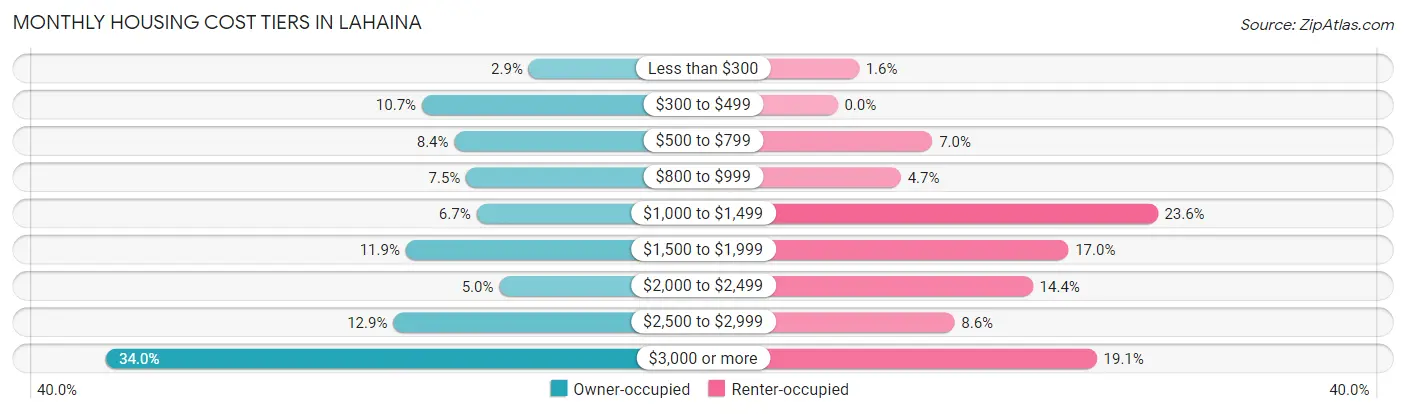
| Monthly Cost | Owner-occupied | Renter-occupied |
| Less than $300 | 53 (2.9%) | 27 (1.6%) |
| $300 to $499 | 198 (10.7%) | 0 (0.0%) |
| $500 to $799 | 154 (8.4%) | 120 (7.0%) |
| $800 to $999 | 138 (7.5%) | 80 (4.7%) |
| $1,000 to $1,499 | 124 (6.7%) | 405 (23.6%) |
| $1,500 to $1,999 | 220 (11.9%) | 292 (17.0%) |
| $2,000 to $2,499 | 93 (5.0%) | 247 (14.4%) |
| $2,500 to $2,999 | 237 (12.9%) | 148 (8.6%) |
| $3,000 or more | 627 (34.0%) | 328 (19.1%) |
| Total | 1,844 (100.0%) | 1,718 (100.0%) |
Physical Housing Characteristics in Lahaina
Housing Structures in Lahaina
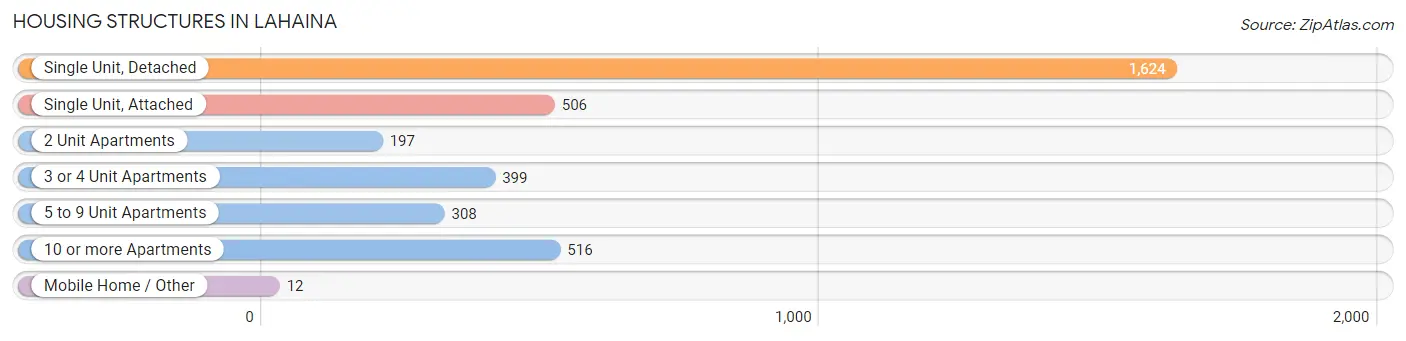
| Structure Type | # Housing Units | % Housing Units |
| Single Unit, Detached | 1,624 | 45.6% |
| Single Unit, Attached | 506 | 14.2% |
| 2 Unit Apartments | 197 | 5.5% |
| 3 or 4 Unit Apartments | 399 | 11.2% |
| 5 to 9 Unit Apartments | 308 | 8.6% |
| 10 or more Apartments | 516 | 14.5% |
| Mobile Home / Other | 12 | 0.3% |
| Total | 3,562 | 100.0% |
Housing Structures by Occupancy in Lahaina
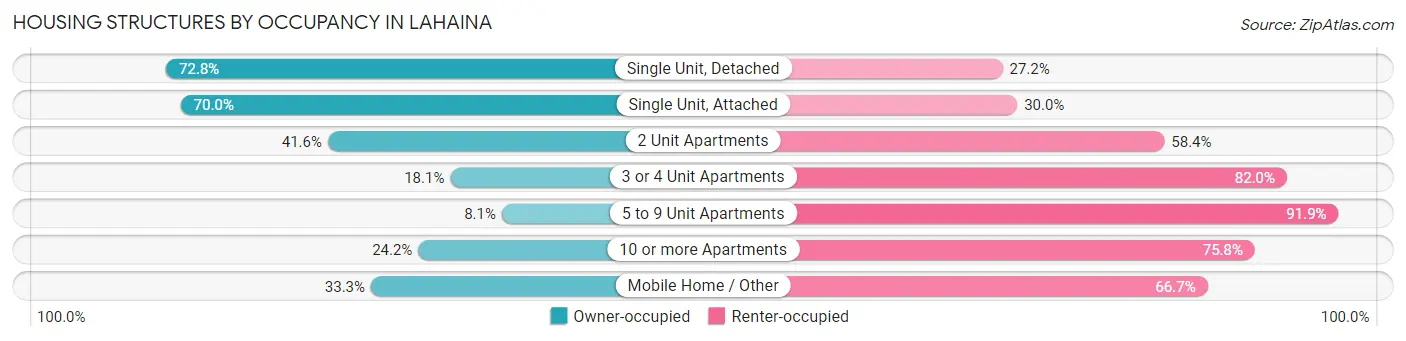
| Structure Type | Owner-occupied | Renter-occupied |
| Single Unit, Detached | 1,182 (72.8%) | 442 (27.2%) |
| Single Unit, Attached | 354 (70.0%) | 152 (30.0%) |
| 2 Unit Apartments | 82 (41.6%) | 115 (58.4%) |
| 3 or 4 Unit Apartments | 72 (18.0%) | 327 (82.0%) |
| 5 to 9 Unit Apartments | 25 (8.1%) | 283 (91.9%) |
| 10 or more Apartments | 125 (24.2%) | 391 (75.8%) |
| Mobile Home / Other | 4 (33.3%) | 8 (66.7%) |
| Total | 1,844 (51.8%) | 1,718 (48.2%) |
Housing Structures by Number of Rooms in Lahaina
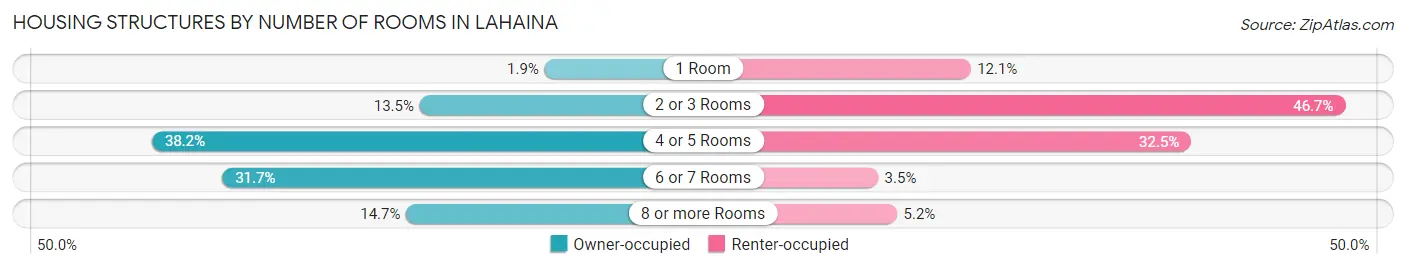
| Number of Rooms | Owner-occupied | Renter-occupied |
| 1 Room | 35 (1.9%) | 207 (12.0%) |
| 2 or 3 Rooms | 248 (13.5%) | 803 (46.7%) |
| 4 or 5 Rooms | 705 (38.2%) | 558 (32.5%) |
| 6 or 7 Rooms | 585 (31.7%) | 60 (3.5%) |
| 8 or more Rooms | 271 (14.7%) | 90 (5.2%) |
| Total | 1,844 (100.0%) | 1,718 (100.0%) |
Housing Structure by Heating Type in Lahaina
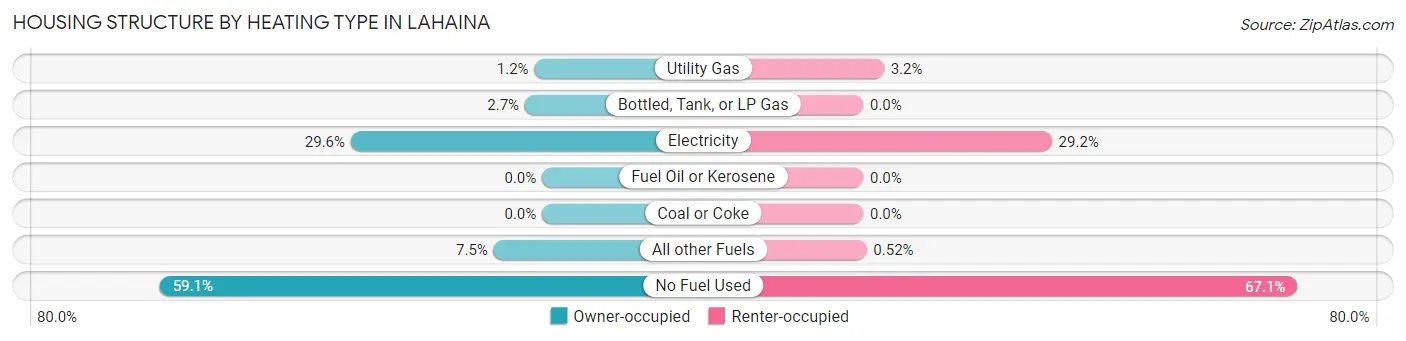
| Heating Type | Owner-occupied | Renter-occupied |
| Utility Gas | 22 (1.2%) | 55 (3.2%) |
| Bottled, Tank, or LP Gas | 49 (2.7%) | 0 (0.0%) |
| Electricity | 545 (29.6%) | 501 (29.2%) |
| Fuel Oil or Kerosene | 0 (0.0%) | 0 (0.0%) |
| Coal or Coke | 0 (0.0%) | 0 (0.0%) |
| All other Fuels | 138 (7.5%) | 9 (0.5%) |
| No Fuel Used | 1,090 (59.1%) | 1,153 (67.1%) |
| Total | 1,844 (100.0%) | 1,718 (100.0%) |
Household Vehicle Usage in Lahaina
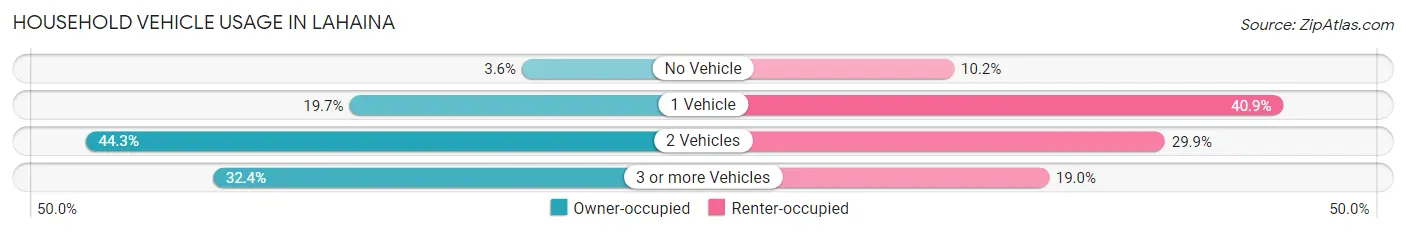
| Vehicles per Household | Owner-occupied | Renter-occupied |
| No Vehicle | 66 (3.6%) | 175 (10.2%) |
| 1 Vehicle | 363 (19.7%) | 703 (40.9%) |
| 2 Vehicles | 817 (44.3%) | 513 (29.9%) |
| 3 or more Vehicles | 598 (32.4%) | 327 (19.0%) |
| Total | 1,844 (100.0%) | 1,718 (100.0%) |
Real Estate & Mortgages in Lahaina
Real Estate and Mortgage Overview in Lahaina
| Characteristic | Without Mortgage | With Mortgage |
| Housing Units | 437 | 1,407 |
| Median Property Value | $777,600 | $815,400 |
| Median Household Income | $82,557 | $613 |
| Monthly Housing Costs | $471 | $627 |
| Real Estate Taxes | $1,226 | $129 |
Property Value by Mortgage Status in Lahaina
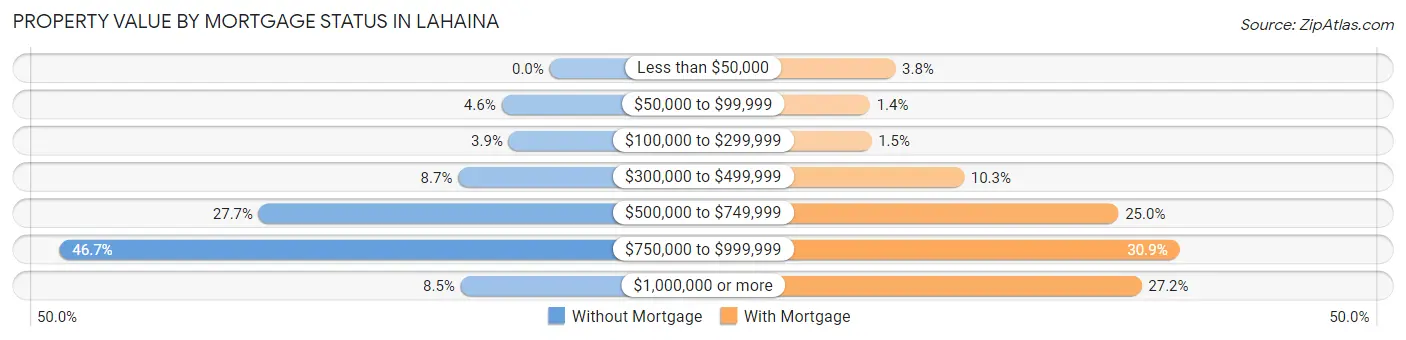
| Property Value | Without Mortgage | With Mortgage |
| Less than $50,000 | 0 (0.0%) | 53 (3.8%) |
| $50,000 to $99,999 | 20 (4.6%) | 19 (1.3%) |
| $100,000 to $299,999 | 17 (3.9%) | 21 (1.5%) |
| $300,000 to $499,999 | 38 (8.7%) | 145 (10.3%) |
| $500,000 to $749,999 | 121 (27.7%) | 352 (25.0%) |
| $750,000 to $999,999 | 204 (46.7%) | 434 (30.8%) |
| $1,000,000 or more | 37 (8.5%) | 383 (27.2%) |
| Total | 437 (100.0%) | 1,407 (100.0%) |
Household Income by Mortgage Status in Lahaina
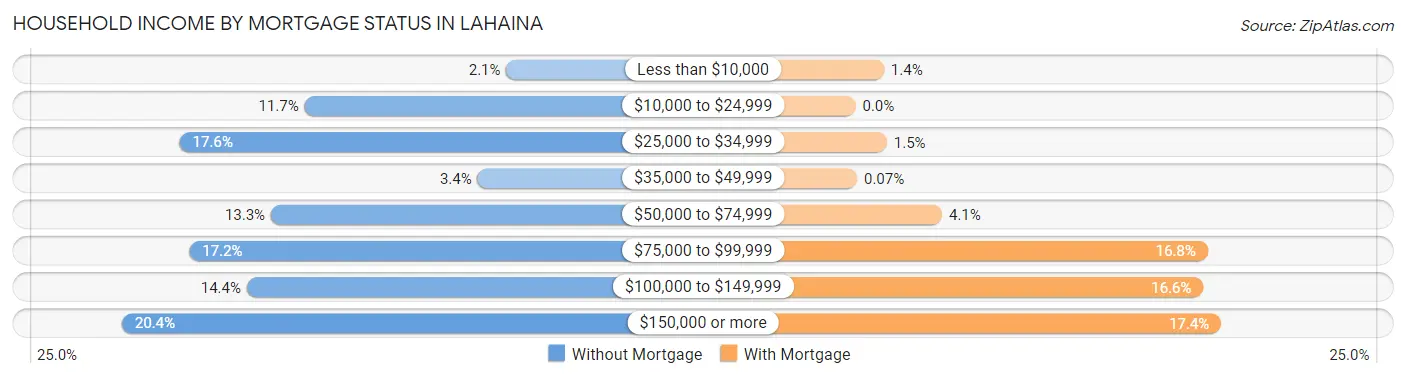
| Household Income | Without Mortgage | With Mortgage |
| Less than $10,000 | 9 (2.1%) | 19 (1.3%) |
| $10,000 to $24,999 | 51 (11.7%) | 0 (0.0%) |
| $25,000 to $34,999 | 77 (17.6%) | 21 (1.5%) |
| $35,000 to $49,999 | 15 (3.4%) | 1 (0.1%) |
| $50,000 to $74,999 | 58 (13.3%) | 58 (4.1%) |
| $75,000 to $99,999 | 75 (17.2%) | 236 (16.8%) |
| $100,000 to $149,999 | 63 (14.4%) | 233 (16.6%) |
| $150,000 or more | 89 (20.4%) | 245 (17.4%) |
| Total | 437 (100.0%) | 1,407 (100.0%) |
Property Value to Household Income Ratio in Lahaina
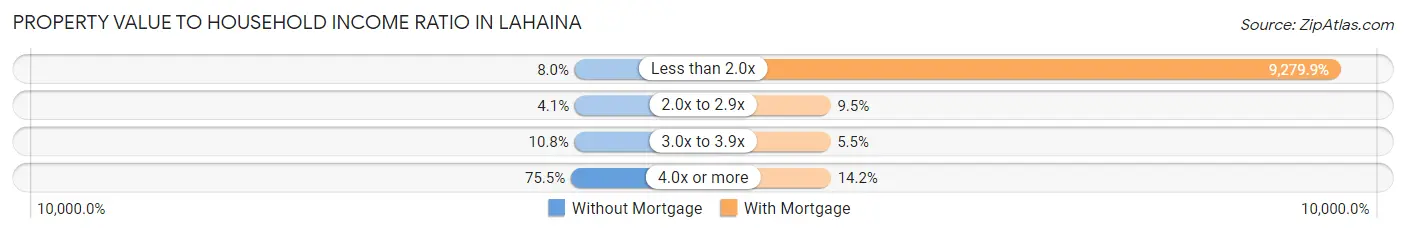
| Value-to-Income Ratio | Without Mortgage | With Mortgage |
| Less than 2.0x | 35 (8.0%) | 130,568 (9,279.9%) |
| 2.0x to 2.9x | 18 (4.1%) | 134 (9.5%) |
| 3.0x to 3.9x | 47 (10.8%) | 77 (5.5%) |
| 4.0x or more | 330 (75.5%) | 200 (14.2%) |
| Total | 437 (100.0%) | 1,407 (100.0%) |
Real Estate Taxes by Mortgage Status in Lahaina
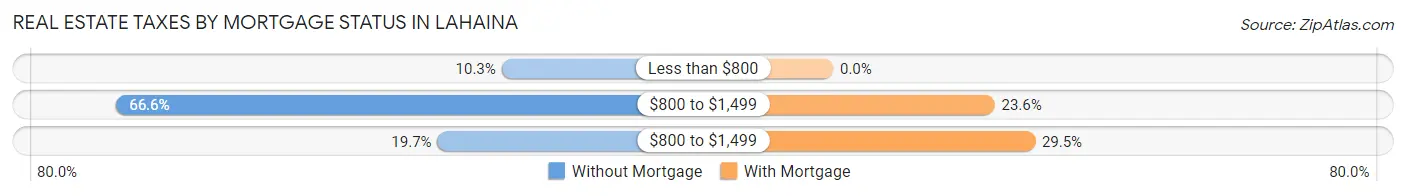
| Property Taxes | Without Mortgage | With Mortgage |
| Less than $800 | 45 (10.3%) | 0 (0.0%) |
| $800 to $1,499 | 291 (66.6%) | 332 (23.6%) |
| $800 to $1,499 | 86 (19.7%) | 415 (29.5%) |
| Total | 437 (100.0%) | 1,407 (100.0%) |
Health & Disability in Lahaina
Health Insurance Coverage by Age in Lahaina
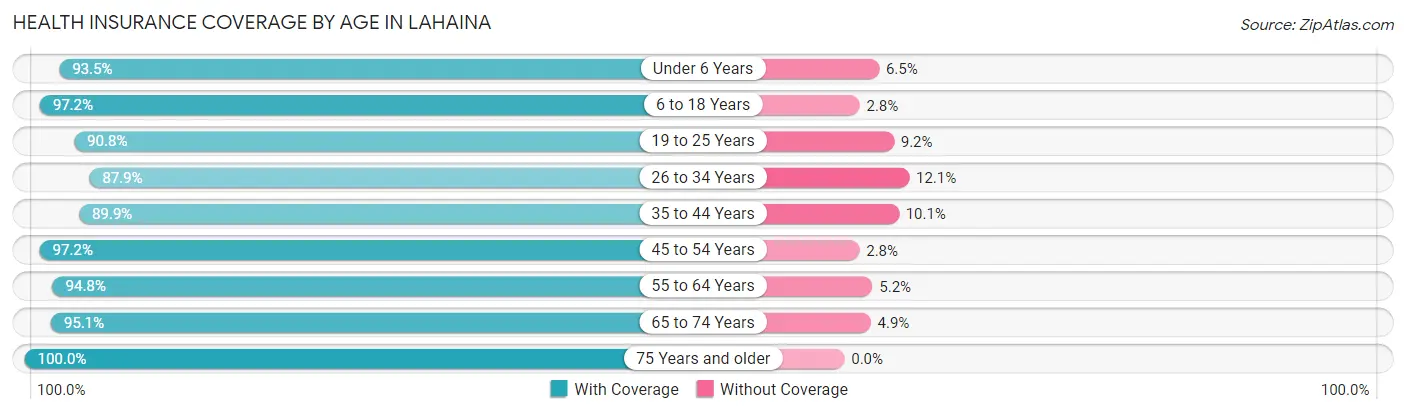
| Age Bracket | With Coverage | Without Coverage |
| Under 6 Years | 1,101 (93.5%) | 76 (6.5%) |
| 6 to 18 Years | 1,848 (97.2%) | 54 (2.8%) |
| 19 to 25 Years | 787 (90.8%) | 80 (9.2%) |
| 26 to 34 Years | 1,450 (87.9%) | 199 (12.1%) |
| 35 to 44 Years | 1,728 (89.9%) | 195 (10.1%) |
| 45 to 54 Years | 1,422 (97.2%) | 41 (2.8%) |
| 55 to 64 Years | 1,632 (94.8%) | 90 (5.2%) |
| 65 to 74 Years | 1,338 (95.1%) | 69 (4.9%) |
| 75 Years and older | 754 (100.0%) | 0 (0.0%) |
| Total | 12,060 (93.8%) | 804 (6.2%) |
Health Insurance Coverage by Citizenship Status in Lahaina
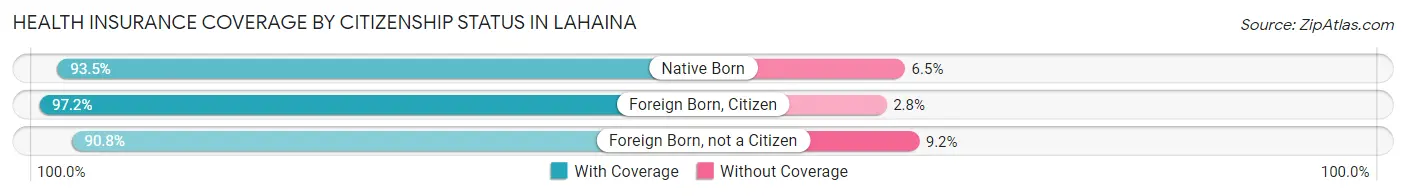
| Citizenship Status | With Coverage | Without Coverage |
| Native Born | 1,101 (93.5%) | 76 (6.5%) |
| Foreign Born, Citizen | 1,848 (97.2%) | 54 (2.8%) |
| Foreign Born, not a Citizen | 787 (90.8%) | 80 (9.2%) |
Health Insurance Coverage by Household Income in Lahaina
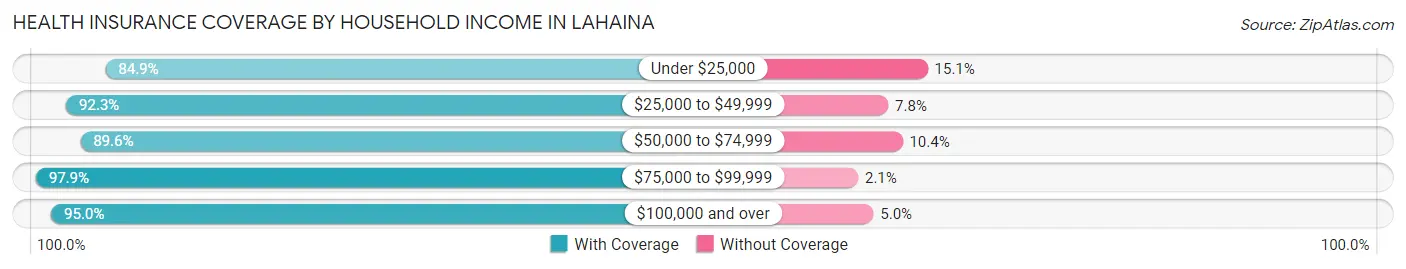
| Household Income | With Coverage | Without Coverage |
| Under $25,000 | 555 (84.9%) | 99 (15.1%) |
| $25,000 to $49,999 | 1,250 (92.2%) | 105 (7.7%) |
| $50,000 to $74,999 | 1,993 (89.6%) | 232 (10.4%) |
| $75,000 to $99,999 | 1,809 (97.9%) | 39 (2.1%) |
| $100,000 and over | 6,136 (95.0%) | 321 (5.0%) |
Public vs Private Health Insurance Coverage by Age in Lahaina
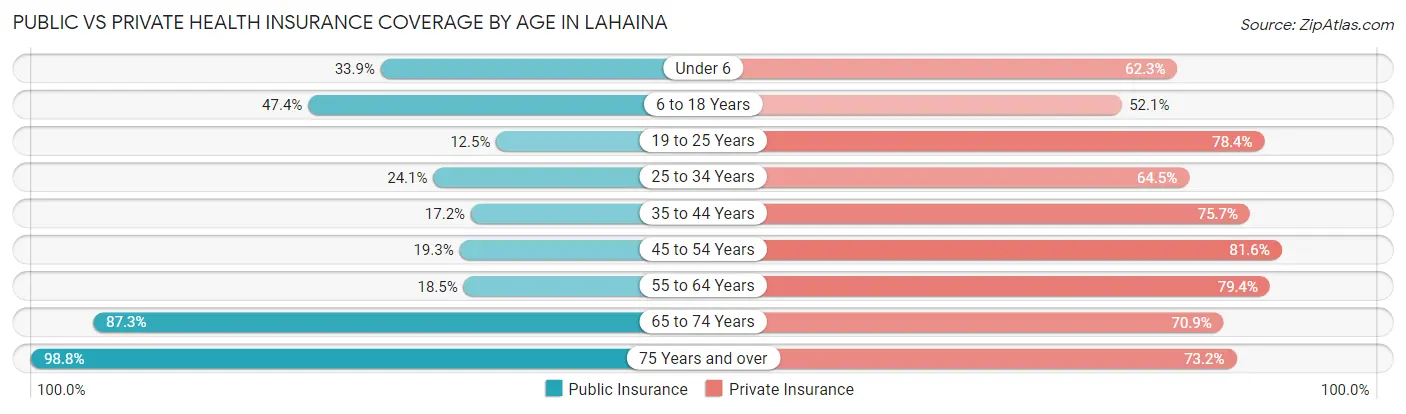
| Age Bracket | Public Insurance | Private Insurance |
| Under 6 | 399 (33.9%) | 733 (62.3%) |
| 6 to 18 Years | 901 (47.4%) | 990 (52.0%) |
| 19 to 25 Years | 108 (12.5%) | 680 (78.4%) |
| 25 to 34 Years | 398 (24.1%) | 1,063 (64.5%) |
| 35 to 44 Years | 330 (17.2%) | 1,456 (75.7%) |
| 45 to 54 Years | 282 (19.3%) | 1,194 (81.6%) |
| 55 to 64 Years | 319 (18.5%) | 1,368 (79.4%) |
| 65 to 74 Years | 1,228 (87.3%) | 997 (70.9%) |
| 75 Years and over | 745 (98.8%) | 552 (73.2%) |
| Total | 4,710 (36.6%) | 9,033 (70.2%) |
Disability Status by Sex by Age in Lahaina
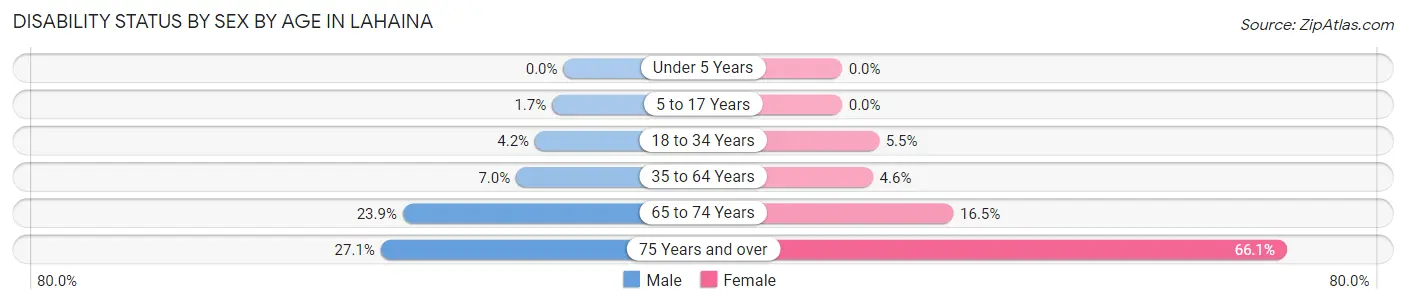
| Age Bracket | Male | Female |
| Under 5 Years | 0 (0.0%) | 0 (0.0%) |
| 5 to 17 Years | 18 (1.7%) | 0 (0.0%) |
| 18 to 34 Years | 56 (4.2%) | 72 (5.5%) |
| 35 to 64 Years | 187 (7.0%) | 112 (4.6%) |
| 65 to 74 Years | 161 (23.8%) | 121 (16.5%) |
| 75 Years and over | 67 (27.1%) | 335 (66.1%) |
Disability Class by Sex by Age in Lahaina
Disability Class: Hearing Difficulty
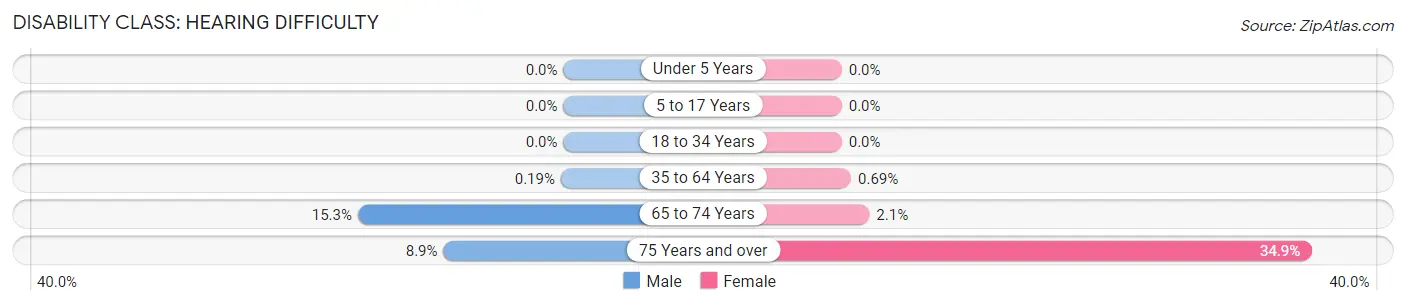
| Age Bracket | Male | Female |
| Under 5 Years | 0 (0.0%) | 0 (0.0%) |
| 5 to 17 Years | 0 (0.0%) | 0 (0.0%) |
| 18 to 34 Years | 0 (0.0%) | 0 (0.0%) |
| 35 to 64 Years | 5 (0.2%) | 17 (0.7%) |
| 65 to 74 Years | 103 (15.3%) | 15 (2.1%) |
| 75 Years and over | 22 (8.9%) | 177 (34.9%) |
Disability Class: Vision Difficulty
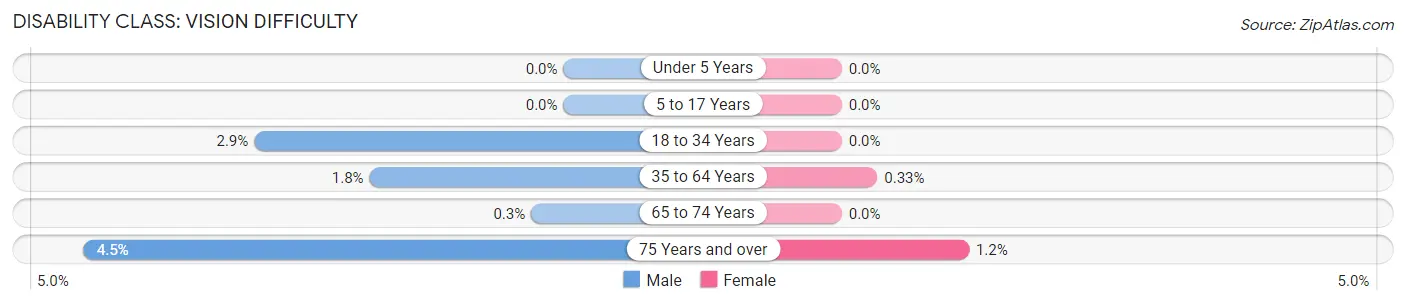
| Age Bracket | Male | Female |
| Under 5 Years | 0 (0.0%) | 0 (0.0%) |
| 5 to 17 Years | 0 (0.0%) | 0 (0.0%) |
| 18 to 34 Years | 38 (2.9%) | 0 (0.0%) |
| 35 to 64 Years | 48 (1.8%) | 8 (0.3%) |
| 65 to 74 Years | 2 (0.3%) | 0 (0.0%) |
| 75 Years and over | 11 (4.4%) | 6 (1.2%) |
Disability Class: Cognitive Difficulty
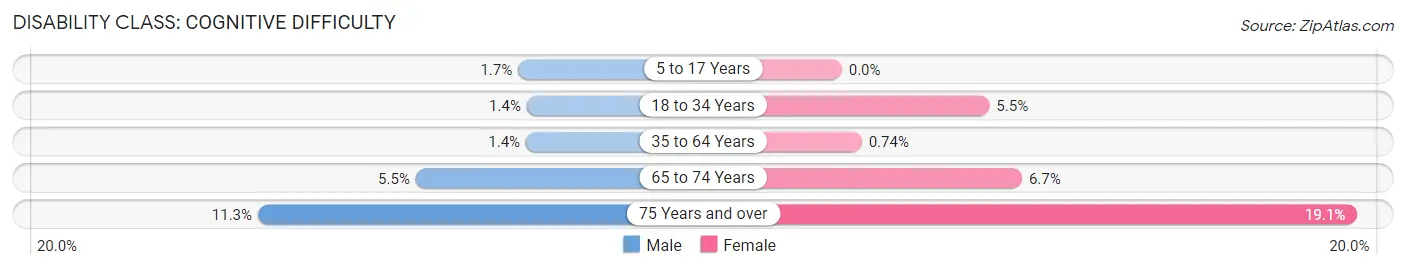
| Age Bracket | Male | Female |
| 5 to 17 Years | 18 (1.7%) | 0 (0.0%) |
| 18 to 34 Years | 18 (1.4%) | 72 (5.5%) |
| 35 to 64 Years | 37 (1.4%) | 18 (0.7%) |
| 65 to 74 Years | 37 (5.5%) | 49 (6.7%) |
| 75 Years and over | 28 (11.3%) | 97 (19.1%) |
Disability Class: Ambulatory Difficulty
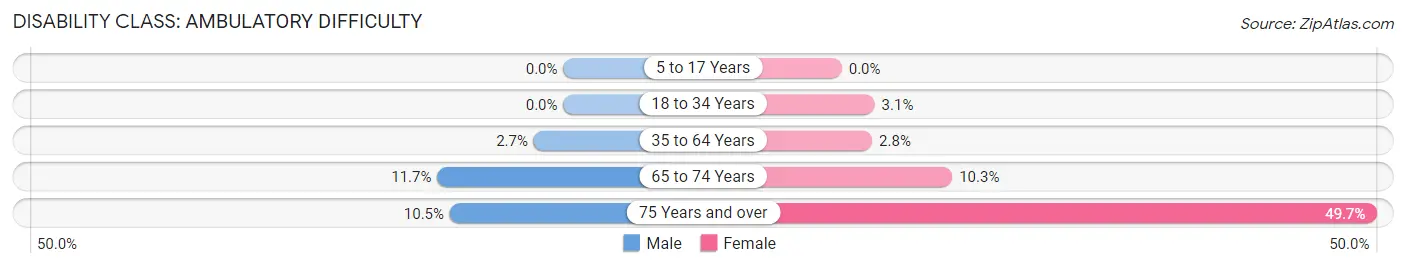
| Age Bracket | Male | Female |
| 5 to 17 Years | 0 (0.0%) | 0 (0.0%) |
| 18 to 34 Years | 0 (0.0%) | 40 (3.0%) |
| 35 to 64 Years | 73 (2.7%) | 69 (2.8%) |
| 65 to 74 Years | 79 (11.7%) | 75 (10.2%) |
| 75 Years and over | 26 (10.5%) | 252 (49.7%) |
Disability Class: Self-Care Difficulty
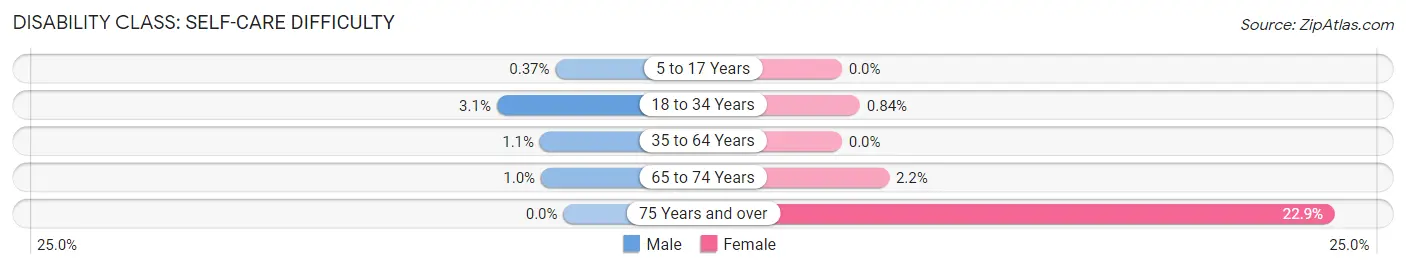
| Age Bracket | Male | Female |
| 5 to 17 Years | 4 (0.4%) | 0 (0.0%) |
| 18 to 34 Years | 41 (3.1%) | 11 (0.8%) |
| 35 to 64 Years | 29 (1.1%) | 0 (0.0%) |
| 65 to 74 Years | 7 (1.0%) | 16 (2.2%) |
| 75 Years and over | 0 (0.0%) | 116 (22.9%) |
Technology Access in Lahaina
Computing Device Access in Lahaina
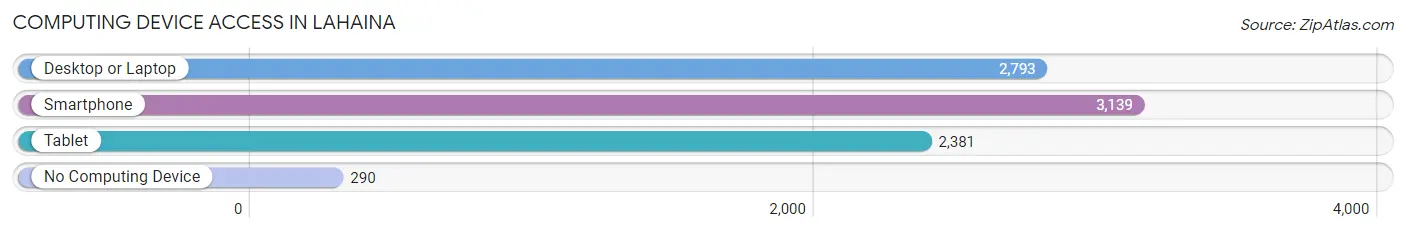
| Device Type | # Households | % Households |
| Desktop or Laptop | 2,793 | 78.4% |
| Smartphone | 3,139 | 88.1% |
| Tablet | 2,381 | 66.8% |
| No Computing Device | 290 | 8.1% |
| Total | 3,562 | 100.0% |
Internet Access in Lahaina
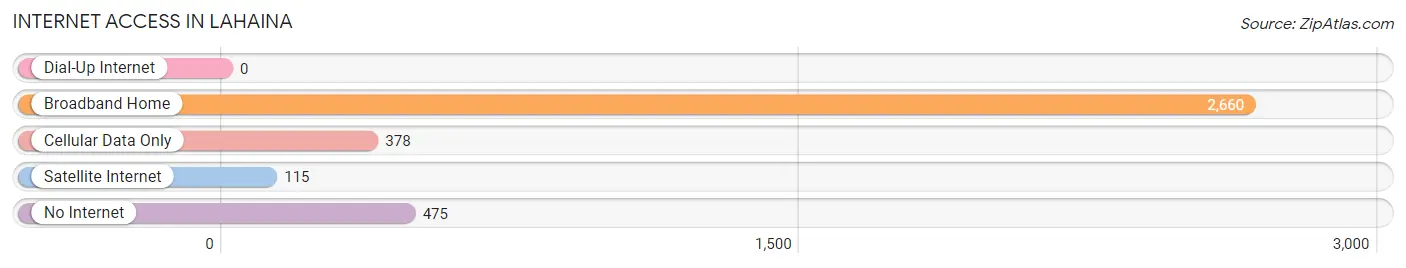
| Internet Type | # Households | % Households |
| Dial-Up Internet | 0 | 0.0% |
| Broadband Home | 2,660 | 74.7% |
| Cellular Data Only | 378 | 10.6% |
| Satellite Internet | 115 | 3.2% |
| No Internet | 475 | 13.3% |
| Total | 3,562 | 100.0% |
Lahaina Summary
Lahaina is a small town located on the western side of the Hawaiian island of Maui. It is the former capital of the Kingdom of Hawaii and is now a popular tourist destination. The town is known for its historic sites, beautiful beaches, and vibrant nightlife.
History
Lahaina has a long and rich history. It was first settled by Polynesian voyagers in the 13th century and was later occupied by the Hawaiian monarchy in the late 18th century. The town was the capital of the Kingdom of Hawaii from 1820 to 1845 and was a major whaling port in the 19th century. During this time, Lahaina was a bustling port town with a large population of sailors, merchants, and whalers.
In the late 19th century, Lahaina began to decline as the whaling industry declined and the Hawaiian monarchy was overthrown. The town was largely abandoned until the 1950s when it began to experience a resurgence as a tourist destination. Today, Lahaina is a popular tourist destination and is home to many historic sites, museums, and cultural attractions.
Geography
Lahaina is located on the western side of the Hawaiian island of Maui. It is situated on the north shore of the island, between the towns of Kaanapali and Kapalua. The town is bordered by the Pacific Ocean to the west and the Auau Channel to the east. The town is located at an elevation of about 10 feet above sea level.
The climate in Lahaina is tropical and humid, with temperatures ranging from the mid-70s to the mid-80s Fahrenheit throughout the year. The town receives an average of about 10 inches of rain per year.
Economy
The economy of Lahaina is largely driven by tourism. The town is home to many resorts, restaurants, and other tourist attractions. The town is also home to a number of art galleries, museums, and cultural attractions.
The town is also home to a number of small businesses, including shops, restaurants, and other services. The town is also home to a number of marinas and boat charters, which provide access to the nearby islands and waters.
Demographics
As of the 2010 census, the population of Lahaina was 11,704. The town is predominantly white, with about 75% of the population identifying as white. The town is also home to a large Native Hawaiian population, with about 20% of the population identifying as Native Hawaiian. The town is also home to a small Asian population, with about 4% of the population identifying as Asian.
The median household income in Lahaina is $63,945, and the median home value is $717,000. The town has a high cost of living, with the average rent for a one-bedroom apartment being $1,800 per month. The town also has a high unemployment rate, with about 8% of the population being unemployed.
Common Questions
What is Per Capita Income in Lahaina?
Per Capita income in Lahaina is $34,615.
What is the Median Family Income in Lahaina?
Median Family Income in Lahaina is $86,000.
What is the Median Household income in Lahaina?
Median Household Income in Lahaina is $83,443.
What is Income or Wage Gap in Lahaina?
Income or Wage Gap in Lahaina is 17.3%.
Women in Lahaina earn 82.7 cents for every dollar earned by a man.
What is Inequality or Gini Index in Lahaina?
Inequality or Gini Index in Lahaina is 0.42.
What is the Total Population of Lahaina?
Total Population of Lahaina is 12,906.
What is the Total Male Population of Lahaina?
Total Male Population of Lahaina is 6,550.
What is the Total Female Population of Lahaina?
Total Female Population of Lahaina is 6,356.
What is the Ratio of Males per 100 Females in Lahaina?
There are 103.05 Males per 100 Females in Lahaina.
What is the Ratio of Females per 100 Males in Lahaina?
There are 97.04 Females per 100 Males in Lahaina.
What is the Median Population Age in Lahaina?
Median Population Age in Lahaina is 38.7 Years.
What is the Average Family Size in Lahaina
Average Family Size in Lahaina is 3.8 People.
What is the Average Household Size in Lahaina
Average Household Size in Lahaina is 3.5 People.
How Large is the Labor Force in Lahaina?
There are 7,581 People in the Labor Forcein in Lahaina.
What is the Percentage of People in the Labor Force in Lahaina?
73.2% of People are in the Labor Force in Lahaina.
What is the Unemployment Rate in Lahaina?
Unemployment Rate in Lahaina is 5.7%.