Farmington, UT Map & Demographics
Farmington Map
Farmington Overview
$42,021
PER CAPITA INCOME
$126,578
AVG FAMILY INCOME
$115,278
AVG HOUSEHOLD INCOME
65.1%
WAGE / INCOME GAP [ % ]
34.9¢/ $1
WAGE / INCOME GAP [ $ ]
0.41
INEQUALITY / GINI INDEX
24,463
TOTAL POPULATION
12,601
MALE POPULATION
11,862
FEMALE POPULATION
106.23
MALES / 100 FEMALES
94.14
FEMALES / 100 MALES
30.1
MEDIAN AGE
4.0
AVG FAMILY SIZE
3.5
AVG HOUSEHOLD SIZE
10,809
LABOR FORCE [ PEOPLE ]
64.5%
PERCENT IN LABOR FORCE
2.2%
UNEMPLOYMENT RATE
Farmington Zip Codes
Income in Farmington
Income Overview in Farmington
Per Capita Income in Farmington is $42,021, while median incomes of families and households are $126,578 and $115,278 respectively.
| Characteristic | Number | Measure |
| Per Capita Income | 24,463 | $42,021 |
| Median Family Income | 5,515 | $126,578 |
| Mean Family Income | 5,515 | $158,614 |
| Median Household Income | 6,890 | $115,278 |
| Mean Household Income | 6,890 | $143,043 |
| Income Deficit | 5,515 | $0 |
| Wage / Income Gap (%) | 24,463 | 65.10% |
| Wage / Income Gap ($) | 24,463 | 34.90¢ per $1 |
| Gini / Inequality Index | 24,463 | 0.41 |
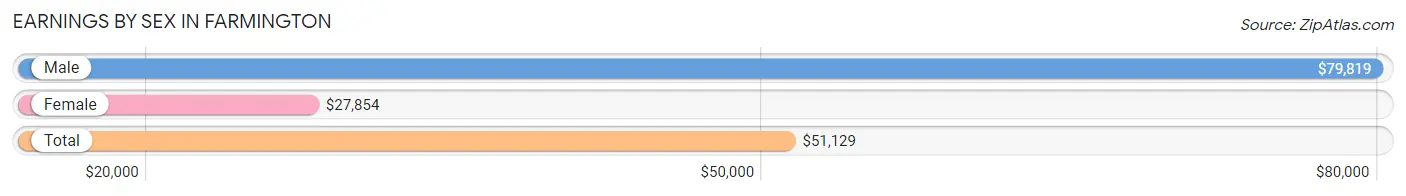
Earnings by Sex in Farmington
Average Earnings in Farmington are $51,129, $79,819 for men and $27,854 for women, a difference of 65.1%.
| Sex | Number | Average Earnings |
| Male | 6,697 (56.5%) | $79,819 |
| Female | 5,149 (43.5%) | $27,854 |
| Total | 11,846 (100.0%) | $51,129 |
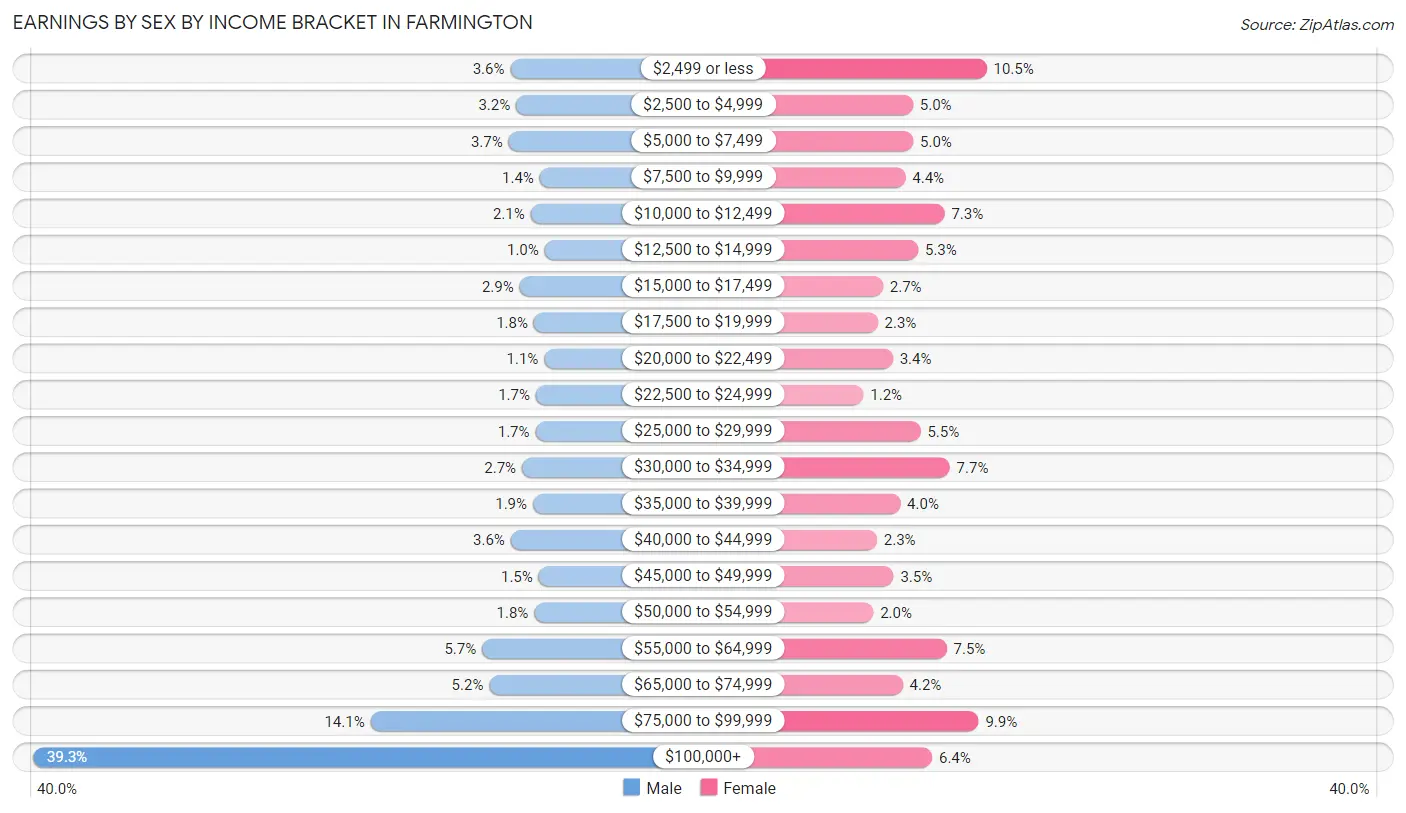
Earnings by Sex by Income Bracket in Farmington
The most common earnings brackets in Farmington are $100,000+ for men (2,632 | 39.3%) and $2,499 or less for women (539 | 10.5%).
| Income | Male | Female |
| $2,499 or less | 241 (3.6%) | 539 (10.5%) |
| $2,500 to $4,999 | 212 (3.2%) | 255 (5.0%) |
| $5,000 to $7,499 | 250 (3.7%) | 256 (5.0%) |
| $7,500 to $9,999 | 94 (1.4%) | 226 (4.4%) |
| $10,000 to $12,499 | 139 (2.1%) | 377 (7.3%) |
| $12,500 to $14,999 | 69 (1.0%) | 275 (5.3%) |
| $15,000 to $17,499 | 195 (2.9%) | 139 (2.7%) |
| $17,500 to $19,999 | 123 (1.8%) | 119 (2.3%) |
| $20,000 to $22,499 | 71 (1.1%) | 177 (3.4%) |
| $22,500 to $24,999 | 113 (1.7%) | 64 (1.2%) |
| $25,000 to $29,999 | 115 (1.7%) | 284 (5.5%) |
| $30,000 to $34,999 | 183 (2.7%) | 397 (7.7%) |
| $35,000 to $39,999 | 128 (1.9%) | 206 (4.0%) |
| $40,000 to $44,999 | 239 (3.6%) | 116 (2.2%) |
| $45,000 to $49,999 | 99 (1.5%) | 180 (3.5%) |
| $50,000 to $54,999 | 121 (1.8%) | 102 (2.0%) |
| $55,000 to $64,999 | 383 (5.7%) | 385 (7.5%) |
| $65,000 to $74,999 | 347 (5.2%) | 215 (4.2%) |
| $75,000 to $99,999 | 943 (14.1%) | 508 (9.9%) |
| $100,000+ | 2,632 (39.3%) | 329 (6.4%) |
| Total | 6,697 (100.0%) | 5,149 (100.0%) |
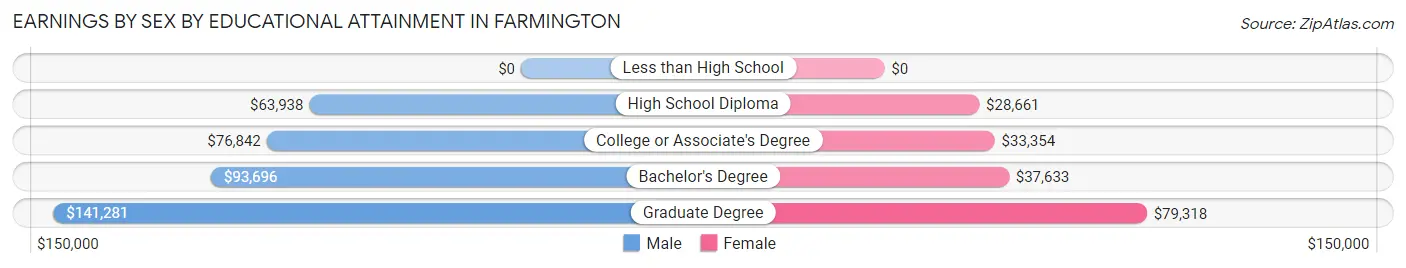
Earnings by Sex by Educational Attainment in Farmington
Average earnings in Farmington are $94,973 for men and $34,667 for women, a difference of 63.5%. Men with an educational attainment of graduate degree enjoy the highest average annual earnings of $141,281, while those with high school diploma education earn the least with $63,938. Women with an educational attainment of graduate degree earn the most with the average annual earnings of $79,318, while those with high school diploma education have the smallest earnings of $28,661.
| Educational Attainment | Male Income | Female Income |
| Less than High School | - | - |
| High School Diploma | $63,938 | $28,661 |
| College or Associate's Degree | $76,842 | $33,354 |
| Bachelor's Degree | $93,696 | $37,633 |
| Graduate Degree | $141,281 | $79,318 |
| Total | $94,973 | $34,667 |
Family Income in Farmington
Family Income Brackets in Farmington
According to the Farmington family income data, there are 1,660 families falling into the $100,000 to $149,999 income range, which is the most common income bracket and makes up 30.1% of all families. Conversely, the $10,000 to $14,999 income bracket is the least frequent group with only 28 families (0.5%) belonging to this category.
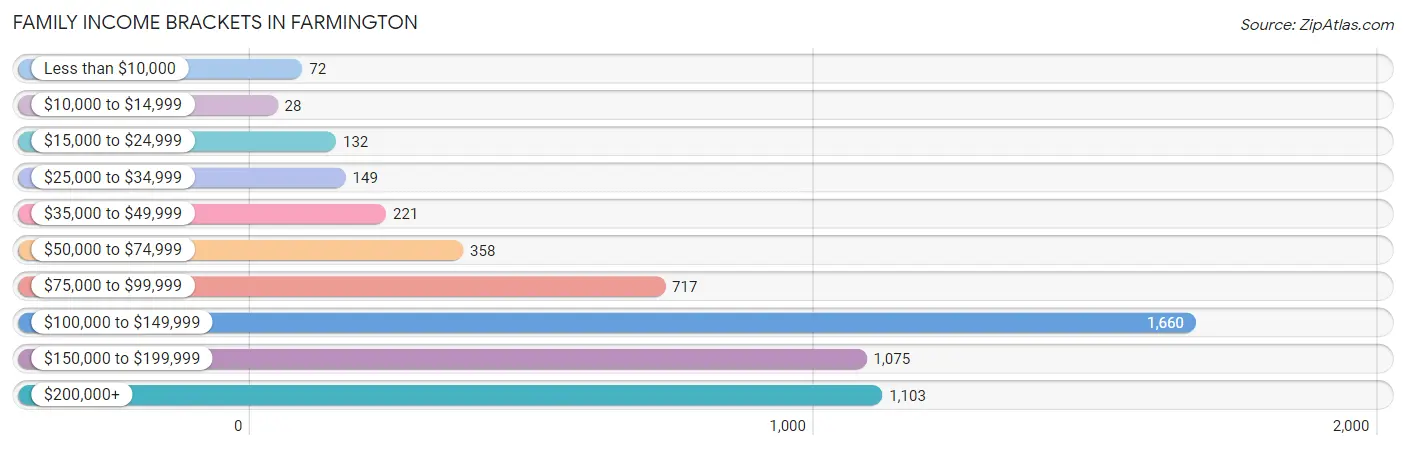
| Income Bracket | # Families | % Families |
| Less than $10,000 | 72 | 1.3% |
| $10,000 to $14,999 | 28 | 0.5% |
| $15,000 to $24,999 | 132 | 2.4% |
| $25,000 to $34,999 | 149 | 2.7% |
| $35,000 to $49,999 | 221 | 4.0% |
| $50,000 to $74,999 | 358 | 6.5% |
| $75,000 to $99,999 | 717 | 13.0% |
| $100,000 to $149,999 | 1,660 | 30.1% |
| $150,000 to $199,999 | 1,075 | 19.5% |
| $200,000+ | 1,103 | 20.0% |
Family Income by Famaliy Size in Farmington
7+ person families (273 | 5.0%) account for the highest median family income in Farmington with $232,578 per family, while 2-person families (1,747 | 31.7%) have the highest median income of $54,788 per family member.
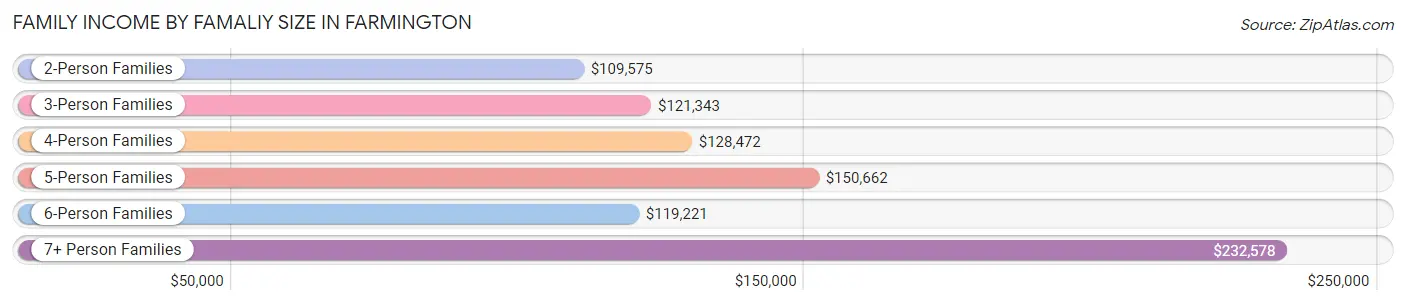
| Income Bracket | # Families | Median Income |
| 2-Person Families | 1,747 (31.7%) | $109,575 |
| 3-Person Families | 707 (12.8%) | $121,343 |
| 4-Person Families | 873 (15.8%) | $128,472 |
| 5-Person Families | 1,261 (22.9%) | $150,662 |
| 6-Person Families | 654 (11.9%) | $119,221 |
| 7+ Person Families | 273 (5.0%) | $232,578 |
| Total | 5,515 (100.0%) | $126,578 |
Family Income by Number of Earners in Farmington
The median family income in Farmington is $126,578, with families comprising 3+ earners (1,215) having the highest median family income of $164,327, while families with no earners (553) have the lowest median family income of $74,875, accounting for 22.0% and 10.0% of families, respectively.
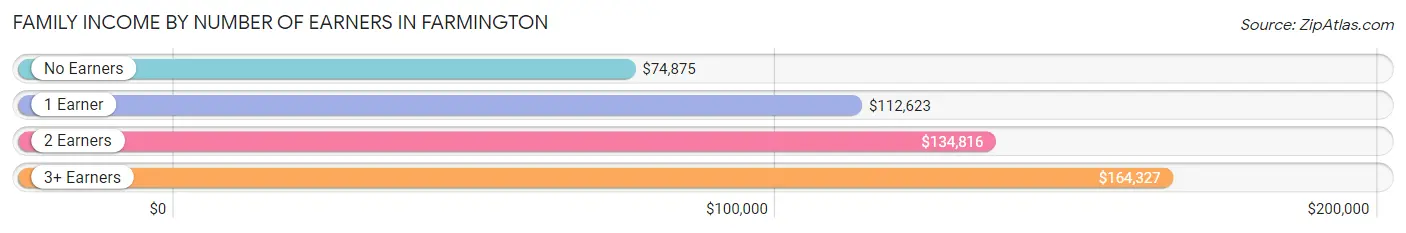
| Number of Earners | # Families | Median Income |
| No Earners | 553 (10.0%) | $74,875 |
| 1 Earner | 1,642 (29.8%) | $112,623 |
| 2 Earners | 2,105 (38.2%) | $134,816 |
| 3+ Earners | 1,215 (22.0%) | $164,327 |
| Total | 5,515 (100.0%) | $126,578 |
Household Income in Farmington
Household Income Brackets in Farmington
With 1,881 households falling in the category, the $100,000 to $149,999 income range is the most frequent in Farmington, accounting for 27.3% of all households. In contrast, only 110 households (1.6%) fall into the less than $10,000 income bracket, making it the least populous group.
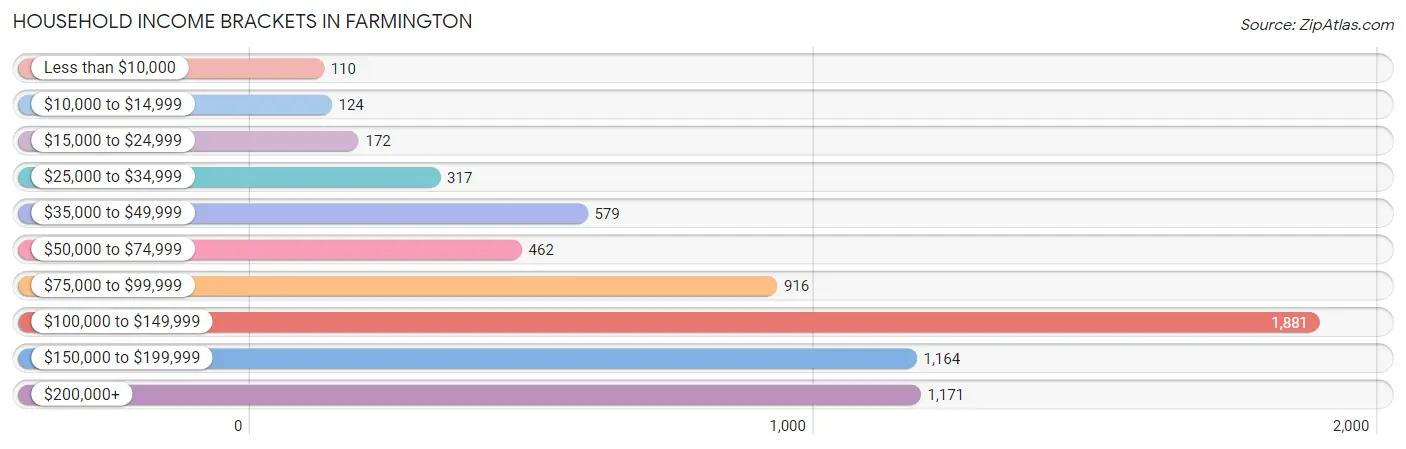
| Income Bracket | # Households | % Households |
| Less than $10,000 | 110 | 1.6% |
| $10,000 to $14,999 | 124 | 1.8% |
| $15,000 to $24,999 | 172 | 2.5% |
| $25,000 to $34,999 | 317 | 4.6% |
| $35,000 to $49,999 | 579 | 8.4% |
| $50,000 to $74,999 | 462 | 6.7% |
| $75,000 to $99,999 | 916 | 13.3% |
| $100,000 to $149,999 | 1,881 | 27.3% |
| $150,000 to $199,999 | 1,164 | 16.9% |
| $200,000+ | 1,171 | 17.0% |
Household Income by Householder Age in Farmington
The median household income in Farmington is $115,278, with the highest median household income of $152,594 found in the 45 to 64 years age bracket for the primary householder. A total of 2,258 households (32.8%) fall into this category. Meanwhile, the 15 to 24 years age bracket for the primary householder has the lowest median household income of $42,222, with 218 households (3.2%) in this group.
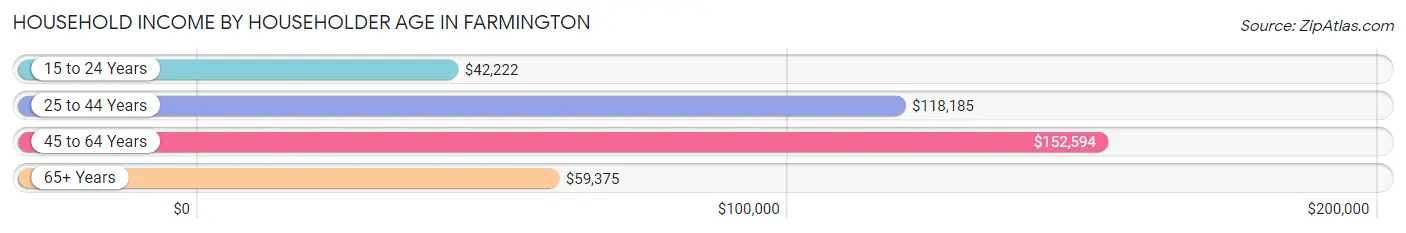
| Income Bracket | # Households | Median Income |
| 15 to 24 Years | 218 (3.2%) | $42,222 |
| 25 to 44 Years | 2,946 (42.8%) | $118,185 |
| 45 to 64 Years | 2,258 (32.8%) | $152,594 |
| 65+ Years | 1,468 (21.3%) | $59,375 |
| Total | 6,890 (100.0%) | $115,278 |
Poverty in Farmington
Income Below Poverty by Sex and Age in Farmington
With 5.4% poverty level for males and 4.0% for females among the residents of Farmington, 15 year old males and 75 year old and over females are the most vulnerable to poverty, with 78 males (20.4%) and 53 females (12.8%) in their respective age groups living below the poverty level.
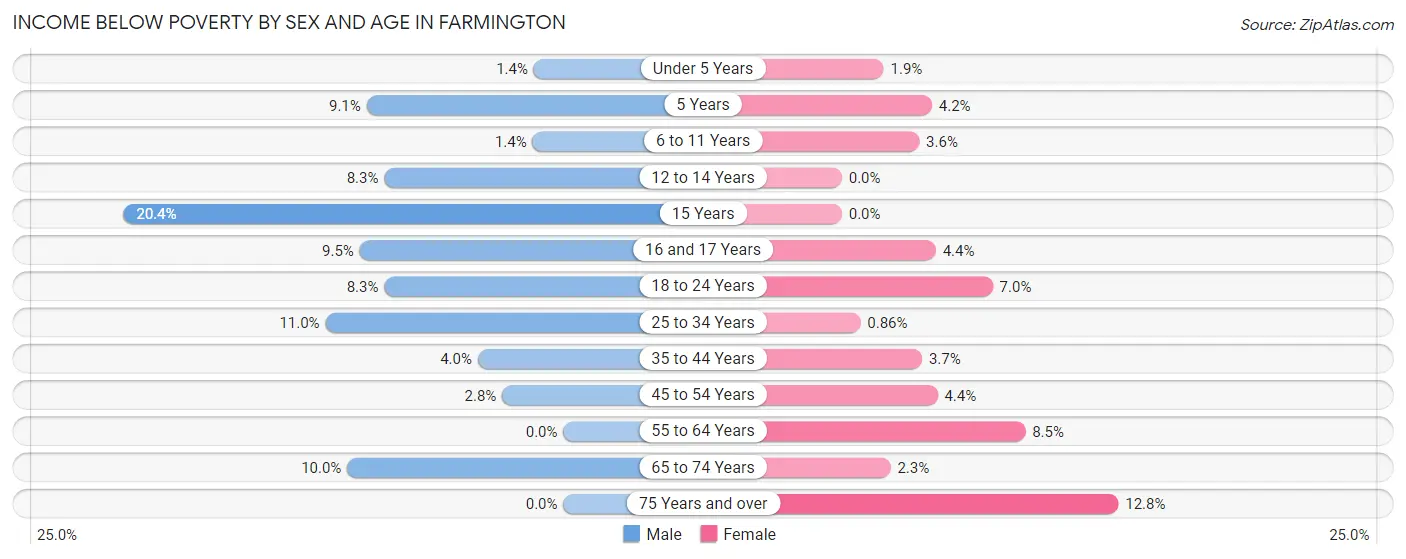
| Age Bracket | Male | Female |
| Under 5 Years | 15 (1.4%) | 14 (1.9%) |
| 5 Years | 20 (9.1%) | 13 (4.2%) |
| 6 to 11 Years | 25 (1.4%) | 53 (3.6%) |
| 12 to 14 Years | 73 (8.3%) | 0 (0.0%) |
| 15 Years | 78 (20.4%) | 0 (0.0%) |
| 16 and 17 Years | 45 (9.5%) | 24 (4.4%) |
| 18 to 24 Years | 86 (8.3%) | 79 (7.0%) |
| 25 to 34 Years | 124 (11.0%) | 12 (0.9%) |
| 35 to 44 Years | 79 (4.0%) | 72 (3.7%) |
| 45 to 54 Years | 37 (2.8%) | 48 (4.4%) |
| 55 to 64 Years | 0 (0.0%) | 80 (8.5%) |
| 65 to 74 Years | 67 (10.0%) | 20 (2.3%) |
| 75 Years and over | 0 (0.0%) | 53 (12.8%) |
| Total | 649 (5.4%) | 468 (4.0%) |
Income Above Poverty by Sex and Age in Farmington
According to the poverty statistics in Farmington, males aged 55 to 64 years and females aged 12 to 14 years are the age groups that are most secure financially, with 100.0% of males and 100.0% of females in these age groups living above the poverty line.
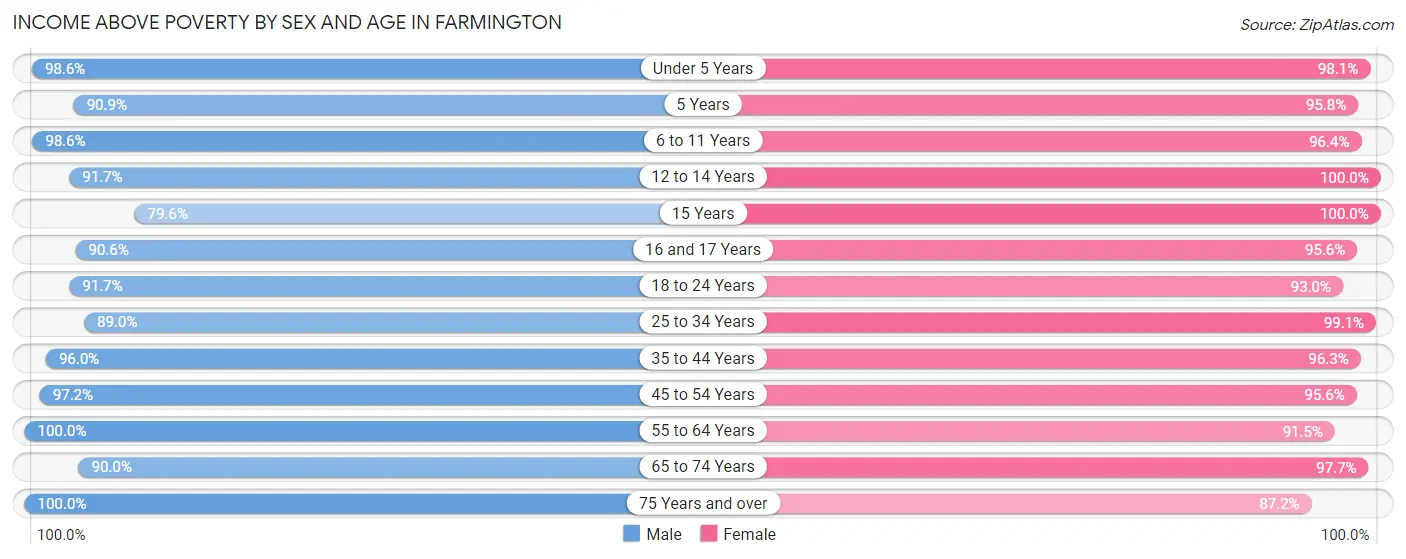
| Age Bracket | Male | Female |
| Under 5 Years | 1,078 (98.6%) | 709 (98.1%) |
| 5 Years | 199 (90.9%) | 298 (95.8%) |
| 6 to 11 Years | 1,720 (98.6%) | 1,424 (96.4%) |
| 12 to 14 Years | 805 (91.7%) | 749 (100.0%) |
| 15 Years | 304 (79.6%) | 128 (100.0%) |
| 16 and 17 Years | 431 (90.5%) | 526 (95.6%) |
| 18 to 24 Years | 949 (91.7%) | 1,049 (93.0%) |
| 25 to 34 Years | 999 (89.0%) | 1,390 (99.1%) |
| 35 to 44 Years | 1,913 (96.0%) | 1,863 (96.3%) |
| 45 to 54 Years | 1,264 (97.2%) | 1,032 (95.6%) |
| 55 to 64 Years | 726 (100.0%) | 860 (91.5%) |
| 65 to 74 Years | 601 (90.0%) | 866 (97.7%) |
| 75 Years and over | 430 (100.0%) | 360 (87.2%) |
| Total | 11,419 (94.6%) | 11,254 (96.0%) |
Income Below Poverty Among Married-Couple Families in Farmington
The poverty statistics for married-couple families in Farmington show that 3.4% or 169 of the total 4,980 families live below the poverty line. Families with 1 or 2 children have the highest poverty rate of 3.6%, comprising of 48 families. On the other hand, families with 5 or more children have the lowest poverty rate of 0.0%, which includes 0 families.
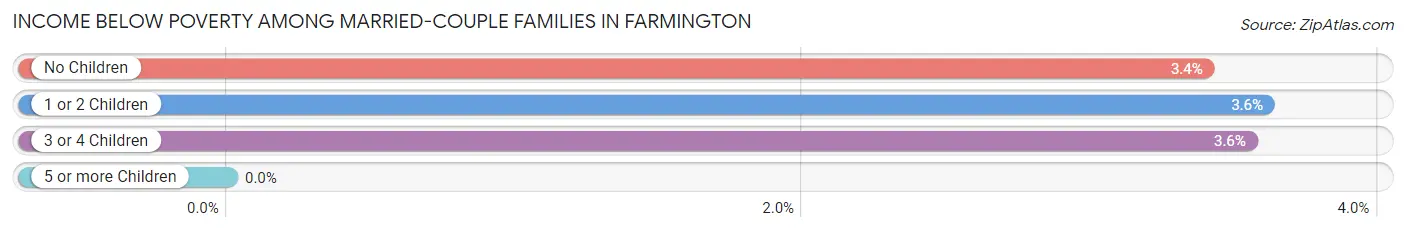
| Children | Above Poverty | Below Poverty |
| No Children | 1,986 (96.6%) | 70 (3.4%) |
| 1 or 2 Children | 1,280 (96.4%) | 48 (3.6%) |
| 3 or 4 Children | 1,387 (96.5%) | 51 (3.5%) |
| 5 or more Children | 158 (100.0%) | 0 (0.0%) |
| Total | 4,811 (96.6%) | 169 (3.4%) |
Income Below Poverty Among Single-Parent Households in Farmington
According to the poverty data in Farmington, 15.2% or 12 single-father households and 11.6% or 53 single-mother households are living below the poverty line. Among single-father households, those with no children have the highest poverty rate, with 12 households (25.5%) experiencing poverty. Likewise, among single-mother households, those with 3 or 4 children have the highest poverty rate, with 25 households (59.5%) falling below the poverty line.
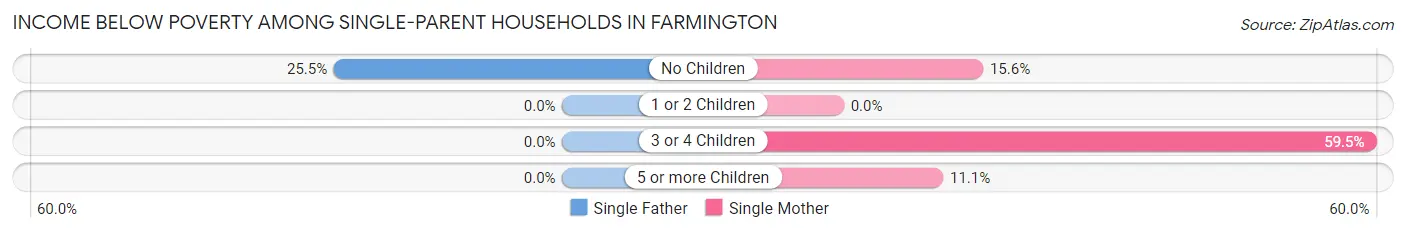
| Children | Single Father | Single Mother |
| No Children | 12 (25.5%) | 26 (15.6%) |
| 1 or 2 Children | 0 (0.0%) | 0 (0.0%) |
| 3 or 4 Children | 0 (0.0%) | 25 (59.5%) |
| 5 or more Children | 0 (0.0%) | 2 (11.1%) |
| Total | 12 (15.2%) | 53 (11.6%) |
Income Below Poverty Among Married-Couple vs Single-Parent Households in Farmington
The poverty data for Farmington shows that 169 of the married-couple family households (3.4%) and 65 of the single-parent households (12.1%) are living below the poverty level. Within the married-couple family households, those with 1 or 2 children have the highest poverty rate, with 48 households (3.6%) falling below the poverty line. Among the single-parent households, those with 3 or 4 children have the highest poverty rate, with 25 household (56.8%) living below poverty.
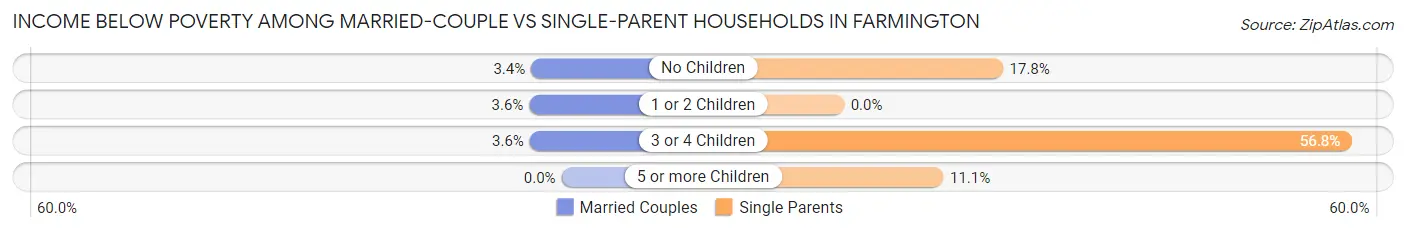
| Children | Married-Couple Families | Single-Parent Households |
| No Children | 70 (3.4%) | 38 (17.8%) |
| 1 or 2 Children | 48 (3.6%) | 0 (0.0%) |
| 3 or 4 Children | 51 (3.5%) | 25 (56.8%) |
| 5 or more Children | 0 (0.0%) | 2 (11.1%) |
| Total | 169 (3.4%) | 65 (12.1%) |
Race in Farmington
The most populous races in Farmington are White / Caucasian (22,326 | 91.3%), Hispanic or Latino (1,562 | 6.4%), and Two or more Races (1,169 | 4.8%).
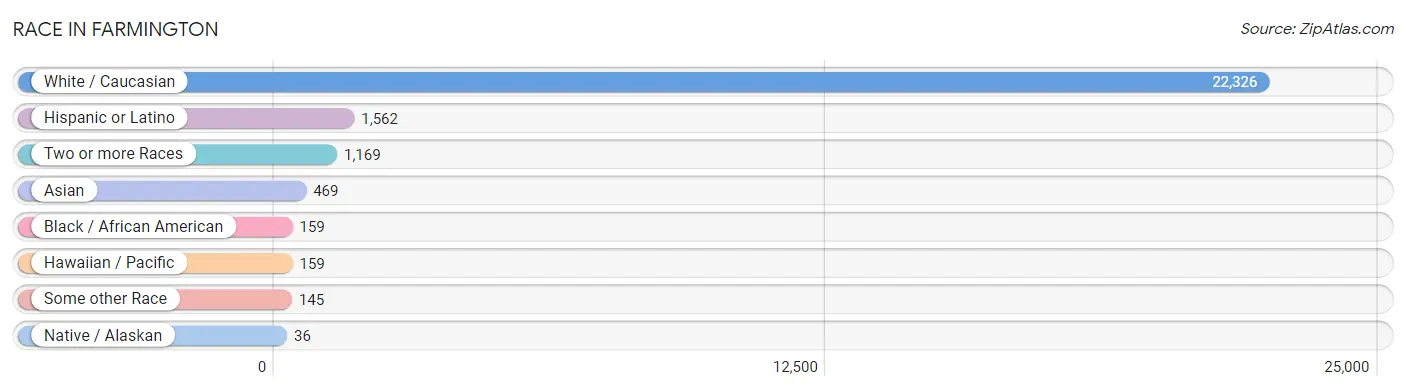
| Race | # Population | % Population |
| Asian | 469 | 1.9% |
| Black / African American | 159 | 0.6% |
| Hawaiian / Pacific | 159 | 0.6% |
| Hispanic or Latino | 1,562 | 6.4% |
| Native / Alaskan | 36 | 0.2% |
| White / Caucasian | 22,326 | 91.3% |
| Two or more Races | 1,169 | 4.8% |
| Some other Race | 145 | 0.6% |
| Total | 24,463 | 100.0% |
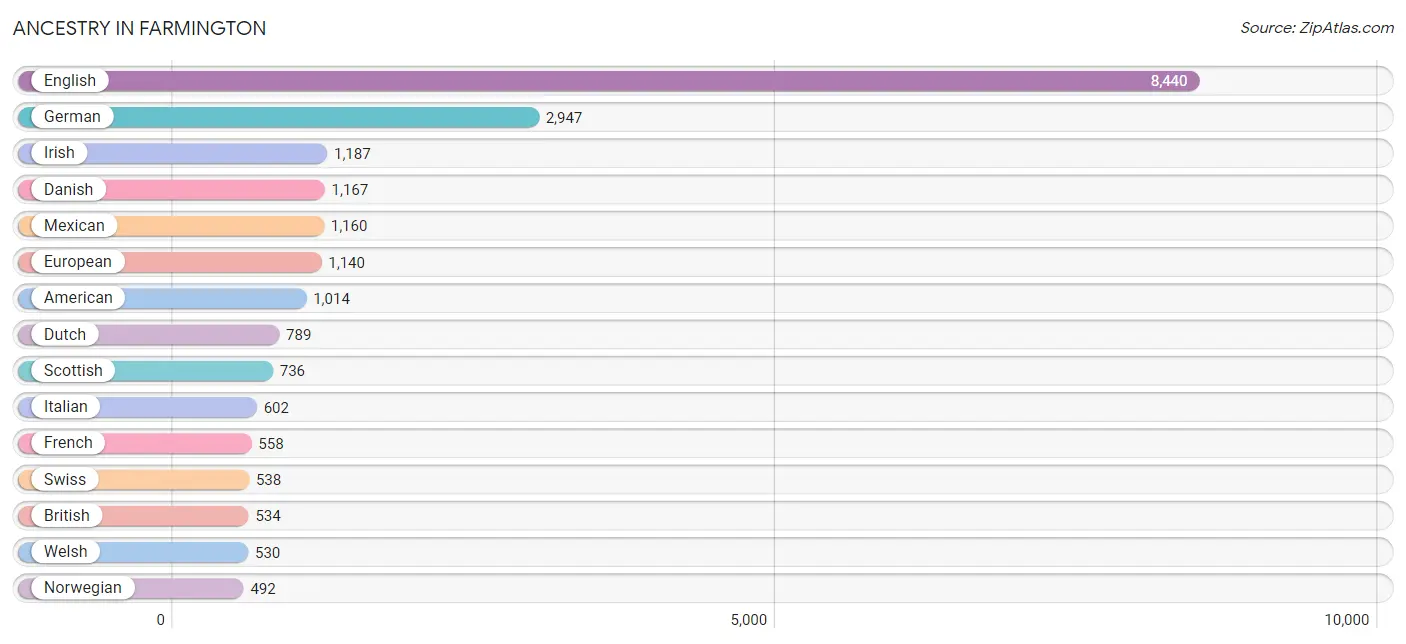
Ancestry in Farmington
The most populous ancestries reported in Farmington are English (8,440 | 34.5%), German (2,947 | 12.0%), Irish (1,187 | 4.9%), Danish (1,167 | 4.8%), and Mexican (1,160 | 4.7%), together accounting for 60.9% of all Farmington residents.
| Ancestry | # Population | % Population |
| American | 1,014 | 4.2% |
| Arab | 30 | 0.1% |
| Argentinean | 4 | 0.0% |
| Armenian | 216 | 0.9% |
| Australian | 10 | 0.0% |
| Austrian | 10 | 0.0% |
| Belgian | 58 | 0.2% |
| Bhutanese | 92 | 0.4% |
| Brazilian | 7 | 0.0% |
| British | 534 | 2.2% |
| Burmese | 5 | 0.0% |
| Canadian | 152 | 0.6% |
| Central American | 136 | 0.6% |
| Cherokee | 7 | 0.0% |
| Chilean | 33 | 0.1% |
| Colombian | 17 | 0.1% |
| Croatian | 2 | 0.0% |
| Czech | 14 | 0.1% |
| Czechoslovakian | 6 | 0.0% |
| Danish | 1,167 | 4.8% |
| Dutch | 789 | 3.2% |
| Eastern European | 10 | 0.0% |
| English | 8,440 | 34.5% |
| European | 1,140 | 4.7% |
| Finnish | 39 | 0.2% |
| French | 558 | 2.3% |
| French Canadian | 56 | 0.2% |
| German | 2,947 | 12.0% |
| Greek | 45 | 0.2% |
| Guatemalan | 25 | 0.1% |
| Haitian | 9 | 0.0% |
| Icelander | 104 | 0.4% |
| Indian (Asian) | 118 | 0.5% |
| Inupiat | 15 | 0.1% |
| Iranian | 47 | 0.2% |
| Irish | 1,187 | 4.9% |
| Italian | 602 | 2.5% |
| Japanese | 205 | 0.8% |
| Korean | 336 | 1.4% |
| Lebanese | 30 | 0.1% |
| Mexican | 1,160 | 4.7% |
| Native Hawaiian | 26 | 0.1% |
| Navajo | 36 | 0.2% |
| Northern European | 39 | 0.2% |
| Norwegian | 492 | 2.0% |
| Pakistani | 8 | 0.0% |
| Pima | 18 | 0.1% |
| Polish | 289 | 1.2% |
| Puerto Rican | 24 | 0.1% |
| Russian | 31 | 0.1% |
| Salvadoran | 111 | 0.4% |
| Scandinavian | 447 | 1.8% |
| Scotch-Irish | 57 | 0.2% |
| Scottish | 736 | 3.0% |
| South American | 61 | 0.3% |
| Spaniard | 38 | 0.2% |
| Spanish | 105 | 0.4% |
| Sri Lankan | 51 | 0.2% |
| Swedish | 480 | 2.0% |
| Swiss | 538 | 2.2% |
| Tlingit-Haida | 9 | 0.0% |
| Tongan | 257 | 1.1% |
| Ukrainian | 5 | 0.0% |
| Venezuelan | 7 | 0.0% |
| Welsh | 530 | 2.2% |
| Yugoslavian | 12 | 0.1% | View All 66 Rows |
Immigrants in Farmington
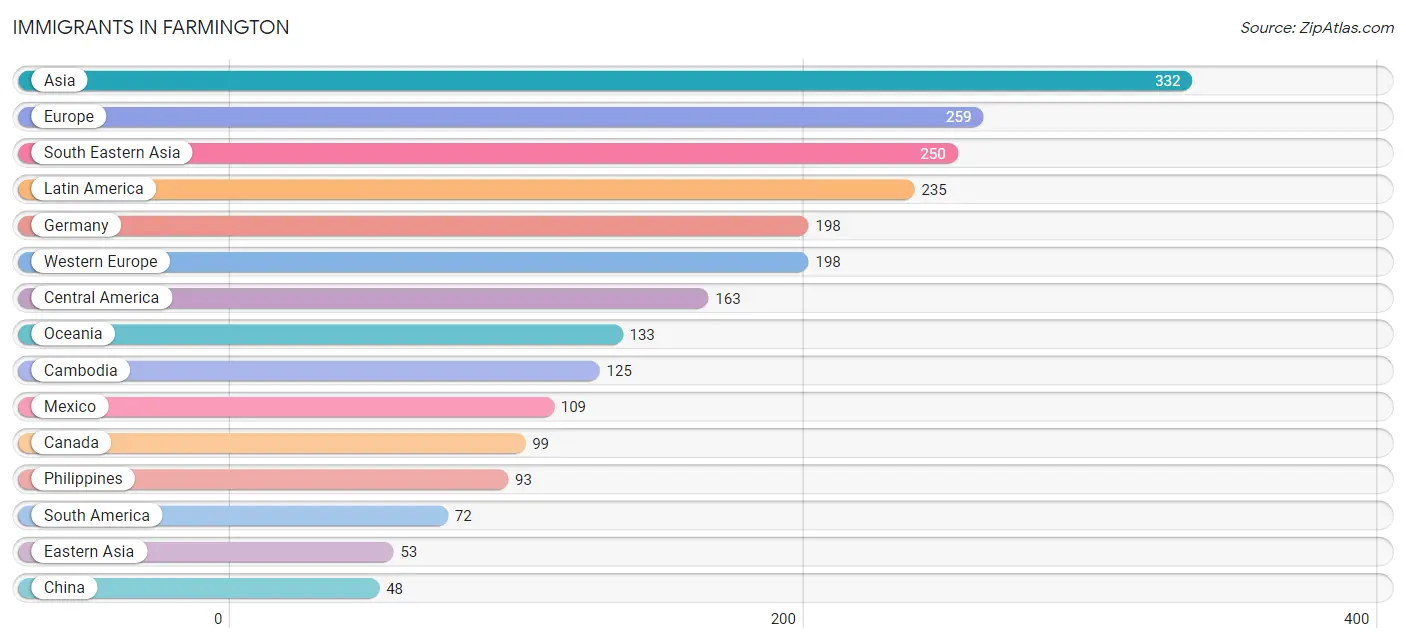
The most numerous immigrant groups reported in Farmington came from Asia (332 | 1.4%), Europe (259 | 1.1%), South Eastern Asia (250 | 1.0%), Latin America (235 | 1.0%), and Germany (198 | 0.8%), together accounting for 5.2% of all Farmington residents.
| Immigration Origin | # Population | % Population |
| Africa | 46 | 0.2% |
| Argentina | 32 | 0.1% |
| Asia | 332 | 1.4% |
| Brazil | 28 | 0.1% |
| Cambodia | 125 | 0.5% |
| Canada | 99 | 0.4% |
| Central America | 163 | 0.7% |
| Chile | 12 | 0.1% |
| China | 48 | 0.2% |
| Croatia | 2 | 0.0% |
| Eastern Asia | 53 | 0.2% |
| Eastern Europe | 2 | 0.0% |
| El Salvador | 29 | 0.1% |
| Europe | 259 | 1.1% |
| Germany | 198 | 0.8% |
| Guatemala | 25 | 0.1% |
| Hong Kong | 4 | 0.0% |
| Iran | 13 | 0.1% |
| Korea | 5 | 0.0% |
| Latin America | 235 | 1.0% |
| Mexico | 109 | 0.4% |
| Nepal | 16 | 0.1% |
| Northern Europe | 30 | 0.1% |
| Norway | 10 | 0.0% |
| Oceania | 133 | 0.5% |
| Philippines | 93 | 0.4% |
| South Africa | 46 | 0.2% |
| South America | 72 | 0.3% |
| South Central Asia | 29 | 0.1% |
| South Eastern Asia | 250 | 1.0% |
| Southern Europe | 29 | 0.1% |
| Spain | 29 | 0.1% |
| Thailand | 7 | 0.0% |
| Vietnam | 25 | 0.1% |
| Western Europe | 198 | 0.8% | View All 35 Rows |
Sex and Age in Farmington
Sex and Age in Farmington
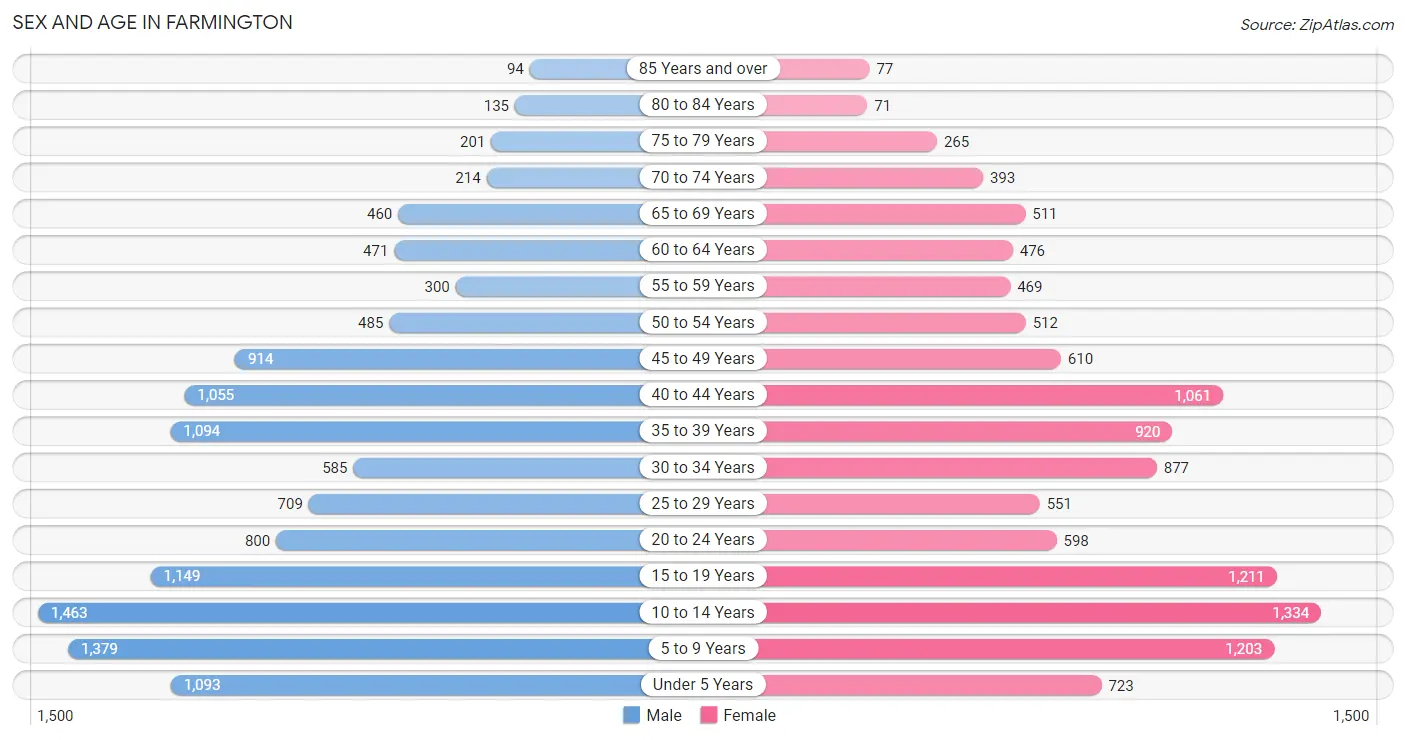
The most populous age groups in Farmington are 10 to 14 Years (1,463 | 11.6%) for men and 10 to 14 Years (1,334 | 11.3%) for women.
| Age Bracket | Male | Female |
| Under 5 Years | 1,093 (8.7%) | 723 (6.1%) |
| 5 to 9 Years | 1,379 (10.9%) | 1,203 (10.1%) |
| 10 to 14 Years | 1,463 (11.6%) | 1,334 (11.3%) |
| 15 to 19 Years | 1,149 (9.1%) | 1,211 (10.2%) |
| 20 to 24 Years | 800 (6.4%) | 598 (5.0%) |
| 25 to 29 Years | 709 (5.6%) | 551 (4.6%) |
| 30 to 34 Years | 585 (4.6%) | 877 (7.4%) |
| 35 to 39 Years | 1,094 (8.7%) | 920 (7.8%) |
| 40 to 44 Years | 1,055 (8.4%) | 1,061 (8.9%) |
| 45 to 49 Years | 914 (7.2%) | 610 (5.1%) |
| 50 to 54 Years | 485 (3.8%) | 512 (4.3%) |
| 55 to 59 Years | 300 (2.4%) | 469 (4.0%) |
| 60 to 64 Years | 471 (3.7%) | 476 (4.0%) |
| 65 to 69 Years | 460 (3.6%) | 511 (4.3%) |
| 70 to 74 Years | 214 (1.7%) | 393 (3.3%) |
| 75 to 79 Years | 201 (1.6%) | 265 (2.2%) |
| 80 to 84 Years | 135 (1.1%) | 71 (0.6%) |
| 85 Years and over | 94 (0.7%) | 77 (0.6%) |
| Total | 12,601 (100.0%) | 11,862 (100.0%) |
Families and Households in Farmington
Median Family Size in Farmington
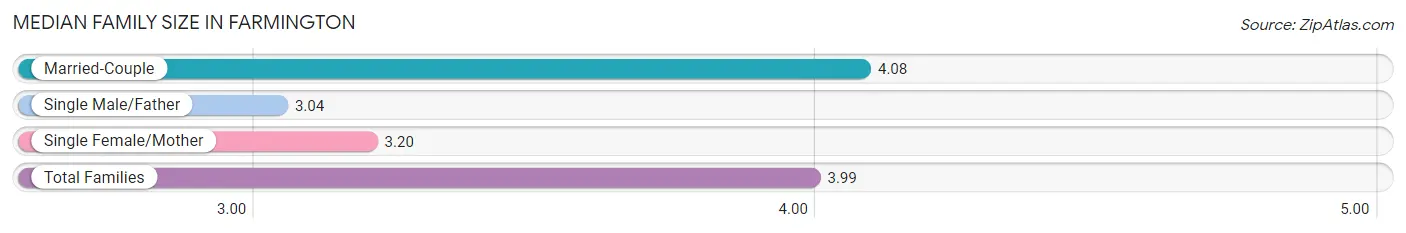
The median family size in Farmington is 3.99 persons per family, with married-couple families (4,980 | 90.3%) accounting for the largest median family size of 4.08 persons per family. On the other hand, single male/father families (79 | 1.4%) represent the smallest median family size with 3.04 persons per family.
| Family Type | # Families | Family Size |
| Married-Couple | 4,980 (90.3%) | 4.08 |
| Single Male/Father | 79 (1.4%) | 3.04 |
| Single Female/Mother | 456 (8.3%) | 3.20 |
| Total Families | 5,515 (100.0%) | 3.99 |
Median Household Size in Farmington
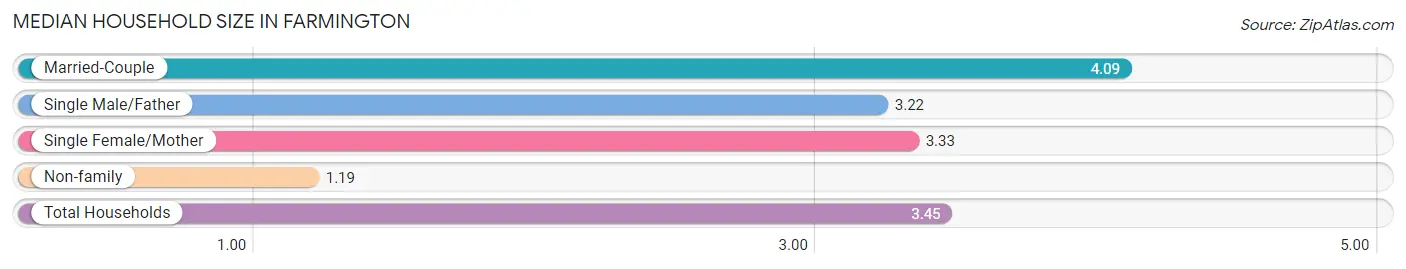
The median household size in Farmington is 3.45 persons per household, with married-couple households (4,980 | 72.3%) accounting for the largest median household size of 4.09 persons per household. non-family households (1,375 | 20.0%) represent the smallest median household size with 1.19 persons per household.
| Household Type | # Households | Household Size |
| Married-Couple | 4,980 (72.3%) | 4.09 |
| Single Male/Father | 79 (1.1%) | 3.22 |
| Single Female/Mother | 456 (6.6%) | 3.33 |
| Non-family | 1,375 (20.0%) | 1.19 |
| Total Households | 6,890 (100.0%) | 3.45 |
Household Size by Marriage Status in Farmington
Out of a total of 6,890 households in Farmington, 5,515 (80.0%) are family households, while 1,375 (20.0%) are nonfamily households. The most numerous type of family households are 2-person households, comprising 1,680, and the most common type of nonfamily households are 1-person households, comprising 1,214.
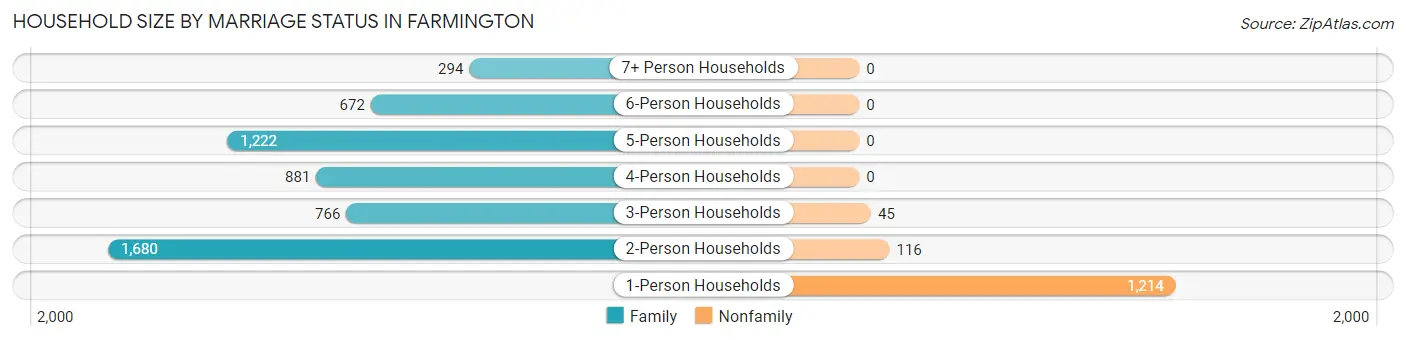
| Household Size | Family Households | Nonfamily Households |
| 1-Person Households | - | 1,214 (17.6%) |
| 2-Person Households | 1,680 (24.4%) | 116 (1.7%) |
| 3-Person Households | 766 (11.1%) | 45 (0.6%) |
| 4-Person Households | 881 (12.8%) | 0 (0.0%) |
| 5-Person Households | 1,222 (17.7%) | 0 (0.0%) |
| 6-Person Households | 672 (9.8%) | 0 (0.0%) |
| 7+ Person Households | 294 (4.3%) | 0 (0.0%) |
| Total | 5,515 (80.0%) | 1,375 (20.0%) |
Female Fertility in Farmington
Fertility by Age in Farmington
Average fertility rate in Farmington is 65.0 births per 1,000 women. Women in the age bracket of 20 to 34 years have the highest fertility rate with 142.0 births per 1,000 women. Women in the age bracket of 20 to 34 years acount for 74.0% of all women with births.
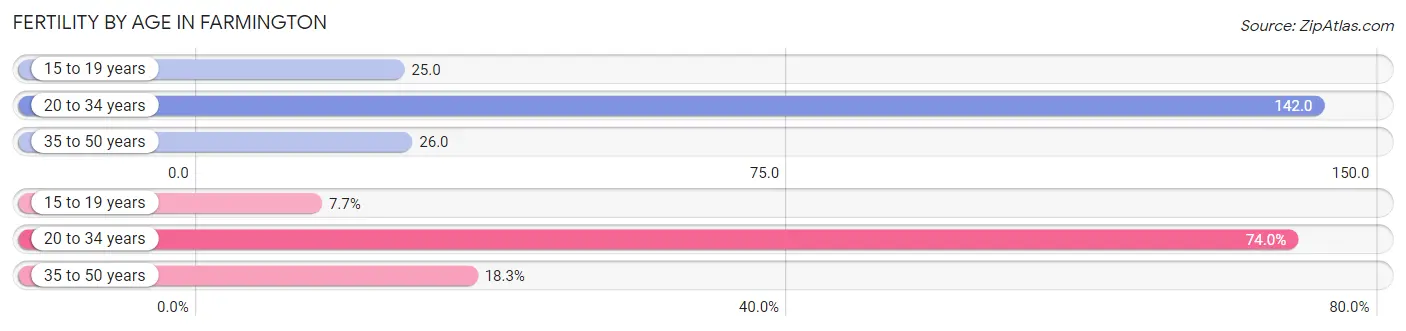
| Age Bracket | Women with Births | Births / 1,000 Women |
| 15 to 19 years | 30 (7.7%) | 25.0 |
| 20 to 34 years | 287 (74.0%) | 142.0 |
| 35 to 50 years | 71 (18.3%) | 26.0 |
| Total | 388 (100.0%) | 65.0 |
Fertility by Age by Marriage Status in Farmington
89.2% of women with births (388) in Farmington are married. The highest percentage of unmarried women with births falls into 15 to 19 years age bracket with 100.0% of them unmarried at the time of birth, while the lowest percentage of unmarried women with births belong to 35 to 50 years age bracket with 0.0% of them unmarried.
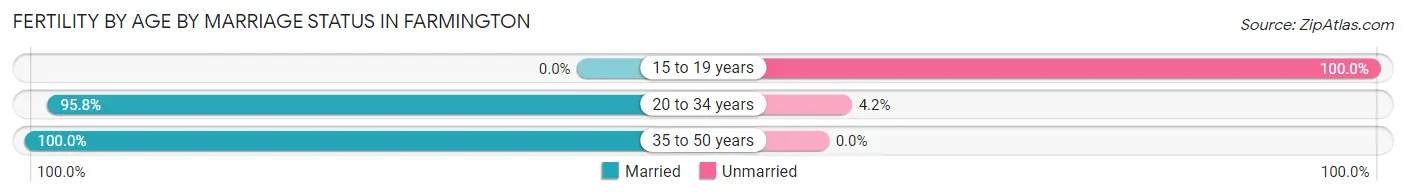
| Age Bracket | Married | Unmarried |
| 15 to 19 years | 0 (0.0%) | 30 (100.0%) |
| 20 to 34 years | 275 (95.8%) | 12 (4.2%) |
| 35 to 50 years | 71 (100.0%) | 0 (0.0%) |
| Total | 346 (89.2%) | 42 (10.8%) |
Fertility by Education in Farmington
Average fertility rate in Farmington is 65.0 births per 1,000 women. Women with the education attainment of bachelor's degree have the highest fertility rate of 133.0 births per 1,000 women, while women with the education attainment of high school diploma have the lowest fertility at 16.0 births per 1,000 women. Women with the education attainment of bachelor's degree represent 58.8% of all women with births.
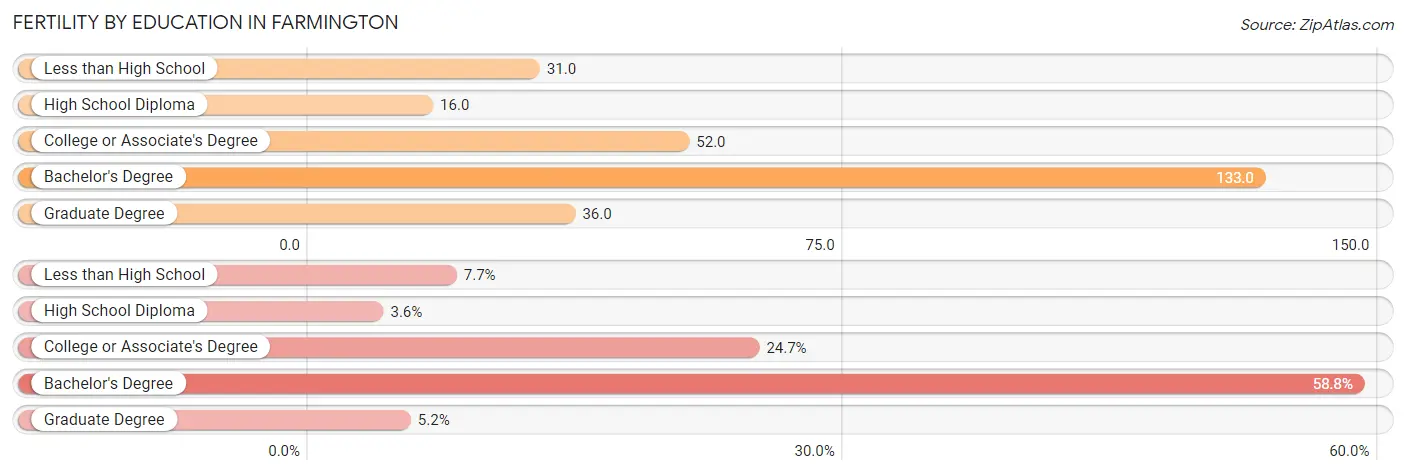
| Educational Attainment | Women with Births | Births / 1,000 Women |
| Less than High School | 30 (7.7%) | 31.0 |
| High School Diploma | 14 (3.6%) | 16.0 |
| College or Associate's Degree | 96 (24.7%) | 52.0 |
| Bachelor's Degree | 228 (58.8%) | 133.0 |
| Graduate Degree | 20 (5.1%) | 36.0 |
| Total | 388 (100.0%) | 65.0 |
Fertility by Education by Marriage Status in Farmington
10.8% of women with births in Farmington are unmarried. Women with the educational attainment of high school diploma are most likely to be married with 100.0% of them married at childbirth, while women with the educational attainment of less than high school are least likely to be married with 100.0% of them unmarried at childbirth.
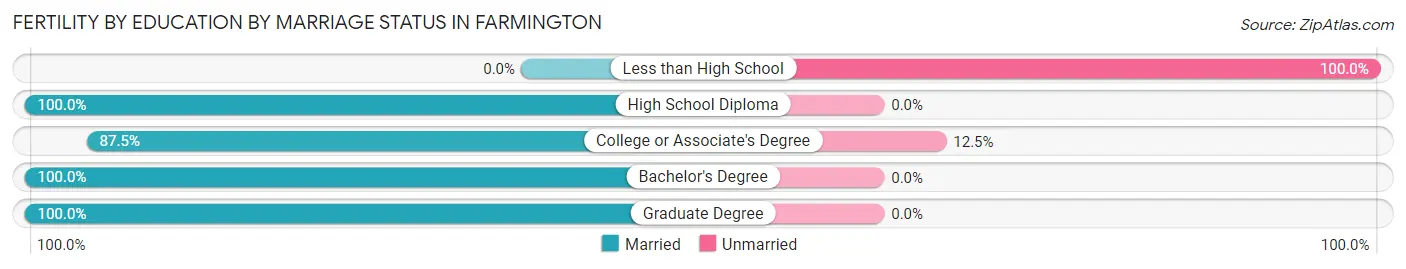
| Educational Attainment | Married | Unmarried |
| Less than High School | 0 (0.0%) | 30 (100.0%) |
| High School Diploma | 14 (100.0%) | 0 (0.0%) |
| College or Associate's Degree | 84 (87.5%) | 12 (12.5%) |
| Bachelor's Degree | 228 (100.0%) | 0 (0.0%) |
| Graduate Degree | 20 (100.0%) | 0 (0.0%) |
| Total | 346 (89.2%) | 42 (10.8%) |
Employment Characteristics in Farmington
Employment by Class of Employer in Farmington
Among the 10,469 employed individuals in Farmington, private company employees (7,107 | 67.9%), not-for-profit organizations (756 | 7.2%), and local government employees (688 | 6.6%) make up the most common classes of employment.
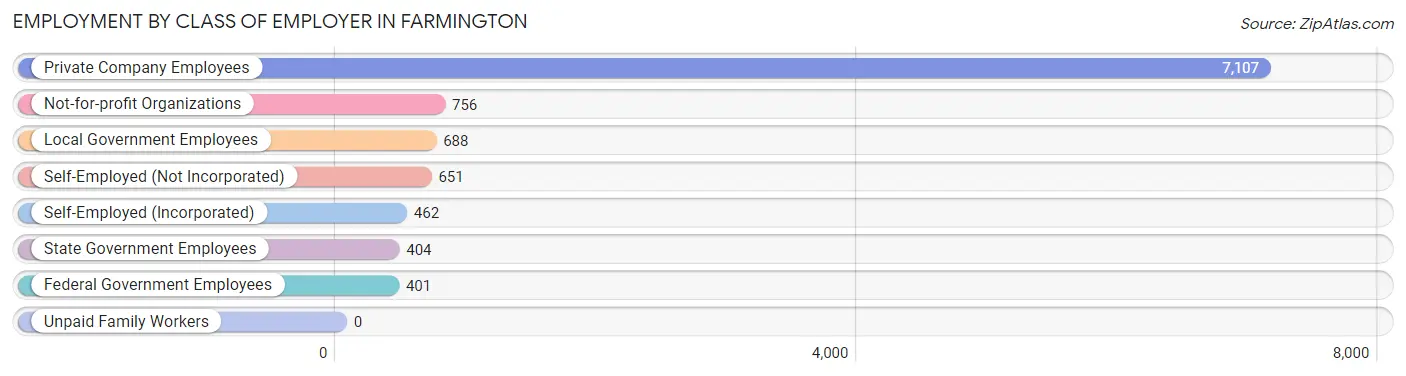
| Employer Class | # Employees | % Employees |
| Private Company Employees | 7,107 | 67.9% |
| Self-Employed (Incorporated) | 462 | 4.4% |
| Self-Employed (Not Incorporated) | 651 | 6.2% |
| Not-for-profit Organizations | 756 | 7.2% |
| Local Government Employees | 688 | 6.6% |
| State Government Employees | 404 | 3.9% |
| Federal Government Employees | 401 | 3.8% |
| Unpaid Family Workers | 0 | 0.0% |
| Total | 10,469 | 100.0% |
Employment Status by Age in Farmington
According to the labor force statistics for Farmington, out of the total population over 16 years of age (16,758), 64.5% or 10,809 individuals are in the labor force, with 2.2% or 238 of them unemployed. The age group with the highest labor force participation rate is 25 to 29 years, with 87.8% or 1,106 individuals in the labor force. Within the labor force, the 20 to 24 years age range has the highest percentage of unemployed individuals, with 7.9% or 83 of them being unemployed.
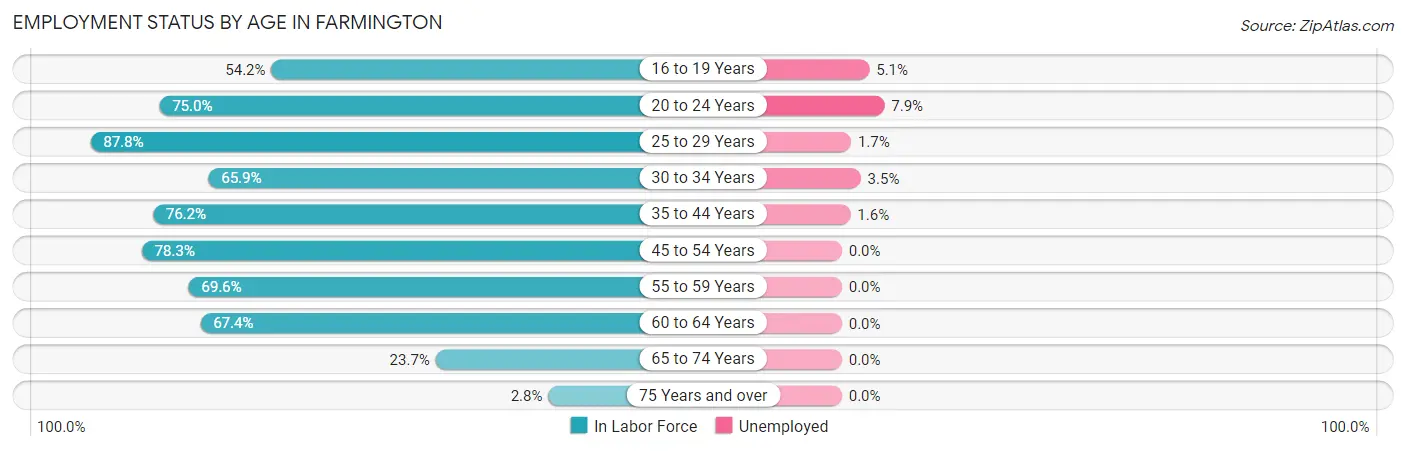
| Age Bracket | In Labor Force | Unemployed |
| 16 to 19 Years | 1,003 (54.2%) | 51 (5.1%) |
| 20 to 24 Years | 1,048 (75.0%) | 83 (7.9%) |
| 25 to 29 Years | 1,106 (87.8%) | 19 (1.7%) |
| 30 to 34 Years | 963 (65.9%) | 34 (3.5%) |
| 35 to 44 Years | 3,147 (76.2%) | 50 (1.6%) |
| 45 to 54 Years | 1,974 (78.3%) | 0 (0.0%) |
| 55 to 59 Years | 535 (69.6%) | 0 (0.0%) |
| 60 to 64 Years | 638 (67.4%) | 0 (0.0%) |
| 65 to 74 Years | 374 (23.7%) | 0 (0.0%) |
| 75 Years and over | 24 (2.8%) | 0 (0.0%) |
| Total | 10,809 (64.5%) | 238 (2.2%) |
Employment Status by Educational Attainment in Farmington
According to labor force statistics for Farmington, 75.4% of individuals (8,361) out of the total population between 25 and 64 years of age (11,089) are in the labor force, with 1.2% or 100 of them being unemployed. The group with the highest labor force participation rate are those with the educational attainment of bachelor's degree or higher, with 80.6% or 4,628 individuals in the labor force. Within the labor force, individuals with college / associate degree education have the highest percentage of unemployment, with 2.7% or 71 of them being unemployed.
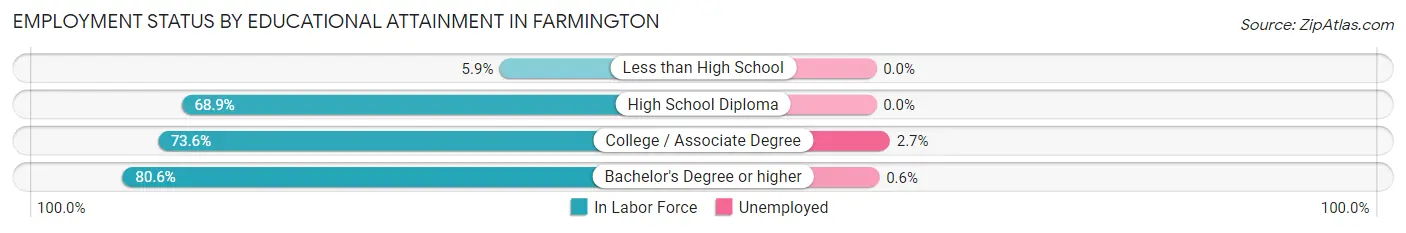
| Educational Attainment | In Labor Force | Unemployed |
| Less than High School | 11 (5.9%) | 0 (0.0%) |
| High School Diploma | 1,076 (68.9%) | 0 (0.0%) |
| College / Associate Degree | 2,648 (73.6%) | 97 (2.7%) |
| Bachelor's Degree or higher | 4,628 (80.6%) | 34 (0.6%) |
| Total | 8,361 (75.4%) | 133 (1.2%) |
Employment Occupations by Sex in Farmington
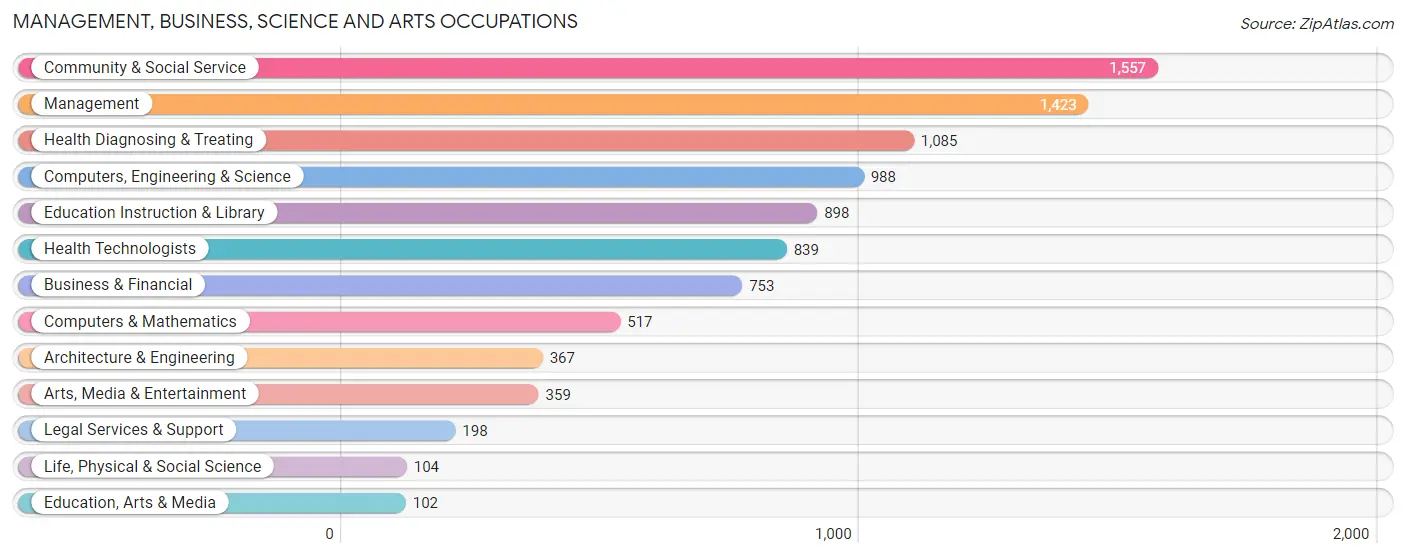
Management, Business, Science and Arts Occupations
The most common Management, Business, Science and Arts occupations in Farmington are Community & Social Service (1,557 | 14.7%), Management (1,423 | 13.5%), Health Diagnosing & Treating (1,085 | 10.3%), Computers, Engineering & Science (988 | 9.4%), and Education Instruction & Library (898 | 8.5%).
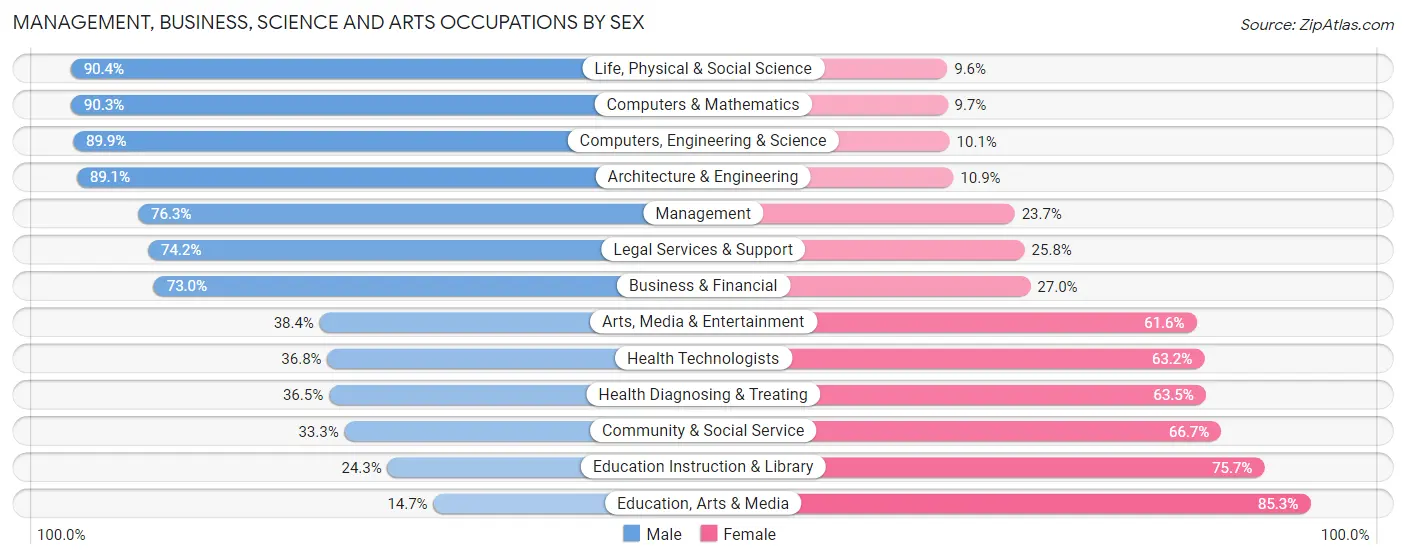
Management, Business, Science and Arts Occupations by Sex
Within the Management, Business, Science and Arts occupations in Farmington, the most male-oriented occupations are Life, Physical & Social Science (90.4%), Computers & Mathematics (90.3%), and Computers, Engineering & Science (89.9%), while the most female-oriented occupations are Education, Arts & Media (85.3%), Education Instruction & Library (75.7%), and Community & Social Service (66.7%).
| Occupation | Male | Female |
| Management | 1,086 (76.3%) | 337 (23.7%) |
| Business & Financial | 550 (73.0%) | 203 (27.0%) |
| Computers, Engineering & Science | 888 (89.9%) | 100 (10.1%) |
| Computers & Mathematics | 467 (90.3%) | 50 (9.7%) |
| Architecture & Engineering | 327 (89.1%) | 40 (10.9%) |
| Life, Physical & Social Science | 94 (90.4%) | 10 (9.6%) |
| Community & Social Service | 518 (33.3%) | 1,039 (66.7%) |
| Education, Arts & Media | 15 (14.7%) | 87 (85.3%) |
| Legal Services & Support | 147 (74.2%) | 51 (25.8%) |
| Education Instruction & Library | 218 (24.3%) | 680 (75.7%) |
| Arts, Media & Entertainment | 138 (38.4%) | 221 (61.6%) |
| Health Diagnosing & Treating | 396 (36.5%) | 689 (63.5%) |
| Health Technologists | 309 (36.8%) | 530 (63.2%) |
| Total (Category) | 3,438 (59.2%) | 2,368 (40.8%) |
| Total (Overall) | 6,015 (57.0%) | 4,538 (43.0%) |
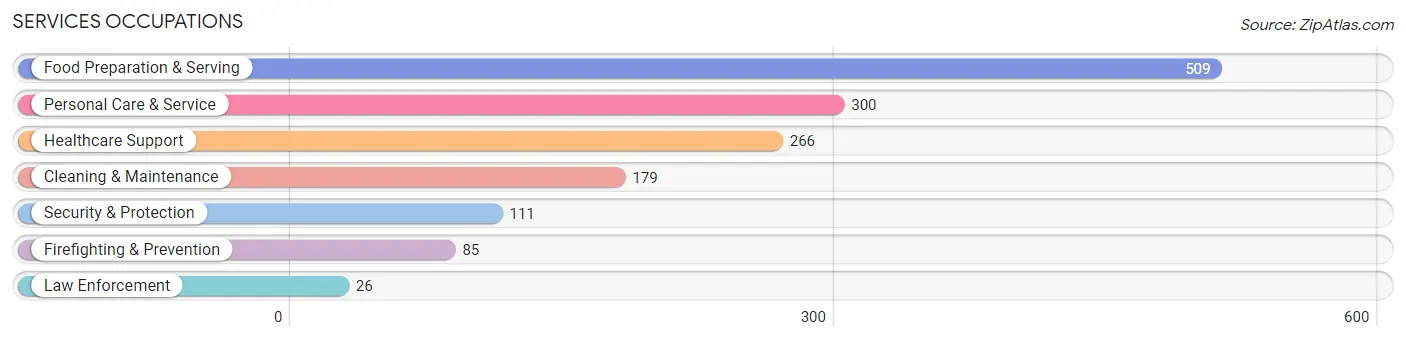
Services Occupations
The most common Services occupations in Farmington are Food Preparation & Serving (509 | 4.8%), Personal Care & Service (300 | 2.8%), Healthcare Support (266 | 2.5%), Cleaning & Maintenance (179 | 1.7%), and Security & Protection (111 | 1.1%).
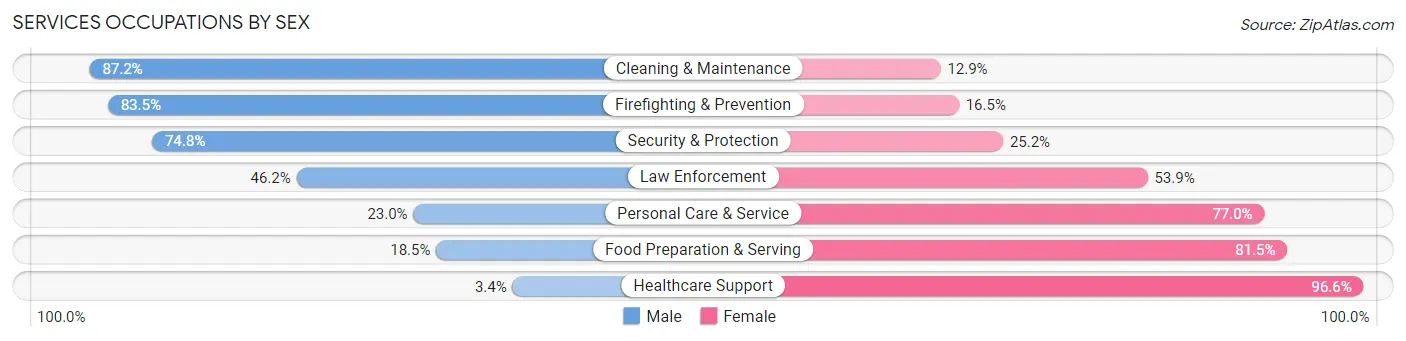
Services Occupations by Sex
Within the Services occupations in Farmington, the most male-oriented occupations are Cleaning & Maintenance (87.2%), Firefighting & Prevention (83.5%), and Security & Protection (74.8%), while the most female-oriented occupations are Healthcare Support (96.6%), Food Preparation & Serving (81.5%), and Personal Care & Service (77.0%).
| Occupation | Male | Female |
| Healthcare Support | 9 (3.4%) | 257 (96.6%) |
| Security & Protection | 83 (74.8%) | 28 (25.2%) |
| Firefighting & Prevention | 71 (83.5%) | 14 (16.5%) |
| Law Enforcement | 12 (46.2%) | 14 (53.8%) |
| Food Preparation & Serving | 94 (18.5%) | 415 (81.5%) |
| Cleaning & Maintenance | 156 (87.2%) | 23 (12.9%) |
| Personal Care & Service | 69 (23.0%) | 231 (77.0%) |
| Total (Category) | 411 (30.1%) | 954 (69.9%) |
| Total (Overall) | 6,015 (57.0%) | 4,538 (43.0%) |
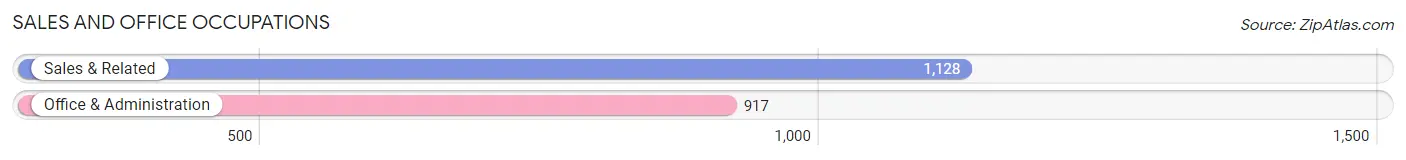
Sales and Office Occupations
The most common Sales and Office occupations in Farmington are Sales & Related (1,128 | 10.7%), and Office & Administration (917 | 8.7%).
Sales and Office Occupations by Sex
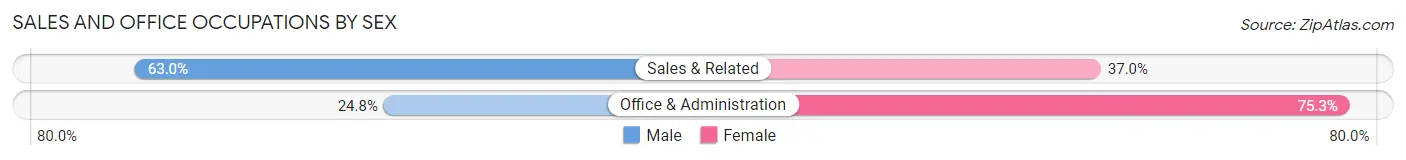
| Occupation | Male | Female |
| Sales & Related | 711 (63.0%) | 417 (37.0%) |
| Office & Administration | 227 (24.7%) | 690 (75.2%) |
| Total (Category) | 938 (45.9%) | 1,107 (54.1%) |
| Total (Overall) | 6,015 (57.0%) | 4,538 (43.0%) |
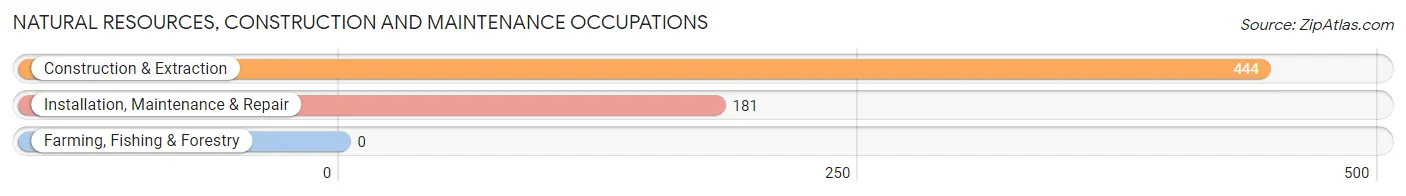
Natural Resources, Construction and Maintenance Occupations
The most common Natural Resources, Construction and Maintenance occupations in Farmington are Construction & Extraction (444 | 4.2%), and Installation, Maintenance & Repair (181 | 1.7%).
Natural Resources, Construction and Maintenance Occupations by Sex
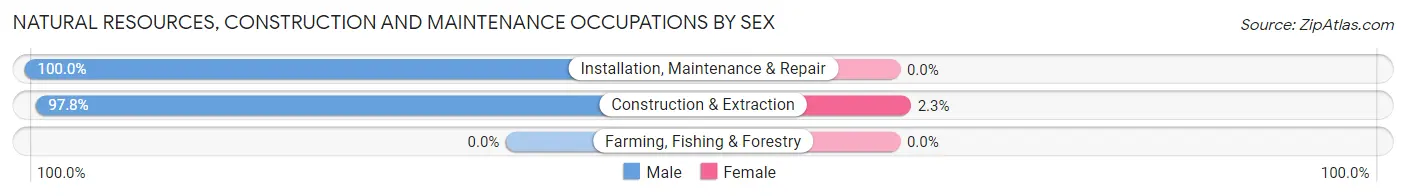
| Occupation | Male | Female |
| Farming, Fishing & Forestry | 0 (0.0%) | 0 (0.0%) |
| Construction & Extraction | 434 (97.8%) | 10 (2.2%) |
| Installation, Maintenance & Repair | 181 (100.0%) | 0 (0.0%) |
| Total (Category) | 615 (98.4%) | 10 (1.6%) |
| Total (Overall) | 6,015 (57.0%) | 4,538 (43.0%) |
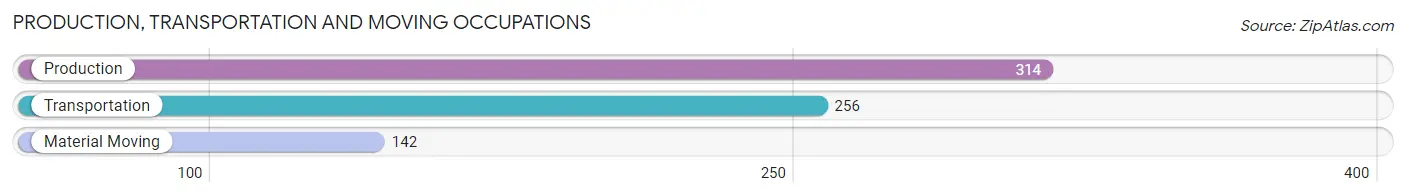
Production, Transportation and Moving Occupations
The most common Production, Transportation and Moving occupations in Farmington are Production (314 | 3.0%), Transportation (256 | 2.4%), and Material Moving (142 | 1.3%).
Production, Transportation and Moving Occupations by Sex
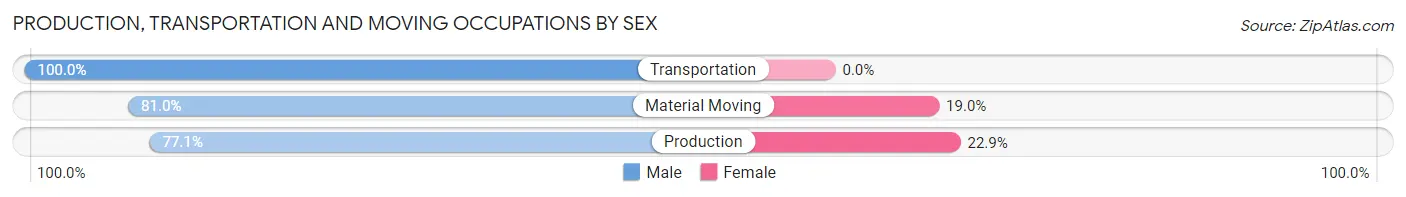
| Occupation | Male | Female |
| Production | 242 (77.1%) | 72 (22.9%) |
| Transportation | 256 (100.0%) | 0 (0.0%) |
| Material Moving | 115 (81.0%) | 27 (19.0%) |
| Total (Category) | 613 (86.1%) | 99 (13.9%) |
| Total (Overall) | 6,015 (57.0%) | 4,538 (43.0%) |
Employment Industries by Sex in Farmington
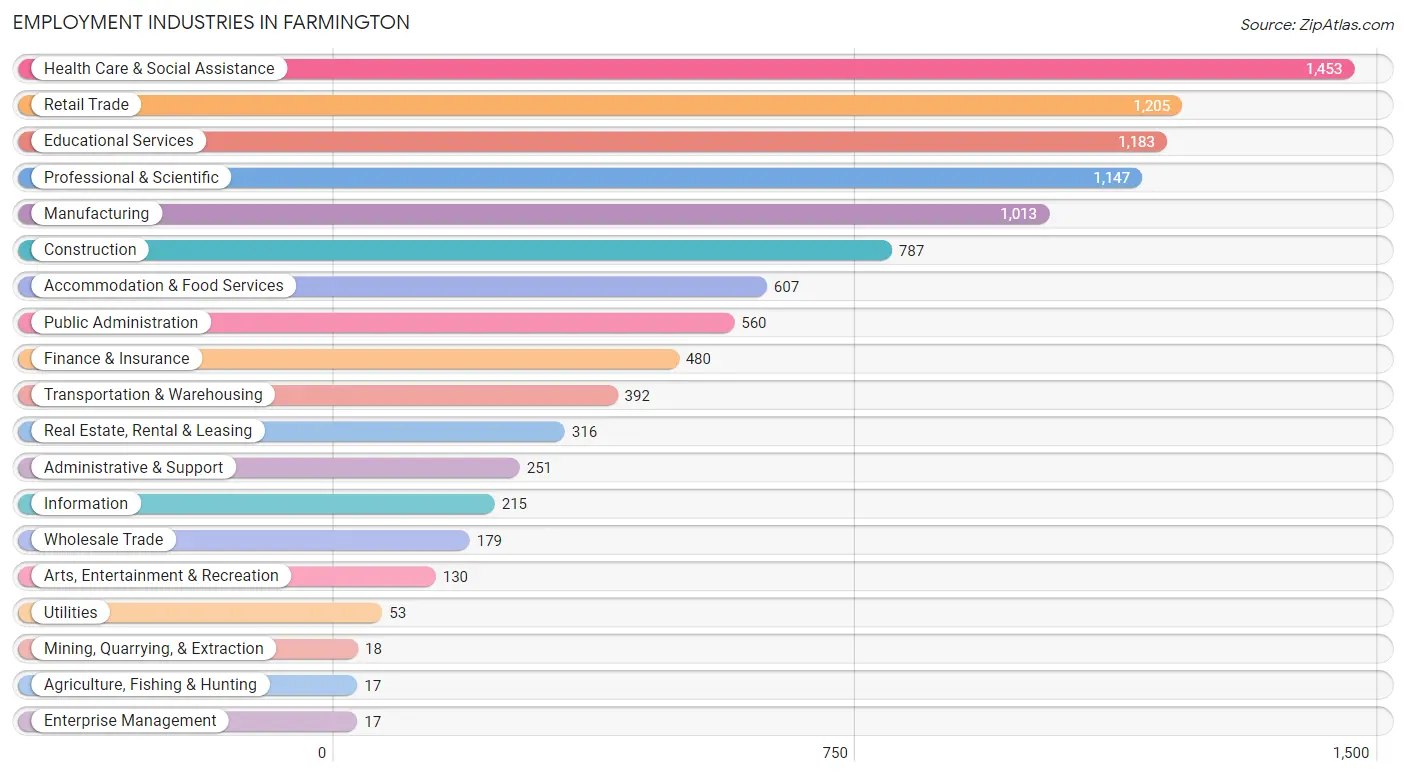
Employment Industries in Farmington
The major employment industries in Farmington include Health Care & Social Assistance (1,453 | 13.8%), Retail Trade (1,205 | 11.4%), Educational Services (1,183 | 11.2%), Professional & Scientific (1,147 | 10.9%), and Manufacturing (1,013 | 9.6%).
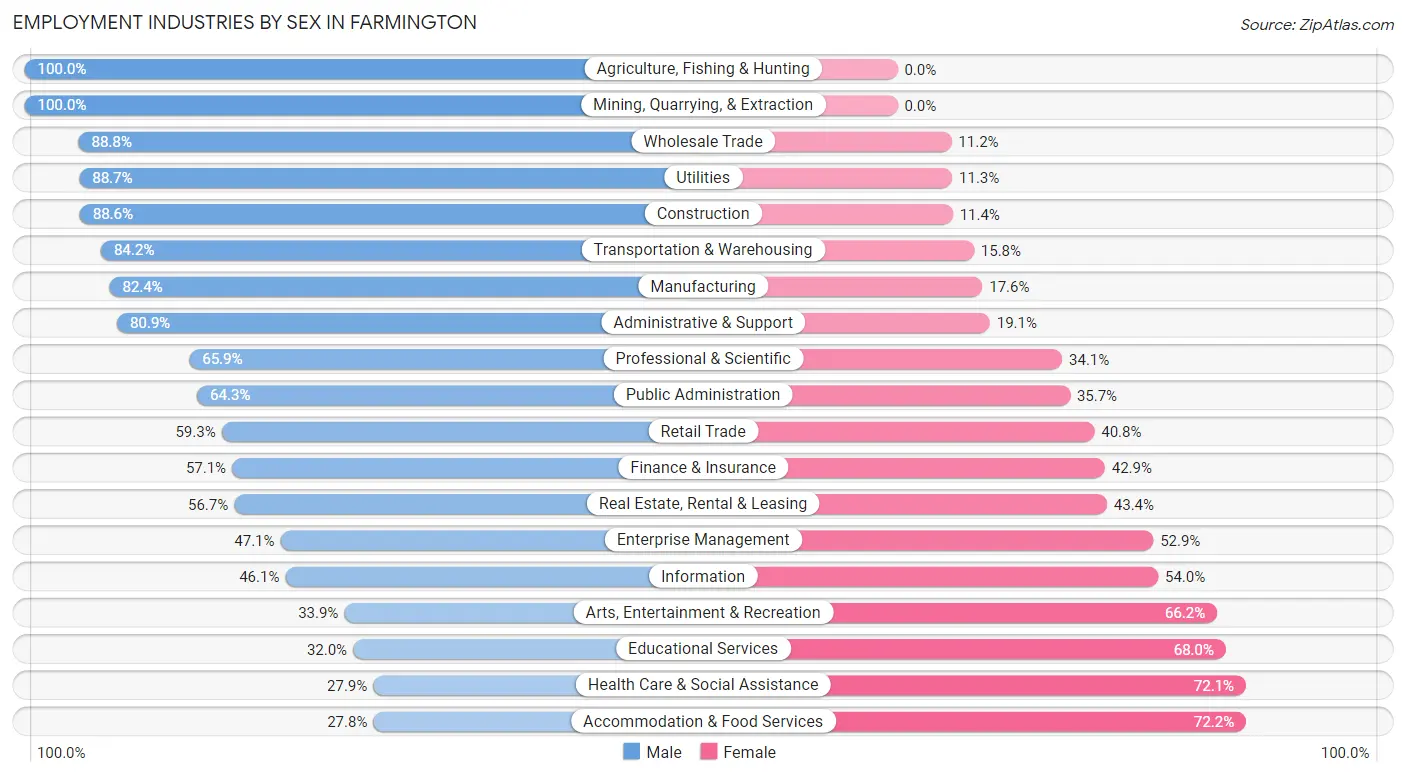
Employment Industries by Sex in Farmington
The Farmington industries that see more men than women are Agriculture, Fishing & Hunting (100.0%), Mining, Quarrying, & Extraction (100.0%), and Wholesale Trade (88.8%), whereas the industries that tend to have a higher number of women are Accommodation & Food Services (72.2%), Health Care & Social Assistance (72.1%), and Educational Services (68.0%).
| Industry | Male | Female |
| Agriculture, Fishing & Hunting | 17 (100.0%) | 0 (0.0%) |
| Mining, Quarrying, & Extraction | 18 (100.0%) | 0 (0.0%) |
| Construction | 697 (88.6%) | 90 (11.4%) |
| Manufacturing | 835 (82.4%) | 178 (17.6%) |
| Wholesale Trade | 159 (88.8%) | 20 (11.2%) |
| Retail Trade | 714 (59.3%) | 491 (40.7%) |
| Transportation & Warehousing | 330 (84.2%) | 62 (15.8%) |
| Utilities | 47 (88.7%) | 6 (11.3%) |
| Information | 99 (46.1%) | 116 (53.9%) |
| Finance & Insurance | 274 (57.1%) | 206 (42.9%) |
| Real Estate, Rental & Leasing | 179 (56.7%) | 137 (43.3%) |
| Professional & Scientific | 756 (65.9%) | 391 (34.1%) |
| Enterprise Management | 8 (47.1%) | 9 (52.9%) |
| Administrative & Support | 203 (80.9%) | 48 (19.1%) |
| Educational Services | 379 (32.0%) | 804 (68.0%) |
| Health Care & Social Assistance | 405 (27.9%) | 1,048 (72.1%) |
| Arts, Entertainment & Recreation | 44 (33.9%) | 86 (66.1%) |
| Accommodation & Food Services | 169 (27.8%) | 438 (72.2%) |
| Public Administration | 360 (64.3%) | 200 (35.7%) |
| Total | 6,015 (57.0%) | 4,538 (43.0%) |
Education in Farmington
School Enrollment in Farmington
The most common levels of schooling among the 9,108 students in Farmington are middle school (2,240 | 24.6%), high school (2,183 | 24.0%), and elementary school (1,982 | 21.8%).
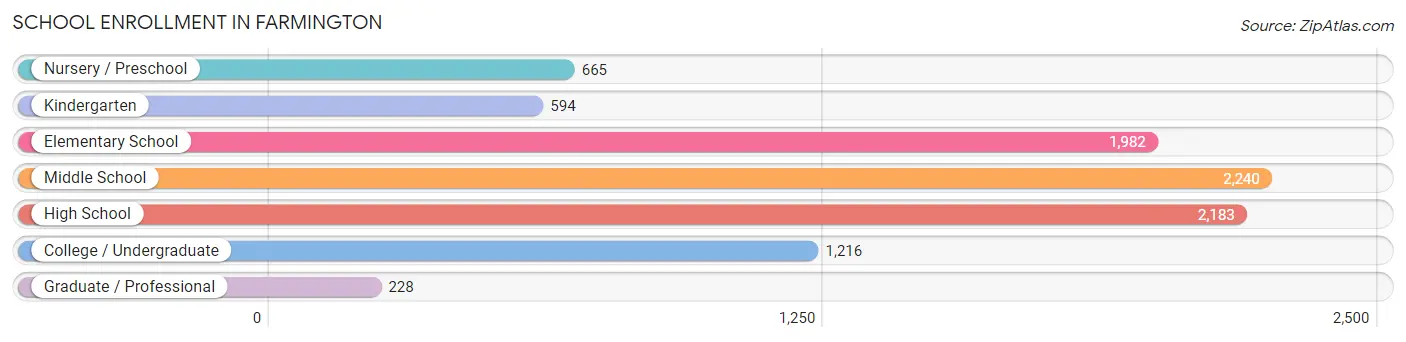
| School Level | # Students | % Students |
| Nursery / Preschool | 665 | 7.3% |
| Kindergarten | 594 | 6.5% |
| Elementary School | 1,982 | 21.8% |
| Middle School | 2,240 | 24.6% |
| High School | 2,183 | 24.0% |
| College / Undergraduate | 1,216 | 13.4% |
| Graduate / Professional | 228 | 2.5% |
| Total | 9,108 | 100.0% |
School Enrollment by Age by Funding Source in Farmington
Out of a total of 9,108 students who are enrolled in schools in Farmington, 829 (9.1%) attend a private institution, while the remaining 8,279 (90.9%) are enrolled in public schools. The age group of 3 to 4 year olds has the highest likelihood of being enrolled in private schools, with 151 (31.6% in the age bracket) enrolled. Conversely, the age group of 18 to 19 year olds has the lowest likelihood of being enrolled in a private school, with 482 (98.4% in the age bracket) attending a public institution.
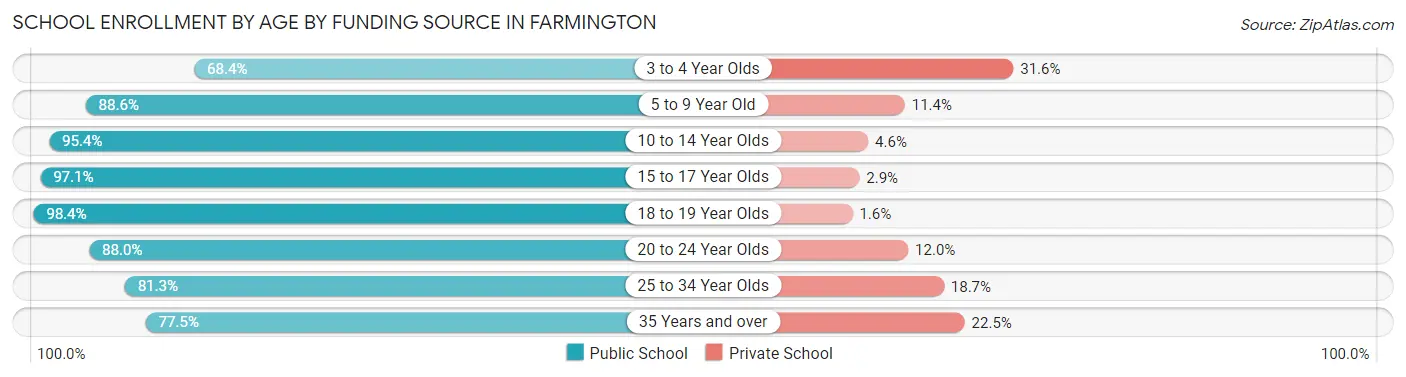
| Age Bracket | Public School | Private School |
| 3 to 4 Year Olds | 327 (68.4%) | 151 (31.6%) |
| 5 to 9 Year Old | 2,212 (88.6%) | 284 (11.4%) |
| 10 to 14 Year Olds | 2,660 (95.4%) | 127 (4.6%) |
| 15 to 17 Year Olds | 1,498 (97.1%) | 45 (2.9%) |
| 18 to 19 Year Olds | 482 (98.4%) | 8 (1.6%) |
| 20 to 24 Year Olds | 608 (88.0%) | 83 (12.0%) |
| 25 to 34 Year Olds | 218 (81.3%) | 50 (18.7%) |
| 35 Years and over | 275 (77.5%) | 80 (22.5%) |
| Total | 8,279 (90.9%) | 829 (9.1%) |
Educational Attainment by Field of Study in Farmington
Business (1,618 | 22.7%), science & technology (730 | 10.3%), arts & humanities (700 | 9.8%), education (644 | 9.0%), and engineering (489 | 6.9%) are the most common fields of study among 7,115 individuals in Farmington who have obtained a bachelor's degree or higher.
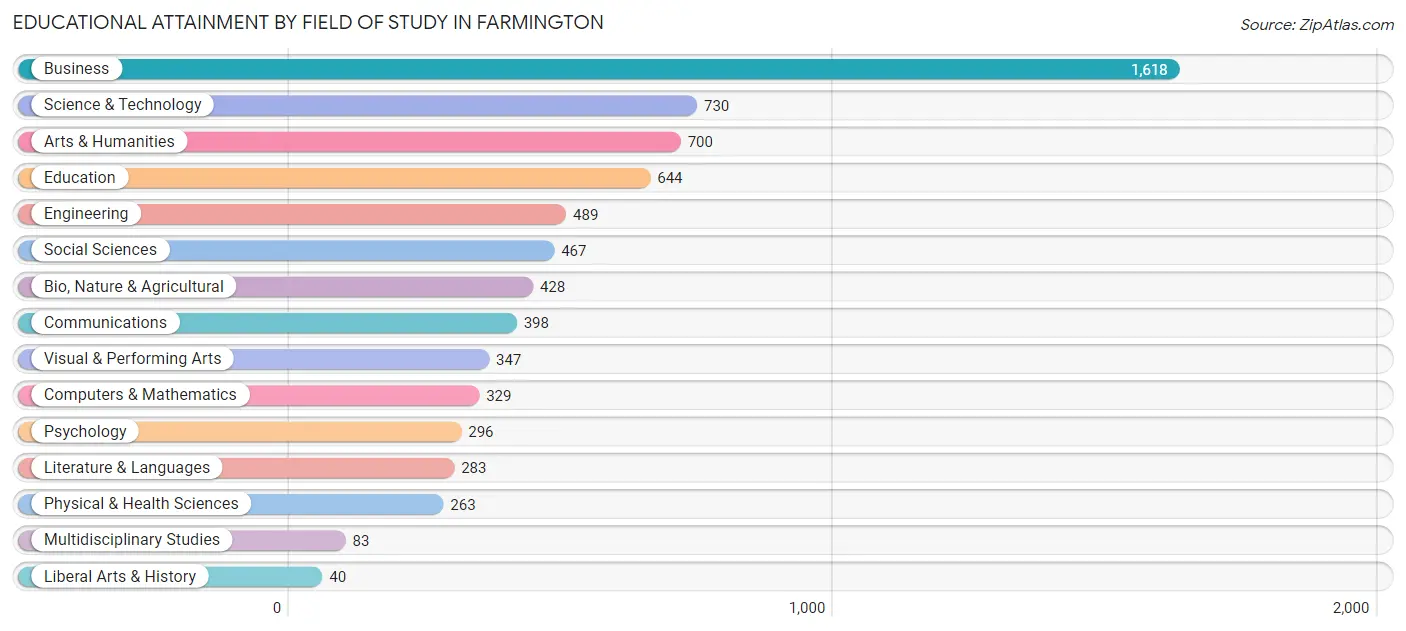
| Field of Study | # Graduates | % Graduates |
| Computers & Mathematics | 329 | 4.6% |
| Bio, Nature & Agricultural | 428 | 6.0% |
| Physical & Health Sciences | 263 | 3.7% |
| Psychology | 296 | 4.2% |
| Social Sciences | 467 | 6.6% |
| Engineering | 489 | 6.9% |
| Multidisciplinary Studies | 83 | 1.2% |
| Science & Technology | 730 | 10.3% |
| Business | 1,618 | 22.7% |
| Education | 644 | 9.0% |
| Literature & Languages | 283 | 4.0% |
| Liberal Arts & History | 40 | 0.6% |
| Visual & Performing Arts | 347 | 4.9% |
| Communications | 398 | 5.6% |
| Arts & Humanities | 700 | 9.8% |
| Total | 7,115 | 100.0% |
Transportation & Commute in Farmington
Vehicle Availability by Sex in Farmington
The most prevalent vehicle ownership categories in Farmington are males with 2 vehicles (2,136, accounting for 35.6%) and females with 2 vehicles (1,639, making up 47.8%).
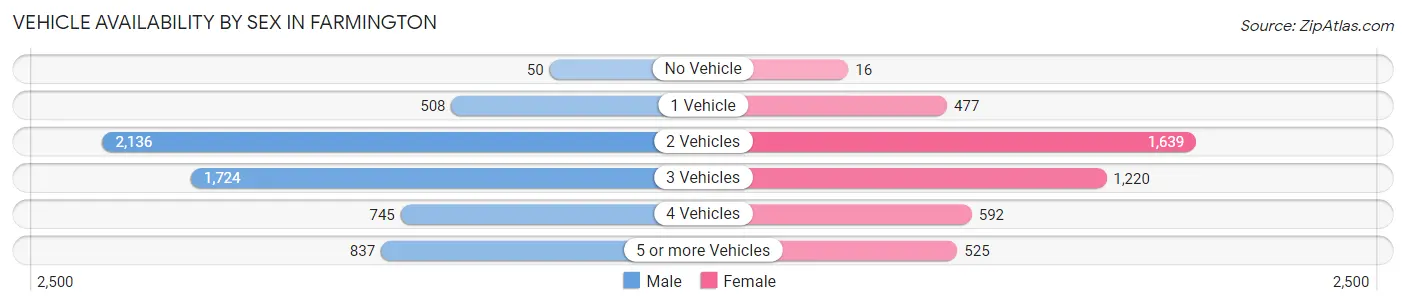
| Vehicles Available | Male | Female |
| No Vehicle | 50 (0.8%) | 16 (0.4%) |
| 1 Vehicle | 508 (8.5%) | 477 (10.7%) |
| 2 Vehicles | 2,136 (35.6%) | 1,639 (36.7%) |
| 3 Vehicles | 1,724 (28.7%) | 1,220 (27.3%) |
| 4 Vehicles | 745 (12.4%) | 592 (13.3%) |
| 5 or more Vehicles | 837 (14.0%) | 525 (11.7%) |
| Total | 6,000 (100.0%) | 4,469 (100.0%) |
Commute Time in Farmington
The most frequently occuring commute durations in Farmington are 15 to 19 minutes (1,684 commuters, 19.7%), 20 to 24 minutes (1,406 commuters, 16.4%), and 30 to 34 minutes (1,310 commuters, 15.3%).
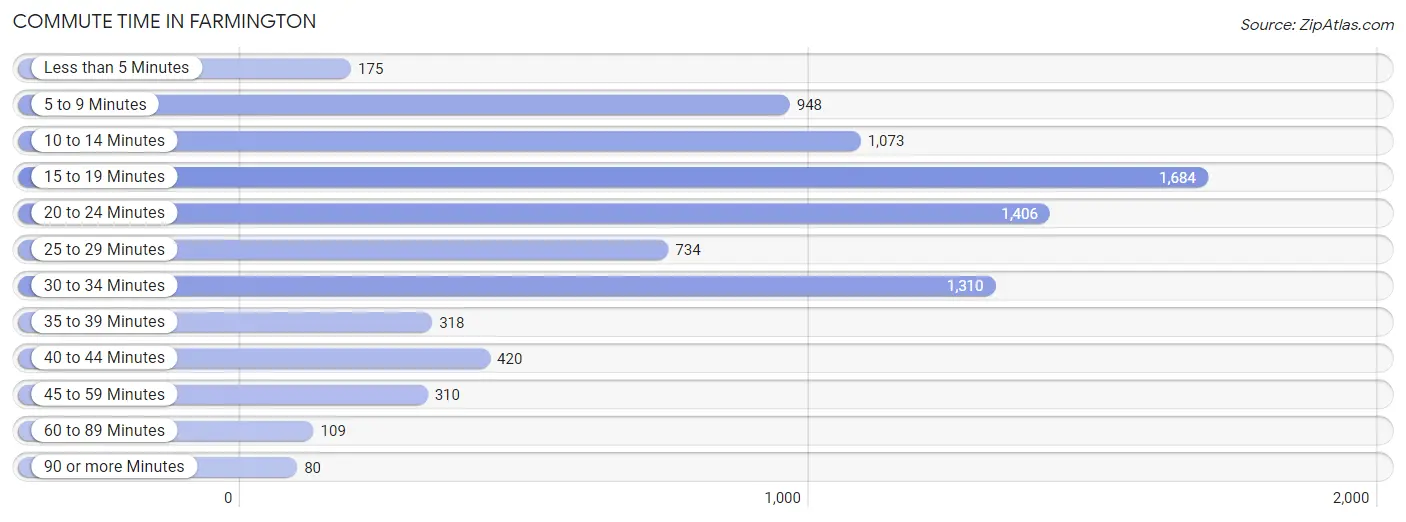
| Commute Time | # Commuters | % Commuters |
| Less than 5 Minutes | 175 | 2.0% |
| 5 to 9 Minutes | 948 | 11.1% |
| 10 to 14 Minutes | 1,073 | 12.5% |
| 15 to 19 Minutes | 1,684 | 19.7% |
| 20 to 24 Minutes | 1,406 | 16.4% |
| 25 to 29 Minutes | 734 | 8.6% |
| 30 to 34 Minutes | 1,310 | 15.3% |
| 35 to 39 Minutes | 318 | 3.7% |
| 40 to 44 Minutes | 420 | 4.9% |
| 45 to 59 Minutes | 310 | 3.6% |
| 60 to 89 Minutes | 109 | 1.3% |
| 90 or more Minutes | 80 | 0.9% |
Commute Time by Sex in Farmington
The most common commute times in Farmington are 20 to 24 minutes (1,036 commuters, 21.1%) for males and 15 to 19 minutes (811 commuters, 22.1%) for females.
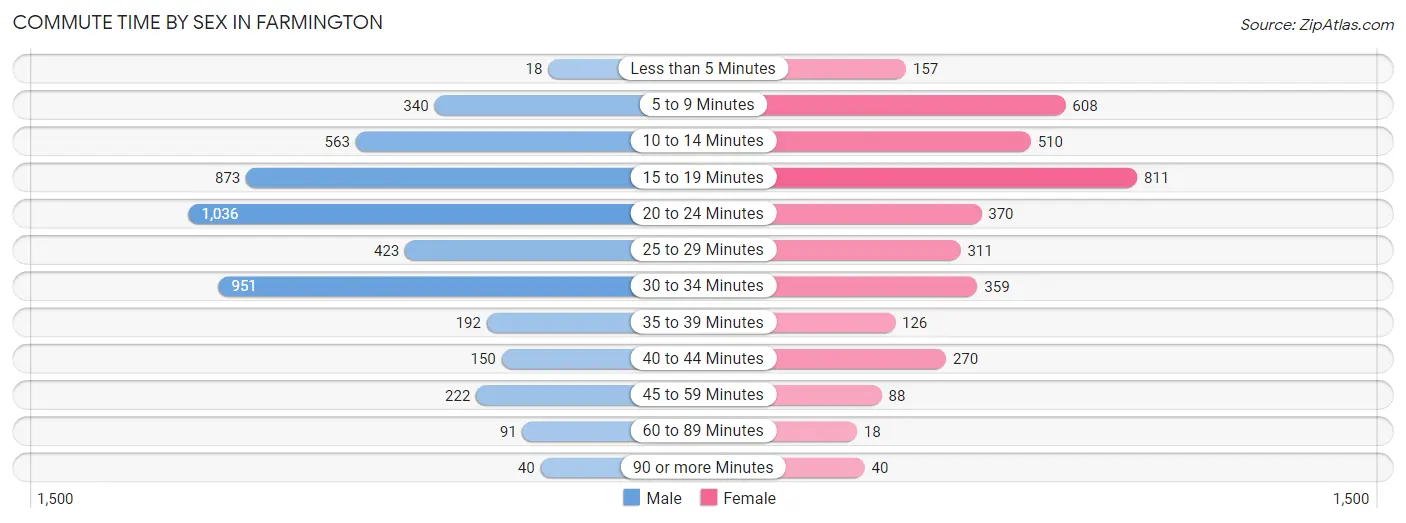
| Commute Time | Male | Female |
| Less than 5 Minutes | 18 (0.4%) | 157 (4.3%) |
| 5 to 9 Minutes | 340 (6.9%) | 608 (16.6%) |
| 10 to 14 Minutes | 563 (11.5%) | 510 (13.9%) |
| 15 to 19 Minutes | 873 (17.8%) | 811 (22.1%) |
| 20 to 24 Minutes | 1,036 (21.1%) | 370 (10.1%) |
| 25 to 29 Minutes | 423 (8.6%) | 311 (8.5%) |
| 30 to 34 Minutes | 951 (19.4%) | 359 (9.8%) |
| 35 to 39 Minutes | 192 (3.9%) | 126 (3.4%) |
| 40 to 44 Minutes | 150 (3.1%) | 270 (7.4%) |
| 45 to 59 Minutes | 222 (4.5%) | 88 (2.4%) |
| 60 to 89 Minutes | 91 (1.9%) | 18 (0.5%) |
| 90 or more Minutes | 40 (0.8%) | 40 (1.1%) |
Time of Departure to Work by Sex in Farmington
The most frequent times of departure to work in Farmington are 6:30 AM to 6:59 AM (757, 15.4%) for males and 8:00 AM to 8:29 AM (567, 15.5%) for females.
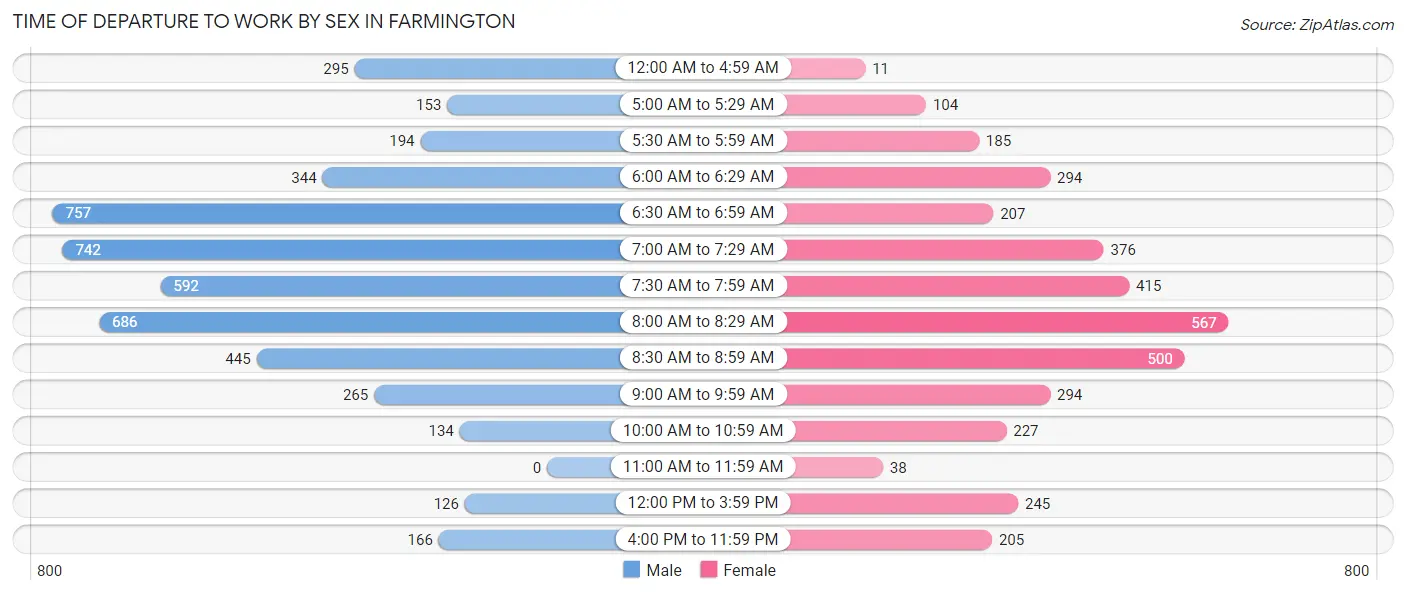
| Time of Departure | Male | Female |
| 12:00 AM to 4:59 AM | 295 (6.0%) | 11 (0.3%) |
| 5:00 AM to 5:29 AM | 153 (3.1%) | 104 (2.8%) |
| 5:30 AM to 5:59 AM | 194 (4.0%) | 185 (5.0%) |
| 6:00 AM to 6:29 AM | 344 (7.0%) | 294 (8.0%) |
| 6:30 AM to 6:59 AM | 757 (15.4%) | 207 (5.6%) |
| 7:00 AM to 7:29 AM | 742 (15.1%) | 376 (10.2%) |
| 7:30 AM to 7:59 AM | 592 (12.1%) | 415 (11.3%) |
| 8:00 AM to 8:29 AM | 686 (14.0%) | 567 (15.5%) |
| 8:30 AM to 8:59 AM | 445 (9.1%) | 500 (13.6%) |
| 9:00 AM to 9:59 AM | 265 (5.4%) | 294 (8.0%) |
| 10:00 AM to 10:59 AM | 134 (2.7%) | 227 (6.2%) |
| 11:00 AM to 11:59 AM | 0 (0.0%) | 38 (1.0%) |
| 12:00 PM to 3:59 PM | 126 (2.6%) | 245 (6.7%) |
| 4:00 PM to 11:59 PM | 166 (3.4%) | 205 (5.6%) |
| Total | 4,899 (100.0%) | 3,668 (100.0%) |
Housing Occupancy in Farmington
Occupancy by Ownership in Farmington
Of the total 6,890 dwellings in Farmington, owner-occupied units account for 5,653 (82.1%), while renter-occupied units make up 1,237 (17.9%).
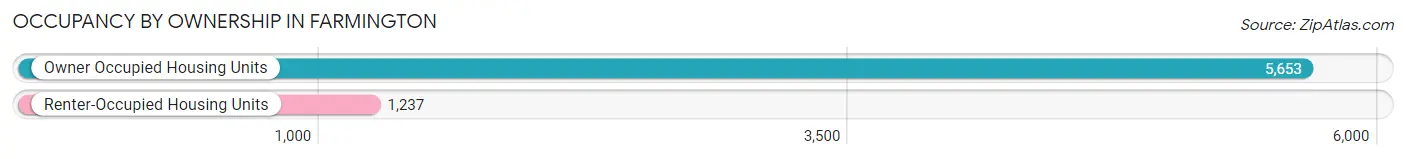
| Occupancy | # Housing Units | % Housing Units |
| Owner Occupied Housing Units | 5,653 | 82.1% |
| Renter-Occupied Housing Units | 1,237 | 17.9% |
| Total Occupied Housing Units | 6,890 | 100.0% |
Occupancy by Household Size in Farmington
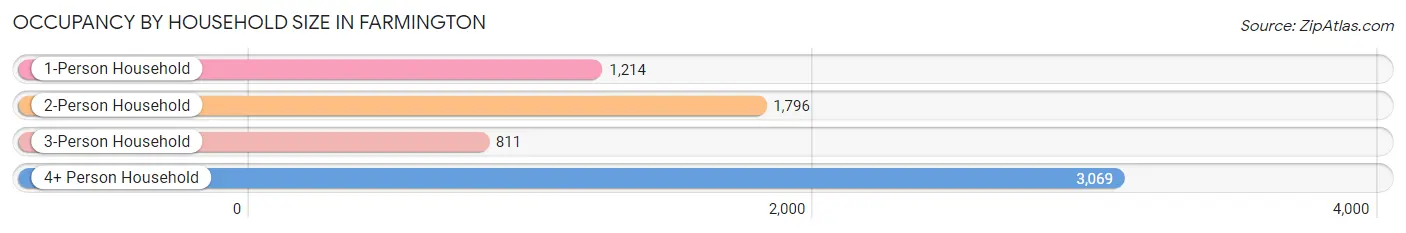
| Household Size | # Housing Units | % Housing Units |
| 1-Person Household | 1,214 | 17.6% |
| 2-Person Household | 1,796 | 26.1% |
| 3-Person Household | 811 | 11.8% |
| 4+ Person Household | 3,069 | 44.5% |
| Total Housing Units | 6,890 | 100.0% |
Occupancy by Ownership by Household Size in Farmington
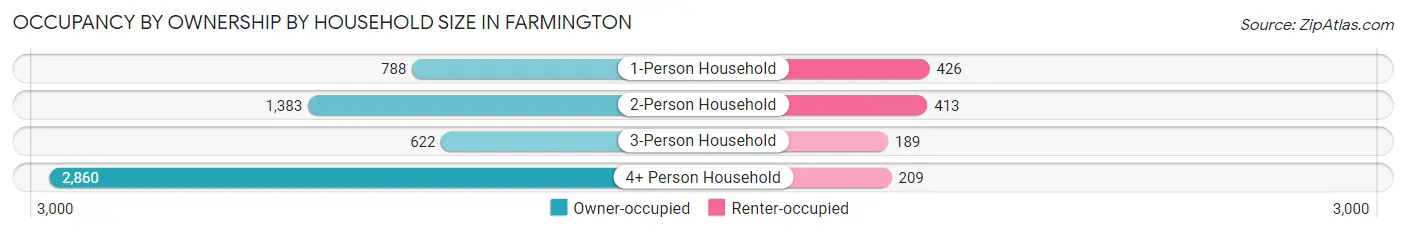
| Household Size | Owner-occupied | Renter-occupied |
| 1-Person Household | 788 (64.9%) | 426 (35.1%) |
| 2-Person Household | 1,383 (77.0%) | 413 (23.0%) |
| 3-Person Household | 622 (76.7%) | 189 (23.3%) |
| 4+ Person Household | 2,860 (93.2%) | 209 (6.8%) |
| Total Housing Units | 5,653 (82.1%) | 1,237 (17.9%) |
Occupancy by Educational Attainment in Farmington
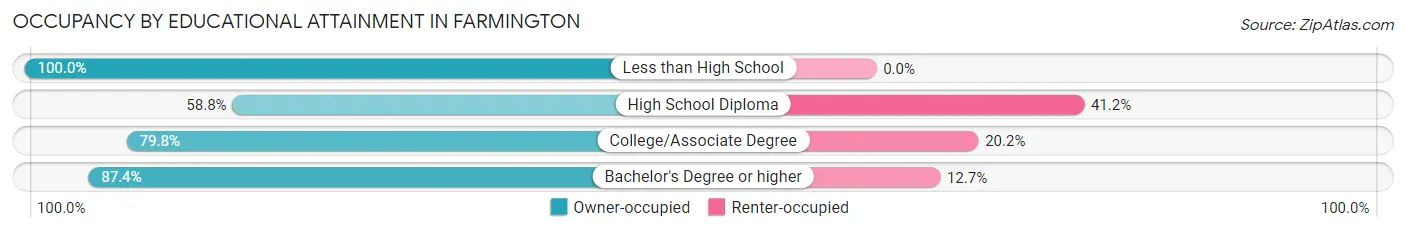
| Household Size | Owner-occupied | Renter-occupied |
| Less than High School | 74 (100.0%) | 0 (0.0%) |
| High School Diploma | 401 (58.8%) | 281 (41.2%) |
| College/Associate Degree | 1,892 (79.8%) | 480 (20.2%) |
| Bachelor's Degree or higher | 3,286 (87.4%) | 476 (12.7%) |
Occupancy by Age of Householder in Farmington
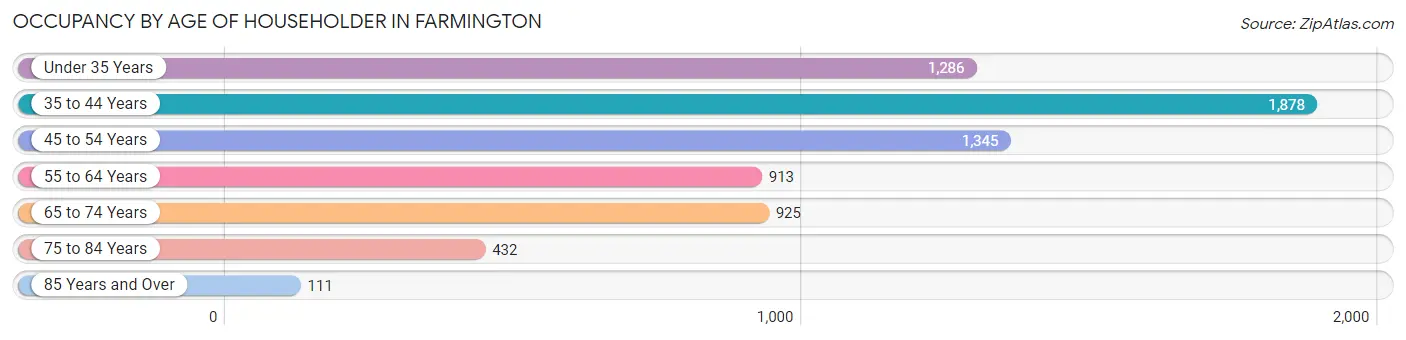
| Age Bracket | # Households | % Households |
| Under 35 Years | 1,286 | 18.7% |
| 35 to 44 Years | 1,878 | 27.3% |
| 45 to 54 Years | 1,345 | 19.5% |
| 55 to 64 Years | 913 | 13.3% |
| 65 to 74 Years | 925 | 13.4% |
| 75 to 84 Years | 432 | 6.3% |
| 85 Years and Over | 111 | 1.6% |
| Total | 6,890 | 100.0% |
Housing Finances in Farmington
Median Income by Occupancy in Farmington
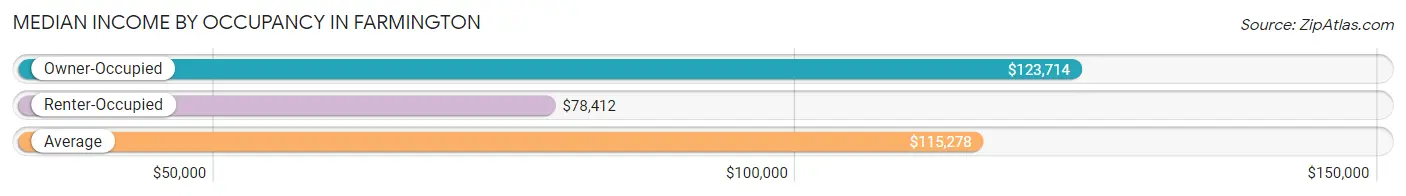
| Occupancy Type | # Households | Median Income |
| Owner-Occupied | 5,653 (82.1%) | $123,714 |
| Renter-Occupied | 1,237 (17.9%) | $78,412 |
| Average | 6,890 (100.0%) | $115,278 |
Occupancy by Householder Income Bracket in Farmington
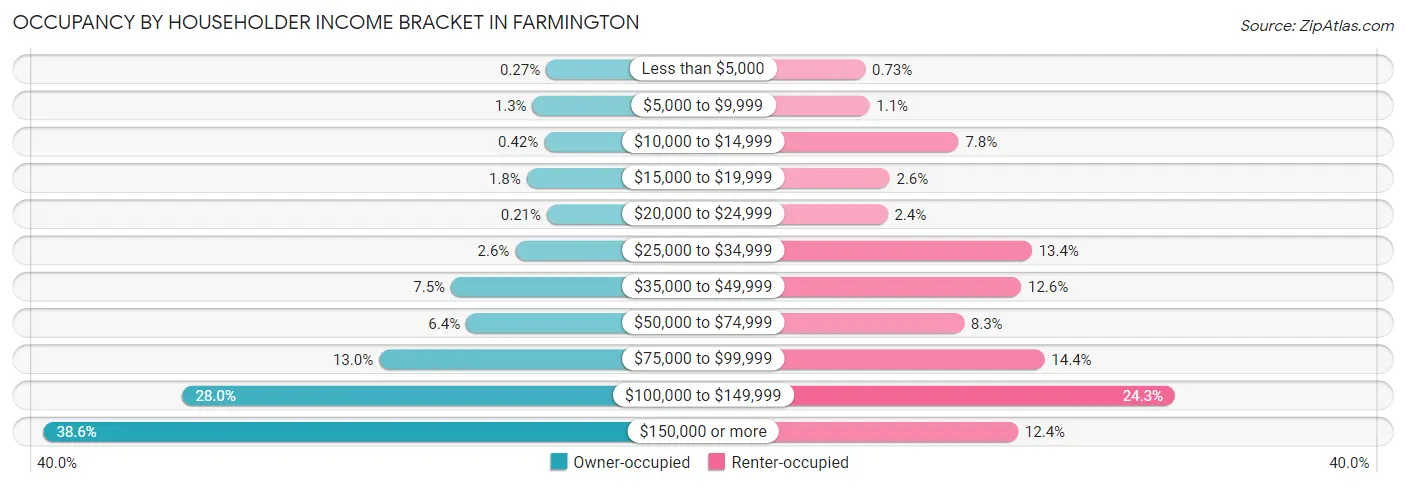
| Income Bracket | Owner-occupied | Renter-occupied |
| Less than $5,000 | 15 (0.3%) | 9 (0.7%) |
| $5,000 to $9,999 | 74 (1.3%) | 13 (1.1%) |
| $10,000 to $14,999 | 24 (0.4%) | 97 (7.8%) |
| $15,000 to $19,999 | 99 (1.8%) | 32 (2.6%) |
| $20,000 to $24,999 | 12 (0.2%) | 30 (2.4%) |
| $25,000 to $34,999 | 148 (2.6%) | 166 (13.4%) |
| $35,000 to $49,999 | 425 (7.5%) | 156 (12.6%) |
| $50,000 to $74,999 | 360 (6.4%) | 102 (8.3%) |
| $75,000 to $99,999 | 735 (13.0%) | 178 (14.4%) |
| $100,000 to $149,999 | 1,581 (28.0%) | 301 (24.3%) |
| $150,000 or more | 2,180 (38.6%) | 153 (12.4%) |
| Total | 5,653 (100.0%) | 1,237 (100.0%) |
Monthly Housing Cost Tiers in Farmington
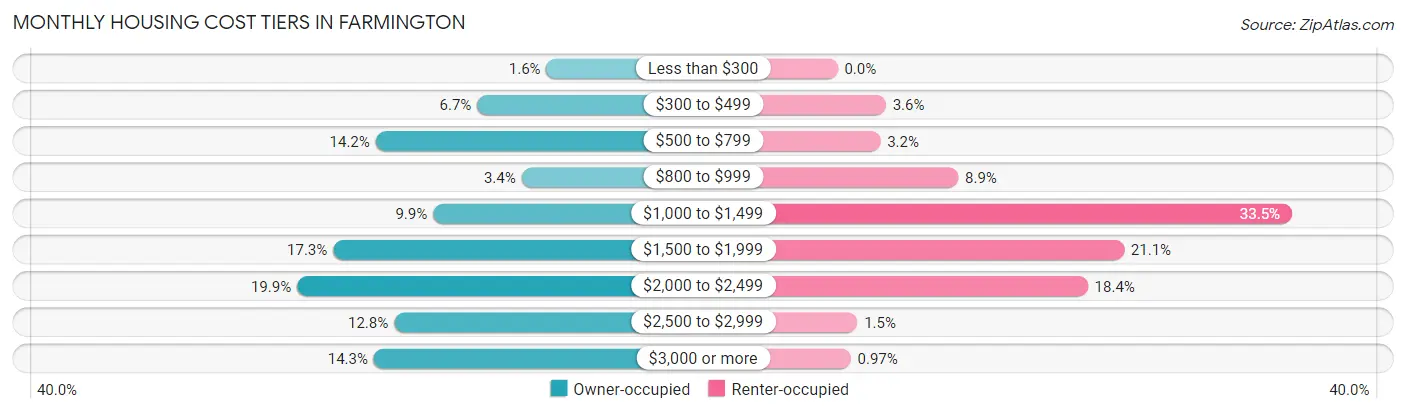
| Monthly Cost | Owner-occupied | Renter-occupied |
| Less than $300 | 89 (1.6%) | 0 (0.0%) |
| $300 to $499 | 377 (6.7%) | 44 (3.6%) |
| $500 to $799 | 800 (14.1%) | 39 (3.2%) |
| $800 to $999 | 192 (3.4%) | 110 (8.9%) |
| $1,000 to $1,499 | 561 (9.9%) | 414 (33.5%) |
| $1,500 to $1,999 | 977 (17.3%) | 261 (21.1%) |
| $2,000 to $2,499 | 1,127 (19.9%) | 228 (18.4%) |
| $2,500 to $2,999 | 723 (12.8%) | 18 (1.5%) |
| $3,000 or more | 807 (14.3%) | 12 (1.0%) |
| Total | 5,653 (100.0%) | 1,237 (100.0%) |
Physical Housing Characteristics in Farmington
Housing Structures in Farmington
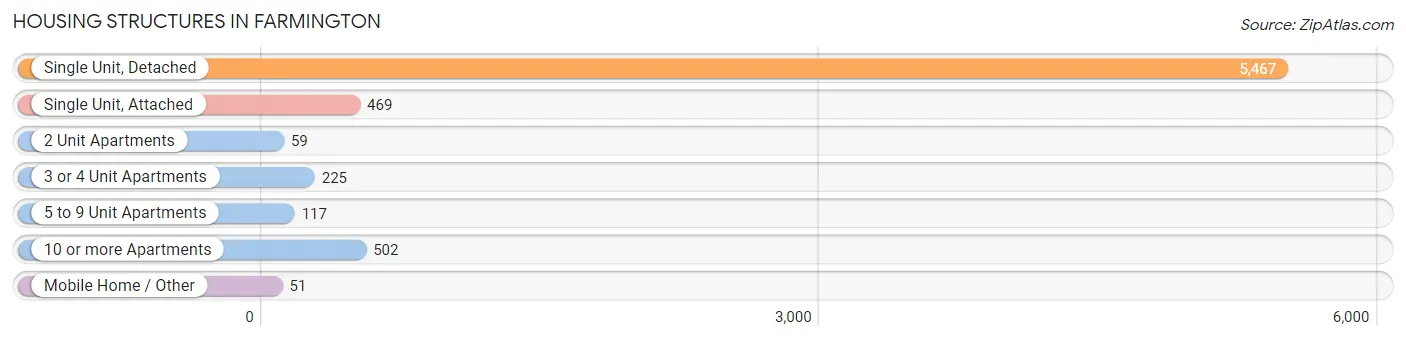
| Structure Type | # Housing Units | % Housing Units |
| Single Unit, Detached | 5,467 | 79.3% |
| Single Unit, Attached | 469 | 6.8% |
| 2 Unit Apartments | 59 | 0.9% |
| 3 or 4 Unit Apartments | 225 | 3.3% |
| 5 to 9 Unit Apartments | 117 | 1.7% |
| 10 or more Apartments | 502 | 7.3% |
| Mobile Home / Other | 51 | 0.7% |
| Total | 6,890 | 100.0% |
Housing Structures by Occupancy in Farmington
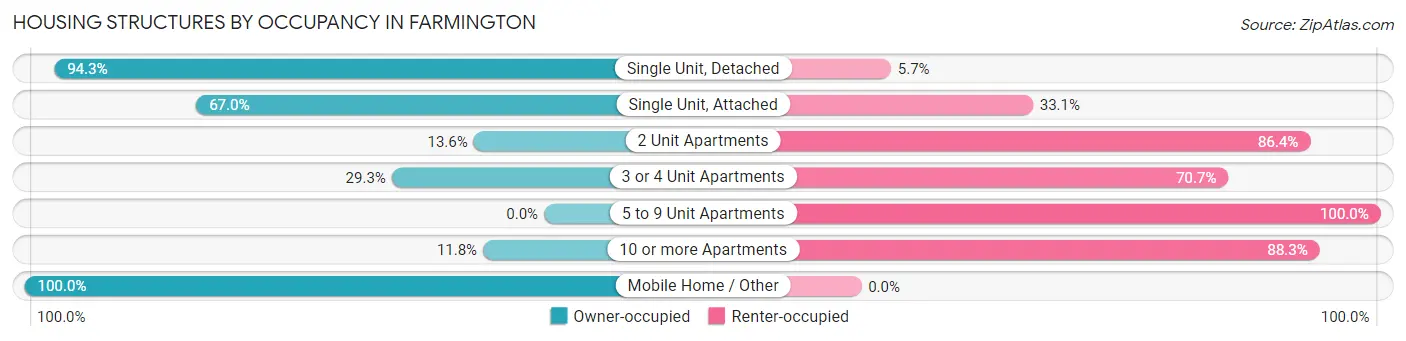
| Structure Type | Owner-occupied | Renter-occupied |
| Single Unit, Detached | 5,155 (94.3%) | 312 (5.7%) |
| Single Unit, Attached | 314 (66.9%) | 155 (33.1%) |
| 2 Unit Apartments | 8 (13.6%) | 51 (86.4%) |
| 3 or 4 Unit Apartments | 66 (29.3%) | 159 (70.7%) |
| 5 to 9 Unit Apartments | 0 (0.0%) | 117 (100.0%) |
| 10 or more Apartments | 59 (11.7%) | 443 (88.2%) |
| Mobile Home / Other | 51 (100.0%) | 0 (0.0%) |
| Total | 5,653 (82.1%) | 1,237 (17.9%) |
Housing Structures by Number of Rooms in Farmington
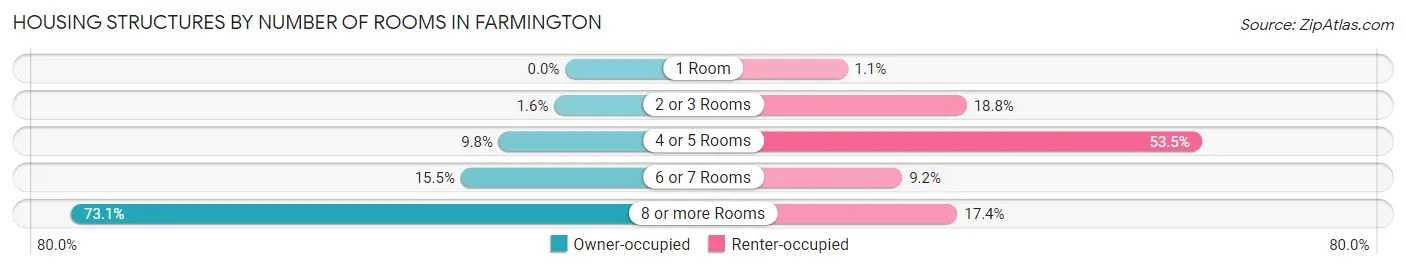
| Number of Rooms | Owner-occupied | Renter-occupied |
| 1 Room | 0 (0.0%) | 14 (1.1%) |
| 2 or 3 Rooms | 91 (1.6%) | 232 (18.8%) |
| 4 or 5 Rooms | 555 (9.8%) | 662 (53.5%) |
| 6 or 7 Rooms | 874 (15.5%) | 114 (9.2%) |
| 8 or more Rooms | 4,133 (73.1%) | 215 (17.4%) |
| Total | 5,653 (100.0%) | 1,237 (100.0%) |
Housing Structure by Heating Type in Farmington
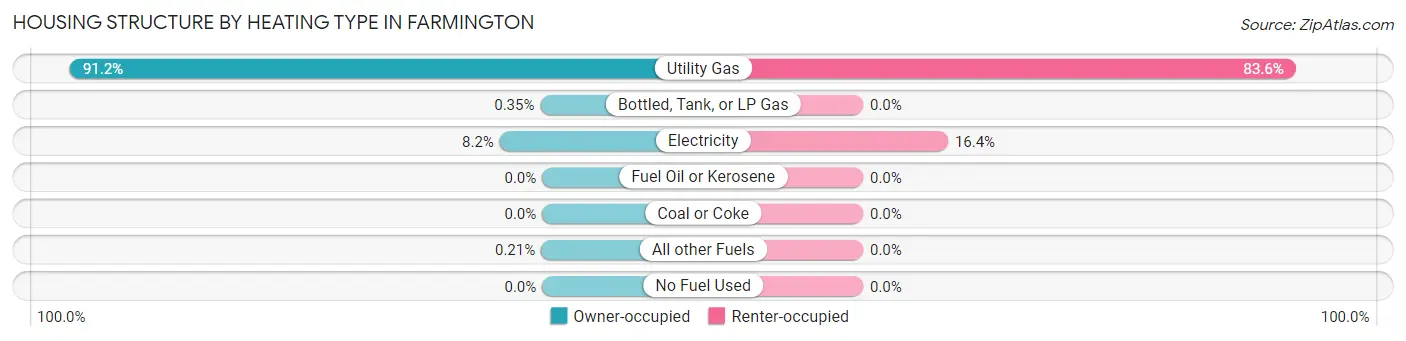
| Heating Type | Owner-occupied | Renter-occupied |
| Utility Gas | 5,158 (91.2%) | 1,034 (83.6%) |
| Bottled, Tank, or LP Gas | 20 (0.4%) | 0 (0.0%) |
| Electricity | 463 (8.2%) | 203 (16.4%) |
| Fuel Oil or Kerosene | 0 (0.0%) | 0 (0.0%) |
| Coal or Coke | 0 (0.0%) | 0 (0.0%) |
| All other Fuels | 12 (0.2%) | 0 (0.0%) |
| No Fuel Used | 0 (0.0%) | 0 (0.0%) |
| Total | 5,653 (100.0%) | 1,237 (100.0%) |
Household Vehicle Usage in Farmington
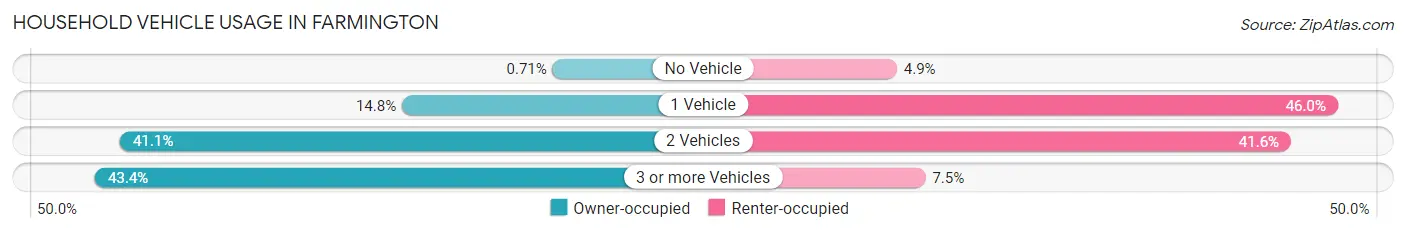
| Vehicles per Household | Owner-occupied | Renter-occupied |
| No Vehicle | 40 (0.7%) | 60 (4.9%) |
| 1 Vehicle | 835 (14.8%) | 569 (46.0%) |
| 2 Vehicles | 2,323 (41.1%) | 515 (41.6%) |
| 3 or more Vehicles | 2,455 (43.4%) | 93 (7.5%) |
| Total | 5,653 (100.0%) | 1,237 (100.0%) |
Real Estate & Mortgages in Farmington
Real Estate and Mortgage Overview in Farmington
| Characteristic | Without Mortgage | With Mortgage |
| Housing Units | 1,491 | 4,162 |
| Median Property Value | $556,900 | $558,900 |
| Median Household Income | $87,344 | $1,825 |
| Monthly Housing Costs | $650 | $762 |
| Real Estate Taxes | $2,801 | $76 |
Property Value by Mortgage Status in Farmington
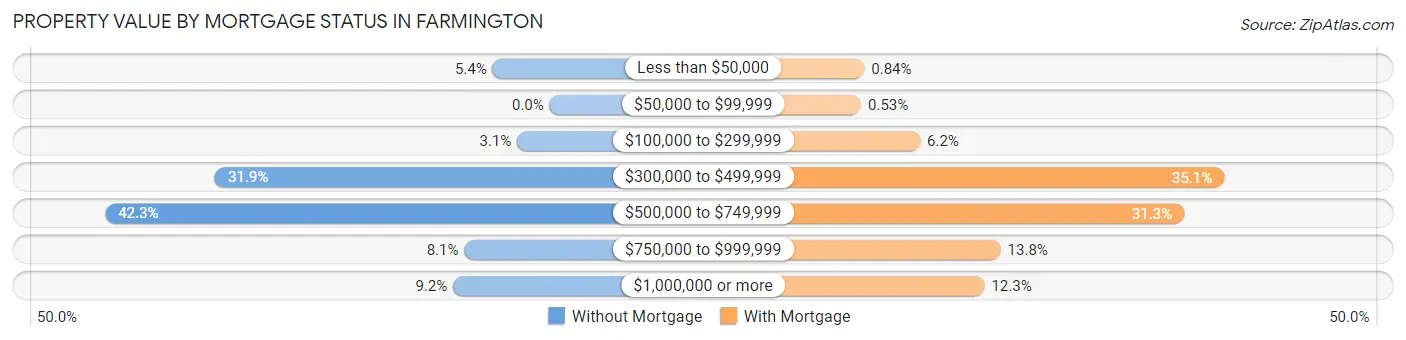
| Property Value | Without Mortgage | With Mortgage |
| Less than $50,000 | 81 (5.4%) | 35 (0.8%) |
| $50,000 to $99,999 | 0 (0.0%) | 22 (0.5%) |
| $100,000 to $299,999 | 46 (3.1%) | 256 (6.1%) |
| $300,000 to $499,999 | 475 (31.9%) | 1,461 (35.1%) |
| $500,000 to $749,999 | 631 (42.3%) | 1,302 (31.3%) |
| $750,000 to $999,999 | 121 (8.1%) | 575 (13.8%) |
| $1,000,000 or more | 137 (9.2%) | 511 (12.3%) |
| Total | 1,491 (100.0%) | 4,162 (100.0%) |
Household Income by Mortgage Status in Farmington
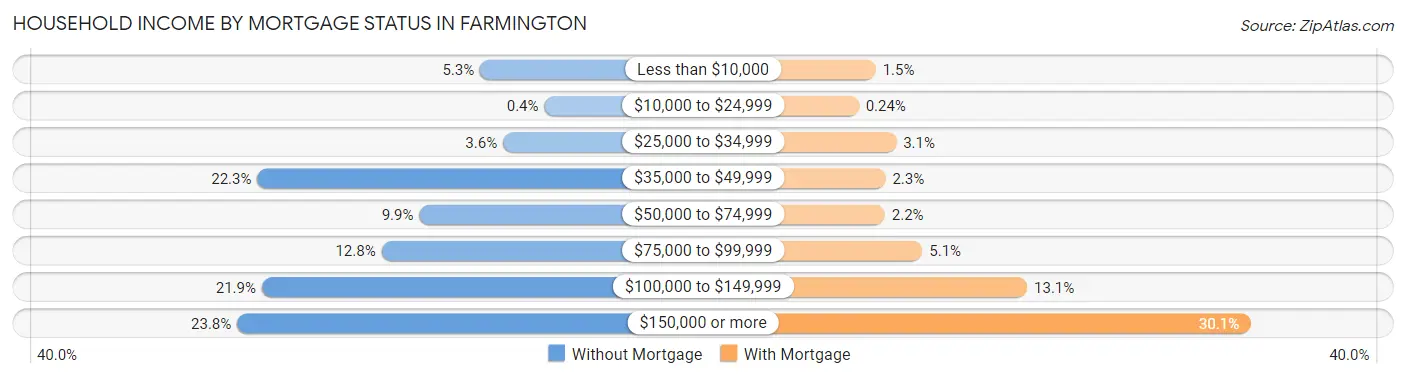
| Household Income | Without Mortgage | With Mortgage |
| Less than $10,000 | 79 (5.3%) | 64 (1.5%) |
| $10,000 to $24,999 | 6 (0.4%) | 10 (0.2%) |
| $25,000 to $34,999 | 53 (3.5%) | 129 (3.1%) |
| $35,000 to $49,999 | 332 (22.3%) | 95 (2.3%) |
| $50,000 to $74,999 | 148 (9.9%) | 93 (2.2%) |
| $75,000 to $99,999 | 191 (12.8%) | 212 (5.1%) |
| $100,000 to $149,999 | 327 (21.9%) | 544 (13.1%) |
| $150,000 or more | 355 (23.8%) | 1,254 (30.1%) |
| Total | 1,491 (100.0%) | 4,162 (100.0%) |
Property Value to Household Income Ratio in Farmington
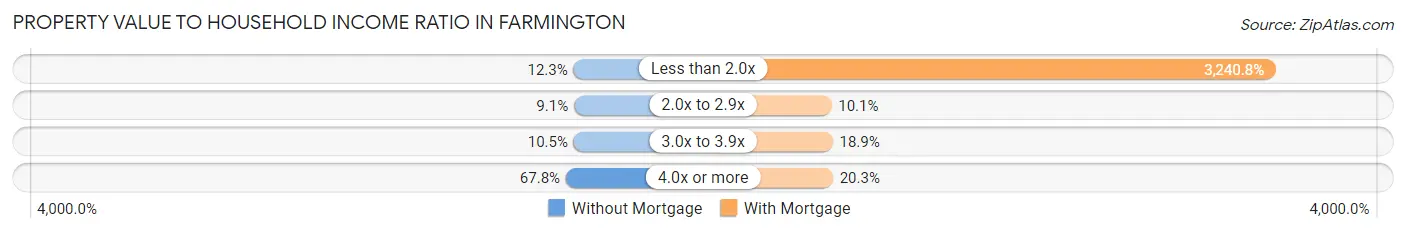
| Value-to-Income Ratio | Without Mortgage | With Mortgage |
| Less than 2.0x | 183 (12.3%) | 134,883 (3,240.8%) |
| 2.0x to 2.9x | 135 (9.0%) | 421 (10.1%) |
| 3.0x to 3.9x | 157 (10.5%) | 788 (18.9%) |
| 4.0x or more | 1,011 (67.8%) | 846 (20.3%) |
| Total | 1,491 (100.0%) | 4,162 (100.0%) |
Real Estate Taxes by Mortgage Status in Farmington
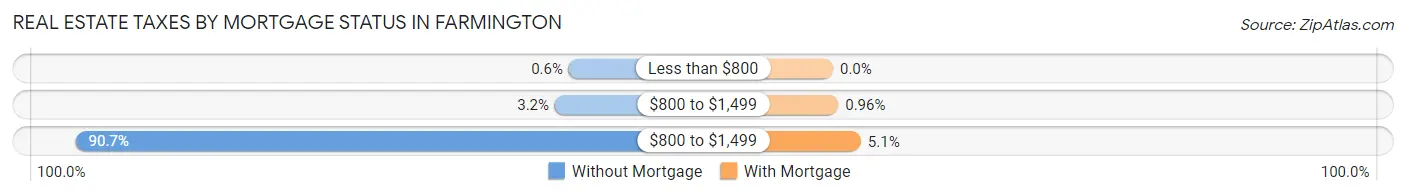
| Property Taxes | Without Mortgage | With Mortgage |
| Less than $800 | 9 (0.6%) | 0 (0.0%) |
| $800 to $1,499 | 47 (3.2%) | 40 (1.0%) |
| $800 to $1,499 | 1,352 (90.7%) | 212 (5.1%) |
| Total | 1,491 (100.0%) | 4,162 (100.0%) |
Health & Disability in Farmington
Health Insurance Coverage by Age in Farmington
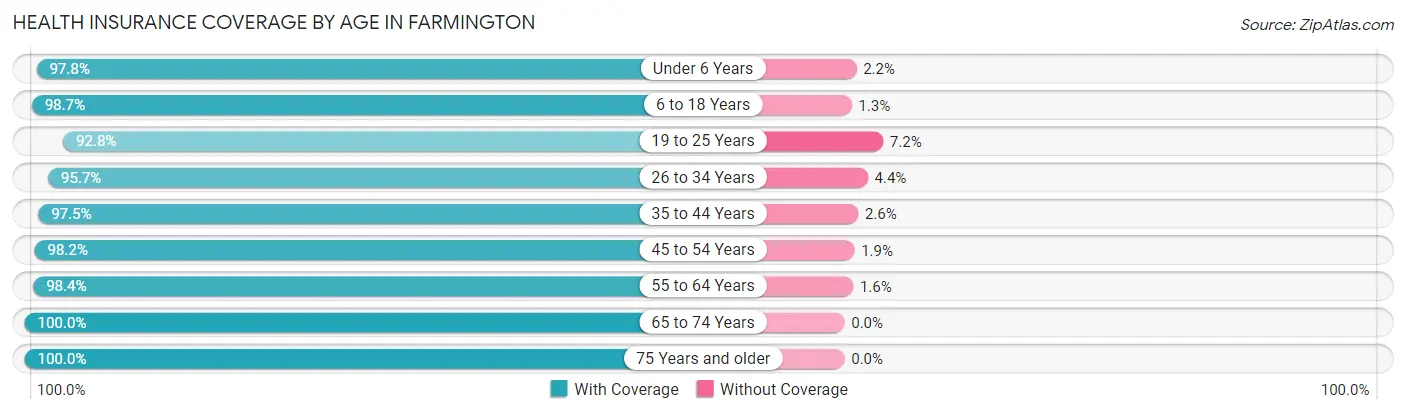
| Age Bracket | With Coverage | Without Coverage |
| Under 6 Years | 2,294 (97.8%) | 52 (2.2%) |
| 6 to 18 Years | 6,722 (98.7%) | 91 (1.3%) |
| 19 to 25 Years | 1,947 (92.8%) | 151 (7.2%) |
| 26 to 34 Years | 2,045 (95.7%) | 93 (4.3%) |
| 35 to 44 Years | 3,827 (97.5%) | 100 (2.5%) |
| 45 to 54 Years | 2,337 (98.2%) | 44 (1.8%) |
| 55 to 64 Years | 1,639 (98.4%) | 27 (1.6%) |
| 65 to 74 Years | 1,554 (100.0%) | 0 (0.0%) |
| 75 Years and older | 843 (100.0%) | 0 (0.0%) |
| Total | 23,208 (97.7%) | 558 (2.4%) |
Health Insurance Coverage by Citizenship Status in Farmington
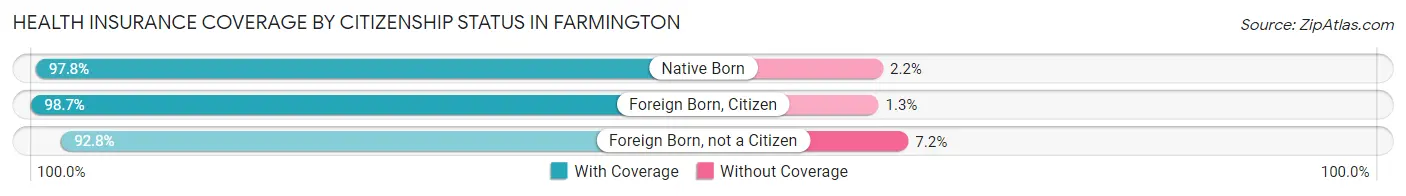
| Citizenship Status | With Coverage | Without Coverage |
| Native Born | 2,294 (97.8%) | 52 (2.2%) |
| Foreign Born, Citizen | 6,722 (98.7%) | 91 (1.3%) |
| Foreign Born, not a Citizen | 1,947 (92.8%) | 151 (7.2%) |
Health Insurance Coverage by Household Income in Farmington
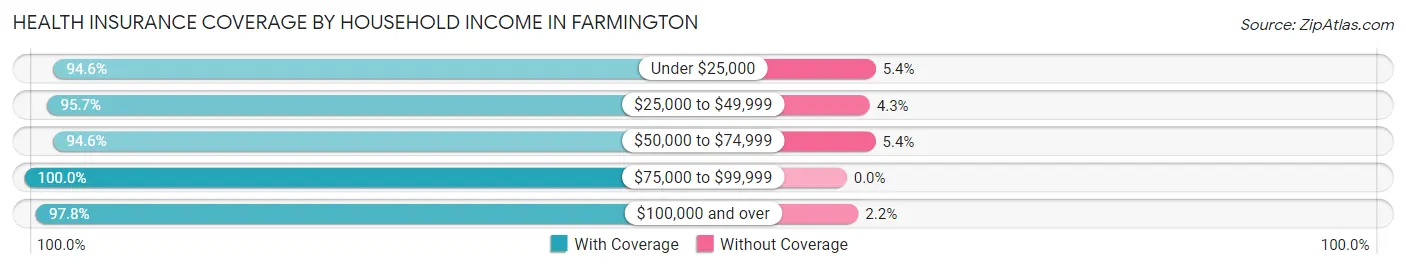
| Household Income | With Coverage | Without Coverage |
| Under $25,000 | 992 (94.6%) | 57 (5.4%) |
| $25,000 to $49,999 | 1,441 (95.7%) | 65 (4.3%) |
| $50,000 to $74,999 | 1,243 (94.6%) | 71 (5.4%) |
| $75,000 to $99,999 | 3,060 (100.0%) | 0 (0.0%) |
| $100,000 and over | 16,467 (97.8%) | 365 (2.2%) |
Public vs Private Health Insurance Coverage by Age in Farmington
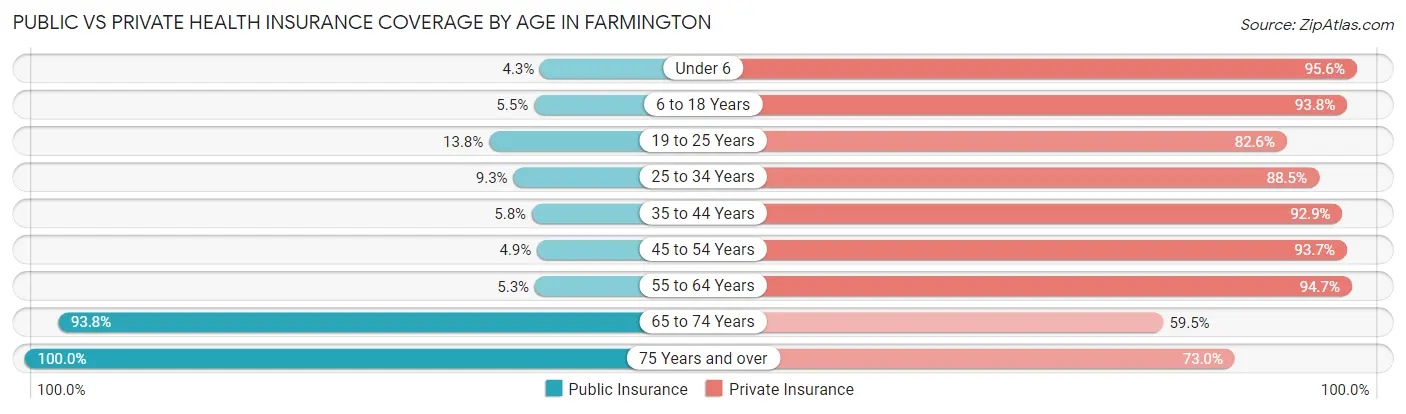
| Age Bracket | Public Insurance | Private Insurance |
| Under 6 | 101 (4.3%) | 2,242 (95.6%) |
| 6 to 18 Years | 371 (5.4%) | 6,390 (93.8%) |
| 19 to 25 Years | 289 (13.8%) | 1,733 (82.6%) |
| 25 to 34 Years | 198 (9.3%) | 1,893 (88.5%) |
| 35 to 44 Years | 229 (5.8%) | 3,649 (92.9%) |
| 45 to 54 Years | 116 (4.9%) | 2,231 (93.7%) |
| 55 to 64 Years | 88 (5.3%) | 1,577 (94.7%) |
| 65 to 74 Years | 1,458 (93.8%) | 925 (59.5%) |
| 75 Years and over | 843 (100.0%) | 615 (73.0%) |
| Total | 3,693 (15.5%) | 21,255 (89.4%) |
Disability Status by Sex by Age in Farmington
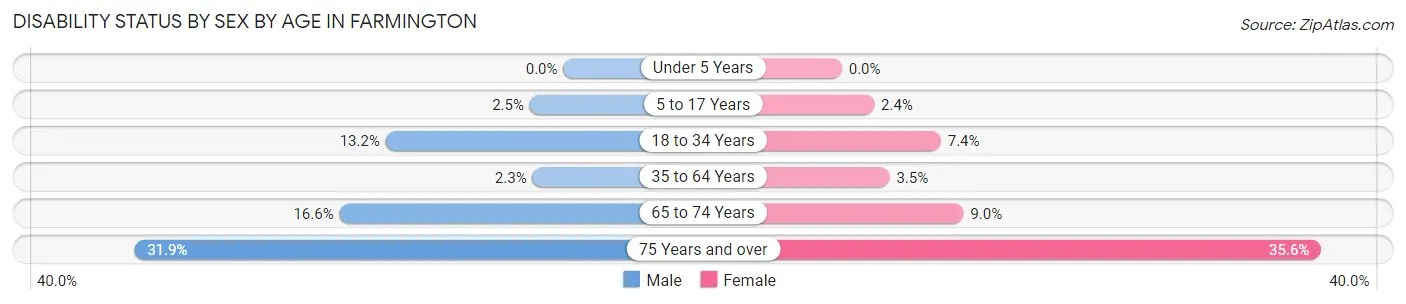
| Age Bracket | Male | Female |
| Under 5 Years | 0 (0.0%) | 0 (0.0%) |
| 5 to 17 Years | 92 (2.5%) | 77 (2.4%) |
| 18 to 34 Years | 283 (13.2%) | 185 (7.3%) |
| 35 to 64 Years | 92 (2.3%) | 140 (3.5%) |
| 65 to 74 Years | 111 (16.6%) | 80 (9.0%) |
| 75 Years and over | 137 (31.9%) | 147 (35.6%) |
Disability Class by Sex by Age in Farmington
Disability Class: Hearing Difficulty
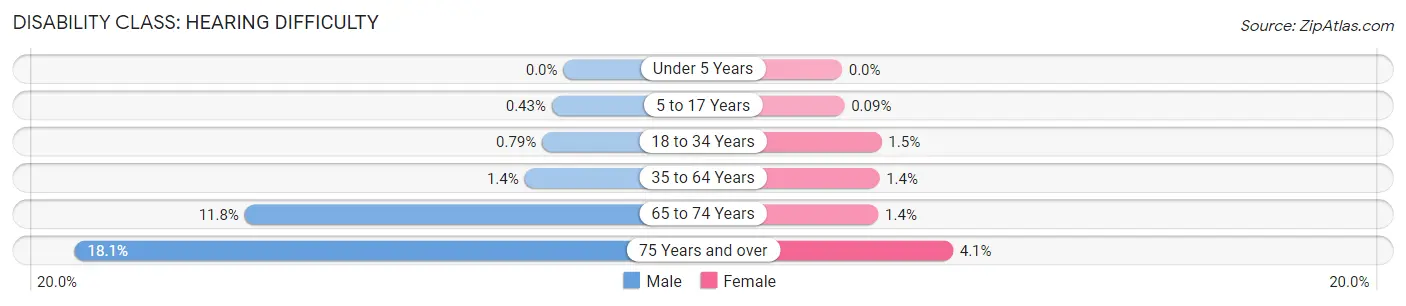
| Age Bracket | Male | Female |
| Under 5 Years | 0 (0.0%) | 0 (0.0%) |
| 5 to 17 Years | 16 (0.4%) | 3 (0.1%) |
| 18 to 34 Years | 17 (0.8%) | 37 (1.5%) |
| 35 to 64 Years | 58 (1.4%) | 55 (1.4%) |
| 65 to 74 Years | 79 (11.8%) | 12 (1.3%) |
| 75 Years and over | 78 (18.1%) | 17 (4.1%) |
Disability Class: Vision Difficulty
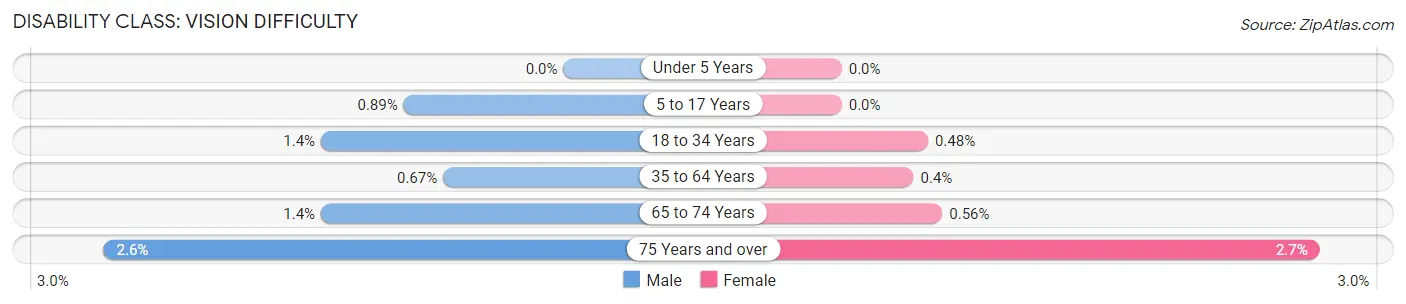
| Age Bracket | Male | Female |
| Under 5 Years | 0 (0.0%) | 0 (0.0%) |
| 5 to 17 Years | 33 (0.9%) | 0 (0.0%) |
| 18 to 34 Years | 29 (1.3%) | 12 (0.5%) |
| 35 to 64 Years | 27 (0.7%) | 16 (0.4%) |
| 65 to 74 Years | 9 (1.3%) | 5 (0.6%) |
| 75 Years and over | 11 (2.6%) | 11 (2.7%) |
Disability Class: Cognitive Difficulty
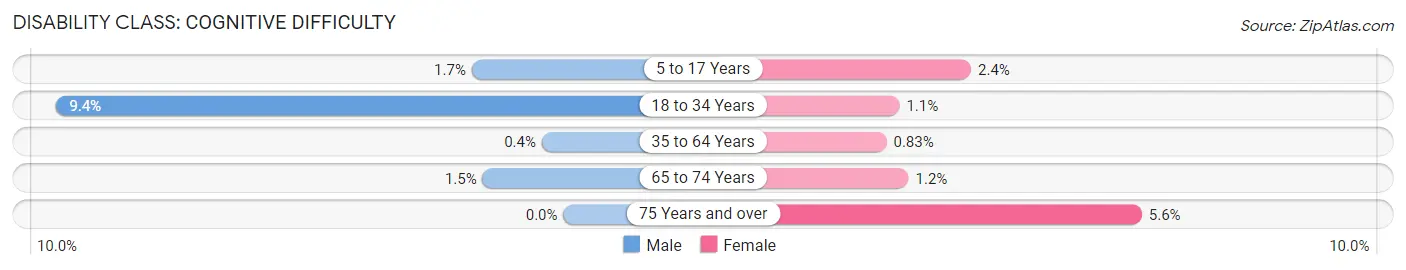
| Age Bracket | Male | Female |
| 5 to 17 Years | 63 (1.7%) | 77 (2.4%) |
| 18 to 34 Years | 202 (9.4%) | 27 (1.1%) |
| 35 to 64 Years | 16 (0.4%) | 33 (0.8%) |
| 65 to 74 Years | 10 (1.5%) | 11 (1.2%) |
| 75 Years and over | 0 (0.0%) | 23 (5.6%) |
Disability Class: Ambulatory Difficulty
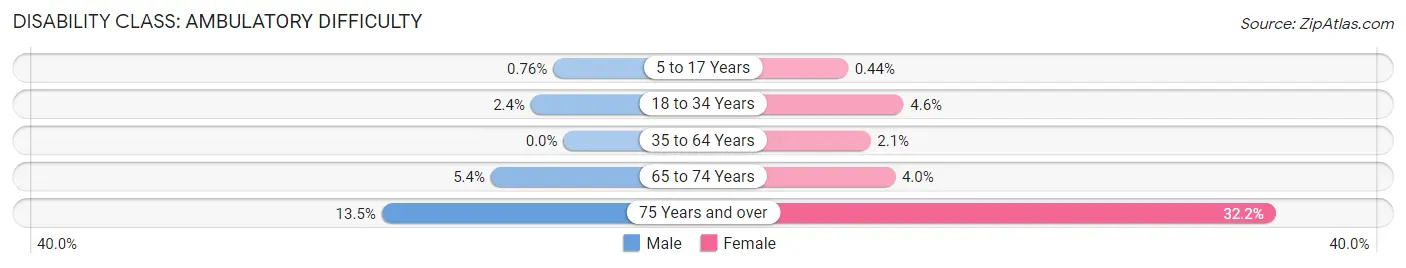
| Age Bracket | Male | Female |
| 5 to 17 Years | 28 (0.8%) | 14 (0.4%) |
| 18 to 34 Years | 52 (2.4%) | 115 (4.6%) |
| 35 to 64 Years | 0 (0.0%) | 84 (2.1%) |
| 65 to 74 Years | 36 (5.4%) | 35 (4.0%) |
| 75 Years and over | 58 (13.5%) | 133 (32.2%) |
Disability Class: Self-Care Difficulty
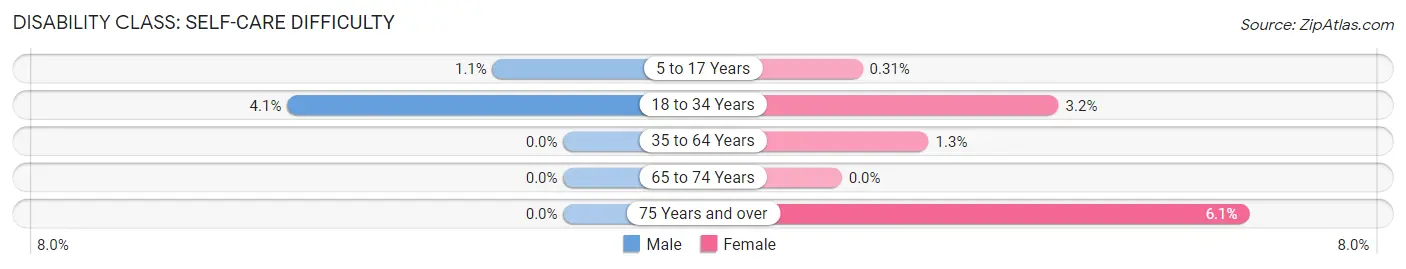
| Age Bracket | Male | Female |
| 5 to 17 Years | 39 (1.1%) | 10 (0.3%) |
| 18 to 34 Years | 88 (4.1%) | 81 (3.2%) |
| 35 to 64 Years | 0 (0.0%) | 51 (1.3%) |
| 65 to 74 Years | 0 (0.0%) | 0 (0.0%) |
| 75 Years and over | 0 (0.0%) | 25 (6.0%) |
Technology Access in Farmington
Computing Device Access in Farmington
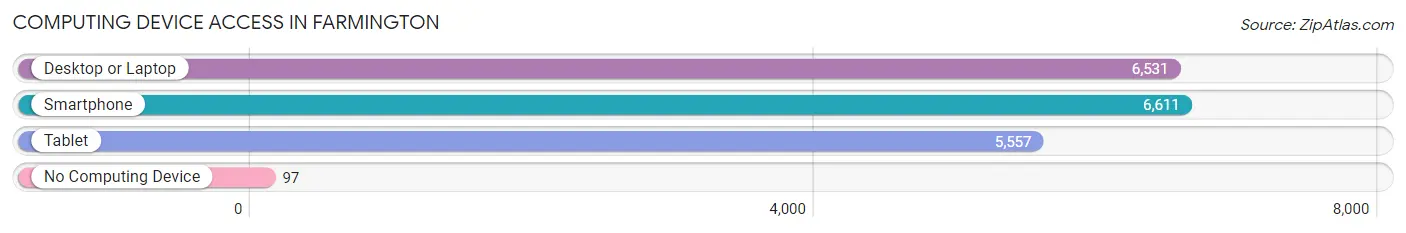
| Device Type | # Households | % Households |
| Desktop or Laptop | 6,531 | 94.8% |
| Smartphone | 6,611 | 96.0% |
| Tablet | 5,557 | 80.6% |
| No Computing Device | 97 | 1.4% |
| Total | 6,890 | 100.0% |
Internet Access in Farmington
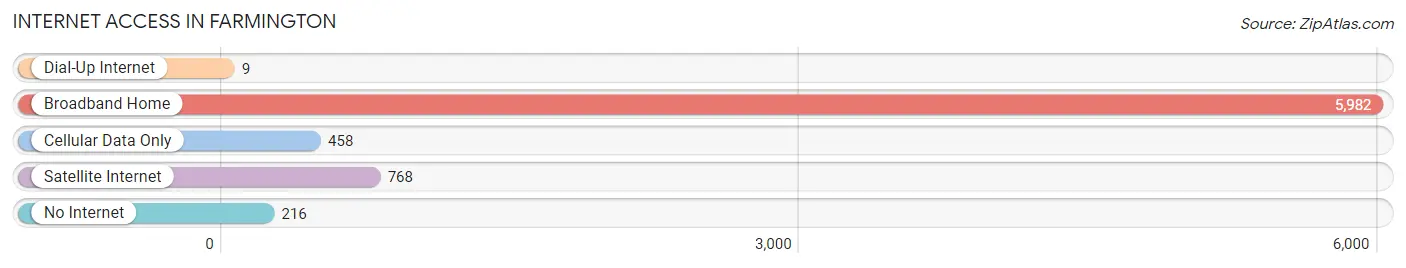
| Internet Type | # Households | % Households |
| Dial-Up Internet | 9 | 0.1% |
| Broadband Home | 5,982 | 86.8% |
| Cellular Data Only | 458 | 6.7% |
| Satellite Internet | 768 | 11.2% |
| No Internet | 216 | 3.1% |
| Total | 6,890 | 100.0% |
Farmington Summary
History
The area now known as Farmington, Utah was first settled in 1847 by a group of Mormon pioneers led by David Wilkin Farrington. The pioneers named the area after their hometown of Farmington, Connecticut. The area was originally part of the larger Davis County, but in 1868, the Utah Territorial Legislature created the county of Davis and Farmington was made the county seat.
The town grew slowly but steadily over the next few decades, and by the turn of the century, it had become a thriving agricultural community. The town was known for its orchards, which produced apples, peaches, and other fruits. The town also had a thriving dairy industry, and the local farmers sold their milk and cream to the Salt Lake City area.
In the early 1900s, the town began to expand beyond its agricultural roots. The first bank opened in 1906, and the first telephone service was established in 1907. The town also saw the construction of a new schoolhouse and a new church.
In the 1920s, the town began to experience a period of rapid growth. The population increased from 1,000 in 1920 to over 4,000 by 1930. This growth was due in part to the construction of the Davis and Weber County Canal, which provided irrigation for the area’s farms. The canal also provided a source of hydroelectric power, which allowed the town to expand its industrial base.
The town continued to grow throughout the 20th century, and by the year 2000, the population had reached over 18,000. The town has continued to grow since then, and as of 2019, the population was estimated to be over 22,000.
Geography
Farmington is located in northern Utah, in Davis County. It is situated at the base of the Wasatch Mountains, about 20 miles north of Salt Lake City. The town is bordered by the cities of Kaysville to the north, Layton to the east, and Fruit Heights to the south.
The town covers an area of about 8.5 square miles, and is situated at an elevation of 4,400 feet. The climate is semi-arid, with hot summers and cold winters. The average annual precipitation is about 17 inches.
Economy
The economy of Farmington is largely based on agriculture and manufacturing. The town is home to several large farms, which produce a variety of crops, including corn, wheat, hay, and alfalfa. The town is also home to several large manufacturing companies, including a paper mill, a plastics factory, and a metal fabrication plant.
The town is also home to several retail stores, restaurants, and other businesses. The town is served by the Davis County School District, which operates several elementary, middle, and high schools.
Demographics
As of the 2010 census, the population of Farmington was 18,275. The racial makeup of the town was 91.3% White, 1.2% African American, 0.7% Native American, 1.2% Asian, 0.2% Pacific Islander, 3.2% from other races, and 2.4% from two or more races. Hispanic or Latino of any race were 6.7% of the population.
The median household income in Farmington was $63,945, and the median family income was $71,945. The per capita income was $27,945. About 4.3% of families and 5.7% of the population were below the poverty line.
Common Questions
What is Per Capita Income in Farmington?
Per Capita income in Farmington is $42,021.
What is the Median Family Income in Farmington?
Median Family Income in Farmington is $126,578.
What is the Median Household income in Farmington?
Median Household Income in Farmington is $115,278.
What is Income or Wage Gap in Farmington?
Income or Wage Gap in Farmington is 65.1%.
Women in Farmington earn 34.9 cents for every dollar earned by a man.
What is Inequality or Gini Index in Farmington?
Inequality or Gini Index in Farmington is 0.41.
What is the Total Population of Farmington?
Total Population of Farmington is 24,463.
What is the Total Male Population of Farmington?
Total Male Population of Farmington is 12,601.
What is the Total Female Population of Farmington?
Total Female Population of Farmington is 11,862.
What is the Ratio of Males per 100 Females in Farmington?
There are 106.23 Males per 100 Females in Farmington.
What is the Ratio of Females per 100 Males in Farmington?
There are 94.14 Females per 100 Males in Farmington.
What is the Median Population Age in Farmington?
Median Population Age in Farmington is 30.1 Years.
What is the Average Family Size in Farmington
Average Family Size in Farmington is 4.0 People.
What is the Average Household Size in Farmington
Average Household Size in Farmington is 3.5 People.
How Large is the Labor Force in Farmington?
There are 10,809 People in the Labor Forcein in Farmington.
What is the Percentage of People in the Labor Force in Farmington?
64.5% of People are in the Labor Force in Farmington.
What is the Unemployment Rate in Farmington?
Unemployment Rate in Farmington is 2.2%.