Centerville, UT Map & Demographics
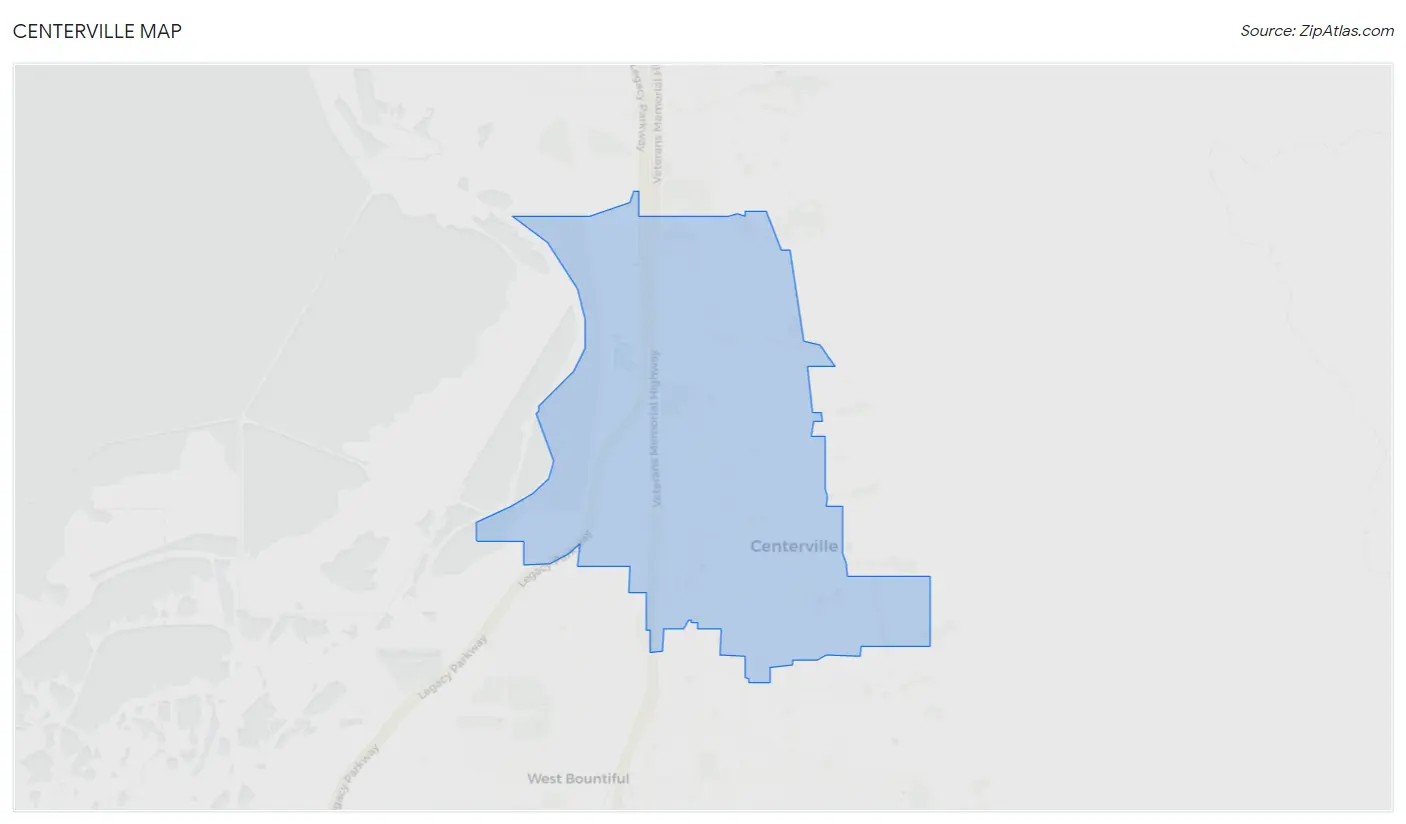
Centerville Map
Centerville Overview
$45,588
PER CAPITA INCOME
$127,301
AVG FAMILY INCOME
$113,697
AVG HOUSEHOLD INCOME
56.0%
WAGE / INCOME GAP [ % ]
44.0¢/ $1
WAGE / INCOME GAP [ $ ]
$4,087
FAMILY INCOME DEFICIT
0.39
INEQUALITY / GINI INDEX
16,740
TOTAL POPULATION
8,183
MALE POPULATION
8,557
FEMALE POPULATION
95.63
MALES / 100 FEMALES
104.57
FEMALES / 100 MALES
38.7
MEDIAN AGE
3.4
AVG FAMILY SIZE
2.9
AVG HOUSEHOLD SIZE
8,516
LABOR FORCE [ PEOPLE ]
66.3%
PERCENT IN LABOR FORCE
1.4%
UNEMPLOYMENT RATE
Centerville Zip Codes
Centerville Area Codes
Income in Centerville
Income Overview in Centerville
Per Capita Income in Centerville is $45,588, while median incomes of families and households are $127,301 and $113,697 respectively.
| Characteristic | Number | Measure |
| Per Capita Income | 16,740 | $45,588 |
| Median Family Income | 4,455 | $127,301 |
| Mean Family Income | 4,455 | $150,938 |
| Median Household Income | 5,675 | $113,697 |
| Mean Household Income | 5,675 | $131,645 |
| Income Deficit | 4,455 | $4,087 |
| Wage / Income Gap (%) | 16,740 | 56.03% |
| Wage / Income Gap ($) | 16,740 | 43.97¢ per $1 |
| Gini / Inequality Index | 16,740 | 0.39 |
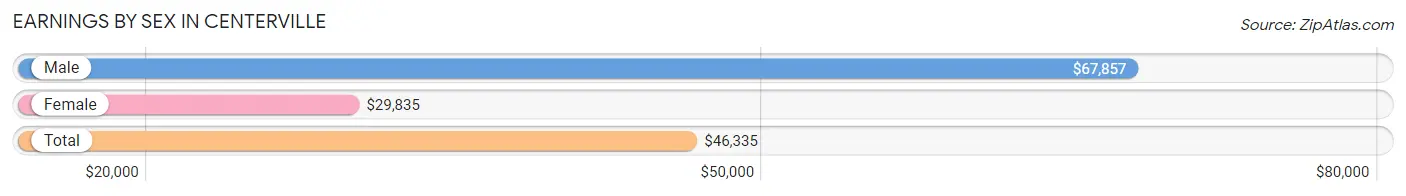
Earnings by Sex in Centerville
Average Earnings in Centerville are $46,335, $67,857 for men and $29,835 for women, a difference of 56.0%.
| Sex | Number | Average Earnings |
| Male | 4,914 (54.9%) | $67,857 |
| Female | 4,036 (45.1%) | $29,835 |
| Total | 8,950 (100.0%) | $46,335 |
Earnings by Sex by Income Bracket in Centerville
The most common earnings brackets in Centerville are $100,000+ for men (1,718 | 35.0%) and $2,499 or less for women (414 | 10.3%).
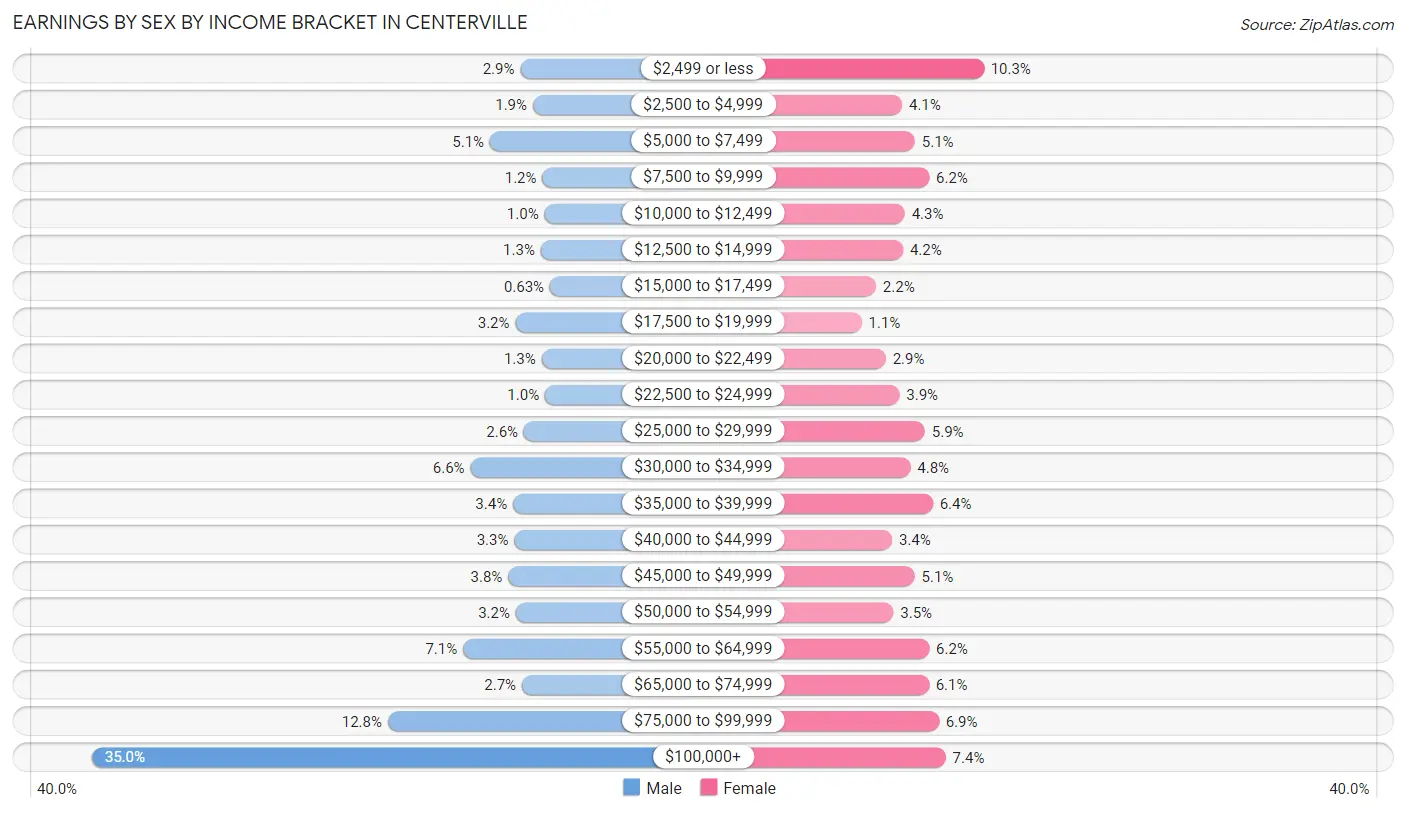
| Income | Male | Female |
| $2,499 or less | 140 (2.9%) | 414 (10.3%) |
| $2,500 to $4,999 | 94 (1.9%) | 167 (4.1%) |
| $5,000 to $7,499 | 252 (5.1%) | 206 (5.1%) |
| $7,500 to $9,999 | 59 (1.2%) | 249 (6.2%) |
| $10,000 to $12,499 | 51 (1.0%) | 175 (4.3%) |
| $12,500 to $14,999 | 65 (1.3%) | 170 (4.2%) |
| $15,000 to $17,499 | 31 (0.6%) | 88 (2.2%) |
| $17,500 to $19,999 | 158 (3.2%) | 45 (1.1%) |
| $20,000 to $22,499 | 62 (1.3%) | 118 (2.9%) |
| $22,500 to $24,999 | 49 (1.0%) | 159 (3.9%) |
| $25,000 to $29,999 | 127 (2.6%) | 236 (5.9%) |
| $30,000 to $34,999 | 324 (6.6%) | 192 (4.8%) |
| $35,000 to $39,999 | 167 (3.4%) | 260 (6.4%) |
| $40,000 to $44,999 | 162 (3.3%) | 137 (3.4%) |
| $45,000 to $49,999 | 185 (3.8%) | 205 (5.1%) |
| $50,000 to $54,999 | 157 (3.2%) | 141 (3.5%) |
| $55,000 to $64,999 | 351 (7.1%) | 249 (6.2%) |
| $65,000 to $74,999 | 134 (2.7%) | 248 (6.1%) |
| $75,000 to $99,999 | 628 (12.8%) | 278 (6.9%) |
| $100,000+ | 1,718 (35.0%) | 299 (7.4%) |
| Total | 4,914 (100.0%) | 4,036 (100.0%) |
Earnings by Sex by Educational Attainment in Centerville
Average earnings in Centerville are $84,611 for men and $36,540 for women, a difference of 56.8%. Men with an educational attainment of graduate degree enjoy the highest average annual earnings of $118,828, while those with less than high school education earn the least with $45,859. Women with an educational attainment of graduate degree earn the most with the average annual earnings of $71,607, while those with high school diploma education have the smallest earnings of $21,979.
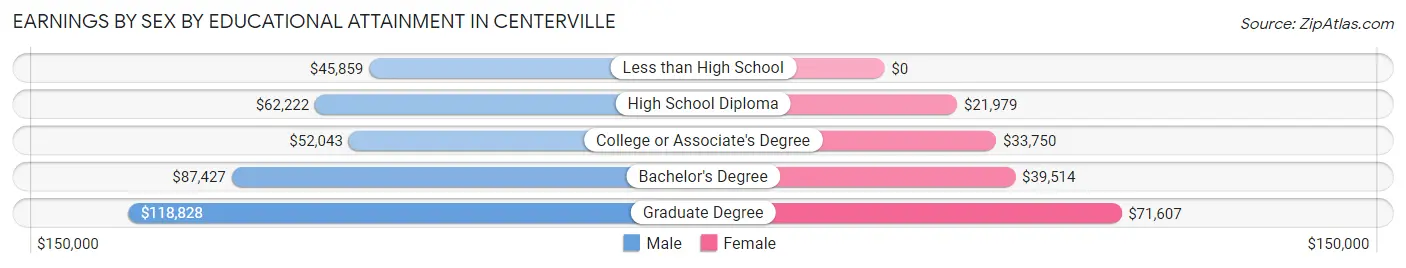
| Educational Attainment | Male Income | Female Income |
| Less than High School | $45,859 | $0 |
| High School Diploma | $62,222 | $21,979 |
| College or Associate's Degree | $52,043 | $33,750 |
| Bachelor's Degree | $87,427 | $39,514 |
| Graduate Degree | $118,828 | $71,607 |
| Total | $84,611 | $36,540 |
Family Income in Centerville
Family Income Brackets in Centerville
According to the Centerville family income data, there are 1,314 families falling into the $100,000 to $149,999 income range, which is the most common income bracket and makes up 29.5% of all families.
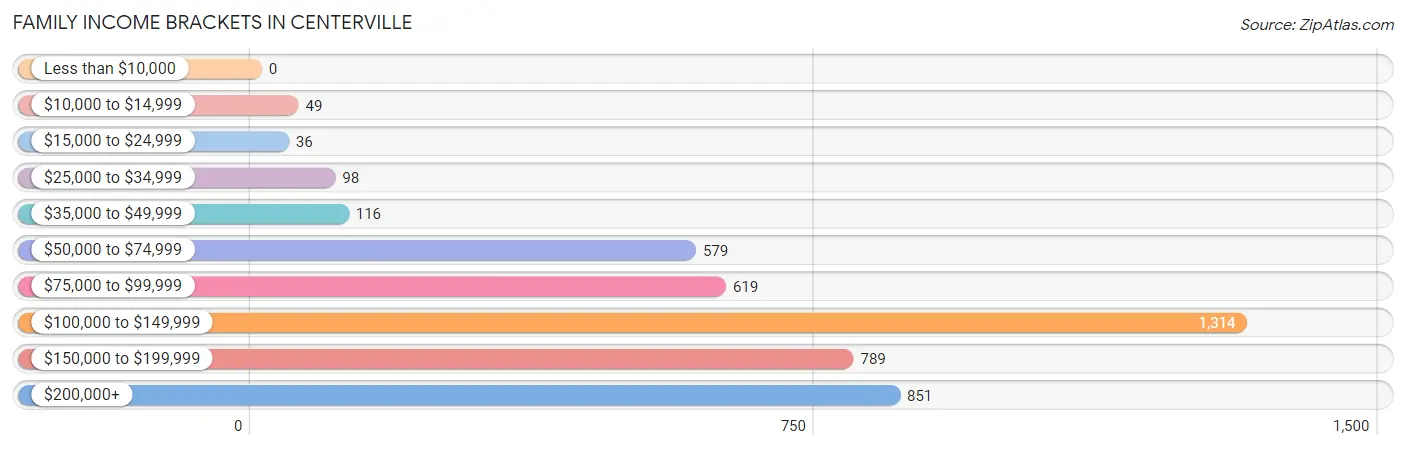
| Income Bracket | # Families | % Families |
| Less than $10,000 | 0 | 0.0% |
| $10,000 to $14,999 | 49 | 1.1% |
| $15,000 to $24,999 | 36 | 0.8% |
| $25,000 to $34,999 | 98 | 2.2% |
| $35,000 to $49,999 | 116 | 2.6% |
| $50,000 to $74,999 | 579 | 13.0% |
| $75,000 to $99,999 | 619 | 13.9% |
| $100,000 to $149,999 | 1,314 | 29.5% |
| $150,000 to $199,999 | 789 | 17.7% |
| $200,000+ | 851 | 19.1% |
Family Income by Famaliy Size in Centerville
7+ person families (249 | 5.6%) account for the highest median family income in Centerville with $189,886 per family, while 2-person families (1,953 | 43.8%) have the highest median income of $50,038 per family member.
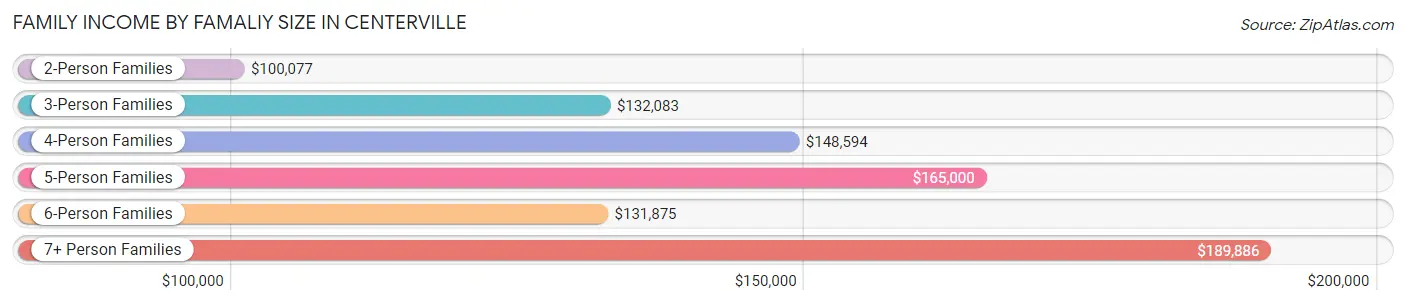
| Income Bracket | # Families | Median Income |
| 2-Person Families | 1,953 (43.8%) | $100,077 |
| 3-Person Families | 885 (19.9%) | $132,083 |
| 4-Person Families | 695 (15.6%) | $148,594 |
| 5-Person Families | 442 (9.9%) | $165,000 |
| 6-Person Families | 231 (5.2%) | $131,875 |
| 7+ Person Families | 249 (5.6%) | $189,886 |
| Total | 4,455 (100.0%) | $127,301 |
Family Income by Number of Earners in Centerville
The median family income in Centerville is $127,301, with families comprising 3+ earners (827) having the highest median family income of $172,862, while families with no earners (532) have the lowest median family income of $78,911, accounting for 18.6% and 11.9% of families, respectively.
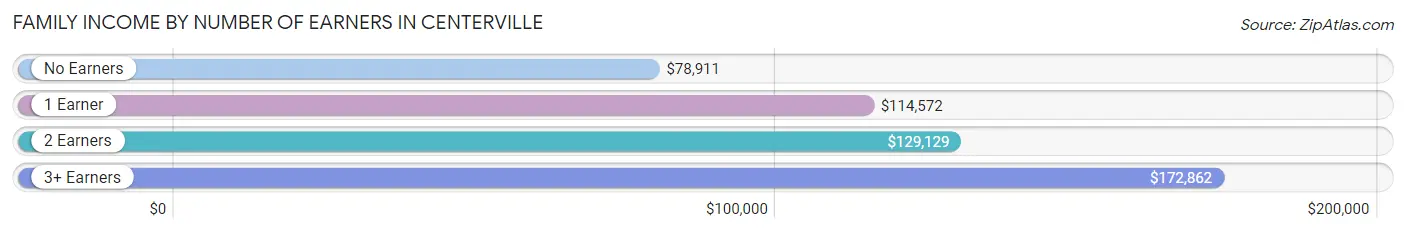
| Number of Earners | # Families | Median Income |
| No Earners | 532 (11.9%) | $78,911 |
| 1 Earner | 1,135 (25.5%) | $114,572 |
| 2 Earners | 1,961 (44.0%) | $129,129 |
| 3+ Earners | 827 (18.6%) | $172,862 |
| Total | 4,455 (100.0%) | $127,301 |
Household Income in Centerville
Household Income Brackets in Centerville
With 1,419 households falling in the category, the $100,000 to $149,999 income range is the most frequent in Centerville, accounting for 25.0% of all households. In contrast, only 45 households (0.8%) fall into the less than $10,000 income bracket, making it the least populous group.
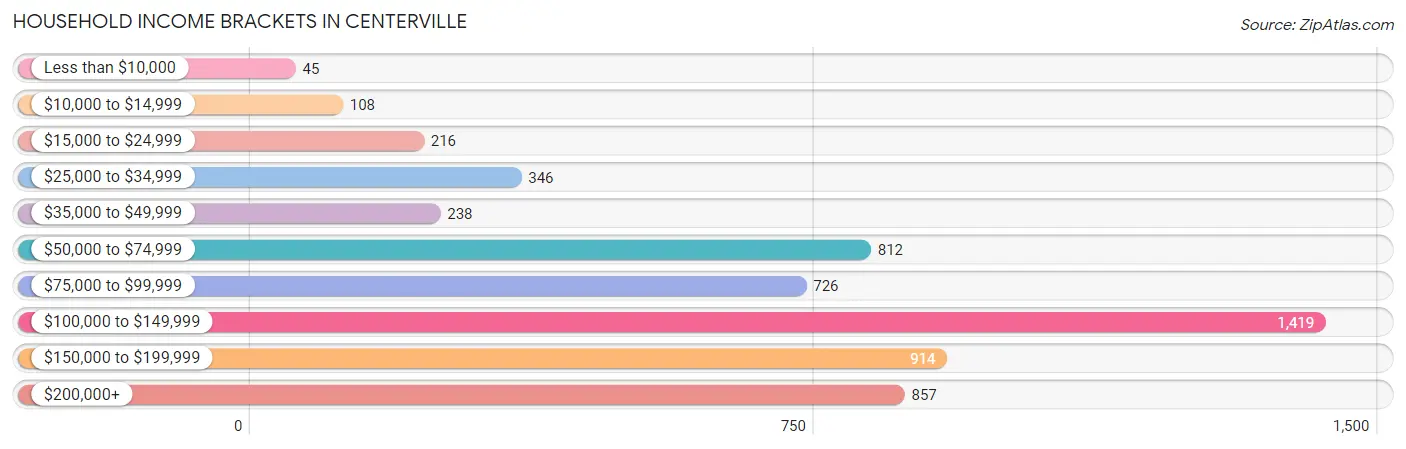
| Income Bracket | # Households | % Households |
| Less than $10,000 | 45 | 0.8% |
| $10,000 to $14,999 | 108 | 1.9% |
| $15,000 to $24,999 | 216 | 3.8% |
| $25,000 to $34,999 | 346 | 6.1% |
| $35,000 to $49,999 | 238 | 4.2% |
| $50,000 to $74,999 | 812 | 14.3% |
| $75,000 to $99,999 | 726 | 12.8% |
| $100,000 to $149,999 | 1,419 | 25.0% |
| $150,000 to $199,999 | 914 | 16.1% |
| $200,000+ | 857 | 15.1% |
Household Income by Householder Age in Centerville
The median household income in Centerville is $113,697, with the highest median household income of $134,762 found in the 45 to 64 years age bracket for the primary householder. A total of 1,950 households (34.4%) fall into this category. Meanwhile, the 15 to 24 years age bracket for the primary householder has the lowest median household income of $75,143, with 96 households (1.7%) in this group.
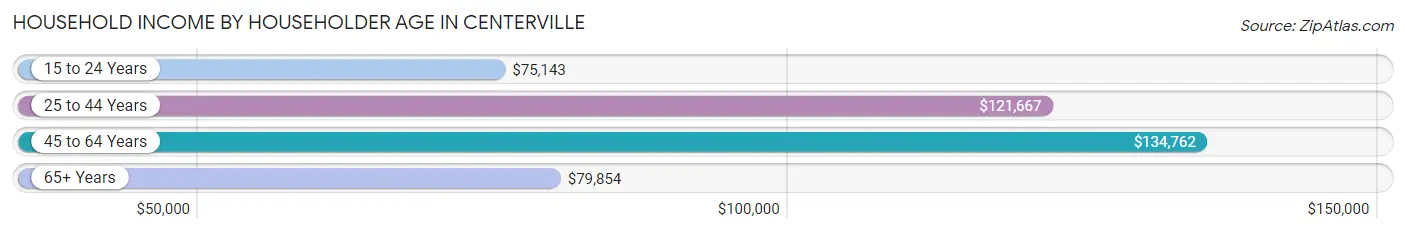
| Income Bracket | # Households | Median Income |
| 15 to 24 Years | 96 (1.7%) | $75,143 |
| 25 to 44 Years | 1,786 (31.5%) | $121,667 |
| 45 to 64 Years | 1,950 (34.4%) | $134,762 |
| 65+ Years | 1,843 (32.5%) | $79,854 |
| Total | 5,675 (100.0%) | $113,697 |
Poverty in Centerville
Income Below Poverty by Sex and Age in Centerville
With 2.0% poverty level for males and 3.2% for females among the residents of Centerville, 16 and 17 year old males and 65 to 74 year old females are the most vulnerable to poverty, with 20 males (7.2%) and 105 females (12.1%) in their respective age groups living below the poverty level.
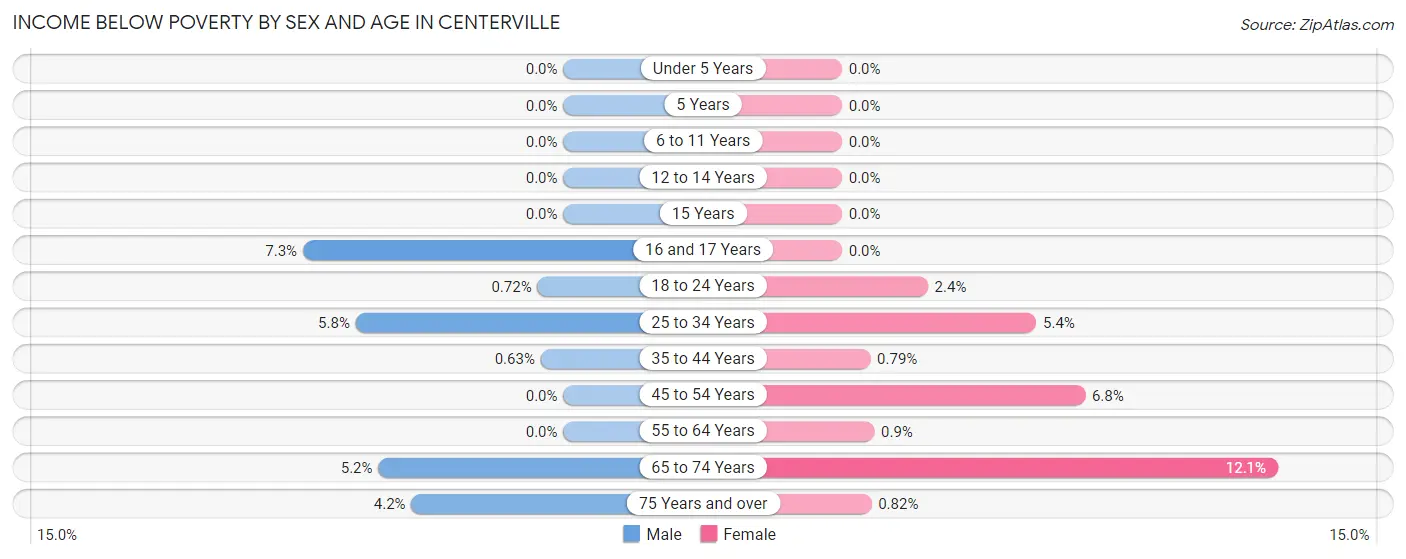
| Age Bracket | Male | Female |
| Under 5 Years | 0 (0.0%) | 0 (0.0%) |
| 5 Years | 0 (0.0%) | 0 (0.0%) |
| 6 to 11 Years | 0 (0.0%) | 0 (0.0%) |
| 12 to 14 Years | 0 (0.0%) | 0 (0.0%) |
| 15 Years | 0 (0.0%) | 0 (0.0%) |
| 16 and 17 Years | 20 (7.2%) | 0 (0.0%) |
| 18 to 24 Years | 4 (0.7%) | 13 (2.4%) |
| 25 to 34 Years | 66 (5.8%) | 57 (5.4%) |
| 35 to 44 Years | 6 (0.6%) | 8 (0.8%) |
| 45 to 54 Years | 0 (0.0%) | 71 (6.8%) |
| 55 to 64 Years | 0 (0.0%) | 9 (0.9%) |
| 65 to 74 Years | 45 (5.1%) | 105 (12.1%) |
| 75 Years and over | 24 (4.2%) | 7 (0.8%) |
| Total | 165 (2.0%) | 270 (3.2%) |
Income Above Poverty by Sex and Age in Centerville
According to the poverty statistics in Centerville, males aged under 5 years and females aged under 5 years are the age groups that are most secure financially, with 100.0% of males and 100.0% of females in these age groups living above the poverty line.
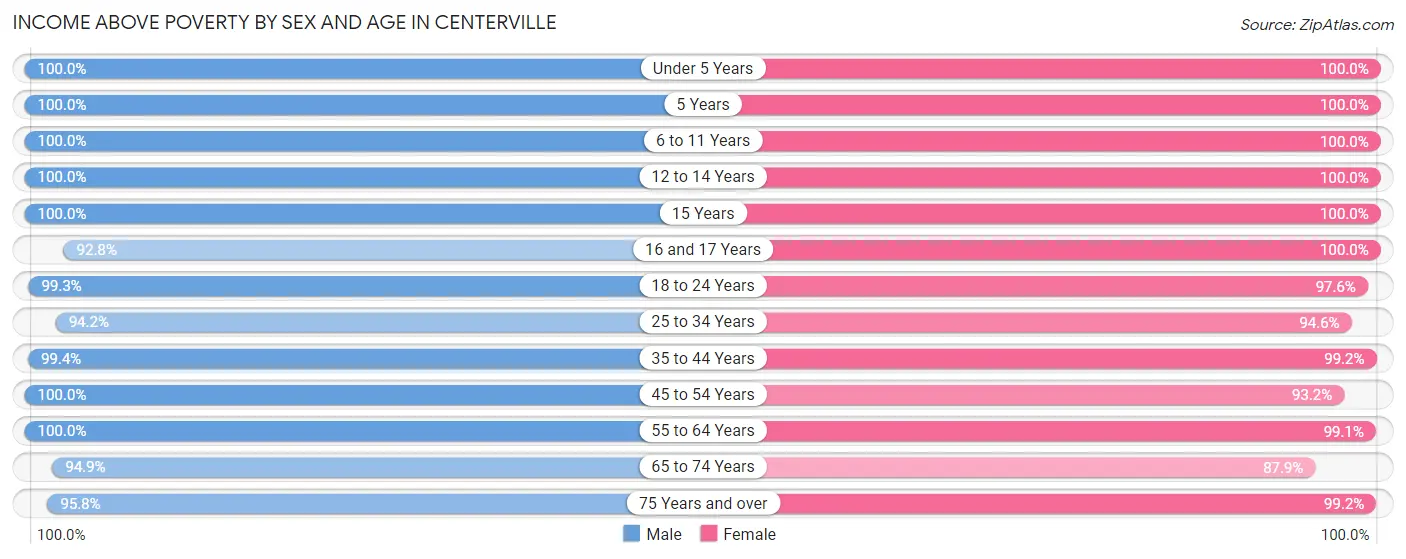
| Age Bracket | Male | Female |
| Under 5 Years | 449 (100.0%) | 593 (100.0%) |
| 5 Years | 129 (100.0%) | 81 (100.0%) |
| 6 to 11 Years | 827 (100.0%) | 812 (100.0%) |
| 12 to 14 Years | 421 (100.0%) | 227 (100.0%) |
| 15 Years | 175 (100.0%) | 182 (100.0%) |
| 16 and 17 Years | 256 (92.7%) | 238 (100.0%) |
| 18 to 24 Years | 553 (99.3%) | 532 (97.6%) |
| 25 to 34 Years | 1,076 (94.2%) | 997 (94.6%) |
| 35 to 44 Years | 945 (99.4%) | 1,011 (99.2%) |
| 45 to 54 Years | 911 (100.0%) | 977 (93.2%) |
| 55 to 64 Years | 896 (100.0%) | 993 (99.1%) |
| 65 to 74 Years | 829 (94.9%) | 760 (87.9%) |
| 75 Years and over | 543 (95.8%) | 847 (99.2%) |
| Total | 8,010 (98.0%) | 8,250 (96.8%) |
Income Below Poverty Among Married-Couple Families in Centerville
The poverty statistics for married-couple families in Centerville show that 1.5% or 60 of the total 4,001 families live below the poverty line. Families with no children have the highest poverty rate of 2.8%, comprising of 60 families. On the other hand, families with 1 or 2 children have the lowest poverty rate of 0.0%, which includes 0 families.
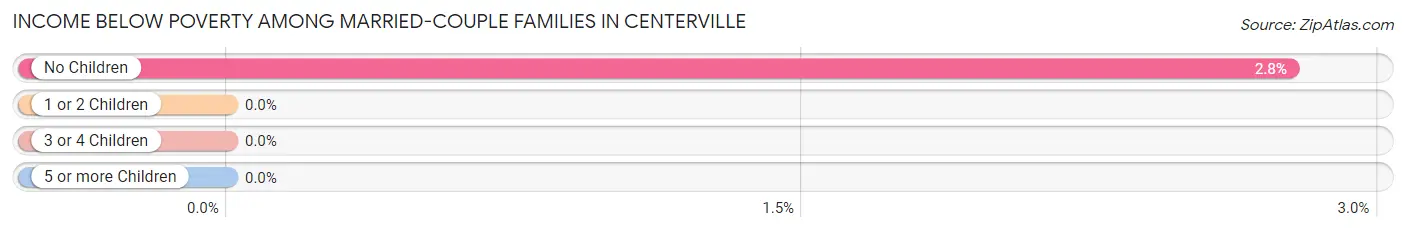
| Children | Above Poverty | Below Poverty |
| No Children | 2,109 (97.2%) | 60 (2.8%) |
| 1 or 2 Children | 1,143 (100.0%) | 0 (0.0%) |
| 3 or 4 Children | 509 (100.0%) | 0 (0.0%) |
| 5 or more Children | 180 (100.0%) | 0 (0.0%) |
| Total | 3,941 (98.5%) | 60 (1.5%) |
Income Below Poverty Among Single-Parent Households in Centerville
| Children | Single Father | Single Mother |
| No Children | 0 (0.0%) | 0 (0.0%) |
| 1 or 2 Children | 0 (0.0%) | 0 (0.0%) |
| 3 or 4 Children | 0 (0.0%) | 0 (0.0%) |
| 5 or more Children | 0 (0.0%) | 0 (0.0%) |
| Total | 0 (0.0%) | 0 (0.0%) |
Income Below Poverty Among Married-Couple vs Single-Parent Households in Centerville
| Children | Married-Couple Families | Single-Parent Households |
| No Children | 60 (2.8%) | 0 (0.0%) |
| 1 or 2 Children | 0 (0.0%) | 0 (0.0%) |
| 3 or 4 Children | 0 (0.0%) | 0 (0.0%) |
| 5 or more Children | 0 (0.0%) | 0 (0.0%) |
| Total | 60 (1.5%) | 0 (0.0%) |
Race in Centerville
The most populous races in Centerville are White / Caucasian (15,209 | 90.8%), Hispanic or Latino (1,168 | 7.0%), and Two or more Races (626 | 3.7%).
| Race | # Population | % Population |
| Asian | 217 | 1.3% |
| Black / African American | 151 | 0.9% |
| Hawaiian / Pacific | 336 | 2.0% |
| Hispanic or Latino | 1,168 | 7.0% |
| Native / Alaskan | 19 | 0.1% |
| White / Caucasian | 15,209 | 90.8% |
| Two or more Races | 626 | 3.7% |
| Some other Race | 182 | 1.1% |
| Total | 16,740 | 100.0% |
Ancestry in Centerville
The most populous ancestries reported in Centerville are English (6,289 | 37.6%), German (1,612 | 9.6%), Danish (952 | 5.7%), European (951 | 5.7%), and Scottish (832 | 5.0%), together accounting for 63.5% of all Centerville residents.
| Ancestry | # Population | % Population |
| African | 48 | 0.3% |
| American | 524 | 3.1% |
| Arab | 16 | 0.1% |
| Argentinean | 37 | 0.2% |
| Armenian | 27 | 0.2% |
| Australian | 37 | 0.2% |
| Austrian | 18 | 0.1% |
| Belgian | 30 | 0.2% |
| Bhutanese | 56 | 0.3% |
| Blackfeet | 7 | 0.0% |
| British | 594 | 3.5% |
| Burmese | 53 | 0.3% |
| Canadian | 5 | 0.0% |
| Central American | 76 | 0.4% |
| Central American Indian | 19 | 0.1% |
| Colombian | 6 | 0.0% |
| Croatian | 21 | 0.1% |
| Cuban | 21 | 0.1% |
| Czech | 29 | 0.2% |
| Danish | 952 | 5.7% |
| Dutch | 232 | 1.4% |
| Ecuadorian | 66 | 0.4% |
| English | 6,289 | 37.6% |
| Ethiopian | 6 | 0.0% |
| European | 951 | 5.7% |
| Finnish | 78 | 0.5% |
| French | 163 | 1.0% |
| German | 1,612 | 9.6% |
| Greek | 11 | 0.1% |
| Guatemalan | 67 | 0.4% |
| Hungarian | 108 | 0.6% |
| Icelander | 9 | 0.1% |
| Indian (Asian) | 141 | 0.8% |
| Iranian | 66 | 0.4% |
| Irish | 573 | 3.4% |
| Italian | 334 | 2.0% |
| Korean | 102 | 0.6% |
| Lebanese | 16 | 0.1% |
| Lumbee | 6 | 0.0% |
| Malaysian | 36 | 0.2% |
| Mexican | 534 | 3.2% |
| Native Hawaiian | 48 | 0.3% |
| Northern European | 71 | 0.4% |
| Norwegian | 357 | 2.1% |
| Ottawa | 18 | 0.1% |
| Panamanian | 9 | 0.1% |
| Pennsylvania German | 29 | 0.2% |
| Peruvian | 116 | 0.7% |
| Polish | 100 | 0.6% |
| Portuguese | 14 | 0.1% |
| Puerto Rican | 48 | 0.3% |
| Romanian | 1 | 0.0% |
| Russian | 10 | 0.1% |
| Scandinavian | 193 | 1.1% |
| Scotch-Irish | 100 | 0.6% |
| Scottish | 832 | 5.0% |
| Sioux | 15 | 0.1% |
| Slovak | 8 | 0.1% |
| South American | 240 | 1.4% |
| Spaniard | 35 | 0.2% |
| Spanish | 89 | 0.5% |
| Subsaharan African | 54 | 0.3% |
| Swedish | 581 | 3.5% |
| Swiss | 488 | 2.9% |
| Thai | 11 | 0.1% |
| Tongan | 304 | 1.8% |
| Venezuelan | 15 | 0.1% |
| Welsh | 437 | 2.6% | View All 68 Rows |
Immigrants in Centerville
The most numerous immigrant groups reported in Centerville came from Latin America (253 | 1.5%), South America (128 | 0.8%), Central America (125 | 0.7%), Asia (79 | 0.5%), and Mexico (74 | 0.4%), together accounting for 3.9% of all Centerville residents.
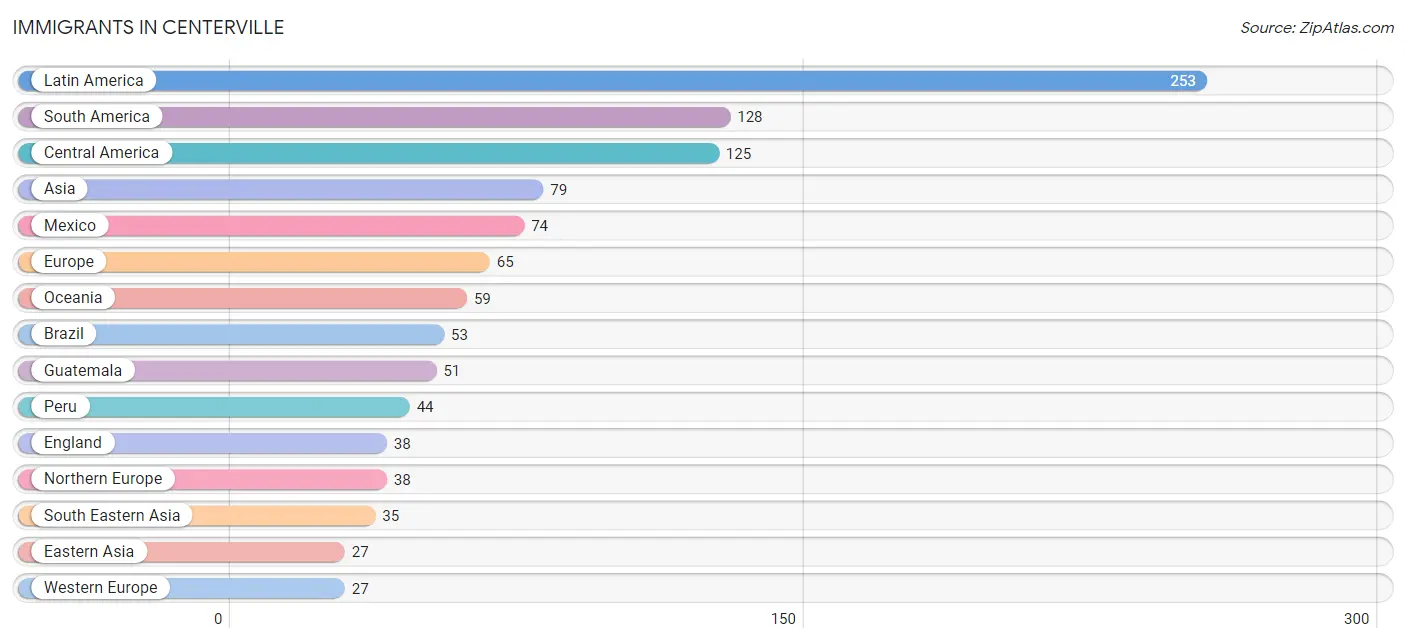
| Immigration Origin | # Population | % Population |
| Africa | 16 | 0.1% |
| Argentina | 10 | 0.1% |
| Asia | 79 | 0.5% |
| Australia | 18 | 0.1% |
| Austria | 19 | 0.1% |
| Bolivia | 21 | 0.1% |
| Brazil | 53 | 0.3% |
| Canada | 13 | 0.1% |
| Central America | 125 | 0.7% |
| China | 15 | 0.1% |
| Eastern Africa | 6 | 0.0% |
| Eastern Asia | 27 | 0.2% |
| England | 38 | 0.2% |
| Ethiopia | 6 | 0.0% |
| Europe | 65 | 0.4% |
| Ghana | 10 | 0.1% |
| Guatemala | 51 | 0.3% |
| Iran | 17 | 0.1% |
| Korea | 12 | 0.1% |
| Laos | 14 | 0.1% |
| Latin America | 253 | 1.5% |
| Mexico | 74 | 0.4% |
| Netherlands | 8 | 0.1% |
| Northern Europe | 38 | 0.2% |
| Oceania | 59 | 0.4% |
| Peru | 44 | 0.3% |
| Philippines | 21 | 0.1% |
| South America | 128 | 0.8% |
| South Central Asia | 17 | 0.1% |
| South Eastern Asia | 35 | 0.2% |
| Western Africa | 10 | 0.1% |
| Western Europe | 27 | 0.2% | View All 32 Rows |
Sex and Age in Centerville
Sex and Age in Centerville
The most populous age groups in Centerville are 10 to 14 Years (693 | 8.5%) for men and 40 to 44 Years (606 | 7.1%) for women.
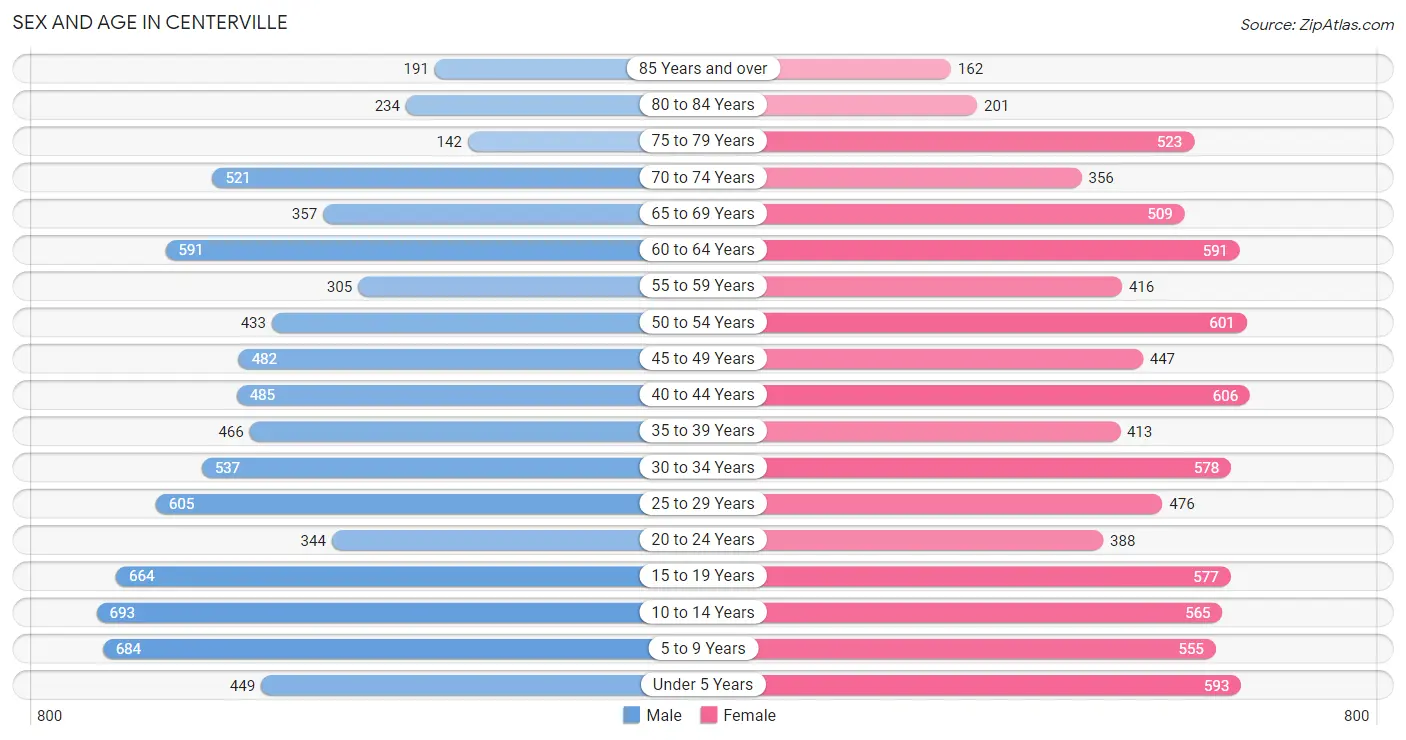
| Age Bracket | Male | Female |
| Under 5 Years | 449 (5.5%) | 593 (6.9%) |
| 5 to 9 Years | 684 (8.4%) | 555 (6.5%) |
| 10 to 14 Years | 693 (8.5%) | 565 (6.6%) |
| 15 to 19 Years | 664 (8.1%) | 577 (6.7%) |
| 20 to 24 Years | 344 (4.2%) | 388 (4.5%) |
| 25 to 29 Years | 605 (7.4%) | 476 (5.6%) |
| 30 to 34 Years | 537 (6.6%) | 578 (6.8%) |
| 35 to 39 Years | 466 (5.7%) | 413 (4.8%) |
| 40 to 44 Years | 485 (5.9%) | 606 (7.1%) |
| 45 to 49 Years | 482 (5.9%) | 447 (5.2%) |
| 50 to 54 Years | 433 (5.3%) | 601 (7.0%) |
| 55 to 59 Years | 305 (3.7%) | 416 (4.9%) |
| 60 to 64 Years | 591 (7.2%) | 591 (6.9%) |
| 65 to 69 Years | 357 (4.4%) | 509 (5.9%) |
| 70 to 74 Years | 521 (6.4%) | 356 (4.2%) |
| 75 to 79 Years | 142 (1.7%) | 523 (6.1%) |
| 80 to 84 Years | 234 (2.9%) | 201 (2.4%) |
| 85 Years and over | 191 (2.3%) | 162 (1.9%) |
| Total | 8,183 (100.0%) | 8,557 (100.0%) |
Families and Households in Centerville
Median Family Size in Centerville
The median family size in Centerville is 3.39 persons per family, with single male/father families (95 | 2.1%) accounting for the largest median family size of 3.69 persons per family. On the other hand, single female/mother families (359 | 8.1%) represent the smallest median family size with 2.74 persons per family.
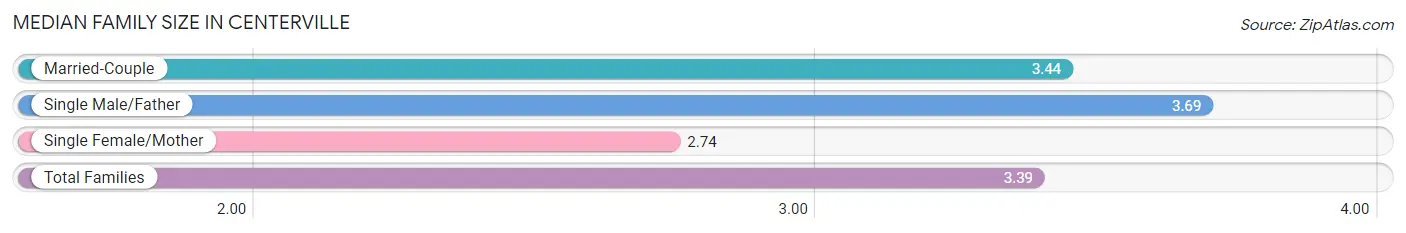
| Family Type | # Families | Family Size |
| Married-Couple | 4,001 (89.8%) | 3.44 |
| Single Male/Father | 95 (2.1%) | 3.69 |
| Single Female/Mother | 359 (8.1%) | 2.74 |
| Total Families | 4,455 (100.0%) | 3.39 |
Median Household Size in Centerville
The median household size in Centerville is 2.94 persons per household, with single male/father households (95 | 1.7%) accounting for the largest median household size of 3.99 persons per household. non-family households (1,220 | 21.5%) represent the smallest median household size with 1.20 persons per household.
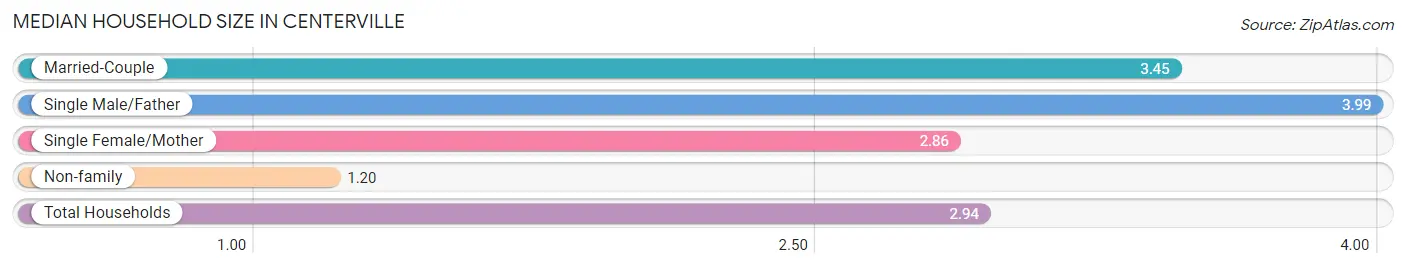
| Household Type | # Households | Household Size |
| Married-Couple | 4,001 (70.5%) | 3.45 |
| Single Male/Father | 95 (1.7%) | 3.99 |
| Single Female/Mother | 359 (6.3%) | 2.86 |
| Non-family | 1,220 (21.5%) | 1.20 |
| Total Households | 5,675 (100.0%) | 2.94 |
Household Size by Marriage Status in Centerville
Out of a total of 5,675 households in Centerville, 4,455 (78.5%) are family households, while 1,220 (21.5%) are nonfamily households. The most numerous type of family households are 2-person households, comprising 1,901, and the most common type of nonfamily households are 1-person households, comprising 1,020.
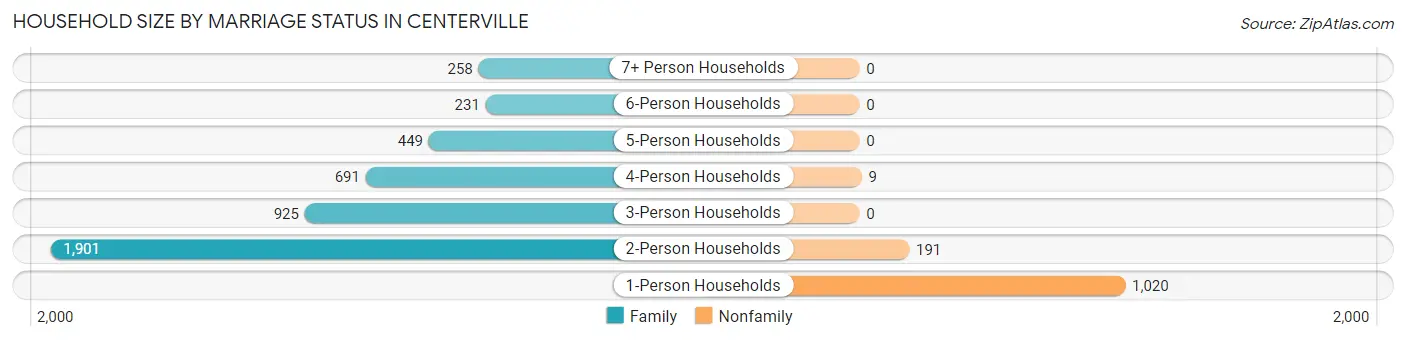
| Household Size | Family Households | Nonfamily Households |
| 1-Person Households | - | 1,020 (18.0%) |
| 2-Person Households | 1,901 (33.5%) | 191 (3.4%) |
| 3-Person Households | 925 (16.3%) | 0 (0.0%) |
| 4-Person Households | 691 (12.2%) | 9 (0.2%) |
| 5-Person Households | 449 (7.9%) | 0 (0.0%) |
| 6-Person Households | 231 (4.1%) | 0 (0.0%) |
| 7+ Person Households | 258 (4.5%) | 0 (0.0%) |
| Total | 4,455 (78.5%) | 1,220 (21.5%) |
Female Fertility in Centerville
Fertility by Age in Centerville
Average fertility rate in Centerville is 41.0 births per 1,000 women. Women in the age bracket of 20 to 34 years have the highest fertility rate with 82.0 births per 1,000 women. Women in the age bracket of 20 to 34 years acount for 79.2% of all women with births.
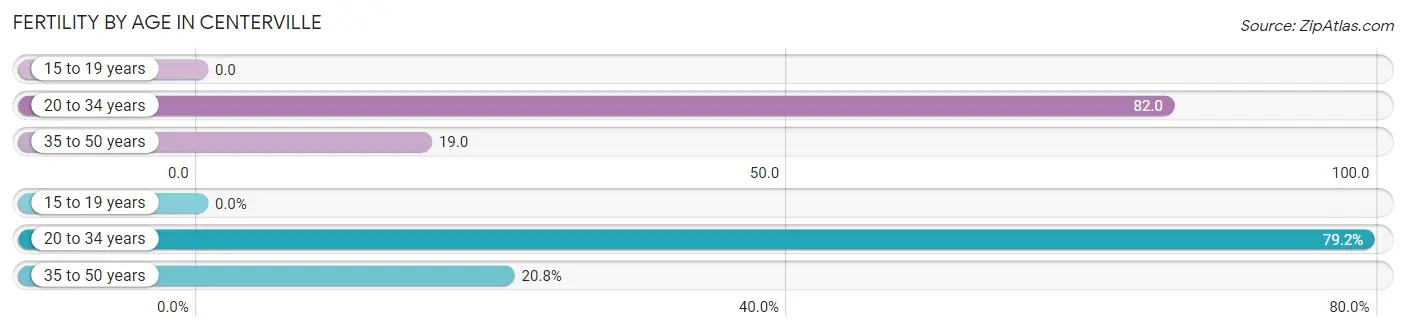
| Age Bracket | Women with Births | Births / 1,000 Women |
| 15 to 19 years | 0 (0.0%) | 0.0 |
| 20 to 34 years | 118 (79.2%) | 82.0 |
| 35 to 50 years | 31 (20.8%) | 19.0 |
| Total | 149 (100.0%) | 41.0 |
Fertility by Age by Marriage Status in Centerville
88.6% of women with births (149) in Centerville are married. The highest percentage of unmarried women with births falls into 20 to 34 years age bracket with 14.4% of them unmarried at the time of birth, while the lowest percentage of unmarried women with births belong to 35 to 50 years age bracket with 0.0% of them unmarried.
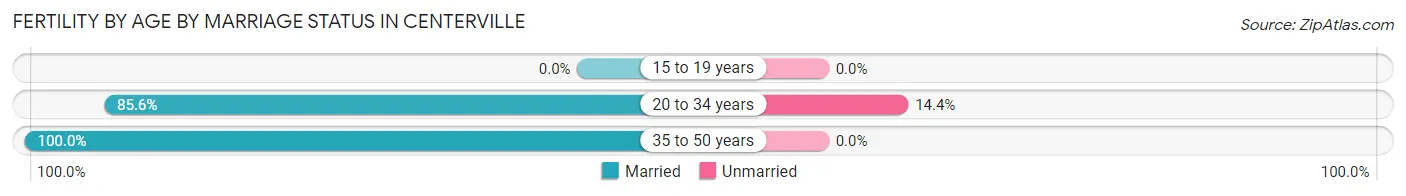
| Age Bracket | Married | Unmarried |
| 15 to 19 years | 0 (0.0%) | 0 (0.0%) |
| 20 to 34 years | 101 (85.6%) | 17 (14.4%) |
| 35 to 50 years | 31 (100.0%) | 0 (0.0%) |
| Total | 132 (88.6%) | 17 (11.4%) |
Fertility by Education in Centerville
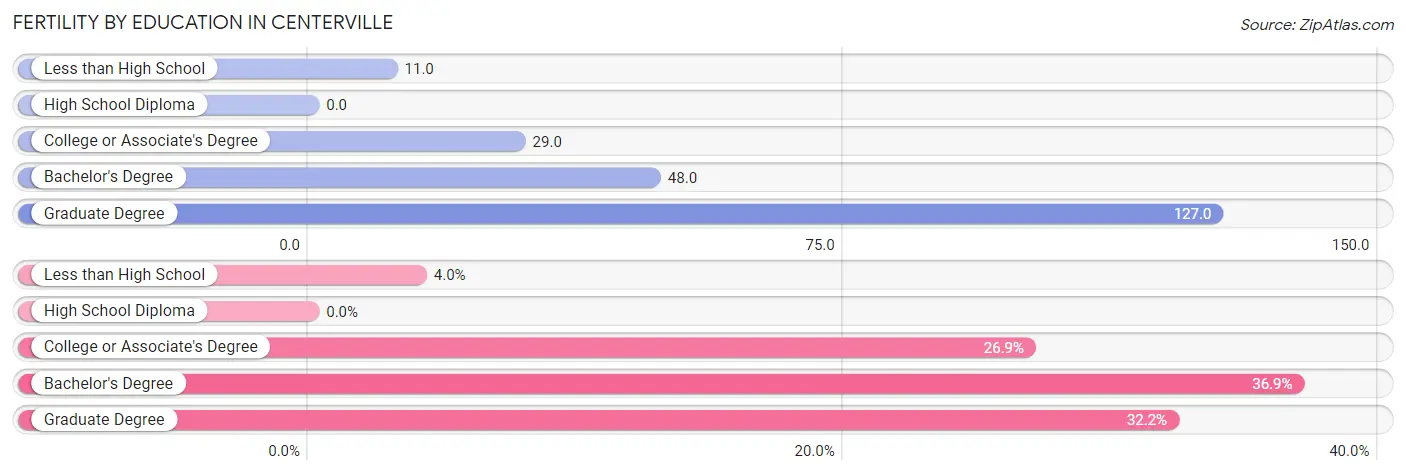
| Educational Attainment | Women with Births | Births / 1,000 Women |
| Less than High School | 6 (4.0%) | 11.0 |
| High School Diploma | 0 (0.0%) | 0.0 |
| College or Associate's Degree | 40 (26.9%) | 29.0 |
| Bachelor's Degree | 55 (36.9%) | 48.0 |
| Graduate Degree | 48 (32.2%) | 127.0 |
| Total | 149 (100.0%) | 41.0 |
Fertility by Education by Marriage Status in Centerville
11.4% of women with births in Centerville are unmarried. Women with the educational attainment of bachelor's degree are most likely to be married with 100.0% of them married at childbirth, while women with the educational attainment of less than high school are least likely to be married with 100.0% of them unmarried at childbirth.
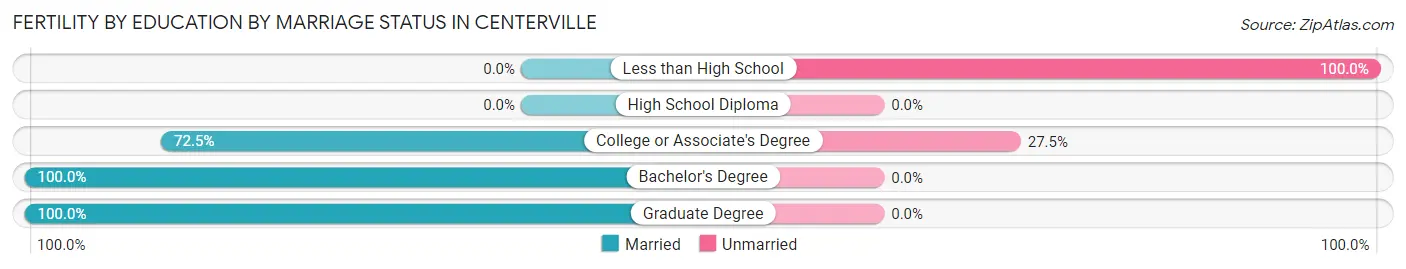
| Educational Attainment | Married | Unmarried |
| Less than High School | 0 (0.0%) | 6 (100.0%) |
| High School Diploma | 0 (0.0%) | 0 (0.0%) |
| College or Associate's Degree | 29 (72.5%) | 11 (27.5%) |
| Bachelor's Degree | 55 (100.0%) | 0 (0.0%) |
| Graduate Degree | 48 (100.0%) | 0 (0.0%) |
| Total | 132 (88.6%) | 17 (11.4%) |
Employment Characteristics in Centerville
Employment by Class of Employer in Centerville
Among the 8,216 employed individuals in Centerville, private company employees (5,399 | 65.7%), not-for-profit organizations (751 | 9.1%), and self-employed (incorporated) (494 | 6.0%) make up the most common classes of employment.
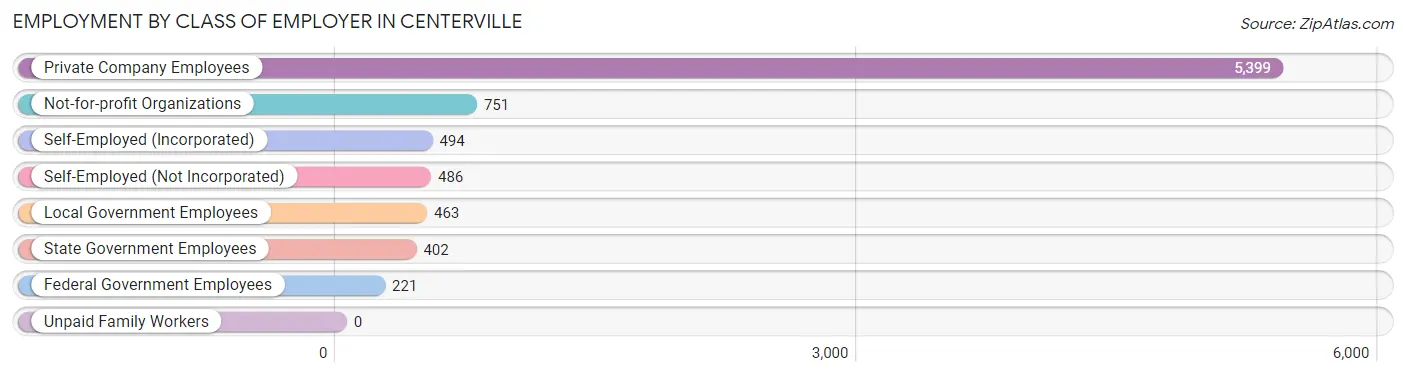
| Employer Class | # Employees | % Employees |
| Private Company Employees | 5,399 | 65.7% |
| Self-Employed (Incorporated) | 494 | 6.0% |
| Self-Employed (Not Incorporated) | 486 | 5.9% |
| Not-for-profit Organizations | 751 | 9.1% |
| Local Government Employees | 463 | 5.6% |
| State Government Employees | 402 | 4.9% |
| Federal Government Employees | 221 | 2.7% |
| Unpaid Family Workers | 0 | 0.0% |
| Total | 8,216 | 100.0% |
Employment Status by Age in Centerville
According to the labor force statistics for Centerville, out of the total population over 16 years of age (12,844), 66.3% or 8,516 individuals are in the labor force, with 1.4% or 119 of them unemployed. The age group with the highest labor force participation rate is 25 to 29 years, with 89.0% or 962 individuals in the labor force. Within the labor force, the 30 to 34 years age range has the highest percentage of unemployed individuals, with 3.5% or 35 of them being unemployed.
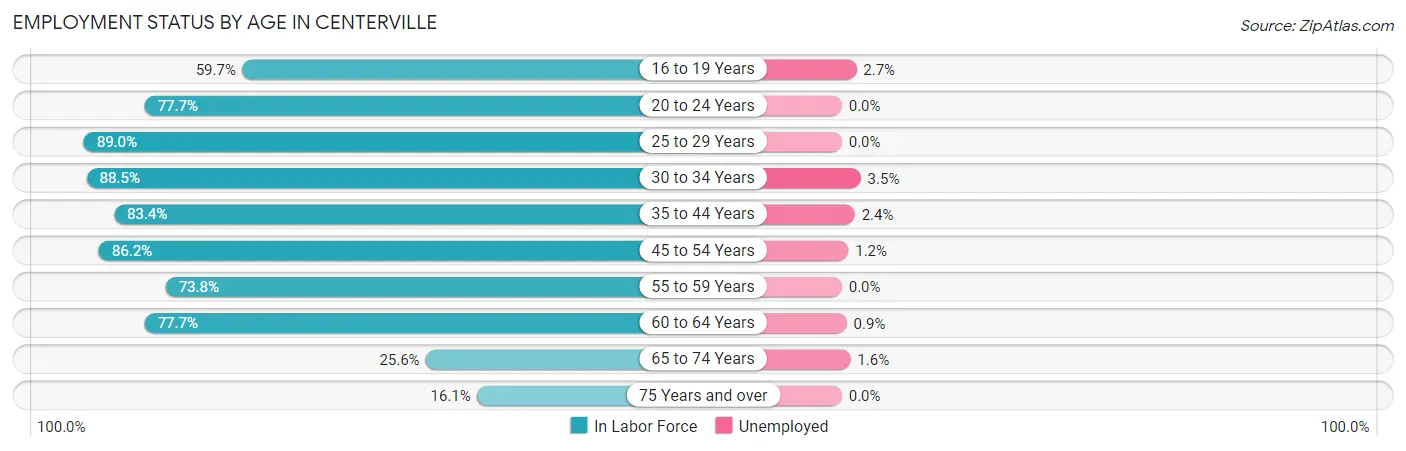
| Age Bracket | In Labor Force | Unemployed |
| 16 to 19 Years | 528 (59.7%) | 14 (2.7%) |
| 20 to 24 Years | 569 (77.7%) | 0 (0.0%) |
| 25 to 29 Years | 962 (89.0%) | 0 (0.0%) |
| 30 to 34 Years | 987 (88.5%) | 35 (3.5%) |
| 35 to 44 Years | 1,643 (83.4%) | 39 (2.4%) |
| 45 to 54 Years | 1,692 (86.2%) | 20 (1.2%) |
| 55 to 59 Years | 532 (73.8%) | 0 (0.0%) |
| 60 to 64 Years | 918 (77.7%) | 8 (0.9%) |
| 65 to 74 Years | 446 (25.6%) | 7 (1.6%) |
| 75 Years and over | 234 (16.1%) | 0 (0.0%) |
| Total | 8,516 (66.3%) | 119 (1.4%) |
Employment Status by Educational Attainment in Centerville
According to labor force statistics for Centerville, 83.9% of individuals (6,739) out of the total population between 25 and 64 years of age (8,032) are in the labor force, with 1.5% or 101 of them being unemployed. The group with the highest labor force participation rate are those with the educational attainment of bachelor's degree or higher, with 90.2% or 3,525 individuals in the labor force. Within the labor force, individuals with less than high school education have the highest percentage of unemployment, with 21.5% or 20 of them being unemployed.
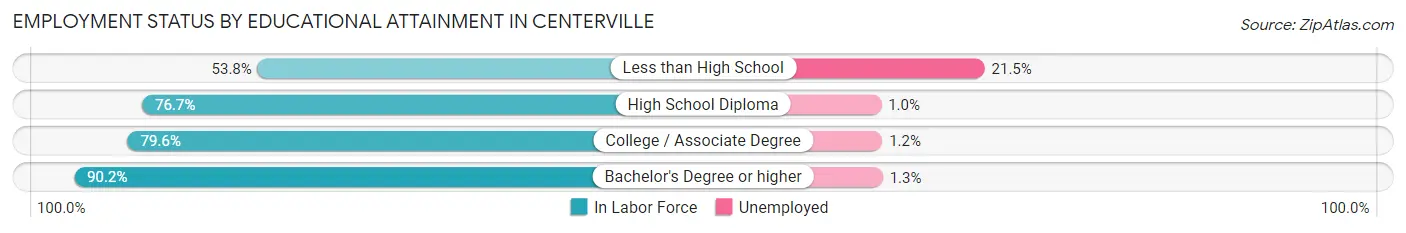
| Educational Attainment | In Labor Force | Unemployed |
| Less than High School | 93 (53.8%) | 37 (21.5%) |
| High School Diploma | 729 (76.7%) | 10 (1.0%) |
| College / Associate Degree | 2,389 (79.6%) | 36 (1.2%) |
| Bachelor's Degree or higher | 3,525 (90.2%) | 51 (1.3%) |
| Total | 6,739 (83.9%) | 120 (1.5%) |
Employment Occupations by Sex in Centerville
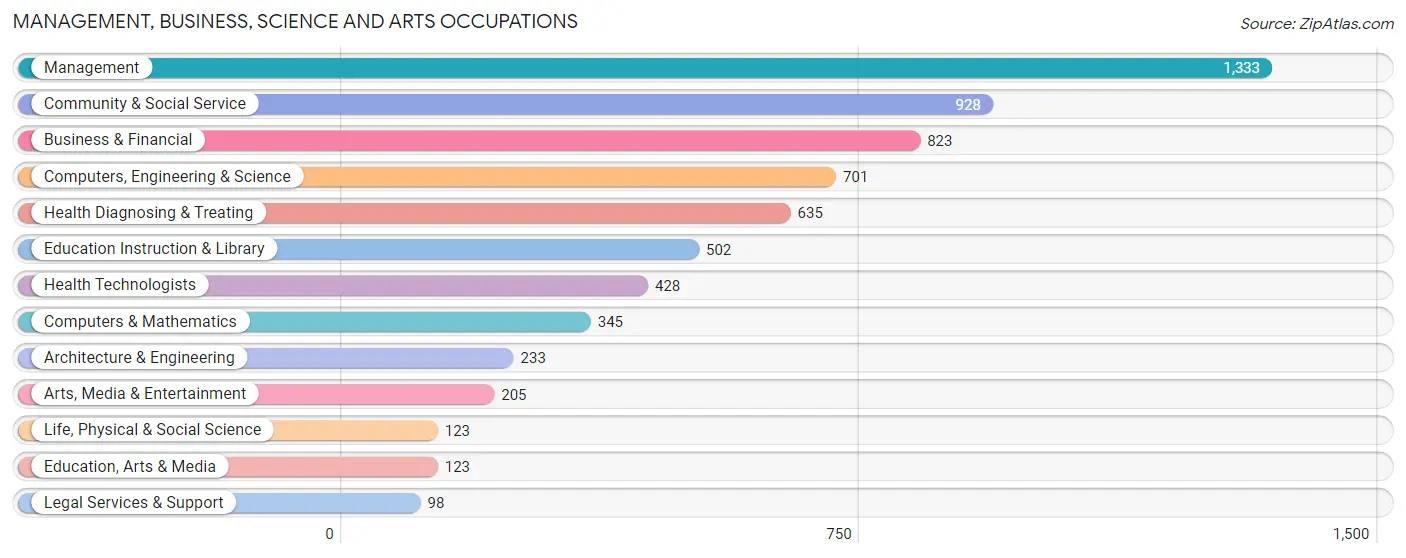
Management, Business, Science and Arts Occupations
The most common Management, Business, Science and Arts occupations in Centerville are Management (1,333 | 15.9%), Community & Social Service (928 | 11.1%), Business & Financial (823 | 9.8%), Computers, Engineering & Science (701 | 8.4%), and Health Diagnosing & Treating (635 | 7.6%).
Management, Business, Science and Arts Occupations by Sex
Within the Management, Business, Science and Arts occupations in Centerville, the most male-oriented occupations are Legal Services & Support (100.0%), Computers & Mathematics (87.0%), and Architecture & Engineering (85.4%), while the most female-oriented occupations are Education Instruction & Library (97.2%), Arts, Media & Entertainment (78.5%), and Health Technologists (77.3%).
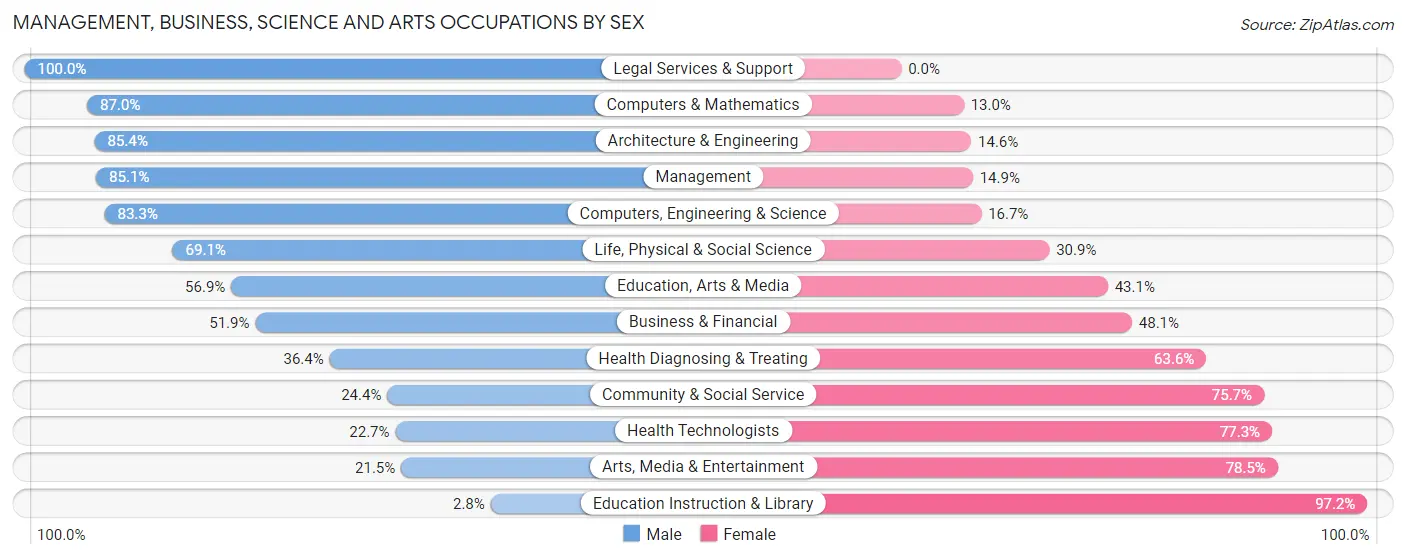
| Occupation | Male | Female |
| Management | 1,134 (85.1%) | 199 (14.9%) |
| Business & Financial | 427 (51.9%) | 396 (48.1%) |
| Computers, Engineering & Science | 584 (83.3%) | 117 (16.7%) |
| Computers & Mathematics | 300 (87.0%) | 45 (13.0%) |
| Architecture & Engineering | 199 (85.4%) | 34 (14.6%) |
| Life, Physical & Social Science | 85 (69.1%) | 38 (30.9%) |
| Community & Social Service | 226 (24.3%) | 702 (75.6%) |
| Education, Arts & Media | 70 (56.9%) | 53 (43.1%) |
| Legal Services & Support | 98 (100.0%) | 0 (0.0%) |
| Education Instruction & Library | 14 (2.8%) | 488 (97.2%) |
| Arts, Media & Entertainment | 44 (21.5%) | 161 (78.5%) |
| Health Diagnosing & Treating | 231 (36.4%) | 404 (63.6%) |
| Health Technologists | 97 (22.7%) | 331 (77.3%) |
| Total (Category) | 2,602 (58.9%) | 1,818 (41.1%) |
| Total (Overall) | 4,730 (56.4%) | 3,658 (43.6%) |
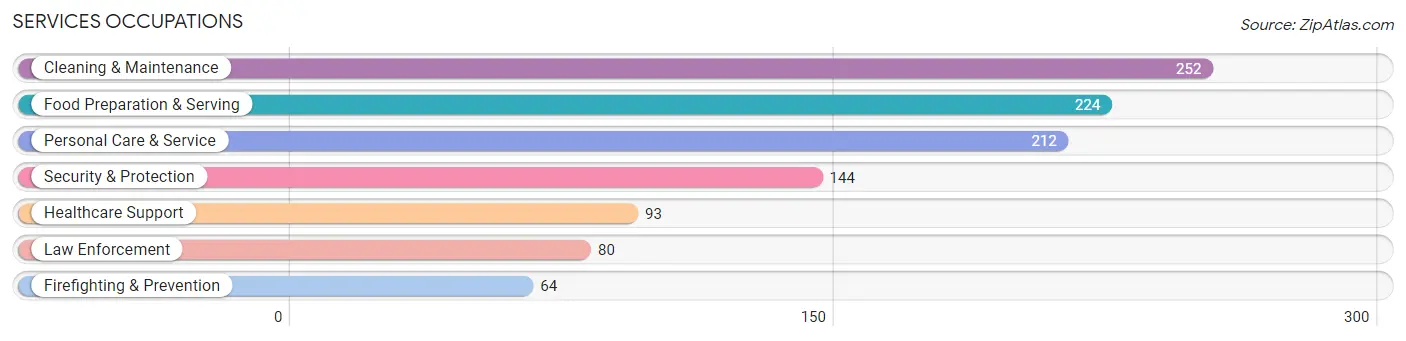
Services Occupations
The most common Services occupations in Centerville are Cleaning & Maintenance (252 | 3.0%), Food Preparation & Serving (224 | 2.7%), Personal Care & Service (212 | 2.5%), Security & Protection (144 | 1.7%), and Healthcare Support (93 | 1.1%).
Services Occupations by Sex
Within the Services occupations in Centerville, the most male-oriented occupations are Law Enforcement (86.3%), Security & Protection (84.7%), and Firefighting & Prevention (82.8%), while the most female-oriented occupations are Personal Care & Service (82.6%), Healthcare Support (77.4%), and Food Preparation & Serving (50.9%).
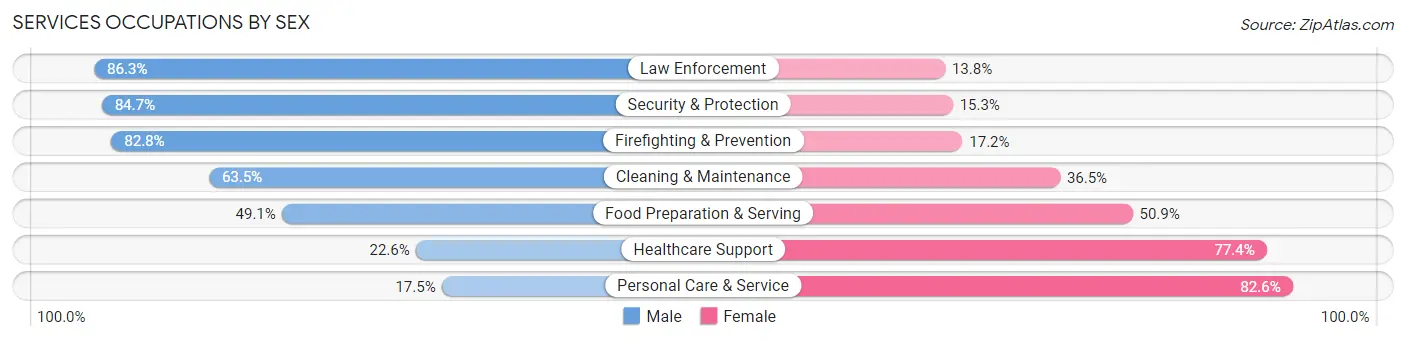
| Occupation | Male | Female |
| Healthcare Support | 21 (22.6%) | 72 (77.4%) |
| Security & Protection | 122 (84.7%) | 22 (15.3%) |
| Firefighting & Prevention | 53 (82.8%) | 11 (17.2%) |
| Law Enforcement | 69 (86.3%) | 11 (13.8%) |
| Food Preparation & Serving | 110 (49.1%) | 114 (50.9%) |
| Cleaning & Maintenance | 160 (63.5%) | 92 (36.5%) |
| Personal Care & Service | 37 (17.4%) | 175 (82.6%) |
| Total (Category) | 450 (48.6%) | 475 (51.3%) |
| Total (Overall) | 4,730 (56.4%) | 3,658 (43.6%) |
Sales and Office Occupations
The most common Sales and Office occupations in Centerville are Office & Administration (1,143 | 13.6%), and Sales & Related (851 | 10.2%).

Sales and Office Occupations by Sex

| Occupation | Male | Female |
| Sales & Related | 543 (63.8%) | 308 (36.2%) |
| Office & Administration | 319 (27.9%) | 824 (72.1%) |
| Total (Category) | 862 (43.2%) | 1,132 (56.8%) |
| Total (Overall) | 4,730 (56.4%) | 3,658 (43.6%) |
Natural Resources, Construction and Maintenance Occupations
The most common Natural Resources, Construction and Maintenance occupations in Centerville are Installation, Maintenance & Repair (207 | 2.5%), and Construction & Extraction (92 | 1.1%).

Natural Resources, Construction and Maintenance Occupations by Sex

| Occupation | Male | Female |
| Farming, Fishing & Forestry | 0 (0.0%) | 0 (0.0%) |
| Construction & Extraction | 85 (92.4%) | 7 (7.6%) |
| Installation, Maintenance & Repair | 207 (100.0%) | 0 (0.0%) |
| Total (Category) | 292 (97.7%) | 7 (2.3%) |
| Total (Overall) | 4,730 (56.4%) | 3,658 (43.6%) |
Production, Transportation and Moving Occupations
The most common Production, Transportation and Moving occupations in Centerville are Production (359 | 4.3%), Transportation (267 | 3.2%), and Material Moving (124 | 1.5%).
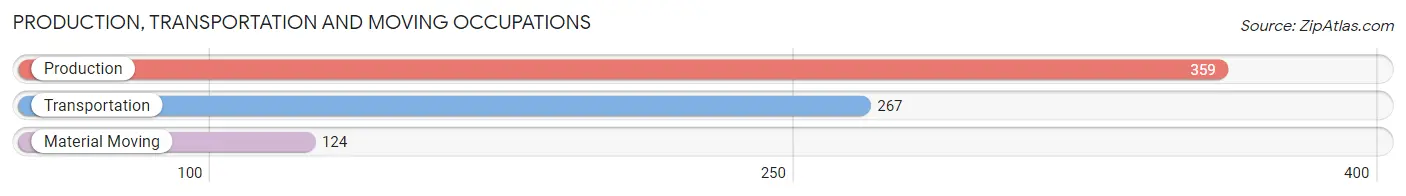
Production, Transportation and Moving Occupations by Sex

| Occupation | Male | Female |
| Production | 225 (62.7%) | 134 (37.3%) |
| Transportation | 227 (85.0%) | 40 (15.0%) |
| Material Moving | 72 (58.1%) | 52 (41.9%) |
| Total (Category) | 524 (69.9%) | 226 (30.1%) |
| Total (Overall) | 4,730 (56.4%) | 3,658 (43.6%) |
Employment Industries by Sex in Centerville
Employment Industries in Centerville
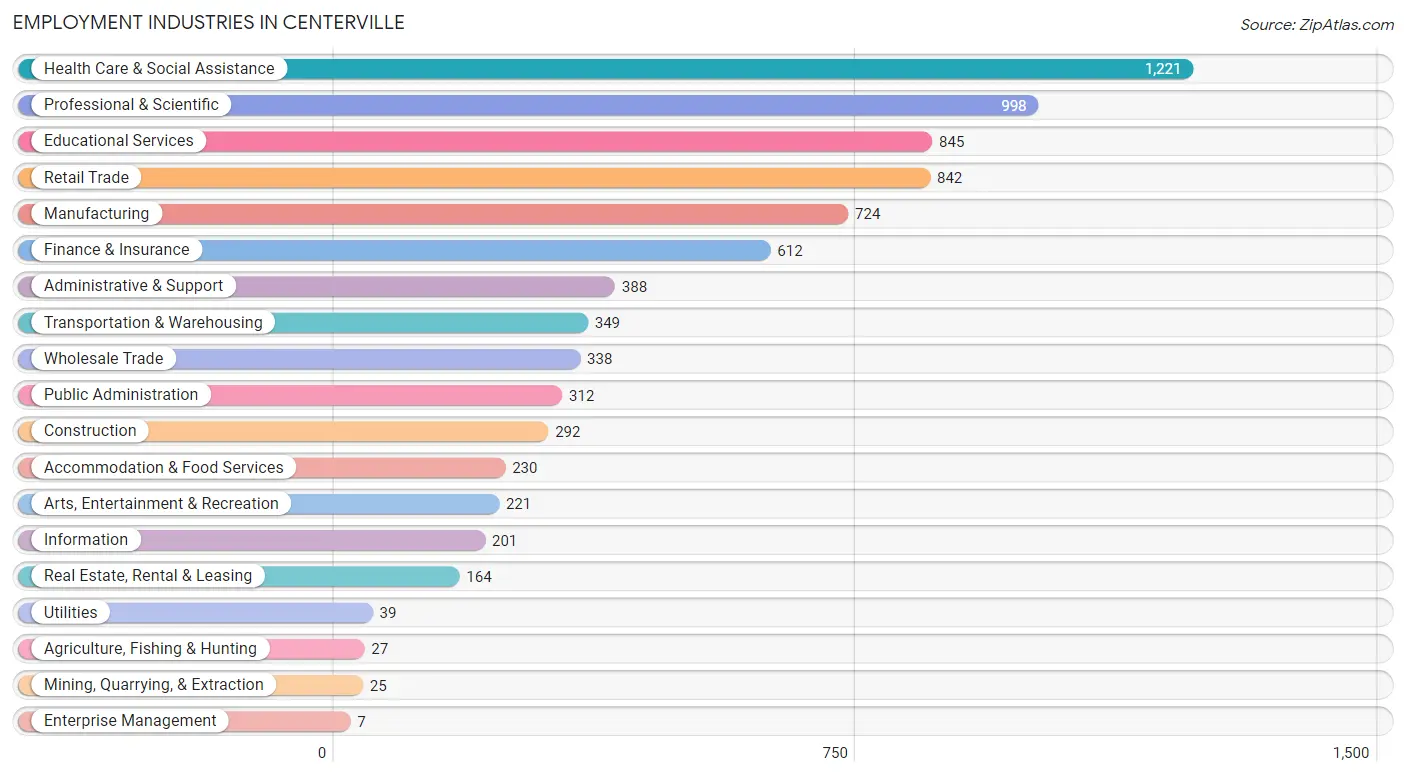
The major employment industries in Centerville include Health Care & Social Assistance (1,221 | 14.6%), Professional & Scientific (998 | 11.9%), Educational Services (845 | 10.1%), Retail Trade (842 | 10.0%), and Manufacturing (724 | 8.6%).
Employment Industries by Sex in Centerville
The Centerville industries that see more men than women are Utilities (100.0%), Real Estate, Rental & Leasing (89.6%), and Construction (84.6%), whereas the industries that tend to have a higher number of women are Enterprise Management (100.0%), Educational Services (79.4%), and Arts, Entertainment & Recreation (61.5%).
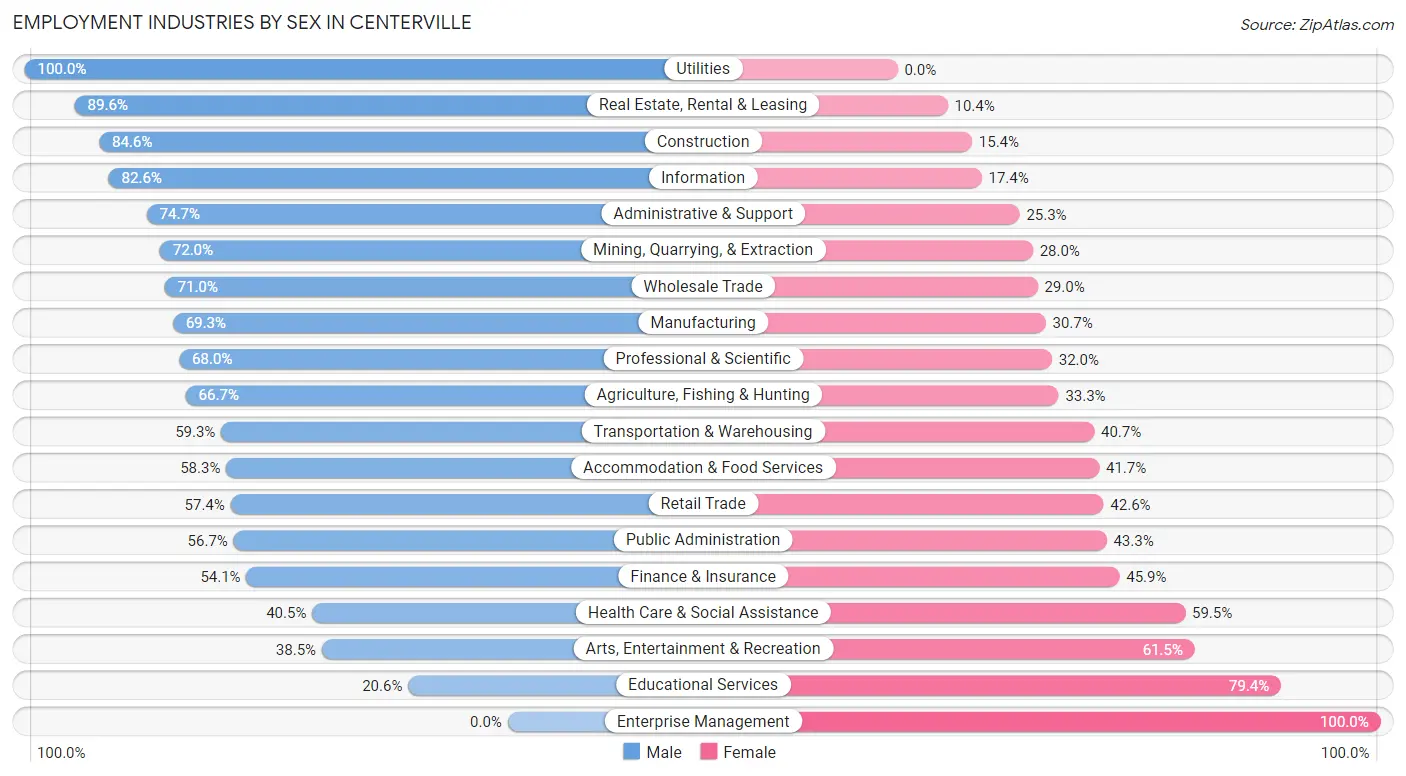
| Industry | Male | Female |
| Agriculture, Fishing & Hunting | 18 (66.7%) | 9 (33.3%) |
| Mining, Quarrying, & Extraction | 18 (72.0%) | 7 (28.0%) |
| Construction | 247 (84.6%) | 45 (15.4%) |
| Manufacturing | 502 (69.3%) | 222 (30.7%) |
| Wholesale Trade | 240 (71.0%) | 98 (29.0%) |
| Retail Trade | 483 (57.4%) | 359 (42.6%) |
| Transportation & Warehousing | 207 (59.3%) | 142 (40.7%) |
| Utilities | 39 (100.0%) | 0 (0.0%) |
| Information | 166 (82.6%) | 35 (17.4%) |
| Finance & Insurance | 331 (54.1%) | 281 (45.9%) |
| Real Estate, Rental & Leasing | 147 (89.6%) | 17 (10.4%) |
| Professional & Scientific | 679 (68.0%) | 319 (32.0%) |
| Enterprise Management | 0 (0.0%) | 7 (100.0%) |
| Administrative & Support | 290 (74.7%) | 98 (25.3%) |
| Educational Services | 174 (20.6%) | 671 (79.4%) |
| Health Care & Social Assistance | 494 (40.5%) | 727 (59.5%) |
| Arts, Entertainment & Recreation | 85 (38.5%) | 136 (61.5%) |
| Accommodation & Food Services | 134 (58.3%) | 96 (41.7%) |
| Public Administration | 177 (56.7%) | 135 (43.3%) |
| Total | 4,730 (56.4%) | 3,658 (43.6%) |
Education in Centerville
School Enrollment in Centerville
The most common levels of schooling among the 4,868 students in Centerville are high school (1,097 | 22.5%), college / undergraduate (1,041 | 21.4%), and elementary school (1,038 | 21.3%).
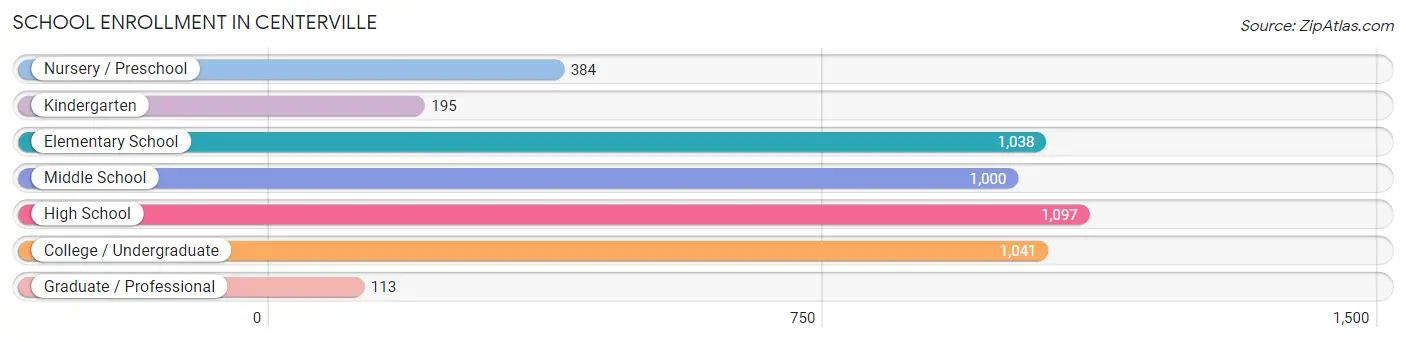
| School Level | # Students | % Students |
| Nursery / Preschool | 384 | 7.9% |
| Kindergarten | 195 | 4.0% |
| Elementary School | 1,038 | 21.3% |
| Middle School | 1,000 | 20.5% |
| High School | 1,097 | 22.5% |
| College / Undergraduate | 1,041 | 21.4% |
| Graduate / Professional | 113 | 2.3% |
| Total | 4,868 | 100.0% |
School Enrollment by Age by Funding Source in Centerville
Out of a total of 4,868 students who are enrolled in schools in Centerville, 633 (13.0%) attend a private institution, while the remaining 4,235 (87.0%) are enrolled in public schools. The age group of 3 to 4 year olds has the highest likelihood of being enrolled in private schools, with 202 (62.7% in the age bracket) enrolled. Conversely, the age group of 18 to 19 year olds has the lowest likelihood of being enrolled in a private school, with 273 (100.0% in the age bracket) attending a public institution.
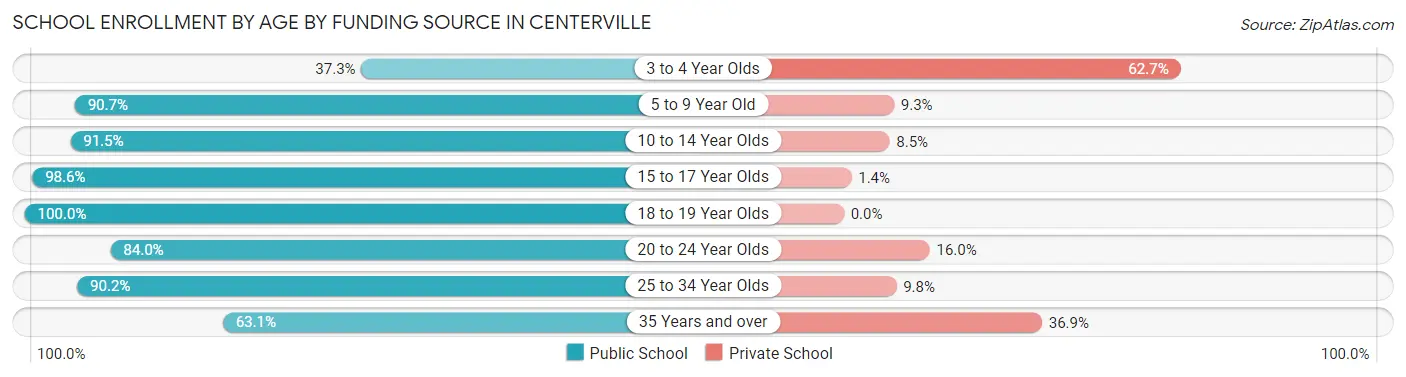
| Age Bracket | Public School | Private School |
| 3 to 4 Year Olds | 120 (37.3%) | 202 (62.7%) |
| 5 to 9 Year Old | 1,009 (90.7%) | 104 (9.3%) |
| 10 to 14 Year Olds | 1,151 (91.5%) | 107 (8.5%) |
| 15 to 17 Year Olds | 836 (98.6%) | 12 (1.4%) |
| 18 to 19 Year Olds | 273 (100.0%) | 0 (0.0%) |
| 20 to 24 Year Olds | 352 (84.0%) | 67 (16.0%) |
| 25 to 34 Year Olds | 304 (90.2%) | 33 (9.8%) |
| 35 Years and over | 188 (63.1%) | 110 (36.9%) |
| Total | 4,235 (87.0%) | 633 (13.0%) |
Educational Attainment by Field of Study in Centerville
Business (1,412 | 25.4%), education (813 | 14.6%), science & technology (456 | 8.2%), social sciences (416 | 7.5%), and arts & humanities (411 | 7.4%) are the most common fields of study among 5,571 individuals in Centerville who have obtained a bachelor's degree or higher.
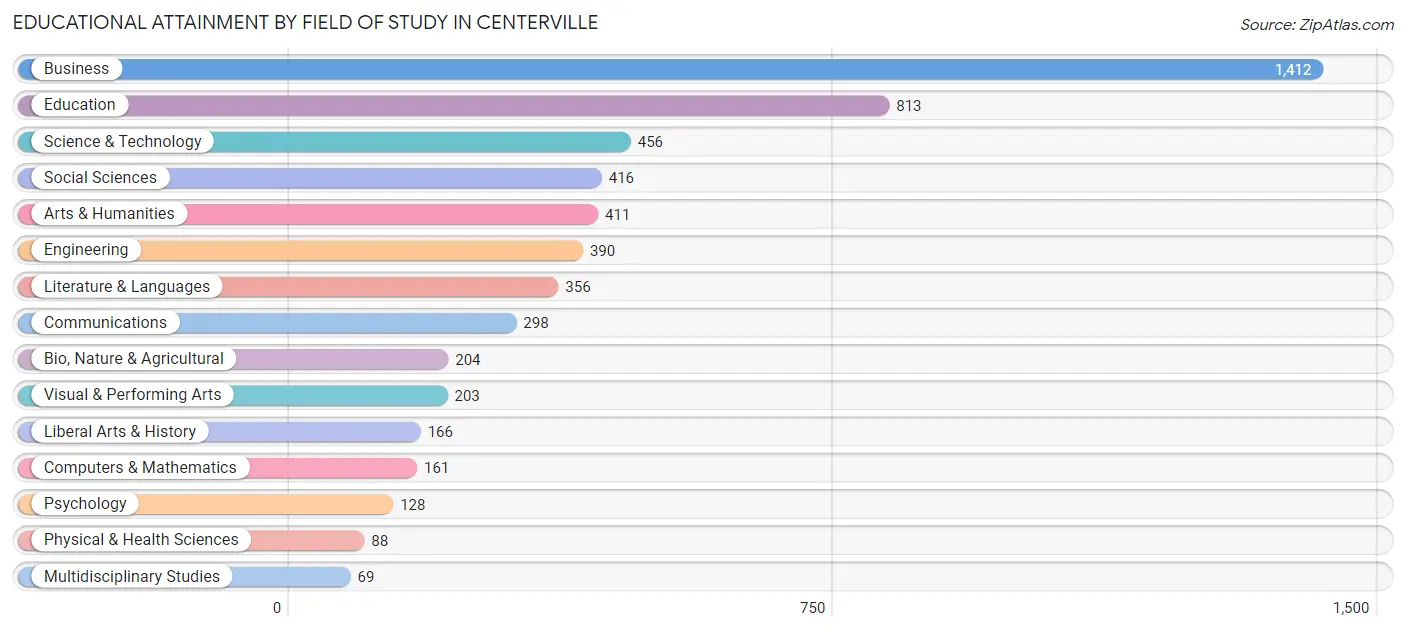
| Field of Study | # Graduates | % Graduates |
| Computers & Mathematics | 161 | 2.9% |
| Bio, Nature & Agricultural | 204 | 3.7% |
| Physical & Health Sciences | 88 | 1.6% |
| Psychology | 128 | 2.3% |
| Social Sciences | 416 | 7.5% |
| Engineering | 390 | 7.0% |
| Multidisciplinary Studies | 69 | 1.2% |
| Science & Technology | 456 | 8.2% |
| Business | 1,412 | 25.4% |
| Education | 813 | 14.6% |
| Literature & Languages | 356 | 6.4% |
| Liberal Arts & History | 166 | 3.0% |
| Visual & Performing Arts | 203 | 3.6% |
| Communications | 298 | 5.3% |
| Arts & Humanities | 411 | 7.4% |
| Total | 5,571 | 100.0% |
Transportation & Commute in Centerville
Vehicle Availability by Sex in Centerville
The most prevalent vehicle ownership categories in Centerville are males with 2 vehicles (2,226, accounting for 47.9%) and females with 2 vehicles (1,522, making up 62.4%).
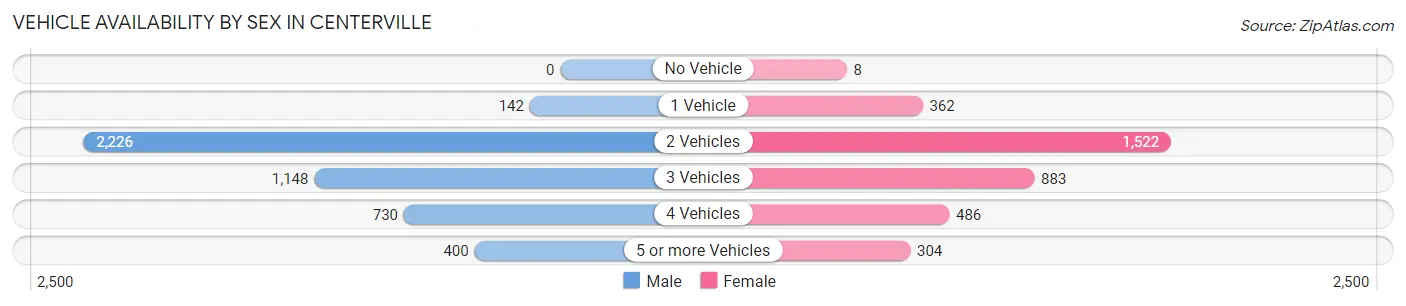
| Vehicles Available | Male | Female |
| No Vehicle | 0 (0.0%) | 8 (0.2%) |
| 1 Vehicle | 142 (3.1%) | 362 (10.2%) |
| 2 Vehicles | 2,226 (47.9%) | 1,522 (42.7%) |
| 3 Vehicles | 1,148 (24.7%) | 883 (24.8%) |
| 4 Vehicles | 730 (15.7%) | 486 (13.6%) |
| 5 or more Vehicles | 400 (8.6%) | 304 (8.5%) |
| Total | 4,646 (100.0%) | 3,565 (100.0%) |
Commute Time in Centerville
The most frequently occuring commute durations in Centerville are 10 to 14 minutes (1,199 commuters, 18.0%), 20 to 24 minutes (958 commuters, 14.4%), and 30 to 34 minutes (906 commuters, 13.6%).
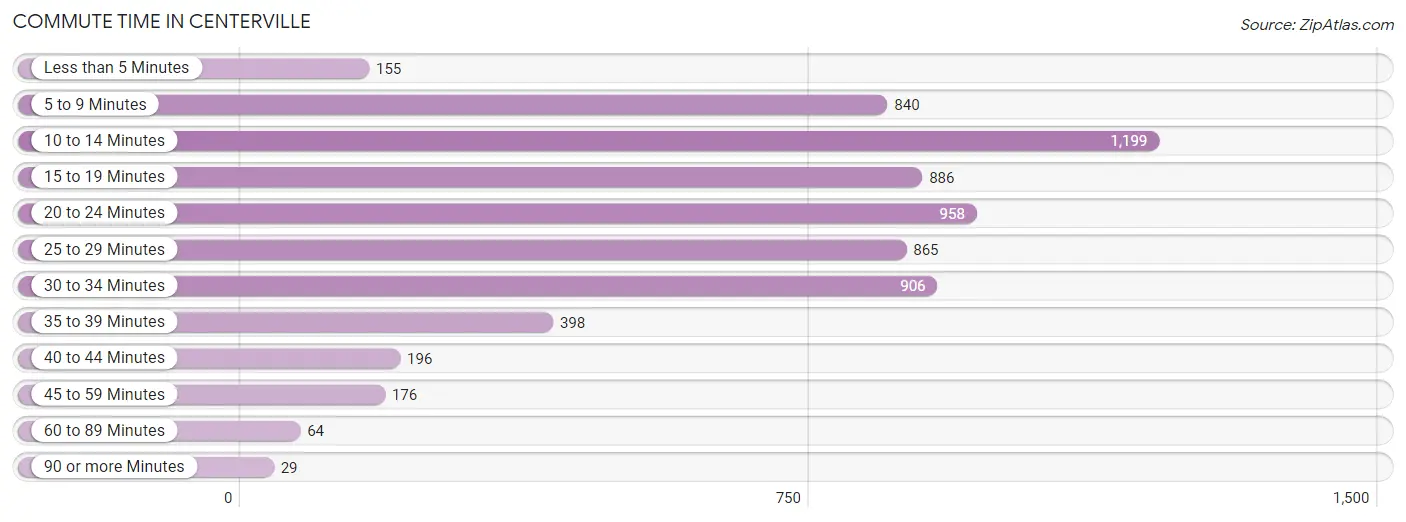
| Commute Time | # Commuters | % Commuters |
| Less than 5 Minutes | 155 | 2.3% |
| 5 to 9 Minutes | 840 | 12.6% |
| 10 to 14 Minutes | 1,199 | 18.0% |
| 15 to 19 Minutes | 886 | 13.3% |
| 20 to 24 Minutes | 958 | 14.4% |
| 25 to 29 Minutes | 865 | 13.0% |
| 30 to 34 Minutes | 906 | 13.6% |
| 35 to 39 Minutes | 398 | 6.0% |
| 40 to 44 Minutes | 196 | 2.9% |
| 45 to 59 Minutes | 176 | 2.6% |
| 60 to 89 Minutes | 64 | 1.0% |
| 90 or more Minutes | 29 | 0.4% |
Commute Time by Sex in Centerville
The most common commute times in Centerville are 20 to 24 minutes (721 commuters, 19.2%) for males and 10 to 14 minutes (654 commuters, 22.4%) for females.
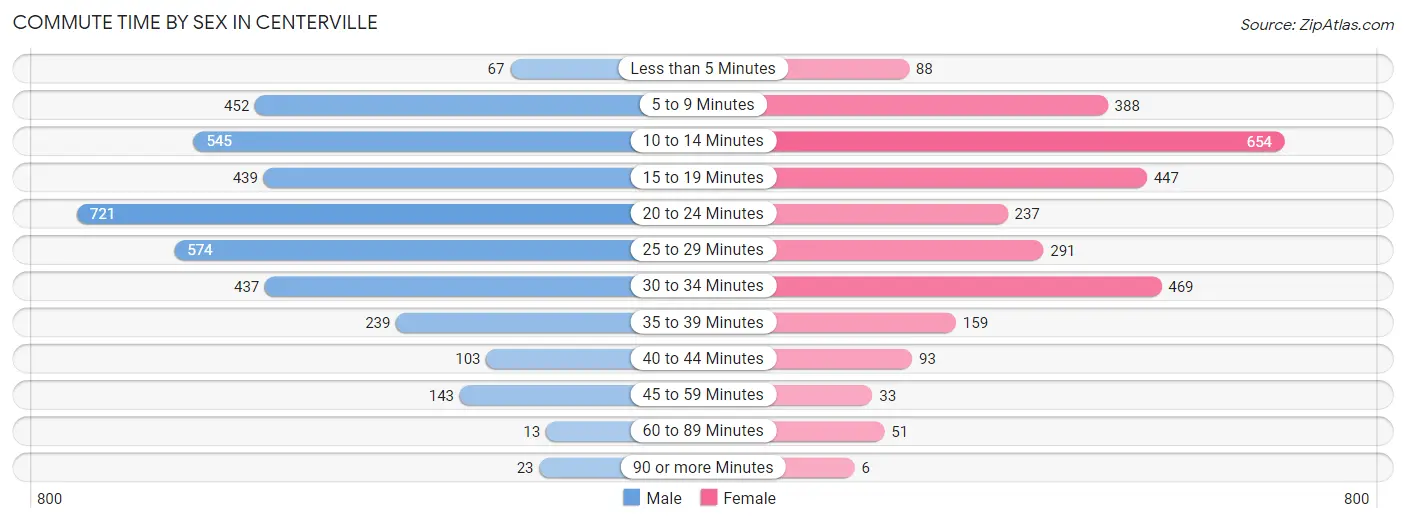
| Commute Time | Male | Female |
| Less than 5 Minutes | 67 (1.8%) | 88 (3.0%) |
| 5 to 9 Minutes | 452 (12.0%) | 388 (13.3%) |
| 10 to 14 Minutes | 545 (14.5%) | 654 (22.4%) |
| 15 to 19 Minutes | 439 (11.7%) | 447 (15.3%) |
| 20 to 24 Minutes | 721 (19.2%) | 237 (8.1%) |
| 25 to 29 Minutes | 574 (15.3%) | 291 (10.0%) |
| 30 to 34 Minutes | 437 (11.6%) | 469 (16.1%) |
| 35 to 39 Minutes | 239 (6.4%) | 159 (5.4%) |
| 40 to 44 Minutes | 103 (2.7%) | 93 (3.2%) |
| 45 to 59 Minutes | 143 (3.8%) | 33 (1.1%) |
| 60 to 89 Minutes | 13 (0.4%) | 51 (1.8%) |
| 90 or more Minutes | 23 (0.6%) | 6 (0.2%) |
Time of Departure to Work by Sex in Centerville
The most frequent times of departure to work in Centerville are 7:30 AM to 7:59 AM (636, 16.9%) for males and 8:00 AM to 8:29 AM (419, 14.4%) for females.
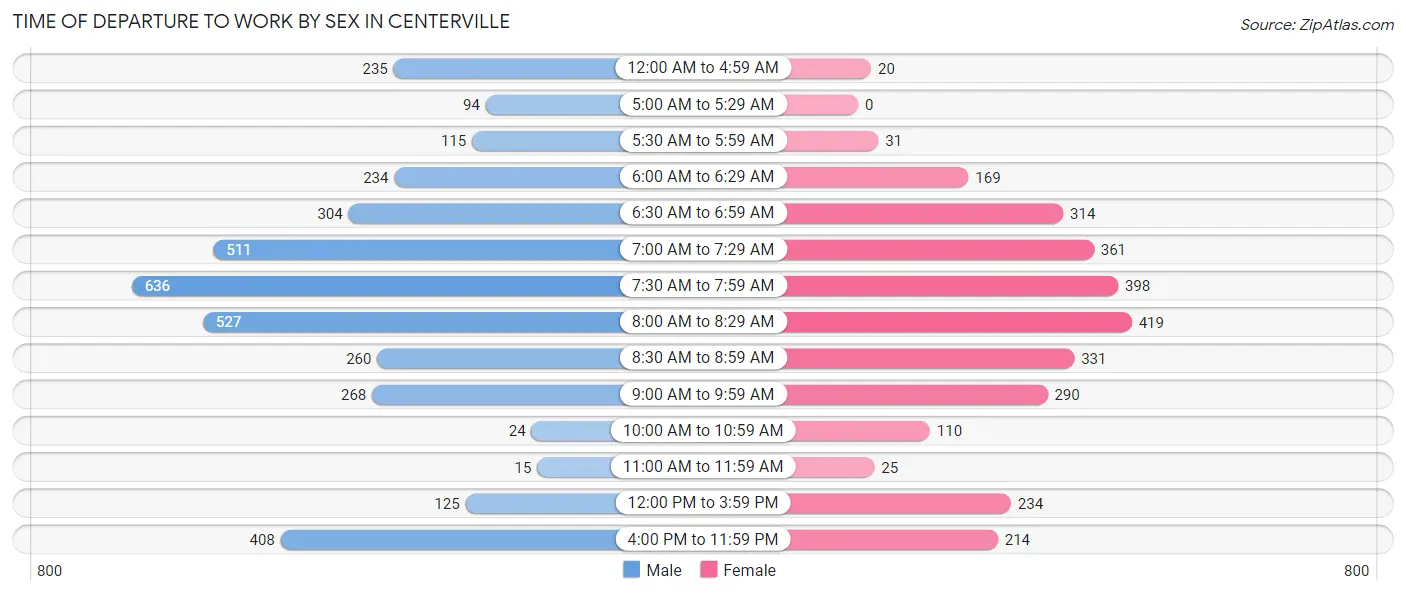
| Time of Departure | Male | Female |
| 12:00 AM to 4:59 AM | 235 (6.3%) | 20 (0.7%) |
| 5:00 AM to 5:29 AM | 94 (2.5%) | 0 (0.0%) |
| 5:30 AM to 5:59 AM | 115 (3.1%) | 31 (1.1%) |
| 6:00 AM to 6:29 AM | 234 (6.2%) | 169 (5.8%) |
| 6:30 AM to 6:59 AM | 304 (8.1%) | 314 (10.8%) |
| 7:00 AM to 7:29 AM | 511 (13.6%) | 361 (12.4%) |
| 7:30 AM to 7:59 AM | 636 (16.9%) | 398 (13.7%) |
| 8:00 AM to 8:29 AM | 527 (14.0%) | 419 (14.4%) |
| 8:30 AM to 8:59 AM | 260 (6.9%) | 331 (11.4%) |
| 9:00 AM to 9:59 AM | 268 (7.1%) | 290 (10.0%) |
| 10:00 AM to 10:59 AM | 24 (0.6%) | 110 (3.8%) |
| 11:00 AM to 11:59 AM | 15 (0.4%) | 25 (0.9%) |
| 12:00 PM to 3:59 PM | 125 (3.3%) | 234 (8.0%) |
| 4:00 PM to 11:59 PM | 408 (10.9%) | 214 (7.3%) |
| Total | 3,756 (100.0%) | 2,916 (100.0%) |
Housing Occupancy in Centerville
Occupancy by Ownership in Centerville
Of the total 5,675 dwellings in Centerville, owner-occupied units account for 4,913 (86.6%), while renter-occupied units make up 762 (13.4%).
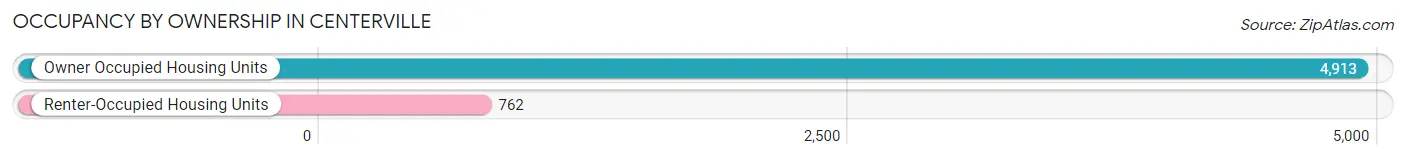
| Occupancy | # Housing Units | % Housing Units |
| Owner Occupied Housing Units | 4,913 | 86.6% |
| Renter-Occupied Housing Units | 762 | 13.4% |
| Total Occupied Housing Units | 5,675 | 100.0% |
Occupancy by Household Size in Centerville
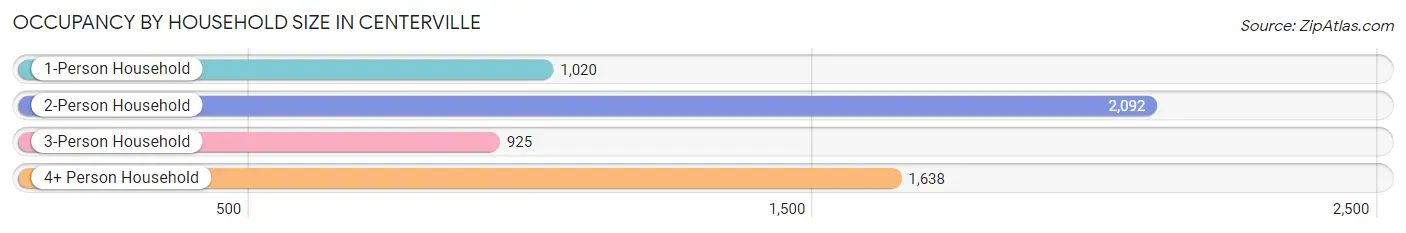
| Household Size | # Housing Units | % Housing Units |
| 1-Person Household | 1,020 | 18.0% |
| 2-Person Household | 2,092 | 36.9% |
| 3-Person Household | 925 | 16.3% |
| 4+ Person Household | 1,638 | 28.9% |
| Total Housing Units | 5,675 | 100.0% |
Occupancy by Ownership by Household Size in Centerville
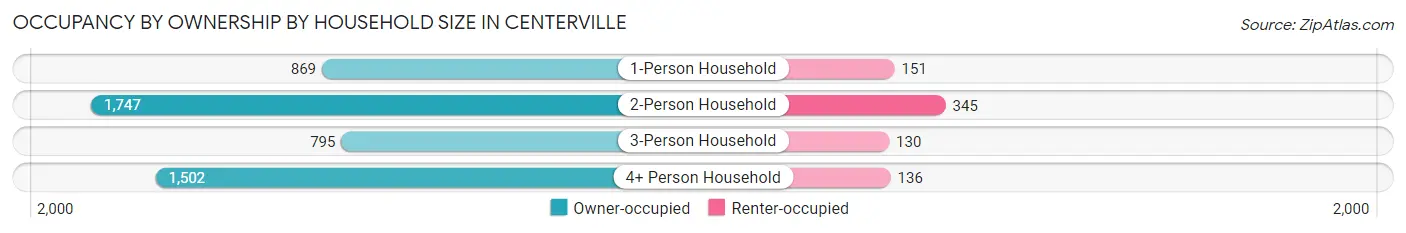
| Household Size | Owner-occupied | Renter-occupied |
| 1-Person Household | 869 (85.2%) | 151 (14.8%) |
| 2-Person Household | 1,747 (83.5%) | 345 (16.5%) |
| 3-Person Household | 795 (86.0%) | 130 (14.1%) |
| 4+ Person Household | 1,502 (91.7%) | 136 (8.3%) |
| Total Housing Units | 4,913 (86.6%) | 762 (13.4%) |
Occupancy by Educational Attainment in Centerville
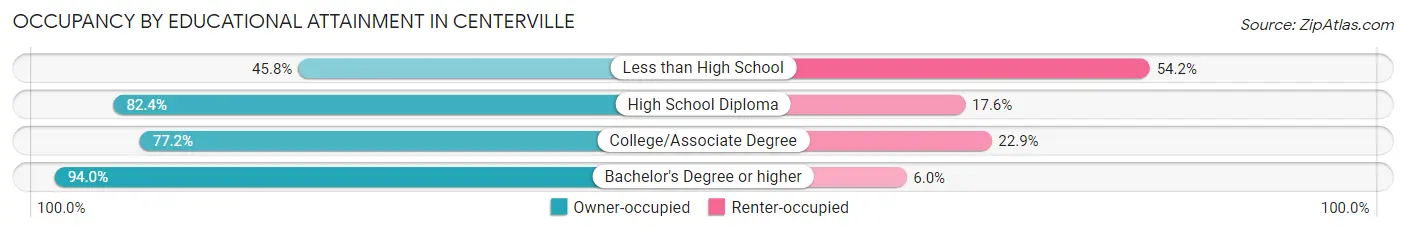
| Household Size | Owner-occupied | Renter-occupied |
| Less than High School | 27 (45.8%) | 32 (54.2%) |
| High School Diploma | 486 (82.4%) | 104 (17.6%) |
| College/Associate Degree | 1,489 (77.1%) | 441 (22.9%) |
| Bachelor's Degree or higher | 2,911 (94.0%) | 185 (6.0%) |
Occupancy by Age of Householder in Centerville
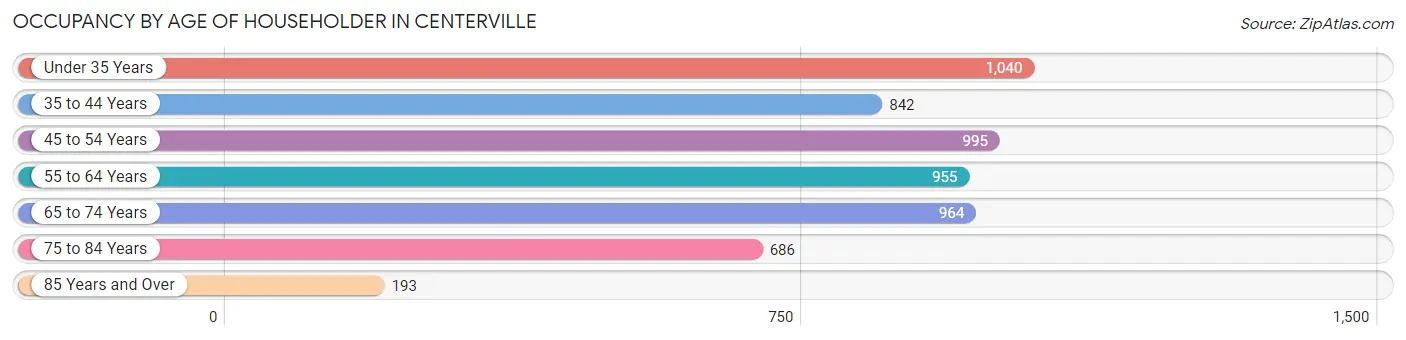
| Age Bracket | # Households | % Households |
| Under 35 Years | 1,040 | 18.3% |
| 35 to 44 Years | 842 | 14.8% |
| 45 to 54 Years | 995 | 17.5% |
| 55 to 64 Years | 955 | 16.8% |
| 65 to 74 Years | 964 | 17.0% |
| 75 to 84 Years | 686 | 12.1% |
| 85 Years and Over | 193 | 3.4% |
| Total | 5,675 | 100.0% |
Housing Finances in Centerville
Median Income by Occupancy in Centerville
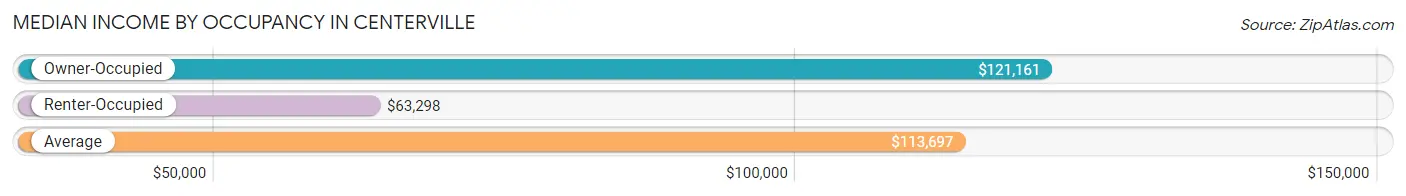
| Occupancy Type | # Households | Median Income |
| Owner-Occupied | 4,913 (86.6%) | $121,161 |
| Renter-Occupied | 762 (13.4%) | $63,298 |
| Average | 5,675 (100.0%) | $113,697 |
Occupancy by Householder Income Bracket in Centerville
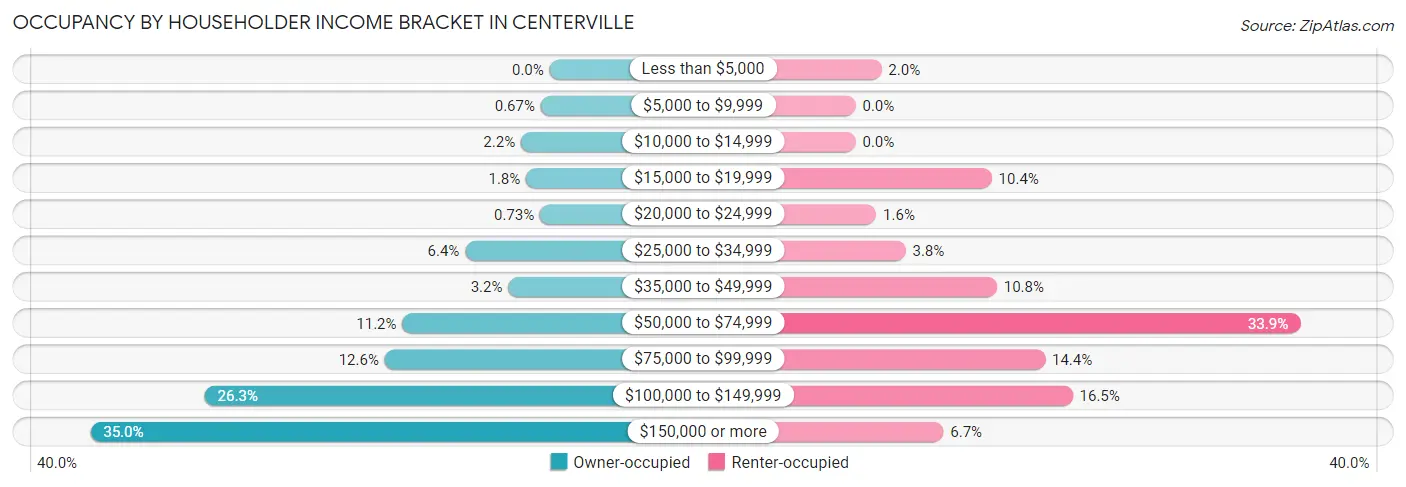
| Income Bracket | Owner-occupied | Renter-occupied |
| Less than $5,000 | 0 (0.0%) | 15 (2.0%) |
| $5,000 to $9,999 | 33 (0.7%) | 0 (0.0%) |
| $10,000 to $14,999 | 107 (2.2%) | 0 (0.0%) |
| $15,000 to $19,999 | 88 (1.8%) | 79 (10.4%) |
| $20,000 to $24,999 | 36 (0.7%) | 12 (1.6%) |
| $25,000 to $34,999 | 316 (6.4%) | 29 (3.8%) |
| $35,000 to $49,999 | 155 (3.2%) | 82 (10.8%) |
| $50,000 to $74,999 | 551 (11.2%) | 258 (33.9%) |
| $75,000 to $99,999 | 617 (12.6%) | 110 (14.4%) |
| $100,000 to $149,999 | 1,291 (26.3%) | 126 (16.5%) |
| $150,000 or more | 1,719 (35.0%) | 51 (6.7%) |
| Total | 4,913 (100.0%) | 762 (100.0%) |
Monthly Housing Cost Tiers in Centerville
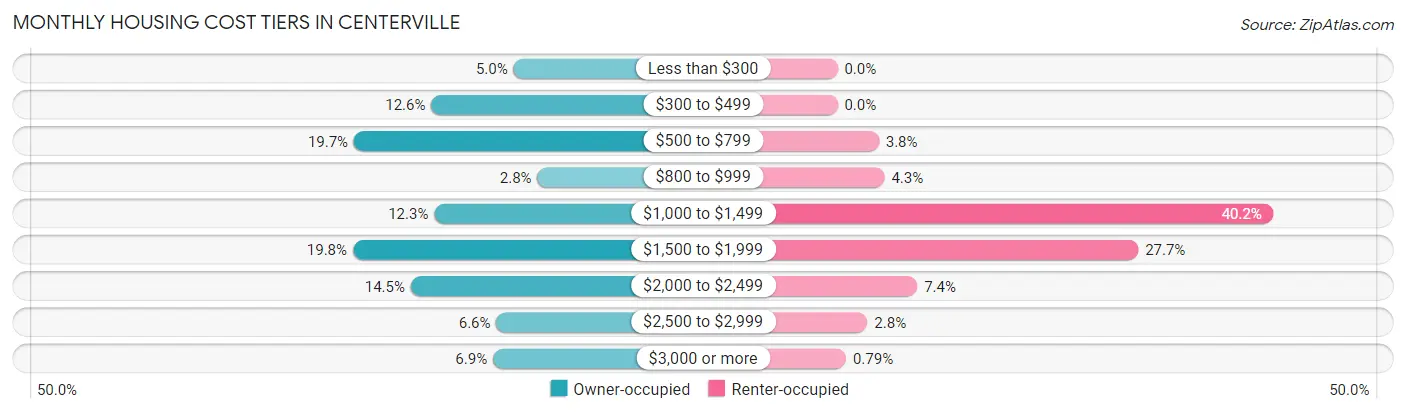
| Monthly Cost | Owner-occupied | Renter-occupied |
| Less than $300 | 245 (5.0%) | 0 (0.0%) |
| $300 to $499 | 617 (12.6%) | 0 (0.0%) |
| $500 to $799 | 967 (19.7%) | 29 (3.8%) |
| $800 to $999 | 137 (2.8%) | 33 (4.3%) |
| $1,000 to $1,499 | 604 (12.3%) | 306 (40.2%) |
| $1,500 to $1,999 | 972 (19.8%) | 211 (27.7%) |
| $2,000 to $2,499 | 710 (14.4%) | 56 (7.3%) |
| $2,500 to $2,999 | 323 (6.6%) | 21 (2.8%) |
| $3,000 or more | 338 (6.9%) | 6 (0.8%) |
| Total | 4,913 (100.0%) | 762 (100.0%) |
Physical Housing Characteristics in Centerville
Housing Structures in Centerville
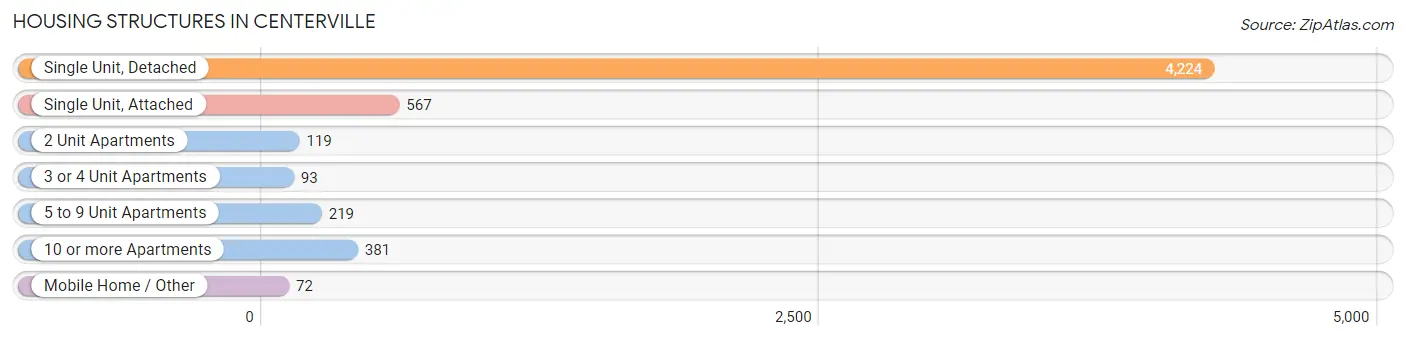
| Structure Type | # Housing Units | % Housing Units |
| Single Unit, Detached | 4,224 | 74.4% |
| Single Unit, Attached | 567 | 10.0% |
| 2 Unit Apartments | 119 | 2.1% |
| 3 or 4 Unit Apartments | 93 | 1.6% |
| 5 to 9 Unit Apartments | 219 | 3.9% |
| 10 or more Apartments | 381 | 6.7% |
| Mobile Home / Other | 72 | 1.3% |
| Total | 5,675 | 100.0% |
Housing Structures by Occupancy in Centerville
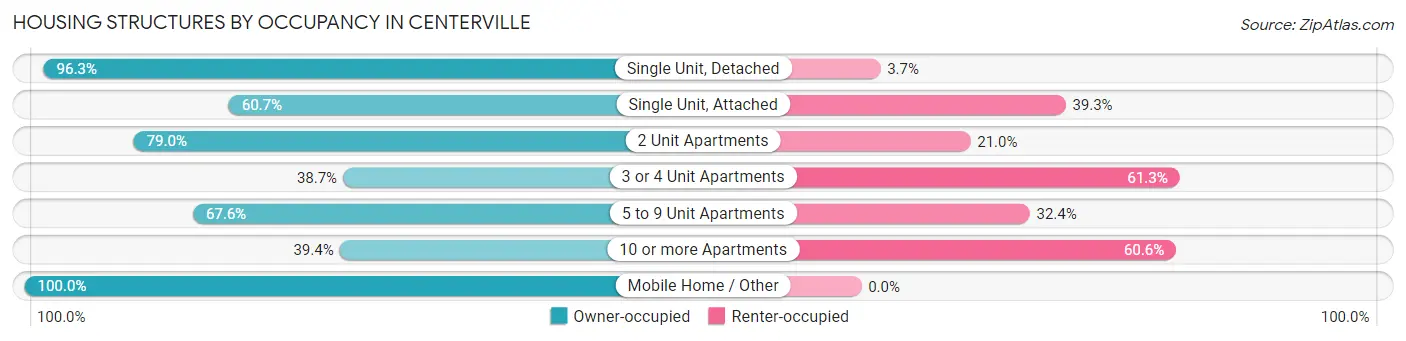
| Structure Type | Owner-occupied | Renter-occupied |
| Single Unit, Detached | 4,069 (96.3%) | 155 (3.7%) |
| Single Unit, Attached | 344 (60.7%) | 223 (39.3%) |
| 2 Unit Apartments | 94 (79.0%) | 25 (21.0%) |
| 3 or 4 Unit Apartments | 36 (38.7%) | 57 (61.3%) |
| 5 to 9 Unit Apartments | 148 (67.6%) | 71 (32.4%) |
| 10 or more Apartments | 150 (39.4%) | 231 (60.6%) |
| Mobile Home / Other | 72 (100.0%) | 0 (0.0%) |
| Total | 4,913 (86.6%) | 762 (13.4%) |
Housing Structures by Number of Rooms in Centerville
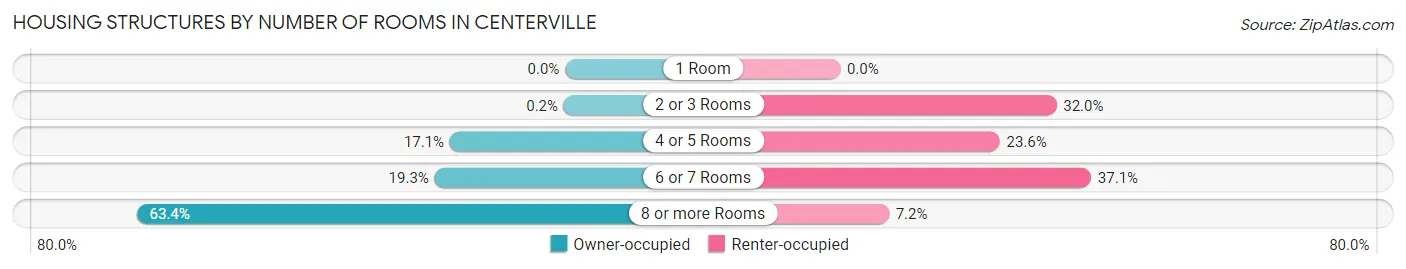
| Number of Rooms | Owner-occupied | Renter-occupied |
| 1 Room | 0 (0.0%) | 0 (0.0%) |
| 2 or 3 Rooms | 10 (0.2%) | 244 (32.0%) |
| 4 or 5 Rooms | 838 (17.1%) | 180 (23.6%) |
| 6 or 7 Rooms | 949 (19.3%) | 283 (37.1%) |
| 8 or more Rooms | 3,116 (63.4%) | 55 (7.2%) |
| Total | 4,913 (100.0%) | 762 (100.0%) |
Housing Structure by Heating Type in Centerville
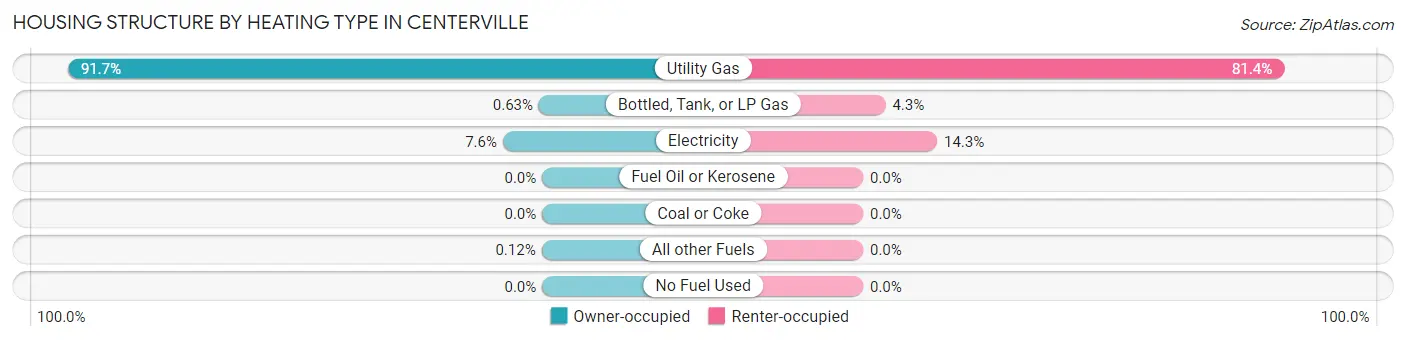
| Heating Type | Owner-occupied | Renter-occupied |
| Utility Gas | 4,503 (91.6%) | 620 (81.4%) |
| Bottled, Tank, or LP Gas | 31 (0.6%) | 33 (4.3%) |
| Electricity | 373 (7.6%) | 109 (14.3%) |
| Fuel Oil or Kerosene | 0 (0.0%) | 0 (0.0%) |
| Coal or Coke | 0 (0.0%) | 0 (0.0%) |
| All other Fuels | 6 (0.1%) | 0 (0.0%) |
| No Fuel Used | 0 (0.0%) | 0 (0.0%) |
| Total | 4,913 (100.0%) | 762 (100.0%) |
Household Vehicle Usage in Centerville
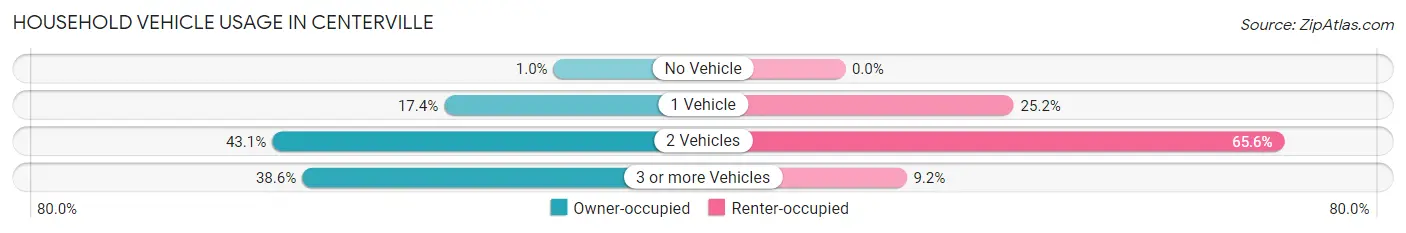
| Vehicles per Household | Owner-occupied | Renter-occupied |
| No Vehicle | 50 (1.0%) | 0 (0.0%) |
| 1 Vehicle | 853 (17.4%) | 192 (25.2%) |
| 2 Vehicles | 2,115 (43.0%) | 500 (65.6%) |
| 3 or more Vehicles | 1,895 (38.6%) | 70 (9.2%) |
| Total | 4,913 (100.0%) | 762 (100.0%) |
Real Estate & Mortgages in Centerville
Real Estate and Mortgage Overview in Centerville
| Characteristic | Without Mortgage | With Mortgage |
| Housing Units | 1,881 | 3,032 |
| Median Property Value | $419,700 | $469,300 |
| Median Household Income | $105,511 | $1,163 |
| Monthly Housing Costs | $518 | $338 |
| Real Estate Taxes | $2,578 | $47 |
Property Value by Mortgage Status in Centerville
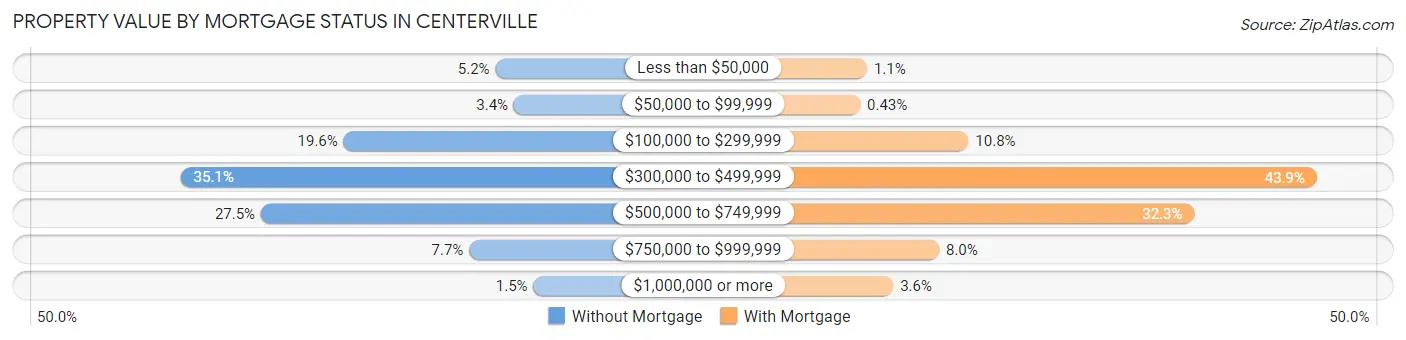
| Property Value | Without Mortgage | With Mortgage |
| Less than $50,000 | 97 (5.2%) | 33 (1.1%) |
| $50,000 to $99,999 | 64 (3.4%) | 13 (0.4%) |
| $100,000 to $299,999 | 369 (19.6%) | 326 (10.7%) |
| $300,000 to $499,999 | 661 (35.1%) | 1,332 (43.9%) |
| $500,000 to $749,999 | 517 (27.5%) | 978 (32.3%) |
| $750,000 to $999,999 | 144 (7.7%) | 241 (8.0%) |
| $1,000,000 or more | 29 (1.5%) | 109 (3.6%) |
| Total | 1,881 (100.0%) | 3,032 (100.0%) |
Household Income by Mortgage Status in Centerville
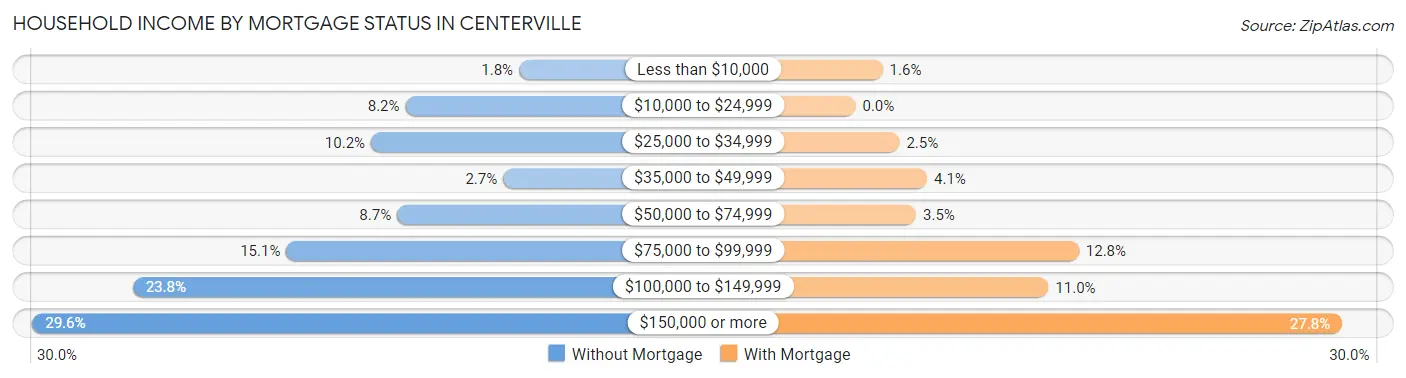
| Household Income | Without Mortgage | With Mortgage |
| Less than $10,000 | 33 (1.8%) | 47 (1.5%) |
| $10,000 to $24,999 | 155 (8.2%) | 0 (0.0%) |
| $25,000 to $34,999 | 192 (10.2%) | 76 (2.5%) |
| $35,000 to $49,999 | 50 (2.7%) | 124 (4.1%) |
| $50,000 to $74,999 | 164 (8.7%) | 105 (3.5%) |
| $75,000 to $99,999 | 283 (15.0%) | 387 (12.8%) |
| $100,000 to $149,999 | 448 (23.8%) | 334 (11.0%) |
| $150,000 or more | 556 (29.6%) | 843 (27.8%) |
| Total | 1,881 (100.0%) | 3,032 (100.0%) |
Property Value to Household Income Ratio in Centerville
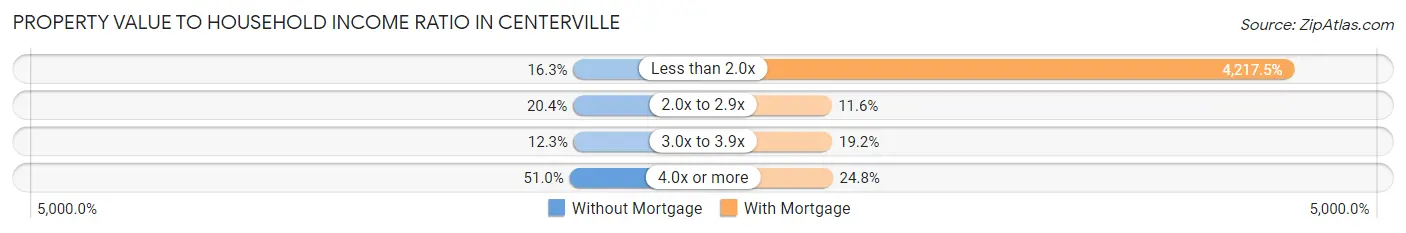
| Value-to-Income Ratio | Without Mortgage | With Mortgage |
| Less than 2.0x | 306 (16.3%) | 127,875 (4,217.5%) |
| 2.0x to 2.9x | 383 (20.4%) | 353 (11.6%) |
| 3.0x to 3.9x | 232 (12.3%) | 581 (19.2%) |
| 4.0x or more | 960 (51.0%) | 752 (24.8%) |
| Total | 1,881 (100.0%) | 3,032 (100.0%) |
Real Estate Taxes by Mortgage Status in Centerville
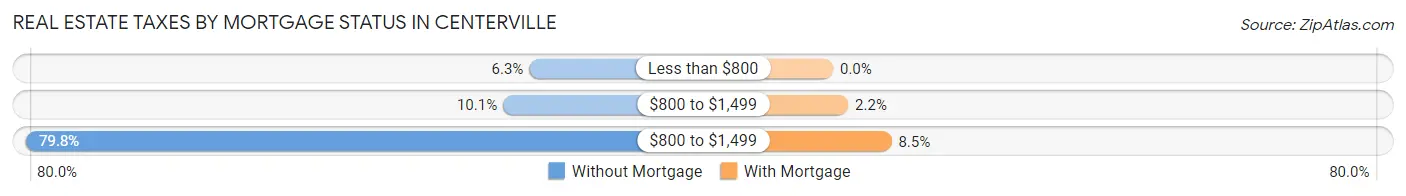
| Property Taxes | Without Mortgage | With Mortgage |
| Less than $800 | 118 (6.3%) | 0 (0.0%) |
| $800 to $1,499 | 190 (10.1%) | 67 (2.2%) |
| $800 to $1,499 | 1,501 (79.8%) | 259 (8.5%) |
| Total | 1,881 (100.0%) | 3,032 (100.0%) |
Health & Disability in Centerville
Health Insurance Coverage by Age in Centerville
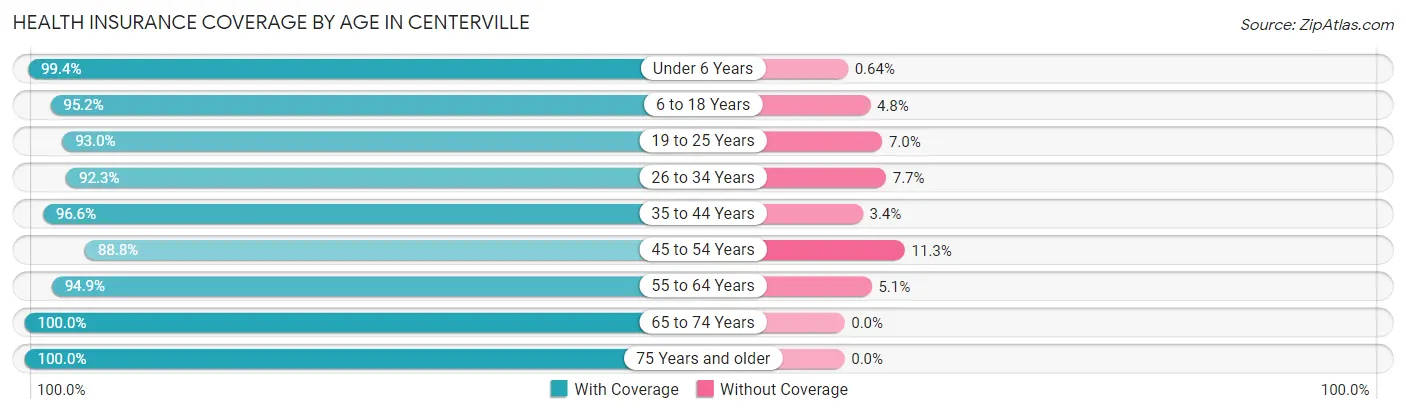
| Age Bracket | With Coverage | Without Coverage |
| Under 6 Years | 1,244 (99.4%) | 8 (0.6%) |
| 6 to 18 Years | 3,230 (95.2%) | 163 (4.8%) |
| 19 to 25 Years | 1,046 (93.0%) | 79 (7.0%) |
| 26 to 34 Years | 1,788 (92.3%) | 150 (7.7%) |
| 35 to 44 Years | 1,903 (96.6%) | 67 (3.4%) |
| 45 to 54 Years | 1,736 (88.7%) | 220 (11.3%) |
| 55 to 64 Years | 1,802 (94.9%) | 96 (5.1%) |
| 65 to 74 Years | 1,739 (100.0%) | 0 (0.0%) |
| 75 Years and older | 1,421 (100.0%) | 0 (0.0%) |
| Total | 15,909 (95.3%) | 783 (4.7%) |
Health Insurance Coverage by Citizenship Status in Centerville

| Citizenship Status | With Coverage | Without Coverage |
| Native Born | 1,244 (99.4%) | 8 (0.6%) |
| Foreign Born, Citizen | 3,230 (95.2%) | 163 (4.8%) |
| Foreign Born, not a Citizen | 1,046 (93.0%) | 79 (7.0%) |
Health Insurance Coverage by Household Income in Centerville
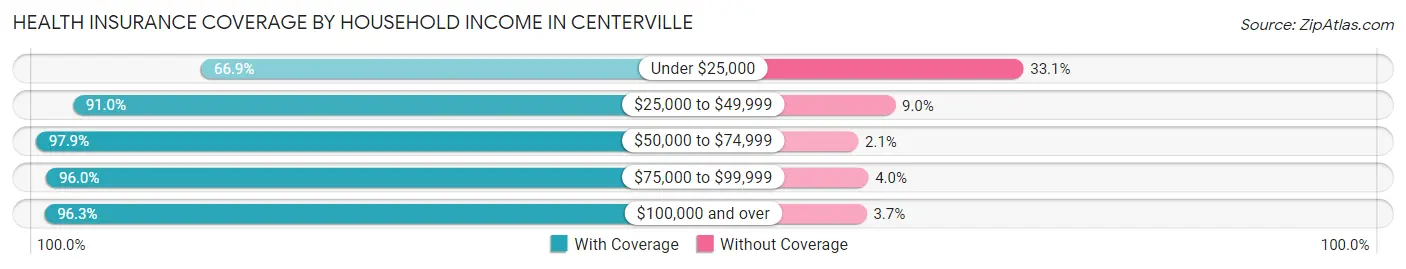
| Household Income | With Coverage | Without Coverage |
| Under $25,000 | 334 (66.9%) | 165 (33.1%) |
| $25,000 to $49,999 | 815 (91.0%) | 81 (9.0%) |
| $50,000 to $74,999 | 2,126 (97.9%) | 46 (2.1%) |
| $75,000 to $99,999 | 1,720 (96.0%) | 72 (4.0%) |
| $100,000 and over | 10,910 (96.3%) | 417 (3.7%) |
Public vs Private Health Insurance Coverage by Age in Centerville
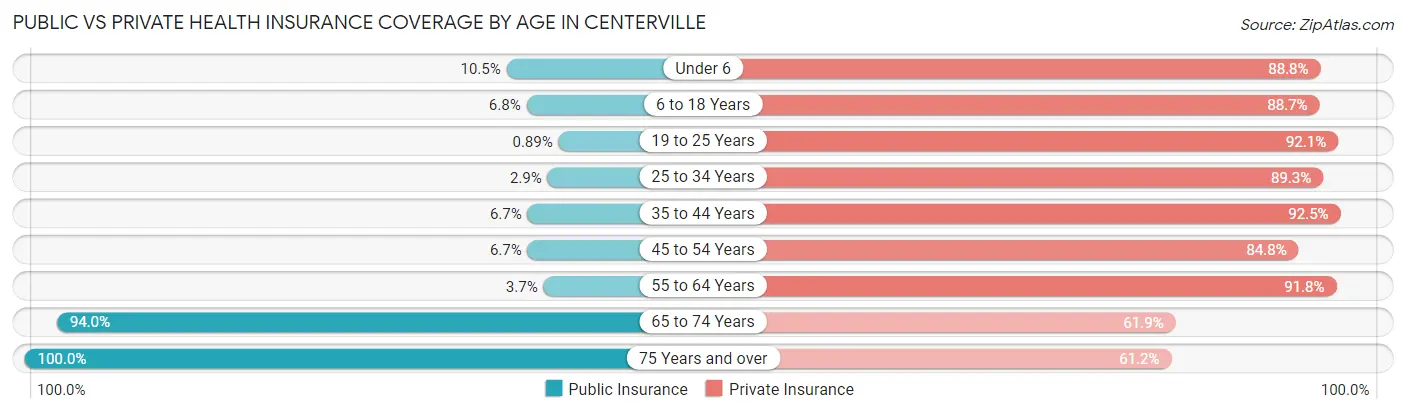
| Age Bracket | Public Insurance | Private Insurance |
| Under 6 | 132 (10.5%) | 1,112 (88.8%) |
| 6 to 18 Years | 232 (6.8%) | 3,008 (88.6%) |
| 19 to 25 Years | 10 (0.9%) | 1,036 (92.1%) |
| 25 to 34 Years | 57 (2.9%) | 1,731 (89.3%) |
| 35 to 44 Years | 131 (6.7%) | 1,823 (92.5%) |
| 45 to 54 Years | 130 (6.7%) | 1,658 (84.8%) |
| 55 to 64 Years | 70 (3.7%) | 1,742 (91.8%) |
| 65 to 74 Years | 1,635 (94.0%) | 1,077 (61.9%) |
| 75 Years and over | 1,421 (100.0%) | 869 (61.2%) |
| Total | 3,818 (22.9%) | 14,056 (84.2%) |
Disability Status by Sex by Age in Centerville
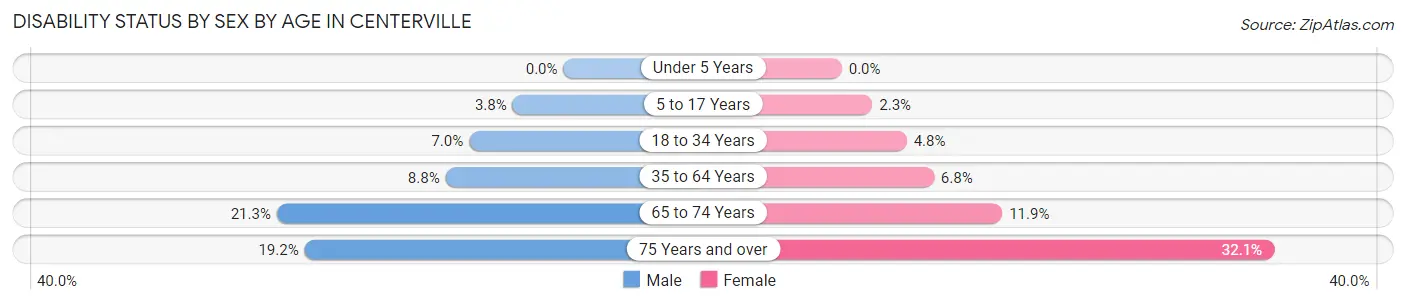
| Age Bracket | Male | Female |
| Under 5 Years | 0 (0.0%) | 0 (0.0%) |
| 5 to 17 Years | 69 (3.8%) | 35 (2.3%) |
| 18 to 34 Years | 119 (7.0%) | 77 (4.8%) |
| 35 to 64 Years | 241 (8.7%) | 210 (6.8%) |
| 65 to 74 Years | 186 (21.3%) | 103 (11.9%) |
| 75 Years and over | 109 (19.2%) | 274 (32.1%) |
Disability Class by Sex by Age in Centerville
Disability Class: Hearing Difficulty
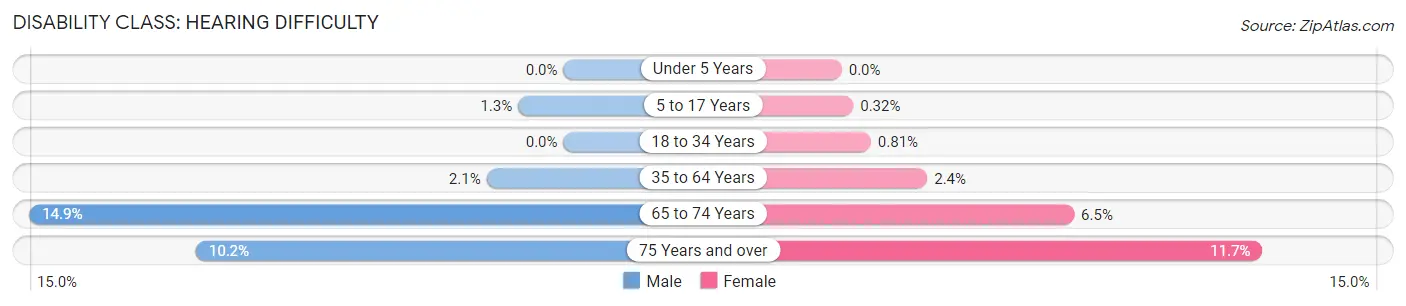
| Age Bracket | Male | Female |
| Under 5 Years | 0 (0.0%) | 0 (0.0%) |
| 5 to 17 Years | 23 (1.3%) | 5 (0.3%) |
| 18 to 34 Years | 0 (0.0%) | 13 (0.8%) |
| 35 to 64 Years | 59 (2.1%) | 73 (2.4%) |
| 65 to 74 Years | 130 (14.9%) | 56 (6.5%) |
| 75 Years and over | 58 (10.2%) | 100 (11.7%) |
Disability Class: Vision Difficulty
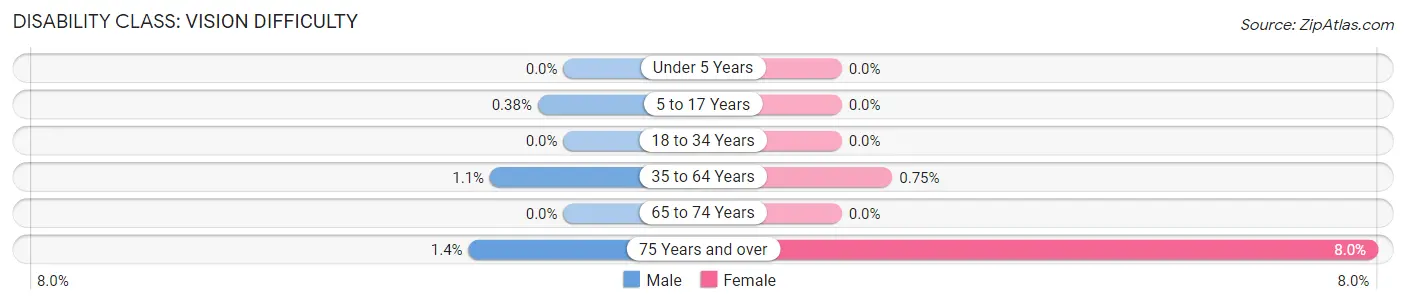
| Age Bracket | Male | Female |
| Under 5 Years | 0 (0.0%) | 0 (0.0%) |
| 5 to 17 Years | 7 (0.4%) | 0 (0.0%) |
| 18 to 34 Years | 0 (0.0%) | 0 (0.0%) |
| 35 to 64 Years | 30 (1.1%) | 23 (0.7%) |
| 65 to 74 Years | 0 (0.0%) | 0 (0.0%) |
| 75 Years and over | 8 (1.4%) | 68 (8.0%) |
Disability Class: Cognitive Difficulty
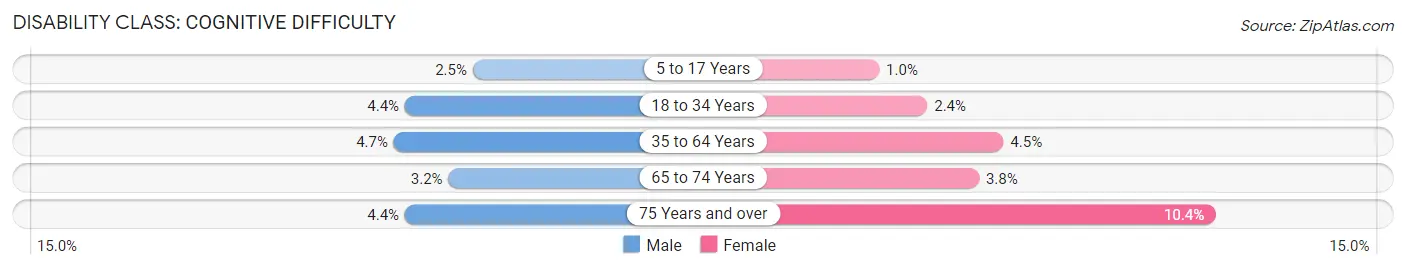
| Age Bracket | Male | Female |
| 5 to 17 Years | 46 (2.5%) | 16 (1.0%) |
| 18 to 34 Years | 75 (4.4%) | 38 (2.4%) |
| 35 to 64 Years | 130 (4.7%) | 138 (4.5%) |
| 65 to 74 Years | 28 (3.2%) | 33 (3.8%) |
| 75 Years and over | 25 (4.4%) | 89 (10.4%) |
Disability Class: Ambulatory Difficulty
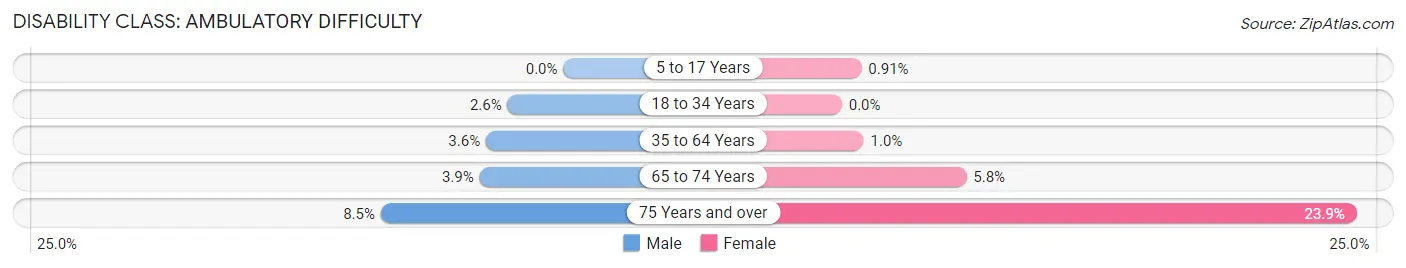
| Age Bracket | Male | Female |
| 5 to 17 Years | 0 (0.0%) | 14 (0.9%) |
| 18 to 34 Years | 44 (2.6%) | 0 (0.0%) |
| 35 to 64 Years | 99 (3.6%) | 31 (1.0%) |
| 65 to 74 Years | 34 (3.9%) | 50 (5.8%) |
| 75 Years and over | 48 (8.5%) | 204 (23.9%) |
Disability Class: Self-Care Difficulty
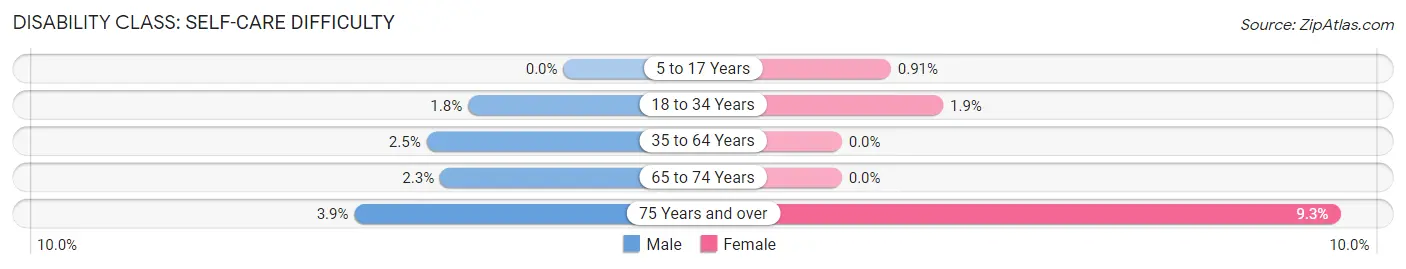
| Age Bracket | Male | Female |
| 5 to 17 Years | 0 (0.0%) | 14 (0.9%) |
| 18 to 34 Years | 30 (1.8%) | 30 (1.9%) |
| 35 to 64 Years | 70 (2.5%) | 0 (0.0%) |
| 65 to 74 Years | 20 (2.3%) | 0 (0.0%) |
| 75 Years and over | 22 (3.9%) | 79 (9.2%) |
Technology Access in Centerville
Computing Device Access in Centerville
| Device Type | # Households | % Households |
| Desktop or Laptop | 5,321 | 93.8% |
| Smartphone | 5,290 | 93.2% |
| Tablet | 4,391 | 77.4% |
| No Computing Device | 123 | 2.2% |
| Total | 5,675 | 100.0% |
Internet Access in Centerville
| Internet Type | # Households | % Households |
| Dial-Up Internet | 25 | 0.4% |
| Broadband Home | 4,858 | 85.6% |
| Cellular Data Only | 223 | 3.9% |
| Satellite Internet | 548 | 9.7% |
| No Internet | 416 | 7.3% |
| Total | 5,675 | 100.0% |
Centerville Summary
Centerville, Utah is a city located in Davis County, Utah, United States. It is part of the Ogden-Clearfield Metropolitan Statistical Area. The population was 15,335 at the 2010 census.
History
Centerville was first settled in 1847 by a group of Mormon pioneers led by John S. Fullmer. The town was originally named Deuel Settlement after one of the original settlers, but was later changed to Centerville due to its location in the center of Davis County. The town was incorporated in 1851 and has since grown to become one of the largest cities in Davis County.
Geography
Centerville is located at the base of the Wasatch Mountains in northern Utah. It is situated at an elevation of 4,521 feet (1,378 m) above sea level. The city covers an area of 8.3 square miles (21.5 km2).
The city is bordered by the cities of Bountiful to the north, Farmington to the east, Kaysville to the south, and Layton to the west. The city is also located near the Great Salt Lake, which is located to the west of the city.
Economy
Centerville is home to a variety of businesses and industries. The city is home to several large employers, including Hill Air Force Base, Intermountain Healthcare, and the Davis School District. The city is also home to several small businesses, including restaurants, retail stores, and professional services.
The city is also home to several major shopping centers, including the Centerville Towne Center, which is home to several major retailers, including Target, Kohl’s, and Best Buy.
Demographics
As of the 2010 census, there were 15,335 people, 5,541 households, and 4,072 families residing in the city. The population density was 1,845.3 people per square mile (715.2/km2). There were 5,845 housing units at an average density of 708.3 per square mile (273.7/km2).
The racial makeup of the city was 91.2% White, 1.2% African American, 0.5% Native American, 1.7% Asian, 0.2% Pacific Islander, 3.2% from other races, and 2.2% from two or more races. Hispanic or Latino of any race were 6.7% of the population.
The median income for a household in the city was $63,945, and the median income for a family was $72,945. Males had a median income of $50,945 versus $35,945 for females. The per capita income for the city was $27,945. About 3.2% of families and 4.7% of the population were below the poverty line, including 5.3% of those under age 18 and 4.2% of those age 65 or over.
Common Questions
What is Per Capita Income in Centerville?
Per Capita income in Centerville is $45,588.
What is the Median Family Income in Centerville?
Median Family Income in Centerville is $127,301.
What is the Median Household income in Centerville?
Median Household Income in Centerville is $113,697.
What is Income or Wage Gap in Centerville?
Income or Wage Gap in Centerville is 56.0%.
Women in Centerville earn 44.0 cents for every dollar earned by a man.
What is Family Income Deficit in Centerville?
Family Income Deficit in Centerville is $4,087.
Families that are below poverty line in Centerville earn $4,087 less on average than the poverty threshold level.
What is Inequality or Gini Index in Centerville?
Inequality or Gini Index in Centerville is 0.39.
What is the Total Population of Centerville?
Total Population of Centerville is 16,740.
What is the Total Male Population of Centerville?
Total Male Population of Centerville is 8,183.
What is the Total Female Population of Centerville?
Total Female Population of Centerville is 8,557.
What is the Ratio of Males per 100 Females in Centerville?
There are 95.63 Males per 100 Females in Centerville.
What is the Ratio of Females per 100 Males in Centerville?
There are 104.57 Females per 100 Males in Centerville.
What is the Median Population Age in Centerville?
Median Population Age in Centerville is 38.7 Years.
What is the Average Family Size in Centerville
Average Family Size in Centerville is 3.4 People.
What is the Average Household Size in Centerville
Average Household Size in Centerville is 2.9 People.
How Large is the Labor Force in Centerville?
There are 8,516 People in the Labor Forcein in Centerville.
What is the Percentage of People in the Labor Force in Centerville?
66.3% of People are in the Labor Force in Centerville.
What is the Unemployment Rate in Centerville?
Unemployment Rate in Centerville is 1.4%.