Taylorsville, UT Map & Demographics
Taylorsville Map
Taylorsville Overview
$33,178
PER CAPITA INCOME
$93,445
AVG FAMILY INCOME
$81,417
AVG HOUSEHOLD INCOME
27.7%
WAGE / INCOME GAP [ % ]
72.3¢/ $1
WAGE / INCOME GAP [ $ ]
$12,562
FAMILY INCOME DEFICIT
0.37
INEQUALITY / GINI INDEX
59,729
TOTAL POPULATION
29,239
MALE POPULATION
30,490
FEMALE POPULATION
95.90
MALES / 100 FEMALES
104.28
FEMALES / 100 MALES
33.7
MEDIAN AGE
3.5
AVG FAMILY SIZE
3.0
AVG HOUSEHOLD SIZE
31,876
LABOR FORCE [ PEOPLE ]
71.1%
PERCENT IN LABOR FORCE
4.5%
UNEMPLOYMENT RATE
Income in Taylorsville
Income Overview in Taylorsville
Per Capita Income in Taylorsville is $33,178, while median incomes of families and households are $93,445 and $81,417 respectively.
| Characteristic | Number | Measure |
| Per Capita Income | 59,729 | $33,178 |
| Median Family Income | 14,384 | $93,445 |
| Mean Family Income | 14,384 | $103,811 |
| Median Household Income | 20,003 | $81,417 |
| Mean Household Income | 20,003 | $96,319 |
| Income Deficit | 14,384 | $12,562 |
| Wage / Income Gap (%) | 59,729 | 27.67% |
| Wage / Income Gap ($) | 59,729 | 72.33¢ per $1 |
| Gini / Inequality Index | 59,729 | 0.37 |
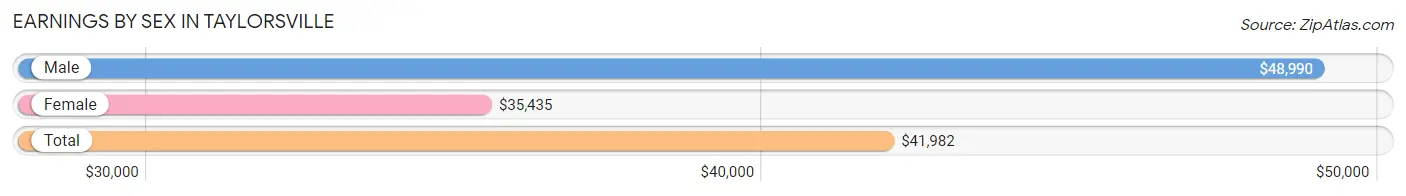
Earnings by Sex in Taylorsville
Average Earnings in Taylorsville are $41,982, $48,990 for men and $35,435 for women, a difference of 27.7%.
| Sex | Number | Average Earnings |
| Male | 17,083 (52.3%) | $48,990 |
| Female | 15,606 (47.7%) | $35,435 |
| Total | 32,689 (100.0%) | $41,982 |
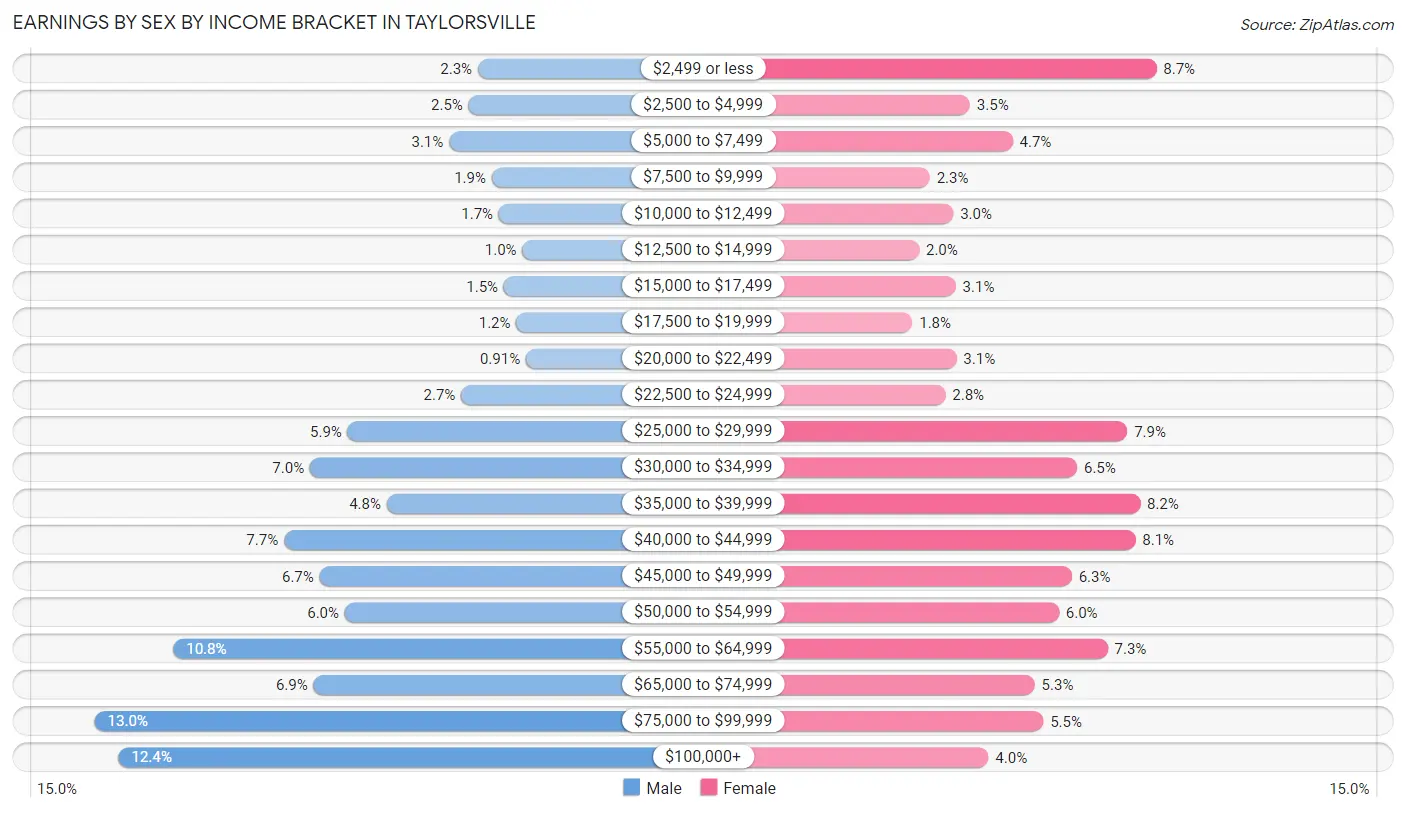
Earnings by Sex by Income Bracket in Taylorsville
The most common earnings brackets in Taylorsville are $75,000 to $99,999 for men (2,226 | 13.0%) and $2,499 or less for women (1,357 | 8.7%).
| Income | Male | Female |
| $2,499 or less | 386 (2.3%) | 1,357 (8.7%) |
| $2,500 to $4,999 | 430 (2.5%) | 540 (3.5%) |
| $5,000 to $7,499 | 525 (3.1%) | 727 (4.7%) |
| $7,500 to $9,999 | 320 (1.9%) | 363 (2.3%) |
| $10,000 to $12,499 | 286 (1.7%) | 467 (3.0%) |
| $12,500 to $14,999 | 172 (1.0%) | 317 (2.0%) |
| $15,000 to $17,499 | 262 (1.5%) | 478 (3.1%) |
| $17,500 to $19,999 | 202 (1.2%) | 287 (1.8%) |
| $20,000 to $22,499 | 156 (0.9%) | 481 (3.1%) |
| $22,500 to $24,999 | 466 (2.7%) | 433 (2.8%) |
| $25,000 to $29,999 | 1,011 (5.9%) | 1,230 (7.9%) |
| $30,000 to $34,999 | 1,193 (7.0%) | 1,009 (6.5%) |
| $35,000 to $39,999 | 823 (4.8%) | 1,286 (8.2%) |
| $40,000 to $44,999 | 1,317 (7.7%) | 1,265 (8.1%) |
| $45,000 to $49,999 | 1,146 (6.7%) | 986 (6.3%) |
| $50,000 to $54,999 | 1,025 (6.0%) | 930 (6.0%) |
| $55,000 to $64,999 | 1,849 (10.8%) | 1,144 (7.3%) |
| $65,000 to $74,999 | 1,176 (6.9%) | 824 (5.3%) |
| $75,000 to $99,999 | 2,226 (13.0%) | 861 (5.5%) |
| $100,000+ | 2,112 (12.4%) | 621 (4.0%) |
| Total | 17,083 (100.0%) | 15,606 (100.0%) |
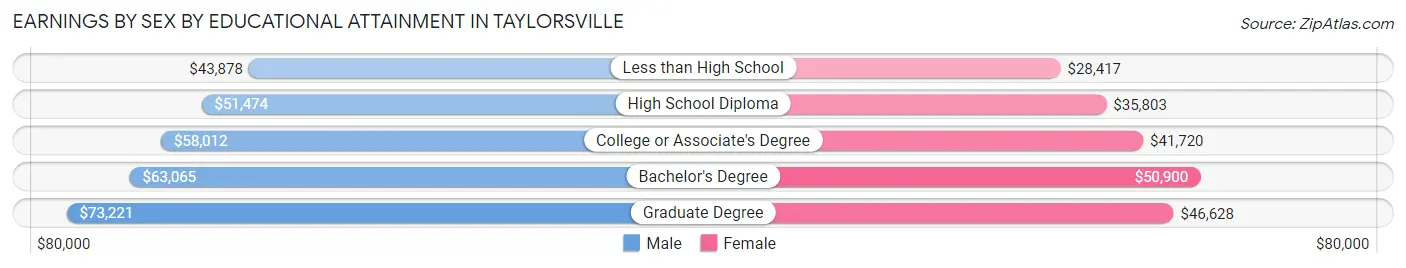
Earnings by Sex by Educational Attainment in Taylorsville
Average earnings in Taylorsville are $54,257 for men and $40,112 for women, a difference of 26.1%. Men with an educational attainment of graduate degree enjoy the highest average annual earnings of $73,221, while those with less than high school education earn the least with $43,878. Women with an educational attainment of bachelor's degree earn the most with the average annual earnings of $50,900, while those with less than high school education have the smallest earnings of $28,417.
| Educational Attainment | Male Income | Female Income |
| Less than High School | $43,878 | $28,417 |
| High School Diploma | $51,474 | $35,803 |
| College or Associate's Degree | $58,012 | $41,720 |
| Bachelor's Degree | $63,065 | $50,900 |
| Graduate Degree | $73,221 | $46,628 |
| Total | $54,257 | $40,112 |
Family Income in Taylorsville
Family Income Brackets in Taylorsville
According to the Taylorsville family income data, there are 3,596 families falling into the $100,000 to $149,999 income range, which is the most common income bracket and makes up 25.0% of all families. Conversely, the $10,000 to $14,999 income bracket is the least frequent group with only 115 families (0.8%) belonging to this category.
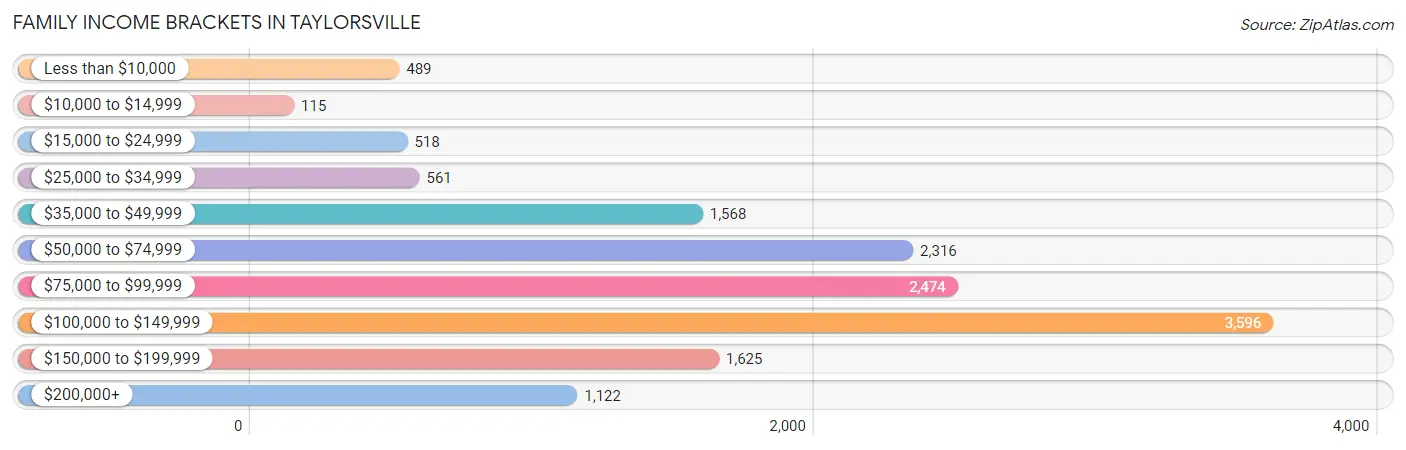
| Income Bracket | # Families | % Families |
| Less than $10,000 | 489 | 3.4% |
| $10,000 to $14,999 | 115 | 0.8% |
| $15,000 to $24,999 | 518 | 3.6% |
| $25,000 to $34,999 | 561 | 3.9% |
| $35,000 to $49,999 | 1,568 | 10.9% |
| $50,000 to $74,999 | 2,316 | 16.1% |
| $75,000 to $99,999 | 2,474 | 17.2% |
| $100,000 to $149,999 | 3,596 | 25.0% |
| $150,000 to $199,999 | 1,625 | 11.3% |
| $200,000+ | 1,122 | 7.8% |
Family Income by Famaliy Size in Taylorsville
4-person families (2,448 | 17.0%) account for the highest median family income in Taylorsville with $115,183 per family, while 2-person families (6,163 | 42.8%) have the highest median income of $39,564 per family member.
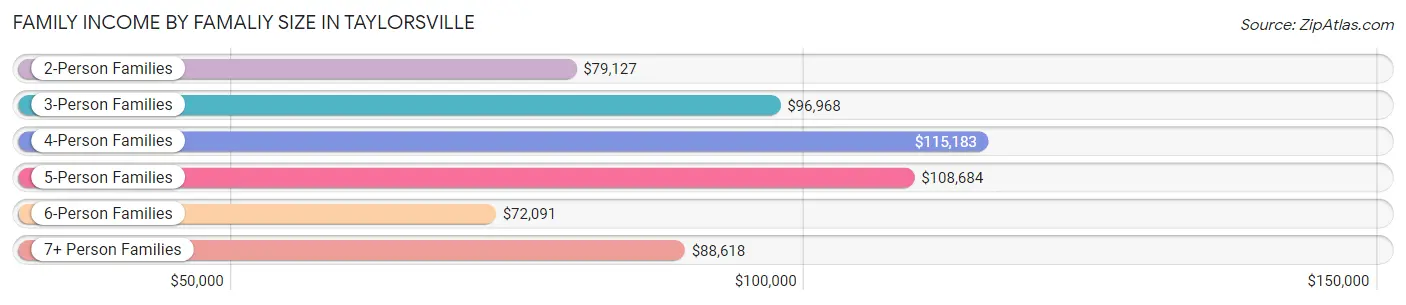
| Income Bracket | # Families | Median Income |
| 2-Person Families | 6,163 (42.8%) | $79,127 |
| 3-Person Families | 2,727 (19.0%) | $96,968 |
| 4-Person Families | 2,448 (17.0%) | $115,183 |
| 5-Person Families | 1,482 (10.3%) | $108,684 |
| 6-Person Families | 1,006 (7.0%) | $72,091 |
| 7+ Person Families | 558 (3.9%) | $88,618 |
| Total | 14,384 (100.0%) | $93,445 |
Family Income by Number of Earners in Taylorsville
The median family income in Taylorsville is $93,445, with families comprising 3+ earners (2,634) having the highest median family income of $143,011, while families with no earners (1,637) have the lowest median family income of $45,524, accounting for 18.3% and 11.4% of families, respectively.
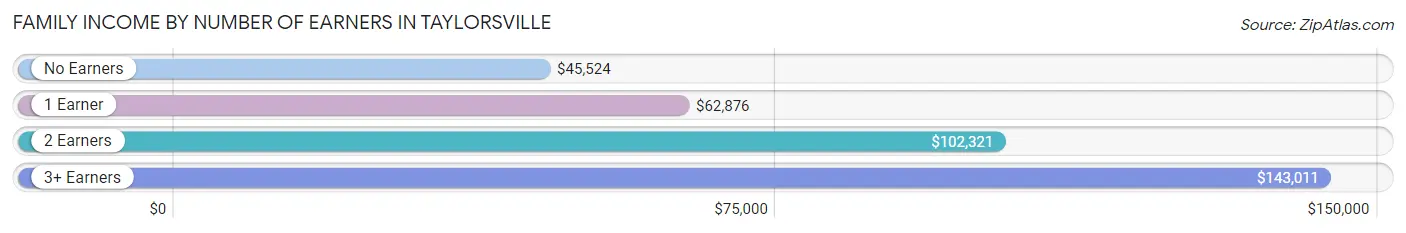
| Number of Earners | # Families | Median Income |
| No Earners | 1,637 (11.4%) | $45,524 |
| 1 Earner | 4,200 (29.2%) | $62,876 |
| 2 Earners | 5,913 (41.1%) | $102,321 |
| 3+ Earners | 2,634 (18.3%) | $143,011 |
| Total | 14,384 (100.0%) | $93,445 |
Household Income in Taylorsville
Household Income Brackets in Taylorsville
With 4,181 households falling in the category, the $100,000 to $149,999 income range is the most frequent in Taylorsville, accounting for 20.9% of all households. In contrast, only 320 households (1.6%) fall into the $10,000 to $14,999 income bracket, making it the least populous group.
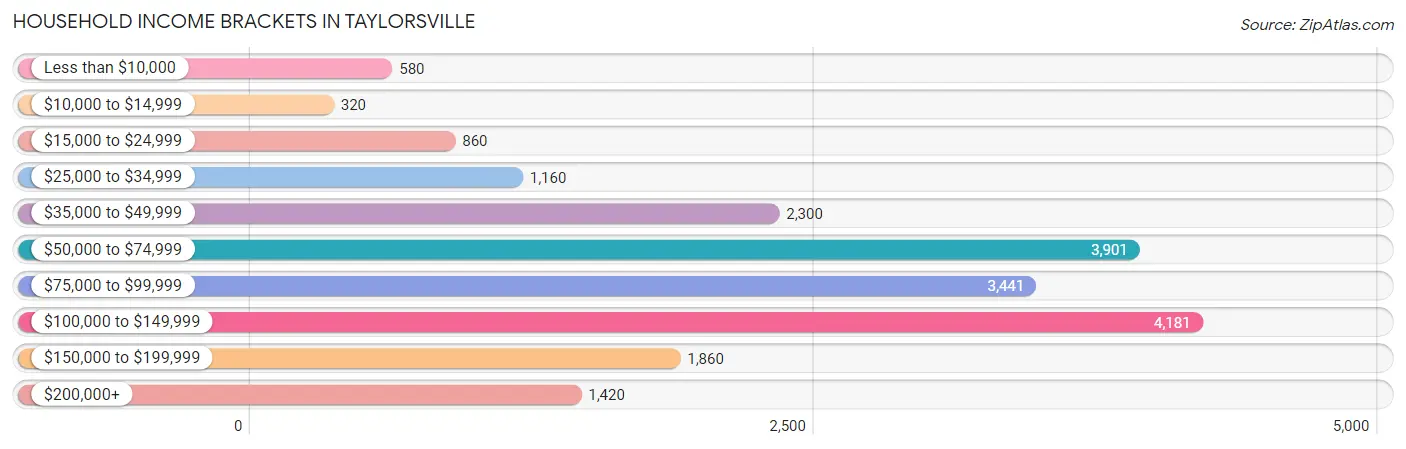
| Income Bracket | # Households | % Households |
| Less than $10,000 | 580 | 2.9% |
| $10,000 to $14,999 | 320 | 1.6% |
| $15,000 to $24,999 | 860 | 4.3% |
| $25,000 to $34,999 | 1,160 | 5.8% |
| $35,000 to $49,999 | 2,300 | 11.5% |
| $50,000 to $74,999 | 3,901 | 19.5% |
| $75,000 to $99,999 | 3,441 | 17.2% |
| $100,000 to $149,999 | 4,181 | 20.9% |
| $150,000 to $199,999 | 1,860 | 9.3% |
| $200,000+ | 1,420 | 7.1% |
Household Income by Householder Age in Taylorsville
The median household income in Taylorsville is $81,417, with the highest median household income of $106,416 found in the 45 to 64 years age bracket for the primary householder. A total of 6,610 households (33.1%) fall into this category. Meanwhile, the 65+ years age bracket for the primary householder has the lowest median household income of $58,702, with 4,577 households (22.9%) in this group.
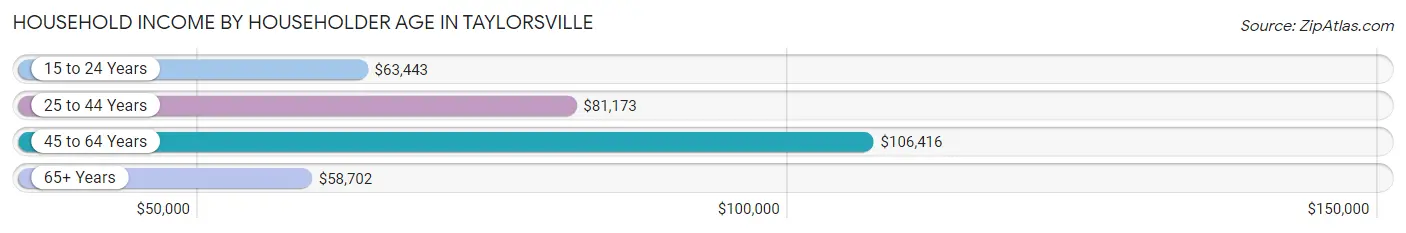
| Income Bracket | # Households | Median Income |
| 15 to 24 Years | 846 (4.2%) | $63,443 |
| 25 to 44 Years | 7,970 (39.8%) | $81,173 |
| 45 to 64 Years | 6,610 (33.1%) | $106,416 |
| 65+ Years | 4,577 (22.9%) | $58,702 |
| Total | 20,003 (100.0%) | $81,417 |
Poverty in Taylorsville
Income Below Poverty by Sex and Age in Taylorsville
With 6.7% poverty level for males and 10.2% for females among the residents of Taylorsville, under 5 year old males and 5 year old females are the most vulnerable to poverty, with 442 males (22.4%) and 125 females (24.2%) in their respective age groups living below the poverty level.
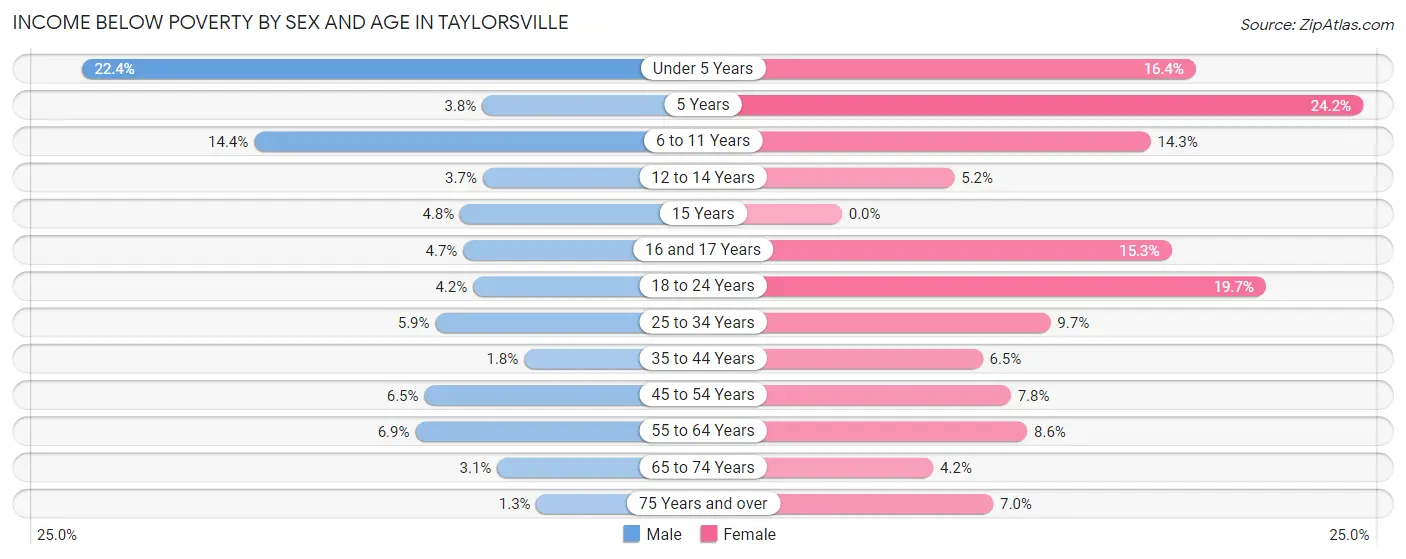
| Age Bracket | Male | Female |
| Under 5 Years | 442 (22.4%) | 385 (16.4%) |
| 5 Years | 17 (3.8%) | 125 (24.2%) |
| 6 to 11 Years | 419 (14.3%) | 421 (14.3%) |
| 12 to 14 Years | 43 (3.7%) | 67 (5.2%) |
| 15 Years | 26 (4.8%) | 0 (0.0%) |
| 16 and 17 Years | 33 (4.6%) | 100 (15.3%) |
| 18 to 24 Years | 104 (4.2%) | 510 (19.7%) |
| 25 to 34 Years | 281 (5.9%) | 470 (9.7%) |
| 35 to 44 Years | 80 (1.8%) | 264 (6.5%) |
| 45 to 54 Years | 196 (6.5%) | 277 (7.8%) |
| 55 to 64 Years | 234 (6.9%) | 257 (8.6%) |
| 65 to 74 Years | 64 (3.1%) | 96 (4.2%) |
| 75 Years and over | 14 (1.3%) | 125 (7.0%) |
| Total | 1,953 (6.7%) | 3,097 (10.2%) |
Income Above Poverty by Sex and Age in Taylorsville
According to the poverty statistics in Taylorsville, males aged 75 years and over and females aged 15 years are the age groups that are most secure financially, with 98.8% of males and 100.0% of females in these age groups living above the poverty line.
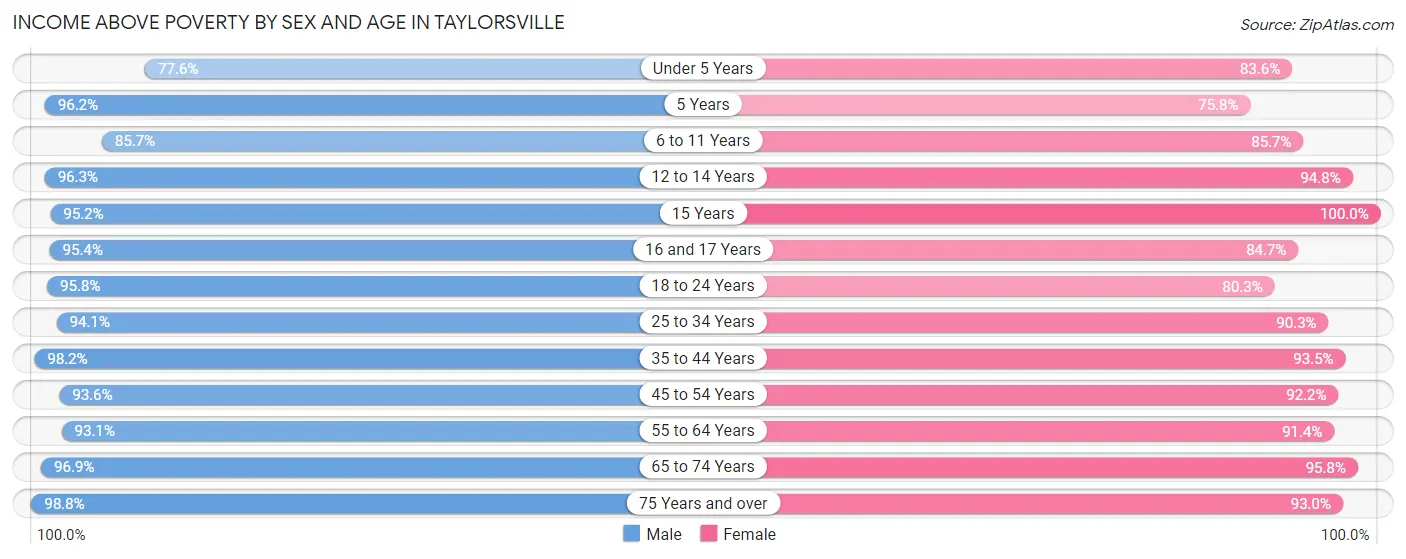
| Age Bracket | Male | Female |
| Under 5 Years | 1,535 (77.6%) | 1,959 (83.6%) |
| 5 Years | 434 (96.2%) | 392 (75.8%) |
| 6 to 11 Years | 2,501 (85.7%) | 2,517 (85.7%) |
| 12 to 14 Years | 1,107 (96.3%) | 1,217 (94.8%) |
| 15 Years | 517 (95.2%) | 554 (100.0%) |
| 16 and 17 Years | 677 (95.4%) | 554 (84.7%) |
| 18 to 24 Years | 2,377 (95.8%) | 2,083 (80.3%) |
| 25 to 34 Years | 4,450 (94.1%) | 4,386 (90.3%) |
| 35 to 44 Years | 4,323 (98.2%) | 3,776 (93.5%) |
| 45 to 54 Years | 2,841 (93.5%) | 3,257 (92.2%) |
| 55 to 64 Years | 3,171 (93.1%) | 2,730 (91.4%) |
| 65 to 74 Years | 2,019 (96.9%) | 2,170 (95.8%) |
| 75 Years and over | 1,110 (98.8%) | 1,655 (93.0%) |
| Total | 27,062 (93.3%) | 27,250 (89.8%) |
Income Below Poverty Among Married-Couple Families in Taylorsville
The poverty statistics for married-couple families in Taylorsville show that 3.2% or 331 of the total 10,447 families live below the poverty line. Families with 5 or more children have the highest poverty rate of 12.8%, comprising of 28 families. On the other hand, families with 1 or 2 children have the lowest poverty rate of 1.2%, which includes 38 families.
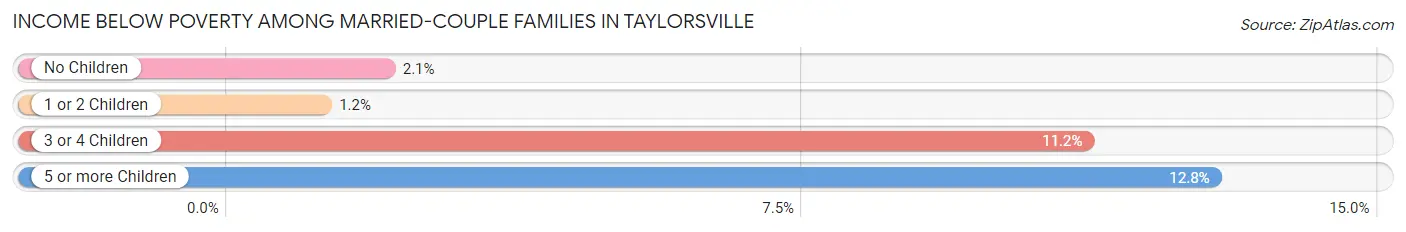
| Children | Above Poverty | Below Poverty |
| No Children | 5,712 (97.9%) | 120 (2.1%) |
| 1 or 2 Children | 3,062 (98.8%) | 38 (1.2%) |
| 3 or 4 Children | 1,152 (88.8%) | 145 (11.2%) |
| 5 or more Children | 190 (87.2%) | 28 (12.8%) |
| Total | 10,116 (96.8%) | 331 (3.2%) |
Income Below Poverty Among Single-Parent Households in Taylorsville
According to the poverty data in Taylorsville, 7.1% or 81 single-father households and 23.7% or 662 single-mother households are living below the poverty line. Among single-father households, those with 3 or 4 children have the highest poverty rate, with 10 households (20.0%) experiencing poverty. Likewise, among single-mother households, those with 3 or 4 children have the highest poverty rate, with 119 households (44.9%) falling below the poverty line.
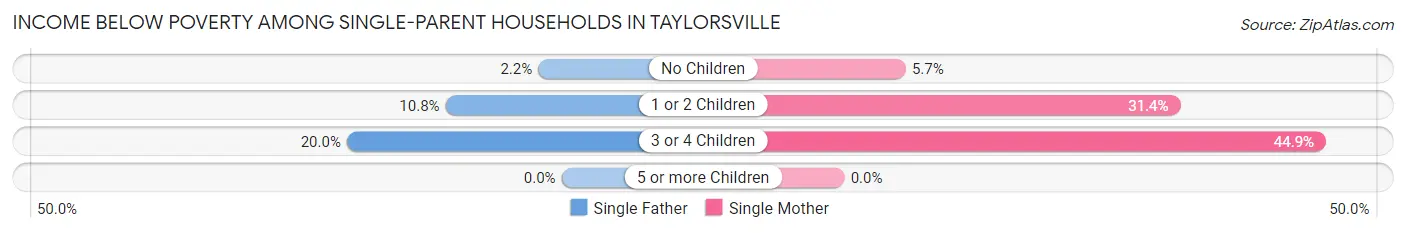
| Children | Single Father | Single Mother |
| No Children | 12 (2.2%) | 48 (5.7%) |
| 1 or 2 Children | 59 (10.8%) | 495 (31.4%) |
| 3 or 4 Children | 10 (20.0%) | 119 (44.9%) |
| 5 or more Children | 0 (0.0%) | 0 (0.0%) |
| Total | 81 (7.1%) | 662 (23.7%) |
Income Below Poverty Among Married-Couple vs Single-Parent Households in Taylorsville
The poverty data for Taylorsville shows that 331 of the married-couple family households (3.2%) and 743 of the single-parent households (18.9%) are living below the poverty level. Within the married-couple family households, those with 5 or more children have the highest poverty rate, with 28 households (12.8%) falling below the poverty line. Among the single-parent households, those with 3 or 4 children have the highest poverty rate, with 129 household (40.9%) living below poverty.
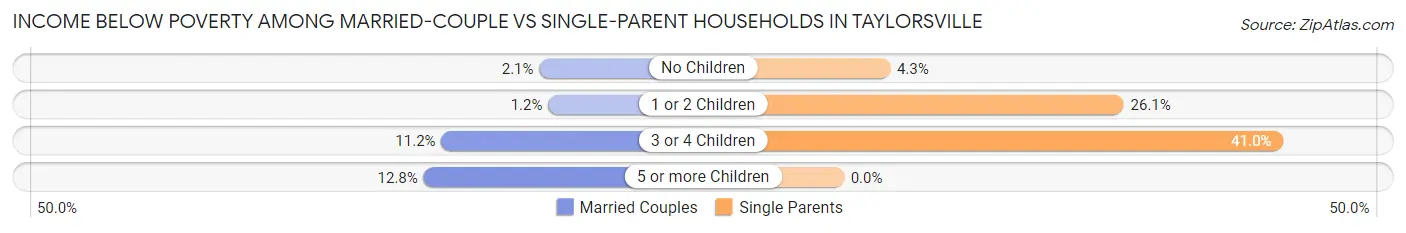
| Children | Married-Couple Families | Single-Parent Households |
| No Children | 120 (2.1%) | 60 (4.3%) |
| 1 or 2 Children | 38 (1.2%) | 554 (26.1%) |
| 3 or 4 Children | 145 (11.2%) | 129 (40.9%) |
| 5 or more Children | 28 (12.8%) | 0 (0.0%) |
| Total | 331 (3.2%) | 743 (18.9%) |
Race in Taylorsville
The most populous races in Taylorsville are White / Caucasian (41,669 | 69.8%), Hispanic or Latino (14,661 | 24.5%), and Some other Race (6,438 | 10.8%).
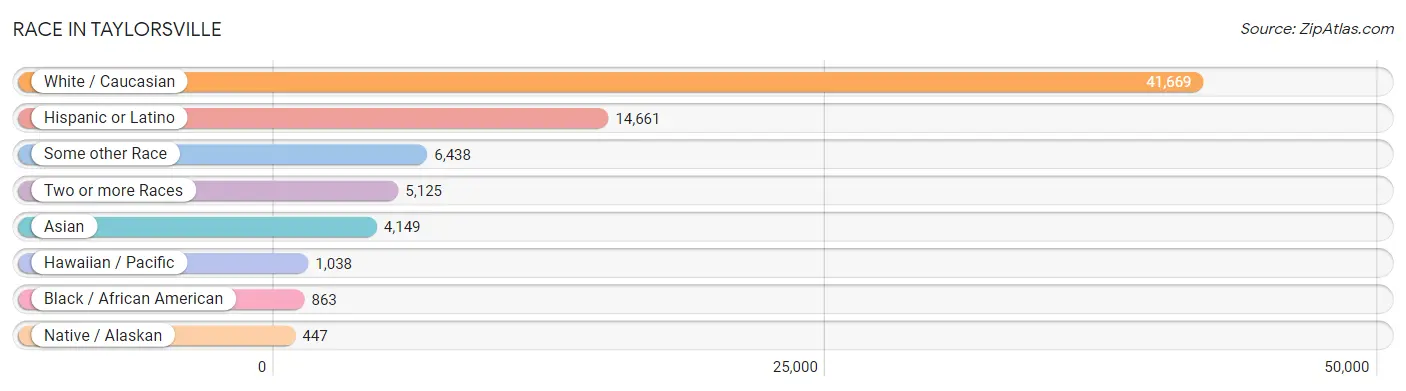
| Race | # Population | % Population |
| Asian | 4,149 | 7.0% |
| Black / African American | 863 | 1.4% |
| Hawaiian / Pacific | 1,038 | 1.7% |
| Hispanic or Latino | 14,661 | 24.5% |
| Native / Alaskan | 447 | 0.7% |
| White / Caucasian | 41,669 | 69.8% |
| Two or more Races | 5,125 | 8.6% |
| Some other Race | 6,438 | 10.8% |
| Total | 59,729 | 100.0% |
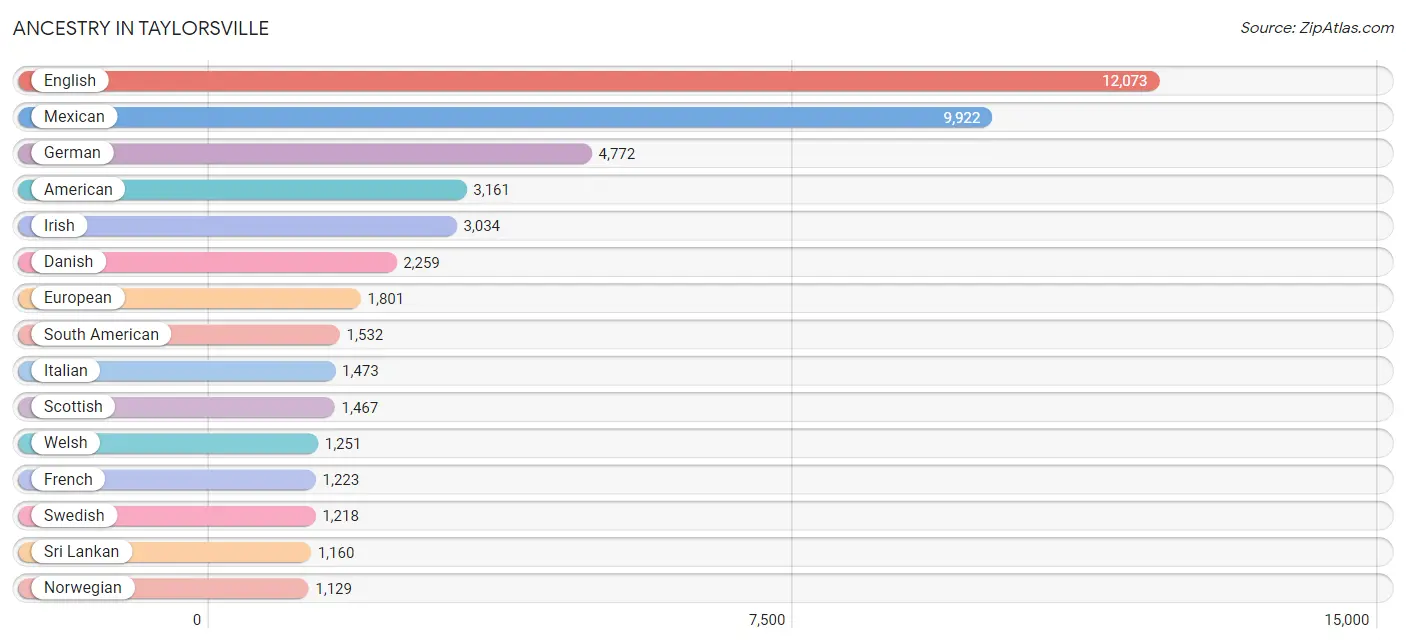
Ancestry in Taylorsville
The most populous ancestries reported in Taylorsville are English (12,073 | 20.2%), Mexican (9,922 | 16.6%), German (4,772 | 8.0%), American (3,161 | 5.3%), and Irish (3,034 | 5.1%), together accounting for 55.2% of all Taylorsville residents.
| Ancestry | # Population | % Population |
| Afghan | 80 | 0.1% |
| African | 55 | 0.1% |
| American | 3,161 | 5.3% |
| Apache | 181 | 0.3% |
| Arab | 545 | 0.9% |
| Argentinean | 64 | 0.1% |
| Armenian | 38 | 0.1% |
| Austrian | 8 | 0.0% |
| Bhutanese | 335 | 0.6% |
| Bolivian | 8 | 0.0% |
| Brazilian | 173 | 0.3% |
| British | 546 | 0.9% |
| Burmese | 440 | 0.7% |
| Cambodian | 57 | 0.1% |
| Canadian | 66 | 0.1% |
| Celtic | 25 | 0.0% |
| Central American | 913 | 1.5% |
| Central American Indian | 118 | 0.2% |
| Cherokee | 209 | 0.4% |
| Cheyenne | 36 | 0.1% |
| Chilean | 70 | 0.1% |
| Colombian | 430 | 0.7% |
| Croatian | 33 | 0.1% |
| Cuban | 83 | 0.1% |
| Czech | 119 | 0.2% |
| Czechoslovakian | 15 | 0.0% |
| Danish | 2,259 | 3.8% |
| Dominican | 89 | 0.2% |
| Dutch | 735 | 1.2% |
| Eastern European | 135 | 0.2% |
| Ecuadorian | 271 | 0.4% |
| English | 12,073 | 20.2% |
| European | 1,801 | 3.0% |
| Fijian | 5 | 0.0% |
| Finnish | 16 | 0.0% |
| French | 1,223 | 2.1% |
| French Canadian | 84 | 0.1% |
| German | 4,772 | 8.0% |
| Greek | 476 | 0.8% |
| Guamanian / Chamorro | 19 | 0.0% |
| Guatemalan | 219 | 0.4% |
| Honduran | 8 | 0.0% |
| Hungarian | 35 | 0.1% |
| Icelander | 6 | 0.0% |
| Indian (Asian) | 930 | 1.6% |
| Iranian | 16 | 0.0% |
| Iraqi | 490 | 0.8% |
| Irish | 3,034 | 5.1% |
| Iroquois | 119 | 0.2% |
| Italian | 1,473 | 2.5% |
| Jamaican | 26 | 0.0% |
| Japanese | 64 | 0.1% |
| Kenyan | 16 | 0.0% |
| Korean | 723 | 1.2% |
| Laotian | 102 | 0.2% |
| Lebanese | 9 | 0.0% |
| Lithuanian | 8 | 0.0% |
| Luxembourger | 13 | 0.0% |
| Malaysian | 109 | 0.2% |
| Mexican | 9,922 | 16.6% |
| Mexican American Indian | 124 | 0.2% |
| Mongolian | 17 | 0.0% |
| Native Hawaiian | 62 | 0.1% |
| Navajo | 276 | 0.5% |
| New Zealander | 79 | 0.1% |
| Nicaraguan | 15 | 0.0% |
| Northern European | 71 | 0.1% |
| Norwegian | 1,129 | 1.9% |
| Pakistani | 17 | 0.0% |
| Peruvian | 388 | 0.6% |
| Polish | 352 | 0.6% |
| Portuguese | 70 | 0.1% |
| Pueblo | 46 | 0.1% |
| Puerto Rican | 636 | 1.1% |
| Romanian | 12 | 0.0% |
| Russian | 104 | 0.2% |
| Salvadoran | 671 | 1.1% |
| Samoan | 814 | 1.4% |
| Scandinavian | 993 | 1.7% |
| Scotch-Irish | 296 | 0.5% |
| Scottish | 1,467 | 2.5% |
| Serbian | 47 | 0.1% |
| Shoshone | 10 | 0.0% |
| Sioux | 6 | 0.0% |
| Slovene | 24 | 0.0% |
| South American | 1,532 | 2.6% |
| South American Indian | 9 | 0.0% |
| Spaniard | 480 | 0.8% |
| Spanish | 286 | 0.5% |
| Spanish American | 10 | 0.0% |
| Sri Lankan | 1,160 | 1.9% |
| Subsaharan African | 311 | 0.5% |
| Swedish | 1,218 | 2.0% |
| Swiss | 362 | 0.6% |
| Syrian | 35 | 0.1% |
| Thai | 749 | 1.3% |
| Tongan | 850 | 1.4% |
| Ukrainian | 8 | 0.0% |
| Uruguayan | 13 | 0.0% |
| Ute | 45 | 0.1% |
| Venezuelan | 275 | 0.5% |
| Welsh | 1,251 | 2.1% |
| Yugoslavian | 69 | 0.1% | View All 103 Rows |
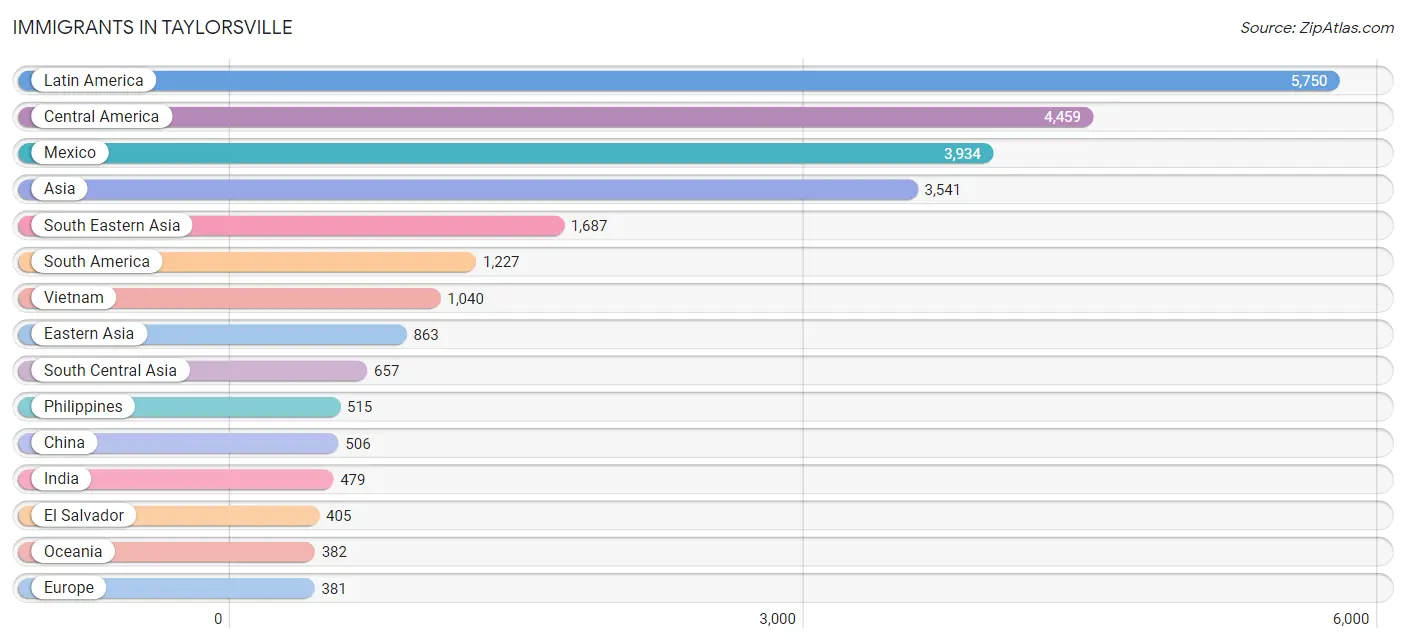
Immigrants in Taylorsville
The most numerous immigrant groups reported in Taylorsville came from Latin America (5,750 | 9.6%), Central America (4,459 | 7.5%), Mexico (3,934 | 6.6%), Asia (3,541 | 5.9%), and South Eastern Asia (1,687 | 2.8%), together accounting for 32.4% of all Taylorsville residents.
| Immigration Origin | # Population | % Population |
| Afghanistan | 15 | 0.0% |
| Africa | 316 | 0.5% |
| Argentina | 68 | 0.1% |
| Asia | 3,541 | 5.9% |
| Austria | 16 | 0.0% |
| Bolivia | 8 | 0.0% |
| Brazil | 166 | 0.3% |
| Cambodia | 42 | 0.1% |
| Canada | 87 | 0.2% |
| Caribbean | 64 | 0.1% |
| Central America | 4,459 | 7.5% |
| Chile | 53 | 0.1% |
| China | 506 | 0.9% |
| Colombia | 308 | 0.5% |
| Congo | 32 | 0.1% |
| Czechoslovakia | 18 | 0.0% |
| Denmark | 15 | 0.0% |
| Dominican Republic | 64 | 0.1% |
| Eastern Africa | 207 | 0.4% |
| Eastern Asia | 863 | 1.4% |
| Eastern Europe | 149 | 0.3% |
| Ecuador | 244 | 0.4% |
| Egypt | 9 | 0.0% |
| El Salvador | 405 | 0.7% |
| England | 20 | 0.0% |
| Europe | 381 | 0.6% |
| Fiji | 52 | 0.1% |
| France | 18 | 0.0% |
| Germany | 59 | 0.1% |
| Greece | 7 | 0.0% |
| Guatemala | 97 | 0.2% |
| Honduras | 8 | 0.0% |
| Hong Kong | 4 | 0.0% |
| Hungary | 22 | 0.0% |
| India | 479 | 0.8% |
| Indonesia | 14 | 0.0% |
| Iran | 81 | 0.1% |
| Iraq | 247 | 0.4% |
| Ireland | 12 | 0.0% |
| Japan | 41 | 0.1% |
| Kenya | 2 | 0.0% |
| Korea | 277 | 0.5% |
| Laos | 41 | 0.1% |
| Latin America | 5,750 | 9.6% |
| Malaysia | 17 | 0.0% |
| Mexico | 3,934 | 6.6% |
| Micronesia | 1 | 0.0% |
| Middle Africa | 32 | 0.1% |
| Nepal | 5 | 0.0% |
| Netherlands | 74 | 0.1% |
| Nicaragua | 15 | 0.0% |
| Northern Africa | 54 | 0.1% |
| Northern Europe | 58 | 0.1% |
| Oceania | 382 | 0.6% |
| Pakistan | 77 | 0.1% |
| Peru | 142 | 0.2% |
| Philippines | 515 | 0.9% |
| Russia | 20 | 0.0% |
| South America | 1,227 | 2.1% |
| South Central Asia | 657 | 1.1% |
| South Eastern Asia | 1,687 | 2.8% |
| Southern Europe | 7 | 0.0% |
| Sudan | 45 | 0.1% |
| Sweden | 5 | 0.0% |
| Syria | 35 | 0.1% |
| Taiwan | 7 | 0.0% |
| Thailand | 18 | 0.0% |
| Venezuela | 238 | 0.4% |
| Vietnam | 1,040 | 1.7% |
| Western Africa | 23 | 0.0% |
| Western Asia | 334 | 0.6% |
| Western Europe | 167 | 0.3% | View All 72 Rows |
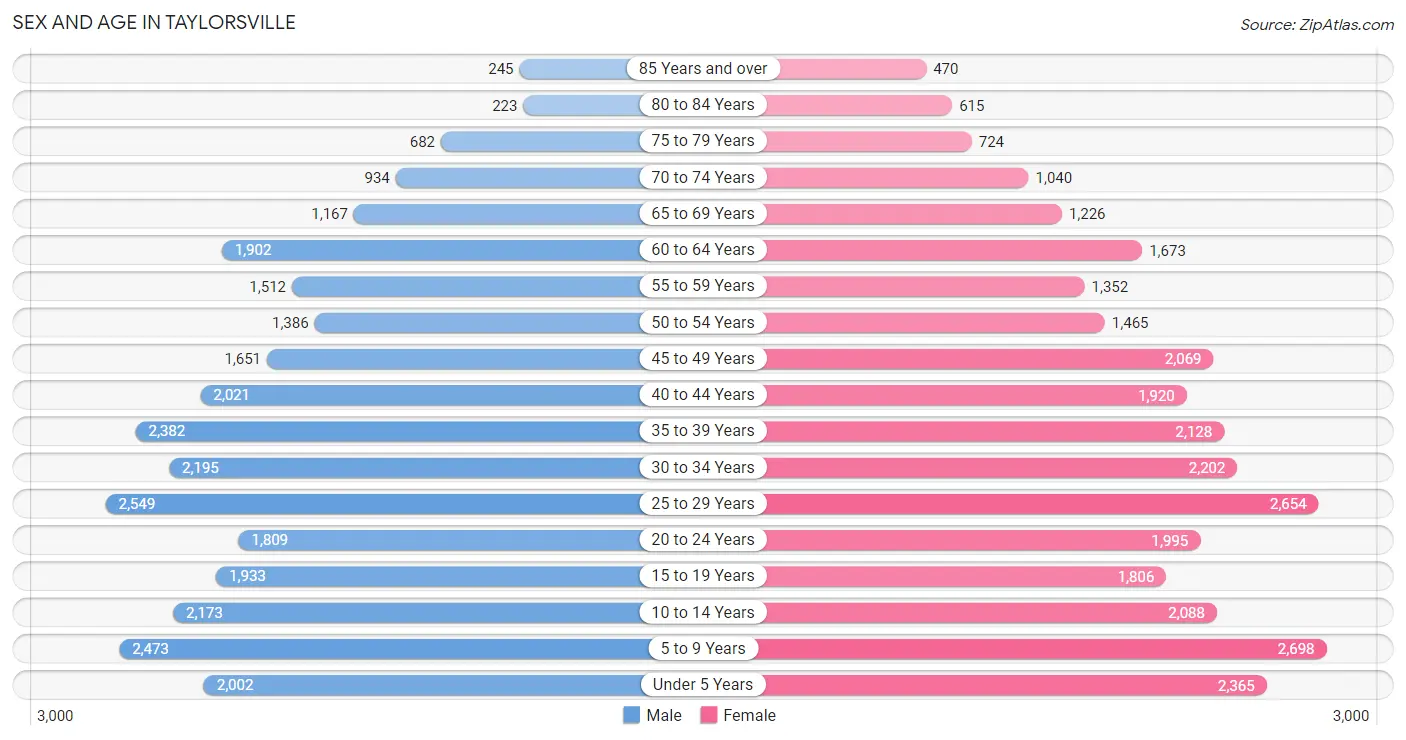
Sex and Age in Taylorsville
Sex and Age in Taylorsville
The most populous age groups in Taylorsville are 25 to 29 Years (2,549 | 8.7%) for men and 5 to 9 Years (2,698 | 8.8%) for women.
| Age Bracket | Male | Female |
| Under 5 Years | 2,002 (6.9%) | 2,365 (7.8%) |
| 5 to 9 Years | 2,473 (8.5%) | 2,698 (8.8%) |
| 10 to 14 Years | 2,173 (7.4%) | 2,088 (6.9%) |
| 15 to 19 Years | 1,933 (6.6%) | 1,806 (5.9%) |
| 20 to 24 Years | 1,809 (6.2%) | 1,995 (6.5%) |
| 25 to 29 Years | 2,549 (8.7%) | 2,654 (8.7%) |
| 30 to 34 Years | 2,195 (7.5%) | 2,202 (7.2%) |
| 35 to 39 Years | 2,382 (8.2%) | 2,128 (7.0%) |
| 40 to 44 Years | 2,021 (6.9%) | 1,920 (6.3%) |
| 45 to 49 Years | 1,651 (5.7%) | 2,069 (6.8%) |
| 50 to 54 Years | 1,386 (4.7%) | 1,465 (4.8%) |
| 55 to 59 Years | 1,512 (5.2%) | 1,352 (4.4%) |
| 60 to 64 Years | 1,902 (6.5%) | 1,673 (5.5%) |
| 65 to 69 Years | 1,167 (4.0%) | 1,226 (4.0%) |
| 70 to 74 Years | 934 (3.2%) | 1,040 (3.4%) |
| 75 to 79 Years | 682 (2.3%) | 724 (2.4%) |
| 80 to 84 Years | 223 (0.8%) | 615 (2.0%) |
| 85 Years and over | 245 (0.8%) | 470 (1.5%) |
| Total | 29,239 (100.0%) | 30,490 (100.0%) |
Families and Households in Taylorsville
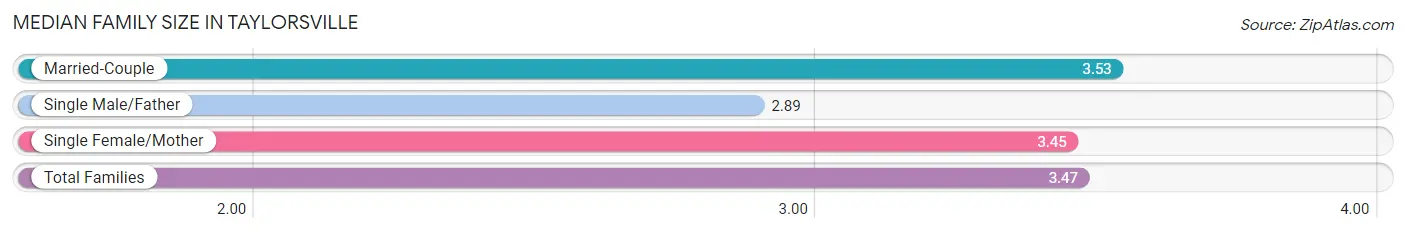
Median Family Size in Taylorsville
The median family size in Taylorsville is 3.47 persons per family, with married-couple families (10,447 | 72.6%) accounting for the largest median family size of 3.53 persons per family. On the other hand, single male/father families (1,147 | 8.0%) represent the smallest median family size with 2.89 persons per family.
| Family Type | # Families | Family Size |
| Married-Couple | 10,447 (72.6%) | 3.53 |
| Single Male/Father | 1,147 (8.0%) | 2.89 |
| Single Female/Mother | 2,790 (19.4%) | 3.45 |
| Total Families | 14,384 (100.0%) | 3.47 |
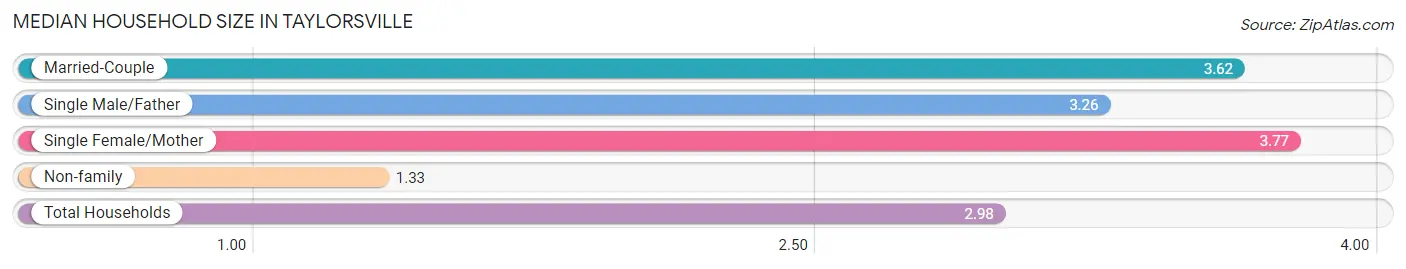
Median Household Size in Taylorsville
The median household size in Taylorsville is 2.98 persons per household, with single female/mother households (2,790 | 14.0%) accounting for the largest median household size of 3.77 persons per household. non-family households (5,619 | 28.1%) represent the smallest median household size with 1.33 persons per household.
| Household Type | # Households | Household Size |
| Married-Couple | 10,447 (52.2%) | 3.62 |
| Single Male/Father | 1,147 (5.7%) | 3.26 |
| Single Female/Mother | 2,790 (14.0%) | 3.77 |
| Non-family | 5,619 (28.1%) | 1.33 |
| Total Households | 20,003 (100.0%) | 2.98 |
Household Size by Marriage Status in Taylorsville
Out of a total of 20,003 households in Taylorsville, 14,384 (71.9%) are family households, while 5,619 (28.1%) are nonfamily households. The most numerous type of family households are 2-person households, comprising 5,554, and the most common type of nonfamily households are 1-person households, comprising 4,270.
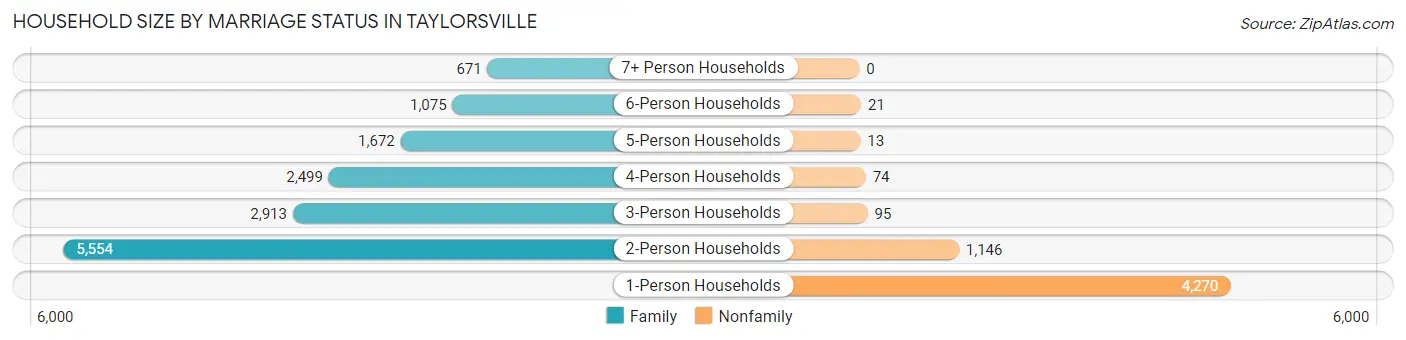
| Household Size | Family Households | Nonfamily Households |
| 1-Person Households | - | 4,270 (21.3%) |
| 2-Person Households | 5,554 (27.8%) | 1,146 (5.7%) |
| 3-Person Households | 2,913 (14.6%) | 95 (0.5%) |
| 4-Person Households | 2,499 (12.5%) | 74 (0.4%) |
| 5-Person Households | 1,672 (8.4%) | 13 (0.1%) |
| 6-Person Households | 1,075 (5.4%) | 21 (0.1%) |
| 7+ Person Households | 671 (3.4%) | 0 (0.0%) |
| Total | 14,384 (71.9%) | 5,619 (28.1%) |
Female Fertility in Taylorsville
Fertility by Age in Taylorsville
Average fertility rate in Taylorsville is 50.0 births per 1,000 women. Women in the age bracket of 20 to 34 years have the highest fertility rate with 89.0 births per 1,000 women. Women in the age bracket of 20 to 34 years acount for 81.8% of all women with births.
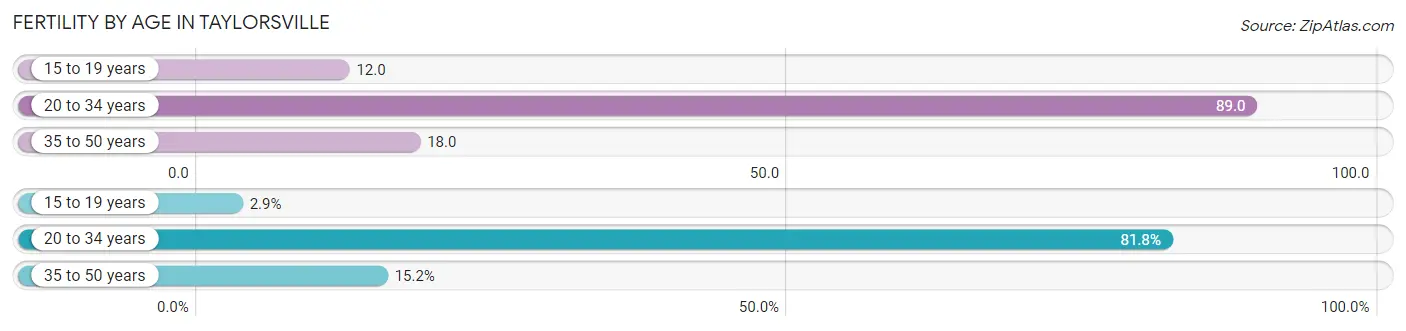
| Age Bracket | Women with Births | Births / 1,000 Women |
| 15 to 19 years | 22 (2.9%) | 12.0 |
| 20 to 34 years | 612 (81.8%) | 89.0 |
| 35 to 50 years | 114 (15.2%) | 18.0 |
| Total | 748 (100.0%) | 50.0 |
Fertility by Age by Marriage Status in Taylorsville
69.0% of women with births (748) in Taylorsville are married. The highest percentage of unmarried women with births falls into 15 to 19 years age bracket with 100.0% of them unmarried at the time of birth, while the lowest percentage of unmarried women with births belong to 35 to 50 years age bracket with 24.6% of them unmarried.
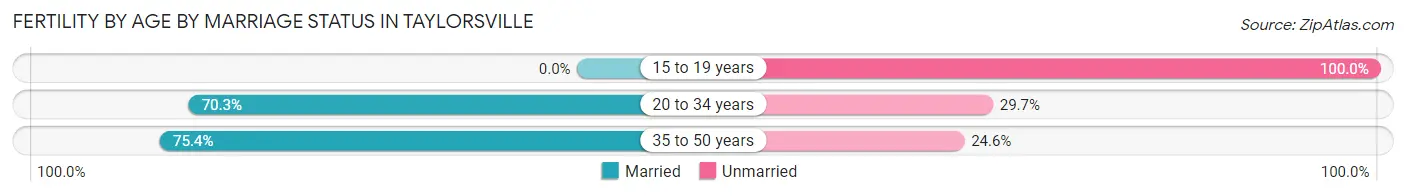
| Age Bracket | Married | Unmarried |
| 15 to 19 years | 0 (0.0%) | 22 (100.0%) |
| 20 to 34 years | 430 (70.3%) | 182 (29.7%) |
| 35 to 50 years | 86 (75.4%) | 28 (24.6%) |
| Total | 516 (69.0%) | 232 (31.0%) |
Fertility by Education in Taylorsville
Average fertility rate in Taylorsville is 50.0 births per 1,000 women. Women with the education attainment of graduate degree have the highest fertility rate of 113.0 births per 1,000 women, while women with the education attainment of less than high school have the lowest fertility at 21.0 births per 1,000 women. Women with the education attainment of college or associate's degree represent 30.7% of all women with births.
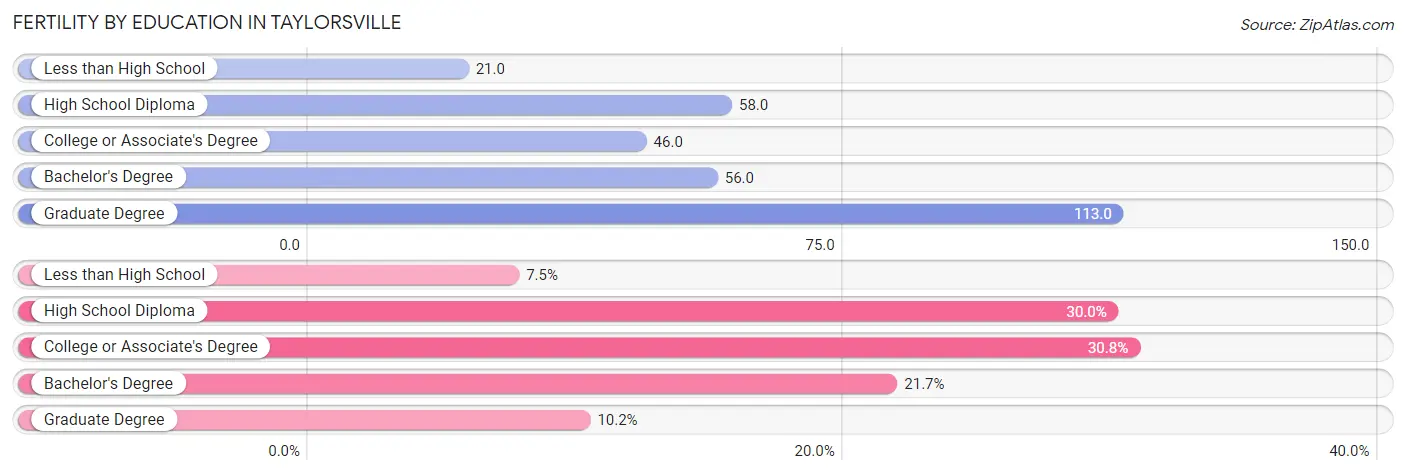
| Educational Attainment | Women with Births | Births / 1,000 Women |
| Less than High School | 56 (7.5%) | 21.0 |
| High School Diploma | 224 (29.9%) | 58.0 |
| College or Associate's Degree | 230 (30.7%) | 46.0 |
| Bachelor's Degree | 162 (21.7%) | 56.0 |
| Graduate Degree | 76 (10.2%) | 113.0 |
| Total | 748 (100.0%) | 50.0 |
Fertility by Education by Marriage Status in Taylorsville
31.0% of women with births in Taylorsville are unmarried. Women with the educational attainment of less than high school are most likely to be married with 100.0% of them married at childbirth, while women with the educational attainment of high school diploma are least likely to be married with 42.4% of them unmarried at childbirth.
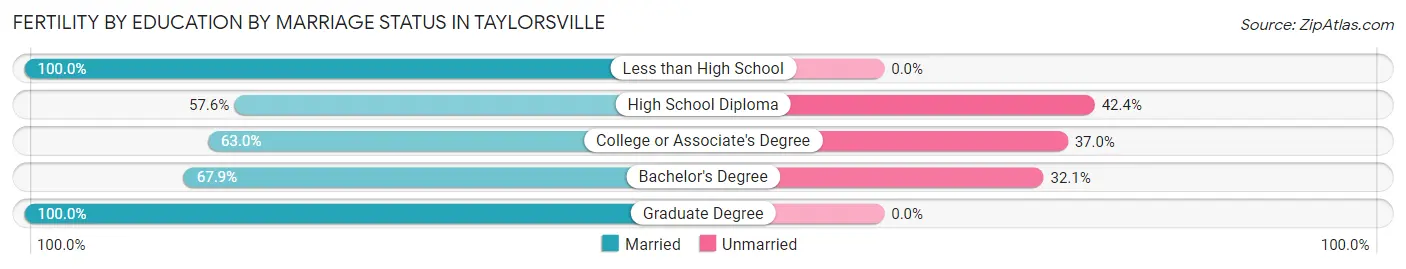
| Educational Attainment | Married | Unmarried |
| Less than High School | 56 (100.0%) | 0 (0.0%) |
| High School Diploma | 129 (57.6%) | 95 (42.4%) |
| College or Associate's Degree | 145 (63.0%) | 85 (37.0%) |
| Bachelor's Degree | 110 (67.9%) | 52 (32.1%) |
| Graduate Degree | 76 (100.0%) | 0 (0.0%) |
| Total | 516 (69.0%) | 232 (31.0%) |
Employment Characteristics in Taylorsville
Employment by Class of Employer in Taylorsville
Among the 30,086 employed individuals in Taylorsville, private company employees (22,660 | 75.3%), not-for-profit organizations (1,805 | 6.0%), and self-employed (not incorporated) (1,465 | 4.9%) make up the most common classes of employment.
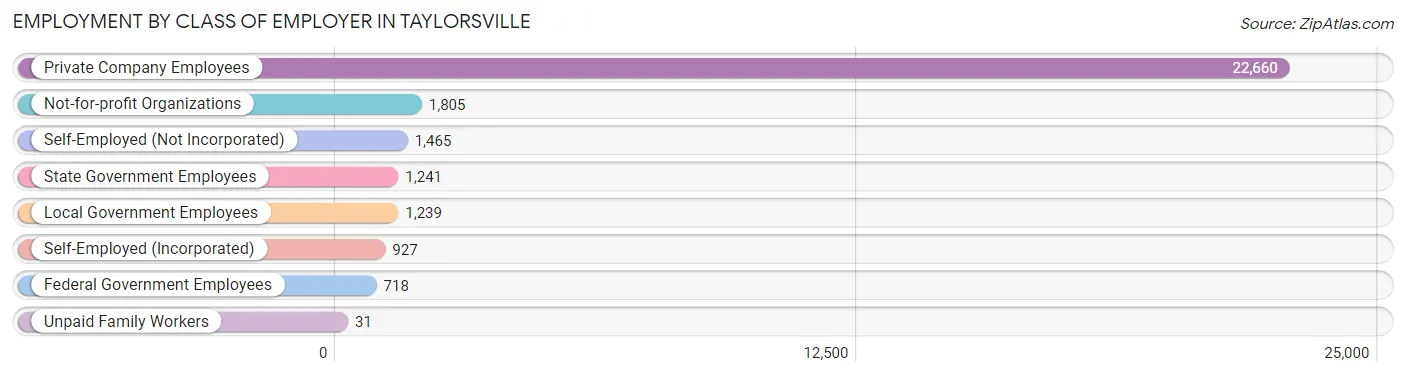
| Employer Class | # Employees | % Employees |
| Private Company Employees | 22,660 | 75.3% |
| Self-Employed (Incorporated) | 927 | 3.1% |
| Self-Employed (Not Incorporated) | 1,465 | 4.9% |
| Not-for-profit Organizations | 1,805 | 6.0% |
| Local Government Employees | 1,239 | 4.1% |
| State Government Employees | 1,241 | 4.1% |
| Federal Government Employees | 718 | 2.4% |
| Unpaid Family Workers | 31 | 0.1% |
| Total | 30,086 | 100.0% |
Employment Status by Age in Taylorsville
According to the labor force statistics for Taylorsville, out of the total population over 16 years of age (44,833), 71.1% or 31,876 individuals are in the labor force, with 4.5% or 1,434 of them unemployed. The age group with the highest labor force participation rate is 25 to 29 years, with 87.6% or 4,558 individuals in the labor force. Within the labor force, the 20 to 24 years age range has the highest percentage of unemployed individuals, with 12.3% or 399 of them being unemployed.
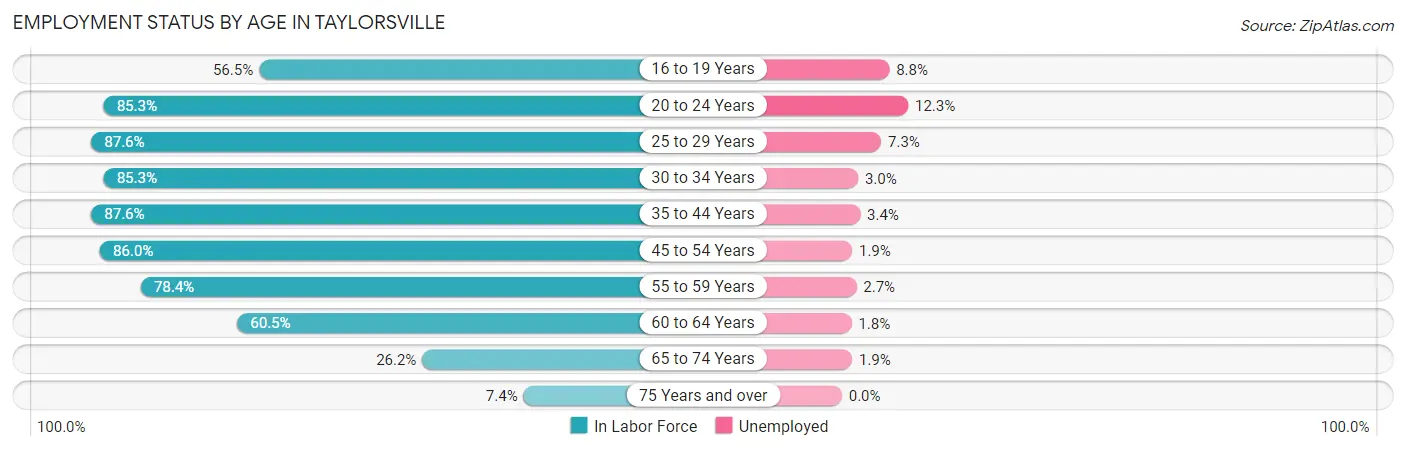
| Age Bracket | In Labor Force | Unemployed |
| 16 to 19 Years | 1,493 (56.5%) | 131 (8.8%) |
| 20 to 24 Years | 3,245 (85.3%) | 399 (12.3%) |
| 25 to 29 Years | 4,558 (87.6%) | 333 (7.3%) |
| 30 to 34 Years | 3,751 (85.3%) | 113 (3.0%) |
| 35 to 44 Years | 7,403 (87.6%) | 252 (3.4%) |
| 45 to 54 Years | 5,651 (86.0%) | 107 (1.9%) |
| 55 to 59 Years | 2,245 (78.4%) | 61 (2.7%) |
| 60 to 64 Years | 2,163 (60.5%) | 39 (1.8%) |
| 65 to 74 Years | 1,144 (26.2%) | 22 (1.9%) |
| 75 Years and over | 219 (7.4%) | 0 (0.0%) |
| Total | 31,876 (71.1%) | 1,434 (4.5%) |
Employment Status by Educational Attainment in Taylorsville
According to labor force statistics for Taylorsville, 83.0% of individuals (25,781) out of the total population between 25 and 64 years of age (31,061) are in the labor force, with 3.5% or 902 of them being unemployed. The group with the highest labor force participation rate are those with the educational attainment of bachelor's degree or higher, with 84.4% or 6,441 individuals in the labor force. Within the labor force, individuals with less than high school education have the highest percentage of unemployment, with 6.0% or 178 of them being unemployed.
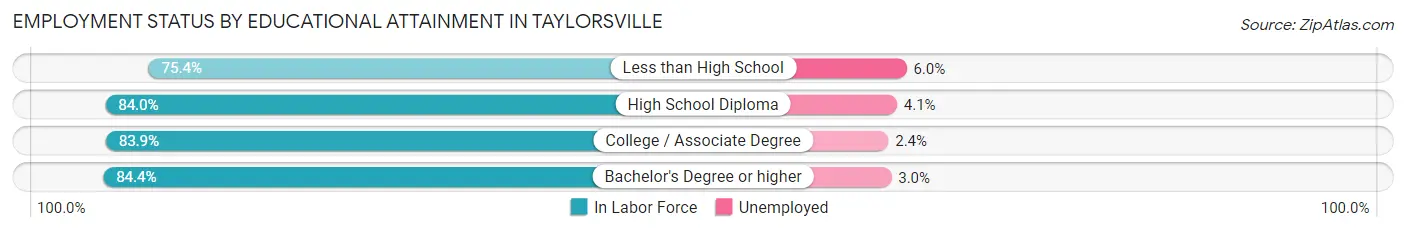
| Educational Attainment | In Labor Force | Unemployed |
| Less than High School | 2,972 (75.4%) | 236 (6.0%) |
| High School Diploma | 7,665 (84.0%) | 374 (4.1%) |
| College / Associate Degree | 8,695 (83.9%) | 249 (2.4%) |
| Bachelor's Degree or higher | 6,441 (84.4%) | 229 (3.0%) |
| Total | 25,781 (83.0%) | 1,087 (3.5%) |
Employment Occupations by Sex in Taylorsville
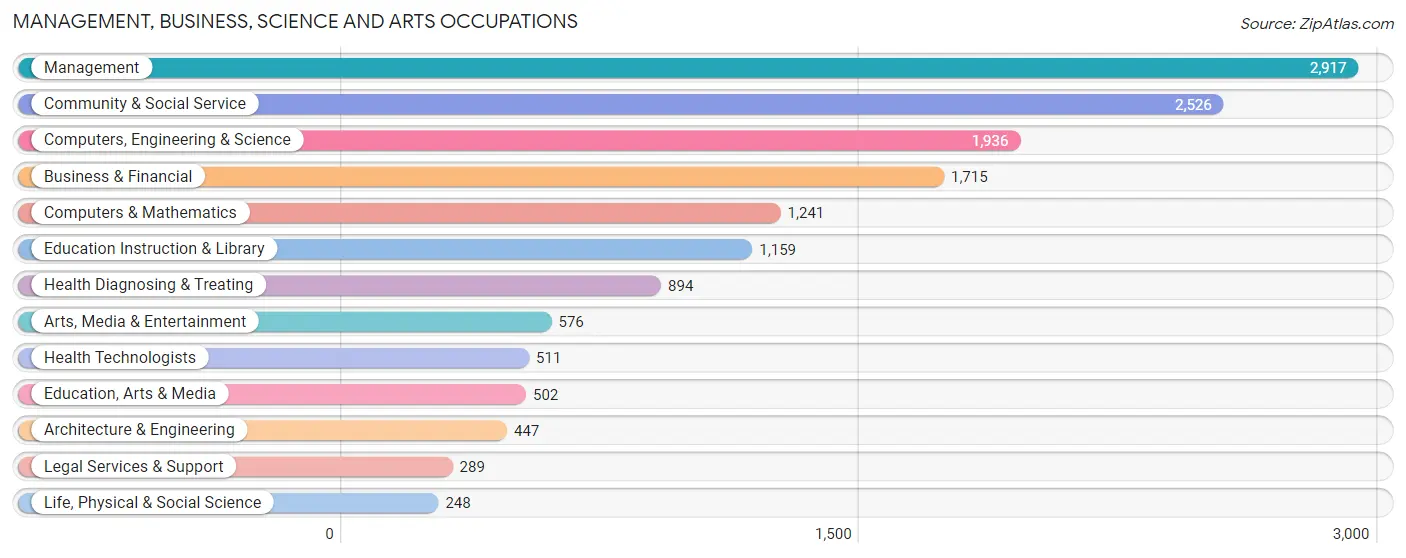
Management, Business, Science and Arts Occupations
The most common Management, Business, Science and Arts occupations in Taylorsville are Management (2,917 | 9.6%), Community & Social Service (2,526 | 8.3%), Computers, Engineering & Science (1,936 | 6.4%), Business & Financial (1,715 | 5.7%), and Computers & Mathematics (1,241 | 4.1%).
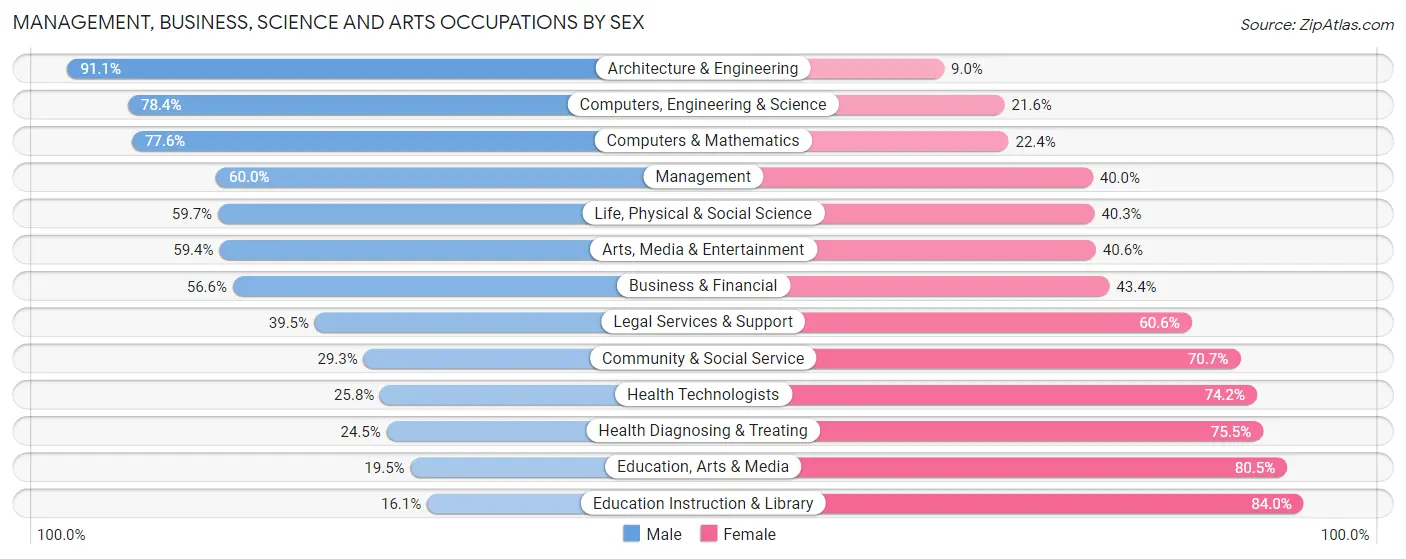
Management, Business, Science and Arts Occupations by Sex
Within the Management, Business, Science and Arts occupations in Taylorsville, the most male-oriented occupations are Architecture & Engineering (91.0%), Computers, Engineering & Science (78.4%), and Computers & Mathematics (77.6%), while the most female-oriented occupations are Education Instruction & Library (84.0%), Education, Arts & Media (80.5%), and Health Diagnosing & Treating (75.5%).
| Occupation | Male | Female |
| Management | 1,751 (60.0%) | 1,166 (40.0%) |
| Business & Financial | 970 (56.6%) | 745 (43.4%) |
| Computers, Engineering & Science | 1,518 (78.4%) | 418 (21.6%) |
| Computers & Mathematics | 963 (77.6%) | 278 (22.4%) |
| Architecture & Engineering | 407 (91.0%) | 40 (8.9%) |
| Life, Physical & Social Science | 148 (59.7%) | 100 (40.3%) |
| Community & Social Service | 740 (29.3%) | 1,786 (70.7%) |
| Education, Arts & Media | 98 (19.5%) | 404 (80.5%) |
| Legal Services & Support | 114 (39.5%) | 175 (60.6%) |
| Education Instruction & Library | 186 (16.1%) | 973 (84.0%) |
| Arts, Media & Entertainment | 342 (59.4%) | 234 (40.6%) |
| Health Diagnosing & Treating | 219 (24.5%) | 675 (75.5%) |
| Health Technologists | 132 (25.8%) | 379 (74.2%) |
| Total (Category) | 5,198 (52.0%) | 4,790 (48.0%) |
| Total (Overall) | 16,124 (53.1%) | 14,217 (46.9%) |
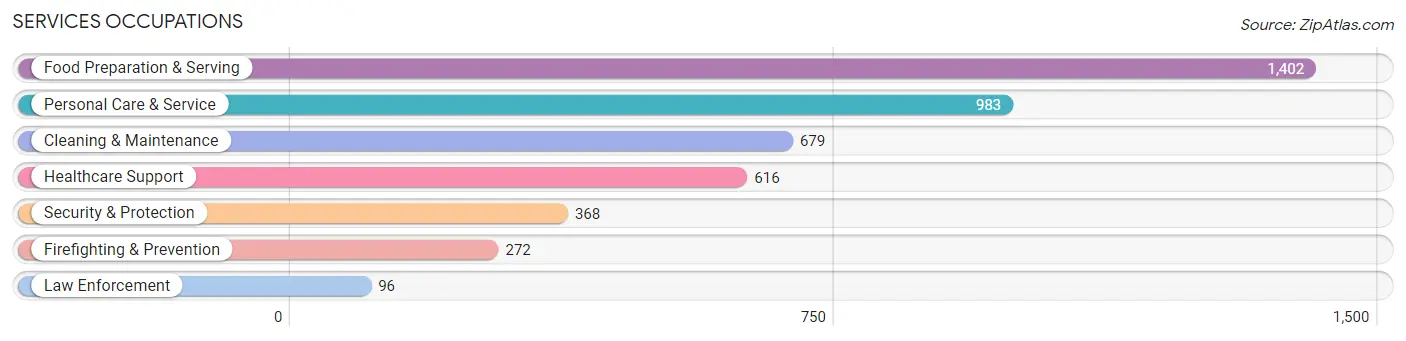
Services Occupations
The most common Services occupations in Taylorsville are Food Preparation & Serving (1,402 | 4.6%), Personal Care & Service (983 | 3.2%), Cleaning & Maintenance (679 | 2.2%), Healthcare Support (616 | 2.0%), and Security & Protection (368 | 1.2%).
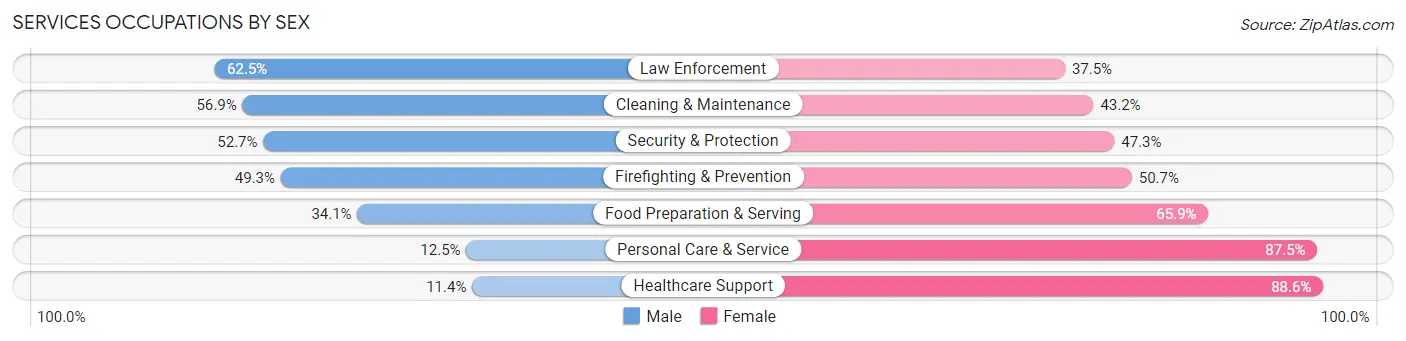
Services Occupations by Sex
Within the Services occupations in Taylorsville, the most male-oriented occupations are Law Enforcement (62.5%), Cleaning & Maintenance (56.9%), and Security & Protection (52.7%), while the most female-oriented occupations are Healthcare Support (88.6%), Personal Care & Service (87.5%), and Food Preparation & Serving (65.9%).
| Occupation | Male | Female |
| Healthcare Support | 70 (11.4%) | 546 (88.6%) |
| Security & Protection | 194 (52.7%) | 174 (47.3%) |
| Firefighting & Prevention | 134 (49.3%) | 138 (50.7%) |
| Law Enforcement | 60 (62.5%) | 36 (37.5%) |
| Food Preparation & Serving | 478 (34.1%) | 924 (65.9%) |
| Cleaning & Maintenance | 386 (56.9%) | 293 (43.1%) |
| Personal Care & Service | 123 (12.5%) | 860 (87.5%) |
| Total (Category) | 1,251 (30.9%) | 2,797 (69.1%) |
| Total (Overall) | 16,124 (53.1%) | 14,217 (46.9%) |
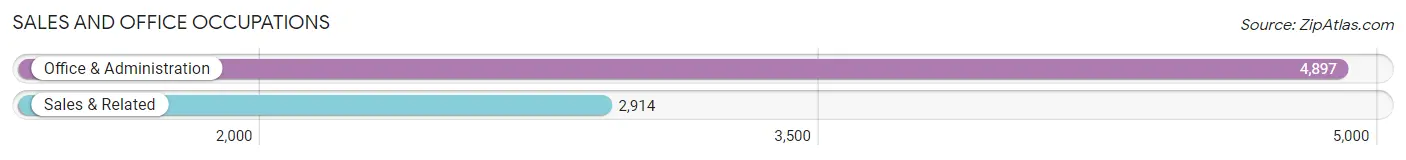
Sales and Office Occupations
The most common Sales and Office occupations in Taylorsville are Office & Administration (4,897 | 16.1%), and Sales & Related (2,914 | 9.6%).
Sales and Office Occupations by Sex
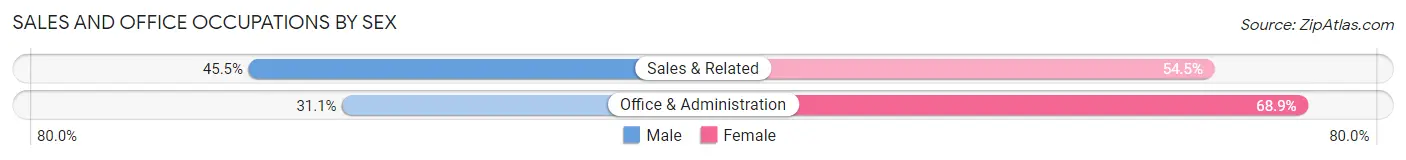
| Occupation | Male | Female |
| Sales & Related | 1,326 (45.5%) | 1,588 (54.5%) |
| Office & Administration | 1,523 (31.1%) | 3,374 (68.9%) |
| Total (Category) | 2,849 (36.5%) | 4,962 (63.5%) |
| Total (Overall) | 16,124 (53.1%) | 14,217 (46.9%) |
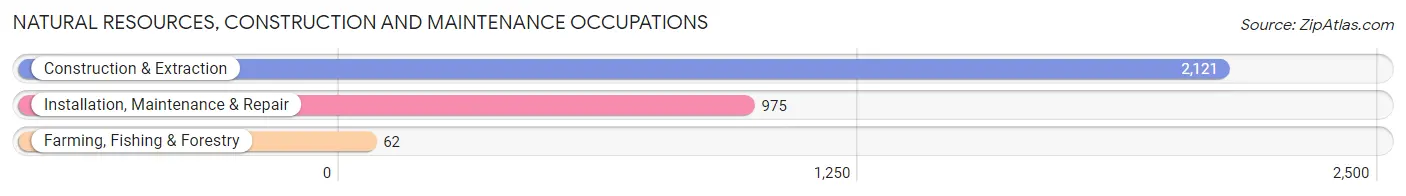
Natural Resources, Construction and Maintenance Occupations
The most common Natural Resources, Construction and Maintenance occupations in Taylorsville are Construction & Extraction (2,121 | 7.0%), Installation, Maintenance & Repair (975 | 3.2%), and Farming, Fishing & Forestry (62 | 0.2%).
Natural Resources, Construction and Maintenance Occupations by Sex
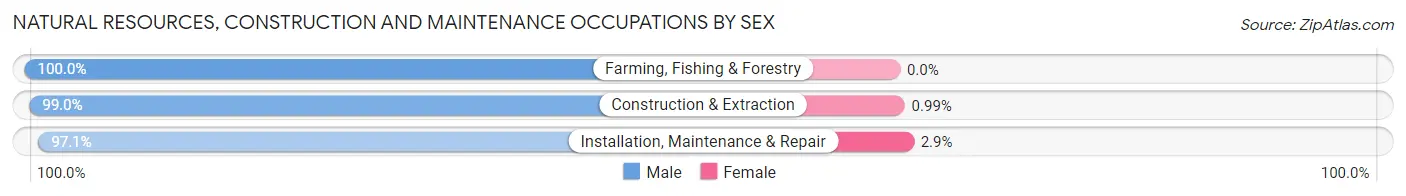
| Occupation | Male | Female |
| Farming, Fishing & Forestry | 62 (100.0%) | 0 (0.0%) |
| Construction & Extraction | 2,100 (99.0%) | 21 (1.0%) |
| Installation, Maintenance & Repair | 947 (97.1%) | 28 (2.9%) |
| Total (Category) | 3,109 (98.5%) | 49 (1.5%) |
| Total (Overall) | 16,124 (53.1%) | 14,217 (46.9%) |
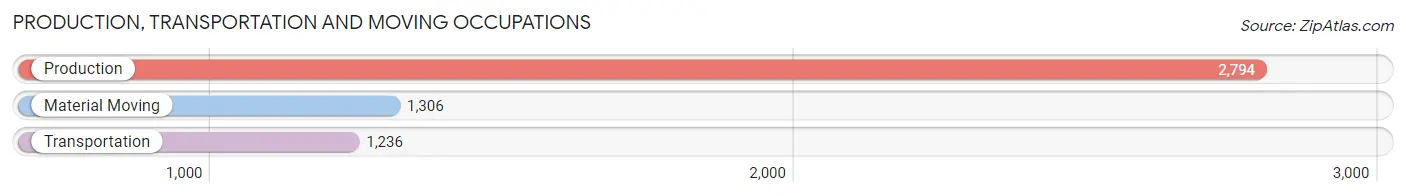
Production, Transportation and Moving Occupations
The most common Production, Transportation and Moving occupations in Taylorsville are Production (2,794 | 9.2%), Material Moving (1,306 | 4.3%), and Transportation (1,236 | 4.1%).
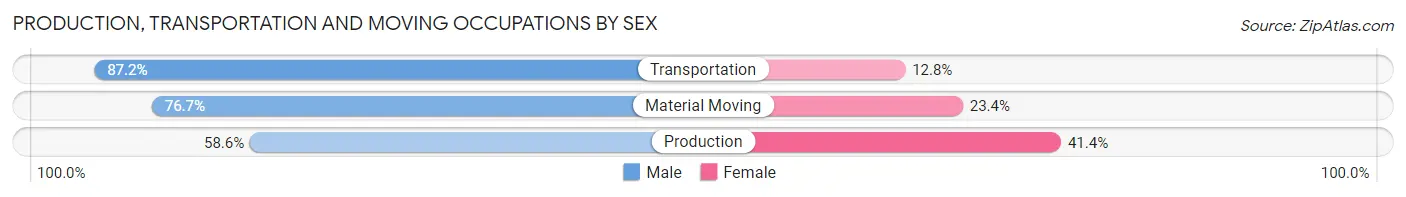
Production, Transportation and Moving Occupations by Sex
| Occupation | Male | Female |
| Production | 1,638 (58.6%) | 1,156 (41.4%) |
| Transportation | 1,078 (87.2%) | 158 (12.8%) |
| Material Moving | 1,001 (76.6%) | 305 (23.4%) |
| Total (Category) | 3,717 (69.7%) | 1,619 (30.3%) |
| Total (Overall) | 16,124 (53.1%) | 14,217 (46.9%) |
Employment Industries by Sex in Taylorsville
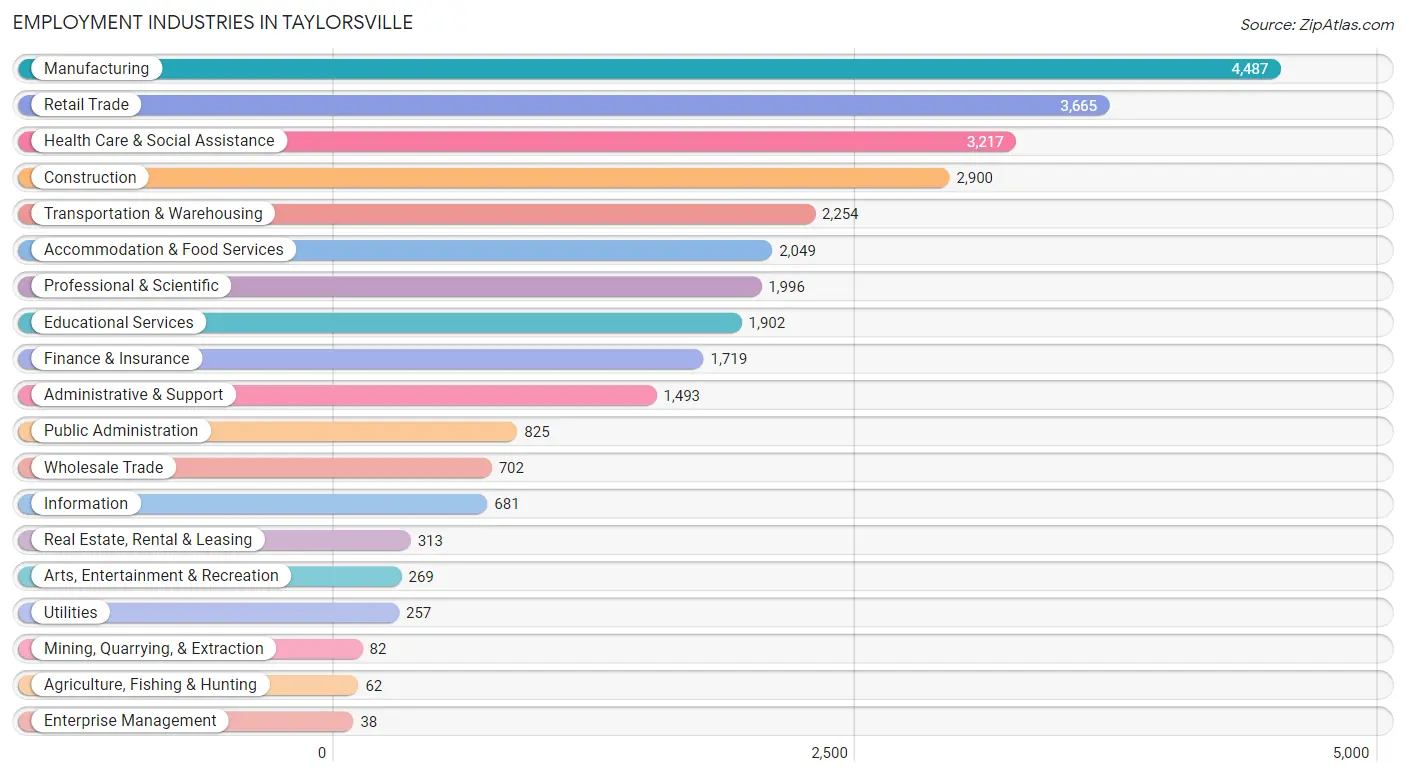
Employment Industries in Taylorsville
The major employment industries in Taylorsville include Manufacturing (4,487 | 14.8%), Retail Trade (3,665 | 12.1%), Health Care & Social Assistance (3,217 | 10.6%), Construction (2,900 | 9.6%), and Transportation & Warehousing (2,254 | 7.4%).
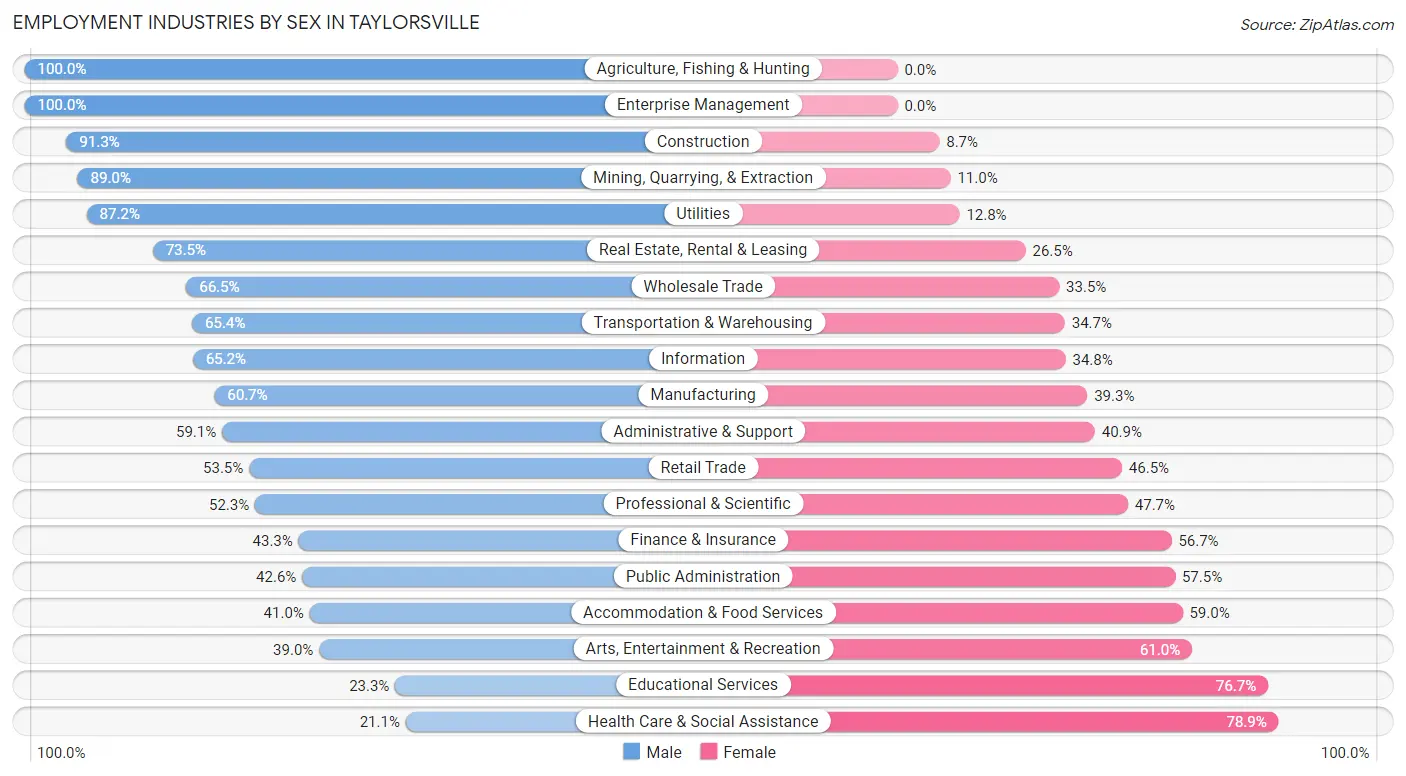
Employment Industries by Sex in Taylorsville
The Taylorsville industries that see more men than women are Agriculture, Fishing & Hunting (100.0%), Enterprise Management (100.0%), and Construction (91.3%), whereas the industries that tend to have a higher number of women are Health Care & Social Assistance (78.9%), Educational Services (76.7%), and Arts, Entertainment & Recreation (61.0%).
| Industry | Male | Female |
| Agriculture, Fishing & Hunting | 62 (100.0%) | 0 (0.0%) |
| Mining, Quarrying, & Extraction | 73 (89.0%) | 9 (11.0%) |
| Construction | 2,649 (91.3%) | 251 (8.7%) |
| Manufacturing | 2,724 (60.7%) | 1,763 (39.3%) |
| Wholesale Trade | 467 (66.5%) | 235 (33.5%) |
| Retail Trade | 1,962 (53.5%) | 1,703 (46.5%) |
| Transportation & Warehousing | 1,473 (65.3%) | 781 (34.6%) |
| Utilities | 224 (87.2%) | 33 (12.8%) |
| Information | 444 (65.2%) | 237 (34.8%) |
| Finance & Insurance | 744 (43.3%) | 975 (56.7%) |
| Real Estate, Rental & Leasing | 230 (73.5%) | 83 (26.5%) |
| Professional & Scientific | 1,044 (52.3%) | 952 (47.7%) |
| Enterprise Management | 38 (100.0%) | 0 (0.0%) |
| Administrative & Support | 883 (59.1%) | 610 (40.9%) |
| Educational Services | 443 (23.3%) | 1,459 (76.7%) |
| Health Care & Social Assistance | 679 (21.1%) | 2,538 (78.9%) |
| Arts, Entertainment & Recreation | 105 (39.0%) | 164 (61.0%) |
| Accommodation & Food Services | 840 (41.0%) | 1,209 (59.0%) |
| Public Administration | 351 (42.5%) | 474 (57.5%) |
| Total | 16,124 (53.1%) | 14,217 (46.9%) |
Education in Taylorsville
School Enrollment in Taylorsville
The most common levels of schooling among the 15,627 students in Taylorsville are elementary school (4,058 | 26.0%), middle school (3,506 | 22.4%), and high school (3,155 | 20.2%).
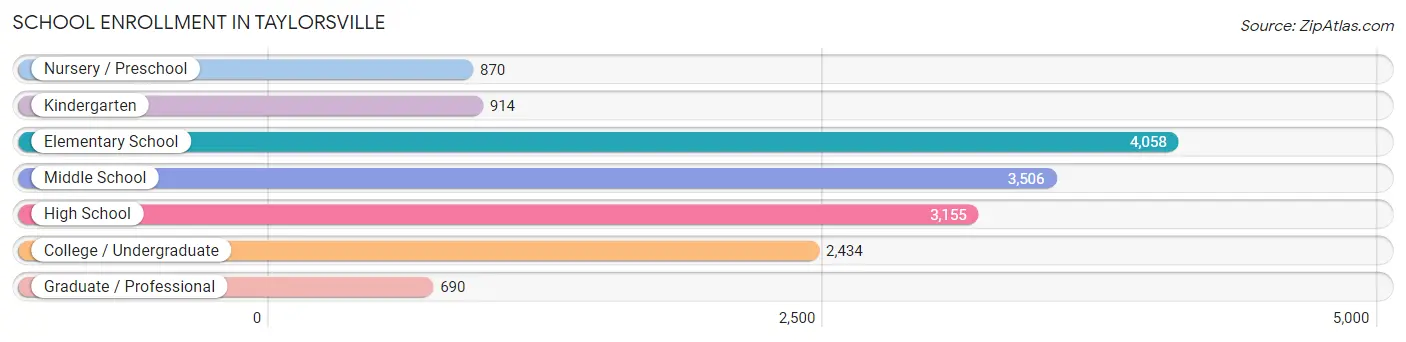
| School Level | # Students | % Students |
| Nursery / Preschool | 870 | 5.6% |
| Kindergarten | 914 | 5.9% |
| Elementary School | 4,058 | 26.0% |
| Middle School | 3,506 | 22.4% |
| High School | 3,155 | 20.2% |
| College / Undergraduate | 2,434 | 15.6% |
| Graduate / Professional | 690 | 4.4% |
| Total | 15,627 | 100.0% |
School Enrollment by Age by Funding Source in Taylorsville
Out of a total of 15,627 students who are enrolled in schools in Taylorsville, 2,266 (14.5%) attend a private institution, while the remaining 13,361 (85.5%) are enrolled in public schools. The age group of 25 to 34 year olds has the highest likelihood of being enrolled in private schools, with 396 (38.0% in the age bracket) enrolled. Conversely, the age group of 18 to 19 year olds has the lowest likelihood of being enrolled in a private school, with 696 (98.9% in the age bracket) attending a public institution.
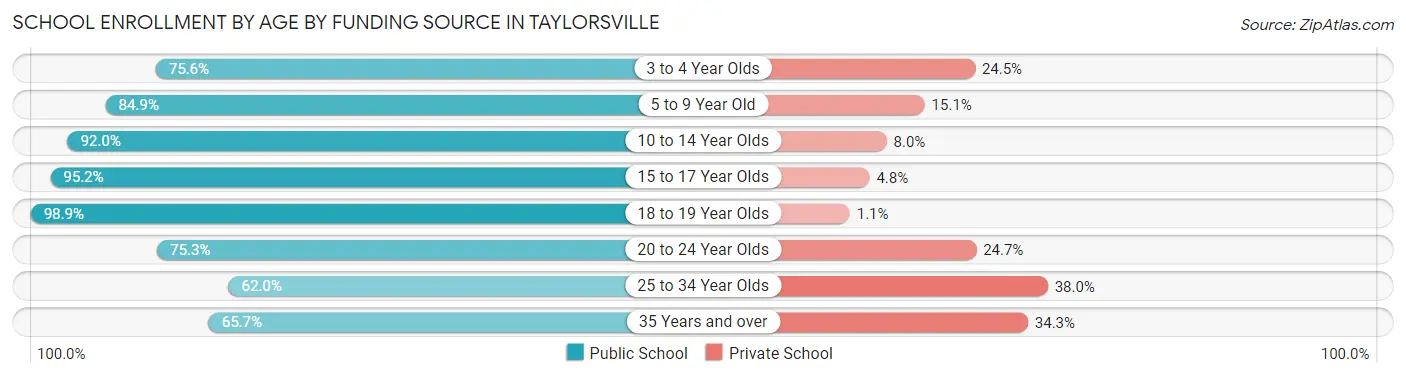
| Age Bracket | Public School | Private School |
| 3 to 4 Year Olds | 513 (75.5%) | 166 (24.4%) |
| 5 to 9 Year Old | 3,978 (84.9%) | 707 (15.1%) |
| 10 to 14 Year Olds | 3,903 (92.0%) | 339 (8.0%) |
| 15 to 17 Year Olds | 2,262 (95.2%) | 114 (4.8%) |
| 18 to 19 Year Olds | 696 (98.9%) | 8 (1.1%) |
| 20 to 24 Year Olds | 888 (75.3%) | 291 (24.7%) |
| 25 to 34 Year Olds | 646 (62.0%) | 396 (38.0%) |
| 35 Years and over | 473 (65.7%) | 247 (34.3%) |
| Total | 13,361 (85.5%) | 2,266 (14.5%) |
Educational Attainment by Field of Study in Taylorsville
Business (1,736 | 18.1%), education (1,213 | 12.7%), science & technology (1,083 | 11.3%), arts & humanities (743 | 7.8%), and engineering (680 | 7.1%) are the most common fields of study among 9,578 individuals in Taylorsville who have obtained a bachelor's degree or higher.
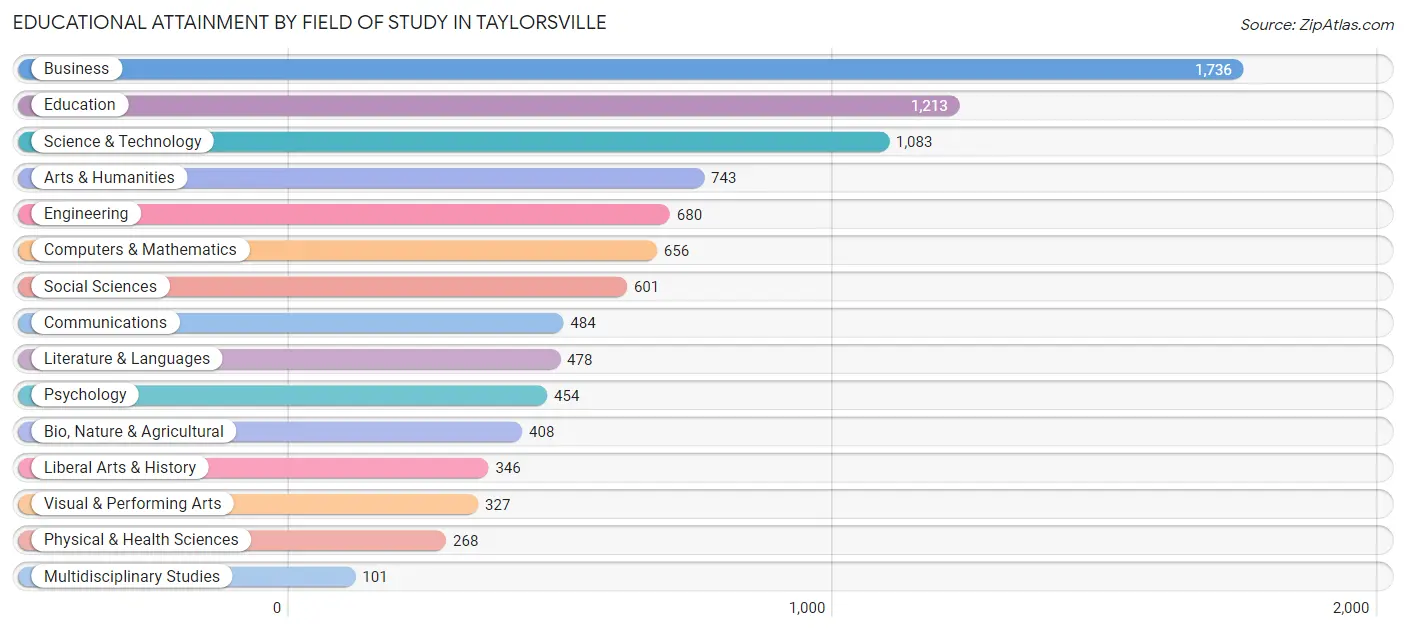
| Field of Study | # Graduates | % Graduates |
| Computers & Mathematics | 656 | 6.9% |
| Bio, Nature & Agricultural | 408 | 4.3% |
| Physical & Health Sciences | 268 | 2.8% |
| Psychology | 454 | 4.7% |
| Social Sciences | 601 | 6.3% |
| Engineering | 680 | 7.1% |
| Multidisciplinary Studies | 101 | 1.1% |
| Science & Technology | 1,083 | 11.3% |
| Business | 1,736 | 18.1% |
| Education | 1,213 | 12.7% |
| Literature & Languages | 478 | 5.0% |
| Liberal Arts & History | 346 | 3.6% |
| Visual & Performing Arts | 327 | 3.4% |
| Communications | 484 | 5.1% |
| Arts & Humanities | 743 | 7.8% |
| Total | 9,578 | 100.0% |
Transportation & Commute in Taylorsville
Vehicle Availability by Sex in Taylorsville
The most prevalent vehicle ownership categories in Taylorsville are males with 2 vehicles (5,962, accounting for 37.1%) and females with 2 vehicles (5,195, making up 42.5%).
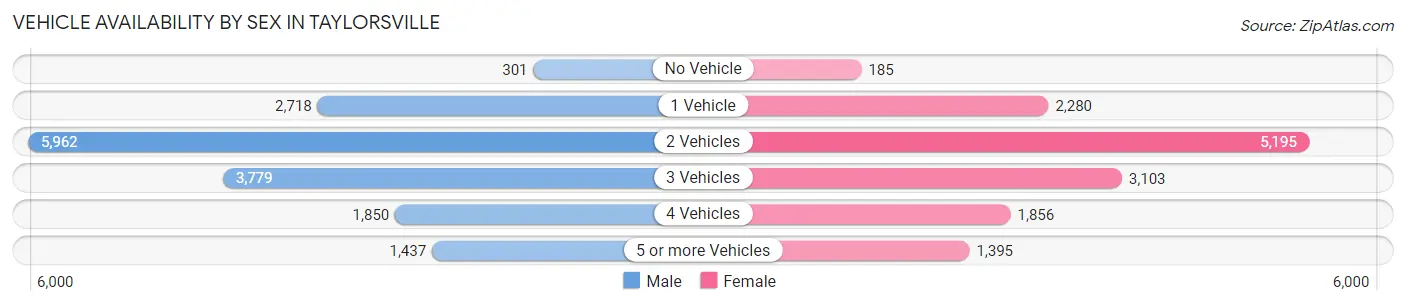
| Vehicles Available | Male | Female |
| No Vehicle | 301 (1.9%) | 185 (1.3%) |
| 1 Vehicle | 2,718 (16.9%) | 2,280 (16.3%) |
| 2 Vehicles | 5,962 (37.1%) | 5,195 (37.1%) |
| 3 Vehicles | 3,779 (23.5%) | 3,103 (22.1%) |
| 4 Vehicles | 1,850 (11.5%) | 1,856 (13.2%) |
| 5 or more Vehicles | 1,437 (8.9%) | 1,395 (10.0%) |
| Total | 16,047 (100.0%) | 14,014 (100.0%) |
Commute Time in Taylorsville
The most frequently occuring commute durations in Taylorsville are 15 to 19 minutes (6,758 commuters, 25.7%), 20 to 24 minutes (6,171 commuters, 23.4%), and 10 to 14 minutes (4,010 commuters, 15.2%).
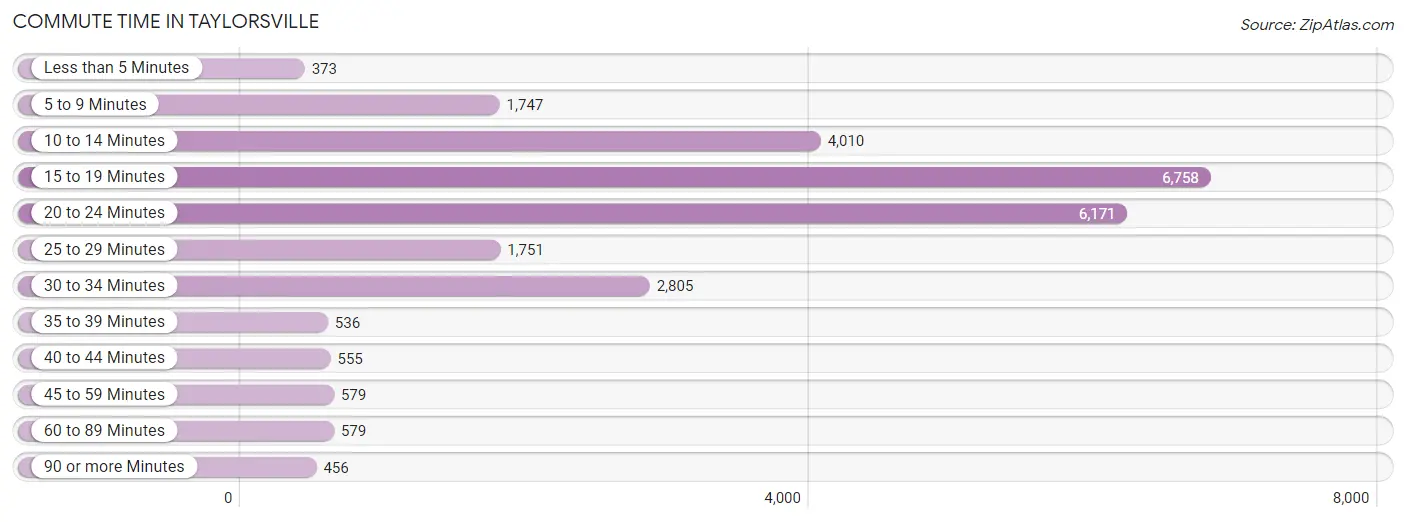
| Commute Time | # Commuters | % Commuters |
| Less than 5 Minutes | 373 | 1.4% |
| 5 to 9 Minutes | 1,747 | 6.6% |
| 10 to 14 Minutes | 4,010 | 15.2% |
| 15 to 19 Minutes | 6,758 | 25.7% |
| 20 to 24 Minutes | 6,171 | 23.4% |
| 25 to 29 Minutes | 1,751 | 6.7% |
| 30 to 34 Minutes | 2,805 | 10.7% |
| 35 to 39 Minutes | 536 | 2.0% |
| 40 to 44 Minutes | 555 | 2.1% |
| 45 to 59 Minutes | 579 | 2.2% |
| 60 to 89 Minutes | 579 | 2.2% |
| 90 or more Minutes | 456 | 1.7% |
Commute Time by Sex in Taylorsville
The most common commute times in Taylorsville are 15 to 19 minutes (3,718 commuters, 25.8%) for males and 15 to 19 minutes (3,040 commuters, 25.5%) for females.
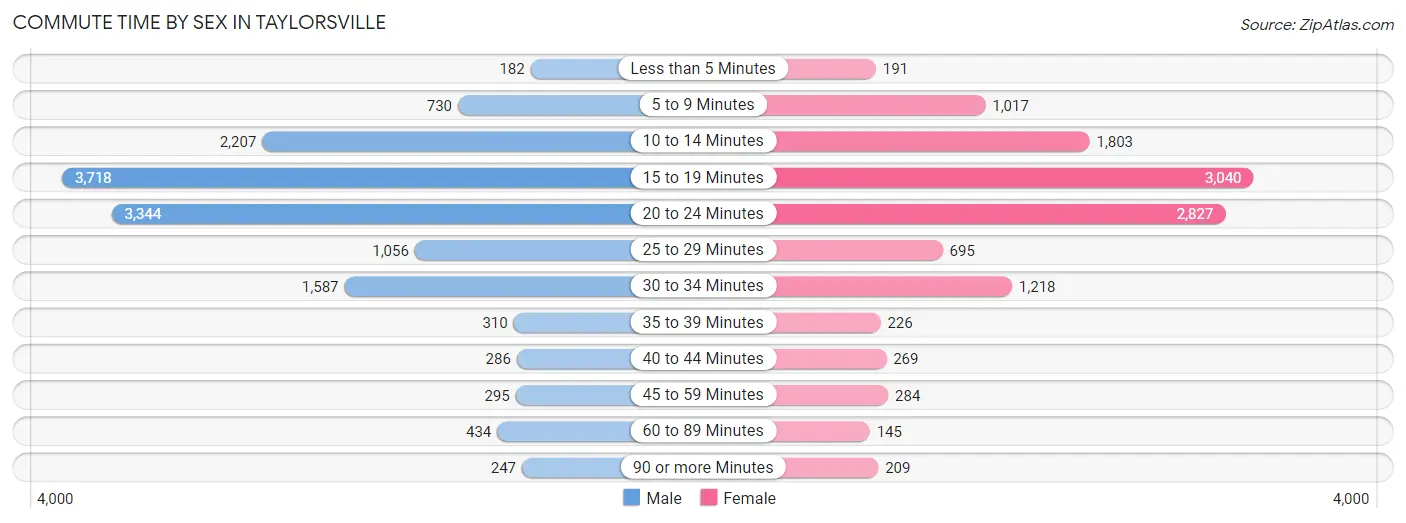
| Commute Time | Male | Female |
| Less than 5 Minutes | 182 (1.3%) | 191 (1.6%) |
| 5 to 9 Minutes | 730 (5.1%) | 1,017 (8.5%) |
| 10 to 14 Minutes | 2,207 (15.3%) | 1,803 (15.1%) |
| 15 to 19 Minutes | 3,718 (25.8%) | 3,040 (25.5%) |
| 20 to 24 Minutes | 3,344 (23.2%) | 2,827 (23.7%) |
| 25 to 29 Minutes | 1,056 (7.3%) | 695 (5.8%) |
| 30 to 34 Minutes | 1,587 (11.0%) | 1,218 (10.2%) |
| 35 to 39 Minutes | 310 (2.1%) | 226 (1.9%) |
| 40 to 44 Minutes | 286 (2.0%) | 269 (2.3%) |
| 45 to 59 Minutes | 295 (2.1%) | 284 (2.4%) |
| 60 to 89 Minutes | 434 (3.0%) | 145 (1.2%) |
| 90 or more Minutes | 247 (1.7%) | 209 (1.8%) |
Time of Departure to Work by Sex in Taylorsville
The most frequent times of departure to work in Taylorsville are 7:30 AM to 7:59 AM (1,742, 12.1%) for males and 7:00 AM to 7:29 AM (1,740, 14.6%) for females.
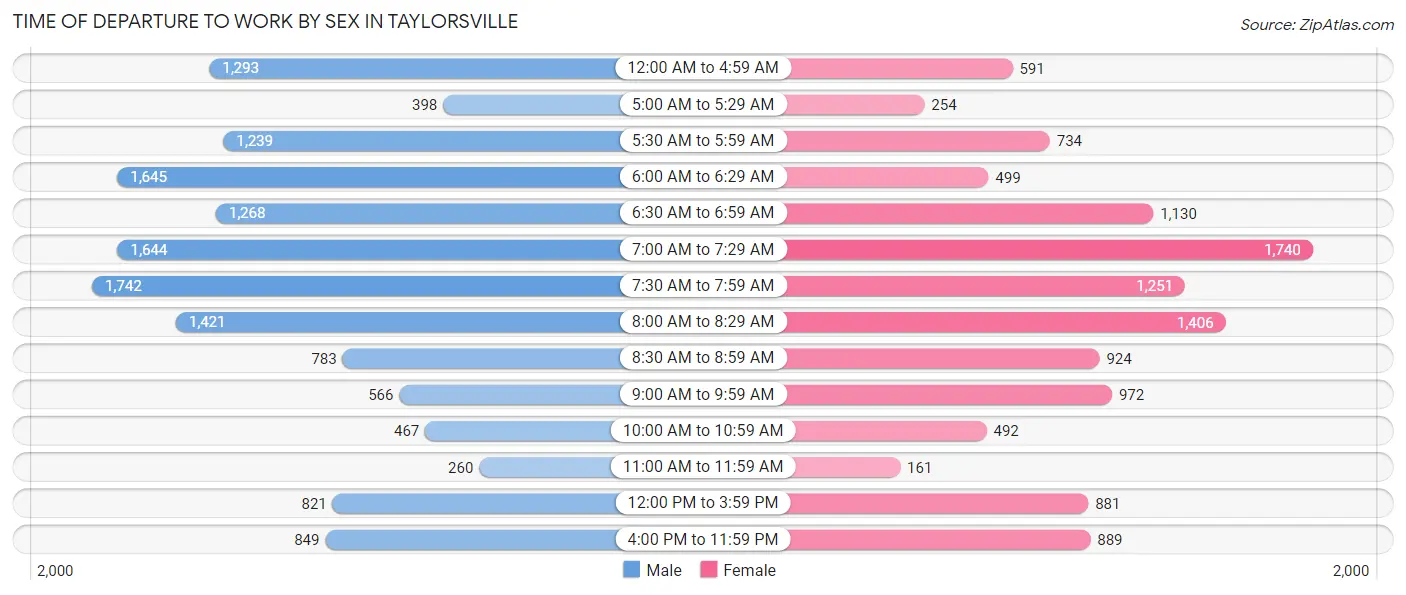
| Time of Departure | Male | Female |
| 12:00 AM to 4:59 AM | 1,293 (9.0%) | 591 (5.0%) |
| 5:00 AM to 5:29 AM | 398 (2.8%) | 254 (2.1%) |
| 5:30 AM to 5:59 AM | 1,239 (8.6%) | 734 (6.2%) |
| 6:00 AM to 6:29 AM | 1,645 (11.4%) | 499 (4.2%) |
| 6:30 AM to 6:59 AM | 1,268 (8.8%) | 1,130 (9.5%) |
| 7:00 AM to 7:29 AM | 1,644 (11.4%) | 1,740 (14.6%) |
| 7:30 AM to 7:59 AM | 1,742 (12.1%) | 1,251 (10.5%) |
| 8:00 AM to 8:29 AM | 1,421 (9.9%) | 1,406 (11.8%) |
| 8:30 AM to 8:59 AM | 783 (5.4%) | 924 (7.7%) |
| 9:00 AM to 9:59 AM | 566 (3.9%) | 972 (8.2%) |
| 10:00 AM to 10:59 AM | 467 (3.2%) | 492 (4.1%) |
| 11:00 AM to 11:59 AM | 260 (1.8%) | 161 (1.3%) |
| 12:00 PM to 3:59 PM | 821 (5.7%) | 881 (7.4%) |
| 4:00 PM to 11:59 PM | 849 (5.9%) | 889 (7.5%) |
| Total | 14,396 (100.0%) | 11,924 (100.0%) |
Housing Occupancy in Taylorsville
Occupancy by Ownership in Taylorsville
Of the total 20,003 dwellings in Taylorsville, owner-occupied units account for 14,089 (70.4%), while renter-occupied units make up 5,914 (29.6%).
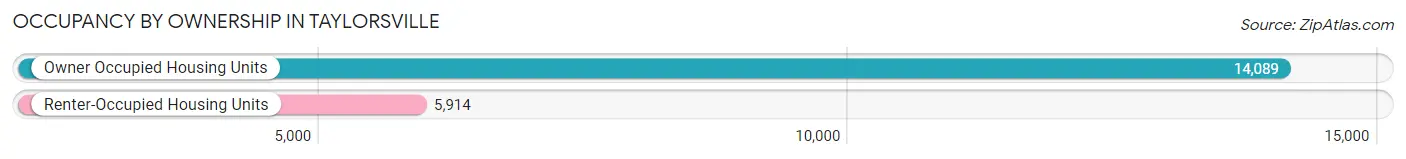
| Occupancy | # Housing Units | % Housing Units |
| Owner Occupied Housing Units | 14,089 | 70.4% |
| Renter-Occupied Housing Units | 5,914 | 29.6% |
| Total Occupied Housing Units | 20,003 | 100.0% |
Occupancy by Household Size in Taylorsville
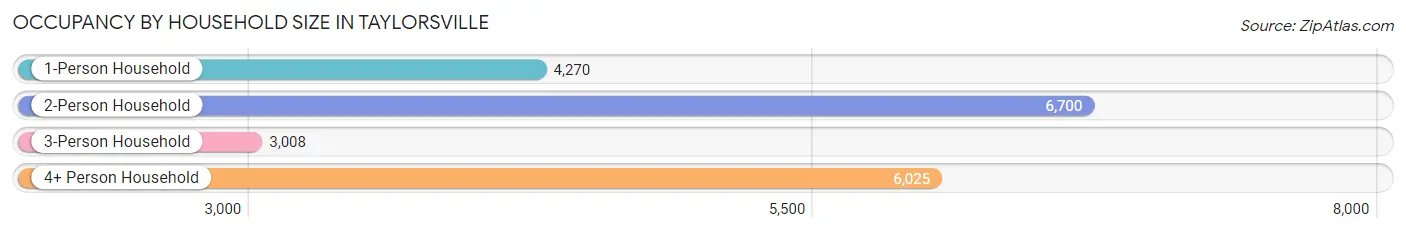
| Household Size | # Housing Units | % Housing Units |
| 1-Person Household | 4,270 | 21.3% |
| 2-Person Household | 6,700 | 33.5% |
| 3-Person Household | 3,008 | 15.0% |
| 4+ Person Household | 6,025 | 30.1% |
| Total Housing Units | 20,003 | 100.0% |
Occupancy by Ownership by Household Size in Taylorsville
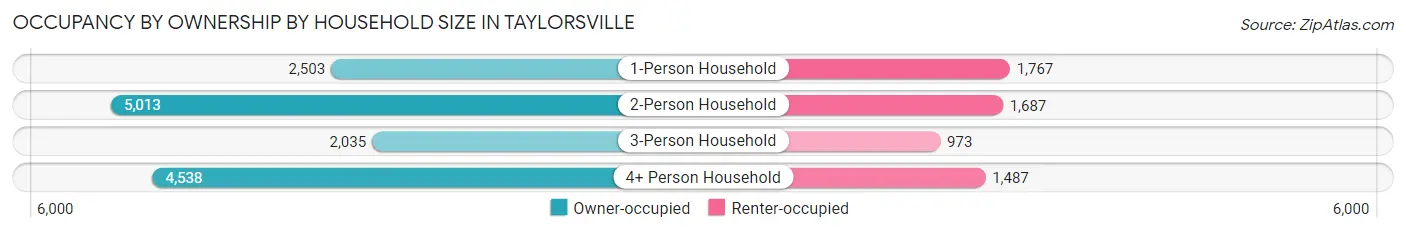
| Household Size | Owner-occupied | Renter-occupied |
| 1-Person Household | 2,503 (58.6%) | 1,767 (41.4%) |
| 2-Person Household | 5,013 (74.8%) | 1,687 (25.2%) |
| 3-Person Household | 2,035 (67.6%) | 973 (32.4%) |
| 4+ Person Household | 4,538 (75.3%) | 1,487 (24.7%) |
| Total Housing Units | 14,089 (70.4%) | 5,914 (29.6%) |
Occupancy by Educational Attainment in Taylorsville
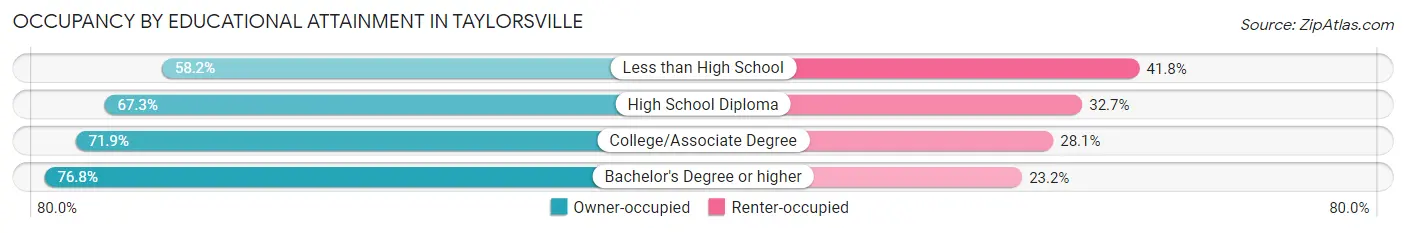
| Household Size | Owner-occupied | Renter-occupied |
| Less than High School | 1,249 (58.2%) | 896 (41.8%) |
| High School Diploma | 3,612 (67.3%) | 1,754 (32.7%) |
| College/Associate Degree | 5,403 (71.9%) | 2,111 (28.1%) |
| Bachelor's Degree or higher | 3,825 (76.8%) | 1,153 (23.2%) |
Occupancy by Age of Householder in Taylorsville
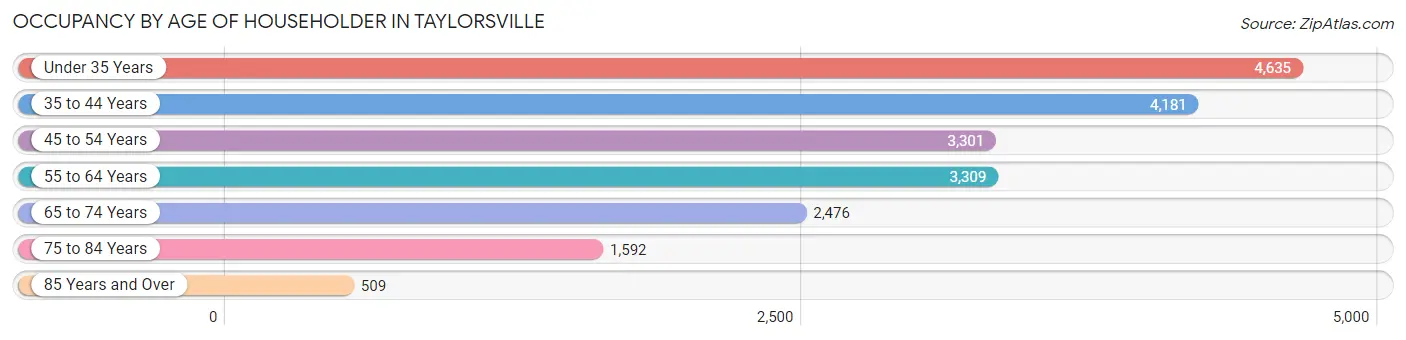
| Age Bracket | # Households | % Households |
| Under 35 Years | 4,635 | 23.2% |
| 35 to 44 Years | 4,181 | 20.9% |
| 45 to 54 Years | 3,301 | 16.5% |
| 55 to 64 Years | 3,309 | 16.5% |
| 65 to 74 Years | 2,476 | 12.4% |
| 75 to 84 Years | 1,592 | 8.0% |
| 85 Years and Over | 509 | 2.5% |
| Total | 20,003 | 100.0% |
Housing Finances in Taylorsville
Median Income by Occupancy in Taylorsville
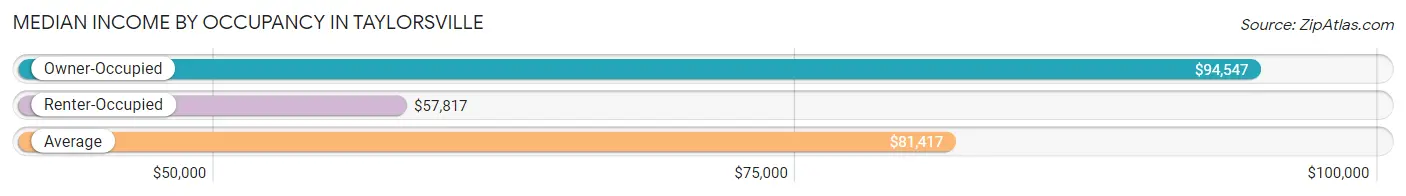
| Occupancy Type | # Households | Median Income |
| Owner-Occupied | 14,089 (70.4%) | $94,547 |
| Renter-Occupied | 5,914 (29.6%) | $57,817 |
| Average | 20,003 (100.0%) | $81,417 |
Occupancy by Householder Income Bracket in Taylorsville
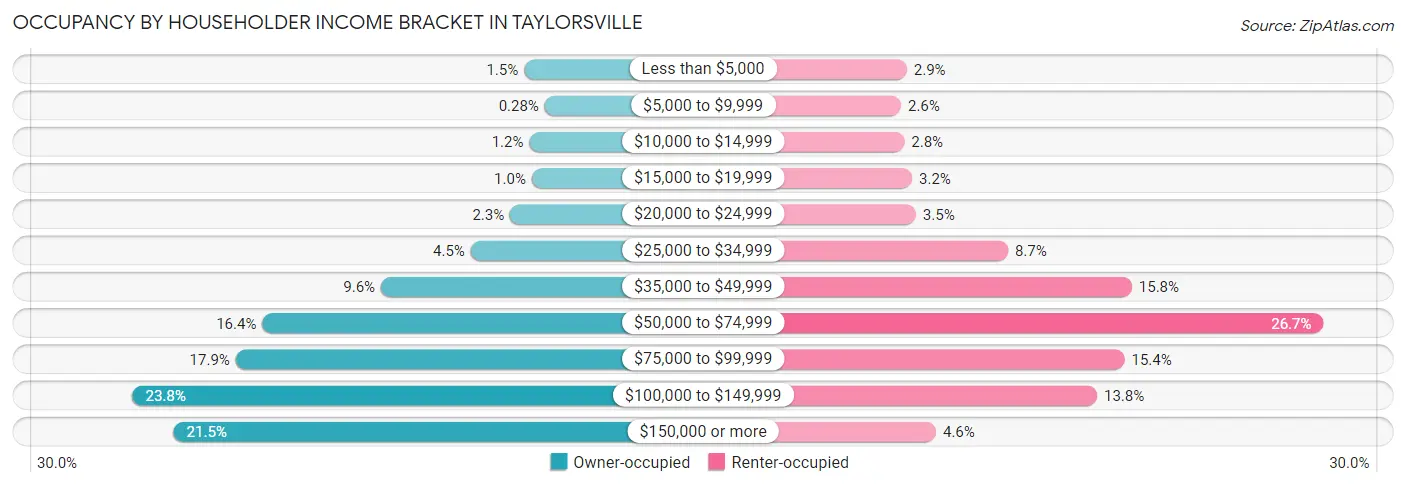
| Income Bracket | Owner-occupied | Renter-occupied |
| Less than $5,000 | 205 (1.5%) | 173 (2.9%) |
| $5,000 to $9,999 | 39 (0.3%) | 154 (2.6%) |
| $10,000 to $14,999 | 163 (1.2%) | 165 (2.8%) |
| $15,000 to $19,999 | 144 (1.0%) | 191 (3.2%) |
| $20,000 to $24,999 | 319 (2.3%) | 204 (3.5%) |
| $25,000 to $34,999 | 636 (4.5%) | 515 (8.7%) |
| $35,000 to $49,999 | 1,358 (9.6%) | 934 (15.8%) |
| $50,000 to $74,999 | 2,313 (16.4%) | 1,581 (26.7%) |
| $75,000 to $99,999 | 2,528 (17.9%) | 909 (15.4%) |
| $100,000 to $149,999 | 3,357 (23.8%) | 816 (13.8%) |
| $150,000 or more | 3,027 (21.5%) | 272 (4.6%) |
| Total | 14,089 (100.0%) | 5,914 (100.0%) |
Monthly Housing Cost Tiers in Taylorsville
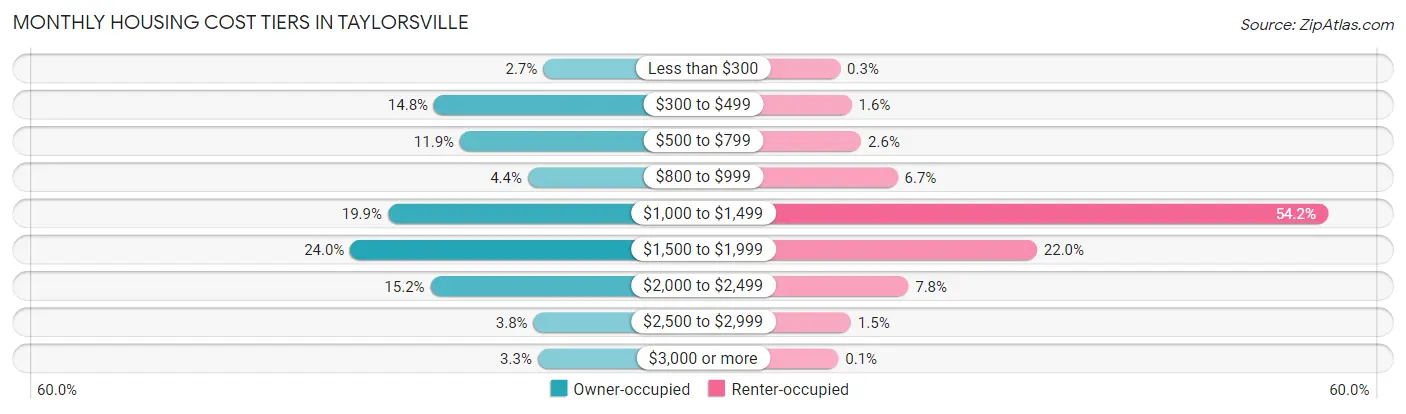
| Monthly Cost | Owner-occupied | Renter-occupied |
| Less than $300 | 383 (2.7%) | 18 (0.3%) |
| $300 to $499 | 2,083 (14.8%) | 93 (1.6%) |
| $500 to $799 | 1,678 (11.9%) | 155 (2.6%) |
| $800 to $999 | 621 (4.4%) | 393 (6.7%) |
| $1,000 to $1,499 | 2,801 (19.9%) | 3,203 (54.2%) |
| $1,500 to $1,999 | 3,385 (24.0%) | 1,303 (22.0%) |
| $2,000 to $2,499 | 2,138 (15.2%) | 463 (7.8%) |
| $2,500 to $2,999 | 534 (3.8%) | 88 (1.5%) |
| $3,000 or more | 466 (3.3%) | 6 (0.1%) |
| Total | 14,089 (100.0%) | 5,914 (100.0%) |
Physical Housing Characteristics in Taylorsville
Housing Structures in Taylorsville
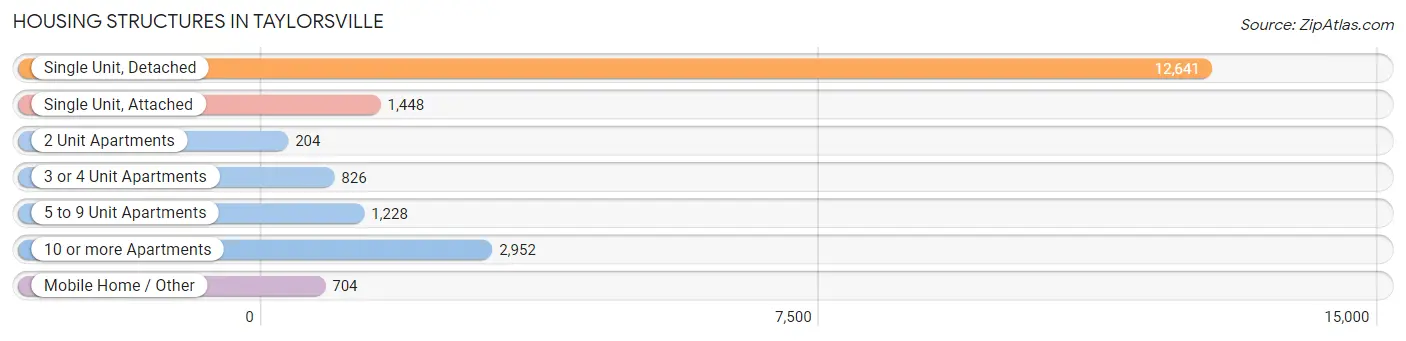
| Structure Type | # Housing Units | % Housing Units |
| Single Unit, Detached | 12,641 | 63.2% |
| Single Unit, Attached | 1,448 | 7.2% |
| 2 Unit Apartments | 204 | 1.0% |
| 3 or 4 Unit Apartments | 826 | 4.1% |
| 5 to 9 Unit Apartments | 1,228 | 6.1% |
| 10 or more Apartments | 2,952 | 14.8% |
| Mobile Home / Other | 704 | 3.5% |
| Total | 20,003 | 100.0% |
Housing Structures by Occupancy in Taylorsville
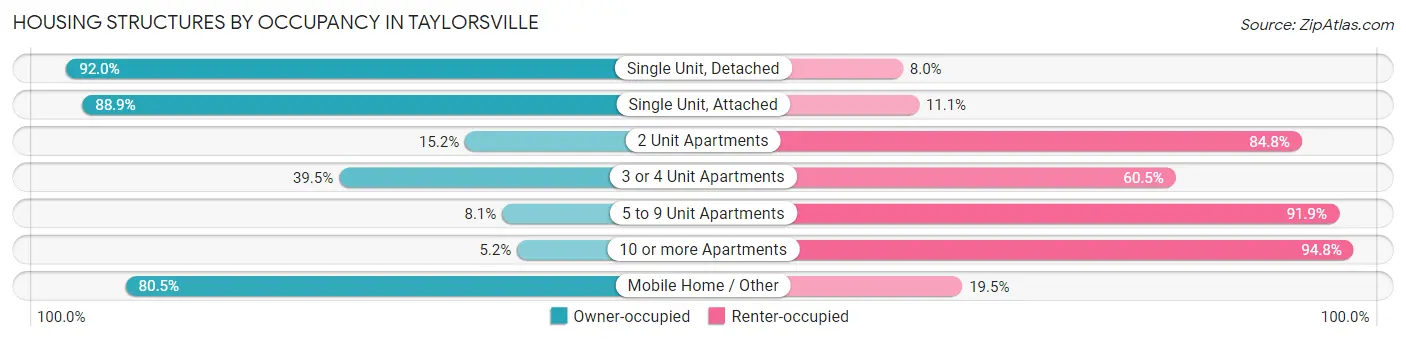
| Structure Type | Owner-occupied | Renter-occupied |
| Single Unit, Detached | 11,626 (92.0%) | 1,015 (8.0%) |
| Single Unit, Attached | 1,287 (88.9%) | 161 (11.1%) |
| 2 Unit Apartments | 31 (15.2%) | 173 (84.8%) |
| 3 or 4 Unit Apartments | 326 (39.5%) | 500 (60.5%) |
| 5 to 9 Unit Apartments | 99 (8.1%) | 1,129 (91.9%) |
| 10 or more Apartments | 153 (5.2%) | 2,799 (94.8%) |
| Mobile Home / Other | 567 (80.5%) | 137 (19.5%) |
| Total | 14,089 (70.4%) | 5,914 (29.6%) |
Housing Structures by Number of Rooms in Taylorsville
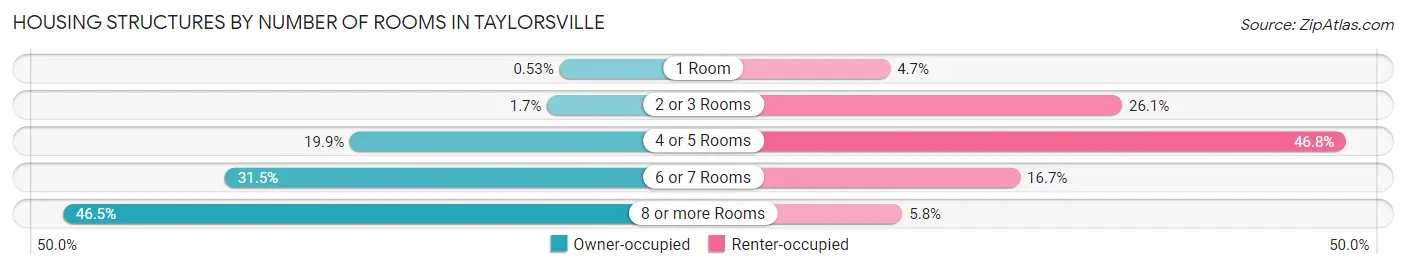
| Number of Rooms | Owner-occupied | Renter-occupied |
| 1 Room | 74 (0.5%) | 275 (4.6%) |
| 2 or 3 Rooms | 233 (1.7%) | 1,543 (26.1%) |
| 4 or 5 Rooms | 2,802 (19.9%) | 2,769 (46.8%) |
| 6 or 7 Rooms | 4,434 (31.5%) | 986 (16.7%) |
| 8 or more Rooms | 6,546 (46.5%) | 341 (5.8%) |
| Total | 14,089 (100.0%) | 5,914 (100.0%) |
Housing Structure by Heating Type in Taylorsville
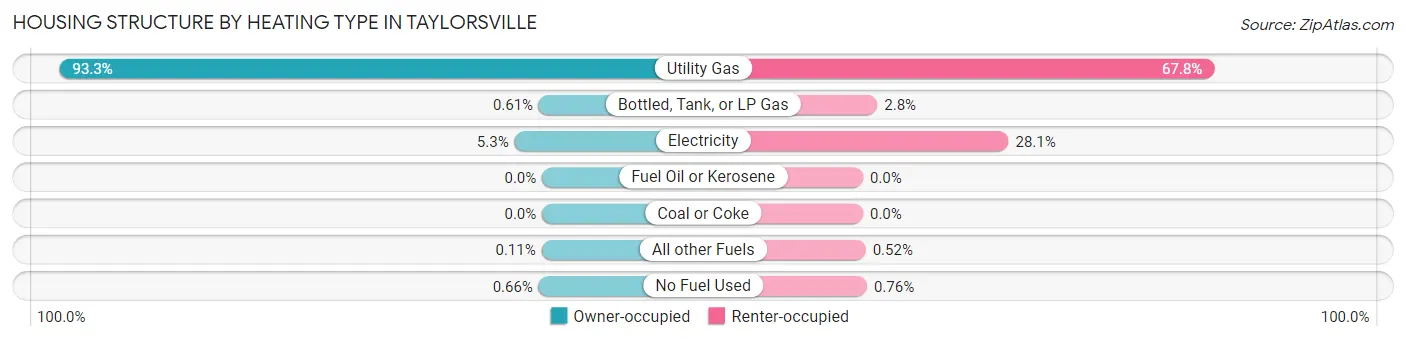
| Heating Type | Owner-occupied | Renter-occupied |
| Utility Gas | 13,141 (93.3%) | 4,012 (67.8%) |
| Bottled, Tank, or LP Gas | 86 (0.6%) | 163 (2.8%) |
| Electricity | 753 (5.3%) | 1,663 (28.1%) |
| Fuel Oil or Kerosene | 0 (0.0%) | 0 (0.0%) |
| Coal or Coke | 0 (0.0%) | 0 (0.0%) |
| All other Fuels | 16 (0.1%) | 31 (0.5%) |
| No Fuel Used | 93 (0.7%) | 45 (0.8%) |
| Total | 14,089 (100.0%) | 5,914 (100.0%) |
Household Vehicle Usage in Taylorsville
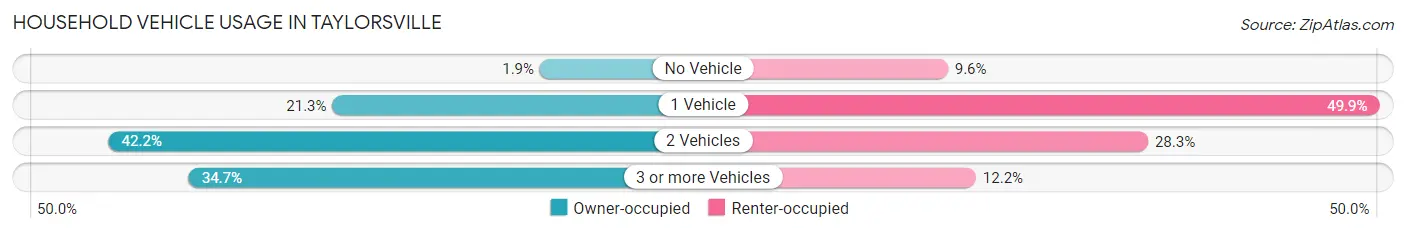
| Vehicles per Household | Owner-occupied | Renter-occupied |
| No Vehicle | 268 (1.9%) | 568 (9.6%) |
| 1 Vehicle | 2,997 (21.3%) | 2,950 (49.9%) |
| 2 Vehicles | 5,939 (42.1%) | 1,673 (28.3%) |
| 3 or more Vehicles | 4,885 (34.7%) | 723 (12.2%) |
| Total | 14,089 (100.0%) | 5,914 (100.0%) |
Real Estate & Mortgages in Taylorsville
Real Estate and Mortgage Overview in Taylorsville
| Characteristic | Without Mortgage | With Mortgage |
| Housing Units | 4,136 | 9,953 |
| Median Property Value | $346,600 | $364,000 |
| Median Household Income | $71,265 | $2,307 |
| Monthly Housing Costs | $479 | $460 |
| Real Estate Taxes | $2,307 | $125 |
Property Value by Mortgage Status in Taylorsville
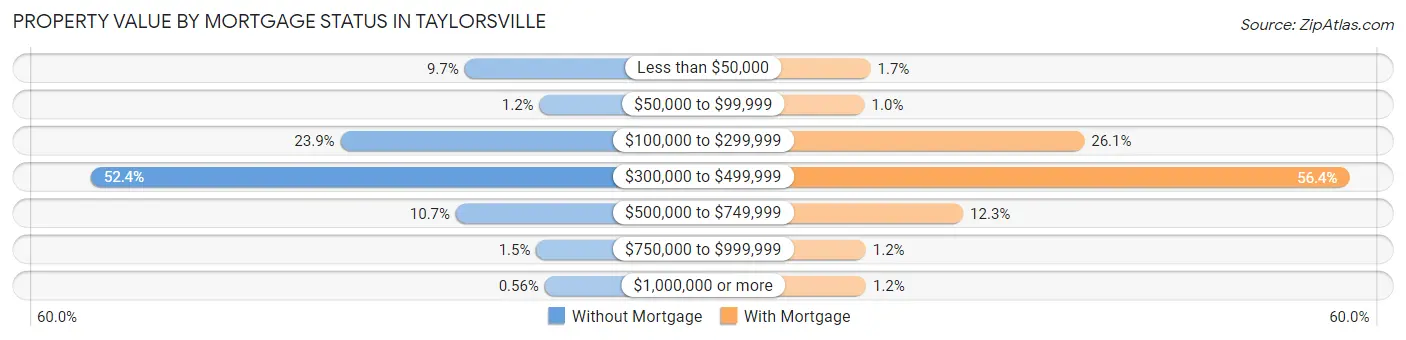
| Property Value | Without Mortgage | With Mortgage |
| Less than $50,000 | 402 (9.7%) | 171 (1.7%) |
| $50,000 to $99,999 | 48 (1.2%) | 104 (1.0%) |
| $100,000 to $299,999 | 989 (23.9%) | 2,602 (26.1%) |
| $300,000 to $499,999 | 2,168 (52.4%) | 5,616 (56.4%) |
| $500,000 to $749,999 | 443 (10.7%) | 1,224 (12.3%) |
| $750,000 to $999,999 | 63 (1.5%) | 117 (1.2%) |
| $1,000,000 or more | 23 (0.6%) | 119 (1.2%) |
| Total | 4,136 (100.0%) | 9,953 (100.0%) |
Household Income by Mortgage Status in Taylorsville
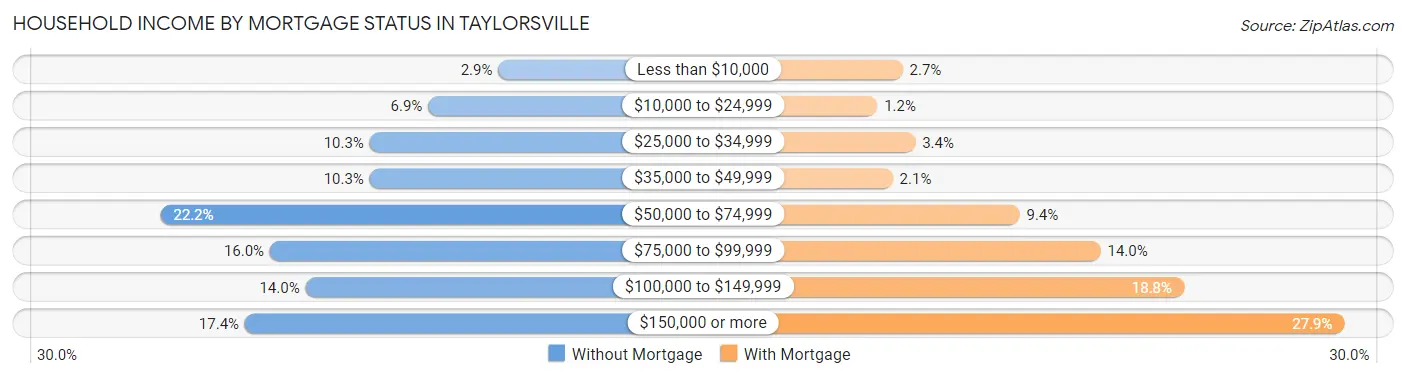
| Household Income | Without Mortgage | With Mortgage |
| Less than $10,000 | 121 (2.9%) | 268 (2.7%) |
| $10,000 to $24,999 | 287 (6.9%) | 123 (1.2%) |
| $25,000 to $34,999 | 425 (10.3%) | 339 (3.4%) |
| $35,000 to $49,999 | 425 (10.3%) | 211 (2.1%) |
| $50,000 to $74,999 | 920 (22.2%) | 933 (9.4%) |
| $75,000 to $99,999 | 661 (16.0%) | 1,393 (14.0%) |
| $100,000 to $149,999 | 577 (14.0%) | 1,867 (18.8%) |
| $150,000 or more | 720 (17.4%) | 2,780 (27.9%) |
| Total | 4,136 (100.0%) | 9,953 (100.0%) |
Property Value to Household Income Ratio in Taylorsville
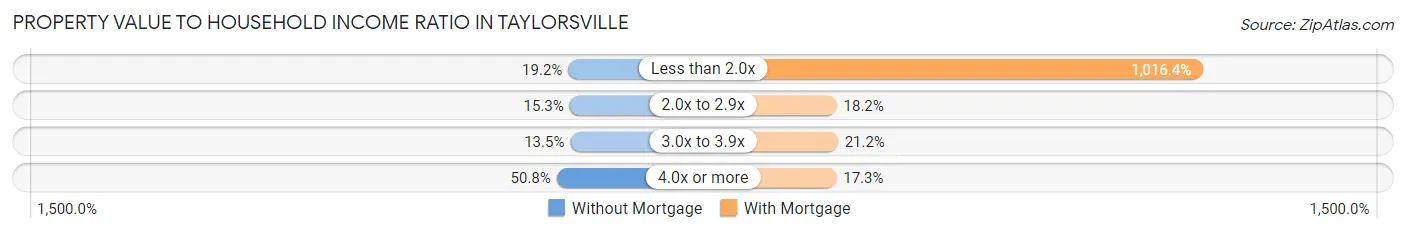
| Value-to-Income Ratio | Without Mortgage | With Mortgage |
| Less than 2.0x | 795 (19.2%) | 101,166 (1,016.4%) |
| 2.0x to 2.9x | 634 (15.3%) | 1,807 (18.2%) |
| 3.0x to 3.9x | 559 (13.5%) | 2,108 (21.2%) |
| 4.0x or more | 2,099 (50.7%) | 1,718 (17.3%) |
| Total | 4,136 (100.0%) | 9,953 (100.0%) |
Real Estate Taxes by Mortgage Status in Taylorsville
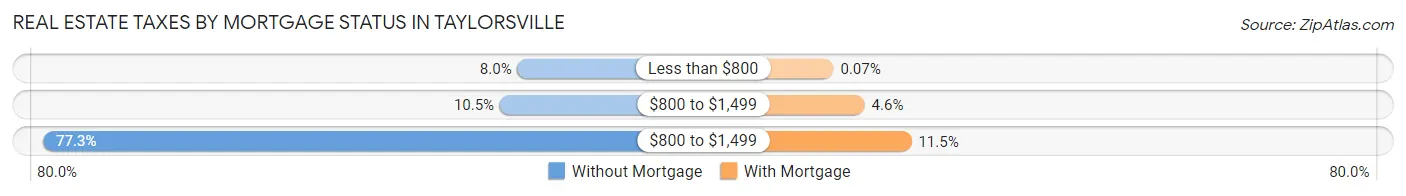
| Property Taxes | Without Mortgage | With Mortgage |
| Less than $800 | 330 (8.0%) | 7 (0.1%) |
| $800 to $1,499 | 436 (10.5%) | 460 (4.6%) |
| $800 to $1,499 | 3,197 (77.3%) | 1,141 (11.5%) |
| Total | 4,136 (100.0%) | 9,953 (100.0%) |
Health & Disability in Taylorsville
Health Insurance Coverage by Age in Taylorsville
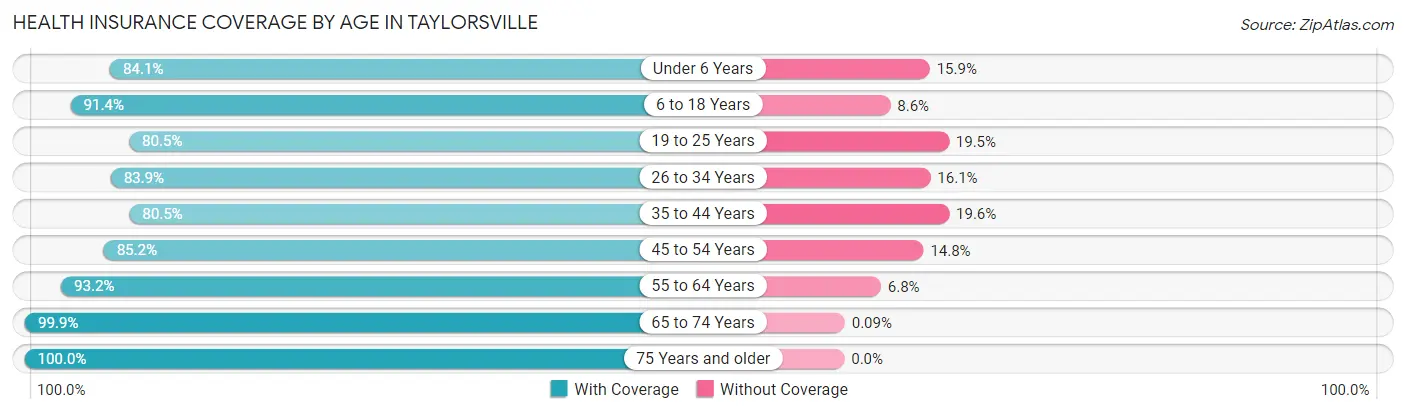
| Age Bracket | With Coverage | Without Coverage |
| Under 6 Years | 4,497 (84.1%) | 852 (15.9%) |
| 6 to 18 Years | 10,592 (91.4%) | 995 (8.6%) |
| 19 to 25 Years | 4,384 (80.5%) | 1,062 (19.5%) |
| 26 to 34 Years | 7,104 (83.9%) | 1,359 (16.1%) |
| 35 to 44 Years | 6,785 (80.4%) | 1,649 (19.6%) |
| 45 to 54 Years | 5,601 (85.2%) | 970 (14.8%) |
| 55 to 64 Years | 5,956 (93.2%) | 436 (6.8%) |
| 65 to 74 Years | 4,345 (99.9%) | 4 (0.1%) |
| 75 Years and older | 2,904 (100.0%) | 0 (0.0%) |
| Total | 52,168 (87.7%) | 7,327 (12.3%) |
Health Insurance Coverage by Citizenship Status in Taylorsville
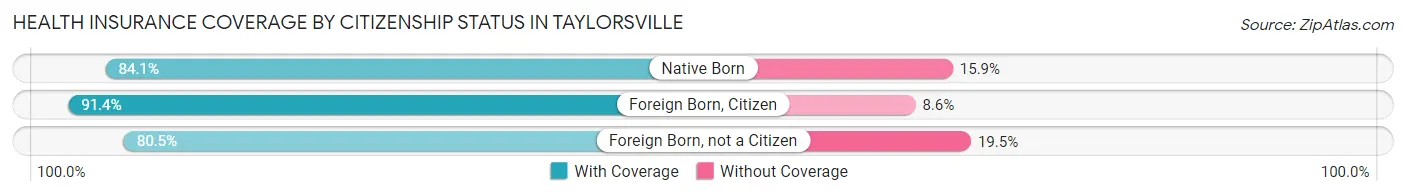
| Citizenship Status | With Coverage | Without Coverage |
| Native Born | 4,497 (84.1%) | 852 (15.9%) |
| Foreign Born, Citizen | 10,592 (91.4%) | 995 (8.6%) |
| Foreign Born, not a Citizen | 4,384 (80.5%) | 1,062 (19.5%) |
Health Insurance Coverage by Household Income in Taylorsville
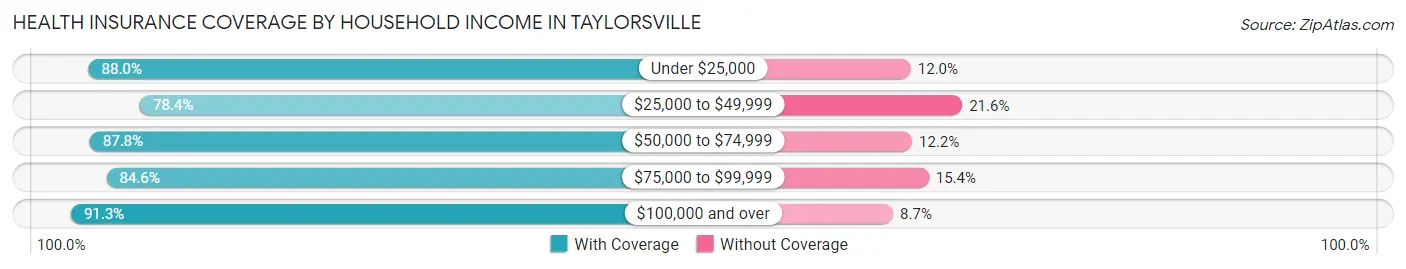
| Household Income | With Coverage | Without Coverage |
| Under $25,000 | 3,279 (88.0%) | 447 (12.0%) |
| $25,000 to $49,999 | 6,040 (78.4%) | 1,667 (21.6%) |
| $50,000 to $74,999 | 9,846 (87.8%) | 1,372 (12.2%) |
| $75,000 to $99,999 | 8,142 (84.6%) | 1,477 (15.4%) |
| $100,000 and over | 24,797 (91.3%) | 2,360 (8.7%) |
Public vs Private Health Insurance Coverage by Age in Taylorsville
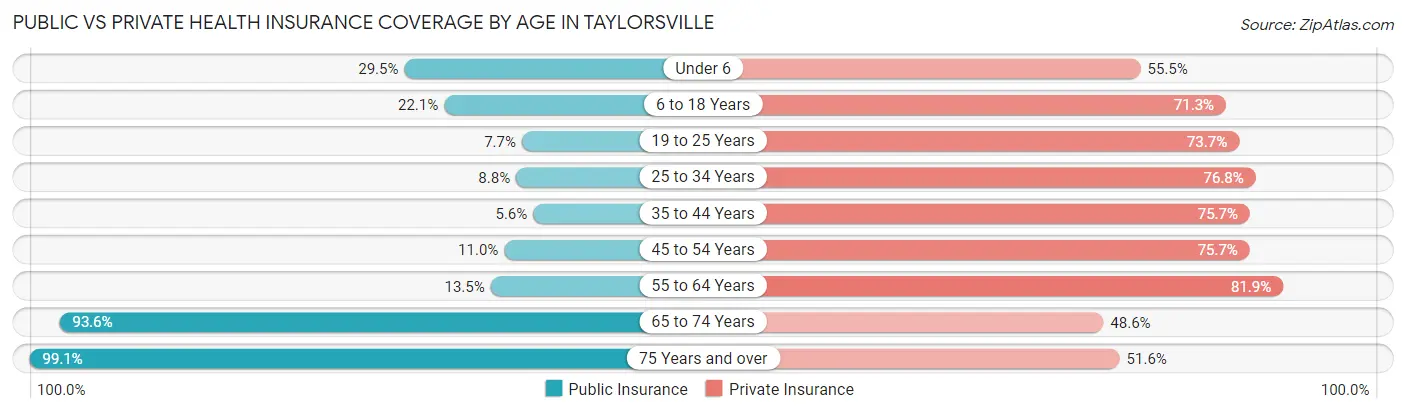
| Age Bracket | Public Insurance | Private Insurance |
| Under 6 | 1,579 (29.5%) | 2,967 (55.5%) |
| 6 to 18 Years | 2,565 (22.1%) | 8,262 (71.3%) |
| 19 to 25 Years | 420 (7.7%) | 4,015 (73.7%) |
| 25 to 34 Years | 744 (8.8%) | 6,500 (76.8%) |
| 35 to 44 Years | 473 (5.6%) | 6,386 (75.7%) |
| 45 to 54 Years | 722 (11.0%) | 4,975 (75.7%) |
| 55 to 64 Years | 864 (13.5%) | 5,235 (81.9%) |
| 65 to 74 Years | 4,069 (93.6%) | 2,112 (48.6%) |
| 75 Years and over | 2,878 (99.1%) | 1,498 (51.6%) |
| Total | 14,314 (24.1%) | 41,950 (70.5%) |
Disability Status by Sex by Age in Taylorsville
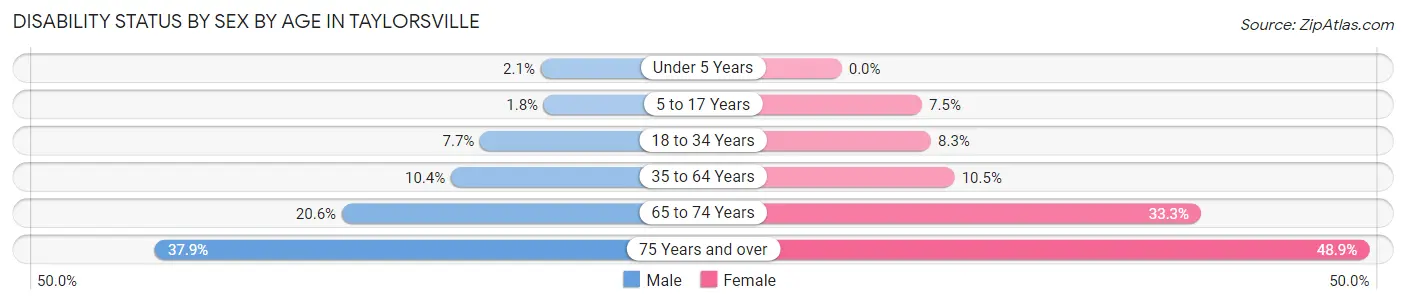
| Age Bracket | Male | Female |
| Under 5 Years | 42 (2.1%) | 0 (0.0%) |
| 5 to 17 Years | 106 (1.8%) | 447 (7.5%) |
| 18 to 34 Years | 551 (7.7%) | 617 (8.3%) |
| 35 to 64 Years | 1,129 (10.4%) | 1,107 (10.5%) |
| 65 to 74 Years | 428 (20.5%) | 755 (33.3%) |
| 75 Years and over | 426 (37.9%) | 871 (48.9%) |
Disability Class by Sex by Age in Taylorsville
Disability Class: Hearing Difficulty
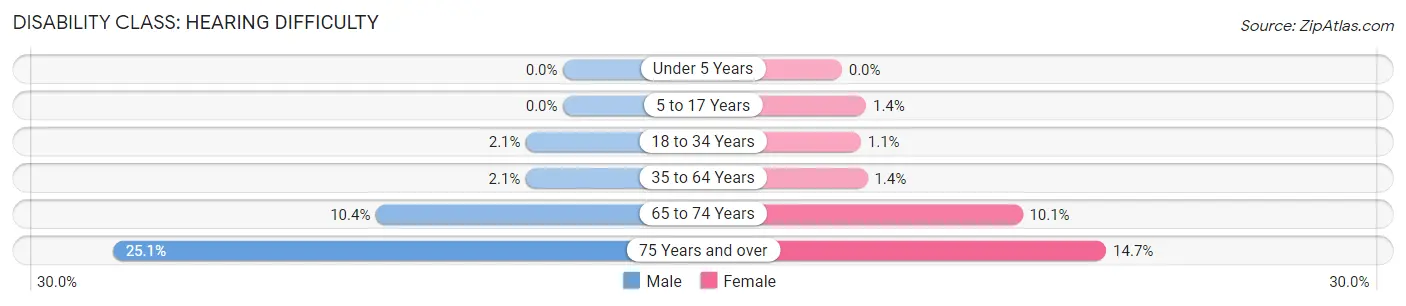
| Age Bracket | Male | Female |
| Under 5 Years | 0 (0.0%) | 0 (0.0%) |
| 5 to 17 Years | 0 (0.0%) | 81 (1.3%) |
| 18 to 34 Years | 147 (2.1%) | 79 (1.1%) |
| 35 to 64 Years | 224 (2.1%) | 151 (1.4%) |
| 65 to 74 Years | 217 (10.4%) | 228 (10.1%) |
| 75 Years and over | 282 (25.1%) | 262 (14.7%) |
Disability Class: Vision Difficulty
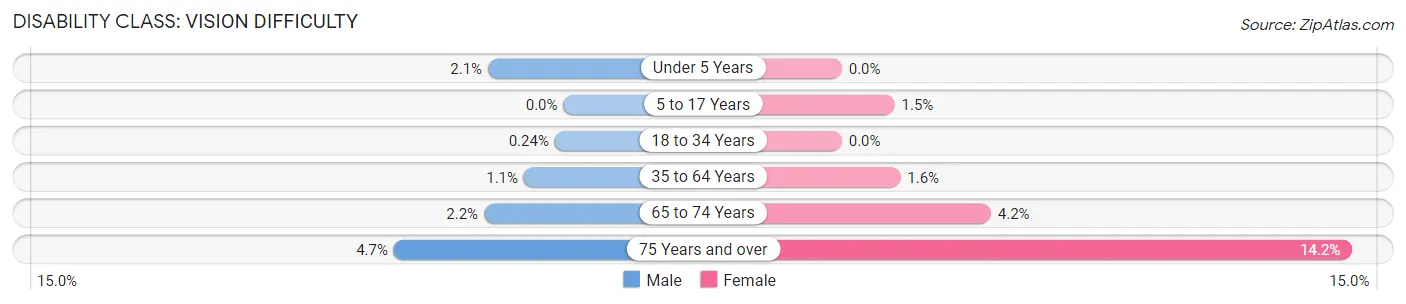
| Age Bracket | Male | Female |
| Under 5 Years | 42 (2.1%) | 0 (0.0%) |
| 5 to 17 Years | 0 (0.0%) | 88 (1.5%) |
| 18 to 34 Years | 17 (0.2%) | 0 (0.0%) |
| 35 to 64 Years | 119 (1.1%) | 172 (1.6%) |
| 65 to 74 Years | 46 (2.2%) | 94 (4.2%) |
| 75 Years and over | 53 (4.7%) | 253 (14.2%) |
Disability Class: Cognitive Difficulty
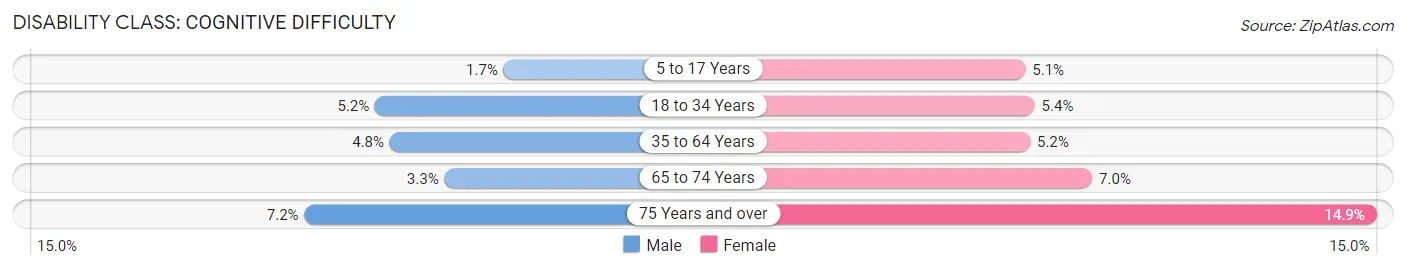
| Age Bracket | Male | Female |
| 5 to 17 Years | 98 (1.7%) | 306 (5.1%) |
| 18 to 34 Years | 374 (5.2%) | 400 (5.4%) |
| 35 to 64 Years | 523 (4.8%) | 553 (5.2%) |
| 65 to 74 Years | 69 (3.3%) | 158 (7.0%) |
| 75 Years and over | 81 (7.2%) | 265 (14.9%) |
Disability Class: Ambulatory Difficulty
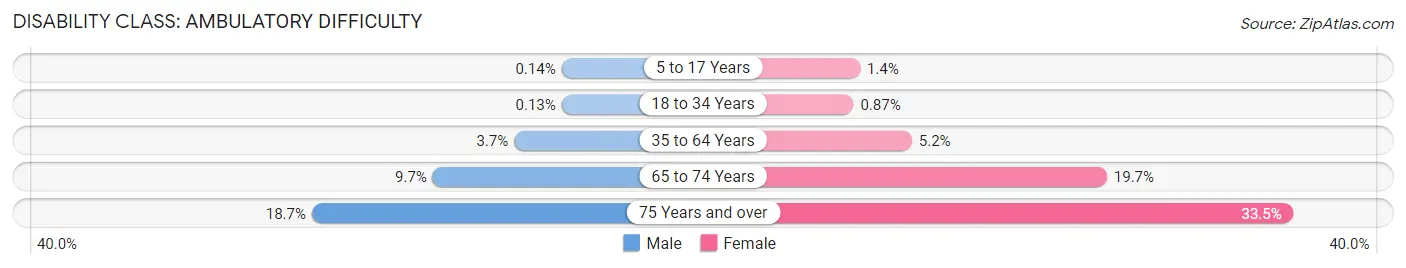
| Age Bracket | Male | Female |
| 5 to 17 Years | 8 (0.1%) | 81 (1.3%) |
| 18 to 34 Years | 9 (0.1%) | 65 (0.9%) |
| 35 to 64 Years | 397 (3.7%) | 549 (5.2%) |
| 65 to 74 Years | 202 (9.7%) | 446 (19.7%) |
| 75 Years and over | 210 (18.7%) | 597 (33.5%) |
Disability Class: Self-Care Difficulty
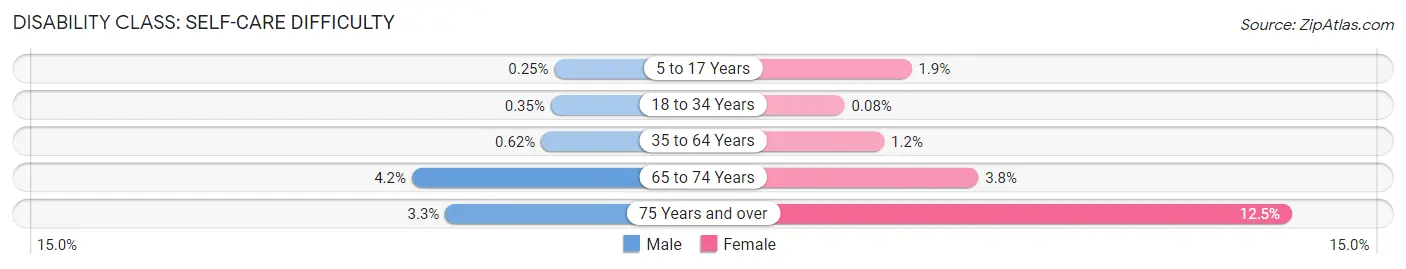
| Age Bracket | Male | Female |
| 5 to 17 Years | 15 (0.3%) | 116 (1.9%) |
| 18 to 34 Years | 25 (0.4%) | 6 (0.1%) |
| 35 to 64 Years | 67 (0.6%) | 125 (1.2%) |
| 65 to 74 Years | 88 (4.2%) | 86 (3.8%) |
| 75 Years and over | 37 (3.3%) | 223 (12.5%) |
Technology Access in Taylorsville
Computing Device Access in Taylorsville
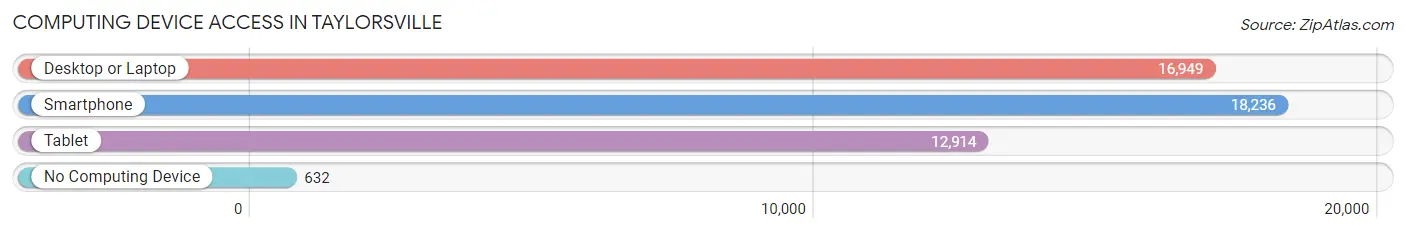
| Device Type | # Households | % Households |
| Desktop or Laptop | 16,949 | 84.7% |
| Smartphone | 18,236 | 91.2% |
| Tablet | 12,914 | 64.6% |
| No Computing Device | 632 | 3.2% |
| Total | 20,003 | 100.0% |
Internet Access in Taylorsville
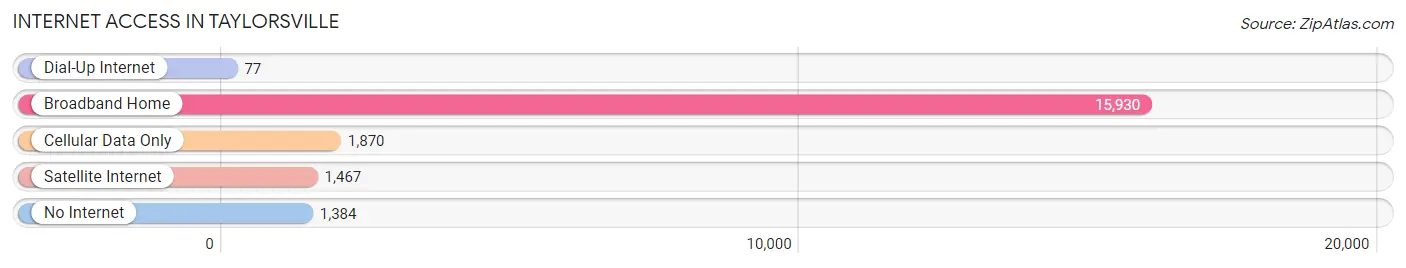
| Internet Type | # Households | % Households |
| Dial-Up Internet | 77 | 0.4% |
| Broadband Home | 15,930 | 79.6% |
| Cellular Data Only | 1,870 | 9.3% |
| Satellite Internet | 1,467 | 7.3% |
| No Internet | 1,384 | 6.9% |
| Total | 20,003 | 100.0% |
Taylorsville Summary
Taylorsville is a city located in Salt Lake County, Utah, United States. It is part of the Salt Lake City metropolitan area. The population was 58,657 at the 2010 census. Taylorsville was incorporated in 1996 from the consolidation of three unincorporated areas, including Bennion, Taylorsville, and Kearns.
History
Taylorsville was first settled in 1848 by James and Mary Taylor. The Taylors were among the first settlers in the Salt Lake Valley. They were sent by Brigham Young to establish a settlement in the area. The Taylors built a log cabin and began farming the land. The area was known as Taylorsville for many years before it was officially incorporated in 1996.
Geography
Taylorsville is located in the Salt Lake Valley at an elevation of 4,400 feet (1,341 m). It is bordered by West Valley City to the north, West Jordan to the east, Murray to the south, and Kearns to the west. The city covers an area of 8.5 square miles (22 km2).
The city is located in the Wasatch Front, a region of the Great Basin that stretches along the Wasatch Mountains from central Utah to the Idaho border. The Wasatch Front is home to some of the most populous cities in the state, including Salt Lake City, Ogden, and Provo.
Climate
Taylorsville has a semi-arid climate, with hot summers and cold winters. The average annual temperature is 50.2 °F (10.1 °C). The average high temperature in July is 90.2 °F (32.3 °C), and the average low temperature in January is 19.2 °F (-7.1 °C). The average annual precipitation is 17.2 inches (437 mm).
Economy
Taylorsville is home to a variety of businesses, including retail stores, restaurants, and medical facilities. The city is also home to several large employers, including the University of Utah Health Care, Intermountain Healthcare, and the Salt Lake County Sheriff's Office.
Demographics
As of the 2010 census, there were 58,657 people, 19,845 households, and 15,845 families living in Taylorsville. The population density was 6,890.3 people per square mile (2,665.2/km2). The racial makeup of the city was 73.2% White, 4.2% African American, 0.7% Native American, 5.3% Asian, 0.3% Pacific Islander, 11.7% from other races, and 4.4% from two or more races. Hispanic or Latino of any race were 22.3% of the population.
The median income for a household in Taylorsville was $50,945, and the median income for a family was $58,945. Males had a median income of $41,945 versus $30,945 for females. The per capita income for the city was $21,945. About 6.7% of families and 8.7% of the population were below the poverty line, including 11.2% of those under age 18 and 6.2% of those age 65 or over.
Common Questions
What is Per Capita Income in Taylorsville?
Per Capita income in Taylorsville is $33,178.
What is the Median Family Income in Taylorsville?
Median Family Income in Taylorsville is $93,445.
What is the Median Household income in Taylorsville?
Median Household Income in Taylorsville is $81,417.
What is Income or Wage Gap in Taylorsville?
Income or Wage Gap in Taylorsville is 27.7%.
Women in Taylorsville earn 72.3 cents for every dollar earned by a man.
What is Family Income Deficit in Taylorsville?
Family Income Deficit in Taylorsville is $12,562.
Families that are below poverty line in Taylorsville earn $12,562 less on average than the poverty threshold level.
What is Inequality or Gini Index in Taylorsville?
Inequality or Gini Index in Taylorsville is 0.37.
What is the Total Population of Taylorsville?
Total Population of Taylorsville is 59,729.
What is the Total Male Population of Taylorsville?
Total Male Population of Taylorsville is 29,239.
What is the Total Female Population of Taylorsville?
Total Female Population of Taylorsville is 30,490.
What is the Ratio of Males per 100 Females in Taylorsville?
There are 95.90 Males per 100 Females in Taylorsville.
What is the Ratio of Females per 100 Males in Taylorsville?
There are 104.28 Females per 100 Males in Taylorsville.
What is the Median Population Age in Taylorsville?
Median Population Age in Taylorsville is 33.7 Years.
What is the Average Family Size in Taylorsville
Average Family Size in Taylorsville is 3.5 People.
What is the Average Household Size in Taylorsville
Average Household Size in Taylorsville is 3.0 People.
How Large is the Labor Force in Taylorsville?
There are 31,876 People in the Labor Forcein in Taylorsville.
What is the Percentage of People in the Labor Force in Taylorsville?
71.1% of People are in the Labor Force in Taylorsville.
What is the Unemployment Rate in Taylorsville?
Unemployment Rate in Taylorsville is 4.5%.