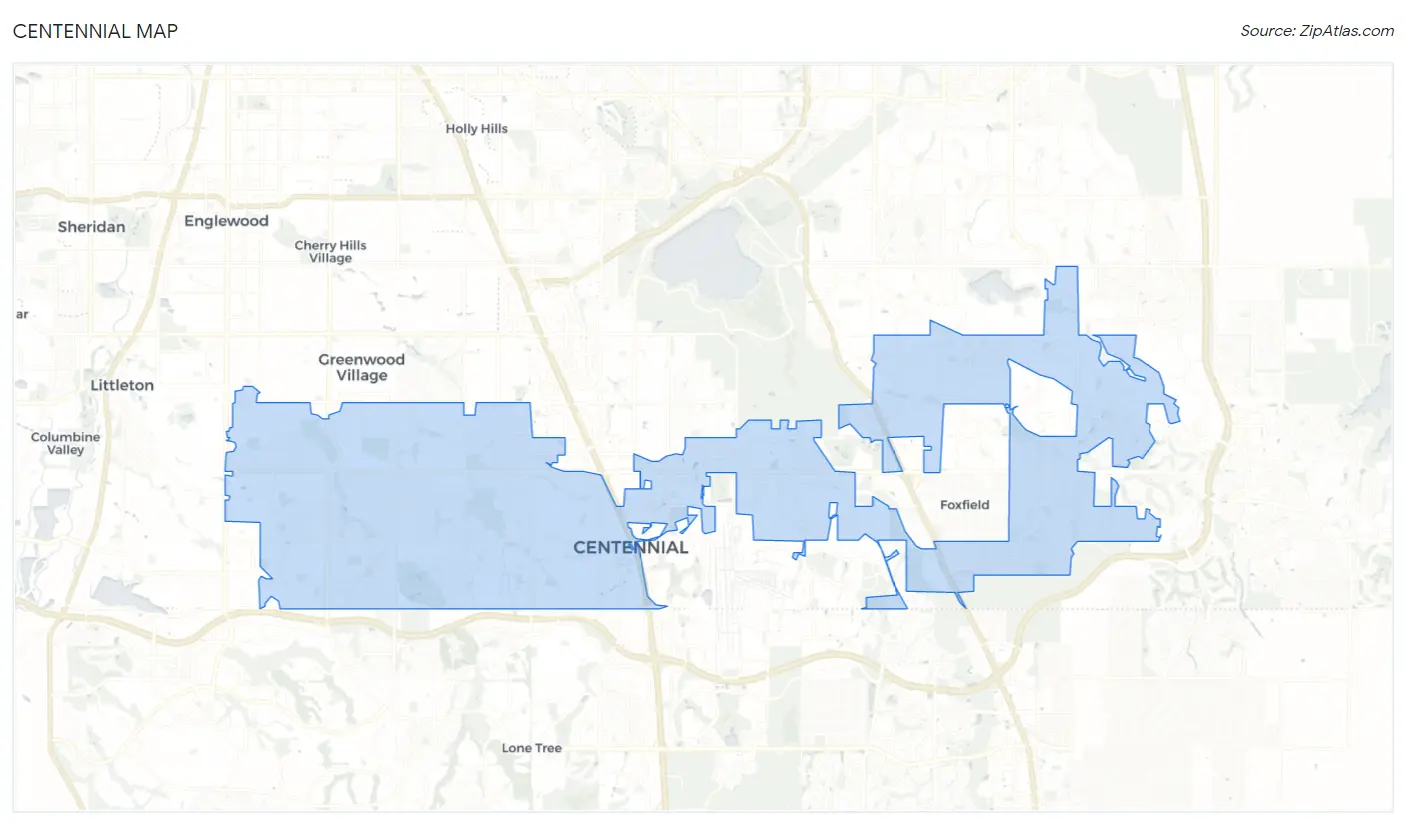
Centennial, CO Map & Demographics
Centennial Map
Centennial Overview
$60,727
PER CAPITA INCOME
$147,309
AVG FAMILY INCOME
$124,617
AVG HOUSEHOLD INCOME
32.2%
WAGE / INCOME GAP [ % ]
67.8¢/ $1
WAGE / INCOME GAP [ $ ]
0.41
INEQUALITY / GINI INDEX
107,702
TOTAL POPULATION
54,230
MALE POPULATION
53,472
FEMALE POPULATION
101.42
MALES / 100 FEMALES
98.60
FEMALES / 100 MALES
41.6
MEDIAN AGE
3.0
AVG FAMILY SIZE
2.6
AVG HOUSEHOLD SIZE
59,995
LABOR FORCE [ PEOPLE ]
69.2%
PERCENT IN LABOR FORCE
3.4%
UNEMPLOYMENT RATE
Income in Centennial
Income Overview in Centennial
Per Capita Income in Centennial is $60,727, while median incomes of families and households are $147,309 and $124,617 respectively.
| Characteristic | Number | Measure |
| Per Capita Income | 107,702 | $60,727 |
| Median Family Income | 29,861 | $147,309 |
| Mean Family Income | 29,861 | $178,581 |
| Median Household Income | 40,952 | $124,617 |
| Mean Household Income | 40,952 | $156,825 |
| Income Deficit | 29,861 | $0 |
| Wage / Income Gap (%) | 107,702 | 32.18% |
| Wage / Income Gap ($) | 107,702 | 67.82¢ per $1 |
| Gini / Inequality Index | 107,702 | 0.41 |
Earnings by Sex in Centennial
Average Earnings in Centennial are $62,955, $75,490 for men and $51,196 for women, a difference of 32.2%.
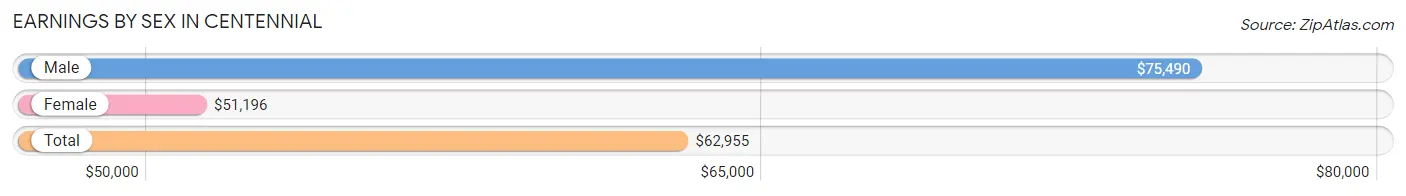
| Sex | Number | Average Earnings |
| Male | 34,040 (53.6%) | $75,490 |
| Female | 29,513 (46.4%) | $51,196 |
| Total | 63,553 (100.0%) | $62,955 |
Earnings by Sex by Income Bracket in Centennial
The most common earnings brackets in Centennial are $100,000+ for men (12,444 | 36.6%) and $100,000+ for women (5,828 | 19.8%).
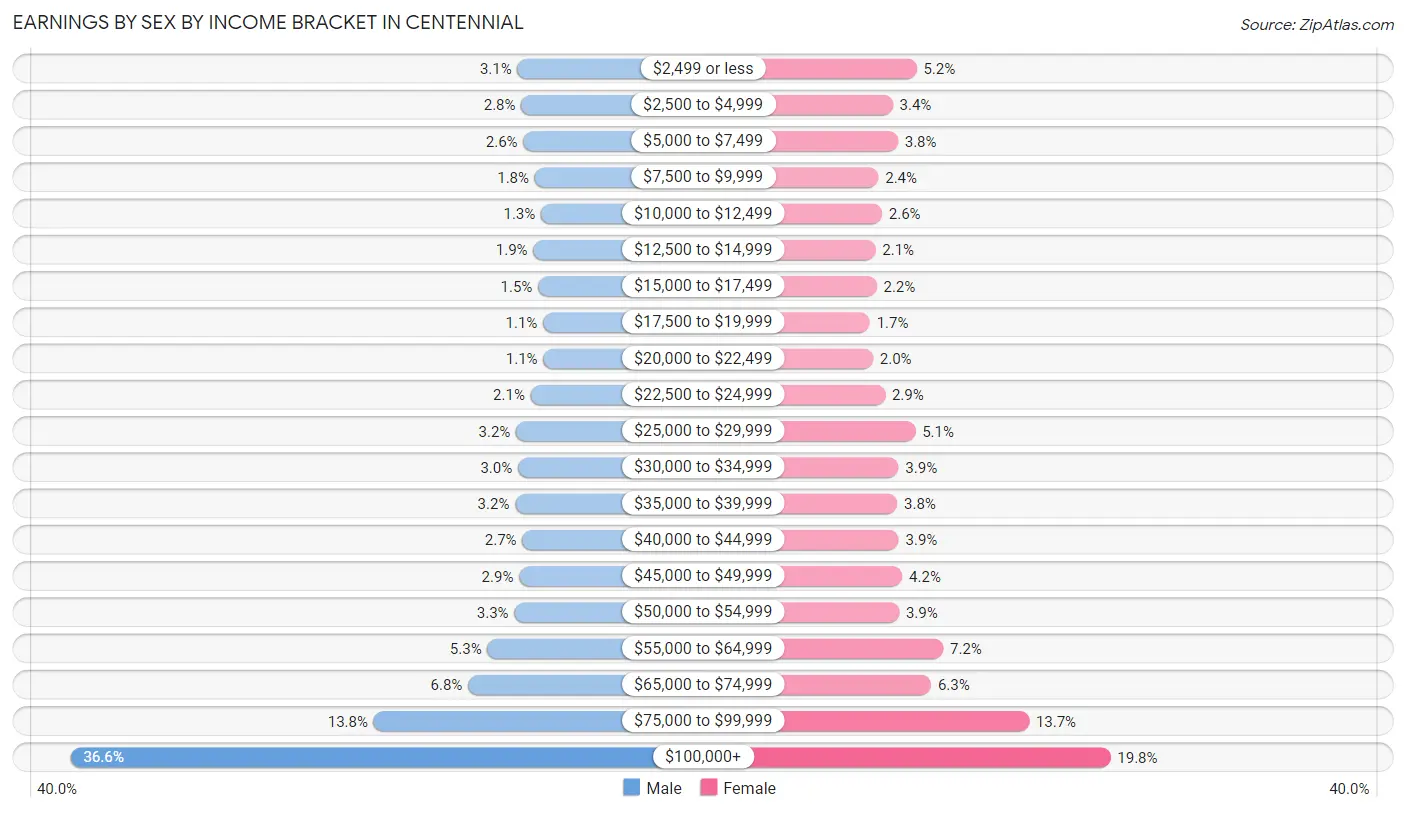
| Income | Male | Female |
| $2,499 or less | 1,043 (3.1%) | 1,541 (5.2%) |
| $2,500 to $4,999 | 943 (2.8%) | 1,011 (3.4%) |
| $5,000 to $7,499 | 893 (2.6%) | 1,128 (3.8%) |
| $7,500 to $9,999 | 600 (1.8%) | 696 (2.4%) |
| $10,000 to $12,499 | 438 (1.3%) | 777 (2.6%) |
| $12,500 to $14,999 | 636 (1.9%) | 632 (2.1%) |
| $15,000 to $17,499 | 514 (1.5%) | 657 (2.2%) |
| $17,500 to $19,999 | 387 (1.1%) | 509 (1.7%) |
| $20,000 to $22,499 | 382 (1.1%) | 575 (1.9%) |
| $22,500 to $24,999 | 706 (2.1%) | 845 (2.9%) |
| $25,000 to $29,999 | 1,076 (3.2%) | 1,514 (5.1%) |
| $30,000 to $34,999 | 1,029 (3.0%) | 1,143 (3.9%) |
| $35,000 to $39,999 | 1,099 (3.2%) | 1,113 (3.8%) |
| $40,000 to $44,999 | 915 (2.7%) | 1,146 (3.9%) |
| $45,000 to $49,999 | 996 (2.9%) | 1,225 (4.2%) |
| $50,000 to $54,999 | 1,121 (3.3%) | 1,153 (3.9%) |
| $55,000 to $64,999 | 1,808 (5.3%) | 2,130 (7.2%) |
| $65,000 to $74,999 | 2,301 (6.8%) | 1,861 (6.3%) |
| $75,000 to $99,999 | 4,709 (13.8%) | 4,029 (13.7%) |
| $100,000+ | 12,444 (36.6%) | 5,828 (19.8%) |
| Total | 34,040 (100.0%) | 29,513 (100.0%) |
Earnings by Sex by Educational Attainment in Centennial
Average earnings in Centennial are $84,865 for men and $57,251 for women, a difference of 32.5%. Men with an educational attainment of graduate degree enjoy the highest average annual earnings of $116,490, while those with high school diploma education earn the least with $46,396. Women with an educational attainment of graduate degree earn the most with the average annual earnings of $77,534, while those with less than high school education have the smallest earnings of $28,400.
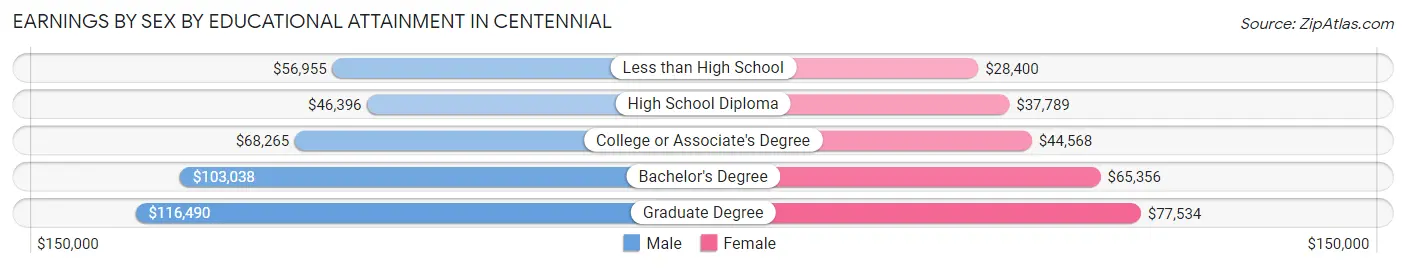
| Educational Attainment | Male Income | Female Income |
| Less than High School | $56,955 | $28,400 |
| High School Diploma | $46,396 | $37,789 |
| College or Associate's Degree | $68,265 | $44,568 |
| Bachelor's Degree | $103,038 | $65,356 |
| Graduate Degree | $116,490 | $77,534 |
| Total | $84,865 | $57,251 |
Family Income in Centennial
Family Income Brackets in Centennial
According to the Centennial family income data, there are 9,227 families falling into the $200,000+ income range, which is the most common income bracket and makes up 30.9% of all families. Conversely, the $10,000 to $14,999 income bracket is the least frequent group with only 149 families (0.5%) belonging to this category.
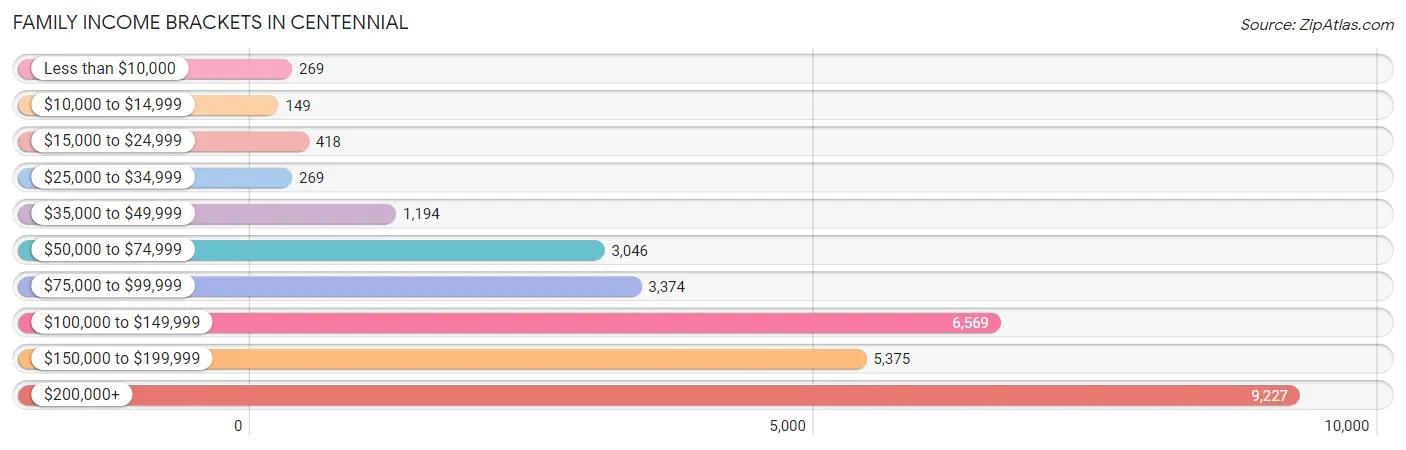
| Income Bracket | # Families | % Families |
| Less than $10,000 | 269 | 0.9% |
| $10,000 to $14,999 | 149 | 0.5% |
| $15,000 to $24,999 | 418 | 1.4% |
| $25,000 to $34,999 | 269 | 0.9% |
| $35,000 to $49,999 | 1,194 | 4.0% |
| $50,000 to $74,999 | 3,046 | 10.2% |
| $75,000 to $99,999 | 3,374 | 11.3% |
| $100,000 to $149,999 | 6,569 | 22.0% |
| $150,000 to $199,999 | 5,375 | 18.0% |
| $200,000+ | 9,227 | 30.9% |
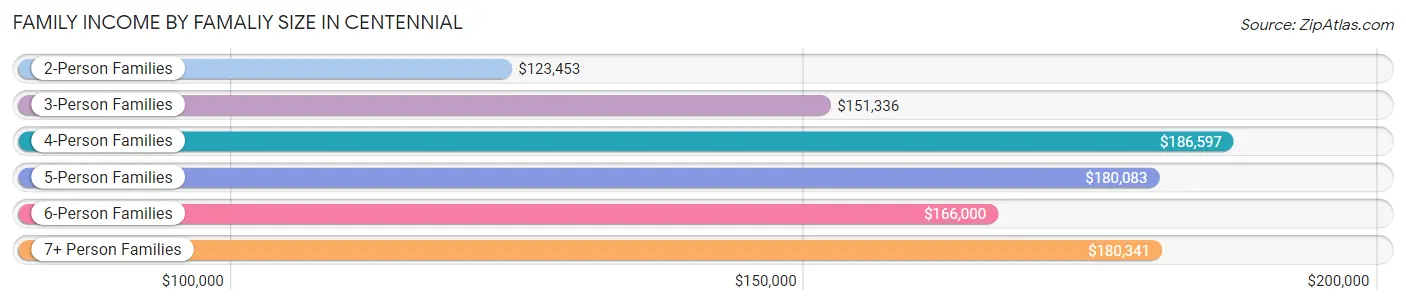
Family Income by Famaliy Size in Centennial
4-person families (6,128 | 20.5%) account for the highest median family income in Centennial with $186,597 per family, while 2-person families (13,752 | 46.1%) have the highest median income of $61,726 per family member.
| Income Bracket | # Families | Median Income |
| 2-Person Families | 13,752 (46.1%) | $123,453 |
| 3-Person Families | 6,778 (22.7%) | $151,336 |
| 4-Person Families | 6,128 (20.5%) | $186,597 |
| 5-Person Families | 2,508 (8.4%) | $180,083 |
| 6-Person Families | 414 (1.4%) | $166,000 |
| 7+ Person Families | 281 (0.9%) | $180,341 |
| Total | 29,861 (100.0%) | $147,309 |
Family Income by Number of Earners in Centennial
The median family income in Centennial is $147,309, with families comprising 3+ earners (3,887) having the highest median family income of $199,209, while families with no earners (3,538) have the lowest median family income of $85,775, accounting for 13.0% and 11.8% of families, respectively.
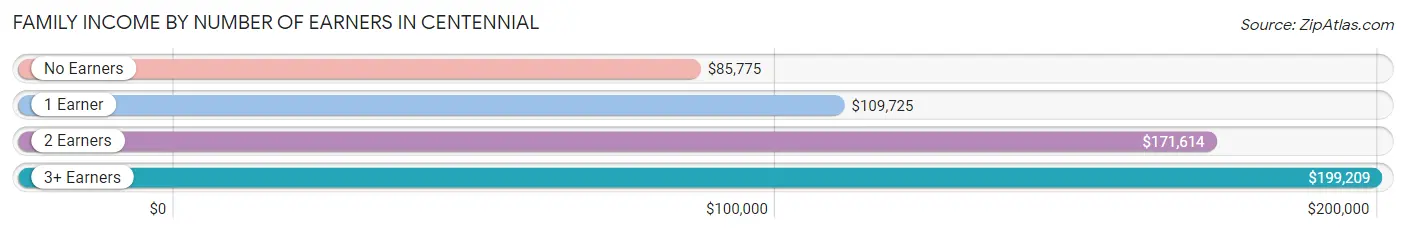
| Number of Earners | # Families | Median Income |
| No Earners | 3,538 (11.8%) | $85,775 |
| 1 Earner | 7,850 (26.3%) | $109,725 |
| 2 Earners | 14,586 (48.8%) | $171,614 |
| 3+ Earners | 3,887 (13.0%) | $199,209 |
| Total | 29,861 (100.0%) | $147,309 |
Household Income in Centennial
Household Income Brackets in Centennial
With 10,238 households falling in the category, the $200,000+ income range is the most frequent in Centennial, accounting for 25.0% of all households. In contrast, only 410 households (1.0%) fall into the $10,000 to $14,999 income bracket, making it the least populous group.
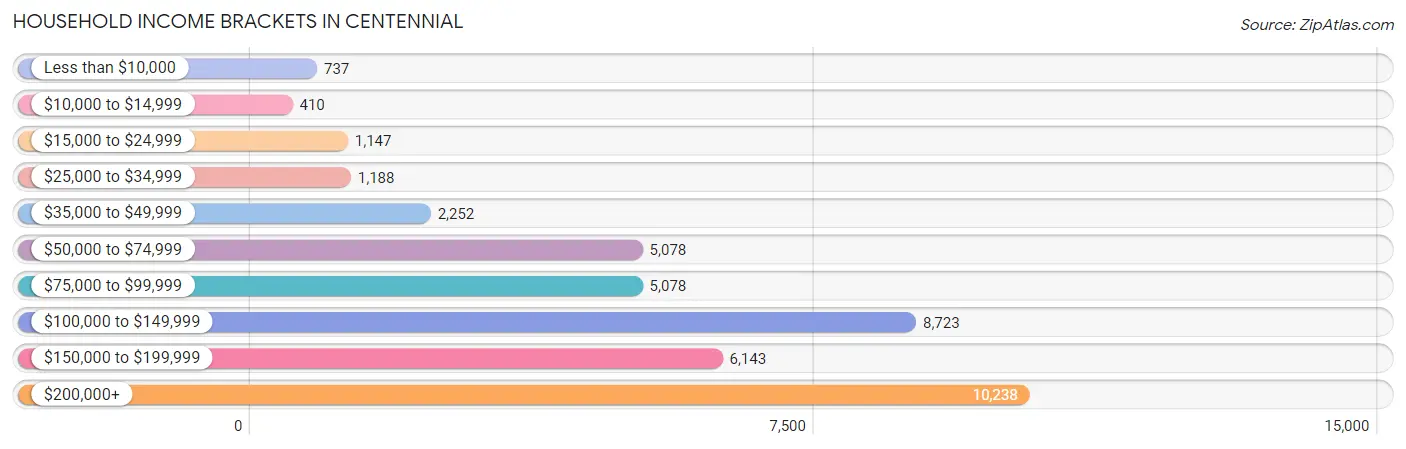
| Income Bracket | # Households | % Households |
| Less than $10,000 | 737 | 1.8% |
| $10,000 to $14,999 | 410 | 1.0% |
| $15,000 to $24,999 | 1,147 | 2.8% |
| $25,000 to $34,999 | 1,188 | 2.9% |
| $35,000 to $49,999 | 2,252 | 5.5% |
| $50,000 to $74,999 | 5,078 | 12.4% |
| $75,000 to $99,999 | 5,078 | 12.4% |
| $100,000 to $149,999 | 8,723 | 21.3% |
| $150,000 to $199,999 | 6,143 | 15.0% |
| $200,000+ | 10,238 | 25.0% |
Household Income by Householder Age in Centennial
The median household income in Centennial is $124,617, with the highest median household income of $147,081 found in the 45 to 64 years age bracket for the primary householder. A total of 15,882 households (38.8%) fall into this category. Meanwhile, the 15 to 24 years age bracket for the primary householder has the lowest median household income of $82,368, with 778 households (1.9%) in this group.
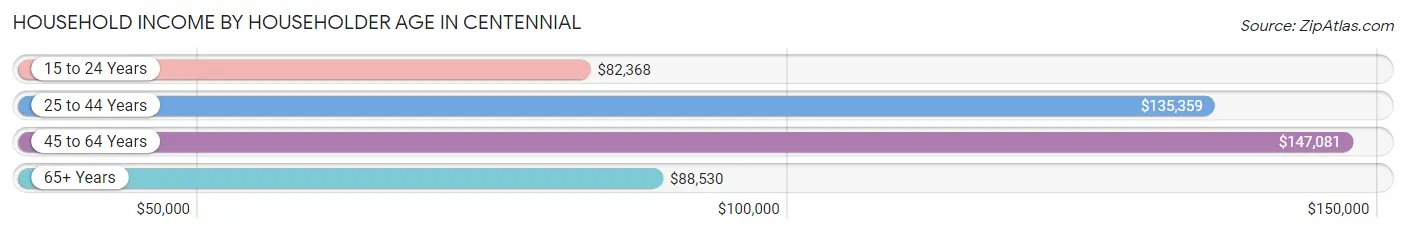
| Income Bracket | # Households | Median Income |
| 15 to 24 Years | 778 (1.9%) | $82,368 |
| 25 to 44 Years | 12,955 (31.6%) | $135,359 |
| 45 to 64 Years | 15,882 (38.8%) | $147,081 |
| 65+ Years | 11,337 (27.7%) | $88,530 |
| Total | 40,952 (100.0%) | $124,617 |
Poverty in Centennial
Income Below Poverty by Sex and Age in Centennial
With 2.7% poverty level for males and 3.5% for females among the residents of Centennial, 25 to 34 year old males and 18 to 24 year old females are the most vulnerable to poverty, with 284 males (4.4%) and 213 females (6.8%) in their respective age groups living below the poverty level.
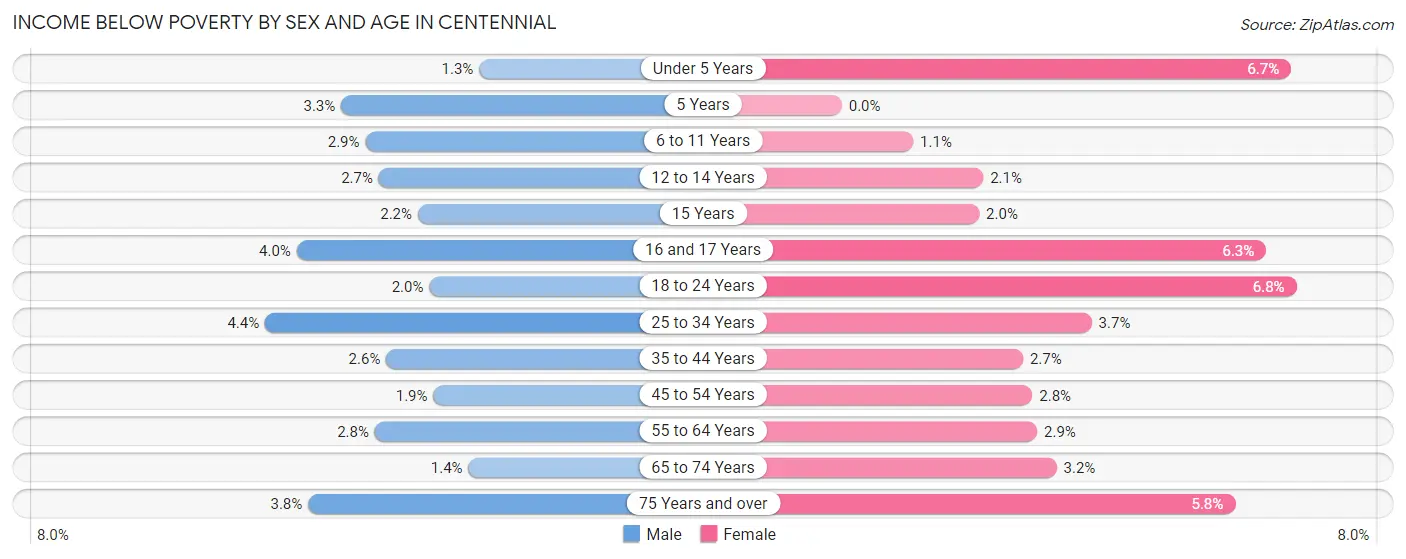
| Age Bracket | Male | Female |
| Under 5 Years | 36 (1.3%) | 178 (6.7%) |
| 5 Years | 32 (3.3%) | 0 (0.0%) |
| 6 to 11 Years | 117 (2.9%) | 44 (1.1%) |
| 12 to 14 Years | 66 (2.7%) | 36 (2.1%) |
| 15 Years | 15 (2.2%) | 15 (2.0%) |
| 16 and 17 Years | 60 (4.0%) | 104 (6.3%) |
| 18 to 24 Years | 73 (2.0%) | 213 (6.8%) |
| 25 to 34 Years | 284 (4.4%) | 215 (3.7%) |
| 35 to 44 Years | 201 (2.6%) | 214 (2.7%) |
| 45 to 54 Years | 140 (1.9%) | 195 (2.8%) |
| 55 to 64 Years | 194 (2.8%) | 219 (2.9%) |
| 65 to 74 Years | 79 (1.4%) | 188 (3.2%) |
| 75 Years and over | 121 (3.8%) | 245 (5.8%) |
| Total | 1,418 (2.7%) | 1,866 (3.5%) |
Income Above Poverty by Sex and Age in Centennial
According to the poverty statistics in Centennial, males aged under 5 years and females aged 5 years are the age groups that are most secure financially, with 98.8% of males and 100.0% of females in these age groups living above the poverty line.
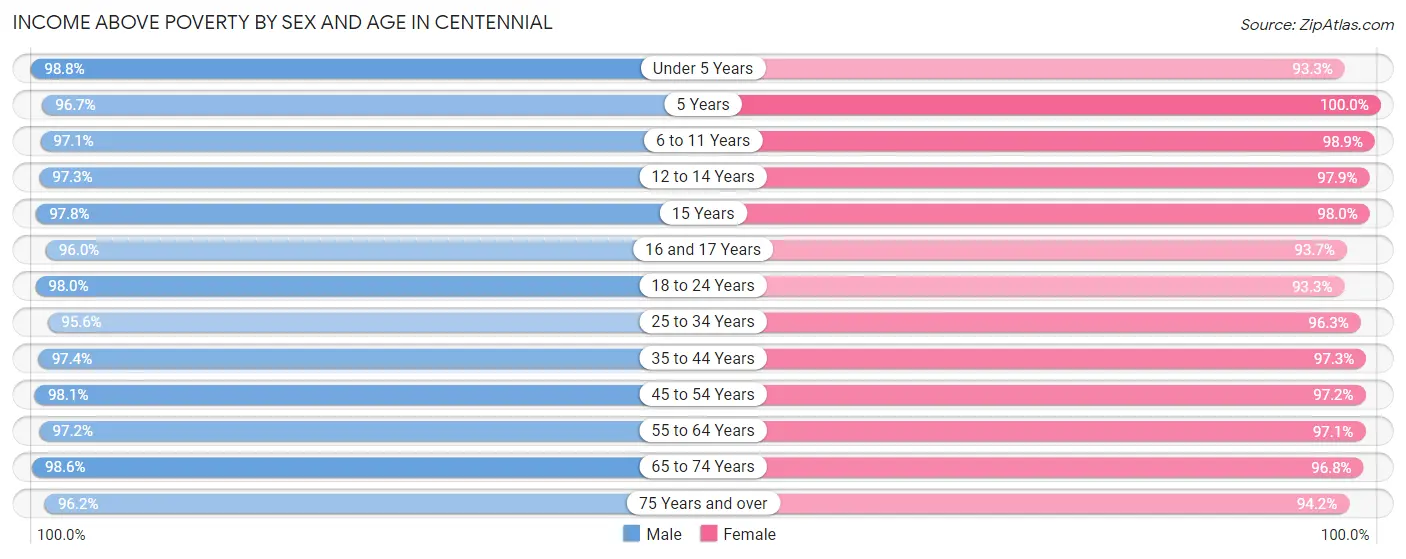
| Age Bracket | Male | Female |
| Under 5 Years | 2,844 (98.8%) | 2,490 (93.3%) |
| 5 Years | 939 (96.7%) | 689 (100.0%) |
| 6 to 11 Years | 3,864 (97.1%) | 4,116 (98.9%) |
| 12 to 14 Years | 2,344 (97.3%) | 1,675 (97.9%) |
| 15 Years | 680 (97.8%) | 719 (98.0%) |
| 16 and 17 Years | 1,456 (96.0%) | 1,548 (93.7%) |
| 18 to 24 Years | 3,594 (98.0%) | 2,944 (93.2%) |
| 25 to 34 Years | 6,134 (95.6%) | 5,584 (96.3%) |
| 35 to 44 Years | 7,456 (97.4%) | 7,756 (97.3%) |
| 45 to 54 Years | 7,115 (98.1%) | 6,686 (97.2%) |
| 55 to 64 Years | 6,737 (97.2%) | 7,335 (97.1%) |
| 65 to 74 Years | 5,540 (98.6%) | 5,700 (96.8%) |
| 75 Years and over | 3,071 (96.2%) | 3,952 (94.2%) |
| Total | 51,774 (97.3%) | 51,194 (96.5%) |
Income Below Poverty Among Married-Couple Families in Centennial
The poverty statistics for married-couple families in Centennial show that 1.1% or 278 of the total 25,147 families live below the poverty line. Families with 3 or 4 children have the highest poverty rate of 1.5%, comprising of 29 families. On the other hand, families with 5 or more children have the lowest poverty rate of 0.0%, which includes 0 families.
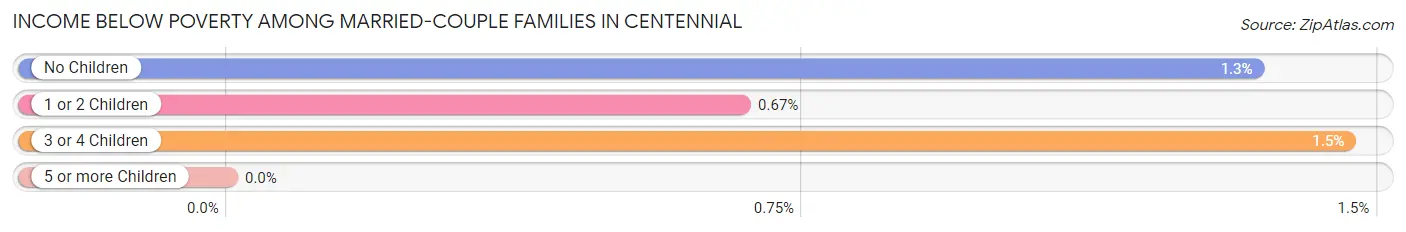
| Children | Above Poverty | Below Poverty |
| No Children | 13,931 (98.7%) | 189 (1.3%) |
| 1 or 2 Children | 8,845 (99.3%) | 60 (0.7%) |
| 3 or 4 Children | 1,955 (98.5%) | 29 (1.5%) |
| 5 or more Children | 138 (100.0%) | 0 (0.0%) |
| Total | 24,869 (98.9%) | 278 (1.1%) |
Income Below Poverty Among Single-Parent Households in Centennial
According to the poverty data in Centennial, 0.6% or 9 single-father households and 9.5% or 301 single-mother households are living below the poverty line. Among single-father households, those with 1 or 2 children have the highest poverty rate, with 9 households (1.3%) experiencing poverty. Likewise, among single-mother households, those with 1 or 2 children have the highest poverty rate, with 255 households (14.4%) falling below the poverty line.
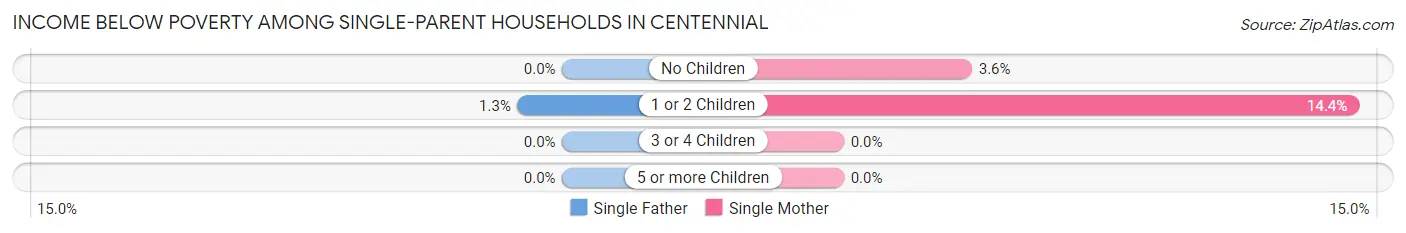
| Children | Single Father | Single Mother |
| No Children | 0 (0.0%) | 46 (3.6%) |
| 1 or 2 Children | 9 (1.3%) | 255 (14.4%) |
| 3 or 4 Children | 0 (0.0%) | 0 (0.0%) |
| 5 or more Children | 0 (0.0%) | 0 (0.0%) |
| Total | 9 (0.6%) | 301 (9.5%) |
Income Below Poverty Among Married-Couple vs Single-Parent Households in Centennial
The poverty data for Centennial shows that 278 of the married-couple family households (1.1%) and 310 of the single-parent households (6.6%) are living below the poverty level. Within the married-couple family households, those with 3 or 4 children have the highest poverty rate, with 29 households (1.5%) falling below the poverty line. Among the single-parent households, those with 1 or 2 children have the highest poverty rate, with 264 household (10.6%) living below poverty.
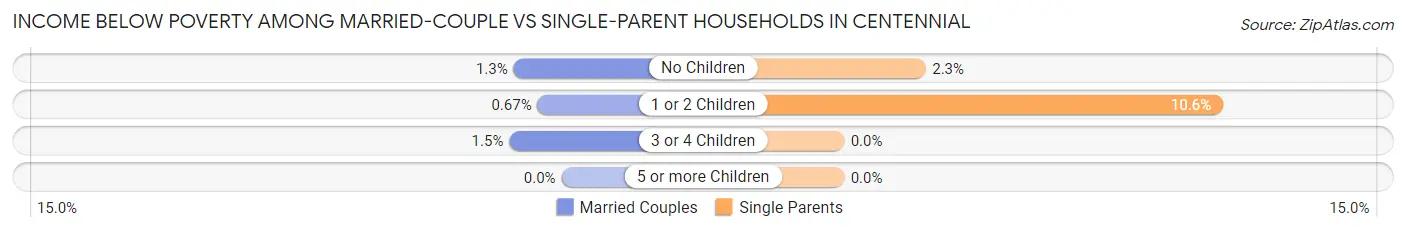
| Children | Married-Couple Families | Single-Parent Households |
| No Children | 189 (1.3%) | 46 (2.3%) |
| 1 or 2 Children | 60 (0.7%) | 264 (10.6%) |
| 3 or 4 Children | 29 (1.5%) | 0 (0.0%) |
| 5 or more Children | 0 (0.0%) | 0 (0.0%) |
| Total | 278 (1.1%) | 310 (6.6%) |
Race in Centennial
The most populous races in Centennial are White / Caucasian (87,724 | 81.5%), Hispanic or Latino (9,799 | 9.1%), and Two or more Races (8,173 | 7.6%).
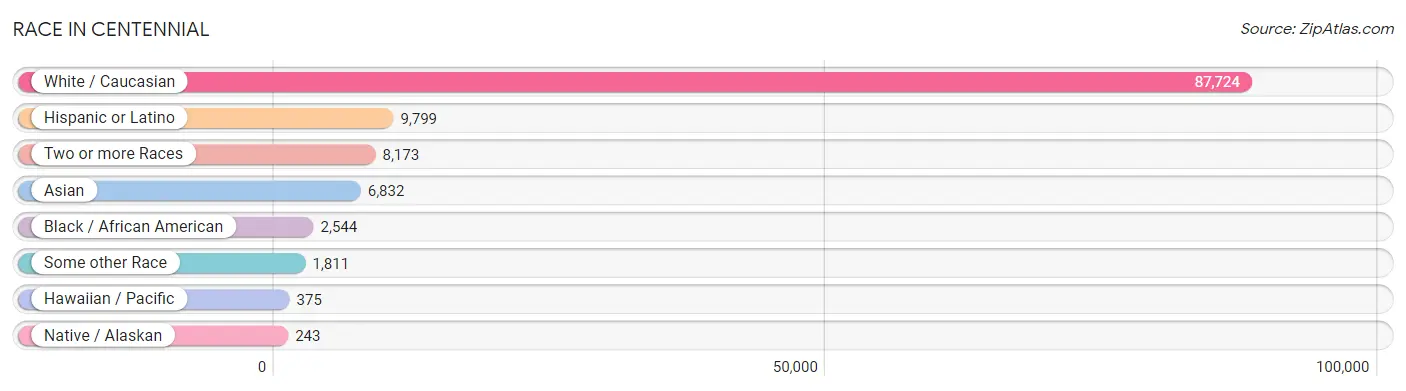
| Race | # Population | % Population |
| Asian | 6,832 | 6.3% |
| Black / African American | 2,544 | 2.4% |
| Hawaiian / Pacific | 375 | 0.4% |
| Hispanic or Latino | 9,799 | 9.1% |
| Native / Alaskan | 243 | 0.2% |
| White / Caucasian | 87,724 | 81.5% |
| Two or more Races | 8,173 | 7.6% |
| Some other Race | 1,811 | 1.7% |
| Total | 107,702 | 100.0% |
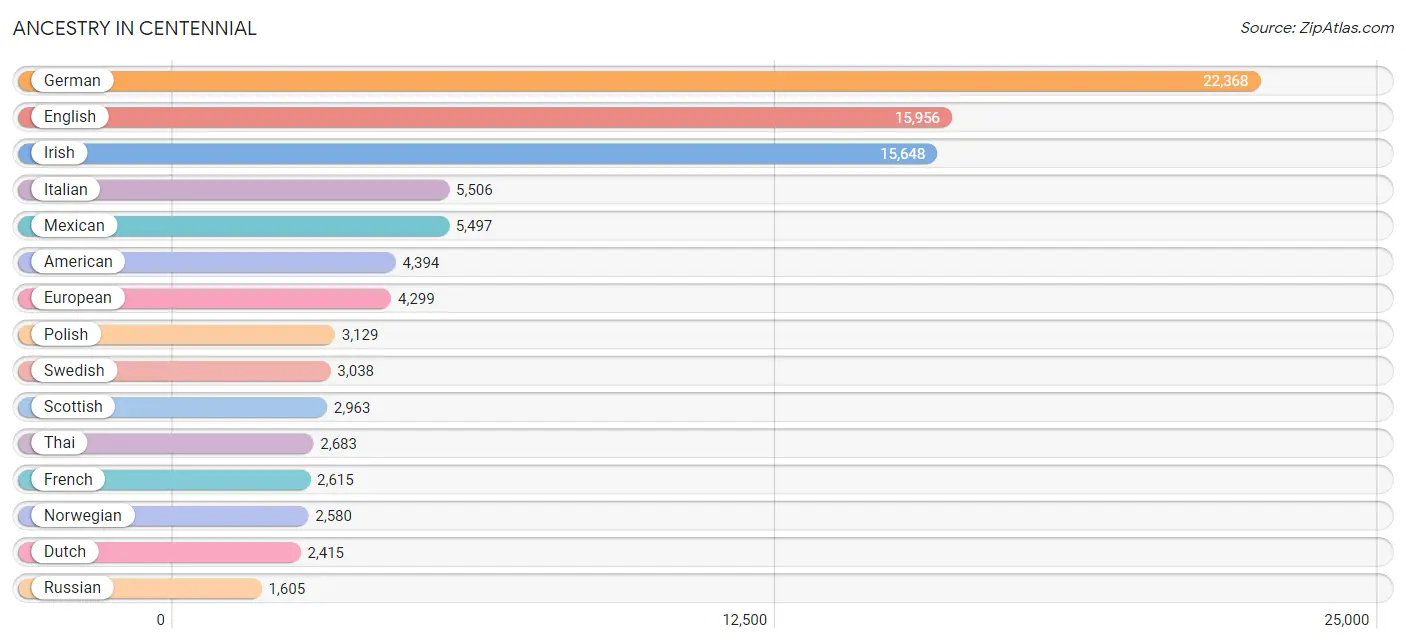
Ancestry in Centennial
The most populous ancestries reported in Centennial are German (22,368 | 20.8%), English (15,956 | 14.8%), Irish (15,648 | 14.5%), Italian (5,506 | 5.1%), and Mexican (5,497 | 5.1%), together accounting for 60.3% of all Centennial residents.
| Ancestry | # Population | % Population |
| Afghan | 19 | 0.0% |
| African | 147 | 0.1% |
| Albanian | 9 | 0.0% |
| American | 4,394 | 4.1% |
| Apache | 64 | 0.1% |
| Arab | 623 | 0.6% |
| Arapaho | 62 | 0.1% |
| Argentinean | 147 | 0.1% |
| Armenian | 205 | 0.2% |
| Australian | 69 | 0.1% |
| Austrian | 503 | 0.5% |
| Basque | 6 | 0.0% |
| Belgian | 118 | 0.1% |
| Bhutanese | 707 | 0.7% |
| Blackfeet | 88 | 0.1% |
| Bolivian | 8 | 0.0% |
| Brazilian | 61 | 0.1% |
| British | 848 | 0.8% |
| Bulgarian | 190 | 0.2% |
| Burmese | 1,315 | 1.2% |
| Cajun | 64 | 0.1% |
| Cambodian | 34 | 0.0% |
| Canadian | 481 | 0.4% |
| Celtic | 26 | 0.0% |
| Central American | 452 | 0.4% |
| Central American Indian | 102 | 0.1% |
| Cherokee | 374 | 0.4% |
| Chickasaw | 70 | 0.1% |
| Chilean | 112 | 0.1% |
| Chippewa | 25 | 0.0% |
| Choctaw | 44 | 0.0% |
| Colombian | 184 | 0.2% |
| Costa Rican | 94 | 0.1% |
| Croatian | 183 | 0.2% |
| Cuban | 101 | 0.1% |
| Czech | 849 | 0.8% |
| Czechoslovakian | 129 | 0.1% |
| Danish | 913 | 0.9% |
| Dominican | 36 | 0.0% |
| Dutch | 2,415 | 2.2% |
| Eastern European | 700 | 0.6% |
| Ecuadorian | 181 | 0.2% |
| Egyptian | 75 | 0.1% |
| English | 15,956 | 14.8% |
| Estonian | 21 | 0.0% |
| Ethiopian | 247 | 0.2% |
| European | 4,299 | 4.0% |
| Filipino | 143 | 0.1% |
| Finnish | 211 | 0.2% |
| French | 2,615 | 2.4% |
| French Canadian | 459 | 0.4% |
| German | 22,368 | 20.8% |
| German Russian | 24 | 0.0% |
| Ghanaian | 83 | 0.1% |
| Greek | 636 | 0.6% |
| Guamanian / Chamorro | 1 | 0.0% |
| Guatemalan | 65 | 0.1% |
| Haitian | 25 | 0.0% |
| Honduran | 108 | 0.1% |
| Hungarian | 481 | 0.4% |
| Icelander | 36 | 0.0% |
| Indian (Asian) | 1,565 | 1.5% |
| Inupiat | 6 | 0.0% |
| Iranian | 268 | 0.3% |
| Iraqi | 18 | 0.0% |
| Irish | 15,648 | 14.5% |
| Iroquois | 48 | 0.0% |
| Israeli | 86 | 0.1% |
| Italian | 5,506 | 5.1% |
| Jamaican | 33 | 0.0% |
| Japanese | 56 | 0.1% |
| Kenyan | 21 | 0.0% |
| Korean | 780 | 0.7% |
| Laotian | 191 | 0.2% |
| Latvian | 22 | 0.0% |
| Lebanese | 333 | 0.3% |
| Liberian | 26 | 0.0% |
| Lithuanian | 169 | 0.2% |
| Luxembourger | 48 | 0.0% |
| Malaysian | 16 | 0.0% |
| Maltese | 14 | 0.0% |
| Marshallese | 6 | 0.0% |
| Mexican | 5,497 | 5.1% |
| Mexican American Indian | 42 | 0.0% |
| Moroccan | 122 | 0.1% |
| Native Hawaiian | 182 | 0.2% |
| Navajo | 23 | 0.0% |
| Nicaraguan | 23 | 0.0% |
| Nigerian | 75 | 0.1% |
| Northern European | 315 | 0.3% |
| Norwegian | 2,580 | 2.4% |
| Pakistani | 77 | 0.1% |
| Palestinian | 18 | 0.0% |
| Panamanian | 91 | 0.1% |
| Pennsylvania German | 10 | 0.0% |
| Peruvian | 207 | 0.2% |
| Polish | 3,129 | 2.9% |
| Portuguese | 155 | 0.1% |
| Potawatomi | 15 | 0.0% |
| Pueblo | 45 | 0.0% |
| Puerto Rican | 667 | 0.6% |
| Romanian | 223 | 0.2% |
| Russian | 1,605 | 1.5% |
| Salvadoran | 71 | 0.1% |
| Samoan | 172 | 0.2% |
| Scandinavian | 595 | 0.5% |
| Scotch-Irish | 1,141 | 1.1% |
| Scottish | 2,963 | 2.8% |
| Serbian | 18 | 0.0% |
| Sioux | 98 | 0.1% |
| Slavic | 83 | 0.1% |
| Slovak | 441 | 0.4% |
| Slovene | 67 | 0.1% |
| South African | 20 | 0.0% |
| South American | 1,120 | 1.0% |
| Soviet Union | 3 | 0.0% |
| Spaniard | 731 | 0.7% |
| Spanish | 694 | 0.6% |
| Spanish American | 23 | 0.0% |
| Spanish American Indian | 14 | 0.0% |
| Sri Lankan | 1,043 | 1.0% |
| Subsaharan African | 671 | 0.6% |
| Sudanese | 39 | 0.0% |
| Swedish | 3,038 | 2.8% |
| Swiss | 654 | 0.6% |
| Syrian | 8 | 0.0% |
| Thai | 2,683 | 2.5% |
| Tongan | 235 | 0.2% |
| Turkish | 93 | 0.1% |
| Ukrainian | 422 | 0.4% |
| Uruguayan | 29 | 0.0% |
| Ute | 16 | 0.0% |
| Venezuelan | 252 | 0.2% |
| Welsh | 1,143 | 1.1% |
| West Indian | 108 | 0.1% |
| Yugoslavian | 199 | 0.2% | View All 136 Rows |
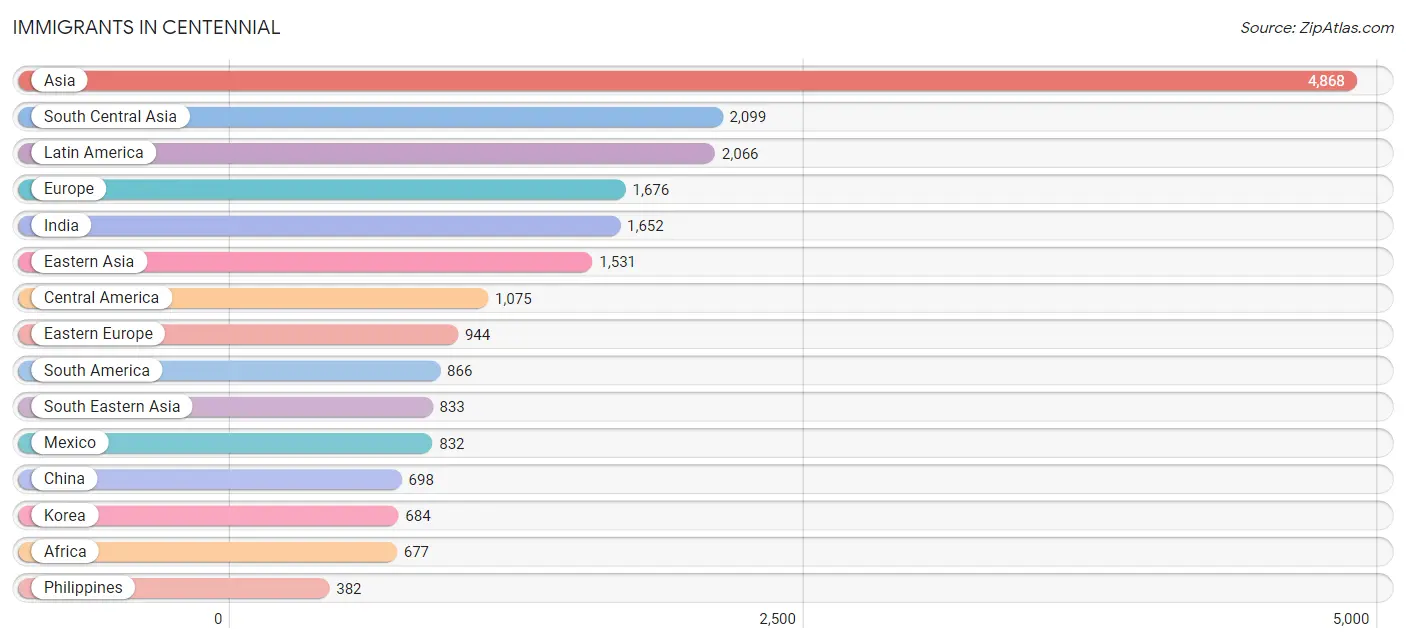
Immigrants in Centennial
The most numerous immigrant groups reported in Centennial came from Asia (4,868 | 4.5%), South Central Asia (2,099 | 1.9%), Latin America (2,066 | 1.9%), Europe (1,676 | 1.6%), and India (1,652 | 1.5%), together accounting for 11.5% of all Centennial residents.
| Immigration Origin | # Population | % Population |
| Afghanistan | 55 | 0.1% |
| Africa | 677 | 0.6% |
| Argentina | 82 | 0.1% |
| Armenia | 40 | 0.0% |
| Asia | 4,868 | 4.5% |
| Australia | 165 | 0.2% |
| Austria | 14 | 0.0% |
| Bangladesh | 35 | 0.0% |
| Belarus | 62 | 0.1% |
| Bosnia and Herzegovina | 88 | 0.1% |
| Brazil | 94 | 0.1% |
| Bulgaria | 116 | 0.1% |
| Cabo Verde | 30 | 0.0% |
| Cambodia | 10 | 0.0% |
| Canada | 291 | 0.3% |
| Caribbean | 125 | 0.1% |
| Central America | 1,075 | 1.0% |
| Chile | 47 | 0.0% |
| China | 698 | 0.6% |
| Colombia | 109 | 0.1% |
| Czechoslovakia | 44 | 0.0% |
| Denmark | 11 | 0.0% |
| Dominican Republic | 25 | 0.0% |
| Eastern Africa | 254 | 0.2% |
| Eastern Asia | 1,531 | 1.4% |
| Eastern Europe | 944 | 0.9% |
| Ecuador | 116 | 0.1% |
| Egypt | 70 | 0.1% |
| El Salvador | 86 | 0.1% |
| England | 144 | 0.1% |
| Ethiopia | 185 | 0.2% |
| Europe | 1,676 | 1.6% |
| France | 23 | 0.0% |
| Germany | 167 | 0.2% |
| Ghana | 95 | 0.1% |
| Greece | 100 | 0.1% |
| Guatemala | 41 | 0.0% |
| Haiti | 25 | 0.0% |
| Honduras | 91 | 0.1% |
| Hong Kong | 24 | 0.0% |
| Hungary | 11 | 0.0% |
| India | 1,652 | 1.5% |
| Indonesia | 41 | 0.0% |
| Iran | 114 | 0.1% |
| Iraq | 11 | 0.0% |
| Ireland | 71 | 0.1% |
| Israel | 21 | 0.0% |
| Italy | 14 | 0.0% |
| Jamaica | 58 | 0.1% |
| Japan | 126 | 0.1% |
| Kazakhstan | 14 | 0.0% |
| Kenya | 69 | 0.1% |
| Korea | 684 | 0.6% |
| Kuwait | 13 | 0.0% |
| Latin America | 2,066 | 1.9% |
| Latvia | 8 | 0.0% |
| Lebanon | 161 | 0.2% |
| Liberia | 57 | 0.1% |
| Lithuania | 15 | 0.0% |
| Malaysia | 7 | 0.0% |
| Mexico | 832 | 0.8% |
| Moldova | 13 | 0.0% |
| Morocco | 62 | 0.1% |
| Nepal | 95 | 0.1% |
| Netherlands | 36 | 0.0% |
| Nicaragua | 25 | 0.0% |
| Nigeria | 24 | 0.0% |
| Northern Africa | 177 | 0.2% |
| Northern Europe | 362 | 0.3% |
| Oceania | 220 | 0.2% |
| Pakistan | 19 | 0.0% |
| Peru | 99 | 0.1% |
| Philippines | 382 | 0.4% |
| Poland | 104 | 0.1% |
| Portugal | 16 | 0.0% |
| Romania | 31 | 0.0% |
| Russia | 268 | 0.3% |
| South Africa | 40 | 0.0% |
| South America | 866 | 0.8% |
| South Central Asia | 2,099 | 1.9% |
| South Eastern Asia | 833 | 0.8% |
| Southern Europe | 130 | 0.1% |
| Sudan | 39 | 0.0% |
| Sweden | 15 | 0.0% |
| Syria | 28 | 0.0% |
| Taiwan | 140 | 0.1% |
| Thailand | 28 | 0.0% |
| Trinidad and Tobago | 10 | 0.0% |
| Turkey | 23 | 0.0% |
| Ukraine | 140 | 0.1% |
| Uzbekistan | 17 | 0.0% |
| Venezuela | 252 | 0.2% |
| Vietnam | 365 | 0.3% |
| Western Africa | 206 | 0.2% |
| Western Asia | 338 | 0.3% |
| Western Europe | 240 | 0.2% |
| Yemen | 31 | 0.0% | View All 97 Rows |
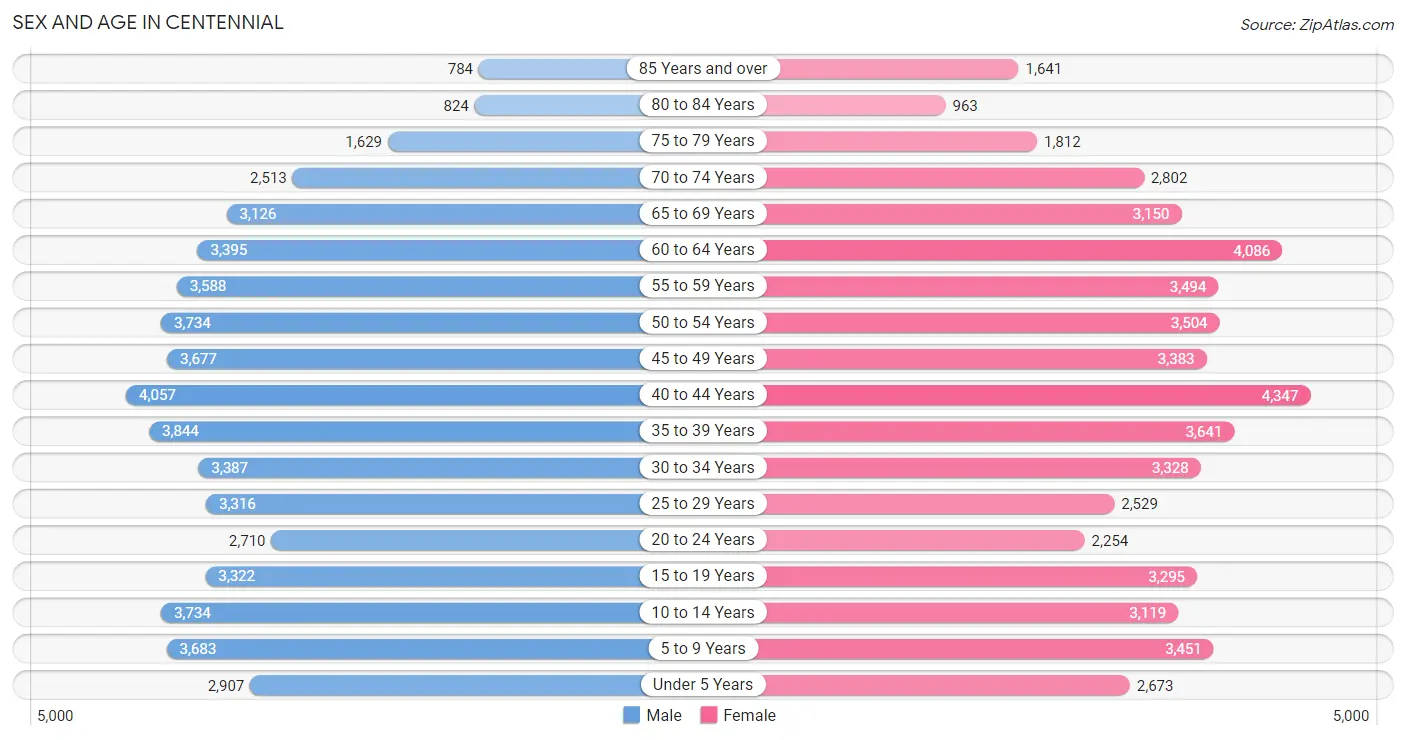
Sex and Age in Centennial
Sex and Age in Centennial
The most populous age groups in Centennial are 40 to 44 Years (4,057 | 7.5%) for men and 40 to 44 Years (4,347 | 8.1%) for women.
| Age Bracket | Male | Female |
| Under 5 Years | 2,907 (5.4%) | 2,673 (5.0%) |
| 5 to 9 Years | 3,683 (6.8%) | 3,451 (6.5%) |
| 10 to 14 Years | 3,734 (6.9%) | 3,119 (5.8%) |
| 15 to 19 Years | 3,322 (6.1%) | 3,295 (6.2%) |
| 20 to 24 Years | 2,710 (5.0%) | 2,254 (4.2%) |
| 25 to 29 Years | 3,316 (6.1%) | 2,529 (4.7%) |
| 30 to 34 Years | 3,387 (6.2%) | 3,328 (6.2%) |
| 35 to 39 Years | 3,844 (7.1%) | 3,641 (6.8%) |
| 40 to 44 Years | 4,057 (7.5%) | 4,347 (8.1%) |
| 45 to 49 Years | 3,677 (6.8%) | 3,383 (6.3%) |
| 50 to 54 Years | 3,734 (6.9%) | 3,504 (6.6%) |
| 55 to 59 Years | 3,588 (6.6%) | 3,494 (6.5%) |
| 60 to 64 Years | 3,395 (6.3%) | 4,086 (7.6%) |
| 65 to 69 Years | 3,126 (5.8%) | 3,150 (5.9%) |
| 70 to 74 Years | 2,513 (4.6%) | 2,802 (5.2%) |
| 75 to 79 Years | 1,629 (3.0%) | 1,812 (3.4%) |
| 80 to 84 Years | 824 (1.5%) | 963 (1.8%) |
| 85 Years and over | 784 (1.5%) | 1,641 (3.1%) |
| Total | 54,230 (100.0%) | 53,472 (100.0%) |
Families and Households in Centennial
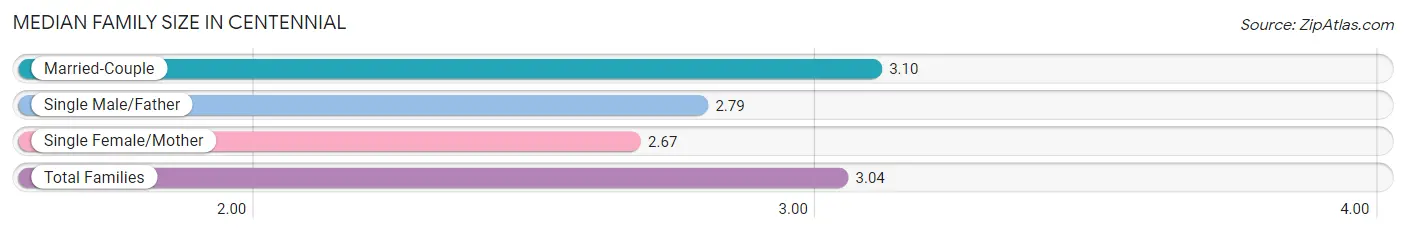
Median Family Size in Centennial
The median family size in Centennial is 3.04 persons per family, with married-couple families (25,147 | 84.2%) accounting for the largest median family size of 3.1 persons per family. On the other hand, single female/mother families (3,173 | 10.6%) represent the smallest median family size with 2.67 persons per family.
| Family Type | # Families | Family Size |
| Married-Couple | 25,147 (84.2%) | 3.10 |
| Single Male/Father | 1,541 (5.2%) | 2.79 |
| Single Female/Mother | 3,173 (10.6%) | 2.67 |
| Total Families | 29,861 (100.0%) | 3.04 |
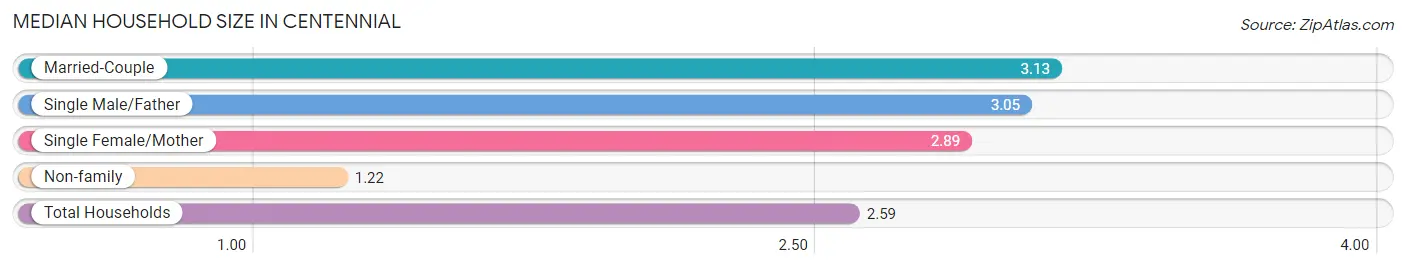
Median Household Size in Centennial
The median household size in Centennial is 2.59 persons per household, with married-couple households (25,147 | 61.4%) accounting for the largest median household size of 3.13 persons per household. non-family households (11,091 | 27.1%) represent the smallest median household size with 1.22 persons per household.
| Household Type | # Households | Household Size |
| Married-Couple | 25,147 (61.4%) | 3.13 |
| Single Male/Father | 1,541 (3.8%) | 3.05 |
| Single Female/Mother | 3,173 (7.7%) | 2.89 |
| Non-family | 11,091 (27.1%) | 1.22 |
| Total Households | 40,952 (100.0%) | 2.59 |
Household Size by Marriage Status in Centennial
Out of a total of 40,952 households in Centennial, 29,861 (72.9%) are family households, while 11,091 (27.1%) are nonfamily households. The most numerous type of family households are 2-person households, comprising 13,228, and the most common type of nonfamily households are 1-person households, comprising 9,184.
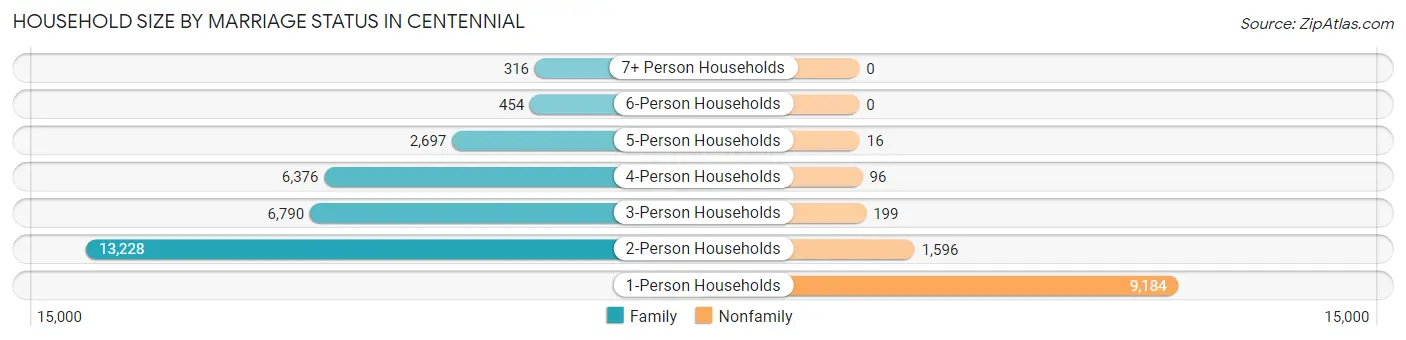
| Household Size | Family Households | Nonfamily Households |
| 1-Person Households | - | 9,184 (22.4%) |
| 2-Person Households | 13,228 (32.3%) | 1,596 (3.9%) |
| 3-Person Households | 6,790 (16.6%) | 199 (0.5%) |
| 4-Person Households | 6,376 (15.6%) | 96 (0.2%) |
| 5-Person Households | 2,697 (6.6%) | 16 (0.0%) |
| 6-Person Households | 454 (1.1%) | 0 (0.0%) |
| 7+ Person Households | 316 (0.8%) | 0 (0.0%) |
| Total | 29,861 (72.9%) | 11,091 (27.1%) |
Female Fertility in Centennial
Fertility by Age in Centennial
Average fertility rate in Centennial is 48.0 births per 1,000 women. Women in the age bracket of 20 to 34 years have the highest fertility rate with 80.0 births per 1,000 women. Women in the age bracket of 20 to 34 years acount for 57.6% of all women with births.
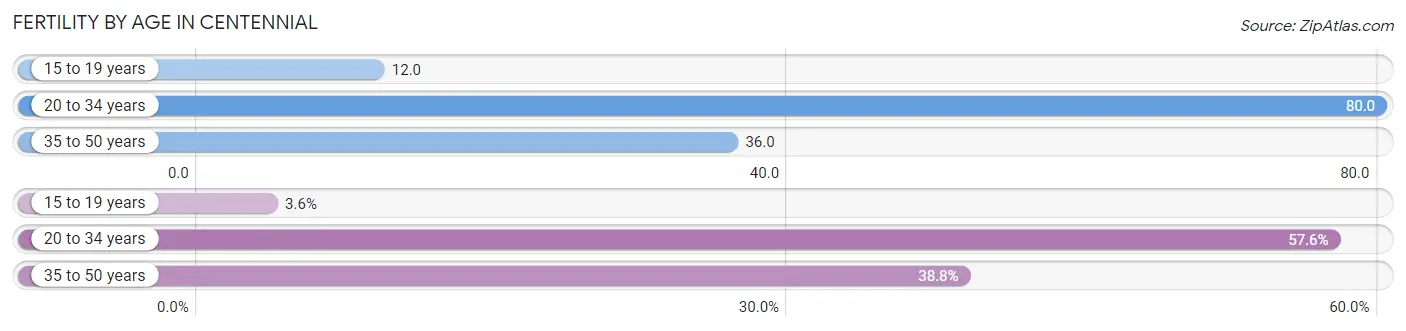
| Age Bracket | Women with Births | Births / 1,000 Women |
| 15 to 19 years | 40 (3.6%) | 12.0 |
| 20 to 34 years | 646 (57.6%) | 80.0 |
| 35 to 50 years | 435 (38.8%) | 36.0 |
| Total | 1,121 (100.0%) | 48.0 |
Fertility by Age by Marriage Status in Centennial
89.2% of women with births (1,121) in Centennial are married. The highest percentage of unmarried women with births falls into 15 to 19 years age bracket with 100.0% of them unmarried at the time of birth, while the lowest percentage of unmarried women with births belong to 20 to 34 years age bracket with 7.0% of them unmarried.
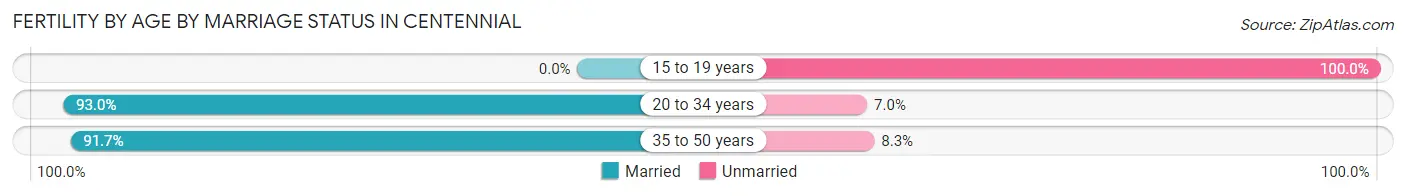
| Age Bracket | Married | Unmarried |
| 15 to 19 years | 0 (0.0%) | 40 (100.0%) |
| 20 to 34 years | 601 (93.0%) | 45 (7.0%) |
| 35 to 50 years | 399 (91.7%) | 36 (8.3%) |
| Total | 1,000 (89.2%) | 121 (10.8%) |
Fertility by Education in Centennial
Average fertility rate in Centennial is 48.0 births per 1,000 women. Women with the education attainment of graduate degree have the highest fertility rate of 76.0 births per 1,000 women, while women with the education attainment of less than high school have the lowest fertility at 14.0 births per 1,000 women. Women with the education attainment of graduate degree represent 35.2% of all women with births.
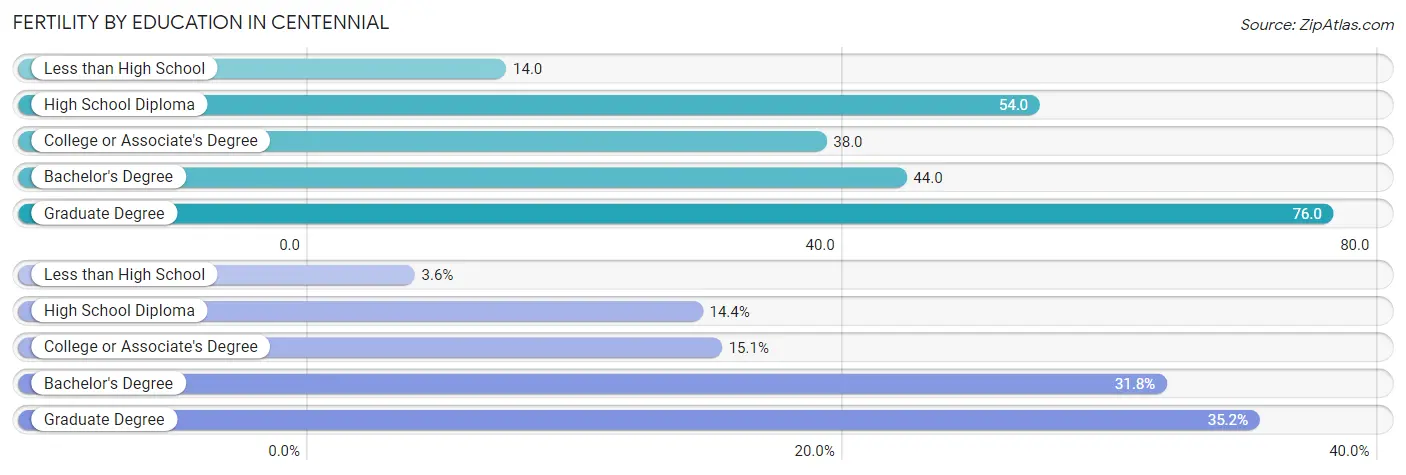
| Educational Attainment | Women with Births | Births / 1,000 Women |
| Less than High School | 40 (3.6%) | 14.0 |
| High School Diploma | 161 (14.4%) | 54.0 |
| College or Associate's Degree | 169 (15.1%) | 38.0 |
| Bachelor's Degree | 356 (31.8%) | 44.0 |
| Graduate Degree | 395 (35.2%) | 76.0 |
| Total | 1,121 (100.0%) | 48.0 |
Fertility by Education by Marriage Status in Centennial
10.8% of women with births in Centennial are unmarried. Women with the educational attainment of graduate degree are most likely to be married with 100.0% of them married at childbirth, while women with the educational attainment of less than high school are least likely to be married with 100.0% of them unmarried at childbirth.
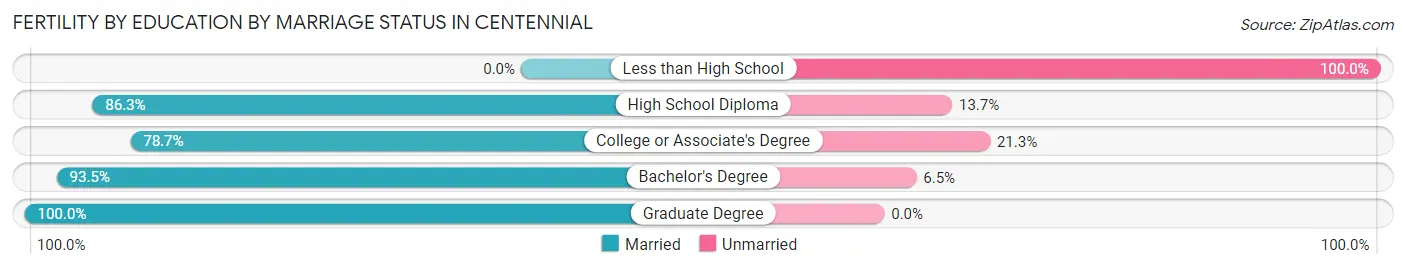
| Educational Attainment | Married | Unmarried |
| Less than High School | 0 (0.0%) | 40 (100.0%) |
| High School Diploma | 139 (86.3%) | 22 (13.7%) |
| College or Associate's Degree | 133 (78.7%) | 36 (21.3%) |
| Bachelor's Degree | 333 (93.5%) | 23 (6.5%) |
| Graduate Degree | 395 (100.0%) | 0 (0.0%) |
| Total | 1,000 (89.2%) | 121 (10.8%) |
Employment Characteristics in Centennial
Employment by Class of Employer in Centennial
Among the 57,100 employed individuals in Centennial, private company employees (38,269 | 67.0%), local government employees (4,361 | 7.6%), and not-for-profit organizations (4,323 | 7.6%) make up the most common classes of employment.
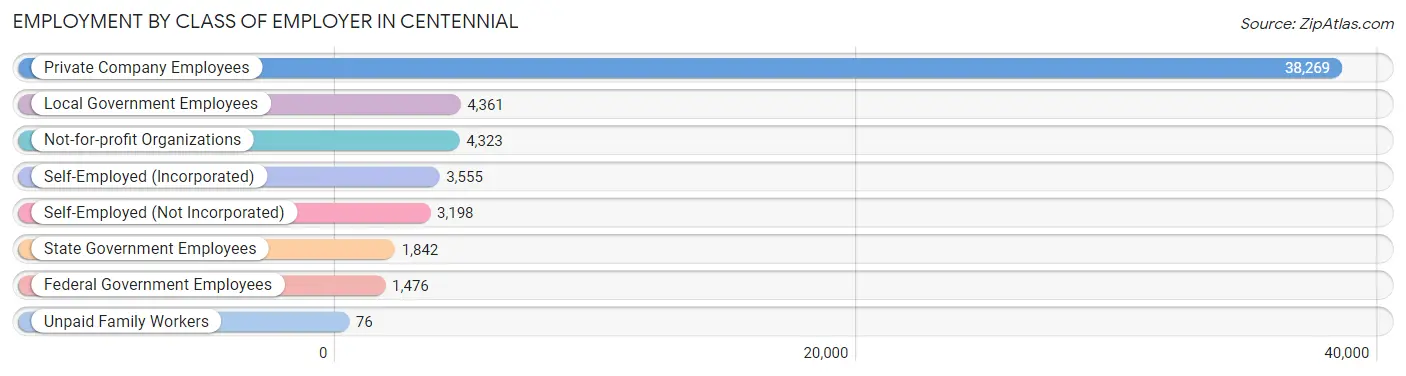
| Employer Class | # Employees | % Employees |
| Private Company Employees | 38,269 | 67.0% |
| Self-Employed (Incorporated) | 3,555 | 6.2% |
| Self-Employed (Not Incorporated) | 3,198 | 5.6% |
| Not-for-profit Organizations | 4,323 | 7.6% |
| Local Government Employees | 4,361 | 7.6% |
| State Government Employees | 1,842 | 3.2% |
| Federal Government Employees | 1,476 | 2.6% |
| Unpaid Family Workers | 76 | 0.1% |
| Total | 57,100 | 100.0% |
Employment Status by Age in Centennial
According to the labor force statistics for Centennial, out of the total population over 16 years of age (86,698), 69.2% or 59,995 individuals are in the labor force, with 3.4% or 2,040 of them unemployed. The age group with the highest labor force participation rate is 45 to 54 years, with 88.7% or 12,682 individuals in the labor force. Within the labor force, the 20 to 24 years age range has the highest percentage of unemployed individuals, with 7.9% or 333 of them being unemployed.
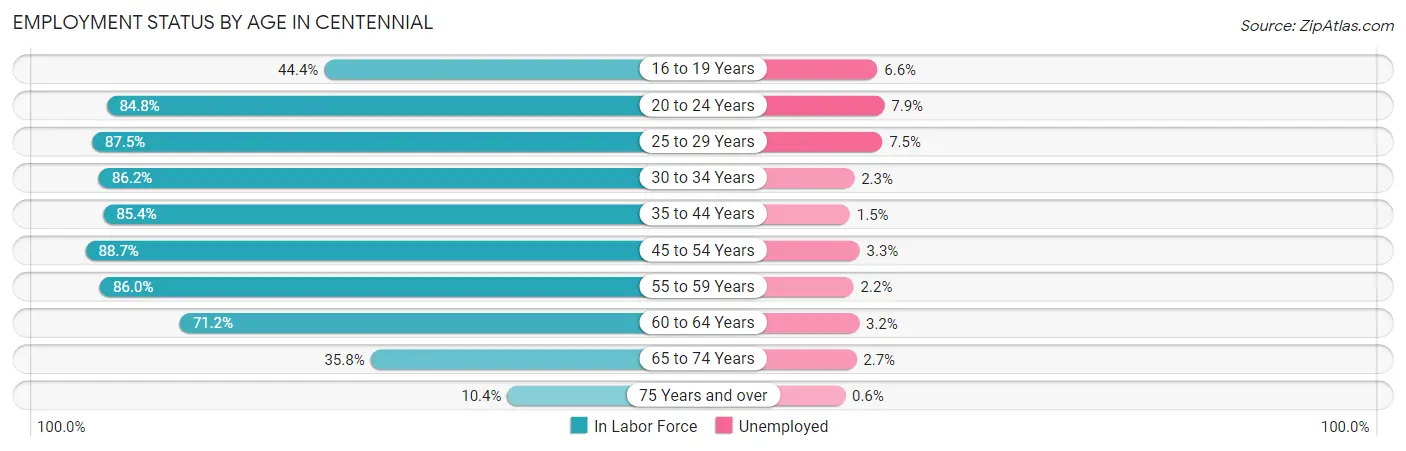
| Age Bracket | In Labor Force | Unemployed |
| 16 to 19 Years | 2,300 (44.4%) | 152 (6.6%) |
| 20 to 24 Years | 4,209 (84.8%) | 333 (7.9%) |
| 25 to 29 Years | 5,114 (87.5%) | 384 (7.5%) |
| 30 to 34 Years | 5,788 (86.2%) | 133 (2.3%) |
| 35 to 44 Years | 13,569 (85.4%) | 204 (1.5%) |
| 45 to 54 Years | 12,682 (88.7%) | 419 (3.3%) |
| 55 to 59 Years | 6,091 (86.0%) | 134 (2.2%) |
| 60 to 64 Years | 5,326 (71.2%) | 170 (3.2%) |
| 65 to 74 Years | 4,150 (35.8%) | 112 (2.7%) |
| 75 Years and over | 796 (10.4%) | 5 (0.6%) |
| Total | 59,995 (69.2%) | 2,040 (3.4%) |
Employment Status by Educational Attainment in Centennial
According to labor force statistics for Centennial, 84.7% of individuals (48,542) out of the total population between 25 and 64 years of age (57,310) are in the labor force, with 3.0% or 1,456 of them being unemployed. The group with the highest labor force participation rate are those with the educational attainment of bachelor's degree or higher, with 88.8% or 31,866 individuals in the labor force. Within the labor force, individuals with less than high school education have the highest percentage of unemployment, with 8.0% or 78 of them being unemployed.
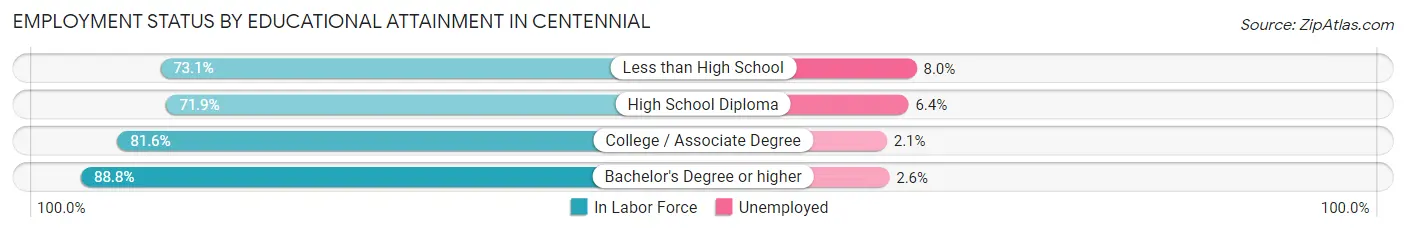
| Educational Attainment | In Labor Force | Unemployed |
| Less than High School | 974 (73.1%) | 107 (8.0%) |
| High School Diploma | 4,808 (71.9%) | 428 (6.4%) |
| College / Associate Degree | 10,938 (81.6%) | 282 (2.1%) |
| Bachelor's Degree or higher | 31,866 (88.8%) | 933 (2.6%) |
| Total | 48,542 (84.7%) | 1,719 (3.0%) |
Employment Occupations by Sex in Centennial
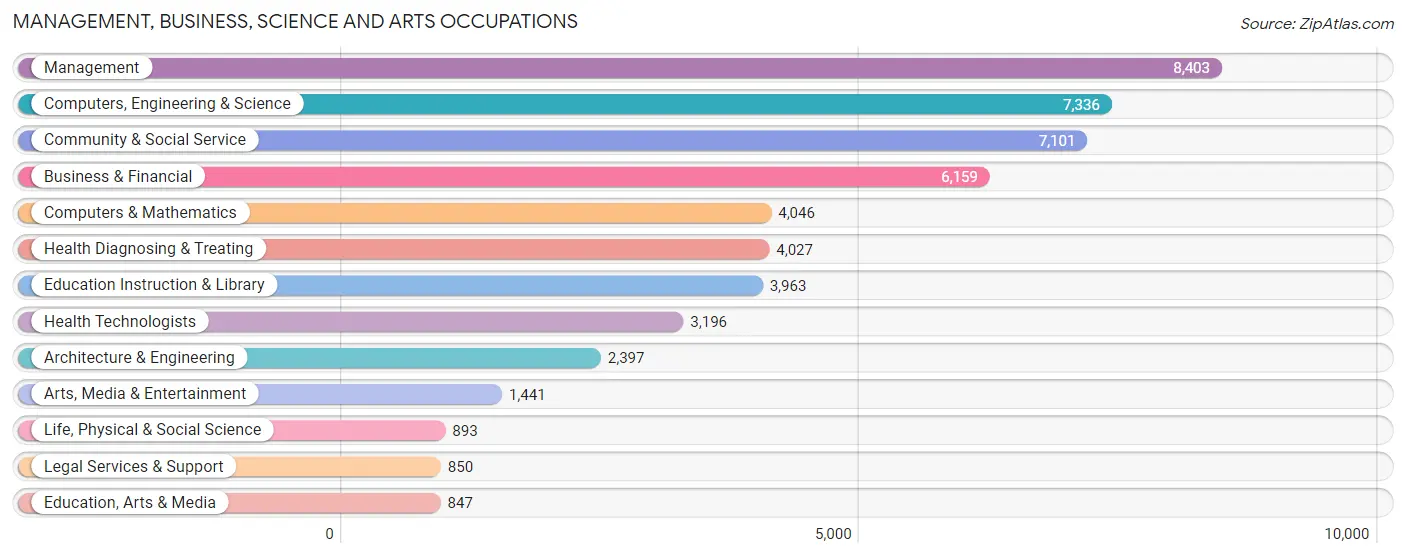
Management, Business, Science and Arts Occupations
The most common Management, Business, Science and Arts occupations in Centennial are Management (8,403 | 14.5%), Computers, Engineering & Science (7,336 | 12.7%), Community & Social Service (7,101 | 12.3%), Business & Financial (6,159 | 10.6%), and Computers & Mathematics (4,046 | 7.0%).
Management, Business, Science and Arts Occupations by Sex
Within the Management, Business, Science and Arts occupations in Centennial, the most male-oriented occupations are Computers & Mathematics (80.3%), Architecture & Engineering (79.8%), and Computers, Engineering & Science (77.0%), while the most female-oriented occupations are Education Instruction & Library (74.5%), Education, Arts & Media (71.3%), and Health Technologists (69.7%).
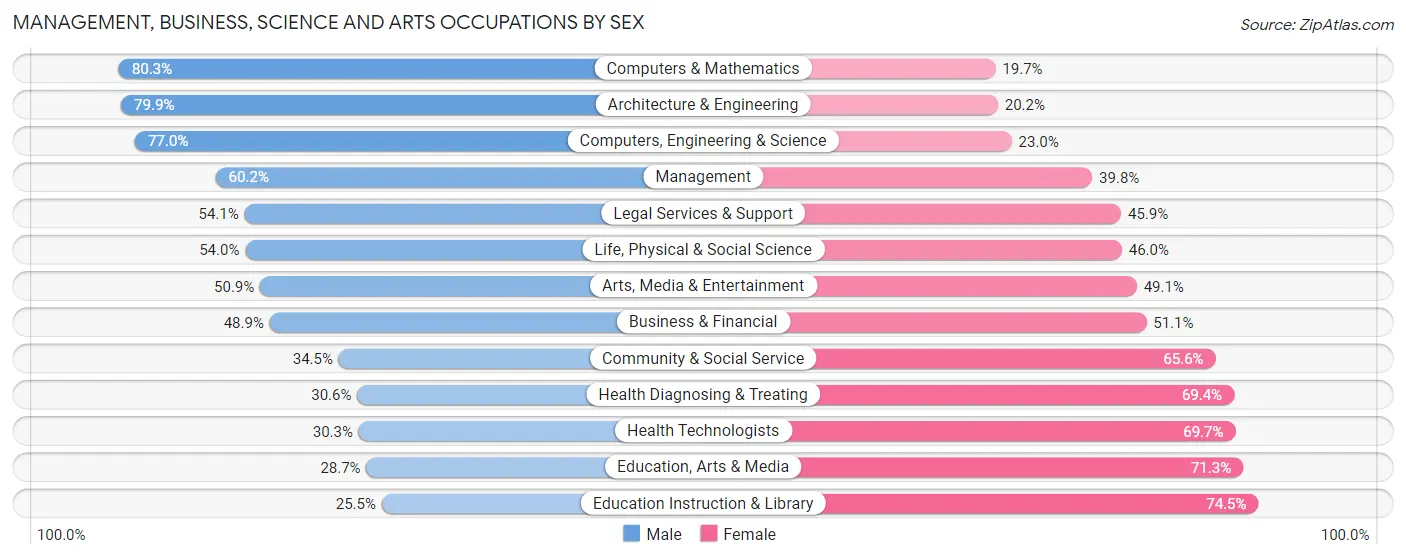
| Occupation | Male | Female |
| Management | 5,055 (60.2%) | 3,348 (39.8%) |
| Business & Financial | 3,009 (48.9%) | 3,150 (51.1%) |
| Computers, Engineering & Science | 5,646 (77.0%) | 1,690 (23.0%) |
| Computers & Mathematics | 3,250 (80.3%) | 796 (19.7%) |
| Architecture & Engineering | 1,914 (79.8%) | 483 (20.2%) |
| Life, Physical & Social Science | 482 (54.0%) | 411 (46.0%) |
| Community & Social Service | 2,446 (34.4%) | 4,655 (65.5%) |
| Education, Arts & Media | 243 (28.7%) | 604 (71.3%) |
| Legal Services & Support | 460 (54.1%) | 390 (45.9%) |
| Education Instruction & Library | 1,010 (25.5%) | 2,953 (74.5%) |
| Arts, Media & Entertainment | 733 (50.9%) | 708 (49.1%) |
| Health Diagnosing & Treating | 1,232 (30.6%) | 2,795 (69.4%) |
| Health Technologists | 968 (30.3%) | 2,228 (69.7%) |
| Total (Category) | 17,388 (52.6%) | 15,638 (47.3%) |
| Total (Overall) | 30,960 (53.5%) | 26,875 (46.5%) |
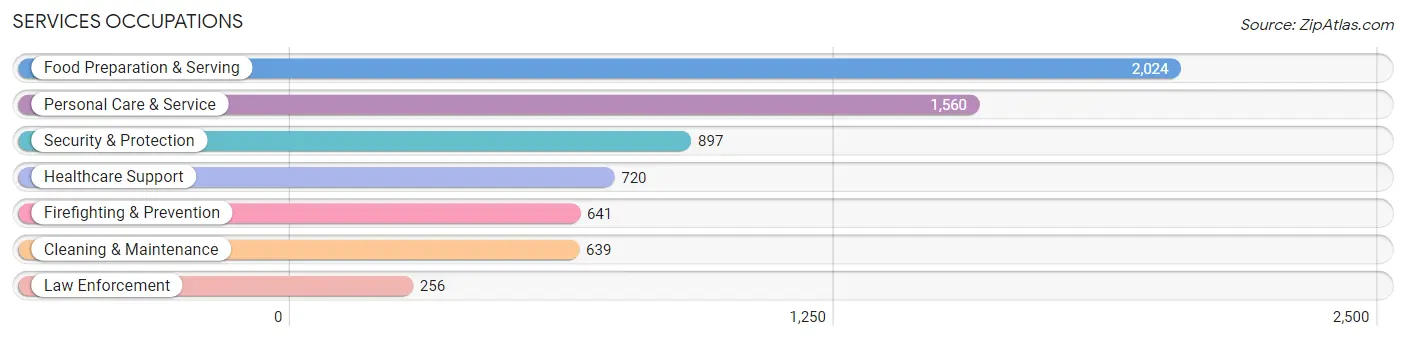
Services Occupations
The most common Services occupations in Centennial are Food Preparation & Serving (2,024 | 3.5%), Personal Care & Service (1,560 | 2.7%), Security & Protection (897 | 1.5%), Healthcare Support (720 | 1.2%), and Firefighting & Prevention (641 | 1.1%).
Services Occupations by Sex
Within the Services occupations in Centennial, the most male-oriented occupations are Law Enforcement (83.6%), Security & Protection (80.4%), and Firefighting & Prevention (79.1%), while the most female-oriented occupations are Personal Care & Service (81.1%), Healthcare Support (77.5%), and Food Preparation & Serving (53.1%).
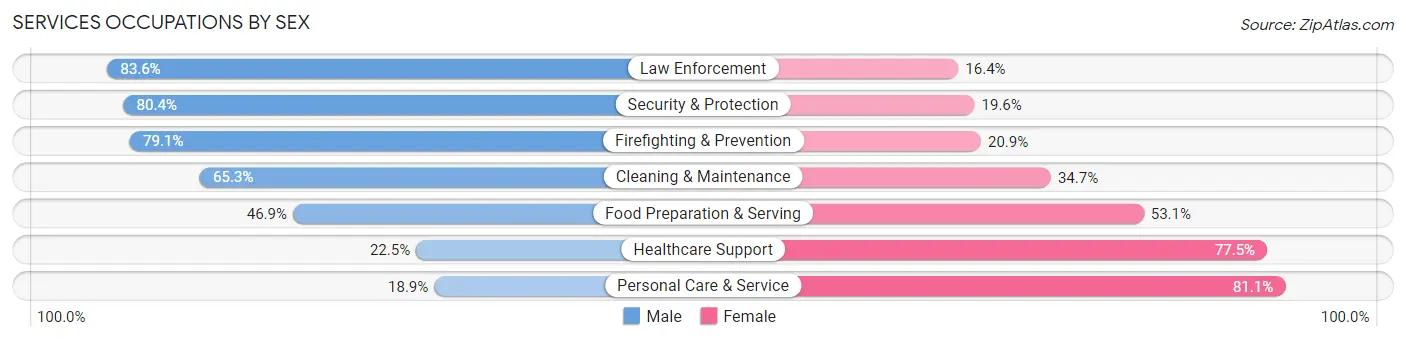
| Occupation | Male | Female |
| Healthcare Support | 162 (22.5%) | 558 (77.5%) |
| Security & Protection | 721 (80.4%) | 176 (19.6%) |
| Firefighting & Prevention | 507 (79.1%) | 134 (20.9%) |
| Law Enforcement | 214 (83.6%) | 42 (16.4%) |
| Food Preparation & Serving | 949 (46.9%) | 1,075 (53.1%) |
| Cleaning & Maintenance | 417 (65.3%) | 222 (34.7%) |
| Personal Care & Service | 295 (18.9%) | 1,265 (81.1%) |
| Total (Category) | 2,544 (43.6%) | 3,296 (56.4%) |
| Total (Overall) | 30,960 (53.5%) | 26,875 (46.5%) |
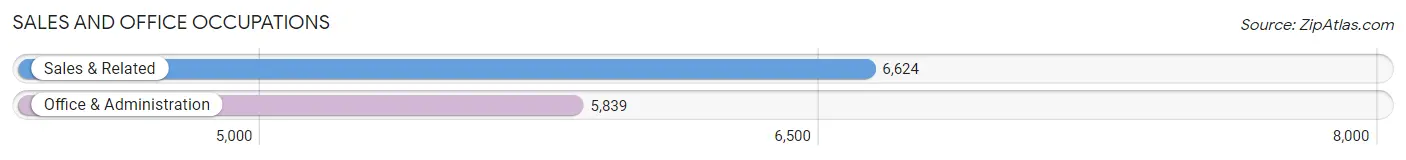
Sales and Office Occupations
The most common Sales and Office occupations in Centennial are Sales & Related (6,624 | 11.5%), and Office & Administration (5,839 | 10.1%).
Sales and Office Occupations by Sex
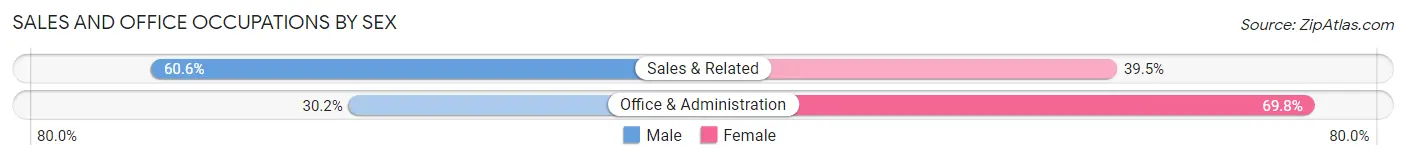
| Occupation | Male | Female |
| Sales & Related | 4,011 (60.6%) | 2,613 (39.5%) |
| Office & Administration | 1,761 (30.2%) | 4,078 (69.8%) |
| Total (Category) | 5,772 (46.3%) | 6,691 (53.7%) |
| Total (Overall) | 30,960 (53.5%) | 26,875 (46.5%) |
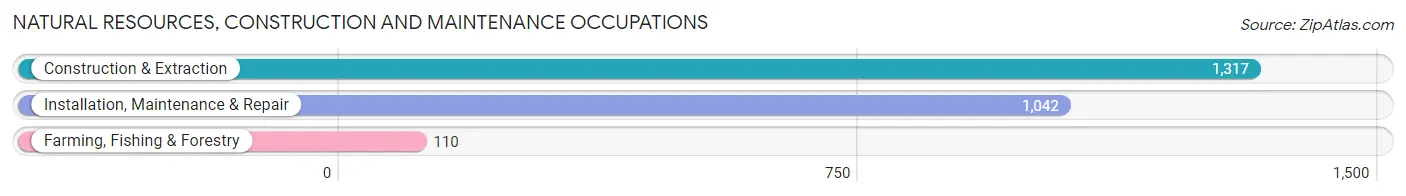
Natural Resources, Construction and Maintenance Occupations
The most common Natural Resources, Construction and Maintenance occupations in Centennial are Construction & Extraction (1,317 | 2.3%), Installation, Maintenance & Repair (1,042 | 1.8%), and Farming, Fishing & Forestry (110 | 0.2%).
Natural Resources, Construction and Maintenance Occupations by Sex
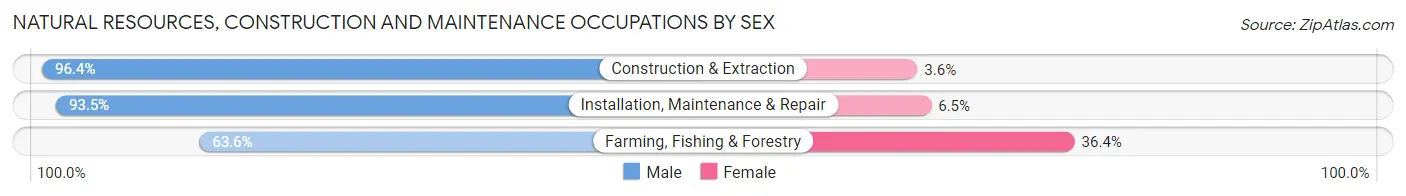
| Occupation | Male | Female |
| Farming, Fishing & Forestry | 70 (63.6%) | 40 (36.4%) |
| Construction & Extraction | 1,269 (96.4%) | 48 (3.6%) |
| Installation, Maintenance & Repair | 974 (93.5%) | 68 (6.5%) |
| Total (Category) | 2,313 (93.7%) | 156 (6.3%) |
| Total (Overall) | 30,960 (53.5%) | 26,875 (46.5%) |
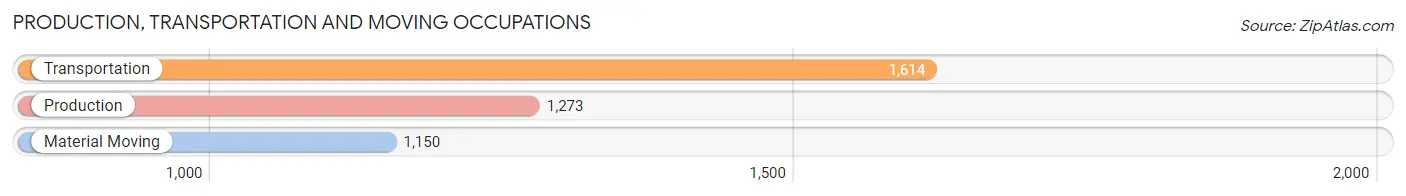
Production, Transportation and Moving Occupations
The most common Production, Transportation and Moving occupations in Centennial are Transportation (1,614 | 2.8%), Production (1,273 | 2.2%), and Material Moving (1,150 | 2.0%).
Production, Transportation and Moving Occupations by Sex
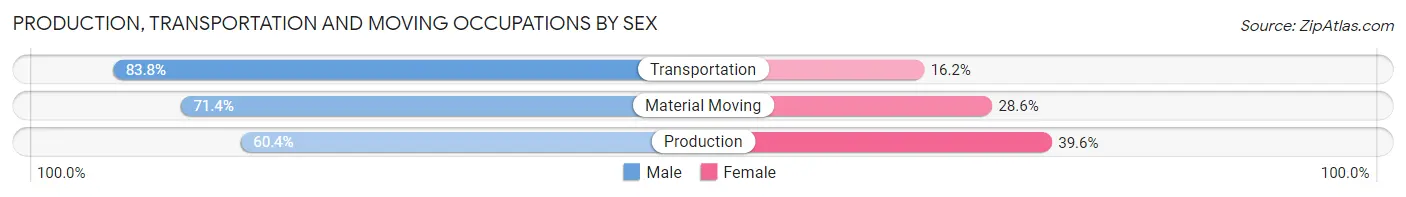
| Occupation | Male | Female |
| Production | 769 (60.4%) | 504 (39.6%) |
| Transportation | 1,353 (83.8%) | 261 (16.2%) |
| Material Moving | 821 (71.4%) | 329 (28.6%) |
| Total (Category) | 2,943 (72.9%) | 1,094 (27.1%) |
| Total (Overall) | 30,960 (53.5%) | 26,875 (46.5%) |
Employment Industries by Sex in Centennial
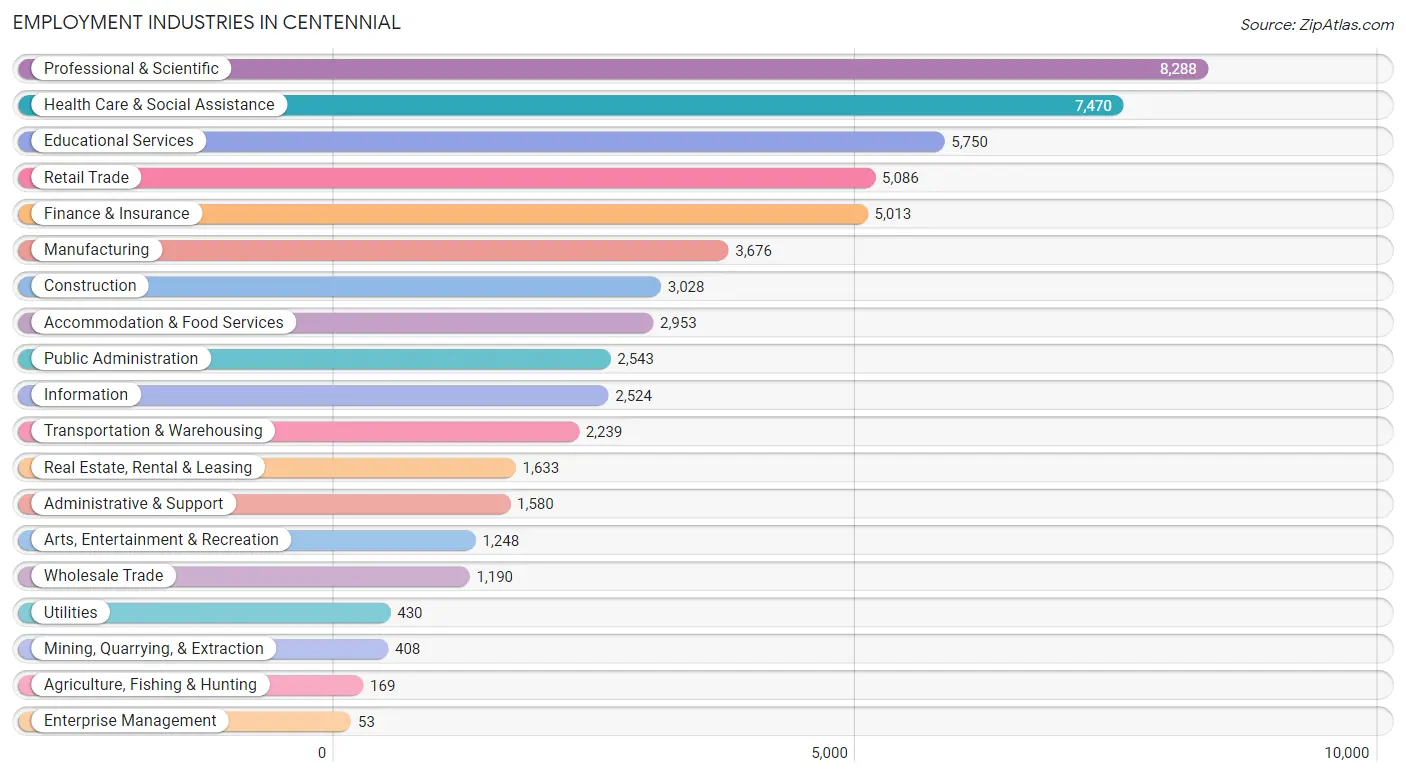
Employment Industries in Centennial
The major employment industries in Centennial include Professional & Scientific (8,288 | 14.3%), Health Care & Social Assistance (7,470 | 12.9%), Educational Services (5,750 | 9.9%), Retail Trade (5,086 | 8.8%), and Finance & Insurance (5,013 | 8.7%).
Employment Industries by Sex in Centennial
The Centennial industries that see more men than women are Construction (81.1%), Manufacturing (77.0%), and Wholesale Trade (74.2%), whereas the industries that tend to have a higher number of women are Health Care & Social Assistance (69.8%), Educational Services (68.8%), and Finance & Insurance (53.7%).
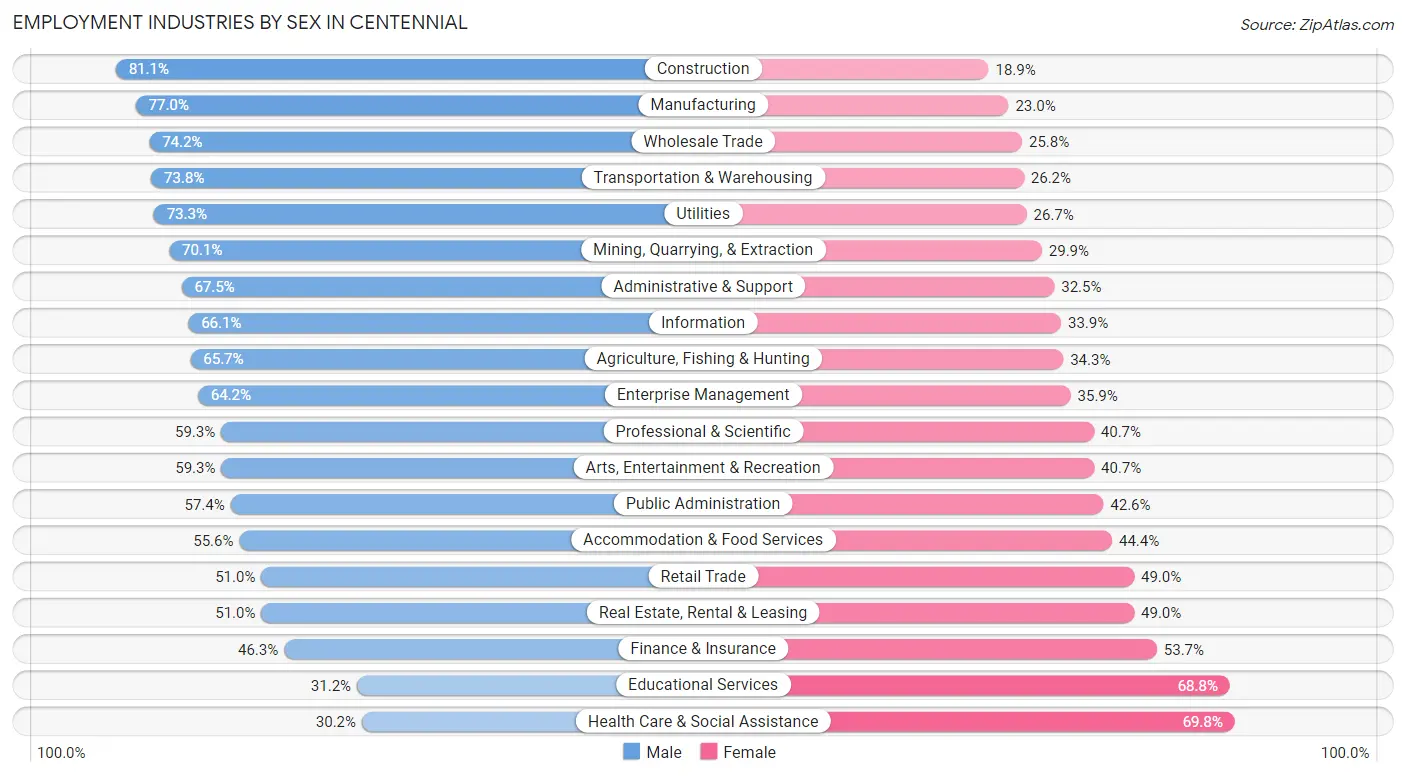
| Industry | Male | Female |
| Agriculture, Fishing & Hunting | 111 (65.7%) | 58 (34.3%) |
| Mining, Quarrying, & Extraction | 286 (70.1%) | 122 (29.9%) |
| Construction | 2,457 (81.1%) | 571 (18.9%) |
| Manufacturing | 2,831 (77.0%) | 845 (23.0%) |
| Wholesale Trade | 883 (74.2%) | 307 (25.8%) |
| Retail Trade | 2,595 (51.0%) | 2,491 (49.0%) |
| Transportation & Warehousing | 1,653 (73.8%) | 586 (26.2%) |
| Utilities | 315 (73.3%) | 115 (26.7%) |
| Information | 1,669 (66.1%) | 855 (33.9%) |
| Finance & Insurance | 2,321 (46.3%) | 2,692 (53.7%) |
| Real Estate, Rental & Leasing | 833 (51.0%) | 800 (49.0%) |
| Professional & Scientific | 4,918 (59.3%) | 3,370 (40.7%) |
| Enterprise Management | 34 (64.1%) | 19 (35.8%) |
| Administrative & Support | 1,067 (67.5%) | 513 (32.5%) |
| Educational Services | 1,795 (31.2%) | 3,955 (68.8%) |
| Health Care & Social Assistance | 2,255 (30.2%) | 5,215 (69.8%) |
| Arts, Entertainment & Recreation | 740 (59.3%) | 508 (40.7%) |
| Accommodation & Food Services | 1,641 (55.6%) | 1,312 (44.4%) |
| Public Administration | 1,459 (57.4%) | 1,084 (42.6%) |
| Total | 30,960 (53.5%) | 26,875 (46.5%) |
Education in Centennial
School Enrollment in Centennial
The most common levels of schooling among the 25,876 students in Centennial are high school (6,342 | 24.5%), elementary school (5,423 | 21.0%), and middle school (5,245 | 20.3%).
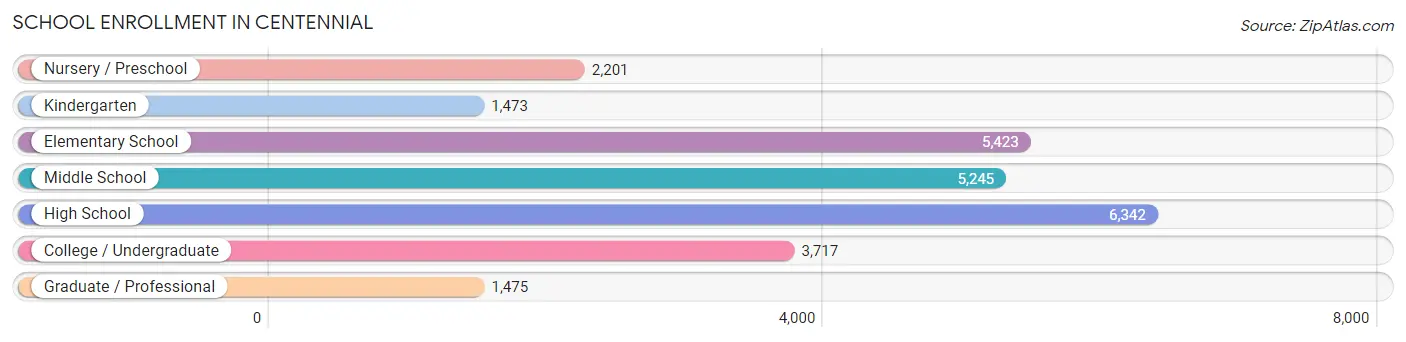
| School Level | # Students | % Students |
| Nursery / Preschool | 2,201 | 8.5% |
| Kindergarten | 1,473 | 5.7% |
| Elementary School | 5,423 | 21.0% |
| Middle School | 5,245 | 20.3% |
| High School | 6,342 | 24.5% |
| College / Undergraduate | 3,717 | 14.4% |
| Graduate / Professional | 1,475 | 5.7% |
| Total | 25,876 | 100.0% |
School Enrollment by Age by Funding Source in Centennial
Out of a total of 25,876 students who are enrolled in schools in Centennial, 4,477 (17.3%) attend a private institution, while the remaining 21,399 (82.7%) are enrolled in public schools. The age group of 3 to 4 year olds has the highest likelihood of being enrolled in private schools, with 838 (55.3% in the age bracket) enrolled. Conversely, the age group of 15 to 17 year olds has the lowest likelihood of being enrolled in a private school, with 4,185 (92.4% in the age bracket) attending a public institution.
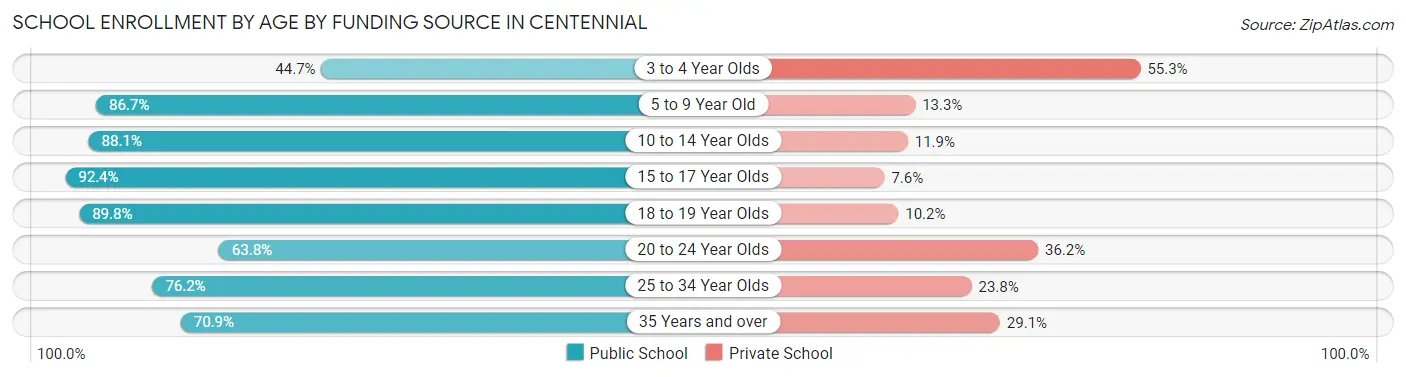
| Age Bracket | Public School | Private School |
| 3 to 4 Year Olds | 678 (44.7%) | 838 (55.3%) |
| 5 to 9 Year Old | 6,026 (86.7%) | 926 (13.3%) |
| 10 to 14 Year Olds | 6,010 (88.1%) | 815 (11.9%) |
| 15 to 17 Year Olds | 4,185 (92.4%) | 344 (7.6%) |
| 18 to 19 Year Olds | 1,376 (89.8%) | 156 (10.2%) |
| 20 to 24 Year Olds | 1,248 (63.8%) | 708 (36.2%) |
| 25 to 34 Year Olds | 905 (76.2%) | 283 (23.8%) |
| 35 Years and over | 977 (70.9%) | 401 (29.1%) |
| Total | 21,399 (82.7%) | 4,477 (17.3%) |
Educational Attainment by Field of Study in Centennial
Business (11,732 | 23.1%), engineering (5,169 | 10.2%), education (4,753 | 9.3%), social sciences (4,441 | 8.7%), and science & technology (4,192 | 8.2%) are the most common fields of study among 50,895 individuals in Centennial who have obtained a bachelor's degree or higher.
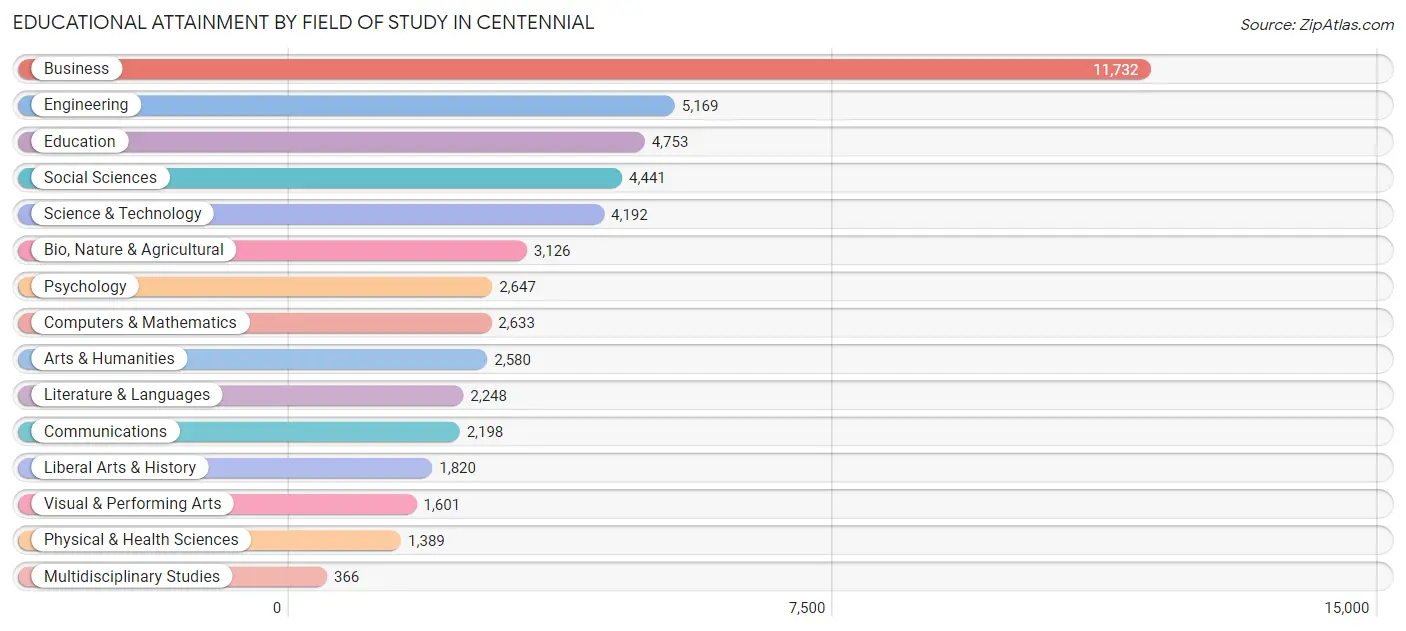
| Field of Study | # Graduates | % Graduates |
| Computers & Mathematics | 2,633 | 5.2% |
| Bio, Nature & Agricultural | 3,126 | 6.1% |
| Physical & Health Sciences | 1,389 | 2.7% |
| Psychology | 2,647 | 5.2% |
| Social Sciences | 4,441 | 8.7% |
| Engineering | 5,169 | 10.2% |
| Multidisciplinary Studies | 366 | 0.7% |
| Science & Technology | 4,192 | 8.2% |
| Business | 11,732 | 23.1% |
| Education | 4,753 | 9.3% |
| Literature & Languages | 2,248 | 4.4% |
| Liberal Arts & History | 1,820 | 3.6% |
| Visual & Performing Arts | 1,601 | 3.2% |
| Communications | 2,198 | 4.3% |
| Arts & Humanities | 2,580 | 5.1% |
| Total | 50,895 | 100.0% |
Transportation & Commute in Centennial
Vehicle Availability by Sex in Centennial
The most prevalent vehicle ownership categories in Centennial are males with 2 vehicles (13,535, accounting for 44.1%) and females with 2 vehicles (11,784, making up 51.4%).

| Vehicles Available | Male | Female |
| No Vehicle | 245 (0.8%) | 294 (1.1%) |
| 1 Vehicle | 3,761 (12.3%) | 4,186 (15.9%) |
| 2 Vehicles | 13,535 (44.1%) | 11,784 (44.8%) |
| 3 Vehicles | 8,147 (26.6%) | 5,970 (22.7%) |
| 4 Vehicles | 3,407 (11.1%) | 2,807 (10.7%) |
| 5 or more Vehicles | 1,573 (5.1%) | 1,281 (4.9%) |
| Total | 30,668 (100.0%) | 26,322 (100.0%) |
Commute Time in Centennial
The most frequently occuring commute durations in Centennial are 15 to 19 minutes (7,139 commuters, 15.9%), 20 to 24 minutes (6,846 commuters, 15.2%), and 30 to 34 minutes (6,507 commuters, 14.5%).
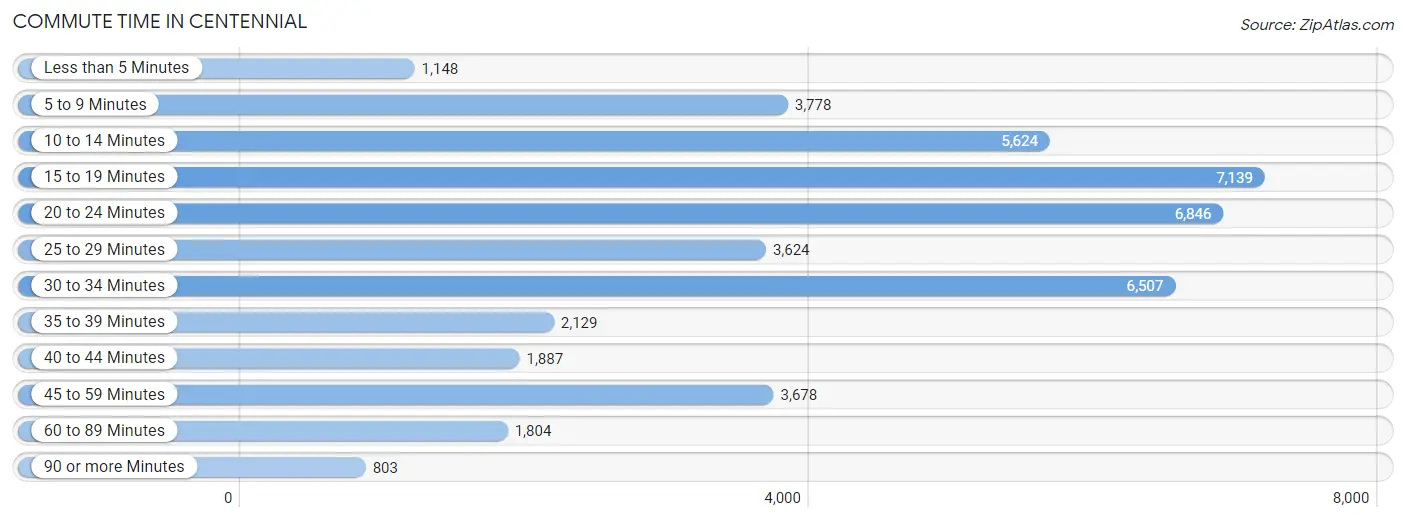
| Commute Time | # Commuters | % Commuters |
| Less than 5 Minutes | 1,148 | 2.5% |
| 5 to 9 Minutes | 3,778 | 8.4% |
| 10 to 14 Minutes | 5,624 | 12.5% |
| 15 to 19 Minutes | 7,139 | 15.9% |
| 20 to 24 Minutes | 6,846 | 15.2% |
| 25 to 29 Minutes | 3,624 | 8.1% |
| 30 to 34 Minutes | 6,507 | 14.5% |
| 35 to 39 Minutes | 2,129 | 4.7% |
| 40 to 44 Minutes | 1,887 | 4.2% |
| 45 to 59 Minutes | 3,678 | 8.2% |
| 60 to 89 Minutes | 1,804 | 4.0% |
| 90 or more Minutes | 803 | 1.8% |
Commute Time by Sex in Centennial
The most common commute times in Centennial are 15 to 19 minutes (3,900 commuters, 15.8%) for males and 20 to 24 minutes (3,284 commuters, 16.2%) for females.
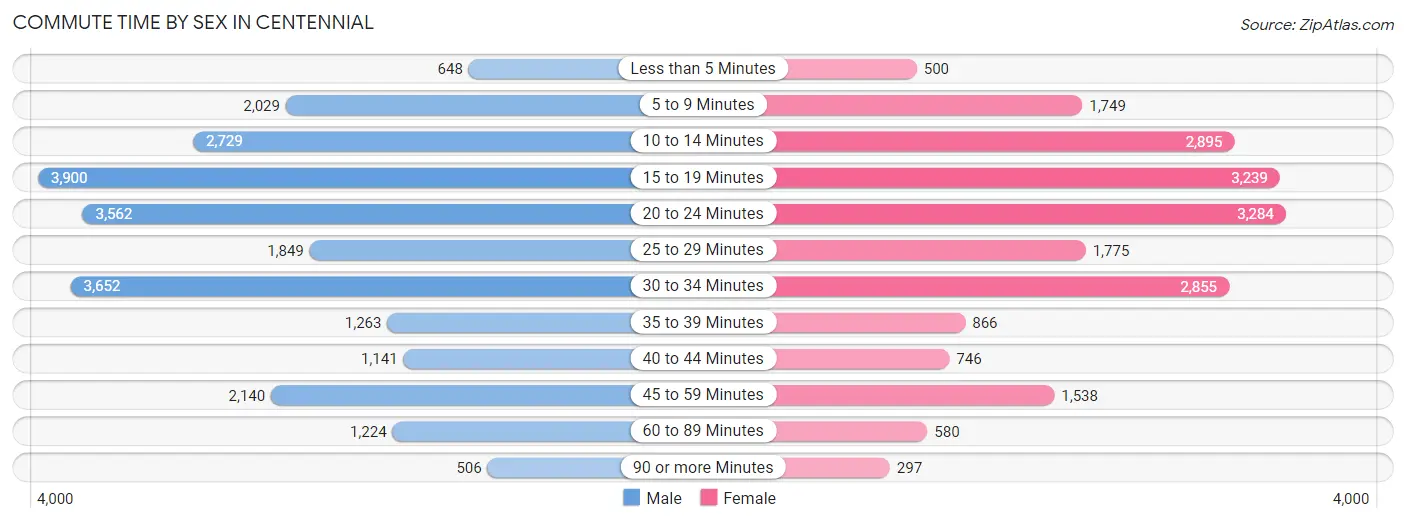
| Commute Time | Male | Female |
| Less than 5 Minutes | 648 (2.6%) | 500 (2.5%) |
| 5 to 9 Minutes | 2,029 (8.2%) | 1,749 (8.6%) |
| 10 to 14 Minutes | 2,729 (11.1%) | 2,895 (14.2%) |
| 15 to 19 Minutes | 3,900 (15.8%) | 3,239 (15.9%) |
| 20 to 24 Minutes | 3,562 (14.4%) | 3,284 (16.2%) |
| 25 to 29 Minutes | 1,849 (7.5%) | 1,775 (8.7%) |
| 30 to 34 Minutes | 3,652 (14.8%) | 2,855 (14.1%) |
| 35 to 39 Minutes | 1,263 (5.1%) | 866 (4.3%) |
| 40 to 44 Minutes | 1,141 (4.6%) | 746 (3.7%) |
| 45 to 59 Minutes | 2,140 (8.7%) | 1,538 (7.6%) |
| 60 to 89 Minutes | 1,224 (5.0%) | 580 (2.9%) |
| 90 or more Minutes | 506 (2.1%) | 297 (1.5%) |
Time of Departure to Work by Sex in Centennial
The most frequent times of departure to work in Centennial are 7:00 AM to 7:29 AM (3,492, 14.2%) for males and 7:30 AM to 7:59 AM (3,661, 18.0%) for females.
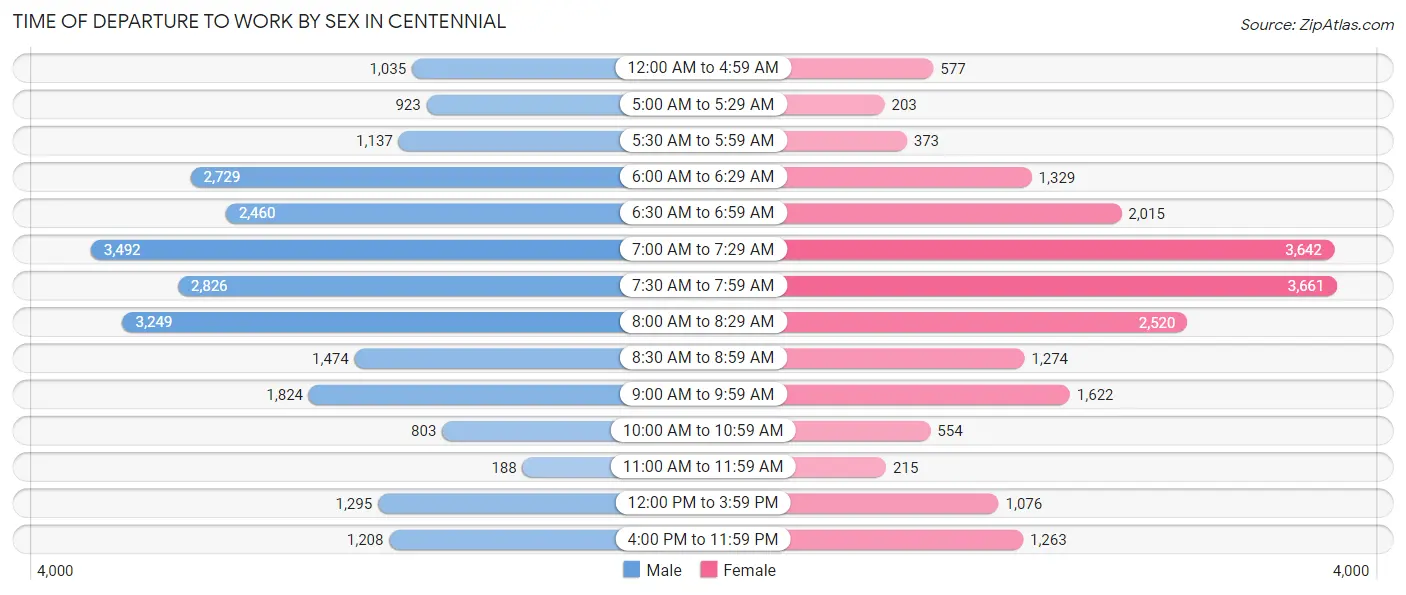
| Time of Departure | Male | Female |
| 12:00 AM to 4:59 AM | 1,035 (4.2%) | 577 (2.8%) |
| 5:00 AM to 5:29 AM | 923 (3.7%) | 203 (1.0%) |
| 5:30 AM to 5:59 AM | 1,137 (4.6%) | 373 (1.8%) |
| 6:00 AM to 6:29 AM | 2,729 (11.1%) | 1,329 (6.5%) |
| 6:30 AM to 6:59 AM | 2,460 (10.0%) | 2,015 (9.9%) |
| 7:00 AM to 7:29 AM | 3,492 (14.2%) | 3,642 (17.9%) |
| 7:30 AM to 7:59 AM | 2,826 (11.5%) | 3,661 (18.0%) |
| 8:00 AM to 8:29 AM | 3,249 (13.2%) | 2,520 (12.4%) |
| 8:30 AM to 8:59 AM | 1,474 (6.0%) | 1,274 (6.3%) |
| 9:00 AM to 9:59 AM | 1,824 (7.4%) | 1,622 (8.0%) |
| 10:00 AM to 10:59 AM | 803 (3.3%) | 554 (2.7%) |
| 11:00 AM to 11:59 AM | 188 (0.8%) | 215 (1.1%) |
| 12:00 PM to 3:59 PM | 1,295 (5.3%) | 1,076 (5.3%) |
| 4:00 PM to 11:59 PM | 1,208 (4.9%) | 1,263 (6.2%) |
| Total | 24,643 (100.0%) | 20,324 (100.0%) |
Housing Occupancy in Centennial
Occupancy by Ownership in Centennial
Of the total 40,952 dwellings in Centennial, owner-occupied units account for 33,687 (82.3%), while renter-occupied units make up 7,265 (17.7%).
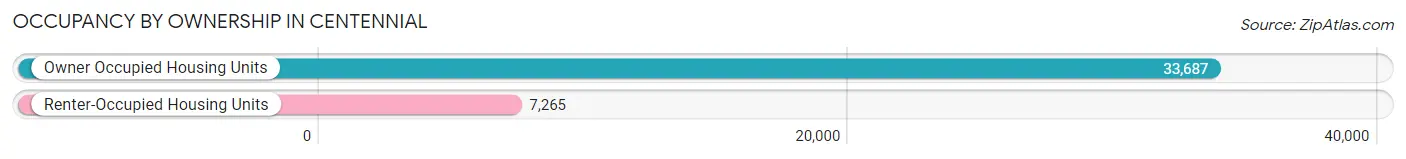
| Occupancy | # Housing Units | % Housing Units |
| Owner Occupied Housing Units | 33,687 | 82.3% |
| Renter-Occupied Housing Units | 7,265 | 17.7% |
| Total Occupied Housing Units | 40,952 | 100.0% |
Occupancy by Household Size in Centennial
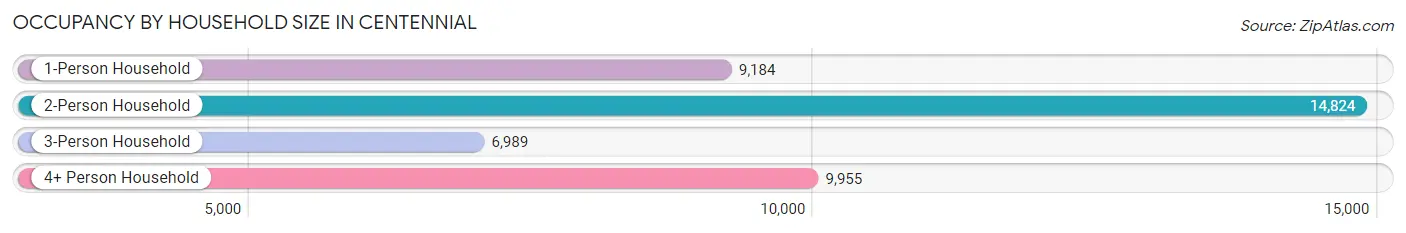
| Household Size | # Housing Units | % Housing Units |
| 1-Person Household | 9,184 | 22.4% |
| 2-Person Household | 14,824 | 36.2% |
| 3-Person Household | 6,989 | 17.1% |
| 4+ Person Household | 9,955 | 24.3% |
| Total Housing Units | 40,952 | 100.0% |
Occupancy by Ownership by Household Size in Centennial
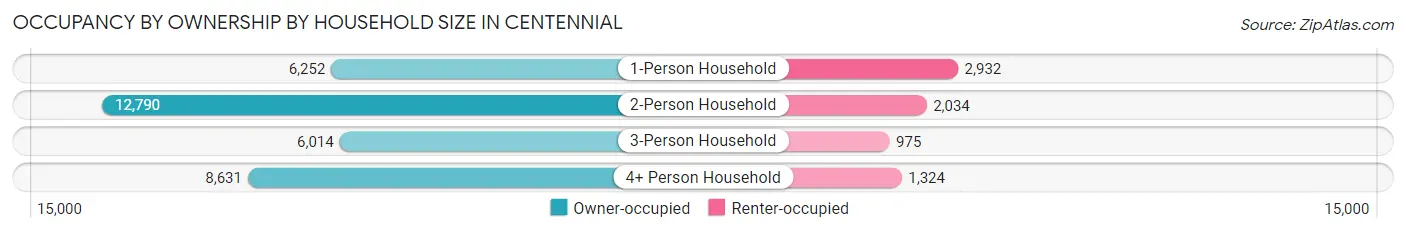
| Household Size | Owner-occupied | Renter-occupied |
| 1-Person Household | 6,252 (68.1%) | 2,932 (31.9%) |
| 2-Person Household | 12,790 (86.3%) | 2,034 (13.7%) |
| 3-Person Household | 6,014 (86.1%) | 975 (14.0%) |
| 4+ Person Household | 8,631 (86.7%) | 1,324 (13.3%) |
| Total Housing Units | 33,687 (82.3%) | 7,265 (17.7%) |
Occupancy by Educational Attainment in Centennial
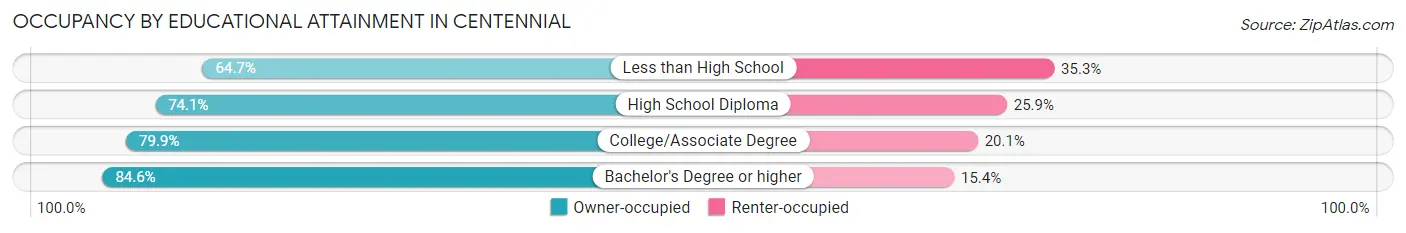
| Household Size | Owner-occupied | Renter-occupied |
| Less than High School | 431 (64.7%) | 235 (35.3%) |
| High School Diploma | 2,875 (74.1%) | 1,005 (25.9%) |
| College/Associate Degree | 6,883 (79.9%) | 1,735 (20.1%) |
| Bachelor's Degree or higher | 23,498 (84.6%) | 4,290 (15.4%) |
Occupancy by Age of Householder in Centennial
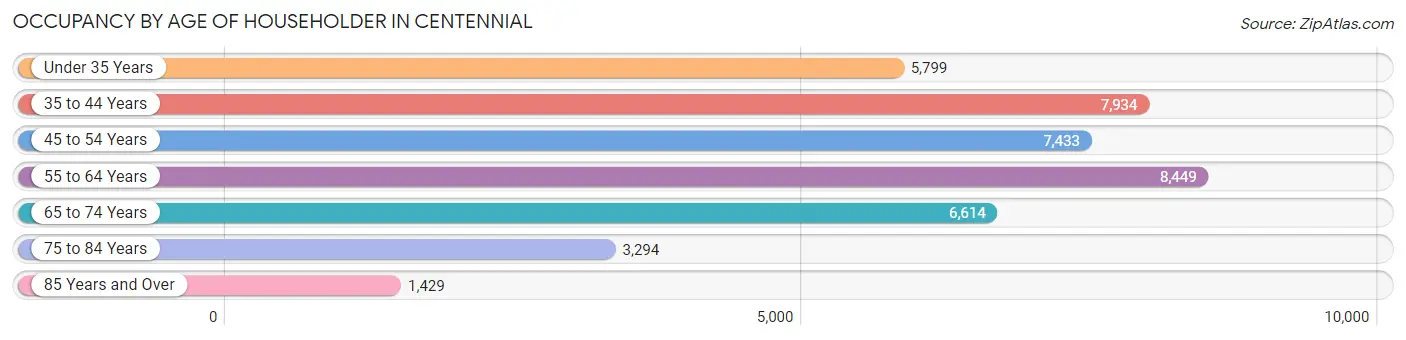
| Age Bracket | # Households | % Households |
| Under 35 Years | 5,799 | 14.2% |
| 35 to 44 Years | 7,934 | 19.4% |
| 45 to 54 Years | 7,433 | 18.1% |
| 55 to 64 Years | 8,449 | 20.6% |
| 65 to 74 Years | 6,614 | 16.2% |
| 75 to 84 Years | 3,294 | 8.0% |
| 85 Years and Over | 1,429 | 3.5% |
| Total | 40,952 | 100.0% |
Housing Finances in Centennial
Median Income by Occupancy in Centennial
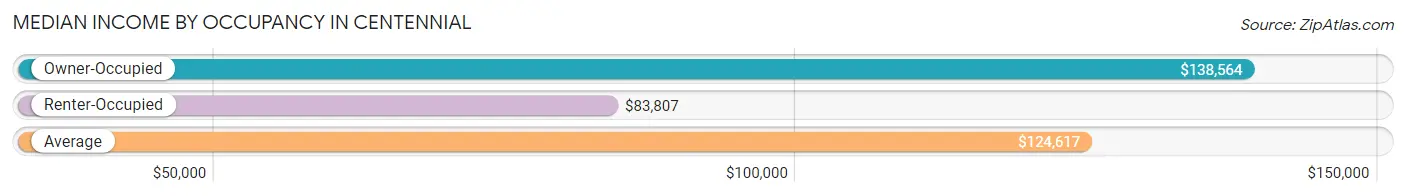
| Occupancy Type | # Households | Median Income |
| Owner-Occupied | 33,687 (82.3%) | $138,564 |
| Renter-Occupied | 7,265 (17.7%) | $83,807 |
| Average | 40,952 (100.0%) | $124,617 |
Occupancy by Householder Income Bracket in Centennial
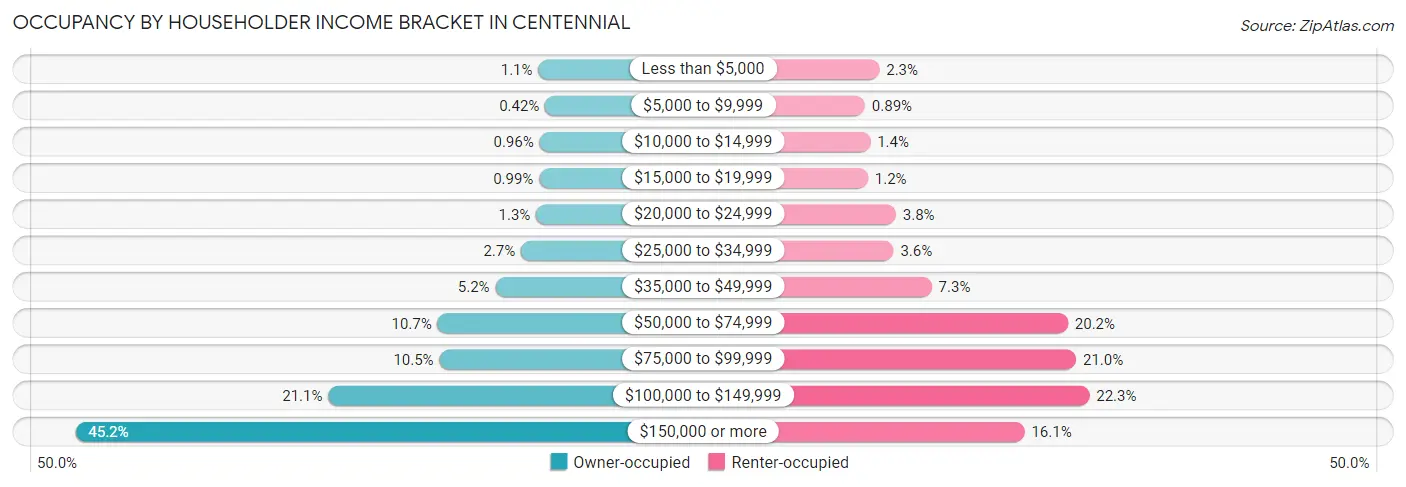
| Income Bracket | Owner-occupied | Renter-occupied |
| Less than $5,000 | 359 (1.1%) | 164 (2.3%) |
| $5,000 to $9,999 | 143 (0.4%) | 65 (0.9%) |
| $10,000 to $14,999 | 325 (1.0%) | 102 (1.4%) |
| $15,000 to $19,999 | 332 (1.0%) | 85 (1.2%) |
| $20,000 to $24,999 | 431 (1.3%) | 279 (3.8%) |
| $25,000 to $34,999 | 917 (2.7%) | 262 (3.6%) |
| $35,000 to $49,999 | 1,739 (5.2%) | 527 (7.2%) |
| $50,000 to $74,999 | 3,596 (10.7%) | 1,469 (20.2%) |
| $75,000 to $99,999 | 3,533 (10.5%) | 1,526 (21.0%) |
| $100,000 to $149,999 | 7,100 (21.1%) | 1,617 (22.3%) |
| $150,000 or more | 15,212 (45.2%) | 1,169 (16.1%) |
| Total | 33,687 (100.0%) | 7,265 (100.0%) |
Monthly Housing Cost Tiers in Centennial
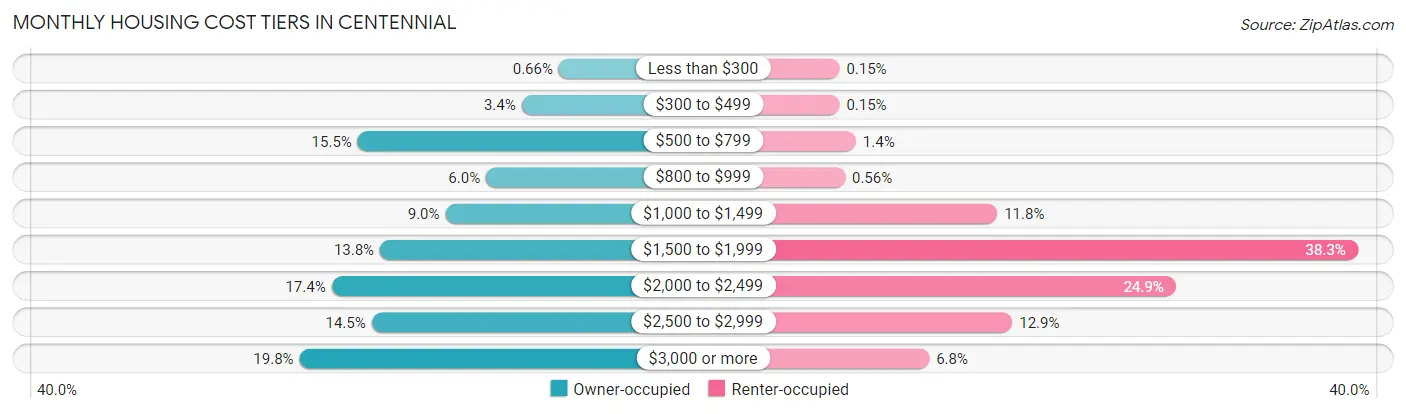
| Monthly Cost | Owner-occupied | Renter-occupied |
| Less than $300 | 223 (0.7%) | 11 (0.2%) |
| $300 to $499 | 1,144 (3.4%) | 11 (0.2%) |
| $500 to $799 | 5,213 (15.5%) | 99 (1.4%) |
| $800 to $999 | 2,028 (6.0%) | 41 (0.6%) |
| $1,000 to $1,499 | 3,036 (9.0%) | 855 (11.8%) |
| $1,500 to $1,999 | 4,659 (13.8%) | 2,783 (38.3%) |
| $2,000 to $2,499 | 5,860 (17.4%) | 1,810 (24.9%) |
| $2,500 to $2,999 | 4,868 (14.4%) | 936 (12.9%) |
| $3,000 or more | 6,656 (19.8%) | 491 (6.8%) |
| Total | 33,687 (100.0%) | 7,265 (100.0%) |
Physical Housing Characteristics in Centennial
Housing Structures in Centennial
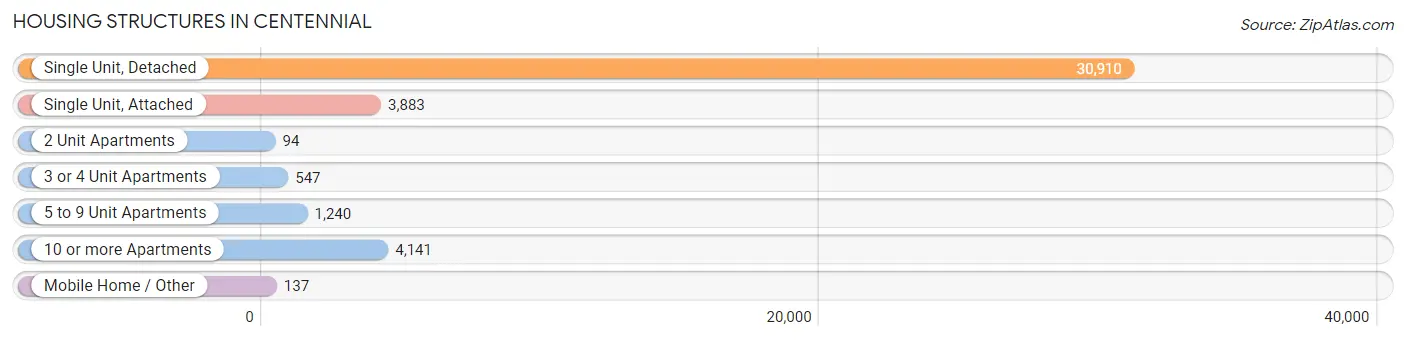
| Structure Type | # Housing Units | % Housing Units |
| Single Unit, Detached | 30,910 | 75.5% |
| Single Unit, Attached | 3,883 | 9.5% |
| 2 Unit Apartments | 94 | 0.2% |
| 3 or 4 Unit Apartments | 547 | 1.3% |
| 5 to 9 Unit Apartments | 1,240 | 3.0% |
| 10 or more Apartments | 4,141 | 10.1% |
| Mobile Home / Other | 137 | 0.3% |
| Total | 40,952 | 100.0% |
Housing Structures by Occupancy in Centennial
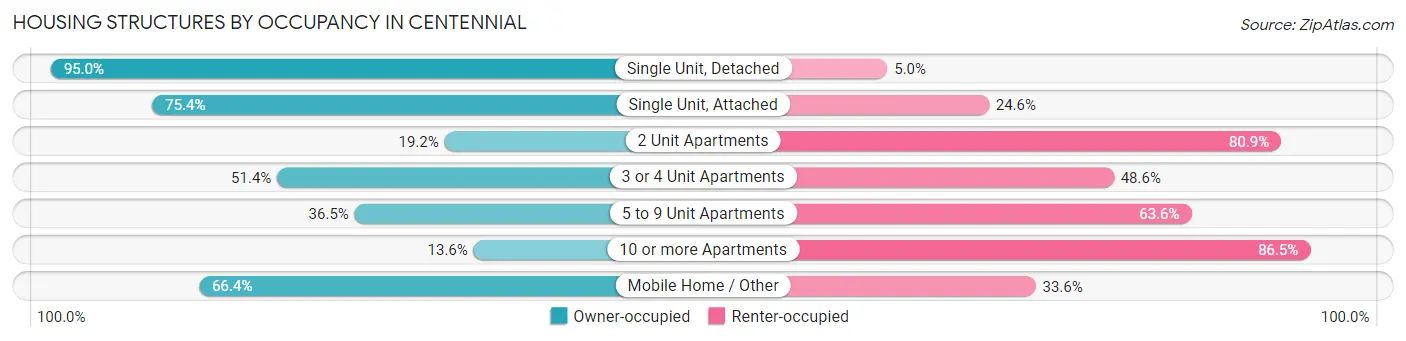
| Structure Type | Owner-occupied | Renter-occupied |
| Single Unit, Detached | 29,355 (95.0%) | 1,555 (5.0%) |
| Single Unit, Attached | 2,929 (75.4%) | 954 (24.6%) |
| 2 Unit Apartments | 18 (19.2%) | 76 (80.8%) |
| 3 or 4 Unit Apartments | 281 (51.4%) | 266 (48.6%) |
| 5 to 9 Unit Apartments | 452 (36.4%) | 788 (63.5%) |
| 10 or more Apartments | 561 (13.6%) | 3,580 (86.5%) |
| Mobile Home / Other | 91 (66.4%) | 46 (33.6%) |
| Total | 33,687 (82.3%) | 7,265 (17.7%) |
Housing Structures by Number of Rooms in Centennial
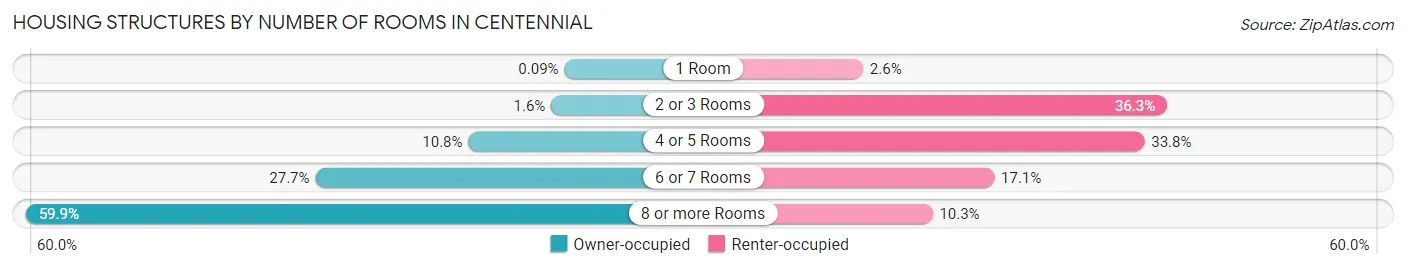
| Number of Rooms | Owner-occupied | Renter-occupied |
| 1 Room | 32 (0.1%) | 185 (2.5%) |
| 2 or 3 Rooms | 526 (1.6%) | 2,637 (36.3%) |
| 4 or 5 Rooms | 3,620 (10.7%) | 2,454 (33.8%) |
| 6 or 7 Rooms | 9,341 (27.7%) | 1,243 (17.1%) |
| 8 or more Rooms | 20,168 (59.9%) | 746 (10.3%) |
| Total | 33,687 (100.0%) | 7,265 (100.0%) |
Housing Structure by Heating Type in Centennial
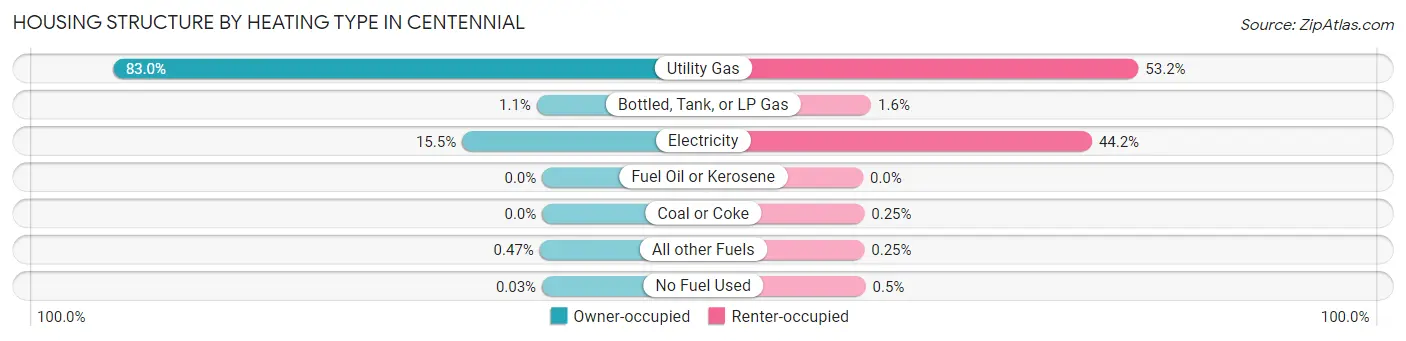
| Heating Type | Owner-occupied | Renter-occupied |
| Utility Gas | 27,951 (83.0%) | 3,866 (53.2%) |
| Bottled, Tank, or LP Gas | 353 (1.1%) | 114 (1.6%) |
| Electricity | 5,215 (15.5%) | 3,213 (44.2%) |
| Fuel Oil or Kerosene | 0 (0.0%) | 0 (0.0%) |
| Coal or Coke | 0 (0.0%) | 18 (0.3%) |
| All other Fuels | 159 (0.5%) | 18 (0.3%) |
| No Fuel Used | 9 (0.0%) | 36 (0.5%) |
| Total | 33,687 (100.0%) | 7,265 (100.0%) |
Household Vehicle Usage in Centennial
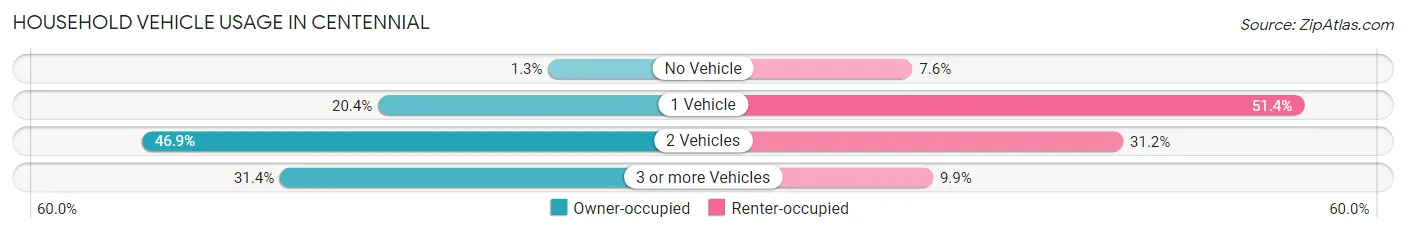
| Vehicles per Household | Owner-occupied | Renter-occupied |
| No Vehicle | 449 (1.3%) | 549 (7.6%) |
| 1 Vehicle | 6,875 (20.4%) | 3,736 (51.4%) |
| 2 Vehicles | 15,787 (46.9%) | 2,264 (31.2%) |
| 3 or more Vehicles | 10,576 (31.4%) | 716 (9.9%) |
| Total | 33,687 (100.0%) | 7,265 (100.0%) |
Real Estate & Mortgages in Centennial
Real Estate and Mortgage Overview in Centennial
| Characteristic | Without Mortgage | With Mortgage |
| Housing Units | 9,498 | 24,189 |
| Median Property Value | $580,800 | $588,600 |
| Median Household Income | $102,403 | $12,134 |
| Monthly Housing Costs | $712 | $6,628 |
| Real Estate Taxes | $3,200 | $262 |
Property Value by Mortgage Status in Centennial
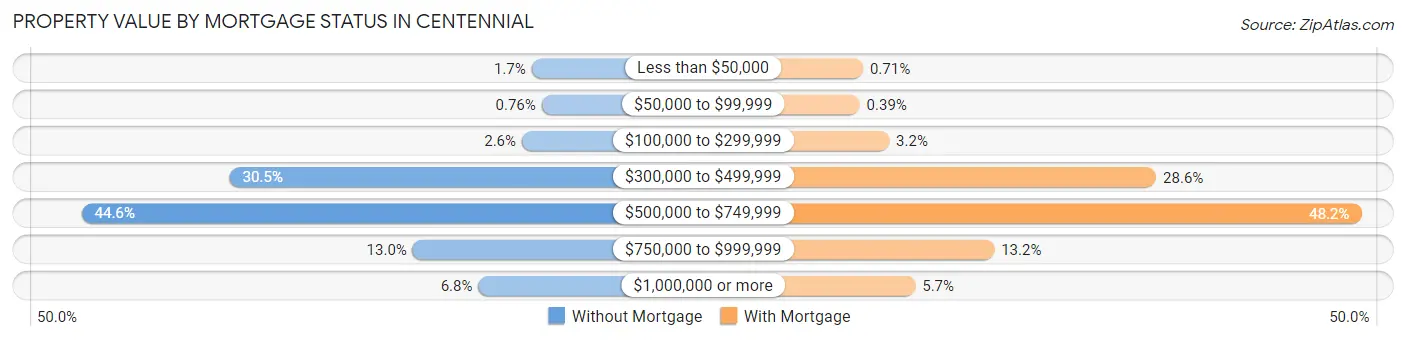
| Property Value | Without Mortgage | With Mortgage |
| Less than $50,000 | 163 (1.7%) | 171 (0.7%) |
| $50,000 to $99,999 | 72 (0.8%) | 94 (0.4%) |
| $100,000 to $299,999 | 251 (2.6%) | 774 (3.2%) |
| $300,000 to $499,999 | 2,895 (30.5%) | 6,926 (28.6%) |
| $500,000 to $749,999 | 4,233 (44.6%) | 11,652 (48.2%) |
| $750,000 to $999,999 | 1,239 (13.0%) | 3,196 (13.2%) |
| $1,000,000 or more | 645 (6.8%) | 1,376 (5.7%) |
| Total | 9,498 (100.0%) | 24,189 (100.0%) |
Household Income by Mortgage Status in Centennial
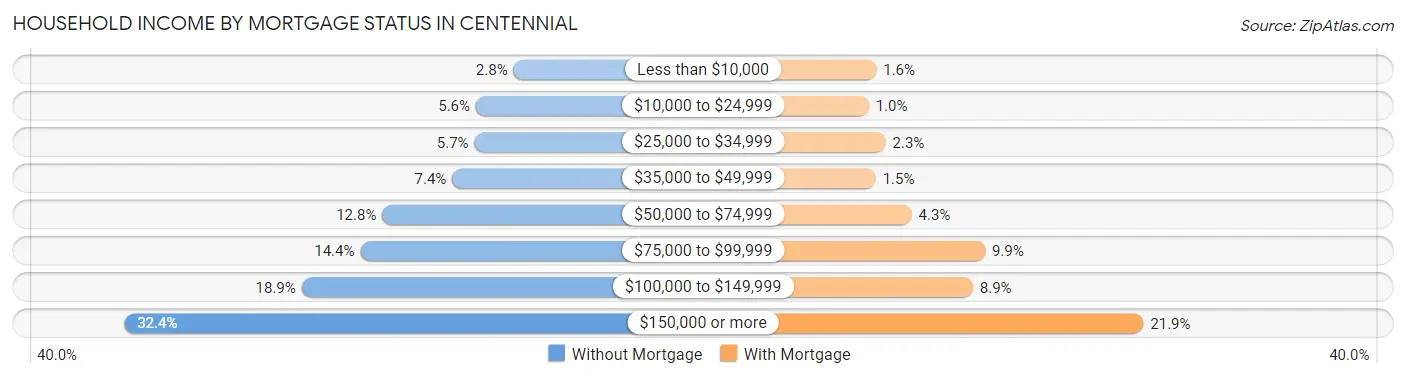
| Household Income | Without Mortgage | With Mortgage |
| Less than $10,000 | 261 (2.8%) | 381 (1.6%) |
| $10,000 to $24,999 | 534 (5.6%) | 241 (1.0%) |
| $25,000 to $34,999 | 544 (5.7%) | 554 (2.3%) |
| $35,000 to $49,999 | 705 (7.4%) | 373 (1.5%) |
| $50,000 to $74,999 | 1,211 (12.8%) | 1,034 (4.3%) |
| $75,000 to $99,999 | 1,370 (14.4%) | 2,385 (9.9%) |
| $100,000 to $149,999 | 1,795 (18.9%) | 2,163 (8.9%) |
| $150,000 or more | 3,078 (32.4%) | 5,305 (21.9%) |
| Total | 9,498 (100.0%) | 24,189 (100.0%) |
Property Value to Household Income Ratio in Centennial
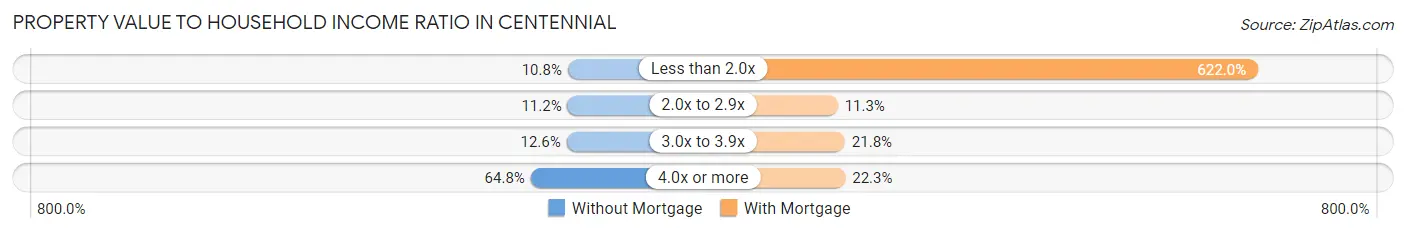
| Value-to-Income Ratio | Without Mortgage | With Mortgage |
| Less than 2.0x | 1,030 (10.8%) | 150,455 (622.0%) |
| 2.0x to 2.9x | 1,067 (11.2%) | 2,725 (11.3%) |
| 3.0x to 3.9x | 1,193 (12.6%) | 5,271 (21.8%) |
| 4.0x or more | 6,151 (64.8%) | 5,397 (22.3%) |
| Total | 9,498 (100.0%) | 24,189 (100.0%) |
Real Estate Taxes by Mortgage Status in Centennial
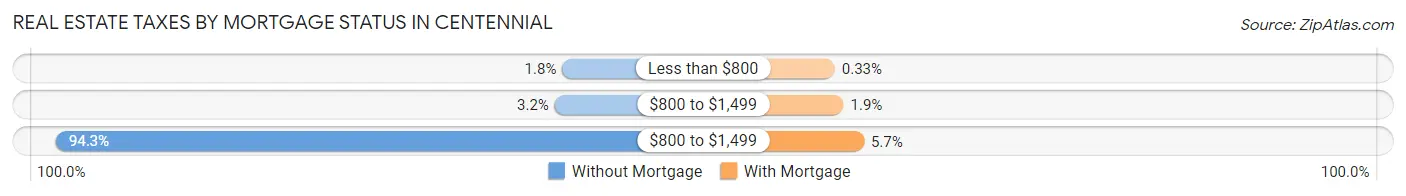
| Property Taxes | Without Mortgage | With Mortgage |
| Less than $800 | 171 (1.8%) | 81 (0.3%) |
| $800 to $1,499 | 302 (3.2%) | 464 (1.9%) |
| $800 to $1,499 | 8,955 (94.3%) | 1,366 (5.7%) |
| Total | 9,498 (100.0%) | 24,189 (100.0%) |
Health & Disability in Centennial
Health Insurance Coverage by Age in Centennial
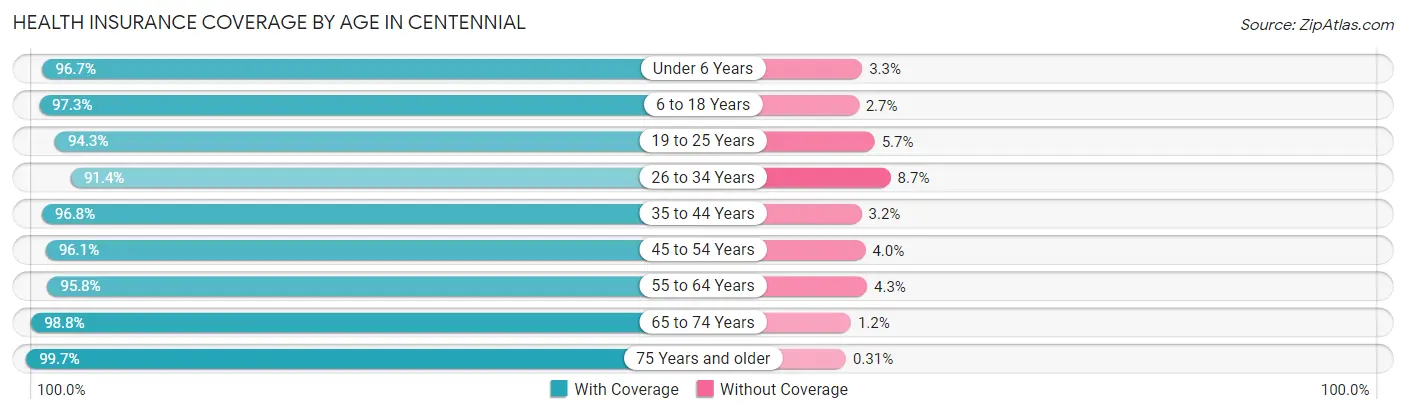
| Age Bracket | With Coverage | Without Coverage |
| Under 6 Years | 7,000 (96.7%) | 242 (3.3%) |
| 6 to 18 Years | 17,623 (97.3%) | 487 (2.7%) |
| 19 to 25 Years | 6,493 (94.3%) | 390 (5.7%) |
| 26 to 34 Years | 9,935 (91.3%) | 941 (8.6%) |
| 35 to 44 Years | 15,075 (96.8%) | 503 (3.2%) |
| 45 to 54 Years | 13,577 (96.1%) | 559 (4.0%) |
| 55 to 64 Years | 13,869 (95.8%) | 616 (4.3%) |
| 65 to 74 Years | 11,364 (98.8%) | 143 (1.2%) |
| 75 Years and older | 7,366 (99.7%) | 23 (0.3%) |
| Total | 102,302 (96.3%) | 3,904 (3.7%) |
Health Insurance Coverage by Citizenship Status in Centennial
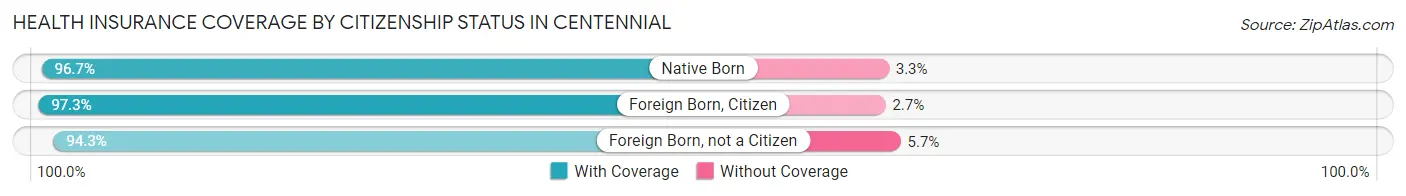
| Citizenship Status | With Coverage | Without Coverage |
| Native Born | 7,000 (96.7%) | 242 (3.3%) |
| Foreign Born, Citizen | 17,623 (97.3%) | 487 (2.7%) |
| Foreign Born, not a Citizen | 6,493 (94.3%) | 390 (5.7%) |
Health Insurance Coverage by Household Income in Centennial
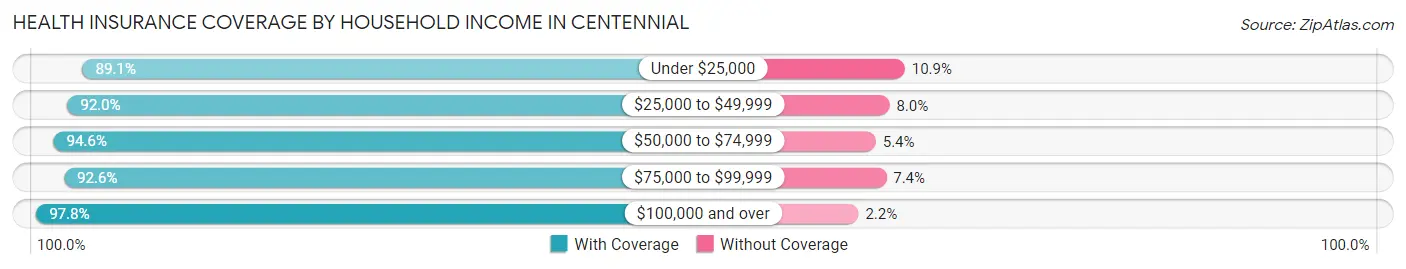
| Household Income | With Coverage | Without Coverage |
| Under $25,000 | 3,101 (89.1%) | 378 (10.9%) |
| $25,000 to $49,999 | 4,911 (92.0%) | 427 (8.0%) |
| $50,000 to $74,999 | 10,350 (94.6%) | 594 (5.4%) |
| $75,000 to $99,999 | 10,719 (92.6%) | 856 (7.4%) |
| $100,000 and over | 72,918 (97.8%) | 1,632 (2.2%) |
Public vs Private Health Insurance Coverage by Age in Centennial
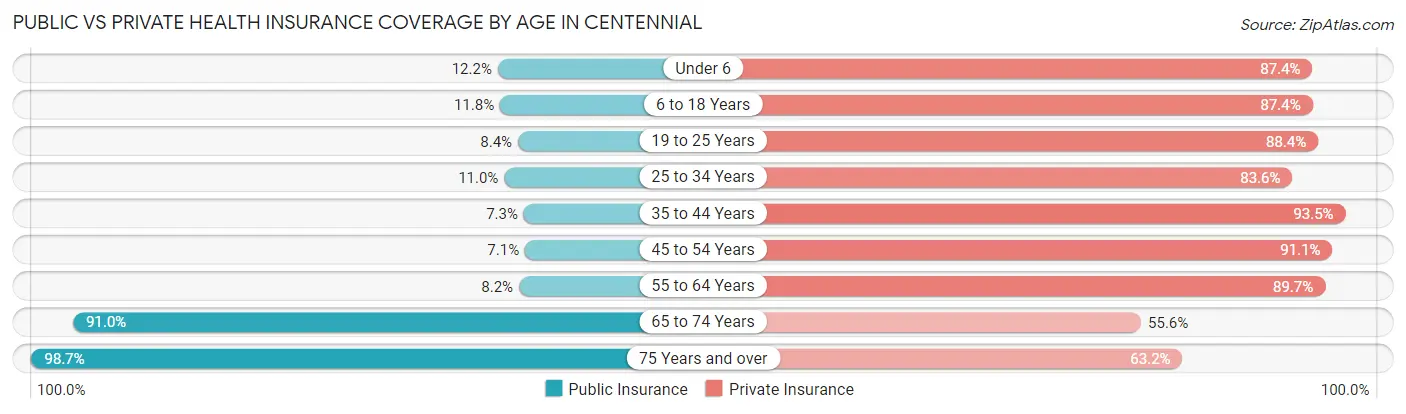
| Age Bracket | Public Insurance | Private Insurance |
| Under 6 | 882 (12.2%) | 6,326 (87.4%) |
| 6 to 18 Years | 2,129 (11.8%) | 15,825 (87.4%) |
| 19 to 25 Years | 580 (8.4%) | 6,084 (88.4%) |
| 25 to 34 Years | 1,194 (11.0%) | 9,095 (83.6%) |
| 35 to 44 Years | 1,143 (7.3%) | 14,562 (93.5%) |
| 45 to 54 Years | 1,007 (7.1%) | 12,872 (91.1%) |
| 55 to 64 Years | 1,193 (8.2%) | 12,993 (89.7%) |
| 65 to 74 Years | 10,474 (91.0%) | 6,393 (55.6%) |
| 75 Years and over | 7,296 (98.7%) | 4,671 (63.2%) |
| Total | 25,898 (24.4%) | 88,821 (83.6%) |
Disability Status by Sex by Age in Centennial
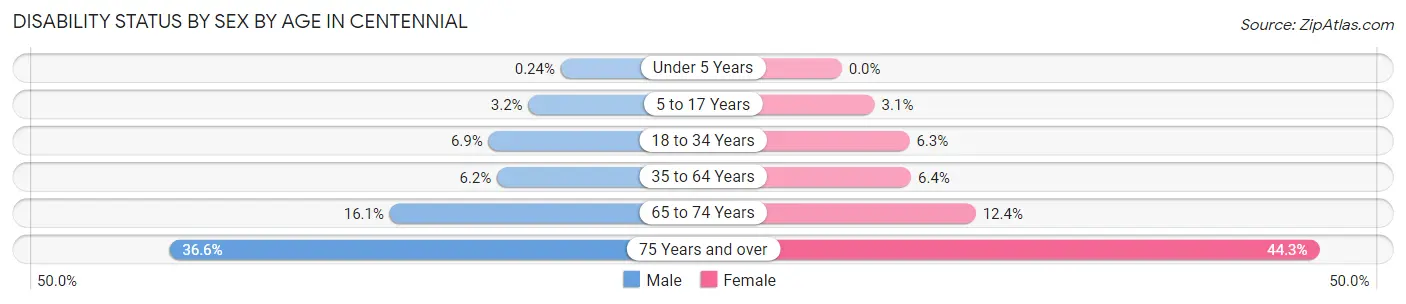
| Age Bracket | Male | Female |
| Under 5 Years | 7 (0.2%) | 0 (0.0%) |
| 5 to 17 Years | 312 (3.2%) | 273 (3.0%) |
| 18 to 34 Years | 694 (6.9%) | 562 (6.3%) |
| 35 to 64 Years | 1,340 (6.1%) | 1,441 (6.4%) |
| 65 to 74 Years | 905 (16.1%) | 732 (12.4%) |
| 75 Years and over | 1,167 (36.6%) | 1,860 (44.3%) |
Disability Class by Sex by Age in Centennial
Disability Class: Hearing Difficulty
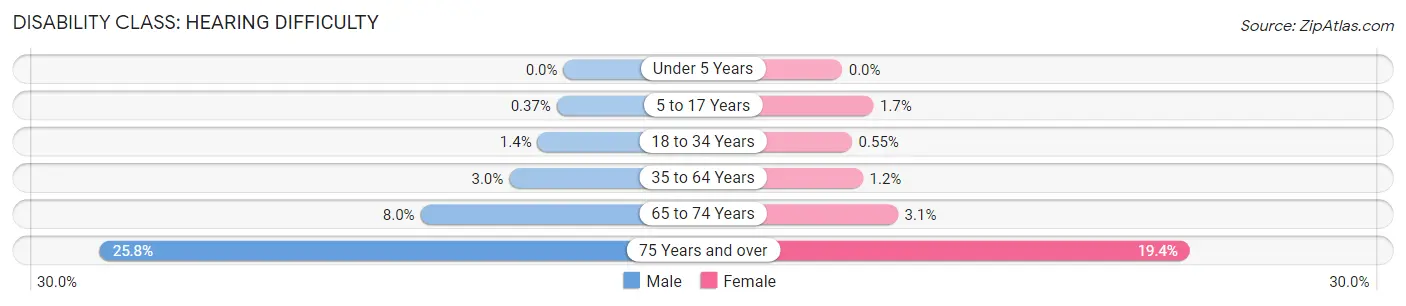
| Age Bracket | Male | Female |
| Under 5 Years | 0 (0.0%) | 0 (0.0%) |
| 5 to 17 Years | 36 (0.4%) | 156 (1.7%) |
| 18 to 34 Years | 144 (1.4%) | 49 (0.5%) |
| 35 to 64 Years | 659 (3.0%) | 261 (1.2%) |
| 65 to 74 Years | 447 (8.0%) | 183 (3.1%) |
| 75 Years and over | 824 (25.8%) | 813 (19.4%) |
Disability Class: Vision Difficulty
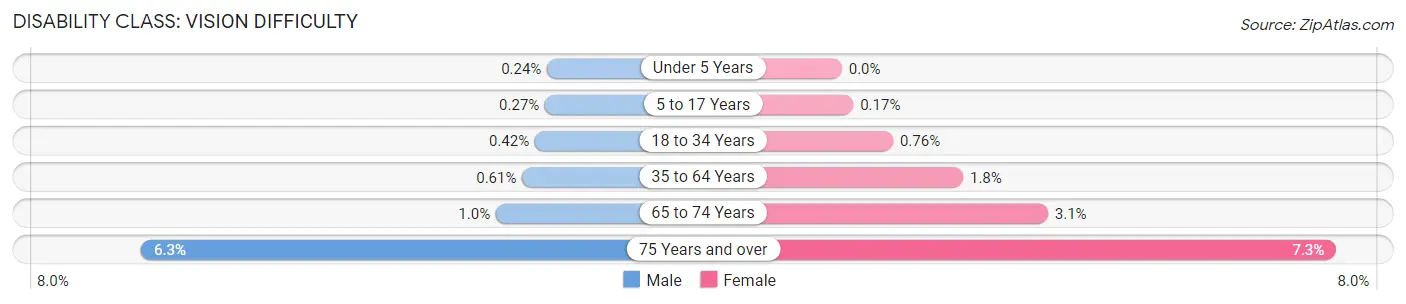
| Age Bracket | Male | Female |
| Under 5 Years | 7 (0.2%) | 0 (0.0%) |
| 5 to 17 Years | 26 (0.3%) | 15 (0.2%) |
| 18 to 34 Years | 42 (0.4%) | 68 (0.8%) |
| 35 to 64 Years | 132 (0.6%) | 404 (1.8%) |
| 65 to 74 Years | 56 (1.0%) | 180 (3.1%) |
| 75 Years and over | 200 (6.3%) | 308 (7.3%) |
Disability Class: Cognitive Difficulty
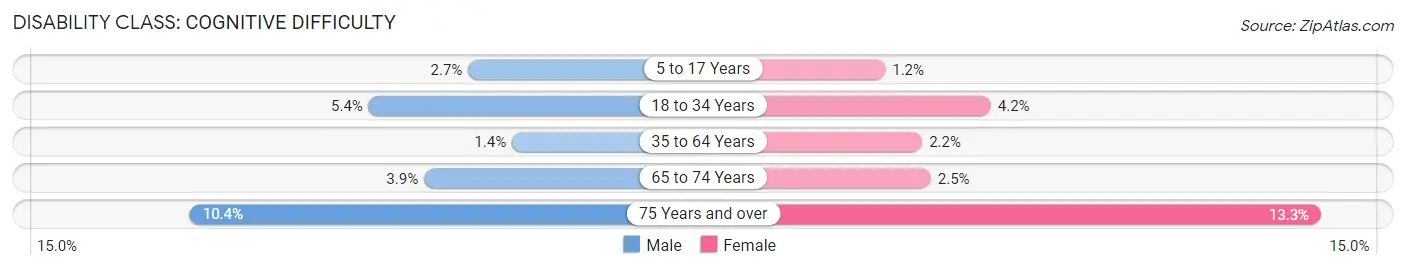
| Age Bracket | Male | Female |
| 5 to 17 Years | 255 (2.6%) | 108 (1.2%) |
| 18 to 34 Years | 542 (5.4%) | 371 (4.2%) |
| 35 to 64 Years | 312 (1.4%) | 501 (2.2%) |
| 65 to 74 Years | 218 (3.9%) | 146 (2.5%) |
| 75 Years and over | 332 (10.4%) | 560 (13.3%) |
Disability Class: Ambulatory Difficulty
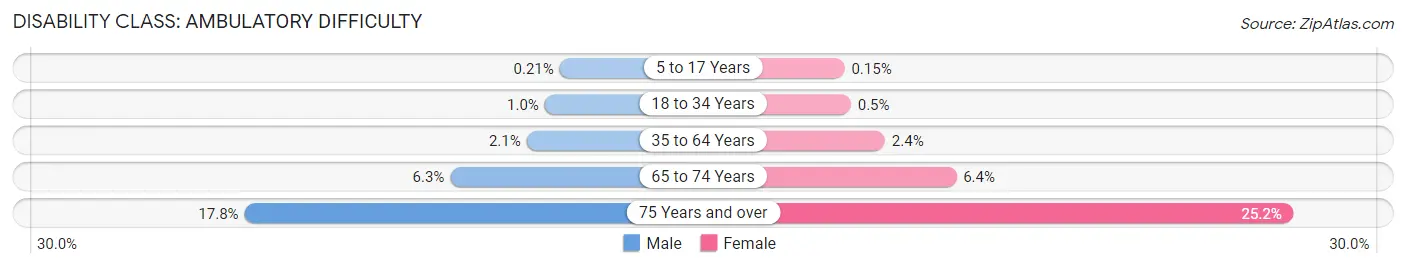
| Age Bracket | Male | Female |
| 5 to 17 Years | 20 (0.2%) | 13 (0.2%) |
| 18 to 34 Years | 104 (1.0%) | 45 (0.5%) |
| 35 to 64 Years | 447 (2.1%) | 538 (2.4%) |
| 65 to 74 Years | 354 (6.3%) | 375 (6.4%) |
| 75 Years and over | 567 (17.8%) | 1,056 (25.2%) |
Disability Class: Self-Care Difficulty
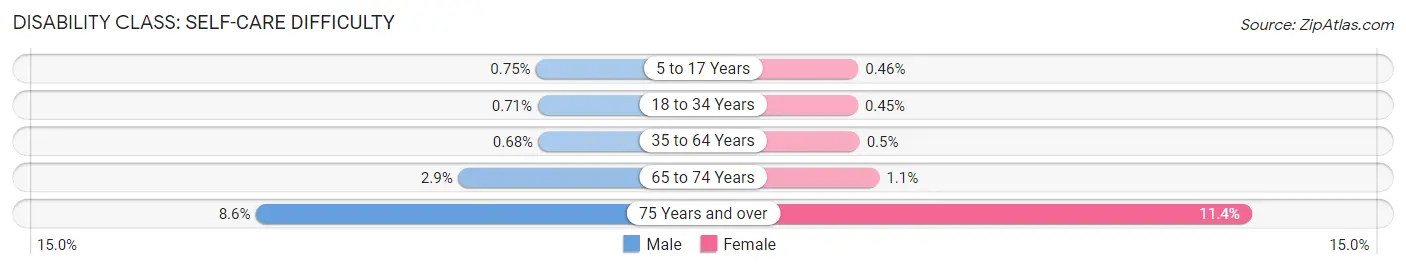
| Age Bracket | Male | Female |
| 5 to 17 Years | 72 (0.7%) | 41 (0.5%) |
| 18 to 34 Years | 71 (0.7%) | 40 (0.4%) |
| 35 to 64 Years | 148 (0.7%) | 113 (0.5%) |
| 65 to 74 Years | 164 (2.9%) | 62 (1.1%) |
| 75 Years and over | 273 (8.6%) | 479 (11.4%) |
Technology Access in Centennial
Computing Device Access in Centennial
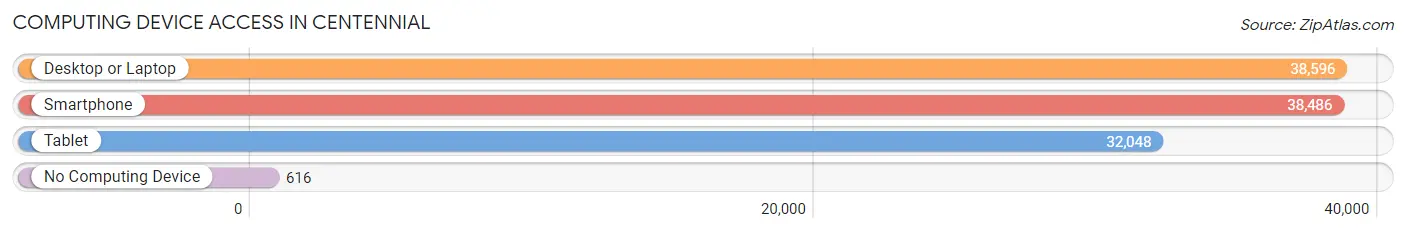
| Device Type | # Households | % Households |
| Desktop or Laptop | 38,596 | 94.3% |
| Smartphone | 38,486 | 94.0% |
| Tablet | 32,048 | 78.3% |
| No Computing Device | 616 | 1.5% |
| Total | 40,952 | 100.0% |
Internet Access in Centennial
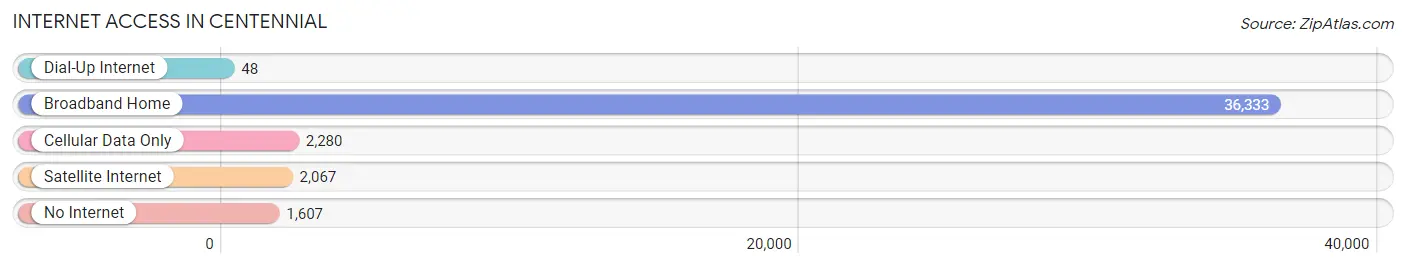
| Internet Type | # Households | % Households |
| Dial-Up Internet | 48 | 0.1% |
| Broadband Home | 36,333 | 88.7% |
| Cellular Data Only | 2,280 | 5.6% |
| Satellite Internet | 2,067 | 5.1% |
| No Internet | 1,607 | 3.9% |
| Total | 40,952 | 100.0% |
Centennial Summary
Centennial, Colorado is a city located in Arapahoe County, Colorado, United States. It is a suburb of Denver and is the tenth most populous city in the state. Centennial was incorporated in 2001, making it the newest municipality in the Denver metropolitan area. The city is located in the south-central portion of the Denver-Aurora-Lakewood, CO Metropolitan Statistical Area.
Geography
Centennial is located at 39°35'N 104°50'W (39.58, -104.83). It is situated at the base of the Rocky Mountains, approximately 12 miles (19 km) south of downtown Denver and 37 miles (60 km) north of Colorado Springs. The city covers an area of 30.1 square miles (78 km2), of which 0.1 square miles (0.26 km2) is water.
The city is bordered by the cities of Aurora to the north, Englewood to the east, Greenwood Village to the south, and Littleton to the west. The city is also bordered by unincorporated Arapahoe County to the north and east, and by Douglas County to the south and west.
Climate
Centennial has a semi-arid climate, with hot summers and cold winters. The average annual temperature is 52.2 °F (11.2 °C). The average annual precipitation is 16.7 inches (42 cm).
Demographics
As of the 2010 census, there were 100,377 people, 38,945 households, and 27,844 families residing in the city. The population density was 3,346.2 people per square mile (1,295.3/km2). There were 40,945 housing units at an average density of 1,360.7 per square mile (525.3/km2). The racial makeup of the city was 79.2% White, 5.2% African American, 0.5% Native American, 8.3% Asian, 0.1% Pacific Islander, 3.2% from other races, and 3.5% from two or more races. Hispanic or Latino of any race were 11.2% of the population.
Economy
Centennial is home to a variety of businesses, including several Fortune 500 companies. The city is home to the headquarters of Arrow Electronics, CH2M Hill, and MDC Holdings. Other major employers include Lockheed Martin, Comcast, and the University of Colorado Hospital.
The city also has a thriving retail sector, with several shopping centers and malls, including the Park Meadows Mall, Southglenn Mall, and the Streets at Southglenn.
Education
Centennial is served by the Littleton Public Schools, Cherry Creek School District, and the Douglas County School District. The city is also home to several private schools, including the Colorado Academy, the Denver Waldorf School, and the Denver Jewish Day School.
The city is home to the University of Colorado Denver South Campus, which offers a variety of undergraduate and graduate degree programs.
Transportation
Centennial is served by the Regional Transportation District (RTD), which operates a network of bus and light rail lines throughout the Denver metropolitan area. The city is also served by the Denver International Airport, which is located approximately 25 miles (40 km) to the northeast.
Conclusion
Centennial, Colorado is a vibrant city located in Arapahoe County, Colorado, United States. It is a suburb of Denver and is the tenth most populous city in the state. Centennial was incorporated in 2001, making it the newest municipality in the Denver metropolitan area. The city is located in the south-central portion of the Denver-Aurora-Lakewood, CO Metropolitan Statistical Area. Centennial has a semi-arid climate, with hot summers and cold winters. As of the 2010 census, there were 100,377 people, 38,945 households, and 27,844 families residing in the city. The city is home to a variety of businesses, including several Fortune 500 companies. Centennial is served by the Regional Transportation District (RTD), which operates a network of bus and light rail lines throughout the Denver metropolitan area. The city is also served by the Denver International Airport, which is located approximately 25 miles (40 km) to the northeast.
Common Questions
What is Per Capita Income in Centennial?
Per Capita income in Centennial is $60,727.
What is the Median Family Income in Centennial?
Median Family Income in Centennial is $147,309.
What is the Median Household income in Centennial?
Median Household Income in Centennial is $124,617.
What is Income or Wage Gap in Centennial?
Income or Wage Gap in Centennial is 32.2%.
Women in Centennial earn 67.8 cents for every dollar earned by a man.
What is Inequality or Gini Index in Centennial?
Inequality or Gini Index in Centennial is 0.41.
What is the Total Population of Centennial?
Total Population of Centennial is 107,702.
What is the Total Male Population of Centennial?
Total Male Population of Centennial is 54,230.
What is the Total Female Population of Centennial?
Total Female Population of Centennial is 53,472.
What is the Ratio of Males per 100 Females in Centennial?
There are 101.42 Males per 100 Females in Centennial.
What is the Ratio of Females per 100 Males in Centennial?
There are 98.60 Females per 100 Males in Centennial.
What is the Median Population Age in Centennial?
Median Population Age in Centennial is 41.6 Years.
What is the Average Family Size in Centennial
Average Family Size in Centennial is 3.0 People.
What is the Average Household Size in Centennial
Average Household Size in Centennial is 2.6 People.
How Large is the Labor Force in Centennial?
There are 59,995 People in the Labor Forcein in Centennial.
What is the Percentage of People in the Labor Force in Centennial?
69.2% of People are in the Labor Force in Centennial.
What is the Unemployment Rate in Centennial?
Unemployment Rate in Centennial is 3.4%.