Clinton, UT Map & Demographics
Clinton Map
Clinton Overview
$33,541
PER CAPITA INCOME
$108,333
AVG FAMILY INCOME
$102,712
AVG HOUSEHOLD INCOME
43.4%
WAGE / INCOME GAP [ % ]
56.6¢/ $1
WAGE / INCOME GAP [ $ ]
$11,359
FAMILY INCOME DEFICIT
0.31
INEQUALITY / GINI INDEX
23,389
TOTAL POPULATION
12,240
MALE POPULATION
11,149
FEMALE POPULATION
109.79
MALES / 100 FEMALES
91.09
FEMALES / 100 MALES
31.7
MEDIAN AGE
3.8
AVG FAMILY SIZE
3.5
AVG HOUSEHOLD SIZE
11,906
LABOR FORCE [ PEOPLE ]
70.8%
PERCENT IN LABOR FORCE
5.3%
UNEMPLOYMENT RATE
Income in Clinton
Income Overview in Clinton
Per Capita Income in Clinton is $33,541, while median incomes of families and households are $108,333 and $102,712 respectively.
| Characteristic | Number | Measure |
| Per Capita Income | 23,389 | $33,541 |
| Median Family Income | 5,670 | $108,333 |
| Mean Family Income | 5,670 | $118,100 |
| Median Household Income | 6,694 | $102,712 |
| Mean Household Income | 6,694 | $113,958 |
| Income Deficit | 5,670 | $11,359 |
| Wage / Income Gap (%) | 23,389 | 43.42% |
| Wage / Income Gap ($) | 23,389 | 56.58¢ per $1 |
| Gini / Inequality Index | 23,389 | 0.31 |
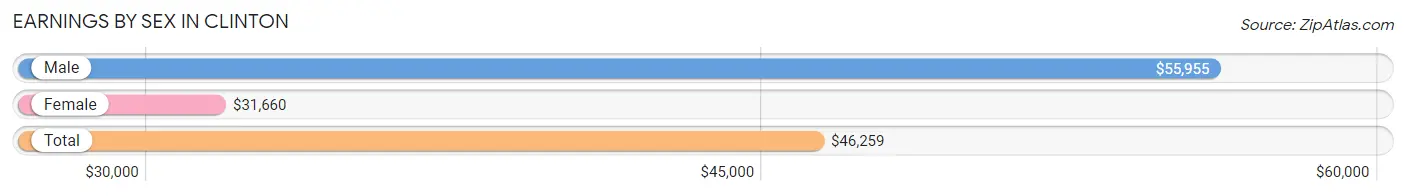
Earnings by Sex in Clinton
Average Earnings in Clinton are $46,259, $55,955 for men and $31,660 for women, a difference of 43.4%.
| Sex | Number | Average Earnings |
| Male | 6,976 (55.7%) | $55,955 |
| Female | 5,546 (44.3%) | $31,660 |
| Total | 12,522 (100.0%) | $46,259 |
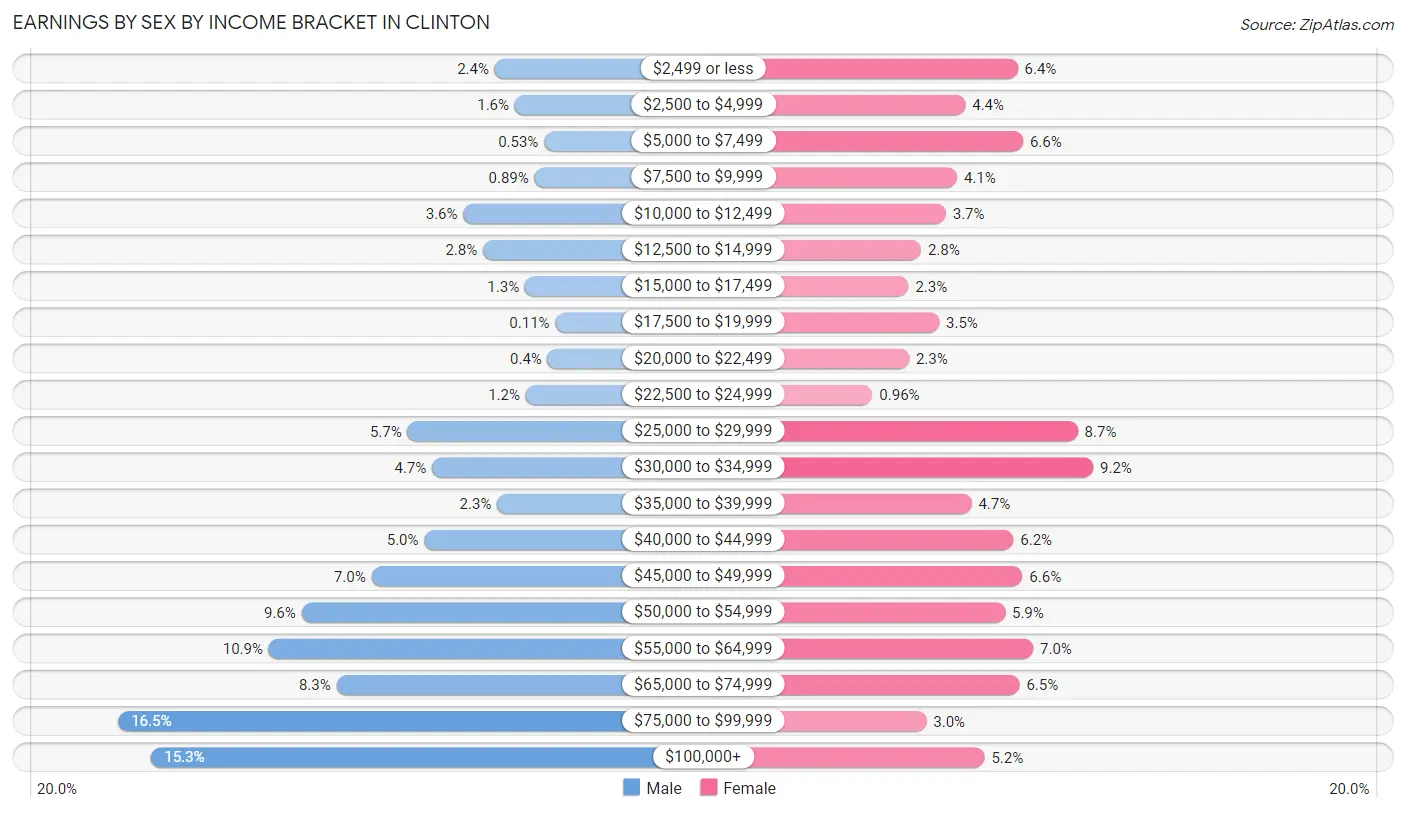
Earnings by Sex by Income Bracket in Clinton
The most common earnings brackets in Clinton are $75,000 to $99,999 for men (1,150 | 16.5%) and $30,000 to $34,999 for women (512 | 9.2%).
| Income | Male | Female |
| $2,499 or less | 166 (2.4%) | 355 (6.4%) |
| $2,500 to $4,999 | 114 (1.6%) | 246 (4.4%) |
| $5,000 to $7,499 | 37 (0.5%) | 366 (6.6%) |
| $7,500 to $9,999 | 62 (0.9%) | 229 (4.1%) |
| $10,000 to $12,499 | 248 (3.6%) | 206 (3.7%) |
| $12,500 to $14,999 | 197 (2.8%) | 154 (2.8%) |
| $15,000 to $17,499 | 87 (1.3%) | 128 (2.3%) |
| $17,500 to $19,999 | 8 (0.1%) | 192 (3.5%) |
| $20,000 to $22,499 | 28 (0.4%) | 129 (2.3%) |
| $22,500 to $24,999 | 85 (1.2%) | 53 (1.0%) |
| $25,000 to $29,999 | 394 (5.7%) | 480 (8.6%) |
| $30,000 to $34,999 | 330 (4.7%) | 512 (9.2%) |
| $35,000 to $39,999 | 160 (2.3%) | 259 (4.7%) |
| $40,000 to $44,999 | 350 (5.0%) | 346 (6.2%) |
| $45,000 to $49,999 | 488 (7.0%) | 365 (6.6%) |
| $50,000 to $54,999 | 671 (9.6%) | 329 (5.9%) |
| $55,000 to $64,999 | 757 (10.8%) | 387 (7.0%) |
| $65,000 to $74,999 | 580 (8.3%) | 359 (6.5%) |
| $75,000 to $99,999 | 1,150 (16.5%) | 165 (3.0%) |
| $100,000+ | 1,064 (15.2%) | 286 (5.2%) |
| Total | 6,976 (100.0%) | 5,546 (100.0%) |
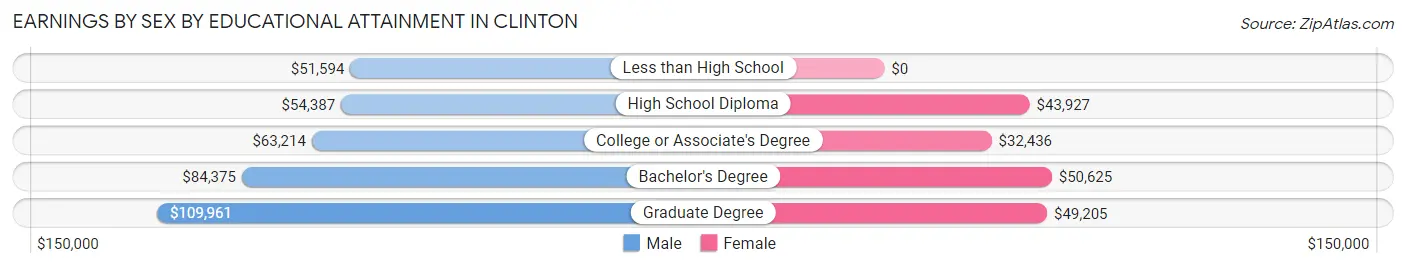
Earnings by Sex by Educational Attainment in Clinton
Average earnings in Clinton are $66,236 for men and $37,944 for women, a difference of 42.7%. Men with an educational attainment of graduate degree enjoy the highest average annual earnings of $109,961, while those with less than high school education earn the least with $51,594. Women with an educational attainment of bachelor's degree earn the most with the average annual earnings of $50,625, while those with college or associate's degree education have the smallest earnings of $32,436.
| Educational Attainment | Male Income | Female Income |
| Less than High School | $51,594 | $0 |
| High School Diploma | $54,387 | $43,927 |
| College or Associate's Degree | $63,214 | $32,436 |
| Bachelor's Degree | $84,375 | $50,625 |
| Graduate Degree | $109,961 | $49,205 |
| Total | $66,236 | $37,944 |
Family Income in Clinton
Family Income Brackets in Clinton
According to the Clinton family income data, there are 1,894 families falling into the $100,000 to $149,999 income range, which is the most common income bracket and makes up 33.4% of all families. Conversely, the $10,000 to $14,999 income bracket is the least frequent group with only 17 families (0.3%) belonging to this category.
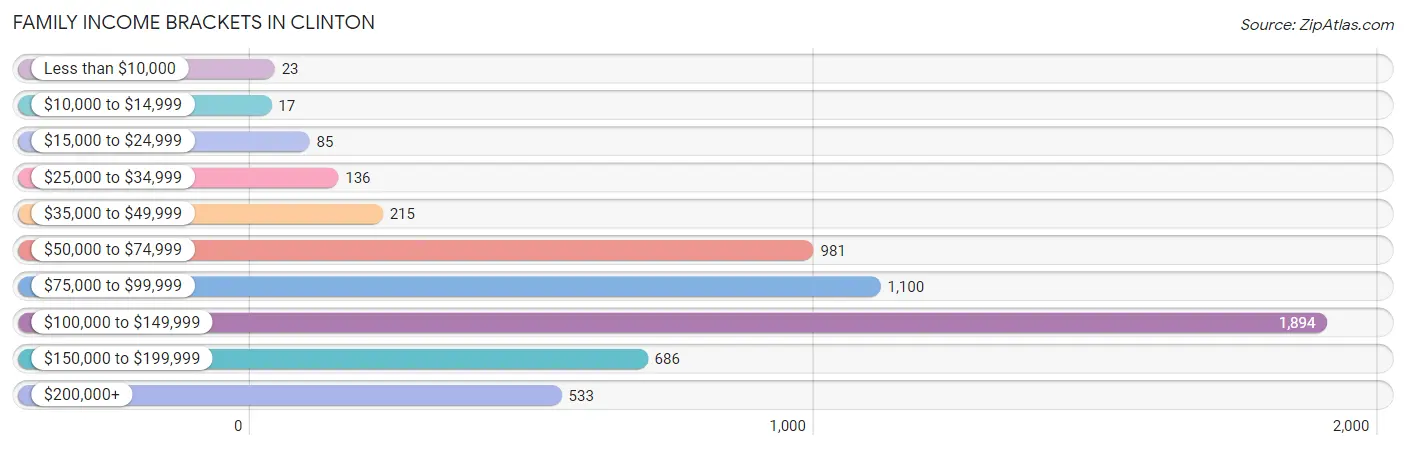
| Income Bracket | # Families | % Families |
| Less than $10,000 | 23 | 0.4% |
| $10,000 to $14,999 | 17 | 0.3% |
| $15,000 to $24,999 | 85 | 1.5% |
| $25,000 to $34,999 | 136 | 2.4% |
| $35,000 to $49,999 | 215 | 3.8% |
| $50,000 to $74,999 | 981 | 17.3% |
| $75,000 to $99,999 | 1,100 | 19.4% |
| $100,000 to $149,999 | 1,894 | 33.4% |
| $150,000 to $199,999 | 686 | 12.1% |
| $200,000+ | 533 | 9.4% |
Family Income by Famaliy Size in Clinton
7+ person families (421 | 7.4%) account for the highest median family income in Clinton with $148,084 per family, while 2-person families (1,712 | 30.2%) have the highest median income of $53,643 per family member.
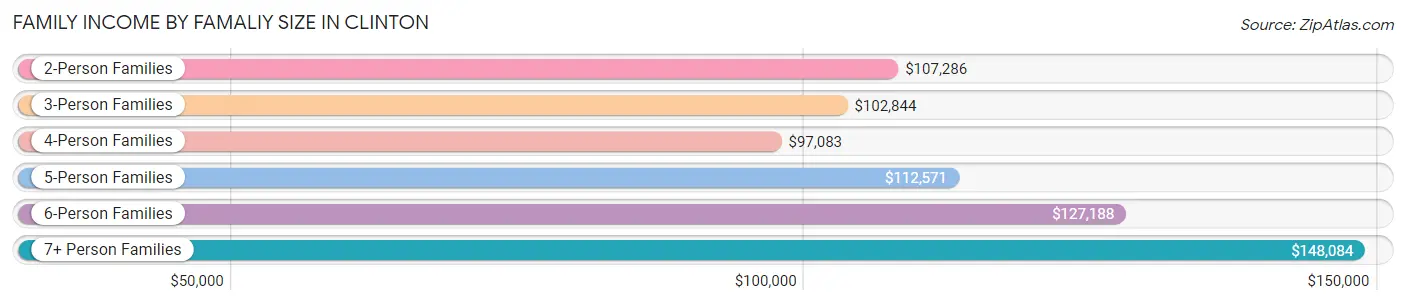
| Income Bracket | # Families | Median Income |
| 2-Person Families | 1,712 (30.2%) | $107,286 |
| 3-Person Families | 1,101 (19.4%) | $102,844 |
| 4-Person Families | 1,283 (22.6%) | $97,083 |
| 5-Person Families | 742 (13.1%) | $112,571 |
| 6-Person Families | 411 (7.2%) | $127,188 |
| 7+ Person Families | 421 (7.4%) | $148,084 |
| Total | 5,670 (100.0%) | $108,333 |
Family Income by Number of Earners in Clinton
The median family income in Clinton is $108,333, with families comprising 3+ earners (1,085) having the highest median family income of $149,624, while families with 1 earner (1,426) have the lowest median family income of $74,083, accounting for 19.1% and 25.2% of families, respectively.
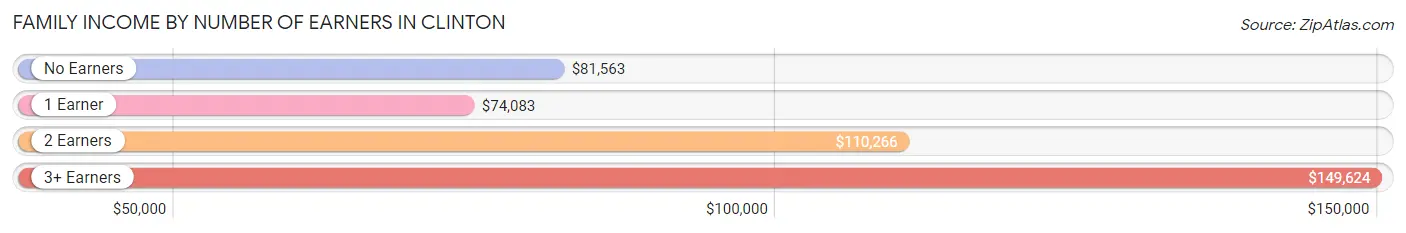
| Number of Earners | # Families | Median Income |
| No Earners | 468 (8.3%) | $81,563 |
| 1 Earner | 1,426 (25.2%) | $74,083 |
| 2 Earners | 2,691 (47.5%) | $110,266 |
| 3+ Earners | 1,085 (19.1%) | $149,624 |
| Total | 5,670 (100.0%) | $108,333 |
Household Income in Clinton
Household Income Brackets in Clinton
With 2,008 households falling in the category, the $100,000 to $149,999 income range is the most frequent in Clinton, accounting for 30.0% of all households. In contrast, only 40 households (0.6%) fall into the $10,000 to $14,999 income bracket, making it the least populous group.
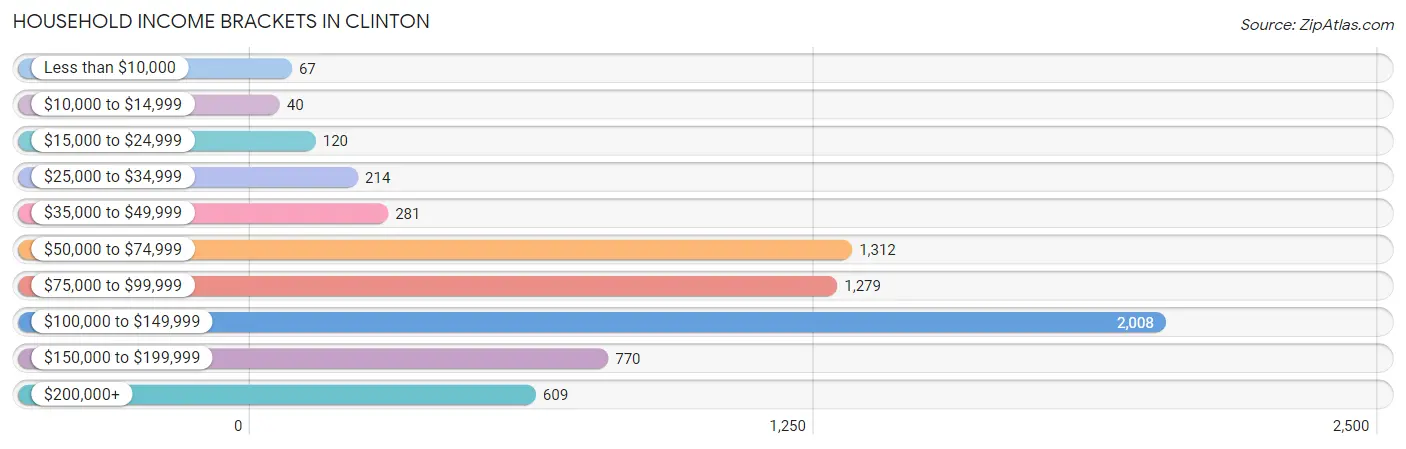
| Income Bracket | # Households | % Households |
| Less than $10,000 | 67 | 1.0% |
| $10,000 to $14,999 | 40 | 0.6% |
| $15,000 to $24,999 | 120 | 1.8% |
| $25,000 to $34,999 | 214 | 3.2% |
| $35,000 to $49,999 | 281 | 4.2% |
| $50,000 to $74,999 | 1,312 | 19.6% |
| $75,000 to $99,999 | 1,279 | 19.1% |
| $100,000 to $149,999 | 2,008 | 30.0% |
| $150,000 to $199,999 | 770 | 11.5% |
| $200,000+ | 609 | 9.1% |
Household Income by Householder Age in Clinton
The median household income in Clinton is $102,712, with the highest median household income of $130,015 found in the 45 to 64 years age bracket for the primary householder. A total of 2,605 households (38.9%) fall into this category. Meanwhile, the 15 to 24 years age bracket for the primary householder has the lowest median household income of $0, with 179 households (2.7%) in this group.
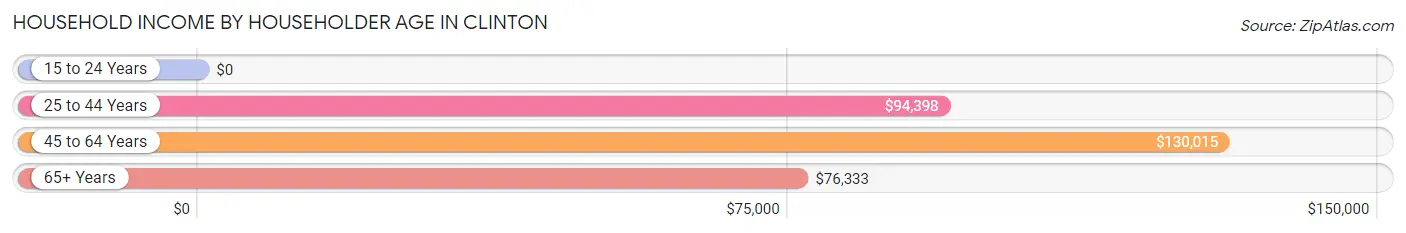
| Income Bracket | # Households | Median Income |
| 15 to 24 Years | 179 (2.7%) | $0 |
| 25 to 44 Years | 2,834 (42.3%) | $94,398 |
| 45 to 64 Years | 2,605 (38.9%) | $130,015 |
| 65+ Years | 1,076 (16.1%) | $76,333 |
| Total | 6,694 (100.0%) | $102,712 |
Poverty in Clinton
Income Below Poverty by Sex and Age in Clinton
With 3.6% poverty level for males and 4.6% for females among the residents of Clinton, 15 year old males and 5 year old females are the most vulnerable to poverty, with 57 males (17.4%) and 13 females (13.4%) in their respective age groups living below the poverty level.
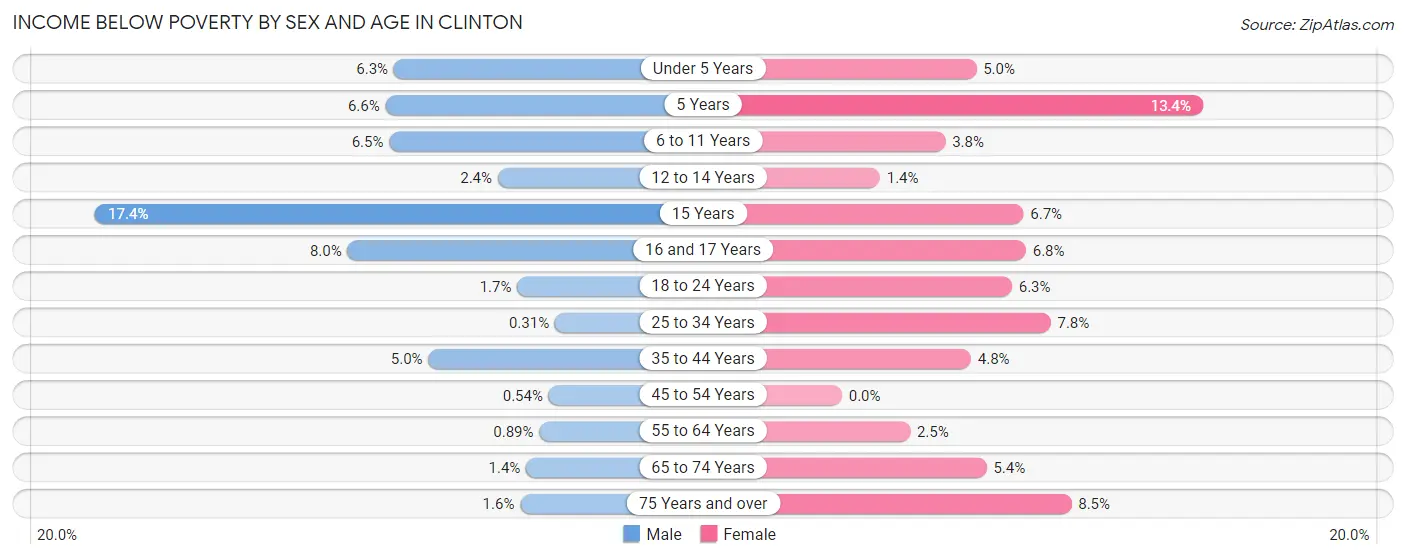
| Age Bracket | Male | Female |
| Under 5 Years | 54 (6.3%) | 53 (5.0%) |
| 5 Years | 13 (6.6%) | 13 (13.4%) |
| 6 to 11 Years | 105 (6.5%) | 37 (3.8%) |
| 12 to 14 Years | 14 (2.4%) | 9 (1.4%) |
| 15 Years | 57 (17.4%) | 13 (6.7%) |
| 16 and 17 Years | 50 (8.0%) | 19 (6.8%) |
| 18 to 24 Years | 23 (1.7%) | 73 (6.3%) |
| 25 to 34 Years | 4 (0.3%) | 113 (7.7%) |
| 35 to 44 Years | 91 (5.0%) | 83 (4.8%) |
| 45 to 54 Years | 8 (0.5%) | 0 (0.0%) |
| 55 to 64 Years | 10 (0.9%) | 30 (2.5%) |
| 65 to 74 Years | 9 (1.4%) | 41 (5.4%) |
| 75 Years and over | 5 (1.6%) | 30 (8.5%) |
| Total | 443 (3.6%) | 514 (4.6%) |
Income Above Poverty by Sex and Age in Clinton
According to the poverty statistics in Clinton, males aged 25 to 34 years and females aged 45 to 54 years are the age groups that are most secure financially, with 99.7% of males and 100.0% of females in these age groups living above the poverty line.
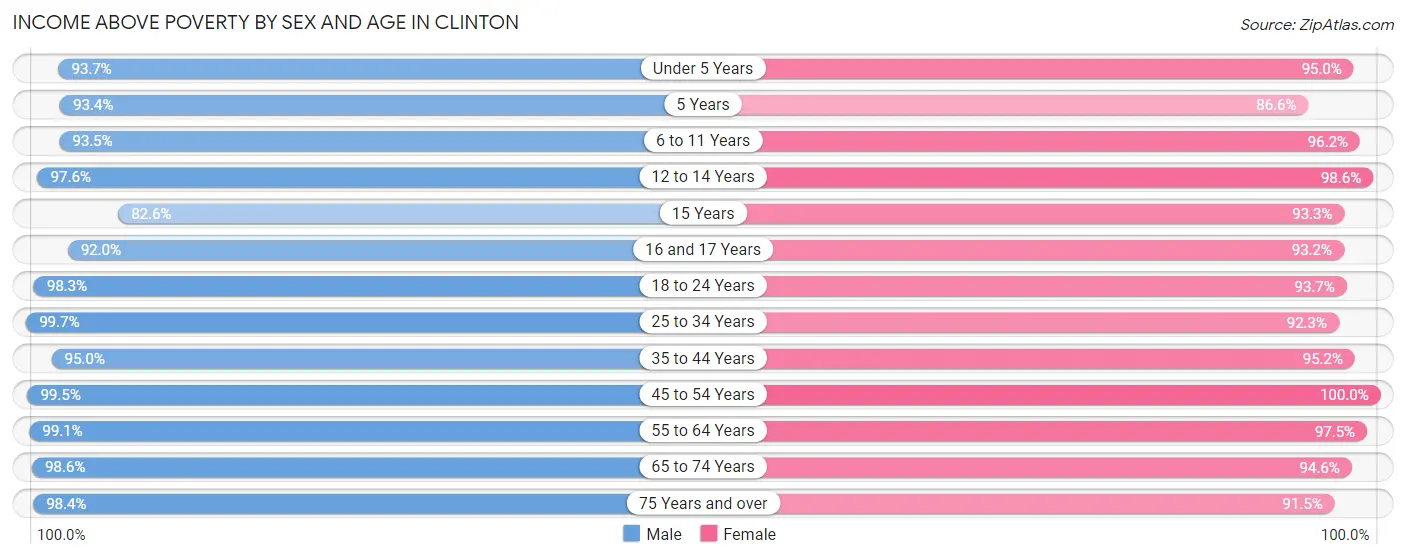
| Age Bracket | Male | Female |
| Under 5 Years | 805 (93.7%) | 1,010 (95.0%) |
| 5 Years | 184 (93.4%) | 84 (86.6%) |
| 6 to 11 Years | 1,521 (93.5%) | 927 (96.2%) |
| 12 to 14 Years | 562 (97.6%) | 629 (98.6%) |
| 15 Years | 271 (82.6%) | 180 (93.3%) |
| 16 and 17 Years | 574 (92.0%) | 259 (93.2%) |
| 18 to 24 Years | 1,319 (98.3%) | 1,084 (93.7%) |
| 25 to 34 Years | 1,303 (99.7%) | 1,345 (92.2%) |
| 35 to 44 Years | 1,725 (95.0%) | 1,650 (95.2%) |
| 45 to 54 Years | 1,465 (99.5%) | 1,242 (100.0%) |
| 55 to 64 Years | 1,111 (99.1%) | 1,155 (97.5%) |
| 65 to 74 Years | 643 (98.6%) | 723 (94.6%) |
| 75 Years and over | 307 (98.4%) | 322 (91.5%) |
| Total | 11,790 (96.4%) | 10,610 (95.4%) |
Income Below Poverty Among Married-Couple Families in Clinton
The poverty statistics for married-couple families in Clinton show that 1.8% or 85 of the total 4,865 families live below the poverty line. Families with 5 or more children have the highest poverty rate of 10.5%, comprising of 16 families. On the other hand, families with no children have the lowest poverty rate of 0.4%, which includes 9 families.
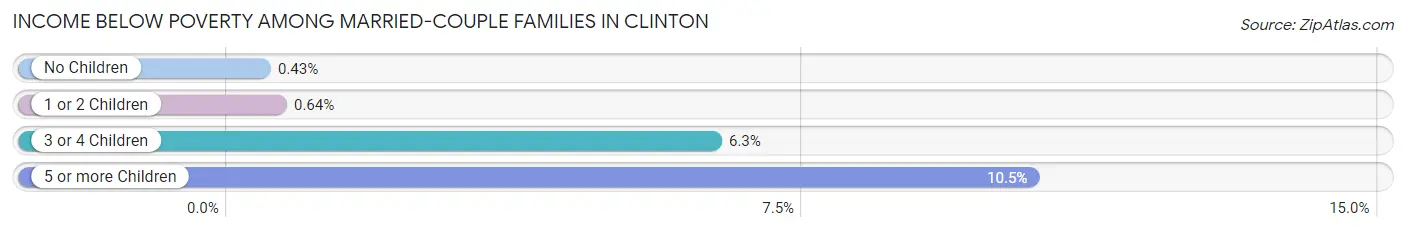
| Children | Above Poverty | Below Poverty |
| No Children | 2,060 (99.6%) | 9 (0.4%) |
| 1 or 2 Children | 1,871 (99.4%) | 12 (0.6%) |
| 3 or 4 Children | 712 (93.7%) | 48 (6.3%) |
| 5 or more Children | 137 (89.5%) | 16 (10.5%) |
| Total | 4,780 (98.3%) | 85 (1.8%) |
Income Below Poverty Among Single-Parent Households in Clinton
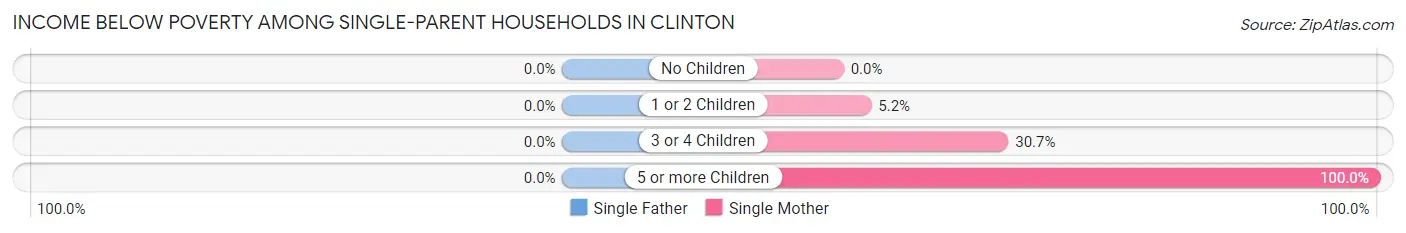
| Children | Single Father | Single Mother |
| No Children | 0 (0.0%) | 0 (0.0%) |
| 1 or 2 Children | 0 (0.0%) | 10 (5.1%) |
| 3 or 4 Children | 0 (0.0%) | 42 (30.7%) |
| 5 or more Children | 0 (0.0%) | 12 (100.0%) |
| Total | 0 (0.0%) | 64 (12.3%) |
Income Below Poverty Among Married-Couple vs Single-Parent Households in Clinton
The poverty data for Clinton shows that 85 of the married-couple family households (1.8%) and 64 of the single-parent households (8.0%) are living below the poverty level. Within the married-couple family households, those with 5 or more children have the highest poverty rate, with 16 households (10.5%) falling below the poverty line. Among the single-parent households, those with 5 or more children have the highest poverty rate, with 12 household (50.0%) living below poverty.
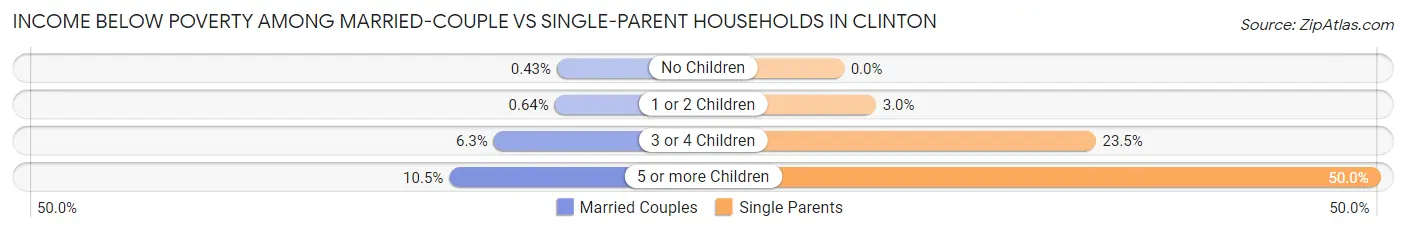
| Children | Married-Couple Families | Single-Parent Households |
| No Children | 9 (0.4%) | 0 (0.0%) |
| 1 or 2 Children | 12 (0.6%) | 10 (3.0%) |
| 3 or 4 Children | 48 (6.3%) | 42 (23.5%) |
| 5 or more Children | 16 (10.5%) | 12 (50.0%) |
| Total | 85 (1.8%) | 64 (8.0%) |
Race in Clinton
The most populous races in Clinton are White / Caucasian (20,596 | 88.1%), Hispanic or Latino (3,125 | 13.4%), and Two or more Races (1,416 | 6.0%).
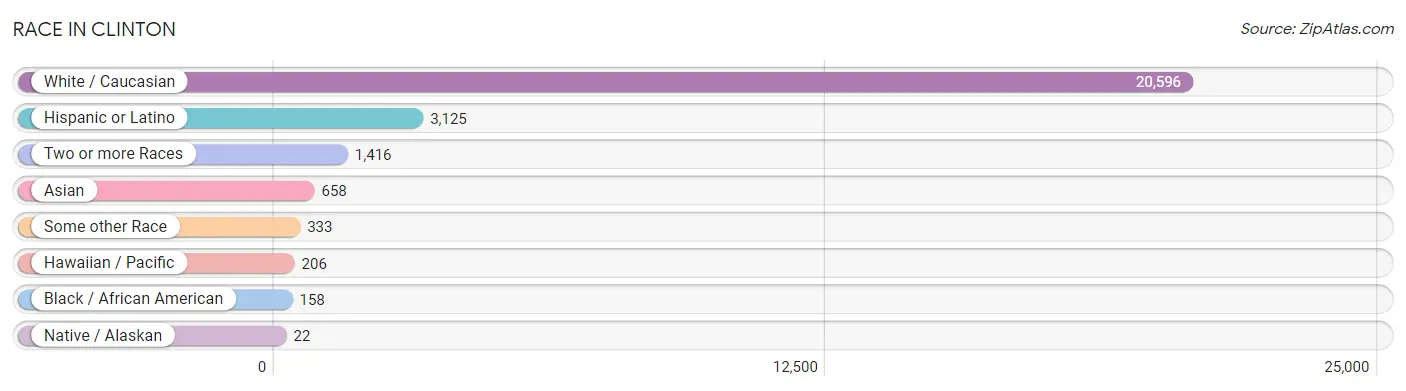
| Race | # Population | % Population |
| Asian | 658 | 2.8% |
| Black / African American | 158 | 0.7% |
| Hawaiian / Pacific | 206 | 0.9% |
| Hispanic or Latino | 3,125 | 13.4% |
| Native / Alaskan | 22 | 0.1% |
| White / Caucasian | 20,596 | 88.1% |
| Two or more Races | 1,416 | 6.0% |
| Some other Race | 333 | 1.4% |
| Total | 23,389 | 100.0% |
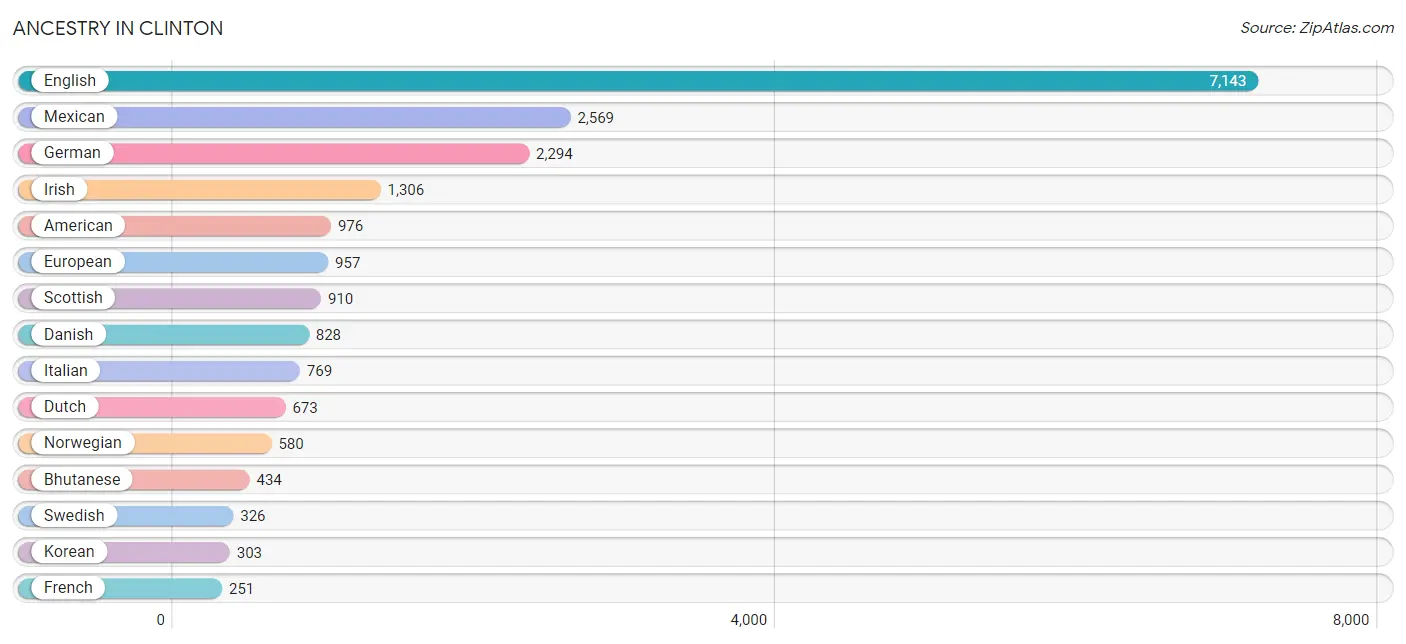
Ancestry in Clinton
The most populous ancestries reported in Clinton are English (7,143 | 30.5%), Mexican (2,569 | 11.0%), German (2,294 | 9.8%), Irish (1,306 | 5.6%), and American (976 | 4.2%), together accounting for 61.1% of all Clinton residents.
| Ancestry | # Population | % Population |
| African | 168 | 0.7% |
| American | 976 | 4.2% |
| Arab | 8 | 0.0% |
| Austrian | 16 | 0.1% |
| Bhutanese | 434 | 1.9% |
| Brazilian | 25 | 0.1% |
| British | 123 | 0.5% |
| Burmese | 171 | 0.7% |
| Canadian | 148 | 0.6% |
| Central American | 188 | 0.8% |
| Cherokee | 11 | 0.1% |
| Cuban | 23 | 0.1% |
| Czechoslovakian | 16 | 0.1% |
| Danish | 828 | 3.5% |
| Dutch | 673 | 2.9% |
| Eastern European | 14 | 0.1% |
| Ecuadorian | 8 | 0.0% |
| English | 7,143 | 30.5% |
| Ethiopian | 21 | 0.1% |
| European | 957 | 4.1% |
| Fijian | 1 | 0.0% |
| Filipino | 12 | 0.1% |
| Finnish | 24 | 0.1% |
| French | 251 | 1.1% |
| French Canadian | 24 | 0.1% |
| German | 2,294 | 9.8% |
| Greek | 62 | 0.3% |
| Guatemalan | 89 | 0.4% |
| Icelander | 12 | 0.1% |
| Indian (Asian) | 49 | 0.2% |
| Irish | 1,306 | 5.6% |
| Iroquois | 6 | 0.0% |
| Italian | 769 | 3.3% |
| Japanese | 92 | 0.4% |
| Korean | 303 | 1.3% |
| Laotian | 8 | 0.0% |
| Lebanese | 8 | 0.0% |
| Lithuanian | 20 | 0.1% |
| Malaysian | 63 | 0.3% |
| Mexican | 2,569 | 11.0% |
| Native Hawaiian | 83 | 0.4% |
| Navajo | 28 | 0.1% |
| Northern European | 28 | 0.1% |
| Norwegian | 580 | 2.5% |
| Pakistani | 31 | 0.1% |
| Polish | 234 | 1.0% |
| Portuguese | 78 | 0.3% |
| Puerto Rican | 44 | 0.2% |
| Russian | 72 | 0.3% |
| Salvadoran | 88 | 0.4% |
| Samoan | 59 | 0.3% |
| Scandinavian | 225 | 1.0% |
| Scotch-Irish | 47 | 0.2% |
| Scottish | 910 | 3.9% |
| South American | 100 | 0.4% |
| Spaniard | 20 | 0.1% |
| Spanish | 8 | 0.0% |
| Sri Lankan | 69 | 0.3% |
| Subsaharan African | 194 | 0.8% |
| Swedish | 326 | 1.4% |
| Swiss | 96 | 0.4% |
| Thai | 41 | 0.2% |
| Tongan | 205 | 0.9% |
| Ukrainian | 7 | 0.0% |
| Venezuelan | 92 | 0.4% |
| Welsh | 183 | 0.8% |
| Yugoslavian | 35 | 0.2% | View All 67 Rows |
Immigrants in Clinton
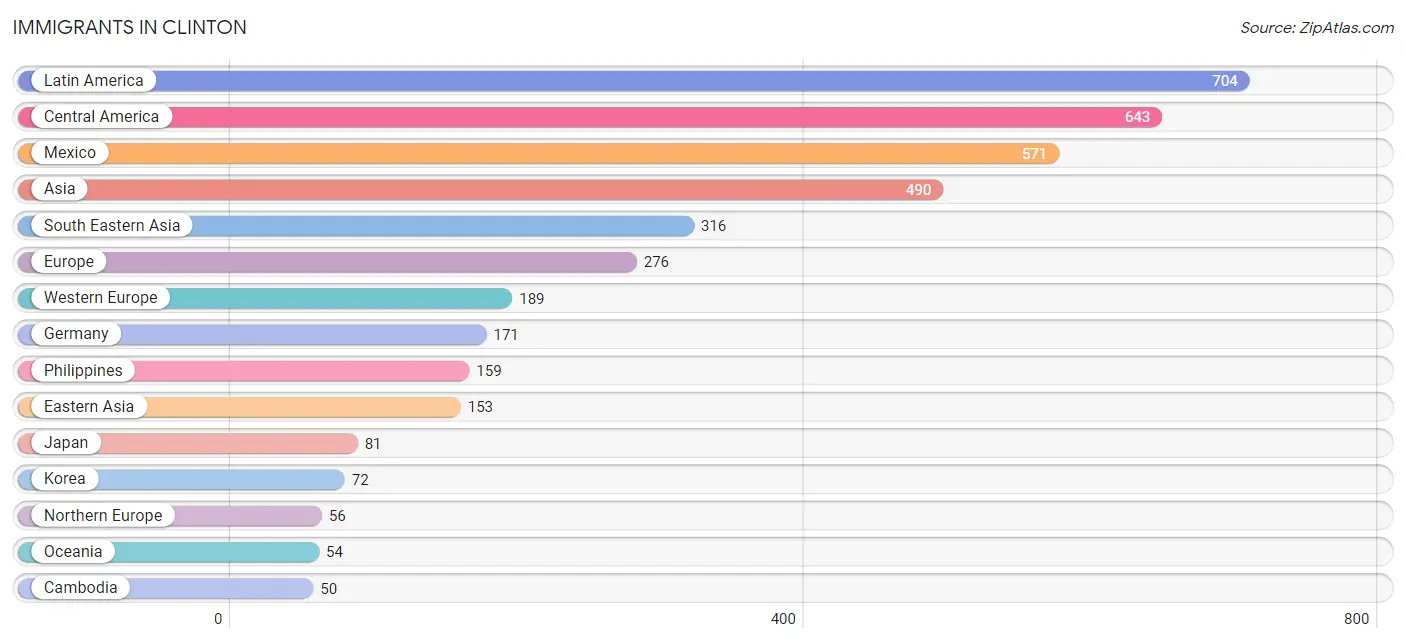
The most numerous immigrant groups reported in Clinton came from Latin America (704 | 3.0%), Central America (643 | 2.8%), Mexico (571 | 2.4%), Asia (490 | 2.1%), and South Eastern Asia (316 | 1.3%), together accounting for 11.7% of all Clinton residents.
| Immigration Origin | # Population | % Population |
| Africa | 26 | 0.1% |
| Asia | 490 | 2.1% |
| Brazil | 30 | 0.1% |
| Cambodia | 50 | 0.2% |
| Canada | 19 | 0.1% |
| Caribbean | 23 | 0.1% |
| Central America | 643 | 2.8% |
| Cuba | 23 | 0.1% |
| Eastern Africa | 26 | 0.1% |
| Eastern Asia | 153 | 0.6% |
| Eastern Europe | 31 | 0.1% |
| Ecuador | 8 | 0.0% |
| El Salvador | 45 | 0.2% |
| England | 27 | 0.1% |
| Ethiopia | 21 | 0.1% |
| Europe | 276 | 1.2% |
| Germany | 171 | 0.7% |
| Guatemala | 27 | 0.1% |
| India | 21 | 0.1% |
| Indonesia | 4 | 0.0% |
| Japan | 81 | 0.4% |
| Korea | 72 | 0.3% |
| Laos | 28 | 0.1% |
| Latin America | 704 | 3.0% |
| Malaysia | 11 | 0.1% |
| Mexico | 571 | 2.4% |
| Netherlands | 18 | 0.1% |
| Northern Europe | 56 | 0.2% |
| Oceania | 54 | 0.2% |
| Philippines | 159 | 0.7% |
| Russia | 31 | 0.1% |
| South America | 38 | 0.2% |
| South Central Asia | 21 | 0.1% |
| South Eastern Asia | 316 | 1.3% |
| Thailand | 37 | 0.2% |
| Vietnam | 27 | 0.1% |
| Western Europe | 189 | 0.8% | View All 37 Rows |
Sex and Age in Clinton
Sex and Age in Clinton
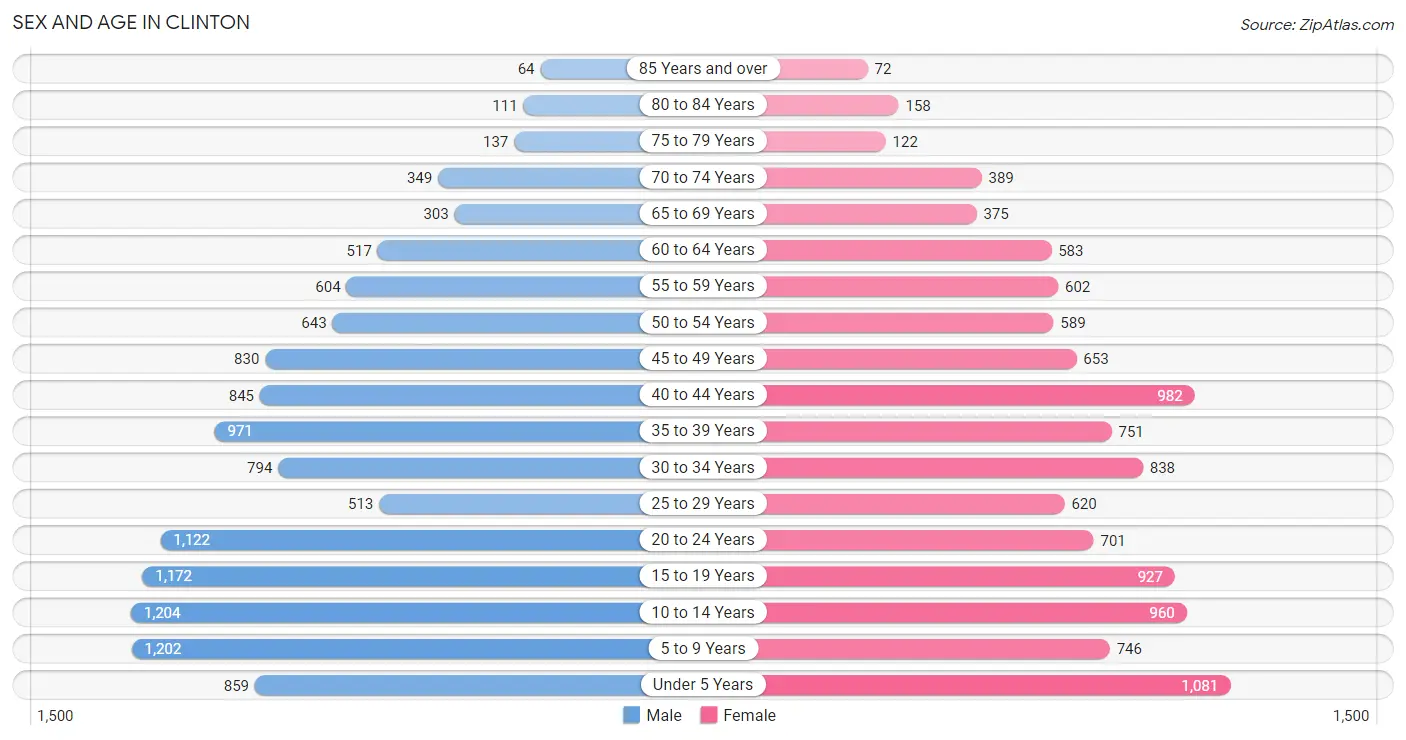
The most populous age groups in Clinton are 10 to 14 Years (1,204 | 9.8%) for men and Under 5 Years (1,081 | 9.7%) for women.
| Age Bracket | Male | Female |
| Under 5 Years | 859 (7.0%) | 1,081 (9.7%) |
| 5 to 9 Years | 1,202 (9.8%) | 746 (6.7%) |
| 10 to 14 Years | 1,204 (9.8%) | 960 (8.6%) |
| 15 to 19 Years | 1,172 (9.6%) | 927 (8.3%) |
| 20 to 24 Years | 1,122 (9.2%) | 701 (6.3%) |
| 25 to 29 Years | 513 (4.2%) | 620 (5.6%) |
| 30 to 34 Years | 794 (6.5%) | 838 (7.5%) |
| 35 to 39 Years | 971 (7.9%) | 751 (6.7%) |
| 40 to 44 Years | 845 (6.9%) | 982 (8.8%) |
| 45 to 49 Years | 830 (6.8%) | 653 (5.9%) |
| 50 to 54 Years | 643 (5.2%) | 589 (5.3%) |
| 55 to 59 Years | 604 (4.9%) | 602 (5.4%) |
| 60 to 64 Years | 517 (4.2%) | 583 (5.2%) |
| 65 to 69 Years | 303 (2.5%) | 375 (3.4%) |
| 70 to 74 Years | 349 (2.9%) | 389 (3.5%) |
| 75 to 79 Years | 137 (1.1%) | 122 (1.1%) |
| 80 to 84 Years | 111 (0.9%) | 158 (1.4%) |
| 85 Years and over | 64 (0.5%) | 72 (0.6%) |
| Total | 12,240 (100.0%) | 11,149 (100.0%) |
Families and Households in Clinton
Median Family Size in Clinton
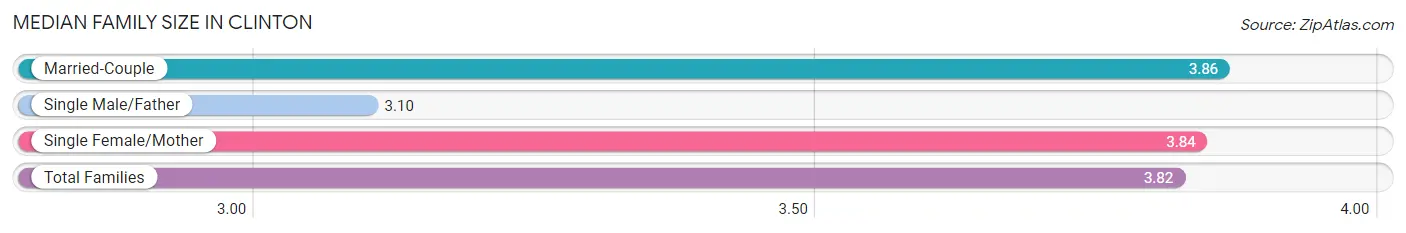
The median family size in Clinton is 3.82 persons per family, with married-couple families (4,865 | 85.8%) accounting for the largest median family size of 3.86 persons per family. On the other hand, single male/father families (283 | 5.0%) represent the smallest median family size with 3.10 persons per family.
| Family Type | # Families | Family Size |
| Married-Couple | 4,865 (85.8%) | 3.86 |
| Single Male/Father | 283 (5.0%) | 3.10 |
| Single Female/Mother | 522 (9.2%) | 3.84 |
| Total Families | 5,670 (100.0%) | 3.82 |
Median Household Size in Clinton
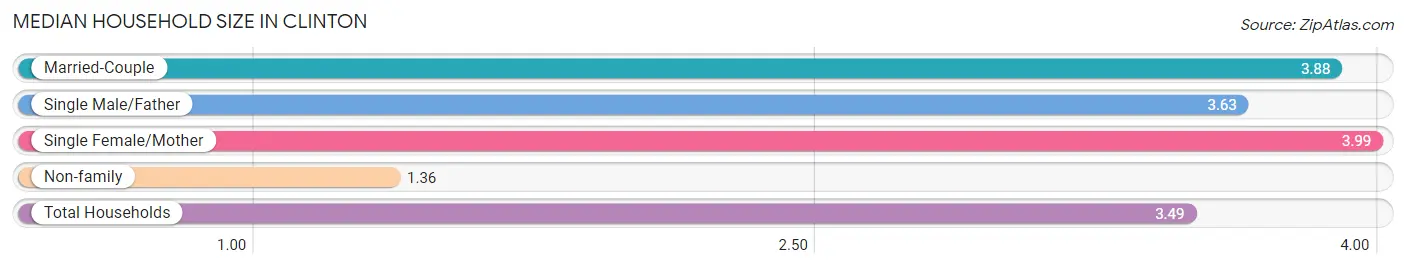
The median household size in Clinton is 3.49 persons per household, with single female/mother households (522 | 7.8%) accounting for the largest median household size of 3.99 persons per household. non-family households (1,024 | 15.3%) represent the smallest median household size with 1.36 persons per household.
| Household Type | # Households | Household Size |
| Married-Couple | 4,865 (72.7%) | 3.88 |
| Single Male/Father | 283 (4.2%) | 3.63 |
| Single Female/Mother | 522 (7.8%) | 3.99 |
| Non-family | 1,024 (15.3%) | 1.36 |
| Total Households | 6,694 (100.0%) | 3.49 |
Household Size by Marriage Status in Clinton
Out of a total of 6,694 households in Clinton, 5,670 (84.7%) are family households, while 1,024 (15.3%) are nonfamily households. The most numerous type of family households are 2-person households, comprising 1,640, and the most common type of nonfamily households are 1-person households, comprising 809.
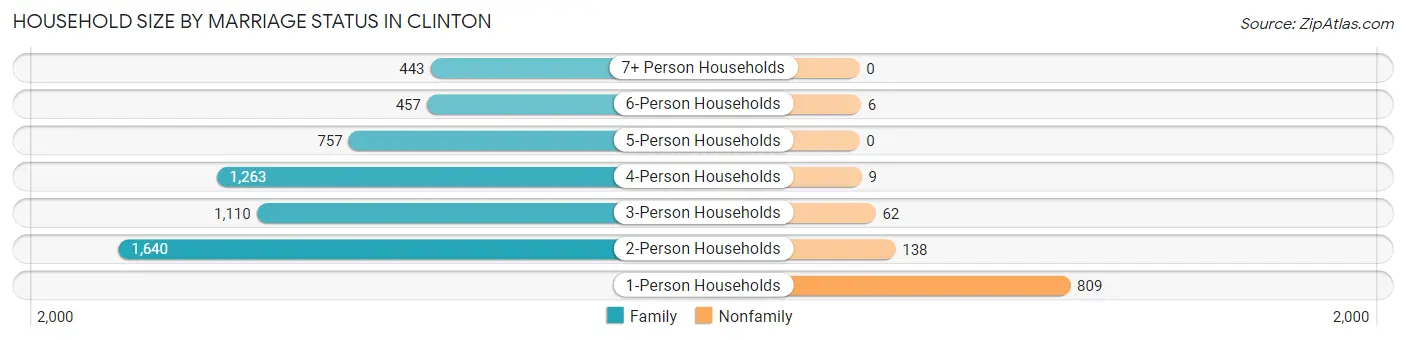
| Household Size | Family Households | Nonfamily Households |
| 1-Person Households | - | 809 (12.1%) |
| 2-Person Households | 1,640 (24.5%) | 138 (2.1%) |
| 3-Person Households | 1,110 (16.6%) | 62 (0.9%) |
| 4-Person Households | 1,263 (18.9%) | 9 (0.1%) |
| 5-Person Households | 757 (11.3%) | 0 (0.0%) |
| 6-Person Households | 457 (6.8%) | 6 (0.1%) |
| 7+ Person Households | 443 (6.6%) | 0 (0.0%) |
| Total | 5,670 (84.7%) | 1,024 (15.3%) |
Female Fertility in Clinton
Fertility by Age in Clinton
Average fertility rate in Clinton is 57.0 births per 1,000 women. Women in the age bracket of 20 to 34 years have the highest fertility rate with 119.0 births per 1,000 women. Women in the age bracket of 20 to 34 years acount for 79.0% of all women with births.
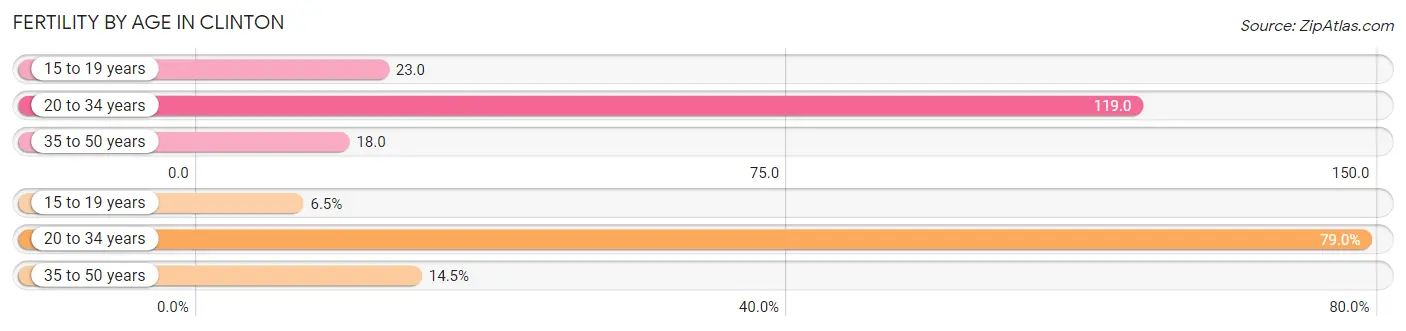
| Age Bracket | Women with Births | Births / 1,000 Women |
| 15 to 19 years | 21 (6.5%) | 23.0 |
| 20 to 34 years | 256 (79.0%) | 119.0 |
| 35 to 50 years | 47 (14.5%) | 18.0 |
| Total | 324 (100.0%) | 57.0 |
Fertility by Age by Marriage Status in Clinton
89.5% of women with births (324) in Clinton are married. The highest percentage of unmarried women with births falls into 15 to 19 years age bracket with 100.0% of them unmarried at the time of birth, while the lowest percentage of unmarried women with births belong to 35 to 50 years age bracket with 0.0% of them unmarried.
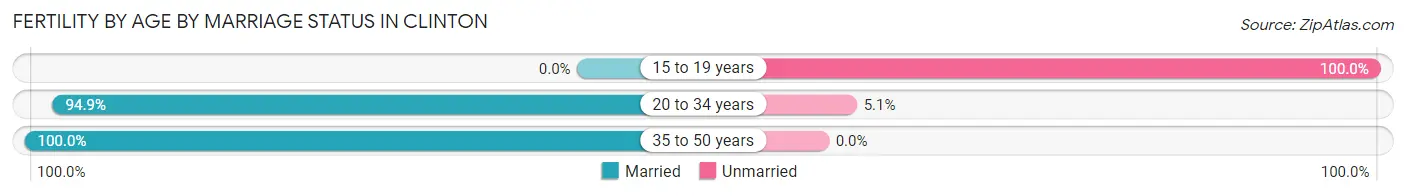
| Age Bracket | Married | Unmarried |
| 15 to 19 years | 0 (0.0%) | 21 (100.0%) |
| 20 to 34 years | 243 (94.9%) | 13 (5.1%) |
| 35 to 50 years | 47 (100.0%) | 0 (0.0%) |
| Total | 290 (89.5%) | 34 (10.5%) |
Fertility by Education in Clinton
Average fertility rate in Clinton is 57.0 births per 1,000 women. Women with the education attainment of college or associate's degree have the highest fertility rate of 89.0 births per 1,000 women, while women with the education attainment of high school diploma have the lowest fertility at 4.0 births per 1,000 women. Women with the education attainment of college or associate's degree represent 68.8% of all women with births.
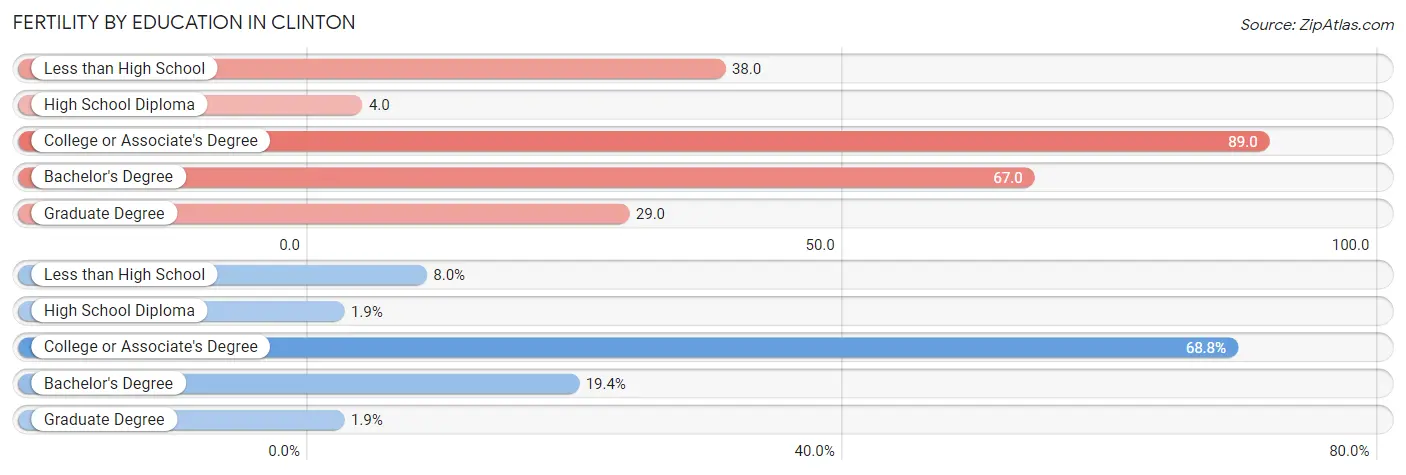
| Educational Attainment | Women with Births | Births / 1,000 Women |
| Less than High School | 26 (8.0%) | 38.0 |
| High School Diploma | 6 (1.8%) | 4.0 |
| College or Associate's Degree | 223 (68.8%) | 89.0 |
| Bachelor's Degree | 63 (19.4%) | 67.0 |
| Graduate Degree | 6 (1.8%) | 29.0 |
| Total | 324 (100.0%) | 57.0 |
Fertility by Education by Marriage Status in Clinton
10.5% of women with births in Clinton are unmarried. Women with the educational attainment of high school diploma are most likely to be married with 100.0% of them married at childbirth, while women with the educational attainment of less than high school are least likely to be married with 80.8% of them unmarried at childbirth.
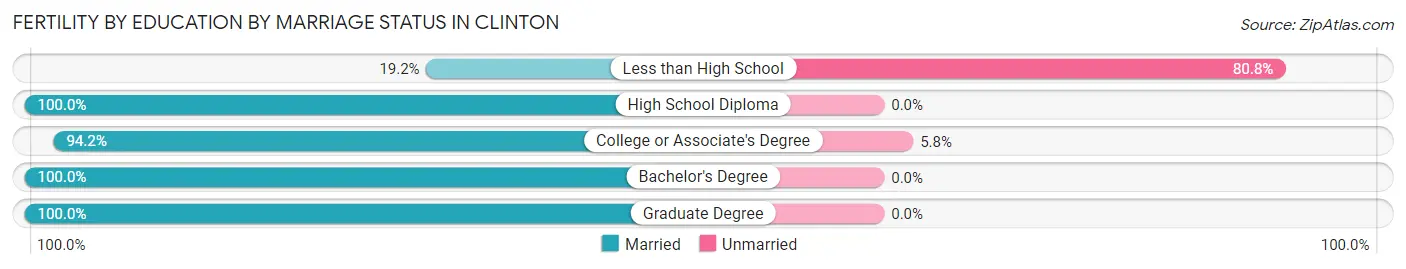
| Educational Attainment | Married | Unmarried |
| Less than High School | 5 (19.2%) | 21 (80.8%) |
| High School Diploma | 6 (100.0%) | 0 (0.0%) |
| College or Associate's Degree | 210 (94.2%) | 13 (5.8%) |
| Bachelor's Degree | 63 (100.0%) | 0 (0.0%) |
| Graduate Degree | 6 (100.0%) | 0 (0.0%) |
| Total | 290 (89.5%) | 34 (10.5%) |
Employment Characteristics in Clinton
Employment by Class of Employer in Clinton
Among the 11,202 employed individuals in Clinton, private company employees (7,129 | 63.6%), federal government employees (1,632 | 14.6%), and local government employees (856 | 7.6%) make up the most common classes of employment.
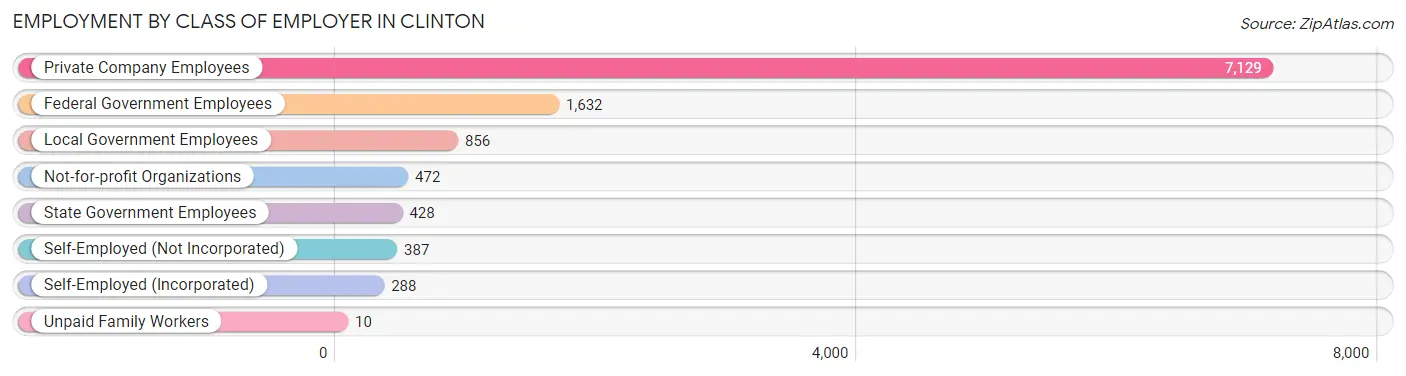
| Employer Class | # Employees | % Employees |
| Private Company Employees | 7,129 | 63.6% |
| Self-Employed (Incorporated) | 288 | 2.6% |
| Self-Employed (Not Incorporated) | 387 | 3.5% |
| Not-for-profit Organizations | 472 | 4.2% |
| Local Government Employees | 856 | 7.6% |
| State Government Employees | 428 | 3.8% |
| Federal Government Employees | 1,632 | 14.6% |
| Unpaid Family Workers | 10 | 0.1% |
| Total | 11,202 | 100.0% |
Employment Status by Age in Clinton
According to the labor force statistics for Clinton, out of the total population over 16 years of age (16,816), 70.8% or 11,906 individuals are in the labor force, with 5.3% or 631 of them unemployed. The age group with the highest labor force participation rate is 55 to 59 years, with 90.9% or 1,096 individuals in the labor force. Within the labor force, the 45 to 54 years age range has the highest percentage of unemployed individuals, with 17.0% or 384 of them being unemployed.
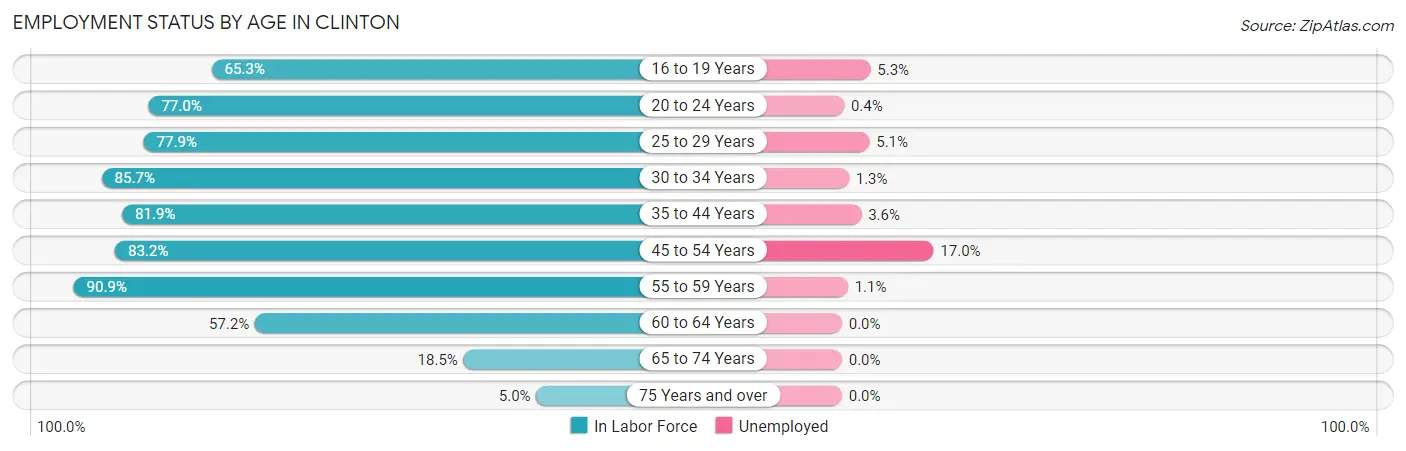
| Age Bracket | In Labor Force | Unemployed |
| 16 to 19 Years | 1,030 (65.3%) | 55 (5.3%) |
| 20 to 24 Years | 1,404 (77.0%) | 6 (0.4%) |
| 25 to 29 Years | 883 (77.9%) | 45 (5.1%) |
| 30 to 34 Years | 1,399 (85.7%) | 18 (1.3%) |
| 35 to 44 Years | 2,907 (81.9%) | 105 (3.6%) |
| 45 to 54 Years | 2,259 (83.2%) | 384 (17.0%) |
| 55 to 59 Years | 1,096 (90.9%) | 12 (1.1%) |
| 60 to 64 Years | 629 (57.2%) | 0 (0.0%) |
| 65 to 74 Years | 262 (18.5%) | 0 (0.0%) |
| 75 Years and over | 33 (5.0%) | 0 (0.0%) |
| Total | 11,906 (70.8%) | 631 (5.3%) |
Employment Status by Educational Attainment in Clinton
According to labor force statistics for Clinton, 80.9% of individuals (9,170) out of the total population between 25 and 64 years of age (11,335) are in the labor force, with 6.2% or 569 of them being unemployed. The group with the highest labor force participation rate are those with the educational attainment of bachelor's degree or higher, with 86.8% or 2,680 individuals in the labor force. Within the labor force, individuals with high school diploma education have the highest percentage of unemployment, with 13.3% or 327 of them being unemployed.
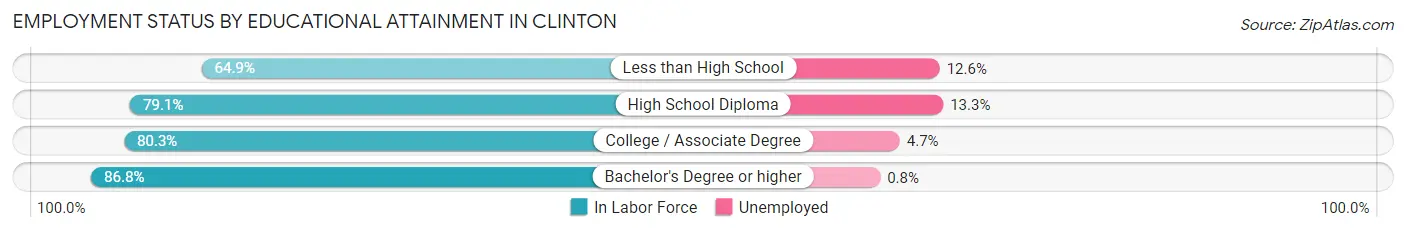
| Educational Attainment | In Labor Force | Unemployed |
| Less than High School | 397 (64.9%) | 77 (12.6%) |
| High School Diploma | 2,460 (79.1%) | 414 (13.3%) |
| College / Associate Degree | 3,634 (80.3%) | 213 (4.7%) |
| Bachelor's Degree or higher | 2,680 (86.8%) | 25 (0.8%) |
| Total | 9,170 (80.9%) | 703 (6.2%) |
Employment Occupations by Sex in Clinton
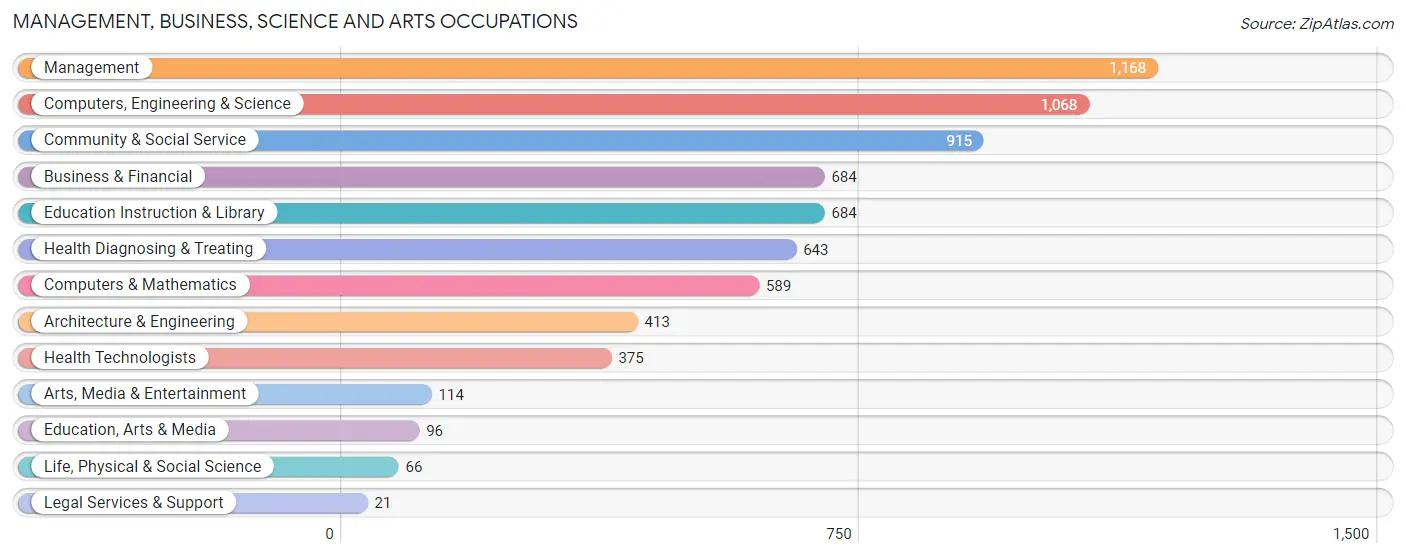
Management, Business, Science and Arts Occupations
The most common Management, Business, Science and Arts occupations in Clinton are Management (1,168 | 10.6%), Computers, Engineering & Science (1,068 | 9.7%), Community & Social Service (915 | 8.3%), Business & Financial (684 | 6.2%), and Education Instruction & Library (684 | 6.2%).
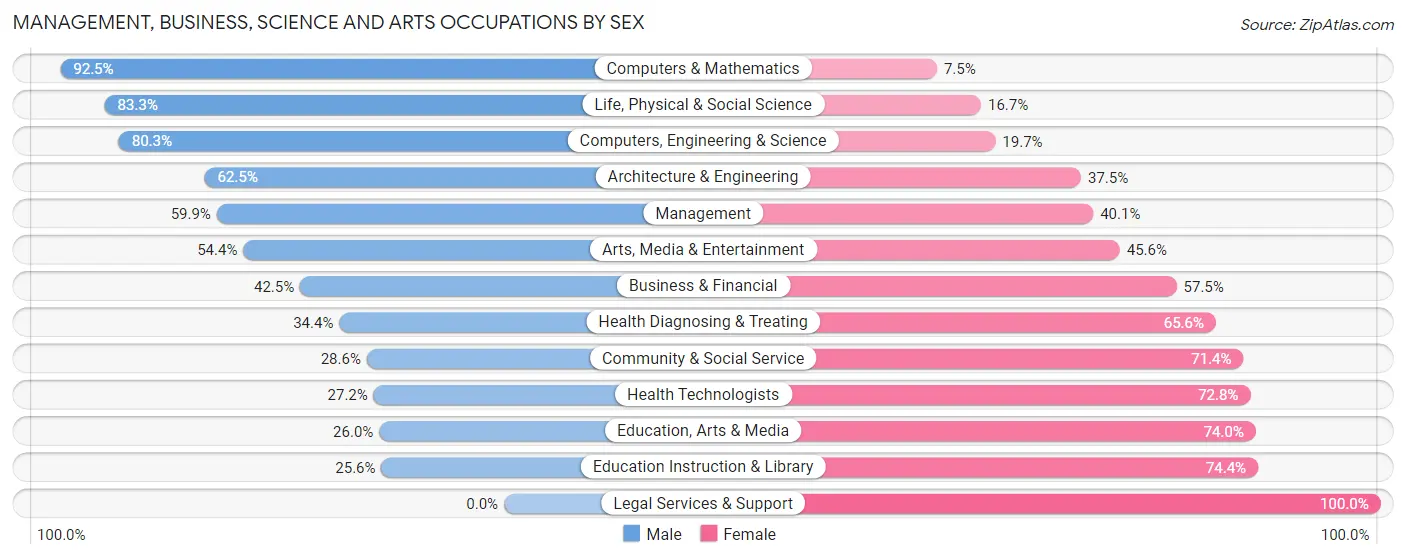
Management, Business, Science and Arts Occupations by Sex
Within the Management, Business, Science and Arts occupations in Clinton, the most male-oriented occupations are Computers & Mathematics (92.5%), Life, Physical & Social Science (83.3%), and Computers, Engineering & Science (80.3%), while the most female-oriented occupations are Legal Services & Support (100.0%), Education Instruction & Library (74.4%), and Education, Arts & Media (74.0%).
| Occupation | Male | Female |
| Management | 700 (59.9%) | 468 (40.1%) |
| Business & Financial | 291 (42.5%) | 393 (57.5%) |
| Computers, Engineering & Science | 858 (80.3%) | 210 (19.7%) |
| Computers & Mathematics | 545 (92.5%) | 44 (7.5%) |
| Architecture & Engineering | 258 (62.5%) | 155 (37.5%) |
| Life, Physical & Social Science | 55 (83.3%) | 11 (16.7%) |
| Community & Social Service | 262 (28.6%) | 653 (71.4%) |
| Education, Arts & Media | 25 (26.0%) | 71 (74.0%) |
| Legal Services & Support | 0 (0.0%) | 21 (100.0%) |
| Education Instruction & Library | 175 (25.6%) | 509 (74.4%) |
| Arts, Media & Entertainment | 62 (54.4%) | 52 (45.6%) |
| Health Diagnosing & Treating | 221 (34.4%) | 422 (65.6%) |
| Health Technologists | 102 (27.2%) | 273 (72.8%) |
| Total (Category) | 2,332 (52.1%) | 2,146 (47.9%) |
| Total (Overall) | 6,012 (54.4%) | 5,032 (45.6%) |
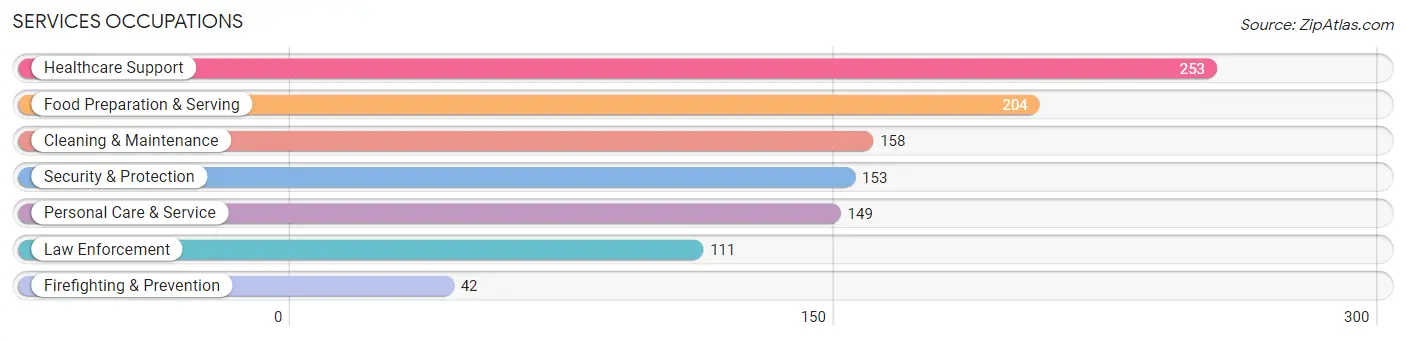
Services Occupations
The most common Services occupations in Clinton are Healthcare Support (253 | 2.3%), Food Preparation & Serving (204 | 1.8%), Cleaning & Maintenance (158 | 1.4%), Security & Protection (153 | 1.4%), and Personal Care & Service (149 | 1.3%).
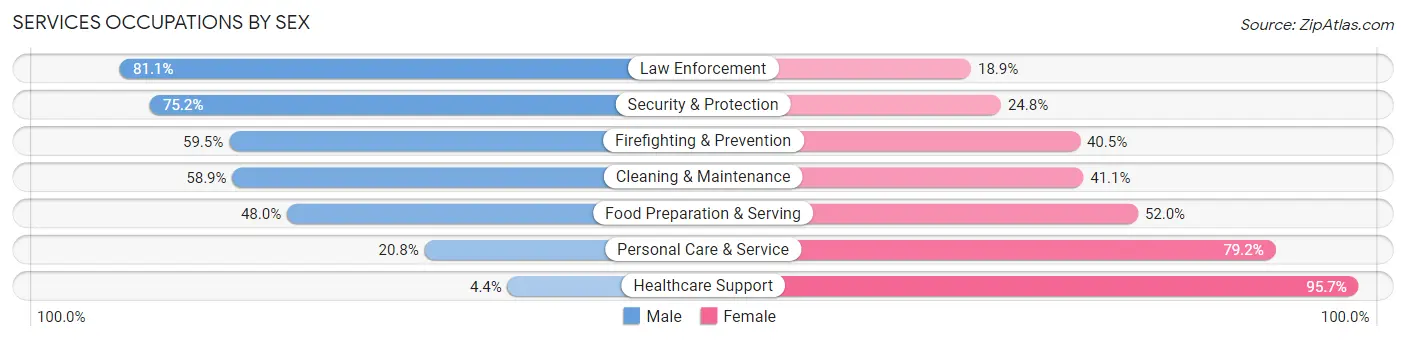
Services Occupations by Sex
Within the Services occupations in Clinton, the most male-oriented occupations are Law Enforcement (81.1%), Security & Protection (75.2%), and Firefighting & Prevention (59.5%), while the most female-oriented occupations are Healthcare Support (95.7%), Personal Care & Service (79.2%), and Food Preparation & Serving (52.0%).
| Occupation | Male | Female |
| Healthcare Support | 11 (4.3%) | 242 (95.7%) |
| Security & Protection | 115 (75.2%) | 38 (24.8%) |
| Firefighting & Prevention | 25 (59.5%) | 17 (40.5%) |
| Law Enforcement | 90 (81.1%) | 21 (18.9%) |
| Food Preparation & Serving | 98 (48.0%) | 106 (52.0%) |
| Cleaning & Maintenance | 93 (58.9%) | 65 (41.1%) |
| Personal Care & Service | 31 (20.8%) | 118 (79.2%) |
| Total (Category) | 348 (38.0%) | 569 (62.1%) |
| Total (Overall) | 6,012 (54.4%) | 5,032 (45.6%) |
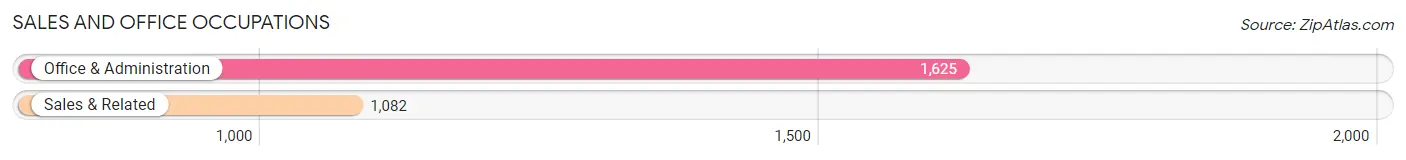
Sales and Office Occupations
The most common Sales and Office occupations in Clinton are Office & Administration (1,625 | 14.7%), and Sales & Related (1,082 | 9.8%).
Sales and Office Occupations by Sex
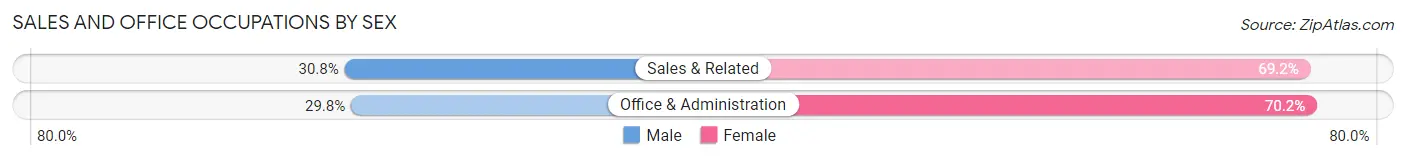
| Occupation | Male | Female |
| Sales & Related | 333 (30.8%) | 749 (69.2%) |
| Office & Administration | 484 (29.8%) | 1,141 (70.2%) |
| Total (Category) | 817 (30.2%) | 1,890 (69.8%) |
| Total (Overall) | 6,012 (54.4%) | 5,032 (45.6%) |
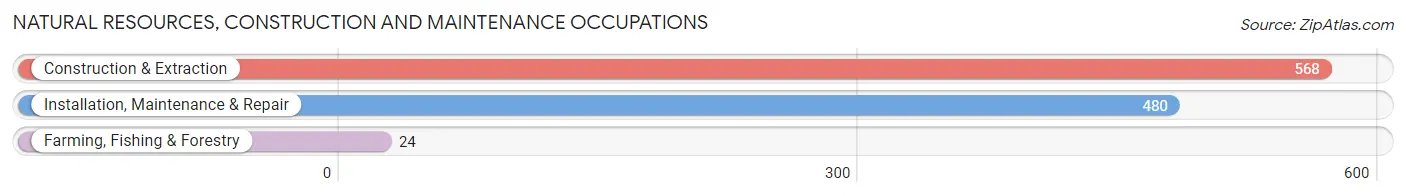
Natural Resources, Construction and Maintenance Occupations
The most common Natural Resources, Construction and Maintenance occupations in Clinton are Construction & Extraction (568 | 5.1%), Installation, Maintenance & Repair (480 | 4.3%), and Farming, Fishing & Forestry (24 | 0.2%).
Natural Resources, Construction and Maintenance Occupations by Sex
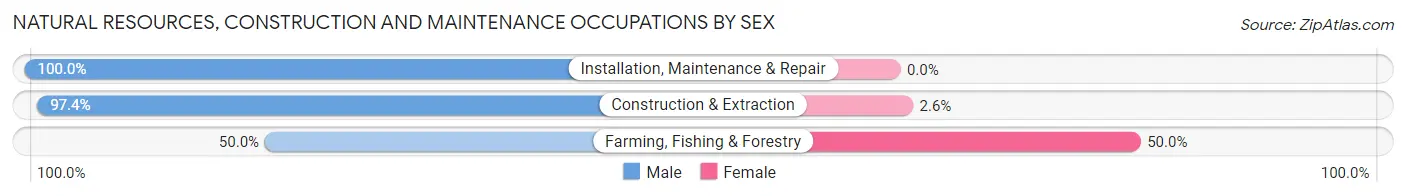
| Occupation | Male | Female |
| Farming, Fishing & Forestry | 12 (50.0%) | 12 (50.0%) |
| Construction & Extraction | 553 (97.4%) | 15 (2.6%) |
| Installation, Maintenance & Repair | 480 (100.0%) | 0 (0.0%) |
| Total (Category) | 1,045 (97.5%) | 27 (2.5%) |
| Total (Overall) | 6,012 (54.4%) | 5,032 (45.6%) |
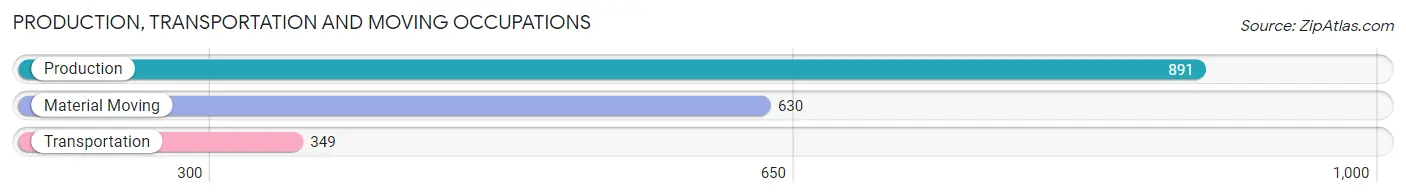
Production, Transportation and Moving Occupations
The most common Production, Transportation and Moving occupations in Clinton are Production (891 | 8.1%), Material Moving (630 | 5.7%), and Transportation (349 | 3.2%).
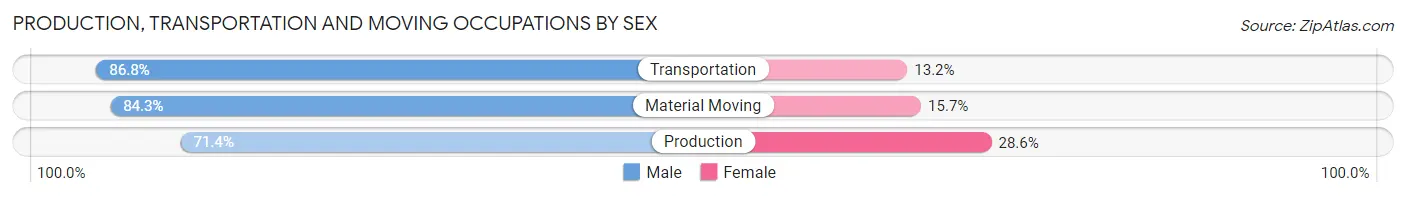
Production, Transportation and Moving Occupations by Sex
| Occupation | Male | Female |
| Production | 636 (71.4%) | 255 (28.6%) |
| Transportation | 303 (86.8%) | 46 (13.2%) |
| Material Moving | 531 (84.3%) | 99 (15.7%) |
| Total (Category) | 1,470 (78.6%) | 400 (21.4%) |
| Total (Overall) | 6,012 (54.4%) | 5,032 (45.6%) |
Employment Industries by Sex in Clinton
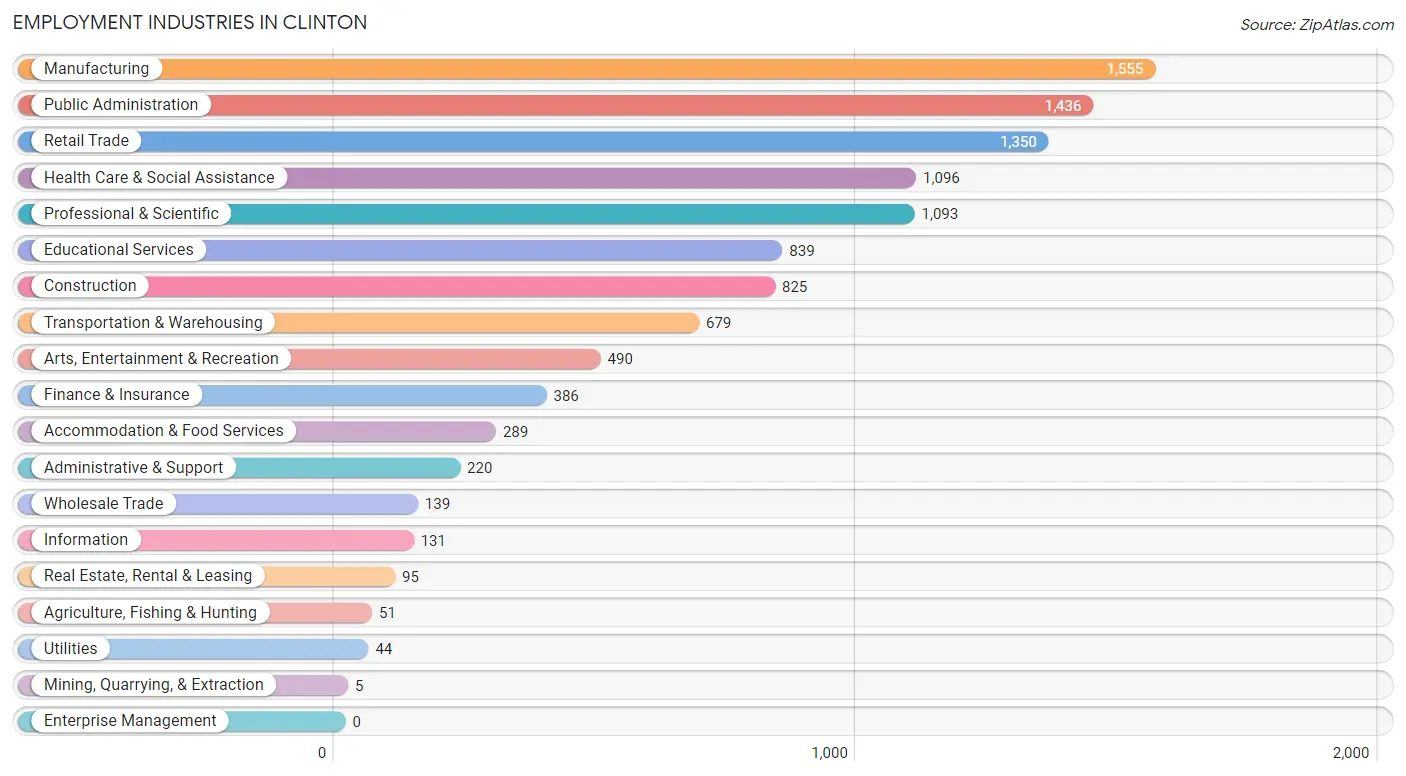
Employment Industries in Clinton
The major employment industries in Clinton include Manufacturing (1,555 | 14.1%), Public Administration (1,436 | 13.0%), Retail Trade (1,350 | 12.2%), Health Care & Social Assistance (1,096 | 9.9%), and Professional & Scientific (1,093 | 9.9%).
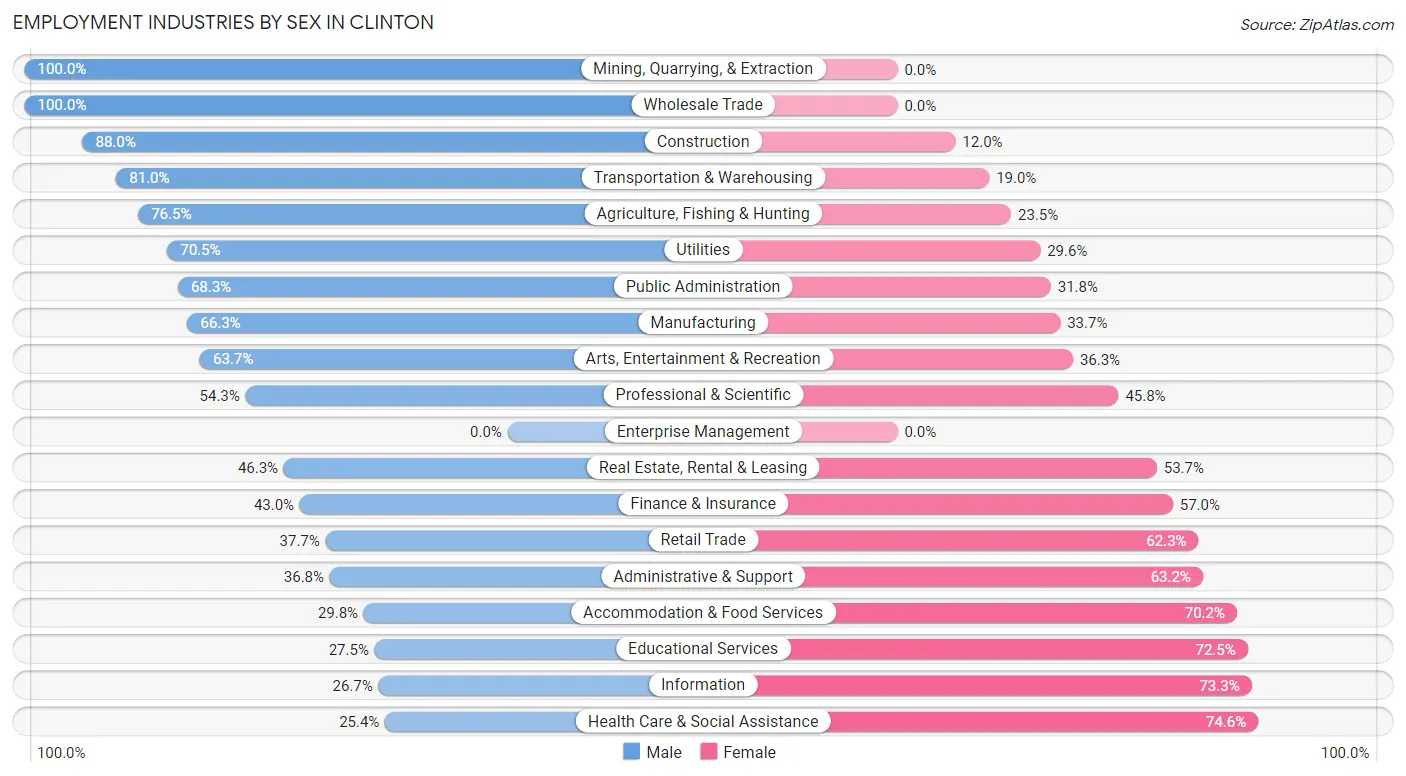
Employment Industries by Sex in Clinton
The Clinton industries that see more men than women are Mining, Quarrying, & Extraction (100.0%), Wholesale Trade (100.0%), and Construction (88.0%), whereas the industries that tend to have a higher number of women are Health Care & Social Assistance (74.6%), Information (73.3%), and Educational Services (72.5%).
| Industry | Male | Female |
| Agriculture, Fishing & Hunting | 39 (76.5%) | 12 (23.5%) |
| Mining, Quarrying, & Extraction | 5 (100.0%) | 0 (0.0%) |
| Construction | 726 (88.0%) | 99 (12.0%) |
| Manufacturing | 1,031 (66.3%) | 524 (33.7%) |
| Wholesale Trade | 139 (100.0%) | 0 (0.0%) |
| Retail Trade | 509 (37.7%) | 841 (62.3%) |
| Transportation & Warehousing | 550 (81.0%) | 129 (19.0%) |
| Utilities | 31 (70.5%) | 13 (29.5%) |
| Information | 35 (26.7%) | 96 (73.3%) |
| Finance & Insurance | 166 (43.0%) | 220 (57.0%) |
| Real Estate, Rental & Leasing | 44 (46.3%) | 51 (53.7%) |
| Professional & Scientific | 593 (54.2%) | 500 (45.8%) |
| Enterprise Management | 0 (0.0%) | 0 (0.0%) |
| Administrative & Support | 81 (36.8%) | 139 (63.2%) |
| Educational Services | 231 (27.5%) | 608 (72.5%) |
| Health Care & Social Assistance | 278 (25.4%) | 818 (74.6%) |
| Arts, Entertainment & Recreation | 312 (63.7%) | 178 (36.3%) |
| Accommodation & Food Services | 86 (29.8%) | 203 (70.2%) |
| Public Administration | 980 (68.2%) | 456 (31.8%) |
| Total | 6,012 (54.4%) | 5,032 (45.6%) |
Education in Clinton
School Enrollment in Clinton
The most common levels of schooling among the 7,571 students in Clinton are high school (2,061 | 27.2%), middle school (1,666 | 22.0%), and elementary school (1,619 | 21.4%).
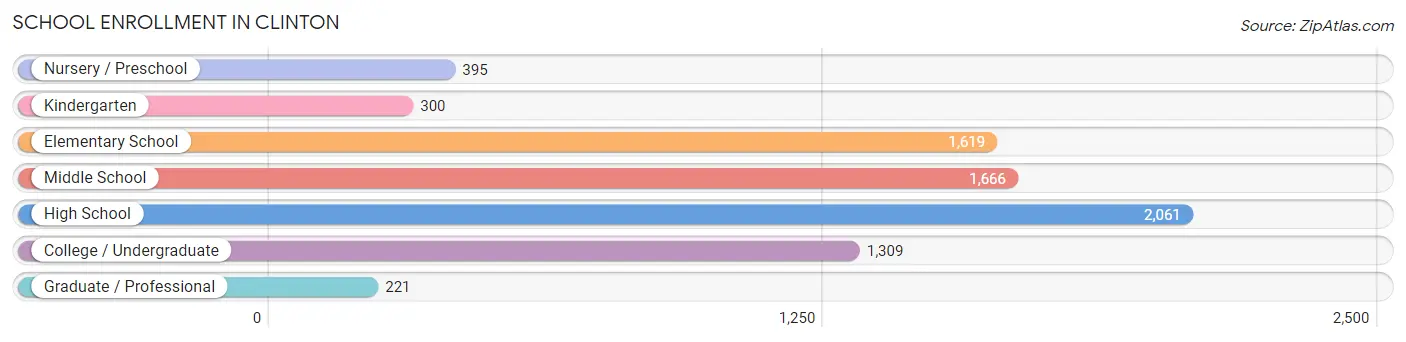
| School Level | # Students | % Students |
| Nursery / Preschool | 395 | 5.2% |
| Kindergarten | 300 | 4.0% |
| Elementary School | 1,619 | 21.4% |
| Middle School | 1,666 | 22.0% |
| High School | 2,061 | 27.2% |
| College / Undergraduate | 1,309 | 17.3% |
| Graduate / Professional | 221 | 2.9% |
| Total | 7,571 | 100.0% |
School Enrollment by Age by Funding Source in Clinton
Out of a total of 7,571 students who are enrolled in schools in Clinton, 727 (9.6%) attend a private institution, while the remaining 6,844 (90.4%) are enrolled in public schools. The age group of 3 to 4 year olds has the highest likelihood of being enrolled in private schools, with 106 (33.5% in the age bracket) enrolled. Conversely, the age group of 18 to 19 year olds has the lowest likelihood of being enrolled in a private school, with 478 (100.0% in the age bracket) attending a public institution.
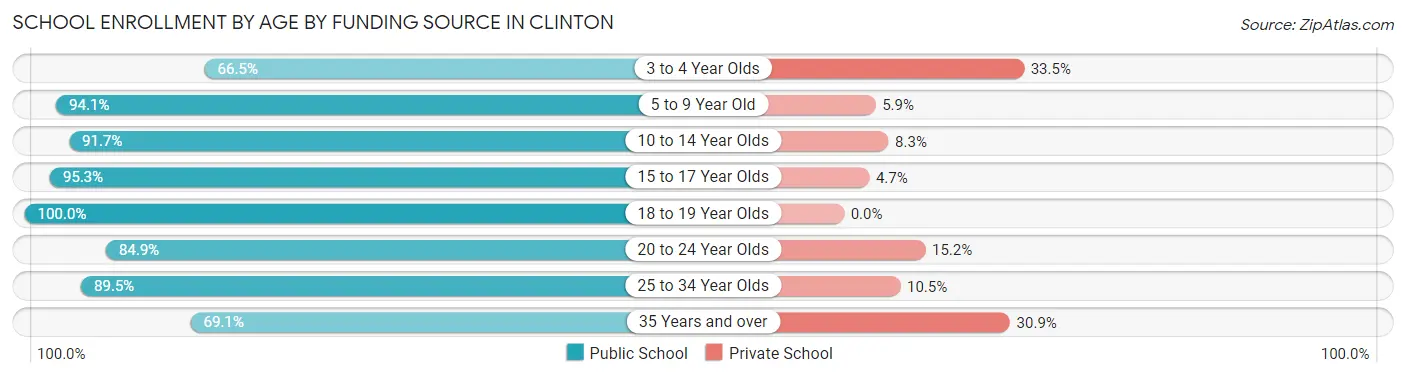
| Age Bracket | Public School | Private School |
| 3 to 4 Year Olds | 210 (66.5%) | 106 (33.5%) |
| 5 to 9 Year Old | 1,696 (94.1%) | 106 (5.9%) |
| 10 to 14 Year Olds | 1,958 (91.7%) | 177 (8.3%) |
| 15 to 17 Year Olds | 1,356 (95.3%) | 67 (4.7%) |
| 18 to 19 Year Olds | 478 (100.0%) | 0 (0.0%) |
| 20 to 24 Year Olds | 465 (84.9%) | 83 (15.1%) |
| 25 to 34 Year Olds | 358 (89.5%) | 42 (10.5%) |
| 35 Years and over | 324 (69.1%) | 145 (30.9%) |
| Total | 6,844 (90.4%) | 727 (9.6%) |
Educational Attainment by Field of Study in Clinton
Business (749 | 19.8%), science & technology (552 | 14.6%), education (386 | 10.2%), computers & mathematics (333 | 8.8%), and arts & humanities (315 | 8.3%) are the most common fields of study among 3,790 individuals in Clinton who have obtained a bachelor's degree or higher.
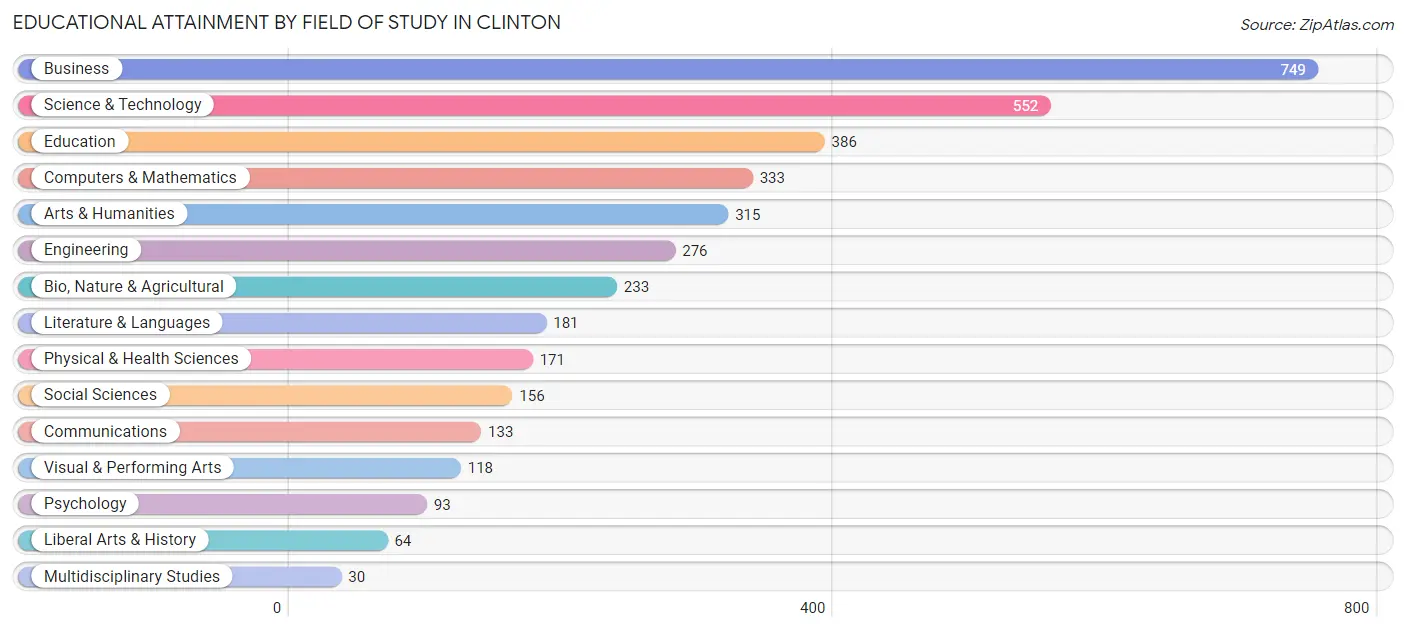
| Field of Study | # Graduates | % Graduates |
| Computers & Mathematics | 333 | 8.8% |
| Bio, Nature & Agricultural | 233 | 6.1% |
| Physical & Health Sciences | 171 | 4.5% |
| Psychology | 93 | 2.5% |
| Social Sciences | 156 | 4.1% |
| Engineering | 276 | 7.3% |
| Multidisciplinary Studies | 30 | 0.8% |
| Science & Technology | 552 | 14.6% |
| Business | 749 | 19.8% |
| Education | 386 | 10.2% |
| Literature & Languages | 181 | 4.8% |
| Liberal Arts & History | 64 | 1.7% |
| Visual & Performing Arts | 118 | 3.1% |
| Communications | 133 | 3.5% |
| Arts & Humanities | 315 | 8.3% |
| Total | 3,790 | 100.0% |
Transportation & Commute in Clinton
Vehicle Availability by Sex in Clinton
The most prevalent vehicle ownership categories in Clinton are males with 2 vehicles (2,506, accounting for 40.5%) and females with 2 vehicles (1,972, making up 49.9%).
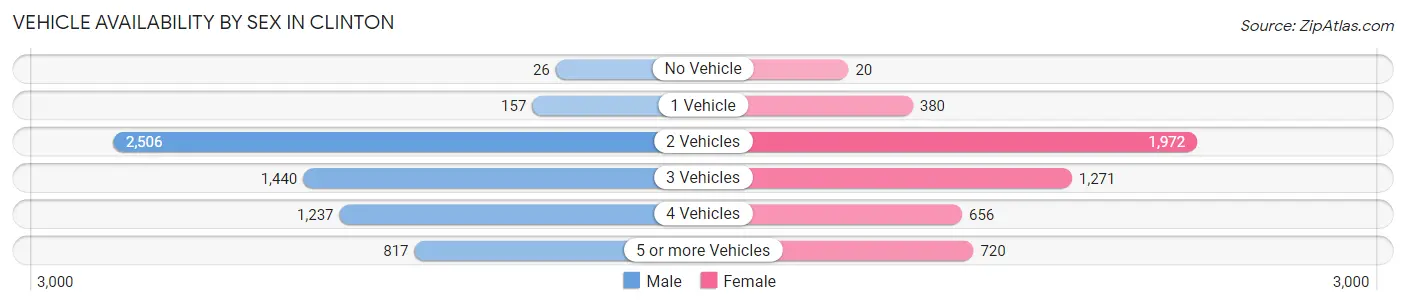
| Vehicles Available | Male | Female |
| No Vehicle | 26 (0.4%) | 20 (0.4%) |
| 1 Vehicle | 157 (2.5%) | 380 (7.6%) |
| 2 Vehicles | 2,506 (40.5%) | 1,972 (39.3%) |
| 3 Vehicles | 1,440 (23.3%) | 1,271 (25.3%) |
| 4 Vehicles | 1,237 (20.0%) | 656 (13.1%) |
| 5 or more Vehicles | 817 (13.2%) | 720 (14.3%) |
| Total | 6,183 (100.0%) | 5,019 (100.0%) |
Commute Time in Clinton
The most frequently occuring commute durations in Clinton are 15 to 19 minutes (2,423 commuters, 24.2%), 20 to 24 minutes (1,785 commuters, 17.8%), and 10 to 14 minutes (1,404 commuters, 14.0%).
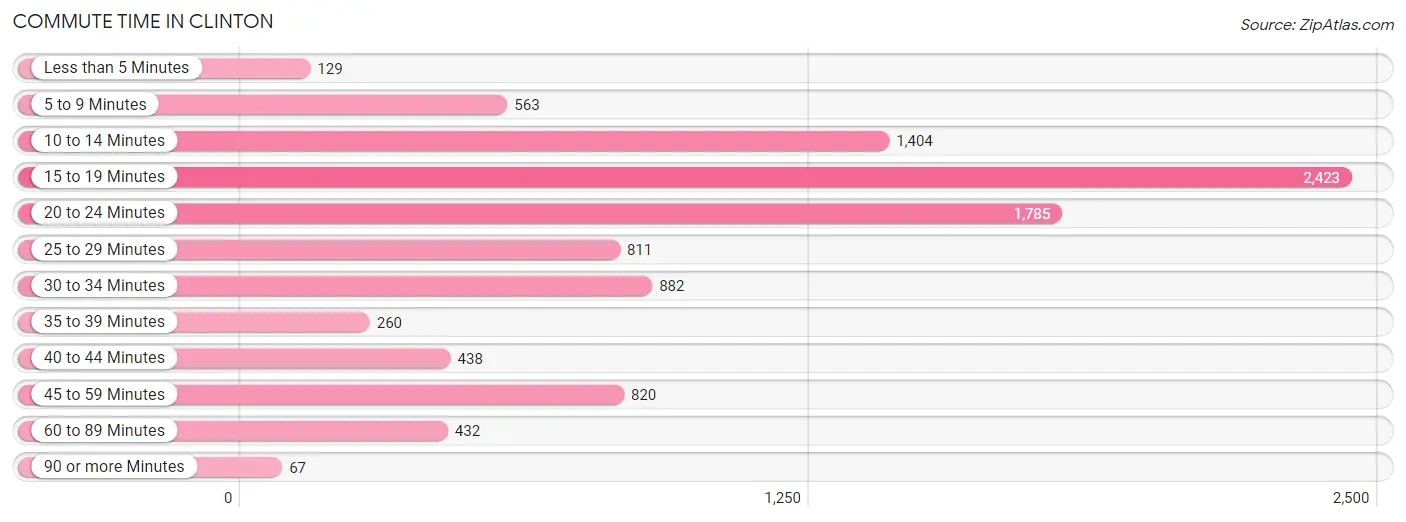
| Commute Time | # Commuters | % Commuters |
| Less than 5 Minutes | 129 | 1.3% |
| 5 to 9 Minutes | 563 | 5.6% |
| 10 to 14 Minutes | 1,404 | 14.0% |
| 15 to 19 Minutes | 2,423 | 24.2% |
| 20 to 24 Minutes | 1,785 | 17.8% |
| 25 to 29 Minutes | 811 | 8.1% |
| 30 to 34 Minutes | 882 | 8.8% |
| 35 to 39 Minutes | 260 | 2.6% |
| 40 to 44 Minutes | 438 | 4.4% |
| 45 to 59 Minutes | 820 | 8.2% |
| 60 to 89 Minutes | 432 | 4.3% |
| 90 or more Minutes | 67 | 0.7% |
Commute Time by Sex in Clinton
The most common commute times in Clinton are 15 to 19 minutes (1,513 commuters, 26.3%) for males and 15 to 19 minutes (910 commuters, 21.3%) for females.
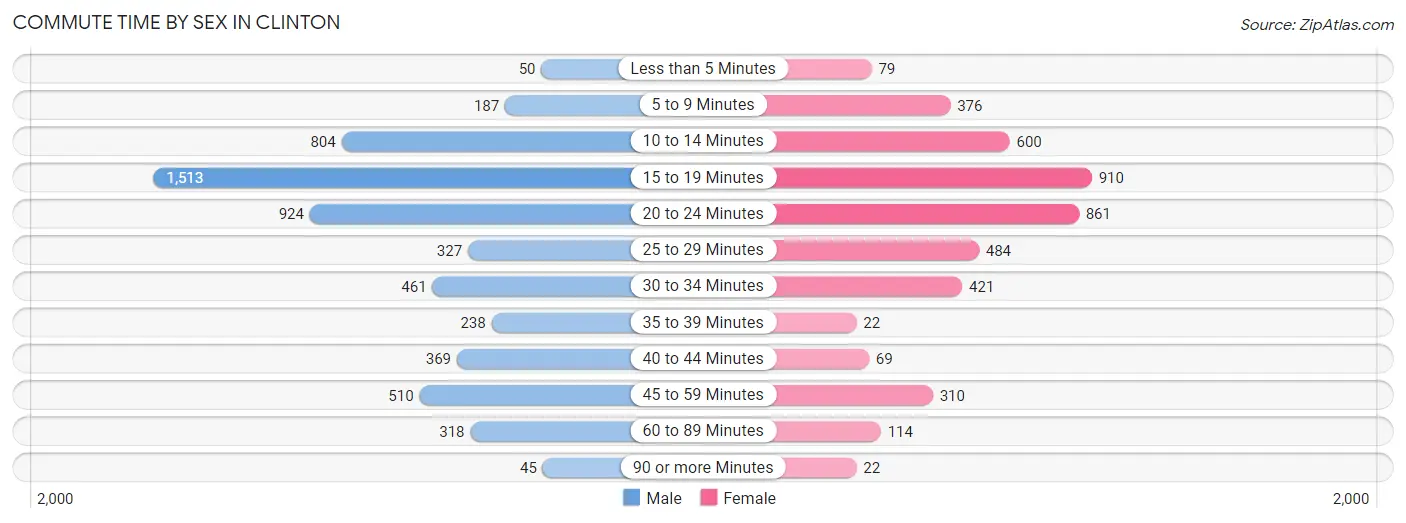
| Commute Time | Male | Female |
| Less than 5 Minutes | 50 (0.9%) | 79 (1.8%) |
| 5 to 9 Minutes | 187 (3.3%) | 376 (8.8%) |
| 10 to 14 Minutes | 804 (14.0%) | 600 (14.1%) |
| 15 to 19 Minutes | 1,513 (26.3%) | 910 (21.3%) |
| 20 to 24 Minutes | 924 (16.1%) | 861 (20.2%) |
| 25 to 29 Minutes | 327 (5.7%) | 484 (11.3%) |
| 30 to 34 Minutes | 461 (8.0%) | 421 (9.9%) |
| 35 to 39 Minutes | 238 (4.1%) | 22 (0.5%) |
| 40 to 44 Minutes | 369 (6.4%) | 69 (1.6%) |
| 45 to 59 Minutes | 510 (8.9%) | 310 (7.3%) |
| 60 to 89 Minutes | 318 (5.5%) | 114 (2.7%) |
| 90 or more Minutes | 45 (0.8%) | 22 (0.5%) |
Time of Departure to Work by Sex in Clinton
The most frequent times of departure to work in Clinton are 12:00 PM to 3:59 PM (660, 11.5%) for males and 7:30 AM to 7:59 AM (529, 12.4%) for females.
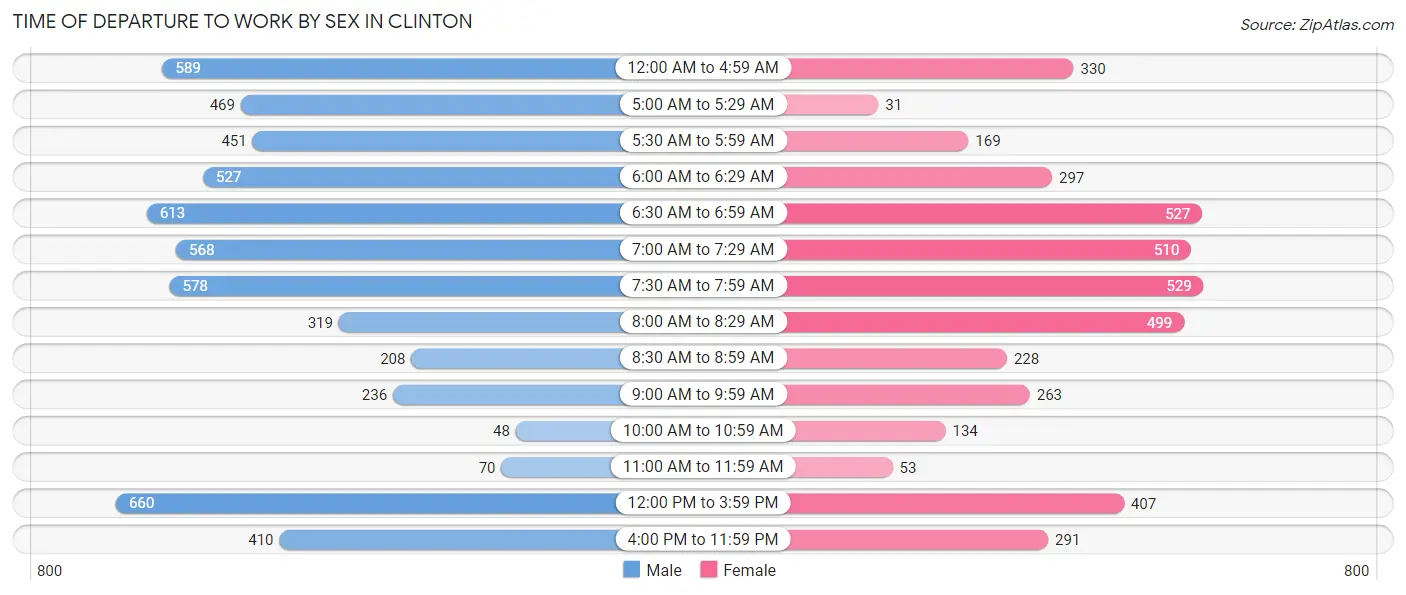
| Time of Departure | Male | Female |
| 12:00 AM to 4:59 AM | 589 (10.2%) | 330 (7.7%) |
| 5:00 AM to 5:29 AM | 469 (8.2%) | 31 (0.7%) |
| 5:30 AM to 5:59 AM | 451 (7.9%) | 169 (4.0%) |
| 6:00 AM to 6:29 AM | 527 (9.2%) | 297 (7.0%) |
| 6:30 AM to 6:59 AM | 613 (10.7%) | 527 (12.3%) |
| 7:00 AM to 7:29 AM | 568 (9.9%) | 510 (11.9%) |
| 7:30 AM to 7:59 AM | 578 (10.1%) | 529 (12.4%) |
| 8:00 AM to 8:29 AM | 319 (5.6%) | 499 (11.7%) |
| 8:30 AM to 8:59 AM | 208 (3.6%) | 228 (5.3%) |
| 9:00 AM to 9:59 AM | 236 (4.1%) | 263 (6.2%) |
| 10:00 AM to 10:59 AM | 48 (0.8%) | 134 (3.1%) |
| 11:00 AM to 11:59 AM | 70 (1.2%) | 53 (1.2%) |
| 12:00 PM to 3:59 PM | 660 (11.5%) | 407 (9.5%) |
| 4:00 PM to 11:59 PM | 410 (7.1%) | 291 (6.8%) |
| Total | 5,746 (100.0%) | 4,268 (100.0%) |
Housing Occupancy in Clinton
Occupancy by Ownership in Clinton
Of the total 6,694 dwellings in Clinton, owner-occupied units account for 6,022 (90.0%), while renter-occupied units make up 672 (10.0%).
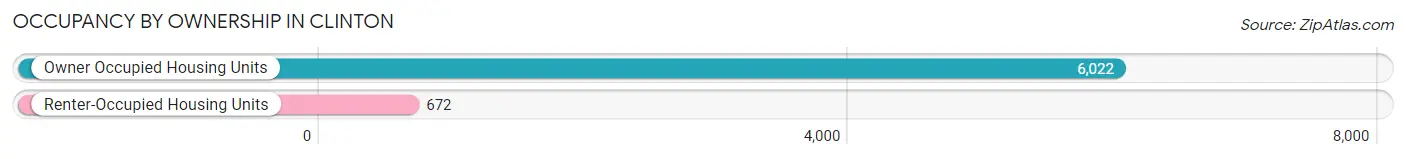
| Occupancy | # Housing Units | % Housing Units |
| Owner Occupied Housing Units | 6,022 | 90.0% |
| Renter-Occupied Housing Units | 672 | 10.0% |
| Total Occupied Housing Units | 6,694 | 100.0% |
Occupancy by Household Size in Clinton
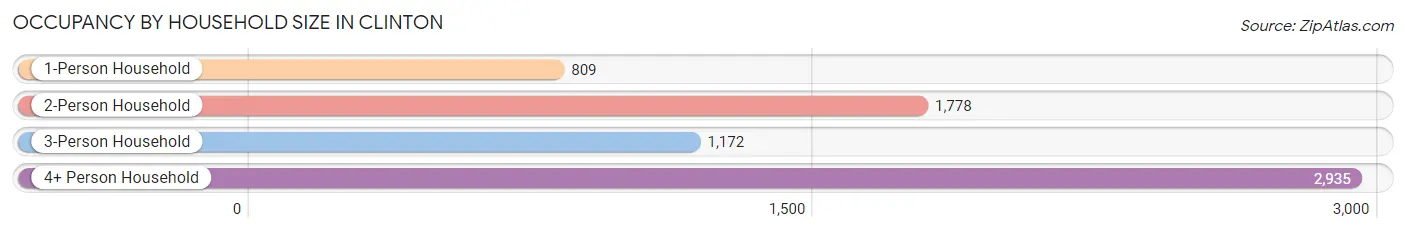
| Household Size | # Housing Units | % Housing Units |
| 1-Person Household | 809 | 12.1% |
| 2-Person Household | 1,778 | 26.6% |
| 3-Person Household | 1,172 | 17.5% |
| 4+ Person Household | 2,935 | 43.9% |
| Total Housing Units | 6,694 | 100.0% |
Occupancy by Ownership by Household Size in Clinton
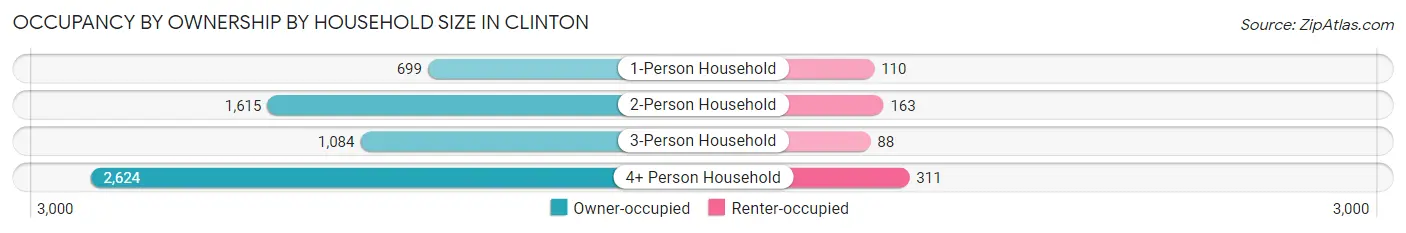
| Household Size | Owner-occupied | Renter-occupied |
| 1-Person Household | 699 (86.4%) | 110 (13.6%) |
| 2-Person Household | 1,615 (90.8%) | 163 (9.2%) |
| 3-Person Household | 1,084 (92.5%) | 88 (7.5%) |
| 4+ Person Household | 2,624 (89.4%) | 311 (10.6%) |
| Total Housing Units | 6,022 (90.0%) | 672 (10.0%) |
Occupancy by Educational Attainment in Clinton
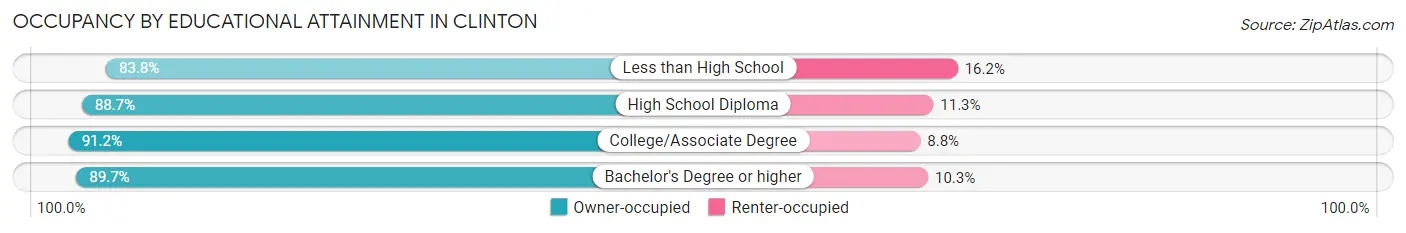
| Household Size | Owner-occupied | Renter-occupied |
| Less than High School | 223 (83.8%) | 43 (16.2%) |
| High School Diploma | 1,298 (88.7%) | 166 (11.3%) |
| College/Associate Degree | 2,843 (91.2%) | 273 (8.8%) |
| Bachelor's Degree or higher | 1,658 (89.7%) | 190 (10.3%) |
Occupancy by Age of Householder in Clinton
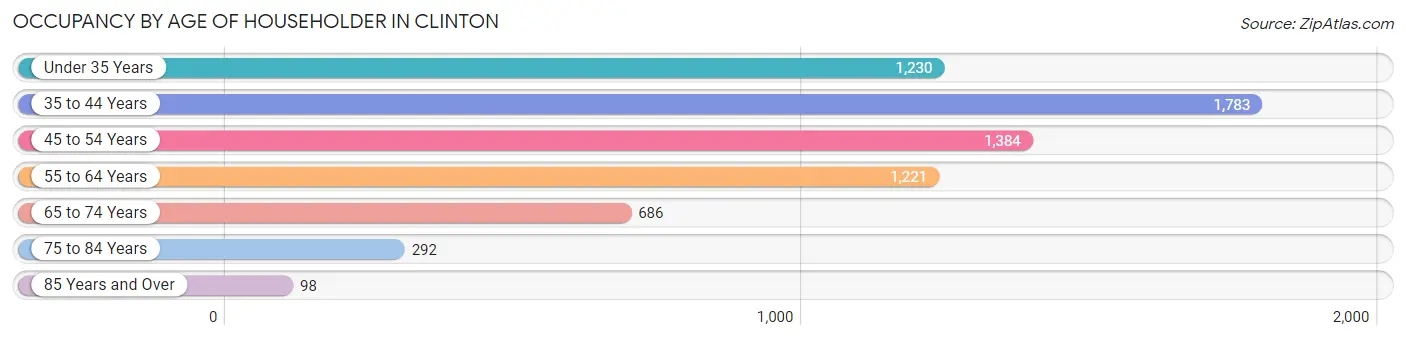
| Age Bracket | # Households | % Households |
| Under 35 Years | 1,230 | 18.4% |
| 35 to 44 Years | 1,783 | 26.6% |
| 45 to 54 Years | 1,384 | 20.7% |
| 55 to 64 Years | 1,221 | 18.2% |
| 65 to 74 Years | 686 | 10.2% |
| 75 to 84 Years | 292 | 4.4% |
| 85 Years and Over | 98 | 1.5% |
| Total | 6,694 | 100.0% |
Housing Finances in Clinton
Median Income by Occupancy in Clinton
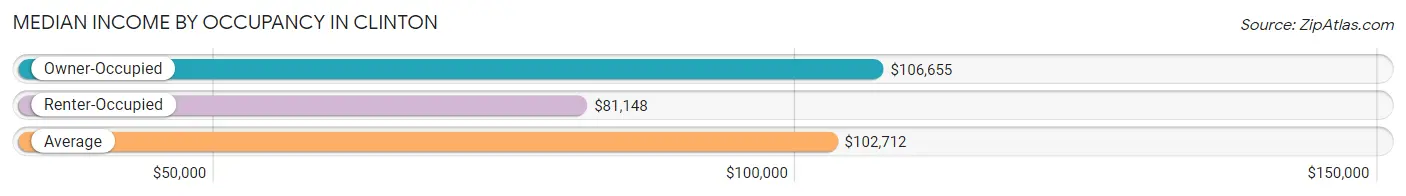
| Occupancy Type | # Households | Median Income |
| Owner-Occupied | 6,022 (90.0%) | $106,655 |
| Renter-Occupied | 672 (10.0%) | $81,148 |
| Average | 6,694 (100.0%) | $102,712 |
Occupancy by Householder Income Bracket in Clinton
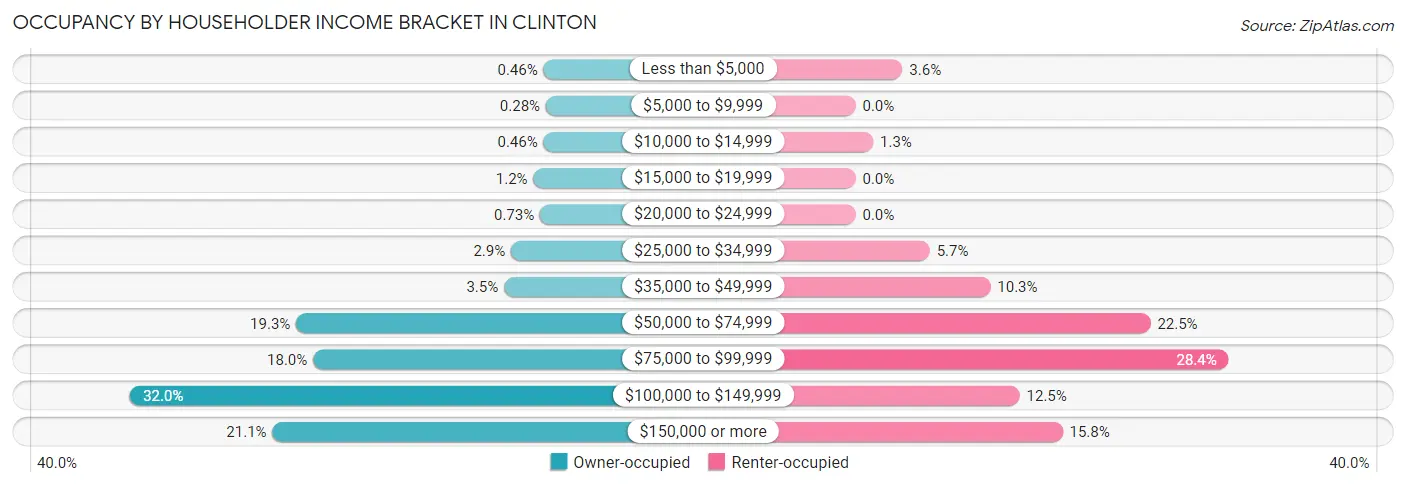
| Income Bracket | Owner-occupied | Renter-occupied |
| Less than $5,000 | 28 (0.5%) | 24 (3.6%) |
| $5,000 to $9,999 | 17 (0.3%) | 0 (0.0%) |
| $10,000 to $14,999 | 28 (0.5%) | 9 (1.3%) |
| $15,000 to $19,999 | 74 (1.2%) | 0 (0.0%) |
| $20,000 to $24,999 | 44 (0.7%) | 0 (0.0%) |
| $25,000 to $34,999 | 177 (2.9%) | 38 (5.7%) |
| $35,000 to $49,999 | 209 (3.5%) | 69 (10.3%) |
| $50,000 to $74,999 | 1,163 (19.3%) | 151 (22.5%) |
| $75,000 to $99,999 | 1,085 (18.0%) | 191 (28.4%) |
| $100,000 to $149,999 | 1,925 (32.0%) | 84 (12.5%) |
| $150,000 or more | 1,272 (21.1%) | 106 (15.8%) |
| Total | 6,022 (100.0%) | 672 (100.0%) |
Monthly Housing Cost Tiers in Clinton
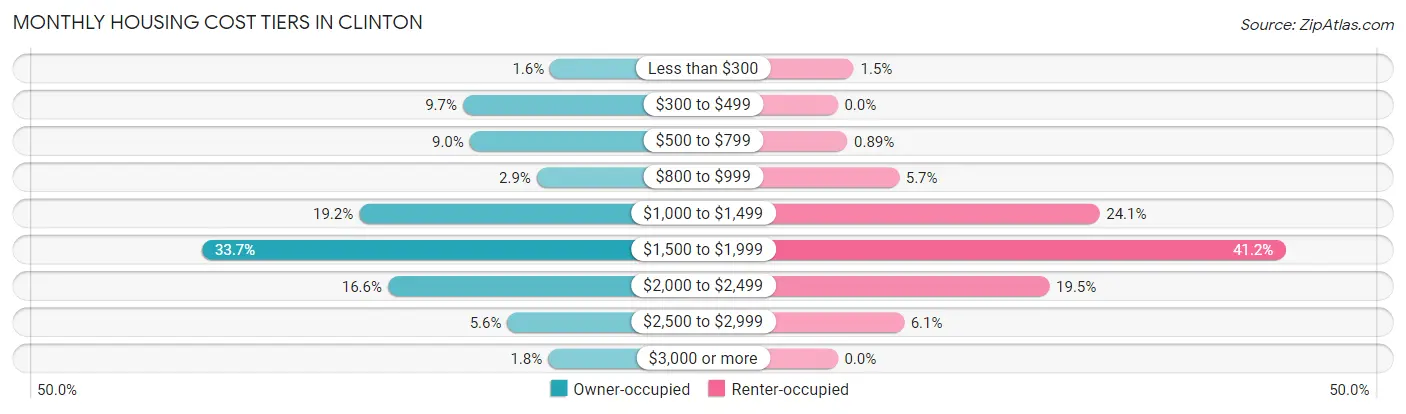
| Monthly Cost | Owner-occupied | Renter-occupied |
| Less than $300 | 98 (1.6%) | 10 (1.5%) |
| $300 to $499 | 582 (9.7%) | 0 (0.0%) |
| $500 to $799 | 544 (9.0%) | 6 (0.9%) |
| $800 to $999 | 172 (2.9%) | 38 (5.7%) |
| $1,000 to $1,499 | 1,157 (19.2%) | 162 (24.1%) |
| $1,500 to $1,999 | 2,028 (33.7%) | 277 (41.2%) |
| $2,000 to $2,499 | 997 (16.6%) | 131 (19.5%) |
| $2,500 to $2,999 | 335 (5.6%) | 41 (6.1%) |
| $3,000 or more | 109 (1.8%) | 0 (0.0%) |
| Total | 6,022 (100.0%) | 672 (100.0%) |
Physical Housing Characteristics in Clinton
Housing Structures in Clinton
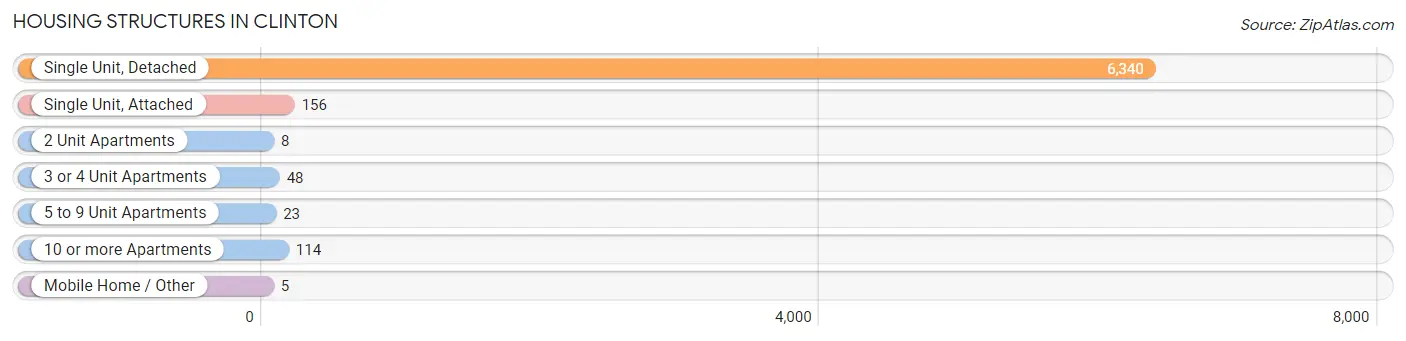
| Structure Type | # Housing Units | % Housing Units |
| Single Unit, Detached | 6,340 | 94.7% |
| Single Unit, Attached | 156 | 2.3% |
| 2 Unit Apartments | 8 | 0.1% |
| 3 or 4 Unit Apartments | 48 | 0.7% |
| 5 to 9 Unit Apartments | 23 | 0.3% |
| 10 or more Apartments | 114 | 1.7% |
| Mobile Home / Other | 5 | 0.1% |
| Total | 6,694 | 100.0% |
Housing Structures by Occupancy in Clinton
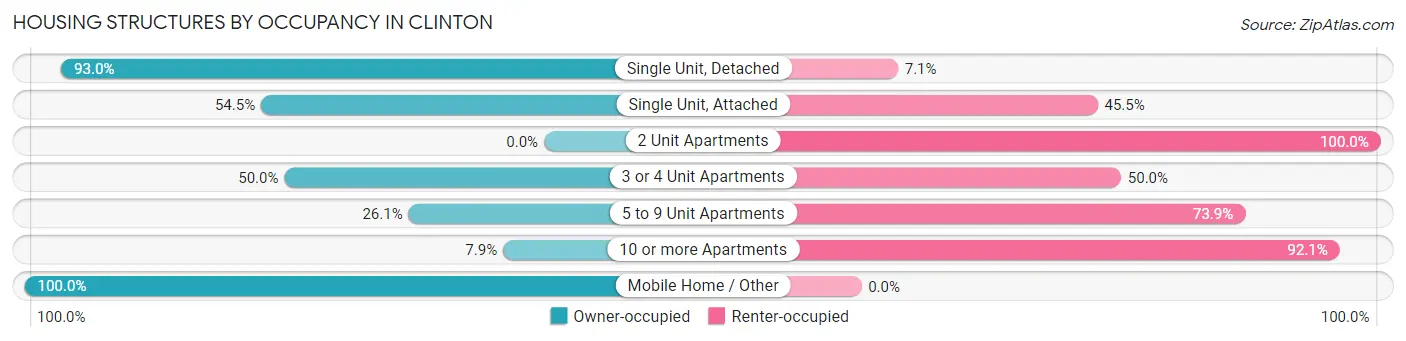
| Structure Type | Owner-occupied | Renter-occupied |
| Single Unit, Detached | 5,893 (92.9%) | 447 (7.0%) |
| Single Unit, Attached | 85 (54.5%) | 71 (45.5%) |
| 2 Unit Apartments | 0 (0.0%) | 8 (100.0%) |
| 3 or 4 Unit Apartments | 24 (50.0%) | 24 (50.0%) |
| 5 to 9 Unit Apartments | 6 (26.1%) | 17 (73.9%) |
| 10 or more Apartments | 9 (7.9%) | 105 (92.1%) |
| Mobile Home / Other | 5 (100.0%) | 0 (0.0%) |
| Total | 6,022 (90.0%) | 672 (10.0%) |
Housing Structures by Number of Rooms in Clinton
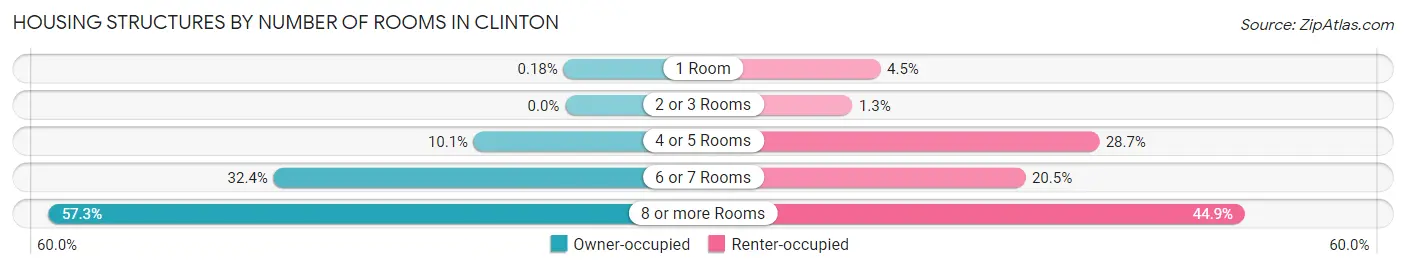
| Number of Rooms | Owner-occupied | Renter-occupied |
| 1 Room | 11 (0.2%) | 30 (4.5%) |
| 2 or 3 Rooms | 0 (0.0%) | 9 (1.3%) |
| 4 or 5 Rooms | 610 (10.1%) | 193 (28.7%) |
| 6 or 7 Rooms | 1,949 (32.4%) | 138 (20.5%) |
| 8 or more Rooms | 3,452 (57.3%) | 302 (44.9%) |
| Total | 6,022 (100.0%) | 672 (100.0%) |
Housing Structure by Heating Type in Clinton
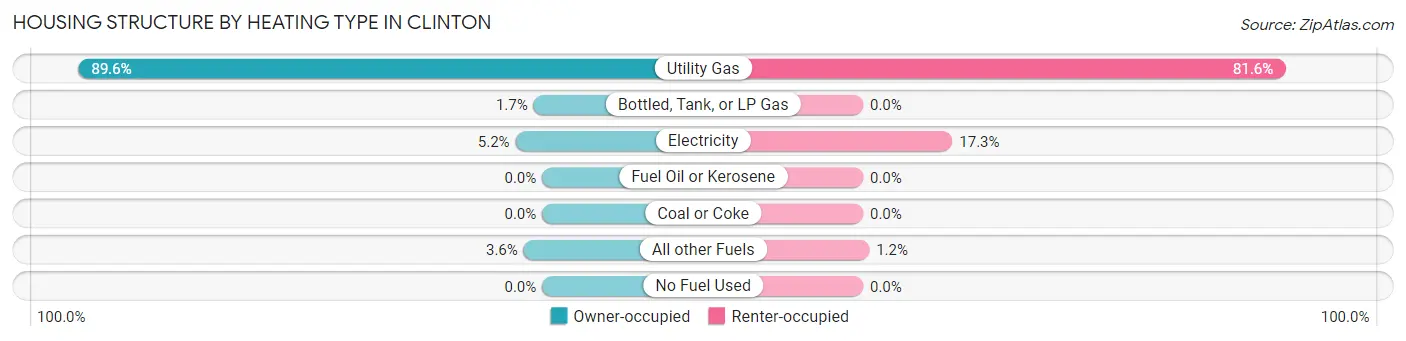
| Heating Type | Owner-occupied | Renter-occupied |
| Utility Gas | 5,397 (89.6%) | 548 (81.6%) |
| Bottled, Tank, or LP Gas | 100 (1.7%) | 0 (0.0%) |
| Electricity | 310 (5.1%) | 116 (17.3%) |
| Fuel Oil or Kerosene | 0 (0.0%) | 0 (0.0%) |
| Coal or Coke | 0 (0.0%) | 0 (0.0%) |
| All other Fuels | 215 (3.6%) | 8 (1.2%) |
| No Fuel Used | 0 (0.0%) | 0 (0.0%) |
| Total | 6,022 (100.0%) | 672 (100.0%) |
Household Vehicle Usage in Clinton
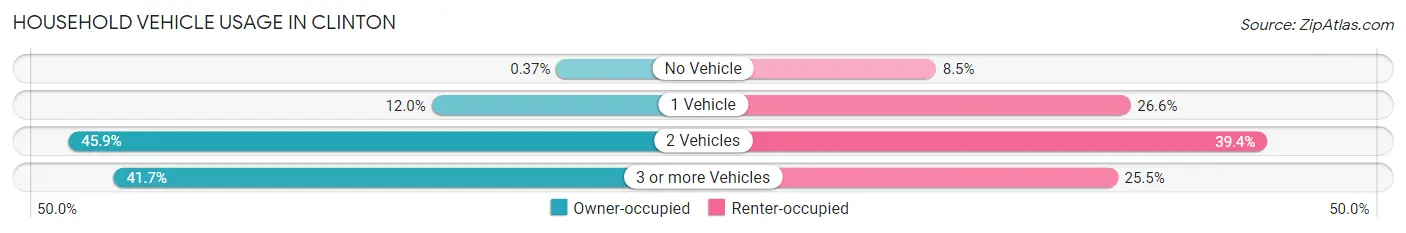
| Vehicles per Household | Owner-occupied | Renter-occupied |
| No Vehicle | 22 (0.4%) | 57 (8.5%) |
| 1 Vehicle | 724 (12.0%) | 179 (26.6%) |
| 2 Vehicles | 2,765 (45.9%) | 265 (39.4%) |
| 3 or more Vehicles | 2,511 (41.7%) | 171 (25.5%) |
| Total | 6,022 (100.0%) | 672 (100.0%) |
Real Estate & Mortgages in Clinton
Real Estate and Mortgage Overview in Clinton
| Characteristic | Without Mortgage | With Mortgage |
| Housing Units | 1,147 | 4,875 |
| Median Property Value | $369,700 | $373,400 |
| Median Household Income | $97,067 | $1,071 |
| Monthly Housing Costs | $467 | $103 |
| Real Estate Taxes | $2,193 | $143 |
Property Value by Mortgage Status in Clinton
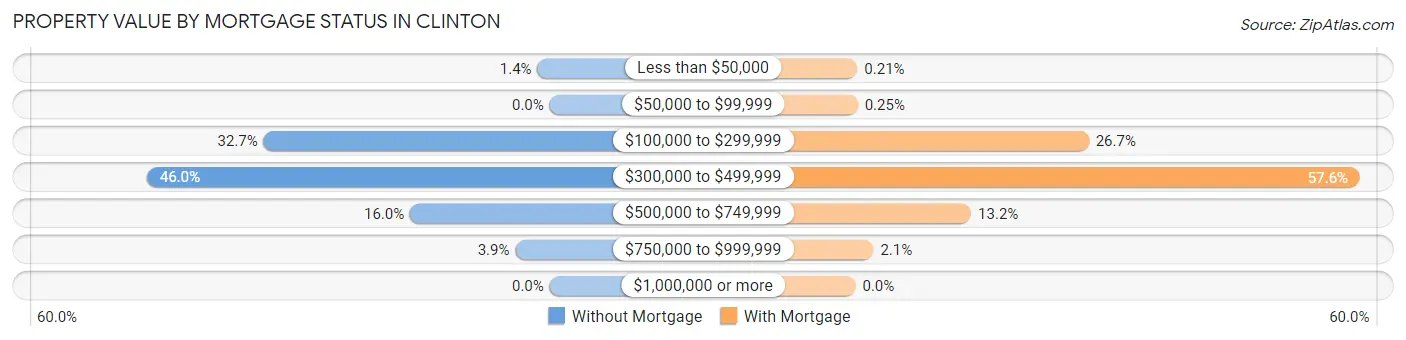
| Property Value | Without Mortgage | With Mortgage |
| Less than $50,000 | 16 (1.4%) | 10 (0.2%) |
| $50,000 to $99,999 | 0 (0.0%) | 12 (0.3%) |
| $100,000 to $299,999 | 375 (32.7%) | 1,299 (26.7%) |
| $300,000 to $499,999 | 528 (46.0%) | 2,810 (57.6%) |
| $500,000 to $749,999 | 183 (16.0%) | 644 (13.2%) |
| $750,000 to $999,999 | 45 (3.9%) | 100 (2.1%) |
| $1,000,000 or more | 0 (0.0%) | 0 (0.0%) |
| Total | 1,147 (100.0%) | 4,875 (100.0%) |
Household Income by Mortgage Status in Clinton
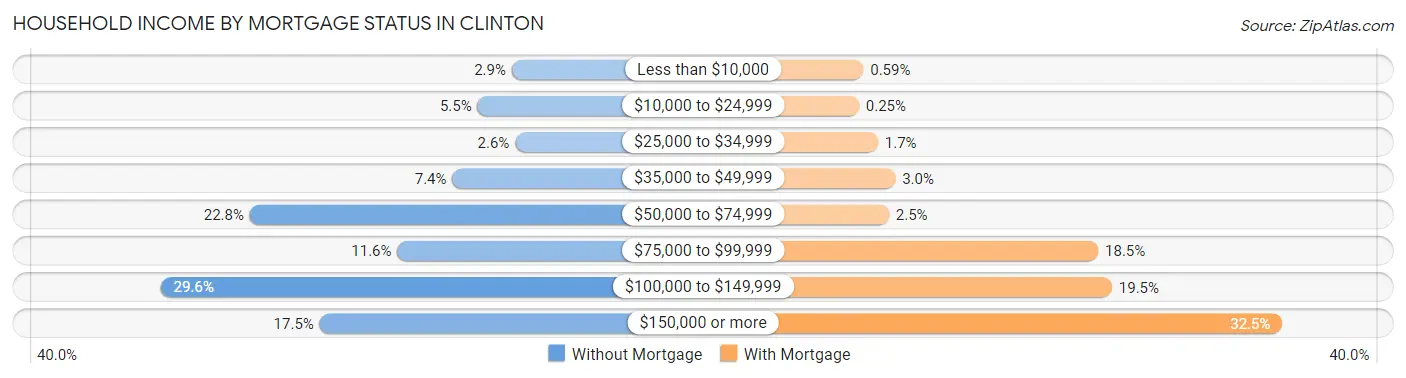
| Household Income | Without Mortgage | With Mortgage |
| Less than $10,000 | 33 (2.9%) | 29 (0.6%) |
| $10,000 to $24,999 | 63 (5.5%) | 12 (0.3%) |
| $25,000 to $34,999 | 30 (2.6%) | 83 (1.7%) |
| $35,000 to $49,999 | 85 (7.4%) | 147 (3.0%) |
| $50,000 to $74,999 | 262 (22.8%) | 124 (2.5%) |
| $75,000 to $99,999 | 133 (11.6%) | 901 (18.5%) |
| $100,000 to $149,999 | 340 (29.6%) | 952 (19.5%) |
| $150,000 or more | 201 (17.5%) | 1,585 (32.5%) |
| Total | 1,147 (100.0%) | 4,875 (100.0%) |
Property Value to Household Income Ratio in Clinton
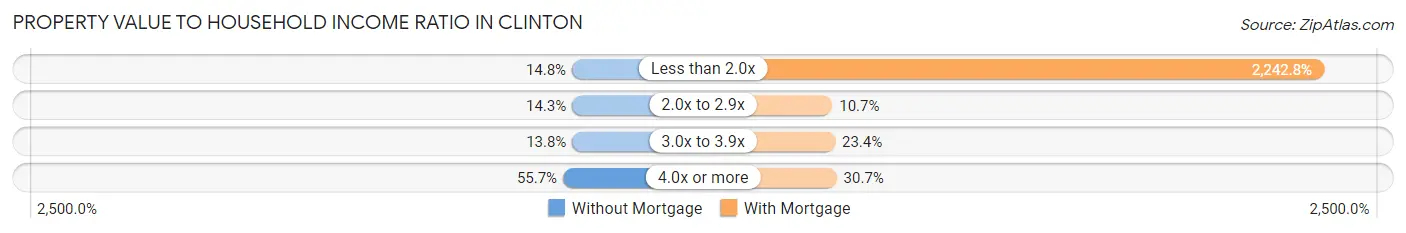
| Value-to-Income Ratio | Without Mortgage | With Mortgage |
| Less than 2.0x | 170 (14.8%) | 109,338 (2,242.8%) |
| 2.0x to 2.9x | 164 (14.3%) | 520 (10.7%) |
| 3.0x to 3.9x | 158 (13.8%) | 1,140 (23.4%) |
| 4.0x or more | 639 (55.7%) | 1,494 (30.6%) |
| Total | 1,147 (100.0%) | 4,875 (100.0%) |
Real Estate Taxes by Mortgage Status in Clinton
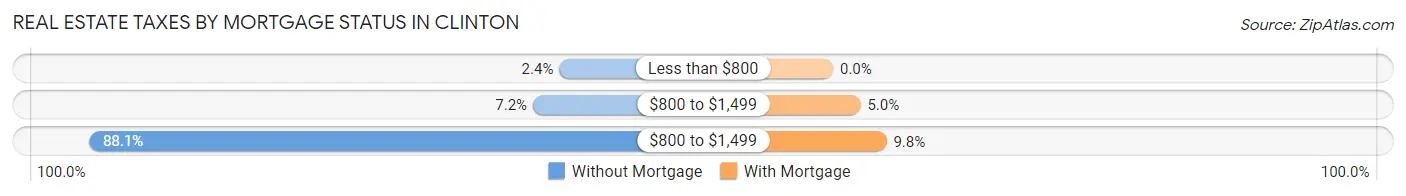
| Property Taxes | Without Mortgage | With Mortgage |
| Less than $800 | 27 (2.4%) | 0 (0.0%) |
| $800 to $1,499 | 82 (7.1%) | 244 (5.0%) |
| $800 to $1,499 | 1,010 (88.1%) | 476 (9.8%) |
| Total | 1,147 (100.0%) | 4,875 (100.0%) |
Health & Disability in Clinton
Health Insurance Coverage by Age in Clinton
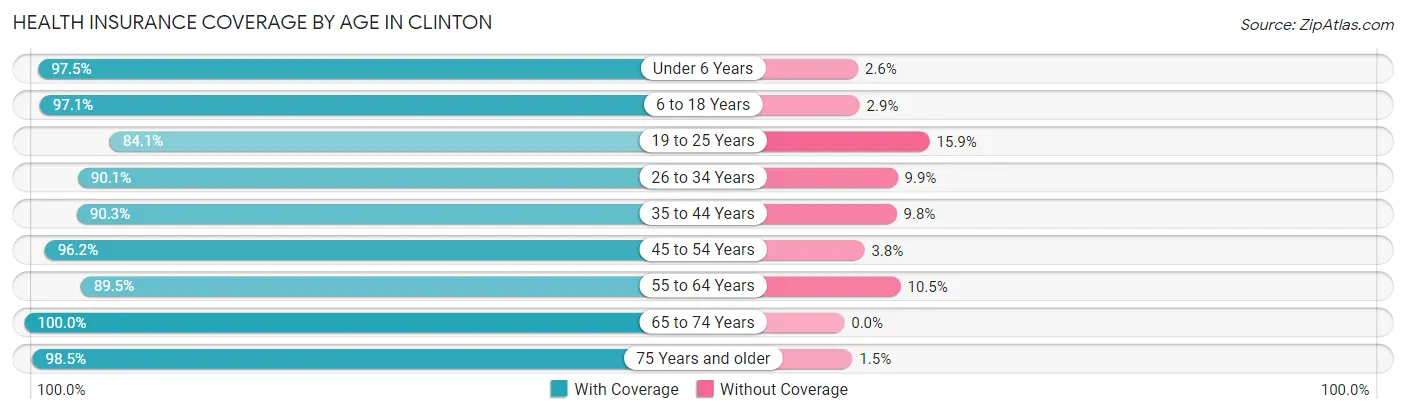
| Age Bracket | With Coverage | Without Coverage |
| Under 6 Years | 2,177 (97.5%) | 57 (2.5%) |
| 6 to 18 Years | 5,562 (97.1%) | 164 (2.9%) |
| 19 to 25 Years | 1,718 (84.1%) | 325 (15.9%) |
| 26 to 34 Years | 2,302 (90.1%) | 254 (9.9%) |
| 35 to 44 Years | 3,155 (90.2%) | 341 (9.8%) |
| 45 to 54 Years | 2,613 (96.2%) | 102 (3.8%) |
| 55 to 64 Years | 2,064 (89.5%) | 242 (10.5%) |
| 65 to 74 Years | 1,416 (100.0%) | 0 (0.0%) |
| 75 Years and older | 654 (98.5%) | 10 (1.5%) |
| Total | 21,661 (93.5%) | 1,495 (6.5%) |
Health Insurance Coverage by Citizenship Status in Clinton
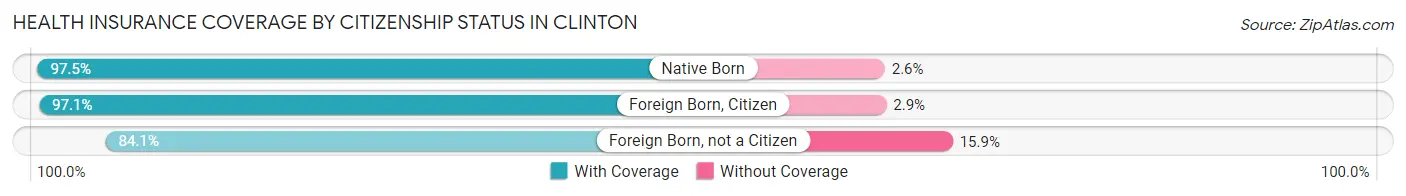
| Citizenship Status | With Coverage | Without Coverage |
| Native Born | 2,177 (97.5%) | 57 (2.5%) |
| Foreign Born, Citizen | 5,562 (97.1%) | 164 (2.9%) |
| Foreign Born, not a Citizen | 1,718 (84.1%) | 325 (15.9%) |
Health Insurance Coverage by Household Income in Clinton
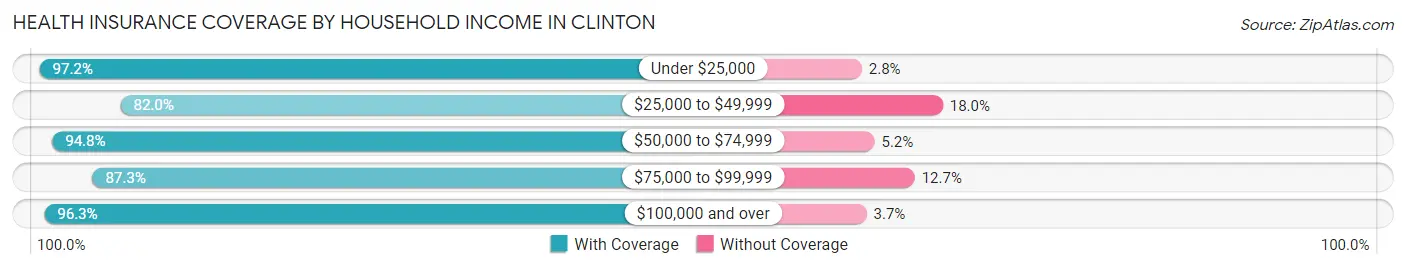
| Household Income | With Coverage | Without Coverage |
| Under $25,000 | 482 (97.2%) | 14 (2.8%) |
| $25,000 to $49,999 | 1,081 (82.0%) | 237 (18.0%) |
| $50,000 to $74,999 | 3,537 (94.8%) | 194 (5.2%) |
| $75,000 to $99,999 | 3,846 (87.3%) | 561 (12.7%) |
| $100,000 and over | 12,705 (96.3%) | 489 (3.7%) |
Public vs Private Health Insurance Coverage by Age in Clinton
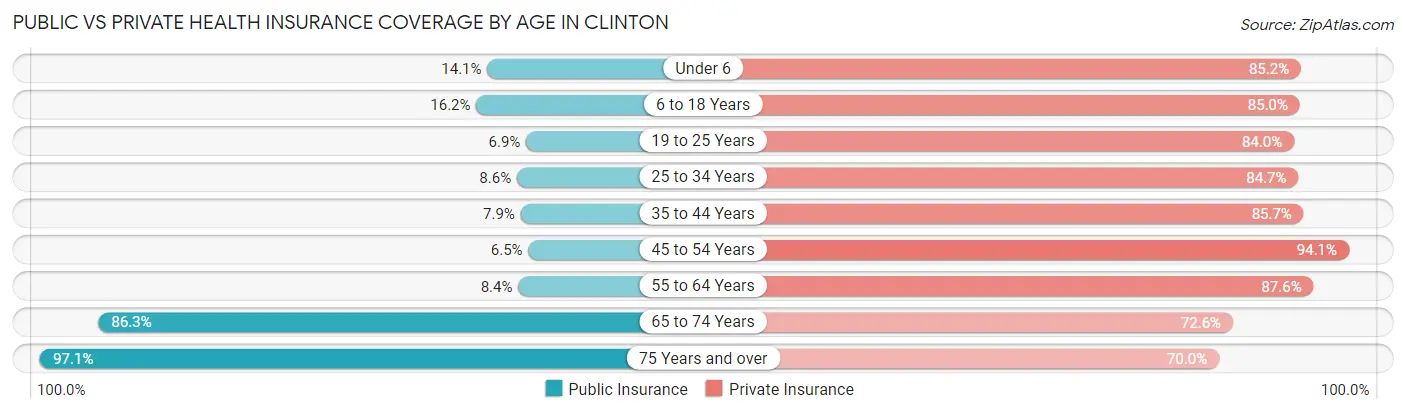
| Age Bracket | Public Insurance | Private Insurance |
| Under 6 | 315 (14.1%) | 1,904 (85.2%) |
| 6 to 18 Years | 925 (16.2%) | 4,868 (85.0%) |
| 19 to 25 Years | 141 (6.9%) | 1,715 (84.0%) |
| 25 to 34 Years | 220 (8.6%) | 2,166 (84.7%) |
| 35 to 44 Years | 277 (7.9%) | 2,997 (85.7%) |
| 45 to 54 Years | 176 (6.5%) | 2,555 (94.1%) |
| 55 to 64 Years | 193 (8.4%) | 2,019 (87.5%) |
| 65 to 74 Years | 1,222 (86.3%) | 1,028 (72.6%) |
| 75 Years and over | 645 (97.1%) | 465 (70.0%) |
| Total | 4,114 (17.8%) | 19,717 (85.2%) |
Disability Status by Sex by Age in Clinton
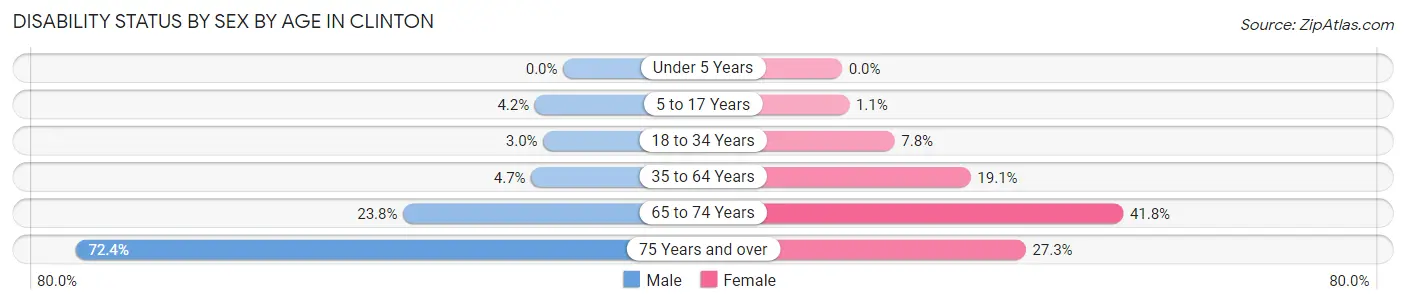
| Age Bracket | Male | Female |
| Under 5 Years | 0 (0.0%) | 0 (0.0%) |
| 5 to 17 Years | 141 (4.2%) | 23 (1.1%) |
| 18 to 34 Years | 73 (3.0%) | 204 (7.8%) |
| 35 to 64 Years | 207 (4.7%) | 792 (19.1%) |
| 65 to 74 Years | 155 (23.8%) | 319 (41.7%) |
| 75 Years and over | 226 (72.4%) | 96 (27.3%) |
Disability Class by Sex by Age in Clinton
Disability Class: Hearing Difficulty
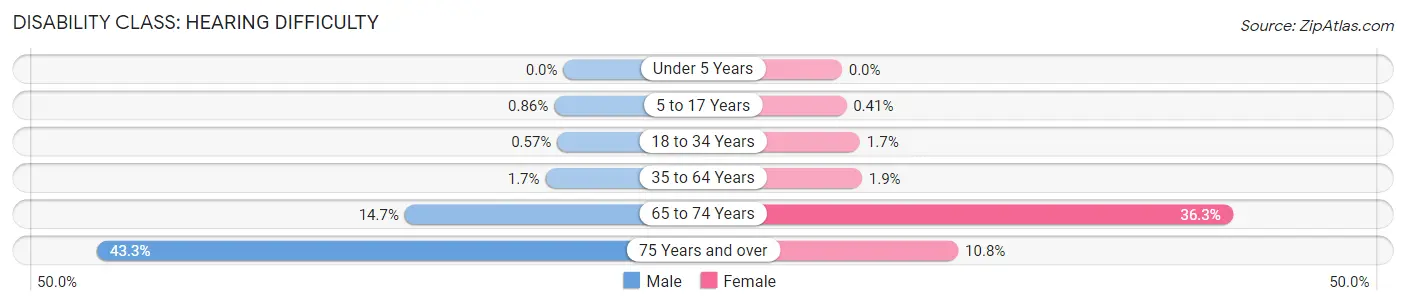
| Age Bracket | Male | Female |
| Under 5 Years | 0 (0.0%) | 0 (0.0%) |
| 5 to 17 Years | 29 (0.9%) | 9 (0.4%) |
| 18 to 34 Years | 14 (0.6%) | 44 (1.7%) |
| 35 to 64 Years | 73 (1.7%) | 77 (1.9%) |
| 65 to 74 Years | 96 (14.7%) | 277 (36.3%) |
| 75 Years and over | 135 (43.3%) | 38 (10.8%) |
Disability Class: Vision Difficulty
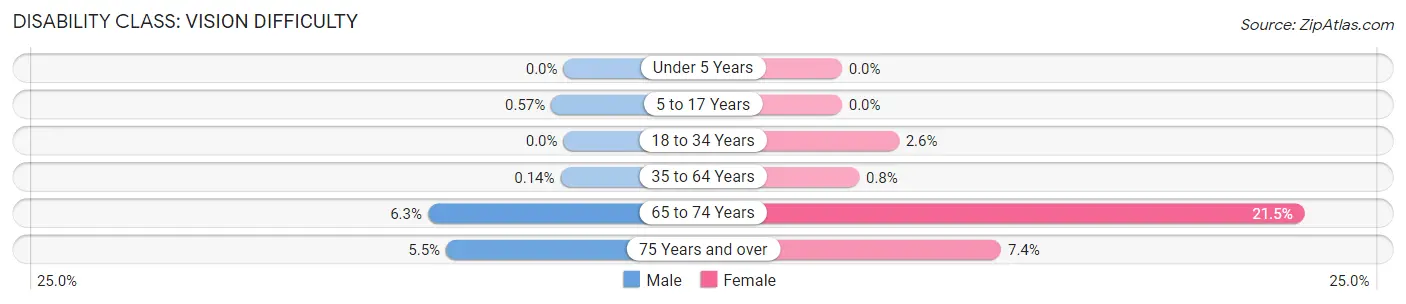
| Age Bracket | Male | Female |
| Under 5 Years | 0 (0.0%) | 0 (0.0%) |
| 5 to 17 Years | 19 (0.6%) | 0 (0.0%) |
| 18 to 34 Years | 0 (0.0%) | 69 (2.6%) |
| 35 to 64 Years | 6 (0.1%) | 33 (0.8%) |
| 65 to 74 Years | 41 (6.3%) | 164 (21.5%) |
| 75 Years and over | 17 (5.4%) | 26 (7.4%) |
Disability Class: Cognitive Difficulty
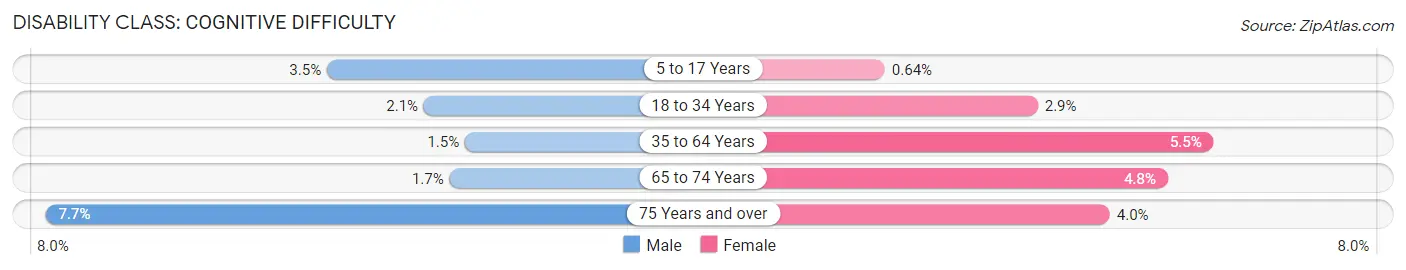
| Age Bracket | Male | Female |
| 5 to 17 Years | 118 (3.5%) | 14 (0.6%) |
| 18 to 34 Years | 51 (2.1%) | 76 (2.9%) |
| 35 to 64 Years | 64 (1.5%) | 229 (5.5%) |
| 65 to 74 Years | 11 (1.7%) | 37 (4.8%) |
| 75 Years and over | 24 (7.7%) | 14 (4.0%) |
Disability Class: Ambulatory Difficulty
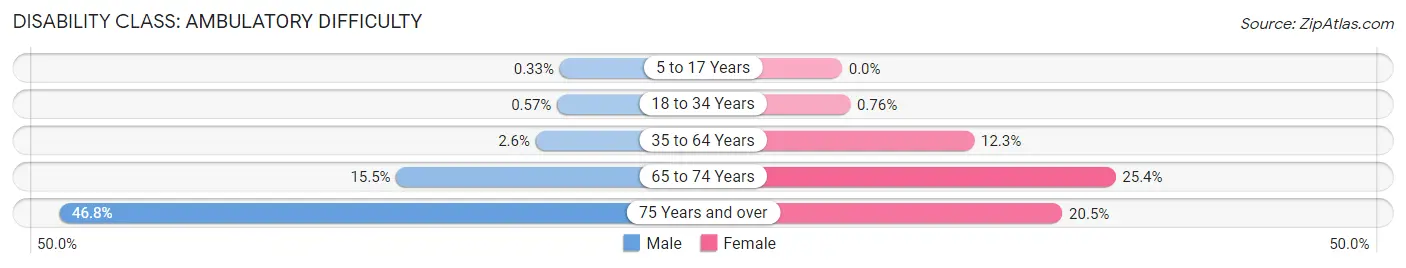
| Age Bracket | Male | Female |
| 5 to 17 Years | 11 (0.3%) | 0 (0.0%) |
| 18 to 34 Years | 14 (0.6%) | 20 (0.8%) |
| 35 to 64 Years | 112 (2.6%) | 509 (12.3%) |
| 65 to 74 Years | 101 (15.5%) | 194 (25.4%) |
| 75 Years and over | 146 (46.8%) | 72 (20.4%) |
Disability Class: Self-Care Difficulty
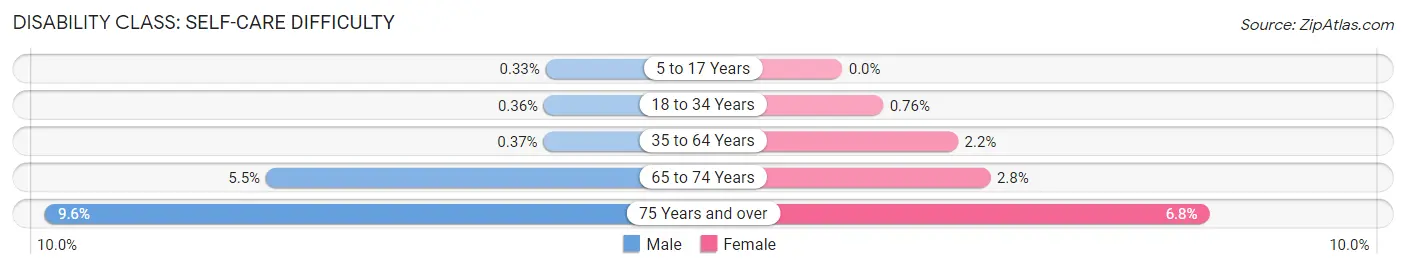
| Age Bracket | Male | Female |
| 5 to 17 Years | 11 (0.3%) | 0 (0.0%) |
| 18 to 34 Years | 9 (0.4%) | 20 (0.8%) |
| 35 to 64 Years | 16 (0.4%) | 89 (2.1%) |
| 65 to 74 Years | 36 (5.5%) | 21 (2.8%) |
| 75 Years and over | 30 (9.6%) | 24 (6.8%) |
Technology Access in Clinton
Computing Device Access in Clinton
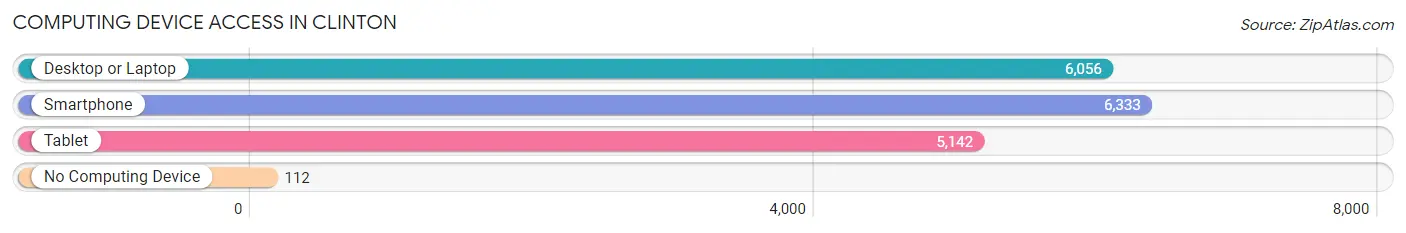
| Device Type | # Households | % Households |
| Desktop or Laptop | 6,056 | 90.5% |
| Smartphone | 6,333 | 94.6% |
| Tablet | 5,142 | 76.8% |
| No Computing Device | 112 | 1.7% |
| Total | 6,694 | 100.0% |
Internet Access in Clinton
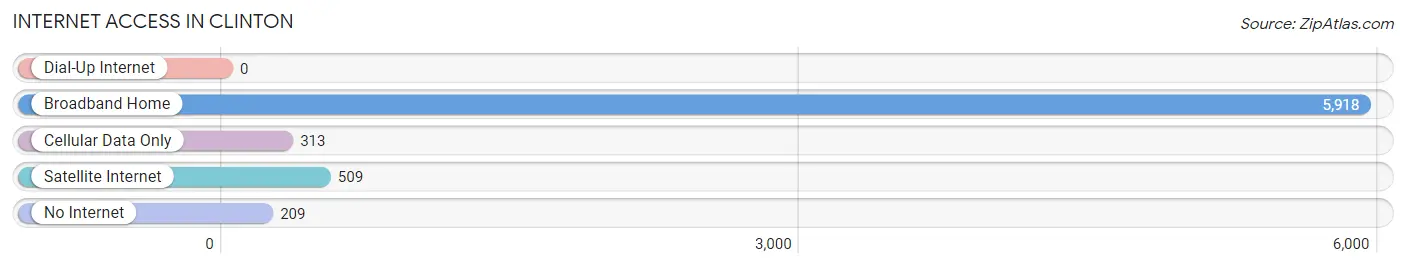
| Internet Type | # Households | % Households |
| Dial-Up Internet | 0 | 0.0% |
| Broadband Home | 5,918 | 88.4% |
| Cellular Data Only | 313 | 4.7% |
| Satellite Internet | 509 | 7.6% |
| No Internet | 209 | 3.1% |
| Total | 6,694 | 100.0% |
Clinton Summary
Clinton, Utah is a small city located in Davis County, Utah, United States. It is part of the Ogden-Clearfield Metropolitan Statistical Area. The population of Clinton was 8,664 at the 2010 census.
History
The area that is now Clinton was first settled in 1857 by a group of Mormon pioneers. The town was originally named "Echo City" after the nearby Echo Canyon. In 1868, the name was changed to Clinton in honor of the first mayor, William Clinton.
The city was incorporated in 1891 and has since grown to become a thriving community. The city is home to several businesses, including a large industrial park, and is a popular destination for outdoor recreation.
Geography
Clinton is located in Davis County, Utah, at the intersection of Interstate 15 and Interstate 84. It is situated at an elevation of 4,541 feet (1,384 m). The city covers an area of 8.3 square miles (21.5 km2).
The city is located in the Wasatch Front region of Utah, which is known for its mild climate and beautiful scenery. The city is surrounded by mountains, including the Wasatch Range to the east and the Oquirrh Mountains to the west.
Economy
Clinton is home to a variety of businesses, including manufacturing, retail, and service industries. The city is also home to a large industrial park, which is home to several large companies, including a major food processing plant.
The city is also home to several educational institutions, including the Davis Applied Technology College and the University of Utah.
Demographics
As of the 2010 census, the population of Clinton was 8,664. The racial makeup of the city was 87.3% White, 1.2% African American, 0.7% Native American, 1.2% Asian, 0.2% Pacific Islander, 6.2% from other races, and 3.4% from two or more races. Hispanic or Latino of any race were 11.3% of the population.
The median income for a household in the city was $50,945, and the median income for a family was $60,945. The per capita income for the city was $22,845. About 5.2% of families and 7.2% of the population were below the poverty line, including 8.3% of those under age 18 and 4.2% of those age 65 or over.
Conclusion
Clinton, Utah is a small city located in Davis County, Utah, United States. It is part of the Ogden-Clearfield Metropolitan Statistical Area. The city was first settled in 1857 by a group of Mormon pioneers and was incorporated in 1891. The city is home to several businesses, including a large industrial park, and is a popular destination for outdoor recreation. The population of Clinton was 8,664 at the 2010 census. The city is home to a variety of businesses, including manufacturing, retail, and service industries. The median income for a household in the city was $50,945, and the median income for a family was $60,945. The racial makeup of the city was 87.3% White, 1.2% African American, 0.7% Native American, 1.2% Asian, 0.2% Pacific Islander, 6.2% from other races, and 3.4% from two or more races. Hispanic or Latino of any race were 11.3% of the population. Clinton is a thriving community that offers a variety of activities and amenities for its residents.
Common Questions
What is Per Capita Income in Clinton?
Per Capita income in Clinton is $33,541.
What is the Median Family Income in Clinton?
Median Family Income in Clinton is $108,333.
What is the Median Household income in Clinton?
Median Household Income in Clinton is $102,712.
What is Income or Wage Gap in Clinton?
Income or Wage Gap in Clinton is 43.4%.
Women in Clinton earn 56.6 cents for every dollar earned by a man.
What is Family Income Deficit in Clinton?
Family Income Deficit in Clinton is $11,359.
Families that are below poverty line in Clinton earn $11,359 less on average than the poverty threshold level.
What is Inequality or Gini Index in Clinton?
Inequality or Gini Index in Clinton is 0.31.
What is the Total Population of Clinton?
Total Population of Clinton is 23,389.
What is the Total Male Population of Clinton?
Total Male Population of Clinton is 12,240.
What is the Total Female Population of Clinton?
Total Female Population of Clinton is 11,149.
What is the Ratio of Males per 100 Females in Clinton?
There are 109.79 Males per 100 Females in Clinton.
What is the Ratio of Females per 100 Males in Clinton?
There are 91.09 Females per 100 Males in Clinton.
What is the Median Population Age in Clinton?
Median Population Age in Clinton is 31.7 Years.
What is the Average Family Size in Clinton
Average Family Size in Clinton is 3.8 People.
What is the Average Household Size in Clinton
Average Household Size in Clinton is 3.5 People.
How Large is the Labor Force in Clinton?
There are 11,906 People in the Labor Forcein in Clinton.
What is the Percentage of People in the Labor Force in Clinton?
70.8% of People are in the Labor Force in Clinton.
What is the Unemployment Rate in Clinton?
Unemployment Rate in Clinton is 5.3%.