St George, UT Map & Demographics
St George Map
St George Overview
$34,653
PER CAPITA INCOME
$86,120
AVG FAMILY INCOME
$69,333
AVG HOUSEHOLD INCOME
38.3%
WAGE / INCOME GAP [ % ]
61.7¢/ $1
WAGE / INCOME GAP [ $ ]
$10,089
FAMILY INCOME DEFICIT
0.44
INEQUALITY / GINI INDEX
96,174
TOTAL POPULATION
46,971
MALE POPULATION
49,203
FEMALE POPULATION
95.46
MALES / 100 FEMALES
104.75
FEMALES / 100 MALES
37.5
MEDIAN AGE
3.2
AVG FAMILY SIZE
2.8
AVG HOUSEHOLD SIZE
41,956
LABOR FORCE [ PEOPLE ]
56.3%
PERCENT IN LABOR FORCE
3.3%
UNEMPLOYMENT RATE
St George Area Codes
Income in St George
Income Overview in St George
Per Capita Income in St George is $34,653, while median incomes of families and households are $86,120 and $69,333 respectively.
| Characteristic | Number | Measure |
| Per Capita Income | 96,174 | $34,653 |
| Median Family Income | 24,640 | $86,120 |
| Mean Family Income | 24,640 | $109,377 |
| Median Household Income | 33,859 | $69,333 |
| Mean Household Income | 33,859 | $95,184 |
| Income Deficit | 24,640 | $10,089 |
| Wage / Income Gap (%) | 96,174 | 38.28% |
| Wage / Income Gap ($) | 96,174 | 61.72¢ per $1 |
| Gini / Inequality Index | 96,174 | 0.44 |
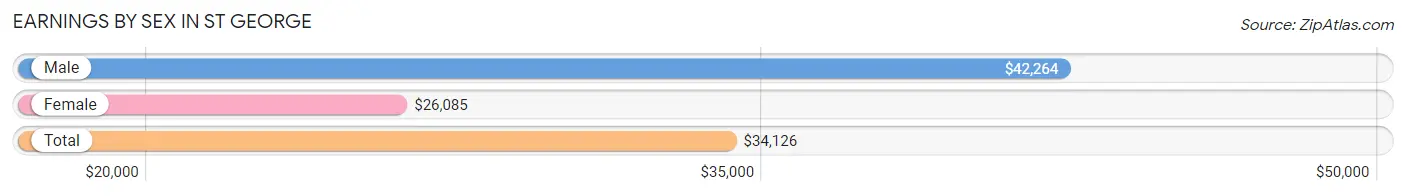
Earnings by Sex in St George
Average Earnings in St George are $34,126, $42,264 for men and $26,085 for women, a difference of 38.3%.
| Sex | Number | Average Earnings |
| Male | 24,474 (54.5%) | $42,264 |
| Female | 20,402 (45.5%) | $26,085 |
| Total | 44,876 (100.0%) | $34,126 |
Earnings by Sex by Income Bracket in St George
The most common earnings brackets in St George are $100,000+ for men (4,400 | 18.0%) and $25,000 to $29,999 for women (1,860 | 9.1%).
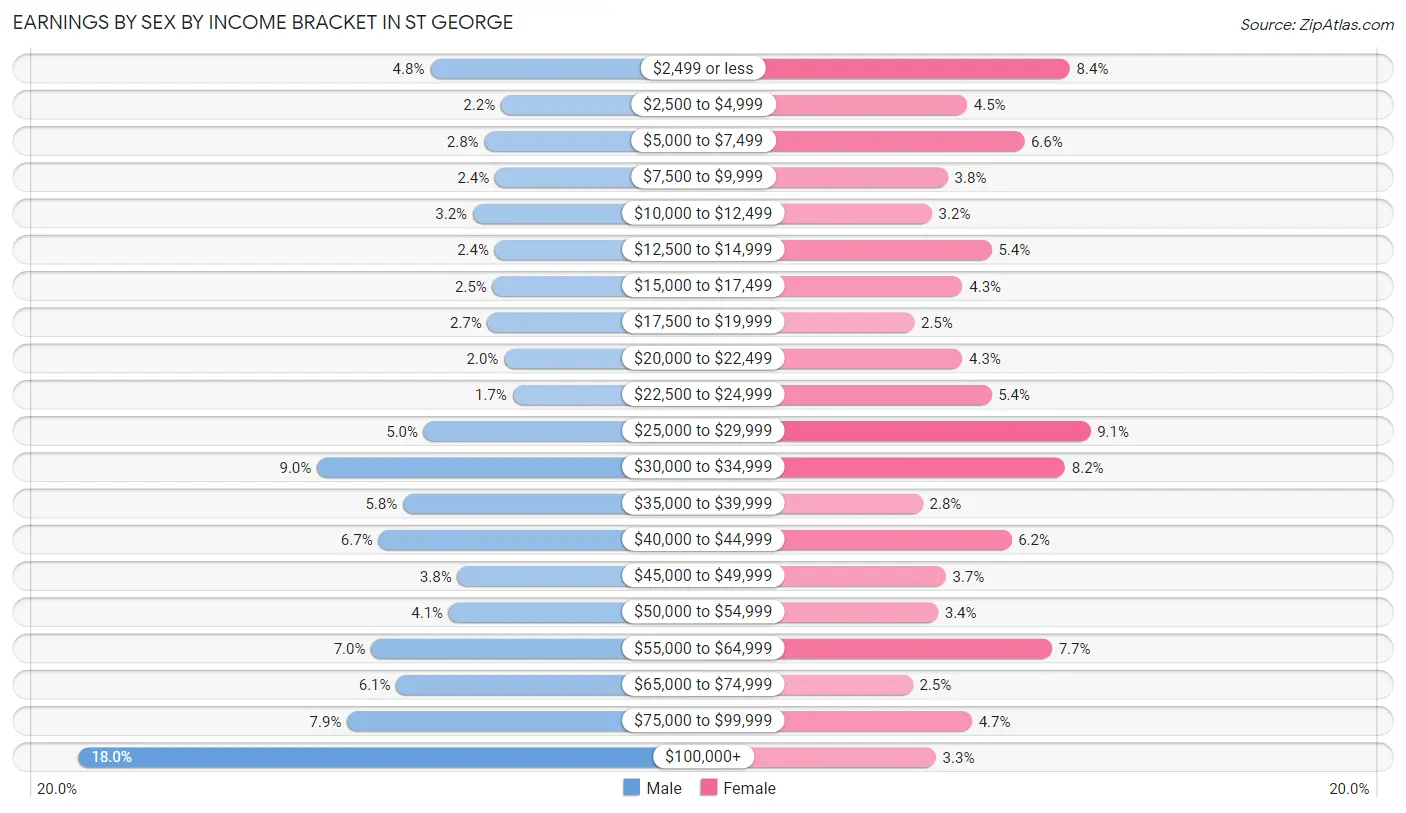
| Income | Male | Female |
| $2,499 or less | 1,174 (4.8%) | 1,704 (8.4%) |
| $2,500 to $4,999 | 525 (2.1%) | 918 (4.5%) |
| $5,000 to $7,499 | 677 (2.8%) | 1,355 (6.6%) |
| $7,500 to $9,999 | 579 (2.4%) | 771 (3.8%) |
| $10,000 to $12,499 | 784 (3.2%) | 649 (3.2%) |
| $12,500 to $14,999 | 583 (2.4%) | 1,106 (5.4%) |
| $15,000 to $17,499 | 601 (2.5%) | 883 (4.3%) |
| $17,500 to $19,999 | 649 (2.6%) | 514 (2.5%) |
| $20,000 to $22,499 | 496 (2.0%) | 882 (4.3%) |
| $22,500 to $24,999 | 418 (1.7%) | 1,104 (5.4%) |
| $25,000 to $29,999 | 1,234 (5.0%) | 1,860 (9.1%) |
| $30,000 to $34,999 | 2,212 (9.0%) | 1,666 (8.2%) |
| $35,000 to $39,999 | 1,424 (5.8%) | 580 (2.8%) |
| $40,000 to $44,999 | 1,650 (6.7%) | 1,257 (6.2%) |
| $45,000 to $49,999 | 926 (3.8%) | 755 (3.7%) |
| $50,000 to $54,999 | 1,004 (4.1%) | 696 (3.4%) |
| $55,000 to $64,999 | 1,716 (7.0%) | 1,567 (7.7%) |
| $65,000 to $74,999 | 1,485 (6.1%) | 501 (2.5%) |
| $75,000 to $99,999 | 1,937 (7.9%) | 955 (4.7%) |
| $100,000+ | 4,400 (18.0%) | 679 (3.3%) |
| Total | 24,474 (100.0%) | 20,402 (100.0%) |
Earnings by Sex by Educational Attainment in St George
Average earnings in St George are $53,135 for men and $30,742 for women, a difference of 42.1%. Men with an educational attainment of graduate degree enjoy the highest average annual earnings of $105,276, while those with high school diploma education earn the least with $36,561. Women with an educational attainment of graduate degree earn the most with the average annual earnings of $59,884, while those with high school diploma education have the smallest earnings of $26,731.
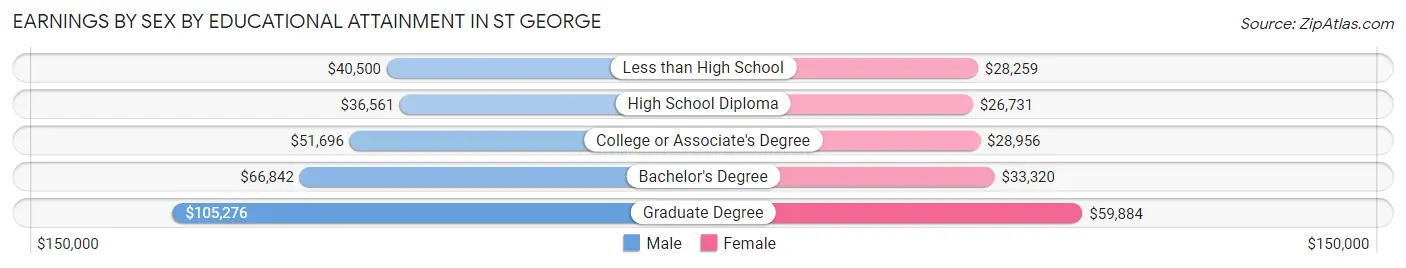
| Educational Attainment | Male Income | Female Income |
| Less than High School | $40,500 | $28,259 |
| High School Diploma | $36,561 | $26,731 |
| College or Associate's Degree | $51,696 | $28,956 |
| Bachelor's Degree | $66,842 | $33,320 |
| Graduate Degree | $105,276 | $59,884 |
| Total | $53,135 | $30,742 |
Family Income in St George
Family Income Brackets in St George
According to the St George family income data, there are 5,618 families falling into the $100,000 to $149,999 income range, which is the most common income bracket and makes up 22.8% of all families. Conversely, the less than $10,000 income bracket is the least frequent group with only 370 families (1.5%) belonging to this category.
| Income Bracket | # Families | % Families |
| Less than $10,000 | 370 | 1.5% |
| $10,000 to $14,999 | 370 | 1.5% |
| $15,000 to $24,999 | 862 | 3.5% |
| $25,000 to $34,999 | 1,799 | 7.3% |
| $35,000 to $49,999 | 2,710 | 11.0% |
| $50,000 to $74,999 | 4,583 | 18.6% |
| $75,000 to $99,999 | 3,696 | 15.0% |
| $100,000 to $149,999 | 5,618 | 22.8% |
| $150,000 to $199,999 | 2,316 | 9.4% |
| $200,000+ | 2,316 | 9.4% |
Family Income by Famaliy Size in St George
6-person families (1,060 | 4.3%) account for the highest median family income in St George with $123,095 per family, while 2-person families (12,629 | 51.2%) have the highest median income of $37,750 per family member.
| Income Bracket | # Families | Median Income |
| 2-Person Families | 12,629 (51.2%) | $75,501 |
| 3-Person Families | 3,283 (13.3%) | $79,021 |
| 4-Person Families | 4,174 (16.9%) | $119,906 |
| 5-Person Families | 2,458 (10.0%) | $100,258 |
| 6-Person Families | 1,060 (4.3%) | $123,095 |
| 7+ Person Families | 1,036 (4.2%) | $119,019 |
| Total | 24,640 (100.0%) | $86,120 |
Family Income by Number of Earners in St George
The median family income in St George is $86,120, with families comprising 3+ earners (3,215) having the highest median family income of $132,298, while families with no earners (6,259) have the lowest median family income of $65,705, accounting for 13.1% and 25.4% of families, respectively.
| Number of Earners | # Families | Median Income |
| No Earners | 6,259 (25.4%) | $65,705 |
| 1 Earner | 6,676 (27.1%) | $69,877 |
| 2 Earners | 8,490 (34.5%) | $96,404 |
| 3+ Earners | 3,215 (13.1%) | $132,298 |
| Total | 24,640 (100.0%) | $86,120 |
Household Income in St George
Household Income Brackets in St George
With 6,365 households falling in the category, the $100,000 to $149,999 income range is the most frequent in St George, accounting for 18.8% of all households. In contrast, only 982 households (2.9%) fall into the $10,000 to $14,999 income bracket, making it the least populous group.
| Income Bracket | # Households | % Households |
| Less than $10,000 | 1,219 | 3.6% |
| $10,000 to $14,999 | 982 | 2.9% |
| $15,000 to $24,999 | 1,828 | 5.4% |
| $25,000 to $34,999 | 3,420 | 10.1% |
| $35,000 to $49,999 | 4,131 | 12.2% |
| $50,000 to $74,999 | 6,298 | 18.6% |
| $75,000 to $99,999 | 4,402 | 13.0% |
| $100,000 to $149,999 | 6,365 | 18.8% |
| $150,000 to $199,999 | 2,675 | 7.9% |
| $200,000+ | 2,539 | 7.5% |
Household Income by Householder Age in St George
The median household income in St George is $69,333, with the highest median household income of $100,262 found in the 45 to 64 years age bracket for the primary householder. A total of 9,161 households (27.1%) fall into this category. Meanwhile, the 15 to 24 years age bracket for the primary householder has the lowest median household income of $43,914, with 2,171 households (6.4%) in this group.
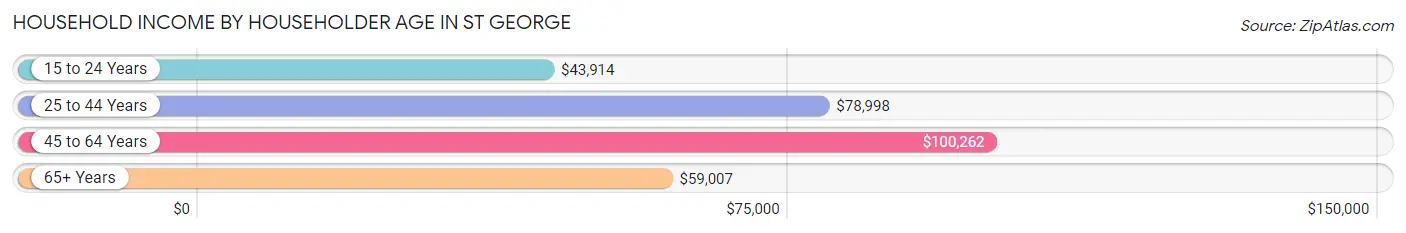
| Income Bracket | # Households | Median Income |
| 15 to 24 Years | 2,171 (6.4%) | $43,914 |
| 25 to 44 Years | 9,586 (28.3%) | $78,998 |
| 45 to 64 Years | 9,161 (27.1%) | $100,262 |
| 65+ Years | 12,941 (38.2%) | $59,007 |
| Total | 33,859 (100.0%) | $69,333 |
Poverty in St George
Income Below Poverty by Sex and Age in St George
With 9.1% poverty level for males and 11.1% for females among the residents of St George, 5 year old males and 18 to 24 year old females are the most vulnerable to poverty, with 119 males (20.5%) and 1,122 females (23.1%) in their respective age groups living below the poverty level.
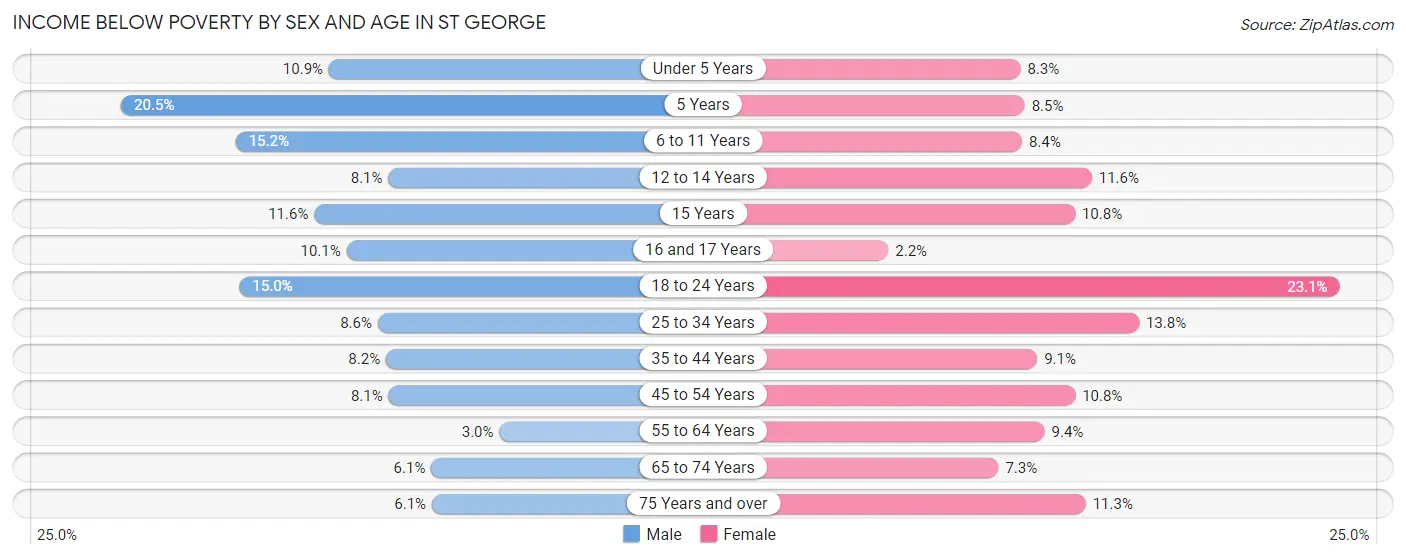
| Age Bracket | Male | Female |
| Under 5 Years | 353 (10.9%) | 225 (8.3%) |
| 5 Years | 119 (20.5%) | 79 (8.5%) |
| 6 to 11 Years | 588 (15.2%) | 337 (8.4%) |
| 12 to 14 Years | 198 (8.1%) | 246 (11.6%) |
| 15 Years | 101 (11.6%) | 63 (10.8%) |
| 16 and 17 Years | 132 (10.1%) | 31 (2.2%) |
| 18 to 24 Years | 755 (15.0%) | 1,122 (23.1%) |
| 25 to 34 Years | 494 (8.6%) | 731 (13.8%) |
| 35 to 44 Years | 427 (8.2%) | 504 (9.1%) |
| 45 to 54 Years | 361 (8.1%) | 493 (10.8%) |
| 55 to 64 Years | 115 (3.0%) | 466 (9.4%) |
| 65 to 74 Years | 312 (6.1%) | 424 (7.3%) |
| 75 Years and over | 299 (6.1%) | 632 (11.3%) |
| Total | 4,254 (9.1%) | 5,353 (11.1%) |
Income Above Poverty by Sex and Age in St George
According to the poverty statistics in St George, males aged 55 to 64 years and females aged 16 and 17 years are the age groups that are most secure financially, with 97.0% of males and 97.8% of females in these age groups living above the poverty line.
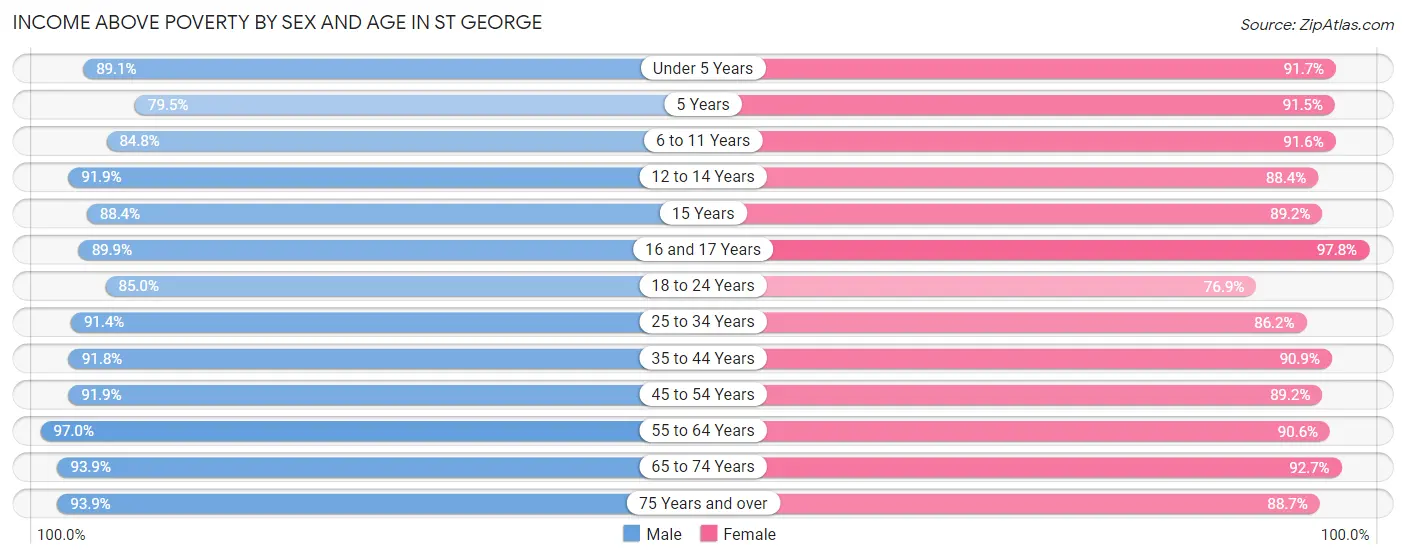
| Age Bracket | Male | Female |
| Under 5 Years | 2,890 (89.1%) | 2,490 (91.7%) |
| 5 Years | 461 (79.5%) | 852 (91.5%) |
| 6 to 11 Years | 3,281 (84.8%) | 3,693 (91.6%) |
| 12 to 14 Years | 2,241 (91.9%) | 1,875 (88.4%) |
| 15 Years | 773 (88.4%) | 519 (89.2%) |
| 16 and 17 Years | 1,180 (89.9%) | 1,402 (97.8%) |
| 18 to 24 Years | 4,268 (85.0%) | 3,738 (76.9%) |
| 25 to 34 Years | 5,244 (91.4%) | 4,569 (86.2%) |
| 35 to 44 Years | 4,763 (91.8%) | 5,052 (90.9%) |
| 45 to 54 Years | 4,089 (91.9%) | 4,060 (89.2%) |
| 55 to 64 Years | 3,755 (97.0%) | 4,485 (90.6%) |
| 65 to 74 Years | 4,776 (93.9%) | 5,406 (92.7%) |
| 75 Years and over | 4,602 (93.9%) | 4,952 (88.7%) |
| Total | 42,323 (90.9%) | 43,093 (88.9%) |
Income Below Poverty Among Married-Couple Families in St George
The poverty statistics for married-couple families in St George show that 4.4% or 909 of the total 20,677 families live below the poverty line. Families with 5 or more children have the highest poverty rate of 9.7%, comprising of 69 families. On the other hand, families with no children have the lowest poverty rate of 3.2%, which includes 384 families.
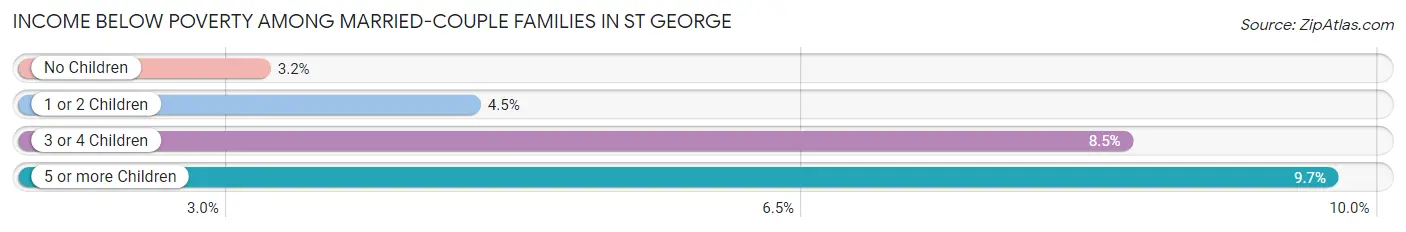
| Children | Above Poverty | Below Poverty |
| No Children | 11,624 (96.8%) | 384 (3.2%) |
| 1 or 2 Children | 5,204 (95.5%) | 244 (4.5%) |
| 3 or 4 Children | 2,298 (91.5%) | 212 (8.5%) |
| 5 or more Children | 642 (90.3%) | 69 (9.7%) |
| Total | 19,768 (95.6%) | 909 (4.4%) |
Income Below Poverty Among Single-Parent Households in St George
According to the poverty data in St George, 3.5% or 45 single-father households and 19.5% or 523 single-mother households are living below the poverty line. Among single-father households, those with no children have the highest poverty rate, with 25 households (4.0%) experiencing poverty. Likewise, among single-mother households, those with 5 or more children have the highest poverty rate, with 49 households (100.0%) falling below the poverty line.
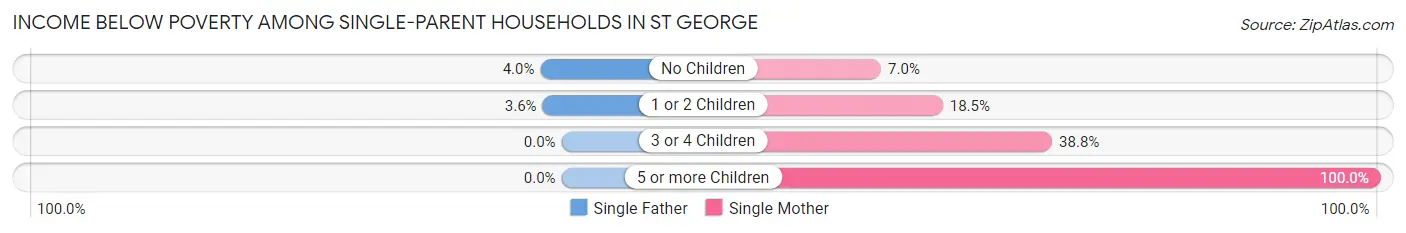
| Children | Single Father | Single Mother |
| No Children | 25 (4.0%) | 59 (7.0%) |
| 1 or 2 Children | 20 (3.5%) | 255 (18.5%) |
| 3 or 4 Children | 0 (0.0%) | 160 (38.8%) |
| 5 or more Children | 0 (0.0%) | 49 (100.0%) |
| Total | 45 (3.5%) | 523 (19.5%) |
Income Below Poverty Among Married-Couple vs Single-Parent Households in St George
The poverty data for St George shows that 909 of the married-couple family households (4.4%) and 568 of the single-parent households (14.3%) are living below the poverty level. Within the married-couple family households, those with 5 or more children have the highest poverty rate, with 69 households (9.7%) falling below the poverty line. Among the single-parent households, those with 5 or more children have the highest poverty rate, with 49 household (100.0%) living below poverty.
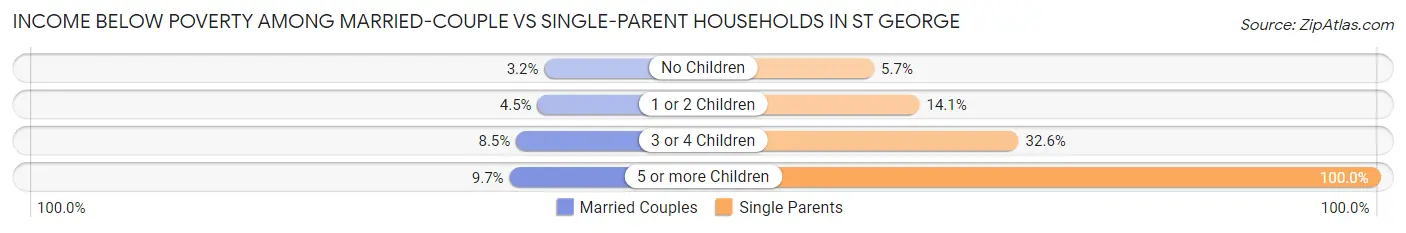
| Children | Married-Couple Families | Single-Parent Households |
| No Children | 384 (3.2%) | 84 (5.7%) |
| 1 or 2 Children | 244 (4.5%) | 275 (14.1%) |
| 3 or 4 Children | 212 (8.5%) | 160 (32.6%) |
| 5 or more Children | 69 (9.7%) | 49 (100.0%) |
| Total | 909 (4.4%) | 568 (14.3%) |
Race in St George
The most populous races in St George are White / Caucasian (83,273 | 86.6%), Hispanic or Latino (11,714 | 12.2%), and Two or more Races (5,064 | 5.3%).
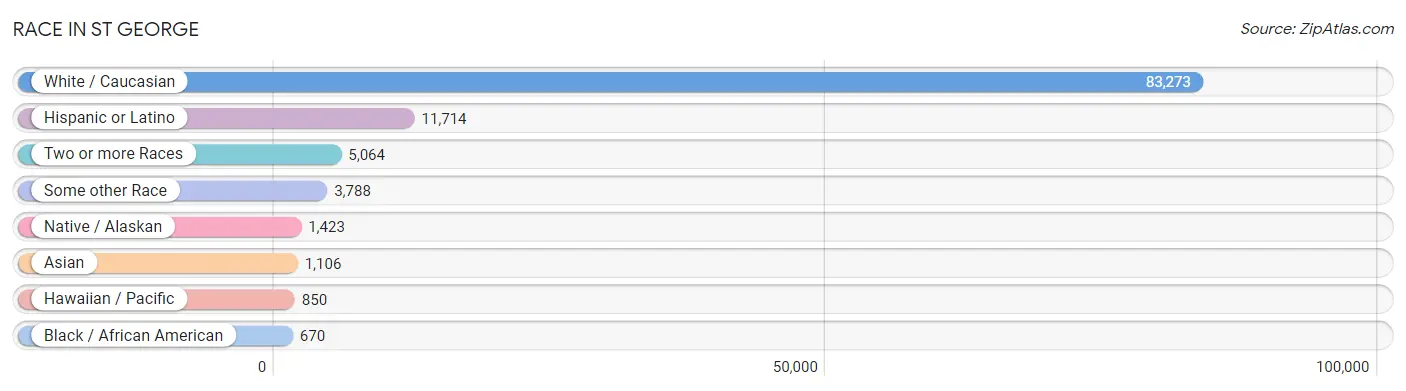
| Race | # Population | % Population |
| Asian | 1,106 | 1.1% |
| Black / African American | 670 | 0.7% |
| Hawaiian / Pacific | 850 | 0.9% |
| Hispanic or Latino | 11,714 | 12.2% |
| Native / Alaskan | 1,423 | 1.5% |
| White / Caucasian | 83,273 | 86.6% |
| Two or more Races | 5,064 | 5.3% |
| Some other Race | 3,788 | 3.9% |
| Total | 96,174 | 100.0% |
Ancestry in St George
The most populous ancestries reported in St George are English (28,169 | 29.3%), German (11,962 | 12.4%), Mexican (7,961 | 8.3%), Irish (7,580 | 7.9%), and American (5,244 | 5.4%), together accounting for 63.3% of all St George residents.
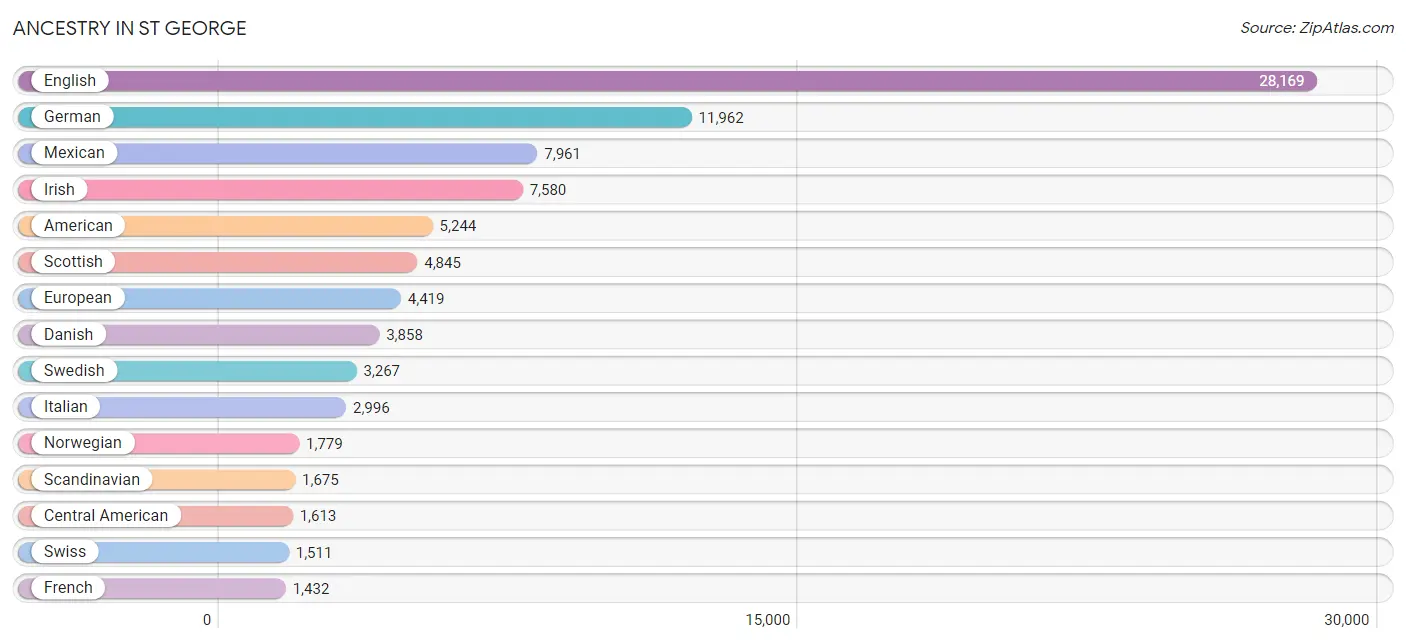
| Ancestry | # Population | % Population |
| African | 64 | 0.1% |
| Aleut | 27 | 0.0% |
| American | 5,244 | 5.4% |
| Apache | 66 | 0.1% |
| Arab | 171 | 0.2% |
| Argentinean | 113 | 0.1% |
| Australian | 22 | 0.0% |
| Austrian | 113 | 0.1% |
| Basque | 2 | 0.0% |
| Bhutanese | 191 | 0.2% |
| Blackfeet | 5 | 0.0% |
| Bolivian | 8 | 0.0% |
| Brazilian | 298 | 0.3% |
| British | 1,411 | 1.5% |
| Burmese | 15 | 0.0% |
| Cambodian | 3 | 0.0% |
| Canadian | 433 | 0.4% |
| Central American | 1,613 | 1.7% |
| Central American Indian | 26 | 0.0% |
| Cherokee | 438 | 0.5% |
| Chickasaw | 43 | 0.0% |
| Chilean | 12 | 0.0% |
| Chippewa | 31 | 0.0% |
| Choctaw | 59 | 0.1% |
| Colombian | 76 | 0.1% |
| Comanche | 51 | 0.1% |
| Costa Rican | 24 | 0.0% |
| Creek | 43 | 0.0% |
| Croatian | 135 | 0.1% |
| Cuban | 61 | 0.1% |
| Czech | 122 | 0.1% |
| Czechoslovakian | 20 | 0.0% |
| Danish | 3,858 | 4.0% |
| Dominican | 7 | 0.0% |
| Dutch | 1,202 | 1.3% |
| Eastern European | 246 | 0.3% |
| Ecuadorian | 11 | 0.0% |
| Egyptian | 171 | 0.2% |
| English | 28,169 | 29.3% |
| Ethiopian | 71 | 0.1% |
| European | 4,419 | 4.6% |
| Fijian | 52 | 0.1% |
| Filipino | 16 | 0.0% |
| Finnish | 267 | 0.3% |
| French | 1,432 | 1.5% |
| French Canadian | 604 | 0.6% |
| German | 11,962 | 12.4% |
| Ghanaian | 27 | 0.0% |
| Greek | 276 | 0.3% |
| Guatemalan | 397 | 0.4% |
| Honduran | 85 | 0.1% |
| Hungarian | 91 | 0.1% |
| Icelander | 257 | 0.3% |
| Indian (Asian) | 170 | 0.2% |
| Irish | 7,580 | 7.9% |
| Italian | 2,996 | 3.1% |
| Jamaican | 41 | 0.0% |
| Korean | 543 | 0.6% |
| Latvian | 6 | 0.0% |
| Lithuanian | 85 | 0.1% |
| Luxembourger | 5 | 0.0% |
| Maltese | 11 | 0.0% |
| Mexican | 7,961 | 8.3% |
| Mexican American Indian | 7 | 0.0% |
| Mongolian | 21 | 0.0% |
| Native Hawaiian | 372 | 0.4% |
| Navajo | 755 | 0.8% |
| Northern European | 331 | 0.3% |
| Norwegian | 1,779 | 1.8% |
| Osage | 21 | 0.0% |
| Paiute | 28 | 0.0% |
| Pakistani | 148 | 0.2% |
| Pennsylvania German | 33 | 0.0% |
| Peruvian | 89 | 0.1% |
| Polish | 1,142 | 1.2% |
| Portuguese | 225 | 0.2% |
| Puerto Rican | 147 | 0.2% |
| Romanian | 43 | 0.0% |
| Russian | 255 | 0.3% |
| Salvadoran | 1,107 | 1.1% |
| Samoan | 778 | 0.8% |
| Scandinavian | 1,675 | 1.7% |
| Scotch-Irish | 610 | 0.6% |
| Scottish | 4,845 | 5.0% |
| Serbian | 47 | 0.1% |
| Slavic | 45 | 0.1% |
| Slovak | 28 | 0.0% |
| South American | 654 | 0.7% |
| Spaniard | 314 | 0.3% |
| Spanish | 138 | 0.1% |
| Spanish American | 73 | 0.1% |
| Spanish American Indian | 109 | 0.1% |
| Sri Lankan | 328 | 0.3% |
| Subsaharan African | 189 | 0.2% |
| Swedish | 3,267 | 3.4% |
| Swiss | 1,511 | 1.6% |
| Thai | 341 | 0.4% |
| Tongan | 289 | 0.3% |
| Turkish | 36 | 0.0% |
| Ukrainian | 115 | 0.1% |
| Uruguayan | 35 | 0.0% |
| Ute | 12 | 0.0% |
| Venezuelan | 310 | 0.3% |
| Welsh | 1,343 | 1.4% |
| Yugoslavian | 56 | 0.1% |
| Yuman | 14 | 0.0% | View All 106 Rows |
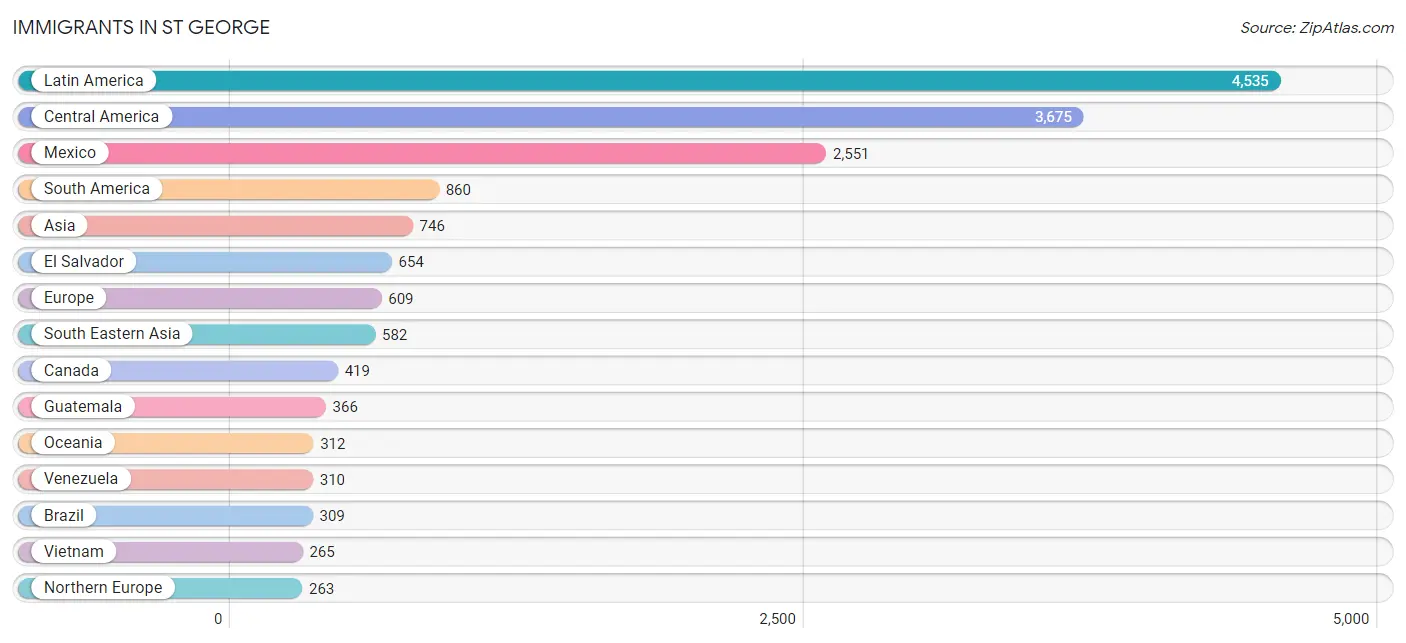
Immigrants in St George
The most numerous immigrant groups reported in St George came from Latin America (4,535 | 4.7%), Central America (3,675 | 3.8%), Mexico (2,551 | 2.6%), South America (860 | 0.9%), and Asia (746 | 0.8%), together accounting for 12.9% of all St George residents.
| Immigration Origin | # Population | % Population |
| Africa | 140 | 0.2% |
| Argentina | 139 | 0.1% |
| Asia | 746 | 0.8% |
| Australia | 44 | 0.1% |
| Austria | 17 | 0.0% |
| Brazil | 309 | 0.3% |
| Canada | 419 | 0.4% |
| Central America | 3,675 | 3.8% |
| Chile | 12 | 0.0% |
| China | 59 | 0.1% |
| Colombia | 32 | 0.0% |
| Costa Rica | 5 | 0.0% |
| Eastern Africa | 71 | 0.1% |
| Eastern Asia | 65 | 0.1% |
| Eastern Europe | 165 | 0.2% |
| Ecuador | 11 | 0.0% |
| El Salvador | 654 | 0.7% |
| England | 51 | 0.1% |
| Ethiopia | 71 | 0.1% |
| Europe | 609 | 0.6% |
| France | 47 | 0.1% |
| Germany | 68 | 0.1% |
| Guatemala | 366 | 0.4% |
| Honduras | 85 | 0.1% |
| Hungary | 17 | 0.0% |
| India | 63 | 0.1% |
| Ireland | 31 | 0.0% |
| Italy | 9 | 0.0% |
| Japan | 3 | 0.0% |
| Latin America | 4,535 | 4.7% |
| Malaysia | 21 | 0.0% |
| Mexico | 2,551 | 2.6% |
| Middle Africa | 11 | 0.0% |
| Netherlands | 20 | 0.0% |
| Nigeria | 50 | 0.1% |
| Northern Europe | 263 | 0.3% |
| Norway | 8 | 0.0% |
| Oceania | 312 | 0.3% |
| Panama | 14 | 0.0% |
| Peru | 12 | 0.0% |
| Philippines | 249 | 0.3% |
| Romania | 18 | 0.0% |
| Russia | 45 | 0.1% |
| Scotland | 17 | 0.0% |
| South America | 860 | 0.9% |
| South Central Asia | 63 | 0.1% |
| South Eastern Asia | 582 | 0.6% |
| Southern Europe | 29 | 0.0% |
| Spain | 20 | 0.0% |
| Sweden | 48 | 0.1% |
| Taiwan | 59 | 0.1% |
| Thailand | 47 | 0.1% |
| Turkey | 36 | 0.0% |
| Ukraine | 85 | 0.1% |
| Uruguay | 35 | 0.0% |
| Venezuela | 310 | 0.3% |
| Vietnam | 265 | 0.3% |
| Western Africa | 50 | 0.1% |
| Western Asia | 36 | 0.0% |
| Western Europe | 152 | 0.2% |
| Zaire | 11 | 0.0% | View All 61 Rows |
Sex and Age in St George
Sex and Age in St George
The most populous age groups in St George are 10 to 14 Years (3,735 | 8.0%) for men and 10 to 14 Years (3,806 | 7.7%) for women.
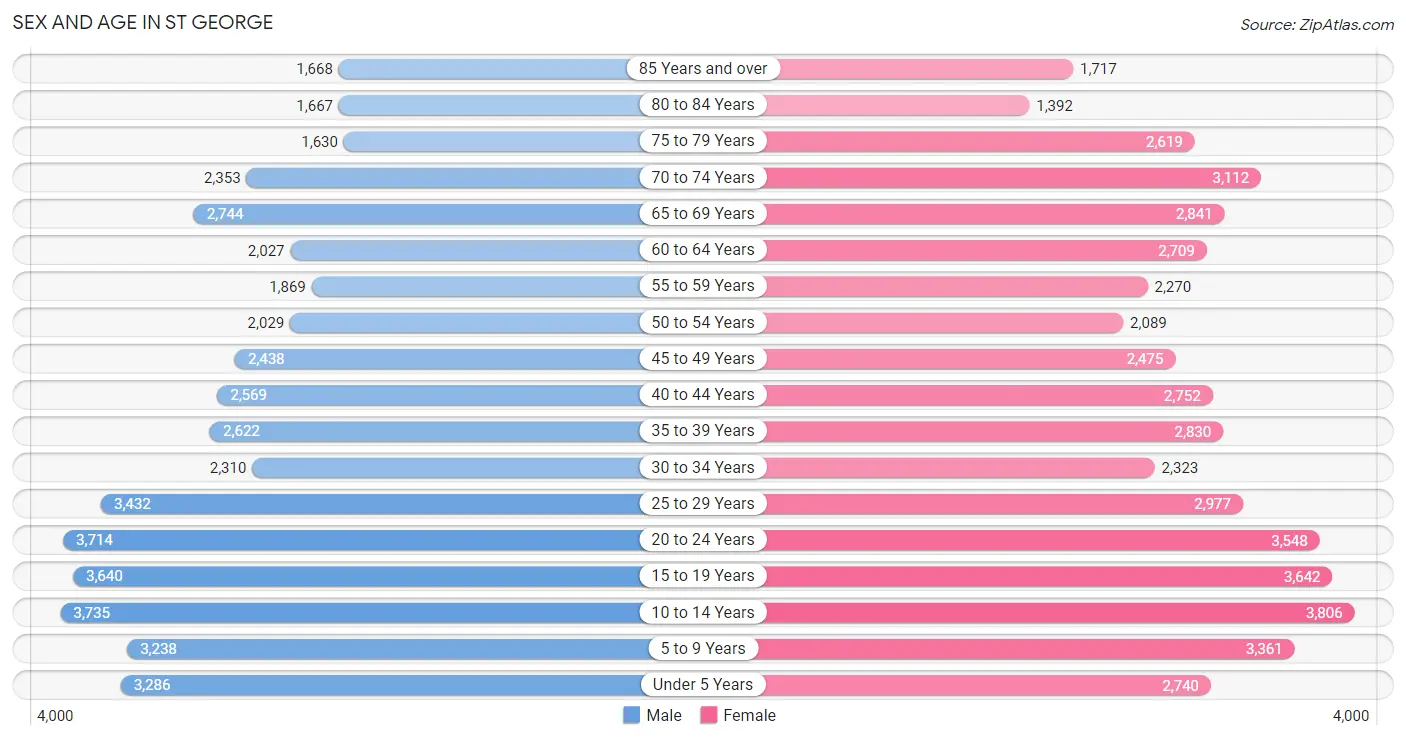
| Age Bracket | Male | Female |
| Under 5 Years | 3,286 (7.0%) | 2,740 (5.6%) |
| 5 to 9 Years | 3,238 (6.9%) | 3,361 (6.8%) |
| 10 to 14 Years | 3,735 (8.0%) | 3,806 (7.7%) |
| 15 to 19 Years | 3,640 (7.7%) | 3,642 (7.4%) |
| 20 to 24 Years | 3,714 (7.9%) | 3,548 (7.2%) |
| 25 to 29 Years | 3,432 (7.3%) | 2,977 (6.0%) |
| 30 to 34 Years | 2,310 (4.9%) | 2,323 (4.7%) |
| 35 to 39 Years | 2,622 (5.6%) | 2,830 (5.8%) |
| 40 to 44 Years | 2,569 (5.5%) | 2,752 (5.6%) |
| 45 to 49 Years | 2,438 (5.2%) | 2,475 (5.0%) |
| 50 to 54 Years | 2,029 (4.3%) | 2,089 (4.3%) |
| 55 to 59 Years | 1,869 (4.0%) | 2,270 (4.6%) |
| 60 to 64 Years | 2,027 (4.3%) | 2,709 (5.5%) |
| 65 to 69 Years | 2,744 (5.8%) | 2,841 (5.8%) |
| 70 to 74 Years | 2,353 (5.0%) | 3,112 (6.3%) |
| 75 to 79 Years | 1,630 (3.5%) | 2,619 (5.3%) |
| 80 to 84 Years | 1,667 (3.5%) | 1,392 (2.8%) |
| 85 Years and over | 1,668 (3.5%) | 1,717 (3.5%) |
| Total | 46,971 (100.0%) | 49,203 (100.0%) |
Families and Households in St George
Median Family Size in St George
The median family size in St George is 3.25 persons per family, with single female/mother families (2,687 | 10.9%) accounting for the largest median family size of 3.38 persons per family. On the other hand, single male/father families (1,276 | 5.2%) represent the smallest median family size with 2.85 persons per family.
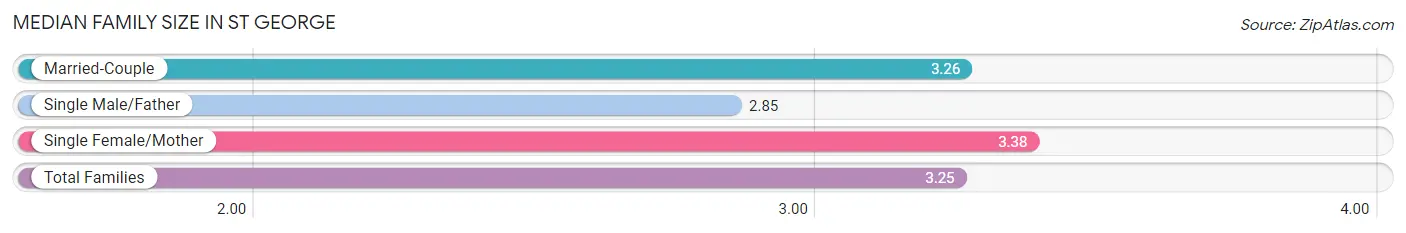
| Family Type | # Families | Family Size |
| Married-Couple | 20,677 (83.9%) | 3.26 |
| Single Male/Father | 1,276 (5.2%) | 2.85 |
| Single Female/Mother | 2,687 (10.9%) | 3.38 |
| Total Families | 24,640 (100.0%) | 3.25 |
Median Household Size in St George
The median household size in St George is 2.80 persons per household, with single female/mother households (2,687 | 7.9%) accounting for the largest median household size of 3.69 persons per household. non-family households (9,219 | 27.2%) represent the smallest median household size with 1.39 persons per household.
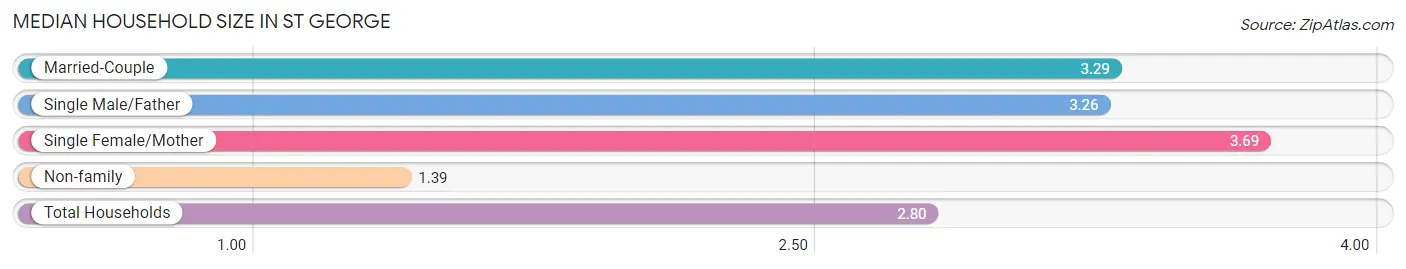
| Household Type | # Households | Household Size |
| Married-Couple | 20,677 (61.1%) | 3.29 |
| Single Male/Father | 1,276 (3.8%) | 3.26 |
| Single Female/Mother | 2,687 (7.9%) | 3.69 |
| Non-family | 9,219 (27.2%) | 1.39 |
| Total Households | 33,859 (100.0%) | 2.80 |
Household Size by Marriage Status in St George
Out of a total of 33,859 households in St George, 24,640 (72.8%) are family households, while 9,219 (27.2%) are nonfamily households. The most numerous type of family households are 2-person households, comprising 12,063, and the most common type of nonfamily households are 1-person households, comprising 7,321.
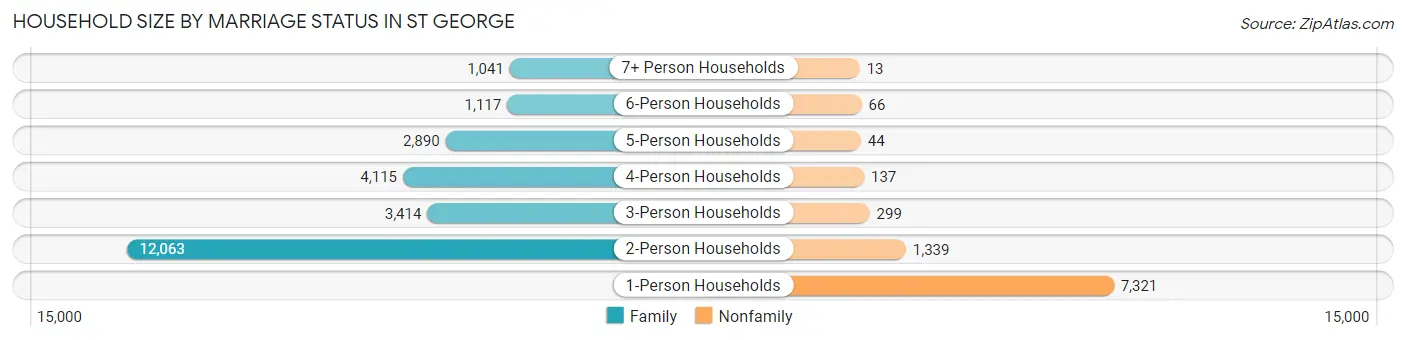
| Household Size | Family Households | Nonfamily Households |
| 1-Person Households | - | 7,321 (21.6%) |
| 2-Person Households | 12,063 (35.6%) | 1,339 (4.0%) |
| 3-Person Households | 3,414 (10.1%) | 299 (0.9%) |
| 4-Person Households | 4,115 (12.1%) | 137 (0.4%) |
| 5-Person Households | 2,890 (8.5%) | 44 (0.1%) |
| 6-Person Households | 1,117 (3.3%) | 66 (0.2%) |
| 7+ Person Households | 1,041 (3.1%) | 13 (0.0%) |
| Total | 24,640 (72.8%) | 9,219 (27.2%) |
Female Fertility in St George
Fertility by Age in St George
Average fertility rate in St George is 55.0 births per 1,000 women. Women in the age bracket of 20 to 34 years have the highest fertility rate with 117.0 births per 1,000 women. Women in the age bracket of 20 to 34 years acount for 88.5% of all women with births.
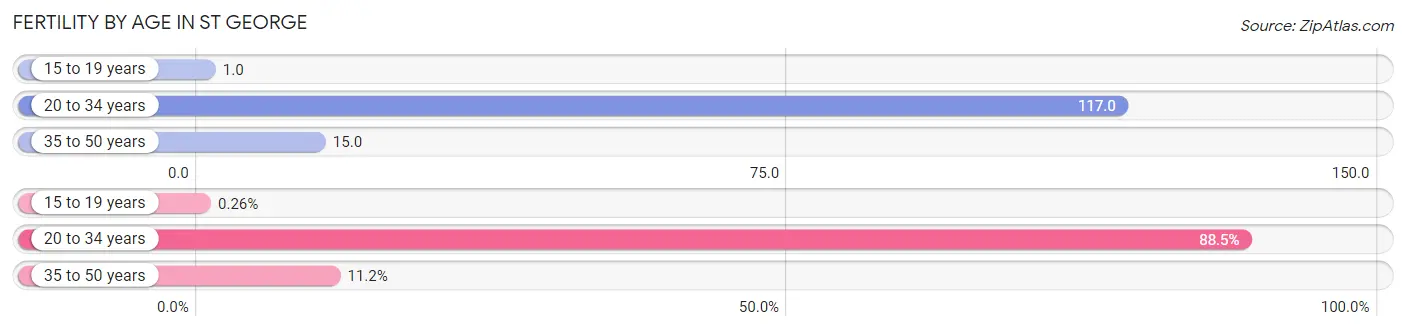
| Age Bracket | Women with Births | Births / 1,000 Women |
| 15 to 19 years | 3 (0.3%) | 1.0 |
| 20 to 34 years | 1,031 (88.5%) | 117.0 |
| 35 to 50 years | 131 (11.2%) | 15.0 |
| Total | 1,165 (100.0%) | 55.0 |
Fertility by Age by Marriage Status in St George
84.8% of women with births (1,165) in St George are married. The highest percentage of unmarried women with births falls into 15 to 19 years age bracket with 100.0% of them unmarried at the time of birth, while the lowest percentage of unmarried women with births belong to 35 to 50 years age bracket with 0.0% of them unmarried.
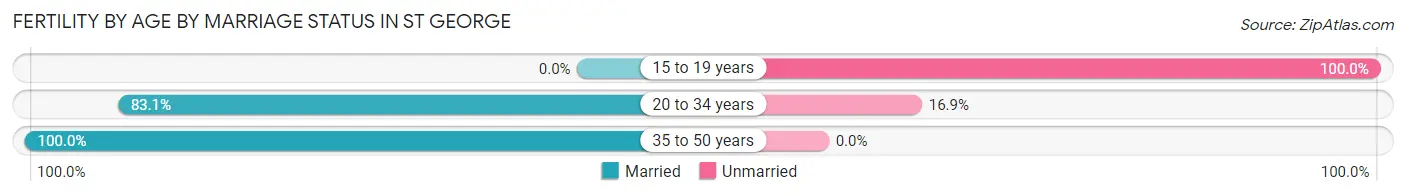
| Age Bracket | Married | Unmarried |
| 15 to 19 years | 0 (0.0%) | 3 (100.0%) |
| 20 to 34 years | 857 (83.1%) | 174 (16.9%) |
| 35 to 50 years | 131 (100.0%) | 0 (0.0%) |
| Total | 988 (84.8%) | 177 (15.2%) |
Fertility by Education in St George
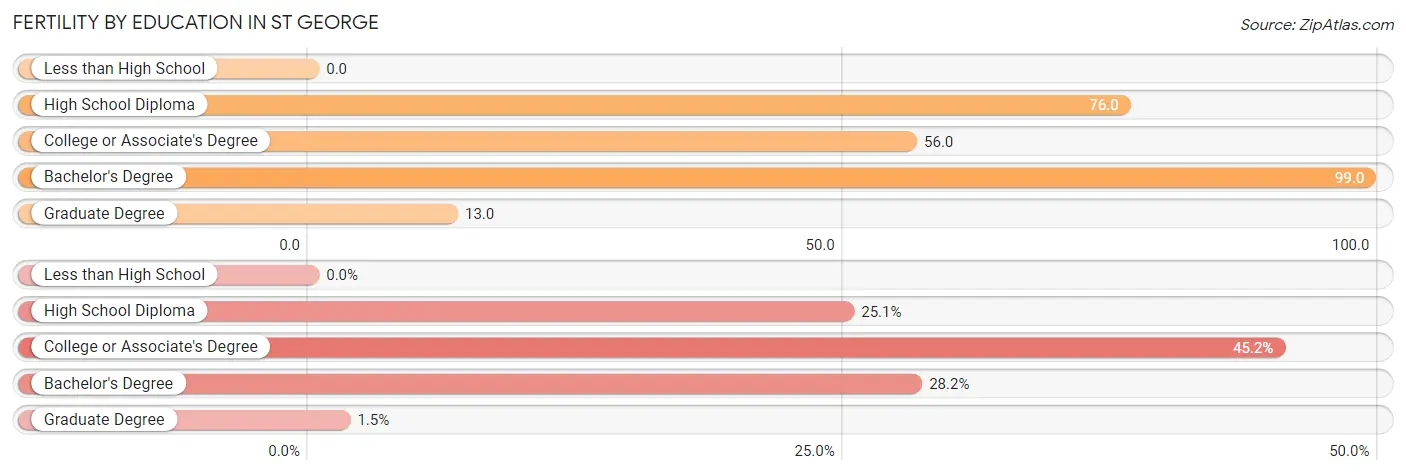
| Educational Attainment | Women with Births | Births / 1,000 Women |
| Less than High School | 0 (0.0%) | 0.0 |
| High School Diploma | 292 (25.1%) | 76.0 |
| College or Associate's Degree | 527 (45.2%) | 56.0 |
| Bachelor's Degree | 329 (28.2%) | 99.0 |
| Graduate Degree | 17 (1.5%) | 13.0 |
| Total | 1,165 (100.0%) | 55.0 |
Fertility by Education by Marriage Status in St George
15.2% of women with births in St George are unmarried. Women with the educational attainment of graduate degree are most likely to be married with 100.0% of them married at childbirth, while women with the educational attainment of high school diploma are least likely to be married with 29.4% of them unmarried at childbirth.
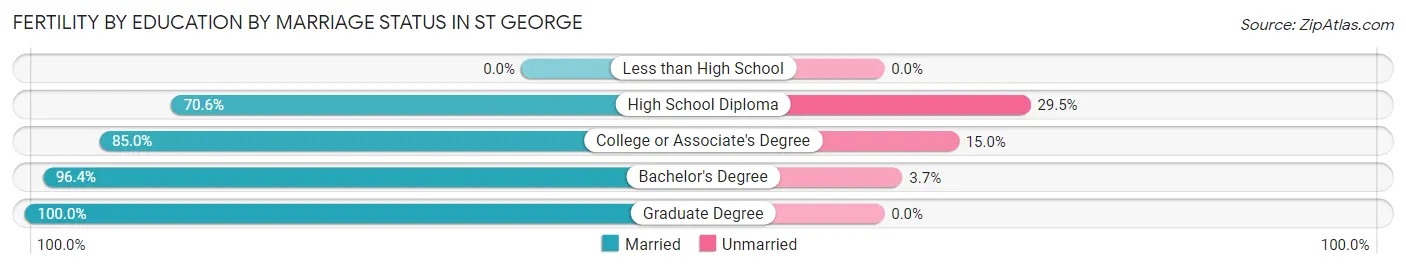
| Educational Attainment | Married | Unmarried |
| Less than High School | 0 (0.0%) | 0 (0.0%) |
| High School Diploma | 206 (70.6%) | 86 (29.4%) |
| College or Associate's Degree | 448 (85.0%) | 79 (15.0%) |
| Bachelor's Degree | 317 (96.4%) | 12 (3.6%) |
| Graduate Degree | 17 (100.0%) | 0 (0.0%) |
| Total | 988 (84.8%) | 177 (15.2%) |
Employment Characteristics in St George
Employment by Class of Employer in St George
Among the 40,054 employed individuals in St George, private company employees (28,000 | 69.9%), self-employed (incorporated) (3,046 | 7.6%), and not-for-profit organizations (2,451 | 6.1%) make up the most common classes of employment.
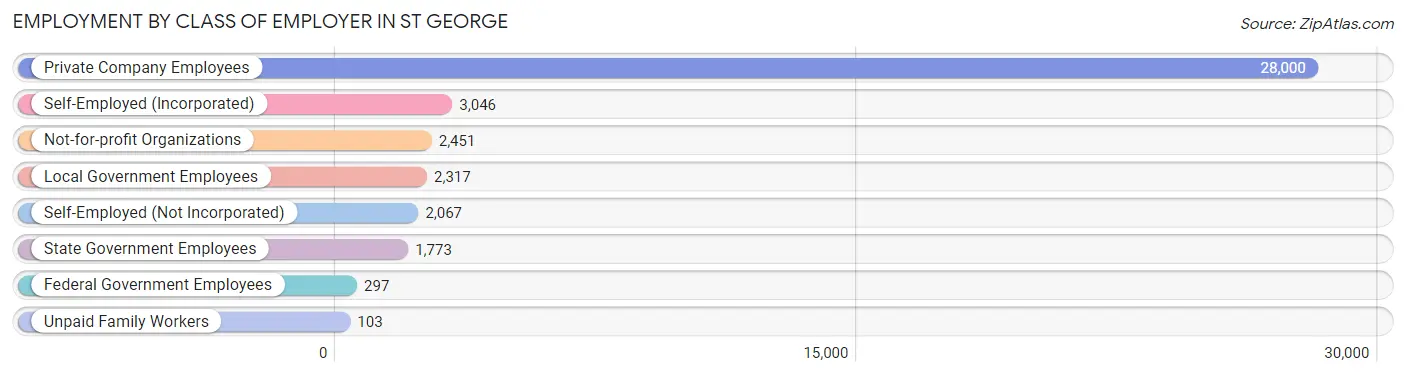
| Employer Class | # Employees | % Employees |
| Private Company Employees | 28,000 | 69.9% |
| Self-Employed (Incorporated) | 3,046 | 7.6% |
| Self-Employed (Not Incorporated) | 2,067 | 5.2% |
| Not-for-profit Organizations | 2,451 | 6.1% |
| Local Government Employees | 2,317 | 5.8% |
| State Government Employees | 1,773 | 4.4% |
| Federal Government Employees | 297 | 0.7% |
| Unpaid Family Workers | 103 | 0.3% |
| Total | 40,054 | 100.0% |
Employment Status by Age in St George
According to the labor force statistics for St George, out of the total population over 16 years of age (74,522), 56.3% or 41,956 individuals are in the labor force, with 3.3% or 1,385 of them unemployed. The age group with the highest labor force participation rate is 20 to 24 years, with 82.5% or 5,991 individuals in the labor force. Within the labor force, the 16 to 19 years age range has the highest percentage of unemployed individuals, with 11.0% or 340 of them being unemployed.
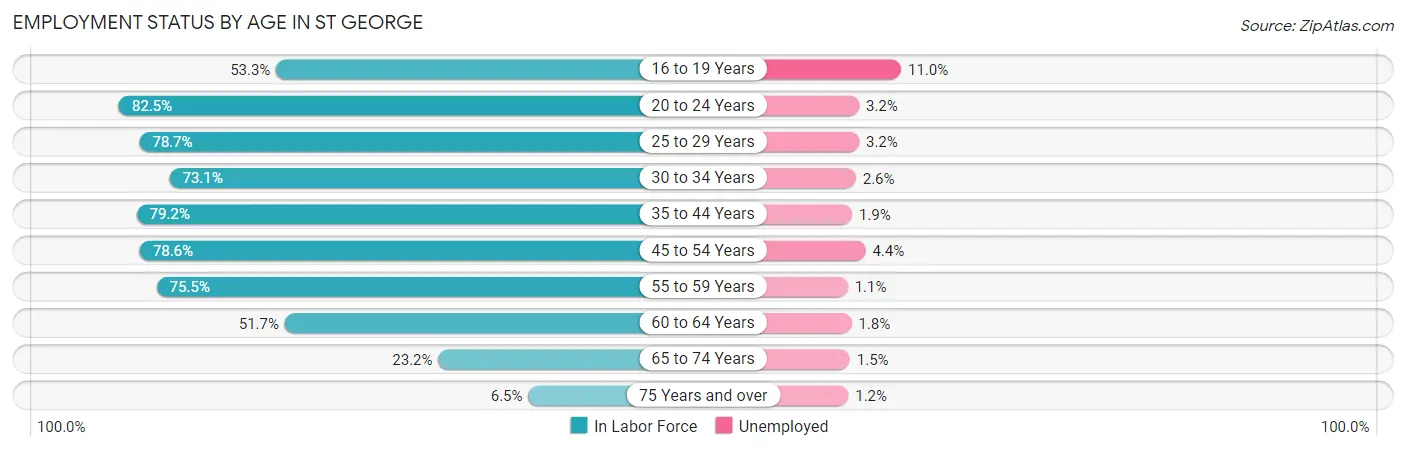
| Age Bracket | In Labor Force | Unemployed |
| 16 to 19 Years | 3,089 (53.3%) | 340 (11.0%) |
| 20 to 24 Years | 5,991 (82.5%) | 192 (3.2%) |
| 25 to 29 Years | 5,044 (78.7%) | 161 (3.2%) |
| 30 to 34 Years | 3,387 (73.1%) | 88 (2.6%) |
| 35 to 44 Years | 8,532 (79.2%) | 162 (1.9%) |
| 45 to 54 Years | 7,098 (78.6%) | 312 (4.4%) |
| 55 to 59 Years | 3,125 (75.5%) | 34 (1.1%) |
| 60 to 64 Years | 2,449 (51.7%) | 44 (1.8%) |
| 65 to 74 Years | 2,564 (23.2%) | 38 (1.5%) |
| 75 Years and over | 695 (6.5%) | 8 (1.2%) |
| Total | 41,956 (56.3%) | 1,385 (3.3%) |
Employment Status by Educational Attainment in St George
According to labor force statistics for St George, 74.6% of individuals (29,632) out of the total population between 25 and 64 years of age (39,721) are in the labor force, with 2.7% or 800 of them being unemployed. The group with the highest labor force participation rate are those with the educational attainment of bachelor's degree or higher, with 79.7% or 9,558 individuals in the labor force. Within the labor force, individuals with high school diploma education have the highest percentage of unemployment, with 6.3% or 380 of them being unemployed.
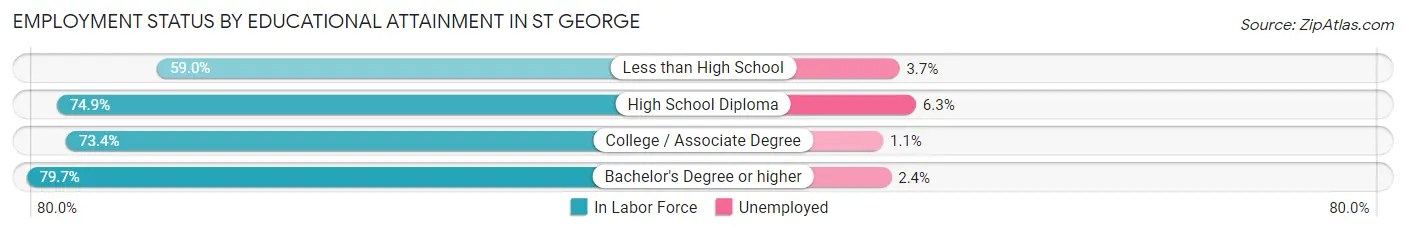
| Educational Attainment | In Labor Force | Unemployed |
| Less than High School | 1,576 (59.0%) | 99 (3.7%) |
| High School Diploma | 6,038 (74.9%) | 508 (6.3%) |
| College / Associate Degree | 12,474 (73.4%) | 187 (1.1%) |
| Bachelor's Degree or higher | 9,558 (79.7%) | 288 (2.4%) |
| Total | 29,632 (74.6%) | 1,072 (2.7%) |
Employment Occupations by Sex in St George
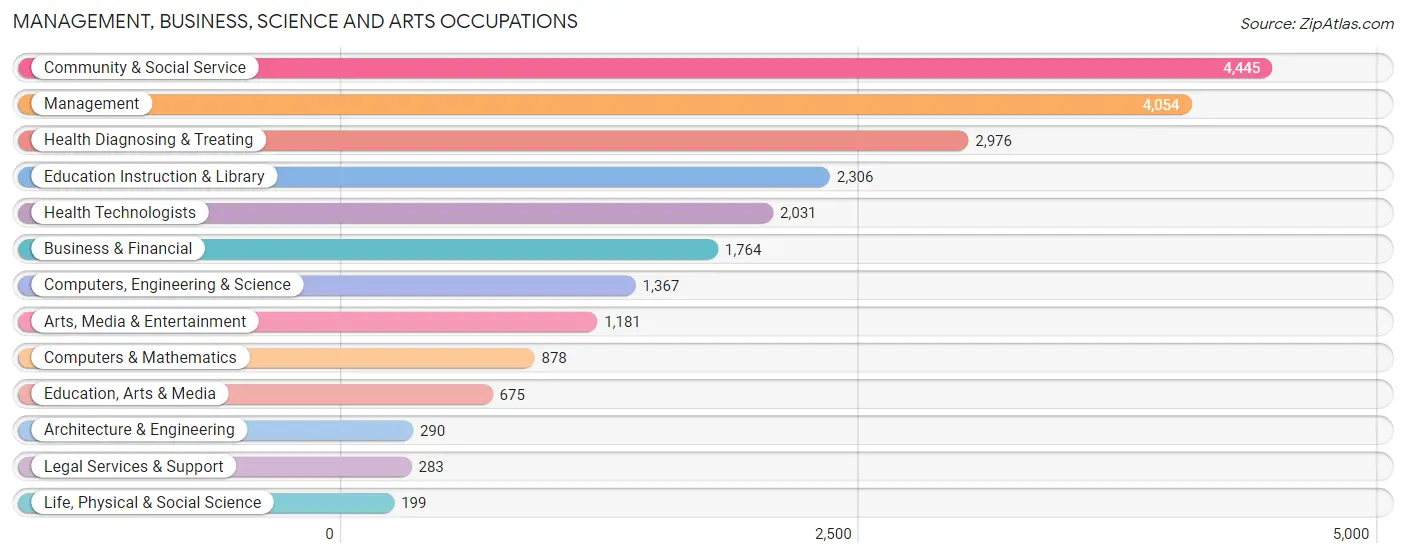
Management, Business, Science and Arts Occupations
The most common Management, Business, Science and Arts occupations in St George are Community & Social Service (4,445 | 11.0%), Management (4,054 | 10.0%), Health Diagnosing & Treating (2,976 | 7.3%), Education Instruction & Library (2,306 | 5.7%), and Health Technologists (2,031 | 5.0%).
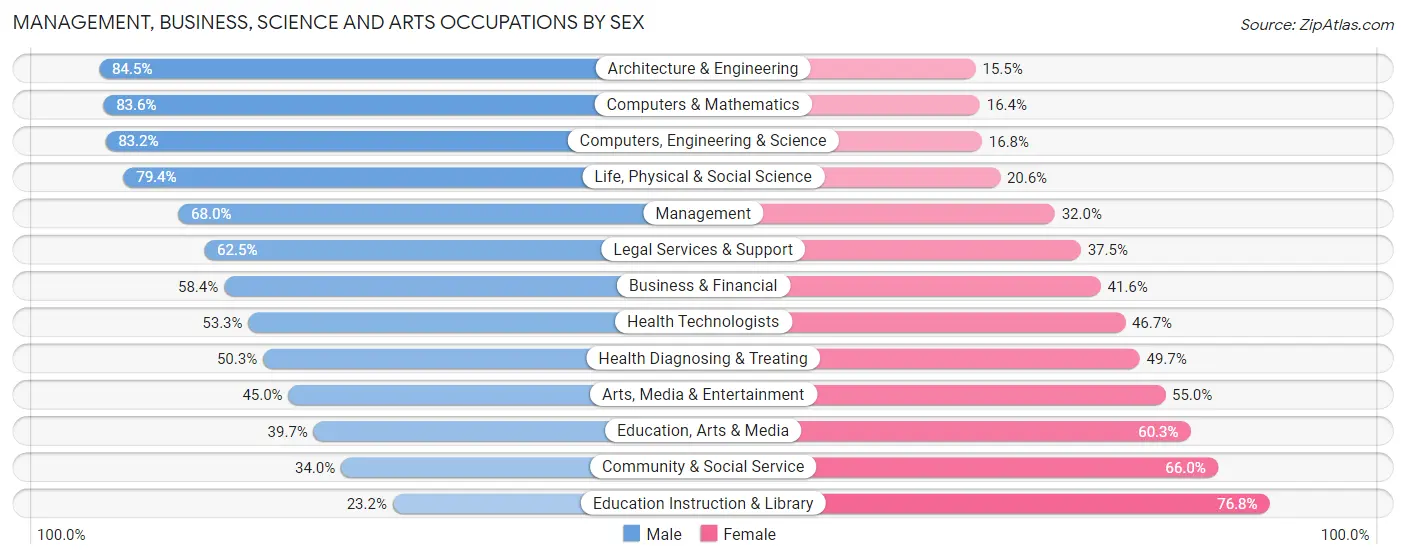
Management, Business, Science and Arts Occupations by Sex
Within the Management, Business, Science and Arts occupations in St George, the most male-oriented occupations are Architecture & Engineering (84.5%), Computers & Mathematics (83.6%), and Computers, Engineering & Science (83.2%), while the most female-oriented occupations are Education Instruction & Library (76.8%), Community & Social Service (66.0%), and Education, Arts & Media (60.3%).
| Occupation | Male | Female |
| Management | 2,755 (68.0%) | 1,299 (32.0%) |
| Business & Financial | 1,030 (58.4%) | 734 (41.6%) |
| Computers, Engineering & Science | 1,137 (83.2%) | 230 (16.8%) |
| Computers & Mathematics | 734 (83.6%) | 144 (16.4%) |
| Architecture & Engineering | 245 (84.5%) | 45 (15.5%) |
| Life, Physical & Social Science | 158 (79.4%) | 41 (20.6%) |
| Community & Social Service | 1,511 (34.0%) | 2,934 (66.0%) |
| Education, Arts & Media | 268 (39.7%) | 407 (60.3%) |
| Legal Services & Support | 177 (62.5%) | 106 (37.5%) |
| Education Instruction & Library | 535 (23.2%) | 1,771 (76.8%) |
| Arts, Media & Entertainment | 531 (45.0%) | 650 (55.0%) |
| Health Diagnosing & Treating | 1,496 (50.3%) | 1,480 (49.7%) |
| Health Technologists | 1,083 (53.3%) | 948 (46.7%) |
| Total (Category) | 7,929 (54.3%) | 6,677 (45.7%) |
| Total (Overall) | 22,312 (55.0%) | 18,270 (45.0%) |
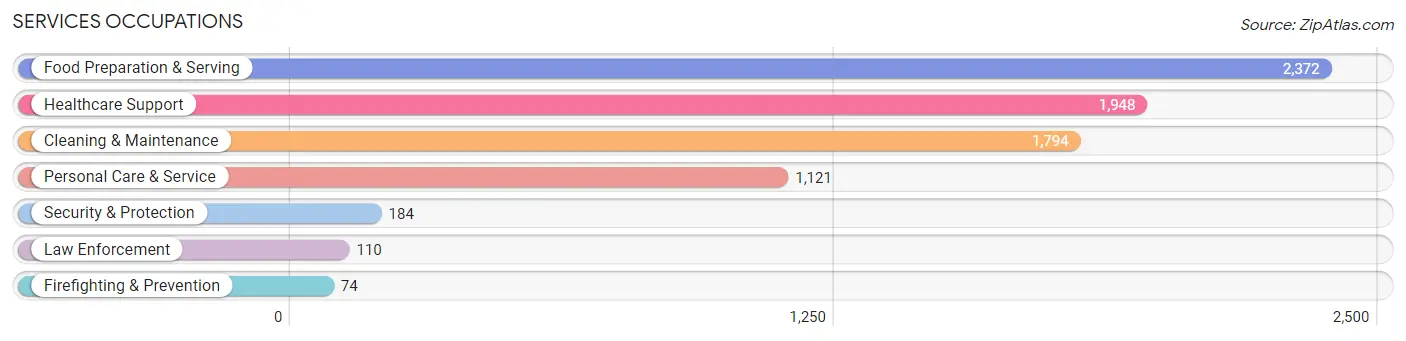
Services Occupations
The most common Services occupations in St George are Food Preparation & Serving (2,372 | 5.8%), Healthcare Support (1,948 | 4.8%), Cleaning & Maintenance (1,794 | 4.4%), Personal Care & Service (1,121 | 2.8%), and Security & Protection (184 | 0.4%).
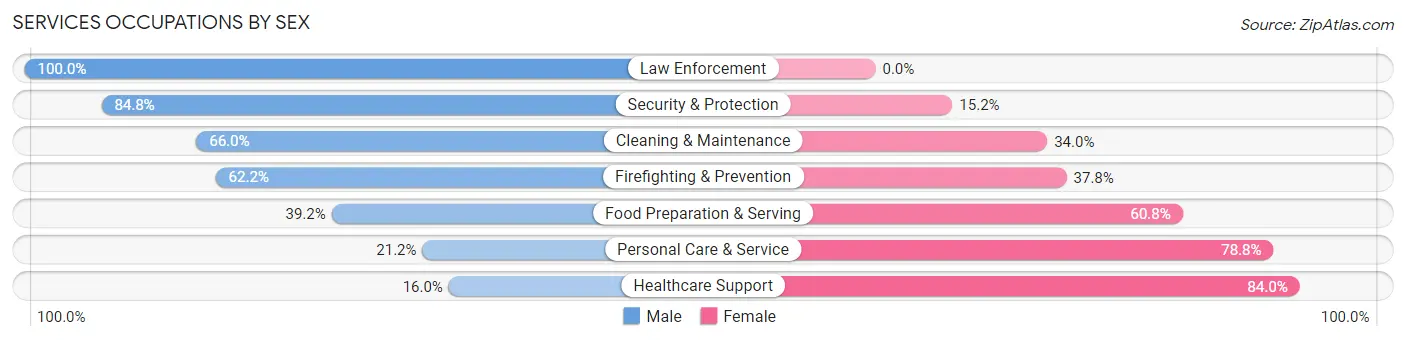
Services Occupations by Sex
Within the Services occupations in St George, the most male-oriented occupations are Law Enforcement (100.0%), Security & Protection (84.8%), and Cleaning & Maintenance (66.0%), while the most female-oriented occupations are Healthcare Support (84.0%), Personal Care & Service (78.8%), and Food Preparation & Serving (60.8%).
| Occupation | Male | Female |
| Healthcare Support | 312 (16.0%) | 1,636 (84.0%) |
| Security & Protection | 156 (84.8%) | 28 (15.2%) |
| Firefighting & Prevention | 46 (62.2%) | 28 (37.8%) |
| Law Enforcement | 110 (100.0%) | 0 (0.0%) |
| Food Preparation & Serving | 930 (39.2%) | 1,442 (60.8%) |
| Cleaning & Maintenance | 1,184 (66.0%) | 610 (34.0%) |
| Personal Care & Service | 238 (21.2%) | 883 (78.8%) |
| Total (Category) | 2,820 (38.0%) | 4,599 (62.0%) |
| Total (Overall) | 22,312 (55.0%) | 18,270 (45.0%) |
Sales and Office Occupations
The most common Sales and Office occupations in St George are Office & Administration (5,125 | 12.6%), and Sales & Related (4,671 | 11.5%).

Sales and Office Occupations by Sex

| Occupation | Male | Female |
| Sales & Related | 2,919 (62.5%) | 1,752 (37.5%) |
| Office & Administration | 1,350 (26.3%) | 3,775 (73.7%) |
| Total (Category) | 4,269 (43.6%) | 5,527 (56.4%) |
| Total (Overall) | 22,312 (55.0%) | 18,270 (45.0%) |
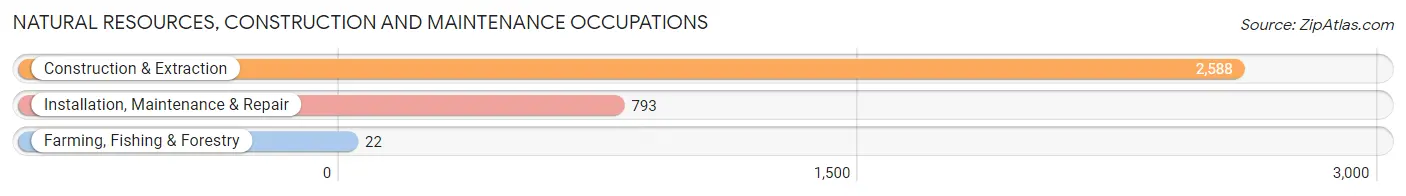
Natural Resources, Construction and Maintenance Occupations
The most common Natural Resources, Construction and Maintenance occupations in St George are Construction & Extraction (2,588 | 6.4%), Installation, Maintenance & Repair (793 | 1.9%), and Farming, Fishing & Forestry (22 | 0.1%).
Natural Resources, Construction and Maintenance Occupations by Sex
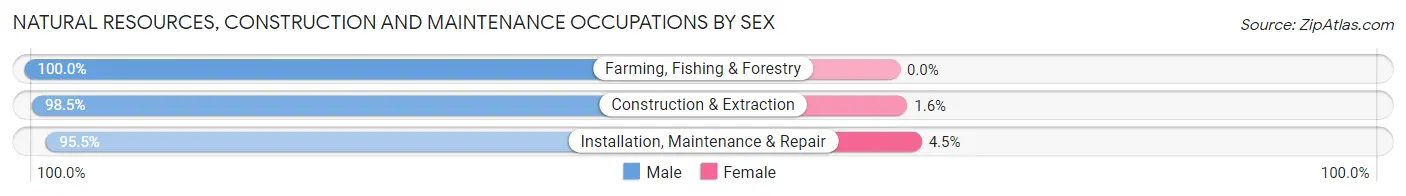
| Occupation | Male | Female |
| Farming, Fishing & Forestry | 22 (100.0%) | 0 (0.0%) |
| Construction & Extraction | 2,548 (98.5%) | 40 (1.5%) |
| Installation, Maintenance & Repair | 757 (95.5%) | 36 (4.5%) |
| Total (Category) | 3,327 (97.8%) | 76 (2.2%) |
| Total (Overall) | 22,312 (55.0%) | 18,270 (45.0%) |
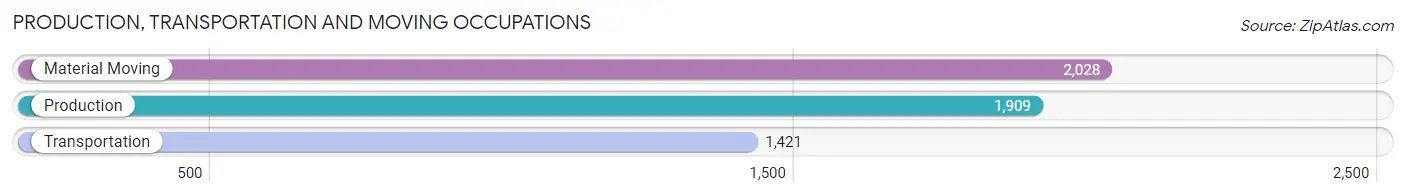
Production, Transportation and Moving Occupations
The most common Production, Transportation and Moving occupations in St George are Material Moving (2,028 | 5.0%), Production (1,909 | 4.7%), and Transportation (1,421 | 3.5%).
Production, Transportation and Moving Occupations by Sex
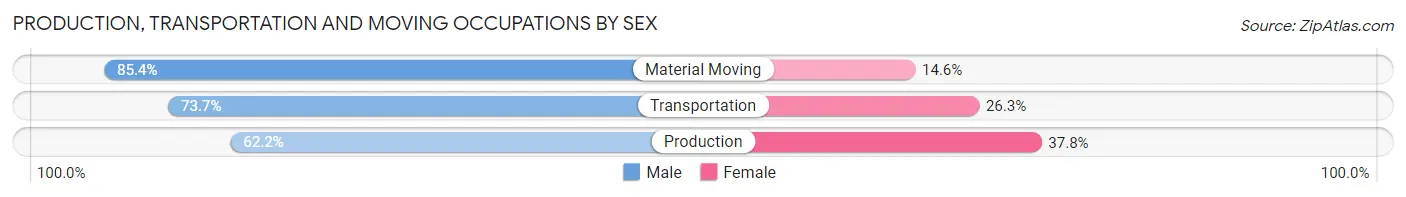
| Occupation | Male | Female |
| Production | 1,188 (62.2%) | 721 (37.8%) |
| Transportation | 1,047 (73.7%) | 374 (26.3%) |
| Material Moving | 1,732 (85.4%) | 296 (14.6%) |
| Total (Category) | 3,967 (74.0%) | 1,391 (26.0%) |
| Total (Overall) | 22,312 (55.0%) | 18,270 (45.0%) |
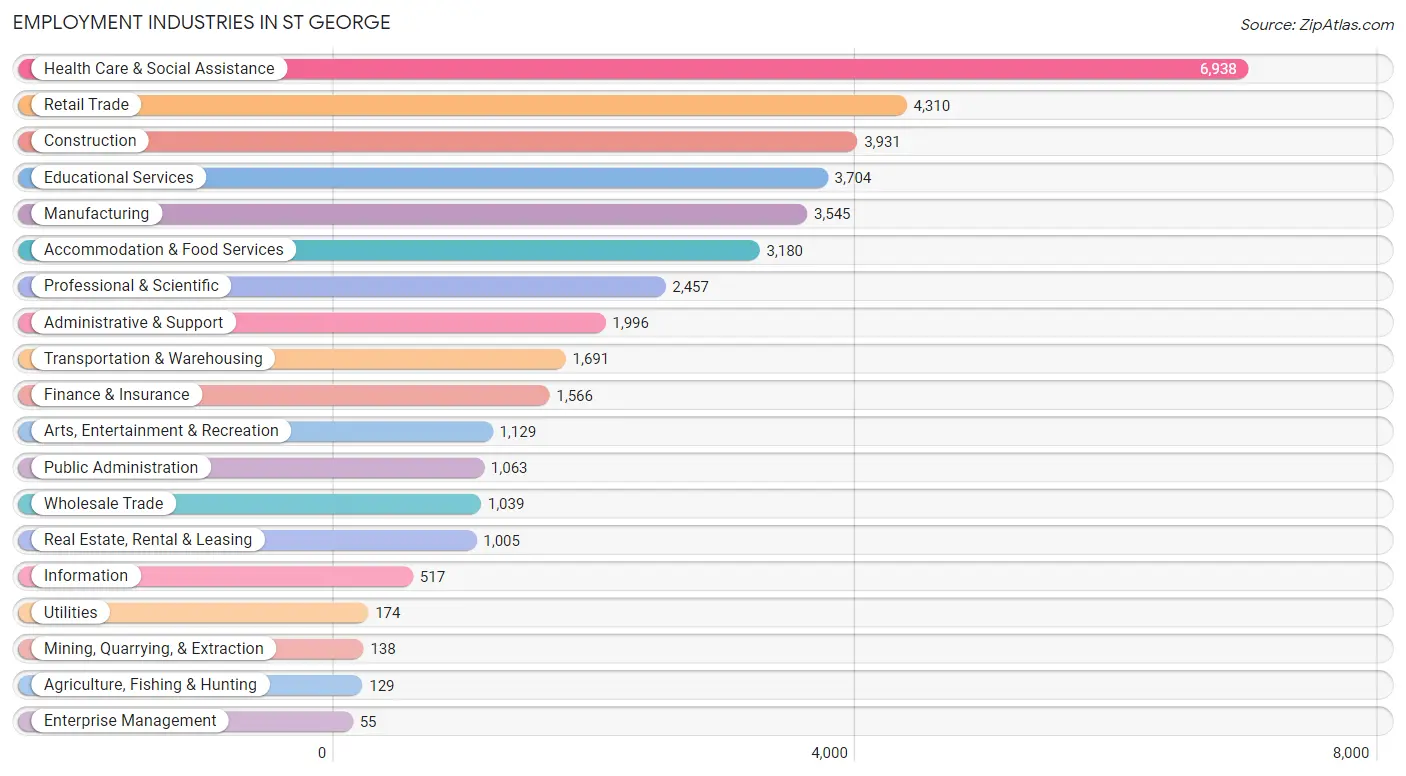
Employment Industries by Sex in St George
Employment Industries in St George
The major employment industries in St George include Health Care & Social Assistance (6,938 | 17.1%), Retail Trade (4,310 | 10.6%), Construction (3,931 | 9.7%), Educational Services (3,704 | 9.1%), and Manufacturing (3,545 | 8.7%).
Employment Industries by Sex in St George
The St George industries that see more men than women are Agriculture, Fishing & Hunting (100.0%), Construction (93.6%), and Mining, Quarrying, & Extraction (89.9%), whereas the industries that tend to have a higher number of women are Educational Services (68.7%), Health Care & Social Assistance (64.7%), and Accommodation & Food Services (63.2%).
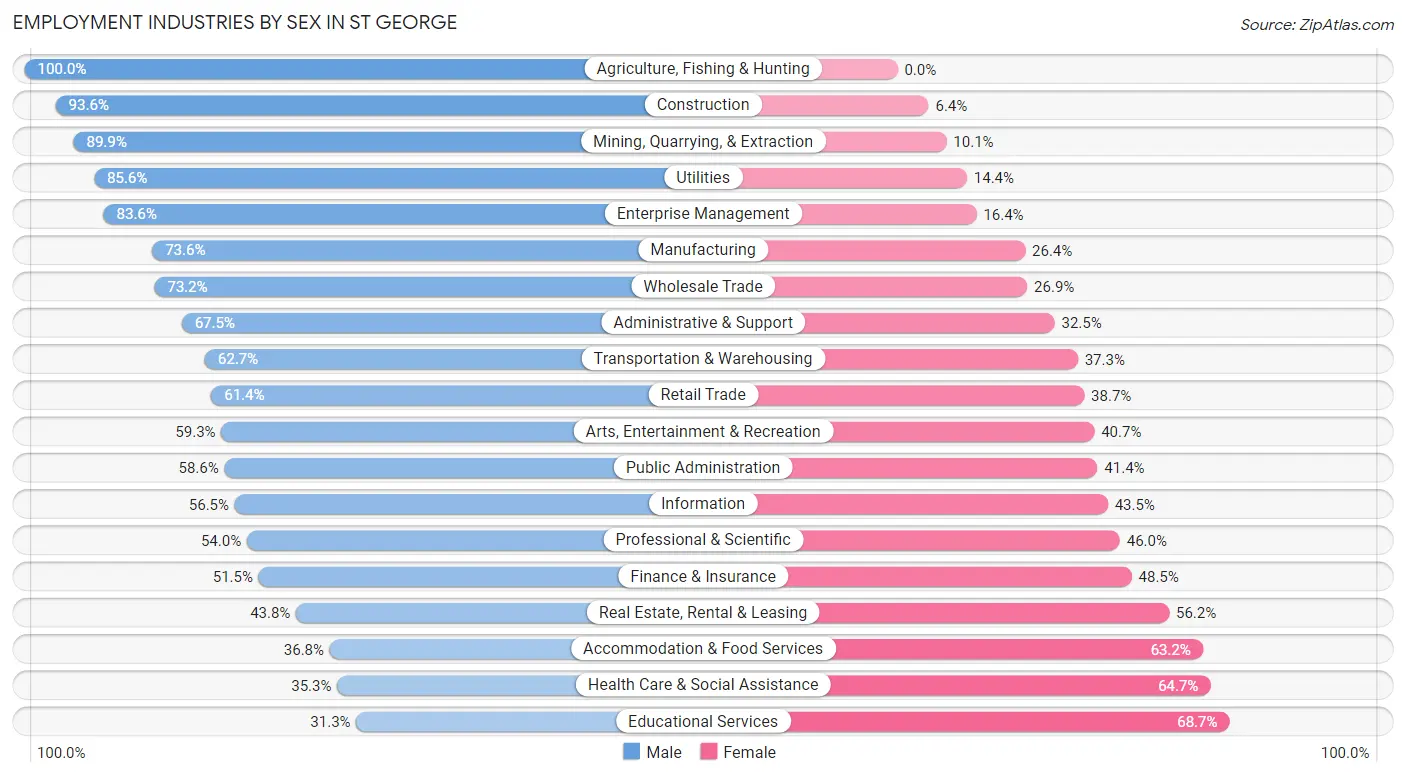
| Industry | Male | Female |
| Agriculture, Fishing & Hunting | 129 (100.0%) | 0 (0.0%) |
| Mining, Quarrying, & Extraction | 124 (89.9%) | 14 (10.1%) |
| Construction | 3,678 (93.6%) | 253 (6.4%) |
| Manufacturing | 2,608 (73.6%) | 937 (26.4%) |
| Wholesale Trade | 760 (73.2%) | 279 (26.9%) |
| Retail Trade | 2,644 (61.4%) | 1,666 (38.7%) |
| Transportation & Warehousing | 1,060 (62.7%) | 631 (37.3%) |
| Utilities | 149 (85.6%) | 25 (14.4%) |
| Information | 292 (56.5%) | 225 (43.5%) |
| Finance & Insurance | 807 (51.5%) | 759 (48.5%) |
| Real Estate, Rental & Leasing | 440 (43.8%) | 565 (56.2%) |
| Professional & Scientific | 1,326 (54.0%) | 1,131 (46.0%) |
| Enterprise Management | 46 (83.6%) | 9 (16.4%) |
| Administrative & Support | 1,347 (67.5%) | 649 (32.5%) |
| Educational Services | 1,160 (31.3%) | 2,544 (68.7%) |
| Health Care & Social Assistance | 2,447 (35.3%) | 4,491 (64.7%) |
| Arts, Entertainment & Recreation | 669 (59.3%) | 460 (40.7%) |
| Accommodation & Food Services | 1,171 (36.8%) | 2,009 (63.2%) |
| Public Administration | 623 (58.6%) | 440 (41.4%) |
| Total | 22,312 (55.0%) | 18,270 (45.0%) |
Education in St George
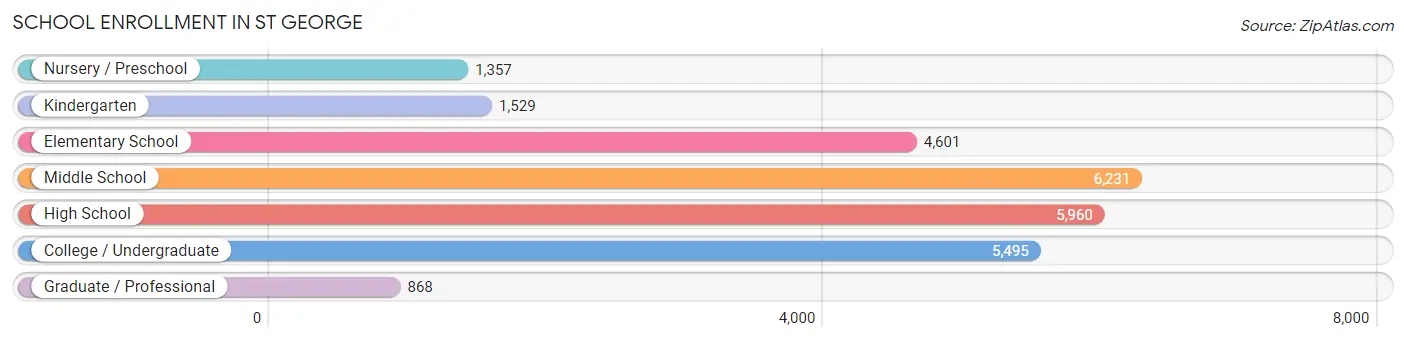
School Enrollment in St George
The most common levels of schooling among the 26,041 students in St George are middle school (6,231 | 23.9%), high school (5,960 | 22.9%), and college / undergraduate (5,495 | 21.1%).
| School Level | # Students | % Students |
| Nursery / Preschool | 1,357 | 5.2% |
| Kindergarten | 1,529 | 5.9% |
| Elementary School | 4,601 | 17.7% |
| Middle School | 6,231 | 23.9% |
| High School | 5,960 | 22.9% |
| College / Undergraduate | 5,495 | 21.1% |
| Graduate / Professional | 868 | 3.3% |
| Total | 26,041 | 100.0% |
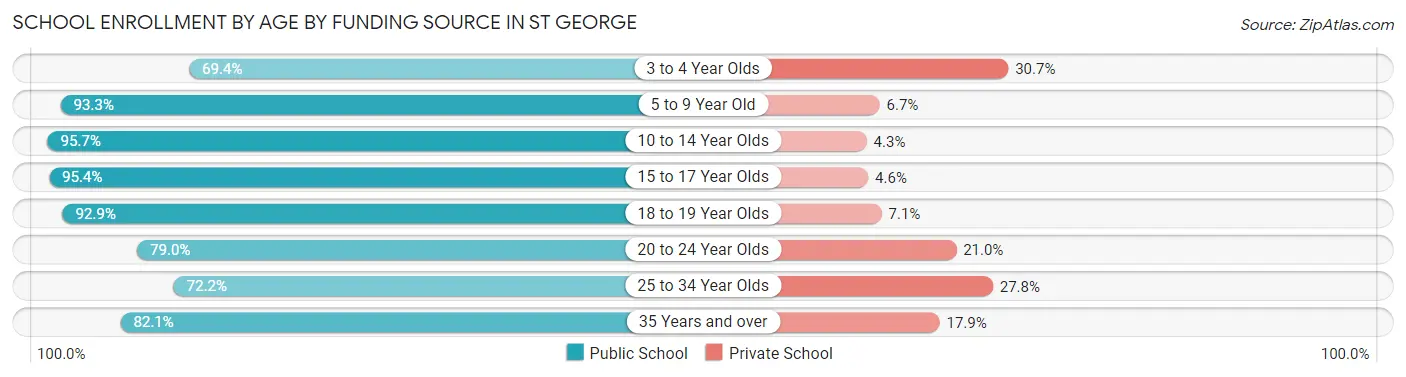
School Enrollment by Age by Funding Source in St George
Out of a total of 26,041 students who are enrolled in schools in St George, 2,500 (9.6%) attend a private institution, while the remaining 23,541 (90.4%) are enrolled in public schools. The age group of 3 to 4 year olds has the highest likelihood of being enrolled in private schools, with 312 (30.6% in the age bracket) enrolled. Conversely, the age group of 10 to 14 year olds has the lowest likelihood of being enrolled in a private school, with 7,068 (95.7% in the age bracket) attending a public institution.
| Age Bracket | Public School | Private School |
| 3 to 4 Year Olds | 706 (69.4%) | 312 (30.6%) |
| 5 to 9 Year Old | 5,728 (93.3%) | 411 (6.7%) |
| 10 to 14 Year Olds | 7,068 (95.7%) | 316 (4.3%) |
| 15 to 17 Year Olds | 3,956 (95.4%) | 189 (4.6%) |
| 18 to 19 Year Olds | 2,000 (92.9%) | 152 (7.1%) |
| 20 to 24 Year Olds | 1,837 (79.0%) | 487 (21.0%) |
| 25 to 34 Year Olds | 939 (72.2%) | 361 (27.8%) |
| 35 Years and over | 1,297 (82.1%) | 282 (17.9%) |
| Total | 23,541 (90.4%) | 2,500 (9.6%) |
Educational Attainment by Field of Study in St George
Business (4,259 | 19.8%), education (3,693 | 17.2%), science & technology (2,538 | 11.8%), social sciences (1,677 | 7.8%), and arts & humanities (1,414 | 6.6%) are the most common fields of study among 21,535 individuals in St George who have obtained a bachelor's degree or higher.
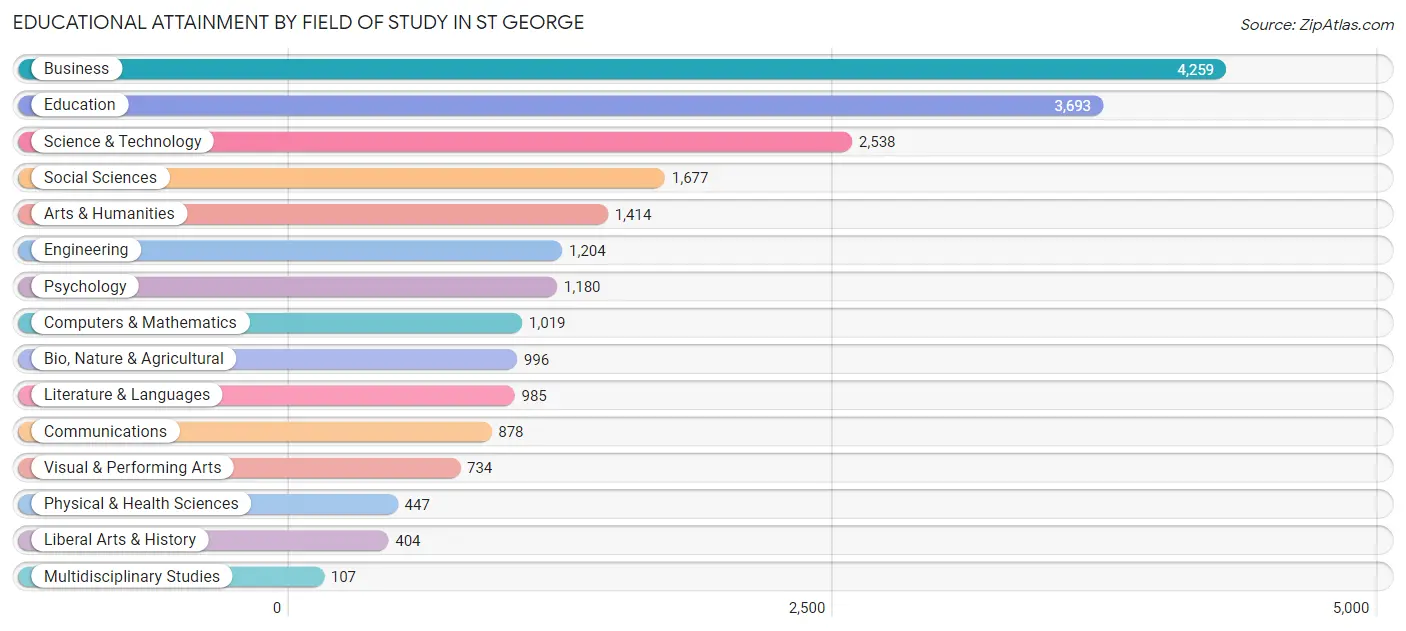
| Field of Study | # Graduates | % Graduates |
| Computers & Mathematics | 1,019 | 4.7% |
| Bio, Nature & Agricultural | 996 | 4.6% |
| Physical & Health Sciences | 447 | 2.1% |
| Psychology | 1,180 | 5.5% |
| Social Sciences | 1,677 | 7.8% |
| Engineering | 1,204 | 5.6% |
| Multidisciplinary Studies | 107 | 0.5% |
| Science & Technology | 2,538 | 11.8% |
| Business | 4,259 | 19.8% |
| Education | 3,693 | 17.2% |
| Literature & Languages | 985 | 4.6% |
| Liberal Arts & History | 404 | 1.9% |
| Visual & Performing Arts | 734 | 3.4% |
| Communications | 878 | 4.1% |
| Arts & Humanities | 1,414 | 6.6% |
| Total | 21,535 | 100.0% |
Transportation & Commute in St George
Vehicle Availability by Sex in St George
The most prevalent vehicle ownership categories in St George are males with 2 vehicles (8,970, accounting for 40.8%) and females with 2 vehicles (7,831, making up 50.2%).
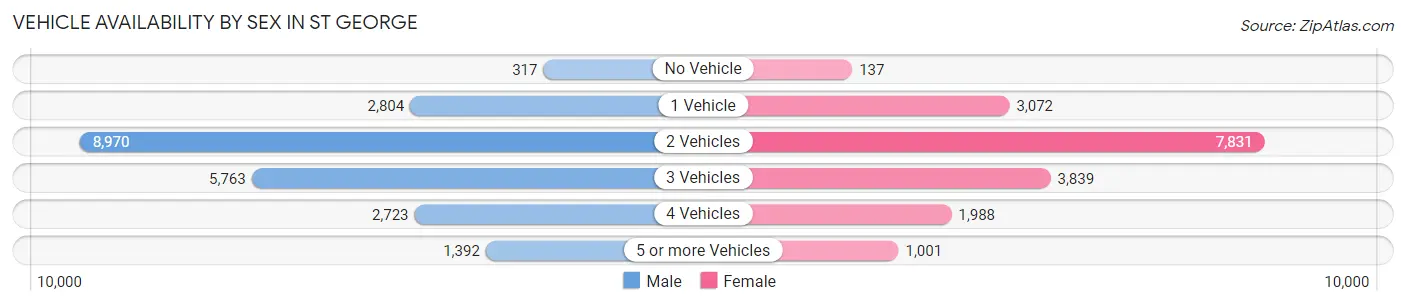
| Vehicles Available | Male | Female |
| No Vehicle | 317 (1.4%) | 137 (0.8%) |
| 1 Vehicle | 2,804 (12.8%) | 3,072 (17.2%) |
| 2 Vehicles | 8,970 (40.8%) | 7,831 (43.8%) |
| 3 Vehicles | 5,763 (26.2%) | 3,839 (21.5%) |
| 4 Vehicles | 2,723 (12.4%) | 1,988 (11.1%) |
| 5 or more Vehicles | 1,392 (6.3%) | 1,001 (5.6%) |
| Total | 21,969 (100.0%) | 17,868 (100.0%) |
Commute Time in St George
The most frequently occuring commute durations in St George are 10 to 14 minutes (9,607 commuters, 27.8%), 15 to 19 minutes (8,752 commuters, 25.3%), and 5 to 9 minutes (6,107 commuters, 17.7%).
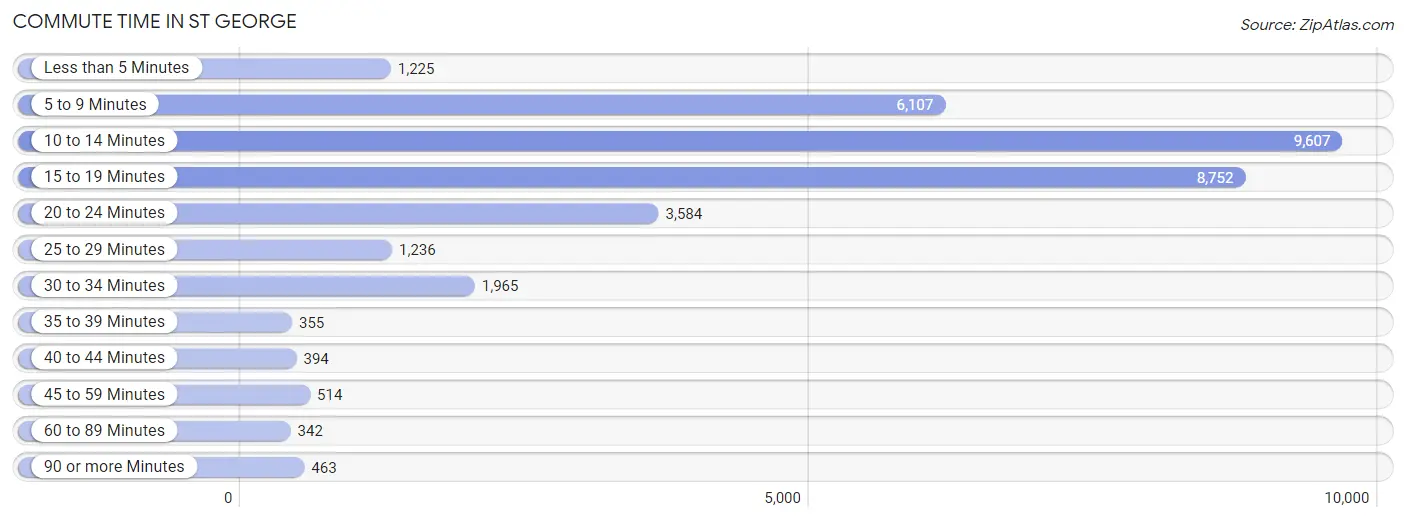
| Commute Time | # Commuters | % Commuters |
| Less than 5 Minutes | 1,225 | 3.5% |
| 5 to 9 Minutes | 6,107 | 17.7% |
| 10 to 14 Minutes | 9,607 | 27.8% |
| 15 to 19 Minutes | 8,752 | 25.3% |
| 20 to 24 Minutes | 3,584 | 10.4% |
| 25 to 29 Minutes | 1,236 | 3.6% |
| 30 to 34 Minutes | 1,965 | 5.7% |
| 35 to 39 Minutes | 355 | 1.0% |
| 40 to 44 Minutes | 394 | 1.1% |
| 45 to 59 Minutes | 514 | 1.5% |
| 60 to 89 Minutes | 342 | 1.0% |
| 90 or more Minutes | 463 | 1.3% |
Commute Time by Sex in St George
The most common commute times in St George are 15 to 19 minutes (5,240 commuters, 26.8%) for males and 10 to 14 minutes (4,767 commuters, 31.8%) for females.
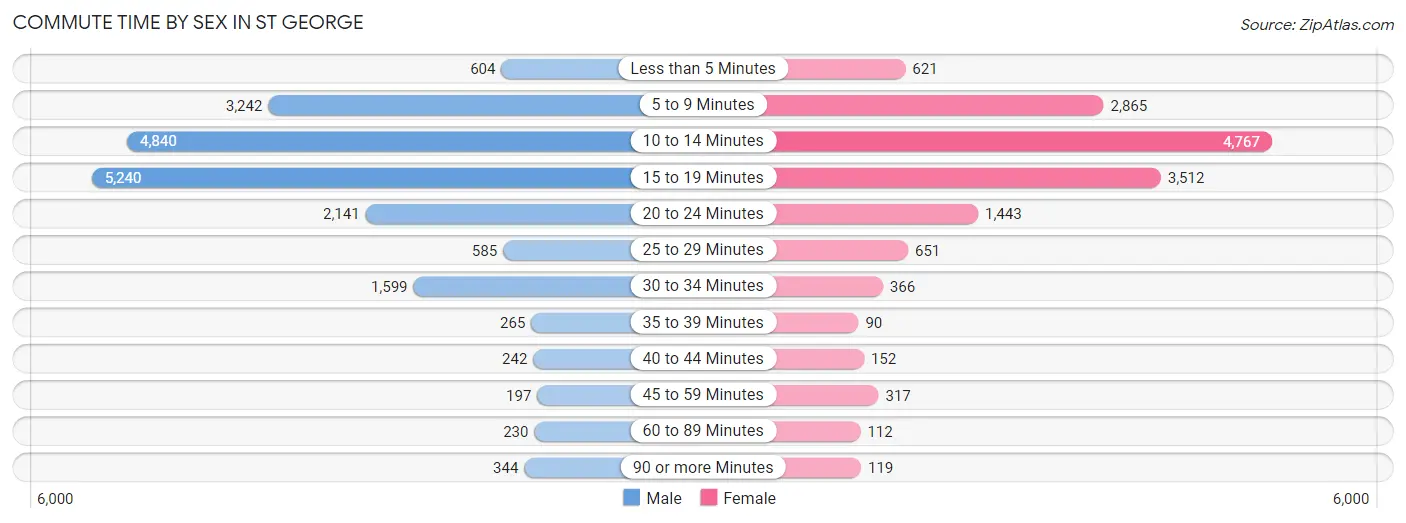
| Commute Time | Male | Female |
| Less than 5 Minutes | 604 (3.1%) | 621 (4.1%) |
| 5 to 9 Minutes | 3,242 (16.6%) | 2,865 (19.1%) |
| 10 to 14 Minutes | 4,840 (24.8%) | 4,767 (31.8%) |
| 15 to 19 Minutes | 5,240 (26.8%) | 3,512 (23.4%) |
| 20 to 24 Minutes | 2,141 (11.0%) | 1,443 (9.6%) |
| 25 to 29 Minutes | 585 (3.0%) | 651 (4.3%) |
| 30 to 34 Minutes | 1,599 (8.2%) | 366 (2.4%) |
| 35 to 39 Minutes | 265 (1.4%) | 90 (0.6%) |
| 40 to 44 Minutes | 242 (1.2%) | 152 (1.0%) |
| 45 to 59 Minutes | 197 (1.0%) | 317 (2.1%) |
| 60 to 89 Minutes | 230 (1.2%) | 112 (0.7%) |
| 90 or more Minutes | 344 (1.8%) | 119 (0.8%) |
Time of Departure to Work by Sex in St George
The most frequent times of departure to work in St George are 7:00 AM to 7:29 AM (3,196, 16.4%) for males and 8:00 AM to 8:29 AM (2,486, 16.6%) for females.
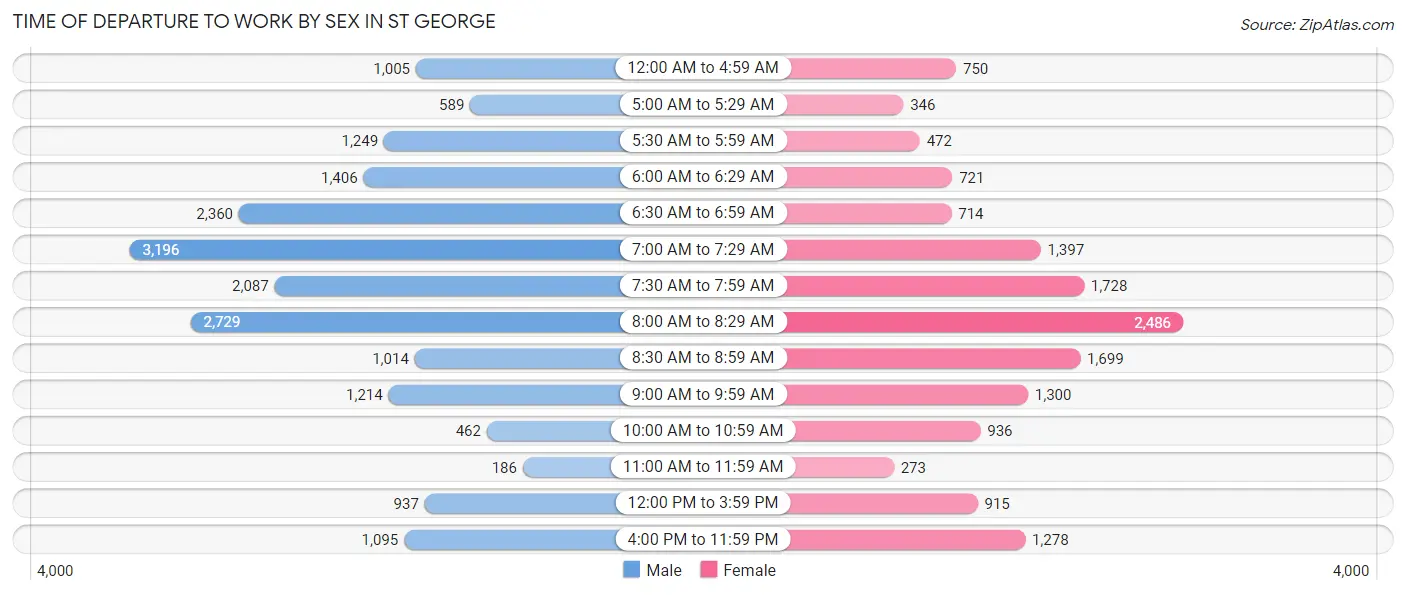
| Time of Departure | Male | Female |
| 12:00 AM to 4:59 AM | 1,005 (5.1%) | 750 (5.0%) |
| 5:00 AM to 5:29 AM | 589 (3.0%) | 346 (2.3%) |
| 5:30 AM to 5:59 AM | 1,249 (6.4%) | 472 (3.1%) |
| 6:00 AM to 6:29 AM | 1,406 (7.2%) | 721 (4.8%) |
| 6:30 AM to 6:59 AM | 2,360 (12.1%) | 714 (4.8%) |
| 7:00 AM to 7:29 AM | 3,196 (16.4%) | 1,397 (9.3%) |
| 7:30 AM to 7:59 AM | 2,087 (10.7%) | 1,728 (11.5%) |
| 8:00 AM to 8:29 AM | 2,729 (14.0%) | 2,486 (16.6%) |
| 8:30 AM to 8:59 AM | 1,014 (5.2%) | 1,699 (11.3%) |
| 9:00 AM to 9:59 AM | 1,214 (6.2%) | 1,300 (8.7%) |
| 10:00 AM to 10:59 AM | 462 (2.4%) | 936 (6.2%) |
| 11:00 AM to 11:59 AM | 186 (0.9%) | 273 (1.8%) |
| 12:00 PM to 3:59 PM | 937 (4.8%) | 915 (6.1%) |
| 4:00 PM to 11:59 PM | 1,095 (5.6%) | 1,278 (8.5%) |
| Total | 19,529 (100.0%) | 15,015 (100.0%) |
Housing Occupancy in St George
Occupancy by Ownership in St George
Of the total 33,859 dwellings in St George, owner-occupied units account for 22,908 (67.7%), while renter-occupied units make up 10,951 (32.3%).
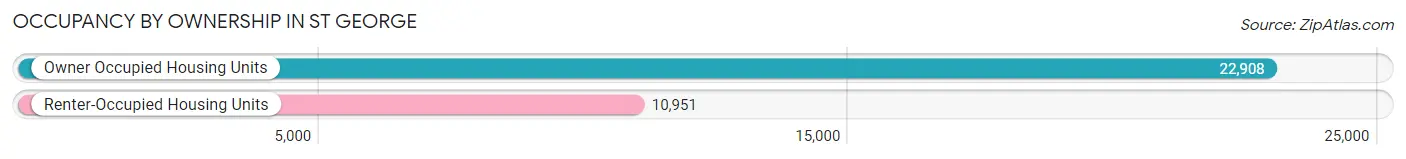
| Occupancy | # Housing Units | % Housing Units |
| Owner Occupied Housing Units | 22,908 | 67.7% |
| Renter-Occupied Housing Units | 10,951 | 32.3% |
| Total Occupied Housing Units | 33,859 | 100.0% |
Occupancy by Household Size in St George
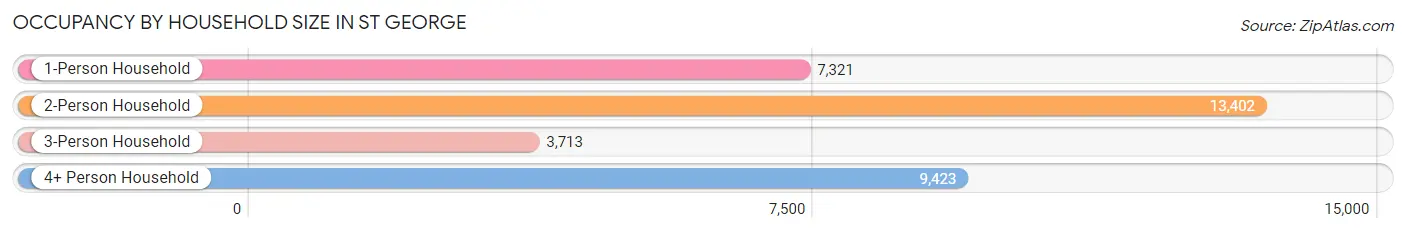
| Household Size | # Housing Units | % Housing Units |
| 1-Person Household | 7,321 | 21.6% |
| 2-Person Household | 13,402 | 39.6% |
| 3-Person Household | 3,713 | 11.0% |
| 4+ Person Household | 9,423 | 27.8% |
| Total Housing Units | 33,859 | 100.0% |
Occupancy by Ownership by Household Size in St George
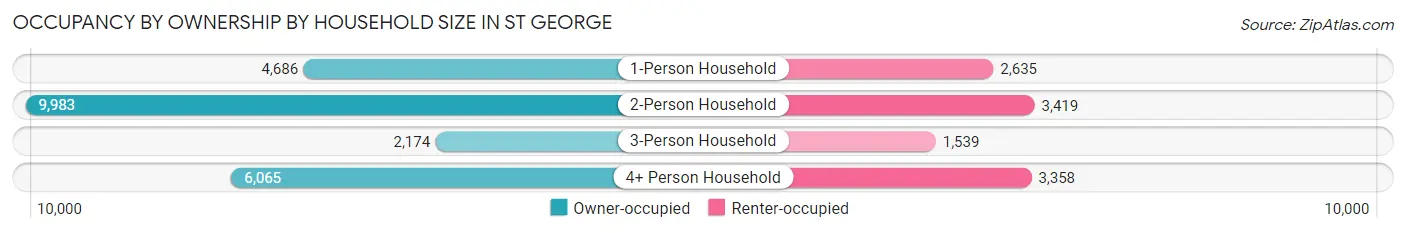
| Household Size | Owner-occupied | Renter-occupied |
| 1-Person Household | 4,686 (64.0%) | 2,635 (36.0%) |
| 2-Person Household | 9,983 (74.5%) | 3,419 (25.5%) |
| 3-Person Household | 2,174 (58.6%) | 1,539 (41.4%) |
| 4+ Person Household | 6,065 (64.4%) | 3,358 (35.6%) |
| Total Housing Units | 22,908 (67.7%) | 10,951 (32.3%) |
Occupancy by Educational Attainment in St George
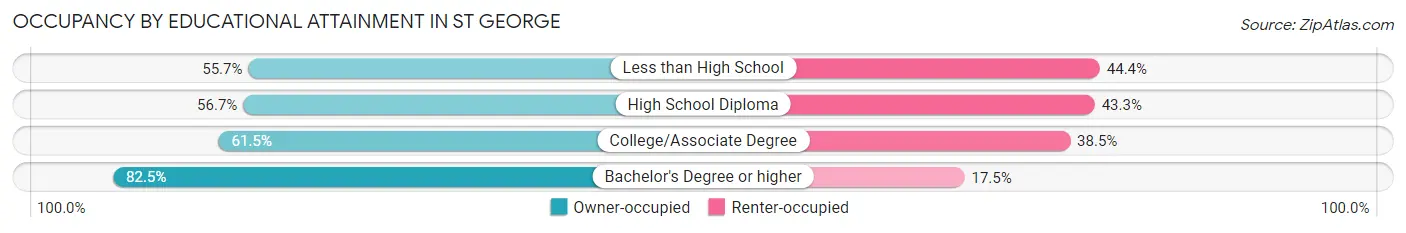
| Household Size | Owner-occupied | Renter-occupied |
| Less than High School | 837 (55.6%) | 667 (44.4%) |
| High School Diploma | 3,327 (56.7%) | 2,544 (43.3%) |
| College/Associate Degree | 9,103 (61.5%) | 5,690 (38.5%) |
| Bachelor's Degree or higher | 9,641 (82.5%) | 2,050 (17.5%) |
Occupancy by Age of Householder in St George
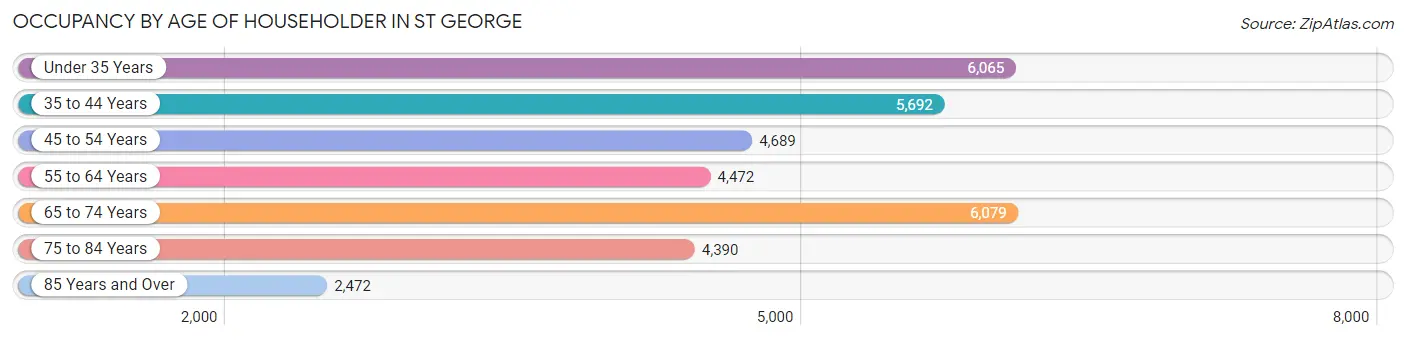
| Age Bracket | # Households | % Households |
| Under 35 Years | 6,065 | 17.9% |
| 35 to 44 Years | 5,692 | 16.8% |
| 45 to 54 Years | 4,689 | 13.9% |
| 55 to 64 Years | 4,472 | 13.2% |
| 65 to 74 Years | 6,079 | 17.9% |
| 75 to 84 Years | 4,390 | 13.0% |
| 85 Years and Over | 2,472 | 7.3% |
| Total | 33,859 | 100.0% |
Housing Finances in St George
Median Income by Occupancy in St George
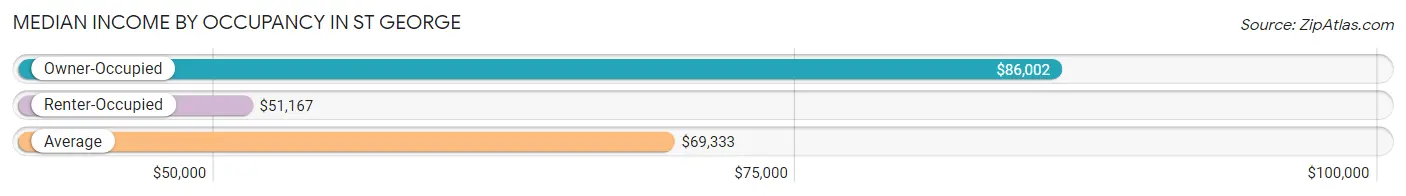
| Occupancy Type | # Households | Median Income |
| Owner-Occupied | 22,908 (67.7%) | $86,002 |
| Renter-Occupied | 10,951 (32.3%) | $51,167 |
| Average | 33,859 (100.0%) | $69,333 |
Occupancy by Householder Income Bracket in St George
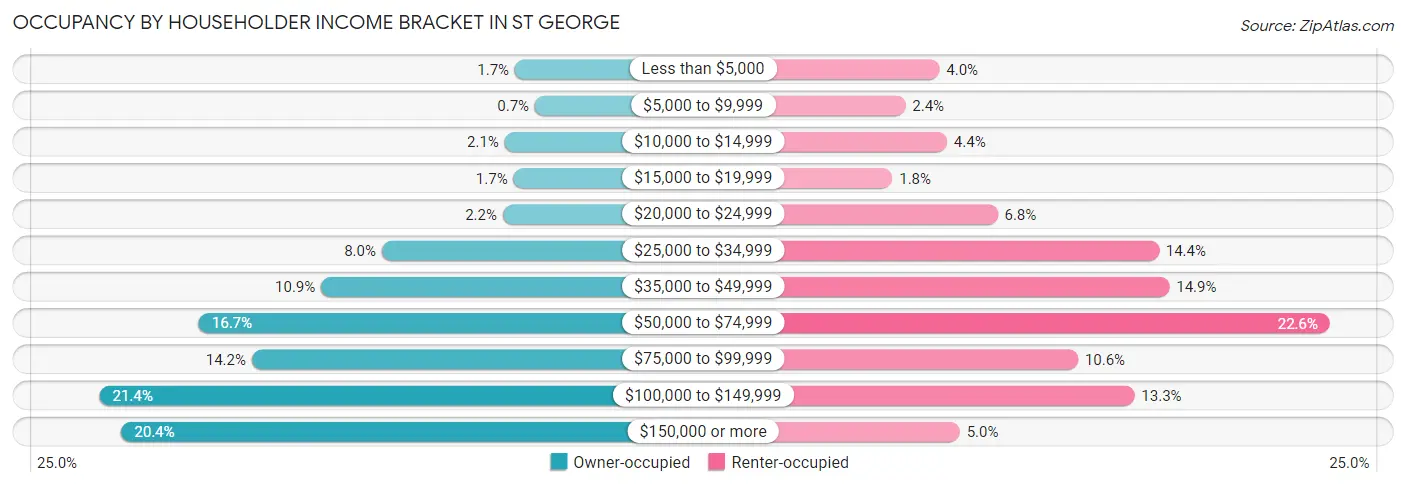
| Income Bracket | Owner-occupied | Renter-occupied |
| Less than $5,000 | 378 (1.7%) | 437 (4.0%) |
| $5,000 to $9,999 | 160 (0.7%) | 259 (2.4%) |
| $10,000 to $14,999 | 491 (2.1%) | 476 (4.3%) |
| $15,000 to $19,999 | 394 (1.7%) | 192 (1.8%) |
| $20,000 to $24,999 | 510 (2.2%) | 740 (6.8%) |
| $25,000 to $34,999 | 1,830 (8.0%) | 1,581 (14.4%) |
| $35,000 to $49,999 | 2,492 (10.9%) | 1,636 (14.9%) |
| $50,000 to $74,999 | 3,826 (16.7%) | 2,473 (22.6%) |
| $75,000 to $99,999 | 3,248 (14.2%) | 1,160 (10.6%) |
| $100,000 to $149,999 | 4,909 (21.4%) | 1,454 (13.3%) |
| $150,000 or more | 4,670 (20.4%) | 543 (5.0%) |
| Total | 22,908 (100.0%) | 10,951 (100.0%) |
Monthly Housing Cost Tiers in St George
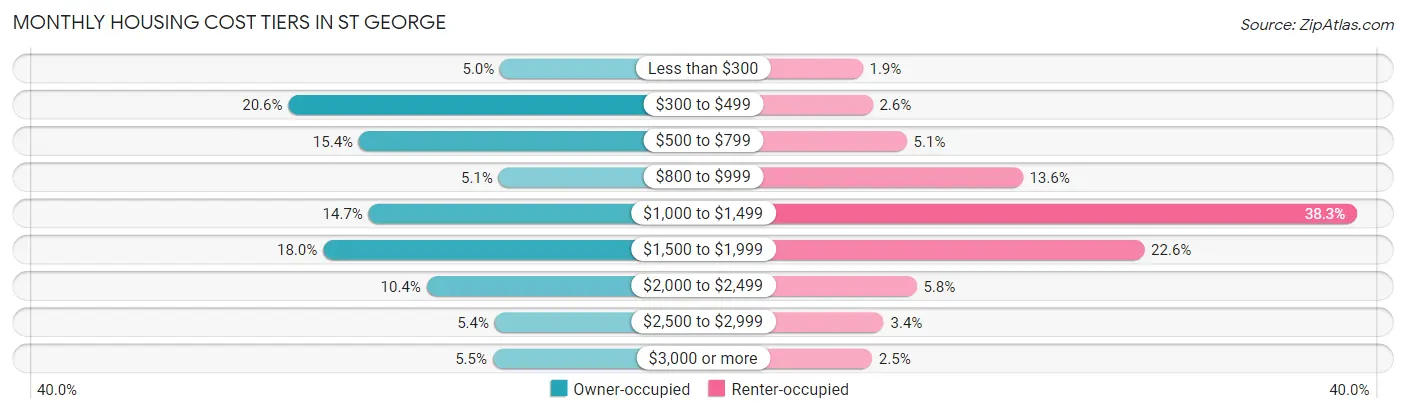
| Monthly Cost | Owner-occupied | Renter-occupied |
| Less than $300 | 1,141 (5.0%) | 203 (1.8%) |
| $300 to $499 | 4,715 (20.6%) | 283 (2.6%) |
| $500 to $799 | 3,524 (15.4%) | 558 (5.1%) |
| $800 to $999 | 1,166 (5.1%) | 1,493 (13.6%) |
| $1,000 to $1,499 | 3,359 (14.7%) | 4,191 (38.3%) |
| $1,500 to $1,999 | 4,129 (18.0%) | 2,474 (22.6%) |
| $2,000 to $2,499 | 2,380 (10.4%) | 637 (5.8%) |
| $2,500 to $2,999 | 1,230 (5.4%) | 372 (3.4%) |
| $3,000 or more | 1,264 (5.5%) | 278 (2.5%) |
| Total | 22,908 (100.0%) | 10,951 (100.0%) |
Physical Housing Characteristics in St George
Housing Structures in St George
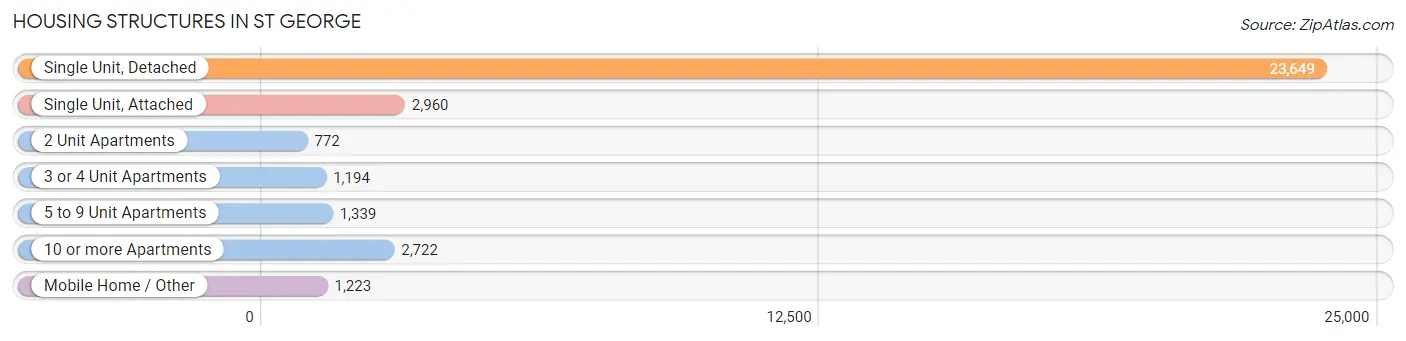
| Structure Type | # Housing Units | % Housing Units |
| Single Unit, Detached | 23,649 | 69.9% |
| Single Unit, Attached | 2,960 | 8.7% |
| 2 Unit Apartments | 772 | 2.3% |
| 3 or 4 Unit Apartments | 1,194 | 3.5% |
| 5 to 9 Unit Apartments | 1,339 | 4.0% |
| 10 or more Apartments | 2,722 | 8.0% |
| Mobile Home / Other | 1,223 | 3.6% |
| Total | 33,859 | 100.0% |
Housing Structures by Occupancy in St George
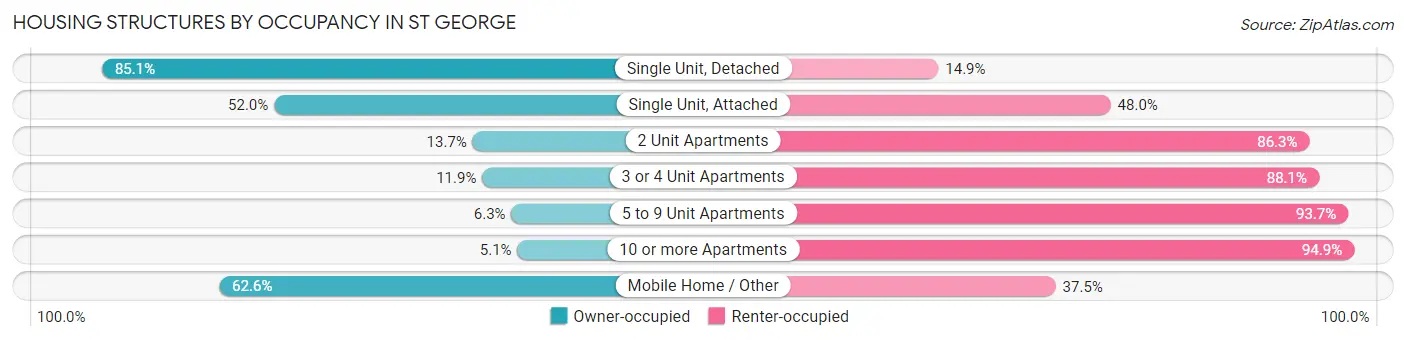
| Structure Type | Owner-occupied | Renter-occupied |
| Single Unit, Detached | 20,134 (85.1%) | 3,515 (14.9%) |
| Single Unit, Attached | 1,538 (52.0%) | 1,422 (48.0%) |
| 2 Unit Apartments | 106 (13.7%) | 666 (86.3%) |
| 3 or 4 Unit Apartments | 142 (11.9%) | 1,052 (88.1%) |
| 5 to 9 Unit Apartments | 84 (6.3%) | 1,255 (93.7%) |
| 10 or more Apartments | 139 (5.1%) | 2,583 (94.9%) |
| Mobile Home / Other | 765 (62.5%) | 458 (37.4%) |
| Total | 22,908 (67.7%) | 10,951 (32.3%) |
Housing Structures by Number of Rooms in St George
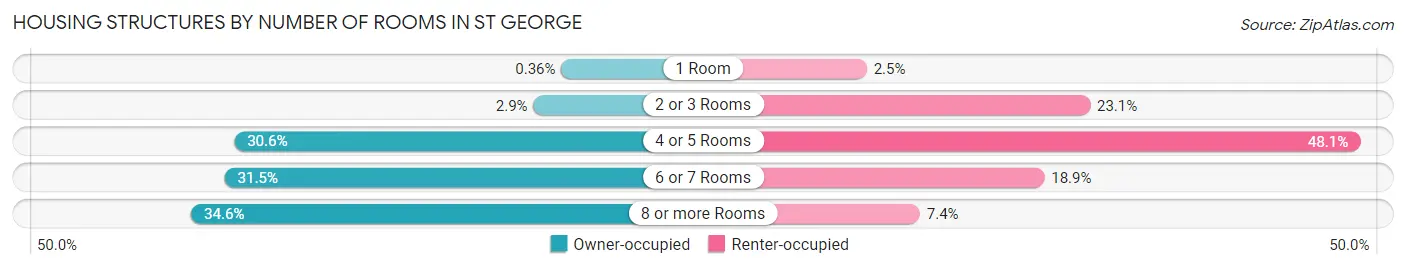
| Number of Rooms | Owner-occupied | Renter-occupied |
| 1 Room | 83 (0.4%) | 272 (2.5%) |
| 2 or 3 Rooms | 673 (2.9%) | 2,533 (23.1%) |
| 4 or 5 Rooms | 7,012 (30.6%) | 5,267 (48.1%) |
| 6 or 7 Rooms | 7,215 (31.5%) | 2,070 (18.9%) |
| 8 or more Rooms | 7,925 (34.6%) | 809 (7.4%) |
| Total | 22,908 (100.0%) | 10,951 (100.0%) |
Housing Structure by Heating Type in St George
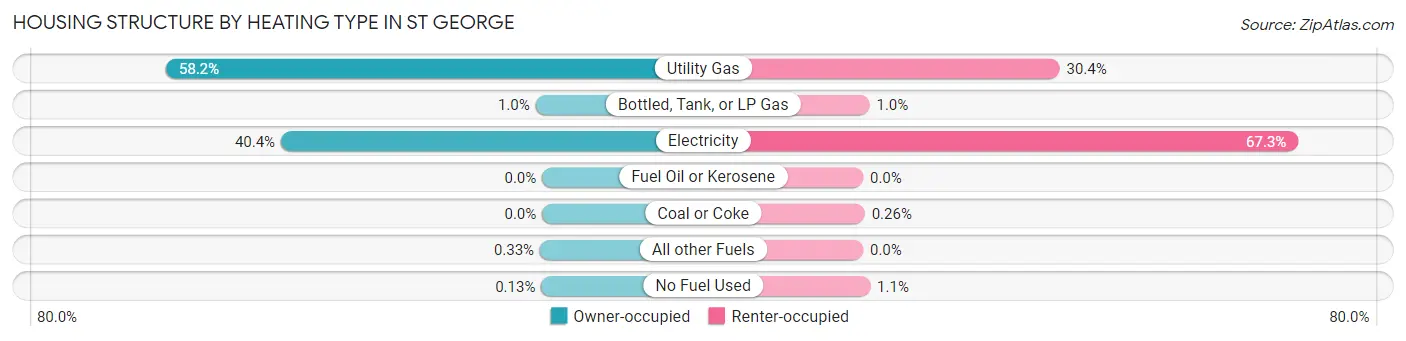
| Heating Type | Owner-occupied | Renter-occupied |
| Utility Gas | 13,323 (58.2%) | 3,327 (30.4%) |
| Bottled, Tank, or LP Gas | 232 (1.0%) | 109 (1.0%) |
| Electricity | 9,247 (40.4%) | 7,366 (67.3%) |
| Fuel Oil or Kerosene | 0 (0.0%) | 0 (0.0%) |
| Coal or Coke | 0 (0.0%) | 28 (0.3%) |
| All other Fuels | 76 (0.3%) | 0 (0.0%) |
| No Fuel Used | 30 (0.1%) | 121 (1.1%) |
| Total | 22,908 (100.0%) | 10,951 (100.0%) |
Household Vehicle Usage in St George
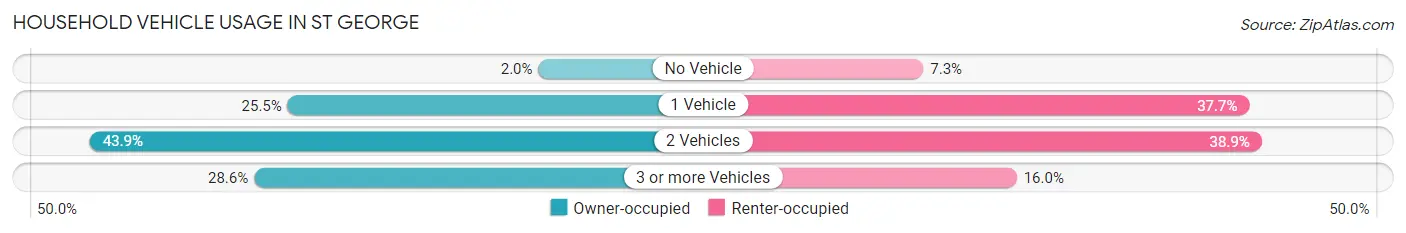
| Vehicles per Household | Owner-occupied | Renter-occupied |
| No Vehicle | 468 (2.0%) | 802 (7.3%) |
| 1 Vehicle | 5,830 (25.5%) | 4,133 (37.7%) |
| 2 Vehicles | 10,062 (43.9%) | 4,260 (38.9%) |
| 3 or more Vehicles | 6,548 (28.6%) | 1,756 (16.0%) |
| Total | 22,908 (100.0%) | 10,951 (100.0%) |
Real Estate & Mortgages in St George
Real Estate and Mortgage Overview in St George
| Characteristic | Without Mortgage | With Mortgage |
| Housing Units | 9,632 | 13,276 |
| Median Property Value | $406,700 | $421,200 |
| Median Household Income | $65,035 | $2,956 |
| Monthly Housing Costs | $464 | $1,241 |
| Real Estate Taxes | $1,926 | $442 |
Property Value by Mortgage Status in St George
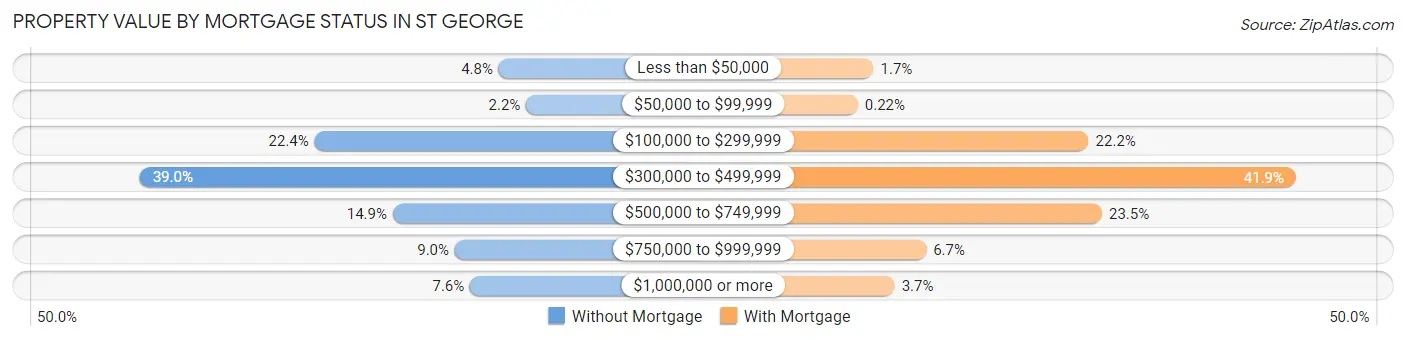
| Property Value | Without Mortgage | With Mortgage |
| Less than $50,000 | 466 (4.8%) | 228 (1.7%) |
| $50,000 to $99,999 | 215 (2.2%) | 29 (0.2%) |
| $100,000 to $299,999 | 2,156 (22.4%) | 2,947 (22.2%) |
| $300,000 to $499,999 | 3,759 (39.0%) | 5,567 (41.9%) |
| $500,000 to $749,999 | 1,438 (14.9%) | 3,117 (23.5%) |
| $750,000 to $999,999 | 869 (9.0%) | 893 (6.7%) |
| $1,000,000 or more | 729 (7.6%) | 495 (3.7%) |
| Total | 9,632 (100.0%) | 13,276 (100.0%) |
Household Income by Mortgage Status in St George
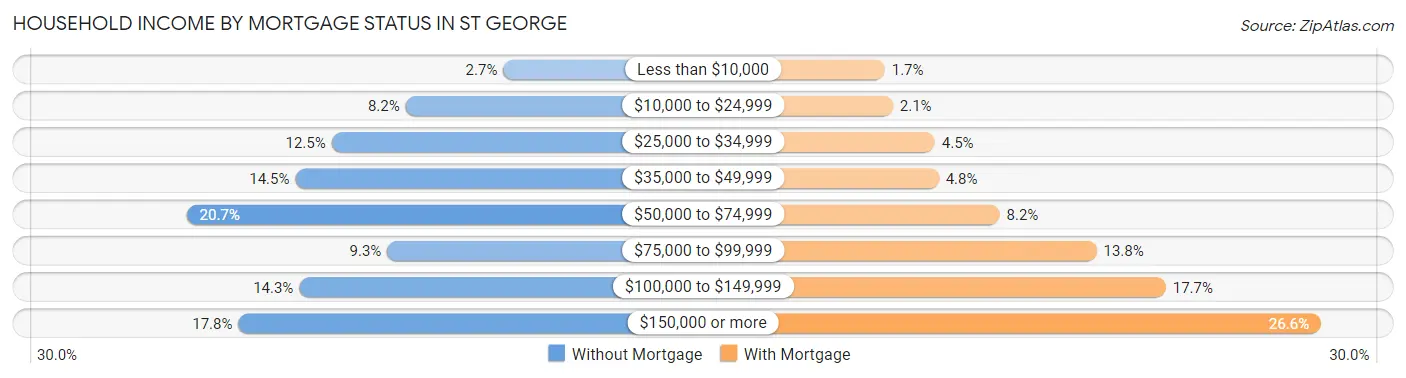
| Household Income | Without Mortgage | With Mortgage |
| Less than $10,000 | 255 (2.6%) | 222 (1.7%) |
| $10,000 to $24,999 | 793 (8.2%) | 283 (2.1%) |
| $25,000 to $34,999 | 1,200 (12.5%) | 602 (4.5%) |
| $35,000 to $49,999 | 1,400 (14.5%) | 630 (4.8%) |
| $50,000 to $74,999 | 1,998 (20.7%) | 1,092 (8.2%) |
| $75,000 to $99,999 | 894 (9.3%) | 1,828 (13.8%) |
| $100,000 to $149,999 | 1,378 (14.3%) | 2,354 (17.7%) |
| $150,000 or more | 1,714 (17.8%) | 3,531 (26.6%) |
| Total | 9,632 (100.0%) | 13,276 (100.0%) |
Property Value to Household Income Ratio in St George
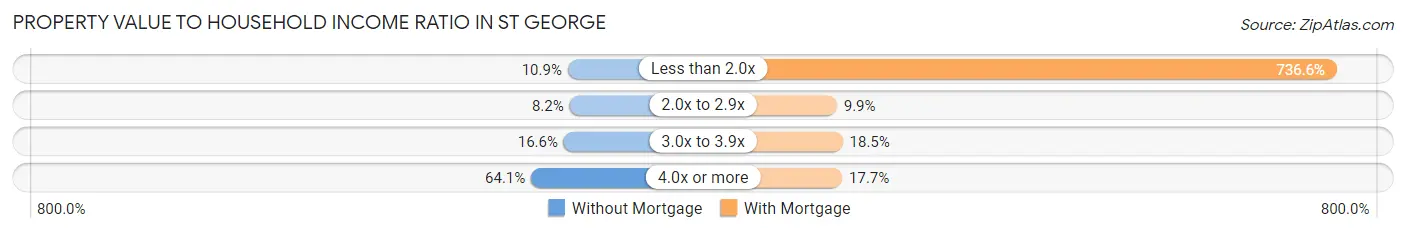
| Value-to-Income Ratio | Without Mortgage | With Mortgage |
| Less than 2.0x | 1,045 (10.8%) | 97,792 (736.6%) |
| 2.0x to 2.9x | 794 (8.2%) | 1,319 (9.9%) |
| 3.0x to 3.9x | 1,603 (16.6%) | 2,450 (18.4%) |
| 4.0x or more | 6,170 (64.1%) | 2,347 (17.7%) |
| Total | 9,632 (100.0%) | 13,276 (100.0%) |
Real Estate Taxes by Mortgage Status in St George
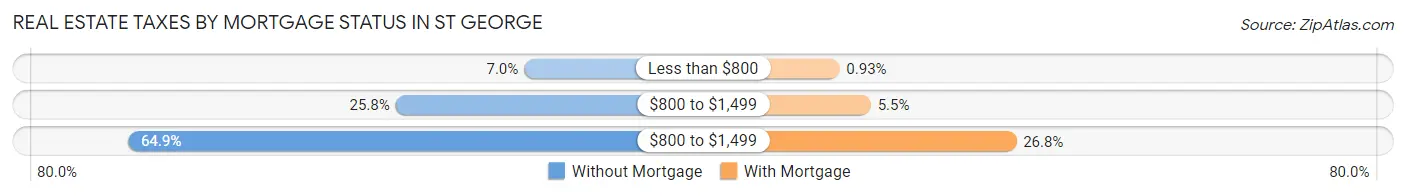
| Property Taxes | Without Mortgage | With Mortgage |
| Less than $800 | 675 (7.0%) | 124 (0.9%) |
| $800 to $1,499 | 2,484 (25.8%) | 730 (5.5%) |
| $800 to $1,499 | 6,250 (64.9%) | 3,553 (26.8%) |
| Total | 9,632 (100.0%) | 13,276 (100.0%) |
Health & Disability in St George
Health Insurance Coverage by Age in St George
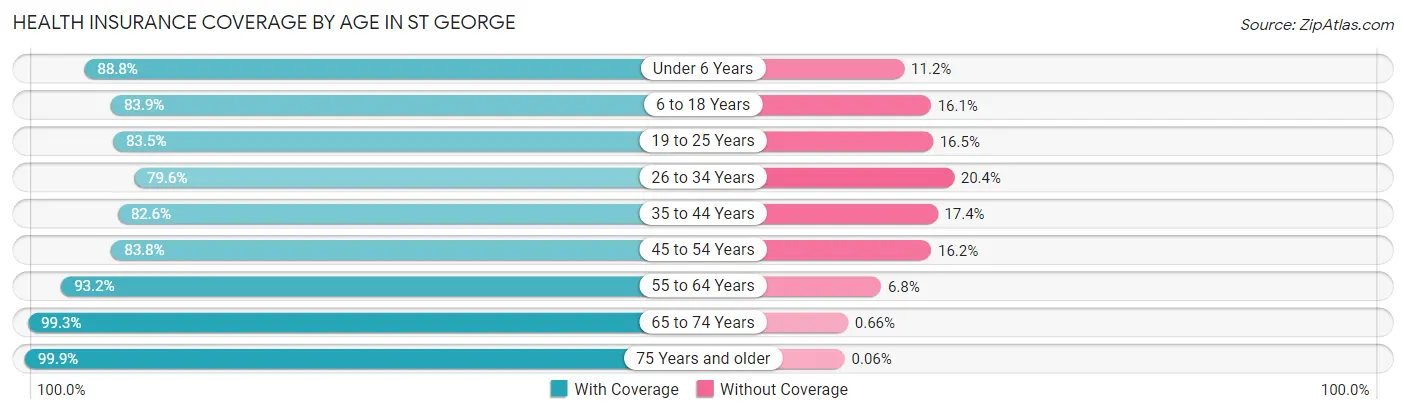
| Age Bracket | With Coverage | Without Coverage |
| Under 6 Years | 6,696 (88.8%) | 841 (11.2%) |
| 6 to 18 Years | 15,492 (83.9%) | 2,975 (16.1%) |
| 19 to 25 Years | 8,099 (83.5%) | 1,599 (16.5%) |
| 26 to 34 Years | 7,874 (79.6%) | 2,020 (20.4%) |
| 35 to 44 Years | 8,879 (82.6%) | 1,867 (17.4%) |
| 45 to 54 Years | 7,546 (83.8%) | 1,457 (16.2%) |
| 55 to 64 Years | 8,218 (93.2%) | 603 (6.8%) |
| 65 to 74 Years | 10,846 (99.3%) | 72 (0.7%) |
| 75 Years and older | 10,479 (99.9%) | 6 (0.1%) |
| Total | 84,129 (88.0%) | 11,440 (12.0%) |
Health Insurance Coverage by Citizenship Status in St George
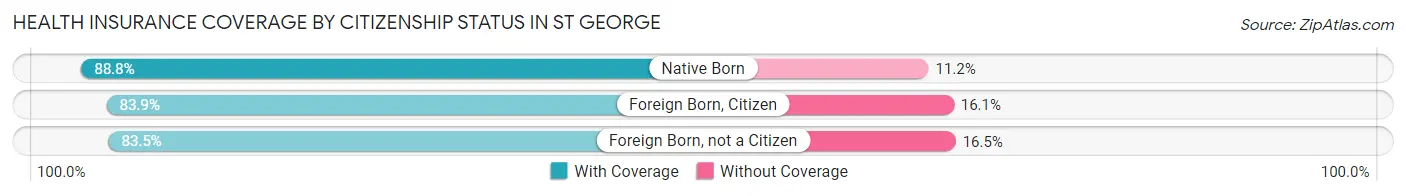
| Citizenship Status | With Coverage | Without Coverage |
| Native Born | 6,696 (88.8%) | 841 (11.2%) |
| Foreign Born, Citizen | 15,492 (83.9%) | 2,975 (16.1%) |
| Foreign Born, not a Citizen | 8,099 (83.5%) | 1,599 (16.5%) |
Health Insurance Coverage by Household Income in St George
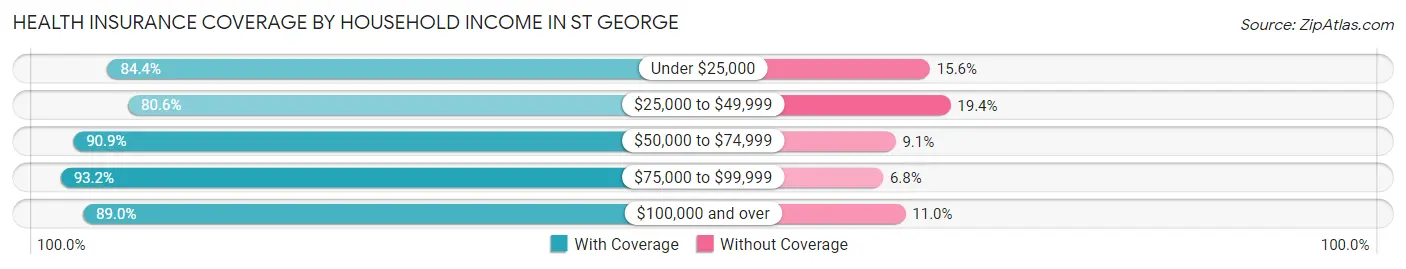
| Household Income | With Coverage | Without Coverage |
| Under $25,000 | 5,959 (84.4%) | 1,098 (15.6%) |
| $25,000 to $49,999 | 13,927 (80.6%) | 3,353 (19.4%) |
| $50,000 to $74,999 | 15,543 (90.9%) | 1,559 (9.1%) |
| $75,000 to $99,999 | 11,434 (93.2%) | 830 (6.8%) |
| $100,000 and over | 36,700 (89.0%) | 4,524 (11.0%) |
Public vs Private Health Insurance Coverage by Age in St George
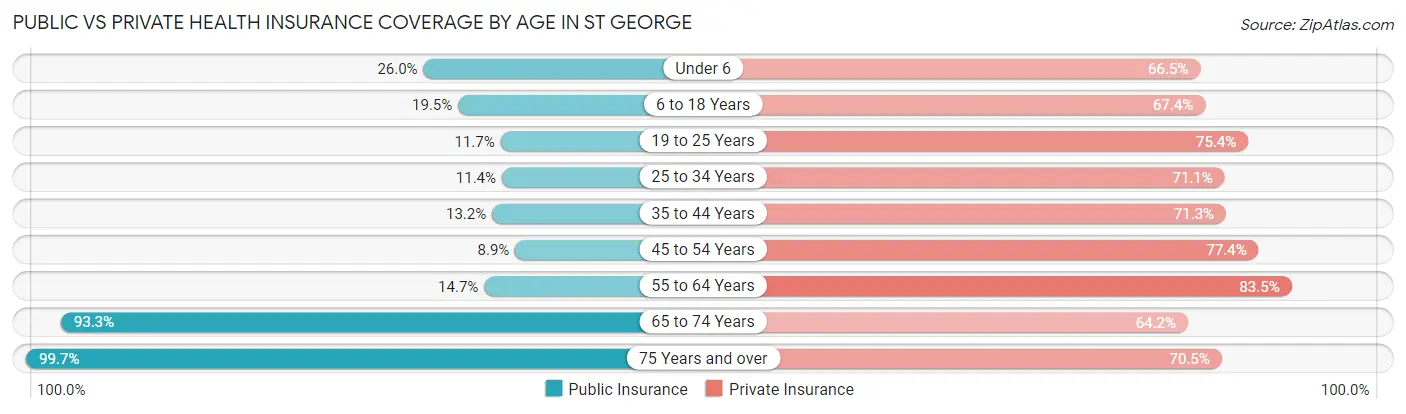
| Age Bracket | Public Insurance | Private Insurance |
| Under 6 | 1,957 (26.0%) | 5,013 (66.5%) |
| 6 to 18 Years | 3,608 (19.5%) | 12,454 (67.4%) |
| 19 to 25 Years | 1,131 (11.7%) | 7,313 (75.4%) |
| 25 to 34 Years | 1,129 (11.4%) | 7,030 (71.1%) |
| 35 to 44 Years | 1,423 (13.2%) | 7,662 (71.3%) |
| 45 to 54 Years | 805 (8.9%) | 6,964 (77.3%) |
| 55 to 64 Years | 1,297 (14.7%) | 7,362 (83.5%) |
| 65 to 74 Years | 10,182 (93.3%) | 7,013 (64.2%) |
| 75 Years and over | 10,457 (99.7%) | 7,391 (70.5%) |
| Total | 31,989 (33.5%) | 68,202 (71.4%) |
Disability Status by Sex by Age in St George
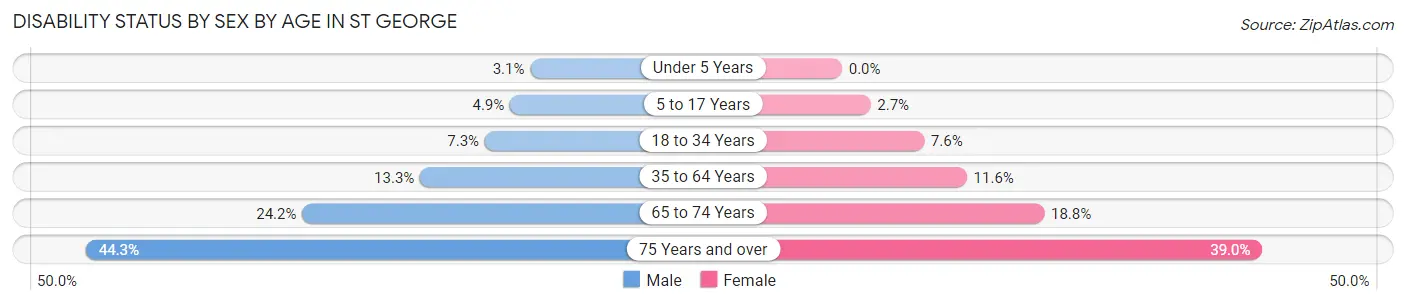
| Age Bracket | Male | Female |
| Under 5 Years | 101 (3.1%) | 0 (0.0%) |
| 5 to 17 Years | 452 (4.9%) | 243 (2.6%) |
| 18 to 34 Years | 791 (7.3%) | 791 (7.6%) |
| 35 to 64 Years | 1,796 (13.3%) | 1,745 (11.6%) |
| 65 to 74 Years | 1,233 (24.2%) | 1,094 (18.8%) |
| 75 Years and over | 2,172 (44.3%) | 2,179 (39.0%) |
Disability Class by Sex by Age in St George
Disability Class: Hearing Difficulty
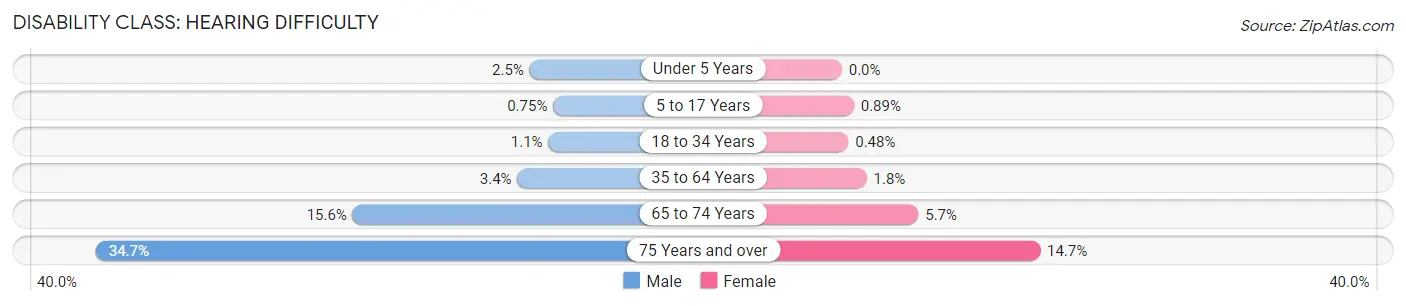
| Age Bracket | Male | Female |
| Under 5 Years | 82 (2.5%) | 0 (0.0%) |
| 5 to 17 Years | 69 (0.7%) | 82 (0.9%) |
| 18 to 34 Years | 121 (1.1%) | 50 (0.5%) |
| 35 to 64 Years | 461 (3.4%) | 277 (1.8%) |
| 65 to 74 Years | 796 (15.6%) | 331 (5.7%) |
| 75 Years and over | 1,701 (34.7%) | 822 (14.7%) |
Disability Class: Vision Difficulty
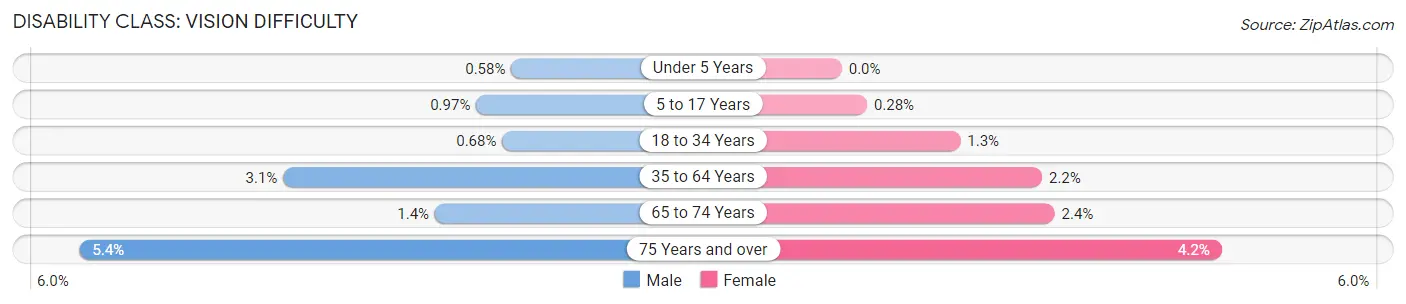
| Age Bracket | Male | Female |
| Under 5 Years | 19 (0.6%) | 0 (0.0%) |
| 5 to 17 Years | 89 (1.0%) | 26 (0.3%) |
| 18 to 34 Years | 74 (0.7%) | 137 (1.3%) |
| 35 to 64 Years | 421 (3.1%) | 336 (2.2%) |
| 65 to 74 Years | 73 (1.4%) | 138 (2.4%) |
| 75 Years and over | 264 (5.4%) | 236 (4.2%) |
Disability Class: Cognitive Difficulty
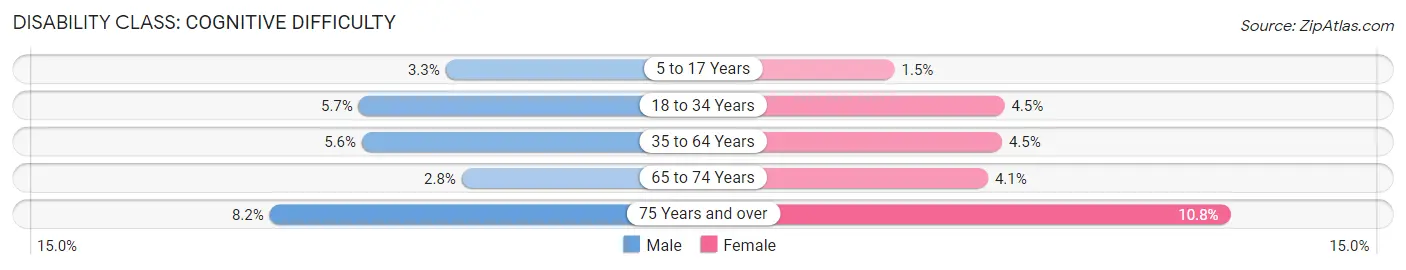
| Age Bracket | Male | Female |
| 5 to 17 Years | 300 (3.3%) | 135 (1.5%) |
| 18 to 34 Years | 620 (5.7%) | 470 (4.5%) |
| 35 to 64 Years | 758 (5.6%) | 671 (4.5%) |
| 65 to 74 Years | 144 (2.8%) | 237 (4.1%) |
| 75 Years and over | 401 (8.2%) | 604 (10.8%) |
Disability Class: Ambulatory Difficulty
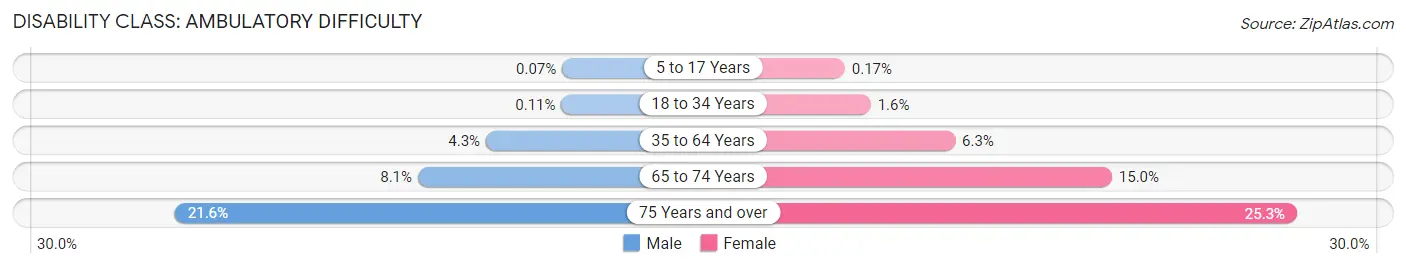
| Age Bracket | Male | Female |
| 5 to 17 Years | 6 (0.1%) | 16 (0.2%) |
| 18 to 34 Years | 12 (0.1%) | 167 (1.6%) |
| 35 to 64 Years | 582 (4.3%) | 950 (6.3%) |
| 65 to 74 Years | 412 (8.1%) | 877 (15.0%) |
| 75 Years and over | 1,060 (21.6%) | 1,415 (25.3%) |
Disability Class: Self-Care Difficulty
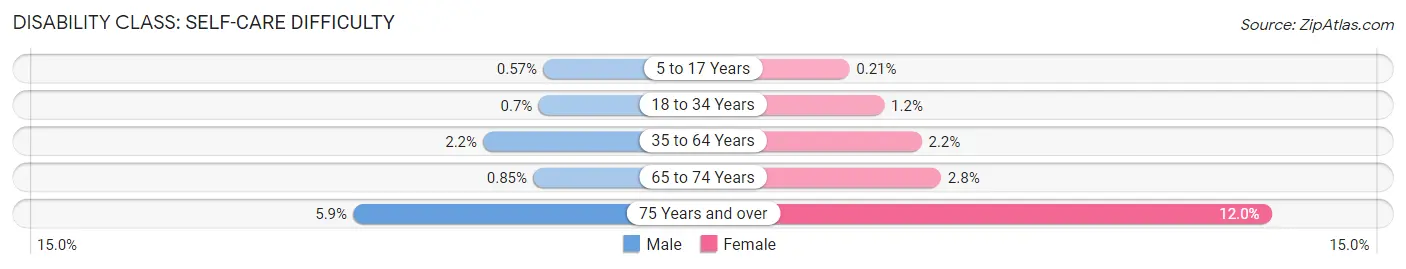
| Age Bracket | Male | Female |
| 5 to 17 Years | 52 (0.6%) | 19 (0.2%) |
| 18 to 34 Years | 76 (0.7%) | 122 (1.2%) |
| 35 to 64 Years | 303 (2.2%) | 335 (2.2%) |
| 65 to 74 Years | 43 (0.9%) | 161 (2.8%) |
| 75 Years and over | 287 (5.9%) | 668 (12.0%) |
Technology Access in St George
Computing Device Access in St George
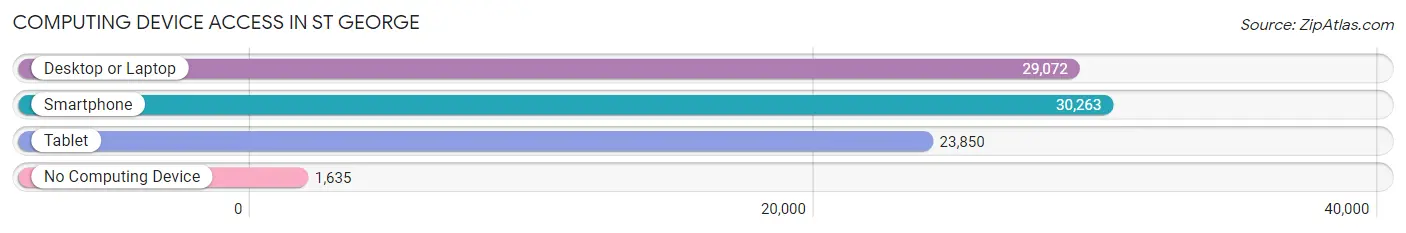
| Device Type | # Households | % Households |
| Desktop or Laptop | 29,072 | 85.9% |
| Smartphone | 30,263 | 89.4% |
| Tablet | 23,850 | 70.4% |
| No Computing Device | 1,635 | 4.8% |
| Total | 33,859 | 100.0% |
Internet Access in St George
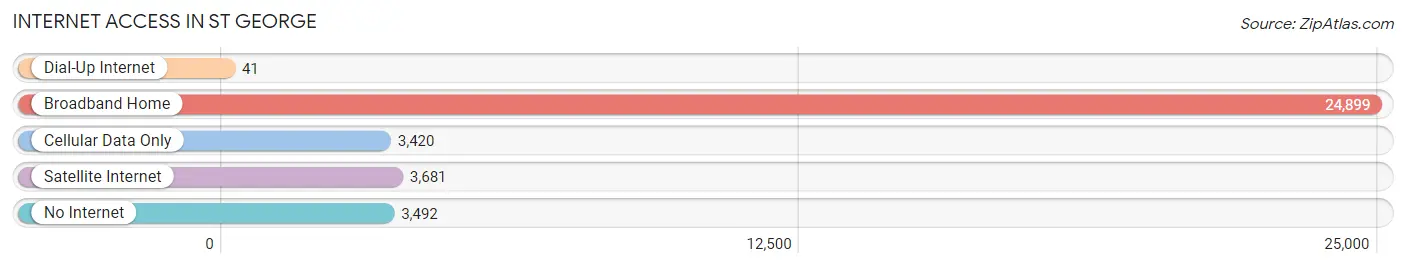
| Internet Type | # Households | % Households |
| Dial-Up Internet | 41 | 0.1% |
| Broadband Home | 24,899 | 73.5% |
| Cellular Data Only | 3,420 | 10.1% |
| Satellite Internet | 3,681 | 10.9% |
| No Internet | 3,492 | 10.3% |
| Total | 33,859 | 100.0% |
St George Summary
Geography
St. George is located in the southwestern corner of Utah, near the Arizona border. It is situated in the Mojave Desert, at the base of the Pine Valley Mountains. The city is located at an elevation of 2,880 feet (879 m) above sea level. The city is surrounded by a variety of natural features, including the Red Cliffs National Conservation Area, the Virgin River, and the Pine Valley Mountains.
The city is divided into several distinct neighborhoods, including Bloomington, Dixie Downs, Green Valley, and SunRiver. The city is also home to several parks, including the St. George City Park, the Red Cliffs Desert Reserve, and the Snow Canyon State Park.
History
St. George was founded in 1861 by Mormon settlers, who were sent by Brigham Young to establish a settlement in the area. The settlers named the city after George A. Smith, an apostle of the Church of Jesus Christ of Latter-day Saints.
The city quickly grew, and by the 1880s, it had become a major agricultural center. The city was also home to several industries, including a woolen mill, a flour mill, and a sugar beet factory.
In the early 1900s, the city began to experience a period of rapid growth. This growth was fueled by the construction of the St. George Temple, which was completed in 1877. The temple was the first temple of the Church of Jesus Christ of Latter-day Saints to be built in the United States.
The city continued to grow throughout the 20th century, and by the 2000s, it had become a major tourist destination. The city is now home to several attractions, including the St. George Dinosaur Discovery Site, the St. George Art Museum, and the St. George Utah Temple.
Economy
St. George has a diverse economy, with a variety of industries. The city is home to several major employers, including the Intermountain Healthcare, the Dixie Regional Medical Center, and the St. George Regional Airport.
The city is also home to several major retail outlets, including the Red Cliffs Mall and the St. George Town Square. The city is also home to several major manufacturing companies, including the St. George Iron Works and the St. George Steel Company.
The city is also home to several major educational institutions, including Dixie State University, the College of Southern Utah, and the University of Utah.
Demographics
As of the 2010 census, the population of St. George was 75,563. The city has a population density of 1,845 people per square mile (715/km2). The racial makeup of the city is 87.3% White, 1.3% African American, 0.7% Native American, 1.3% Asian, 0.2% Pacific Islander, 6.2% from other races, and 3.2% from two or more races.
The median income for a household in the city is $45,945, and the median income for a family is $51,945. The per capita income for the city is $22,945. The city has a poverty rate of 11.3%.
Conclusion
St. George is a vibrant city located in the southwestern corner of Utah. The city has a rich history, and it has experienced a period of rapid growth in recent years. The city is home to a diverse economy, with a variety of industries and employers. The city is also home to several major educational institutions, and it has a population of 75,563. St. George is a great place to live, work, and visit.
Common Questions
What is Per Capita Income in St George?
Per Capita income in St George is $34,653.
What is the Median Family Income in St George?
Median Family Income in St George is $86,120.
What is the Median Household income in St George?
Median Household Income in St George is $69,333.
What is Income or Wage Gap in St George?
Income or Wage Gap in St George is 38.3%.
Women in St George earn 61.7 cents for every dollar earned by a man.
What is Family Income Deficit in St George?
Family Income Deficit in St George is $10,089.
Families that are below poverty line in St George earn $10,089 less on average than the poverty threshold level.
What is Inequality or Gini Index in St George?
Inequality or Gini Index in St George is 0.44.
What is the Total Population of St George?
Total Population of St George is 96,174.
What is the Total Male Population of St George?
Total Male Population of St George is 46,971.
What is the Total Female Population of St George?
Total Female Population of St George is 49,203.
What is the Ratio of Males per 100 Females in St George?
There are 95.46 Males per 100 Females in St George.
What is the Ratio of Females per 100 Males in St George?
There are 104.75 Females per 100 Males in St George.
What is the Median Population Age in St George?
Median Population Age in St George is 37.5 Years.
What is the Average Family Size in St George
Average Family Size in St George is 3.2 People.
What is the Average Household Size in St George
Average Household Size in St George is 2.8 People.
How Large is the Labor Force in St George?
There are 41,956 People in the Labor Forcein in St George.
What is the Percentage of People in the Labor Force in St George?
56.3% of People are in the Labor Force in St George.
What is the Unemployment Rate in St George?
Unemployment Rate in St George is 3.3%.