Hauula, HI Map & Demographics
Hauula Map
Hauula Overview
$27,792
PER CAPITA INCOME
$115,900
AVG FAMILY INCOME
$108,800
AVG HOUSEHOLD INCOME
6.2%
WAGE / INCOME GAP [ % ]
93.8¢/ $1
WAGE / INCOME GAP [ $ ]
0.41
INEQUALITY / GINI INDEX
3,593
TOTAL POPULATION
2,052
MALE POPULATION
1,541
FEMALE POPULATION
133.16
MALES / 100 FEMALES
75.10
FEMALES / 100 MALES
31.3
MEDIAN AGE
4.7
AVG FAMILY SIZE
4.3
AVG HOUSEHOLD SIZE
1,612
LABOR FORCE [ PEOPLE ]
64.9%
PERCENT IN LABOR FORCE
6.9%
UNEMPLOYMENT RATE
Hauula Zip Codes
Hauula Area Codes
Income in Hauula
Income Overview in Hauula
Per Capita Income in Hauula is $27,792, while median incomes of families and households are $115,900 and $108,800 respectively.
| Characteristic | Number | Measure |
| Per Capita Income | 3,593 | $27,792 |
| Median Family Income | 628 | $115,900 |
| Mean Family Income | 628 | $119,368 |
| Median Household Income | 822 | $108,800 |
| Mean Household Income | 822 | $124,510 |
| Income Deficit | 628 | $0 |
| Wage / Income Gap (%) | 3,593 | 6.18% |
| Wage / Income Gap ($) | 3,593 | 93.82¢ per $1 |
| Gini / Inequality Index | 3,593 | 0.41 |
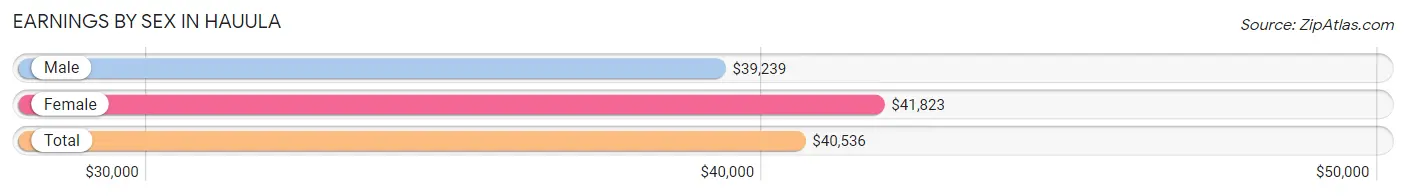
Earnings by Sex in Hauula
Average Earnings in Hauula are $40,536, $39,239 for men and $41,823 for women, a difference of 6.2%.
| Sex | Number | Average Earnings |
| Male | 964 (59.3%) | $39,239 |
| Female | 661 (40.7%) | $41,823 |
| Total | 1,625 (100.0%) | $40,536 |
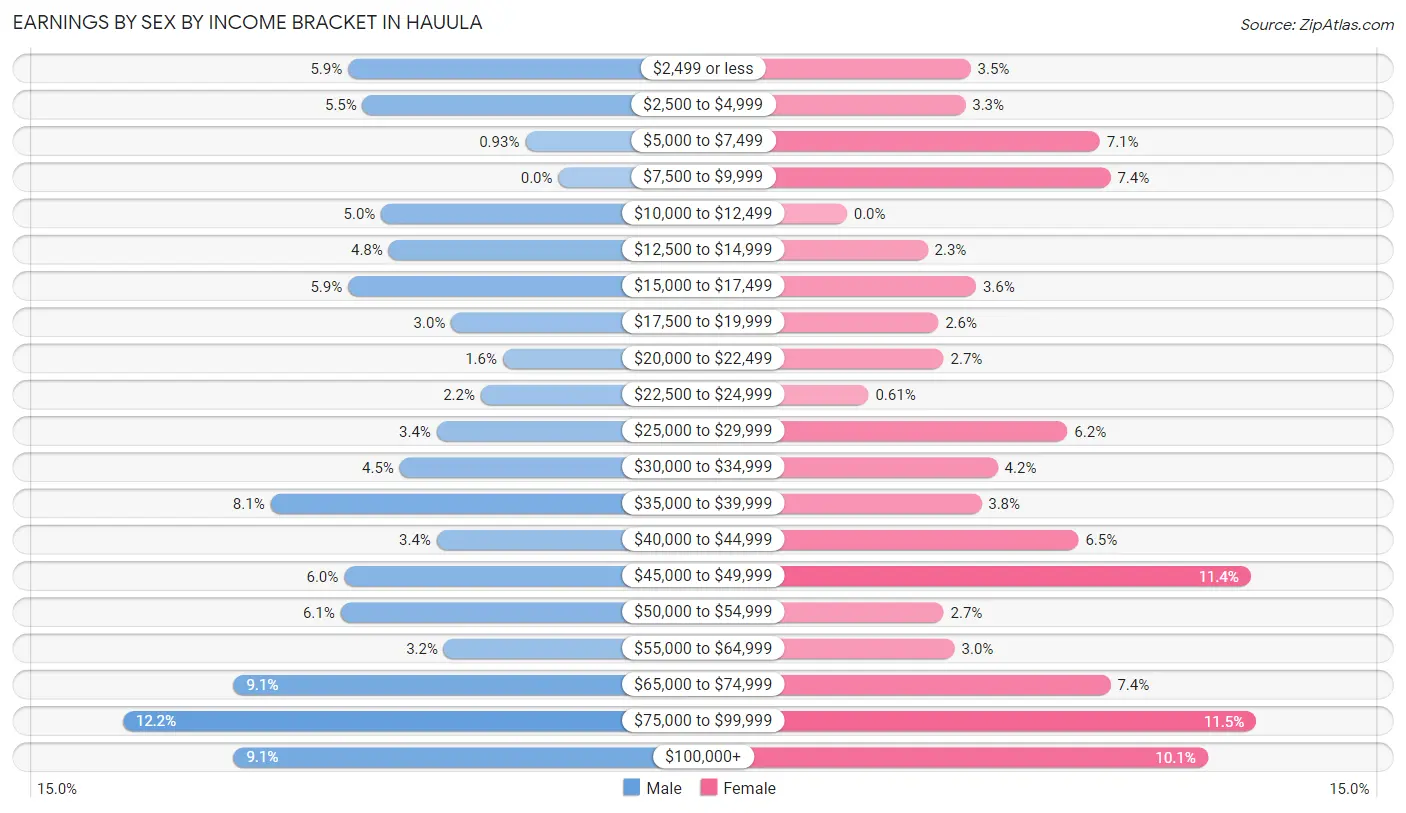
Earnings by Sex by Income Bracket in Hauula
The most common earnings brackets in Hauula are $75,000 to $99,999 for men (118 | 12.2%) and $75,000 to $99,999 for women (76 | 11.5%).
| Income | Male | Female |
| $2,499 or less | 57 (5.9%) | 23 (3.5%) |
| $2,500 to $4,999 | 53 (5.5%) | 22 (3.3%) |
| $5,000 to $7,499 | 9 (0.9%) | 47 (7.1%) |
| $7,500 to $9,999 | 0 (0.0%) | 49 (7.4%) |
| $10,000 to $12,499 | 48 (5.0%) | 0 (0.0%) |
| $12,500 to $14,999 | 46 (4.8%) | 15 (2.3%) |
| $15,000 to $17,499 | 57 (5.9%) | 24 (3.6%) |
| $17,500 to $19,999 | 29 (3.0%) | 17 (2.6%) |
| $20,000 to $22,499 | 15 (1.6%) | 18 (2.7%) |
| $22,500 to $24,999 | 21 (2.2%) | 4 (0.6%) |
| $25,000 to $29,999 | 33 (3.4%) | 41 (6.2%) |
| $30,000 to $34,999 | 43 (4.5%) | 28 (4.2%) |
| $35,000 to $39,999 | 78 (8.1%) | 25 (3.8%) |
| $40,000 to $44,999 | 33 (3.4%) | 43 (6.5%) |
| $45,000 to $49,999 | 58 (6.0%) | 75 (11.4%) |
| $50,000 to $54,999 | 59 (6.1%) | 18 (2.7%) |
| $55,000 to $64,999 | 31 (3.2%) | 20 (3.0%) |
| $65,000 to $74,999 | 88 (9.1%) | 49 (7.4%) |
| $75,000 to $99,999 | 118 (12.2%) | 76 (11.5%) |
| $100,000+ | 88 (9.1%) | 67 (10.1%) |
| Total | 964 (100.0%) | 661 (100.0%) |
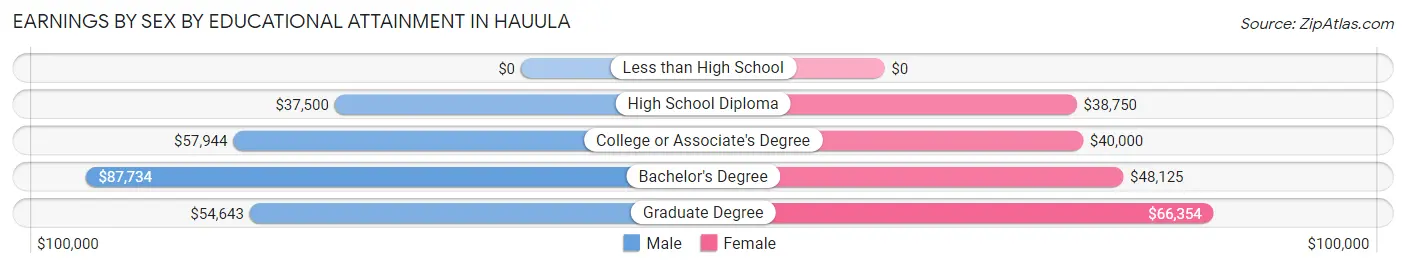
Earnings by Sex by Educational Attainment in Hauula
Average earnings in Hauula are $49,940 for men and $45,117 for women, a difference of 9.7%. Men with an educational attainment of bachelor's degree enjoy the highest average annual earnings of $87,734, while those with high school diploma education earn the least with $37,500. Women with an educational attainment of graduate degree earn the most with the average annual earnings of $66,354, while those with high school diploma education have the smallest earnings of $38,750.
| Educational Attainment | Male Income | Female Income |
| Less than High School | - | - |
| High School Diploma | $37,500 | $38,750 |
| College or Associate's Degree | $57,944 | $40,000 |
| Bachelor's Degree | $87,734 | $48,125 |
| Graduate Degree | $54,643 | $66,354 |
| Total | $49,940 | $45,117 |
Family Income in Hauula
Family Income Brackets in Hauula
According to the Hauula family income data, there are 189 families falling into the $100,000 to $149,999 income range, which is the most common income bracket and makes up 30.1% of all families.
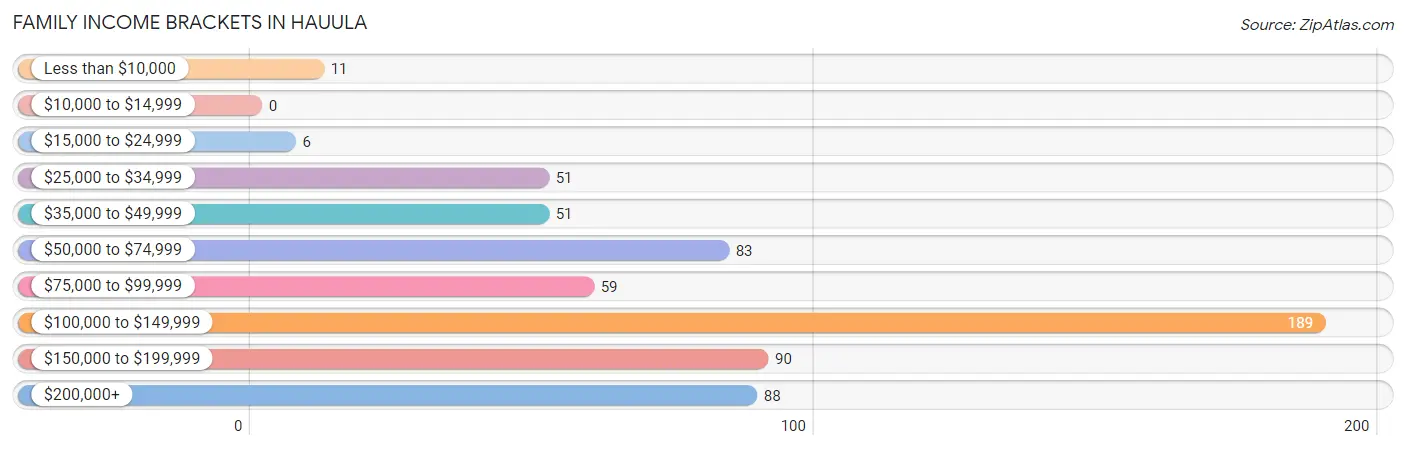
| Income Bracket | # Families | % Families |
| Less than $10,000 | 11 | 1.8% |
| $10,000 to $14,999 | 0 | 0.0% |
| $15,000 to $24,999 | 6 | 1.0% |
| $25,000 to $34,999 | 51 | 8.1% |
| $35,000 to $49,999 | 51 | 8.1% |
| $50,000 to $74,999 | 83 | 13.2% |
| $75,000 to $99,999 | 59 | 9.4% |
| $100,000 to $149,999 | 189 | 30.1% |
| $150,000 to $199,999 | 90 | 14.3% |
| $200,000+ | 88 | 14.0% |
Family Income by Famaliy Size in Hauula
7+ person families (73 | 11.6%) account for the highest median family income in Hauula with $157,596 per family, while 2-person families (139 | 22.1%) have the highest median income of $58,920 per family member.
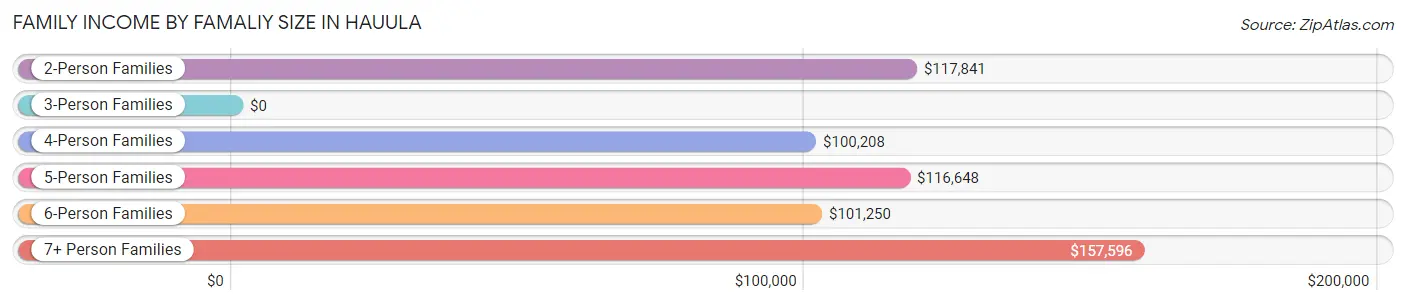
| Income Bracket | # Families | Median Income |
| 2-Person Families | 139 (22.1%) | $117,841 |
| 3-Person Families | 97 (15.4%) | $0 |
| 4-Person Families | 93 (14.8%) | $100,208 |
| 5-Person Families | 128 (20.4%) | $116,648 |
| 6-Person Families | 98 (15.6%) | $101,250 |
| 7+ Person Families | 73 (11.6%) | $157,596 |
| Total | 628 (100.0%) | $115,900 |
Family Income by Number of Earners in Hauula
The median family income in Hauula is $115,900, with families comprising 3+ earners (155) having the highest median family income of $136,719, while families with no earners (52) have the lowest median family income of $44,500, accounting for 24.7% and 8.3% of families, respectively.
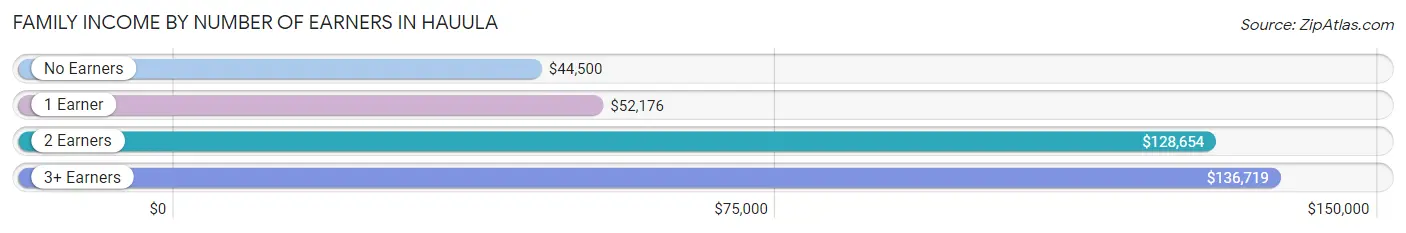
| Number of Earners | # Families | Median Income |
| No Earners | 52 (8.3%) | $44,500 |
| 1 Earner | 181 (28.8%) | $52,176 |
| 2 Earners | 240 (38.2%) | $128,654 |
| 3+ Earners | 155 (24.7%) | $136,719 |
| Total | 628 (100.0%) | $115,900 |
Household Income in Hauula
Household Income Brackets in Hauula
With 239 households falling in the category, the $100,000 to $149,999 income range is the most frequent in Hauula, accounting for 29.1% of all households.
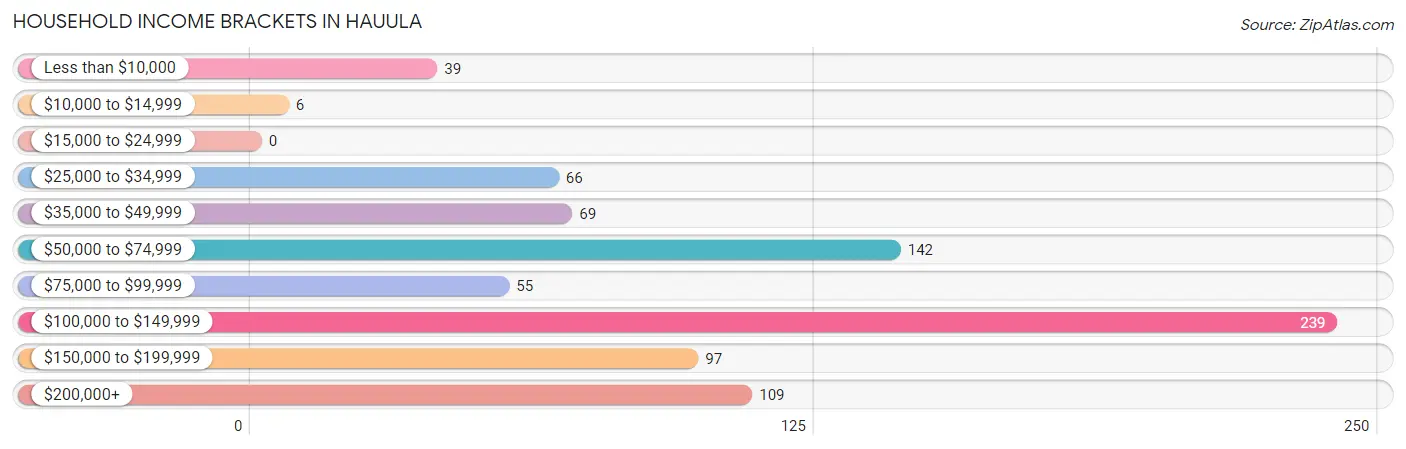
| Income Bracket | # Households | % Households |
| Less than $10,000 | 39 | 4.7% |
| $10,000 to $14,999 | 6 | 0.7% |
| $15,000 to $24,999 | 0 | 0.0% |
| $25,000 to $34,999 | 66 | 8.0% |
| $35,000 to $49,999 | 69 | 8.4% |
| $50,000 to $74,999 | 142 | 17.3% |
| $75,000 to $99,999 | 55 | 6.7% |
| $100,000 to $149,999 | 239 | 29.1% |
| $150,000 to $199,999 | 97 | 11.8% |
| $200,000+ | 109 | 13.3% |
Household Income by Householder Age in Hauula
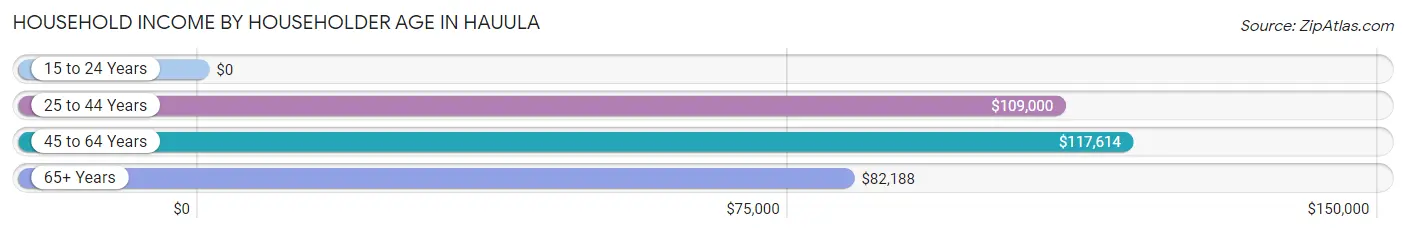
The median household income in Hauula is $108,800, with the highest median household income of $117,614 found in the 45 to 64 years age bracket for the primary householder. A total of 333 households (40.5%) fall into this category.
| Income Bracket | # Households | Median Income |
| 15 to 24 Years | 0 (0.0%) | $0 |
| 25 to 44 Years | 278 (33.8%) | $109,000 |
| 45 to 64 Years | 333 (40.5%) | $117,614 |
| 65+ Years | 211 (25.7%) | $82,188 |
| Total | 822 (100.0%) | $108,800 |
Poverty in Hauula
Income Below Poverty by Sex and Age in Hauula
With 6.4% poverty level for males and 13.1% for females among the residents of Hauula, 18 to 24 year old males and 16 and 17 year old females are the most vulnerable to poverty, with 43 males (17.8%) and 6 females (35.3%) in their respective age groups living below the poverty level.
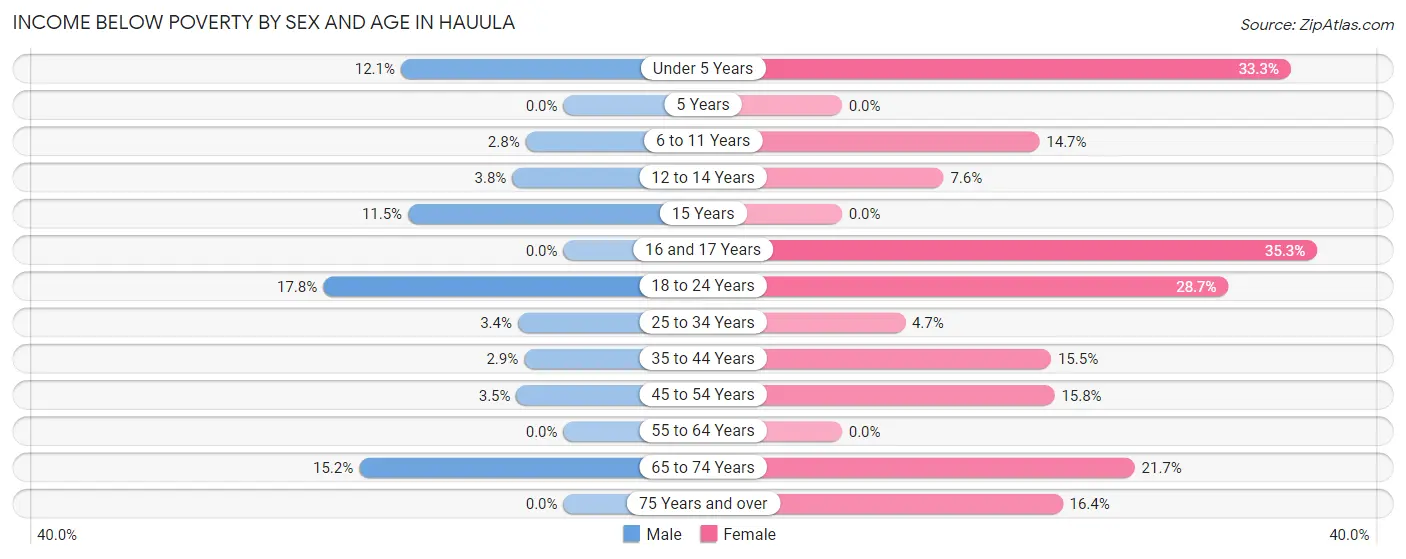
| Age Bracket | Male | Female |
| Under 5 Years | 21 (12.1%) | 17 (33.3%) |
| 5 Years | 0 (0.0%) | 0 (0.0%) |
| 6 to 11 Years | 7 (2.8%) | 22 (14.7%) |
| 12 to 14 Years | 6 (3.8%) | 8 (7.5%) |
| 15 Years | 6 (11.5%) | 0 (0.0%) |
| 16 and 17 Years | 0 (0.0%) | 6 (35.3%) |
| 18 to 24 Years | 43 (17.8%) | 31 (28.7%) |
| 25 to 34 Years | 9 (3.4%) | 10 (4.7%) |
| 35 to 44 Years | 7 (2.9%) | 32 (15.5%) |
| 45 to 54 Years | 8 (3.5%) | 36 (15.8%) |
| 55 to 64 Years | 0 (0.0%) | 0 (0.0%) |
| 65 to 74 Years | 22 (15.2%) | 20 (21.7%) |
| 75 Years and over | 0 (0.0%) | 20 (16.4%) |
| Total | 129 (6.4%) | 202 (13.1%) |
Income Above Poverty by Sex and Age in Hauula
According to the poverty statistics in Hauula, males aged 5 years and females aged 5 years are the age groups that are most secure financially, with 100.0% of males and 100.0% of females in these age groups living above the poverty line.
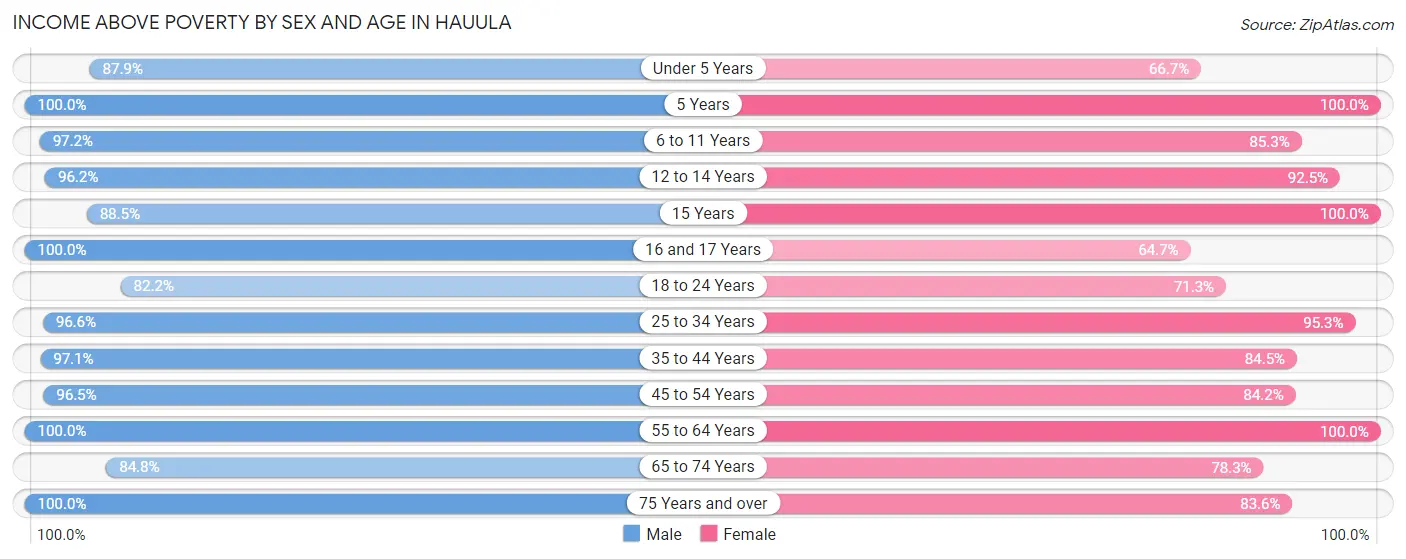
| Age Bracket | Male | Female |
| Under 5 Years | 153 (87.9%) | 34 (66.7%) |
| 5 Years | 7 (100.0%) | 65 (100.0%) |
| 6 to 11 Years | 242 (97.2%) | 128 (85.3%) |
| 12 to 14 Years | 152 (96.2%) | 98 (92.4%) |
| 15 Years | 46 (88.5%) | 56 (100.0%) |
| 16 and 17 Years | 55 (100.0%) | 11 (64.7%) |
| 18 to 24 Years | 198 (82.2%) | 77 (71.3%) |
| 25 to 34 Years | 257 (96.6%) | 203 (95.3%) |
| 35 to 44 Years | 233 (97.1%) | 174 (84.5%) |
| 45 to 54 Years | 221 (96.5%) | 192 (84.2%) |
| 55 to 64 Years | 144 (100.0%) | 123 (100.0%) |
| 65 to 74 Years | 123 (84.8%) | 72 (78.3%) |
| 75 Years and over | 55 (100.0%) | 102 (83.6%) |
| Total | 1,886 (93.6%) | 1,335 (86.9%) |
Income Below Poverty Among Married-Couple Families in Hauula
The poverty statistics for married-couple families in Hauula show that 2.1% or 11 of the total 520 families live below the poverty line. Families with 5 or more children have the highest poverty rate of 13.0%, comprising of 7 families. On the other hand, families with no children have the lowest poverty rate of 0.0%, which includes 0 families.
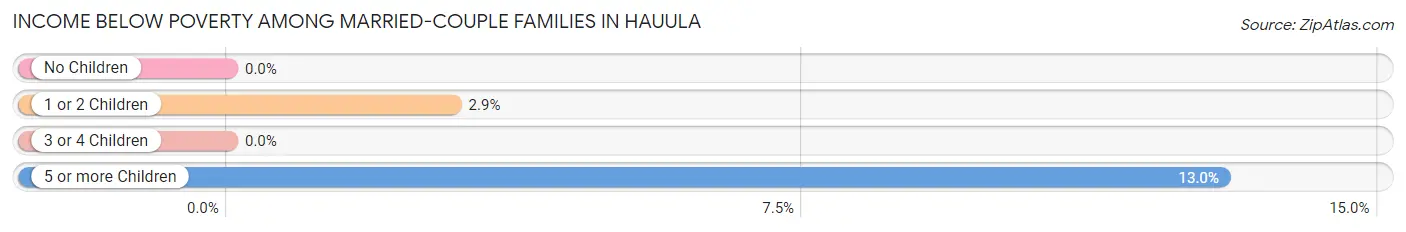
| Children | Above Poverty | Below Poverty |
| No Children | 213 (100.0%) | 0 (0.0%) |
| 1 or 2 Children | 133 (97.1%) | 4 (2.9%) |
| 3 or 4 Children | 116 (100.0%) | 0 (0.0%) |
| 5 or more Children | 47 (87.0%) | 7 (13.0%) |
| Total | 509 (97.9%) | 11 (2.1%) |
Income Below Poverty Among Single-Parent Households in Hauula
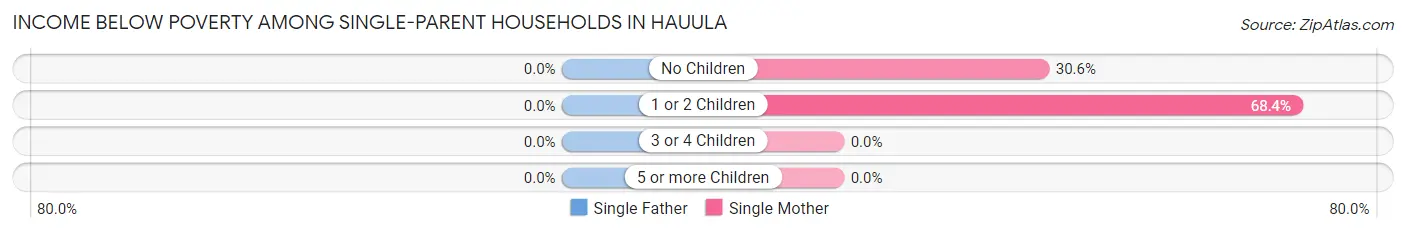
| Children | Single Father | Single Mother |
| No Children | 0 (0.0%) | 11 (30.6%) |
| 1 or 2 Children | 0 (0.0%) | 13 (68.4%) |
| 3 or 4 Children | 0 (0.0%) | 0 (0.0%) |
| 5 or more Children | 0 (0.0%) | 0 (0.0%) |
| Total | 0 (0.0%) | 24 (35.3%) |
Income Below Poverty Among Married-Couple vs Single-Parent Households in Hauula
The poverty data for Hauula shows that 11 of the married-couple family households (2.1%) and 24 of the single-parent households (22.2%) are living below the poverty level. Within the married-couple family households, those with 5 or more children have the highest poverty rate, with 7 households (13.0%) falling below the poverty line. Among the single-parent households, those with 1 or 2 children have the highest poverty rate, with 13 household (26.0%) living below poverty.
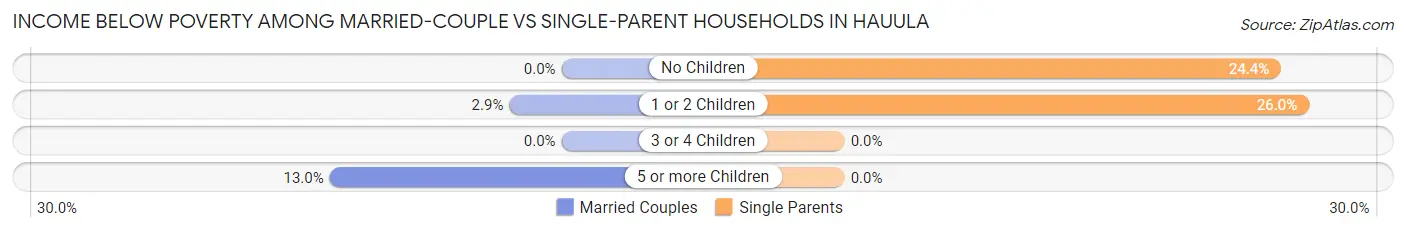
| Children | Married-Couple Families | Single-Parent Households |
| No Children | 0 (0.0%) | 11 (24.4%) |
| 1 or 2 Children | 4 (2.9%) | 13 (26.0%) |
| 3 or 4 Children | 0 (0.0%) | 0 (0.0%) |
| 5 or more Children | 7 (13.0%) | 0 (0.0%) |
| Total | 11 (2.1%) | 24 (22.2%) |
Race in Hauula
The most populous races in Hauula are Two or more Races (1,370 | 38.1%), White / Caucasian (1,082 | 30.1%), and Hawaiian / Pacific (917 | 25.5%).
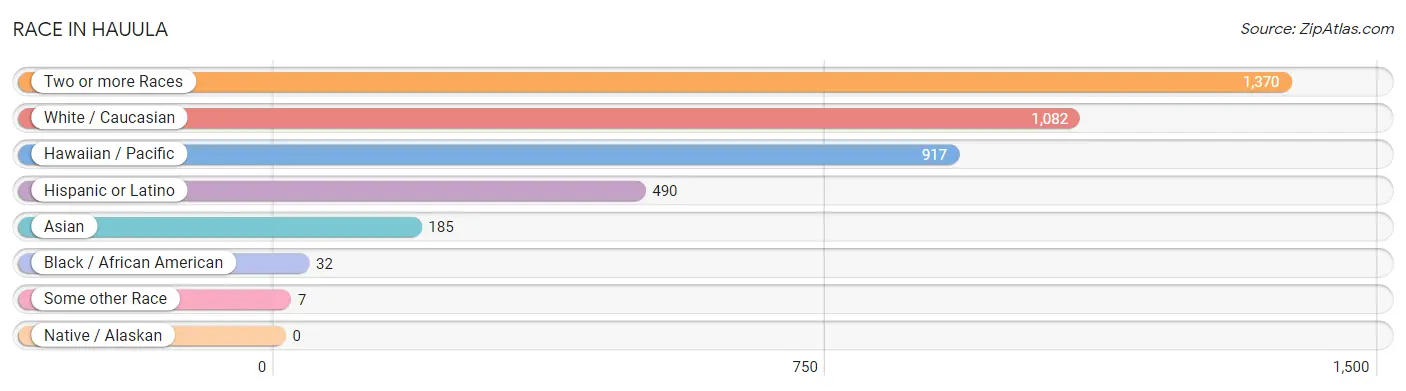
| Race | # Population | % Population |
| Asian | 185 | 5.1% |
| Black / African American | 32 | 0.9% |
| Hawaiian / Pacific | 917 | 25.5% |
| Hispanic or Latino | 490 | 13.6% |
| Native / Alaskan | 0 | 0.0% |
| White / Caucasian | 1,082 | 30.1% |
| Two or more Races | 1,370 | 38.1% |
| Some other Race | 7 | 0.2% |
| Total | 3,593 | 100.0% |
Ancestry in Hauula
The most populous ancestries reported in Hauula are Native Hawaiian (1,680 | 46.8%), Samoan (453 | 12.6%), Indian (Asian) (447 | 12.4%), German (343 | 9.6%), and Korean (325 | 9.0%), together accounting for 90.4% of all Hauula residents.
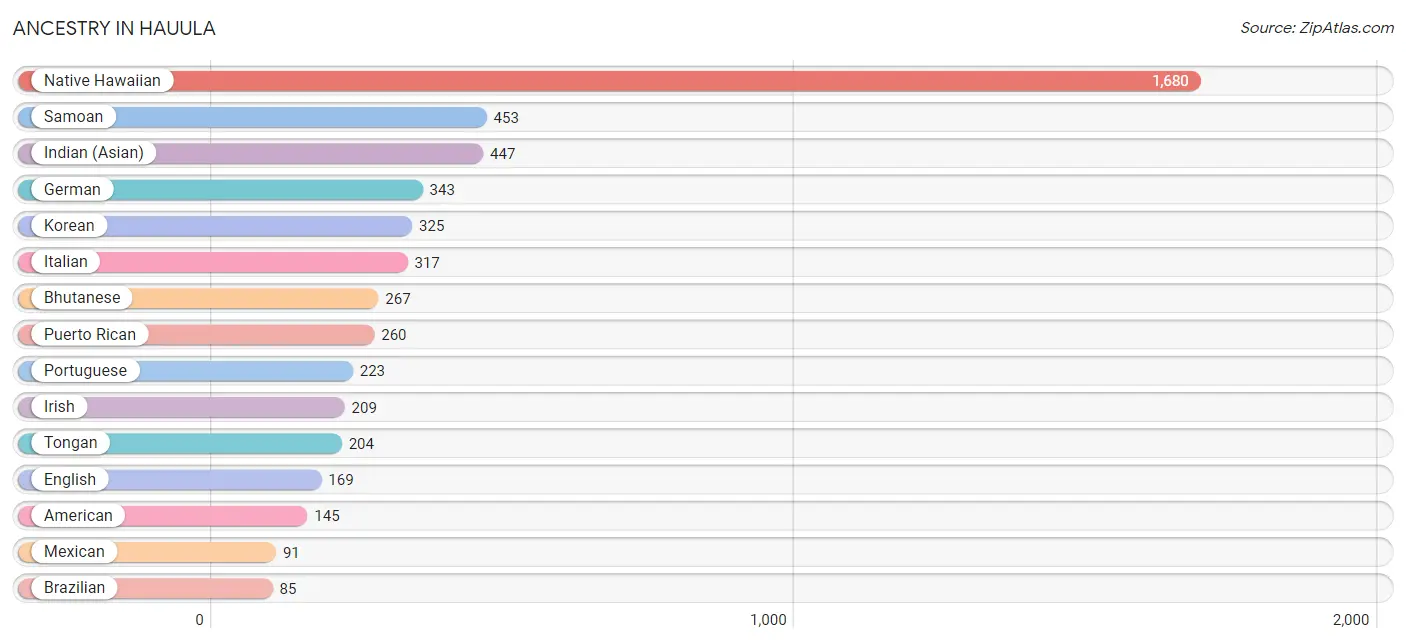
| Ancestry | # Population | % Population |
| African | 4 | 0.1% |
| American | 145 | 4.0% |
| Bhutanese | 267 | 7.4% |
| Brazilian | 85 | 2.4% |
| Burmese | 21 | 0.6% |
| Cambodian | 37 | 1.0% |
| Central American | 16 | 0.4% |
| Czech | 4 | 0.1% |
| Czechoslovakian | 10 | 0.3% |
| Danish | 13 | 0.4% |
| Dutch | 34 | 0.9% |
| English | 169 | 4.7% |
| European | 36 | 1.0% |
| Filipino | 8 | 0.2% |
| French | 18 | 0.5% |
| French Canadian | 11 | 0.3% |
| German | 343 | 9.6% |
| Indian (Asian) | 447 | 12.4% |
| Irish | 209 | 5.8% |
| Italian | 317 | 8.8% |
| Korean | 325 | 9.0% |
| Malaysian | 20 | 0.6% |
| Marshallese | 8 | 0.2% |
| Mexican | 91 | 2.5% |
| Native Hawaiian | 1,680 | 46.8% |
| New Zealander | 8 | 0.2% |
| Norwegian | 19 | 0.5% |
| Polish | 30 | 0.8% |
| Portuguese | 223 | 6.2% |
| Puerto Rican | 260 | 7.2% |
| Russian | 5 | 0.1% |
| Salvadoran | 16 | 0.4% |
| Samoan | 453 | 12.6% |
| Scandinavian | 45 | 1.3% |
| Scotch-Irish | 13 | 0.4% |
| Scottish | 6 | 0.2% |
| Spaniard | 32 | 0.9% |
| Spanish | 31 | 0.9% |
| Subsaharan African | 4 | 0.1% |
| Swedish | 11 | 0.3% |
| Swiss | 6 | 0.2% |
| Tongan | 204 | 5.7% |
| West Indian | 17 | 0.5% | View All 43 Rows |
Immigrants in Hauula
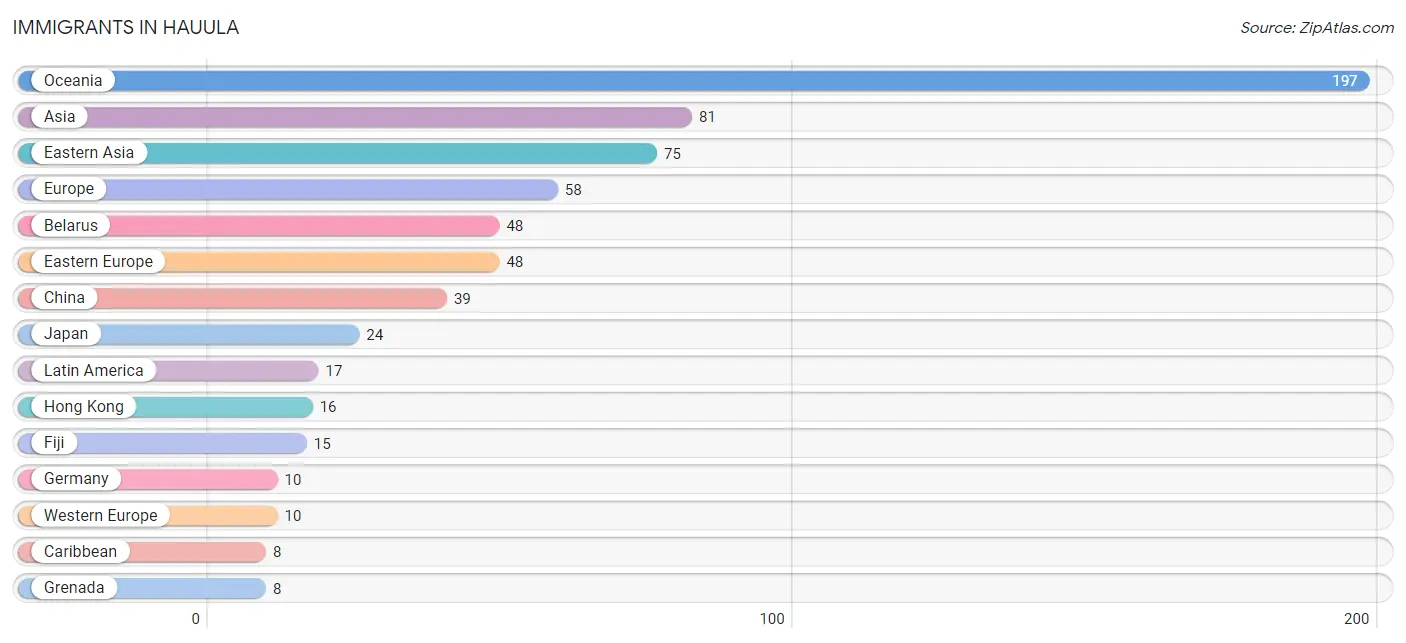
The most numerous immigrant groups reported in Hauula came from Oceania (197 | 5.5%), Asia (81 | 2.2%), Eastern Asia (75 | 2.1%), Europe (58 | 1.6%), and Belarus (48 | 1.3%), together accounting for 12.8% of all Hauula residents.
| Immigration Origin | # Population | % Population |
| Asia | 81 | 2.2% |
| Belarus | 48 | 1.3% |
| Brazil | 4 | 0.1% |
| Caribbean | 8 | 0.2% |
| Central America | 5 | 0.1% |
| China | 39 | 1.1% |
| Eastern Asia | 75 | 2.1% |
| Eastern Europe | 48 | 1.3% |
| Europe | 58 | 1.6% |
| Fiji | 15 | 0.4% |
| Germany | 10 | 0.3% |
| Grenada | 8 | 0.2% |
| Hong Kong | 16 | 0.4% |
| Japan | 24 | 0.7% |
| Latin America | 17 | 0.5% |
| Mexico | 5 | 0.1% |
| Micronesia | 4 | 0.1% |
| Oceania | 197 | 5.5% |
| Philippines | 6 | 0.2% |
| South America | 4 | 0.1% |
| South Eastern Asia | 6 | 0.2% |
| Taiwan | 4 | 0.1% |
| Western Europe | 10 | 0.3% | View All 23 Rows |
Sex and Age in Hauula
Sex and Age in Hauula
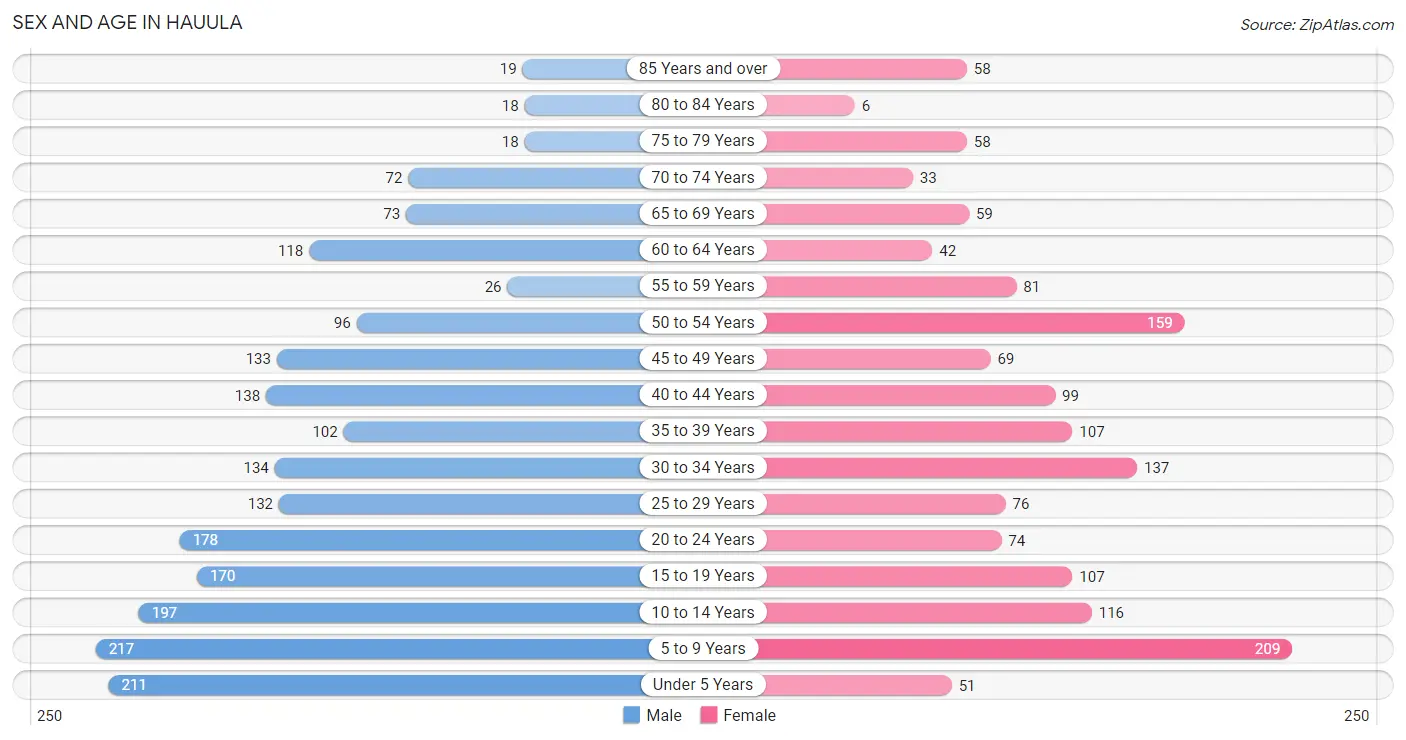
The most populous age groups in Hauula are 5 to 9 Years (217 | 10.6%) for men and 5 to 9 Years (209 | 13.6%) for women.
| Age Bracket | Male | Female |
| Under 5 Years | 211 (10.3%) | 51 (3.3%) |
| 5 to 9 Years | 217 (10.6%) | 209 (13.6%) |
| 10 to 14 Years | 197 (9.6%) | 116 (7.5%) |
| 15 to 19 Years | 170 (8.3%) | 107 (6.9%) |
| 20 to 24 Years | 178 (8.7%) | 74 (4.8%) |
| 25 to 29 Years | 132 (6.4%) | 76 (4.9%) |
| 30 to 34 Years | 134 (6.5%) | 137 (8.9%) |
| 35 to 39 Years | 102 (5.0%) | 107 (6.9%) |
| 40 to 44 Years | 138 (6.7%) | 99 (6.4%) |
| 45 to 49 Years | 133 (6.5%) | 69 (4.5%) |
| 50 to 54 Years | 96 (4.7%) | 159 (10.3%) |
| 55 to 59 Years | 26 (1.3%) | 81 (5.3%) |
| 60 to 64 Years | 118 (5.8%) | 42 (2.7%) |
| 65 to 69 Years | 73 (3.6%) | 59 (3.8%) |
| 70 to 74 Years | 72 (3.5%) | 33 (2.1%) |
| 75 to 79 Years | 18 (0.9%) | 58 (3.8%) |
| 80 to 84 Years | 18 (0.9%) | 6 (0.4%) |
| 85 Years and over | 19 (0.9%) | 58 (3.8%) |
| Total | 2,052 (100.0%) | 1,541 (100.0%) |
Families and Households in Hauula
Median Family Size in Hauula
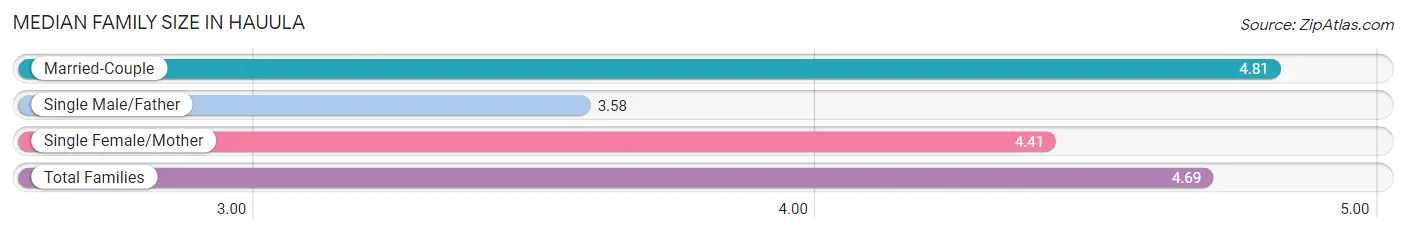
The median family size in Hauula is 4.69 persons per family, with married-couple families (520 | 82.8%) accounting for the largest median family size of 4.81 persons per family. On the other hand, single male/father families (40 | 6.4%) represent the smallest median family size with 3.58 persons per family.
| Family Type | # Families | Family Size |
| Married-Couple | 520 (82.8%) | 4.81 |
| Single Male/Father | 40 (6.4%) | 3.58 |
| Single Female/Mother | 68 (10.8%) | 4.41 |
| Total Families | 628 (100.0%) | 4.69 |
Median Household Size in Hauula
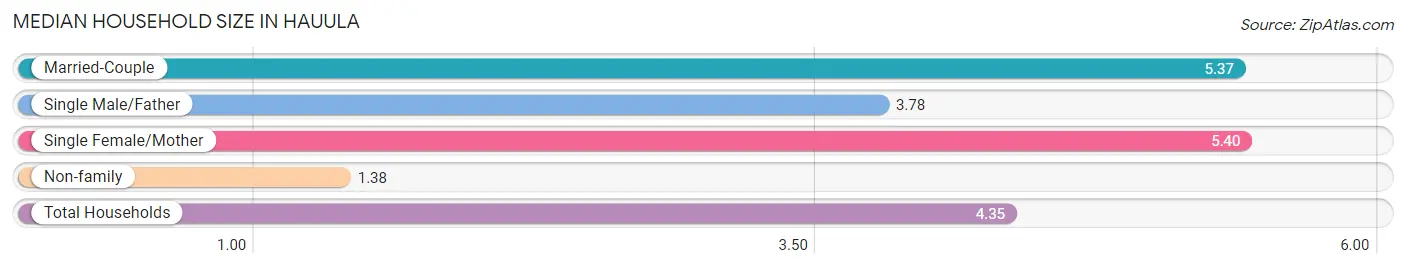
The median household size in Hauula is 4.35 persons per household, with single female/mother households (68 | 8.3%) accounting for the largest median household size of 5.4 persons per household. non-family households (194 | 23.6%) represent the smallest median household size with 1.38 persons per household.
| Household Type | # Households | Household Size |
| Married-Couple | 520 (63.3%) | 5.37 |
| Single Male/Father | 40 (4.9%) | 3.78 |
| Single Female/Mother | 68 (8.3%) | 5.40 |
| Non-family | 194 (23.6%) | 1.38 |
| Total Households | 822 (100.0%) | 4.35 |
Household Size by Marriage Status in Hauula
Out of a total of 822 households in Hauula, 628 (76.4%) are family households, while 194 (23.6%) are nonfamily households. The most numerous type of family households are 2-person households, comprising 122, and the most common type of nonfamily households are 1-person households, comprising 154.
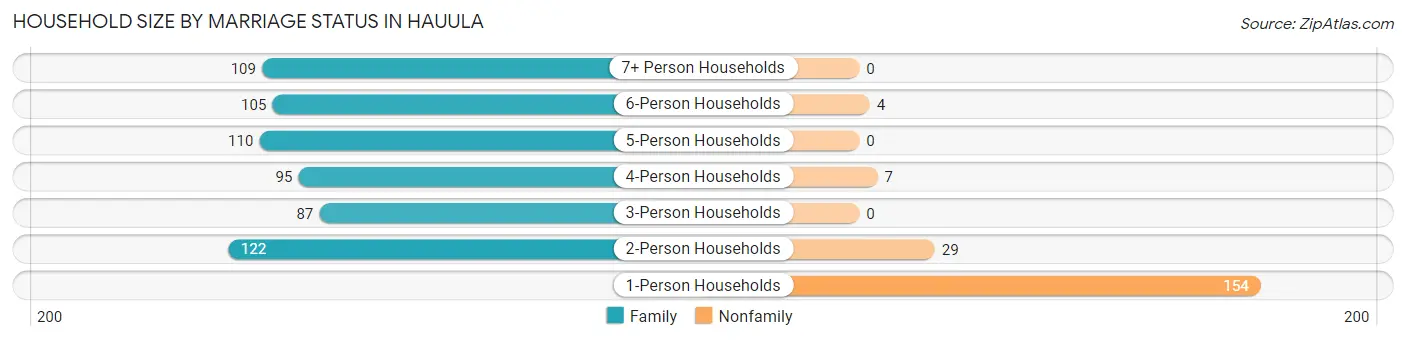
| Household Size | Family Households | Nonfamily Households |
| 1-Person Households | - | 154 (18.7%) |
| 2-Person Households | 122 (14.8%) | 29 (3.5%) |
| 3-Person Households | 87 (10.6%) | 0 (0.0%) |
| 4-Person Households | 95 (11.6%) | 7 (0.9%) |
| 5-Person Households | 110 (13.4%) | 0 (0.0%) |
| 6-Person Households | 105 (12.8%) | 4 (0.5%) |
| 7+ Person Households | 109 (13.3%) | 0 (0.0%) |
| Total | 628 (76.4%) | 194 (23.6%) |
Female Fertility in Hauula
Fertility by Age in Hauula
Average fertility rate in Hauula is 45.0 births per 1,000 women. Women in the age bracket of 20 to 34 years have the highest fertility rate with 59.0 births per 1,000 women. Women in the age bracket of 20 to 34 years acount for 54.8% of all women with births.
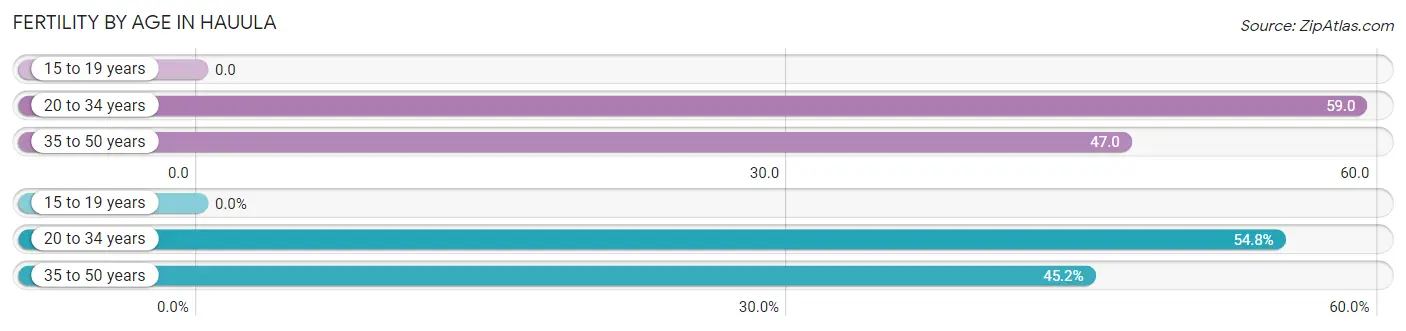
| Age Bracket | Women with Births | Births / 1,000 Women |
| 15 to 19 years | 0 (0.0%) | 0.0 |
| 20 to 34 years | 17 (54.8%) | 59.0 |
| 35 to 50 years | 14 (45.2%) | 47.0 |
| Total | 31 (100.0%) | 45.0 |
Fertility by Age by Marriage Status in Hauula
77.4% of women with births (31) in Hauula are married. The highest percentage of unmarried women with births falls into 35 to 50 years age bracket with 50.0% of them unmarried at the time of birth, while the lowest percentage of unmarried women with births belong to 20 to 34 years age bracket with 0.0% of them unmarried.
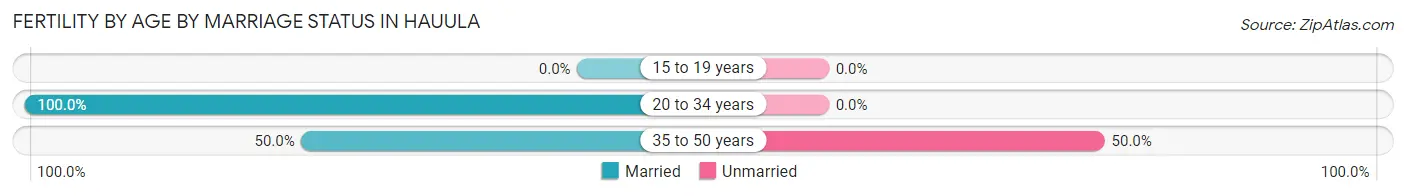
| Age Bracket | Married | Unmarried |
| 15 to 19 years | 0 (0.0%) | 0 (0.0%) |
| 20 to 34 years | 17 (100.0%) | 0 (0.0%) |
| 35 to 50 years | 7 (50.0%) | 7 (50.0%) |
| Total | 24 (77.4%) | 7 (22.6%) |
Fertility by Education in Hauula
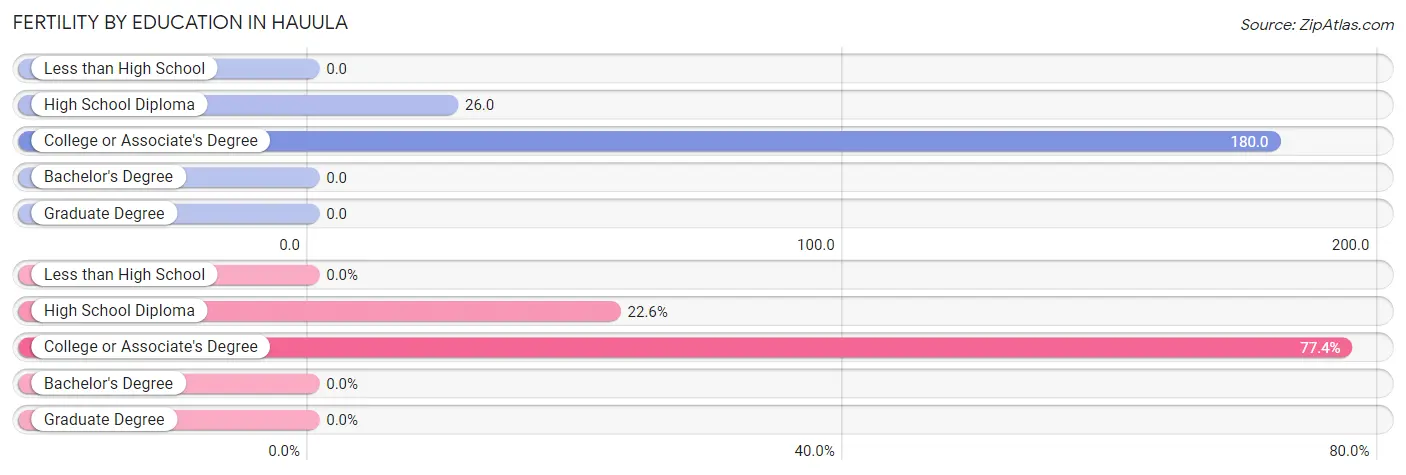
| Educational Attainment | Women with Births | Births / 1,000 Women |
| Less than High School | 0 (0.0%) | 0.0 |
| High School Diploma | 7 (22.6%) | 26.0 |
| College or Associate's Degree | 24 (77.4%) | 180.0 |
| Bachelor's Degree | 0 (0.0%) | 0.0 |
| Graduate Degree | 0 (0.0%) | 0.0 |
| Total | 31 (100.0%) | 45.0 |
Fertility by Education by Marriage Status in Hauula
22.6% of women with births in Hauula are unmarried. Women with the educational attainment of college or associate's degree are most likely to be married with 100.0% of them married at childbirth, while women with the educational attainment of high school diploma are least likely to be married with 100.0% of them unmarried at childbirth.
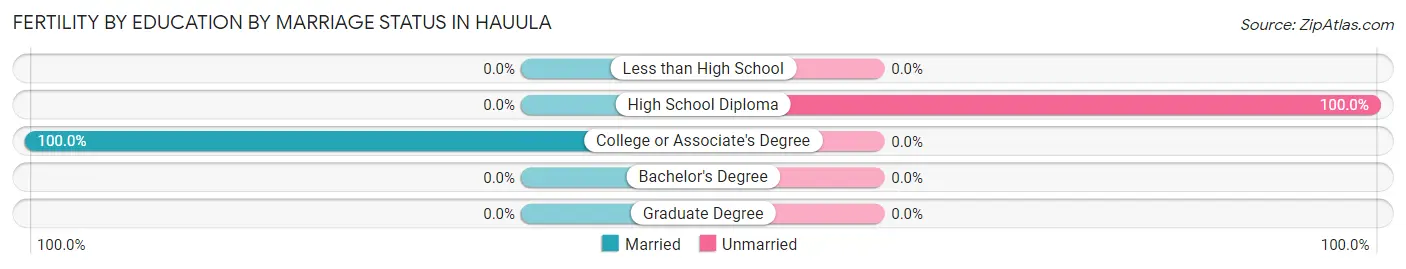
| Educational Attainment | Married | Unmarried |
| Less than High School | 0 (0.0%) | 0 (0.0%) |
| High School Diploma | 0 (0.0%) | 7 (100.0%) |
| College or Associate's Degree | 24 (100.0%) | 0 (0.0%) |
| Bachelor's Degree | 0 (0.0%) | 0 (0.0%) |
| Graduate Degree | 0 (0.0%) | 0 (0.0%) |
| Total | 24 (77.4%) | 7 (22.6%) |
Employment Characteristics in Hauula
Employment by Class of Employer in Hauula
Among the 1,419 employed individuals in Hauula, private company employees (806 | 56.8%), self-employed (not incorporated) (141 | 9.9%), and not-for-profit organizations (129 | 9.1%) make up the most common classes of employment.
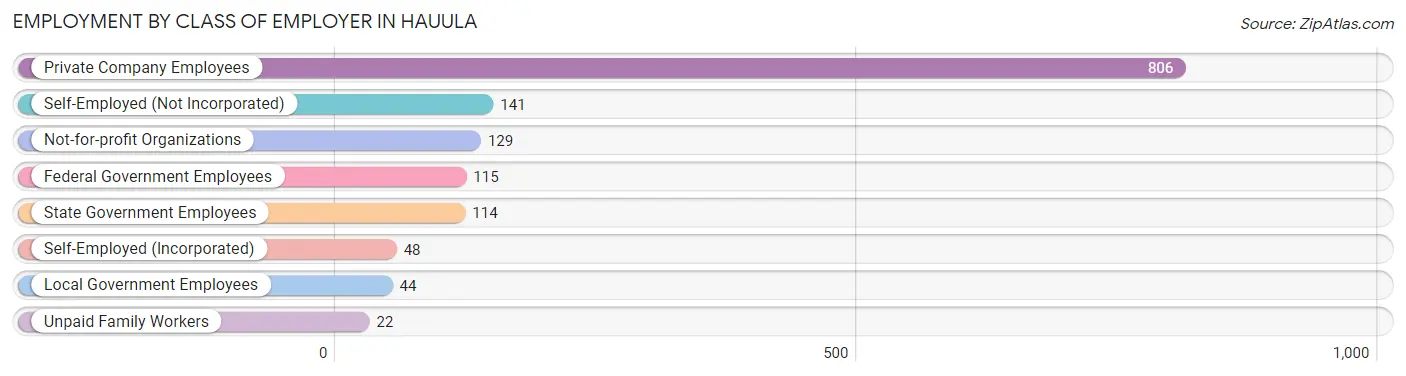
| Employer Class | # Employees | % Employees |
| Private Company Employees | 806 | 56.8% |
| Self-Employed (Incorporated) | 48 | 3.4% |
| Self-Employed (Not Incorporated) | 141 | 9.9% |
| Not-for-profit Organizations | 129 | 9.1% |
| Local Government Employees | 44 | 3.1% |
| State Government Employees | 114 | 8.0% |
| Federal Government Employees | 115 | 8.1% |
| Unpaid Family Workers | 22 | 1.5% |
| Total | 1,419 | 100.0% |
Employment Status by Age in Hauula
According to the labor force statistics for Hauula, out of the total population over 16 years of age (2,484), 64.9% or 1,612 individuals are in the labor force, with 6.9% or 111 of them unemployed. The age group with the highest labor force participation rate is 25 to 29 years, with 86.1% or 179 individuals in the labor force. Within the labor force, the 20 to 24 years age range has the highest percentage of unemployed individuals, with 40.4% or 75 of them being unemployed.
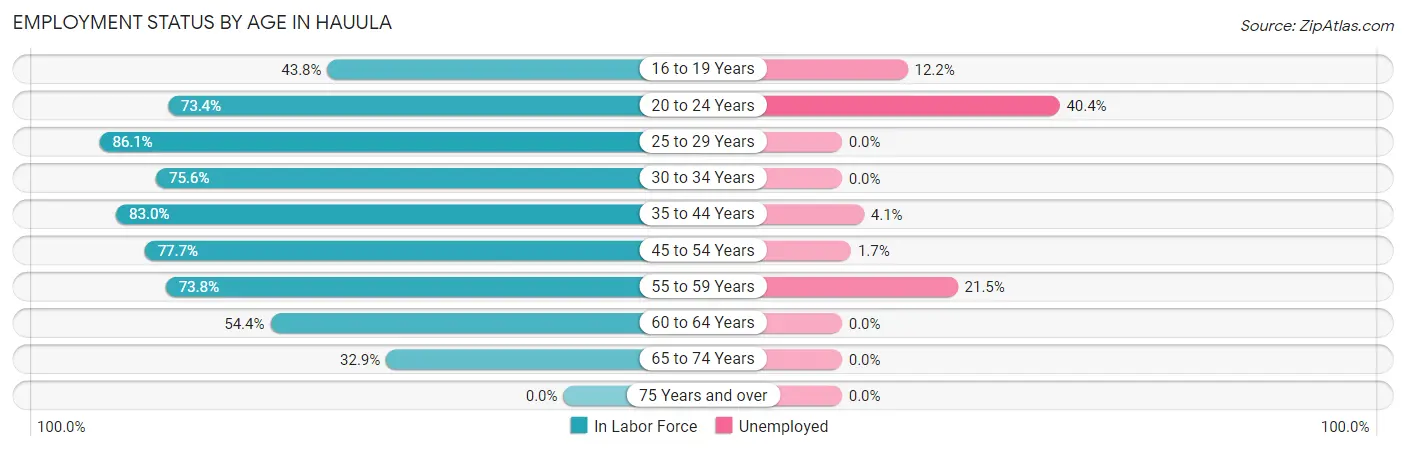
| Age Bracket | In Labor Force | Unemployed |
| 16 to 19 Years | 74 (43.8%) | 9 (12.2%) |
| 20 to 24 Years | 185 (73.4%) | 75 (40.4%) |
| 25 to 29 Years | 179 (86.1%) | 0 (0.0%) |
| 30 to 34 Years | 205 (75.6%) | 0 (0.0%) |
| 35 to 44 Years | 370 (83.0%) | 15 (4.1%) |
| 45 to 54 Years | 355 (77.7%) | 6 (1.7%) |
| 55 to 59 Years | 79 (73.8%) | 17 (21.5%) |
| 60 to 64 Years | 87 (54.4%) | 0 (0.0%) |
| 65 to 74 Years | 78 (32.9%) | 0 (0.0%) |
| 75 Years and over | 0 (0.0%) | 0 (0.0%) |
| Total | 1,612 (64.9%) | 111 (6.9%) |
Employment Status by Educational Attainment in Hauula
According to labor force statistics for Hauula, 77.3% of individuals (1,275) out of the total population between 25 and 64 years of age (1,649) are in the labor force, with 3.0% or 38 of them being unemployed. The group with the highest labor force participation rate are those with the educational attainment of bachelor's degree or higher, with 85.5% or 495 individuals in the labor force. Within the labor force, individuals with high school diploma education have the highest percentage of unemployment, with 5.3% or 27 of them being unemployed.
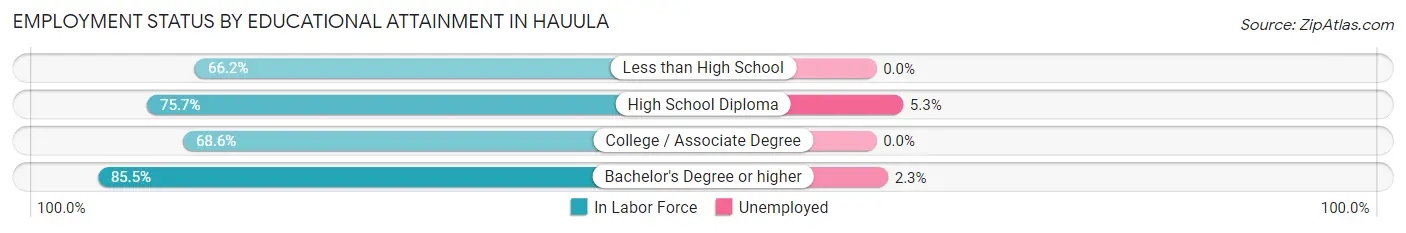
| Educational Attainment | In Labor Force | Unemployed |
| Less than High School | 49 (66.2%) | 0 (0.0%) |
| High School Diploma | 510 (75.7%) | 36 (5.3%) |
| College / Associate Degree | 221 (68.6%) | 0 (0.0%) |
| Bachelor's Degree or higher | 495 (85.5%) | 13 (2.3%) |
| Total | 1,275 (77.3%) | 49 (3.0%) |
Employment Occupations by Sex in Hauula
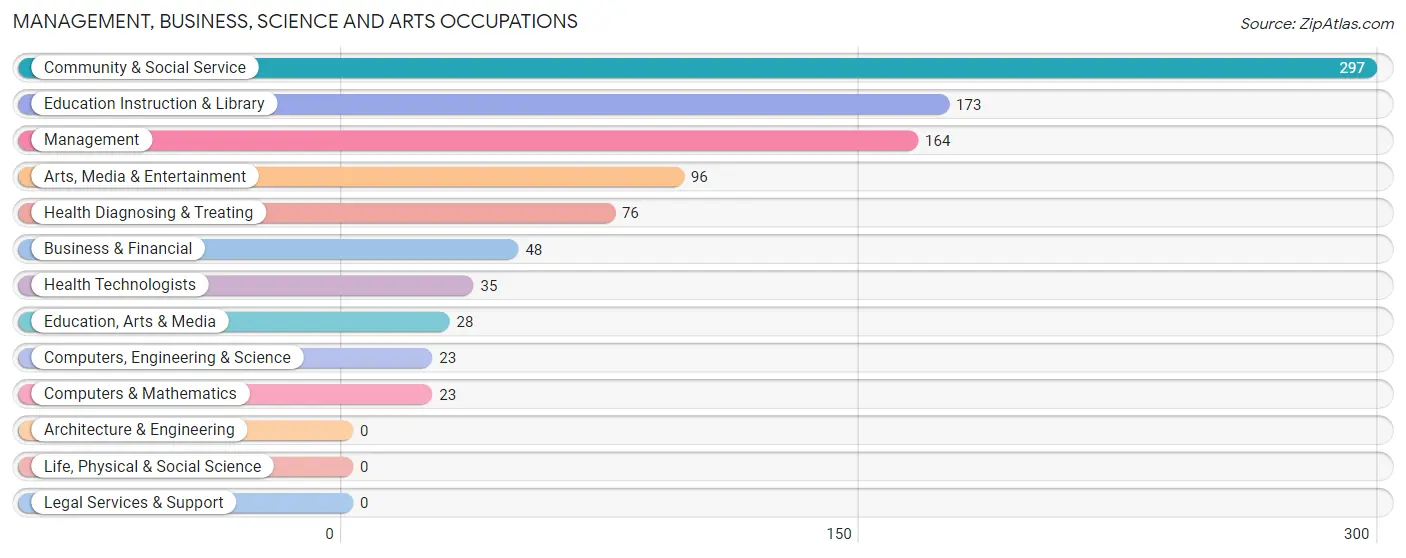
Management, Business, Science and Arts Occupations
The most common Management, Business, Science and Arts occupations in Hauula are Community & Social Service (297 | 20.4%), Education Instruction & Library (173 | 11.9%), Management (164 | 11.3%), Arts, Media & Entertainment (96 | 6.6%), and Health Diagnosing & Treating (76 | 5.2%).
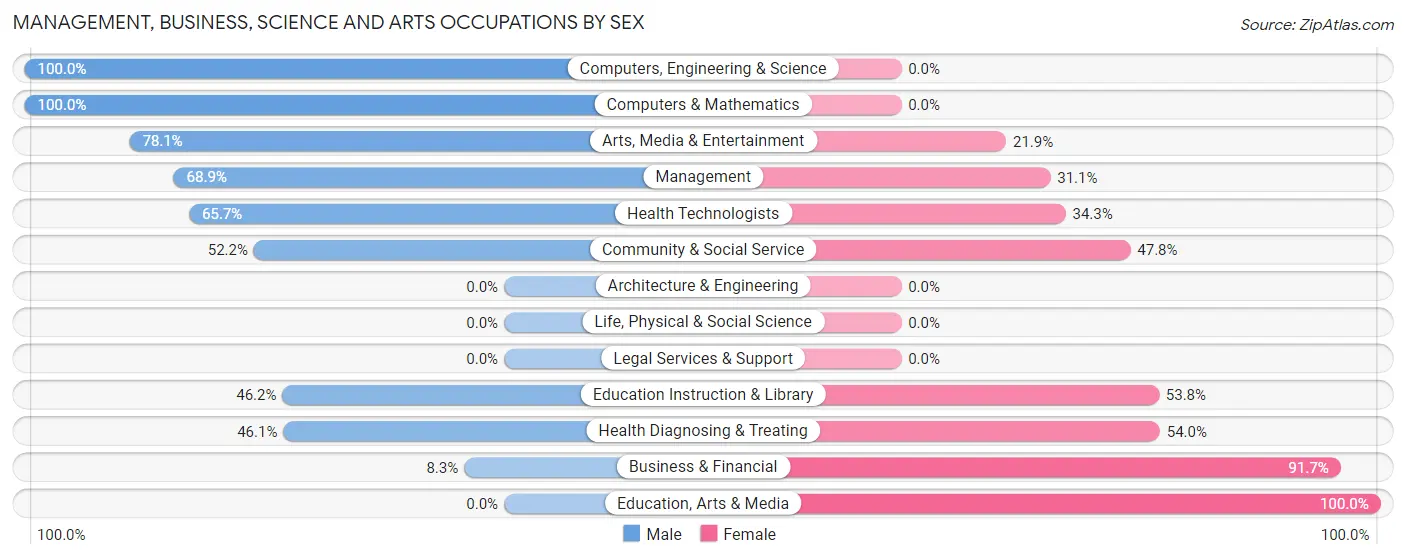
Management, Business, Science and Arts Occupations by Sex
Within the Management, Business, Science and Arts occupations in Hauula, the most male-oriented occupations are Computers, Engineering & Science (100.0%), Computers & Mathematics (100.0%), and Arts, Media & Entertainment (78.1%), while the most female-oriented occupations are Education, Arts & Media (100.0%), Business & Financial (91.7%), and Health Diagnosing & Treating (53.9%).
| Occupation | Male | Female |
| Management | 113 (68.9%) | 51 (31.1%) |
| Business & Financial | 4 (8.3%) | 44 (91.7%) |
| Computers, Engineering & Science | 23 (100.0%) | 0 (0.0%) |
| Computers & Mathematics | 23 (100.0%) | 0 (0.0%) |
| Architecture & Engineering | 0 (0.0%) | 0 (0.0%) |
| Life, Physical & Social Science | 0 (0.0%) | 0 (0.0%) |
| Community & Social Service | 155 (52.2%) | 142 (47.8%) |
| Education, Arts & Media | 0 (0.0%) | 28 (100.0%) |
| Legal Services & Support | 0 (0.0%) | 0 (0.0%) |
| Education Instruction & Library | 80 (46.2%) | 93 (53.8%) |
| Arts, Media & Entertainment | 75 (78.1%) | 21 (21.9%) |
| Health Diagnosing & Treating | 35 (46.1%) | 41 (53.9%) |
| Health Technologists | 23 (65.7%) | 12 (34.3%) |
| Total (Category) | 330 (54.3%) | 278 (45.7%) |
| Total (Overall) | 842 (58.0%) | 610 (42.0%) |
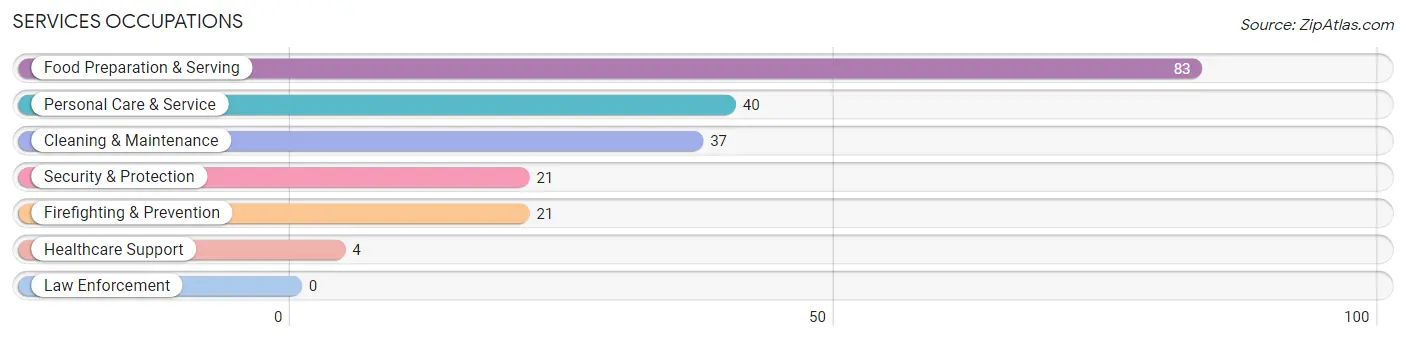
Services Occupations
The most common Services occupations in Hauula are Food Preparation & Serving (83 | 5.7%), Personal Care & Service (40 | 2.8%), Cleaning & Maintenance (37 | 2.5%), Security & Protection (21 | 1.5%), and Firefighting & Prevention (21 | 1.5%).
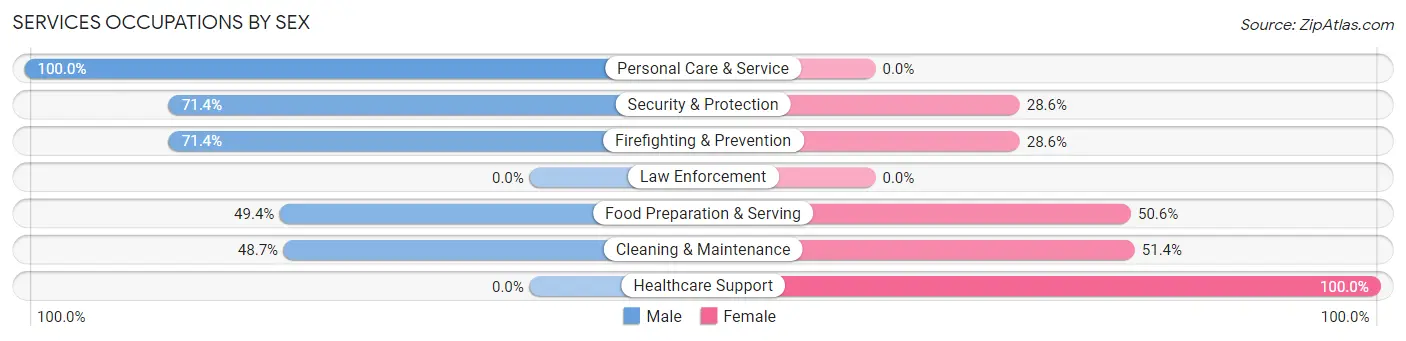
Services Occupations by Sex
Within the Services occupations in Hauula, the most male-oriented occupations are Personal Care & Service (100.0%), Security & Protection (71.4%), and Firefighting & Prevention (71.4%), while the most female-oriented occupations are Healthcare Support (100.0%), Cleaning & Maintenance (51.3%), and Food Preparation & Serving (50.6%).
| Occupation | Male | Female |
| Healthcare Support | 0 (0.0%) | 4 (100.0%) |
| Security & Protection | 15 (71.4%) | 6 (28.6%) |
| Firefighting & Prevention | 15 (71.4%) | 6 (28.6%) |
| Law Enforcement | 0 (0.0%) | 0 (0.0%) |
| Food Preparation & Serving | 41 (49.4%) | 42 (50.6%) |
| Cleaning & Maintenance | 18 (48.6%) | 19 (51.3%) |
| Personal Care & Service | 40 (100.0%) | 0 (0.0%) |
| Total (Category) | 114 (61.6%) | 71 (38.4%) |
| Total (Overall) | 842 (58.0%) | 610 (42.0%) |
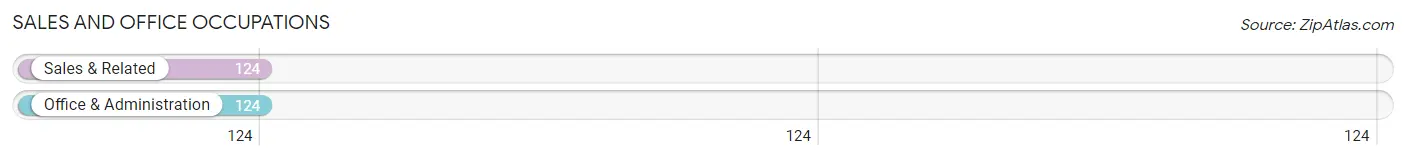
Sales and Office Occupations
The most common Sales and Office occupations in Hauula are Sales & Related (124 | 8.5%), and Office & Administration (124 | 8.5%).
Sales and Office Occupations by Sex
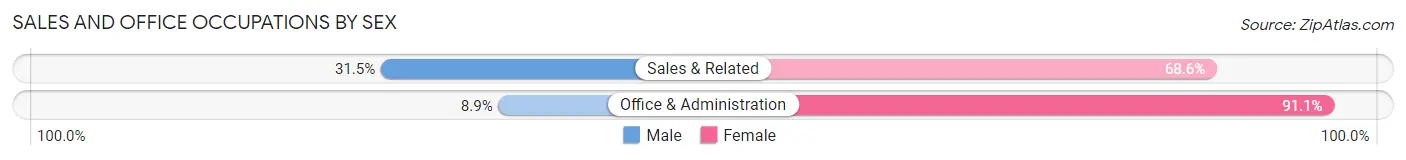
| Occupation | Male | Female |
| Sales & Related | 39 (31.5%) | 85 (68.5%) |
| Office & Administration | 11 (8.9%) | 113 (91.1%) |
| Total (Category) | 50 (20.2%) | 198 (79.8%) |
| Total (Overall) | 842 (58.0%) | 610 (42.0%) |
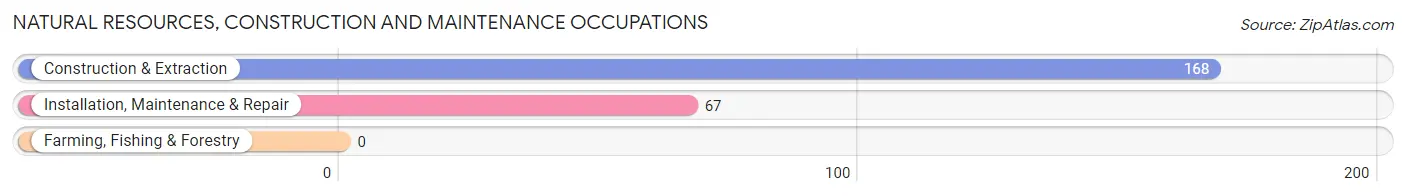
Natural Resources, Construction and Maintenance Occupations
The most common Natural Resources, Construction and Maintenance occupations in Hauula are Construction & Extraction (168 | 11.6%), and Installation, Maintenance & Repair (67 | 4.6%).
Natural Resources, Construction and Maintenance Occupations by Sex
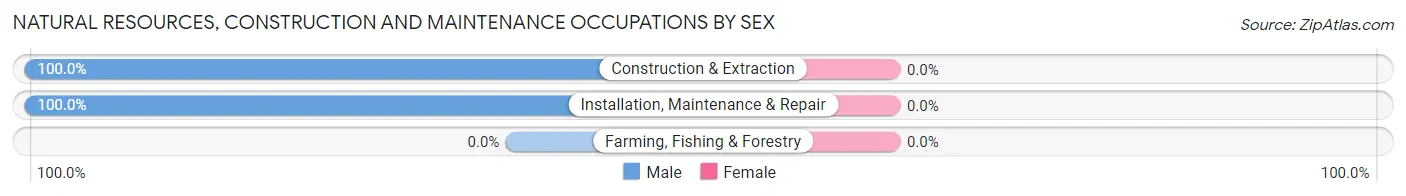
| Occupation | Male | Female |
| Farming, Fishing & Forestry | 0 (0.0%) | 0 (0.0%) |
| Construction & Extraction | 168 (100.0%) | 0 (0.0%) |
| Installation, Maintenance & Repair | 67 (100.0%) | 0 (0.0%) |
| Total (Category) | 235 (100.0%) | 0 (0.0%) |
| Total (Overall) | 842 (58.0%) | 610 (42.0%) |
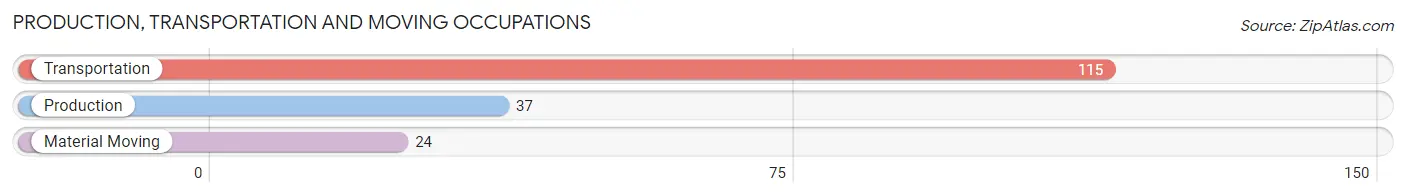
Production, Transportation and Moving Occupations
The most common Production, Transportation and Moving occupations in Hauula are Transportation (115 | 7.9%), Production (37 | 2.5%), and Material Moving (24 | 1.7%).
Production, Transportation and Moving Occupations by Sex
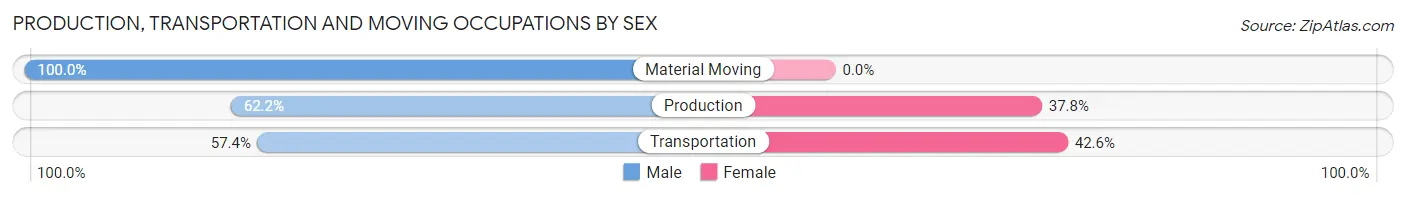
| Occupation | Male | Female |
| Production | 23 (62.2%) | 14 (37.8%) |
| Transportation | 66 (57.4%) | 49 (42.6%) |
| Material Moving | 24 (100.0%) | 0 (0.0%) |
| Total (Category) | 113 (64.2%) | 63 (35.8%) |
| Total (Overall) | 842 (58.0%) | 610 (42.0%) |
Employment Industries by Sex in Hauula
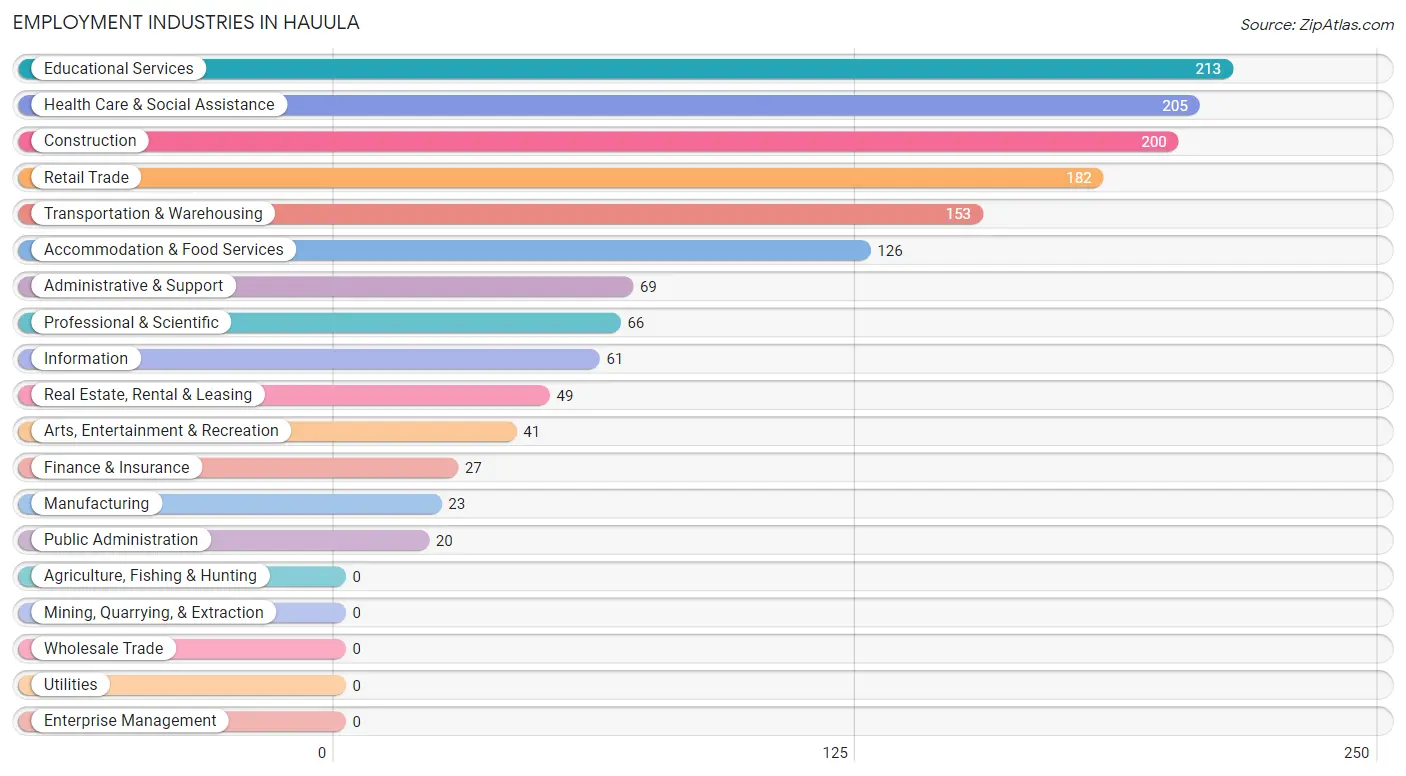
Employment Industries in Hauula
The major employment industries in Hauula include Educational Services (213 | 14.7%), Health Care & Social Assistance (205 | 14.1%), Construction (200 | 13.8%), Retail Trade (182 | 12.5%), and Transportation & Warehousing (153 | 10.5%).
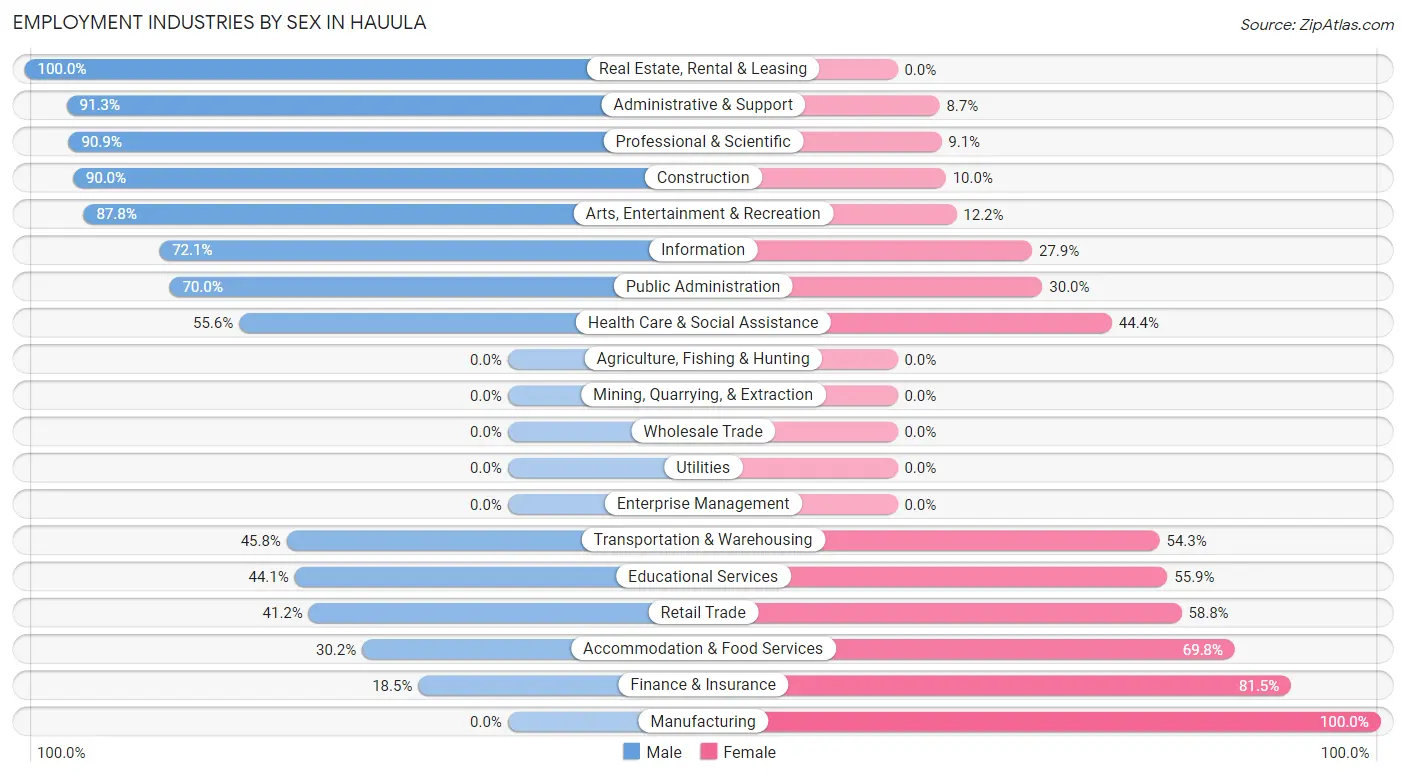
Employment Industries by Sex in Hauula
The Hauula industries that see more men than women are Real Estate, Rental & Leasing (100.0%), Administrative & Support (91.3%), and Professional & Scientific (90.9%), whereas the industries that tend to have a higher number of women are Manufacturing (100.0%), Finance & Insurance (81.5%), and Accommodation & Food Services (69.8%).
| Industry | Male | Female |
| Agriculture, Fishing & Hunting | 0 (0.0%) | 0 (0.0%) |
| Mining, Quarrying, & Extraction | 0 (0.0%) | 0 (0.0%) |
| Construction | 180 (90.0%) | 20 (10.0%) |
| Manufacturing | 0 (0.0%) | 23 (100.0%) |
| Wholesale Trade | 0 (0.0%) | 0 (0.0%) |
| Retail Trade | 75 (41.2%) | 107 (58.8%) |
| Transportation & Warehousing | 70 (45.8%) | 83 (54.2%) |
| Utilities | 0 (0.0%) | 0 (0.0%) |
| Information | 44 (72.1%) | 17 (27.9%) |
| Finance & Insurance | 5 (18.5%) | 22 (81.5%) |
| Real Estate, Rental & Leasing | 49 (100.0%) | 0 (0.0%) |
| Professional & Scientific | 60 (90.9%) | 6 (9.1%) |
| Enterprise Management | 0 (0.0%) | 0 (0.0%) |
| Administrative & Support | 63 (91.3%) | 6 (8.7%) |
| Educational Services | 94 (44.1%) | 119 (55.9%) |
| Health Care & Social Assistance | 114 (55.6%) | 91 (44.4%) |
| Arts, Entertainment & Recreation | 36 (87.8%) | 5 (12.2%) |
| Accommodation & Food Services | 38 (30.2%) | 88 (69.8%) |
| Public Administration | 14 (70.0%) | 6 (30.0%) |
| Total | 842 (58.0%) | 610 (42.0%) |
Education in Hauula
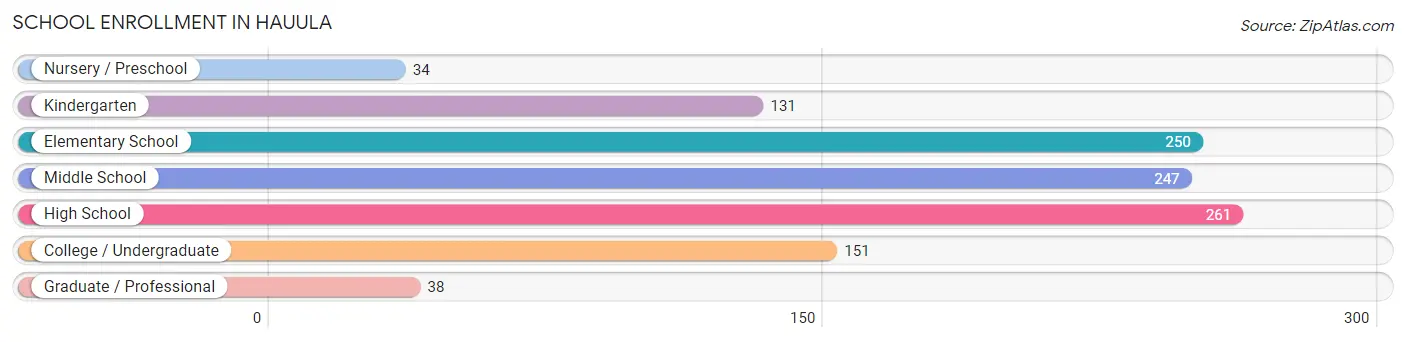
School Enrollment in Hauula
The most common levels of schooling among the 1,112 students in Hauula are high school (261 | 23.5%), elementary school (250 | 22.5%), and middle school (247 | 22.2%).
| School Level | # Students | % Students |
| Nursery / Preschool | 34 | 3.1% |
| Kindergarten | 131 | 11.8% |
| Elementary School | 250 | 22.5% |
| Middle School | 247 | 22.2% |
| High School | 261 | 23.5% |
| College / Undergraduate | 151 | 13.6% |
| Graduate / Professional | 38 | 3.4% |
| Total | 1,112 | 100.0% |
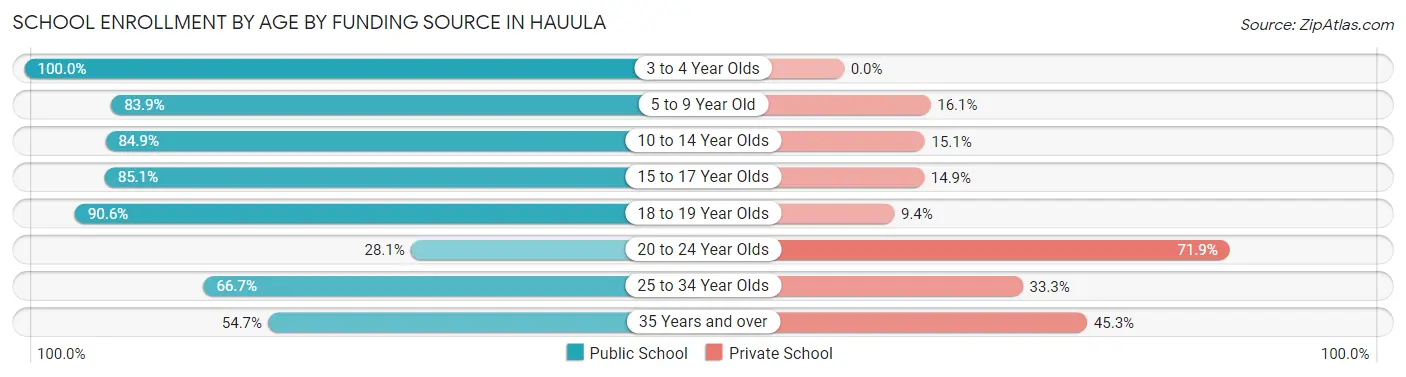
School Enrollment by Age by Funding Source in Hauula
Out of a total of 1,112 students who are enrolled in schools in Hauula, 230 (20.7%) attend a private institution, while the remaining 882 (79.3%) are enrolled in public schools. The age group of 20 to 24 year olds has the highest likelihood of being enrolled in private schools, with 46 (71.9% in the age bracket) enrolled. Conversely, the age group of 3 to 4 year olds has the lowest likelihood of being enrolled in a private school, with 6 (100.0% in the age bracket) attending a public institution.
| Age Bracket | Public School | Private School |
| 3 to 4 Year Olds | 6 (100.0%) | 0 (0.0%) |
| 5 to 9 Year Old | 343 (83.9%) | 66 (16.1%) |
| 10 to 14 Year Olds | 248 (84.9%) | 44 (15.1%) |
| 15 to 17 Year Olds | 148 (85.1%) | 26 (14.9%) |
| 18 to 19 Year Olds | 58 (90.6%) | 6 (9.4%) |
| 20 to 24 Year Olds | 18 (28.1%) | 46 (71.9%) |
| 25 to 34 Year Olds | 26 (66.7%) | 13 (33.3%) |
| 35 Years and over | 35 (54.7%) | 29 (45.3%) |
| Total | 882 (79.3%) | 230 (20.7%) |
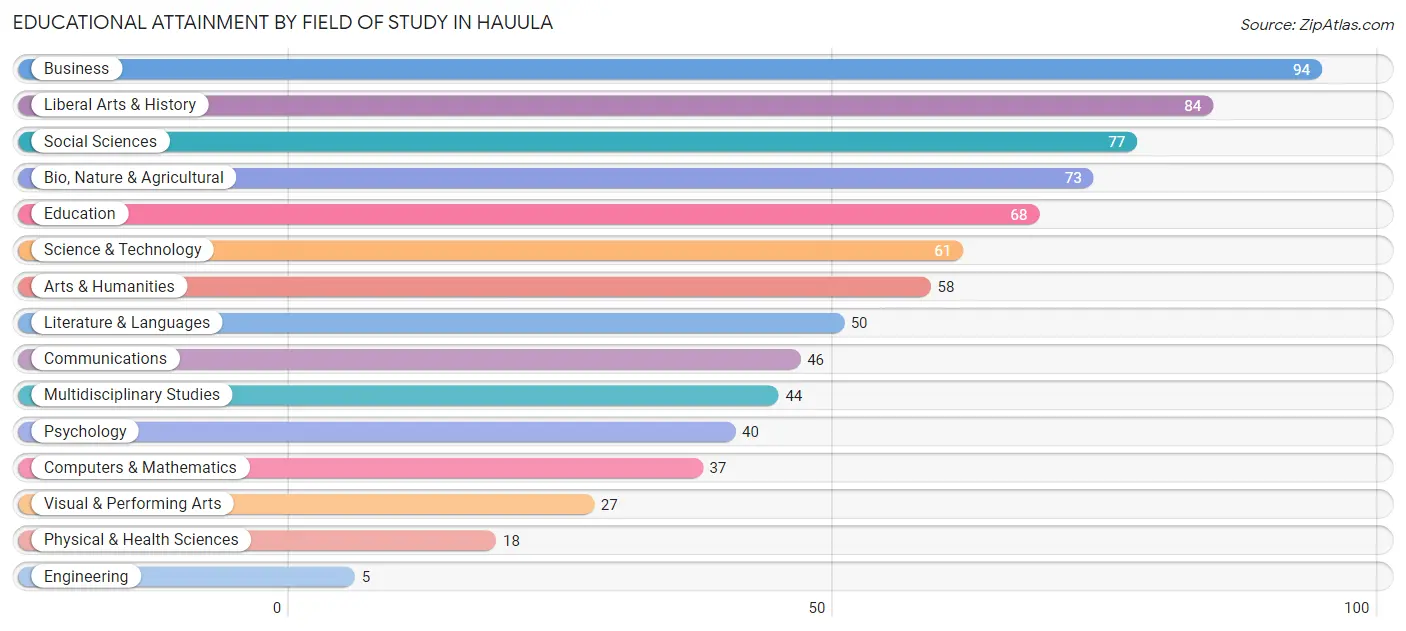
Educational Attainment by Field of Study in Hauula
Business (94 | 12.0%), liberal arts & history (84 | 10.7%), social sciences (77 | 9.9%), bio, nature & agricultural (73 | 9.3%), and education (68 | 8.7%) are the most common fields of study among 782 individuals in Hauula who have obtained a bachelor's degree or higher.
| Field of Study | # Graduates | % Graduates |
| Computers & Mathematics | 37 | 4.7% |
| Bio, Nature & Agricultural | 73 | 9.3% |
| Physical & Health Sciences | 18 | 2.3% |
| Psychology | 40 | 5.1% |
| Social Sciences | 77 | 9.9% |
| Engineering | 5 | 0.6% |
| Multidisciplinary Studies | 44 | 5.6% |
| Science & Technology | 61 | 7.8% |
| Business | 94 | 12.0% |
| Education | 68 | 8.7% |
| Literature & Languages | 50 | 6.4% |
| Liberal Arts & History | 84 | 10.7% |
| Visual & Performing Arts | 27 | 3.5% |
| Communications | 46 | 5.9% |
| Arts & Humanities | 58 | 7.4% |
| Total | 782 | 100.0% |
Transportation & Commute in Hauula
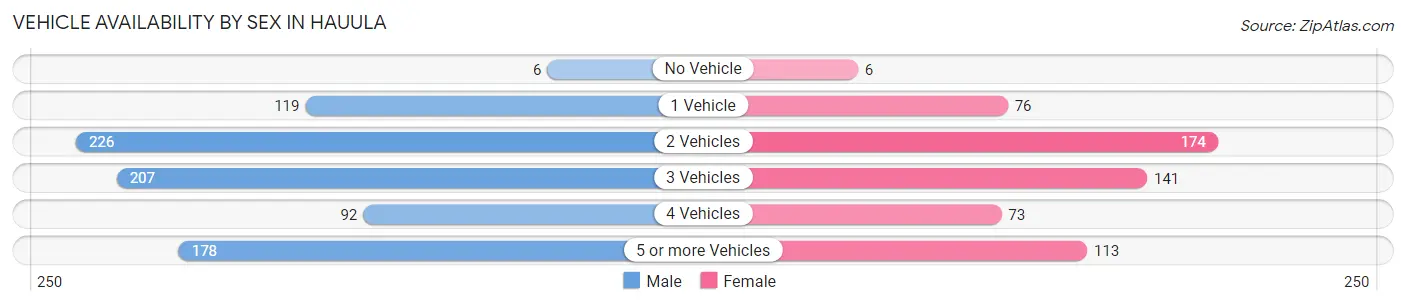
Vehicle Availability by Sex in Hauula
The most prevalent vehicle ownership categories in Hauula are males with 2 vehicles (226, accounting for 27.3%) and females with 2 vehicles (174, making up 38.8%).
| Vehicles Available | Male | Female |
| No Vehicle | 6 (0.7%) | 6 (1.0%) |
| 1 Vehicle | 119 (14.4%) | 76 (13.0%) |
| 2 Vehicles | 226 (27.3%) | 174 (29.8%) |
| 3 Vehicles | 207 (25.0%) | 141 (24.2%) |
| 4 Vehicles | 92 (11.1%) | 73 (12.5%) |
| 5 or more Vehicles | 178 (21.5%) | 113 (19.4%) |
| Total | 828 (100.0%) | 583 (100.0%) |
Commute Time in Hauula
The most frequently occuring commute durations in Hauula are 60 to 89 minutes (315 commuters, 24.2%), 45 to 59 minutes (164 commuters, 12.6%), and 5 to 9 minutes (159 commuters, 12.2%).
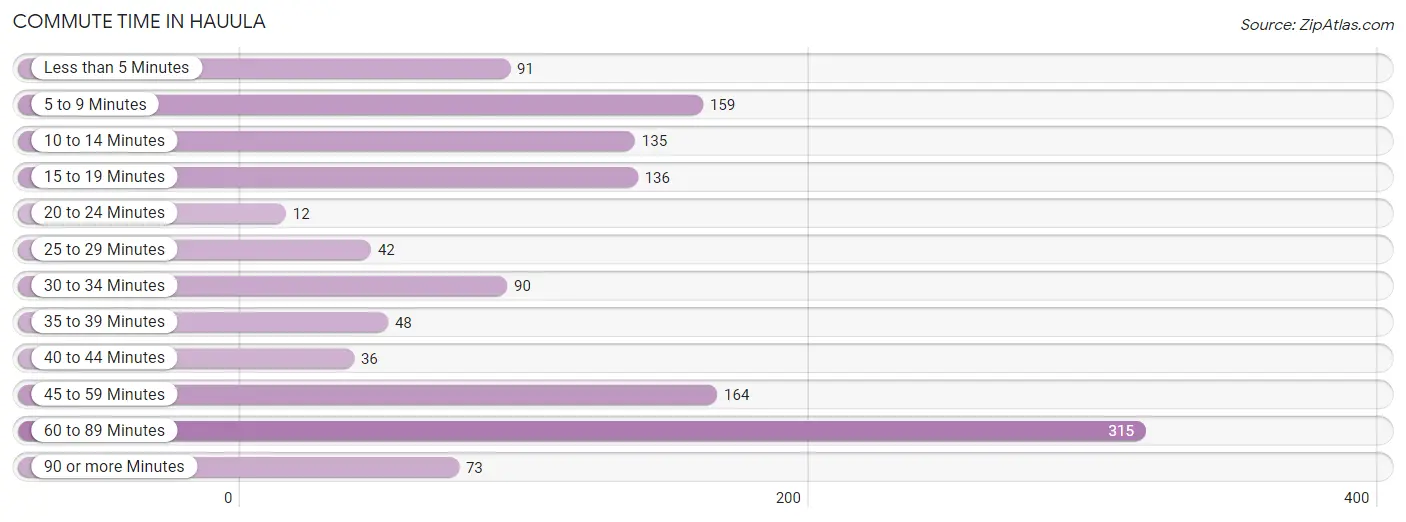
| Commute Time | # Commuters | % Commuters |
| Less than 5 Minutes | 91 | 7.0% |
| 5 to 9 Minutes | 159 | 12.2% |
| 10 to 14 Minutes | 135 | 10.4% |
| 15 to 19 Minutes | 136 | 10.4% |
| 20 to 24 Minutes | 12 | 0.9% |
| 25 to 29 Minutes | 42 | 3.2% |
| 30 to 34 Minutes | 90 | 6.9% |
| 35 to 39 Minutes | 48 | 3.7% |
| 40 to 44 Minutes | 36 | 2.8% |
| 45 to 59 Minutes | 164 | 12.6% |
| 60 to 89 Minutes | 315 | 24.2% |
| 90 or more Minutes | 73 | 5.6% |
Commute Time by Sex in Hauula
The most common commute times in Hauula are 60 to 89 minutes (228 commuters, 29.8%) for males and 5 to 9 minutes (89 commuters, 16.6%) for females.
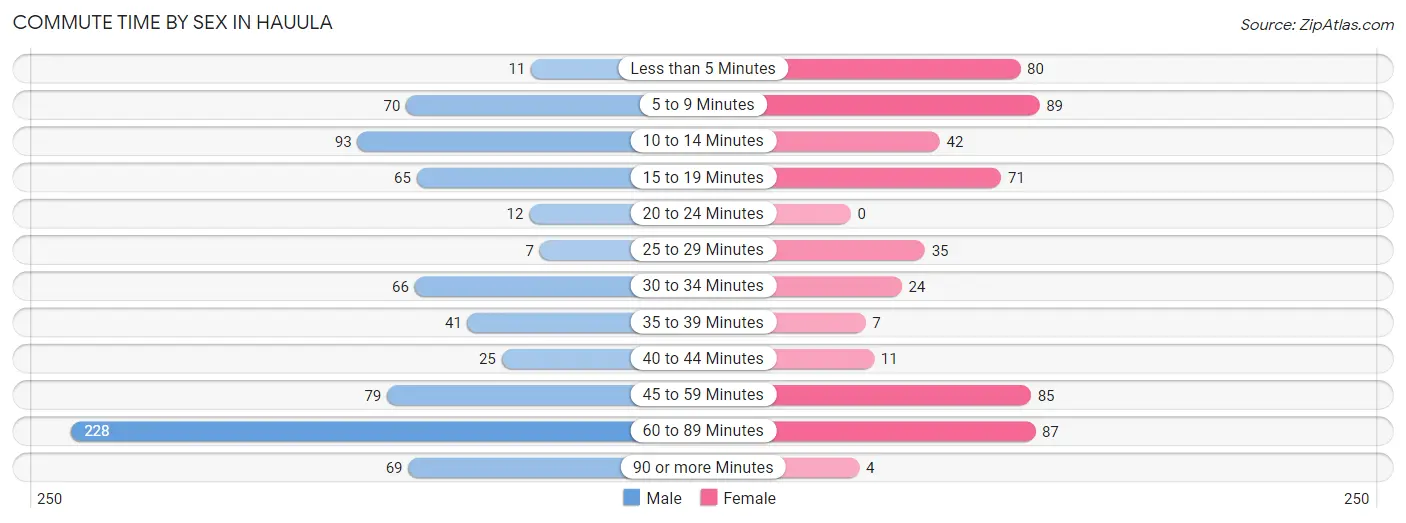
| Commute Time | Male | Female |
| Less than 5 Minutes | 11 (1.4%) | 80 (14.9%) |
| 5 to 9 Minutes | 70 (9.1%) | 89 (16.6%) |
| 10 to 14 Minutes | 93 (12.1%) | 42 (7.9%) |
| 15 to 19 Minutes | 65 (8.5%) | 71 (13.3%) |
| 20 to 24 Minutes | 12 (1.6%) | 0 (0.0%) |
| 25 to 29 Minutes | 7 (0.9%) | 35 (6.5%) |
| 30 to 34 Minutes | 66 (8.6%) | 24 (4.5%) |
| 35 to 39 Minutes | 41 (5.3%) | 7 (1.3%) |
| 40 to 44 Minutes | 25 (3.3%) | 11 (2.1%) |
| 45 to 59 Minutes | 79 (10.3%) | 85 (15.9%) |
| 60 to 89 Minutes | 228 (29.8%) | 87 (16.3%) |
| 90 or more Minutes | 69 (9.0%) | 4 (0.7%) |
Time of Departure to Work by Sex in Hauula
The most frequent times of departure to work in Hauula are 6:30 AM to 6:59 AM (110, 14.4%) for males and 6:30 AM to 6:59 AM (91, 17.0%) for females.
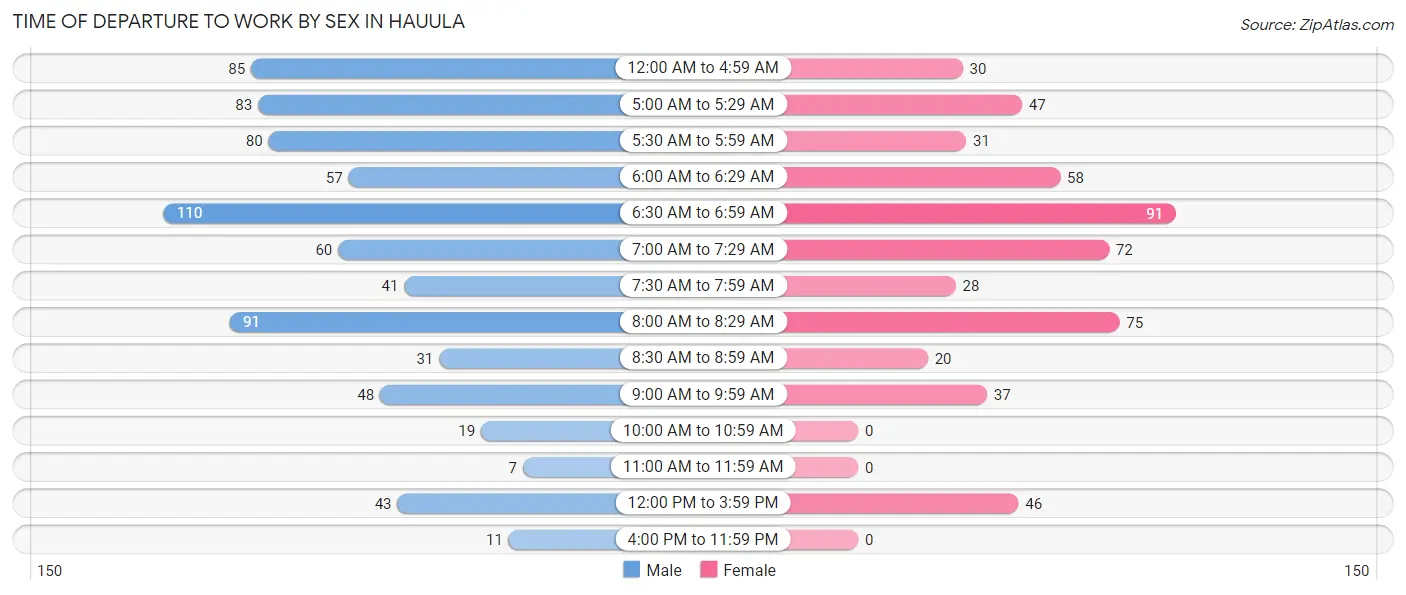
| Time of Departure | Male | Female |
| 12:00 AM to 4:59 AM | 85 (11.1%) | 30 (5.6%) |
| 5:00 AM to 5:29 AM | 83 (10.8%) | 47 (8.8%) |
| 5:30 AM to 5:59 AM | 80 (10.4%) | 31 (5.8%) |
| 6:00 AM to 6:29 AM | 57 (7.4%) | 58 (10.8%) |
| 6:30 AM to 6:59 AM | 110 (14.4%) | 91 (17.0%) |
| 7:00 AM to 7:29 AM | 60 (7.8%) | 72 (13.5%) |
| 7:30 AM to 7:59 AM | 41 (5.3%) | 28 (5.2%) |
| 8:00 AM to 8:29 AM | 91 (11.9%) | 75 (14.0%) |
| 8:30 AM to 8:59 AM | 31 (4.1%) | 20 (3.7%) |
| 9:00 AM to 9:59 AM | 48 (6.3%) | 37 (6.9%) |
| 10:00 AM to 10:59 AM | 19 (2.5%) | 0 (0.0%) |
| 11:00 AM to 11:59 AM | 7 (0.9%) | 0 (0.0%) |
| 12:00 PM to 3:59 PM | 43 (5.6%) | 46 (8.6%) |
| 4:00 PM to 11:59 PM | 11 (1.4%) | 0 (0.0%) |
| Total | 766 (100.0%) | 535 (100.0%) |
Housing Occupancy in Hauula
Occupancy by Ownership in Hauula
Of the total 822 dwellings in Hauula, owner-occupied units account for 467 (56.8%), while renter-occupied units make up 355 (43.2%).
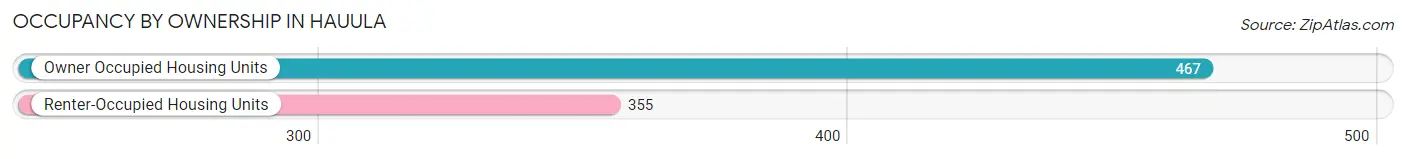
| Occupancy | # Housing Units | % Housing Units |
| Owner Occupied Housing Units | 467 | 56.8% |
| Renter-Occupied Housing Units | 355 | 43.2% |
| Total Occupied Housing Units | 822 | 100.0% |
Occupancy by Household Size in Hauula
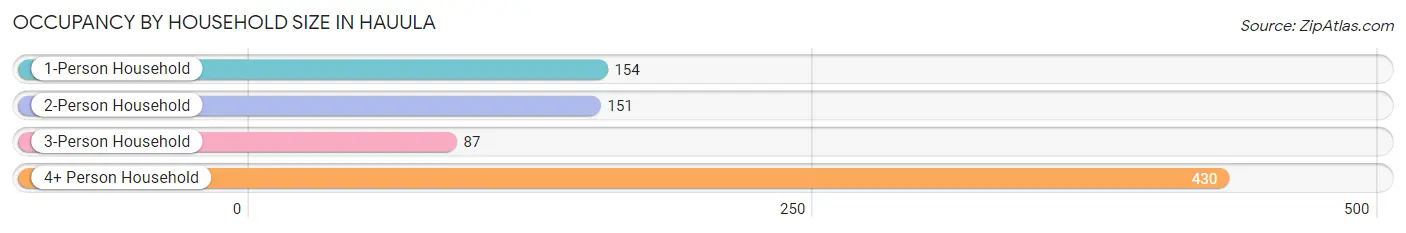
| Household Size | # Housing Units | % Housing Units |
| 1-Person Household | 154 | 18.7% |
| 2-Person Household | 151 | 18.4% |
| 3-Person Household | 87 | 10.6% |
| 4+ Person Household | 430 | 52.3% |
| Total Housing Units | 822 | 100.0% |
Occupancy by Ownership by Household Size in Hauula
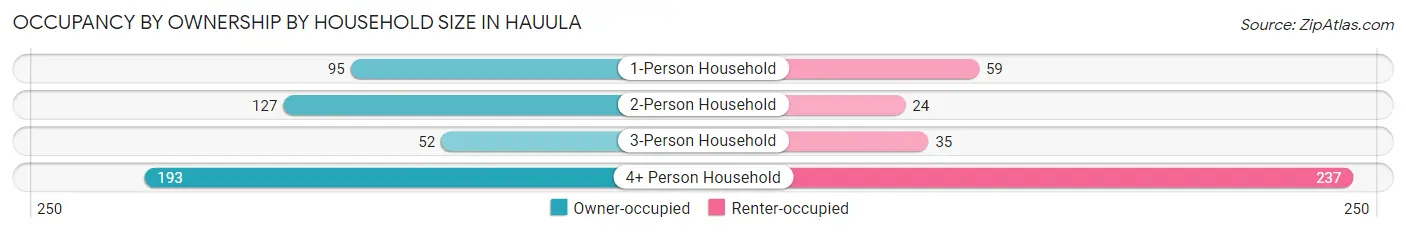
| Household Size | Owner-occupied | Renter-occupied |
| 1-Person Household | 95 (61.7%) | 59 (38.3%) |
| 2-Person Household | 127 (84.1%) | 24 (15.9%) |
| 3-Person Household | 52 (59.8%) | 35 (40.2%) |
| 4+ Person Household | 193 (44.9%) | 237 (55.1%) |
| Total Housing Units | 467 (56.8%) | 355 (43.2%) |
Occupancy by Educational Attainment in Hauula
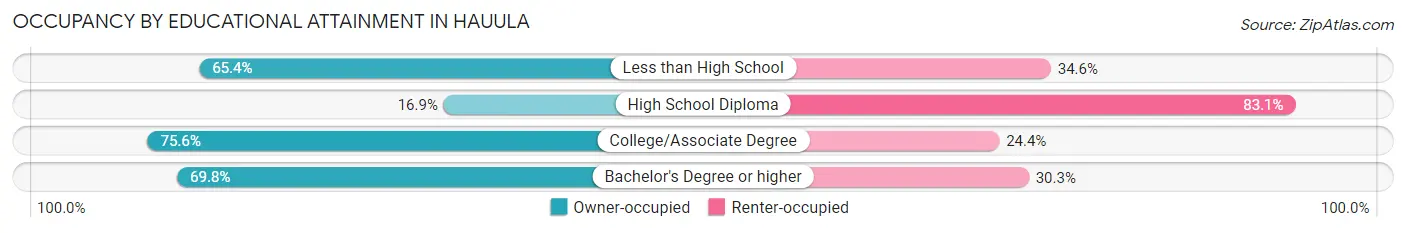
| Household Size | Owner-occupied | Renter-occupied |
| Less than High School | 51 (65.4%) | 27 (34.6%) |
| High School Diploma | 36 (16.9%) | 177 (83.1%) |
| College/Associate Degree | 124 (75.6%) | 40 (24.4%) |
| Bachelor's Degree or higher | 256 (69.8%) | 111 (30.2%) |
Occupancy by Age of Householder in Hauula
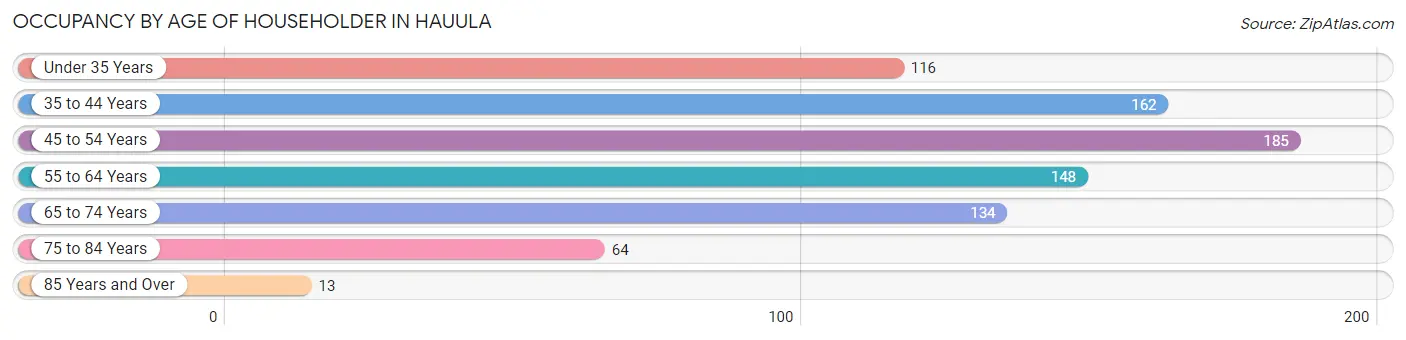
| Age Bracket | # Households | % Households |
| Under 35 Years | 116 | 14.1% |
| 35 to 44 Years | 162 | 19.7% |
| 45 to 54 Years | 185 | 22.5% |
| 55 to 64 Years | 148 | 18.0% |
| 65 to 74 Years | 134 | 16.3% |
| 75 to 84 Years | 64 | 7.8% |
| 85 Years and Over | 13 | 1.6% |
| Total | 822 | 100.0% |
Housing Finances in Hauula
Median Income by Occupancy in Hauula
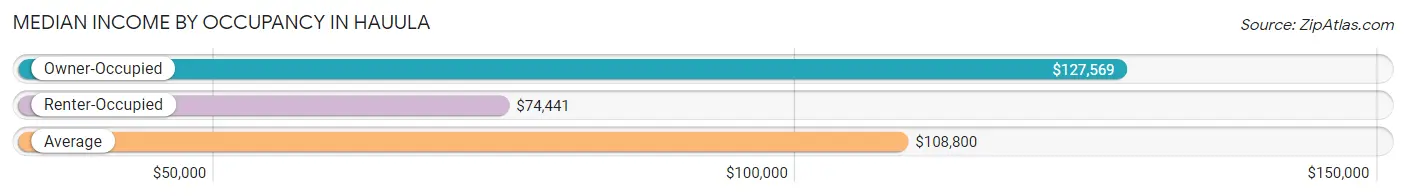
| Occupancy Type | # Households | Median Income |
| Owner-Occupied | 467 (56.8%) | $127,569 |
| Renter-Occupied | 355 (43.2%) | $74,441 |
| Average | 822 (100.0%) | $108,800 |
Occupancy by Householder Income Bracket in Hauula
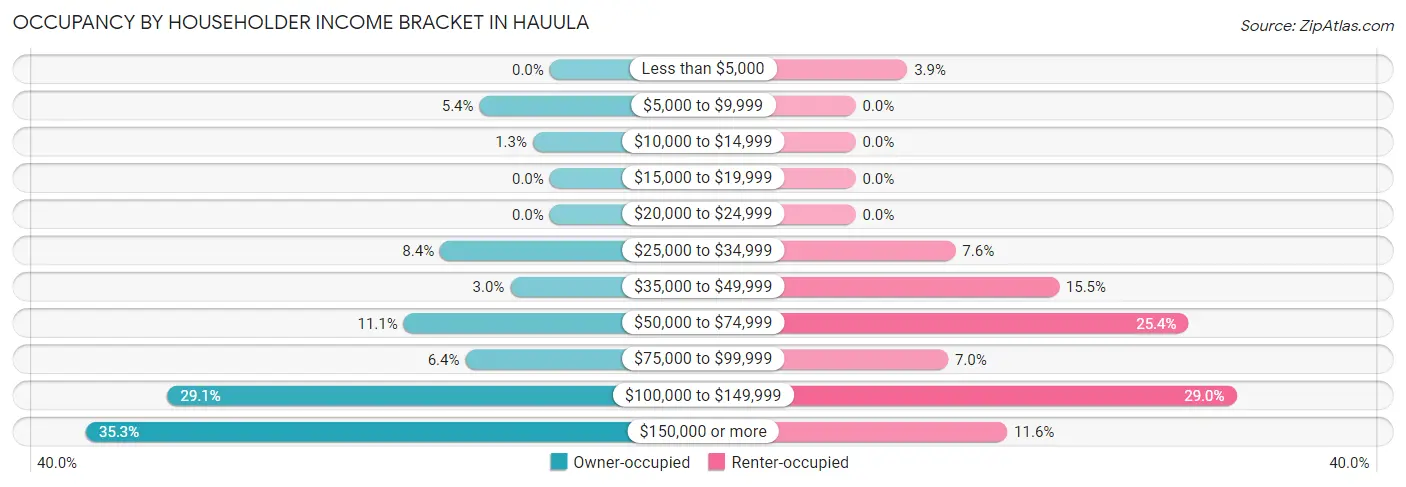
| Income Bracket | Owner-occupied | Renter-occupied |
| Less than $5,000 | 0 (0.0%) | 14 (3.9%) |
| $5,000 to $9,999 | 25 (5.3%) | 0 (0.0%) |
| $10,000 to $14,999 | 6 (1.3%) | 0 (0.0%) |
| $15,000 to $19,999 | 0 (0.0%) | 0 (0.0%) |
| $20,000 to $24,999 | 0 (0.0%) | 0 (0.0%) |
| $25,000 to $34,999 | 39 (8.4%) | 27 (7.6%) |
| $35,000 to $49,999 | 14 (3.0%) | 55 (15.5%) |
| $50,000 to $74,999 | 52 (11.1%) | 90 (25.4%) |
| $75,000 to $99,999 | 30 (6.4%) | 25 (7.0%) |
| $100,000 to $149,999 | 136 (29.1%) | 103 (29.0%) |
| $150,000 or more | 165 (35.3%) | 41 (11.6%) |
| Total | 467 (100.0%) | 355 (100.0%) |
Monthly Housing Cost Tiers in Hauula
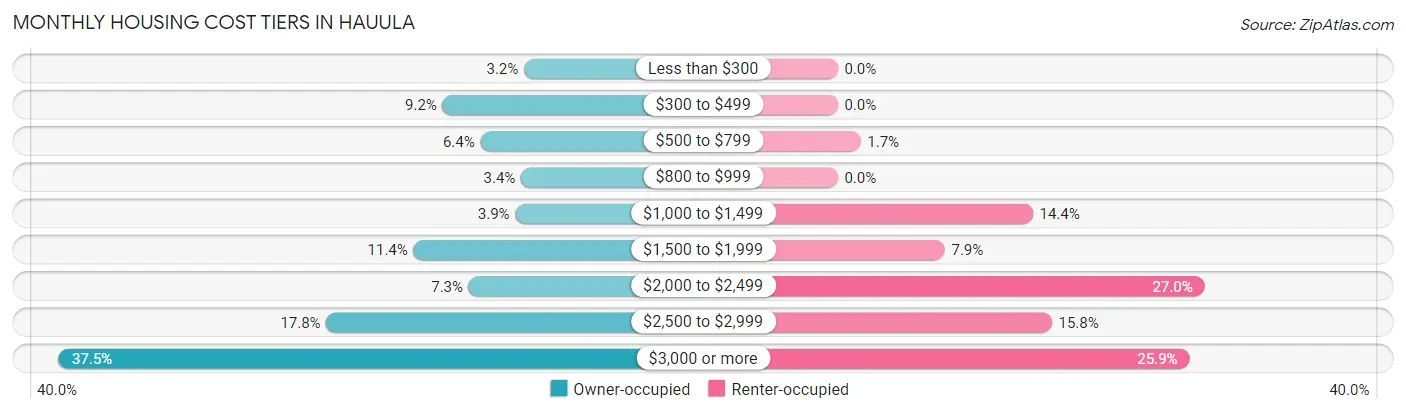
| Monthly Cost | Owner-occupied | Renter-occupied |
| Less than $300 | 15 (3.2%) | 0 (0.0%) |
| $300 to $499 | 43 (9.2%) | 0 (0.0%) |
| $500 to $799 | 30 (6.4%) | 6 (1.7%) |
| $800 to $999 | 16 (3.4%) | 0 (0.0%) |
| $1,000 to $1,499 | 18 (3.8%) | 51 (14.4%) |
| $1,500 to $1,999 | 53 (11.4%) | 28 (7.9%) |
| $2,000 to $2,499 | 34 (7.3%) | 96 (27.0%) |
| $2,500 to $2,999 | 83 (17.8%) | 56 (15.8%) |
| $3,000 or more | 175 (37.5%) | 92 (25.9%) |
| Total | 467 (100.0%) | 355 (100.0%) |
Physical Housing Characteristics in Hauula
Housing Structures in Hauula
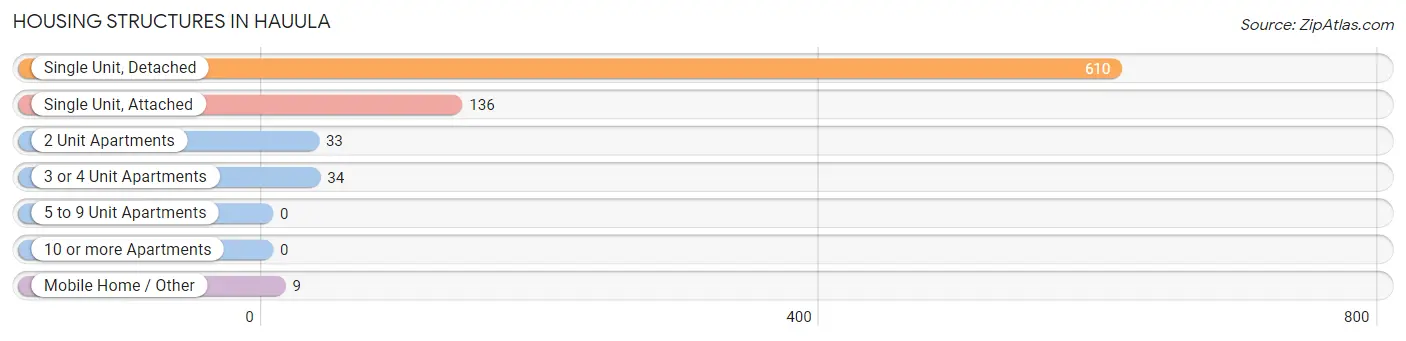
| Structure Type | # Housing Units | % Housing Units |
| Single Unit, Detached | 610 | 74.2% |
| Single Unit, Attached | 136 | 16.6% |
| 2 Unit Apartments | 33 | 4.0% |
| 3 or 4 Unit Apartments | 34 | 4.1% |
| 5 to 9 Unit Apartments | 0 | 0.0% |
| 10 or more Apartments | 0 | 0.0% |
| Mobile Home / Other | 9 | 1.1% |
| Total | 822 | 100.0% |
Housing Structures by Occupancy in Hauula
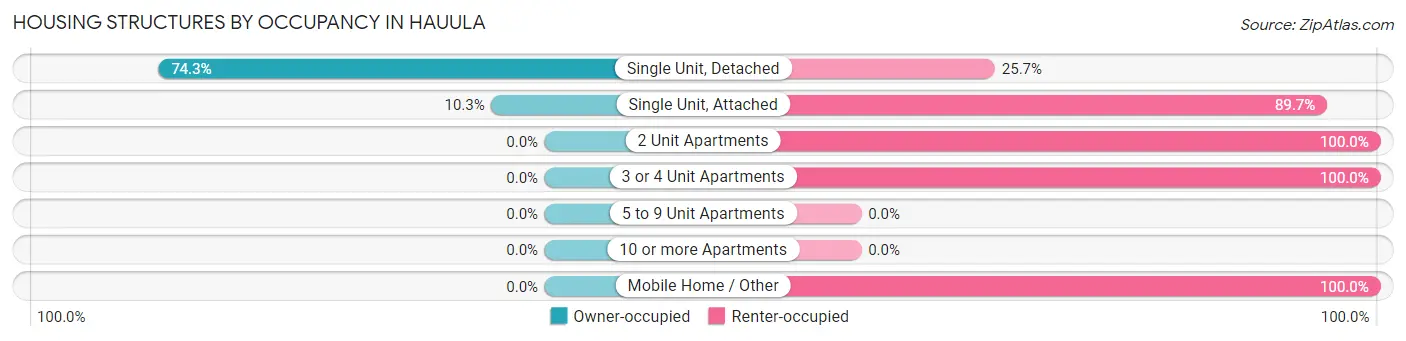
| Structure Type | Owner-occupied | Renter-occupied |
| Single Unit, Detached | 453 (74.3%) | 157 (25.7%) |
| Single Unit, Attached | 14 (10.3%) | 122 (89.7%) |
| 2 Unit Apartments | 0 (0.0%) | 33 (100.0%) |
| 3 or 4 Unit Apartments | 0 (0.0%) | 34 (100.0%) |
| 5 to 9 Unit Apartments | 0 (0.0%) | 0 (0.0%) |
| 10 or more Apartments | 0 (0.0%) | 0 (0.0%) |
| Mobile Home / Other | 0 (0.0%) | 9 (100.0%) |
| Total | 467 (56.8%) | 355 (43.2%) |
Housing Structures by Number of Rooms in Hauula
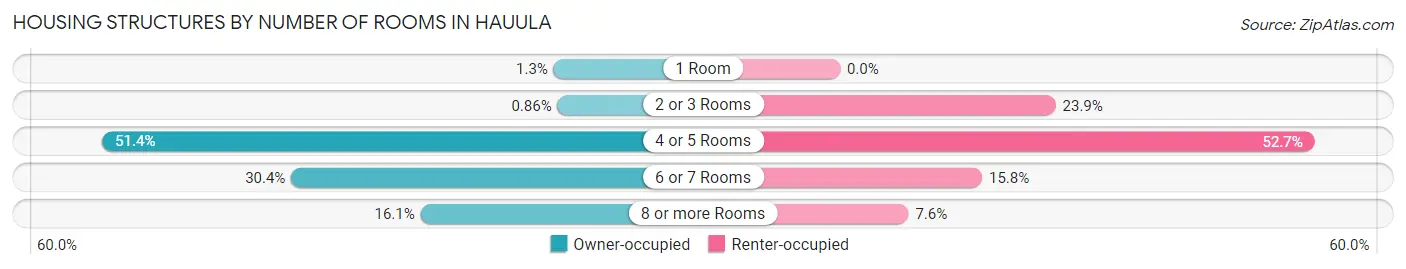
| Number of Rooms | Owner-occupied | Renter-occupied |
| 1 Room | 6 (1.3%) | 0 (0.0%) |
| 2 or 3 Rooms | 4 (0.9%) | 85 (23.9%) |
| 4 or 5 Rooms | 240 (51.4%) | 187 (52.7%) |
| 6 or 7 Rooms | 142 (30.4%) | 56 (15.8%) |
| 8 or more Rooms | 75 (16.1%) | 27 (7.6%) |
| Total | 467 (100.0%) | 355 (100.0%) |
Housing Structure by Heating Type in Hauula
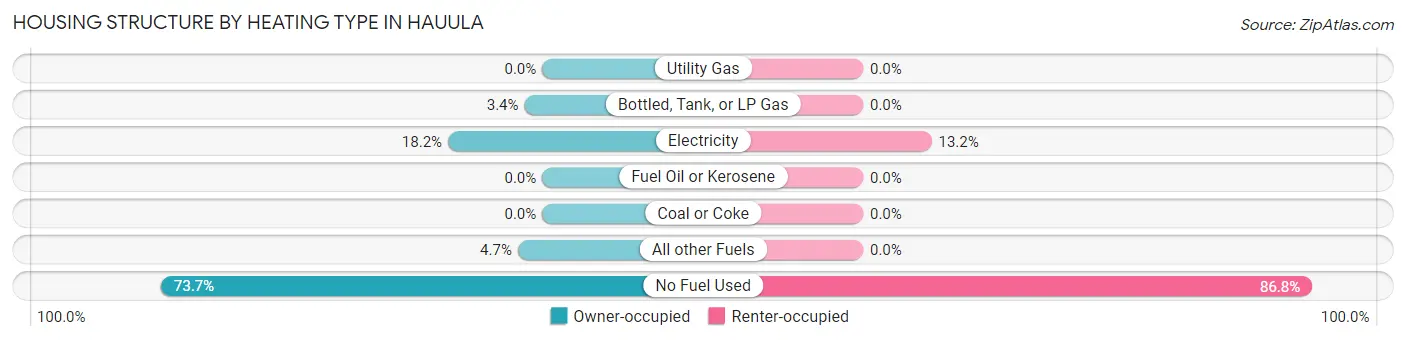
| Heating Type | Owner-occupied | Renter-occupied |
| Utility Gas | 0 (0.0%) | 0 (0.0%) |
| Bottled, Tank, or LP Gas | 16 (3.4%) | 0 (0.0%) |
| Electricity | 85 (18.2%) | 47 (13.2%) |
| Fuel Oil or Kerosene | 0 (0.0%) | 0 (0.0%) |
| Coal or Coke | 0 (0.0%) | 0 (0.0%) |
| All other Fuels | 22 (4.7%) | 0 (0.0%) |
| No Fuel Used | 344 (73.7%) | 308 (86.8%) |
| Total | 467 (100.0%) | 355 (100.0%) |
Household Vehicle Usage in Hauula
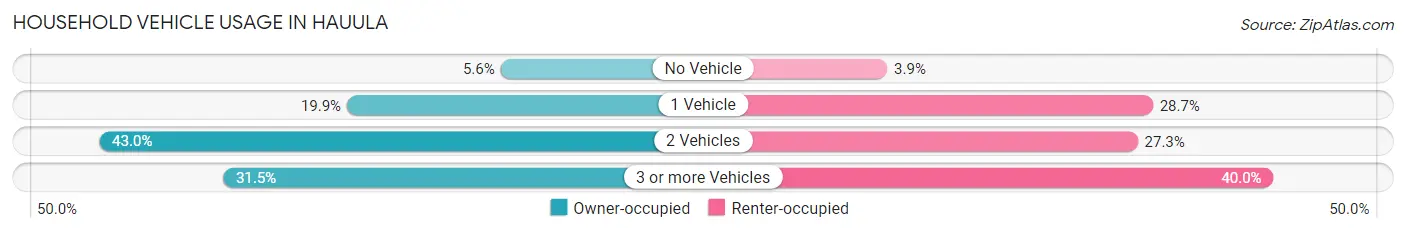
| Vehicles per Household | Owner-occupied | Renter-occupied |
| No Vehicle | 26 (5.6%) | 14 (3.9%) |
| 1 Vehicle | 93 (19.9%) | 102 (28.7%) |
| 2 Vehicles | 201 (43.0%) | 97 (27.3%) |
| 3 or more Vehicles | 147 (31.5%) | 142 (40.0%) |
| Total | 467 (100.0%) | 355 (100.0%) |
Real Estate & Mortgages in Hauula
Real Estate and Mortgage Overview in Hauula
| Characteristic | Without Mortgage | With Mortgage |
| Housing Units | 121 | 346 |
| Median Property Value | $778,600 | $889,100 |
| Median Household Income | $101,042 | $135 |
| Monthly Housing Costs | $510 | $168 |
| Real Estate Taxes | $2,155 | $12 |
Property Value by Mortgage Status in Hauula
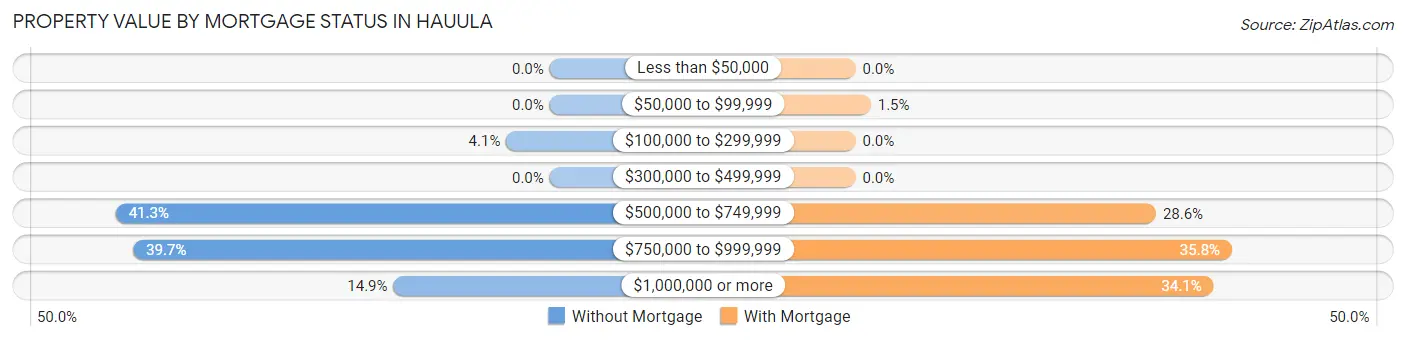
| Property Value | Without Mortgage | With Mortgage |
| Less than $50,000 | 0 (0.0%) | 0 (0.0%) |
| $50,000 to $99,999 | 0 (0.0%) | 5 (1.5%) |
| $100,000 to $299,999 | 5 (4.1%) | 0 (0.0%) |
| $300,000 to $499,999 | 0 (0.0%) | 0 (0.0%) |
| $500,000 to $749,999 | 50 (41.3%) | 99 (28.6%) |
| $750,000 to $999,999 | 48 (39.7%) | 124 (35.8%) |
| $1,000,000 or more | 18 (14.9%) | 118 (34.1%) |
| Total | 121 (100.0%) | 346 (100.0%) |
Household Income by Mortgage Status in Hauula
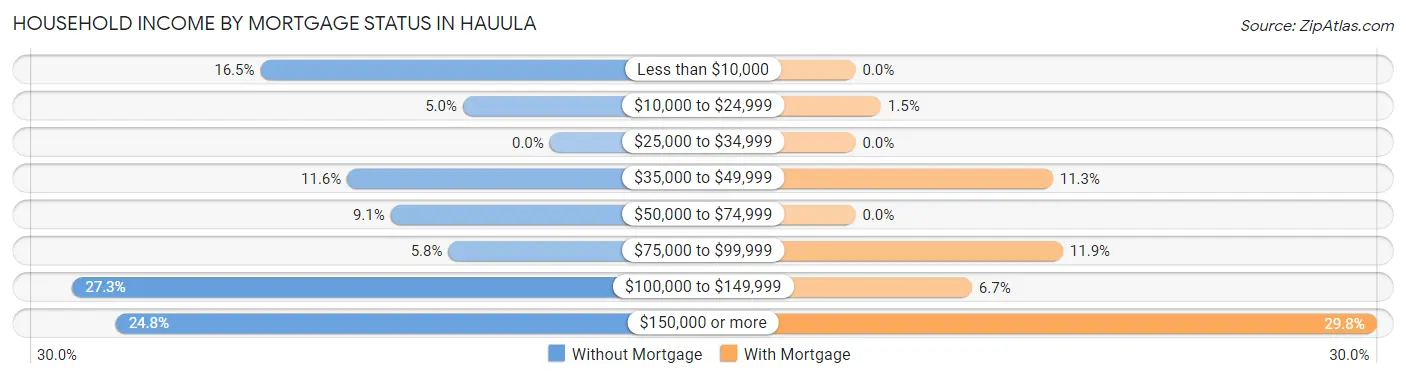
| Household Income | Without Mortgage | With Mortgage |
| Less than $10,000 | 20 (16.5%) | 0 (0.0%) |
| $10,000 to $24,999 | 6 (5.0%) | 5 (1.5%) |
| $25,000 to $34,999 | 0 (0.0%) | 0 (0.0%) |
| $35,000 to $49,999 | 14 (11.6%) | 39 (11.3%) |
| $50,000 to $74,999 | 11 (9.1%) | 0 (0.0%) |
| $75,000 to $99,999 | 7 (5.8%) | 41 (11.8%) |
| $100,000 to $149,999 | 33 (27.3%) | 23 (6.7%) |
| $150,000 or more | 30 (24.8%) | 103 (29.8%) |
| Total | 121 (100.0%) | 346 (100.0%) |
Property Value to Household Income Ratio in Hauula
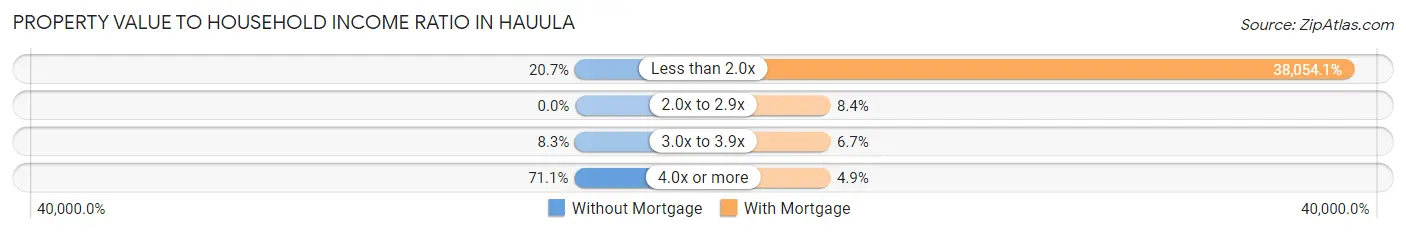
| Value-to-Income Ratio | Without Mortgage | With Mortgage |
| Less than 2.0x | 25 (20.7%) | 131,667 (38,054.1%) |
| 2.0x to 2.9x | 0 (0.0%) | 29 (8.4%) |
| 3.0x to 3.9x | 10 (8.3%) | 23 (6.7%) |
| 4.0x or more | 86 (71.1%) | 17 (4.9%) |
| Total | 121 (100.0%) | 346 (100.0%) |
Real Estate Taxes by Mortgage Status in Hauula
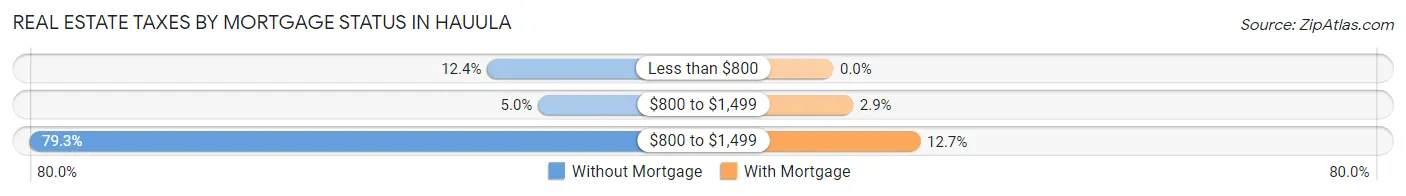
| Property Taxes | Without Mortgage | With Mortgage |
| Less than $800 | 15 (12.4%) | 0 (0.0%) |
| $800 to $1,499 | 6 (5.0%) | 10 (2.9%) |
| $800 to $1,499 | 96 (79.3%) | 44 (12.7%) |
| Total | 121 (100.0%) | 346 (100.0%) |
Health & Disability in Hauula
Health Insurance Coverage by Age in Hauula
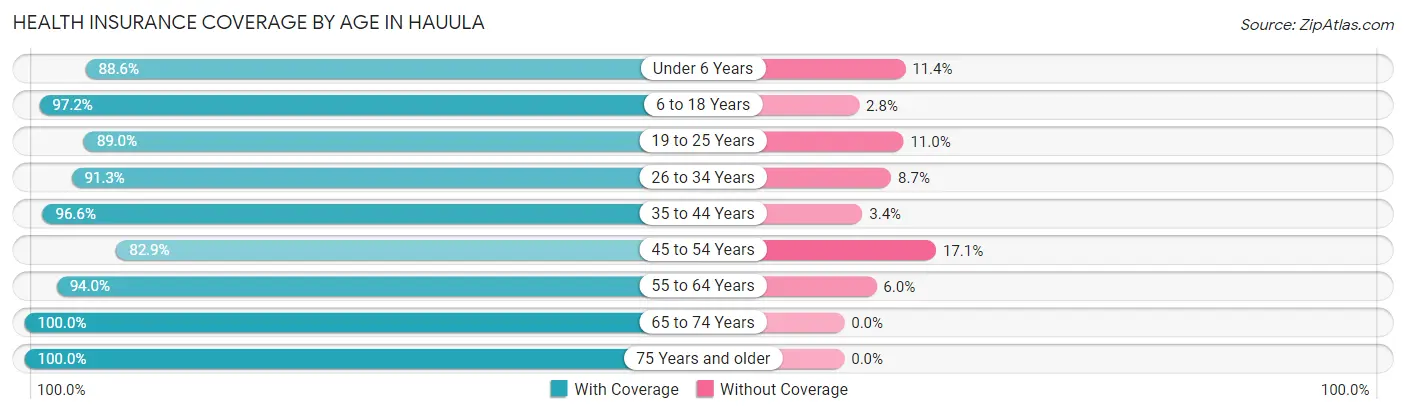
| Age Bracket | With Coverage | Without Coverage |
| Under 6 Years | 296 (88.6%) | 38 (11.4%) |
| 6 to 18 Years | 876 (97.2%) | 25 (2.8%) |
| 19 to 25 Years | 282 (89.0%) | 35 (11.0%) |
| 26 to 34 Years | 376 (91.3%) | 36 (8.7%) |
| 35 to 44 Years | 431 (96.6%) | 15 (3.4%) |
| 45 to 54 Years | 373 (82.9%) | 77 (17.1%) |
| 55 to 64 Years | 251 (94.0%) | 16 (6.0%) |
| 65 to 74 Years | 237 (100.0%) | 0 (0.0%) |
| 75 Years and older | 177 (100.0%) | 0 (0.0%) |
| Total | 3,299 (93.2%) | 242 (6.8%) |
Health Insurance Coverage by Citizenship Status in Hauula
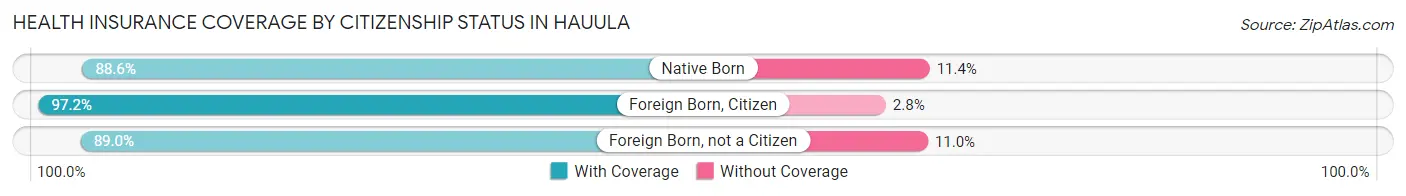
| Citizenship Status | With Coverage | Without Coverage |
| Native Born | 296 (88.6%) | 38 (11.4%) |
| Foreign Born, Citizen | 876 (97.2%) | 25 (2.8%) |
| Foreign Born, not a Citizen | 282 (89.0%) | 35 (11.0%) |
Health Insurance Coverage by Household Income in Hauula
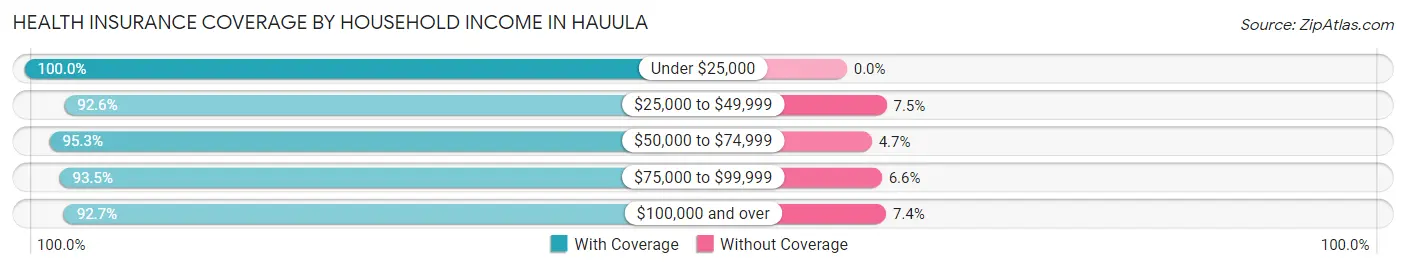
| Household Income | With Coverage | Without Coverage |
| Under $25,000 | 45 (100.0%) | 0 (0.0%) |
| $25,000 to $49,999 | 385 (92.5%) | 31 (7.4%) |
| $50,000 to $74,999 | 449 (95.3%) | 22 (4.7%) |
| $75,000 to $99,999 | 214 (93.4%) | 15 (6.6%) |
| $100,000 and over | 2,192 (92.6%) | 174 (7.3%) |
Public vs Private Health Insurance Coverage by Age in Hauula
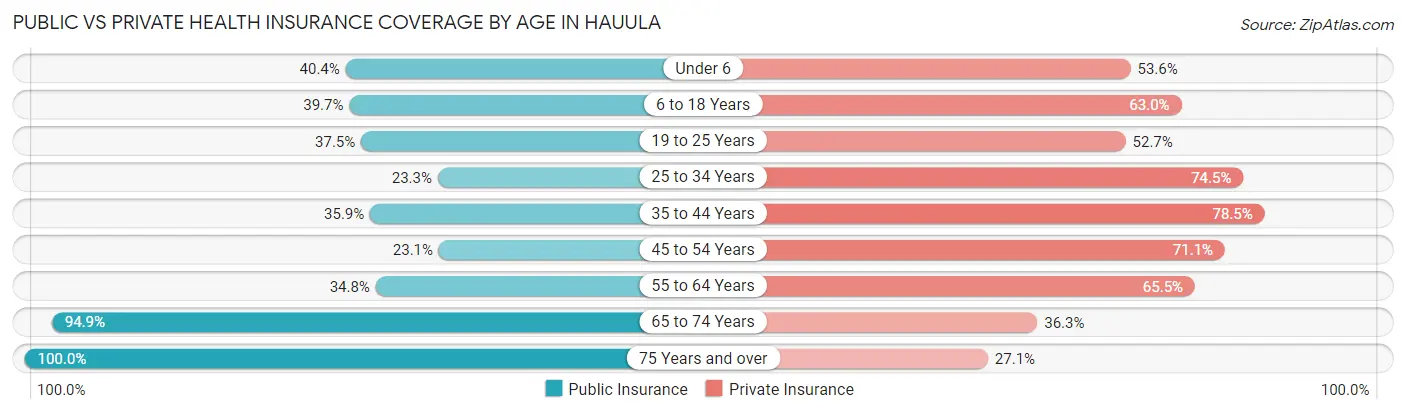
| Age Bracket | Public Insurance | Private Insurance |
| Under 6 | 135 (40.4%) | 179 (53.6%) |
| 6 to 18 Years | 358 (39.7%) | 568 (63.0%) |
| 19 to 25 Years | 119 (37.5%) | 167 (52.7%) |
| 25 to 34 Years | 96 (23.3%) | 307 (74.5%) |
| 35 to 44 Years | 160 (35.9%) | 350 (78.5%) |
| 45 to 54 Years | 104 (23.1%) | 320 (71.1%) |
| 55 to 64 Years | 93 (34.8%) | 175 (65.5%) |
| 65 to 74 Years | 225 (94.9%) | 86 (36.3%) |
| 75 Years and over | 177 (100.0%) | 48 (27.1%) |
| Total | 1,467 (41.4%) | 2,200 (62.1%) |
Disability Status by Sex by Age in Hauula
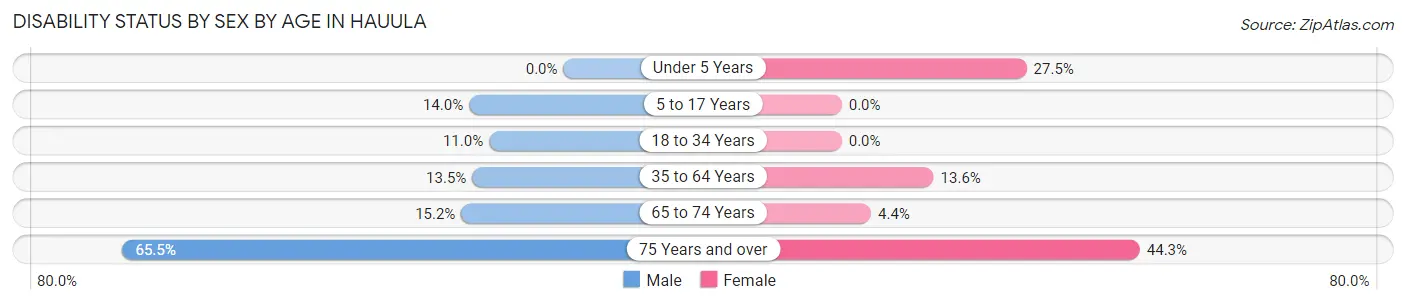
| Age Bracket | Male | Female |
| Under 5 Years | 0 (0.0%) | 14 (27.5%) |
| 5 to 17 Years | 73 (14.0%) | 0 (0.0%) |
| 18 to 34 Years | 51 (11.0%) | 0 (0.0%) |
| 35 to 64 Years | 83 (13.5%) | 75 (13.6%) |
| 65 to 74 Years | 22 (15.2%) | 4 (4.3%) |
| 75 Years and over | 36 (65.4%) | 54 (44.3%) |
Disability Class by Sex by Age in Hauula
Disability Class: Hearing Difficulty
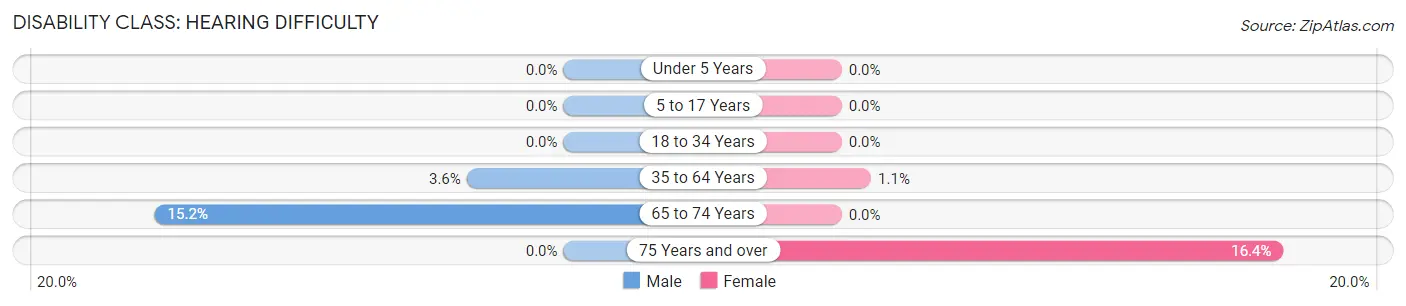
| Age Bracket | Male | Female |
| Under 5 Years | 0 (0.0%) | 0 (0.0%) |
| 5 to 17 Years | 0 (0.0%) | 0 (0.0%) |
| 18 to 34 Years | 0 (0.0%) | 0 (0.0%) |
| 35 to 64 Years | 22 (3.6%) | 6 (1.1%) |
| 65 to 74 Years | 22 (15.2%) | 0 (0.0%) |
| 75 Years and over | 0 (0.0%) | 20 (16.4%) |
Disability Class: Vision Difficulty
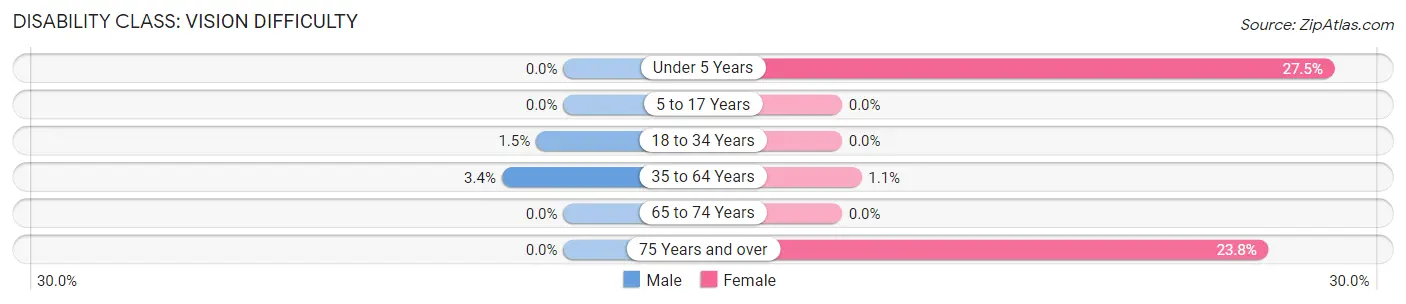
| Age Bracket | Male | Female |
| Under 5 Years | 0 (0.0%) | 14 (27.5%) |
| 5 to 17 Years | 0 (0.0%) | 0 (0.0%) |
| 18 to 34 Years | 7 (1.5%) | 0 (0.0%) |
| 35 to 64 Years | 21 (3.4%) | 6 (1.1%) |
| 65 to 74 Years | 0 (0.0%) | 0 (0.0%) |
| 75 Years and over | 0 (0.0%) | 29 (23.8%) |
Disability Class: Cognitive Difficulty
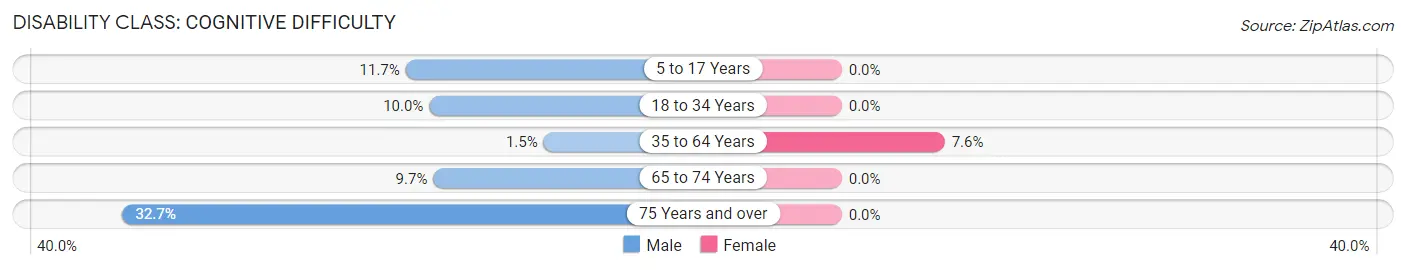
| Age Bracket | Male | Female |
| 5 to 17 Years | 61 (11.7%) | 0 (0.0%) |
| 18 to 34 Years | 46 (10.0%) | 0 (0.0%) |
| 35 to 64 Years | 9 (1.5%) | 42 (7.6%) |
| 65 to 74 Years | 14 (9.7%) | 0 (0.0%) |
| 75 Years and over | 18 (32.7%) | 0 (0.0%) |
Disability Class: Ambulatory Difficulty
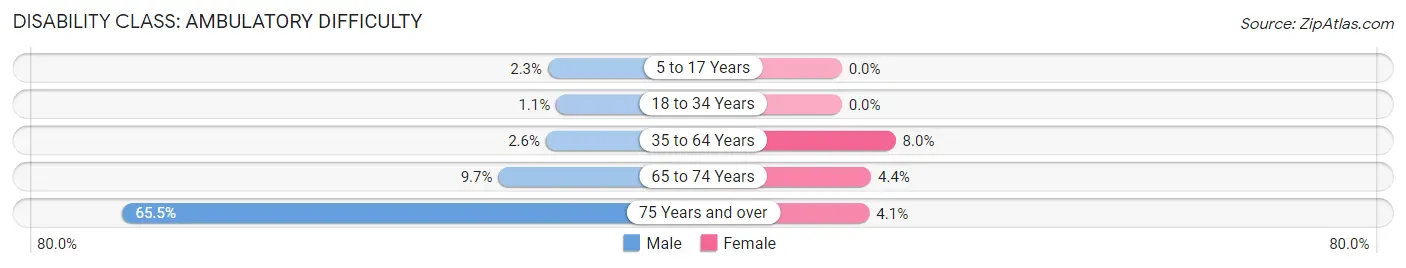
| Age Bracket | Male | Female |
| 5 to 17 Years | 12 (2.3%) | 0 (0.0%) |
| 18 to 34 Years | 5 (1.1%) | 0 (0.0%) |
| 35 to 64 Years | 16 (2.6%) | 44 (8.0%) |
| 65 to 74 Years | 14 (9.7%) | 4 (4.3%) |
| 75 Years and over | 36 (65.4%) | 5 (4.1%) |
Disability Class: Self-Care Difficulty
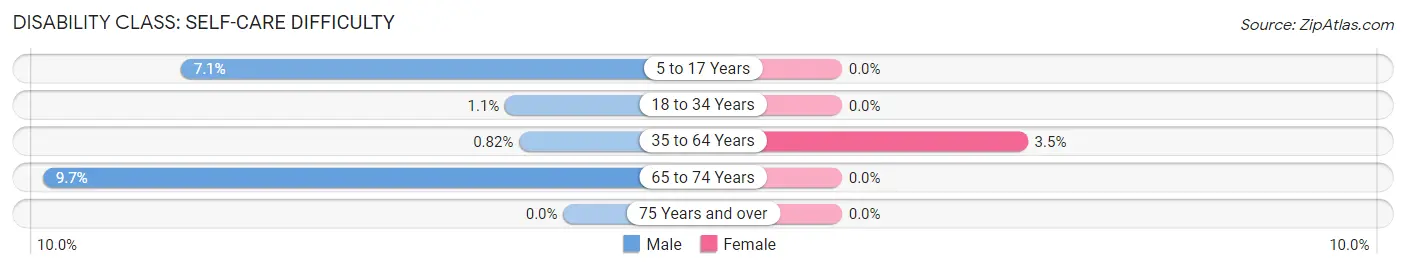
| Age Bracket | Male | Female |
| 5 to 17 Years | 37 (7.1%) | 0 (0.0%) |
| 18 to 34 Years | 5 (1.1%) | 0 (0.0%) |
| 35 to 64 Years | 5 (0.8%) | 19 (3.5%) |
| 65 to 74 Years | 14 (9.7%) | 0 (0.0%) |
| 75 Years and over | 0 (0.0%) | 0 (0.0%) |
Technology Access in Hauula
Computing Device Access in Hauula
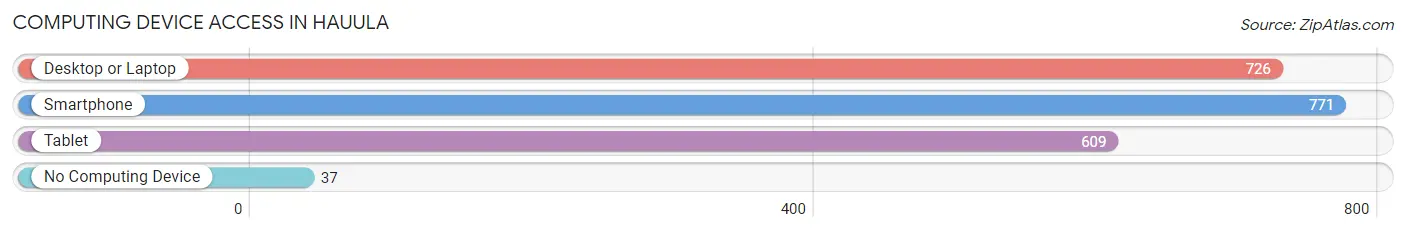
| Device Type | # Households | % Households |
| Desktop or Laptop | 726 | 88.3% |
| Smartphone | 771 | 93.8% |
| Tablet | 609 | 74.1% |
| No Computing Device | 37 | 4.5% |
| Total | 822 | 100.0% |
Internet Access in Hauula
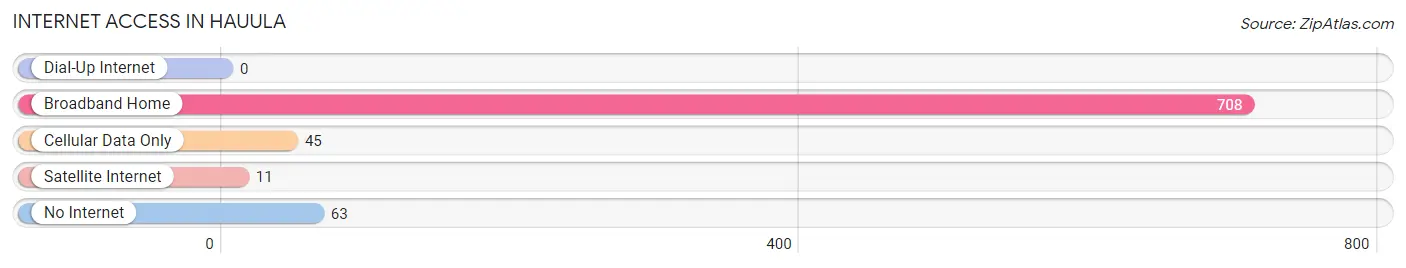
| Internet Type | # Households | % Households |
| Dial-Up Internet | 0 | 0.0% |
| Broadband Home | 708 | 86.1% |
| Cellular Data Only | 45 | 5.5% |
| Satellite Internet | 11 | 1.3% |
| No Internet | 63 | 7.7% |
| Total | 822 | 100.0% |
Hauula Summary
Hauula is a small unincorporated community located on the northeastern coast of the island of Oahu in the state of Hawaii. It is located in the Ko’olauloa District of the island and is part of the Honolulu metropolitan area. The population of Hauula was 2,902 at the 2000 census.
History
Hauula has a long and rich history that dates back to the early Polynesian settlers of the area. The first settlers of the area were believed to have arrived in the late 1700s and were of Tahitian descent. These settlers were known as the “Kahana” and were the first to inhabit the area. The Kahana were known for their fishing and farming skills and were able to sustain themselves in the area for many years.
In the early 1800s, the area was taken over by the Kingdom of Hawaii and was used as a royal retreat for the Hawaiian royalty. The area was also used as a place of refuge for the Hawaiian people during times of war.
In the late 1800s, the area was opened up to foreign settlers and missionaries. These settlers brought with them new technologies and ideas that helped to shape the area into what it is today.
Geography
Hauula is located on the northeastern coast of the island of Oahu in the state of Hawaii. It is located in the Ko’olauloa District of the island and is part of the Honolulu metropolitan area. The area is bordered by the towns of Laie to the north, Kahuku to the east, and Punalu’u to the south.
The area is known for its beautiful beaches and lush tropical forests. The area is also home to several small streams and rivers that flow into the ocean. The area is also known for its many hiking trails and scenic views.
Economy
The economy of Hauula is largely based on tourism and agriculture. The area is home to several resorts and hotels that cater to tourists from all over the world. The area is also home to several farms and ranches that produce a variety of fruits and vegetables.
The area is also home to several small businesses that provide goods and services to the local community. These businesses include restaurants, retail stores, and other services.
Demographics
As of the 2000 census, the population of Hauula was 2,902. The racial makeup of the area was 57.3% White, 0.7% African American, 0.3% Native American, 24.2% Asian, 0.2% Pacific Islander, 11.2% from other races, and 6.3% from two or more races.
The median income for a household in the area was $50,977 and the median income for a family was $56,977. The per capita income for the area was $21,977. About 8.3% of families and 10.2% of the population were below the poverty line, including 13.2% of those under age 18 and 8.3% of those age 65 or over.
Conclusion
Hauula is a small unincorporated community located on the northeastern coast of the island of Oahu in the state of Hawaii. It has a long and rich history that dates back to the early Polynesian settlers of the area. The area is known for its beautiful beaches and lush tropical forests. The economy of Hauula is largely based on tourism and agriculture. As of the 2000 census, the population of Hauula was 2,902. The racial makeup of the area was 57.3% White, 0.7% African American, 0.3% Native American, 24.2% Asian, 0.2% Pacific Islander, 11.2% from other races, and 6.3% from two or more races.
Common Questions
What is Per Capita Income in Hauula?
Per Capita income in Hauula is $27,792.
What is the Median Family Income in Hauula?
Median Family Income in Hauula is $115,900.
What is the Median Household income in Hauula?
Median Household Income in Hauula is $108,800.
What is Income or Wage Gap in Hauula?
Income or Wage Gap in Hauula is 6.2%.
Women in Hauula earn 93.8 cents for every dollar earned by a man.
What is Inequality or Gini Index in Hauula?
Inequality or Gini Index in Hauula is 0.41.
What is the Total Population of Hauula?
Total Population of Hauula is 3,593.
What is the Total Male Population of Hauula?
Total Male Population of Hauula is 2,052.
What is the Total Female Population of Hauula?
Total Female Population of Hauula is 1,541.
What is the Ratio of Males per 100 Females in Hauula?
There are 133.16 Males per 100 Females in Hauula.
What is the Ratio of Females per 100 Males in Hauula?
There are 75.10 Females per 100 Males in Hauula.
What is the Median Population Age in Hauula?
Median Population Age in Hauula is 31.3 Years.
What is the Average Family Size in Hauula
Average Family Size in Hauula is 4.7 People.
What is the Average Household Size in Hauula
Average Household Size in Hauula is 4.3 People.
How Large is the Labor Force in Hauula?
There are 1,612 People in the Labor Forcein in Hauula.
What is the Percentage of People in the Labor Force in Hauula?
64.9% of People are in the Labor Force in Hauula.
What is the Unemployment Rate in Hauula?
Unemployment Rate in Hauula is 6.9%.