Eagle Mountain, UT Map & Demographics
Eagle Mountain Map
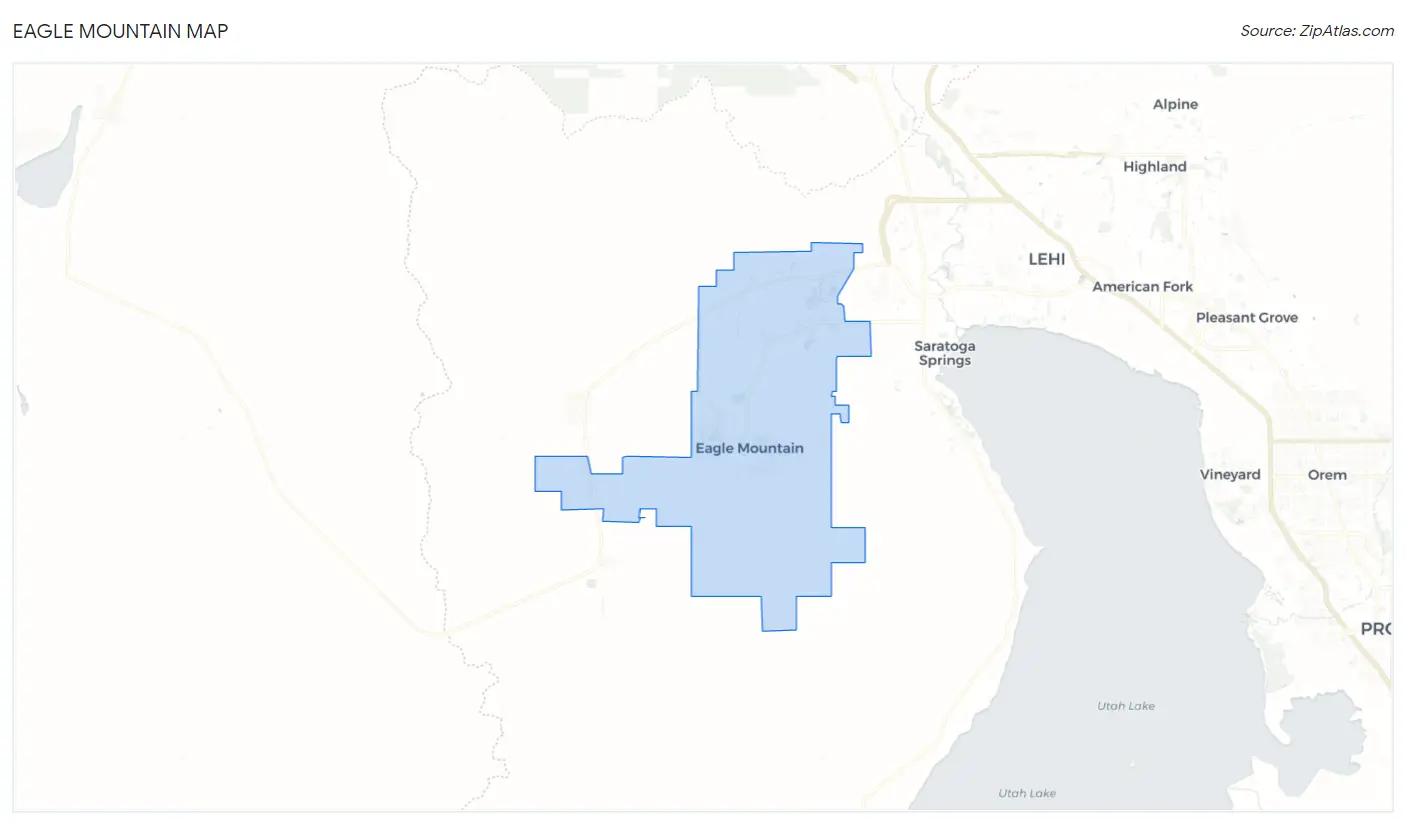
Eagle Mountain Overview
$27,480
PER CAPITA INCOME
$100,378
AVG FAMILY INCOME
$100,837
AVG HOUSEHOLD INCOME
62.4%
WAGE / INCOME GAP [ % ]
37.6¢/ $1
WAGE / INCOME GAP [ $ ]
$9,000
FAMILY INCOME DEFICIT
0.31
INEQUALITY / GINI INDEX
46,109
TOTAL POPULATION
23,266
MALE POPULATION
22,843
FEMALE POPULATION
101.85
MALES / 100 FEMALES
98.18
FEMALES / 100 MALES
21.9
MEDIAN AGE
4.4
AVG FAMILY SIZE
4.2
AVG HOUSEHOLD SIZE
20,664
LABOR FORCE [ PEOPLE ]
76.0%
PERCENT IN LABOR FORCE
3.4%
UNEMPLOYMENT RATE
Eagle Mountain Zip Codes
Income in Eagle Mountain
Income Overview in Eagle Mountain
Per Capita Income in Eagle Mountain is $27,480, while median incomes of families and households are $100,378 and $100,837 respectively.
| Characteristic | Number | Measure |
| Per Capita Income | 46,109 | $27,480 |
| Median Family Income | 10,183 | $100,378 |
| Mean Family Income | 10,183 | $114,777 |
| Median Household Income | 10,896 | $100,837 |
| Mean Household Income | 10,896 | $114,524 |
| Income Deficit | 10,183 | $9,000 |
| Wage / Income Gap (%) | 46,109 | 62.44% |
| Wage / Income Gap ($) | 46,109 | 37.56¢ per $1 |
| Gini / Inequality Index | 46,109 | 0.31 |
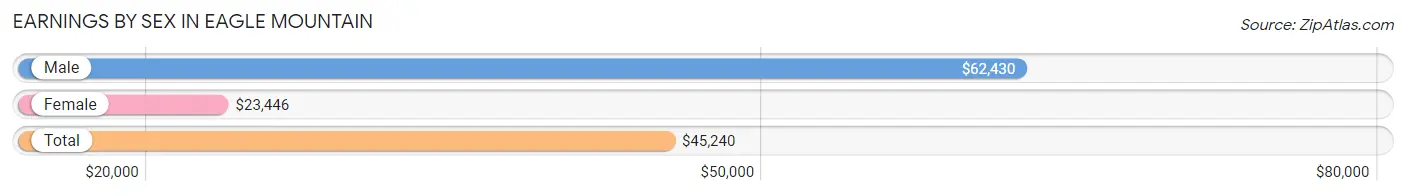
Earnings by Sex in Eagle Mountain
Average Earnings in Eagle Mountain are $45,240, $62,430 for men and $23,446 for women, a difference of 62.4%.
| Sex | Number | Average Earnings |
| Male | 12,823 (59.7%) | $62,430 |
| Female | 8,668 (40.3%) | $23,446 |
| Total | 21,491 (100.0%) | $45,240 |
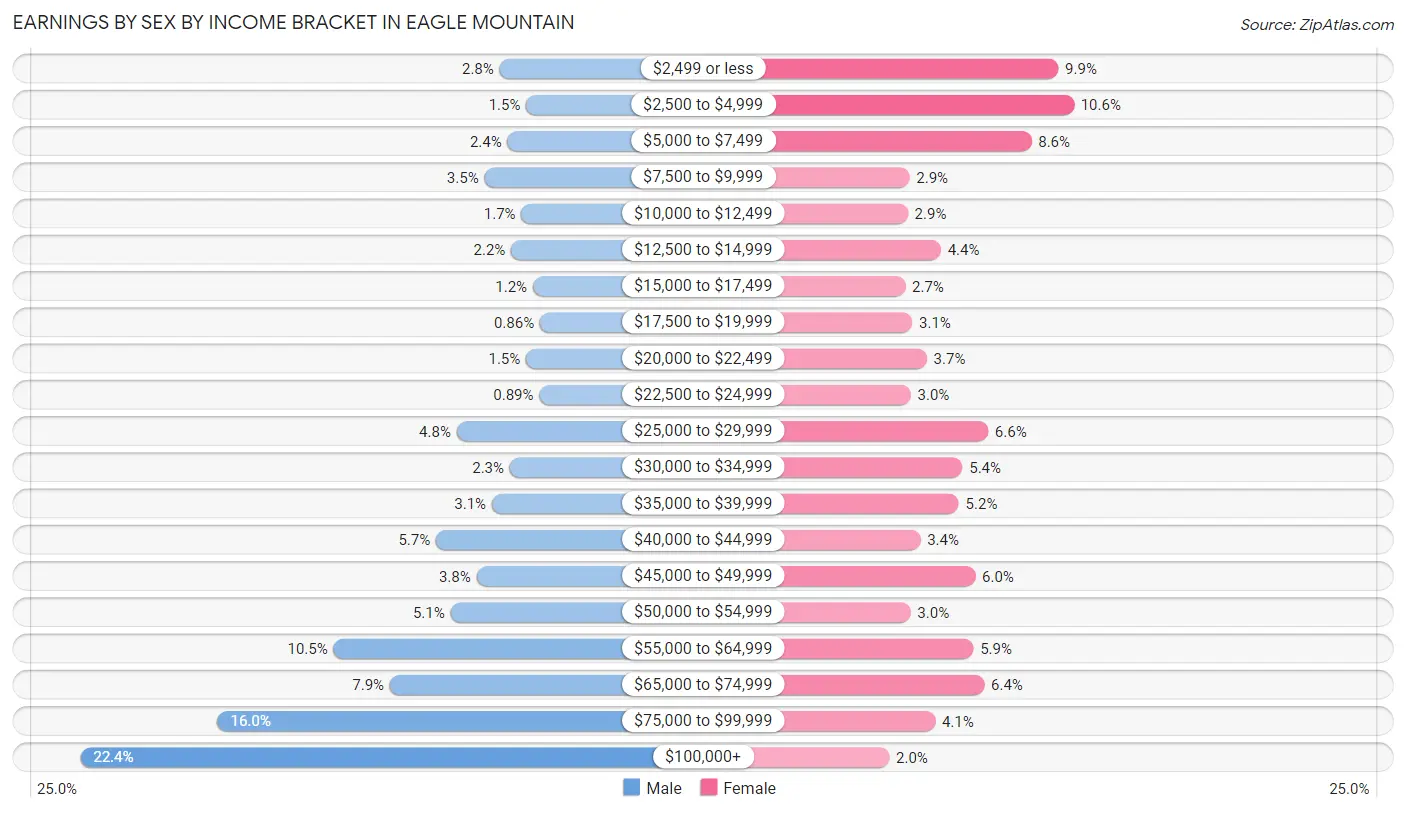
Earnings by Sex by Income Bracket in Eagle Mountain
The most common earnings brackets in Eagle Mountain are $100,000+ for men (2,871 | 22.4%) and $2,500 to $4,999 for women (921 | 10.6%).
| Income | Male | Female |
| $2,499 or less | 352 (2.8%) | 858 (9.9%) |
| $2,500 to $4,999 | 192 (1.5%) | 921 (10.6%) |
| $5,000 to $7,499 | 305 (2.4%) | 749 (8.6%) |
| $7,500 to $9,999 | 444 (3.5%) | 254 (2.9%) |
| $10,000 to $12,499 | 222 (1.7%) | 247 (2.9%) |
| $12,500 to $14,999 | 283 (2.2%) | 381 (4.4%) |
| $15,000 to $17,499 | 153 (1.2%) | 237 (2.7%) |
| $17,500 to $19,999 | 110 (0.9%) | 265 (3.1%) |
| $20,000 to $22,499 | 194 (1.5%) | 324 (3.7%) |
| $22,500 to $24,999 | 114 (0.9%) | 259 (3.0%) |
| $25,000 to $29,999 | 610 (4.8%) | 573 (6.6%) |
| $30,000 to $34,999 | 291 (2.3%) | 469 (5.4%) |
| $35,000 to $39,999 | 399 (3.1%) | 454 (5.2%) |
| $40,000 to $44,999 | 735 (5.7%) | 298 (3.4%) |
| $45,000 to $49,999 | 491 (3.8%) | 521 (6.0%) |
| $50,000 to $54,999 | 648 (5.1%) | 258 (3.0%) |
| $55,000 to $64,999 | 1,350 (10.5%) | 513 (5.9%) |
| $65,000 to $74,999 | 1,012 (7.9%) | 557 (6.4%) |
| $75,000 to $99,999 | 2,047 (16.0%) | 358 (4.1%) |
| $100,000+ | 2,871 (22.4%) | 172 (2.0%) |
| Total | 12,823 (100.0%) | 8,668 (100.0%) |
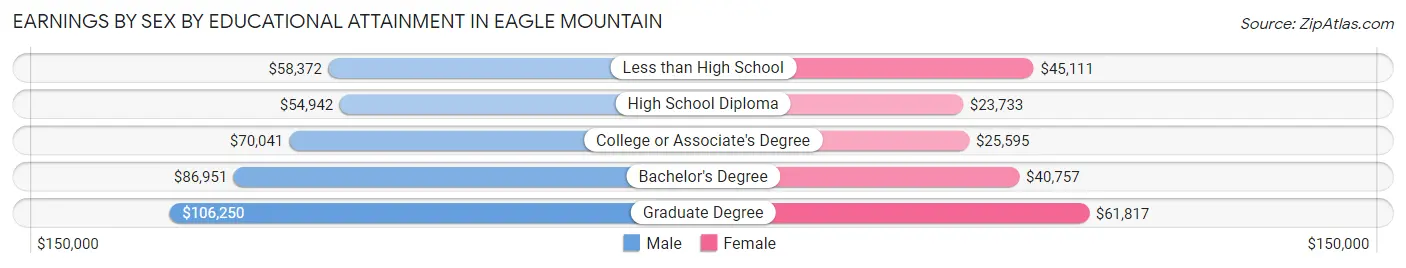
Earnings by Sex by Educational Attainment in Eagle Mountain
Average earnings in Eagle Mountain are $73,876 for men and $33,122 for women, a difference of 55.2%. Men with an educational attainment of graduate degree enjoy the highest average annual earnings of $106,250, while those with high school diploma education earn the least with $54,942. Women with an educational attainment of graduate degree earn the most with the average annual earnings of $61,817, while those with high school diploma education have the smallest earnings of $23,733.
| Educational Attainment | Male Income | Female Income |
| Less than High School | $58,372 | $45,111 |
| High School Diploma | $54,942 | $23,733 |
| College or Associate's Degree | $70,041 | $25,595 |
| Bachelor's Degree | $86,951 | $40,757 |
| Graduate Degree | $106,250 | $61,817 |
| Total | $73,876 | $33,122 |
Family Income in Eagle Mountain
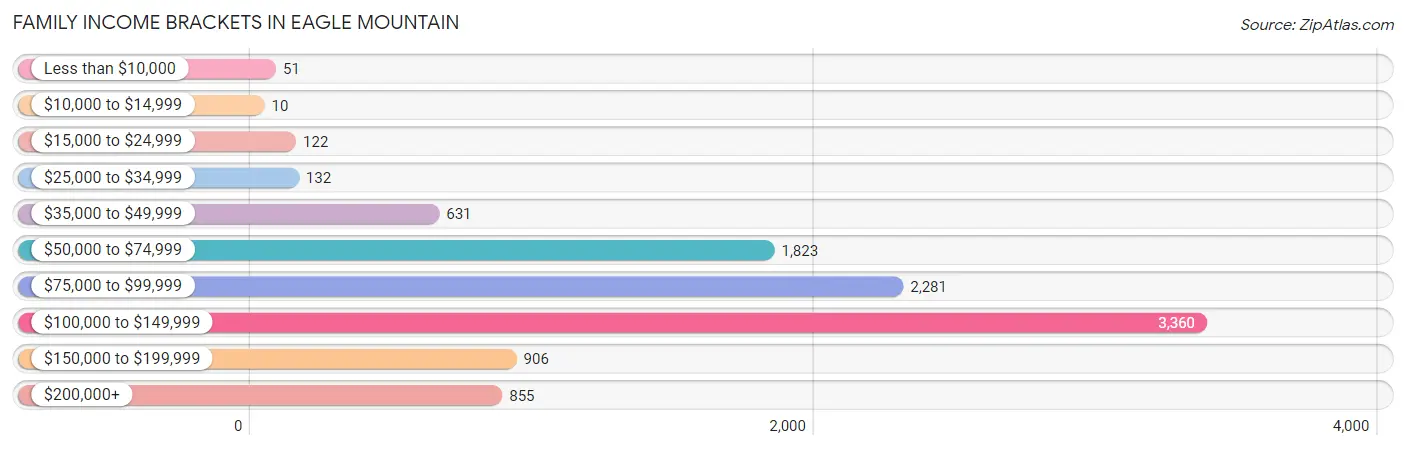
Family Income Brackets in Eagle Mountain
According to the Eagle Mountain family income data, there are 3,360 families falling into the $100,000 to $149,999 income range, which is the most common income bracket and makes up 33.0% of all families. Conversely, the $10,000 to $14,999 income bracket is the least frequent group with only 10 families (0.1%) belonging to this category.
| Income Bracket | # Families | % Families |
| Less than $10,000 | 51 | 0.5% |
| $10,000 to $14,999 | 10 | 0.1% |
| $15,000 to $24,999 | 122 | 1.2% |
| $25,000 to $34,999 | 132 | 1.3% |
| $35,000 to $49,999 | 631 | 6.2% |
| $50,000 to $74,999 | 1,823 | 17.9% |
| $75,000 to $99,999 | 2,281 | 22.4% |
| $100,000 to $149,999 | 3,360 | 33.0% |
| $150,000 to $199,999 | 906 | 8.9% |
| $200,000+ | 855 | 8.4% |
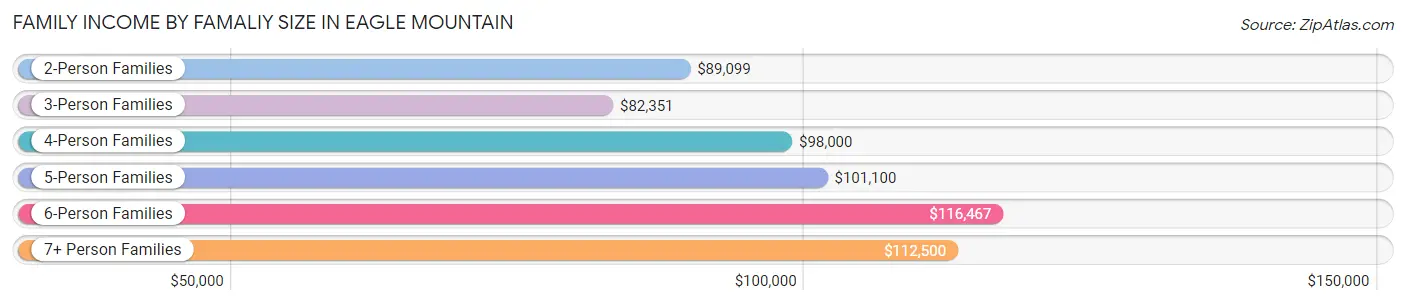
Family Income by Famaliy Size in Eagle Mountain
6-person families (1,385 | 13.6%) account for the highest median family income in Eagle Mountain with $116,467 per family, while 2-person families (1,749 | 17.2%) have the highest median income of $44,550 per family member.
| Income Bracket | # Families | Median Income |
| 2-Person Families | 1,749 (17.2%) | $89,099 |
| 3-Person Families | 1,444 (14.2%) | $82,351 |
| 4-Person Families | 2,604 (25.6%) | $98,000 |
| 5-Person Families | 2,145 (21.1%) | $101,100 |
| 6-Person Families | 1,385 (13.6%) | $116,467 |
| 7+ Person Families | 856 (8.4%) | $112,500 |
| Total | 10,183 (100.0%) | $100,378 |
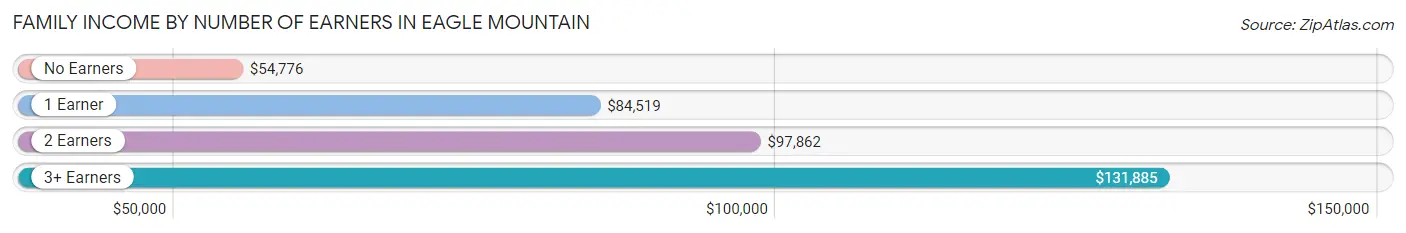
Family Income by Number of Earners in Eagle Mountain
The median family income in Eagle Mountain is $100,378, with families comprising 3+ earners (2,053) having the highest median family income of $131,885, while families with no earners (243) have the lowest median family income of $54,776, accounting for 20.2% and 2.4% of families, respectively.
| Number of Earners | # Families | Median Income |
| No Earners | 243 (2.4%) | $54,776 |
| 1 Earner | 3,344 (32.8%) | $84,519 |
| 2 Earners | 4,543 (44.6%) | $97,862 |
| 3+ Earners | 2,053 (20.2%) | $131,885 |
| Total | 10,183 (100.0%) | $100,378 |
Household Income in Eagle Mountain
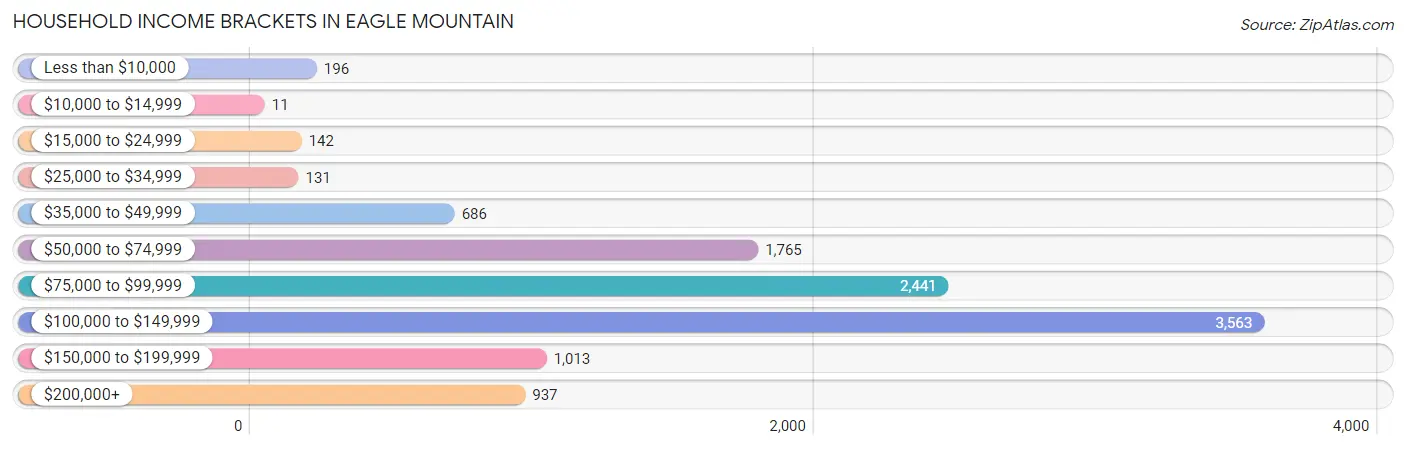
Household Income Brackets in Eagle Mountain
With 3,563 households falling in the category, the $100,000 to $149,999 income range is the most frequent in Eagle Mountain, accounting for 32.7% of all households. In contrast, only 11 households (0.1%) fall into the $10,000 to $14,999 income bracket, making it the least populous group.
| Income Bracket | # Households | % Households |
| Less than $10,000 | 196 | 1.8% |
| $10,000 to $14,999 | 11 | 0.1% |
| $15,000 to $24,999 | 142 | 1.3% |
| $25,000 to $34,999 | 131 | 1.2% |
| $35,000 to $49,999 | 686 | 6.3% |
| $50,000 to $74,999 | 1,765 | 16.2% |
| $75,000 to $99,999 | 2,441 | 22.4% |
| $100,000 to $149,999 | 3,563 | 32.7% |
| $150,000 to $199,999 | 1,013 | 9.3% |
| $200,000+ | 937 | 8.6% |
Household Income by Householder Age in Eagle Mountain
The median household income in Eagle Mountain is $100,837, with the highest median household income of $127,295 found in the 45 to 64 years age bracket for the primary householder. A total of 2,641 households (24.2%) fall into this category. Meanwhile, the 65+ years age bracket for the primary householder has the lowest median household income of $85,376, with 725 households (6.7%) in this group.
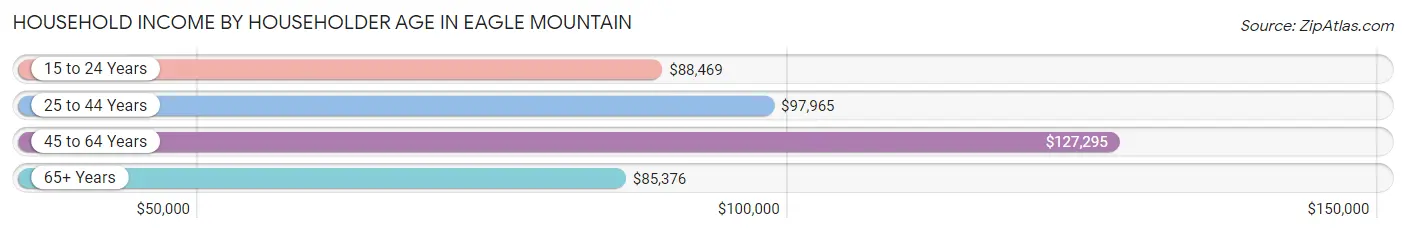
| Income Bracket | # Households | Median Income |
| 15 to 24 Years | 398 (3.6%) | $88,469 |
| 25 to 44 Years | 7,132 (65.5%) | $97,965 |
| 45 to 64 Years | 2,641 (24.2%) | $127,295 |
| 65+ Years | 725 (6.7%) | $85,376 |
| Total | 10,896 (100.0%) | $100,837 |
Poverty in Eagle Mountain
Income Below Poverty by Sex and Age in Eagle Mountain
With 2.3% poverty level for males and 4.5% for females among the residents of Eagle Mountain, 65 to 74 year old males and 15 year old females are the most vulnerable to poverty, with 30 males (8.4%) and 55 females (9.2%) in their respective age groups living below the poverty level.
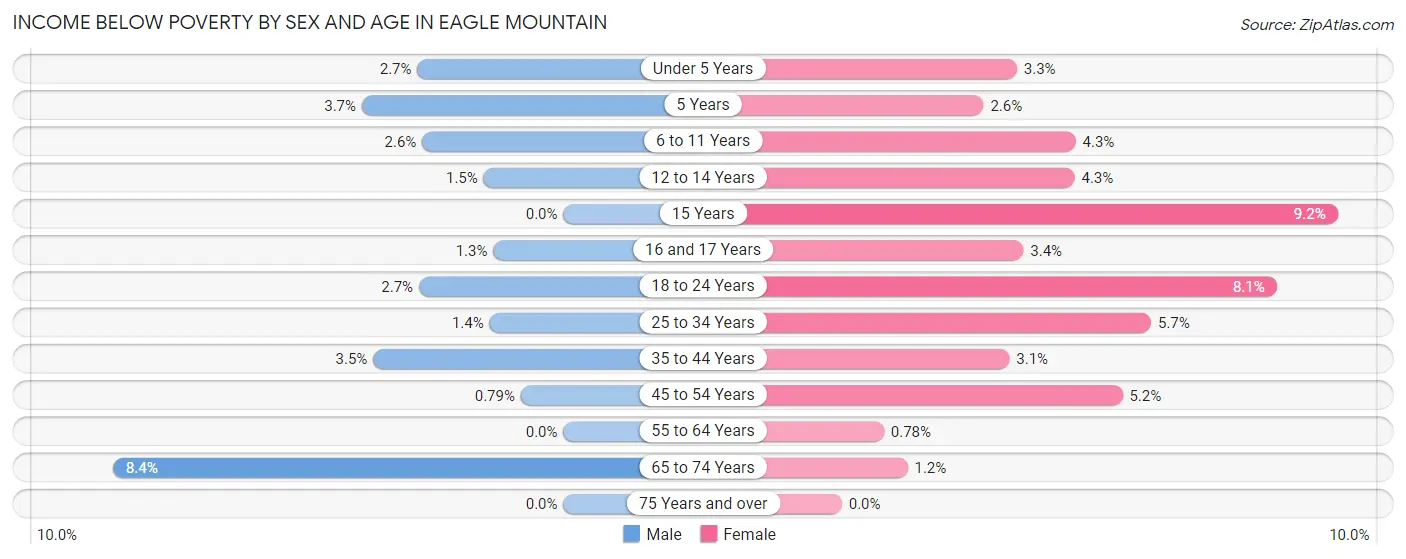
| Age Bracket | Male | Female |
| Under 5 Years | 95 (2.7%) | 112 (3.3%) |
| 5 Years | 24 (3.7%) | 15 (2.6%) |
| 6 to 11 Years | 94 (2.6%) | 162 (4.3%) |
| 12 to 14 Years | 20 (1.5%) | 52 (4.3%) |
| 15 Years | 0 (0.0%) | 55 (9.2%) |
| 16 and 17 Years | 9 (1.3%) | 23 (3.4%) |
| 18 to 24 Years | 67 (2.7%) | 175 (8.1%) |
| 25 to 34 Years | 47 (1.4%) | 229 (5.7%) |
| 35 to 44 Years | 128 (3.5%) | 111 (3.1%) |
| 45 to 54 Years | 19 (0.8%) | 77 (5.2%) |
| 55 to 64 Years | 0 (0.0%) | 6 (0.8%) |
| 65 to 74 Years | 30 (8.4%) | 5 (1.2%) |
| 75 Years and over | 0 (0.0%) | 0 (0.0%) |
| Total | 533 (2.3%) | 1,022 (4.5%) |
Income Above Poverty by Sex and Age in Eagle Mountain
According to the poverty statistics in Eagle Mountain, males aged 15 years and females aged 75 years and over are the age groups that are most secure financially, with 100.0% of males and 100.0% of females in these age groups living above the poverty line.
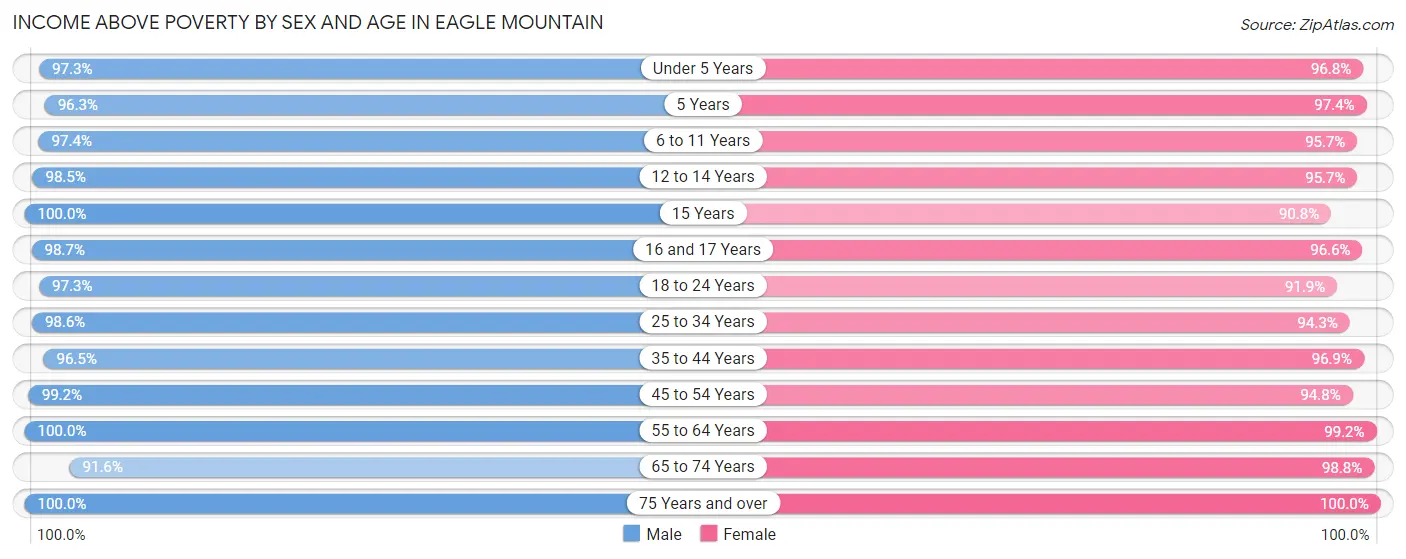
| Age Bracket | Male | Female |
| Under 5 Years | 3,405 (97.3%) | 3,330 (96.8%) |
| 5 Years | 618 (96.3%) | 556 (97.4%) |
| 6 to 11 Years | 3,490 (97.4%) | 3,569 (95.7%) |
| 12 to 14 Years | 1,333 (98.5%) | 1,151 (95.7%) |
| 15 Years | 260 (100.0%) | 543 (90.8%) |
| 16 and 17 Years | 684 (98.7%) | 659 (96.6%) |
| 18 to 24 Years | 2,434 (97.3%) | 1,994 (91.9%) |
| 25 to 34 Years | 3,382 (98.6%) | 3,758 (94.3%) |
| 35 to 44 Years | 3,502 (96.5%) | 3,460 (96.9%) |
| 45 to 54 Years | 2,401 (99.2%) | 1,400 (94.8%) |
| 55 to 64 Years | 741 (100.0%) | 766 (99.2%) |
| 65 to 74 Years | 329 (91.6%) | 405 (98.8%) |
| 75 Years and over | 154 (100.0%) | 195 (100.0%) |
| Total | 22,733 (97.7%) | 21,786 (95.5%) |
Income Below Poverty Among Married-Couple Families in Eagle Mountain
The poverty statistics for married-couple families in Eagle Mountain show that 1.9% or 178 of the total 9,119 families live below the poverty line. Families with 5 or more children have the highest poverty rate of 8.5%, comprising of 53 families. On the other hand, families with no children have the lowest poverty rate of 0.3%, which includes 5 families.
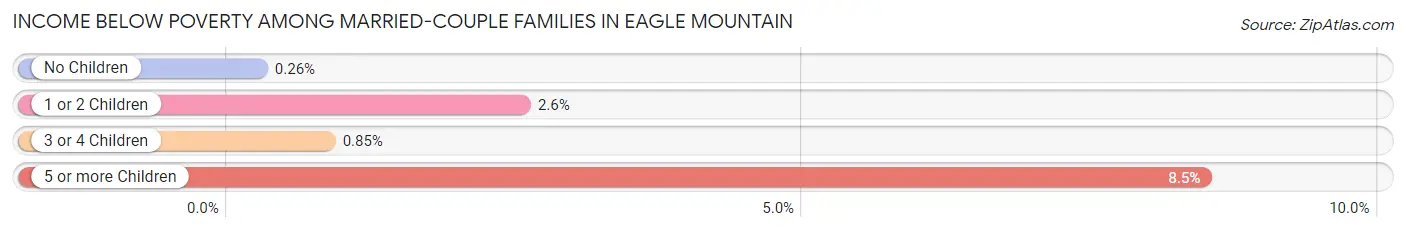
| Children | Above Poverty | Below Poverty |
| No Children | 1,905 (99.7%) | 5 (0.3%) |
| 1 or 2 Children | 3,675 (97.5%) | 96 (2.5%) |
| 3 or 4 Children | 2,789 (99.2%) | 24 (0.9%) |
| 5 or more Children | 572 (91.5%) | 53 (8.5%) |
| Total | 8,941 (98.1%) | 178 (1.9%) |
Income Below Poverty Among Single-Parent Households in Eagle Mountain
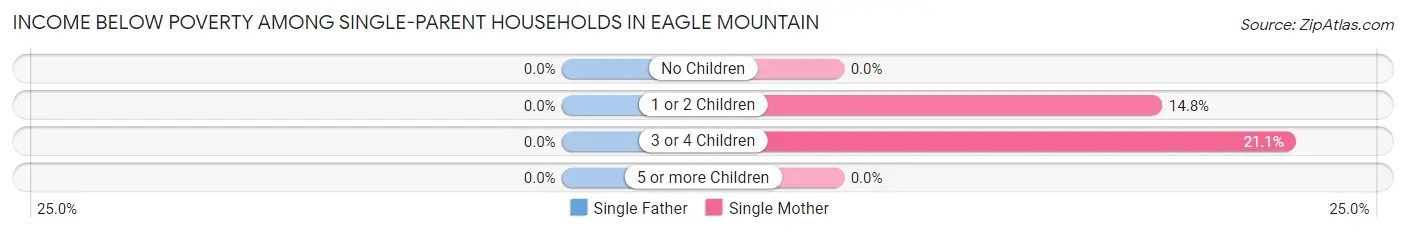
| Children | Single Father | Single Mother |
| No Children | 0 (0.0%) | 0 (0.0%) |
| 1 or 2 Children | 0 (0.0%) | 55 (14.8%) |
| 3 or 4 Children | 0 (0.0%) | 8 (21.0%) |
| 5 or more Children | 0 (0.0%) | 0 (0.0%) |
| Total | 0 (0.0%) | 63 (10.6%) |
Income Below Poverty Among Married-Couple vs Single-Parent Households in Eagle Mountain
The poverty data for Eagle Mountain shows that 178 of the married-couple family households (1.9%) and 63 of the single-parent households (5.9%) are living below the poverty level. Within the married-couple family households, those with 5 or more children have the highest poverty rate, with 53 households (8.5%) falling below the poverty line. Among the single-parent households, those with 1 or 2 children have the highest poverty rate, with 55 household (10.5%) living below poverty.
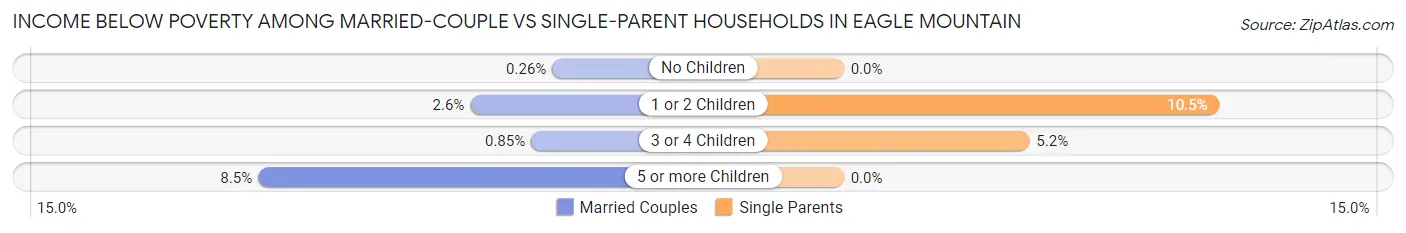
| Children | Married-Couple Families | Single-Parent Households |
| No Children | 5 (0.3%) | 0 (0.0%) |
| 1 or 2 Children | 96 (2.5%) | 55 (10.5%) |
| 3 or 4 Children | 24 (0.9%) | 8 (5.2%) |
| 5 or more Children | 53 (8.5%) | 0 (0.0%) |
| Total | 178 (1.9%) | 63 (5.9%) |
Race in Eagle Mountain
The most populous races in Eagle Mountain are White / Caucasian (41,001 | 88.9%), Hispanic or Latino (5,204 | 11.3%), and Two or more Races (2,610 | 5.7%).
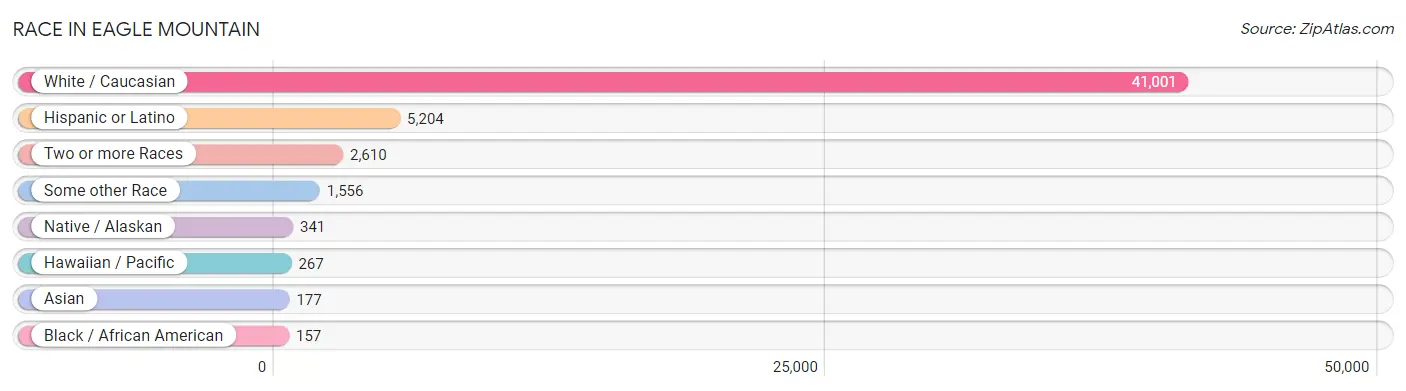
| Race | # Population | % Population |
| Asian | 177 | 0.4% |
| Black / African American | 157 | 0.3% |
| Hawaiian / Pacific | 267 | 0.6% |
| Hispanic or Latino | 5,204 | 11.3% |
| Native / Alaskan | 341 | 0.7% |
| White / Caucasian | 41,001 | 88.9% |
| Two or more Races | 2,610 | 5.7% |
| Some other Race | 1,556 | 3.4% |
| Total | 46,109 | 100.0% |
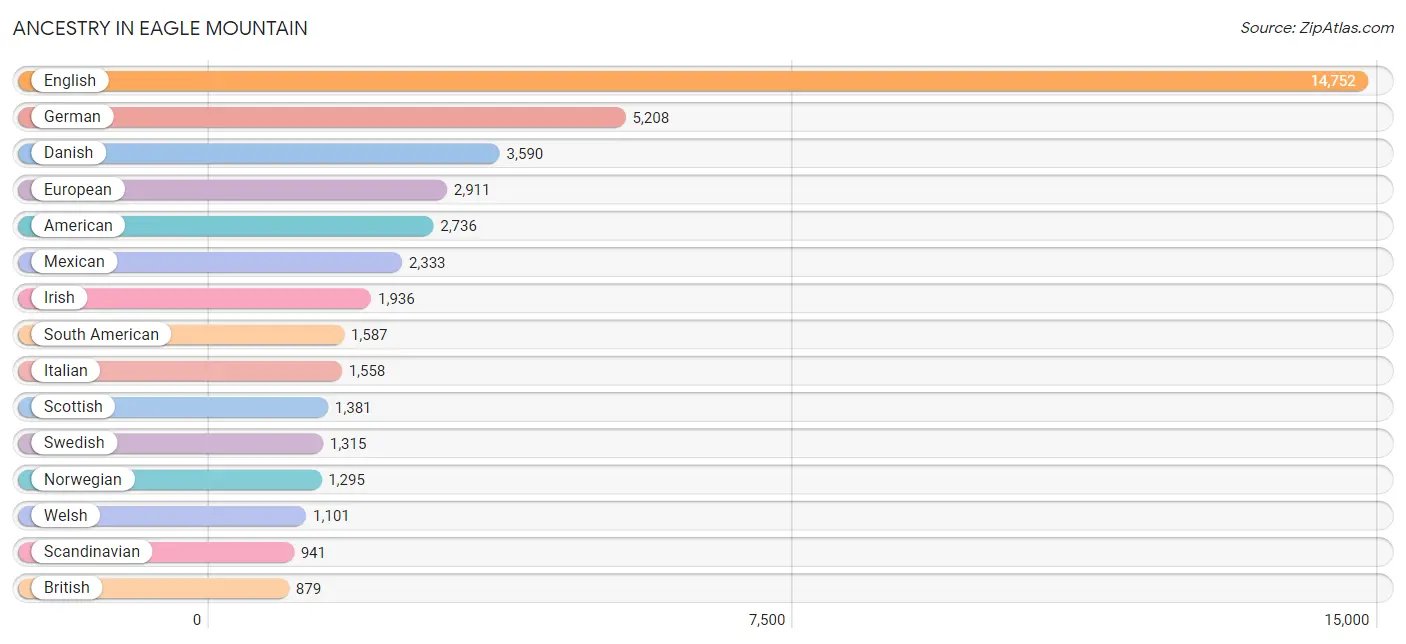
Ancestry in Eagle Mountain
The most populous ancestries reported in Eagle Mountain are English (14,752 | 32.0%), German (5,208 | 11.3%), Danish (3,590 | 7.8%), European (2,911 | 6.3%), and American (2,736 | 5.9%), together accounting for 63.3% of all Eagle Mountain residents.
| Ancestry | # Population | % Population |
| African | 18 | 0.0% |
| Alaska Native | 8 | 0.0% |
| American | 2,736 | 5.9% |
| Arab | 37 | 0.1% |
| Argentinean | 243 | 0.5% |
| Armenian | 25 | 0.1% |
| Austrian | 36 | 0.1% |
| Bhutanese | 428 | 0.9% |
| Bolivian | 16 | 0.0% |
| Brazilian | 115 | 0.3% |
| British | 879 | 1.9% |
| Burmese | 44 | 0.1% |
| Cambodian | 69 | 0.2% |
| Canadian | 52 | 0.1% |
| Celtic | 28 | 0.1% |
| Central American | 527 | 1.1% |
| Cherokee | 67 | 0.2% |
| Chilean | 193 | 0.4% |
| Colombian | 58 | 0.1% |
| Costa Rican | 82 | 0.2% |
| Cuban | 190 | 0.4% |
| Czech | 43 | 0.1% |
| Czechoslovakian | 17 | 0.0% |
| Danish | 3,590 | 7.8% |
| Dominican | 226 | 0.5% |
| Dutch | 741 | 1.6% |
| Ecuadorian | 100 | 0.2% |
| English | 14,752 | 32.0% |
| European | 2,911 | 6.3% |
| Finnish | 16 | 0.0% |
| French | 819 | 1.8% |
| French Canadian | 68 | 0.2% |
| German | 5,208 | 11.3% |
| Greek | 255 | 0.5% |
| Guatemalan | 40 | 0.1% |
| Hungarian | 3 | 0.0% |
| Icelander | 254 | 0.5% |
| Indian (Asian) | 223 | 0.5% |
| Iranian | 33 | 0.1% |
| Irish | 1,936 | 4.2% |
| Israeli | 21 | 0.1% |
| Italian | 1,558 | 3.4% |
| Jamaican | 76 | 0.2% |
| Japanese | 58 | 0.1% |
| Korean | 55 | 0.1% |
| Mexican | 2,333 | 5.1% |
| Mexican American Indian | 213 | 0.5% |
| Moroccan | 20 | 0.0% |
| Native Hawaiian | 55 | 0.1% |
| Navajo | 7 | 0.0% |
| New Zealander | 12 | 0.0% |
| Nigerian | 21 | 0.1% |
| Northern European | 78 | 0.2% |
| Norwegian | 1,295 | 2.8% |
| Peruvian | 353 | 0.8% |
| Polish | 208 | 0.4% |
| Portuguese | 48 | 0.1% |
| Puerto Rican | 137 | 0.3% |
| Romanian | 43 | 0.1% |
| Russian | 234 | 0.5% |
| Salvadoran | 405 | 0.9% |
| Samoan | 201 | 0.4% |
| Scandinavian | 941 | 2.0% |
| Scotch-Irish | 435 | 0.9% |
| Scottish | 1,381 | 3.0% |
| Shoshone | 16 | 0.0% |
| Slovak | 67 | 0.2% |
| Slovene | 18 | 0.0% |
| South American | 1,587 | 3.4% |
| South American Indian | 369 | 0.8% |
| Spaniard | 66 | 0.1% |
| Spanish | 67 | 0.2% |
| Subsaharan African | 39 | 0.1% |
| Swedish | 1,315 | 2.9% |
| Swiss | 429 | 0.9% |
| Syrian | 17 | 0.0% |
| Thai | 10 | 0.0% |
| Tongan | 338 | 0.7% |
| Ukrainian | 27 | 0.1% |
| Venezuelan | 564 | 1.2% |
| Welsh | 1,101 | 2.4% | View All 81 Rows |
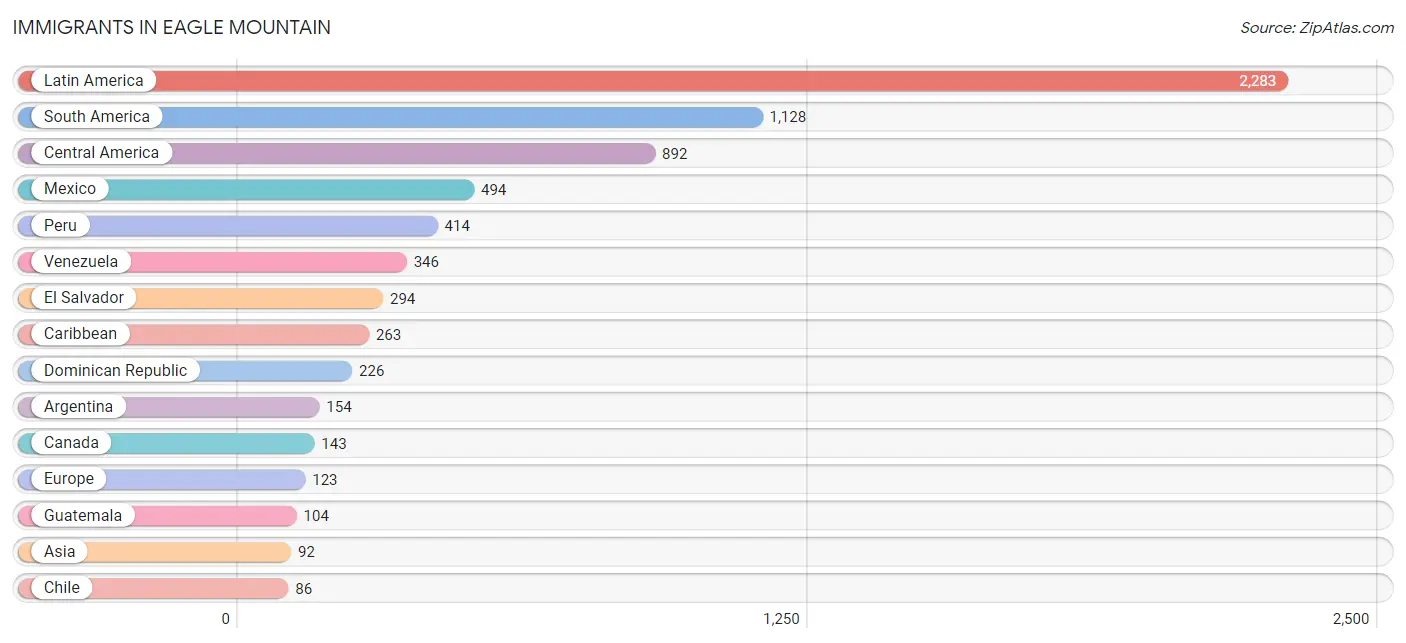
Immigrants in Eagle Mountain
The most numerous immigrant groups reported in Eagle Mountain came from Latin America (2,283 | 5.0%), South America (1,128 | 2.5%), Central America (892 | 1.9%), Mexico (494 | 1.1%), and Peru (414 | 0.9%), together accounting for 11.3% of all Eagle Mountain residents.
| Immigration Origin | # Population | % Population |
| Argentina | 154 | 0.3% |
| Asia | 92 | 0.2% |
| Bolivia | 16 | 0.0% |
| Brazil | 18 | 0.0% |
| Bulgaria | 10 | 0.0% |
| Canada | 143 | 0.3% |
| Caribbean | 263 | 0.6% |
| Central America | 892 | 1.9% |
| Chile | 86 | 0.2% |
| China | 71 | 0.2% |
| Colombia | 21 | 0.1% |
| Czechoslovakia | 19 | 0.0% |
| Dominican Republic | 226 | 0.5% |
| Eastern Asia | 71 | 0.2% |
| Eastern Europe | 29 | 0.1% |
| Ecuador | 34 | 0.1% |
| El Salvador | 294 | 0.6% |
| England | 20 | 0.0% |
| Europe | 123 | 0.3% |
| France | 35 | 0.1% |
| Germany | 23 | 0.1% |
| Guatemala | 104 | 0.2% |
| Hong Kong | 22 | 0.1% |
| Israel | 21 | 0.1% |
| Jamaica | 37 | 0.1% |
| Latin America | 2,283 | 5.0% |
| Mexico | 494 | 1.1% |
| Northern Europe | 36 | 0.1% |
| Peru | 414 | 0.9% |
| South America | 1,128 | 2.5% |
| Venezuela | 346 | 0.7% |
| Western Asia | 21 | 0.1% |
| Western Europe | 58 | 0.1% | View All 33 Rows |
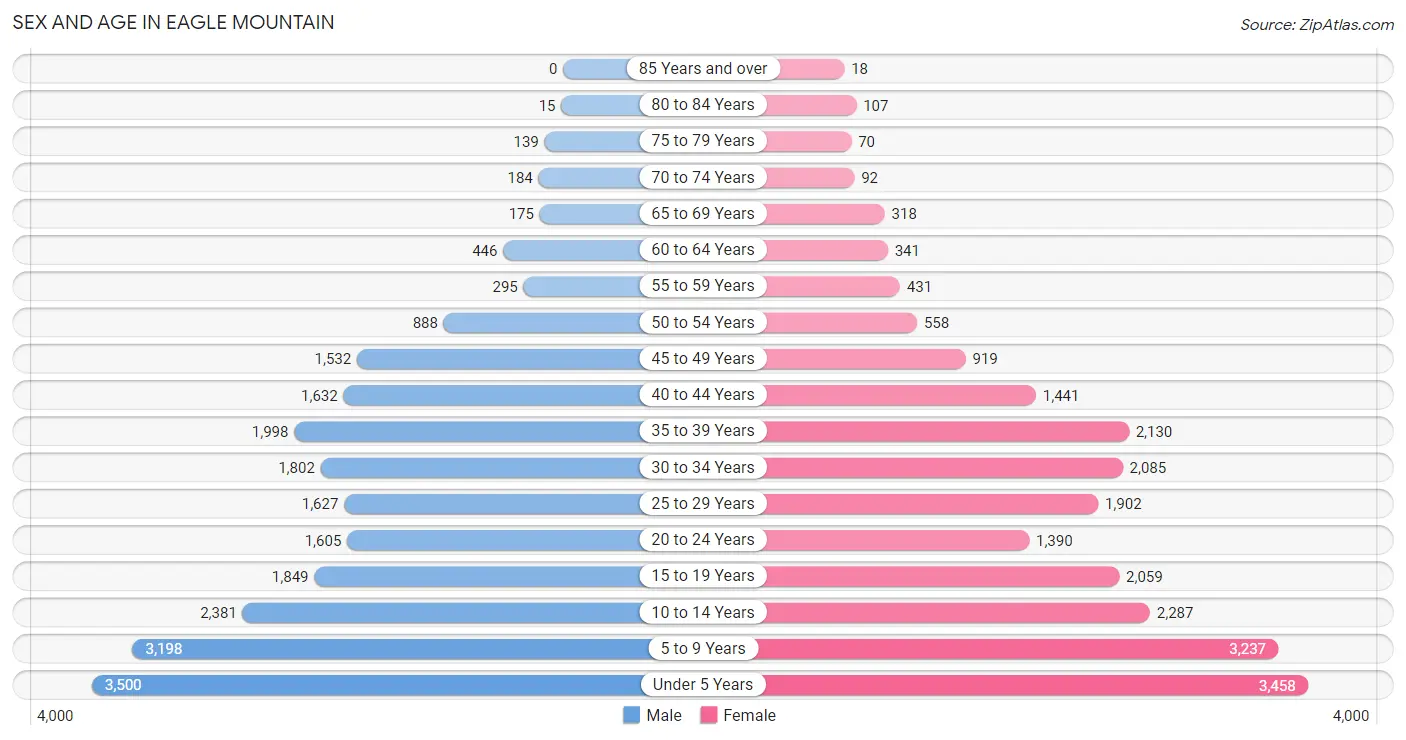
Sex and Age in Eagle Mountain
Sex and Age in Eagle Mountain
The most populous age groups in Eagle Mountain are Under 5 Years (3,500 | 15.0%) for men and Under 5 Years (3,458 | 15.1%) for women.
| Age Bracket | Male | Female |
| Under 5 Years | 3,500 (15.0%) | 3,458 (15.1%) |
| 5 to 9 Years | 3,198 (13.8%) | 3,237 (14.2%) |
| 10 to 14 Years | 2,381 (10.2%) | 2,287 (10.0%) |
| 15 to 19 Years | 1,849 (8.0%) | 2,059 (9.0%) |
| 20 to 24 Years | 1,605 (6.9%) | 1,390 (6.1%) |
| 25 to 29 Years | 1,627 (7.0%) | 1,902 (8.3%) |
| 30 to 34 Years | 1,802 (7.7%) | 2,085 (9.1%) |
| 35 to 39 Years | 1,998 (8.6%) | 2,130 (9.3%) |
| 40 to 44 Years | 1,632 (7.0%) | 1,441 (6.3%) |
| 45 to 49 Years | 1,532 (6.6%) | 919 (4.0%) |
| 50 to 54 Years | 888 (3.8%) | 558 (2.4%) |
| 55 to 59 Years | 295 (1.3%) | 431 (1.9%) |
| 60 to 64 Years | 446 (1.9%) | 341 (1.5%) |
| 65 to 69 Years | 175 (0.7%) | 318 (1.4%) |
| 70 to 74 Years | 184 (0.8%) | 92 (0.4%) |
| 75 to 79 Years | 139 (0.6%) | 70 (0.3%) |
| 80 to 84 Years | 15 (0.1%) | 107 (0.5%) |
| 85 Years and over | 0 (0.0%) | 18 (0.1%) |
| Total | 23,266 (100.0%) | 22,843 (100.0%) |
Families and Households in Eagle Mountain
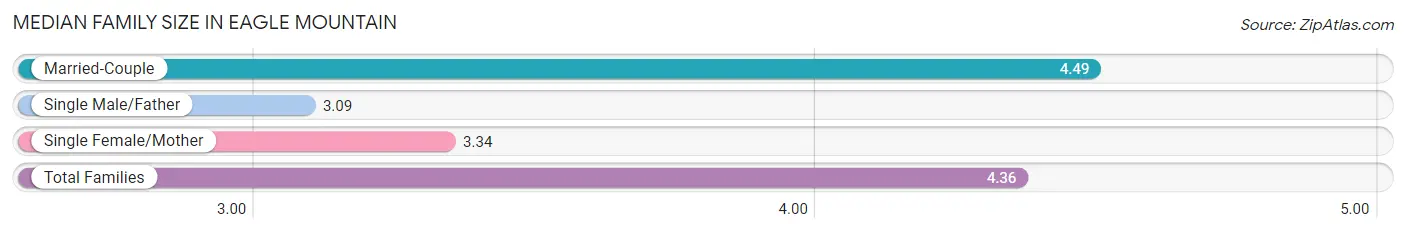
Median Family Size in Eagle Mountain
The median family size in Eagle Mountain is 4.36 persons per family, with married-couple families (9,119 | 89.5%) accounting for the largest median family size of 4.49 persons per family. On the other hand, single male/father families (470 | 4.6%) represent the smallest median family size with 3.09 persons per family.
| Family Type | # Families | Family Size |
| Married-Couple | 9,119 (89.5%) | 4.49 |
| Single Male/Father | 470 (4.6%) | 3.09 |
| Single Female/Mother | 594 (5.8%) | 3.34 |
| Total Families | 10,183 (100.0%) | 4.36 |
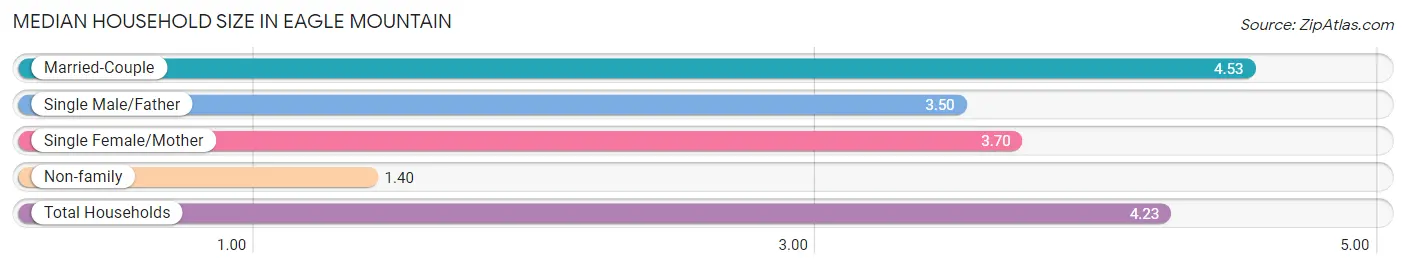
Median Household Size in Eagle Mountain
The median household size in Eagle Mountain is 4.23 persons per household, with married-couple households (9,119 | 83.7%) accounting for the largest median household size of 4.53 persons per household. non-family households (713 | 6.5%) represent the smallest median household size with 1.40 persons per household.
| Household Type | # Households | Household Size |
| Married-Couple | 9,119 (83.7%) | 4.53 |
| Single Male/Father | 470 (4.3%) | 3.50 |
| Single Female/Mother | 594 (5.4%) | 3.70 |
| Non-family | 713 (6.5%) | 1.40 |
| Total Households | 10,896 (100.0%) | 4.23 |
Household Size by Marriage Status in Eagle Mountain
Out of a total of 10,896 households in Eagle Mountain, 10,183 (93.5%) are family households, while 713 (6.5%) are nonfamily households. The most numerous type of family households are 4-person households, comprising 2,574, and the most common type of nonfamily households are 1-person households, comprising 518.
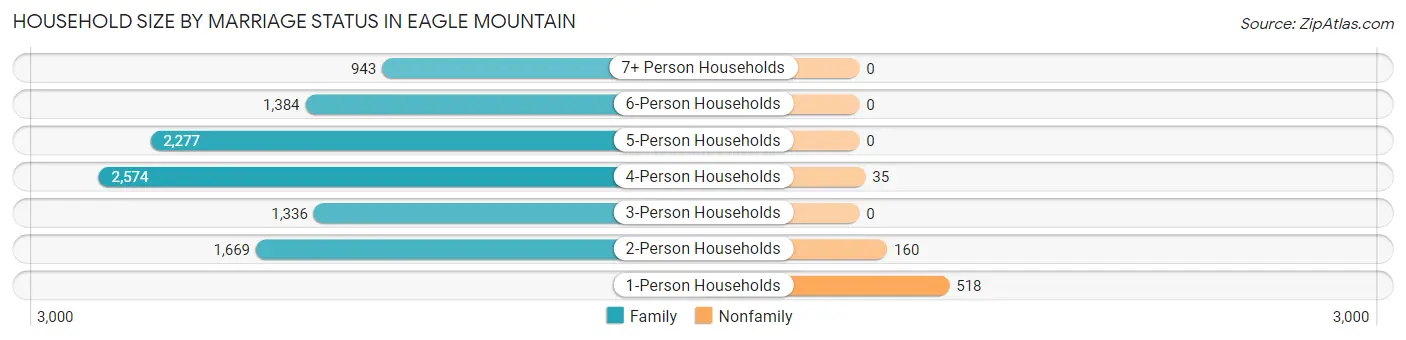
| Household Size | Family Households | Nonfamily Households |
| 1-Person Households | - | 518 (4.8%) |
| 2-Person Households | 1,669 (15.3%) | 160 (1.5%) |
| 3-Person Households | 1,336 (12.3%) | 0 (0.0%) |
| 4-Person Households | 2,574 (23.6%) | 35 (0.3%) |
| 5-Person Households | 2,277 (20.9%) | 0 (0.0%) |
| 6-Person Households | 1,384 (12.7%) | 0 (0.0%) |
| 7+ Person Households | 943 (8.6%) | 0 (0.0%) |
| Total | 10,183 (93.5%) | 713 (6.5%) |
Female Fertility in Eagle Mountain
Fertility by Age in Eagle Mountain
Average fertility rate in Eagle Mountain is 133.0 births per 1,000 women. Women in the age bracket of 20 to 34 years have the highest fertility rate with 223.0 births per 1,000 women. Women in the age bracket of 20 to 34 years acount for 73.9% of all women with births.
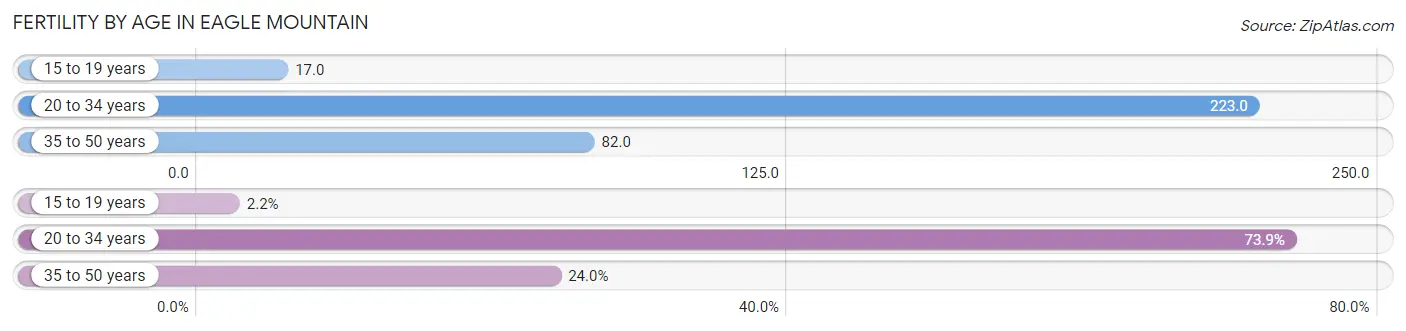
| Age Bracket | Women with Births | Births / 1,000 Women |
| 15 to 19 years | 35 (2.2%) | 17.0 |
| 20 to 34 years | 1,199 (73.9%) | 223.0 |
| 35 to 50 years | 389 (24.0%) | 82.0 |
| Total | 1,623 (100.0%) | 133.0 |
Fertility by Age by Marriage Status in Eagle Mountain
95.1% of women with births (1,623) in Eagle Mountain are married. The highest percentage of unmarried women with births falls into 20 to 34 years age bracket with 6.7% of them unmarried at the time of birth, while the lowest percentage of unmarried women with births belong to 15 to 19 years age bracket with 0.0% of them unmarried.
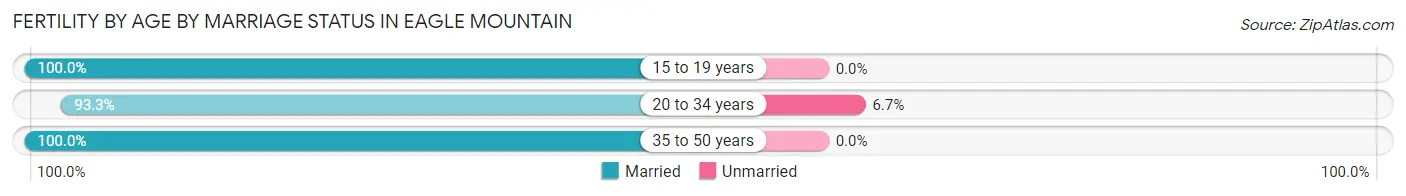
| Age Bracket | Married | Unmarried |
| 15 to 19 years | 35 (100.0%) | 0 (0.0%) |
| 20 to 34 years | 1,119 (93.3%) | 80 (6.7%) |
| 35 to 50 years | 389 (100.0%) | 0 (0.0%) |
| Total | 1,543 (95.1%) | 80 (4.9%) |
Fertility by Education in Eagle Mountain
Average fertility rate in Eagle Mountain is 133.0 births per 1,000 women. Women with the education attainment of graduate degree have the highest fertility rate of 263.0 births per 1,000 women, while women with the education attainment of less than high school have the lowest fertility at 3.0 births per 1,000 women. Women with the education attainment of college or associate's degree represent 44.2% of all women with births.
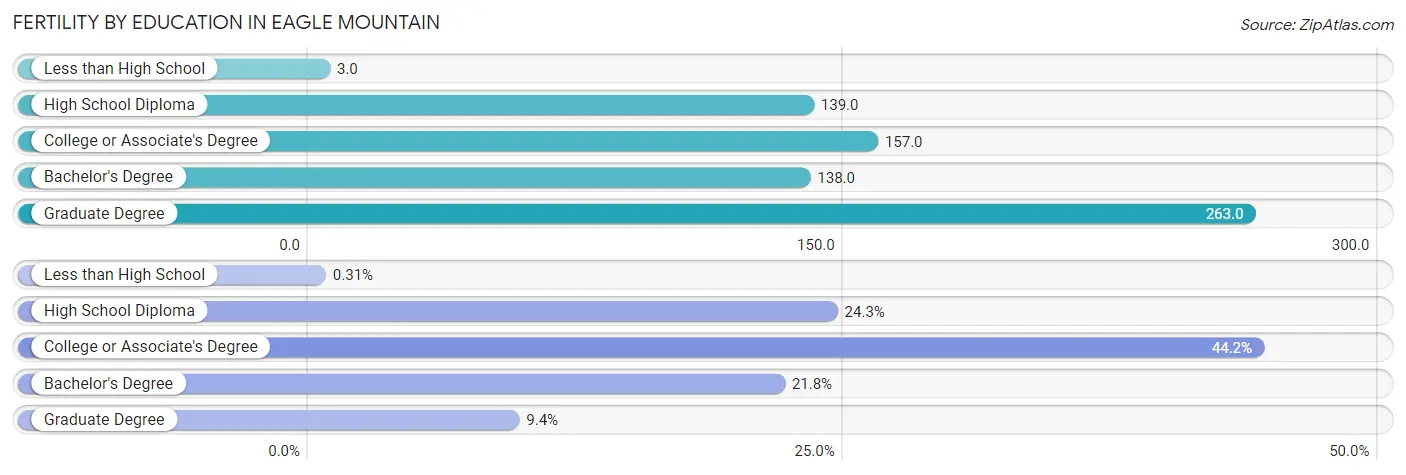
| Educational Attainment | Women with Births | Births / 1,000 Women |
| Less than High School | 5 (0.3%) | 3.0 |
| High School Diploma | 394 (24.3%) | 139.0 |
| College or Associate's Degree | 718 (44.2%) | 157.0 |
| Bachelor's Degree | 354 (21.8%) | 138.0 |
| Graduate Degree | 152 (9.4%) | 263.0 |
| Total | 1,623 (100.0%) | 133.0 |
Fertility by Education by Marriage Status in Eagle Mountain
4.9% of women with births in Eagle Mountain are unmarried. Women with the educational attainment of bachelor's degree are most likely to be married with 100.0% of them married at childbirth, while women with the educational attainment of less than high school are least likely to be married with 100.0% of them unmarried at childbirth.
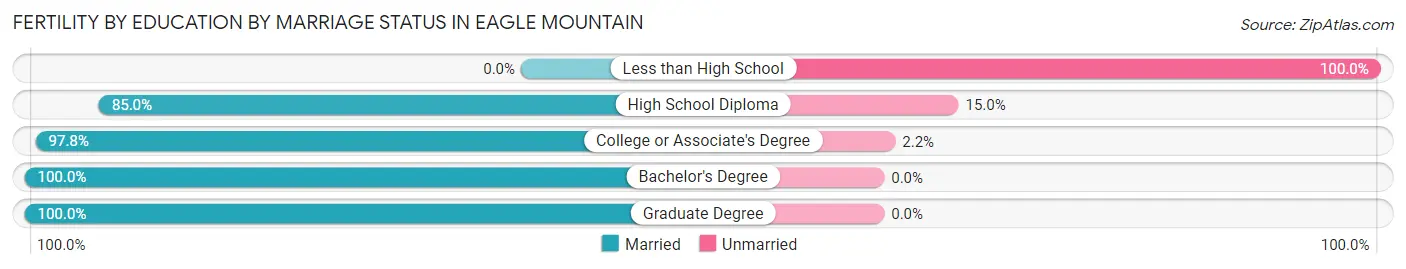
| Educational Attainment | Married | Unmarried |
| Less than High School | 0 (0.0%) | 5 (100.0%) |
| High School Diploma | 335 (85.0%) | 59 (15.0%) |
| College or Associate's Degree | 702 (97.8%) | 16 (2.2%) |
| Bachelor's Degree | 354 (100.0%) | 0 (0.0%) |
| Graduate Degree | 152 (100.0%) | 0 (0.0%) |
| Total | 1,543 (95.1%) | 80 (4.9%) |
Employment Characteristics in Eagle Mountain
Employment by Class of Employer in Eagle Mountain
Among the 19,724 employed individuals in Eagle Mountain, private company employees (14,233 | 72.2%), local government employees (1,891 | 9.6%), and not-for-profit organizations (1,357 | 6.9%) make up the most common classes of employment.
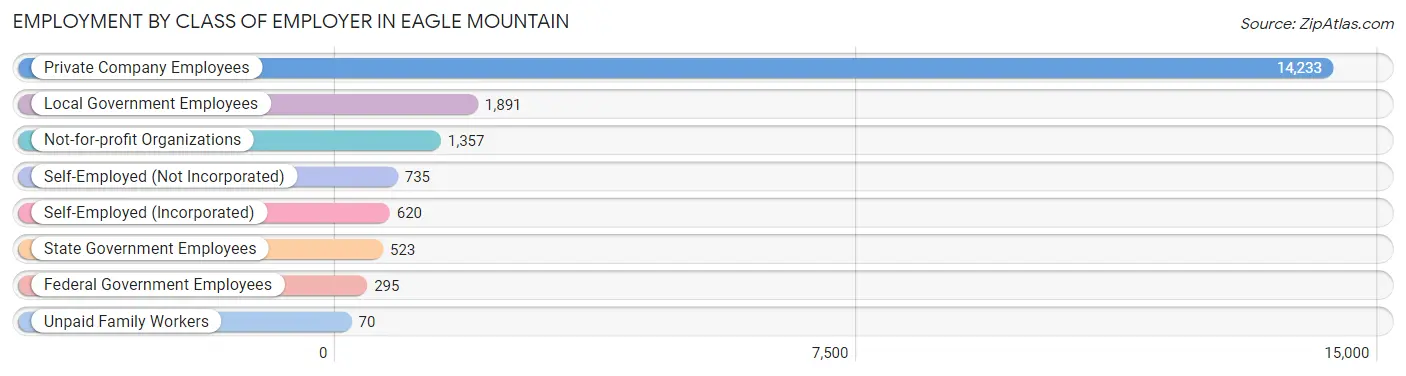
| Employer Class | # Employees | % Employees |
| Private Company Employees | 14,233 | 72.2% |
| Self-Employed (Incorporated) | 620 | 3.1% |
| Self-Employed (Not Incorporated) | 735 | 3.7% |
| Not-for-profit Organizations | 1,357 | 6.9% |
| Local Government Employees | 1,891 | 9.6% |
| State Government Employees | 523 | 2.6% |
| Federal Government Employees | 295 | 1.5% |
| Unpaid Family Workers | 70 | 0.4% |
| Total | 19,724 | 100.0% |
Employment Status by Age in Eagle Mountain
According to the labor force statistics for Eagle Mountain, out of the total population over 16 years of age (27,190), 76.0% or 20,664 individuals are in the labor force, with 3.4% or 703 of them unemployed. The age group with the highest labor force participation rate is 20 to 24 years, with 88.7% or 2,657 individuals in the labor force. Within the labor force, the 65 to 74 years age range has the highest percentage of unemployed individuals, with 31.3% or 87 of them being unemployed.
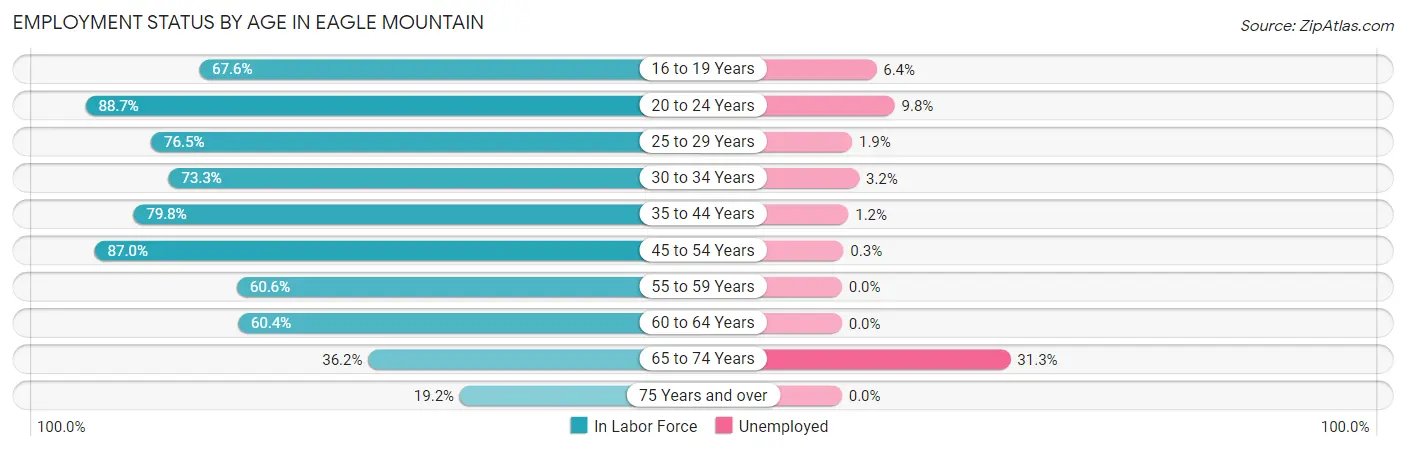
| Age Bracket | In Labor Force | Unemployed |
| 16 to 19 Years | 2,062 (67.6%) | 132 (6.4%) |
| 20 to 24 Years | 2,657 (88.7%) | 260 (9.8%) |
| 25 to 29 Years | 2,700 (76.5%) | 51 (1.9%) |
| 30 to 34 Years | 2,849 (73.3%) | 91 (3.2%) |
| 35 to 44 Years | 5,746 (79.8%) | 69 (1.2%) |
| 45 to 54 Years | 3,390 (87.0%) | 10 (0.3%) |
| 55 to 59 Years | 440 (60.6%) | 0 (0.0%) |
| 60 to 64 Years | 475 (60.4%) | 0 (0.0%) |
| 65 to 74 Years | 278 (36.2%) | 87 (31.3%) |
| 75 Years and over | 67 (19.2%) | 0 (0.0%) |
| Total | 20,664 (76.0%) | 703 (3.4%) |
Employment Status by Educational Attainment in Eagle Mountain
According to labor force statistics for Eagle Mountain, 77.9% of individuals (15,601) out of the total population between 25 and 64 years of age (20,027) are in the labor force, with 1.4% or 218 of them being unemployed. The group with the highest labor force participation rate are those with the educational attainment of bachelor's degree or higher, with 85.5% or 6,339 individuals in the labor force. Within the labor force, individuals with bachelor's degree or higher education have the highest percentage of unemployment, with 2.4% or 152 of them being unemployed.
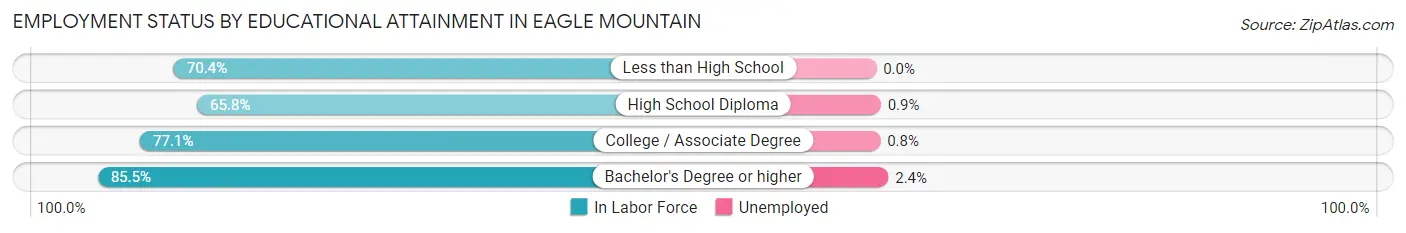
| Educational Attainment | In Labor Force | Unemployed |
| Less than High School | 468 (70.4%) | 0 (0.0%) |
| High School Diploma | 2,425 (65.8%) | 33 (0.9%) |
| College / Associate Degree | 6,371 (77.1%) | 66 (0.8%) |
| Bachelor's Degree or higher | 6,339 (85.5%) | 178 (2.4%) |
| Total | 15,601 (77.9%) | 280 (1.4%) |
Employment Occupations by Sex in Eagle Mountain
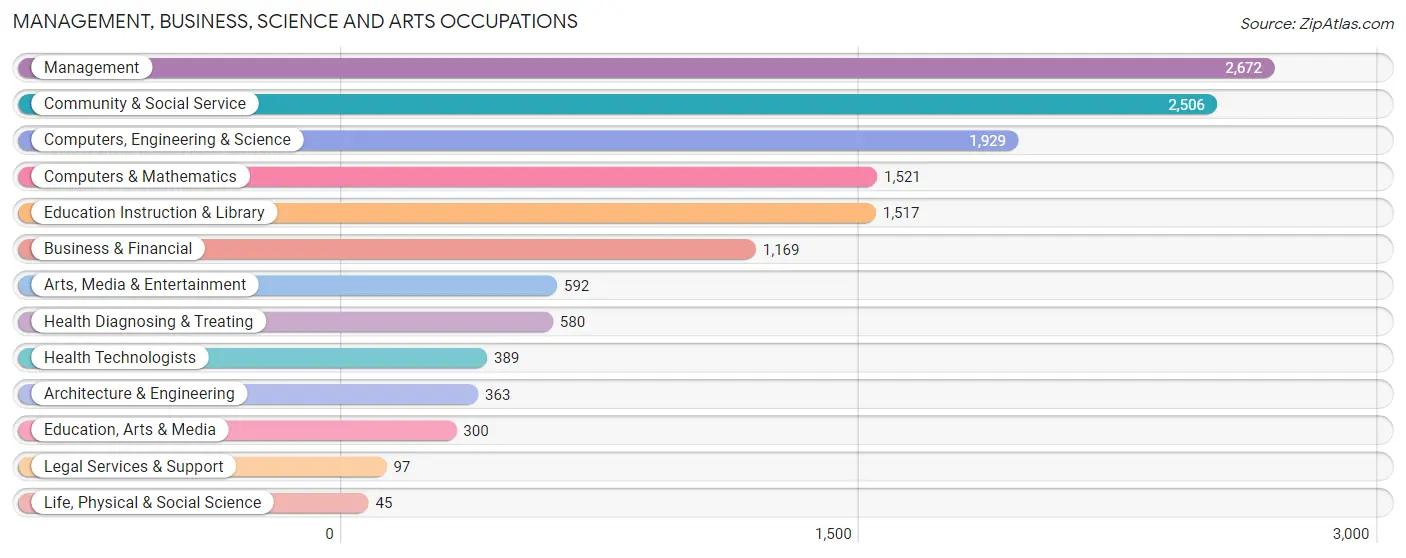
Management, Business, Science and Arts Occupations
The most common Management, Business, Science and Arts occupations in Eagle Mountain are Management (2,672 | 13.5%), Community & Social Service (2,506 | 12.7%), Computers, Engineering & Science (1,929 | 9.7%), Computers & Mathematics (1,521 | 7.7%), and Education Instruction & Library (1,517 | 7.7%).
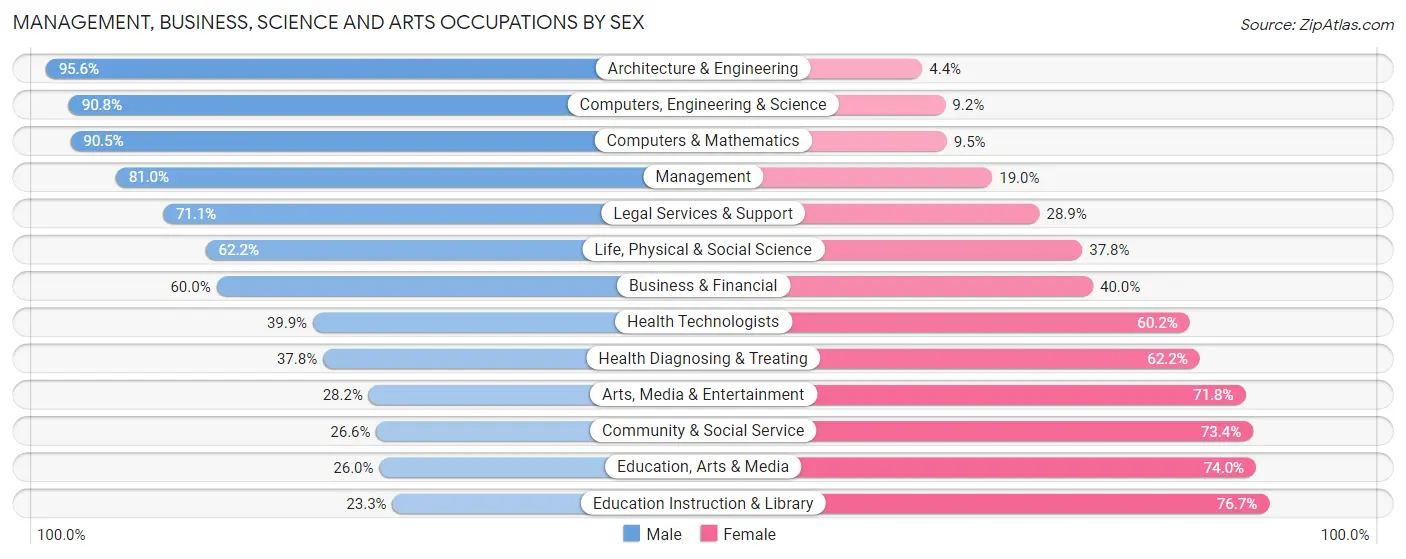
Management, Business, Science and Arts Occupations by Sex
Within the Management, Business, Science and Arts occupations in Eagle Mountain, the most male-oriented occupations are Architecture & Engineering (95.6%), Computers, Engineering & Science (90.8%), and Computers & Mathematics (90.5%), while the most female-oriented occupations are Education Instruction & Library (76.7%), Education, Arts & Media (74.0%), and Community & Social Service (73.4%).
| Occupation | Male | Female |
| Management | 2,164 (81.0%) | 508 (19.0%) |
| Business & Financial | 701 (60.0%) | 468 (40.0%) |
| Computers, Engineering & Science | 1,751 (90.8%) | 178 (9.2%) |
| Computers & Mathematics | 1,376 (90.5%) | 145 (9.5%) |
| Architecture & Engineering | 347 (95.6%) | 16 (4.4%) |
| Life, Physical & Social Science | 28 (62.2%) | 17 (37.8%) |
| Community & Social Service | 667 (26.6%) | 1,839 (73.4%) |
| Education, Arts & Media | 78 (26.0%) | 222 (74.0%) |
| Legal Services & Support | 69 (71.1%) | 28 (28.9%) |
| Education Instruction & Library | 353 (23.3%) | 1,164 (76.7%) |
| Arts, Media & Entertainment | 167 (28.2%) | 425 (71.8%) |
| Health Diagnosing & Treating | 219 (37.8%) | 361 (62.2%) |
| Health Technologists | 155 (39.9%) | 234 (60.2%) |
| Total (Category) | 5,502 (62.1%) | 3,354 (37.9%) |
| Total (Overall) | 12,175 (61.5%) | 7,639 (38.6%) |
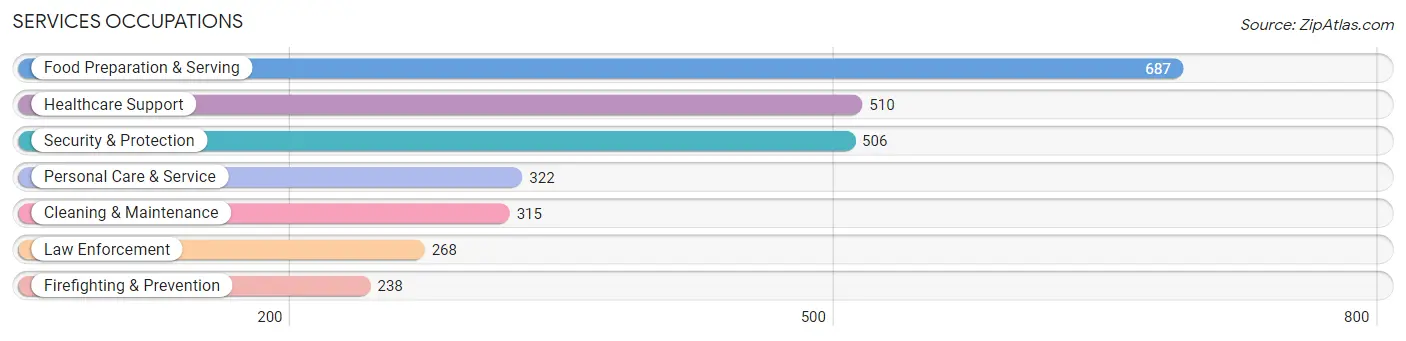
Services Occupations
The most common Services occupations in Eagle Mountain are Food Preparation & Serving (687 | 3.5%), Healthcare Support (510 | 2.6%), Security & Protection (506 | 2.5%), Personal Care & Service (322 | 1.6%), and Cleaning & Maintenance (315 | 1.6%).
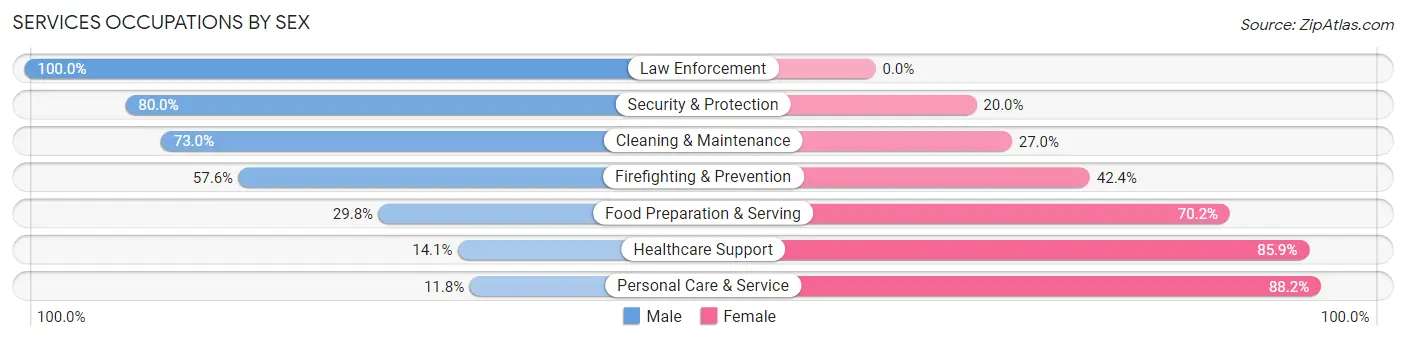
Services Occupations by Sex
Within the Services occupations in Eagle Mountain, the most male-oriented occupations are Law Enforcement (100.0%), Security & Protection (80.0%), and Cleaning & Maintenance (73.0%), while the most female-oriented occupations are Personal Care & Service (88.2%), Healthcare Support (85.9%), and Food Preparation & Serving (70.2%).
| Occupation | Male | Female |
| Healthcare Support | 72 (14.1%) | 438 (85.9%) |
| Security & Protection | 405 (80.0%) | 101 (20.0%) |
| Firefighting & Prevention | 137 (57.6%) | 101 (42.4%) |
| Law Enforcement | 268 (100.0%) | 0 (0.0%) |
| Food Preparation & Serving | 205 (29.8%) | 482 (70.2%) |
| Cleaning & Maintenance | 230 (73.0%) | 85 (27.0%) |
| Personal Care & Service | 38 (11.8%) | 284 (88.2%) |
| Total (Category) | 950 (40.6%) | 1,390 (59.4%) |
| Total (Overall) | 12,175 (61.5%) | 7,639 (38.6%) |
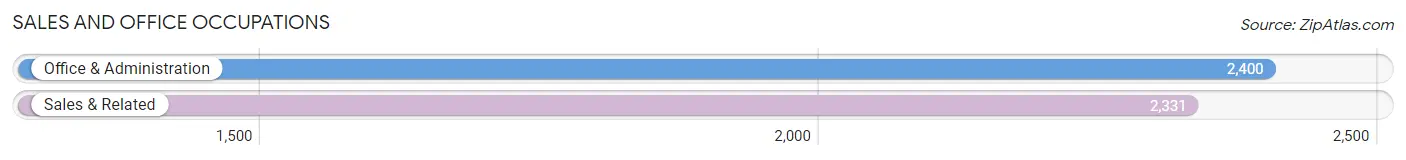
Sales and Office Occupations
The most common Sales and Office occupations in Eagle Mountain are Office & Administration (2,400 | 12.1%), and Sales & Related (2,331 | 11.8%).
Sales and Office Occupations by Sex
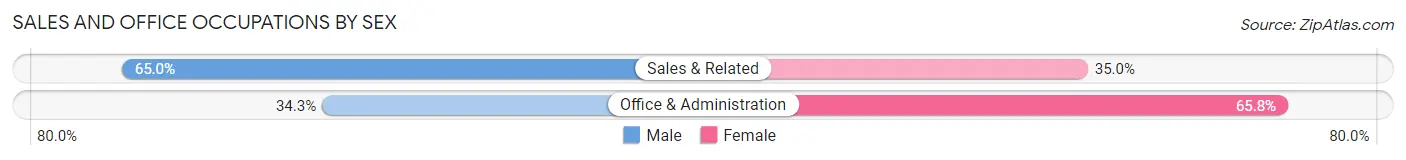
| Occupation | Male | Female |
| Sales & Related | 1,516 (65.0%) | 815 (35.0%) |
| Office & Administration | 822 (34.3%) | 1,578 (65.7%) |
| Total (Category) | 2,338 (49.4%) | 2,393 (50.6%) |
| Total (Overall) | 12,175 (61.5%) | 7,639 (38.6%) |
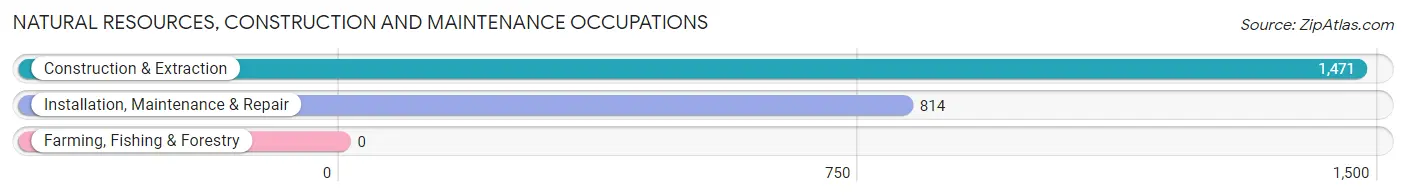
Natural Resources, Construction and Maintenance Occupations
The most common Natural Resources, Construction and Maintenance occupations in Eagle Mountain are Construction & Extraction (1,471 | 7.4%), and Installation, Maintenance & Repair (814 | 4.1%).
Natural Resources, Construction and Maintenance Occupations by Sex
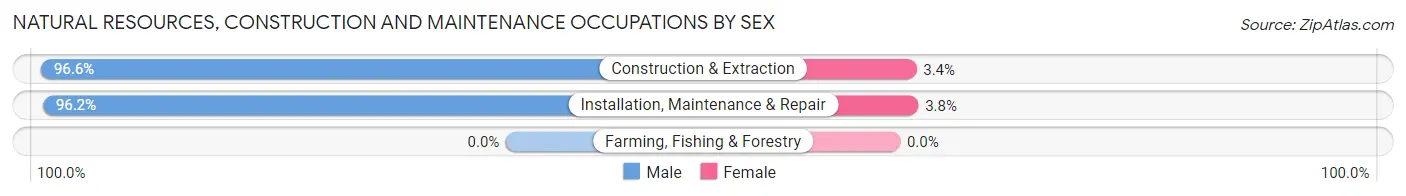
| Occupation | Male | Female |
| Farming, Fishing & Forestry | 0 (0.0%) | 0 (0.0%) |
| Construction & Extraction | 1,421 (96.6%) | 50 (3.4%) |
| Installation, Maintenance & Repair | 783 (96.2%) | 31 (3.8%) |
| Total (Category) | 2,204 (96.5%) | 81 (3.5%) |
| Total (Overall) | 12,175 (61.5%) | 7,639 (38.6%) |
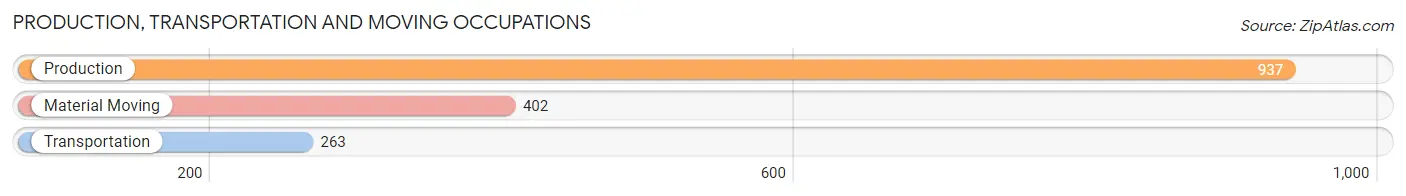
Production, Transportation and Moving Occupations
The most common Production, Transportation and Moving occupations in Eagle Mountain are Production (937 | 4.7%), Material Moving (402 | 2.0%), and Transportation (263 | 1.3%).
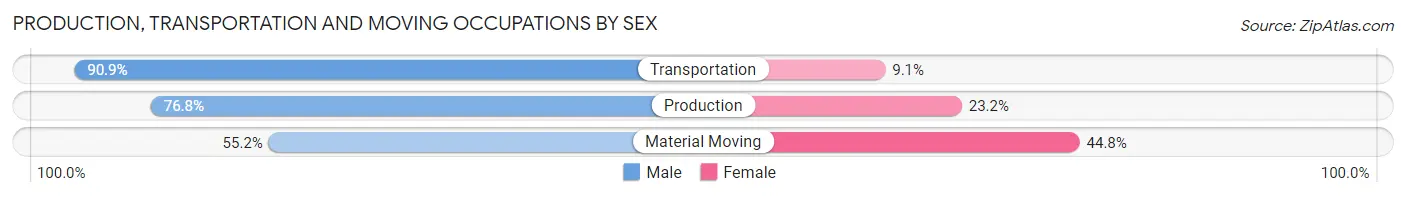
Production, Transportation and Moving Occupations by Sex
| Occupation | Male | Female |
| Production | 720 (76.8%) | 217 (23.2%) |
| Transportation | 239 (90.9%) | 24 (9.1%) |
| Material Moving | 222 (55.2%) | 180 (44.8%) |
| Total (Category) | 1,181 (73.7%) | 421 (26.3%) |
| Total (Overall) | 12,175 (61.5%) | 7,639 (38.6%) |
Employment Industries by Sex in Eagle Mountain
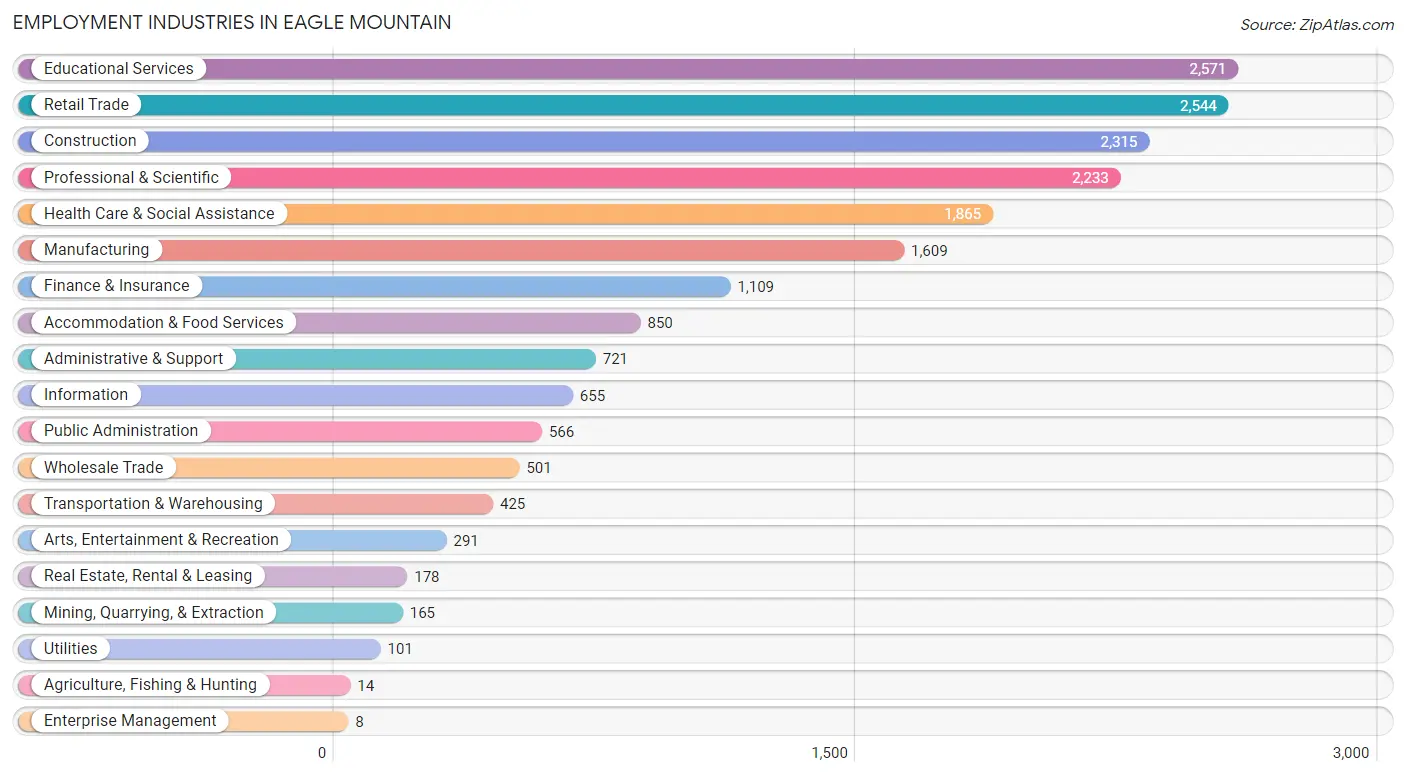
Employment Industries in Eagle Mountain
The major employment industries in Eagle Mountain include Educational Services (2,571 | 13.0%), Retail Trade (2,544 | 12.8%), Construction (2,315 | 11.7%), Professional & Scientific (2,233 | 11.3%), and Health Care & Social Assistance (1,865 | 9.4%).
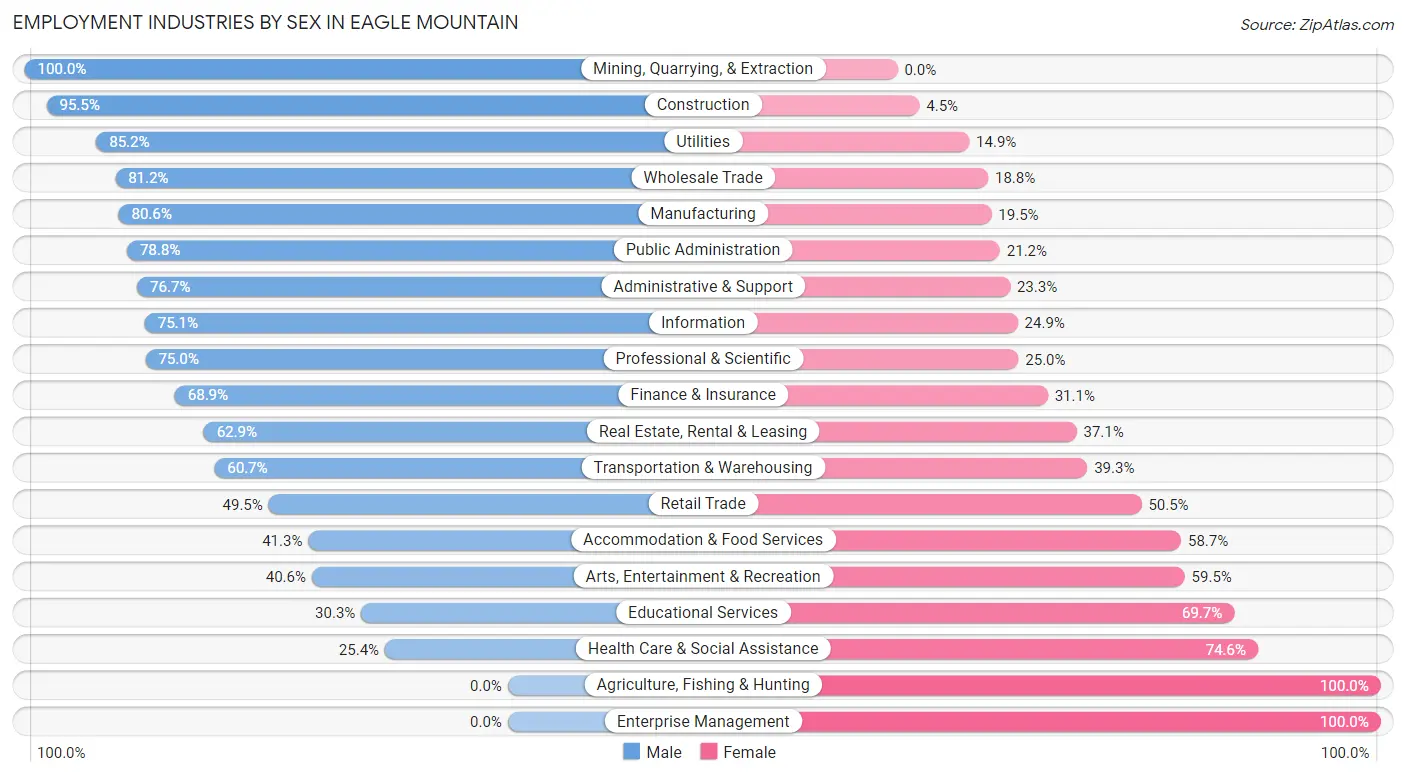
Employment Industries by Sex in Eagle Mountain
The Eagle Mountain industries that see more men than women are Mining, Quarrying, & Extraction (100.0%), Construction (95.5%), and Utilities (85.2%), whereas the industries that tend to have a higher number of women are Agriculture, Fishing & Hunting (100.0%), Enterprise Management (100.0%), and Health Care & Social Assistance (74.6%).
| Industry | Male | Female |
| Agriculture, Fishing & Hunting | 0 (0.0%) | 14 (100.0%) |
| Mining, Quarrying, & Extraction | 165 (100.0%) | 0 (0.0%) |
| Construction | 2,210 (95.5%) | 105 (4.5%) |
| Manufacturing | 1,296 (80.5%) | 313 (19.5%) |
| Wholesale Trade | 407 (81.2%) | 94 (18.8%) |
| Retail Trade | 1,259 (49.5%) | 1,285 (50.5%) |
| Transportation & Warehousing | 258 (60.7%) | 167 (39.3%) |
| Utilities | 86 (85.2%) | 15 (14.8%) |
| Information | 492 (75.1%) | 163 (24.9%) |
| Finance & Insurance | 764 (68.9%) | 345 (31.1%) |
| Real Estate, Rental & Leasing | 112 (62.9%) | 66 (37.1%) |
| Professional & Scientific | 1,674 (75.0%) | 559 (25.0%) |
| Enterprise Management | 0 (0.0%) | 8 (100.0%) |
| Administrative & Support | 553 (76.7%) | 168 (23.3%) |
| Educational Services | 780 (30.3%) | 1,791 (69.7%) |
| Health Care & Social Assistance | 474 (25.4%) | 1,391 (74.6%) |
| Arts, Entertainment & Recreation | 118 (40.6%) | 173 (59.5%) |
| Accommodation & Food Services | 351 (41.3%) | 499 (58.7%) |
| Public Administration | 446 (78.8%) | 120 (21.2%) |
| Total | 12,175 (61.5%) | 7,639 (38.6%) |
Education in Eagle Mountain
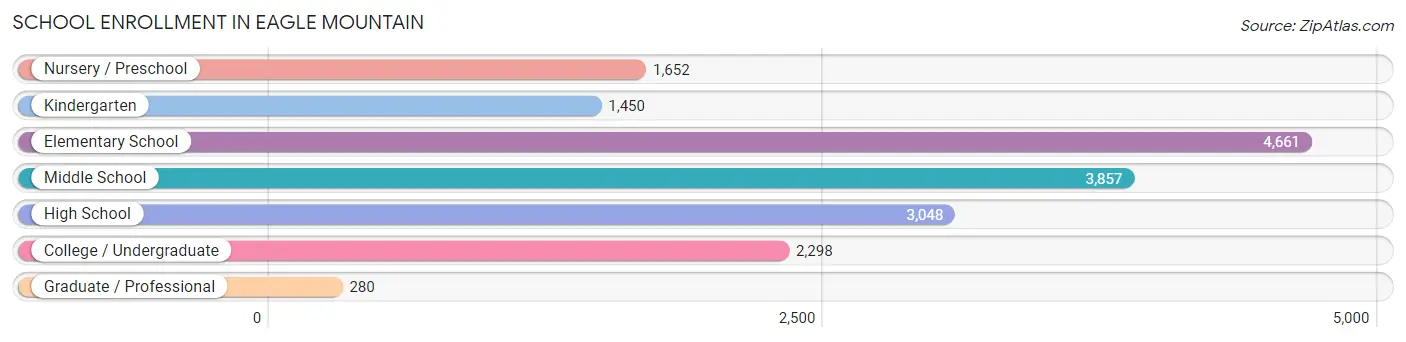
School Enrollment in Eagle Mountain
The most common levels of schooling among the 17,246 students in Eagle Mountain are elementary school (4,661 | 27.0%), middle school (3,857 | 22.4%), and high school (3,048 | 17.7%).
| School Level | # Students | % Students |
| Nursery / Preschool | 1,652 | 9.6% |
| Kindergarten | 1,450 | 8.4% |
| Elementary School | 4,661 | 27.0% |
| Middle School | 3,857 | 22.4% |
| High School | 3,048 | 17.7% |
| College / Undergraduate | 2,298 | 13.3% |
| Graduate / Professional | 280 | 1.6% |
| Total | 17,246 | 100.0% |
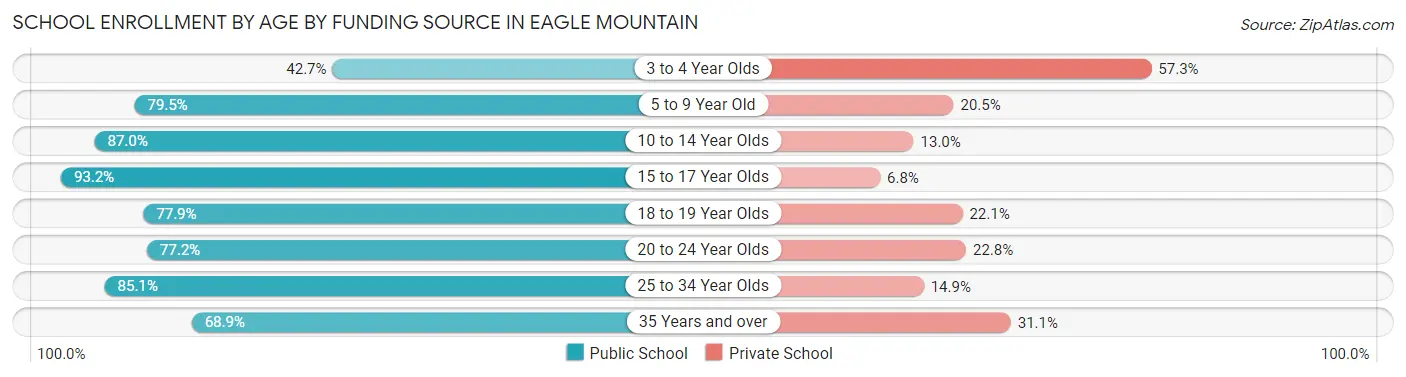
School Enrollment by Age by Funding Source in Eagle Mountain
Out of a total of 17,246 students who are enrolled in schools in Eagle Mountain, 3,380 (19.6%) attend a private institution, while the remaining 13,866 (80.4%) are enrolled in public schools. The age group of 3 to 4 year olds has the highest likelihood of being enrolled in private schools, with 689 (57.3% in the age bracket) enrolled. Conversely, the age group of 15 to 17 year olds has the lowest likelihood of being enrolled in a private school, with 2,048 (93.2% in the age bracket) attending a public institution.
| Age Bracket | Public School | Private School |
| 3 to 4 Year Olds | 513 (42.7%) | 689 (57.3%) |
| 5 to 9 Year Old | 4,902 (79.5%) | 1,261 (20.5%) |
| 10 to 14 Year Olds | 3,972 (87.0%) | 595 (13.0%) |
| 15 to 17 Year Olds | 2,048 (93.2%) | 149 (6.8%) |
| 18 to 19 Year Olds | 753 (77.9%) | 214 (22.1%) |
| 20 to 24 Year Olds | 593 (77.2%) | 175 (22.8%) |
| 25 to 34 Year Olds | 725 (85.1%) | 127 (14.9%) |
| 35 Years and over | 365 (68.9%) | 165 (31.1%) |
| Total | 13,866 (80.4%) | 3,380 (19.6%) |
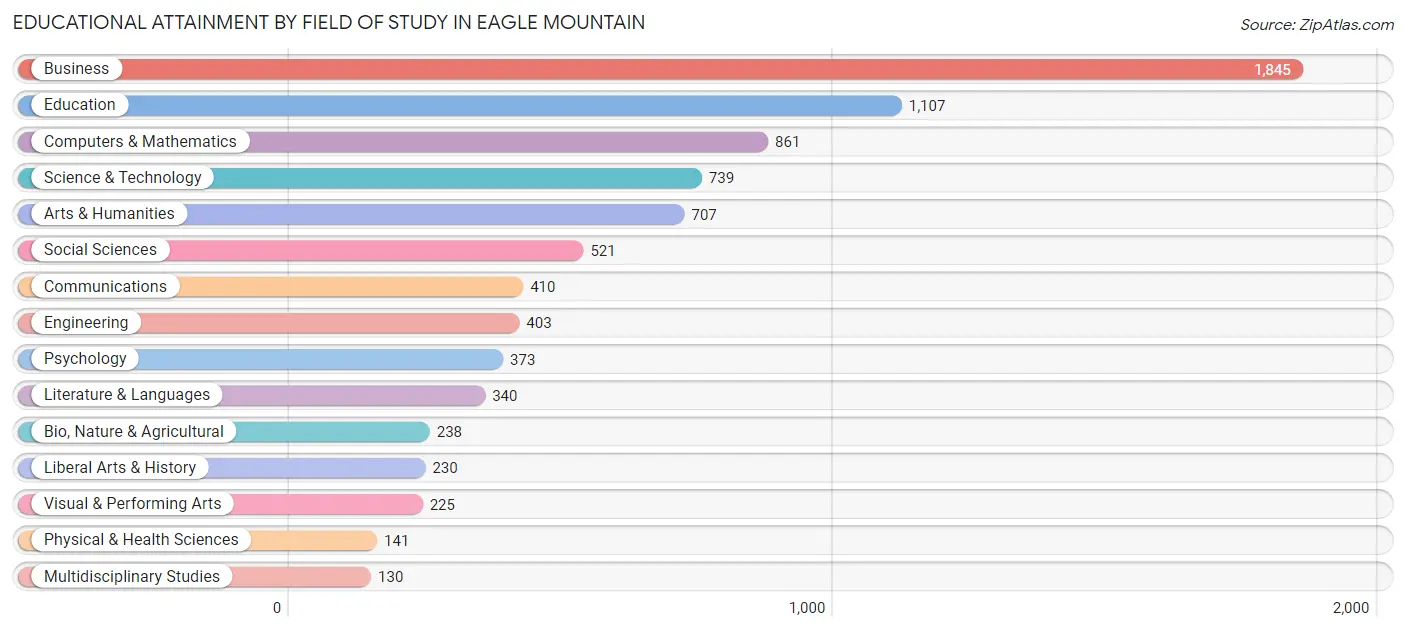
Educational Attainment by Field of Study in Eagle Mountain
Business (1,845 | 22.3%), education (1,107 | 13.4%), computers & mathematics (861 | 10.4%), science & technology (739 | 8.9%), and arts & humanities (707 | 8.6%) are the most common fields of study among 8,270 individuals in Eagle Mountain who have obtained a bachelor's degree or higher.
| Field of Study | # Graduates | % Graduates |
| Computers & Mathematics | 861 | 10.4% |
| Bio, Nature & Agricultural | 238 | 2.9% |
| Physical & Health Sciences | 141 | 1.7% |
| Psychology | 373 | 4.5% |
| Social Sciences | 521 | 6.3% |
| Engineering | 403 | 4.9% |
| Multidisciplinary Studies | 130 | 1.6% |
| Science & Technology | 739 | 8.9% |
| Business | 1,845 | 22.3% |
| Education | 1,107 | 13.4% |
| Literature & Languages | 340 | 4.1% |
| Liberal Arts & History | 230 | 2.8% |
| Visual & Performing Arts | 225 | 2.7% |
| Communications | 410 | 5.0% |
| Arts & Humanities | 707 | 8.6% |
| Total | 8,270 | 100.0% |
Transportation & Commute in Eagle Mountain
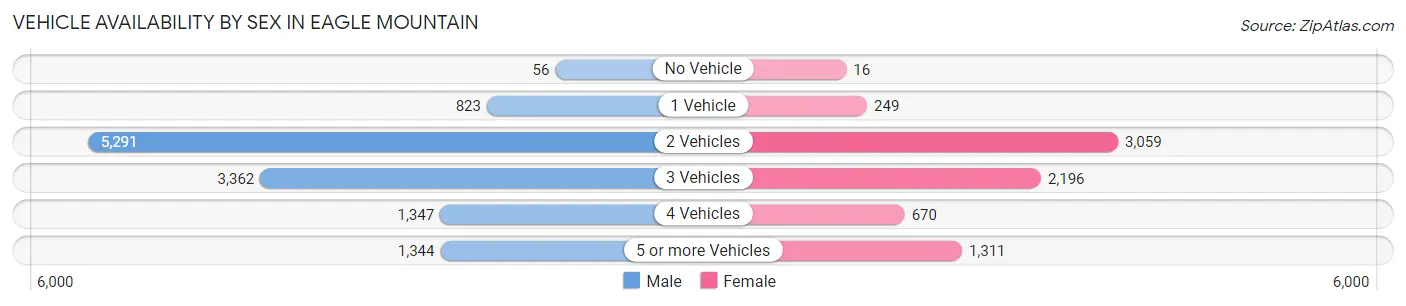
Vehicle Availability by Sex in Eagle Mountain
The most prevalent vehicle ownership categories in Eagle Mountain are males with 2 vehicles (5,291, accounting for 43.3%) and females with 2 vehicles (3,059, making up 70.5%).
| Vehicles Available | Male | Female |
| No Vehicle | 56 (0.5%) | 16 (0.2%) |
| 1 Vehicle | 823 (6.7%) | 249 (3.3%) |
| 2 Vehicles | 5,291 (43.3%) | 3,059 (40.8%) |
| 3 Vehicles | 3,362 (27.5%) | 2,196 (29.3%) |
| 4 Vehicles | 1,347 (11.0%) | 670 (8.9%) |
| 5 or more Vehicles | 1,344 (11.0%) | 1,311 (17.5%) |
| Total | 12,223 (100.0%) | 7,501 (100.0%) |
Commute Time in Eagle Mountain
The most frequently occuring commute durations in Eagle Mountain are 30 to 34 minutes (2,944 commuters, 18.0%), 45 to 59 minutes (2,255 commuters, 13.8%), and 40 to 44 minutes (1,690 commuters, 10.4%).
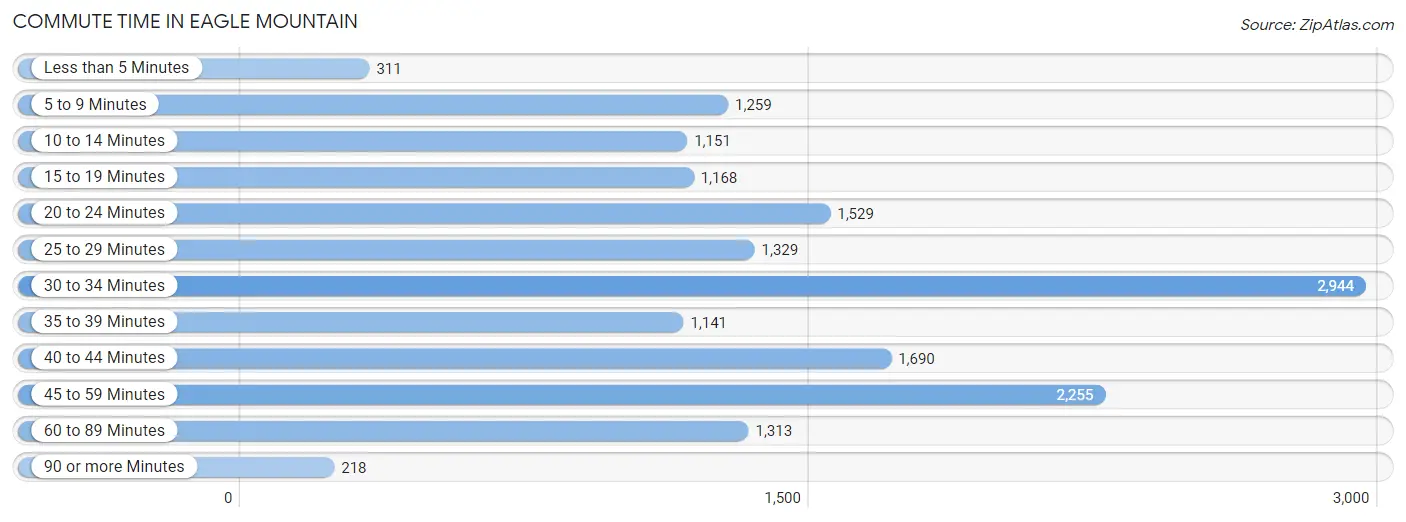
| Commute Time | # Commuters | % Commuters |
| Less than 5 Minutes | 311 | 1.9% |
| 5 to 9 Minutes | 1,259 | 7.7% |
| 10 to 14 Minutes | 1,151 | 7.1% |
| 15 to 19 Minutes | 1,168 | 7.2% |
| 20 to 24 Minutes | 1,529 | 9.4% |
| 25 to 29 Minutes | 1,329 | 8.2% |
| 30 to 34 Minutes | 2,944 | 18.0% |
| 35 to 39 Minutes | 1,141 | 7.0% |
| 40 to 44 Minutes | 1,690 | 10.4% |
| 45 to 59 Minutes | 2,255 | 13.8% |
| 60 to 89 Minutes | 1,313 | 8.1% |
| 90 or more Minutes | 218 | 1.3% |
Commute Time by Sex in Eagle Mountain
The most common commute times in Eagle Mountain are 30 to 34 minutes (2,125 commuters, 20.8%) for males and 30 to 34 minutes (819 commuters, 13.4%) for females.
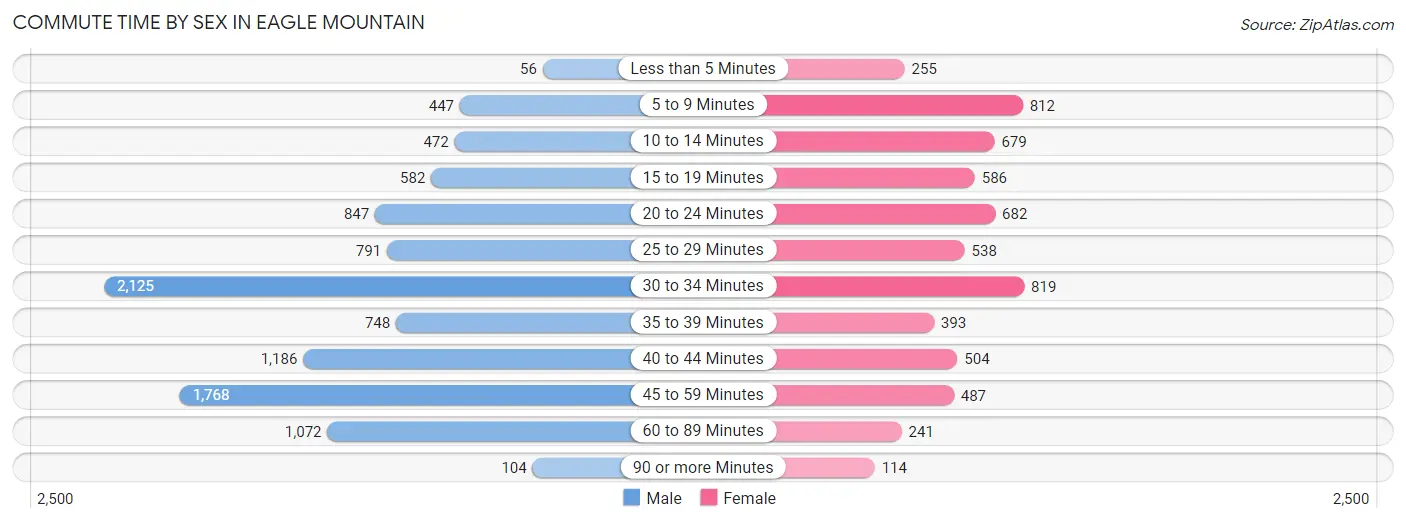
| Commute Time | Male | Female |
| Less than 5 Minutes | 56 (0.5%) | 255 (4.2%) |
| 5 to 9 Minutes | 447 (4.4%) | 812 (13.3%) |
| 10 to 14 Minutes | 472 (4.6%) | 679 (11.1%) |
| 15 to 19 Minutes | 582 (5.7%) | 586 (9.6%) |
| 20 to 24 Minutes | 847 (8.3%) | 682 (11.2%) |
| 25 to 29 Minutes | 791 (7.8%) | 538 (8.8%) |
| 30 to 34 Minutes | 2,125 (20.8%) | 819 (13.4%) |
| 35 to 39 Minutes | 748 (7.3%) | 393 (6.4%) |
| 40 to 44 Minutes | 1,186 (11.6%) | 504 (8.3%) |
| 45 to 59 Minutes | 1,768 (17.3%) | 487 (8.0%) |
| 60 to 89 Minutes | 1,072 (10.5%) | 241 (3.9%) |
| 90 or more Minutes | 104 (1.0%) | 114 (1.9%) |
Time of Departure to Work by Sex in Eagle Mountain
The most frequent times of departure to work in Eagle Mountain are 7:00 AM to 7:29 AM (1,641, 16.1%) for males and 7:00 AM to 7:29 AM (1,066, 17.4%) for females.
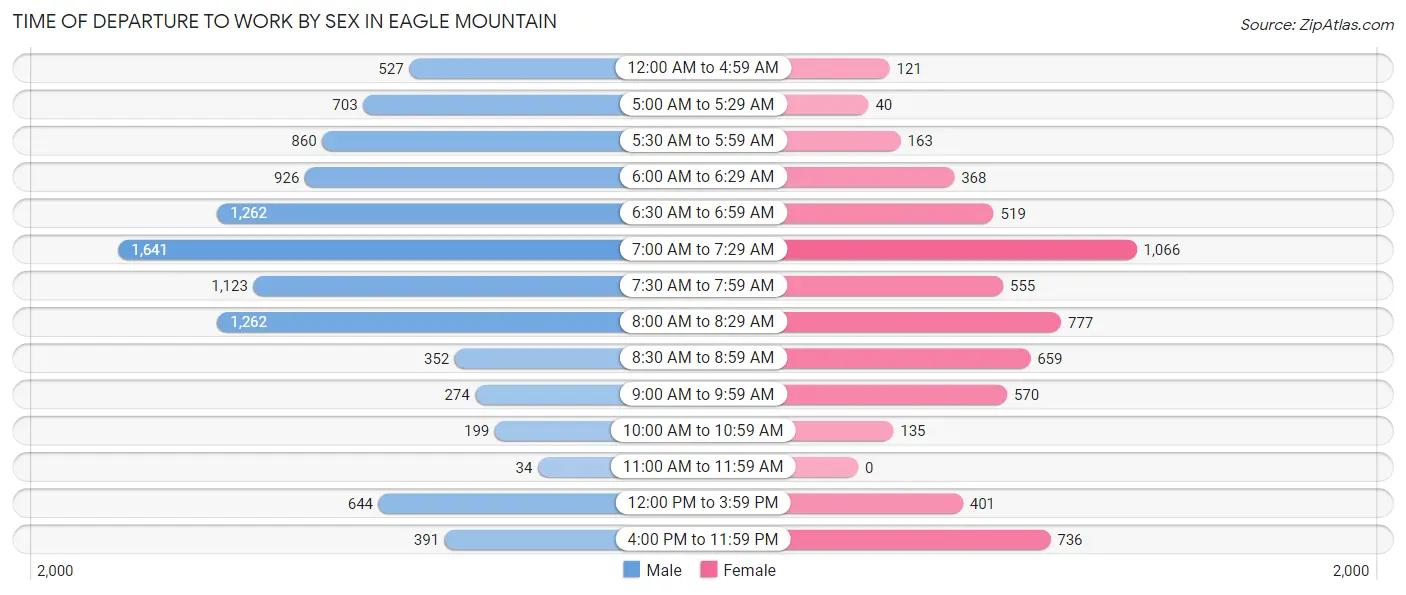
| Time of Departure | Male | Female |
| 12:00 AM to 4:59 AM | 527 (5.2%) | 121 (2.0%) |
| 5:00 AM to 5:29 AM | 703 (6.9%) | 40 (0.6%) |
| 5:30 AM to 5:59 AM | 860 (8.4%) | 163 (2.7%) |
| 6:00 AM to 6:29 AM | 926 (9.1%) | 368 (6.0%) |
| 6:30 AM to 6:59 AM | 1,262 (12.4%) | 519 (8.5%) |
| 7:00 AM to 7:29 AM | 1,641 (16.1%) | 1,066 (17.4%) |
| 7:30 AM to 7:59 AM | 1,123 (11.0%) | 555 (9.1%) |
| 8:00 AM to 8:29 AM | 1,262 (12.4%) | 777 (12.7%) |
| 8:30 AM to 8:59 AM | 352 (3.5%) | 659 (10.8%) |
| 9:00 AM to 9:59 AM | 274 (2.7%) | 570 (9.3%) |
| 10:00 AM to 10:59 AM | 199 (1.9%) | 135 (2.2%) |
| 11:00 AM to 11:59 AM | 34 (0.3%) | 0 (0.0%) |
| 12:00 PM to 3:59 PM | 644 (6.3%) | 401 (6.6%) |
| 4:00 PM to 11:59 PM | 391 (3.8%) | 736 (12.0%) |
| Total | 10,198 (100.0%) | 6,110 (100.0%) |
Housing Occupancy in Eagle Mountain
Occupancy by Ownership in Eagle Mountain
Of the total 10,896 dwellings in Eagle Mountain, owner-occupied units account for 9,623 (88.3%), while renter-occupied units make up 1,273 (11.7%).
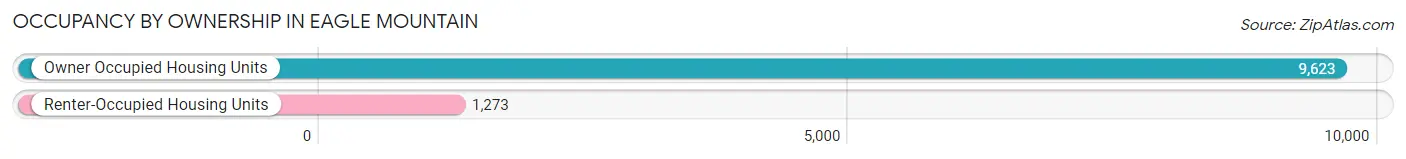
| Occupancy | # Housing Units | % Housing Units |
| Owner Occupied Housing Units | 9,623 | 88.3% |
| Renter-Occupied Housing Units | 1,273 | 11.7% |
| Total Occupied Housing Units | 10,896 | 100.0% |
Occupancy by Household Size in Eagle Mountain
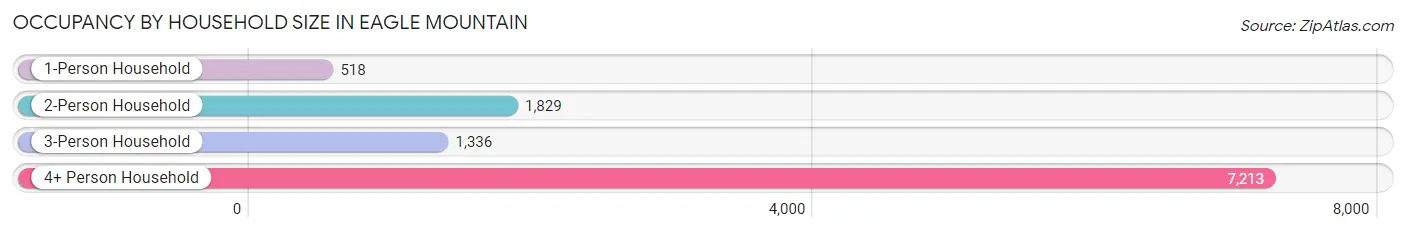
| Household Size | # Housing Units | % Housing Units |
| 1-Person Household | 518 | 4.8% |
| 2-Person Household | 1,829 | 16.8% |
| 3-Person Household | 1,336 | 12.3% |
| 4+ Person Household | 7,213 | 66.2% |
| Total Housing Units | 10,896 | 100.0% |
Occupancy by Ownership by Household Size in Eagle Mountain
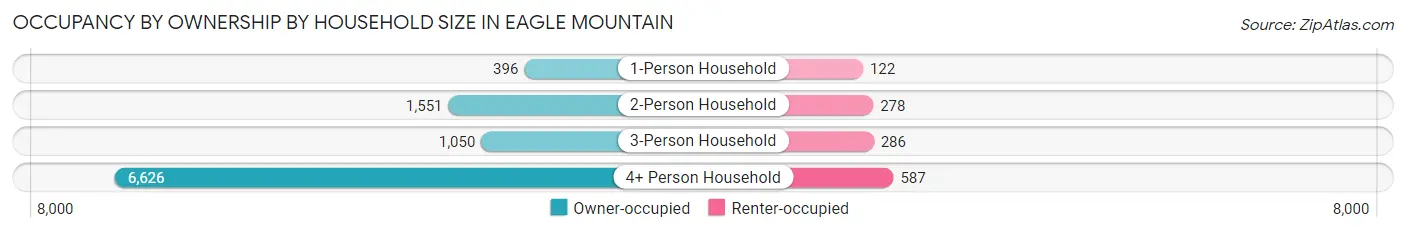
| Household Size | Owner-occupied | Renter-occupied |
| 1-Person Household | 396 (76.4%) | 122 (23.5%) |
| 2-Person Household | 1,551 (84.8%) | 278 (15.2%) |
| 3-Person Household | 1,050 (78.6%) | 286 (21.4%) |
| 4+ Person Household | 6,626 (91.9%) | 587 (8.1%) |
| Total Housing Units | 9,623 (88.3%) | 1,273 (11.7%) |
Occupancy by Educational Attainment in Eagle Mountain
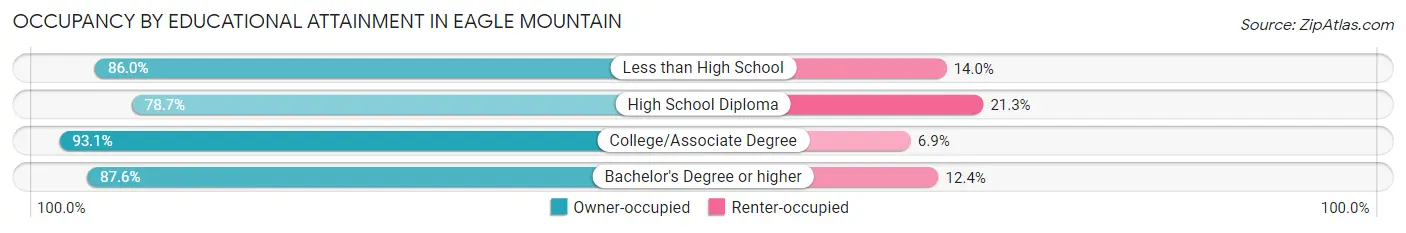
| Household Size | Owner-occupied | Renter-occupied |
| Less than High School | 326 (86.0%) | 53 (14.0%) |
| High School Diploma | 1,403 (78.7%) | 379 (21.3%) |
| College/Associate Degree | 4,081 (93.1%) | 302 (6.9%) |
| Bachelor's Degree or higher | 3,813 (87.6%) | 539 (12.4%) |
Occupancy by Age of Householder in Eagle Mountain
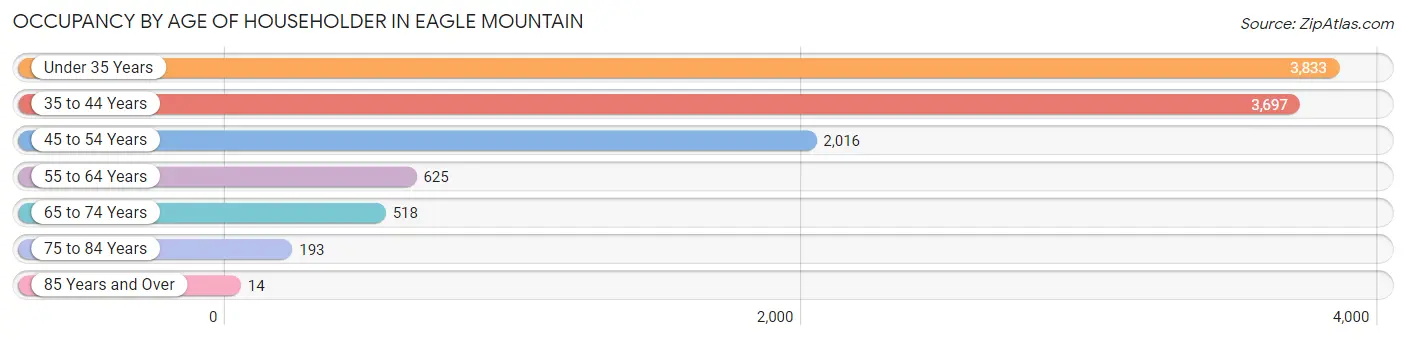
| Age Bracket | # Households | % Households |
| Under 35 Years | 3,833 | 35.2% |
| 35 to 44 Years | 3,697 | 33.9% |
| 45 to 54 Years | 2,016 | 18.5% |
| 55 to 64 Years | 625 | 5.7% |
| 65 to 74 Years | 518 | 4.8% |
| 75 to 84 Years | 193 | 1.8% |
| 85 Years and Over | 14 | 0.1% |
| Total | 10,896 | 100.0% |
Housing Finances in Eagle Mountain
Median Income by Occupancy in Eagle Mountain
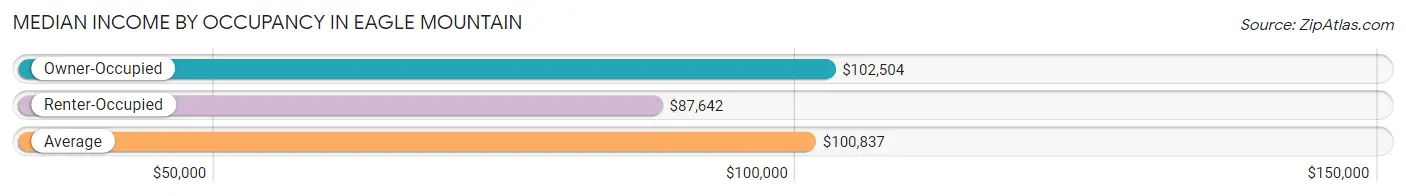
| Occupancy Type | # Households | Median Income |
| Owner-Occupied | 9,623 (88.3%) | $102,504 |
| Renter-Occupied | 1,273 (11.7%) | $87,642 |
| Average | 10,896 (100.0%) | $100,837 |
Occupancy by Householder Income Bracket in Eagle Mountain
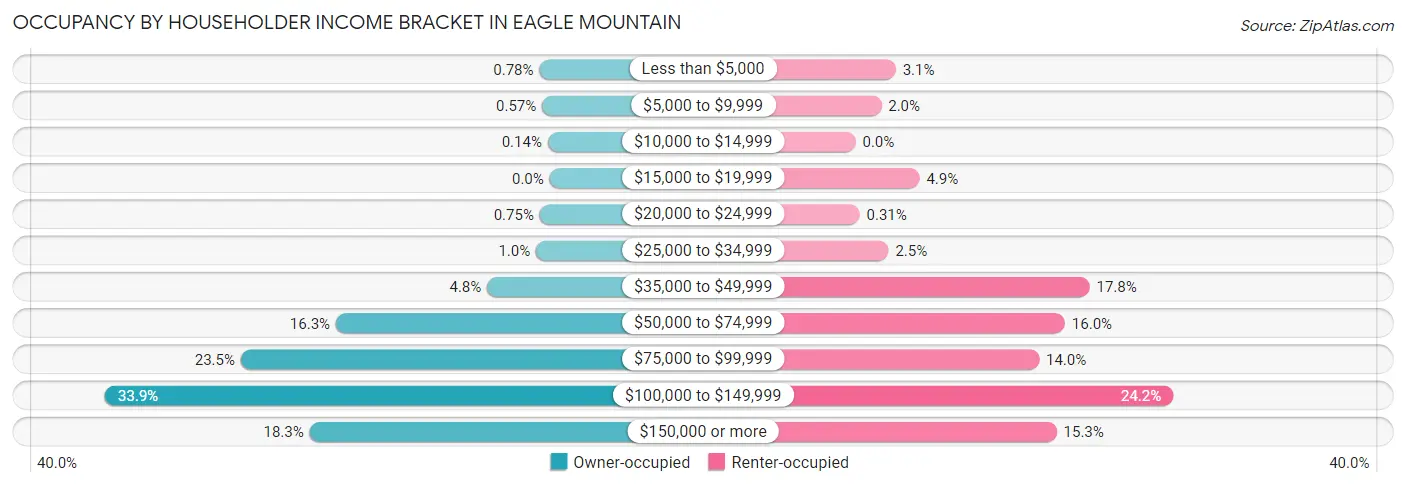
| Income Bracket | Owner-occupied | Renter-occupied |
| Less than $5,000 | 75 (0.8%) | 39 (3.1%) |
| $5,000 to $9,999 | 55 (0.6%) | 25 (2.0%) |
| $10,000 to $14,999 | 13 (0.1%) | 0 (0.0%) |
| $15,000 to $19,999 | 0 (0.0%) | 62 (4.9%) |
| $20,000 to $24,999 | 72 (0.7%) | 4 (0.3%) |
| $25,000 to $34,999 | 99 (1.0%) | 32 (2.5%) |
| $35,000 to $49,999 | 458 (4.8%) | 227 (17.8%) |
| $50,000 to $74,999 | 1,567 (16.3%) | 203 (16.0%) |
| $75,000 to $99,999 | 2,264 (23.5%) | 178 (14.0%) |
| $100,000 to $149,999 | 3,260 (33.9%) | 308 (24.2%) |
| $150,000 or more | 1,760 (18.3%) | 195 (15.3%) |
| Total | 9,623 (100.0%) | 1,273 (100.0%) |
Monthly Housing Cost Tiers in Eagle Mountain
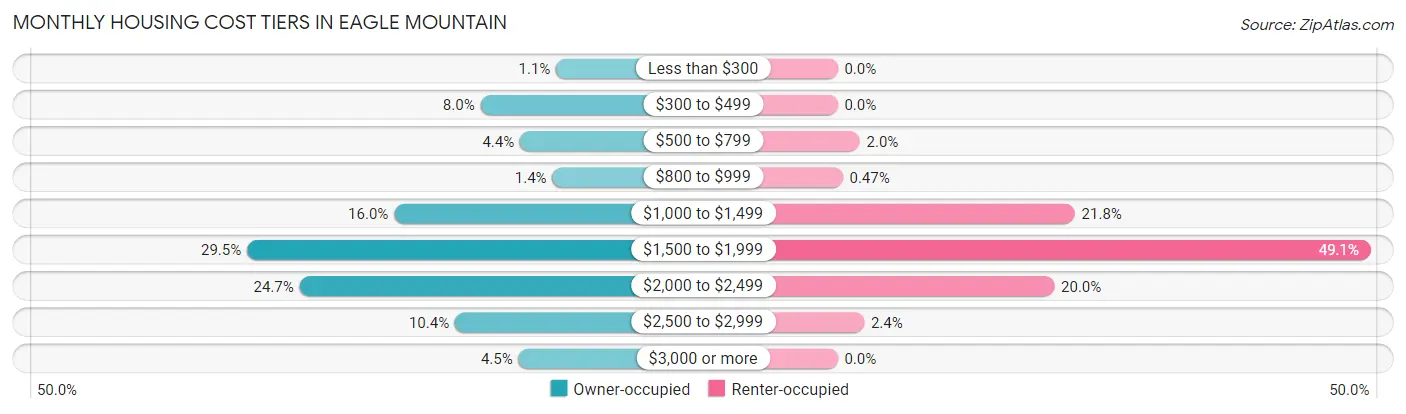
| Monthly Cost | Owner-occupied | Renter-occupied |
| Less than $300 | 102 (1.1%) | 0 (0.0%) |
| $300 to $499 | 773 (8.0%) | 0 (0.0%) |
| $500 to $799 | 422 (4.4%) | 26 (2.0%) |
| $800 to $999 | 136 (1.4%) | 6 (0.5%) |
| $1,000 to $1,499 | 1,538 (16.0%) | 278 (21.8%) |
| $1,500 to $1,999 | 2,841 (29.5%) | 625 (49.1%) |
| $2,000 to $2,499 | 2,376 (24.7%) | 254 (20.0%) |
| $2,500 to $2,999 | 999 (10.4%) | 31 (2.4%) |
| $3,000 or more | 436 (4.5%) | 0 (0.0%) |
| Total | 9,623 (100.0%) | 1,273 (100.0%) |
Physical Housing Characteristics in Eagle Mountain
Housing Structures in Eagle Mountain
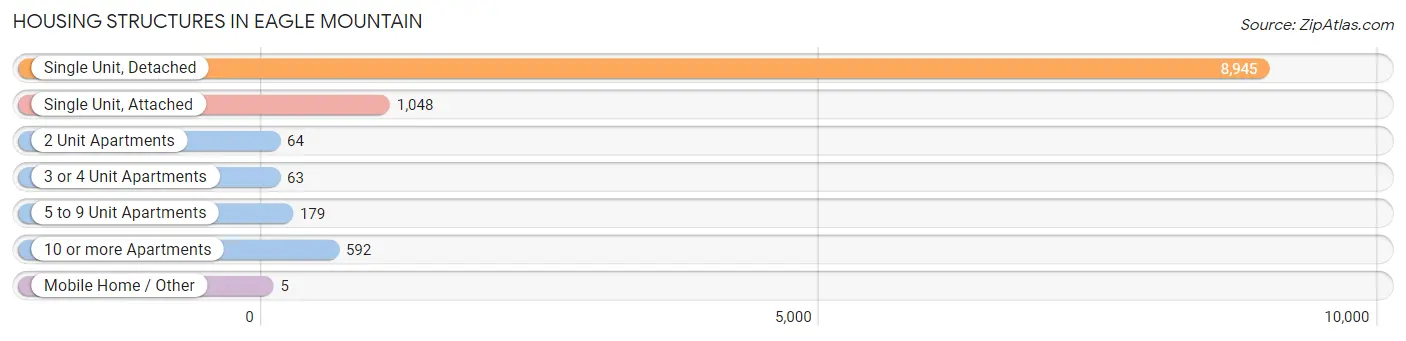
| Structure Type | # Housing Units | % Housing Units |
| Single Unit, Detached | 8,945 | 82.1% |
| Single Unit, Attached | 1,048 | 9.6% |
| 2 Unit Apartments | 64 | 0.6% |
| 3 or 4 Unit Apartments | 63 | 0.6% |
| 5 to 9 Unit Apartments | 179 | 1.6% |
| 10 or more Apartments | 592 | 5.4% |
| Mobile Home / Other | 5 | 0.1% |
| Total | 10,896 | 100.0% |
Housing Structures by Occupancy in Eagle Mountain
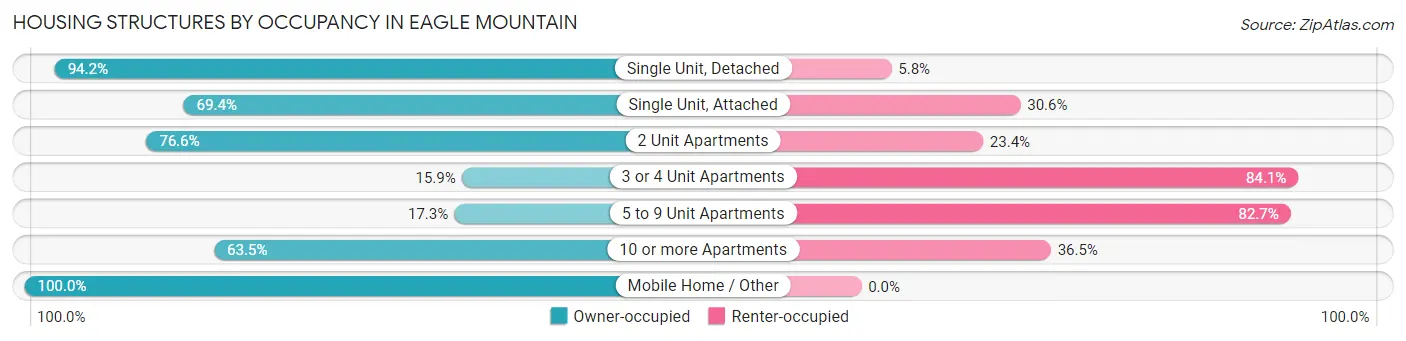
| Structure Type | Owner-occupied | Renter-occupied |
| Single Unit, Detached | 8,425 (94.2%) | 520 (5.8%) |
| Single Unit, Attached | 727 (69.4%) | 321 (30.6%) |
| 2 Unit Apartments | 49 (76.6%) | 15 (23.4%) |
| 3 or 4 Unit Apartments | 10 (15.9%) | 53 (84.1%) |
| 5 to 9 Unit Apartments | 31 (17.3%) | 148 (82.7%) |
| 10 or more Apartments | 376 (63.5%) | 216 (36.5%) |
| Mobile Home / Other | 5 (100.0%) | 0 (0.0%) |
| Total | 9,623 (88.3%) | 1,273 (11.7%) |
Housing Structures by Number of Rooms in Eagle Mountain
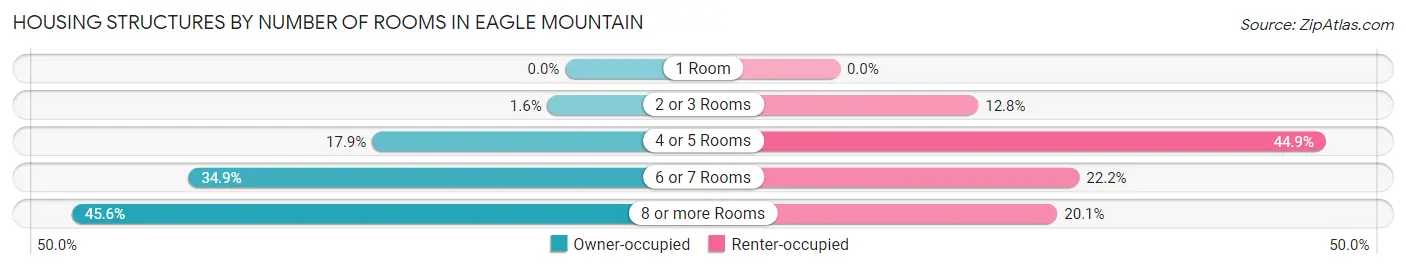
| Number of Rooms | Owner-occupied | Renter-occupied |
| 1 Room | 0 (0.0%) | 0 (0.0%) |
| 2 or 3 Rooms | 158 (1.6%) | 163 (12.8%) |
| 4 or 5 Rooms | 1,719 (17.9%) | 572 (44.9%) |
| 6 or 7 Rooms | 3,355 (34.9%) | 282 (22.2%) |
| 8 or more Rooms | 4,391 (45.6%) | 256 (20.1%) |
| Total | 9,623 (100.0%) | 1,273 (100.0%) |
Housing Structure by Heating Type in Eagle Mountain
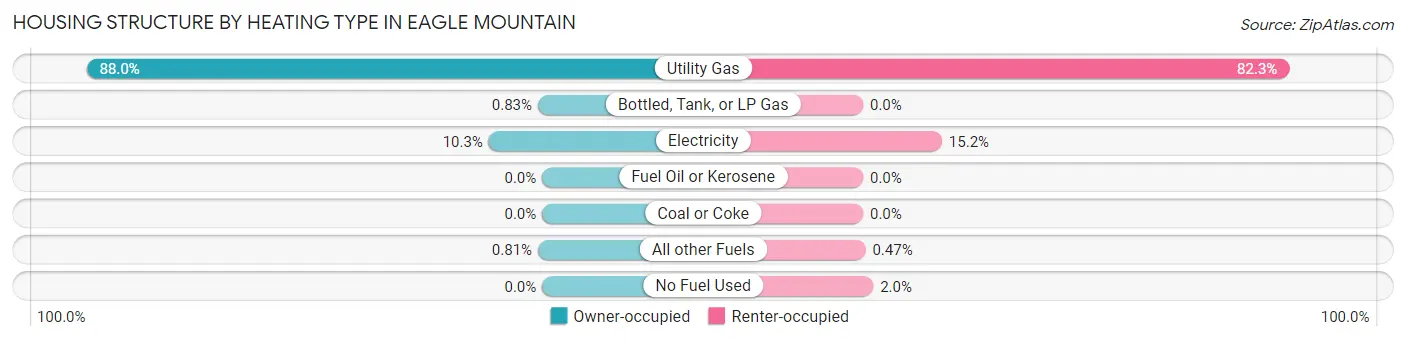
| Heating Type | Owner-occupied | Renter-occupied |
| Utility Gas | 8,472 (88.0%) | 1,048 (82.3%) |
| Bottled, Tank, or LP Gas | 80 (0.8%) | 0 (0.0%) |
| Electricity | 993 (10.3%) | 194 (15.2%) |
| Fuel Oil or Kerosene | 0 (0.0%) | 0 (0.0%) |
| Coal or Coke | 0 (0.0%) | 0 (0.0%) |
| All other Fuels | 78 (0.8%) | 6 (0.5%) |
| No Fuel Used | 0 (0.0%) | 25 (2.0%) |
| Total | 9,623 (100.0%) | 1,273 (100.0%) |
Household Vehicle Usage in Eagle Mountain
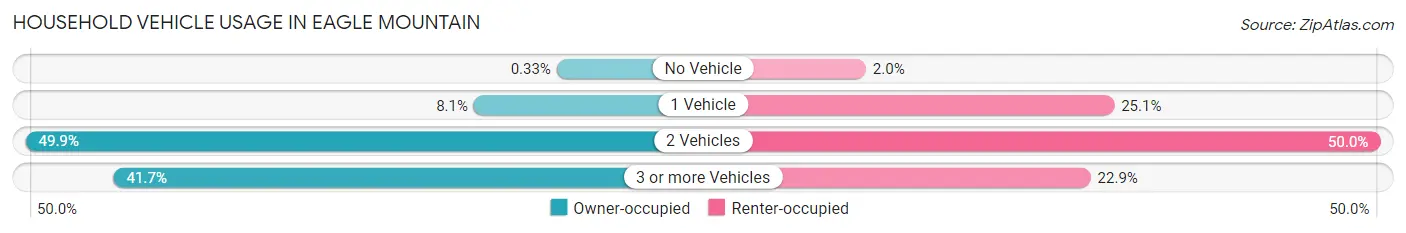
| Vehicles per Household | Owner-occupied | Renter-occupied |
| No Vehicle | 32 (0.3%) | 25 (2.0%) |
| 1 Vehicle | 777 (8.1%) | 320 (25.1%) |
| 2 Vehicles | 4,802 (49.9%) | 636 (50.0%) |
| 3 or more Vehicles | 4,012 (41.7%) | 292 (22.9%) |
| Total | 9,623 (100.0%) | 1,273 (100.0%) |
Real Estate & Mortgages in Eagle Mountain
Real Estate and Mortgage Overview in Eagle Mountain
| Characteristic | Without Mortgage | With Mortgage |
| Housing Units | 1,222 | 8,401 |
| Median Property Value | $418,100 | $433,100 |
| Median Household Income | $98,454 | $1,663 |
| Monthly Housing Costs | $453 | $436 |
| Real Estate Taxes | $1,904 | $222 |
Property Value by Mortgage Status in Eagle Mountain
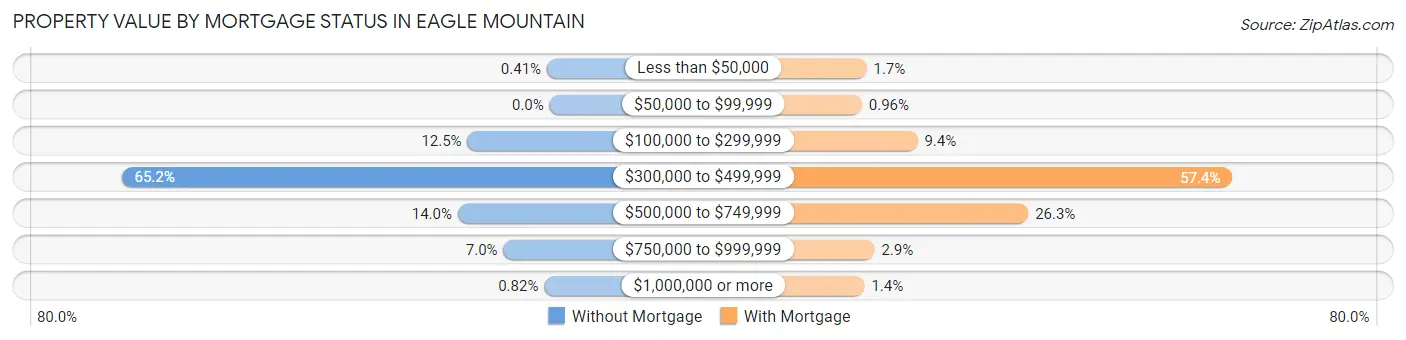
| Property Value | Without Mortgage | With Mortgage |
| Less than $50,000 | 5 (0.4%) | 140 (1.7%) |
| $50,000 to $99,999 | 0 (0.0%) | 81 (1.0%) |
| $100,000 to $299,999 | 153 (12.5%) | 792 (9.4%) |
| $300,000 to $499,999 | 797 (65.2%) | 4,822 (57.4%) |
| $500,000 to $749,999 | 171 (14.0%) | 2,210 (26.3%) |
| $750,000 to $999,999 | 86 (7.0%) | 242 (2.9%) |
| $1,000,000 or more | 10 (0.8%) | 114 (1.4%) |
| Total | 1,222 (100.0%) | 8,401 (100.0%) |
Household Income by Mortgage Status in Eagle Mountain
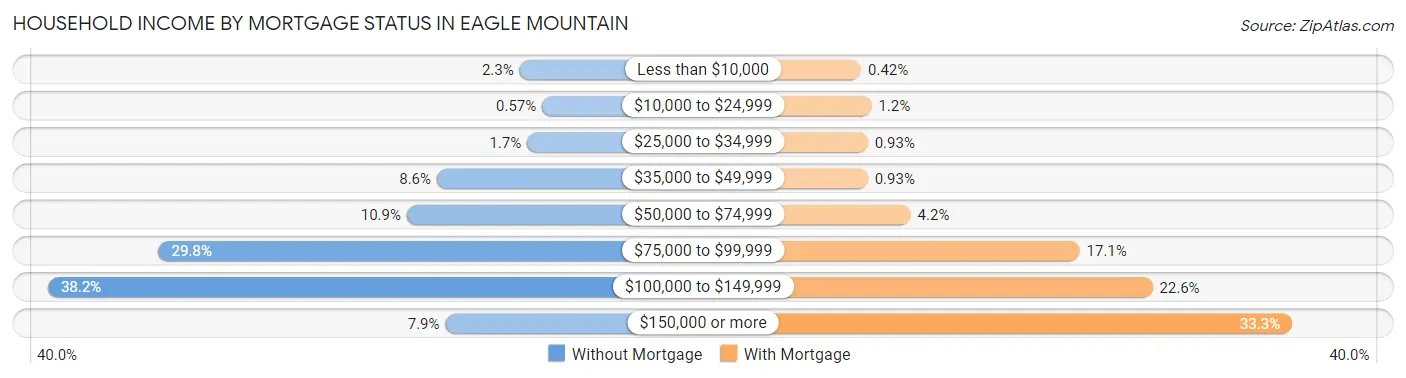
| Household Income | Without Mortgage | With Mortgage |
| Less than $10,000 | 28 (2.3%) | 35 (0.4%) |
| $10,000 to $24,999 | 7 (0.6%) | 102 (1.2%) |
| $25,000 to $34,999 | 21 (1.7%) | 78 (0.9%) |
| $35,000 to $49,999 | 105 (8.6%) | 78 (0.9%) |
| $50,000 to $74,999 | 133 (10.9%) | 353 (4.2%) |
| $75,000 to $99,999 | 364 (29.8%) | 1,434 (17.1%) |
| $100,000 to $149,999 | 467 (38.2%) | 1,900 (22.6%) |
| $150,000 or more | 97 (7.9%) | 2,793 (33.3%) |
| Total | 1,222 (100.0%) | 8,401 (100.0%) |
Property Value to Household Income Ratio in Eagle Mountain
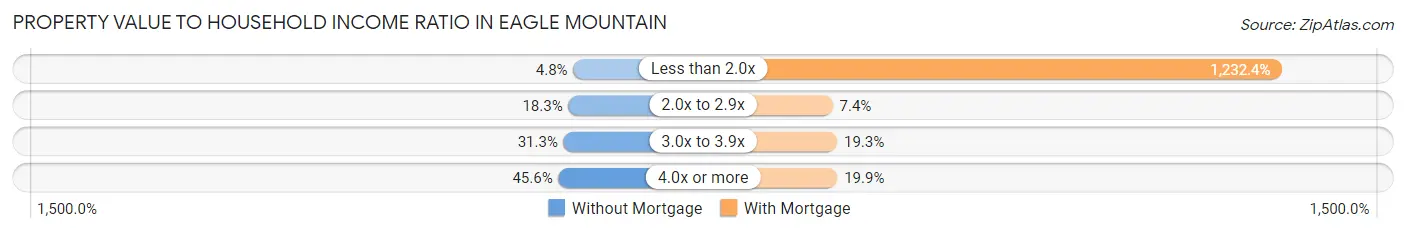
| Value-to-Income Ratio | Without Mortgage | With Mortgage |
| Less than 2.0x | 59 (4.8%) | 103,536 (1,232.4%) |
| 2.0x to 2.9x | 224 (18.3%) | 618 (7.4%) |
| 3.0x to 3.9x | 382 (31.3%) | 1,625 (19.3%) |
| 4.0x or more | 557 (45.6%) | 1,672 (19.9%) |
| Total | 1,222 (100.0%) | 8,401 (100.0%) |
Real Estate Taxes by Mortgage Status in Eagle Mountain
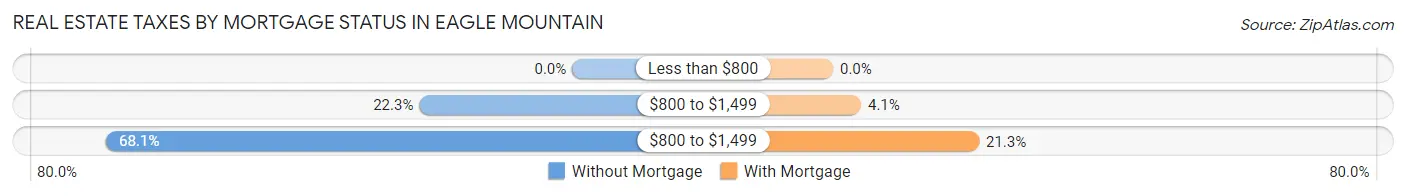
| Property Taxes | Without Mortgage | With Mortgage |
| Less than $800 | 0 (0.0%) | 0 (0.0%) |
| $800 to $1,499 | 273 (22.3%) | 344 (4.1%) |
| $800 to $1,499 | 832 (68.1%) | 1,792 (21.3%) |
| Total | 1,222 (100.0%) | 8,401 (100.0%) |
Health & Disability in Eagle Mountain
Health Insurance Coverage by Age in Eagle Mountain
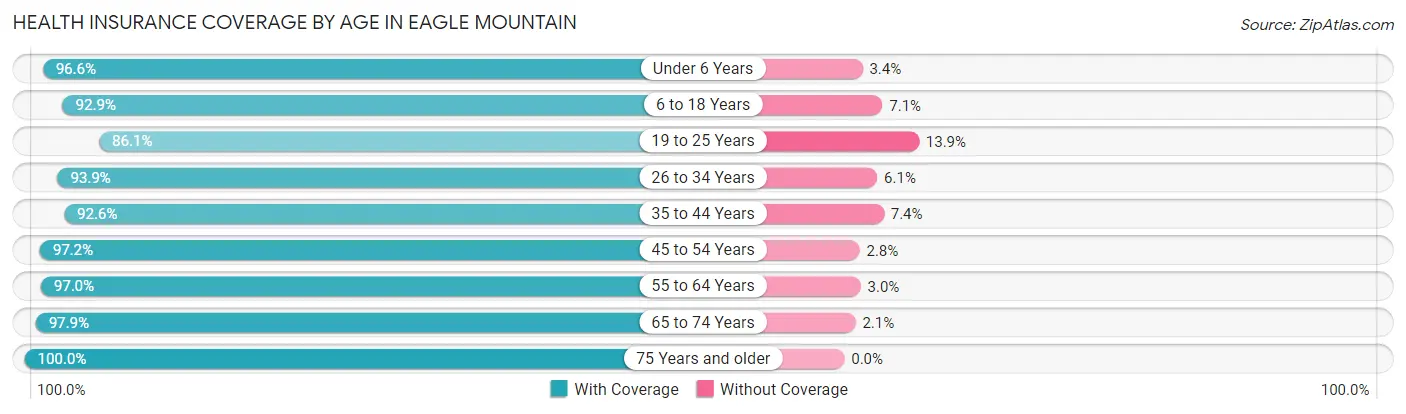
| Age Bracket | With Coverage | Without Coverage |
| Under 6 Years | 7,894 (96.6%) | 277 (3.4%) |
| 6 to 18 Years | 12,186 (92.9%) | 931 (7.1%) |
| 19 to 25 Years | 3,674 (86.1%) | 593 (13.9%) |
| 26 to 34 Years | 6,342 (93.9%) | 414 (6.1%) |
| 35 to 44 Years | 6,610 (92.6%) | 525 (7.4%) |
| 45 to 54 Years | 3,769 (97.2%) | 110 (2.8%) |
| 55 to 64 Years | 1,467 (97.0%) | 46 (3.0%) |
| 65 to 74 Years | 753 (97.9%) | 16 (2.1%) |
| 75 Years and older | 349 (100.0%) | 0 (0.0%) |
| Total | 43,044 (93.7%) | 2,912 (6.3%) |
Health Insurance Coverage by Citizenship Status in Eagle Mountain
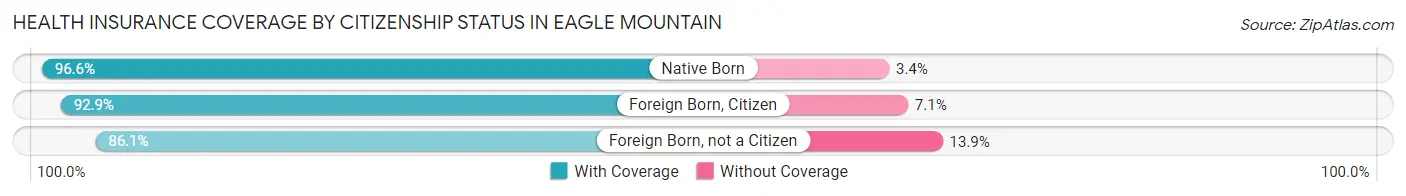
| Citizenship Status | With Coverage | Without Coverage |
| Native Born | 7,894 (96.6%) | 277 (3.4%) |
| Foreign Born, Citizen | 12,186 (92.9%) | 931 (7.1%) |
| Foreign Born, not a Citizen | 3,674 (86.1%) | 593 (13.9%) |
Health Insurance Coverage by Household Income in Eagle Mountain
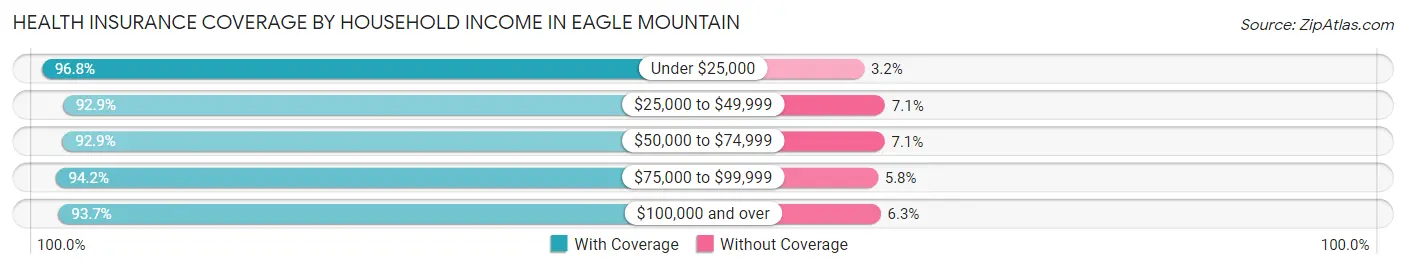
| Household Income | With Coverage | Without Coverage |
| Under $25,000 | 875 (96.8%) | 29 (3.2%) |
| $25,000 to $49,999 | 2,808 (92.9%) | 216 (7.1%) |
| $50,000 to $74,999 | 6,413 (92.9%) | 488 (7.1%) |
| $75,000 to $99,999 | 8,606 (94.2%) | 531 (5.8%) |
| $100,000 and over | 24,342 (93.7%) | 1,648 (6.3%) |
Public vs Private Health Insurance Coverage by Age in Eagle Mountain
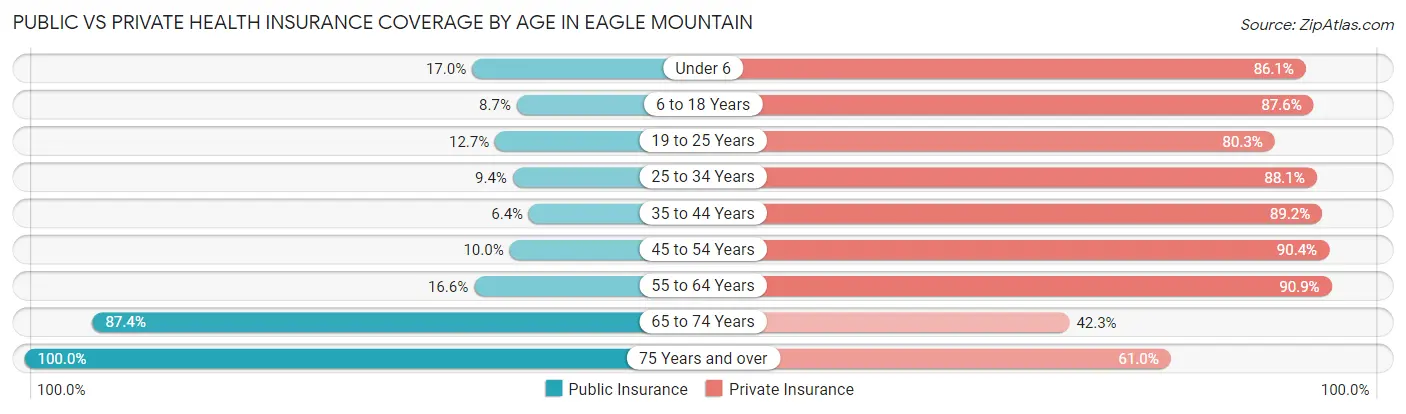
| Age Bracket | Public Insurance | Private Insurance |
| Under 6 | 1,386 (17.0%) | 7,035 (86.1%) |
| 6 to 18 Years | 1,134 (8.6%) | 11,484 (87.5%) |
| 19 to 25 Years | 541 (12.7%) | 3,428 (80.3%) |
| 25 to 34 Years | 635 (9.4%) | 5,953 (88.1%) |
| 35 to 44 Years | 456 (6.4%) | 6,361 (89.1%) |
| 45 to 54 Years | 388 (10.0%) | 3,507 (90.4%) |
| 55 to 64 Years | 251 (16.6%) | 1,375 (90.9%) |
| 65 to 74 Years | 672 (87.4%) | 325 (42.3%) |
| 75 Years and over | 349 (100.0%) | 213 (61.0%) |
| Total | 5,812 (12.7%) | 39,681 (86.4%) |
Disability Status by Sex by Age in Eagle Mountain
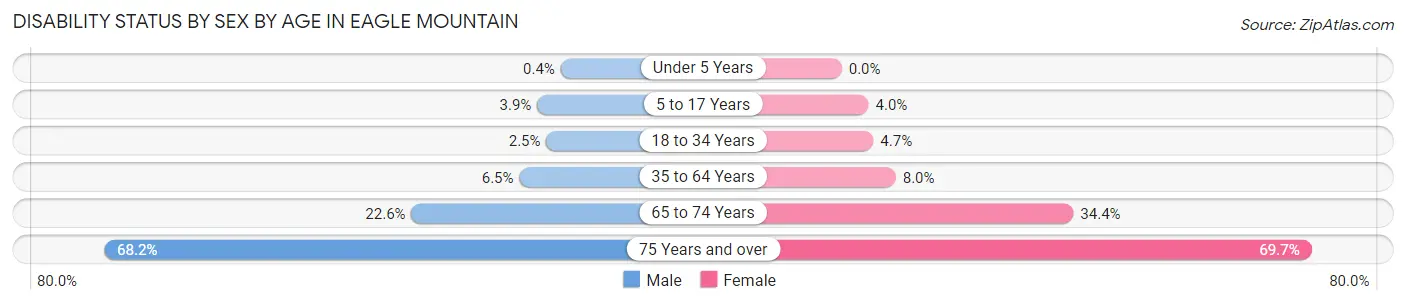
| Age Bracket | Male | Female |
| Under 5 Years | 14 (0.4%) | 0 (0.0%) |
| 5 to 17 Years | 254 (3.9%) | 271 (4.0%) |
| 18 to 34 Years | 148 (2.5%) | 288 (4.7%) |
| 35 to 64 Years | 438 (6.5%) | 467 (8.0%) |
| 65 to 74 Years | 81 (22.6%) | 141 (34.4%) |
| 75 Years and over | 105 (68.2%) | 136 (69.7%) |
Disability Class by Sex by Age in Eagle Mountain
Disability Class: Hearing Difficulty
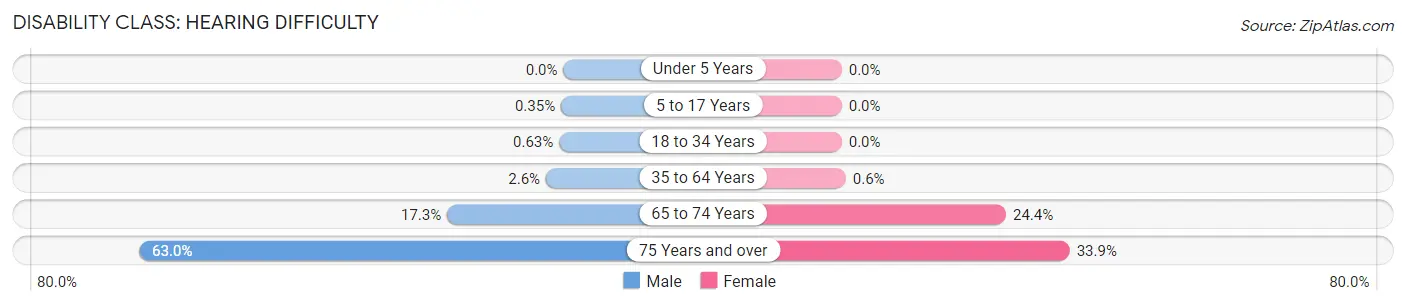
| Age Bracket | Male | Female |
| Under 5 Years | 0 (0.0%) | 0 (0.0%) |
| 5 to 17 Years | 23 (0.4%) | 0 (0.0%) |
| 18 to 34 Years | 37 (0.6%) | 0 (0.0%) |
| 35 to 64 Years | 174 (2.6%) | 35 (0.6%) |
| 65 to 74 Years | 62 (17.3%) | 100 (24.4%) |
| 75 Years and over | 97 (63.0%) | 66 (33.9%) |
Disability Class: Vision Difficulty
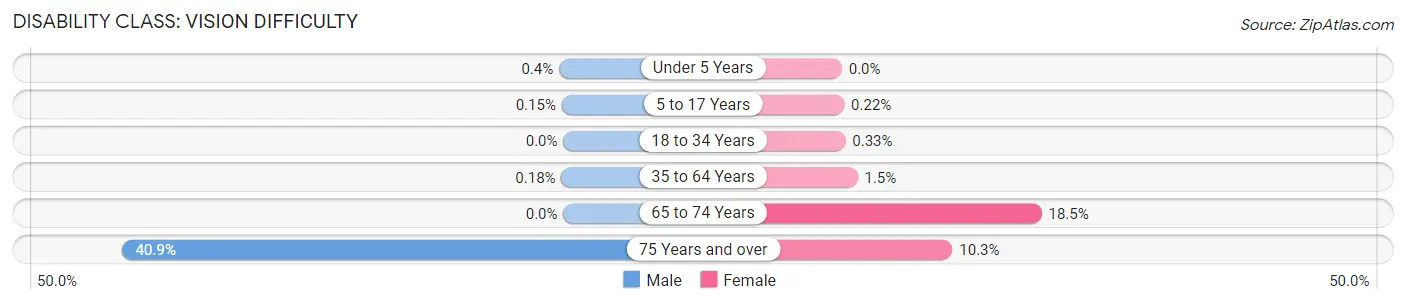
| Age Bracket | Male | Female |
| Under 5 Years | 14 (0.4%) | 0 (0.0%) |
| 5 to 17 Years | 10 (0.2%) | 15 (0.2%) |
| 18 to 34 Years | 0 (0.0%) | 20 (0.3%) |
| 35 to 64 Years | 12 (0.2%) | 85 (1.5%) |
| 65 to 74 Years | 0 (0.0%) | 76 (18.5%) |
| 75 Years and over | 63 (40.9%) | 20 (10.3%) |
Disability Class: Cognitive Difficulty
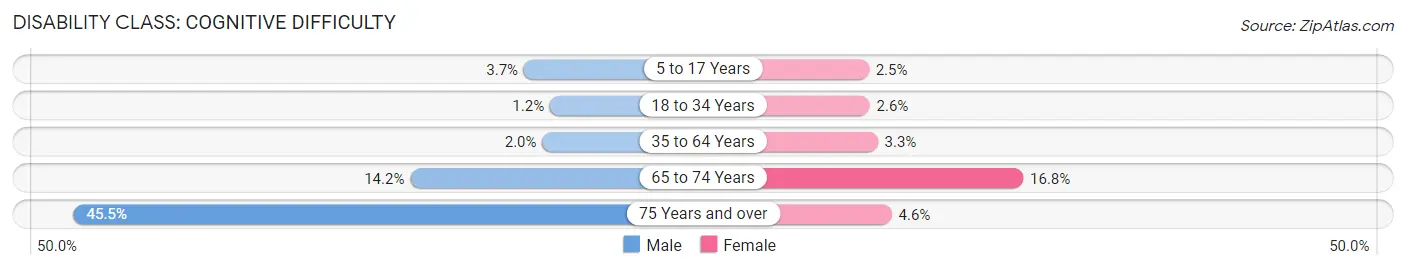
| Age Bracket | Male | Female |
| 5 to 17 Years | 239 (3.7%) | 170 (2.5%) |
| 18 to 34 Years | 73 (1.2%) | 158 (2.6%) |
| 35 to 64 Years | 131 (1.9%) | 193 (3.3%) |
| 65 to 74 Years | 51 (14.2%) | 69 (16.8%) |
| 75 Years and over | 70 (45.5%) | 9 (4.6%) |
Disability Class: Ambulatory Difficulty
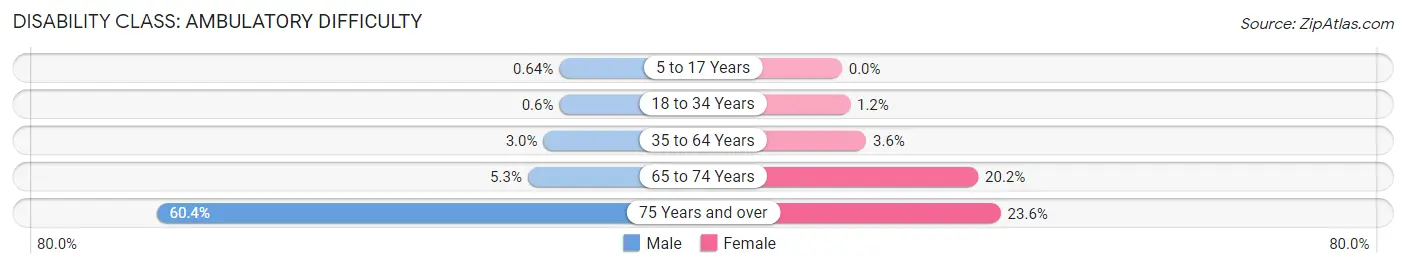
| Age Bracket | Male | Female |
| 5 to 17 Years | 42 (0.6%) | 0 (0.0%) |
| 18 to 34 Years | 35 (0.6%) | 75 (1.2%) |
| 35 to 64 Years | 200 (3.0%) | 210 (3.6%) |
| 65 to 74 Years | 19 (5.3%) | 83 (20.2%) |
| 75 Years and over | 93 (60.4%) | 46 (23.6%) |
Disability Class: Self-Care Difficulty
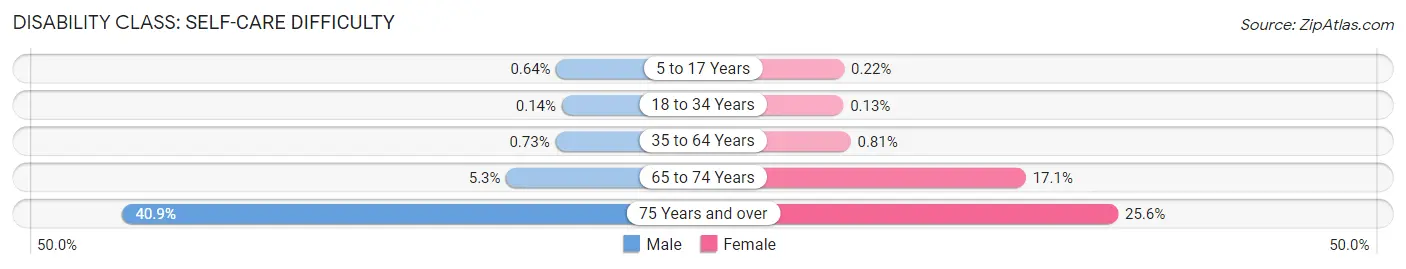
| Age Bracket | Male | Female |
| 5 to 17 Years | 42 (0.6%) | 15 (0.2%) |
| 18 to 34 Years | 8 (0.1%) | 8 (0.1%) |
| 35 to 64 Years | 49 (0.7%) | 47 (0.8%) |
| 65 to 74 Years | 19 (5.3%) | 70 (17.1%) |
| 75 Years and over | 63 (40.9%) | 50 (25.6%) |
Technology Access in Eagle Mountain
Computing Device Access in Eagle Mountain
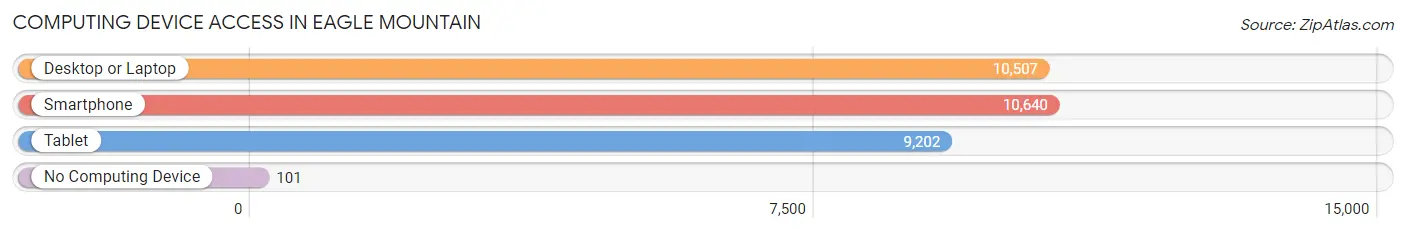
| Device Type | # Households | % Households |
| Desktop or Laptop | 10,507 | 96.4% |
| Smartphone | 10,640 | 97.7% |
| Tablet | 9,202 | 84.5% |
| No Computing Device | 101 | 0.9% |
| Total | 10,896 | 100.0% |
Internet Access in Eagle Mountain
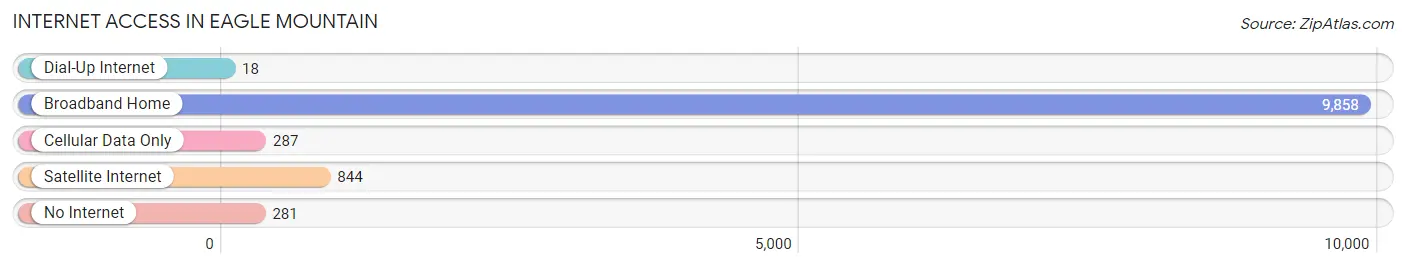
| Internet Type | # Households | % Households |
| Dial-Up Internet | 18 | 0.2% |
| Broadband Home | 9,858 | 90.5% |
| Cellular Data Only | 287 | 2.6% |
| Satellite Internet | 844 | 7.7% |
| No Internet | 281 | 2.6% |
| Total | 10,896 | 100.0% |
Eagle Mountain Summary
Eagle Mountain, Utah is a city located in the western part of Utah County, Utah, United States. It is part of the Provo-Orem Metropolitan Statistical Area. The city is located on the western edge of the Wasatch Range, and is bordered by the cities of Saratoga Springs to the north, Lehi to the east, and Cedar Valley to the south. As of the 2010 census, the city had a population of 21,415, making it the second-largest city in Utah County.
History
The area that is now Eagle Mountain was first settled in the late 19th century by Mormon pioneers. The area was originally known as "Little Mountain," and was part of the larger Cedar Valley area. In the early 20th century, the area was used for farming and ranching. In the late 1970s, the area was developed as a planned community, and the city of Eagle Mountain was incorporated in 1996.
Geography
Eagle Mountain is located in the western part of Utah County, Utah, United States. It is part of the Provo-Orem Metropolitan Statistical Area. The city is located on the western edge of the Wasatch Range, and is bordered by the cities of Saratoga Springs to the north, Lehi to the east, and Cedar Valley to the south.
The city has a total area of 33.3 square miles, of which 33.2 square miles is land and 0.1 square miles is water. The city is located at an elevation of 4,890 feet above sea level.
Economy
Eagle Mountain is home to several major employers, including the Eagle Mountain International Church, the Eagle Mountain City Corporation, and the Eagle Mountain Golf Course. The city is also home to several small businesses, including restaurants, retail stores, and service providers.
Demographics
As of the 2010 census, there were 21,415 people, 6,845 households, and 5,845 families residing in the city. The population density was 645.2 people per square mile. There were 7,093 housing units at an average density of 213.7 per square mile. The racial makeup of the city was 91.2% White, 0.7% African American, 0.4% Native American, 1.2% Asian, 0.1% Pacific Islander, 4.2% from other races, and 2.2% from two or more races. Hispanic or Latino of any race were 8.7% of the population.
There were 6,845 households, out of which 51.2% had children under the age of 18 living with them, 73.2% were married couples living together, 8.2% had a female householder with no husband present, and 15.2% were non-families. 11.7% of all households were made up of individuals, and 2.7% had someone living alone who was 65 years of age or older. The average household size was 3.13 and the average family size was 3.41.
In the city, the population was spread out, with 34.2% under the age of 18, 8.2% from 18 to 24, 33.2% from 25 to 44, 19.2% from 45 to 64, and 5.2% who were 65 years of age or older. The median age was 30 years. For every 100 females, there were 99.2 males. For every 100 females age 18 and over, there were 97.2 males.
The median income for a household in the city was $76,945, and the median income for a family was $79,945. Males had a median income of $51,945 versus $35,945 for females. The per capita income for the city was $25,945. About 3.2% of families and 4.2% of the population were below the poverty line, including 5.2% of those under age 18 and none of those age 65 or over.
Common Questions
What is Per Capita Income in Eagle Mountain?
Per Capita income in Eagle Mountain is $27,480.
What is the Median Family Income in Eagle Mountain?
Median Family Income in Eagle Mountain is $100,378.
What is the Median Household income in Eagle Mountain?
Median Household Income in Eagle Mountain is $100,837.
What is Income or Wage Gap in Eagle Mountain?
Income or Wage Gap in Eagle Mountain is 62.4%.
Women in Eagle Mountain earn 37.6 cents for every dollar earned by a man.
What is Family Income Deficit in Eagle Mountain?
Family Income Deficit in Eagle Mountain is $9,000.
Families that are below poverty line in Eagle Mountain earn $9,000 less on average than the poverty threshold level.
What is Inequality or Gini Index in Eagle Mountain?
Inequality or Gini Index in Eagle Mountain is 0.31.
What is the Total Population of Eagle Mountain?
Total Population of Eagle Mountain is 46,109.
What is the Total Male Population of Eagle Mountain?
Total Male Population of Eagle Mountain is 23,266.
What is the Total Female Population of Eagle Mountain?
Total Female Population of Eagle Mountain is 22,843.
What is the Ratio of Males per 100 Females in Eagle Mountain?
There are 101.85 Males per 100 Females in Eagle Mountain.
What is the Ratio of Females per 100 Males in Eagle Mountain?
There are 98.18 Females per 100 Males in Eagle Mountain.
What is the Median Population Age in Eagle Mountain?
Median Population Age in Eagle Mountain is 21.9 Years.
What is the Average Family Size in Eagle Mountain
Average Family Size in Eagle Mountain is 4.4 People.
What is the Average Household Size in Eagle Mountain
Average Household Size in Eagle Mountain is 4.2 People.
How Large is the Labor Force in Eagle Mountain?
There are 20,664 People in the Labor Forcein in Eagle Mountain.
What is the Percentage of People in the Labor Force in Eagle Mountain?
76.0% of People are in the Labor Force in Eagle Mountain.
What is the Unemployment Rate in Eagle Mountain?
Unemployment Rate in Eagle Mountain is 3.4%.