South Salt Lake, UT Map & Demographics
South Salt Lake Map
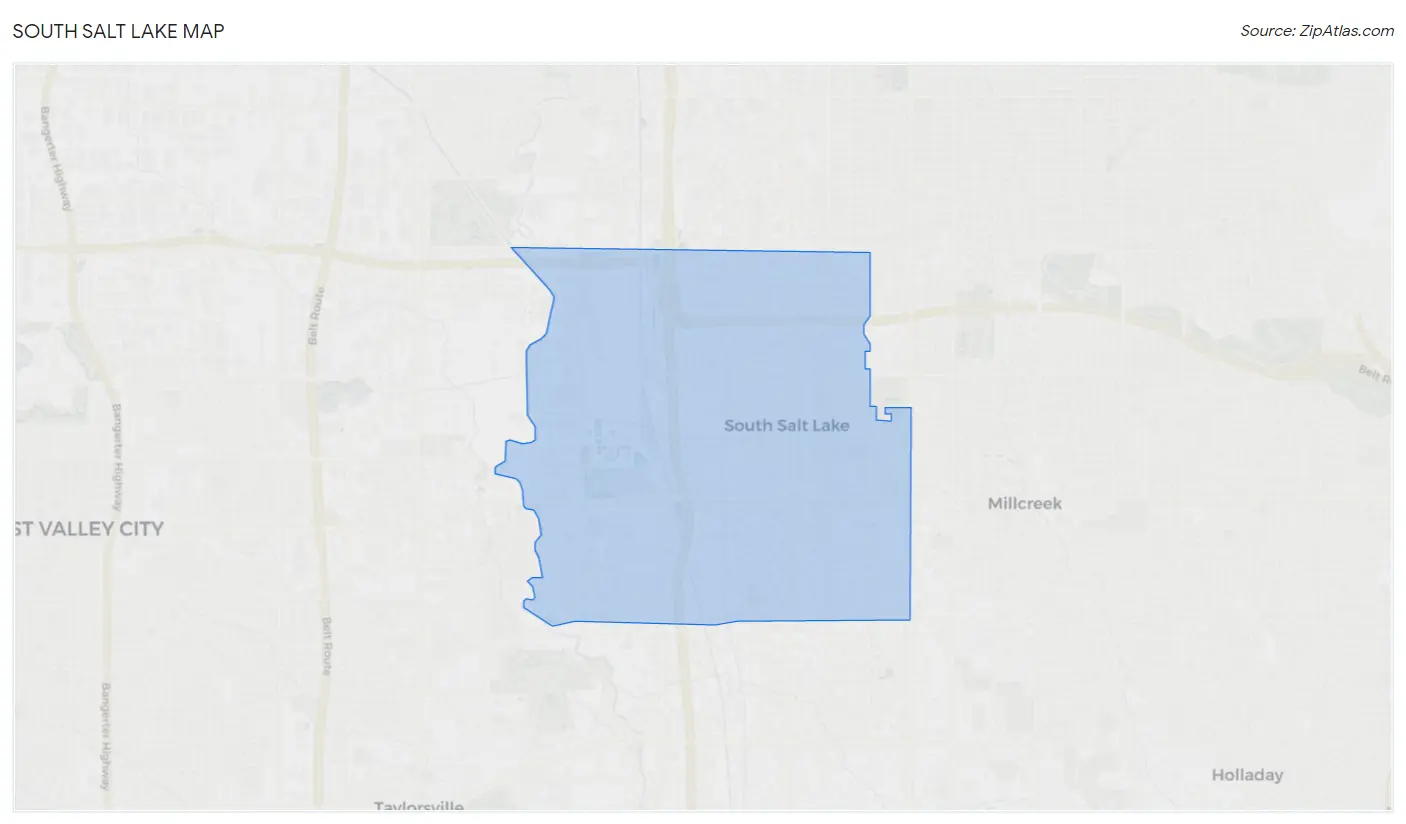
South Salt Lake Overview
$32,327
PER CAPITA INCOME
$69,112
AVG FAMILY INCOME
$57,125
AVG HOUSEHOLD INCOME
21.4%
WAGE / INCOME GAP [ % ]
78.6¢/ $1
WAGE / INCOME GAP [ $ ]
$13,329
FAMILY INCOME DEFICIT
0.42
INEQUALITY / GINI INDEX
26,315
TOTAL POPULATION
13,518
MALE POPULATION
12,797
FEMALE POPULATION
105.63
MALES / 100 FEMALES
94.67
FEMALES / 100 MALES
31.3
MEDIAN AGE
3.2
AVG FAMILY SIZE
2.4
AVG HOUSEHOLD SIZE
15,778
LABOR FORCE [ PEOPLE ]
73.3%
PERCENT IN LABOR FORCE
4.8%
UNEMPLOYMENT RATE
Income in South Salt Lake
Income Overview in South Salt Lake
Per Capita Income in South Salt Lake is $32,327, while median incomes of families and households are $69,112 and $57,125 respectively.
| Characteristic | Number | Measure |
| Per Capita Income | 26,315 | $32,327 |
| Median Family Income | 5,449 | $69,112 |
| Mean Family Income | 5,449 | $85,427 |
| Median Household Income | 10,600 | $57,125 |
| Mean Household Income | 10,600 | $76,947 |
| Income Deficit | 5,449 | $13,329 |
| Wage / Income Gap (%) | 26,315 | 21.37% |
| Wage / Income Gap ($) | 26,315 | 78.63¢ per $1 |
| Gini / Inequality Index | 26,315 | 0.42 |
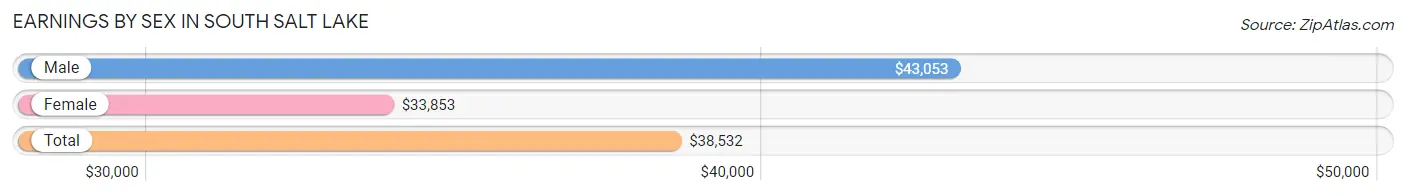
Earnings by Sex in South Salt Lake
Average Earnings in South Salt Lake are $38,532, $43,053 for men and $33,853 for women, a difference of 21.4%.
| Sex | Number | Average Earnings |
| Male | 8,906 (54.0%) | $43,053 |
| Female | 7,586 (46.0%) | $33,853 |
| Total | 16,492 (100.0%) | $38,532 |
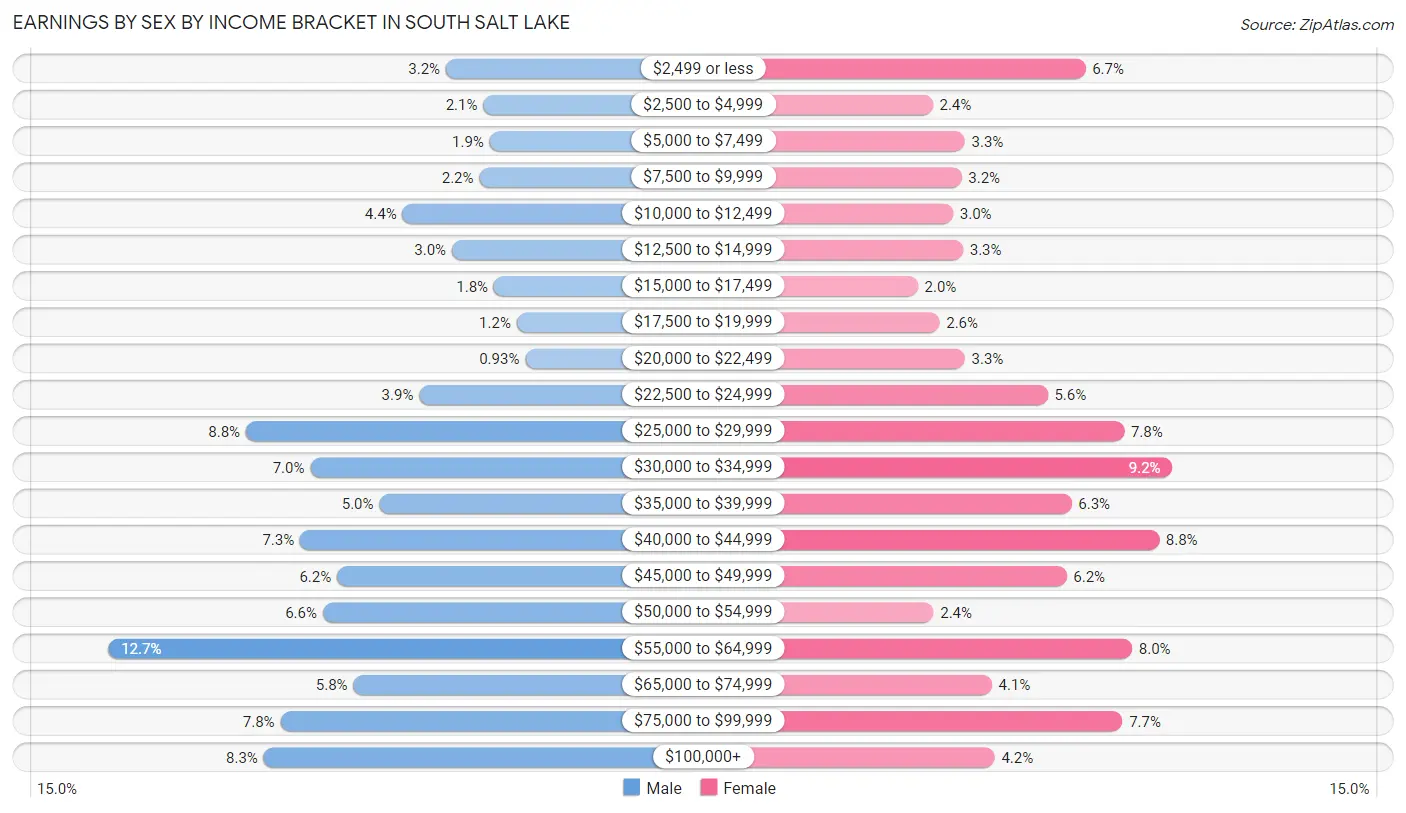
Earnings by Sex by Income Bracket in South Salt Lake
The most common earnings brackets in South Salt Lake are $55,000 to $64,999 for men (1,127 | 12.7%) and $30,000 to $34,999 for women (694 | 9.1%).
| Income | Male | Female |
| $2,499 or less | 281 (3.2%) | 508 (6.7%) |
| $2,500 to $4,999 | 188 (2.1%) | 183 (2.4%) |
| $5,000 to $7,499 | 172 (1.9%) | 251 (3.3%) |
| $7,500 to $9,999 | 198 (2.2%) | 244 (3.2%) |
| $10,000 to $12,499 | 390 (4.4%) | 226 (3.0%) |
| $12,500 to $14,999 | 266 (3.0%) | 247 (3.3%) |
| $15,000 to $17,499 | 161 (1.8%) | 151 (2.0%) |
| $17,500 to $19,999 | 104 (1.2%) | 197 (2.6%) |
| $20,000 to $22,499 | 83 (0.9%) | 251 (3.3%) |
| $22,500 to $24,999 | 348 (3.9%) | 428 (5.6%) |
| $25,000 to $29,999 | 782 (8.8%) | 591 (7.8%) |
| $30,000 to $34,999 | 621 (7.0%) | 694 (9.1%) |
| $35,000 to $39,999 | 448 (5.0%) | 479 (6.3%) |
| $40,000 to $44,999 | 647 (7.3%) | 665 (8.8%) |
| $45,000 to $49,999 | 554 (6.2%) | 468 (6.2%) |
| $50,000 to $54,999 | 590 (6.6%) | 184 (2.4%) |
| $55,000 to $64,999 | 1,127 (12.7%) | 608 (8.0%) |
| $65,000 to $74,999 | 513 (5.8%) | 309 (4.1%) |
| $75,000 to $99,999 | 696 (7.8%) | 587 (7.7%) |
| $100,000+ | 737 (8.3%) | 315 (4.2%) |
| Total | 8,906 (100.0%) | 7,586 (100.0%) |
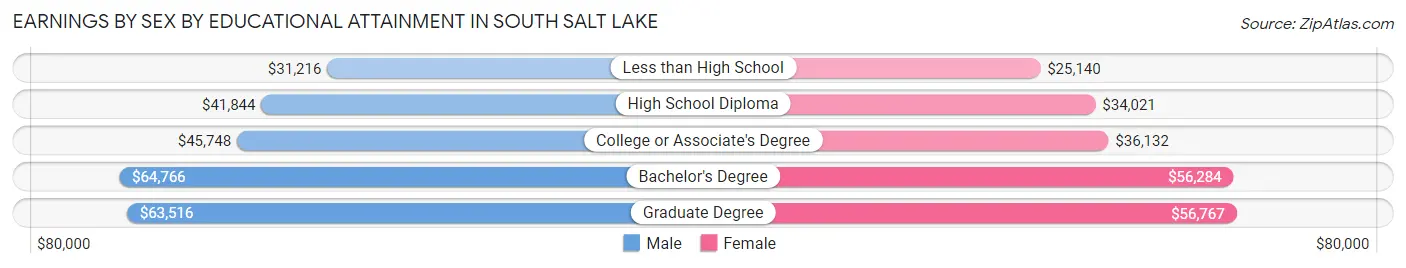
Earnings by Sex by Educational Attainment in South Salt Lake
Average earnings in South Salt Lake are $46,554 for men and $40,113 for women, a difference of 13.8%. Men with an educational attainment of bachelor's degree enjoy the highest average annual earnings of $64,766, while those with less than high school education earn the least with $31,216. Women with an educational attainment of graduate degree earn the most with the average annual earnings of $56,767, while those with less than high school education have the smallest earnings of $25,140.
| Educational Attainment | Male Income | Female Income |
| Less than High School | $31,216 | $25,140 |
| High School Diploma | $41,844 | $34,021 |
| College or Associate's Degree | $45,748 | $36,132 |
| Bachelor's Degree | $64,766 | $56,284 |
| Graduate Degree | $63,516 | $56,767 |
| Total | $46,554 | $40,113 |
Family Income in South Salt Lake
Family Income Brackets in South Salt Lake
According to the South Salt Lake family income data, there are 1,264 families falling into the $50,000 to $74,999 income range, which is the most common income bracket and makes up 23.2% of all families. Conversely, the $10,000 to $14,999 income bracket is the least frequent group with only 142 families (2.6%) belonging to this category.
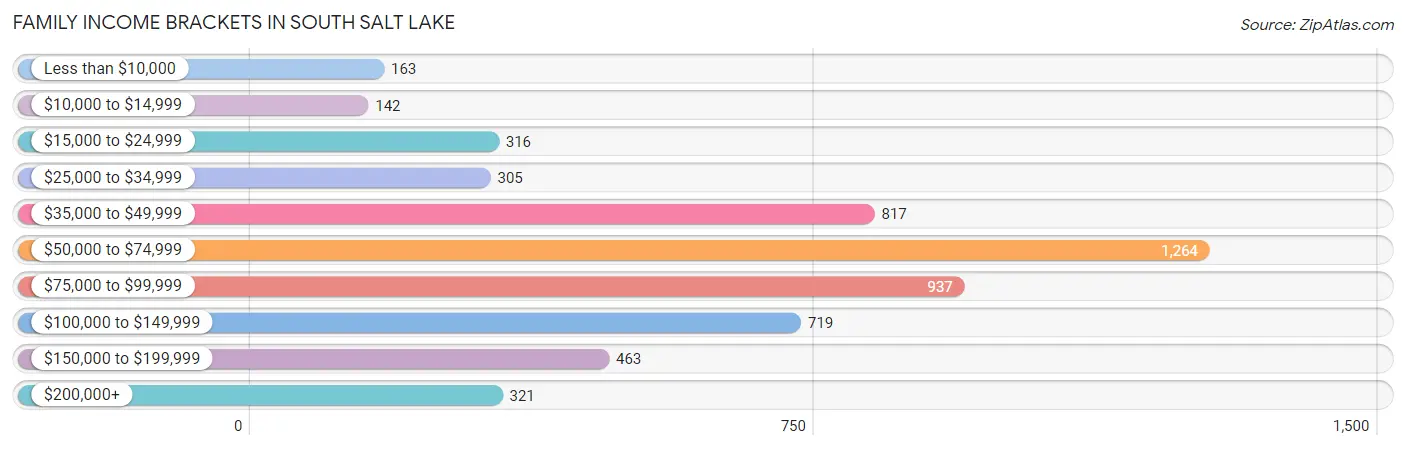
| Income Bracket | # Families | % Families |
| Less than $10,000 | 163 | 3.0% |
| $10,000 to $14,999 | 142 | 2.6% |
| $15,000 to $24,999 | 316 | 5.8% |
| $25,000 to $34,999 | 305 | 5.6% |
| $35,000 to $49,999 | 817 | 15.0% |
| $50,000 to $74,999 | 1,264 | 23.2% |
| $75,000 to $99,999 | 937 | 17.2% |
| $100,000 to $149,999 | 719 | 13.2% |
| $150,000 to $199,999 | 463 | 8.5% |
| $200,000+ | 321 | 5.9% |
Family Income by Famaliy Size in South Salt Lake
3-person families (1,238 | 22.7%) account for the highest median family income in South Salt Lake with $95,114 per family, while 2-person families (2,594 | 47.6%) have the highest median income of $34,904 per family member.
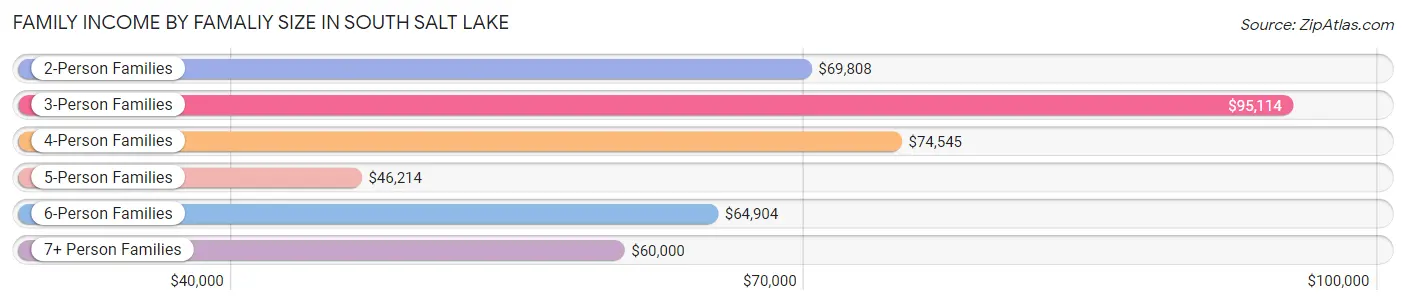
| Income Bracket | # Families | Median Income |
| 2-Person Families | 2,594 (47.6%) | $69,808 |
| 3-Person Families | 1,238 (22.7%) | $95,114 |
| 4-Person Families | 778 (14.3%) | $74,545 |
| 5-Person Families | 582 (10.7%) | $46,214 |
| 6-Person Families | 139 (2.5%) | $64,904 |
| 7+ Person Families | 118 (2.2%) | $60,000 |
| Total | 5,449 (100.0%) | $69,112 |
Family Income by Number of Earners in South Salt Lake
The median family income in South Salt Lake is $69,112, with families comprising 3+ earners (595) having the highest median family income of $99,793, while families with no earners (443) have the lowest median family income of $14,528, accounting for 10.9% and 8.1% of families, respectively.
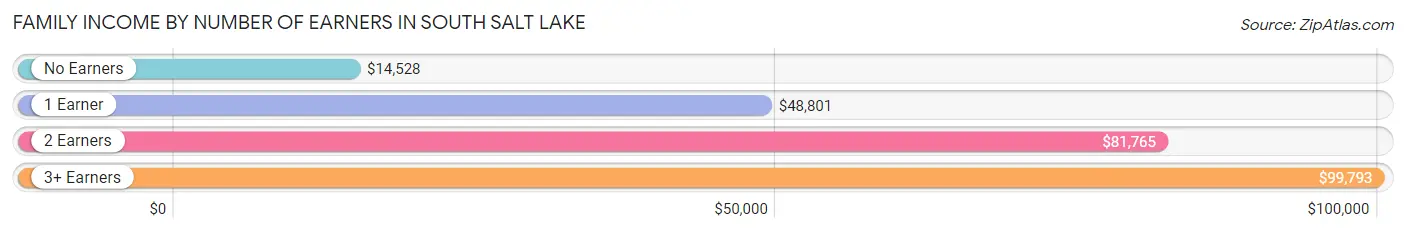
| Number of Earners | # Families | Median Income |
| No Earners | 443 (8.1%) | $14,528 |
| 1 Earner | 1,515 (27.8%) | $48,801 |
| 2 Earners | 2,896 (53.1%) | $81,765 |
| 3+ Earners | 595 (10.9%) | $99,793 |
| Total | 5,449 (100.0%) | $69,112 |
Household Income in South Salt Lake
Household Income Brackets in South Salt Lake
With 2,332 households falling in the category, the $50,000 to $74,999 income range is the most frequent in South Salt Lake, accounting for 22.0% of all households. In contrast, only 339 households (3.2%) fall into the $10,000 to $14,999 income bracket, making it the least populous group.
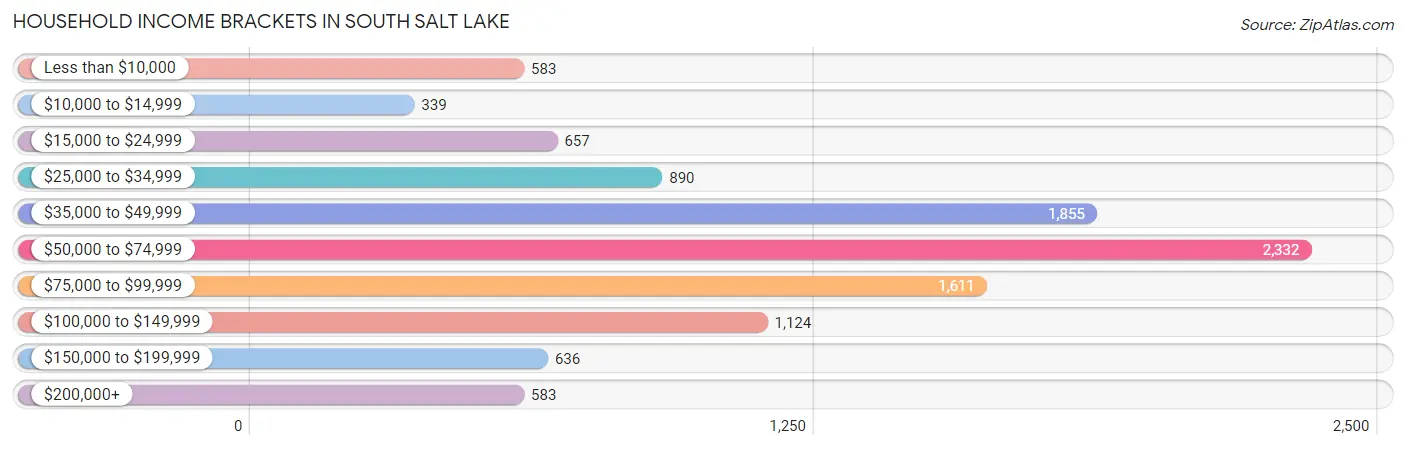
| Income Bracket | # Households | % Households |
| Less than $10,000 | 583 | 5.5% |
| $10,000 to $14,999 | 339 | 3.2% |
| $15,000 to $24,999 | 657 | 6.2% |
| $25,000 to $34,999 | 890 | 8.4% |
| $35,000 to $49,999 | 1,855 | 17.5% |
| $50,000 to $74,999 | 2,332 | 22.0% |
| $75,000 to $99,999 | 1,611 | 15.2% |
| $100,000 to $149,999 | 1,124 | 10.6% |
| $150,000 to $199,999 | 636 | 6.0% |
| $200,000+ | 583 | 5.5% |
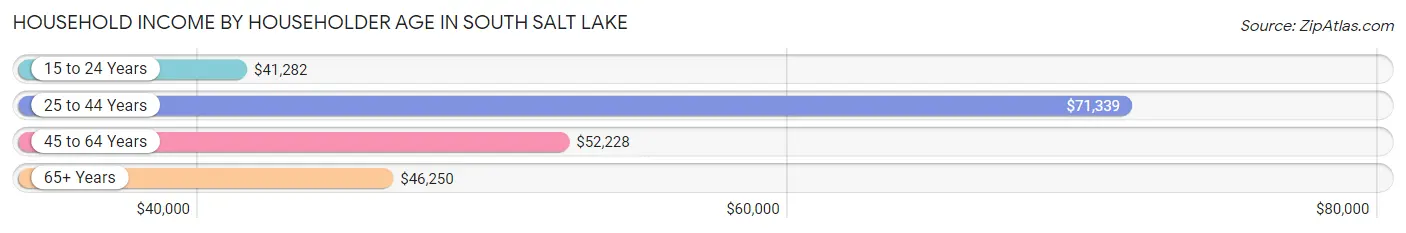
Household Income by Householder Age in South Salt Lake
The median household income in South Salt Lake is $57,125, with the highest median household income of $71,339 found in the 25 to 44 years age bracket for the primary householder. A total of 5,176 households (48.8%) fall into this category. Meanwhile, the 15 to 24 years age bracket for the primary householder has the lowest median household income of $41,282, with 1,080 households (10.2%) in this group.
| Income Bracket | # Households | Median Income |
| 15 to 24 Years | 1,080 (10.2%) | $41,282 |
| 25 to 44 Years | 5,176 (48.8%) | $71,339 |
| 45 to 64 Years | 2,912 (27.5%) | $52,228 |
| 65+ Years | 1,432 (13.5%) | $46,250 |
| Total | 10,600 (100.0%) | $57,125 |
Poverty in South Salt Lake
Income Below Poverty by Sex and Age in South Salt Lake
With 12.1% poverty level for males and 17.0% for females among the residents of South Salt Lake, 12 to 14 year old males and 5 year old females are the most vulnerable to poverty, with 123 males (26.3%) and 81 females (57.0%) in their respective age groups living below the poverty level.
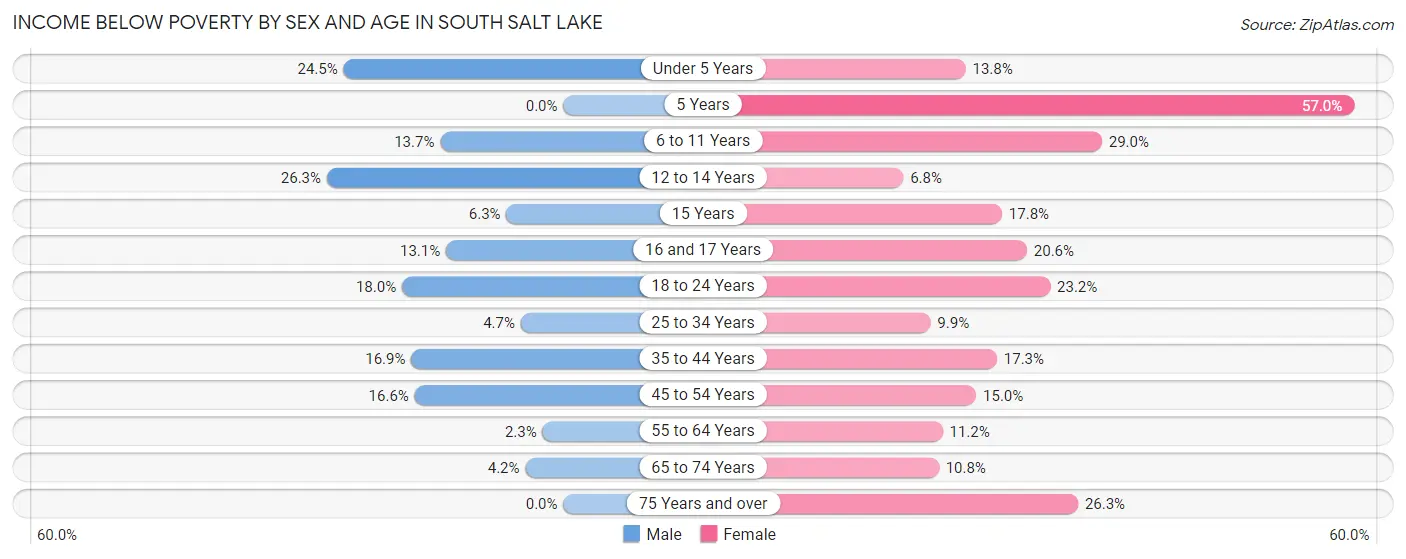
| Age Bracket | Male | Female |
| Under 5 Years | 106 (24.5%) | 113 (13.8%) |
| 5 Years | 0 (0.0%) | 81 (57.0%) |
| 6 to 11 Years | 126 (13.7%) | 285 (29.0%) |
| 12 to 14 Years | 123 (26.3%) | 21 (6.8%) |
| 15 Years | 13 (6.3%) | 23 (17.8%) |
| 16 and 17 Years | 38 (13.1%) | 68 (20.6%) |
| 18 to 24 Years | 269 (18.0%) | 490 (23.2%) |
| 25 to 34 Years | 134 (4.7%) | 231 (9.9%) |
| 35 to 44 Years | 377 (16.9%) | 363 (17.3%) |
| 45 to 54 Years | 261 (16.6%) | 184 (15.0%) |
| 55 to 64 Years | 18 (2.3%) | 127 (11.2%) |
| 65 to 74 Years | 26 (4.2%) | 63 (10.8%) |
| 75 Years and over | 0 (0.0%) | 91 (26.3%) |
| Total | 1,491 (12.1%) | 2,140 (17.0%) |
Income Above Poverty by Sex and Age in South Salt Lake
According to the poverty statistics in South Salt Lake, males aged 5 years and females aged 12 to 14 years are the age groups that are most secure financially, with 100.0% of males and 93.2% of females in these age groups living above the poverty line.
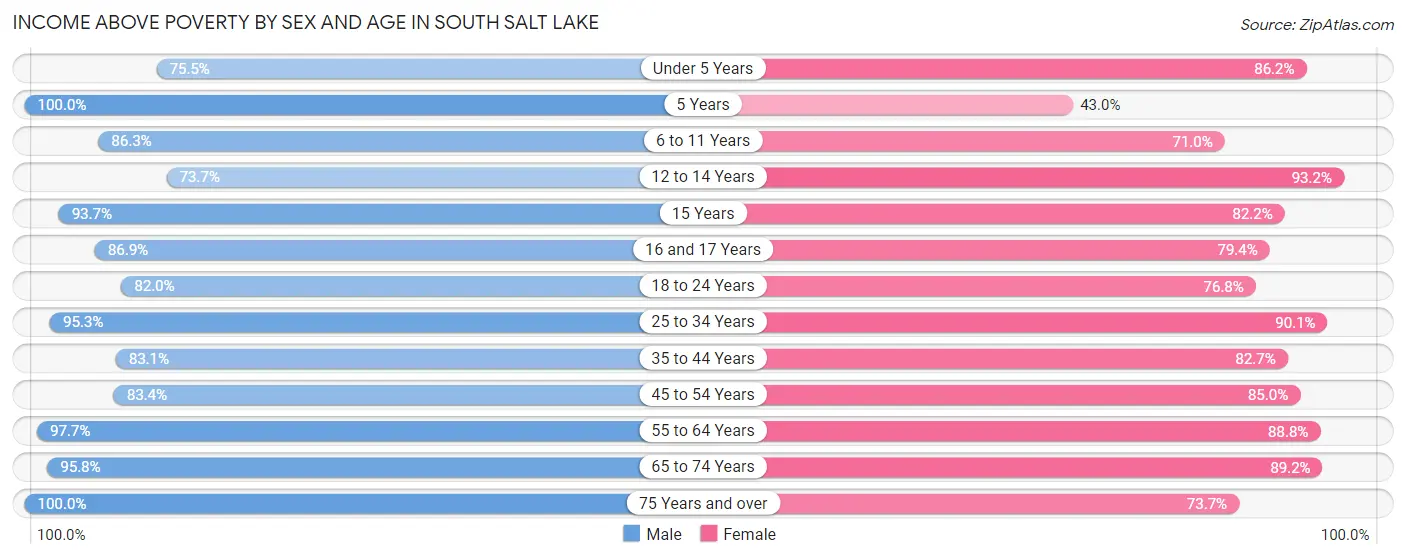
| Age Bracket | Male | Female |
| Under 5 Years | 327 (75.5%) | 707 (86.2%) |
| 5 Years | 137 (100.0%) | 61 (43.0%) |
| 6 to 11 Years | 793 (86.3%) | 699 (71.0%) |
| 12 to 14 Years | 344 (73.7%) | 286 (93.2%) |
| 15 Years | 192 (93.7%) | 106 (82.2%) |
| 16 and 17 Years | 253 (86.9%) | 262 (79.4%) |
| 18 to 24 Years | 1,228 (82.0%) | 1,622 (76.8%) |
| 25 to 34 Years | 2,693 (95.3%) | 2,109 (90.1%) |
| 35 to 44 Years | 1,850 (83.1%) | 1,739 (82.7%) |
| 45 to 54 Years | 1,315 (83.4%) | 1,046 (85.0%) |
| 55 to 64 Years | 758 (97.7%) | 1,005 (88.8%) |
| 65 to 74 Years | 588 (95.8%) | 521 (89.2%) |
| 75 Years and over | 358 (100.0%) | 255 (73.7%) |
| Total | 10,836 (87.9%) | 10,418 (83.0%) |
Income Below Poverty Among Married-Couple Families in South Salt Lake
The poverty statistics for married-couple families in South Salt Lake show that 6.5% or 217 of the total 3,348 families live below the poverty line. Families with 3 or 4 children have the highest poverty rate of 29.3%, comprising of 119 families. On the other hand, families with 5 or more children have the lowest poverty rate of 0.0%, which includes 0 families.
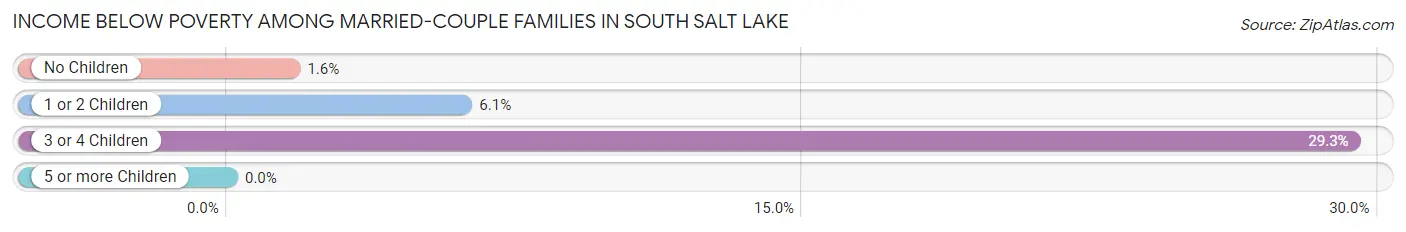
| Children | Above Poverty | Below Poverty |
| No Children | 1,750 (98.4%) | 29 (1.6%) |
| 1 or 2 Children | 1,059 (93.9%) | 69 (6.1%) |
| 3 or 4 Children | 287 (70.7%) | 119 (29.3%) |
| 5 or more Children | 35 (100.0%) | 0 (0.0%) |
| Total | 3,131 (93.5%) | 217 (6.5%) |
Income Below Poverty Among Single-Parent Households in South Salt Lake
According to the poverty data in South Salt Lake, 14.0% or 127 single-father households and 15.3% or 183 single-mother households are living below the poverty line. Among single-father households, those with 3 or 4 children have the highest poverty rate, with 56 households (73.7%) experiencing poverty. Likewise, among single-mother households, those with 3 or 4 children have the highest poverty rate, with 62 households (46.6%) falling below the poverty line.
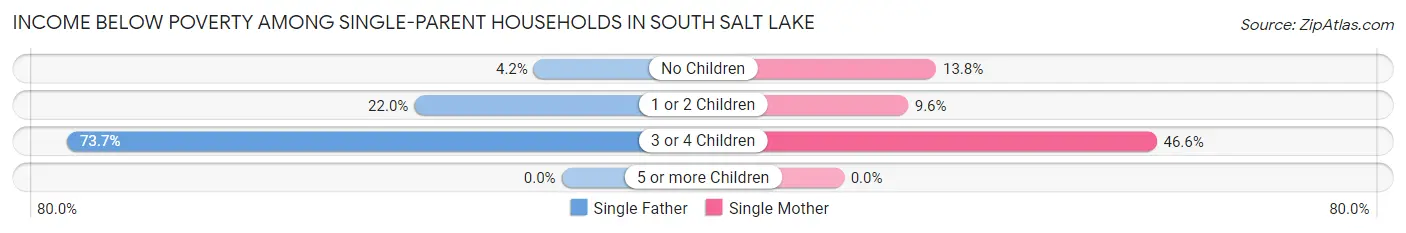
| Children | Single Father | Single Mother |
| No Children | 26 (4.2%) | 68 (13.8%) |
| 1 or 2 Children | 45 (22.0%) | 53 (9.6%) |
| 3 or 4 Children | 56 (73.7%) | 62 (46.6%) |
| 5 or more Children | 0 (0.0%) | 0 (0.0%) |
| Total | 127 (14.0%) | 183 (15.3%) |
Income Below Poverty Among Married-Couple vs Single-Parent Households in South Salt Lake
The poverty data for South Salt Lake shows that 217 of the married-couple family households (6.5%) and 310 of the single-parent households (14.7%) are living below the poverty level. Within the married-couple family households, those with 3 or 4 children have the highest poverty rate, with 119 households (29.3%) falling below the poverty line. Among the single-parent households, those with 3 or 4 children have the highest poverty rate, with 118 household (56.5%) living below poverty.
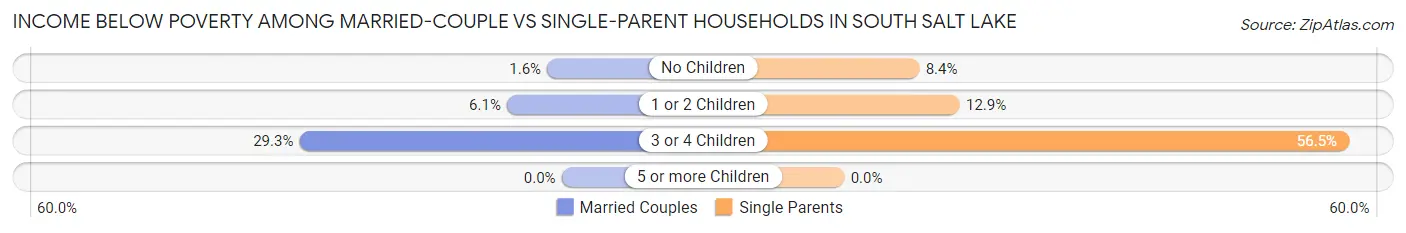
| Children | Married-Couple Families | Single-Parent Households |
| No Children | 29 (1.6%) | 94 (8.4%) |
| 1 or 2 Children | 69 (6.1%) | 98 (12.9%) |
| 3 or 4 Children | 119 (29.3%) | 118 (56.5%) |
| 5 or more Children | 0 (0.0%) | 0 (0.0%) |
| Total | 217 (6.5%) | 310 (14.7%) |
Race in South Salt Lake
The most populous races in South Salt Lake are White / Caucasian (16,117 | 61.3%), Hispanic or Latino (7,724 | 29.3%), and Some other Race (2,967 | 11.3%).
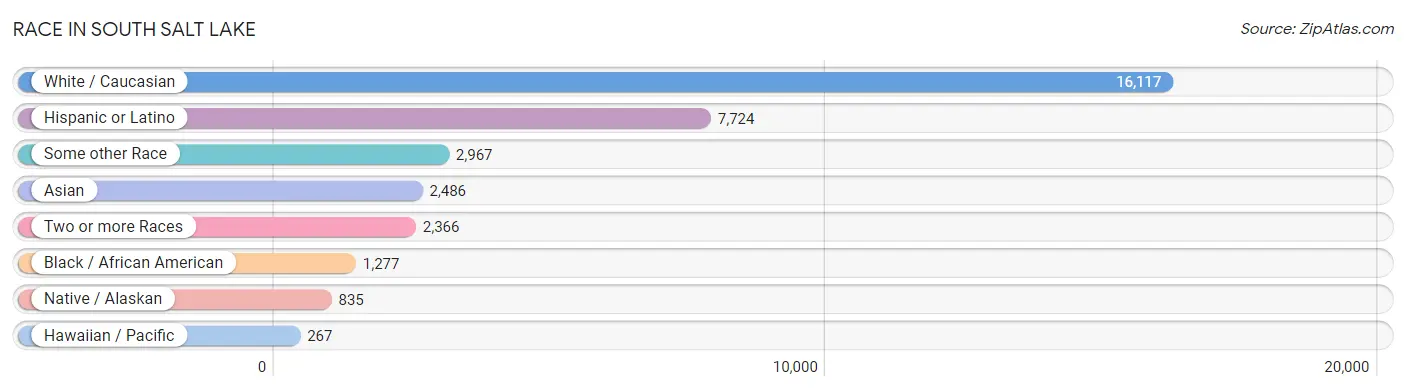
| Race | # Population | % Population |
| Asian | 2,486 | 9.5% |
| Black / African American | 1,277 | 4.9% |
| Hawaiian / Pacific | 267 | 1.0% |
| Hispanic or Latino | 7,724 | 29.3% |
| Native / Alaskan | 835 | 3.2% |
| White / Caucasian | 16,117 | 61.3% |
| Two or more Races | 2,366 | 9.0% |
| Some other Race | 2,967 | 11.3% |
| Total | 26,315 | 100.0% |
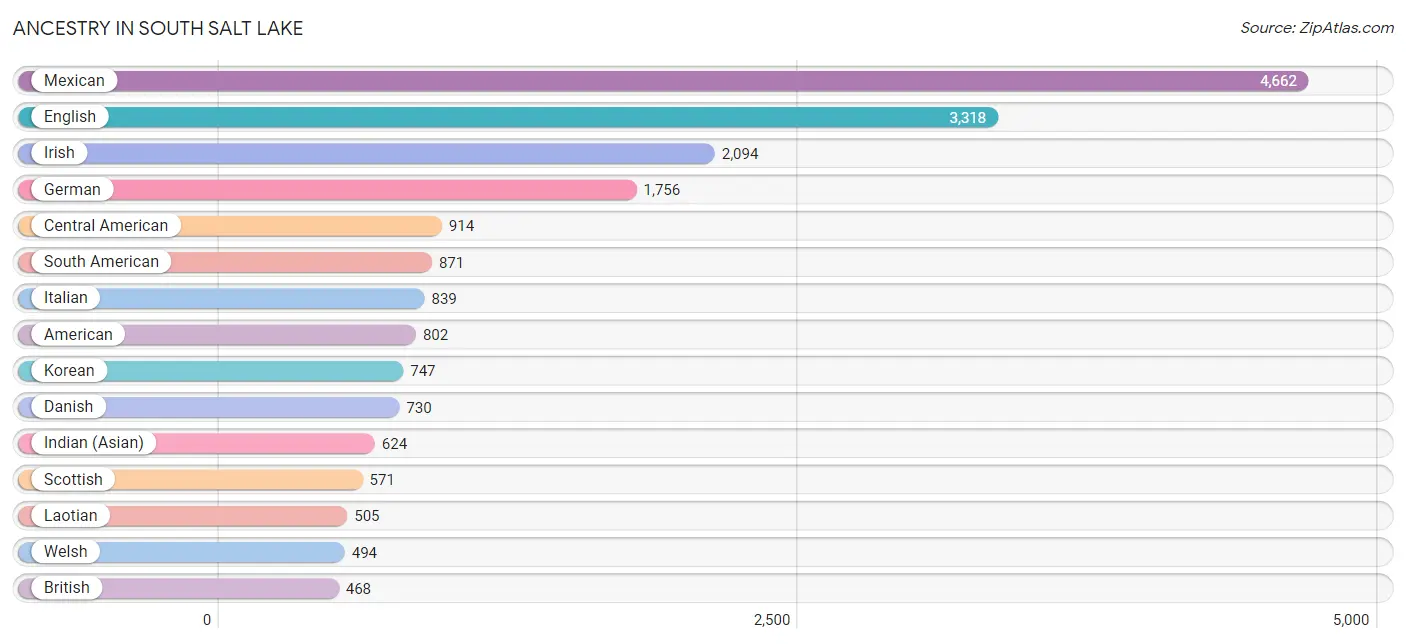
Ancestry in South Salt Lake
The most populous ancestries reported in South Salt Lake are Mexican (4,662 | 17.7%), English (3,318 | 12.6%), Irish (2,094 | 8.0%), German (1,756 | 6.7%), and Central American (914 | 3.5%), together accounting for 48.4% of all South Salt Lake residents.
| Ancestry | # Population | % Population |
| African | 77 | 0.3% |
| Alaska Native | 8 | 0.0% |
| American | 802 | 3.0% |
| Apache | 315 | 1.2% |
| Arab | 119 | 0.4% |
| Arapaho | 100 | 0.4% |
| Argentinean | 78 | 0.3% |
| Armenian | 5 | 0.0% |
| Australian | 8 | 0.0% |
| Austrian | 18 | 0.1% |
| Basque | 28 | 0.1% |
| Belgian | 6 | 0.0% |
| Bhutanese | 144 | 0.5% |
| Blackfeet | 12 | 0.1% |
| Bolivian | 72 | 0.3% |
| Brazilian | 219 | 0.8% |
| British | 468 | 1.8% |
| Burmese | 11 | 0.0% |
| Canadian | 53 | 0.2% |
| Central American | 914 | 3.5% |
| Central American Indian | 20 | 0.1% |
| Cherokee | 38 | 0.1% |
| Chilean | 22 | 0.1% |
| Chippewa | 7 | 0.0% |
| Colombian | 148 | 0.6% |
| Cuban | 138 | 0.5% |
| Czech | 10 | 0.0% |
| Danish | 730 | 2.8% |
| Dominican | 358 | 1.4% |
| Dutch | 362 | 1.4% |
| Ecuadorian | 27 | 0.1% |
| English | 3,318 | 12.6% |
| Ethiopian | 119 | 0.4% |
| European | 416 | 1.6% |
| Finnish | 32 | 0.1% |
| French | 315 | 1.2% |
| French Canadian | 3 | 0.0% |
| German | 1,756 | 6.7% |
| Greek | 122 | 0.5% |
| Guamanian / Chamorro | 26 | 0.1% |
| Guatemalan | 285 | 1.1% |
| Honduran | 433 | 1.7% |
| Hopi | 42 | 0.2% |
| Hungarian | 94 | 0.4% |
| Indian (Asian) | 624 | 2.4% |
| Indonesian | 94 | 0.4% |
| Iranian | 134 | 0.5% |
| Iraqi | 34 | 0.1% |
| Irish | 2,094 | 8.0% |
| Italian | 839 | 3.2% |
| Japanese | 18 | 0.1% |
| Korean | 747 | 2.8% |
| Laotian | 505 | 1.9% |
| Lebanese | 65 | 0.3% |
| Liberian | 15 | 0.1% |
| Lithuanian | 38 | 0.1% |
| Mexican | 4,662 | 17.7% |
| Mexican American Indian | 26 | 0.1% |
| Native Hawaiian | 315 | 1.2% |
| Navajo | 362 | 1.4% |
| Nicaraguan | 43 | 0.2% |
| Nigerian | 36 | 0.1% |
| Northern European | 25 | 0.1% |
| Norwegian | 297 | 1.1% |
| Paiute | 6 | 0.0% |
| Peruvian | 456 | 1.7% |
| Polish | 138 | 0.5% |
| Portuguese | 30 | 0.1% |
| Pueblo | 25 | 0.1% |
| Puerto Rican | 27 | 0.1% |
| Romanian | 29 | 0.1% |
| Russian | 119 | 0.4% |
| Salvadoran | 153 | 0.6% |
| Samoan | 147 | 0.6% |
| Scandinavian | 83 | 0.3% |
| Scotch-Irish | 95 | 0.4% |
| Scottish | 571 | 2.2% |
| Shoshone | 4 | 0.0% |
| Slovak | 8 | 0.0% |
| Somali | 24 | 0.1% |
| South American | 871 | 3.3% |
| South American Indian | 12 | 0.1% |
| Spaniard | 95 | 0.4% |
| Spanish | 341 | 1.3% |
| Spanish American | 17 | 0.1% |
| Spanish American Indian | 17 | 0.1% |
| Sri Lankan | 18 | 0.1% |
| Subsaharan African | 446 | 1.7% |
| Sudanese | 88 | 0.3% |
| Swedish | 378 | 1.4% |
| Swiss | 148 | 0.6% |
| Thai | 384 | 1.5% |
| Tongan | 464 | 1.8% |
| Ugandan | 64 | 0.2% |
| Uruguayan | 22 | 0.1% |
| Ute | 19 | 0.1% |
| Venezuelan | 12 | 0.1% |
| Welsh | 494 | 1.9% |
| Yugoslavian | 10 | 0.0% | View All 99 Rows |
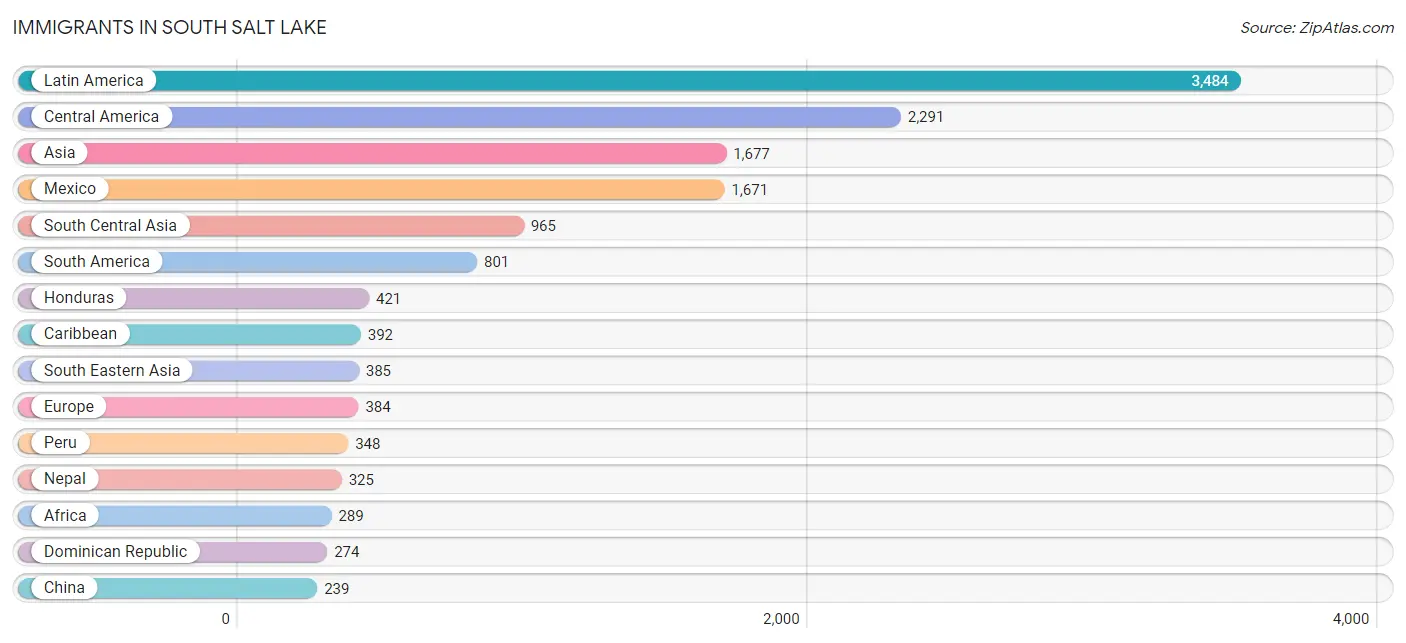
Immigrants in South Salt Lake
The most numerous immigrant groups reported in South Salt Lake came from Latin America (3,484 | 13.2%), Central America (2,291 | 8.7%), Asia (1,677 | 6.4%), Mexico (1,671 | 6.4%), and South Central Asia (965 | 3.7%), together accounting for 38.3% of all South Salt Lake residents.
| Immigration Origin | # Population | % Population |
| Africa | 289 | 1.1% |
| Argentina | 44 | 0.2% |
| Asia | 1,677 | 6.4% |
| Bolivia | 72 | 0.3% |
| Brazil | 205 | 0.8% |
| Canada | 53 | 0.2% |
| Caribbean | 392 | 1.5% |
| Central America | 2,291 | 8.7% |
| Chile | 22 | 0.1% |
| China | 239 | 0.9% |
| Colombia | 76 | 0.3% |
| Congo | 63 | 0.2% |
| Cuba | 67 | 0.3% |
| Denmark | 49 | 0.2% |
| Dominican Republic | 274 | 1.0% |
| Eastern Africa | 144 | 0.5% |
| Eastern Asia | 239 | 0.9% |
| Eastern Europe | 124 | 0.5% |
| El Salvador | 64 | 0.2% |
| England | 17 | 0.1% |
| Ethiopia | 95 | 0.4% |
| Europe | 384 | 1.5% |
| Guatemala | 104 | 0.4% |
| Haiti | 51 | 0.2% |
| Honduras | 421 | 1.6% |
| Hong Kong | 21 | 0.1% |
| Hungary | 48 | 0.2% |
| India | 80 | 0.3% |
| Iran | 164 | 0.6% |
| Iraq | 88 | 0.3% |
| Latin America | 3,484 | 13.2% |
| Liberia | 15 | 0.1% |
| Malaysia | 180 | 0.7% |
| Mexico | 1,671 | 6.4% |
| Middle Africa | 63 | 0.2% |
| Nepal | 325 | 1.2% |
| Netherlands | 26 | 0.1% |
| Nicaragua | 31 | 0.1% |
| Nigeria | 33 | 0.1% |
| Northern Africa | 24 | 0.1% |
| Northern Europe | 66 | 0.3% |
| Pakistan | 7 | 0.0% |
| Peru | 348 | 1.3% |
| Philippines | 9 | 0.0% |
| Russia | 41 | 0.2% |
| Serbia | 10 | 0.0% |
| Somalia | 24 | 0.1% |
| South America | 801 | 3.0% |
| South Central Asia | 965 | 3.7% |
| South Eastern Asia | 385 | 1.5% |
| Southern Europe | 168 | 0.6% |
| Spain | 168 | 0.6% |
| Sudan | 24 | 0.1% |
| Taiwan | 14 | 0.1% |
| Thailand | 45 | 0.2% |
| Uganda | 11 | 0.0% |
| Uruguay | 22 | 0.1% |
| Venezuela | 12 | 0.1% |
| Vietnam | 18 | 0.1% |
| Western Africa | 58 | 0.2% |
| Western Asia | 88 | 0.3% |
| Western Europe | 26 | 0.1% | View All 62 Rows |
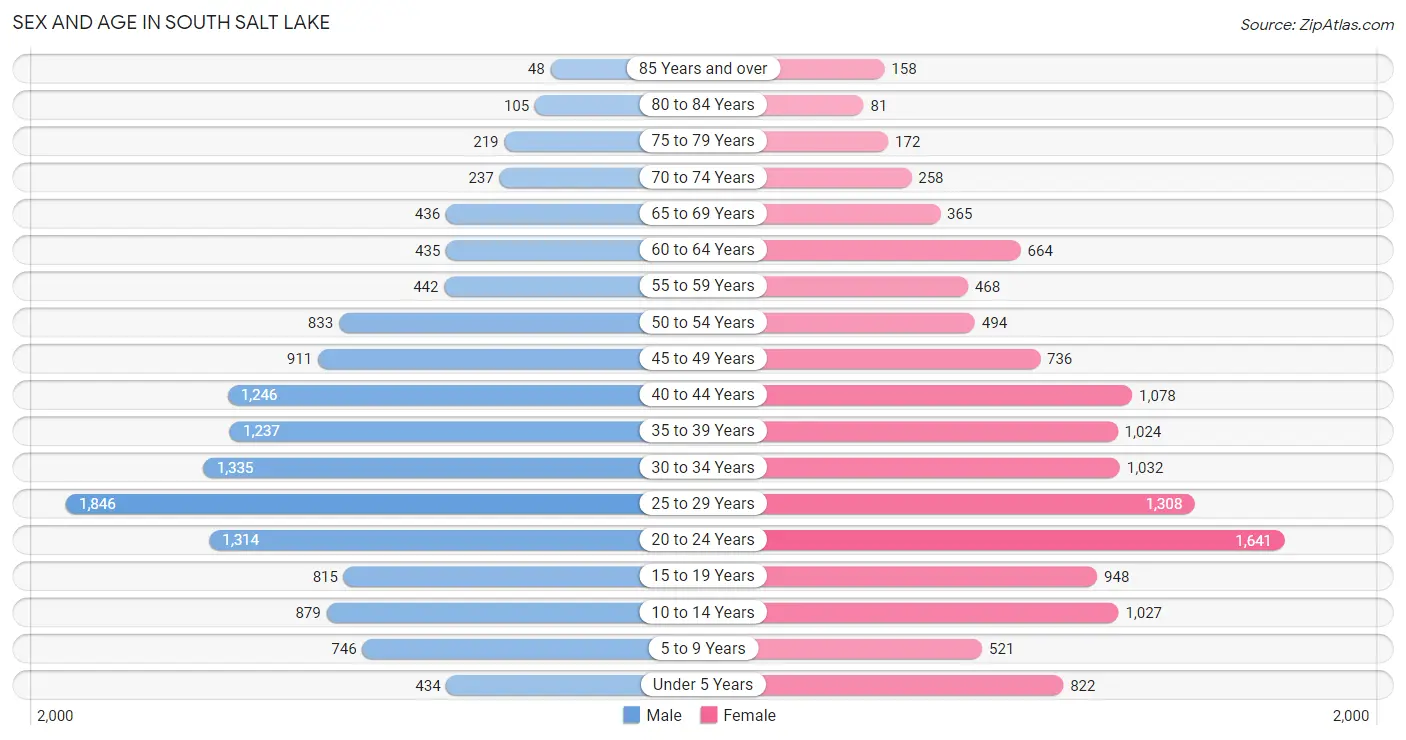
Sex and Age in South Salt Lake
Sex and Age in South Salt Lake
The most populous age groups in South Salt Lake are 25 to 29 Years (1,846 | 13.7%) for men and 20 to 24 Years (1,641 | 12.8%) for women.
| Age Bracket | Male | Female |
| Under 5 Years | 434 (3.2%) | 822 (6.4%) |
| 5 to 9 Years | 746 (5.5%) | 521 (4.1%) |
| 10 to 14 Years | 879 (6.5%) | 1,027 (8.0%) |
| 15 to 19 Years | 815 (6.0%) | 948 (7.4%) |
| 20 to 24 Years | 1,314 (9.7%) | 1,641 (12.8%) |
| 25 to 29 Years | 1,846 (13.7%) | 1,308 (10.2%) |
| 30 to 34 Years | 1,335 (9.9%) | 1,032 (8.1%) |
| 35 to 39 Years | 1,237 (9.1%) | 1,024 (8.0%) |
| 40 to 44 Years | 1,246 (9.2%) | 1,078 (8.4%) |
| 45 to 49 Years | 911 (6.7%) | 736 (5.8%) |
| 50 to 54 Years | 833 (6.2%) | 494 (3.9%) |
| 55 to 59 Years | 442 (3.3%) | 468 (3.7%) |
| 60 to 64 Years | 435 (3.2%) | 664 (5.2%) |
| 65 to 69 Years | 436 (3.2%) | 365 (2.9%) |
| 70 to 74 Years | 237 (1.8%) | 258 (2.0%) |
| 75 to 79 Years | 219 (1.6%) | 172 (1.3%) |
| 80 to 84 Years | 105 (0.8%) | 81 (0.6%) |
| 85 Years and over | 48 (0.4%) | 158 (1.2%) |
| Total | 13,518 (100.0%) | 12,797 (100.0%) |
Families and Households in South Salt Lake
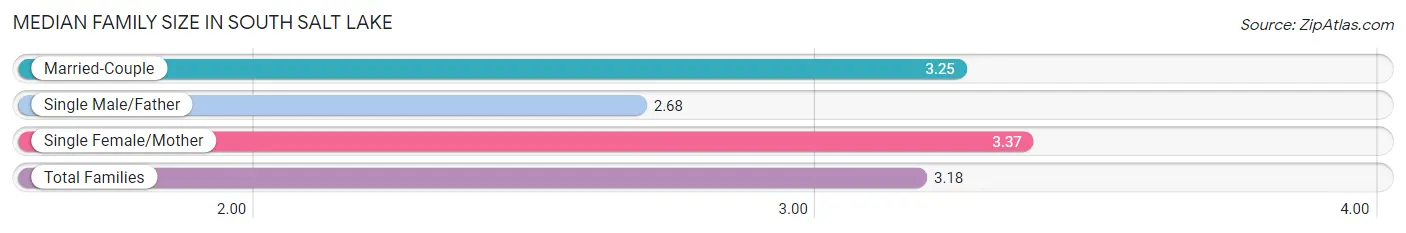
Median Family Size in South Salt Lake
The median family size in South Salt Lake is 3.18 persons per family, with single female/mother families (1,193 | 21.9%) accounting for the largest median family size of 3.37 persons per family. On the other hand, single male/father families (908 | 16.7%) represent the smallest median family size with 2.68 persons per family.
| Family Type | # Families | Family Size |
| Married-Couple | 3,348 (61.4%) | 3.25 |
| Single Male/Father | 908 (16.7%) | 2.68 |
| Single Female/Mother | 1,193 (21.9%) | 3.37 |
| Total Families | 5,449 (100.0%) | 3.18 |
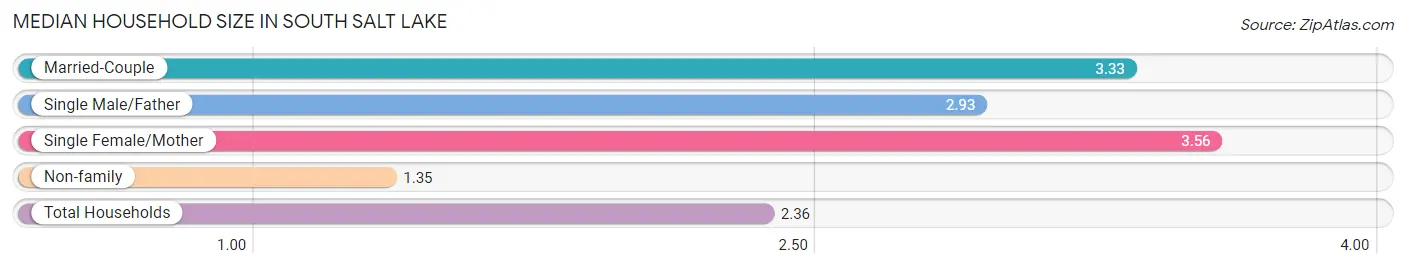
Median Household Size in South Salt Lake
The median household size in South Salt Lake is 2.36 persons per household, with single female/mother households (1,193 | 11.3%) accounting for the largest median household size of 3.56 persons per household. non-family households (5,151 | 48.6%) represent the smallest median household size with 1.35 persons per household.
| Household Type | # Households | Household Size |
| Married-Couple | 3,348 (31.6%) | 3.33 |
| Single Male/Father | 908 (8.6%) | 2.93 |
| Single Female/Mother | 1,193 (11.3%) | 3.56 |
| Non-family | 5,151 (48.6%) | 1.35 |
| Total Households | 10,600 (100.0%) | 2.36 |
Household Size by Marriage Status in South Salt Lake
Out of a total of 10,600 households in South Salt Lake, 5,449 (51.4%) are family households, while 5,151 (48.6%) are nonfamily households. The most numerous type of family households are 2-person households, comprising 2,372, and the most common type of nonfamily households are 1-person households, comprising 3,931.
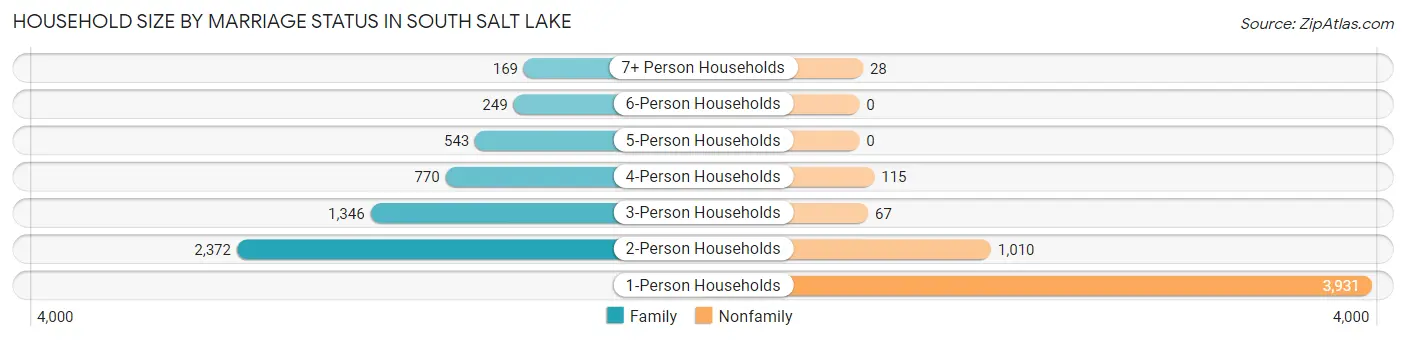
| Household Size | Family Households | Nonfamily Households |
| 1-Person Households | - | 3,931 (37.1%) |
| 2-Person Households | 2,372 (22.4%) | 1,010 (9.5%) |
| 3-Person Households | 1,346 (12.7%) | 67 (0.6%) |
| 4-Person Households | 770 (7.3%) | 115 (1.1%) |
| 5-Person Households | 543 (5.1%) | 0 (0.0%) |
| 6-Person Households | 249 (2.4%) | 0 (0.0%) |
| 7+ Person Households | 169 (1.6%) | 28 (0.3%) |
| Total | 5,449 (51.4%) | 5,151 (48.6%) |
Female Fertility in South Salt Lake
Fertility by Age in South Salt Lake
Average fertility rate in South Salt Lake is 48.0 births per 1,000 women. Women in the age bracket of 35 to 50 years have the highest fertility rate with 63.0 births per 1,000 women. Women in the age bracket of 20 to 34 years acount for 50.9% of all women with births.
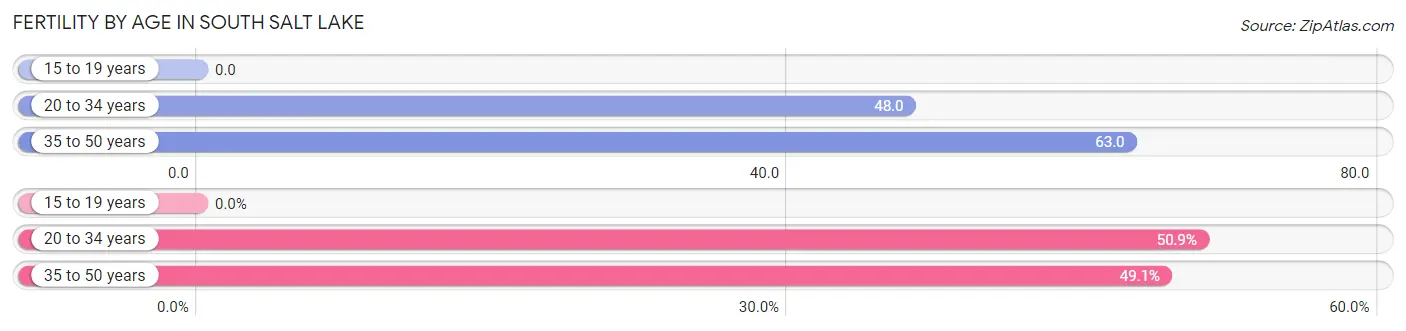
| Age Bracket | Women with Births | Births / 1,000 Women |
| 15 to 19 years | 0 (0.0%) | 0.0 |
| 20 to 34 years | 190 (50.9%) | 48.0 |
| 35 to 50 years | 183 (49.1%) | 63.0 |
| Total | 373 (100.0%) | 48.0 |
Fertility by Age by Marriage Status in South Salt Lake
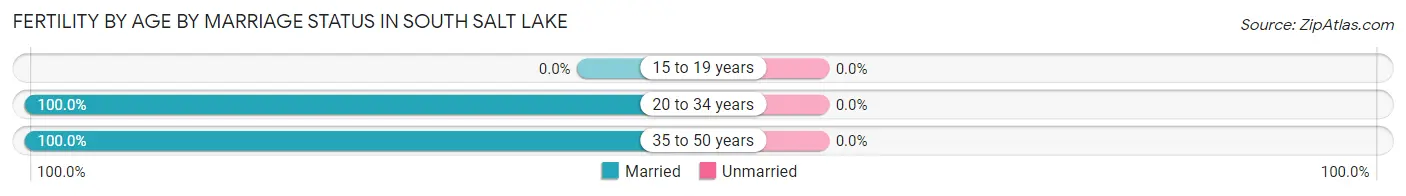
| Age Bracket | Married | Unmarried |
| 15 to 19 years | 0 (0.0%) | 0 (0.0%) |
| 20 to 34 years | 190 (100.0%) | 0 (0.0%) |
| 35 to 50 years | 183 (100.0%) | 0 (0.0%) |
| Total | 373 (100.0%) | 0 (0.0%) |
Fertility by Education in South Salt Lake
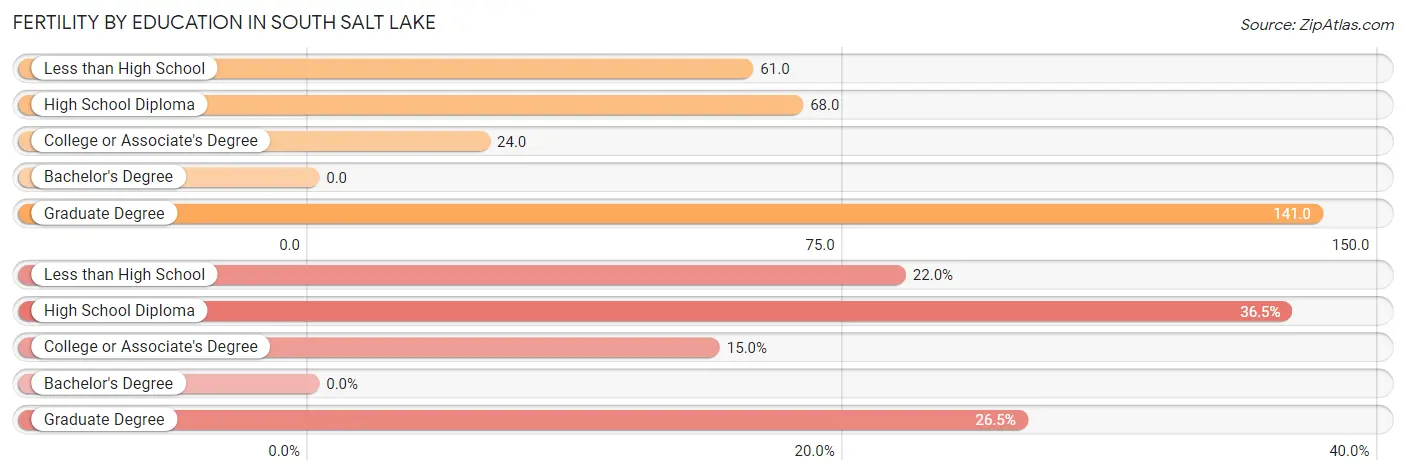
| Educational Attainment | Women with Births | Births / 1,000 Women |
| Less than High School | 82 (22.0%) | 61.0 |
| High School Diploma | 136 (36.5%) | 68.0 |
| College or Associate's Degree | 56 (15.0%) | 24.0 |
| Bachelor's Degree | 0 (0.0%) | 0.0 |
| Graduate Degree | 99 (26.5%) | 141.0 |
| Total | 373 (100.0%) | 48.0 |
Fertility by Education by Marriage Status in South Salt Lake
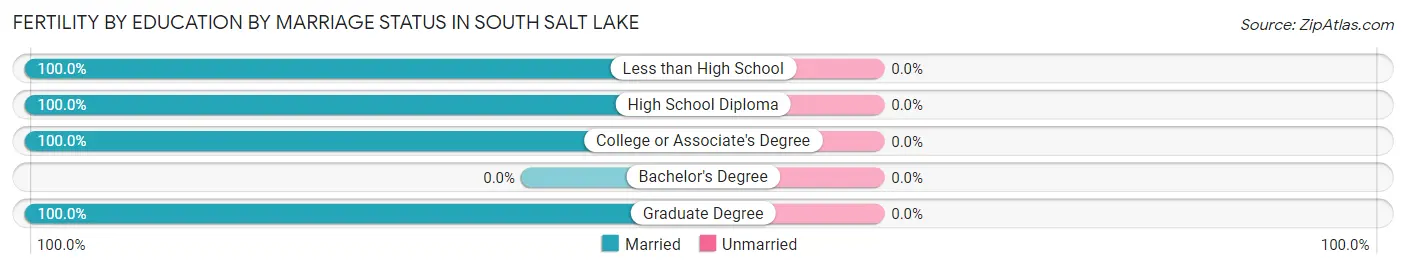
| Educational Attainment | Married | Unmarried |
| Less than High School | 82 (100.0%) | 0 (0.0%) |
| High School Diploma | 136 (100.0%) | 0 (0.0%) |
| College or Associate's Degree | 56 (100.0%) | 0 (0.0%) |
| Bachelor's Degree | 0 (0.0%) | 0 (0.0%) |
| Graduate Degree | 99 (100.0%) | 0 (0.0%) |
| Total | 373 (100.0%) | 0 (0.0%) |
Employment Characteristics in South Salt Lake
Employment by Class of Employer in South Salt Lake
Among the 14,810 employed individuals in South Salt Lake, private company employees (10,587 | 71.5%), not-for-profit organizations (1,271 | 8.6%), and state government employees (1,151 | 7.8%) make up the most common classes of employment.
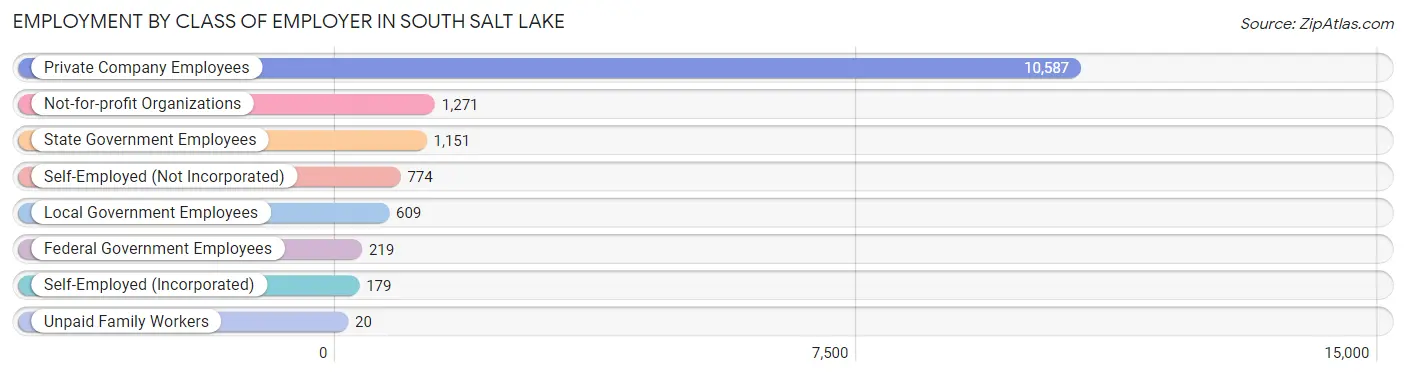
| Employer Class | # Employees | % Employees |
| Private Company Employees | 10,587 | 71.5% |
| Self-Employed (Incorporated) | 179 | 1.2% |
| Self-Employed (Not Incorporated) | 774 | 5.2% |
| Not-for-profit Organizations | 1,271 | 8.6% |
| Local Government Employees | 609 | 4.1% |
| State Government Employees | 1,151 | 7.8% |
| Federal Government Employees | 219 | 1.5% |
| Unpaid Family Workers | 20 | 0.1% |
| Total | 14,810 | 100.0% |
Employment Status by Age in South Salt Lake
According to the labor force statistics for South Salt Lake, out of the total population over 16 years of age (21,525), 73.3% or 15,778 individuals are in the labor force, with 4.8% or 757 of them unemployed. The age group with the highest labor force participation rate is 55 to 59 years, with 86.5% or 787 individuals in the labor force. Within the labor force, the 16 to 19 years age range has the highest percentage of unemployed individuals, with 16.9% or 79 of them being unemployed.
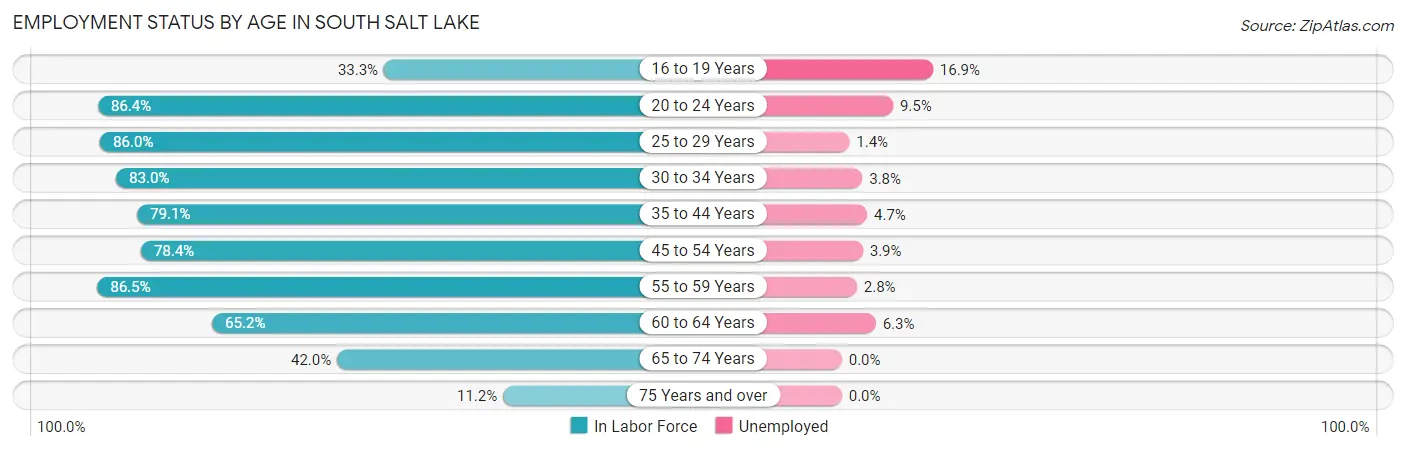
| Age Bracket | In Labor Force | Unemployed |
| 16 to 19 Years | 467 (33.3%) | 79 (16.9%) |
| 20 to 24 Years | 2,553 (86.4%) | 243 (9.5%) |
| 25 to 29 Years | 2,712 (86.0%) | 38 (1.4%) |
| 30 to 34 Years | 1,965 (83.0%) | 75 (3.8%) |
| 35 to 44 Years | 3,627 (79.1%) | 170 (4.7%) |
| 45 to 54 Years | 2,332 (78.4%) | 91 (3.9%) |
| 55 to 59 Years | 787 (86.5%) | 22 (2.8%) |
| 60 to 64 Years | 717 (65.2%) | 45 (6.3%) |
| 65 to 74 Years | 544 (42.0%) | 0 (0.0%) |
| 75 Years and over | 88 (11.2%) | 0 (0.0%) |
| Total | 15,778 (73.3%) | 757 (4.8%) |
Employment Status by Educational Attainment in South Salt Lake
According to labor force statistics for South Salt Lake, 80.4% of individuals (12,132) out of the total population between 25 and 64 years of age (15,089) are in the labor force, with 3.7% or 449 of them being unemployed. The group with the highest labor force participation rate are those with the educational attainment of bachelor's degree or higher, with 93.1% or 4,299 individuals in the labor force. Within the labor force, individuals with high school diploma education have the highest percentage of unemployment, with 5.6% or 176 of them being unemployed.
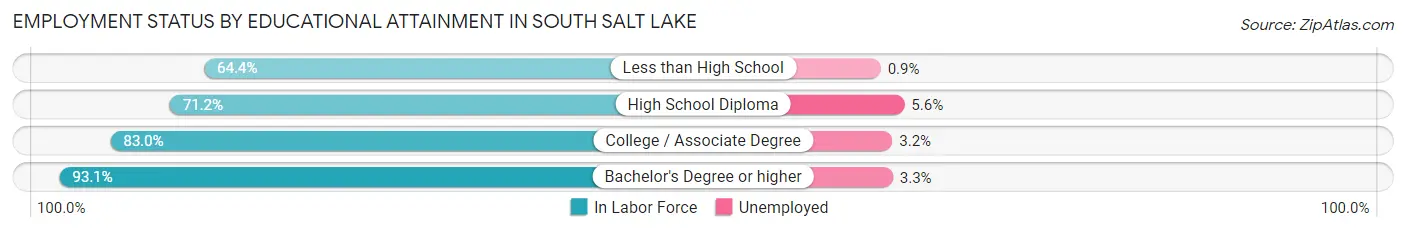
| Educational Attainment | In Labor Force | Unemployed |
| Less than High School | 1,157 (64.4%) | 16 (0.9%) |
| High School Diploma | 3,138 (71.2%) | 247 (5.6%) |
| College / Associate Degree | 3,542 (83.0%) | 137 (3.2%) |
| Bachelor's Degree or higher | 4,299 (93.1%) | 152 (3.3%) |
| Total | 12,132 (80.4%) | 558 (3.7%) |
Employment Occupations by Sex in South Salt Lake
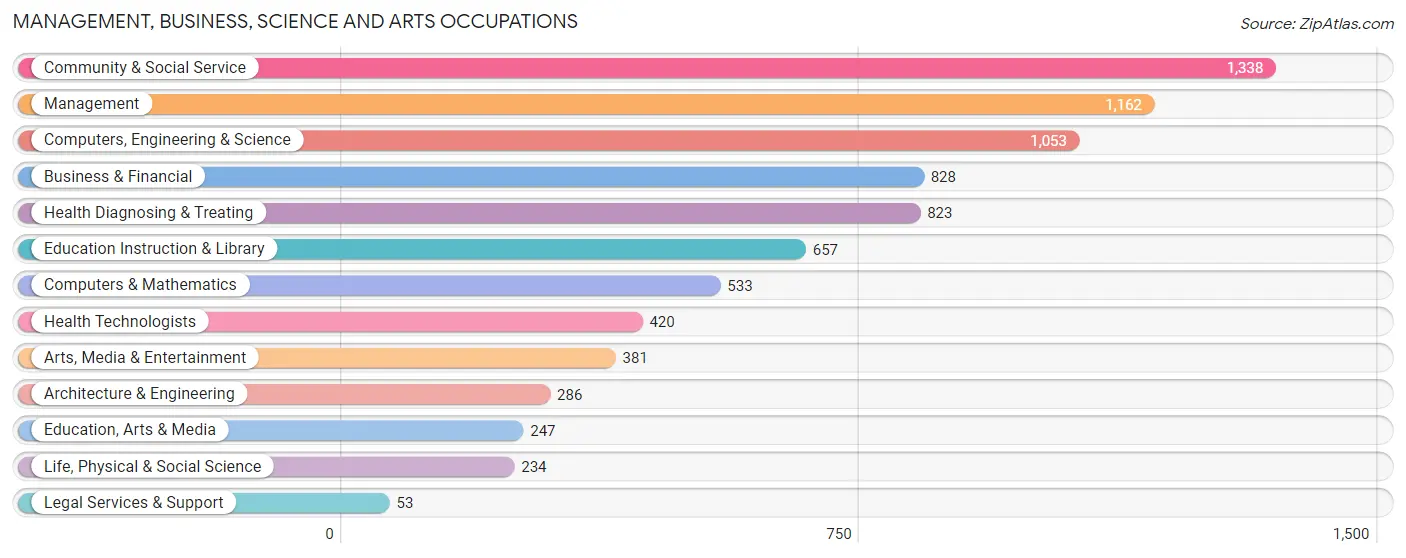
Management, Business, Science and Arts Occupations
The most common Management, Business, Science and Arts occupations in South Salt Lake are Community & Social Service (1,338 | 8.9%), Management (1,162 | 7.7%), Computers, Engineering & Science (1,053 | 7.0%), Business & Financial (828 | 5.5%), and Health Diagnosing & Treating (823 | 5.5%).
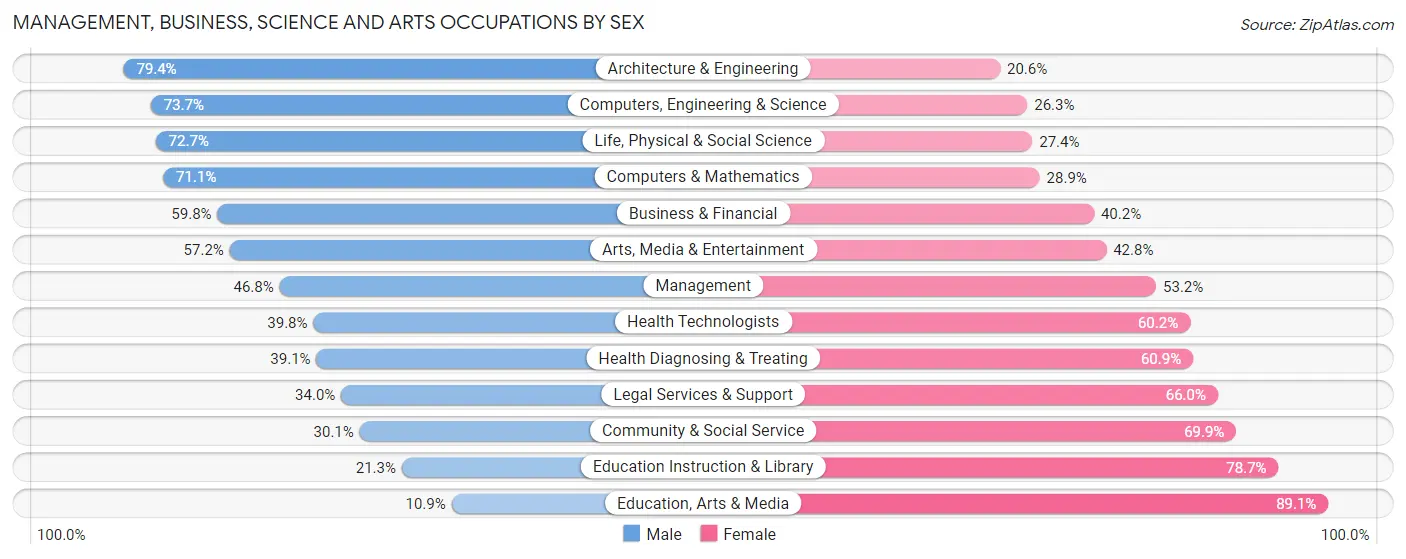
Management, Business, Science and Arts Occupations by Sex
Within the Management, Business, Science and Arts occupations in South Salt Lake, the most male-oriented occupations are Architecture & Engineering (79.4%), Computers, Engineering & Science (73.7%), and Life, Physical & Social Science (72.7%), while the most female-oriented occupations are Education, Arts & Media (89.1%), Education Instruction & Library (78.7%), and Community & Social Service (69.9%).
| Occupation | Male | Female |
| Management | 544 (46.8%) | 618 (53.2%) |
| Business & Financial | 495 (59.8%) | 333 (40.2%) |
| Computers, Engineering & Science | 776 (73.7%) | 277 (26.3%) |
| Computers & Mathematics | 379 (71.1%) | 154 (28.9%) |
| Architecture & Engineering | 227 (79.4%) | 59 (20.6%) |
| Life, Physical & Social Science | 170 (72.7%) | 64 (27.4%) |
| Community & Social Service | 403 (30.1%) | 935 (69.9%) |
| Education, Arts & Media | 27 (10.9%) | 220 (89.1%) |
| Legal Services & Support | 18 (34.0%) | 35 (66.0%) |
| Education Instruction & Library | 140 (21.3%) | 517 (78.7%) |
| Arts, Media & Entertainment | 218 (57.2%) | 163 (42.8%) |
| Health Diagnosing & Treating | 322 (39.1%) | 501 (60.9%) |
| Health Technologists | 167 (39.8%) | 253 (60.2%) |
| Total (Category) | 2,540 (48.8%) | 2,664 (51.2%) |
| Total (Overall) | 8,013 (53.4%) | 6,997 (46.6%) |
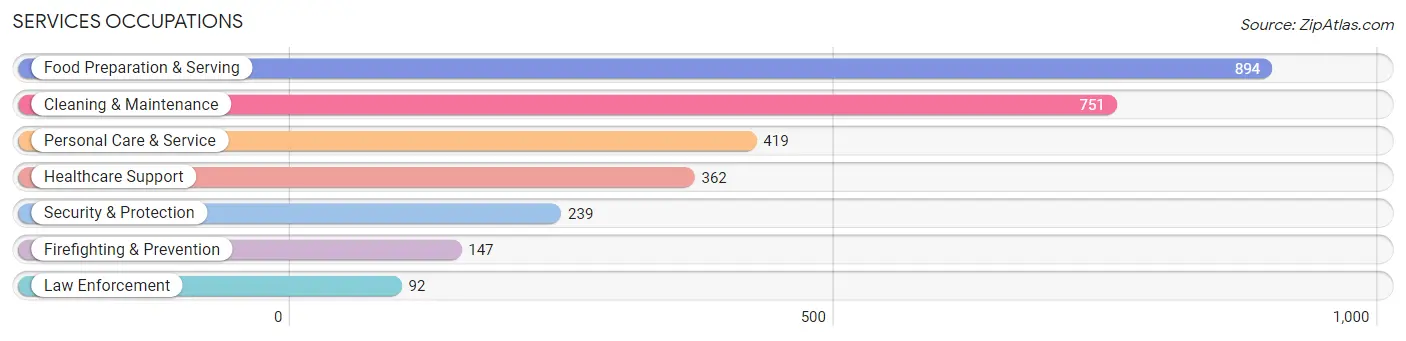
Services Occupations
The most common Services occupations in South Salt Lake are Food Preparation & Serving (894 | 6.0%), Cleaning & Maintenance (751 | 5.0%), Personal Care & Service (419 | 2.8%), Healthcare Support (362 | 2.4%), and Security & Protection (239 | 1.6%).
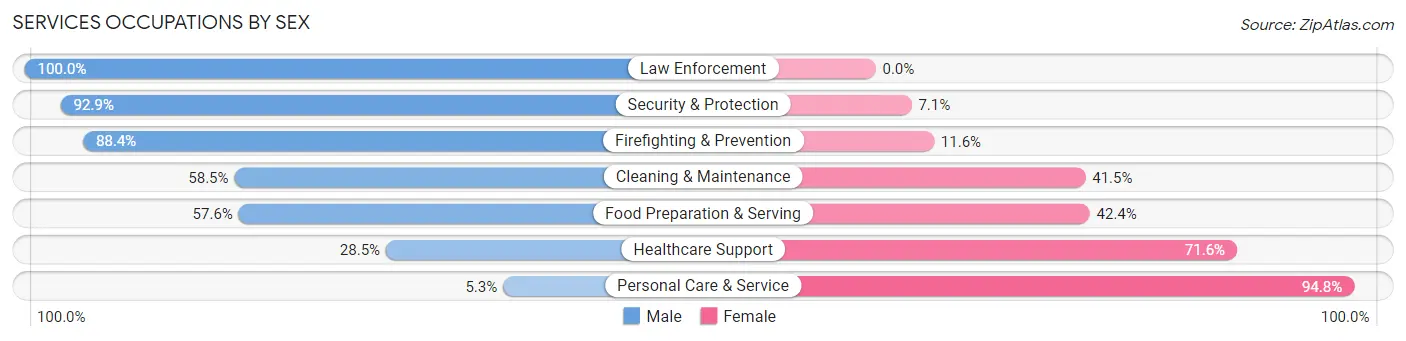
Services Occupations by Sex
Within the Services occupations in South Salt Lake, the most male-oriented occupations are Law Enforcement (100.0%), Security & Protection (92.9%), and Firefighting & Prevention (88.4%), while the most female-oriented occupations are Personal Care & Service (94.8%), Healthcare Support (71.6%), and Food Preparation & Serving (42.4%).
| Occupation | Male | Female |
| Healthcare Support | 103 (28.4%) | 259 (71.6%) |
| Security & Protection | 222 (92.9%) | 17 (7.1%) |
| Firefighting & Prevention | 130 (88.4%) | 17 (11.6%) |
| Law Enforcement | 92 (100.0%) | 0 (0.0%) |
| Food Preparation & Serving | 515 (57.6%) | 379 (42.4%) |
| Cleaning & Maintenance | 439 (58.5%) | 312 (41.5%) |
| Personal Care & Service | 22 (5.2%) | 397 (94.8%) |
| Total (Category) | 1,301 (48.8%) | 1,364 (51.2%) |
| Total (Overall) | 8,013 (53.4%) | 6,997 (46.6%) |
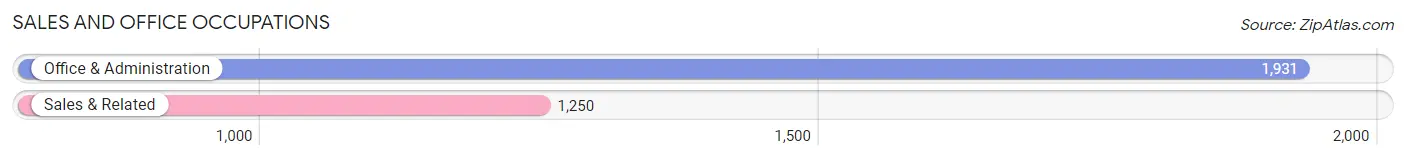
Sales and Office Occupations
The most common Sales and Office occupations in South Salt Lake are Office & Administration (1,931 | 12.9%), and Sales & Related (1,250 | 8.3%).
Sales and Office Occupations by Sex
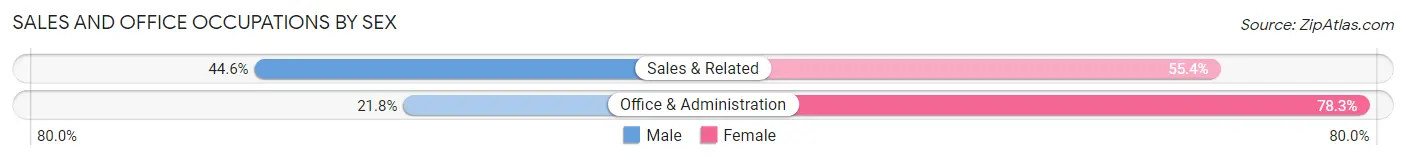
| Occupation | Male | Female |
| Sales & Related | 558 (44.6%) | 692 (55.4%) |
| Office & Administration | 420 (21.7%) | 1,511 (78.2%) |
| Total (Category) | 978 (30.7%) | 2,203 (69.3%) |
| Total (Overall) | 8,013 (53.4%) | 6,997 (46.6%) |
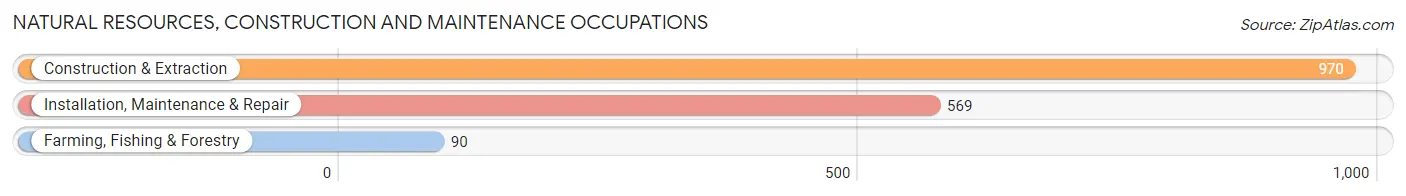
Natural Resources, Construction and Maintenance Occupations
The most common Natural Resources, Construction and Maintenance occupations in South Salt Lake are Construction & Extraction (970 | 6.5%), Installation, Maintenance & Repair (569 | 3.8%), and Farming, Fishing & Forestry (90 | 0.6%).
Natural Resources, Construction and Maintenance Occupations by Sex
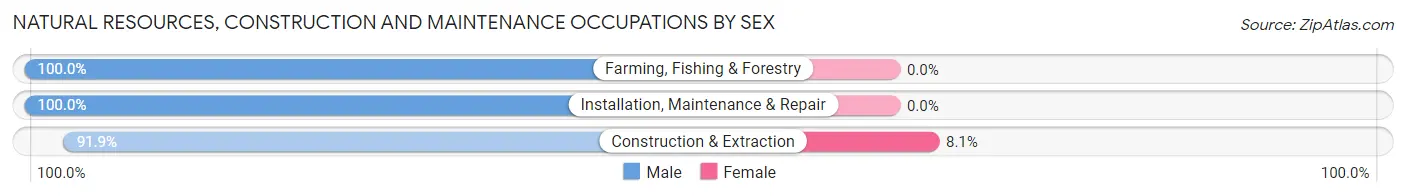
| Occupation | Male | Female |
| Farming, Fishing & Forestry | 90 (100.0%) | 0 (0.0%) |
| Construction & Extraction | 891 (91.9%) | 79 (8.1%) |
| Installation, Maintenance & Repair | 569 (100.0%) | 0 (0.0%) |
| Total (Category) | 1,550 (95.2%) | 79 (4.9%) |
| Total (Overall) | 8,013 (53.4%) | 6,997 (46.6%) |
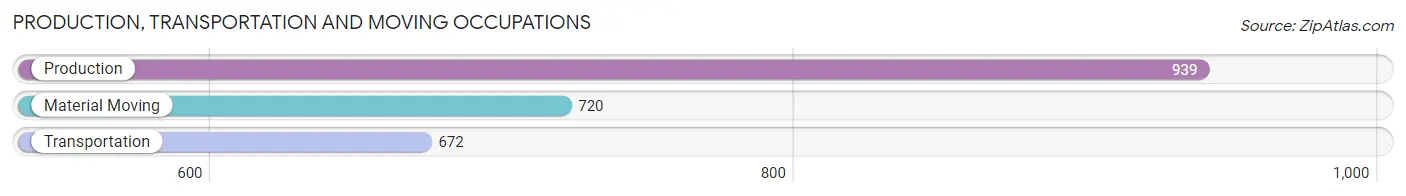
Production, Transportation and Moving Occupations
The most common Production, Transportation and Moving occupations in South Salt Lake are Production (939 | 6.3%), Material Moving (720 | 4.8%), and Transportation (672 | 4.5%).
Production, Transportation and Moving Occupations by Sex
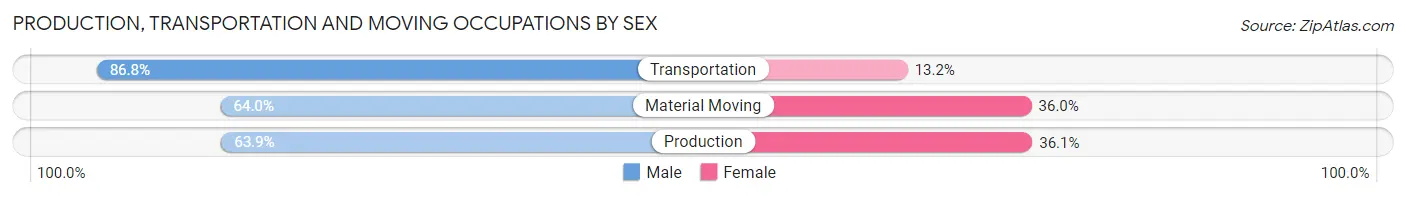
| Occupation | Male | Female |
| Production | 600 (63.9%) | 339 (36.1%) |
| Transportation | 583 (86.8%) | 89 (13.2%) |
| Material Moving | 461 (64.0%) | 259 (36.0%) |
| Total (Category) | 1,644 (70.5%) | 687 (29.5%) |
| Total (Overall) | 8,013 (53.4%) | 6,997 (46.6%) |
Employment Industries by Sex in South Salt Lake
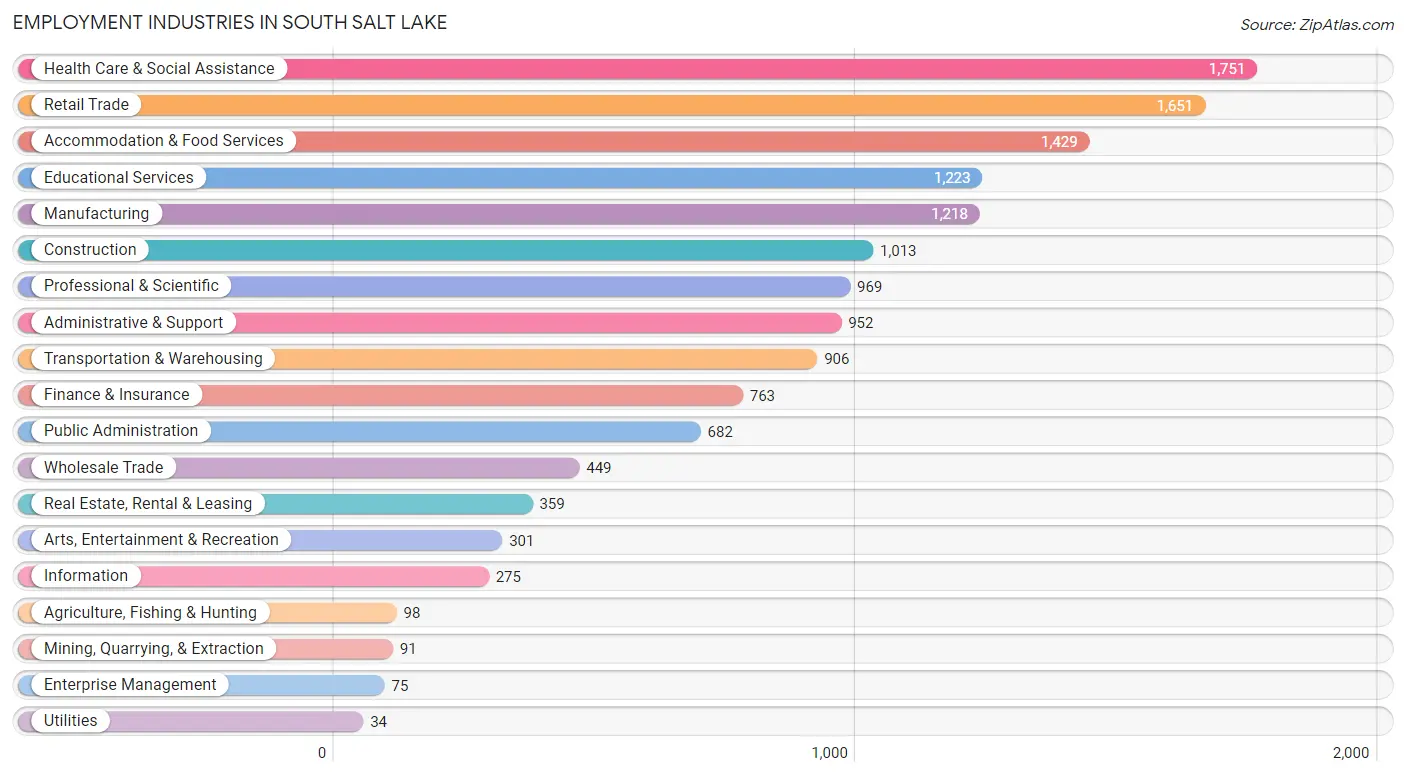
Employment Industries in South Salt Lake
The major employment industries in South Salt Lake include Health Care & Social Assistance (1,751 | 11.7%), Retail Trade (1,651 | 11.0%), Accommodation & Food Services (1,429 | 9.5%), Educational Services (1,223 | 8.2%), and Manufacturing (1,218 | 8.1%).
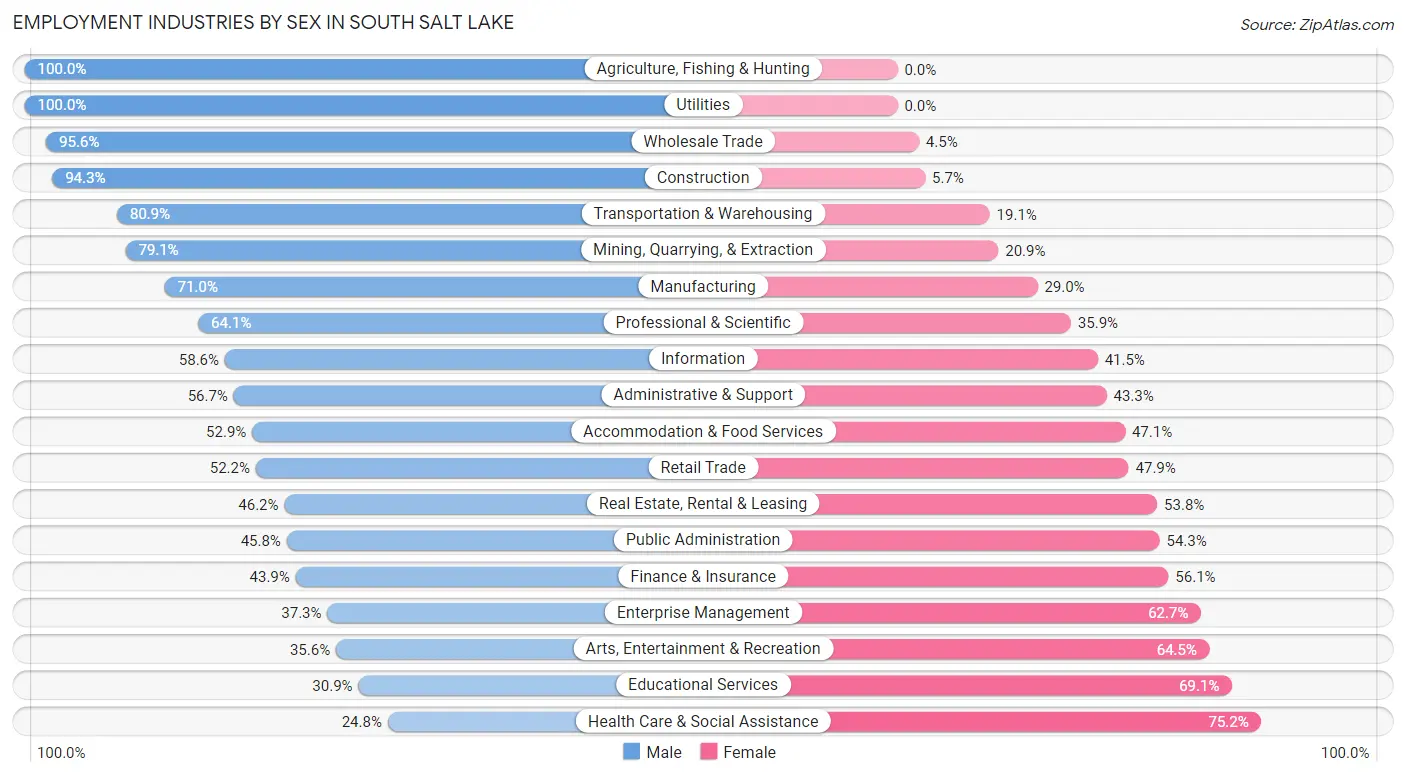
Employment Industries by Sex in South Salt Lake
The South Salt Lake industries that see more men than women are Agriculture, Fishing & Hunting (100.0%), Utilities (100.0%), and Wholesale Trade (95.6%), whereas the industries that tend to have a higher number of women are Health Care & Social Assistance (75.2%), Educational Services (69.1%), and Arts, Entertainment & Recreation (64.4%).
| Industry | Male | Female |
| Agriculture, Fishing & Hunting | 98 (100.0%) | 0 (0.0%) |
| Mining, Quarrying, & Extraction | 72 (79.1%) | 19 (20.9%) |
| Construction | 955 (94.3%) | 58 (5.7%) |
| Manufacturing | 865 (71.0%) | 353 (29.0%) |
| Wholesale Trade | 429 (95.6%) | 20 (4.4%) |
| Retail Trade | 861 (52.1%) | 790 (47.8%) |
| Transportation & Warehousing | 733 (80.9%) | 173 (19.1%) |
| Utilities | 34 (100.0%) | 0 (0.0%) |
| Information | 161 (58.6%) | 114 (41.4%) |
| Finance & Insurance | 335 (43.9%) | 428 (56.1%) |
| Real Estate, Rental & Leasing | 166 (46.2%) | 193 (53.8%) |
| Professional & Scientific | 621 (64.1%) | 348 (35.9%) |
| Enterprise Management | 28 (37.3%) | 47 (62.7%) |
| Administrative & Support | 540 (56.7%) | 412 (43.3%) |
| Educational Services | 378 (30.9%) | 845 (69.1%) |
| Health Care & Social Assistance | 435 (24.8%) | 1,316 (75.2%) |
| Arts, Entertainment & Recreation | 107 (35.5%) | 194 (64.4%) |
| Accommodation & Food Services | 756 (52.9%) | 673 (47.1%) |
| Public Administration | 312 (45.8%) | 370 (54.2%) |
| Total | 8,013 (53.4%) | 6,997 (46.6%) |
Education in South Salt Lake
School Enrollment in South Salt Lake
The most common levels of schooling among the 6,873 students in South Salt Lake are college / undergraduate (1,780 | 25.9%), high school (1,619 | 23.6%), and middle school (1,317 | 19.2%).
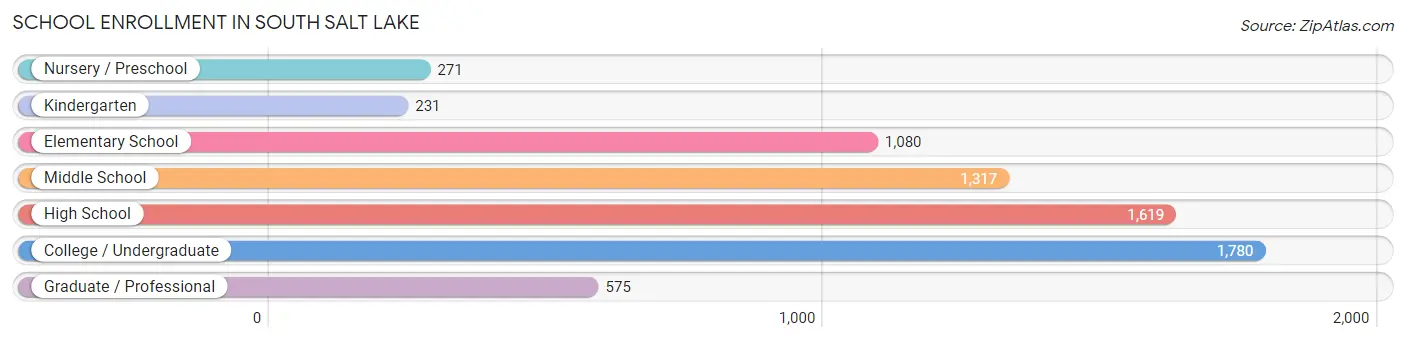
| School Level | # Students | % Students |
| Nursery / Preschool | 271 | 3.9% |
| Kindergarten | 231 | 3.4% |
| Elementary School | 1,080 | 15.7% |
| Middle School | 1,317 | 19.2% |
| High School | 1,619 | 23.6% |
| College / Undergraduate | 1,780 | 25.9% |
| Graduate / Professional | 575 | 8.4% |
| Total | 6,873 | 100.0% |
School Enrollment by Age by Funding Source in South Salt Lake
Out of a total of 6,873 students who are enrolled in schools in South Salt Lake, 632 (9.2%) attend a private institution, while the remaining 6,241 (90.8%) are enrolled in public schools. The age group of 3 to 4 year olds has the highest likelihood of being enrolled in private schools, with 134 (72.0% in the age bracket) enrolled. Conversely, the age group of 18 to 19 year olds has the lowest likelihood of being enrolled in a private school, with 700 (99.6% in the age bracket) attending a public institution.
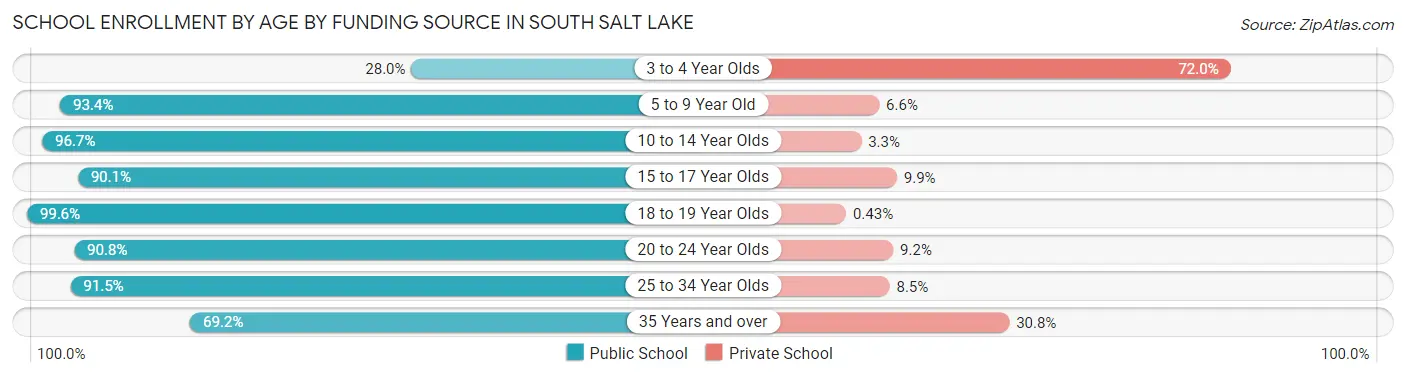
| Age Bracket | Public School | Private School |
| 3 to 4 Year Olds | 52 (28.0%) | 134 (72.0%) |
| 5 to 9 Year Old | 1,017 (93.4%) | 72 (6.6%) |
| 10 to 14 Year Olds | 1,813 (96.7%) | 61 (3.3%) |
| 15 to 17 Year Olds | 837 (90.1%) | 92 (9.9%) |
| 18 to 19 Year Olds | 700 (99.6%) | 3 (0.4%) |
| 20 to 24 Year Olds | 689 (90.8%) | 70 (9.2%) |
| 25 to 34 Year Olds | 878 (91.5%) | 82 (8.5%) |
| 35 Years and over | 258 (69.2%) | 115 (30.8%) |
| Total | 6,241 (90.8%) | 632 (9.2%) |
Educational Attainment by Field of Study in South Salt Lake
Business (965 | 18.1%), science & technology (752 | 14.1%), social sciences (463 | 8.7%), bio, nature & agricultural (442 | 8.3%), and communications (383 | 7.2%) are the most common fields of study among 5,334 individuals in South Salt Lake who have obtained a bachelor's degree or higher.
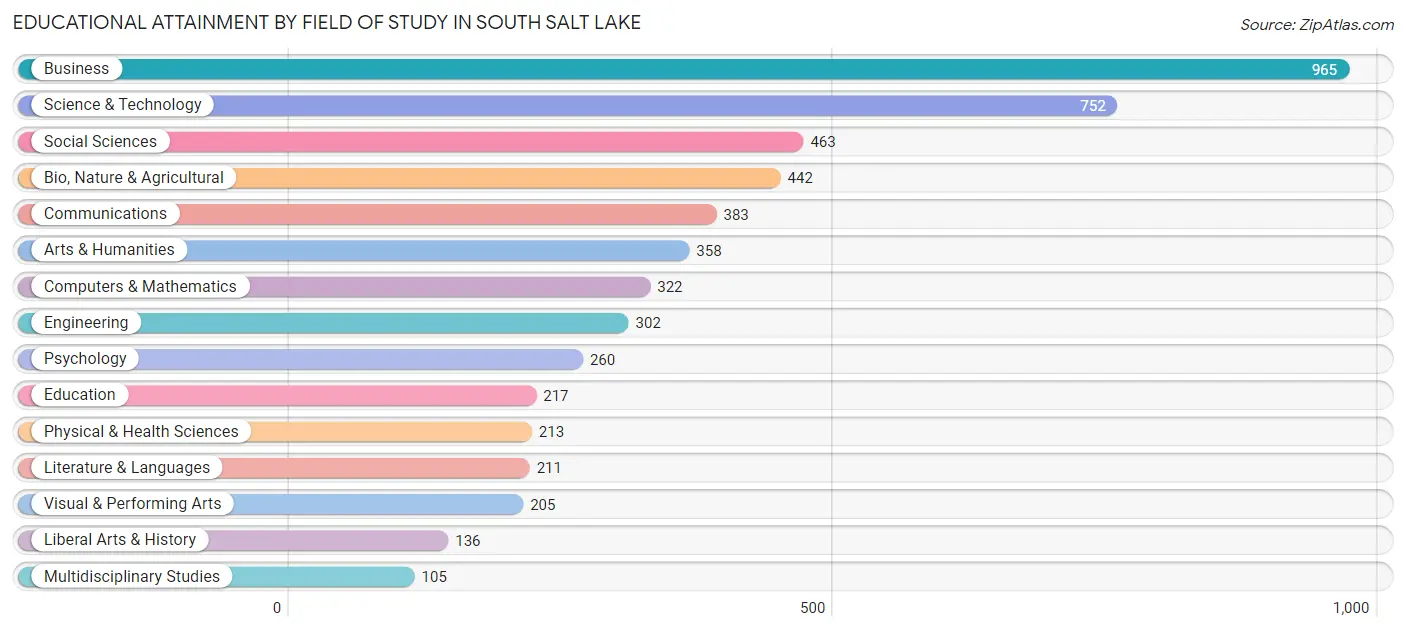
| Field of Study | # Graduates | % Graduates |
| Computers & Mathematics | 322 | 6.0% |
| Bio, Nature & Agricultural | 442 | 8.3% |
| Physical & Health Sciences | 213 | 4.0% |
| Psychology | 260 | 4.9% |
| Social Sciences | 463 | 8.7% |
| Engineering | 302 | 5.7% |
| Multidisciplinary Studies | 105 | 2.0% |
| Science & Technology | 752 | 14.1% |
| Business | 965 | 18.1% |
| Education | 217 | 4.1% |
| Literature & Languages | 211 | 4.0% |
| Liberal Arts & History | 136 | 2.5% |
| Visual & Performing Arts | 205 | 3.8% |
| Communications | 383 | 7.2% |
| Arts & Humanities | 358 | 6.7% |
| Total | 5,334 | 100.0% |
Transportation & Commute in South Salt Lake
Vehicle Availability by Sex in South Salt Lake
The most prevalent vehicle ownership categories in South Salt Lake are males with 2 vehicles (3,634, accounting for 46.0%) and females with 2 vehicles (2,955, making up 53.1%).
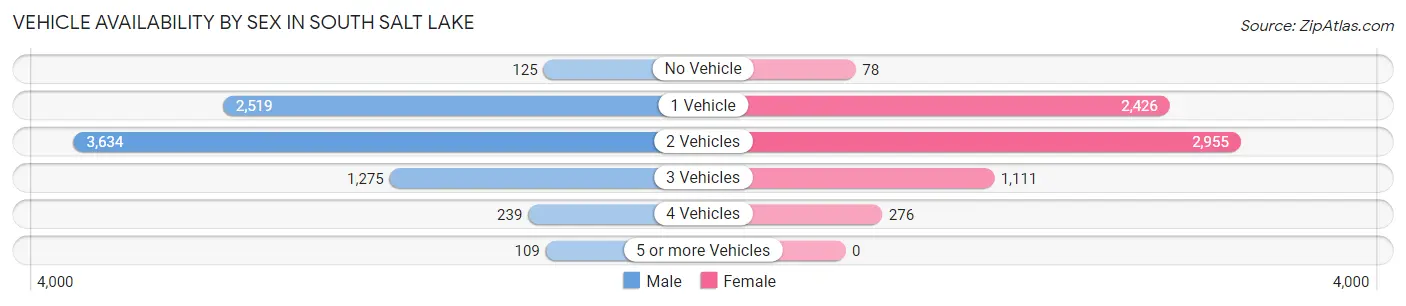
| Vehicles Available | Male | Female |
| No Vehicle | 125 (1.6%) | 78 (1.1%) |
| 1 Vehicle | 2,519 (31.9%) | 2,426 (35.4%) |
| 2 Vehicles | 3,634 (46.0%) | 2,955 (43.2%) |
| 3 Vehicles | 1,275 (16.1%) | 1,111 (16.2%) |
| 4 Vehicles | 239 (3.0%) | 276 (4.0%) |
| 5 or more Vehicles | 109 (1.4%) | 0 (0.0%) |
| Total | 7,901 (100.0%) | 6,846 (100.0%) |
Commute Time in South Salt Lake
The most frequently occuring commute durations in South Salt Lake are 15 to 19 minutes (2,666 commuters, 19.9%), 20 to 24 minutes (2,557 commuters, 19.1%), and 10 to 14 minutes (2,393 commuters, 17.9%).
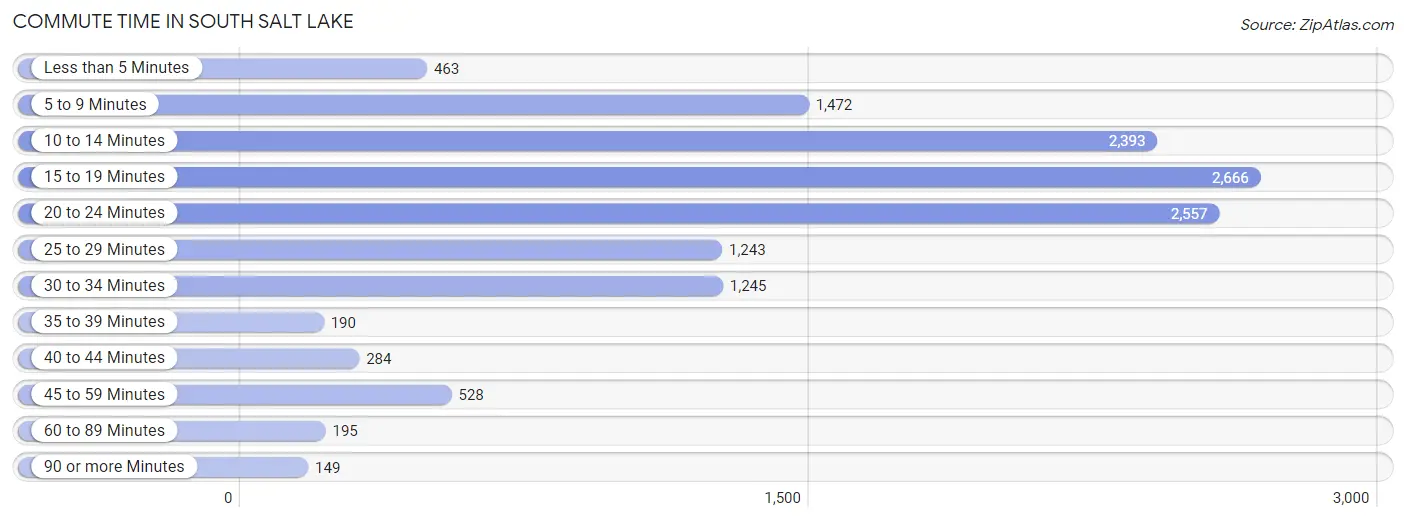
| Commute Time | # Commuters | % Commuters |
| Less than 5 Minutes | 463 | 3.5% |
| 5 to 9 Minutes | 1,472 | 11.0% |
| 10 to 14 Minutes | 2,393 | 17.9% |
| 15 to 19 Minutes | 2,666 | 19.9% |
| 20 to 24 Minutes | 2,557 | 19.1% |
| 25 to 29 Minutes | 1,243 | 9.3% |
| 30 to 34 Minutes | 1,245 | 9.3% |
| 35 to 39 Minutes | 190 | 1.4% |
| 40 to 44 Minutes | 284 | 2.1% |
| 45 to 59 Minutes | 528 | 3.9% |
| 60 to 89 Minutes | 195 | 1.5% |
| 90 or more Minutes | 149 | 1.1% |
Commute Time by Sex in South Salt Lake
The most common commute times in South Salt Lake are 20 to 24 minutes (1,614 commuters, 21.9%) for males and 15 to 19 minutes (1,337 commuters, 22.2%) for females.
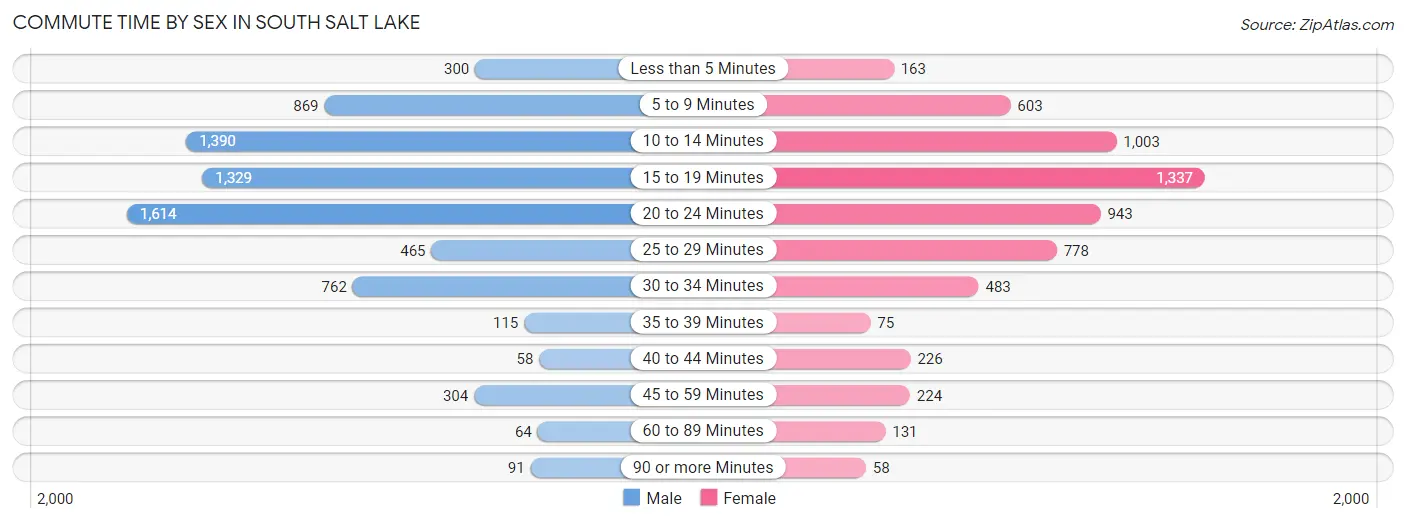
| Commute Time | Male | Female |
| Less than 5 Minutes | 300 (4.1%) | 163 (2.7%) |
| 5 to 9 Minutes | 869 (11.8%) | 603 (10.0%) |
| 10 to 14 Minutes | 1,390 (18.9%) | 1,003 (16.7%) |
| 15 to 19 Minutes | 1,329 (18.0%) | 1,337 (22.2%) |
| 20 to 24 Minutes | 1,614 (21.9%) | 943 (15.7%) |
| 25 to 29 Minutes | 465 (6.3%) | 778 (12.9%) |
| 30 to 34 Minutes | 762 (10.3%) | 483 (8.0%) |
| 35 to 39 Minutes | 115 (1.6%) | 75 (1.3%) |
| 40 to 44 Minutes | 58 (0.8%) | 226 (3.7%) |
| 45 to 59 Minutes | 304 (4.1%) | 224 (3.7%) |
| 60 to 89 Minutes | 64 (0.9%) | 131 (2.2%) |
| 90 or more Minutes | 91 (1.2%) | 58 (1.0%) |
Time of Departure to Work by Sex in South Salt Lake
The most frequent times of departure to work in South Salt Lake are 7:00 AM to 7:29 AM (837, 11.4%) for males and 8:00 AM to 8:29 AM (752, 12.5%) for females.
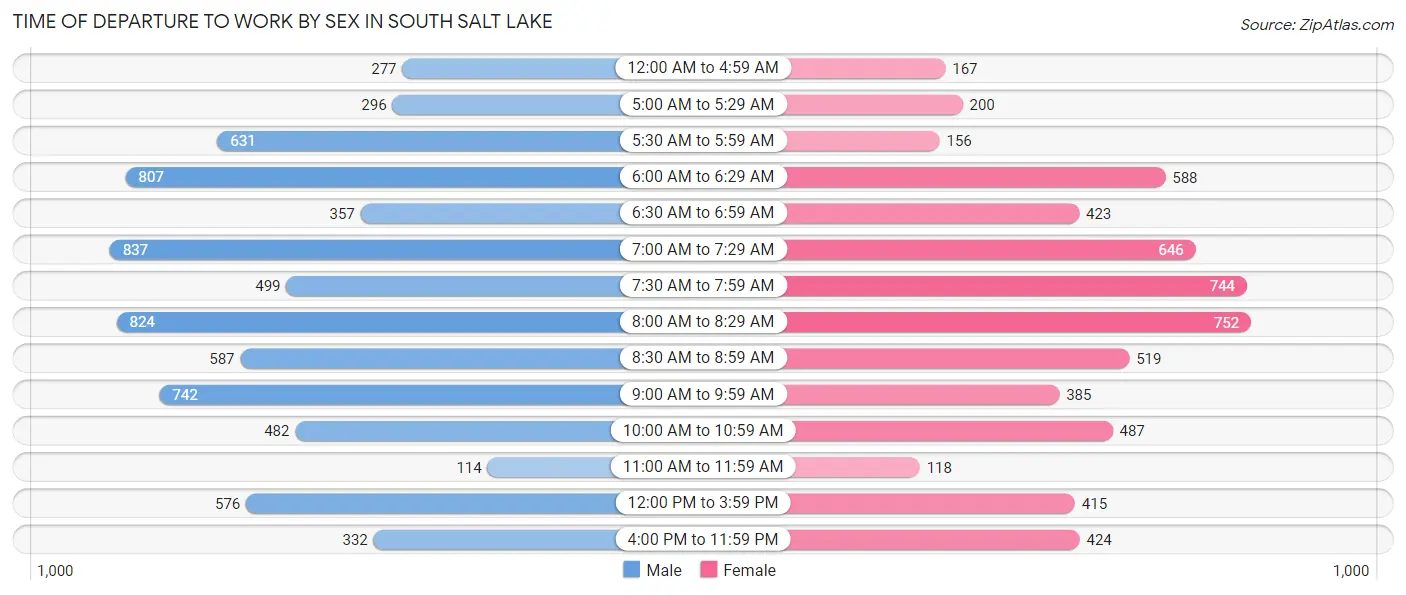
| Time of Departure | Male | Female |
| 12:00 AM to 4:59 AM | 277 (3.8%) | 167 (2.8%) |
| 5:00 AM to 5:29 AM | 296 (4.0%) | 200 (3.3%) |
| 5:30 AM to 5:59 AM | 631 (8.6%) | 156 (2.6%) |
| 6:00 AM to 6:29 AM | 807 (11.0%) | 588 (9.8%) |
| 6:30 AM to 6:59 AM | 357 (4.9%) | 423 (7.0%) |
| 7:00 AM to 7:29 AM | 837 (11.4%) | 646 (10.7%) |
| 7:30 AM to 7:59 AM | 499 (6.8%) | 744 (12.3%) |
| 8:00 AM to 8:29 AM | 824 (11.2%) | 752 (12.5%) |
| 8:30 AM to 8:59 AM | 587 (8.0%) | 519 (8.6%) |
| 9:00 AM to 9:59 AM | 742 (10.1%) | 385 (6.4%) |
| 10:00 AM to 10:59 AM | 482 (6.6%) | 487 (8.1%) |
| 11:00 AM to 11:59 AM | 114 (1.5%) | 118 (2.0%) |
| 12:00 PM to 3:59 PM | 576 (7.8%) | 415 (6.9%) |
| 4:00 PM to 11:59 PM | 332 (4.5%) | 424 (7.0%) |
| Total | 7,361 (100.0%) | 6,024 (100.0%) |
Housing Occupancy in South Salt Lake
Occupancy by Ownership in South Salt Lake
Of the total 10,600 dwellings in South Salt Lake, owner-occupied units account for 4,161 (39.3%), while renter-occupied units make up 6,439 (60.8%).
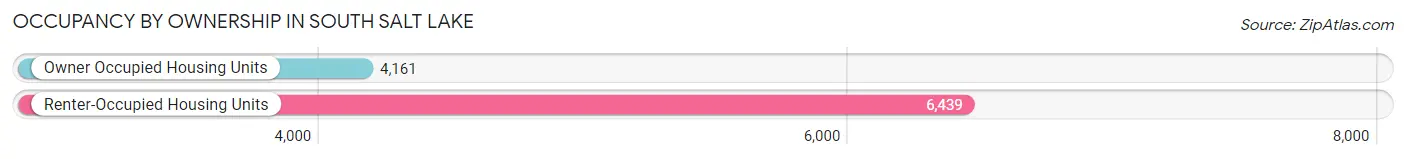
| Occupancy | # Housing Units | % Housing Units |
| Owner Occupied Housing Units | 4,161 | 39.3% |
| Renter-Occupied Housing Units | 6,439 | 60.8% |
| Total Occupied Housing Units | 10,600 | 100.0% |
Occupancy by Household Size in South Salt Lake
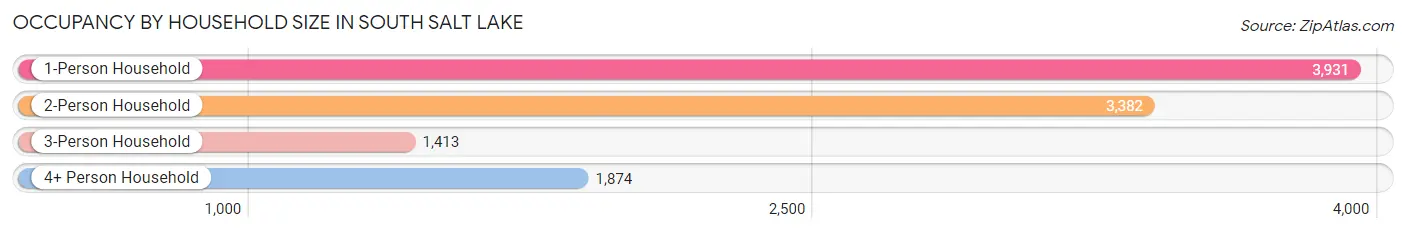
| Household Size | # Housing Units | % Housing Units |
| 1-Person Household | 3,931 | 37.1% |
| 2-Person Household | 3,382 | 31.9% |
| 3-Person Household | 1,413 | 13.3% |
| 4+ Person Household | 1,874 | 17.7% |
| Total Housing Units | 10,600 | 100.0% |
Occupancy by Ownership by Household Size in South Salt Lake
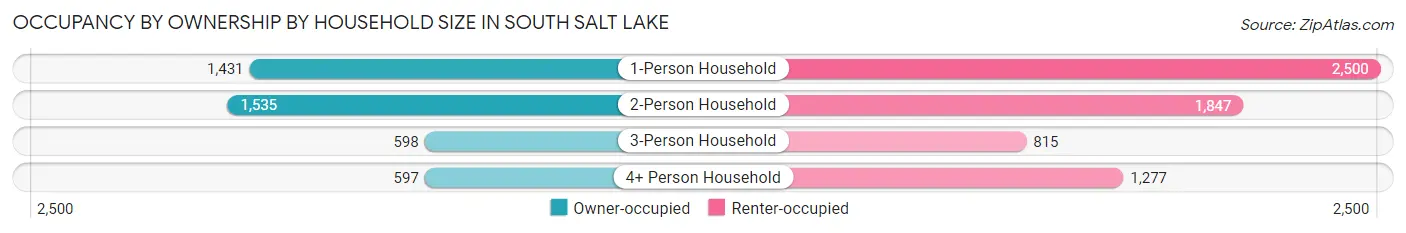
| Household Size | Owner-occupied | Renter-occupied |
| 1-Person Household | 1,431 (36.4%) | 2,500 (63.6%) |
| 2-Person Household | 1,535 (45.4%) | 1,847 (54.6%) |
| 3-Person Household | 598 (42.3%) | 815 (57.7%) |
| 4+ Person Household | 597 (31.9%) | 1,277 (68.1%) |
| Total Housing Units | 4,161 (39.3%) | 6,439 (60.8%) |
Occupancy by Educational Attainment in South Salt Lake
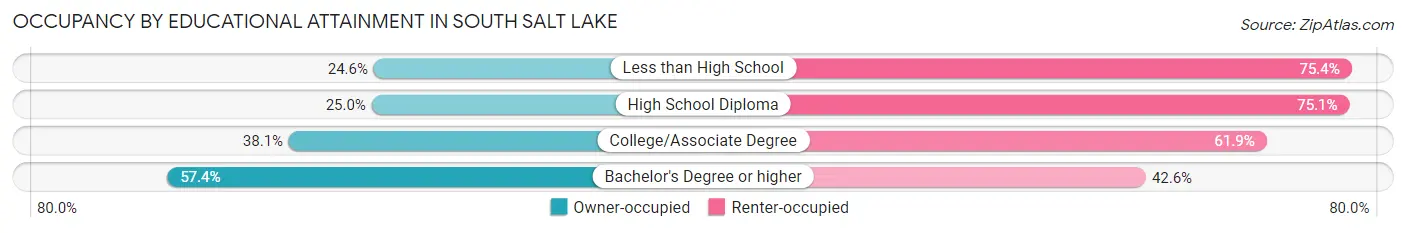
| Household Size | Owner-occupied | Renter-occupied |
| Less than High School | 271 (24.6%) | 830 (75.4%) |
| High School Diploma | 668 (24.9%) | 2,009 (75.0%) |
| College/Associate Degree | 1,366 (38.1%) | 2,221 (61.9%) |
| Bachelor's Degree or higher | 1,856 (57.4%) | 1,379 (42.6%) |
Occupancy by Age of Householder in South Salt Lake
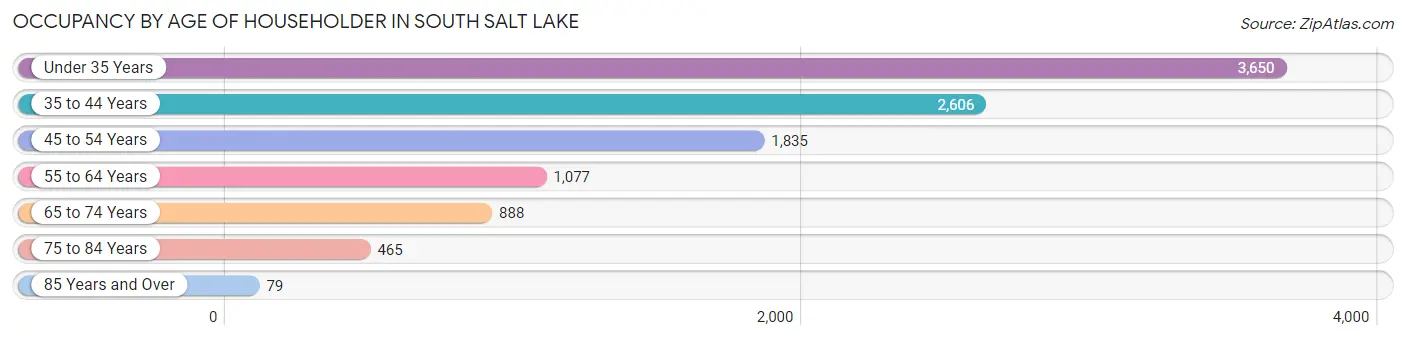
| Age Bracket | # Households | % Households |
| Under 35 Years | 3,650 | 34.4% |
| 35 to 44 Years | 2,606 | 24.6% |
| 45 to 54 Years | 1,835 | 17.3% |
| 55 to 64 Years | 1,077 | 10.2% |
| 65 to 74 Years | 888 | 8.4% |
| 75 to 84 Years | 465 | 4.4% |
| 85 Years and Over | 79 | 0.7% |
| Total | 10,600 | 100.0% |
Housing Finances in South Salt Lake
Median Income by Occupancy in South Salt Lake
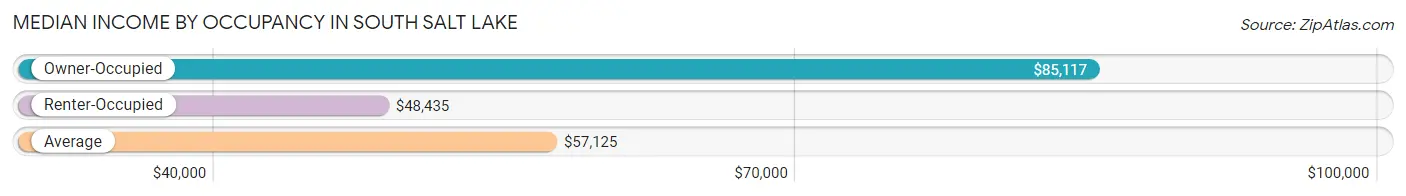
| Occupancy Type | # Households | Median Income |
| Owner-Occupied | 4,161 (39.3%) | $85,117 |
| Renter-Occupied | 6,439 (60.8%) | $48,435 |
| Average | 10,600 (100.0%) | $57,125 |
Occupancy by Householder Income Bracket in South Salt Lake
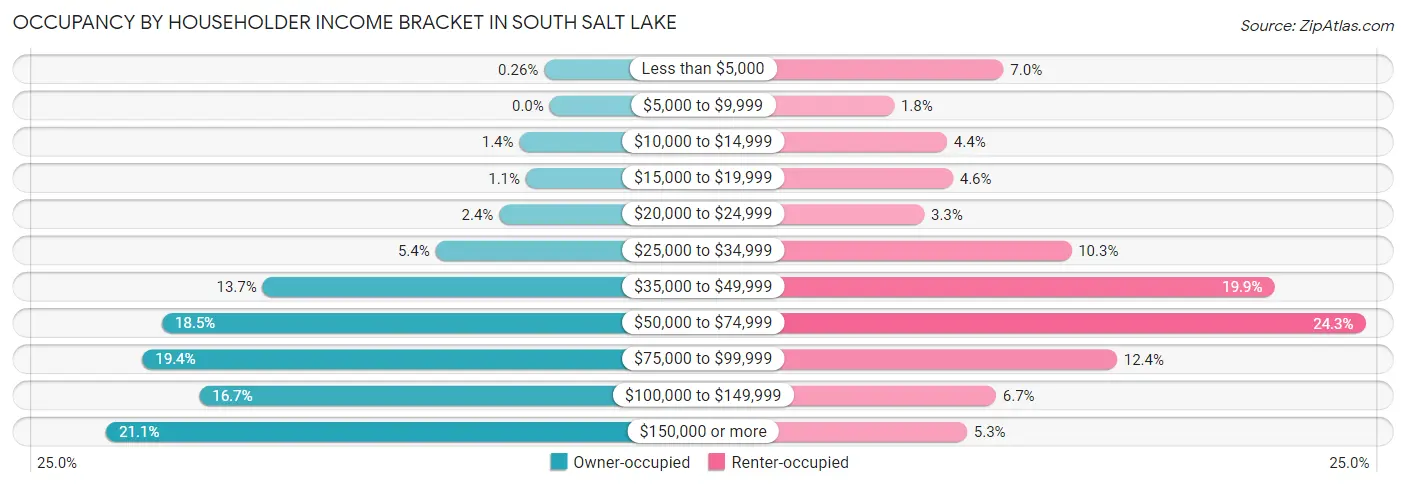
| Income Bracket | Owner-occupied | Renter-occupied |
| Less than $5,000 | 11 (0.3%) | 453 (7.0%) |
| $5,000 to $9,999 | 0 (0.0%) | 118 (1.8%) |
| $10,000 to $14,999 | 60 (1.4%) | 280 (4.3%) |
| $15,000 to $19,999 | 47 (1.1%) | 298 (4.6%) |
| $20,000 to $24,999 | 100 (2.4%) | 210 (3.3%) |
| $25,000 to $34,999 | 226 (5.4%) | 661 (10.3%) |
| $35,000 to $49,999 | 569 (13.7%) | 1,284 (19.9%) |
| $50,000 to $74,999 | 768 (18.5%) | 1,563 (24.3%) |
| $75,000 to $99,999 | 807 (19.4%) | 801 (12.4%) |
| $100,000 to $149,999 | 694 (16.7%) | 430 (6.7%) |
| $150,000 or more | 879 (21.1%) | 341 (5.3%) |
| Total | 4,161 (100.0%) | 6,439 (100.0%) |
Monthly Housing Cost Tiers in South Salt Lake
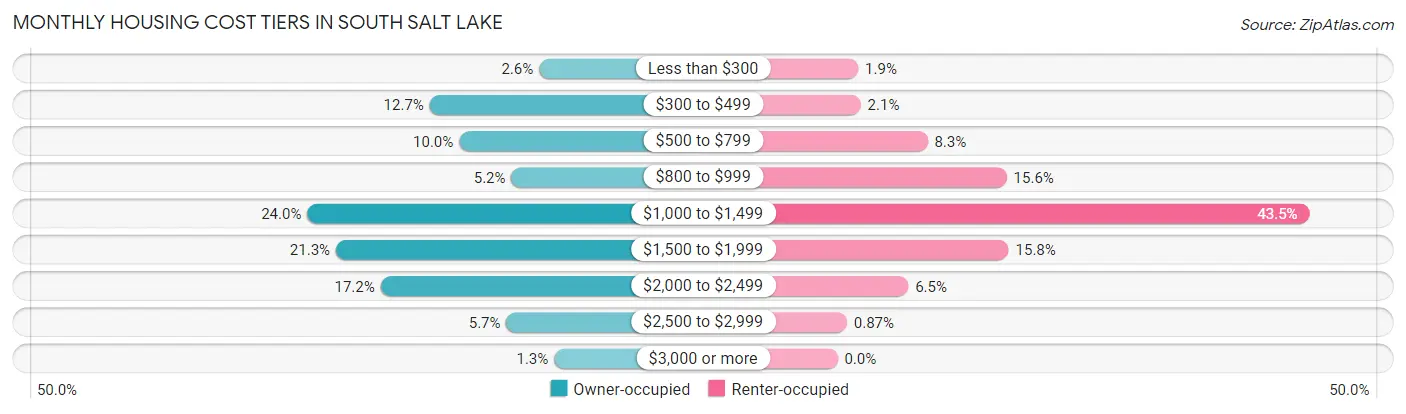
| Monthly Cost | Owner-occupied | Renter-occupied |
| Less than $300 | 110 (2.6%) | 123 (1.9%) |
| $300 to $499 | 529 (12.7%) | 138 (2.1%) |
| $500 to $799 | 416 (10.0%) | 534 (8.3%) |
| $800 to $999 | 216 (5.2%) | 1,003 (15.6%) |
| $1,000 to $1,499 | 998 (24.0%) | 2,798 (43.4%) |
| $1,500 to $1,999 | 888 (21.3%) | 1,015 (15.8%) |
| $2,000 to $2,499 | 717 (17.2%) | 420 (6.5%) |
| $2,500 to $2,999 | 235 (5.7%) | 56 (0.9%) |
| $3,000 or more | 52 (1.3%) | 0 (0.0%) |
| Total | 4,161 (100.0%) | 6,439 (100.0%) |
Physical Housing Characteristics in South Salt Lake
Housing Structures in South Salt Lake
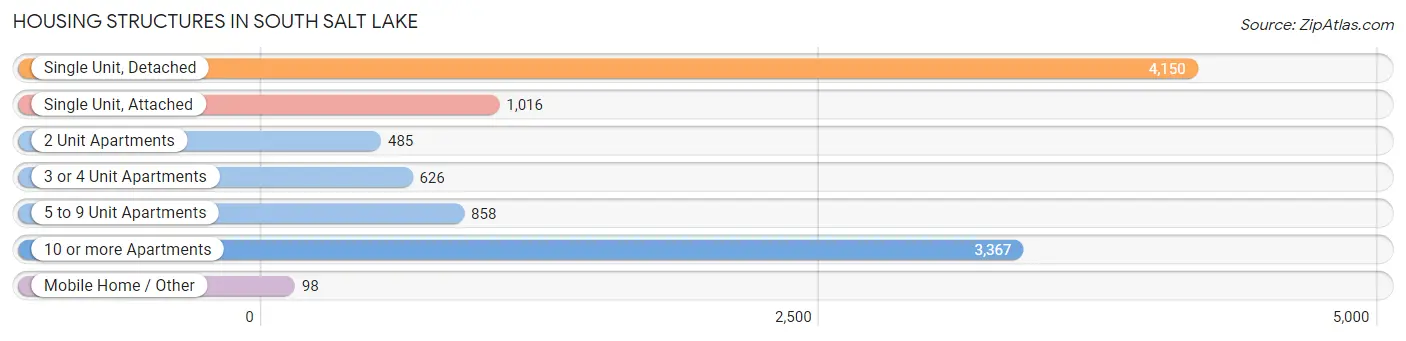
| Structure Type | # Housing Units | % Housing Units |
| Single Unit, Detached | 4,150 | 39.2% |
| Single Unit, Attached | 1,016 | 9.6% |
| 2 Unit Apartments | 485 | 4.6% |
| 3 or 4 Unit Apartments | 626 | 5.9% |
| 5 to 9 Unit Apartments | 858 | 8.1% |
| 10 or more Apartments | 3,367 | 31.8% |
| Mobile Home / Other | 98 | 0.9% |
| Total | 10,600 | 100.0% |
Housing Structures by Occupancy in South Salt Lake
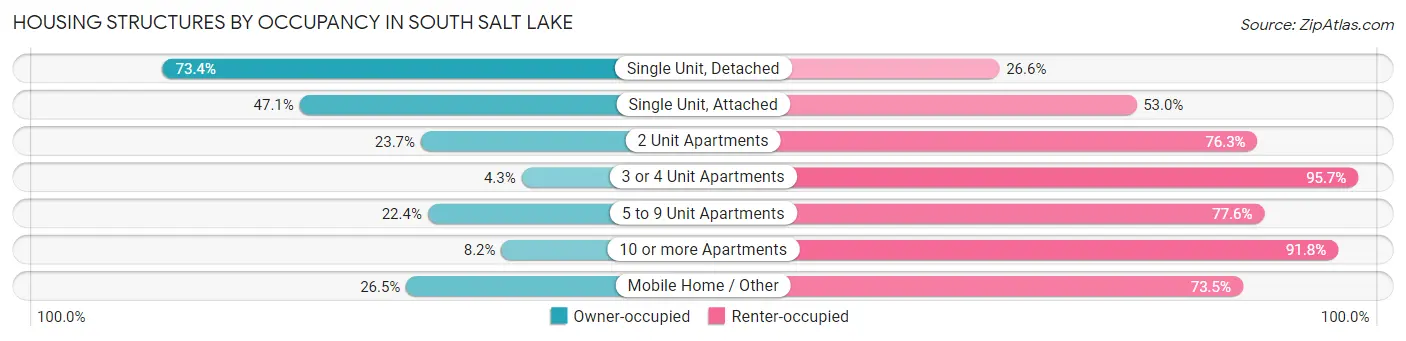
| Structure Type | Owner-occupied | Renter-occupied |
| Single Unit, Detached | 3,047 (73.4%) | 1,103 (26.6%) |
| Single Unit, Attached | 478 (47.0%) | 538 (52.9%) |
| 2 Unit Apartments | 115 (23.7%) | 370 (76.3%) |
| 3 or 4 Unit Apartments | 27 (4.3%) | 599 (95.7%) |
| 5 to 9 Unit Apartments | 192 (22.4%) | 666 (77.6%) |
| 10 or more Apartments | 276 (8.2%) | 3,091 (91.8%) |
| Mobile Home / Other | 26 (26.5%) | 72 (73.5%) |
| Total | 4,161 (39.3%) | 6,439 (60.8%) |
Housing Structures by Number of Rooms in South Salt Lake
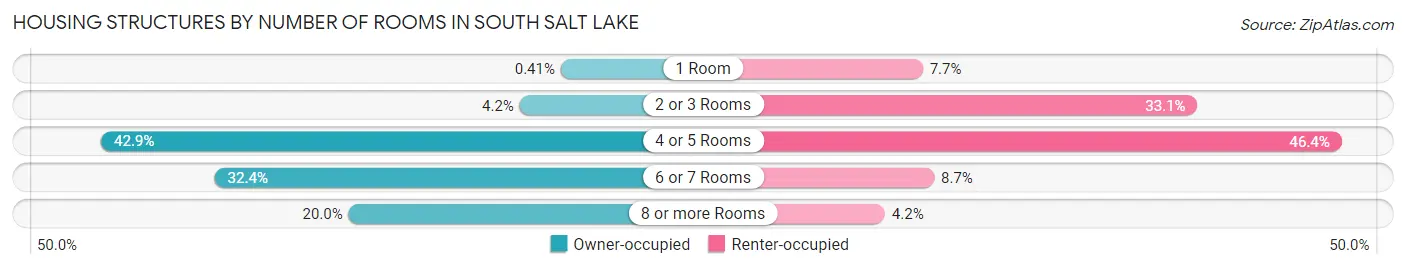
| Number of Rooms | Owner-occupied | Renter-occupied |
| 1 Room | 17 (0.4%) | 493 (7.7%) |
| 2 or 3 Rooms | 175 (4.2%) | 2,129 (33.1%) |
| 4 or 5 Rooms | 1,786 (42.9%) | 2,988 (46.4%) |
| 6 or 7 Rooms | 1,349 (32.4%) | 561 (8.7%) |
| 8 or more Rooms | 834 (20.0%) | 268 (4.2%) |
| Total | 4,161 (100.0%) | 6,439 (100.0%) |
Housing Structure by Heating Type in South Salt Lake
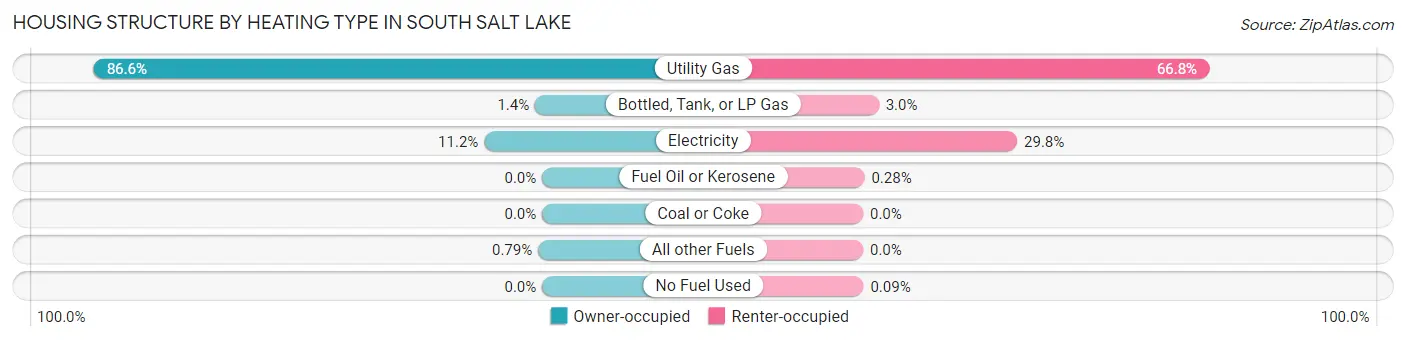
| Heating Type | Owner-occupied | Renter-occupied |
| Utility Gas | 3,605 (86.6%) | 4,303 (66.8%) |
| Bottled, Tank, or LP Gas | 57 (1.4%) | 195 (3.0%) |
| Electricity | 466 (11.2%) | 1,917 (29.8%) |
| Fuel Oil or Kerosene | 0 (0.0%) | 18 (0.3%) |
| Coal or Coke | 0 (0.0%) | 0 (0.0%) |
| All other Fuels | 33 (0.8%) | 0 (0.0%) |
| No Fuel Used | 0 (0.0%) | 6 (0.1%) |
| Total | 4,161 (100.0%) | 6,439 (100.0%) |
Household Vehicle Usage in South Salt Lake
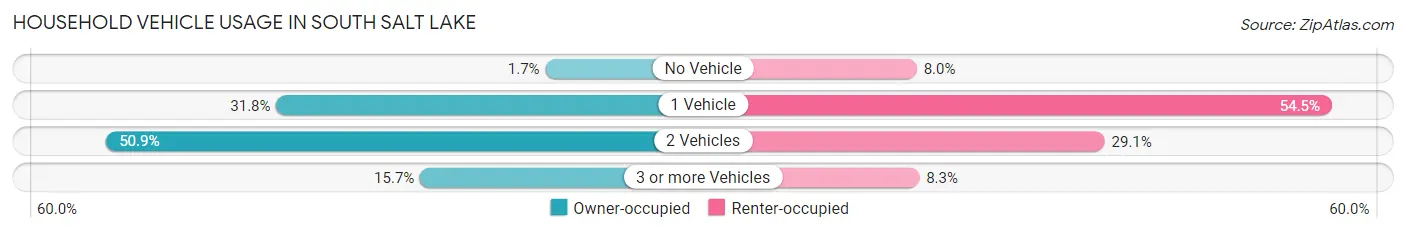
| Vehicles per Household | Owner-occupied | Renter-occupied |
| No Vehicle | 69 (1.7%) | 518 (8.0%) |
| 1 Vehicle | 1,323 (31.8%) | 3,512 (54.5%) |
| 2 Vehicles | 2,116 (50.8%) | 1,873 (29.1%) |
| 3 or more Vehicles | 653 (15.7%) | 536 (8.3%) |
| Total | 4,161 (100.0%) | 6,439 (100.0%) |
Real Estate & Mortgages in South Salt Lake
Real Estate and Mortgage Overview in South Salt Lake
| Characteristic | Without Mortgage | With Mortgage |
| Housing Units | 971 | 3,190 |
| Median Property Value | $350,000 | $354,300 |
| Median Household Income | $68,839 | $759 |
| Monthly Housing Costs | $447 | $52 |
| Real Estate Taxes | $2,052 | $65 |
Property Value by Mortgage Status in South Salt Lake
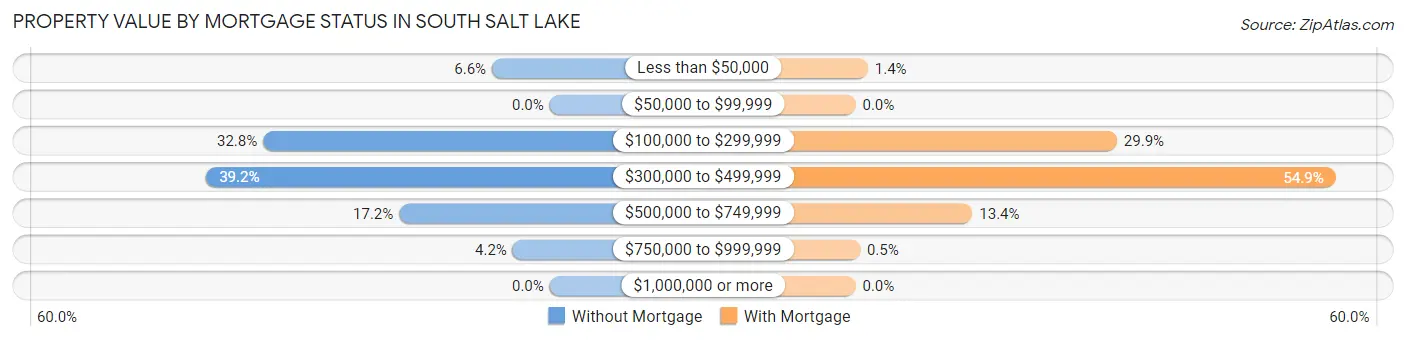
| Property Value | Without Mortgage | With Mortgage |
| Less than $50,000 | 64 (6.6%) | 45 (1.4%) |
| $50,000 to $99,999 | 0 (0.0%) | 0 (0.0%) |
| $100,000 to $299,999 | 318 (32.8%) | 953 (29.9%) |
| $300,000 to $499,999 | 381 (39.2%) | 1,750 (54.9%) |
| $500,000 to $749,999 | 167 (17.2%) | 426 (13.4%) |
| $750,000 to $999,999 | 41 (4.2%) | 16 (0.5%) |
| $1,000,000 or more | 0 (0.0%) | 0 (0.0%) |
| Total | 971 (100.0%) | 3,190 (100.0%) |
Household Income by Mortgage Status in South Salt Lake
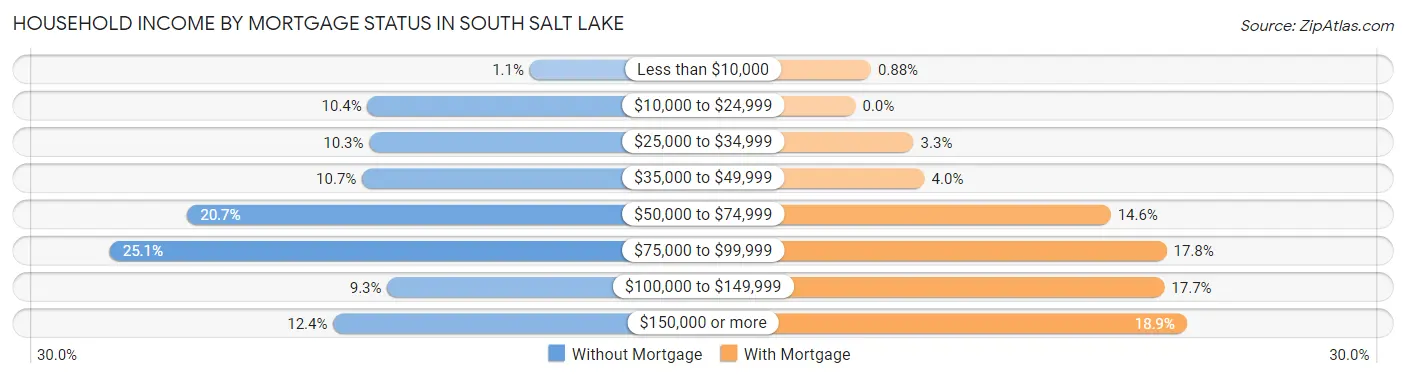
| Household Income | Without Mortgage | With Mortgage |
| Less than $10,000 | 11 (1.1%) | 28 (0.9%) |
| $10,000 to $24,999 | 101 (10.4%) | 0 (0.0%) |
| $25,000 to $34,999 | 100 (10.3%) | 106 (3.3%) |
| $35,000 to $49,999 | 104 (10.7%) | 126 (4.0%) |
| $50,000 to $74,999 | 201 (20.7%) | 465 (14.6%) |
| $75,000 to $99,999 | 244 (25.1%) | 567 (17.8%) |
| $100,000 to $149,999 | 90 (9.3%) | 563 (17.6%) |
| $150,000 or more | 120 (12.4%) | 604 (18.9%) |
| Total | 971 (100.0%) | 3,190 (100.0%) |
Property Value to Household Income Ratio in South Salt Lake
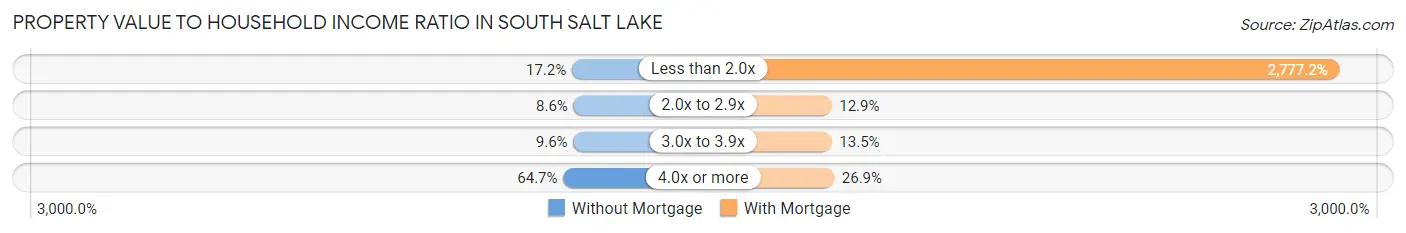
| Value-to-Income Ratio | Without Mortgage | With Mortgage |
| Less than 2.0x | 167 (17.2%) | 88,591 (2,777.1%) |
| 2.0x to 2.9x | 83 (8.6%) | 412 (12.9%) |
| 3.0x to 3.9x | 93 (9.6%) | 432 (13.5%) |
| 4.0x or more | 628 (64.7%) | 859 (26.9%) |
| Total | 971 (100.0%) | 3,190 (100.0%) |
Real Estate Taxes by Mortgage Status in South Salt Lake
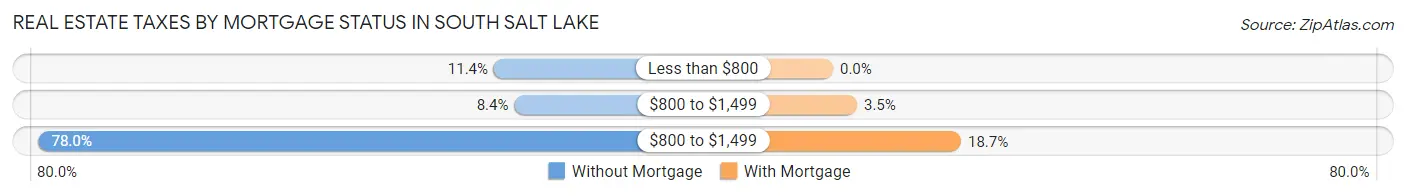
| Property Taxes | Without Mortgage | With Mortgage |
| Less than $800 | 111 (11.4%) | 0 (0.0%) |
| $800 to $1,499 | 82 (8.4%) | 112 (3.5%) |
| $800 to $1,499 | 757 (78.0%) | 597 (18.7%) |
| Total | 971 (100.0%) | 3,190 (100.0%) |
Health & Disability in South Salt Lake
Health Insurance Coverage by Age in South Salt Lake
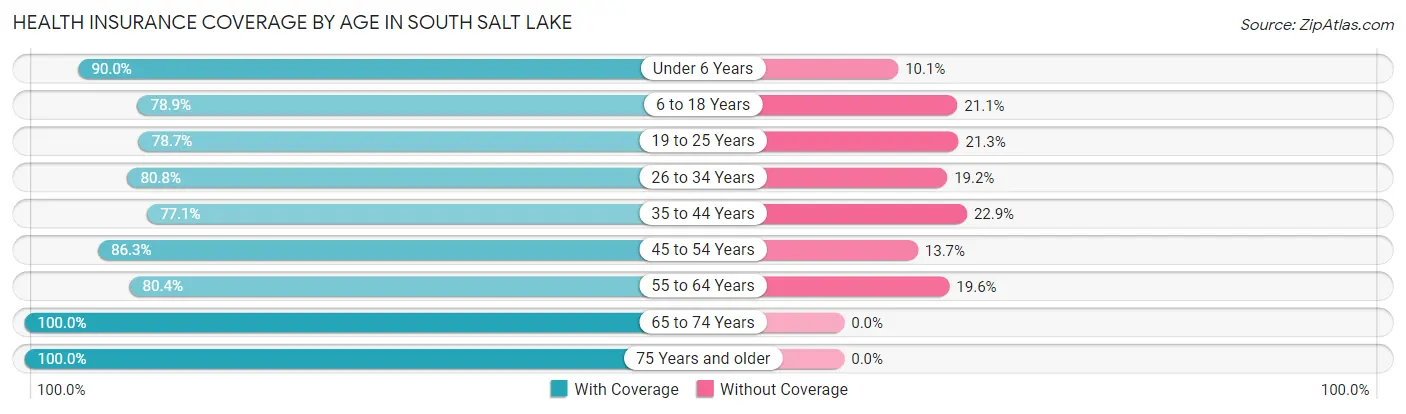
| Age Bracket | With Coverage | Without Coverage |
| Under 6 Years | 1,378 (89.9%) | 154 (10.1%) |
| 6 to 18 Years | 3,348 (78.9%) | 895 (21.1%) |
| 19 to 25 Years | 2,875 (78.7%) | 779 (21.3%) |
| 26 to 34 Years | 3,777 (80.8%) | 897 (19.2%) |
| 35 to 44 Years | 3,339 (77.1%) | 990 (22.9%) |
| 45 to 54 Years | 2,421 (86.3%) | 385 (13.7%) |
| 55 to 64 Years | 1,534 (80.4%) | 374 (19.6%) |
| 65 to 74 Years | 1,198 (100.0%) | 0 (0.0%) |
| 75 Years and older | 704 (100.0%) | 0 (0.0%) |
| Total | 20,574 (82.1%) | 4,474 (17.9%) |
Health Insurance Coverage by Citizenship Status in South Salt Lake
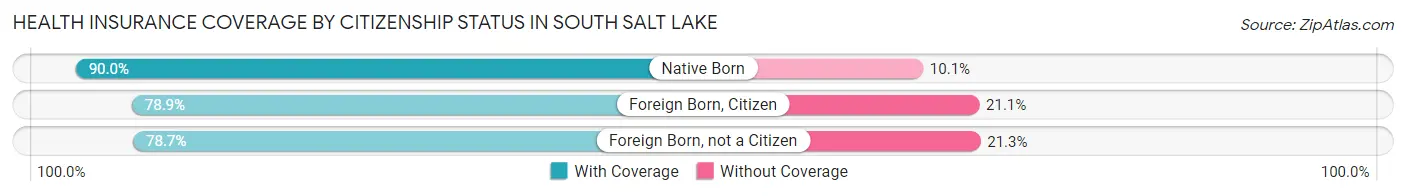
| Citizenship Status | With Coverage | Without Coverage |
| Native Born | 1,378 (89.9%) | 154 (10.1%) |
| Foreign Born, Citizen | 3,348 (78.9%) | 895 (21.1%) |
| Foreign Born, not a Citizen | 2,875 (78.7%) | 779 (21.3%) |
Health Insurance Coverage by Household Income in South Salt Lake
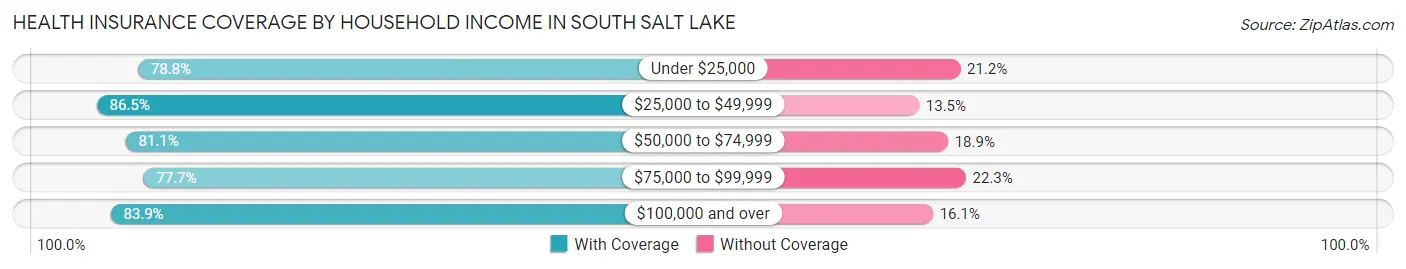
| Household Income | With Coverage | Without Coverage |
| Under $25,000 | 2,274 (78.8%) | 612 (21.2%) |
| $25,000 to $49,999 | 4,473 (86.5%) | 698 (13.5%) |
| $50,000 to $74,999 | 4,499 (81.1%) | 1,049 (18.9%) |
| $75,000 to $99,999 | 3,576 (77.7%) | 1,024 (22.3%) |
| $100,000 and over | 5,688 (83.9%) | 1,091 (16.1%) |
Public vs Private Health Insurance Coverage by Age in South Salt Lake
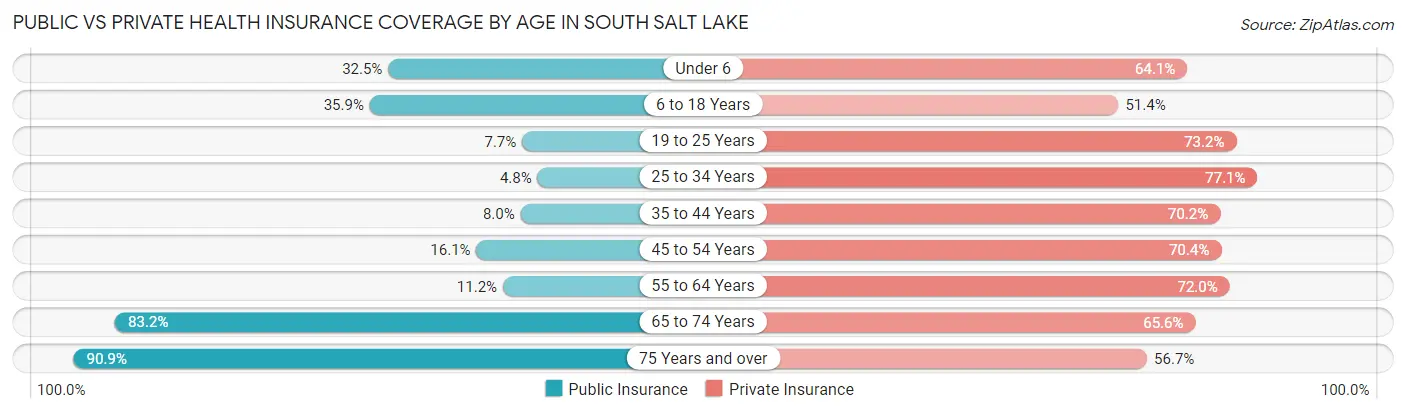
| Age Bracket | Public Insurance | Private Insurance |
| Under 6 | 498 (32.5%) | 982 (64.1%) |
| 6 to 18 Years | 1,525 (35.9%) | 2,179 (51.4%) |
| 19 to 25 Years | 280 (7.7%) | 2,675 (73.2%) |
| 25 to 34 Years | 224 (4.8%) | 3,605 (77.1%) |
| 35 to 44 Years | 344 (8.0%) | 3,039 (70.2%) |
| 45 to 54 Years | 453 (16.1%) | 1,976 (70.4%) |
| 55 to 64 Years | 214 (11.2%) | 1,373 (72.0%) |
| 65 to 74 Years | 997 (83.2%) | 786 (65.6%) |
| 75 Years and over | 640 (90.9%) | 399 (56.7%) |
| Total | 5,175 (20.7%) | 17,014 (67.9%) |
Disability Status by Sex by Age in South Salt Lake
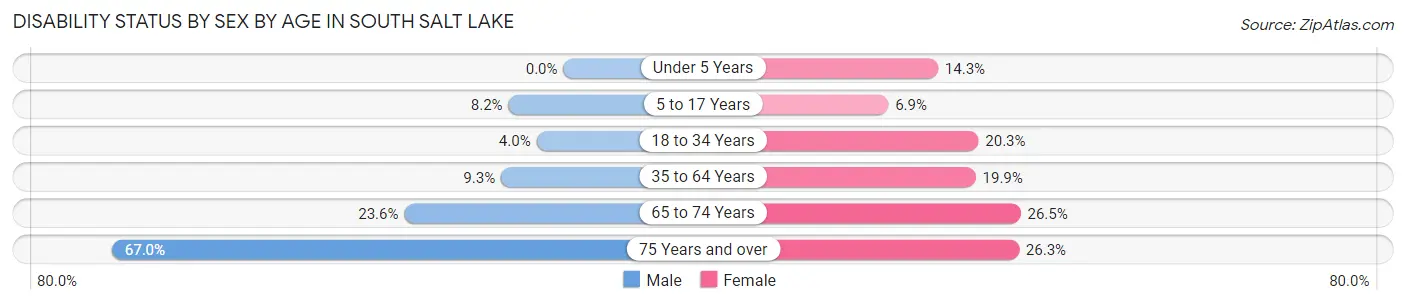
| Age Bracket | Male | Female |
| Under 5 Years | 0 (0.0%) | 117 (14.3%) |
| 5 to 17 Years | 170 (8.2%) | 138 (6.9%) |
| 18 to 34 Years | 172 (4.0%) | 903 (20.3%) |
| 35 to 64 Years | 424 (9.3%) | 887 (19.9%) |
| 65 to 74 Years | 145 (23.6%) | 155 (26.5%) |
| 75 Years and over | 240 (67.0%) | 91 (26.3%) |
Disability Class by Sex by Age in South Salt Lake
Disability Class: Hearing Difficulty
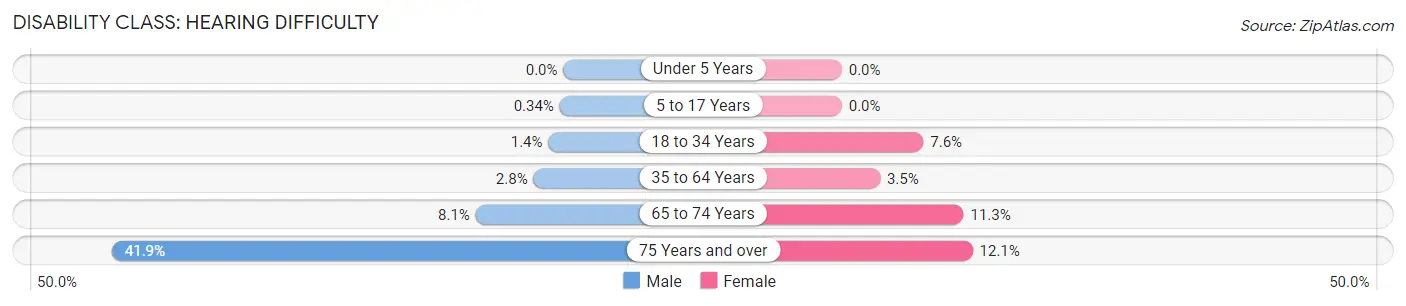
| Age Bracket | Male | Female |
| Under 5 Years | 0 (0.0%) | 0 (0.0%) |
| 5 to 17 Years | 7 (0.3%) | 0 (0.0%) |
| 18 to 34 Years | 60 (1.4%) | 337 (7.6%) |
| 35 to 64 Years | 127 (2.8%) | 158 (3.5%) |
| 65 to 74 Years | 50 (8.1%) | 66 (11.3%) |
| 75 Years and over | 150 (41.9%) | 42 (12.1%) |
Disability Class: Vision Difficulty
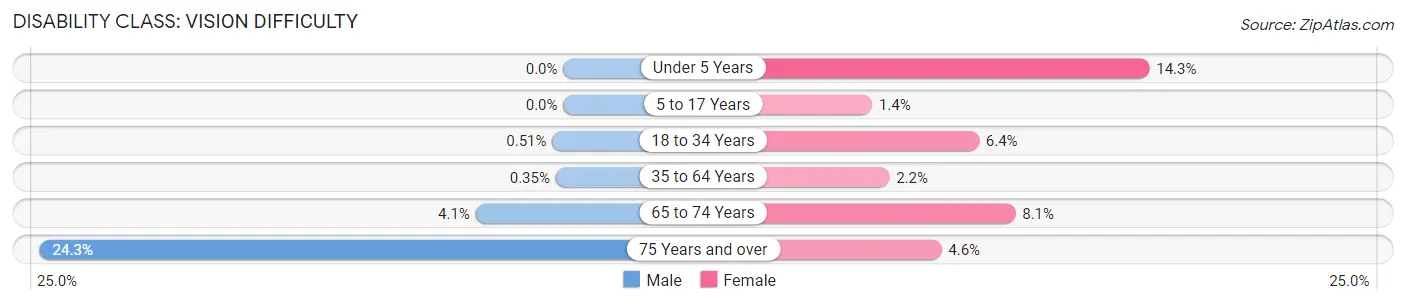
| Age Bracket | Male | Female |
| Under 5 Years | 0 (0.0%) | 117 (14.3%) |
| 5 to 17 Years | 0 (0.0%) | 28 (1.4%) |
| 18 to 34 Years | 22 (0.5%) | 283 (6.4%) |
| 35 to 64 Years | 16 (0.4%) | 98 (2.2%) |
| 65 to 74 Years | 25 (4.1%) | 47 (8.1%) |
| 75 Years and over | 87 (24.3%) | 16 (4.6%) |
Disability Class: Cognitive Difficulty
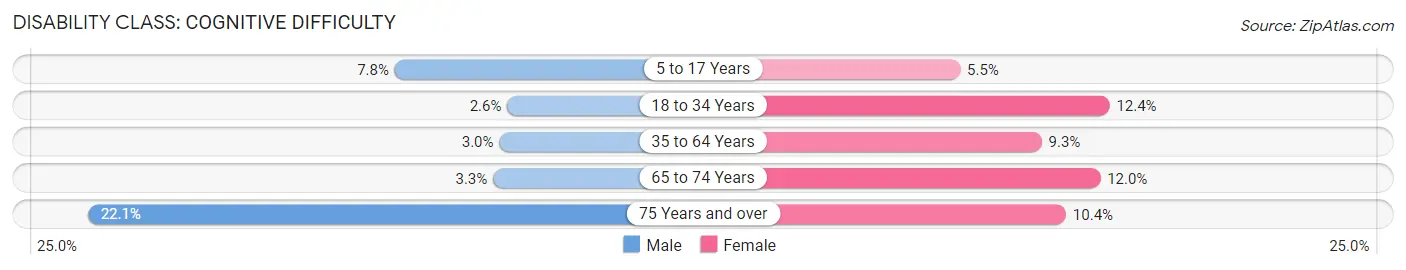
| Age Bracket | Male | Female |
| 5 to 17 Years | 163 (7.8%) | 110 (5.5%) |
| 18 to 34 Years | 112 (2.6%) | 553 (12.4%) |
| 35 to 64 Years | 136 (3.0%) | 414 (9.3%) |
| 65 to 74 Years | 20 (3.3%) | 70 (12.0%) |
| 75 Years and over | 79 (22.1%) | 36 (10.4%) |
Disability Class: Ambulatory Difficulty
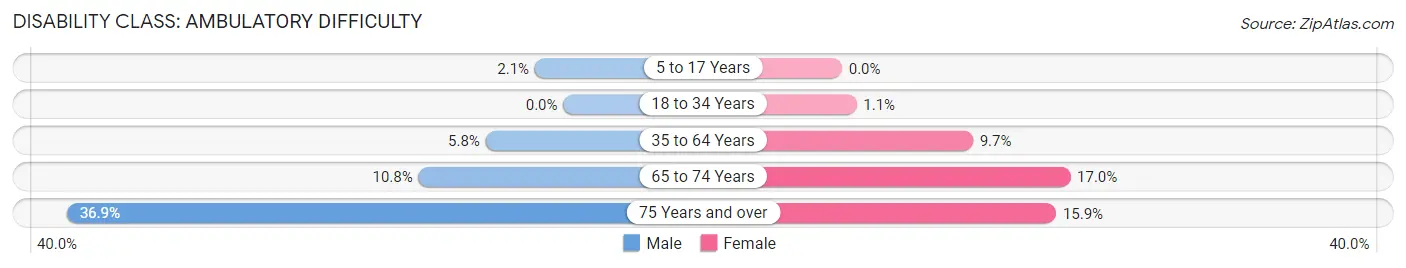
| Age Bracket | Male | Female |
| 5 to 17 Years | 44 (2.1%) | 0 (0.0%) |
| 18 to 34 Years | 0 (0.0%) | 48 (1.1%) |
| 35 to 64 Years | 264 (5.8%) | 434 (9.7%) |
| 65 to 74 Years | 66 (10.7%) | 99 (17.0%) |
| 75 Years and over | 132 (36.9%) | 55 (15.9%) |
Disability Class: Self-Care Difficulty
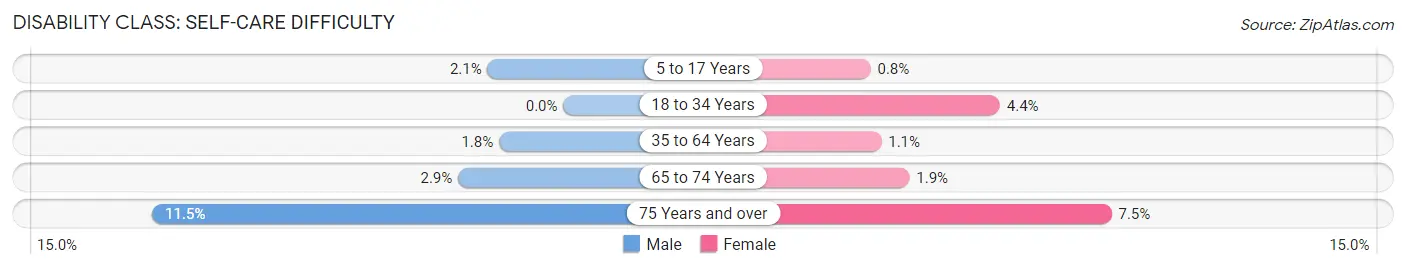
| Age Bracket | Male | Female |
| 5 to 17 Years | 44 (2.1%) | 16 (0.8%) |
| 18 to 34 Years | 0 (0.0%) | 196 (4.4%) |
| 35 to 64 Years | 82 (1.8%) | 49 (1.1%) |
| 65 to 74 Years | 18 (2.9%) | 11 (1.9%) |
| 75 Years and over | 41 (11.5%) | 26 (7.5%) |
Technology Access in South Salt Lake
Computing Device Access in South Salt Lake
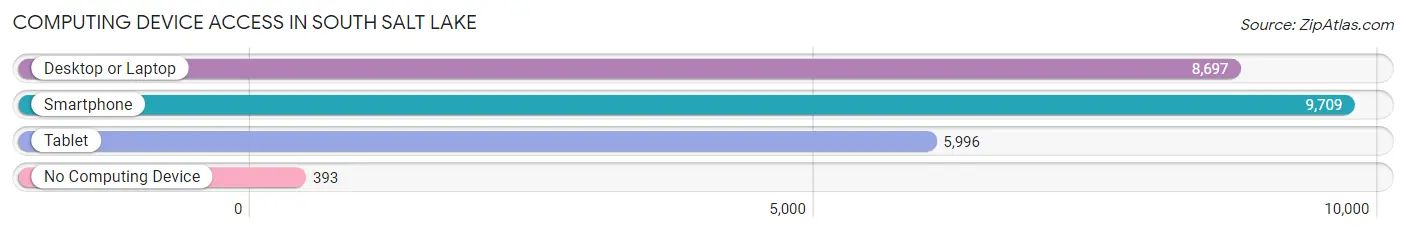
| Device Type | # Households | % Households |
| Desktop or Laptop | 8,697 | 82.1% |
| Smartphone | 9,709 | 91.6% |
| Tablet | 5,996 | 56.6% |
| No Computing Device | 393 | 3.7% |
| Total | 10,600 | 100.0% |
Internet Access in South Salt Lake
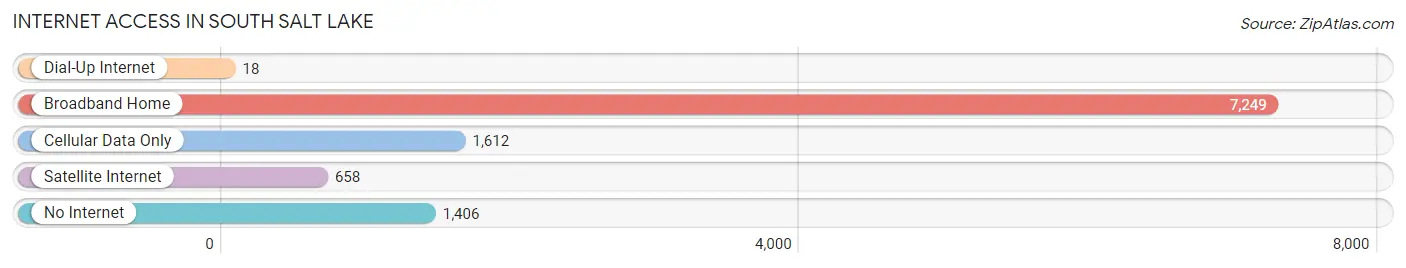
| Internet Type | # Households | % Households |
| Dial-Up Internet | 18 | 0.2% |
| Broadband Home | 7,249 | 68.4% |
| Cellular Data Only | 1,612 | 15.2% |
| Satellite Internet | 658 | 6.2% |
| No Internet | 1,406 | 13.3% |
| Total | 10,600 | 100.0% |
South Salt Lake Summary
Salt Lake City, Utah is the capital and most populous city in the state of Utah. It is located in the northern part of the state, along the Wasatch Front, and is the core of the Salt Lake City metropolitan area, which has a population of 1.2 million people. Salt Lake City is the cultural, economic, and governmental center of Utah, and is home to many of the state's major attractions, including the Great Salt Lake, Temple Square, and the University of Utah.
History
Salt Lake City was founded in 1847 by a group of Mormon pioneers led by Brigham Young. The pioneers were seeking to establish a new home in the West, away from the persecution they had faced in the East. The city was named after the nearby Great Salt Lake, which was an important source of salt for the pioneers.
The city quickly grew, and by the 1860s it had become an important hub for trade and transportation. The completion of the transcontinental railroad in 1869 further increased the city's importance, and it became the gateway to the West.
In the late 19th century, Salt Lake City was the center of the Mormon Church, and the city was home to many of the church's most important buildings, including the Salt Lake Temple and the Salt Lake Tabernacle. The city was also the site of the 2002 Winter Olympics, which brought international attention to the city.
Geography
Salt Lake City is located in the northern part of Utah, along the Wasatch Front. The city is situated in a valley between the Wasatch Mountains to the east and the Oquirrh Mountains to the west. The city is located at an elevation of 4,327 feet (1,319 m).
The city covers an area of 110.4 square miles (285.4 km2), and is divided into four distinct geographic regions: the downtown area, the East Bench, the West Bench, and the South Valley. The downtown area is the most densely populated, and is home to many of the city's major attractions, including Temple Square and the Salt Palace Convention Center.
Economy
Salt Lake City is the economic and financial center of Utah, and is home to many of the state's major businesses and corporations. The city is a major hub for the technology, finance, and healthcare industries, and is home to several Fortune 500 companies, including Zions Bancorporation, Questar Corporation, and Overstock.com.
The city is also home to several major universities, including the University of Utah, Westminster College, and Salt Lake Community College. These institutions provide a large number of jobs to the city's economy, as well as providing a highly educated workforce.
Demographics
As of the 2010 census, Salt Lake City had a population of 186,440 people. The city is racially and ethnically diverse, with the largest racial group being White (63.2%), followed by Hispanic or Latino (17.2%), Asian (7.2%), and African American (5.2%).
The median household income in Salt Lake City is $50,936, and the median home value is $219,400. The city has a poverty rate of 13.7%, and the unemployment rate is 3.7%.
Salt Lake City is a major cultural center in Utah, and is home to many of the state's major attractions, including Temple Square, the Salt Palace Convention Center, and the Great Salt Lake. The city is also home to several major universities, and is a major hub for the technology, finance, and healthcare industries. Salt Lake City is a diverse and vibrant city, and is an important part of the state of Utah.
Common Questions
What is Per Capita Income in South Salt Lake?
Per Capita income in South Salt Lake is $32,327.
What is the Median Family Income in South Salt Lake?
Median Family Income in South Salt Lake is $69,112.
What is the Median Household income in South Salt Lake?
Median Household Income in South Salt Lake is $57,125.
What is Income or Wage Gap in South Salt Lake?
Income or Wage Gap in South Salt Lake is 21.4%.
Women in South Salt Lake earn 78.6 cents for every dollar earned by a man.
What is Family Income Deficit in South Salt Lake?
Family Income Deficit in South Salt Lake is $13,329.
Families that are below poverty line in South Salt Lake earn $13,329 less on average than the poverty threshold level.
What is Inequality or Gini Index in South Salt Lake?
Inequality or Gini Index in South Salt Lake is 0.42.
What is the Total Population of South Salt Lake?
Total Population of South Salt Lake is 26,315.
What is the Total Male Population of South Salt Lake?
Total Male Population of South Salt Lake is 13,518.
What is the Total Female Population of South Salt Lake?
Total Female Population of South Salt Lake is 12,797.
What is the Ratio of Males per 100 Females in South Salt Lake?
There are 105.63 Males per 100 Females in South Salt Lake.
What is the Ratio of Females per 100 Males in South Salt Lake?
There are 94.67 Females per 100 Males in South Salt Lake.
What is the Median Population Age in South Salt Lake?
Median Population Age in South Salt Lake is 31.3 Years.
What is the Average Family Size in South Salt Lake
Average Family Size in South Salt Lake is 3.2 People.
What is the Average Household Size in South Salt Lake
Average Household Size in South Salt Lake is 2.4 People.
How Large is the Labor Force in South Salt Lake?
There are 15,778 People in the Labor Forcein in South Salt Lake.
What is the Percentage of People in the Labor Force in South Salt Lake?
73.3% of People are in the Labor Force in South Salt Lake.
What is the Unemployment Rate in South Salt Lake?
Unemployment Rate in South Salt Lake is 4.8%.