West Jordan, UT Map & Demographics
West Jordan Map
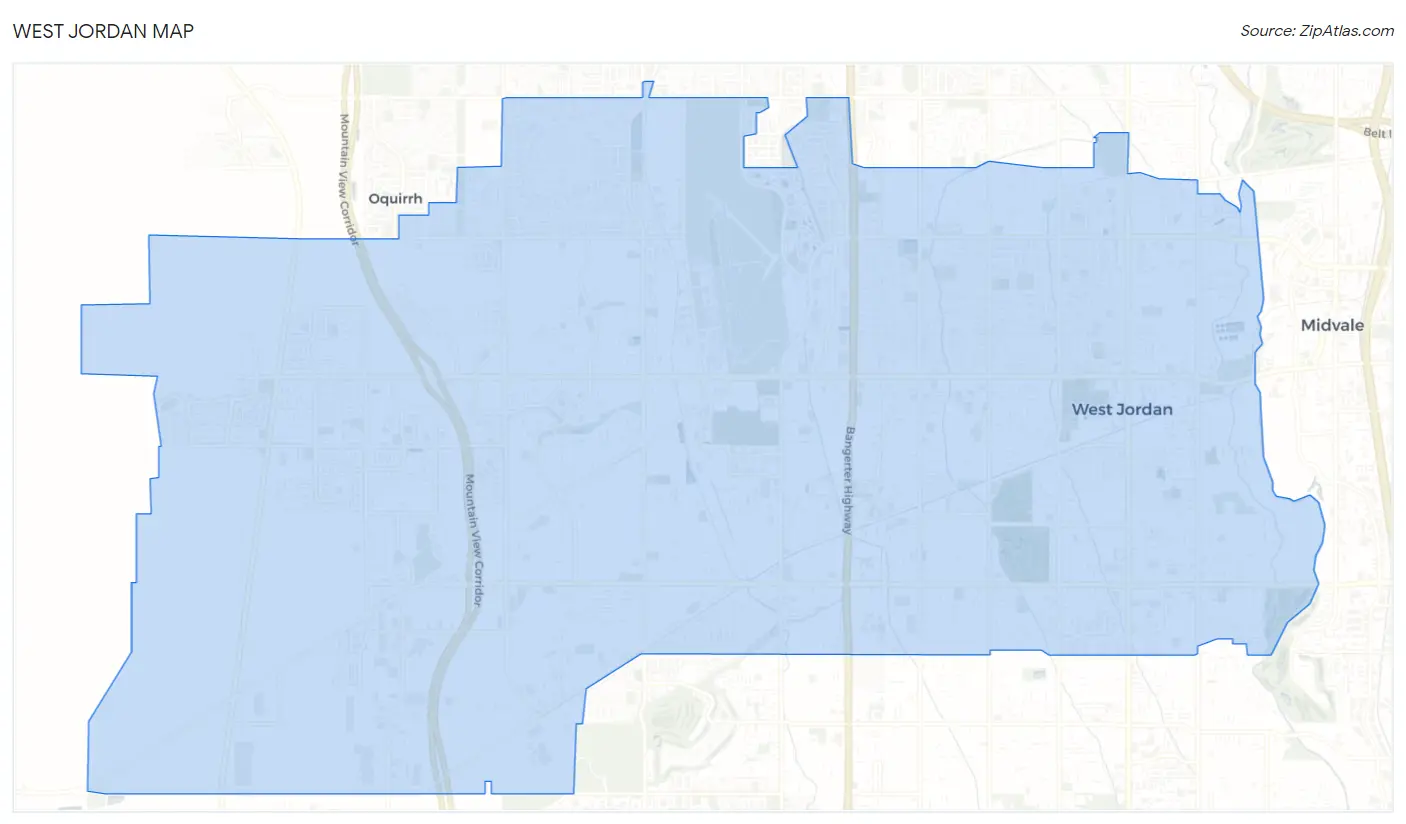
West Jordan Overview
$34,765
PER CAPITA INCOME
$106,097
AVG FAMILY INCOME
$99,002
AVG HOUSEHOLD INCOME
36.8%
WAGE / INCOME GAP [ % ]
63.2¢/ $1
WAGE / INCOME GAP [ $ ]
$11,838
FAMILY INCOME DEFICIT
0.34
INEQUALITY / GINI INDEX
116,383
TOTAL POPULATION
60,125
MALE POPULATION
56,258
FEMALE POPULATION
106.87
MALES / 100 FEMALES
93.57
FEMALES / 100 MALES
32.6
MEDIAN AGE
3.6
AVG FAMILY SIZE
3.2
AVG HOUSEHOLD SIZE
66,059
LABOR FORCE [ PEOPLE ]
76.1%
PERCENT IN LABOR FORCE
4.2%
UNEMPLOYMENT RATE
West Jordan Area Codes
Income in West Jordan
Income Overview in West Jordan
Per Capita Income in West Jordan is $34,765, while median incomes of families and households are $106,097 and $99,002 respectively.
| Characteristic | Number | Measure |
| Per Capita Income | 116,383 | $34,765 |
| Median Family Income | 28,853 | $106,097 |
| Mean Family Income | 28,853 | $117,669 |
| Median Household Income | 35,976 | $99,002 |
| Mean Household Income | 35,976 | $110,374 |
| Income Deficit | 28,853 | $11,838 |
| Wage / Income Gap (%) | 116,383 | 36.80% |
| Wage / Income Gap ($) | 116,383 | 63.20¢ per $1 |
| Gini / Inequality Index | 116,383 | 0.34 |
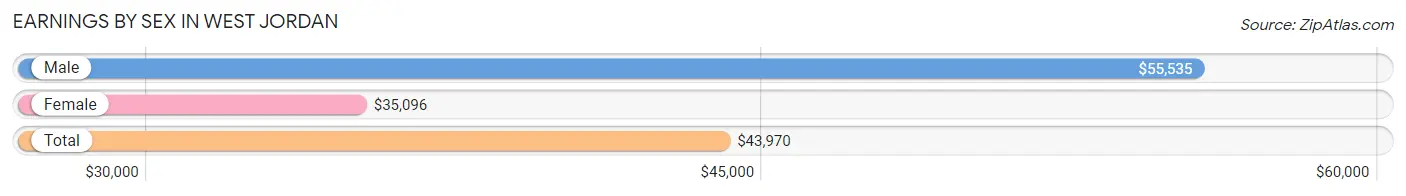
Earnings by Sex in West Jordan
Average Earnings in West Jordan are $43,970, $55,535 for men and $35,096 for women, a difference of 36.8%.
| Sex | Number | Average Earnings |
| Male | 37,050 (54.6%) | $55,535 |
| Female | 30,747 (45.4%) | $35,096 |
| Total | 67,797 (100.0%) | $43,970 |
Earnings by Sex by Income Bracket in West Jordan
The most common earnings brackets in West Jordan are $100,000+ for men (6,091 | 16.4%) and $65,000 to $74,999 for women (2,352 | 7.6%).
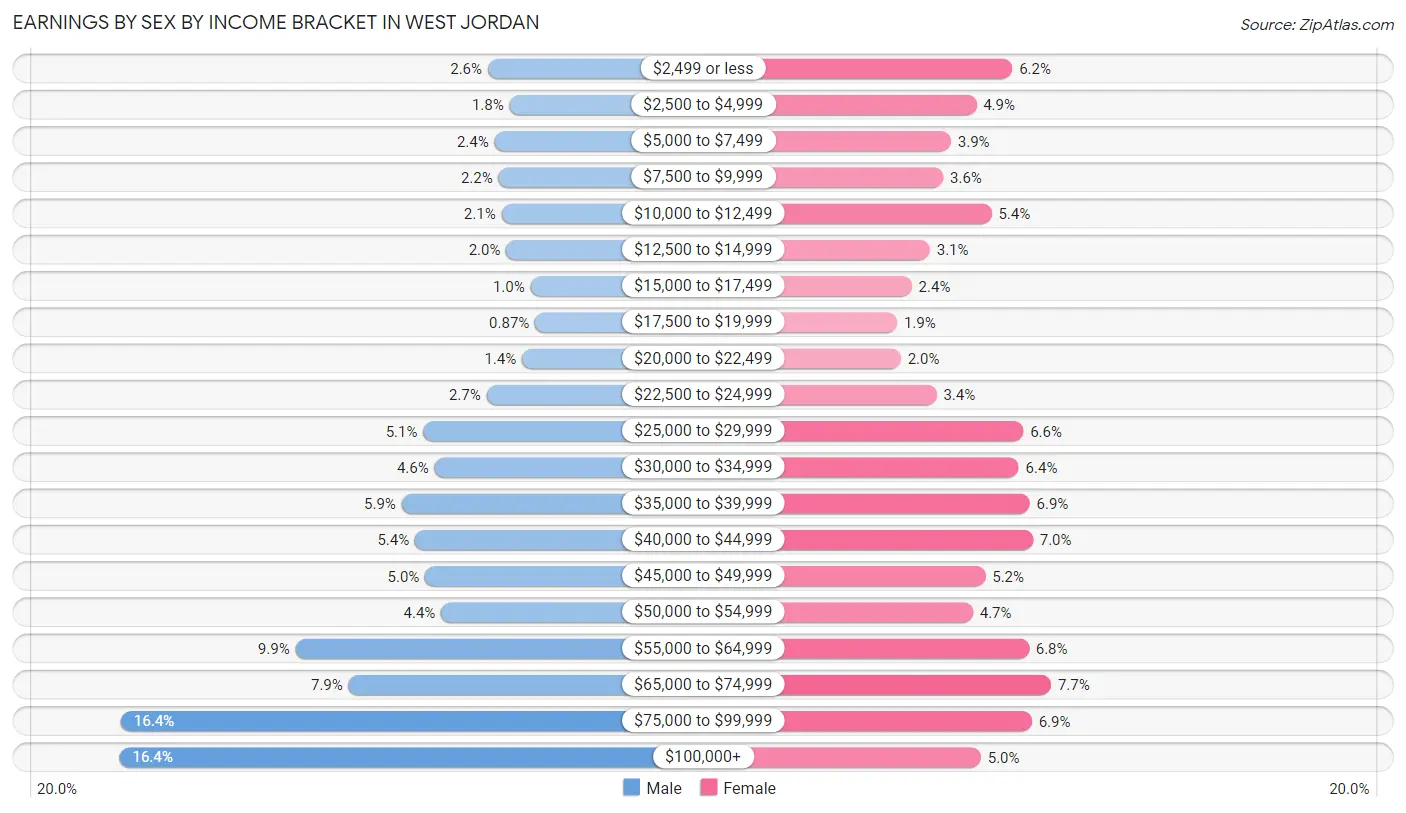
| Income | Male | Female |
| $2,499 or less | 979 (2.6%) | 1,907 (6.2%) |
| $2,500 to $4,999 | 678 (1.8%) | 1,490 (4.9%) |
| $5,000 to $7,499 | 884 (2.4%) | 1,200 (3.9%) |
| $7,500 to $9,999 | 831 (2.2%) | 1,109 (3.6%) |
| $10,000 to $12,499 | 790 (2.1%) | 1,668 (5.4%) |
| $12,500 to $14,999 | 723 (1.9%) | 955 (3.1%) |
| $15,000 to $17,499 | 386 (1.0%) | 748 (2.4%) |
| $17,500 to $19,999 | 321 (0.9%) | 578 (1.9%) |
| $20,000 to $22,499 | 505 (1.4%) | 621 (2.0%) |
| $22,500 to $24,999 | 995 (2.7%) | 1,033 (3.4%) |
| $25,000 to $29,999 | 1,876 (5.1%) | 2,033 (6.6%) |
| $30,000 to $34,999 | 1,718 (4.6%) | 1,980 (6.4%) |
| $35,000 to $39,999 | 2,176 (5.9%) | 2,107 (6.9%) |
| $40,000 to $44,999 | 1,988 (5.4%) | 2,144 (7.0%) |
| $45,000 to $49,999 | 1,848 (5.0%) | 1,597 (5.2%) |
| $50,000 to $54,999 | 1,626 (4.4%) | 1,452 (4.7%) |
| $55,000 to $64,999 | 3,651 (9.9%) | 2,097 (6.8%) |
| $65,000 to $74,999 | 2,911 (7.9%) | 2,352 (7.6%) |
| $75,000 to $99,999 | 6,073 (16.4%) | 2,132 (6.9%) |
| $100,000+ | 6,091 (16.4%) | 1,544 (5.0%) |
| Total | 37,050 (100.0%) | 30,747 (100.0%) |
Earnings by Sex by Educational Attainment in West Jordan
Average earnings in West Jordan are $63,273 for men and $40,911 for women, a difference of 35.3%. Men with an educational attainment of graduate degree enjoy the highest average annual earnings of $94,451, while those with less than high school education earn the least with $39,414. Women with an educational attainment of graduate degree earn the most with the average annual earnings of $59,808, while those with less than high school education have the smallest earnings of $26,447.
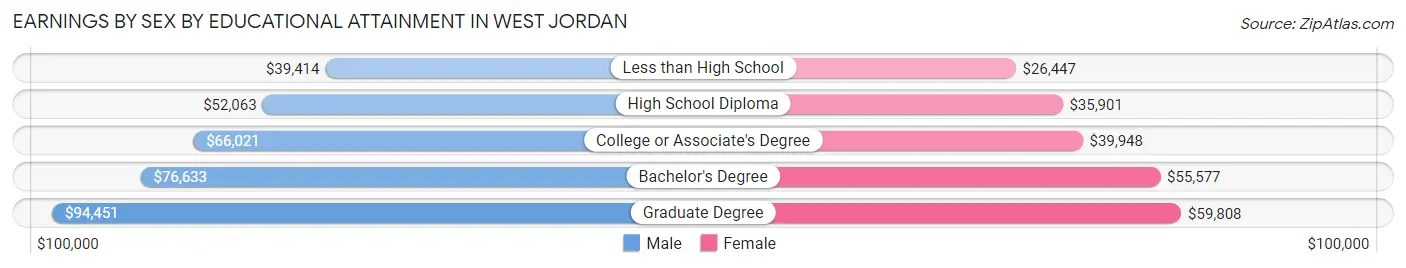
| Educational Attainment | Male Income | Female Income |
| Less than High School | $39,414 | $26,447 |
| High School Diploma | $52,063 | $35,901 |
| College or Associate's Degree | $66,021 | $39,948 |
| Bachelor's Degree | $76,633 | $55,577 |
| Graduate Degree | $94,451 | $59,808 |
| Total | $63,273 | $40,911 |
Family Income in West Jordan
Family Income Brackets in West Jordan
According to the West Jordan family income data, there are 8,483 families falling into the $100,000 to $149,999 income range, which is the most common income bracket and makes up 29.4% of all families. Conversely, the $10,000 to $14,999 income bracket is the least frequent group with only 317 families (1.1%) belonging to this category.
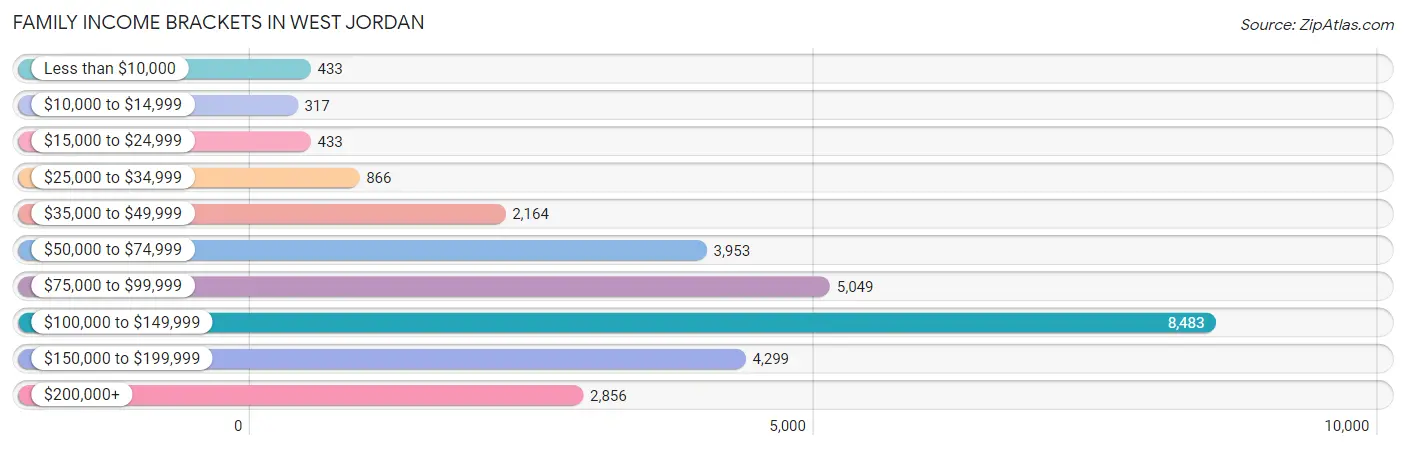
| Income Bracket | # Families | % Families |
| Less than $10,000 | 433 | 1.5% |
| $10,000 to $14,999 | 317 | 1.1% |
| $15,000 to $24,999 | 433 | 1.5% |
| $25,000 to $34,999 | 866 | 3.0% |
| $35,000 to $49,999 | 2,164 | 7.5% |
| $50,000 to $74,999 | 3,953 | 13.7% |
| $75,000 to $99,999 | 5,049 | 17.5% |
| $100,000 to $149,999 | 8,483 | 29.4% |
| $150,000 to $199,999 | 4,299 | 14.9% |
| $200,000+ | 2,856 | 9.9% |
Family Income by Famaliy Size in West Jordan
7+ person families (1,056 | 3.7%) account for the highest median family income in West Jordan with $138,182 per family, while 2-person families (9,629 | 33.4%) have the highest median income of $46,111 per family member.
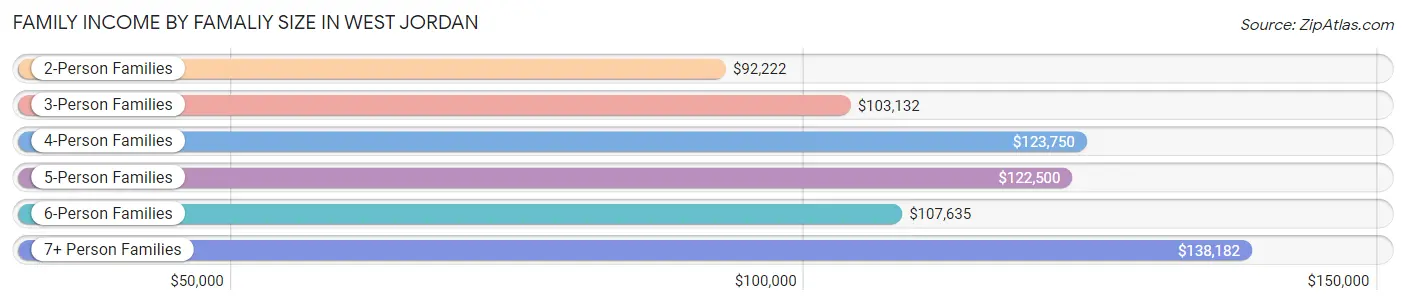
| Income Bracket | # Families | Median Income |
| 2-Person Families | 9,629 (33.4%) | $92,222 |
| 3-Person Families | 6,513 (22.6%) | $103,132 |
| 4-Person Families | 6,255 (21.7%) | $123,750 |
| 5-Person Families | 3,696 (12.8%) | $122,500 |
| 6-Person Families | 1,704 (5.9%) | $107,635 |
| 7+ Person Families | 1,056 (3.7%) | $138,182 |
| Total | 28,853 (100.0%) | $106,097 |
Family Income by Number of Earners in West Jordan
The median family income in West Jordan is $106,097, with families comprising 3+ earners (6,366) having the highest median family income of $151,481, while families with no earners (1,661) have the lowest median family income of $53,996, accounting for 22.1% and 5.8% of families, respectively.
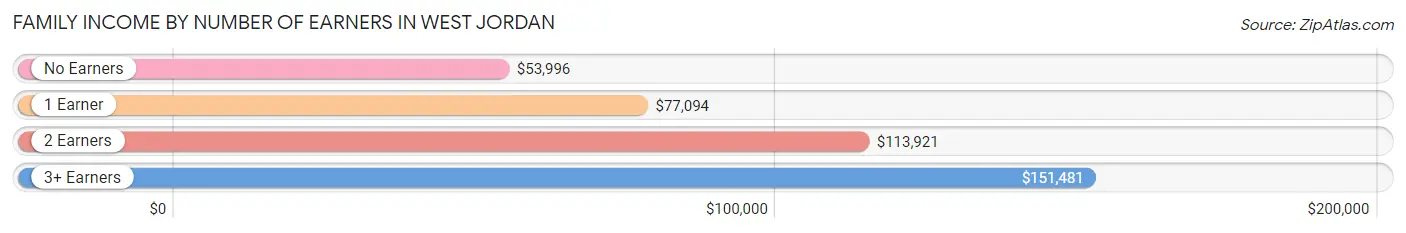
| Number of Earners | # Families | Median Income |
| No Earners | 1,661 (5.8%) | $53,996 |
| 1 Earner | 7,051 (24.4%) | $77,094 |
| 2 Earners | 13,775 (47.7%) | $113,921 |
| 3+ Earners | 6,366 (22.1%) | $151,481 |
| Total | 28,853 (100.0%) | $106,097 |
Household Income in West Jordan
Household Income Brackets in West Jordan
With 9,714 households falling in the category, the $100,000 to $149,999 income range is the most frequent in West Jordan, accounting for 27.0% of all households. In contrast, only 648 households (1.8%) fall into the less than $10,000 income bracket, making it the least populous group.
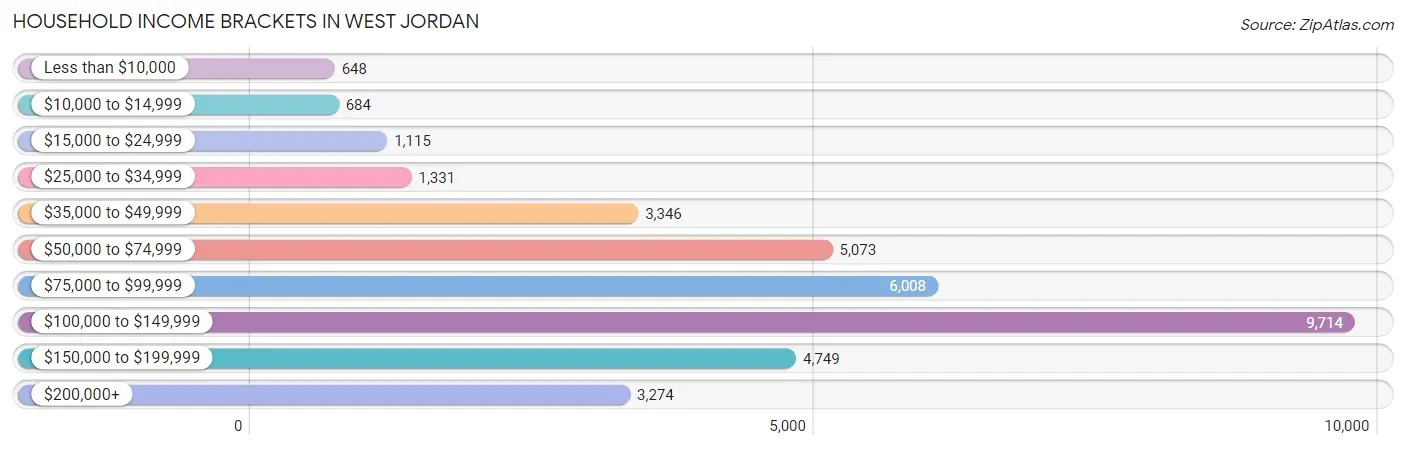
| Income Bracket | # Households | % Households |
| Less than $10,000 | 648 | 1.8% |
| $10,000 to $14,999 | 684 | 1.9% |
| $15,000 to $24,999 | 1,115 | 3.1% |
| $25,000 to $34,999 | 1,331 | 3.7% |
| $35,000 to $49,999 | 3,346 | 9.3% |
| $50,000 to $74,999 | 5,073 | 14.1% |
| $75,000 to $99,999 | 6,008 | 16.7% |
| $100,000 to $149,999 | 9,714 | 27.0% |
| $150,000 to $199,999 | 4,749 | 13.2% |
| $200,000+ | 3,274 | 9.1% |
Household Income by Householder Age in West Jordan
The median household income in West Jordan is $99,002, with the highest median household income of $119,075 found in the 45 to 64 years age bracket for the primary householder. A total of 13,245 households (36.8%) fall into this category. Meanwhile, the 15 to 24 years age bracket for the primary householder has the lowest median household income of $56,685, with 1,815 households (5.1%) in this group.
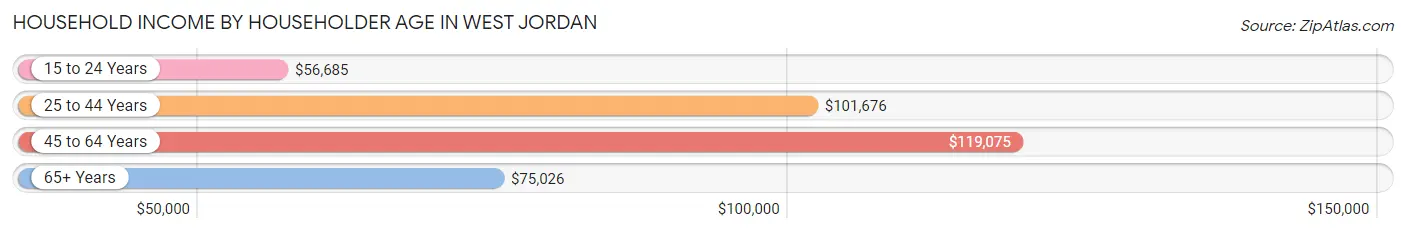
| Income Bracket | # Households | Median Income |
| 15 to 24 Years | 1,815 (5.1%) | $56,685 |
| 25 to 44 Years | 15,131 (42.1%) | $101,676 |
| 45 to 64 Years | 13,245 (36.8%) | $119,075 |
| 65+ Years | 5,785 (16.1%) | $75,026 |
| Total | 35,976 (100.0%) | $99,002 |
Poverty in West Jordan
Income Below Poverty by Sex and Age in West Jordan
With 5.2% poverty level for males and 7.0% for females among the residents of West Jordan, under 5 year old males and 12 to 14 year old females are the most vulnerable to poverty, with 434 males (10.6%) and 340 females (12.2%) in their respective age groups living below the poverty level.
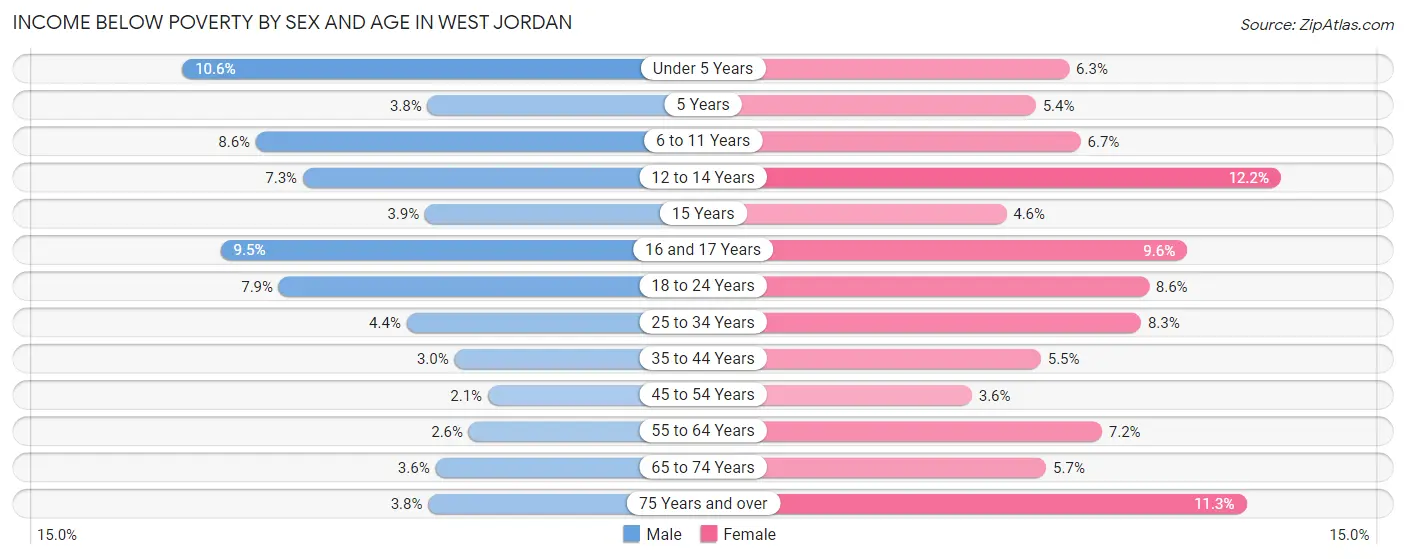
| Age Bracket | Male | Female |
| Under 5 Years | 434 (10.6%) | 217 (6.3%) |
| 5 Years | 25 (3.8%) | 34 (5.4%) |
| 6 to 11 Years | 492 (8.6%) | 415 (6.7%) |
| 12 to 14 Years | 273 (7.2%) | 340 (12.2%) |
| 15 Years | 50 (3.8%) | 28 (4.6%) |
| 16 and 17 Years | 167 (9.5%) | 186 (9.6%) |
| 18 to 24 Years | 509 (7.9%) | 459 (8.6%) |
| 25 to 34 Years | 387 (4.4%) | 706 (8.3%) |
| 35 to 44 Years | 297 (3.0%) | 487 (5.5%) |
| 45 to 54 Years | 157 (2.1%) | 243 (3.6%) |
| 55 to 64 Years | 138 (2.6%) | 395 (7.2%) |
| 65 to 74 Years | 121 (3.6%) | 220 (5.7%) |
| 75 Years and over | 46 (3.8%) | 187 (11.3%) |
| Total | 3,096 (5.2%) | 3,917 (7.0%) |
Income Above Poverty by Sex and Age in West Jordan
According to the poverty statistics in West Jordan, males aged 45 to 54 years and females aged 45 to 54 years are the age groups that are most secure financially, with 97.9% of males and 96.4% of females in these age groups living above the poverty line.
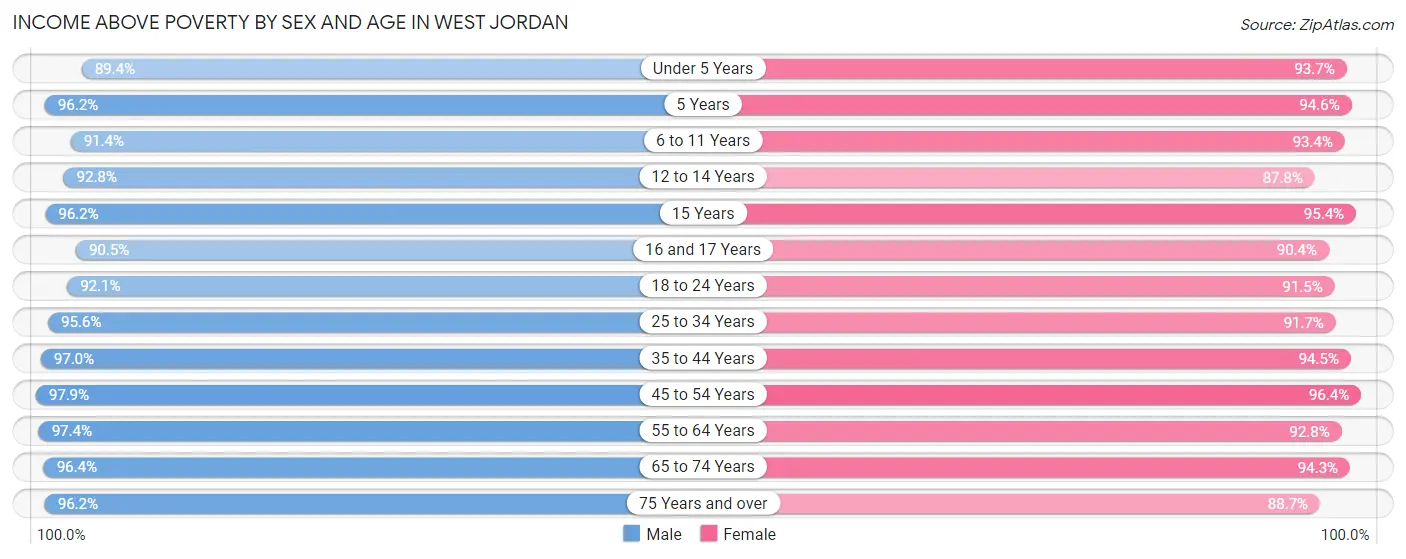
| Age Bracket | Male | Female |
| Under 5 Years | 3,656 (89.4%) | 3,210 (93.7%) |
| 5 Years | 637 (96.2%) | 596 (94.6%) |
| 6 to 11 Years | 5,254 (91.4%) | 5,821 (93.3%) |
| 12 to 14 Years | 3,490 (92.7%) | 2,443 (87.8%) |
| 15 Years | 1,249 (96.2%) | 584 (95.4%) |
| 16 and 17 Years | 1,584 (90.5%) | 1,750 (90.4%) |
| 18 to 24 Years | 5,918 (92.1%) | 4,910 (91.4%) |
| 25 to 34 Years | 8,497 (95.6%) | 7,774 (91.7%) |
| 35 to 44 Years | 9,510 (97.0%) | 8,311 (94.5%) |
| 45 to 54 Years | 7,323 (97.9%) | 6,473 (96.4%) |
| 55 to 64 Years | 5,118 (97.4%) | 5,061 (92.8%) |
| 65 to 74 Years | 3,276 (96.4%) | 3,646 (94.3%) |
| 75 Years and over | 1,179 (96.2%) | 1,474 (88.7%) |
| Total | 56,691 (94.8%) | 52,053 (93.0%) |
Income Below Poverty Among Married-Couple Families in West Jordan
The poverty statistics for married-couple families in West Jordan show that 2.7% or 633 of the total 23,107 families live below the poverty line. Families with 5 or more children have the highest poverty rate of 15.8%, comprising of 64 families. On the other hand, families with no children have the lowest poverty rate of 1.3%, which includes 141 families.
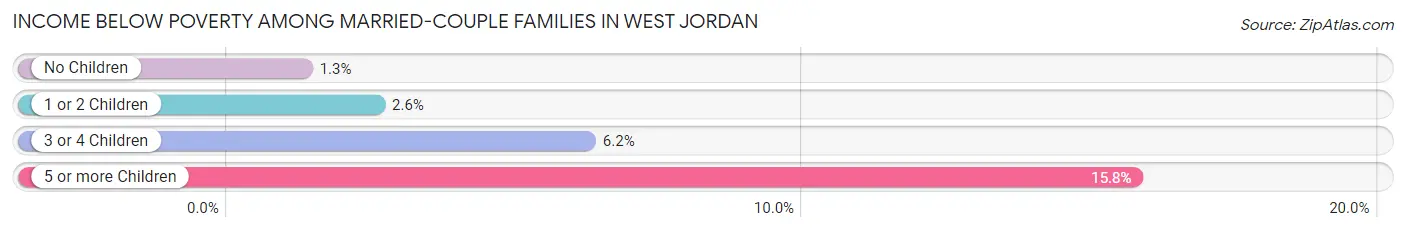
| Children | Above Poverty | Below Poverty |
| No Children | 10,707 (98.7%) | 141 (1.3%) |
| 1 or 2 Children | 8,248 (97.4%) | 217 (2.6%) |
| 3 or 4 Children | 3,177 (93.8%) | 211 (6.2%) |
| 5 or more Children | 342 (84.2%) | 64 (15.8%) |
| Total | 22,474 (97.3%) | 633 (2.7%) |
Income Below Poverty Among Single-Parent Households in West Jordan
According to the poverty data in West Jordan, 6.4% or 131 single-father households and 15.5% or 575 single-mother households are living below the poverty line. Among single-father households, those with no children have the highest poverty rate, with 78 households (9.1%) experiencing poverty. Likewise, among single-mother households, those with 3 or 4 children have the highest poverty rate, with 147 households (47.1%) falling below the poverty line.
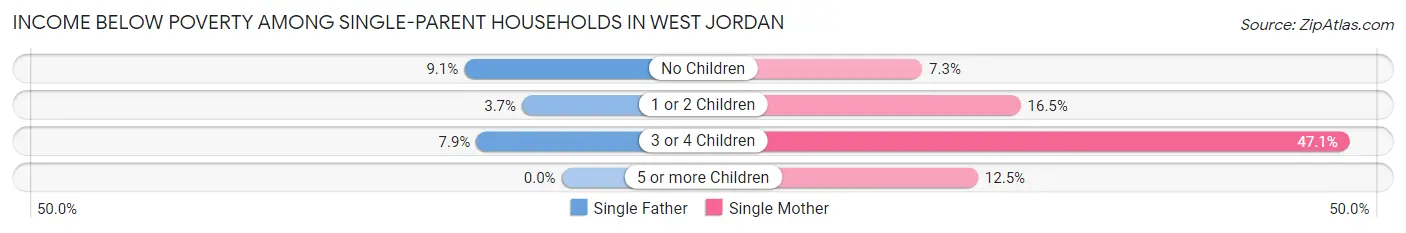
| Children | Single Father | Single Mother |
| No Children | 78 (9.1%) | 103 (7.3%) |
| 1 or 2 Children | 36 (3.7%) | 323 (16.5%) |
| 3 or 4 Children | 17 (7.9%) | 147 (47.1%) |
| 5 or more Children | 0 (0.0%) | 2 (12.5%) |
| Total | 131 (6.4%) | 575 (15.5%) |
Income Below Poverty Among Married-Couple vs Single-Parent Households in West Jordan
The poverty data for West Jordan shows that 633 of the married-couple family households (2.7%) and 706 of the single-parent households (12.3%) are living below the poverty level. Within the married-couple family households, those with 5 or more children have the highest poverty rate, with 64 households (15.8%) falling below the poverty line. Among the single-parent households, those with 3 or 4 children have the highest poverty rate, with 164 household (31.2%) living below poverty.
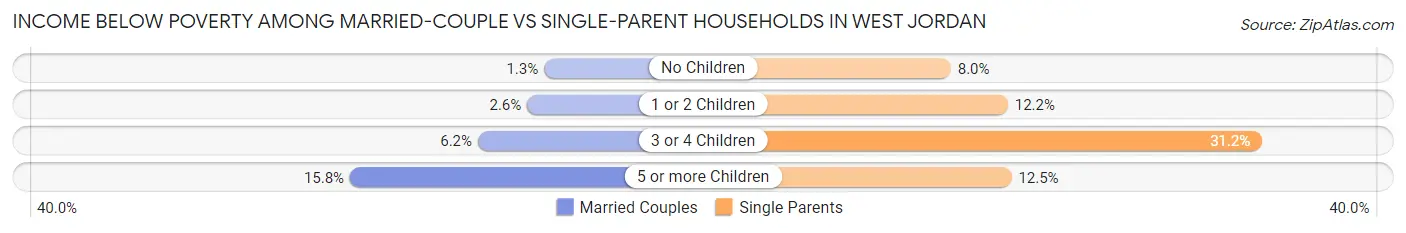
| Children | Married-Couple Families | Single-Parent Households |
| No Children | 141 (1.3%) | 181 (8.0%) |
| 1 or 2 Children | 217 (2.6%) | 359 (12.2%) |
| 3 or 4 Children | 211 (6.2%) | 164 (31.2%) |
| 5 or more Children | 64 (15.8%) | 2 (12.5%) |
| Total | 633 (2.7%) | 706 (12.3%) |
Race in West Jordan
The most populous races in West Jordan are White / Caucasian (87,276 | 75.0%), Hispanic or Latino (26,645 | 22.9%), and Two or more Races (11,443 | 9.8%).
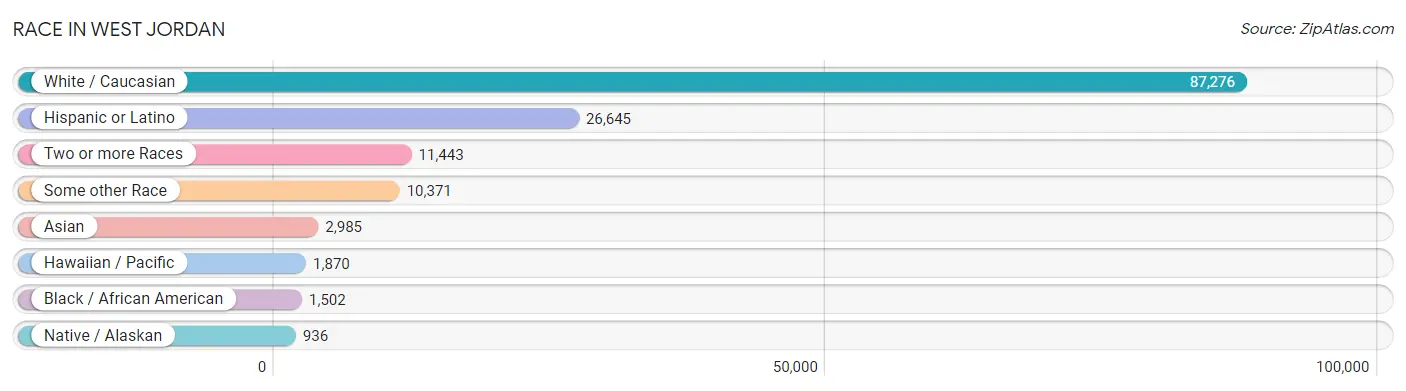
| Race | # Population | % Population |
| Asian | 2,985 | 2.6% |
| Black / African American | 1,502 | 1.3% |
| Hawaiian / Pacific | 1,870 | 1.6% |
| Hispanic or Latino | 26,645 | 22.9% |
| Native / Alaskan | 936 | 0.8% |
| White / Caucasian | 87,276 | 75.0% |
| Two or more Races | 11,443 | 9.8% |
| Some other Race | 10,371 | 8.9% |
| Total | 116,383 | 100.0% |
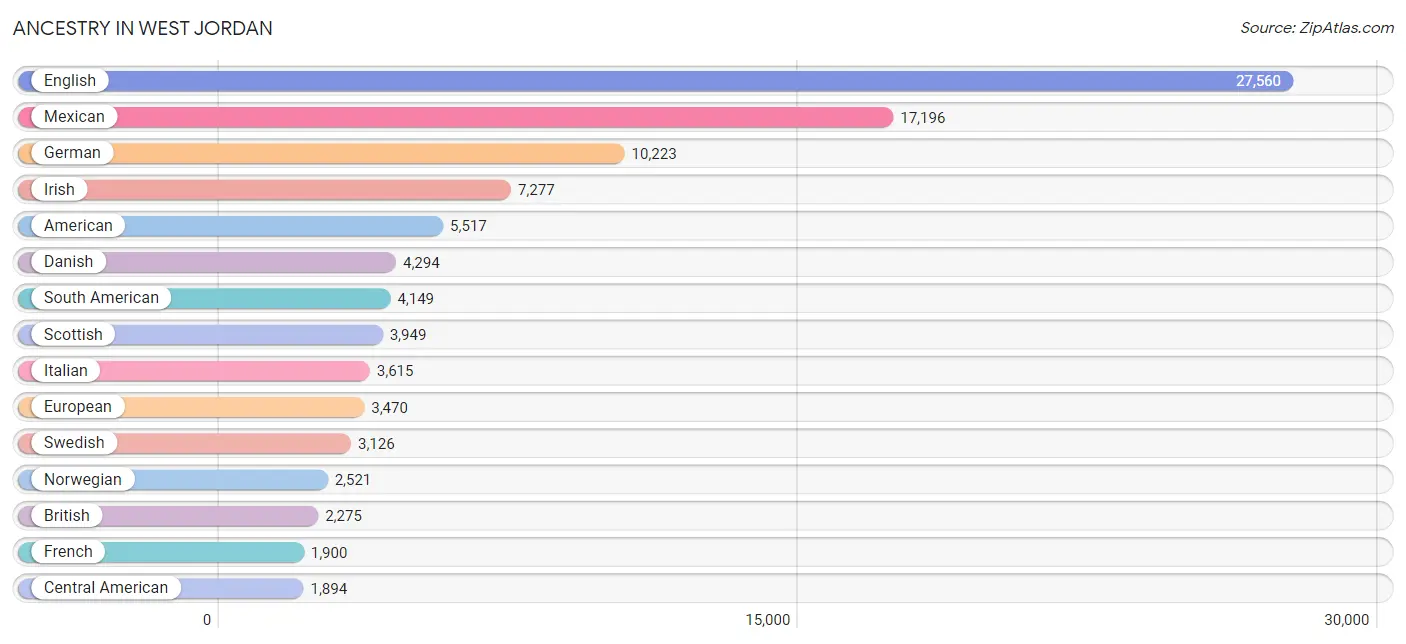
Ancestry in West Jordan
The most populous ancestries reported in West Jordan are English (27,560 | 23.7%), Mexican (17,196 | 14.8%), German (10,223 | 8.8%), Irish (7,277 | 6.2%), and American (5,517 | 4.7%), together accounting for 58.2% of all West Jordan residents.
| Ancestry | # Population | % Population |
| African | 62 | 0.1% |
| Albanian | 10 | 0.0% |
| American | 5,517 | 4.7% |
| Apache | 68 | 0.1% |
| Arab | 388 | 0.3% |
| Argentinean | 675 | 0.6% |
| Armenian | 147 | 0.1% |
| Australian | 58 | 0.1% |
| Austrian | 69 | 0.1% |
| Basque | 95 | 0.1% |
| Belgian | 50 | 0.0% |
| Bhutanese | 241 | 0.2% |
| Blackfeet | 10 | 0.0% |
| Bolivian | 99 | 0.1% |
| Brazilian | 228 | 0.2% |
| British | 2,275 | 1.9% |
| Burmese | 198 | 0.2% |
| Canadian | 91 | 0.1% |
| Central American | 1,894 | 1.6% |
| Central American Indian | 161 | 0.1% |
| Cherokee | 450 | 0.4% |
| Chilean | 240 | 0.2% |
| Chippewa | 21 | 0.0% |
| Choctaw | 39 | 0.0% |
| Colombian | 654 | 0.6% |
| Costa Rican | 66 | 0.1% |
| Creek | 100 | 0.1% |
| Croatian | 263 | 0.2% |
| Cuban | 101 | 0.1% |
| Czech | 350 | 0.3% |
| Czechoslovakian | 6 | 0.0% |
| Danish | 4,294 | 3.7% |
| Dominican | 229 | 0.2% |
| Dutch | 1,539 | 1.3% |
| Dutch West Indian | 19 | 0.0% |
| Eastern European | 42 | 0.0% |
| Ecuadorian | 299 | 0.3% |
| Egyptian | 10 | 0.0% |
| English | 27,560 | 23.7% |
| Estonian | 7 | 0.0% |
| European | 3,470 | 3.0% |
| Fijian | 111 | 0.1% |
| Filipino | 27 | 0.0% |
| Finnish | 293 | 0.3% |
| French | 1,900 | 1.6% |
| French Canadian | 162 | 0.1% |
| German | 10,223 | 8.8% |
| Ghanaian | 13 | 0.0% |
| Greek | 409 | 0.4% |
| Guatemalan | 493 | 0.4% |
| Honduran | 35 | 0.0% |
| Hopi | 36 | 0.0% |
| Hungarian | 143 | 0.1% |
| Icelander | 116 | 0.1% |
| Indian (Asian) | 1,099 | 0.9% |
| Indonesian | 84 | 0.1% |
| Iranian | 176 | 0.2% |
| Iraqi | 67 | 0.1% |
| Irish | 7,277 | 6.2% |
| Israeli | 20 | 0.0% |
| Italian | 3,615 | 3.1% |
| Jamaican | 147 | 0.1% |
| Japanese | 270 | 0.2% |
| Korean | 1,344 | 1.1% |
| Laotian | 34 | 0.0% |
| Latvian | 45 | 0.0% |
| Lebanese | 40 | 0.0% |
| Lithuanian | 48 | 0.0% |
| Malaysian | 267 | 0.2% |
| Maltese | 9 | 0.0% |
| Mexican | 17,196 | 14.8% |
| Mexican American Indian | 130 | 0.1% |
| Mongolian | 12 | 0.0% |
| Native Hawaiian | 23 | 0.0% |
| Navajo | 326 | 0.3% |
| New Zealander | 9 | 0.0% |
| Nicaraguan | 64 | 0.1% |
| Nigerian | 12 | 0.0% |
| Northern European | 155 | 0.1% |
| Norwegian | 2,521 | 2.2% |
| Paiute | 10 | 0.0% |
| Pakistani | 355 | 0.3% |
| Panamanian | 17 | 0.0% |
| Paraguayan | 70 | 0.1% |
| Peruvian | 580 | 0.5% |
| Polish | 970 | 0.8% |
| Portuguese | 69 | 0.1% |
| Pueblo | 182 | 0.2% |
| Puerto Rican | 738 | 0.6% |
| Romanian | 61 | 0.1% |
| Russian | 227 | 0.2% |
| Salvadoran | 1,219 | 1.1% |
| Samoan | 1,025 | 0.9% |
| Scandinavian | 1,108 | 0.9% |
| Scotch-Irish | 1,065 | 0.9% |
| Scottish | 3,949 | 3.4% |
| Sioux | 114 | 0.1% |
| Slavic | 35 | 0.0% |
| Slovak | 55 | 0.1% |
| Slovene | 7 | 0.0% |
| South American | 4,149 | 3.6% |
| South American Indian | 218 | 0.2% |
| Spaniard | 970 | 0.8% |
| Spanish | 667 | 0.6% |
| Spanish American | 17 | 0.0% |
| Spanish American Indian | 105 | 0.1% |
| Sri Lankan | 824 | 0.7% |
| Subsaharan African | 185 | 0.2% |
| Sudanese | 13 | 0.0% |
| Swedish | 3,126 | 2.7% |
| Swiss | 1,037 | 0.9% |
| Syrian | 130 | 0.1% |
| Thai | 226 | 0.2% |
| Tongan | 1,349 | 1.2% |
| Trinidadian and Tobagonian | 49 | 0.0% |
| Turkish | 60 | 0.1% |
| Ukrainian | 14 | 0.0% |
| Uruguayan | 104 | 0.1% |
| Ute | 1 | 0.0% |
| Venezuelan | 1,428 | 1.2% |
| Welsh | 1,499 | 1.3% |
| Yugoslavian | 228 | 0.2% | View All 122 Rows |
Immigrants in West Jordan
The most numerous immigrant groups reported in West Jordan came from Latin America (9,938 | 8.5%), Central America (6,295 | 5.4%), Mexico (5,412 | 4.6%), South America (3,447 | 3.0%), and Asia (2,345 | 2.0%), together accounting for 23.6% of all West Jordan residents.
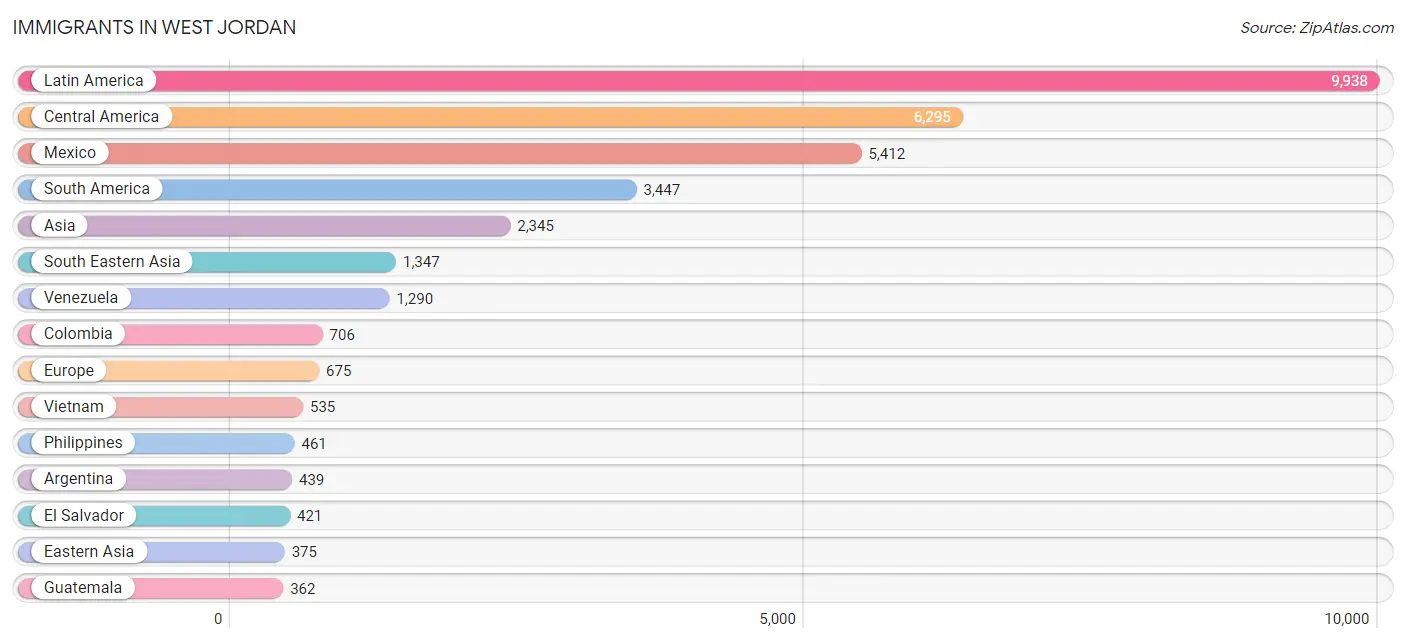
| Immigration Origin | # Population | % Population |
| Africa | 116 | 0.1% |
| Albania | 10 | 0.0% |
| Argentina | 439 | 0.4% |
| Armenia | 83 | 0.1% |
| Asia | 2,345 | 2.0% |
| Australia | 24 | 0.0% |
| Bolivia | 99 | 0.1% |
| Bosnia and Herzegovina | 37 | 0.0% |
| Brazil | 144 | 0.1% |
| Cambodia | 137 | 0.1% |
| Canada | 263 | 0.2% |
| Caribbean | 196 | 0.2% |
| Central America | 6,295 | 5.4% |
| Chile | 269 | 0.2% |
| China | 128 | 0.1% |
| Colombia | 706 | 0.6% |
| Costa Rica | 30 | 0.0% |
| Croatia | 10 | 0.0% |
| Denmark | 17 | 0.0% |
| Eastern Africa | 51 | 0.0% |
| Eastern Asia | 375 | 0.3% |
| Eastern Europe | 186 | 0.2% |
| Ecuador | 177 | 0.2% |
| El Salvador | 421 | 0.4% |
| England | 107 | 0.1% |
| Europe | 675 | 0.6% |
| France | 69 | 0.1% |
| Germany | 98 | 0.1% |
| Ghana | 13 | 0.0% |
| Greece | 20 | 0.0% |
| Guatemala | 362 | 0.3% |
| Honduras | 35 | 0.0% |
| India | 150 | 0.1% |
| Indonesia | 31 | 0.0% |
| Iran | 46 | 0.0% |
| Iraq | 51 | 0.0% |
| Italy | 9 | 0.0% |
| Jamaica | 147 | 0.1% |
| Japan | 92 | 0.1% |
| Kazakhstan | 83 | 0.1% |
| Korea | 152 | 0.1% |
| Kuwait | 67 | 0.1% |
| Laos | 155 | 0.1% |
| Latin America | 9,938 | 8.5% |
| Lebanon | 16 | 0.0% |
| Lithuania | 13 | 0.0% |
| Malaysia | 14 | 0.0% |
| Mexico | 5,412 | 4.6% |
| Middle Africa | 16 | 0.0% |
| Netherlands | 47 | 0.0% |
| Nicaragua | 13 | 0.0% |
| Northern Africa | 11 | 0.0% |
| Northern Europe | 158 | 0.1% |
| Oceania | 319 | 0.3% |
| Panama | 22 | 0.0% |
| Peru | 237 | 0.2% |
| Philippines | 461 | 0.4% |
| Poland | 11 | 0.0% |
| Portugal | 20 | 0.0% |
| Romania | 28 | 0.0% |
| Russia | 7 | 0.0% |
| Scotland | 8 | 0.0% |
| Serbia | 21 | 0.0% |
| Sierra Leone | 25 | 0.0% |
| South America | 3,447 | 3.0% |
| South Central Asia | 279 | 0.2% |
| South Eastern Asia | 1,347 | 1.2% |
| Southern Europe | 109 | 0.1% |
| Spain | 60 | 0.1% |
| Switzerland | 8 | 0.0% |
| Syria | 101 | 0.1% |
| Taiwan | 37 | 0.0% |
| Thailand | 5 | 0.0% |
| Trinidad and Tobago | 49 | 0.0% |
| Turkey | 26 | 0.0% |
| Ukraine | 25 | 0.0% |
| Uruguay | 54 | 0.1% |
| Venezuela | 1,290 | 1.1% |
| Vietnam | 535 | 0.5% |
| Western Africa | 38 | 0.0% |
| Western Asia | 344 | 0.3% |
| Western Europe | 222 | 0.2% |
| Zaire | 16 | 0.0% | View All 83 Rows |
Sex and Age in West Jordan
Sex and Age in West Jordan
The most populous age groups in West Jordan are 10 to 14 Years (6,067 | 10.1%) for men and 10 to 14 Years (5,385 | 9.6%) for women.
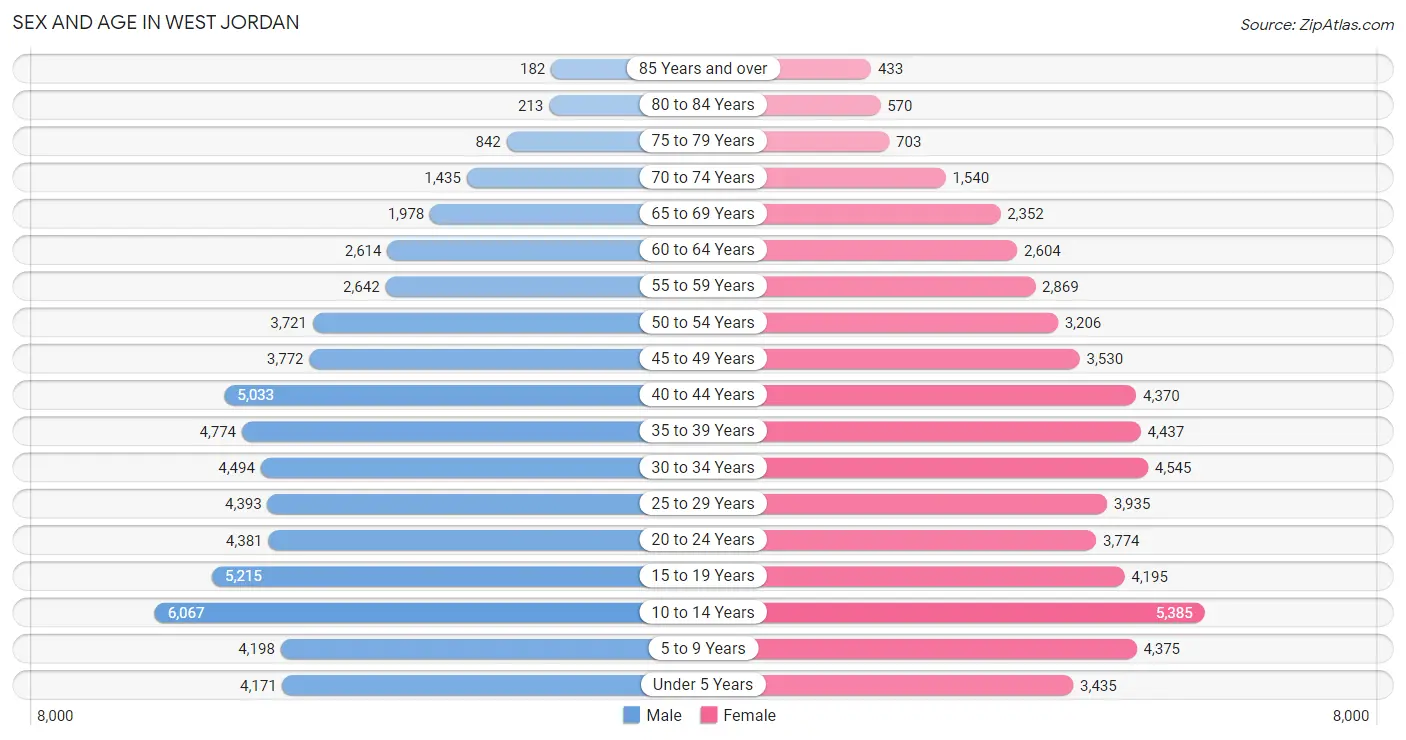
| Age Bracket | Male | Female |
| Under 5 Years | 4,171 (6.9%) | 3,435 (6.1%) |
| 5 to 9 Years | 4,198 (7.0%) | 4,375 (7.8%) |
| 10 to 14 Years | 6,067 (10.1%) | 5,385 (9.6%) |
| 15 to 19 Years | 5,215 (8.7%) | 4,195 (7.5%) |
| 20 to 24 Years | 4,381 (7.3%) | 3,774 (6.7%) |
| 25 to 29 Years | 4,393 (7.3%) | 3,935 (7.0%) |
| 30 to 34 Years | 4,494 (7.5%) | 4,545 (8.1%) |
| 35 to 39 Years | 4,774 (7.9%) | 4,437 (7.9%) |
| 40 to 44 Years | 5,033 (8.4%) | 4,370 (7.8%) |
| 45 to 49 Years | 3,772 (6.3%) | 3,530 (6.3%) |
| 50 to 54 Years | 3,721 (6.2%) | 3,206 (5.7%) |
| 55 to 59 Years | 2,642 (4.4%) | 2,869 (5.1%) |
| 60 to 64 Years | 2,614 (4.3%) | 2,604 (4.6%) |
| 65 to 69 Years | 1,978 (3.3%) | 2,352 (4.2%) |
| 70 to 74 Years | 1,435 (2.4%) | 1,540 (2.7%) |
| 75 to 79 Years | 842 (1.4%) | 703 (1.3%) |
| 80 to 84 Years | 213 (0.4%) | 570 (1.0%) |
| 85 Years and over | 182 (0.3%) | 433 (0.8%) |
| Total | 60,125 (100.0%) | 56,258 (100.0%) |
Families and Households in West Jordan
Median Family Size in West Jordan
The median family size in West Jordan is 3.57 persons per family, with married-couple families (23,107 | 80.1%) accounting for the largest median family size of 3.66 persons per family. On the other hand, single male/father families (2,049 | 7.1%) represent the smallest median family size with 3.01 persons per family.
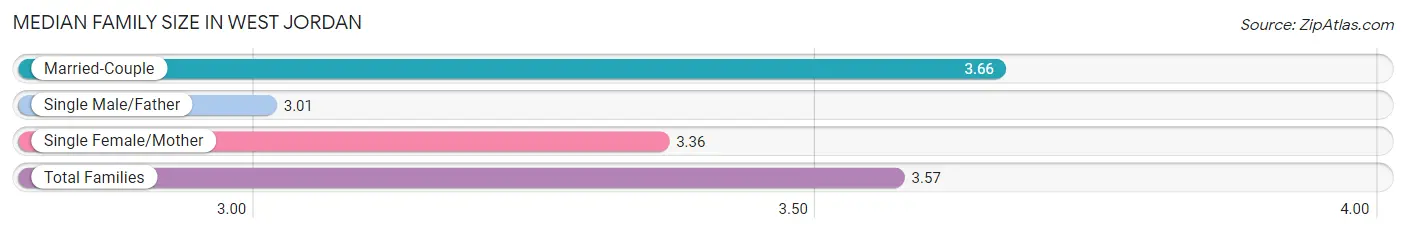
| Family Type | # Families | Family Size |
| Married-Couple | 23,107 (80.1%) | 3.66 |
| Single Male/Father | 2,049 (7.1%) | 3.01 |
| Single Female/Mother | 3,697 (12.8%) | 3.36 |
| Total Families | 28,853 (100.0%) | 3.57 |
Median Household Size in West Jordan
The median household size in West Jordan is 3.22 persons per household, with married-couple households (23,107 | 64.2%) accounting for the largest median household size of 3.72 persons per household. non-family households (7,123 | 19.8%) represent the smallest median household size with 1.37 persons per household.
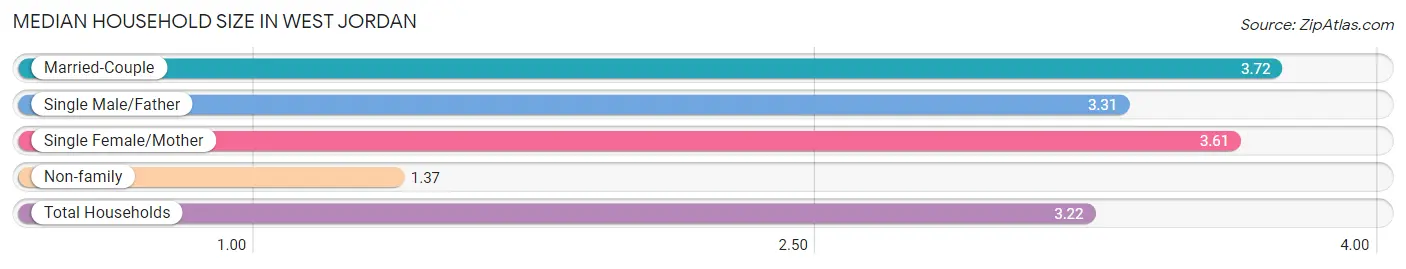
| Household Type | # Households | Household Size |
| Married-Couple | 23,107 (64.2%) | 3.72 |
| Single Male/Father | 2,049 (5.7%) | 3.31 |
| Single Female/Mother | 3,697 (10.3%) | 3.61 |
| Non-family | 7,123 (19.8%) | 1.37 |
| Total Households | 35,976 (100.0%) | 3.22 |
Household Size by Marriage Status in West Jordan
Out of a total of 35,976 households in West Jordan, 28,853 (80.2%) are family households, while 7,123 (19.8%) are nonfamily households. The most numerous type of family households are 2-person households, comprising 8,708, and the most common type of nonfamily households are 1-person households, comprising 5,309.
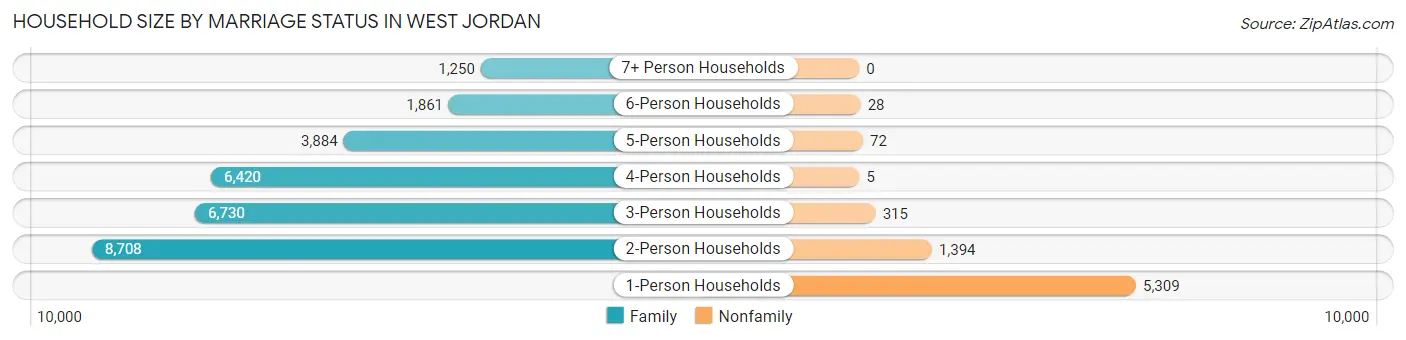
| Household Size | Family Households | Nonfamily Households |
| 1-Person Households | - | 5,309 (14.8%) |
| 2-Person Households | 8,708 (24.2%) | 1,394 (3.9%) |
| 3-Person Households | 6,730 (18.7%) | 315 (0.9%) |
| 4-Person Households | 6,420 (17.8%) | 5 (0.0%) |
| 5-Person Households | 3,884 (10.8%) | 72 (0.2%) |
| 6-Person Households | 1,861 (5.2%) | 28 (0.1%) |
| 7+ Person Households | 1,250 (3.5%) | 0 (0.0%) |
| Total | 28,853 (80.2%) | 7,123 (19.8%) |
Female Fertility in West Jordan
Fertility by Age in West Jordan
Average fertility rate in West Jordan is 44.0 births per 1,000 women. Women in the age bracket of 20 to 34 years have the highest fertility rate with 87.0 births per 1,000 women. Women in the age bracket of 20 to 34 years acount for 81.4% of all women with births.
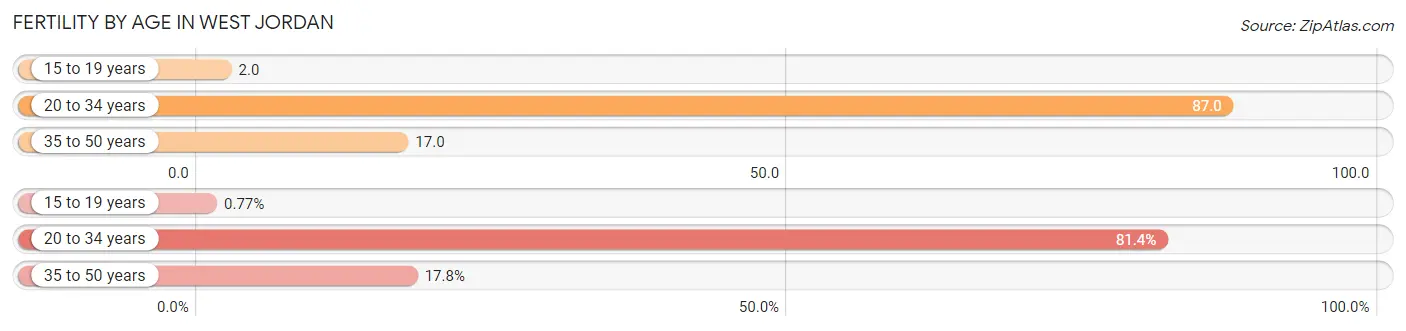
| Age Bracket | Women with Births | Births / 1,000 Women |
| 15 to 19 years | 10 (0.8%) | 2.0 |
| 20 to 34 years | 1,062 (81.4%) | 87.0 |
| 35 to 50 years | 232 (17.8%) | 17.0 |
| Total | 1,304 (100.0%) | 44.0 |
Fertility by Age by Marriage Status in West Jordan
81.1% of women with births (1,304) in West Jordan are married. The highest percentage of unmarried women with births falls into 20 to 34 years age bracket with 20.0% of them unmarried at the time of birth, while the lowest percentage of unmarried women with births belong to 15 to 19 years age bracket with 0.0% of them unmarried.
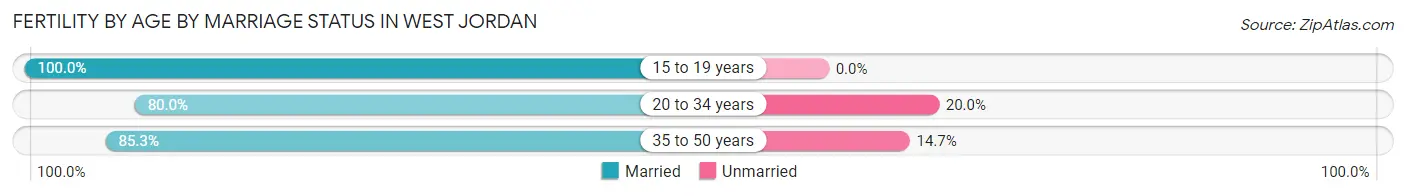
| Age Bracket | Married | Unmarried |
| 15 to 19 years | 10 (100.0%) | 0 (0.0%) |
| 20 to 34 years | 850 (80.0%) | 212 (20.0%) |
| 35 to 50 years | 198 (85.3%) | 34 (14.7%) |
| Total | 1,058 (81.1%) | 246 (18.9%) |
Fertility by Education in West Jordan
Average fertility rate in West Jordan is 44.0 births per 1,000 women. Women with the education attainment of bachelor's degree have the highest fertility rate of 56.0 births per 1,000 women, while women with the education attainment of less than high school have the lowest fertility at 12.0 births per 1,000 women. Women with the education attainment of college or associate's degree represent 38.3% of all women with births.
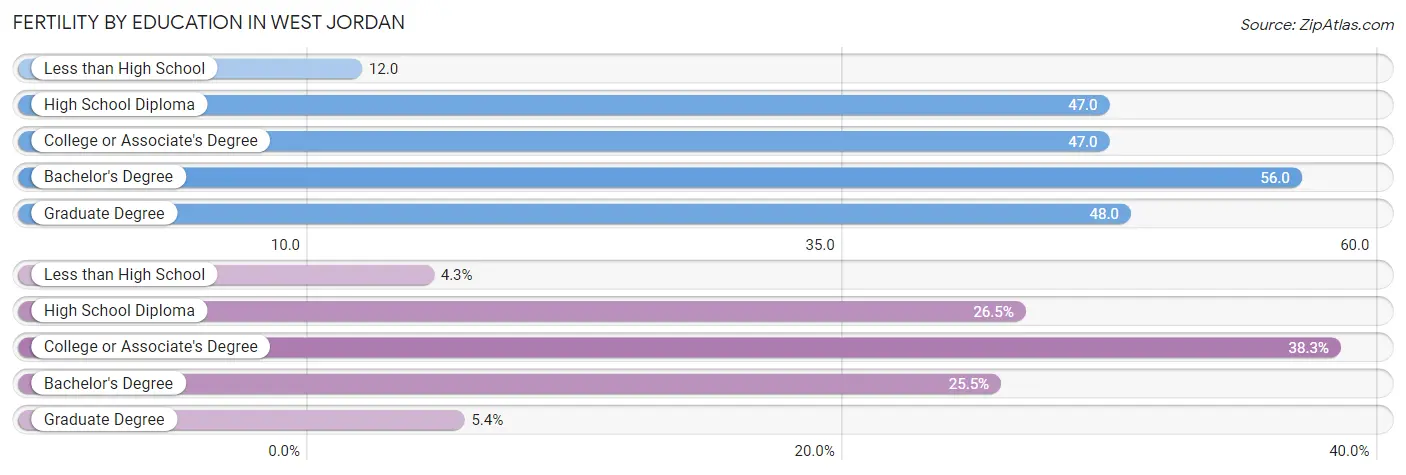
| Educational Attainment | Women with Births | Births / 1,000 Women |
| Less than High School | 56 (4.3%) | 12.0 |
| High School Diploma | 345 (26.5%) | 47.0 |
| College or Associate's Degree | 499 (38.3%) | 47.0 |
| Bachelor's Degree | 333 (25.5%) | 56.0 |
| Graduate Degree | 71 (5.4%) | 48.0 |
| Total | 1,304 (100.0%) | 44.0 |
Fertility by Education by Marriage Status in West Jordan
18.9% of women with births in West Jordan are unmarried. Women with the educational attainment of graduate degree are most likely to be married with 100.0% of them married at childbirth, while women with the educational attainment of less than high school are least likely to be married with 51.8% of them unmarried at childbirth.
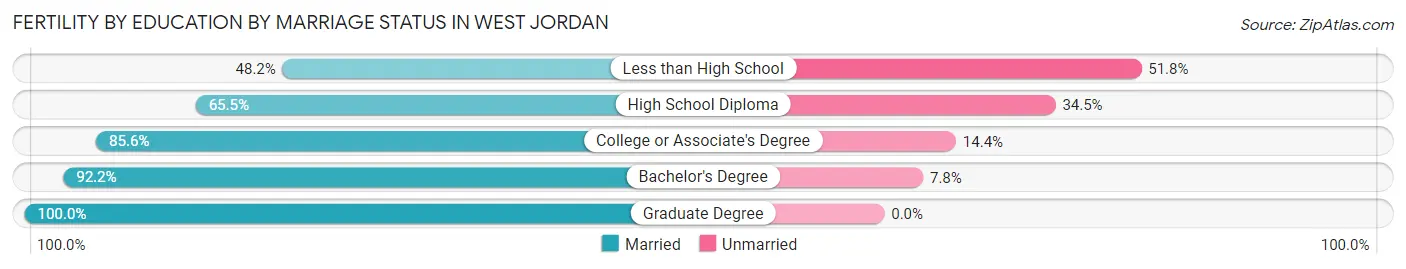
| Educational Attainment | Married | Unmarried |
| Less than High School | 27 (48.2%) | 29 (51.8%) |
| High School Diploma | 226 (65.5%) | 119 (34.5%) |
| College or Associate's Degree | 427 (85.6%) | 72 (14.4%) |
| Bachelor's Degree | 307 (92.2%) | 26 (7.8%) |
| Graduate Degree | 71 (100.0%) | 0 (0.0%) |
| Total | 1,058 (81.1%) | 246 (18.9%) |
Employment Characteristics in West Jordan
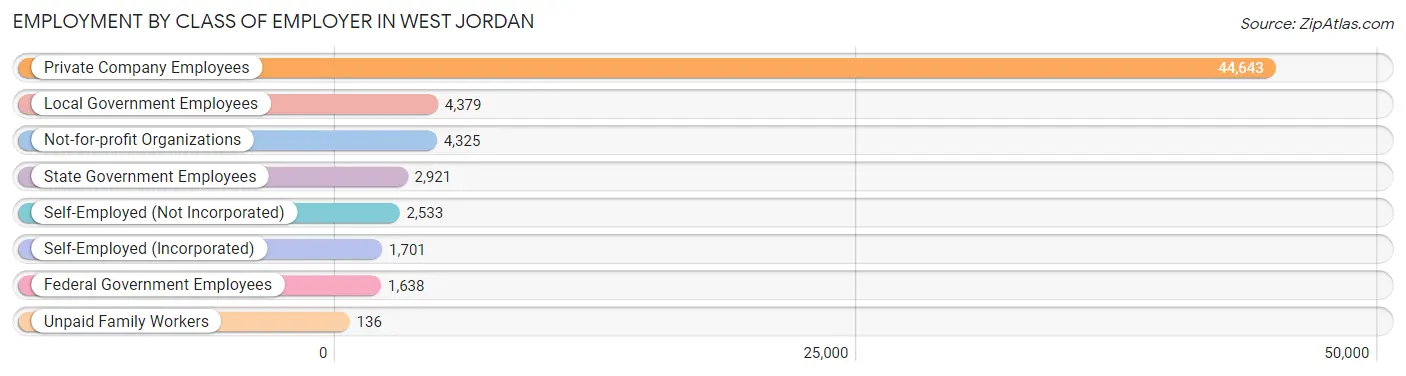
Employment by Class of Employer in West Jordan
Among the 62,276 employed individuals in West Jordan, private company employees (44,643 | 71.7%), local government employees (4,379 | 7.0%), and not-for-profit organizations (4,325 | 6.9%) make up the most common classes of employment.
| Employer Class | # Employees | % Employees |
| Private Company Employees | 44,643 | 71.7% |
| Self-Employed (Incorporated) | 1,701 | 2.7% |
| Self-Employed (Not Incorporated) | 2,533 | 4.1% |
| Not-for-profit Organizations | 4,325 | 6.9% |
| Local Government Employees | 4,379 | 7.0% |
| State Government Employees | 2,921 | 4.7% |
| Federal Government Employees | 1,638 | 2.6% |
| Unpaid Family Workers | 136 | 0.2% |
| Total | 62,276 | 100.0% |
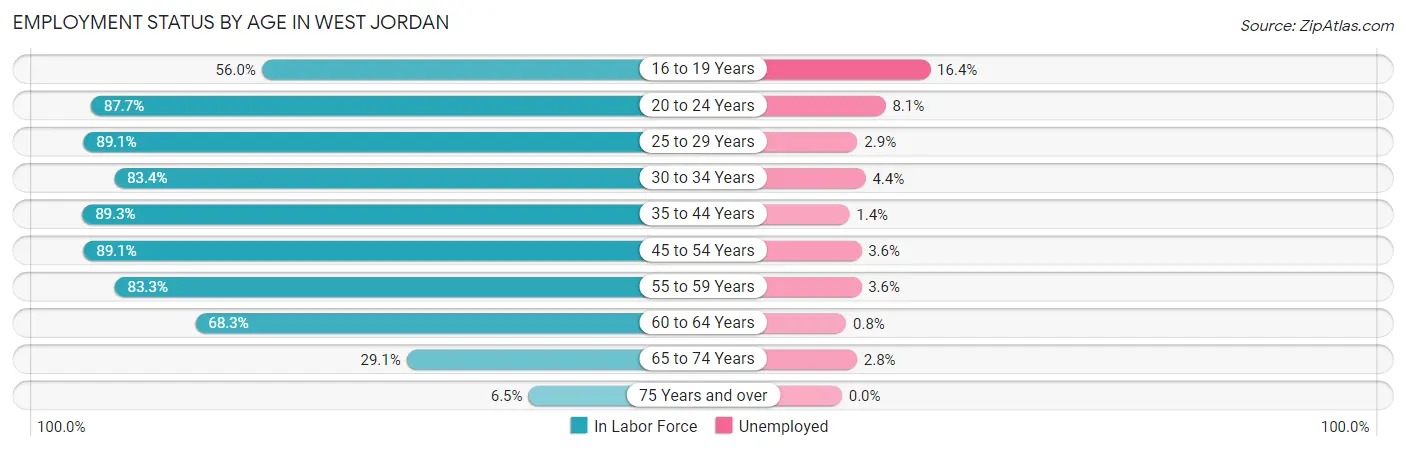
Employment Status by Age in West Jordan
According to the labor force statistics for West Jordan, out of the total population over 16 years of age (86,806), 76.1% or 66,059 individuals are in the labor force, with 4.2% or 2,774 of them unemployed. The age group with the highest labor force participation rate is 35 to 44 years, with 89.3% or 16,622 individuals in the labor force. Within the labor force, the 16 to 19 years age range has the highest percentage of unemployed individuals, with 16.4% or 686 of them being unemployed.
| Age Bracket | In Labor Force | Unemployed |
| 16 to 19 Years | 4,180 (56.0%) | 686 (16.4%) |
| 20 to 24 Years | 7,152 (87.7%) | 579 (8.1%) |
| 25 to 29 Years | 7,420 (89.1%) | 215 (2.9%) |
| 30 to 34 Years | 7,539 (83.4%) | 332 (4.4%) |
| 35 to 44 Years | 16,622 (89.3%) | 233 (1.4%) |
| 45 to 54 Years | 12,678 (89.1%) | 456 (3.6%) |
| 55 to 59 Years | 4,591 (83.3%) | 165 (3.6%) |
| 60 to 64 Years | 3,564 (68.3%) | 29 (0.8%) |
| 65 to 74 Years | 2,126 (29.1%) | 60 (2.8%) |
| 75 Years and over | 191 (6.5%) | 0 (0.0%) |
| Total | 66,059 (76.1%) | 2,774 (4.2%) |
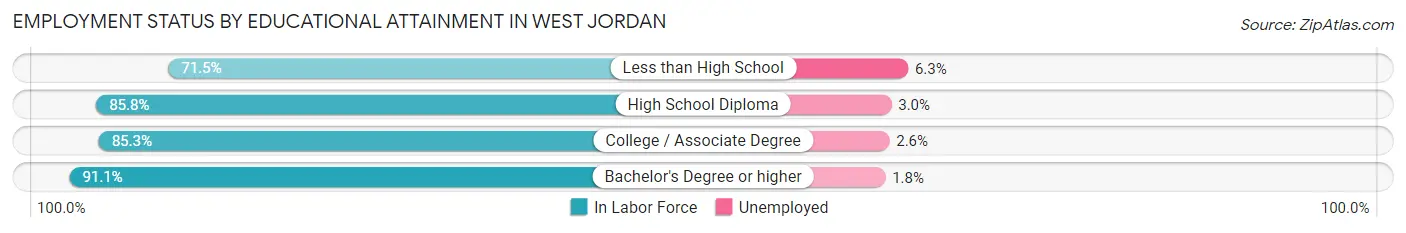
Employment Status by Educational Attainment in West Jordan
According to labor force statistics for West Jordan, 86.0% of individuals (52,408) out of the total population between 25 and 64 years of age (60,939) are in the labor force, with 2.7% or 1,415 of them being unemployed. The group with the highest labor force participation rate are those with the educational attainment of bachelor's degree or higher, with 91.1% or 15,935 individuals in the labor force. Within the labor force, individuals with less than high school education have the highest percentage of unemployment, with 6.3% or 214 of them being unemployed.
| Educational Attainment | In Labor Force | Unemployed |
| Less than High School | 3,401 (71.5%) | 300 (6.3%) |
| High School Diploma | 14,099 (85.8%) | 493 (3.0%) |
| College / Associate Degree | 18,986 (85.3%) | 579 (2.6%) |
| Bachelor's Degree or higher | 15,935 (91.1%) | 315 (1.8%) |
| Total | 52,408 (86.0%) | 1,645 (2.7%) |
Employment Occupations by Sex in West Jordan
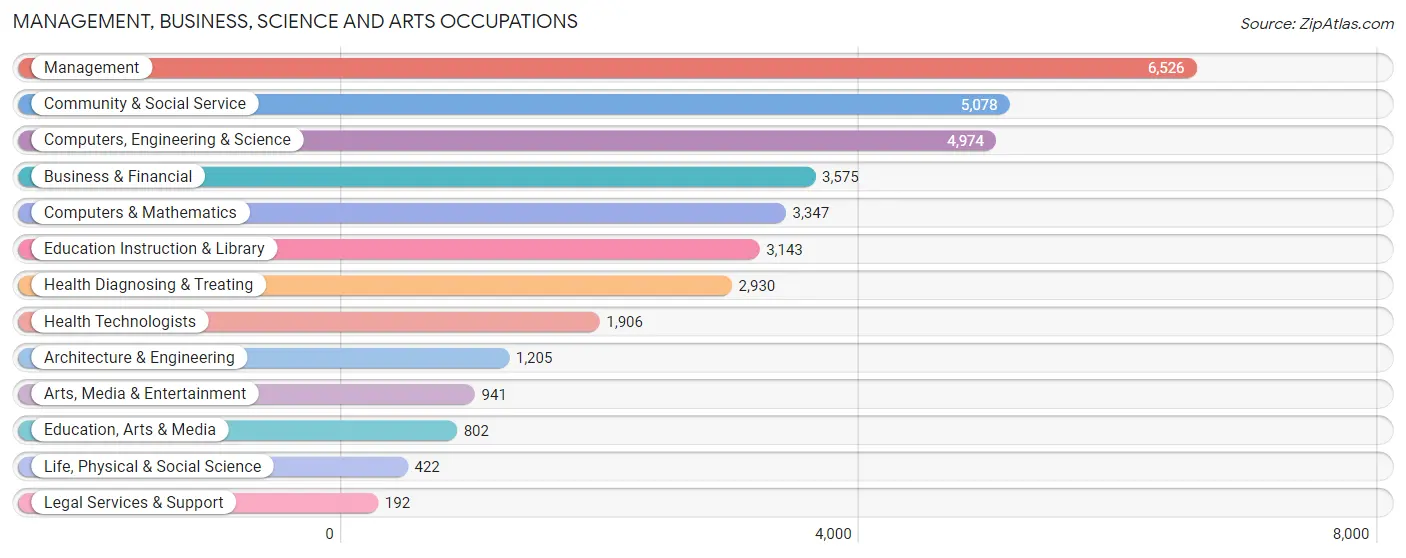
Management, Business, Science and Arts Occupations
The most common Management, Business, Science and Arts occupations in West Jordan are Management (6,526 | 10.3%), Community & Social Service (5,078 | 8.0%), Computers, Engineering & Science (4,974 | 7.9%), Business & Financial (3,575 | 5.7%), and Computers & Mathematics (3,347 | 5.3%).
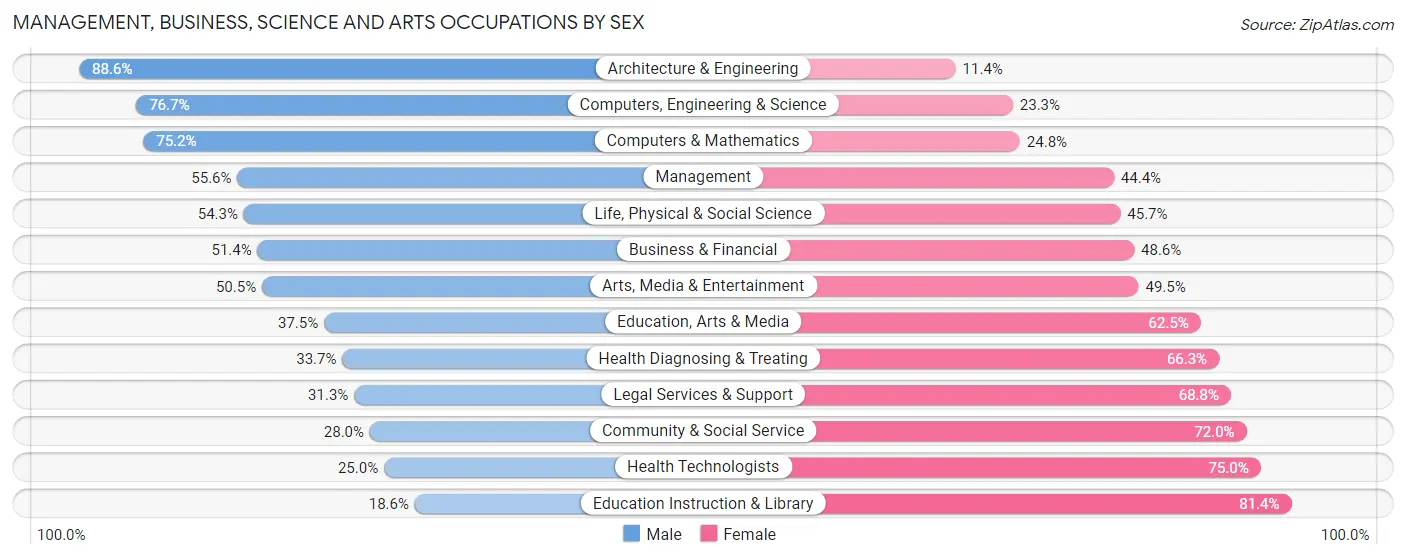
Management, Business, Science and Arts Occupations by Sex
Within the Management, Business, Science and Arts occupations in West Jordan, the most male-oriented occupations are Architecture & Engineering (88.6%), Computers, Engineering & Science (76.7%), and Computers & Mathematics (75.2%), while the most female-oriented occupations are Education Instruction & Library (81.4%), Health Technologists (75.0%), and Community & Social Service (72.0%).
| Occupation | Male | Female |
| Management | 3,630 (55.6%) | 2,896 (44.4%) |
| Business & Financial | 1,838 (51.4%) | 1,737 (48.6%) |
| Computers, Engineering & Science | 3,815 (76.7%) | 1,159 (23.3%) |
| Computers & Mathematics | 2,518 (75.2%) | 829 (24.8%) |
| Architecture & Engineering | 1,068 (88.6%) | 137 (11.4%) |
| Life, Physical & Social Science | 229 (54.3%) | 193 (45.7%) |
| Community & Social Service | 1,421 (28.0%) | 3,657 (72.0%) |
| Education, Arts & Media | 301 (37.5%) | 501 (62.5%) |
| Legal Services & Support | 60 (31.2%) | 132 (68.8%) |
| Education Instruction & Library | 585 (18.6%) | 2,558 (81.4%) |
| Arts, Media & Entertainment | 475 (50.5%) | 466 (49.5%) |
| Health Diagnosing & Treating | 988 (33.7%) | 1,942 (66.3%) |
| Health Technologists | 477 (25.0%) | 1,429 (75.0%) |
| Total (Category) | 11,692 (50.6%) | 11,391 (49.3%) |
| Total (Overall) | 35,075 (55.5%) | 28,134 (44.5%) |
Services Occupations
The most common Services occupations in West Jordan are Food Preparation & Serving (2,397 | 3.8%), Personal Care & Service (1,850 | 2.9%), Cleaning & Maintenance (1,672 | 2.6%), Healthcare Support (1,569 | 2.5%), and Security & Protection (1,448 | 2.3%).

Services Occupations by Sex
Within the Services occupations in West Jordan, the most male-oriented occupations are Law Enforcement (93.0%), Security & Protection (88.6%), and Firefighting & Prevention (85.4%), while the most female-oriented occupations are Healthcare Support (73.9%), Personal Care & Service (71.7%), and Food Preparation & Serving (59.2%).
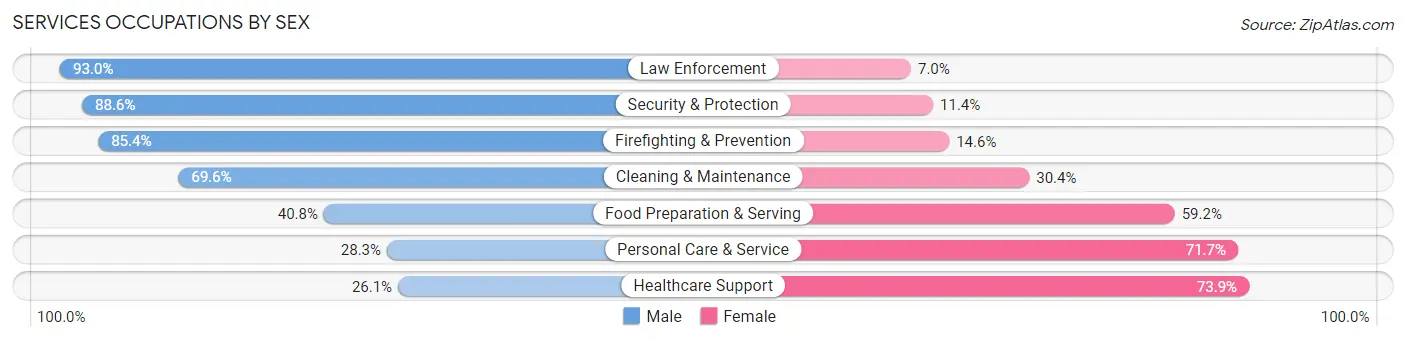
| Occupation | Male | Female |
| Healthcare Support | 409 (26.1%) | 1,160 (73.9%) |
| Security & Protection | 1,283 (88.6%) | 165 (11.4%) |
| Firefighting & Prevention | 714 (85.4%) | 122 (14.6%) |
| Law Enforcement | 569 (93.0%) | 43 (7.0%) |
| Food Preparation & Serving | 977 (40.8%) | 1,420 (59.2%) |
| Cleaning & Maintenance | 1,163 (69.6%) | 509 (30.4%) |
| Personal Care & Service | 523 (28.3%) | 1,327 (71.7%) |
| Total (Category) | 4,355 (48.7%) | 4,581 (51.3%) |
| Total (Overall) | 35,075 (55.5%) | 28,134 (44.5%) |
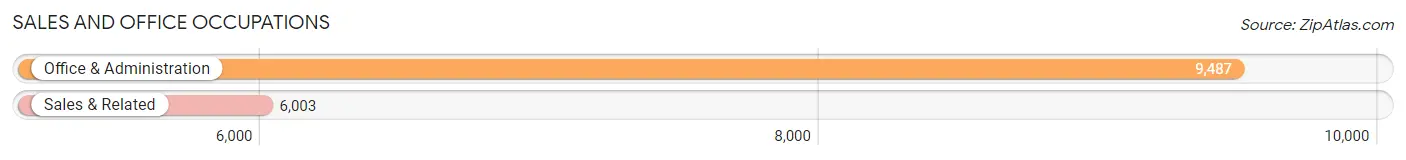
Sales and Office Occupations
The most common Sales and Office occupations in West Jordan are Office & Administration (9,487 | 15.0%), and Sales & Related (6,003 | 9.5%).
Sales and Office Occupations by Sex
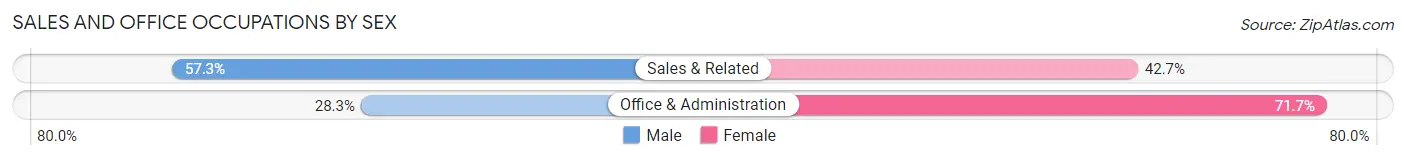
| Occupation | Male | Female |
| Sales & Related | 3,442 (57.3%) | 2,561 (42.7%) |
| Office & Administration | 2,683 (28.3%) | 6,804 (71.7%) |
| Total (Category) | 6,125 (39.5%) | 9,365 (60.5%) |
| Total (Overall) | 35,075 (55.5%) | 28,134 (44.5%) |
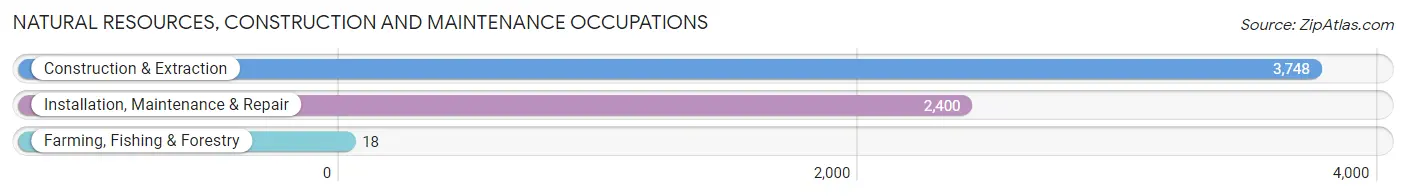
Natural Resources, Construction and Maintenance Occupations
The most common Natural Resources, Construction and Maintenance occupations in West Jordan are Construction & Extraction (3,748 | 5.9%), Installation, Maintenance & Repair (2,400 | 3.8%), and Farming, Fishing & Forestry (18 | 0.0%).
Natural Resources, Construction and Maintenance Occupations by Sex
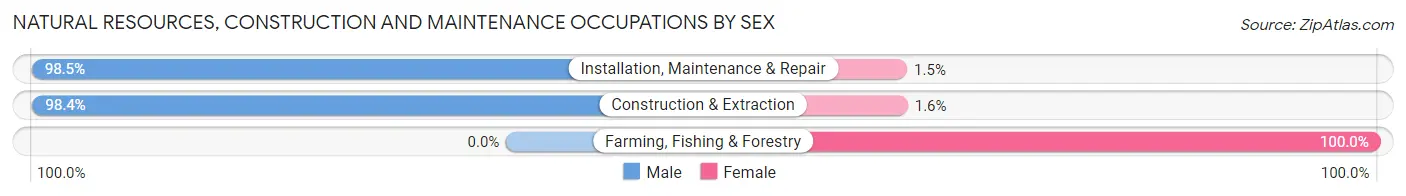
| Occupation | Male | Female |
| Farming, Fishing & Forestry | 0 (0.0%) | 18 (100.0%) |
| Construction & Extraction | 3,687 (98.4%) | 61 (1.6%) |
| Installation, Maintenance & Repair | 2,364 (98.5%) | 36 (1.5%) |
| Total (Category) | 6,051 (98.1%) | 115 (1.9%) |
| Total (Overall) | 35,075 (55.5%) | 28,134 (44.5%) |
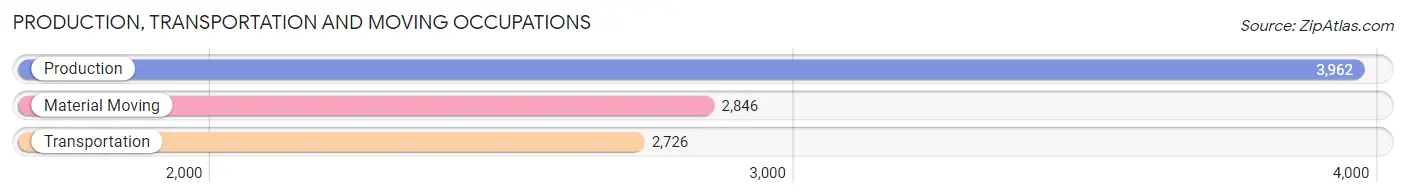
Production, Transportation and Moving Occupations
The most common Production, Transportation and Moving occupations in West Jordan are Production (3,962 | 6.3%), Material Moving (2,846 | 4.5%), and Transportation (2,726 | 4.3%).
Production, Transportation and Moving Occupations by Sex
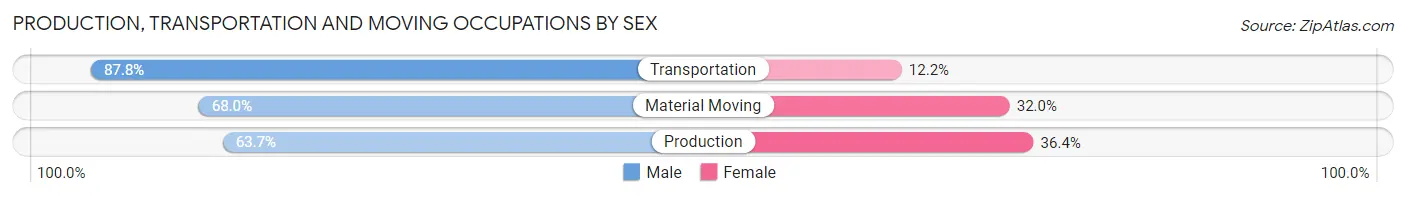
| Occupation | Male | Female |
| Production | 2,522 (63.6%) | 1,440 (36.3%) |
| Transportation | 2,394 (87.8%) | 332 (12.2%) |
| Material Moving | 1,936 (68.0%) | 910 (32.0%) |
| Total (Category) | 6,852 (71.9%) | 2,682 (28.1%) |
| Total (Overall) | 35,075 (55.5%) | 28,134 (44.5%) |
Employment Industries by Sex in West Jordan
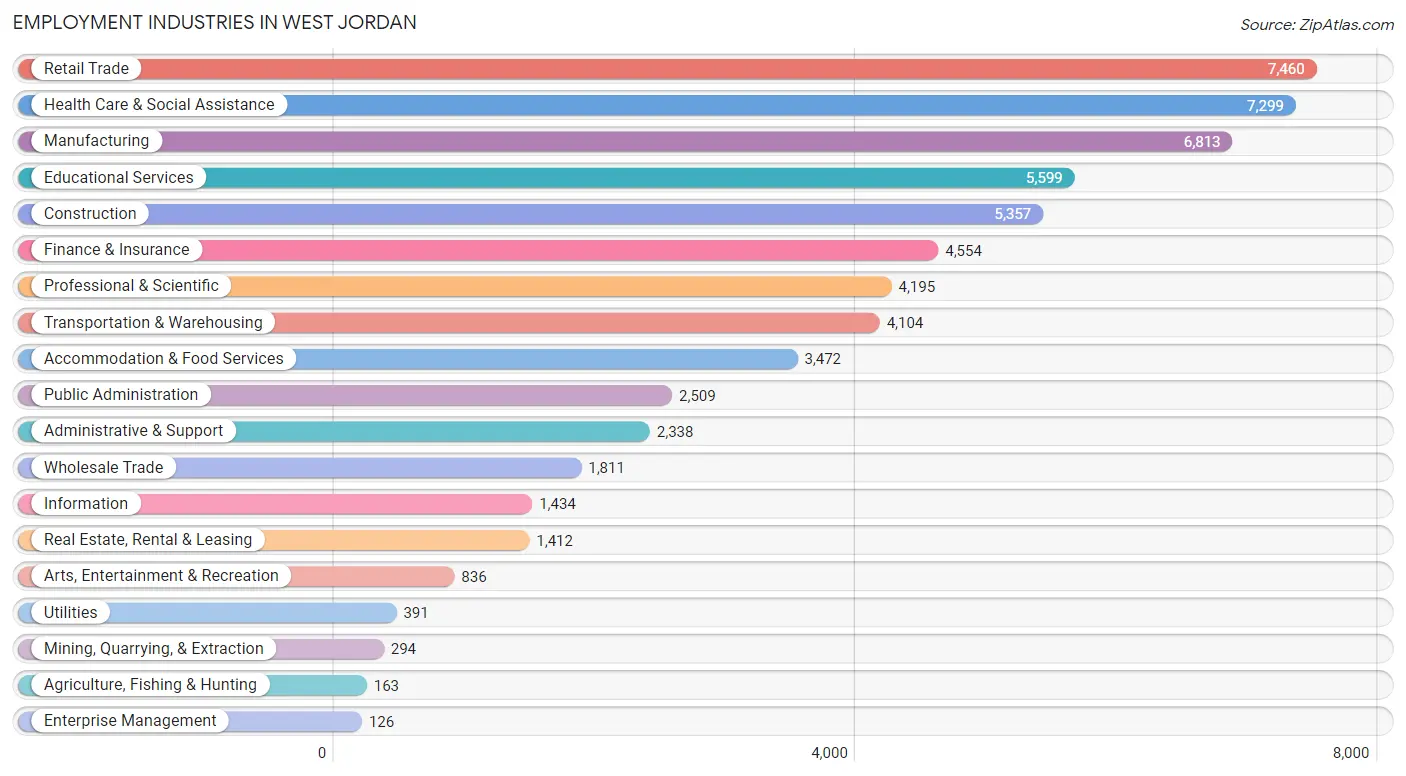
Employment Industries in West Jordan
The major employment industries in West Jordan include Retail Trade (7,460 | 11.8%), Health Care & Social Assistance (7,299 | 11.6%), Manufacturing (6,813 | 10.8%), Educational Services (5,599 | 8.9%), and Construction (5,357 | 8.5%).
Employment Industries by Sex in West Jordan
The West Jordan industries that see more men than women are Mining, Quarrying, & Extraction (94.6%), Enterprise Management (91.3%), and Construction (90.8%), whereas the industries that tend to have a higher number of women are Educational Services (79.6%), Health Care & Social Assistance (68.9%), and Finance & Insurance (58.4%).
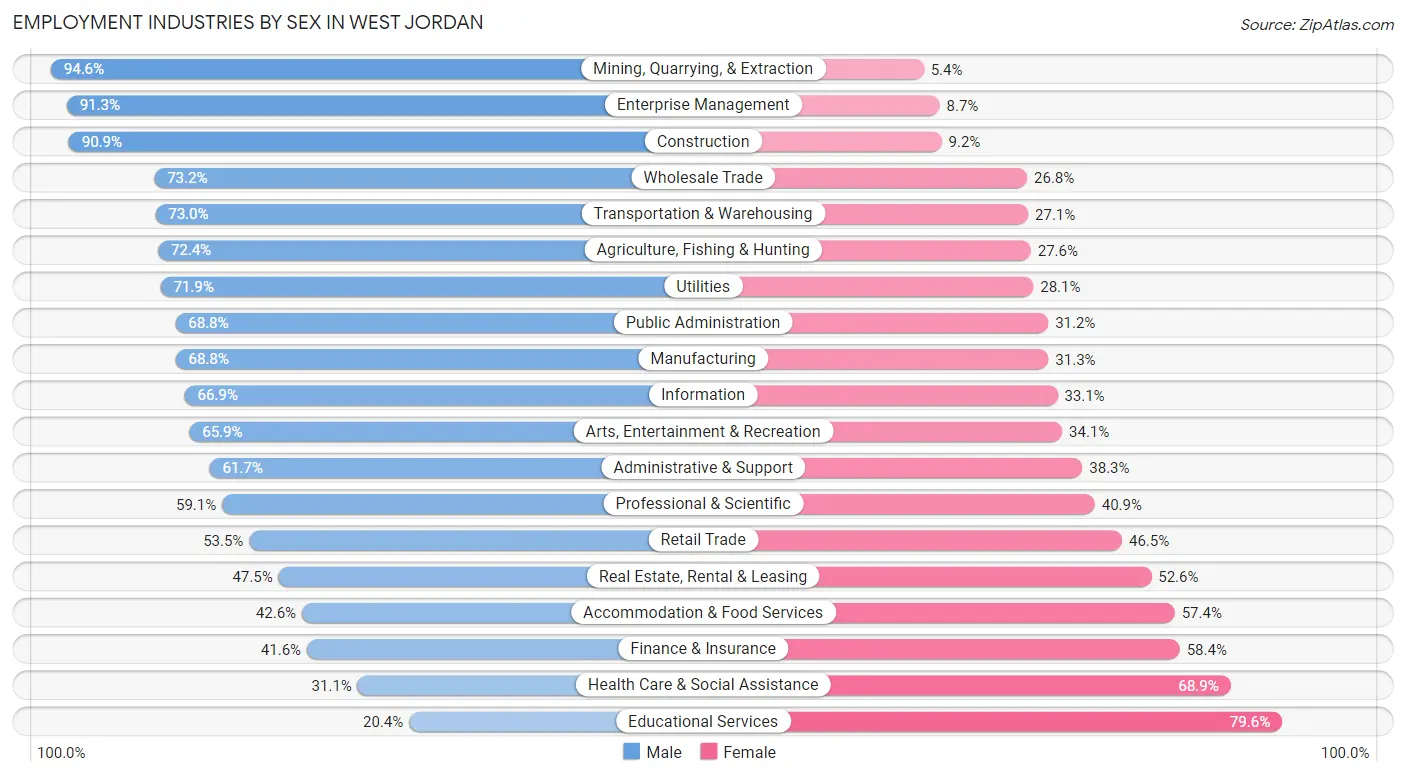
| Industry | Male | Female |
| Agriculture, Fishing & Hunting | 118 (72.4%) | 45 (27.6%) |
| Mining, Quarrying, & Extraction | 278 (94.6%) | 16 (5.4%) |
| Construction | 4,867 (90.8%) | 490 (9.1%) |
| Manufacturing | 4,684 (68.8%) | 2,129 (31.2%) |
| Wholesale Trade | 1,325 (73.2%) | 486 (26.8%) |
| Retail Trade | 3,992 (53.5%) | 3,468 (46.5%) |
| Transportation & Warehousing | 2,994 (73.0%) | 1,110 (27.1%) |
| Utilities | 281 (71.9%) | 110 (28.1%) |
| Information | 959 (66.9%) | 475 (33.1%) |
| Finance & Insurance | 1,893 (41.6%) | 2,661 (58.4%) |
| Real Estate, Rental & Leasing | 670 (47.4%) | 742 (52.5%) |
| Professional & Scientific | 2,481 (59.1%) | 1,714 (40.9%) |
| Enterprise Management | 115 (91.3%) | 11 (8.7%) |
| Administrative & Support | 1,443 (61.7%) | 895 (38.3%) |
| Educational Services | 1,143 (20.4%) | 4,456 (79.6%) |
| Health Care & Social Assistance | 2,267 (31.1%) | 5,032 (68.9%) |
| Arts, Entertainment & Recreation | 551 (65.9%) | 285 (34.1%) |
| Accommodation & Food Services | 1,479 (42.6%) | 1,993 (57.4%) |
| Public Administration | 1,726 (68.8%) | 783 (31.2%) |
| Total | 35,075 (55.5%) | 28,134 (44.5%) |
Education in West Jordan
School Enrollment in West Jordan
The most common levels of schooling among the 34,856 students in West Jordan are high school (9,039 | 25.9%), middle school (8,754 | 25.1%), and elementary school (7,340 | 21.1%).
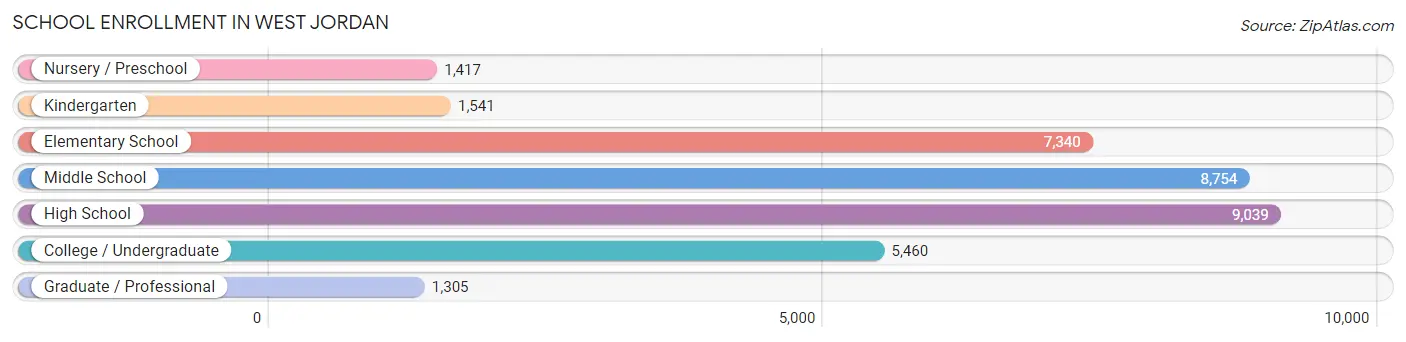
| School Level | # Students | % Students |
| Nursery / Preschool | 1,417 | 4.1% |
| Kindergarten | 1,541 | 4.4% |
| Elementary School | 7,340 | 21.1% |
| Middle School | 8,754 | 25.1% |
| High School | 9,039 | 25.9% |
| College / Undergraduate | 5,460 | 15.7% |
| Graduate / Professional | 1,305 | 3.7% |
| Total | 34,856 | 100.0% |
School Enrollment by Age by Funding Source in West Jordan
Out of a total of 34,856 students who are enrolled in schools in West Jordan, 3,172 (9.1%) attend a private institution, while the remaining 31,684 (90.9%) are enrolled in public schools. The age group of 3 to 4 year olds has the highest likelihood of being enrolled in private schools, with 367 (35.4% in the age bracket) enrolled. Conversely, the age group of 18 to 19 year olds has the lowest likelihood of being enrolled in a private school, with 2,306 (96.0% in the age bracket) attending a public institution.
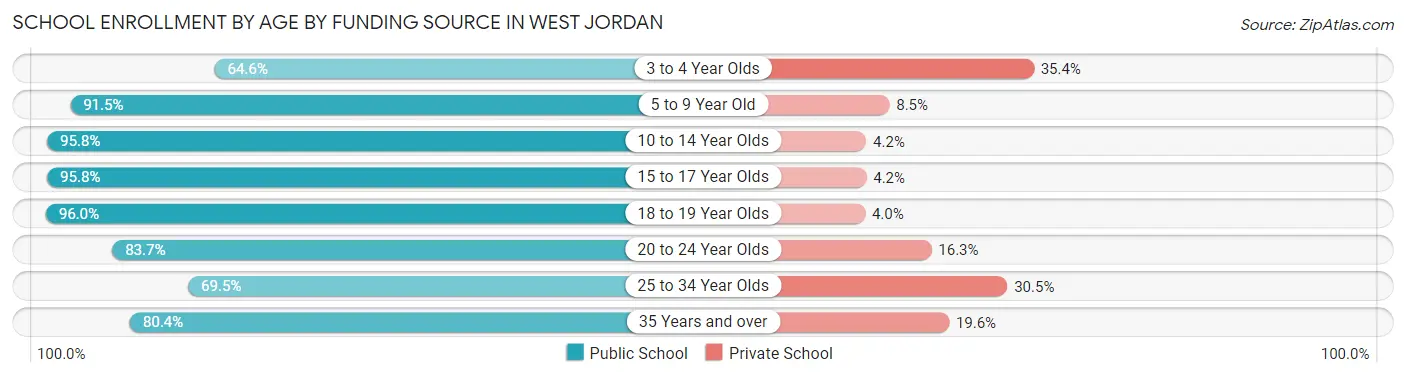
| Age Bracket | Public School | Private School |
| 3 to 4 Year Olds | 670 (64.6%) | 367 (35.4%) |
| 5 to 9 Year Old | 7,677 (91.5%) | 713 (8.5%) |
| 10 to 14 Year Olds | 10,824 (95.8%) | 473 (4.2%) |
| 15 to 17 Year Olds | 5,350 (95.8%) | 235 (4.2%) |
| 18 to 19 Year Olds | 2,306 (96.0%) | 95 (4.0%) |
| 20 to 24 Year Olds | 2,214 (83.7%) | 432 (16.3%) |
| 25 to 34 Year Olds | 1,175 (69.5%) | 515 (30.5%) |
| 35 Years and over | 1,455 (80.4%) | 355 (19.6%) |
| Total | 31,684 (90.9%) | 3,172 (9.1%) |
Educational Attainment by Field of Study in West Jordan
Business (4,842 | 22.8%), education (2,566 | 12.1%), science & technology (2,546 | 12.0%), social sciences (1,583 | 7.4%), and engineering (1,521 | 7.1%) are the most common fields of study among 21,280 individuals in West Jordan who have obtained a bachelor's degree or higher.
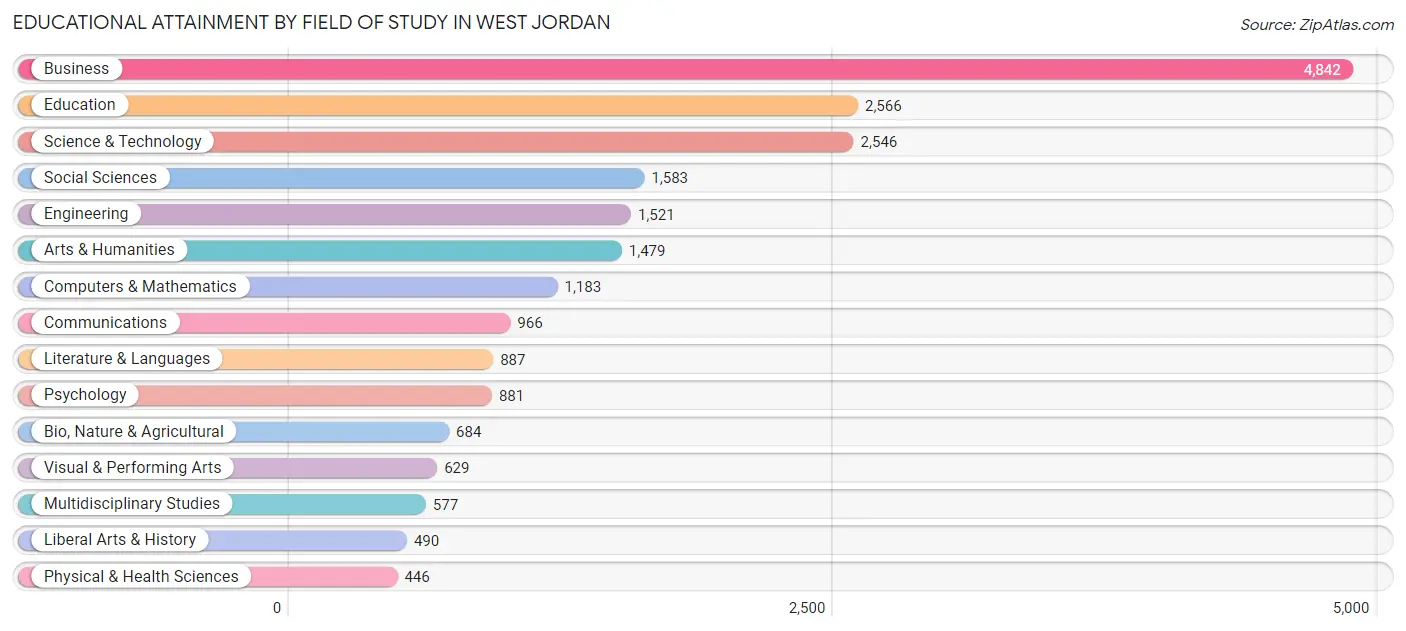
| Field of Study | # Graduates | % Graduates |
| Computers & Mathematics | 1,183 | 5.6% |
| Bio, Nature & Agricultural | 684 | 3.2% |
| Physical & Health Sciences | 446 | 2.1% |
| Psychology | 881 | 4.1% |
| Social Sciences | 1,583 | 7.4% |
| Engineering | 1,521 | 7.1% |
| Multidisciplinary Studies | 577 | 2.7% |
| Science & Technology | 2,546 | 12.0% |
| Business | 4,842 | 22.8% |
| Education | 2,566 | 12.1% |
| Literature & Languages | 887 | 4.2% |
| Liberal Arts & History | 490 | 2.3% |
| Visual & Performing Arts | 629 | 3.0% |
| Communications | 966 | 4.5% |
| Arts & Humanities | 1,479 | 7.0% |
| Total | 21,280 | 100.0% |
Transportation & Commute in West Jordan
Vehicle Availability by Sex in West Jordan
The most prevalent vehicle ownership categories in West Jordan are males with 2 vehicles (13,479, accounting for 38.9%) and females with 2 vehicles (10,002, making up 48.9%).
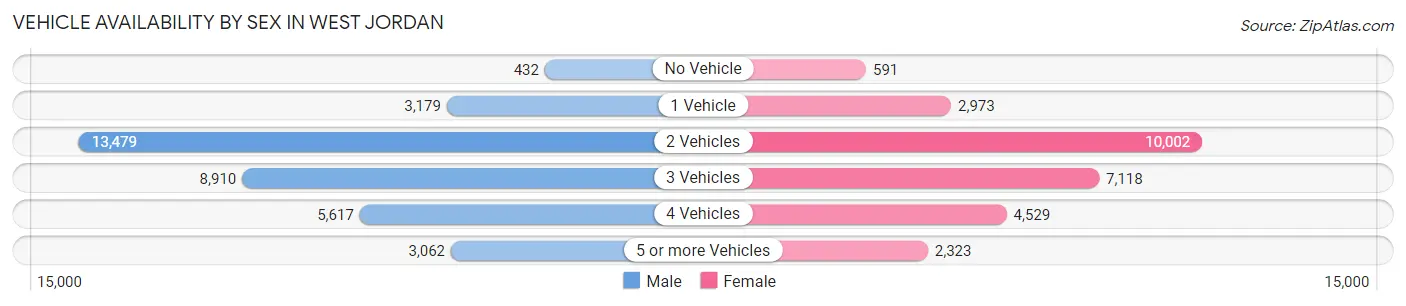
| Vehicles Available | Male | Female |
| No Vehicle | 432 (1.3%) | 591 (2.1%) |
| 1 Vehicle | 3,179 (9.2%) | 2,973 (10.8%) |
| 2 Vehicles | 13,479 (38.9%) | 10,002 (36.3%) |
| 3 Vehicles | 8,910 (25.7%) | 7,118 (25.9%) |
| 4 Vehicles | 5,617 (16.2%) | 4,529 (16.5%) |
| 5 or more Vehicles | 3,062 (8.8%) | 2,323 (8.4%) |
| Total | 34,679 (100.0%) | 27,536 (100.0%) |
Commute Time in West Jordan
The most frequently occuring commute durations in West Jordan are 20 to 24 minutes (11,222 commuters, 21.2%), 30 to 34 minutes (9,945 commuters, 18.8%), and 15 to 19 minutes (7,968 commuters, 15.1%).
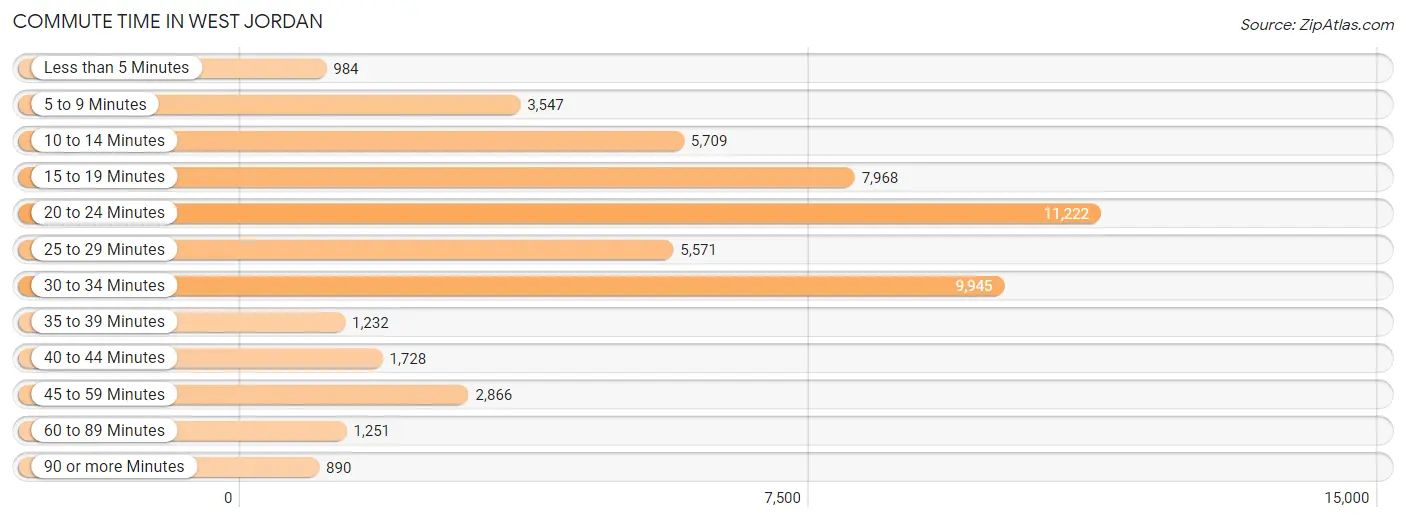
| Commute Time | # Commuters | % Commuters |
| Less than 5 Minutes | 984 | 1.9% |
| 5 to 9 Minutes | 3,547 | 6.7% |
| 10 to 14 Minutes | 5,709 | 10.8% |
| 15 to 19 Minutes | 7,968 | 15.1% |
| 20 to 24 Minutes | 11,222 | 21.2% |
| 25 to 29 Minutes | 5,571 | 10.5% |
| 30 to 34 Minutes | 9,945 | 18.8% |
| 35 to 39 Minutes | 1,232 | 2.3% |
| 40 to 44 Minutes | 1,728 | 3.3% |
| 45 to 59 Minutes | 2,866 | 5.4% |
| 60 to 89 Minutes | 1,251 | 2.4% |
| 90 or more Minutes | 890 | 1.7% |
Commute Time by Sex in West Jordan
The most common commute times in West Jordan are 20 to 24 minutes (6,576 commuters, 21.7%) for males and 20 to 24 minutes (4,646 commuters, 20.5%) for females.
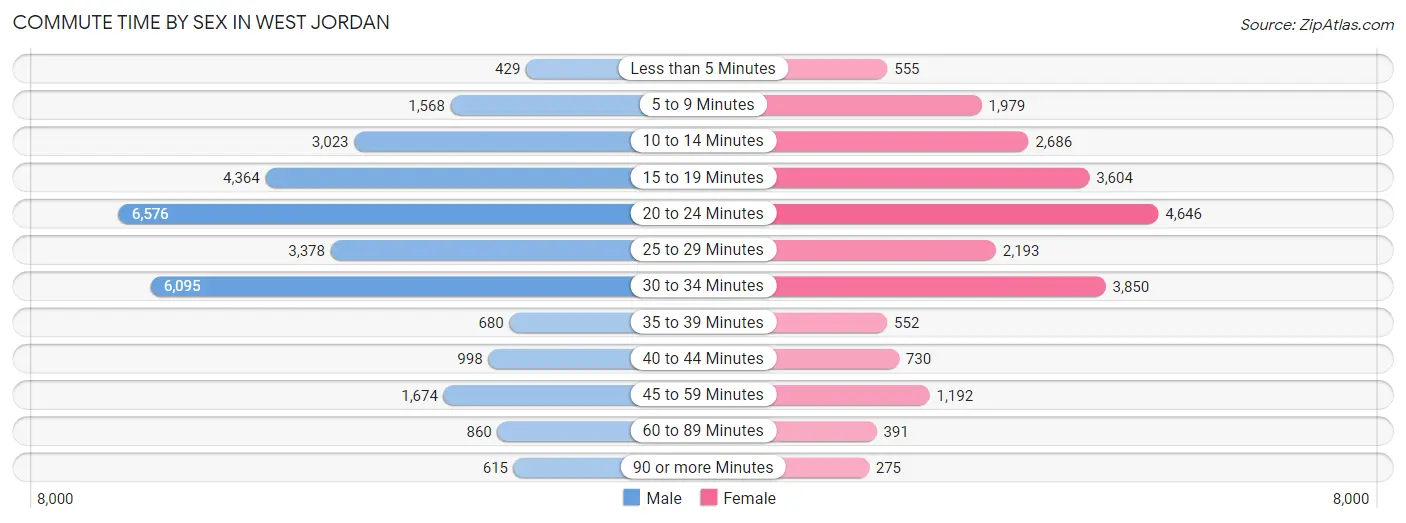
| Commute Time | Male | Female |
| Less than 5 Minutes | 429 (1.4%) | 555 (2.5%) |
| 5 to 9 Minutes | 1,568 (5.2%) | 1,979 (8.7%) |
| 10 to 14 Minutes | 3,023 (10.0%) | 2,686 (11.9%) |
| 15 to 19 Minutes | 4,364 (14.4%) | 3,604 (15.9%) |
| 20 to 24 Minutes | 6,576 (21.7%) | 4,646 (20.5%) |
| 25 to 29 Minutes | 3,378 (11.2%) | 2,193 (9.7%) |
| 30 to 34 Minutes | 6,095 (20.1%) | 3,850 (17.0%) |
| 35 to 39 Minutes | 680 (2.2%) | 552 (2.4%) |
| 40 to 44 Minutes | 998 (3.3%) | 730 (3.2%) |
| 45 to 59 Minutes | 1,674 (5.5%) | 1,192 (5.3%) |
| 60 to 89 Minutes | 860 (2.8%) | 391 (1.7%) |
| 90 or more Minutes | 615 (2.0%) | 275 (1.2%) |
Time of Departure to Work by Sex in West Jordan
The most frequent times of departure to work in West Jordan are 7:00 AM to 7:29 AM (3,909, 12.9%) for males and 7:00 AM to 7:29 AM (3,198, 14.1%) for females.
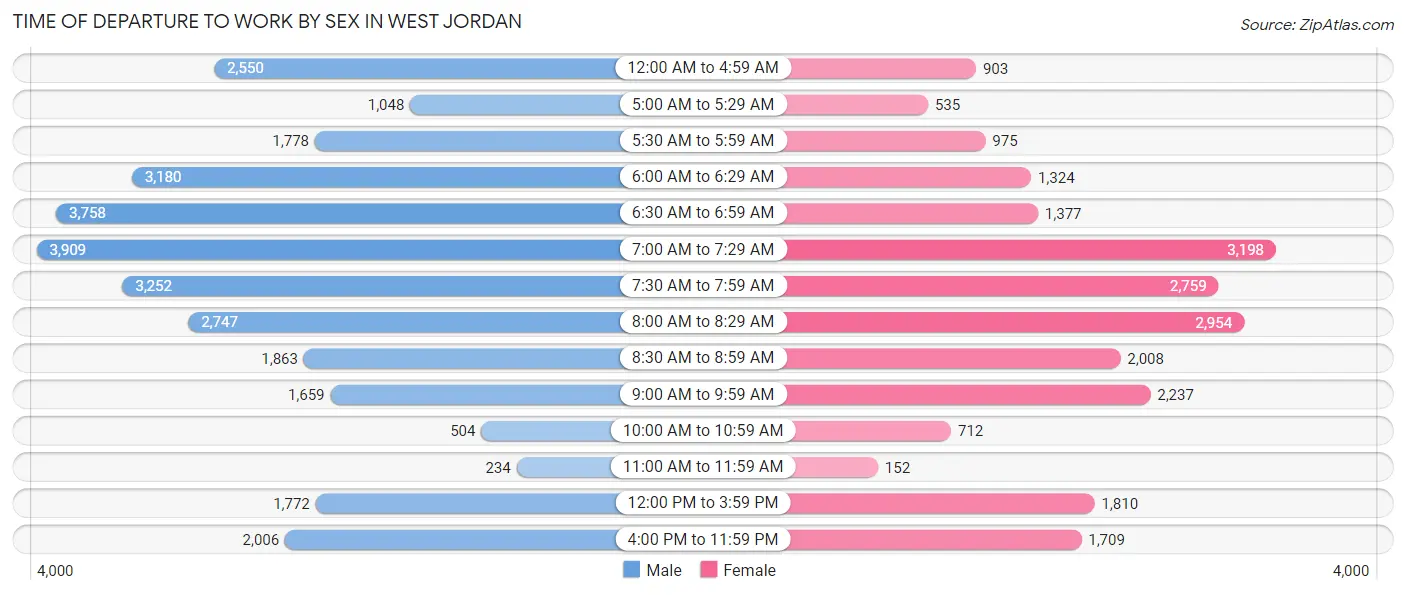
| Time of Departure | Male | Female |
| 12:00 AM to 4:59 AM | 2,550 (8.4%) | 903 (4.0%) |
| 5:00 AM to 5:29 AM | 1,048 (3.5%) | 535 (2.4%) |
| 5:30 AM to 5:59 AM | 1,778 (5.9%) | 975 (4.3%) |
| 6:00 AM to 6:29 AM | 3,180 (10.5%) | 1,324 (5.8%) |
| 6:30 AM to 6:59 AM | 3,758 (12.4%) | 1,377 (6.1%) |
| 7:00 AM to 7:29 AM | 3,909 (12.9%) | 3,198 (14.1%) |
| 7:30 AM to 7:59 AM | 3,252 (10.7%) | 2,759 (12.2%) |
| 8:00 AM to 8:29 AM | 2,747 (9.1%) | 2,954 (13.0%) |
| 8:30 AM to 8:59 AM | 1,863 (6.2%) | 2,008 (8.9%) |
| 9:00 AM to 9:59 AM | 1,659 (5.5%) | 2,237 (9.9%) |
| 10:00 AM to 10:59 AM | 504 (1.7%) | 712 (3.1%) |
| 11:00 AM to 11:59 AM | 234 (0.8%) | 152 (0.7%) |
| 12:00 PM to 3:59 PM | 1,772 (5.9%) | 1,810 (8.0%) |
| 4:00 PM to 11:59 PM | 2,006 (6.6%) | 1,709 (7.5%) |
| Total | 30,260 (100.0%) | 22,653 (100.0%) |
Housing Occupancy in West Jordan
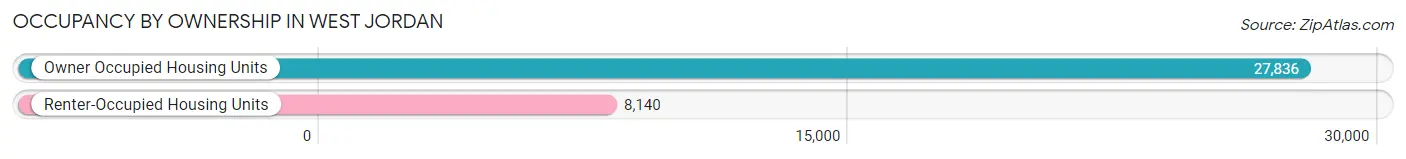
Occupancy by Ownership in West Jordan
Of the total 35,976 dwellings in West Jordan, owner-occupied units account for 27,836 (77.4%), while renter-occupied units make up 8,140 (22.6%).
| Occupancy | # Housing Units | % Housing Units |
| Owner Occupied Housing Units | 27,836 | 77.4% |
| Renter-Occupied Housing Units | 8,140 | 22.6% |
| Total Occupied Housing Units | 35,976 | 100.0% |
Occupancy by Household Size in West Jordan
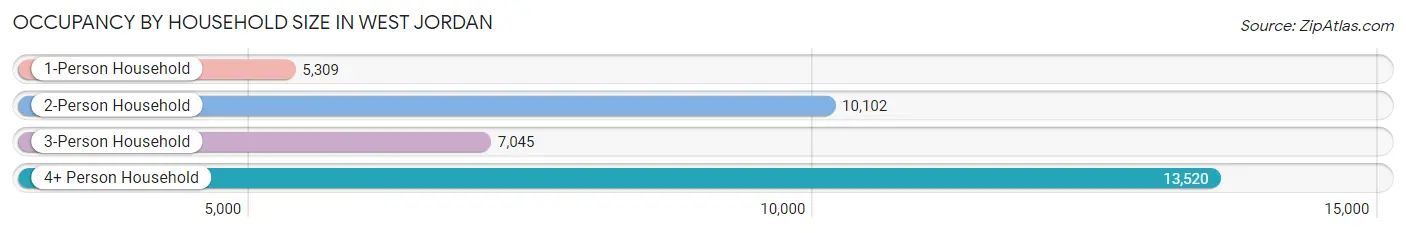
| Household Size | # Housing Units | % Housing Units |
| 1-Person Household | 5,309 | 14.8% |
| 2-Person Household | 10,102 | 28.1% |
| 3-Person Household | 7,045 | 19.6% |
| 4+ Person Household | 13,520 | 37.6% |
| Total Housing Units | 35,976 | 100.0% |
Occupancy by Ownership by Household Size in West Jordan
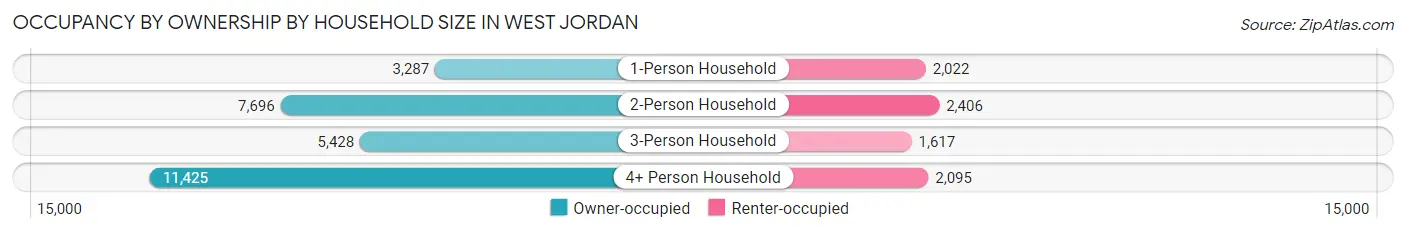
| Household Size | Owner-occupied | Renter-occupied |
| 1-Person Household | 3,287 (61.9%) | 2,022 (38.1%) |
| 2-Person Household | 7,696 (76.2%) | 2,406 (23.8%) |
| 3-Person Household | 5,428 (77.0%) | 1,617 (23.0%) |
| 4+ Person Household | 11,425 (84.5%) | 2,095 (15.5%) |
| Total Housing Units | 27,836 (77.4%) | 8,140 (22.6%) |
Occupancy by Educational Attainment in West Jordan
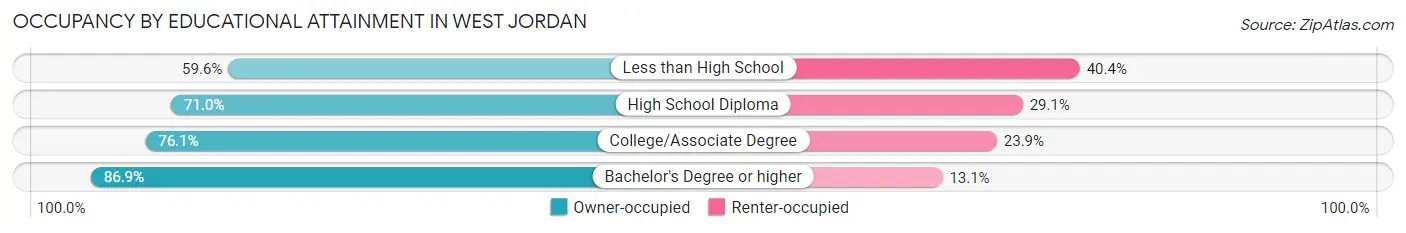
| Household Size | Owner-occupied | Renter-occupied |
| Less than High School | 1,123 (59.6%) | 760 (40.4%) |
| High School Diploma | 5,921 (71.0%) | 2,424 (29.0%) |
| College/Associate Degree | 11,087 (76.1%) | 3,488 (23.9%) |
| Bachelor's Degree or higher | 9,705 (86.9%) | 1,468 (13.1%) |
Occupancy by Age of Householder in West Jordan
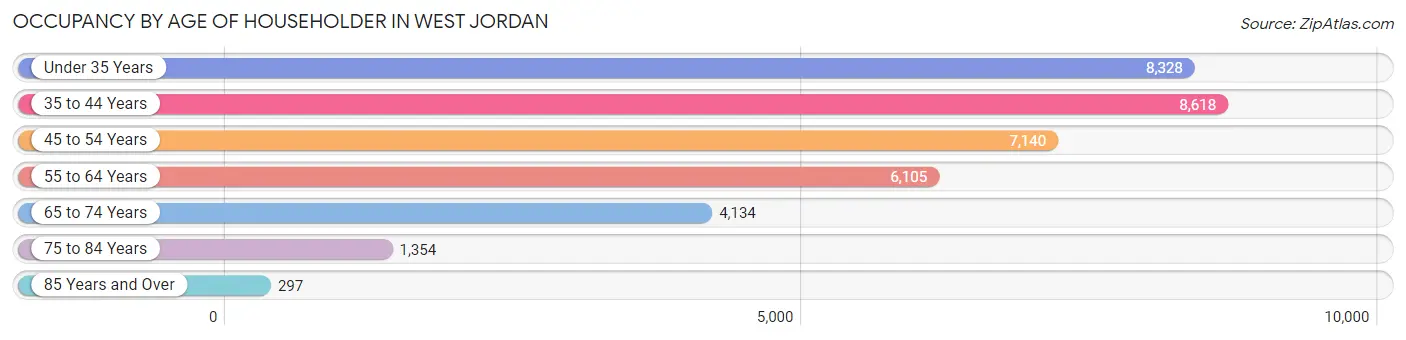
| Age Bracket | # Households | % Households |
| Under 35 Years | 8,328 | 23.2% |
| 35 to 44 Years | 8,618 | 23.9% |
| 45 to 54 Years | 7,140 | 19.9% |
| 55 to 64 Years | 6,105 | 17.0% |
| 65 to 74 Years | 4,134 | 11.5% |
| 75 to 84 Years | 1,354 | 3.8% |
| 85 Years and Over | 297 | 0.8% |
| Total | 35,976 | 100.0% |
Housing Finances in West Jordan
Median Income by Occupancy in West Jordan
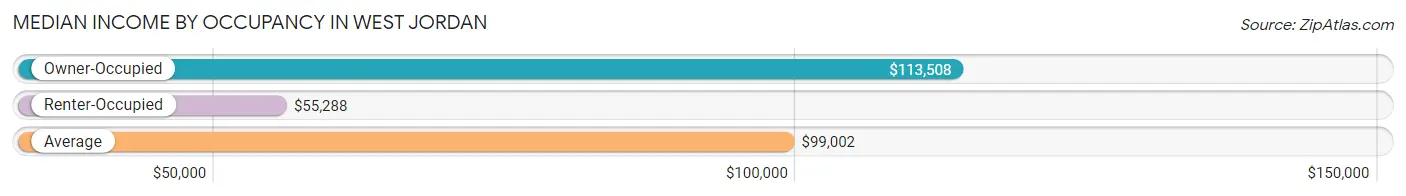
| Occupancy Type | # Households | Median Income |
| Owner-Occupied | 27,836 (77.4%) | $113,508 |
| Renter-Occupied | 8,140 (22.6%) | $55,288 |
| Average | 35,976 (100.0%) | $99,002 |
Occupancy by Householder Income Bracket in West Jordan
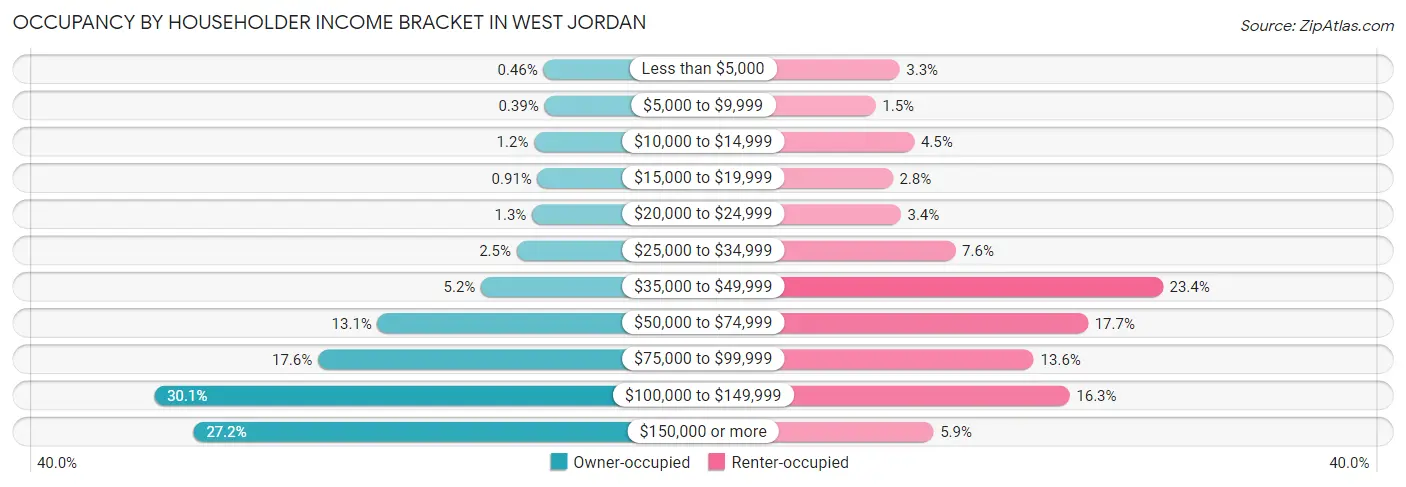
| Income Bracket | Owner-occupied | Renter-occupied |
| Less than $5,000 | 129 (0.5%) | 272 (3.3%) |
| $5,000 to $9,999 | 108 (0.4%) | 123 (1.5%) |
| $10,000 to $14,999 | 327 (1.2%) | 362 (4.4%) |
| $15,000 to $19,999 | 252 (0.9%) | 229 (2.8%) |
| $20,000 to $24,999 | 370 (1.3%) | 279 (3.4%) |
| $25,000 to $34,999 | 697 (2.5%) | 618 (7.6%) |
| $35,000 to $49,999 | 1,450 (5.2%) | 1,904 (23.4%) |
| $50,000 to $74,999 | 3,647 (13.1%) | 1,440 (17.7%) |
| $75,000 to $99,999 | 4,910 (17.6%) | 1,105 (13.6%) |
| $100,000 to $149,999 | 8,389 (30.1%) | 1,326 (16.3%) |
| $150,000 or more | 7,557 (27.2%) | 482 (5.9%) |
| Total | 27,836 (100.0%) | 8,140 (100.0%) |
Monthly Housing Cost Tiers in West Jordan
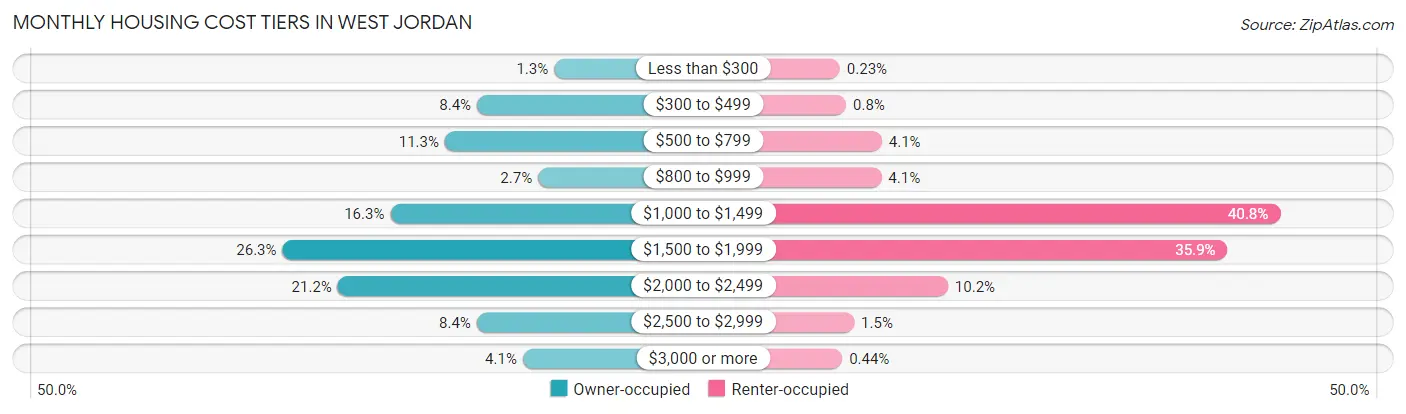
| Monthly Cost | Owner-occupied | Renter-occupied |
| Less than $300 | 351 (1.3%) | 19 (0.2%) |
| $300 to $499 | 2,328 (8.4%) | 65 (0.8%) |
| $500 to $799 | 3,151 (11.3%) | 333 (4.1%) |
| $800 to $999 | 764 (2.7%) | 330 (4.1%) |
| $1,000 to $1,499 | 4,548 (16.3%) | 3,317 (40.7%) |
| $1,500 to $1,999 | 7,312 (26.3%) | 2,922 (35.9%) |
| $2,000 to $2,499 | 5,895 (21.2%) | 828 (10.2%) |
| $2,500 to $2,999 | 2,334 (8.4%) | 125 (1.5%) |
| $3,000 or more | 1,153 (4.1%) | 36 (0.4%) |
| Total | 27,836 (100.0%) | 8,140 (100.0%) |
Physical Housing Characteristics in West Jordan
Housing Structures in West Jordan
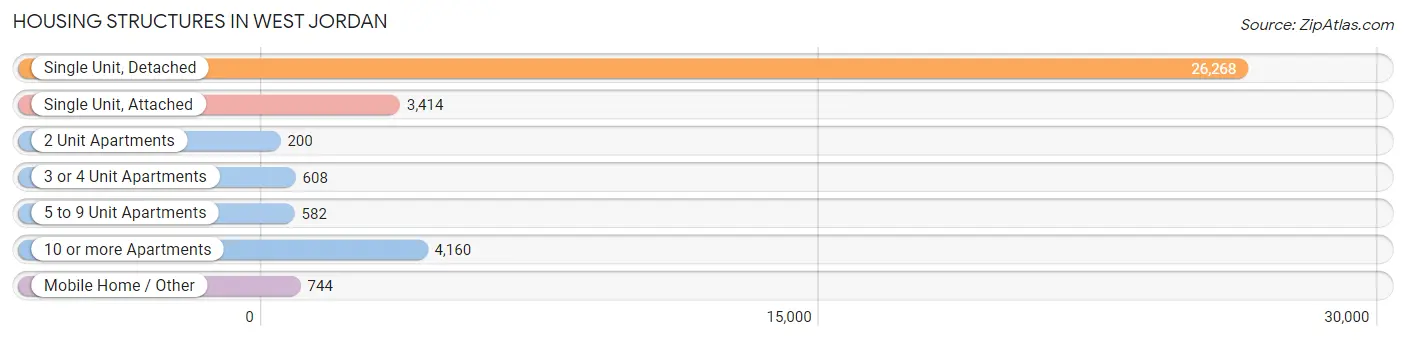
| Structure Type | # Housing Units | % Housing Units |
| Single Unit, Detached | 26,268 | 73.0% |
| Single Unit, Attached | 3,414 | 9.5% |
| 2 Unit Apartments | 200 | 0.6% |
| 3 or 4 Unit Apartments | 608 | 1.7% |
| 5 to 9 Unit Apartments | 582 | 1.6% |
| 10 or more Apartments | 4,160 | 11.6% |
| Mobile Home / Other | 744 | 2.1% |
| Total | 35,976 | 100.0% |
Housing Structures by Occupancy in West Jordan
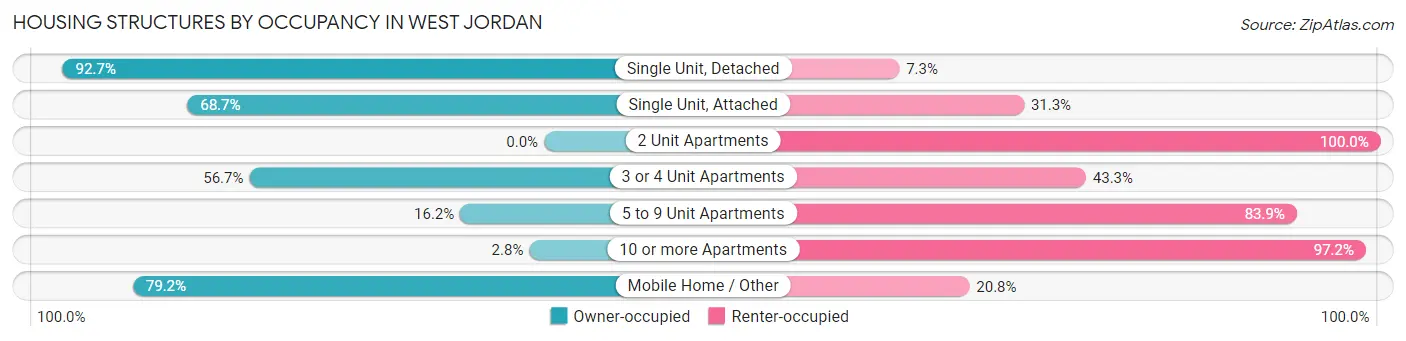
| Structure Type | Owner-occupied | Renter-occupied |
| Single Unit, Detached | 24,346 (92.7%) | 1,922 (7.3%) |
| Single Unit, Attached | 2,344 (68.7%) | 1,070 (31.3%) |
| 2 Unit Apartments | 0 (0.0%) | 200 (100.0%) |
| 3 or 4 Unit Apartments | 345 (56.7%) | 263 (43.3%) |
| 5 to 9 Unit Apartments | 94 (16.2%) | 488 (83.9%) |
| 10 or more Apartments | 118 (2.8%) | 4,042 (97.2%) |
| Mobile Home / Other | 589 (79.2%) | 155 (20.8%) |
| Total | 27,836 (77.4%) | 8,140 (22.6%) |
Housing Structures by Number of Rooms in West Jordan
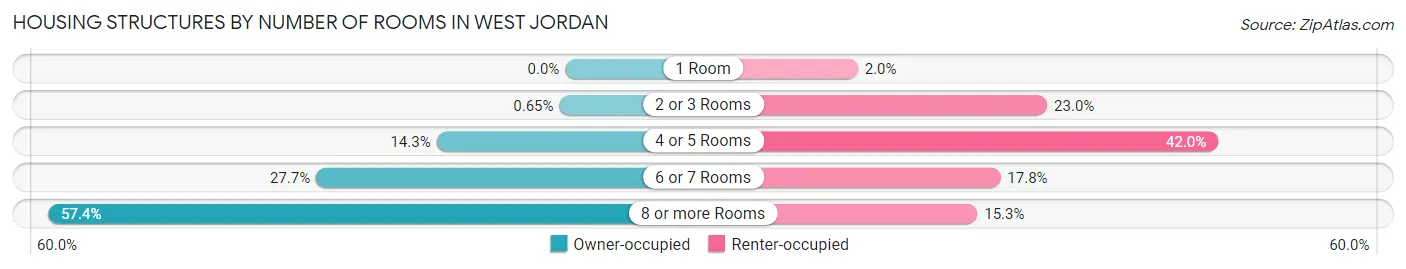
| Number of Rooms | Owner-occupied | Renter-occupied |
| 1 Room | 0 (0.0%) | 161 (2.0%) |
| 2 or 3 Rooms | 182 (0.6%) | 1,872 (23.0%) |
| 4 or 5 Rooms | 3,979 (14.3%) | 3,416 (42.0%) |
| 6 or 7 Rooms | 7,696 (27.7%) | 1,450 (17.8%) |
| 8 or more Rooms | 15,979 (57.4%) | 1,241 (15.2%) |
| Total | 27,836 (100.0%) | 8,140 (100.0%) |
Housing Structure by Heating Type in West Jordan
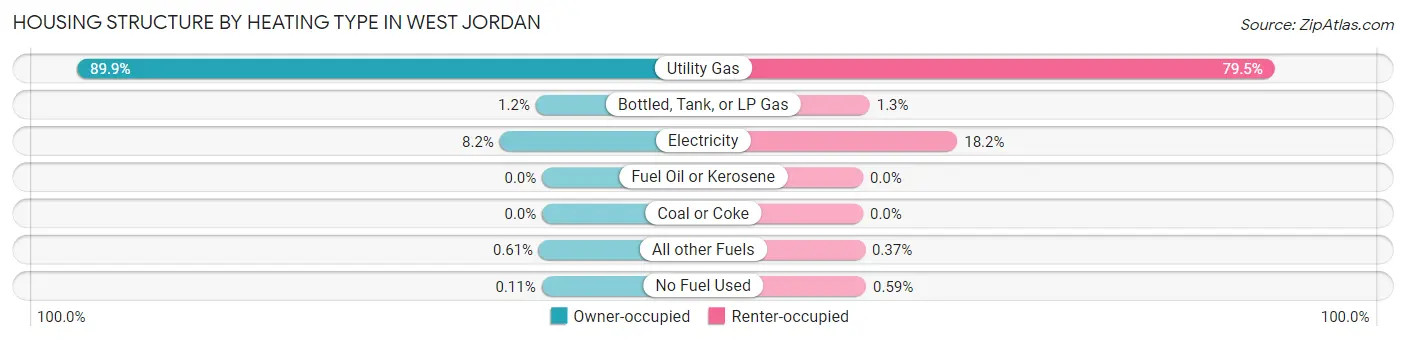
| Heating Type | Owner-occupied | Renter-occupied |
| Utility Gas | 25,012 (89.8%) | 6,473 (79.5%) |
| Bottled, Tank, or LP Gas | 342 (1.2%) | 106 (1.3%) |
| Electricity | 2,279 (8.2%) | 1,483 (18.2%) |
| Fuel Oil or Kerosene | 0 (0.0%) | 0 (0.0%) |
| Coal or Coke | 0 (0.0%) | 0 (0.0%) |
| All other Fuels | 171 (0.6%) | 30 (0.4%) |
| No Fuel Used | 32 (0.1%) | 48 (0.6%) |
| Total | 27,836 (100.0%) | 8,140 (100.0%) |
Household Vehicle Usage in West Jordan
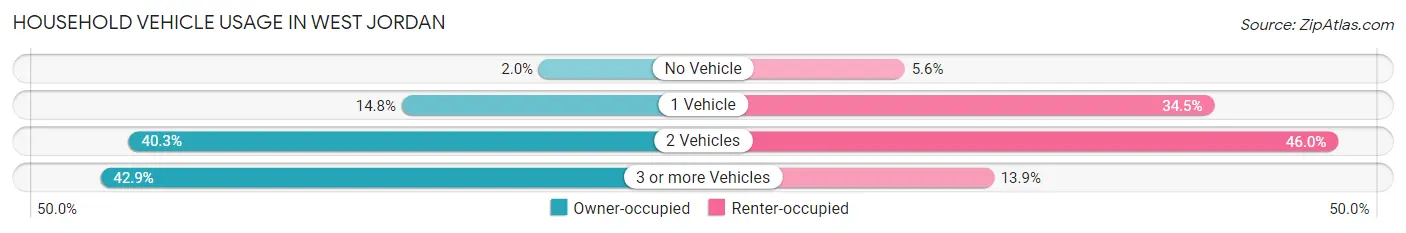
| Vehicles per Household | Owner-occupied | Renter-occupied |
| No Vehicle | 555 (2.0%) | 454 (5.6%) |
| 1 Vehicle | 4,118 (14.8%) | 2,807 (34.5%) |
| 2 Vehicles | 11,215 (40.3%) | 3,748 (46.0%) |
| 3 or more Vehicles | 11,948 (42.9%) | 1,131 (13.9%) |
| Total | 27,836 (100.0%) | 8,140 (100.0%) |
Real Estate & Mortgages in West Jordan
Real Estate and Mortgage Overview in West Jordan
| Characteristic | Without Mortgage | With Mortgage |
| Housing Units | 6,066 | 21,770 |
| Median Property Value | $383,400 | $419,600 |
| Median Household Income | $88,417 | $6,471 |
| Monthly Housing Costs | $525 | $1,144 |
| Real Estate Taxes | $2,309 | $628 |
Property Value by Mortgage Status in West Jordan
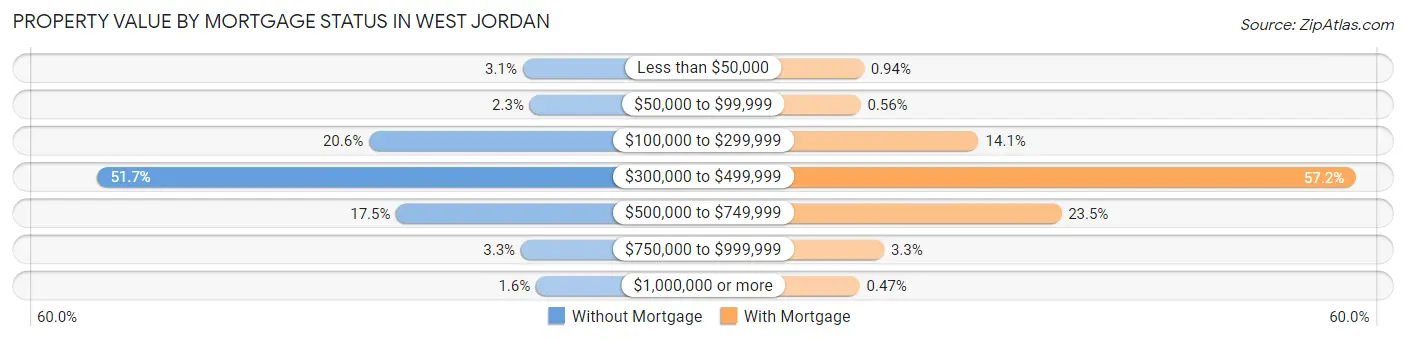
| Property Value | Without Mortgage | With Mortgage |
| Less than $50,000 | 186 (3.1%) | 204 (0.9%) |
| $50,000 to $99,999 | 138 (2.3%) | 122 (0.6%) |
| $100,000 to $299,999 | 1,252 (20.6%) | 3,063 (14.1%) |
| $300,000 to $499,999 | 3,134 (51.7%) | 12,454 (57.2%) |
| $500,000 to $749,999 | 1,063 (17.5%) | 5,116 (23.5%) |
| $750,000 to $999,999 | 199 (3.3%) | 708 (3.3%) |
| $1,000,000 or more | 94 (1.5%) | 103 (0.5%) |
| Total | 6,066 (100.0%) | 21,770 (100.0%) |
Household Income by Mortgage Status in West Jordan
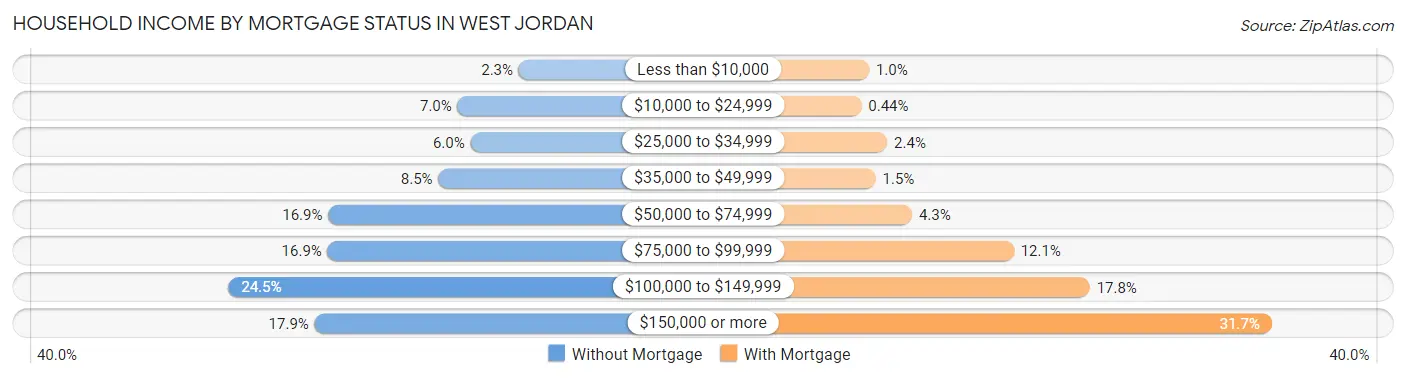
| Household Income | Without Mortgage | With Mortgage |
| Less than $10,000 | 142 (2.3%) | 222 (1.0%) |
| $10,000 to $24,999 | 425 (7.0%) | 95 (0.4%) |
| $25,000 to $34,999 | 365 (6.0%) | 524 (2.4%) |
| $35,000 to $49,999 | 514 (8.5%) | 332 (1.5%) |
| $50,000 to $74,999 | 1,023 (16.9%) | 936 (4.3%) |
| $75,000 to $99,999 | 1,026 (16.9%) | 2,624 (12.0%) |
| $100,000 to $149,999 | 1,485 (24.5%) | 3,884 (17.8%) |
| $150,000 or more | 1,086 (17.9%) | 6,904 (31.7%) |
| Total | 6,066 (100.0%) | 21,770 (100.0%) |
Property Value to Household Income Ratio in West Jordan
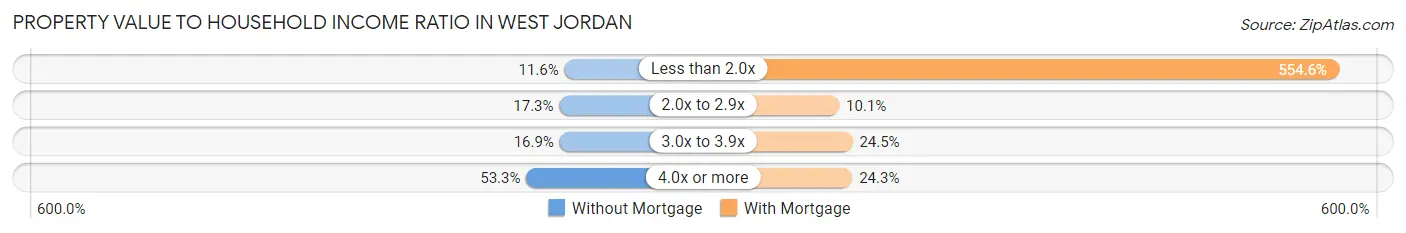
| Value-to-Income Ratio | Without Mortgage | With Mortgage |
| Less than 2.0x | 706 (11.6%) | 120,733 (554.6%) |
| 2.0x to 2.9x | 1,048 (17.3%) | 2,191 (10.1%) |
| 3.0x to 3.9x | 1,026 (16.9%) | 5,337 (24.5%) |
| 4.0x or more | 3,233 (53.3%) | 5,298 (24.3%) |
| Total | 6,066 (100.0%) | 21,770 (100.0%) |
Real Estate Taxes by Mortgage Status in West Jordan
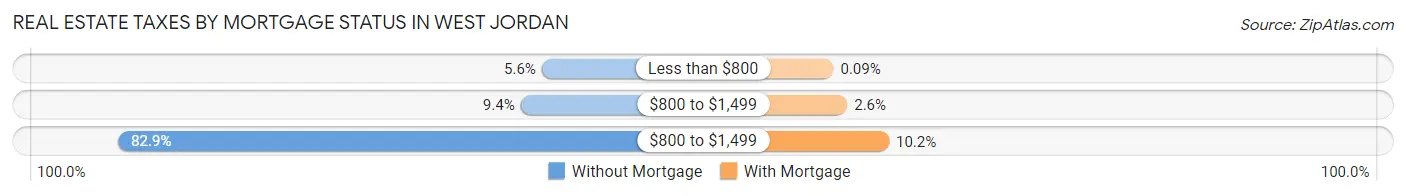
| Property Taxes | Without Mortgage | With Mortgage |
| Less than $800 | 337 (5.6%) | 20 (0.1%) |
| $800 to $1,499 | 572 (9.4%) | 565 (2.6%) |
| $800 to $1,499 | 5,031 (82.9%) | 2,227 (10.2%) |
| Total | 6,066 (100.0%) | 21,770 (100.0%) |
Health & Disability in West Jordan
Health Insurance Coverage by Age in West Jordan
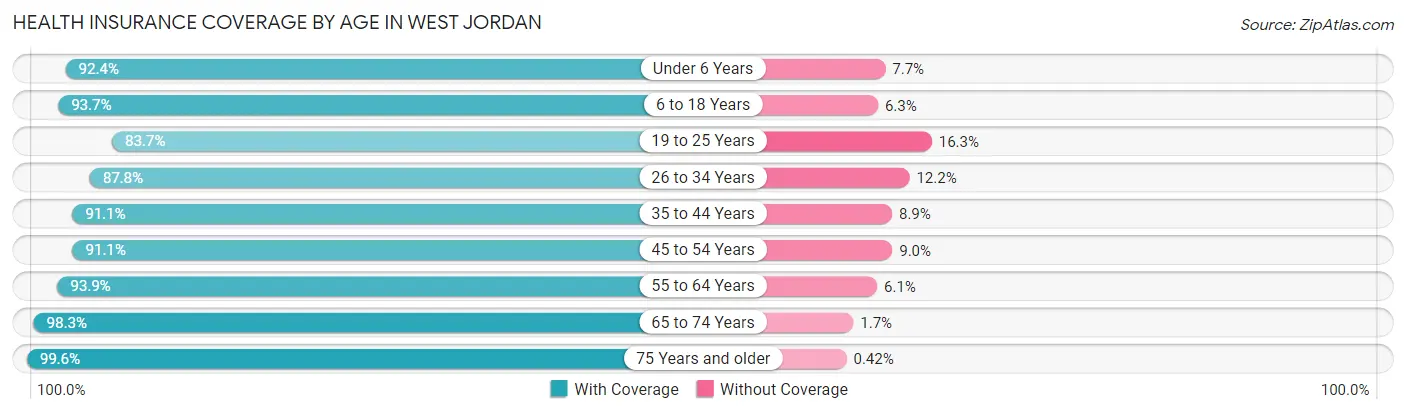
| Age Bracket | With Coverage | Without Coverage |
| Under 6 Years | 8,225 (92.3%) | 681 (7.6%) |
| 6 to 18 Years | 24,887 (93.7%) | 1,669 (6.3%) |
| 19 to 25 Years | 9,219 (83.7%) | 1,798 (16.3%) |
| 26 to 34 Years | 13,871 (87.8%) | 1,920 (12.2%) |
| 35 to 44 Years | 16,939 (91.1%) | 1,654 (8.9%) |
| 45 to 54 Years | 12,925 (91.0%) | 1,271 (8.9%) |
| 55 to 64 Years | 10,056 (93.9%) | 656 (6.1%) |
| 65 to 74 Years | 7,140 (98.3%) | 123 (1.7%) |
| 75 Years and older | 2,874 (99.6%) | 12 (0.4%) |
| Total | 106,136 (91.6%) | 9,784 (8.4%) |
Health Insurance Coverage by Citizenship Status in West Jordan
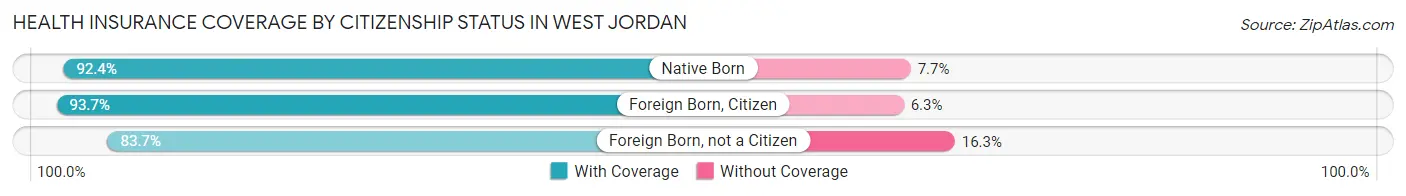
| Citizenship Status | With Coverage | Without Coverage |
| Native Born | 8,225 (92.3%) | 681 (7.6%) |
| Foreign Born, Citizen | 24,887 (93.7%) | 1,669 (6.3%) |
| Foreign Born, not a Citizen | 9,219 (83.7%) | 1,798 (16.3%) |
Health Insurance Coverage by Household Income in West Jordan
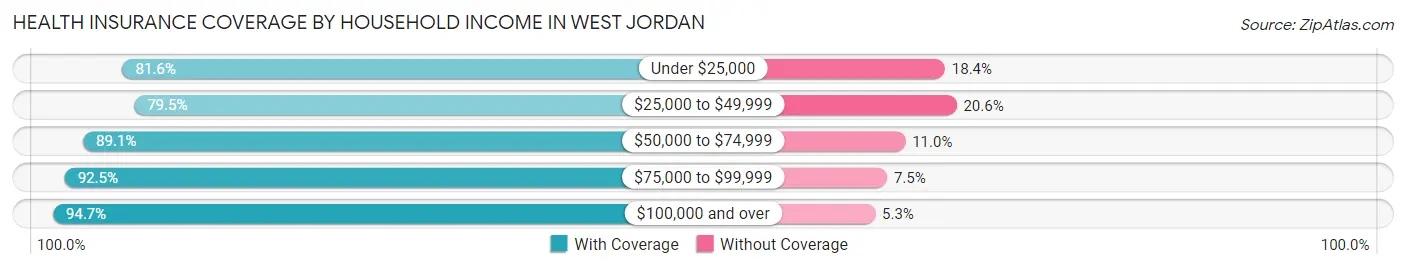
| Household Income | With Coverage | Without Coverage |
| Under $25,000 | 4,043 (81.6%) | 910 (18.4%) |
| $25,000 to $49,999 | 8,965 (79.4%) | 2,319 (20.5%) |
| $50,000 to $74,999 | 13,908 (89.0%) | 1,710 (11.0%) |
| $75,000 to $99,999 | 16,641 (92.5%) | 1,356 (7.5%) |
| $100,000 and over | 62,338 (94.7%) | 3,488 (5.3%) |
Public vs Private Health Insurance Coverage by Age in West Jordan
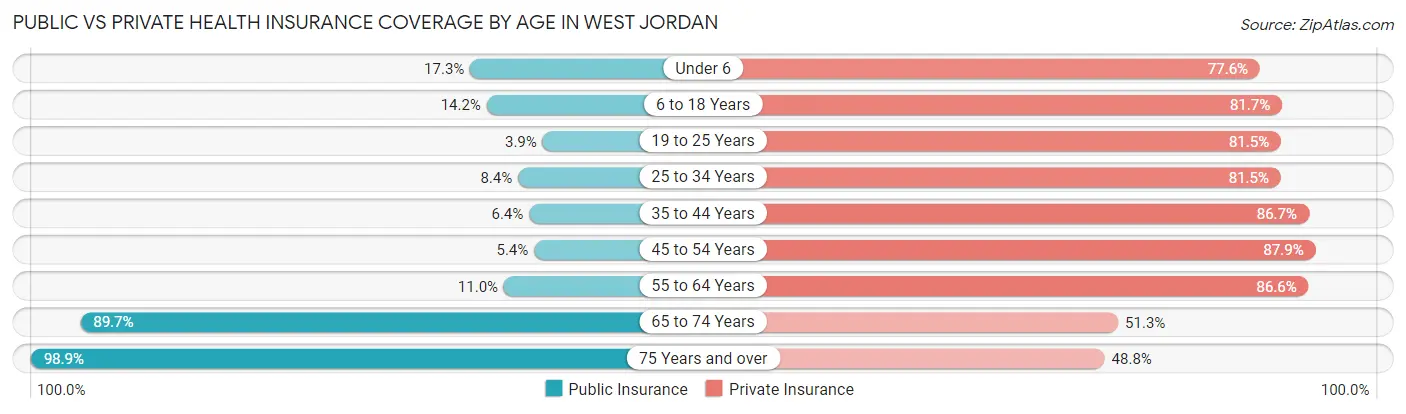
| Age Bracket | Public Insurance | Private Insurance |
| Under 6 | 1,541 (17.3%) | 6,911 (77.6%) |
| 6 to 18 Years | 3,780 (14.2%) | 21,698 (81.7%) |
| 19 to 25 Years | 424 (3.8%) | 8,982 (81.5%) |
| 25 to 34 Years | 1,327 (8.4%) | 12,867 (81.5%) |
| 35 to 44 Years | 1,181 (6.4%) | 16,117 (86.7%) |
| 45 to 54 Years | 769 (5.4%) | 12,481 (87.9%) |
| 55 to 64 Years | 1,182 (11.0%) | 9,281 (86.6%) |
| 65 to 74 Years | 6,512 (89.7%) | 3,726 (51.3%) |
| 75 Years and over | 2,853 (98.9%) | 1,408 (48.8%) |
| Total | 19,569 (16.9%) | 93,471 (80.6%) |
Disability Status by Sex by Age in West Jordan
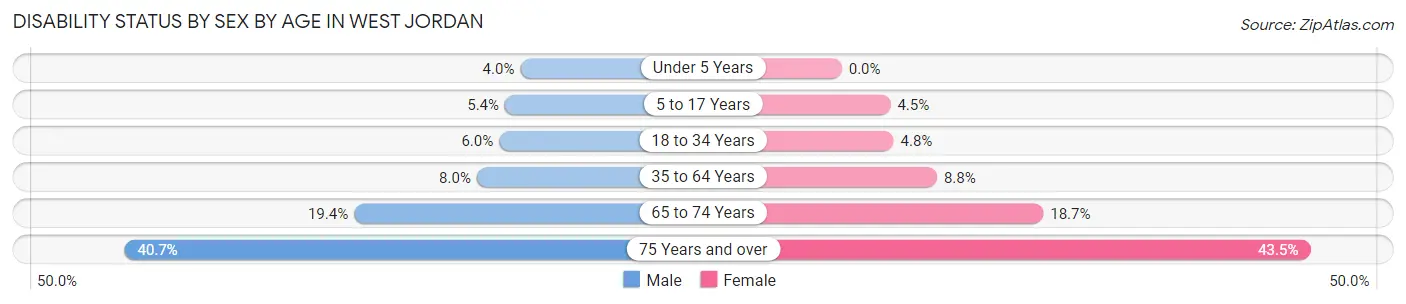
| Age Bracket | Male | Female |
| Under 5 Years | 167 (4.0%) | 0 (0.0%) |
| 5 to 17 Years | 722 (5.4%) | 556 (4.5%) |
| 18 to 34 Years | 908 (6.0%) | 666 (4.8%) |
| 35 to 64 Years | 1,812 (8.0%) | 1,852 (8.8%) |
| 65 to 74 Years | 660 (19.4%) | 723 (18.7%) |
| 75 Years and over | 499 (40.7%) | 722 (43.5%) |
Disability Class by Sex by Age in West Jordan
Disability Class: Hearing Difficulty
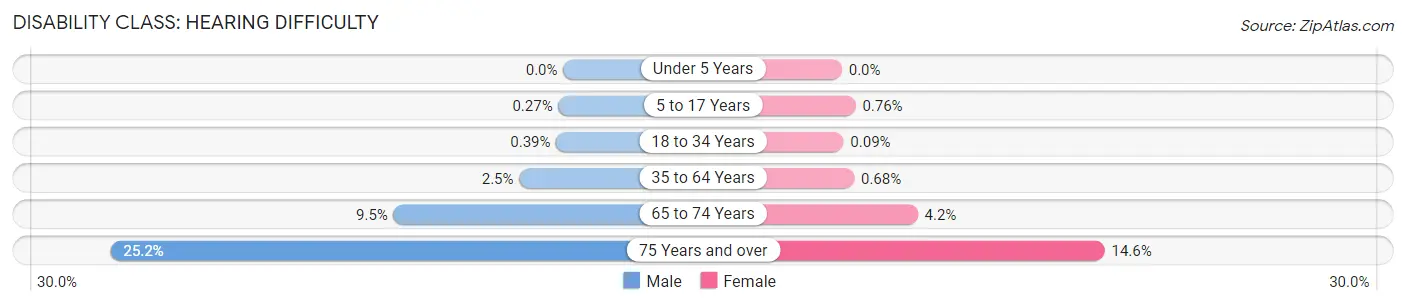
| Age Bracket | Male | Female |
| Under 5 Years | 0 (0.0%) | 0 (0.0%) |
| 5 to 17 Years | 36 (0.3%) | 93 (0.8%) |
| 18 to 34 Years | 60 (0.4%) | 12 (0.1%) |
| 35 to 64 Years | 551 (2.5%) | 142 (0.7%) |
| 65 to 74 Years | 321 (9.5%) | 163 (4.2%) |
| 75 Years and over | 309 (25.2%) | 243 (14.6%) |
Disability Class: Vision Difficulty
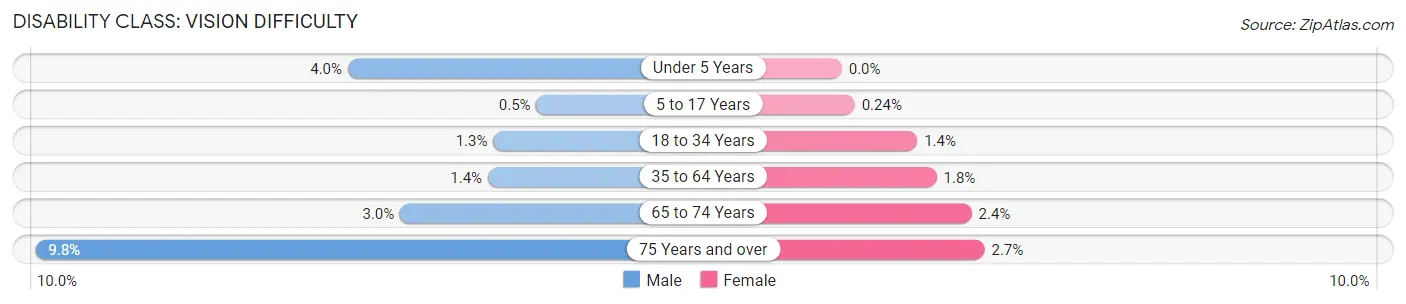
| Age Bracket | Male | Female |
| Under 5 Years | 167 (4.0%) | 0 (0.0%) |
| 5 to 17 Years | 66 (0.5%) | 30 (0.2%) |
| 18 to 34 Years | 198 (1.3%) | 194 (1.4%) |
| 35 to 64 Years | 315 (1.4%) | 370 (1.8%) |
| 65 to 74 Years | 103 (3.0%) | 93 (2.4%) |
| 75 Years and over | 120 (9.8%) | 44 (2.6%) |
Disability Class: Cognitive Difficulty
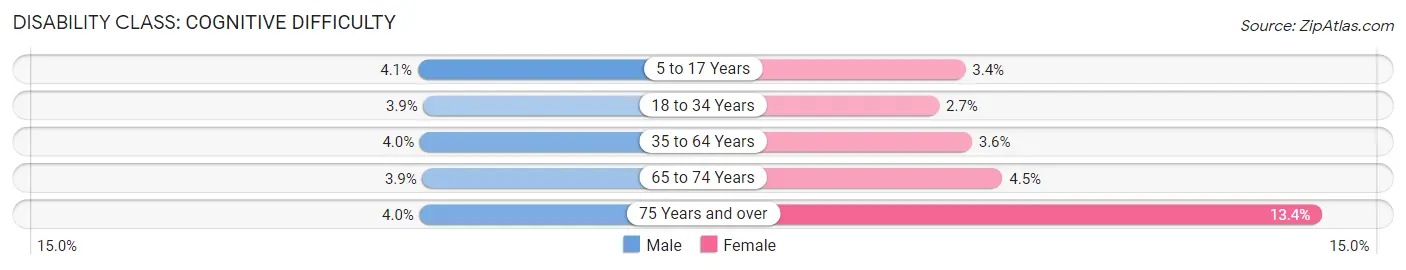
| Age Bracket | Male | Female |
| 5 to 17 Years | 538 (4.1%) | 423 (3.4%) |
| 18 to 34 Years | 592 (3.9%) | 376 (2.7%) |
| 35 to 64 Years | 899 (4.0%) | 760 (3.6%) |
| 65 to 74 Years | 133 (3.9%) | 173 (4.5%) |
| 75 Years and over | 49 (4.0%) | 222 (13.4%) |
Disability Class: Ambulatory Difficulty
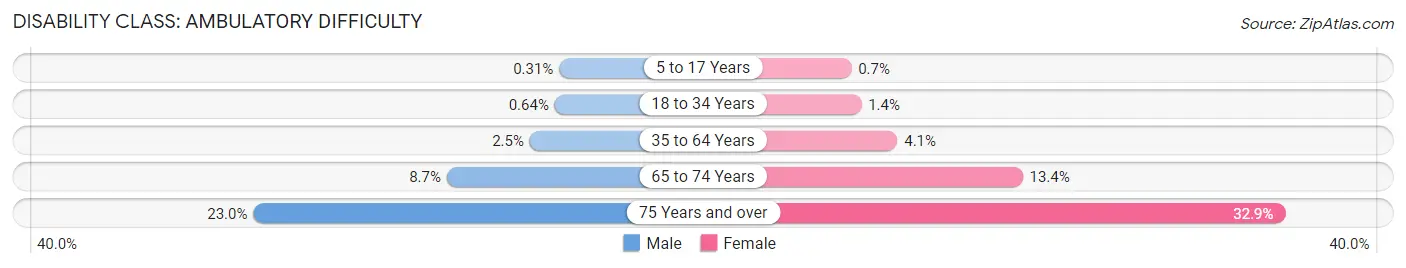
| Age Bracket | Male | Female |
| 5 to 17 Years | 41 (0.3%) | 86 (0.7%) |
| 18 to 34 Years | 98 (0.6%) | 200 (1.4%) |
| 35 to 64 Years | 561 (2.5%) | 863 (4.1%) |
| 65 to 74 Years | 294 (8.6%) | 519 (13.4%) |
| 75 Years and over | 282 (23.0%) | 547 (32.9%) |
Disability Class: Self-Care Difficulty
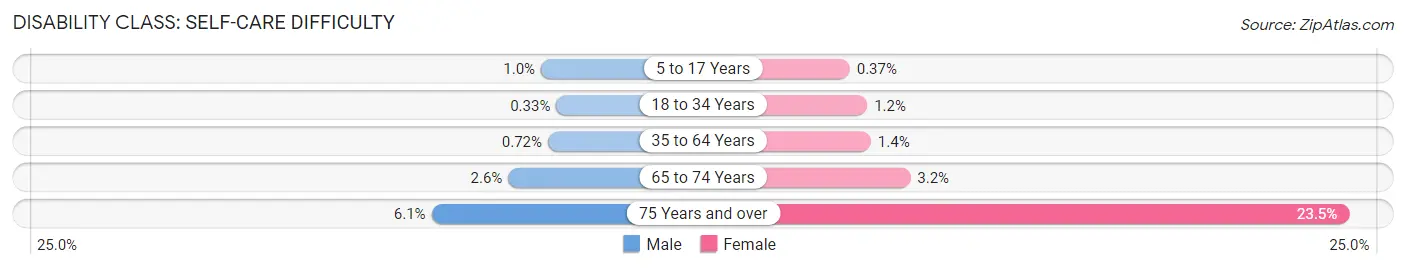
| Age Bracket | Male | Female |
| 5 to 17 Years | 138 (1.0%) | 46 (0.4%) |
| 18 to 34 Years | 50 (0.3%) | 164 (1.2%) |
| 35 to 64 Years | 162 (0.7%) | 284 (1.3%) |
| 65 to 74 Years | 87 (2.6%) | 123 (3.2%) |
| 75 Years and over | 75 (6.1%) | 391 (23.5%) |
Technology Access in West Jordan
Computing Device Access in West Jordan
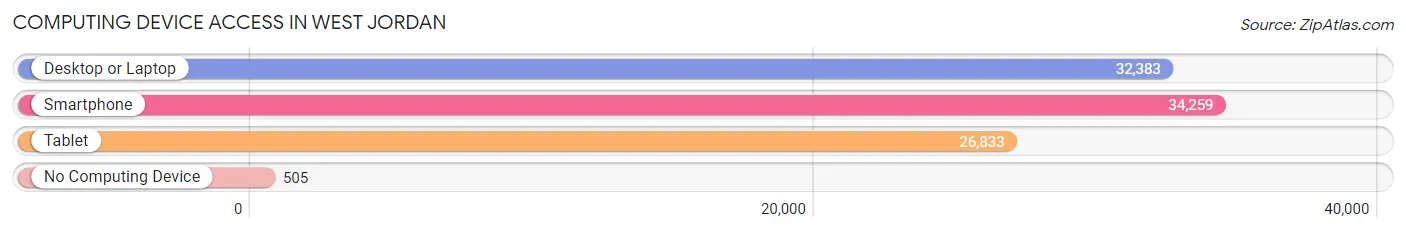
| Device Type | # Households | % Households |
| Desktop or Laptop | 32,383 | 90.0% |
| Smartphone | 34,259 | 95.2% |
| Tablet | 26,833 | 74.6% |
| No Computing Device | 505 | 1.4% |
| Total | 35,976 | 100.0% |
Internet Access in West Jordan
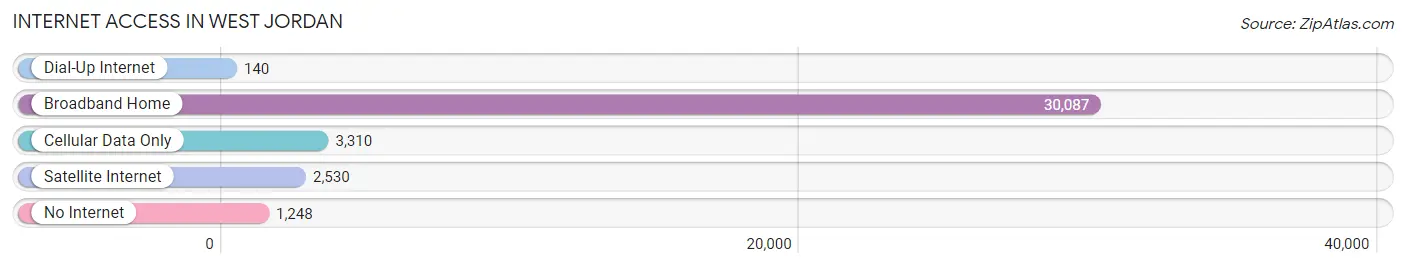
| Internet Type | # Households | % Households |
| Dial-Up Internet | 140 | 0.4% |
| Broadband Home | 30,087 | 83.6% |
| Cellular Data Only | 3,310 | 9.2% |
| Satellite Internet | 2,530 | 7.0% |
| No Internet | 1,248 | 3.5% |
| Total | 35,976 | 100.0% |
West Jordan Summary
History
West Jordan is a city located in Salt Lake County, Utah, United States. It is a suburb of Salt Lake City and was first settled in 1848 by Mormon pioneers. The city was originally named after the Jordan River, which runs through the area. The city was incorporated in 1938 and has since grown to become the fourth largest city in the state of Utah.
West Jordan has a rich history that dates back to the early days of the Mormon pioneers. The first settlers in the area were members of the Church of Jesus Christ of Latter-day Saints, who were sent to the area to establish a settlement. The first settlers arrived in 1848 and named the area after the Jordan River, which runs through the area. The settlers built a fort and began to farm the land.
The city was officially incorporated in 1938 and has since grown to become the fourth largest city in the state of Utah. The city has experienced rapid growth in recent years, with the population increasing by over 50% since 2000.
Geography
West Jordan is located in the Salt Lake Valley in northern Utah. The city is bordered by the cities of South Jordan to the north, Taylorsville to the east, and West Valley City to the south. The city is located at an elevation of 4,400 feet above sea level and covers an area of approximately 30 square miles.
The city is located in a semi-arid climate zone, with hot summers and cold winters. The average annual temperature is around 50 degrees Fahrenheit, with temperatures ranging from the low 30s in the winter to the high 90s in the summer.
Economy
West Jordan is a major economic center in the Salt Lake Valley. The city is home to several large employers, including the Jordan School District, Intermountain Healthcare, and the University of Utah. The city also has a thriving retail sector, with several large shopping centers and malls located in the city.
The city is also home to several major industrial parks, including the West Jordan Industrial Park and the Jordan Industrial Park. These parks are home to a variety of businesses, including manufacturing, warehousing, and distribution companies.
Demographics
As of the 2020 census, West Jordan had a population of 111,717. The city has a population density of 3,717 people per square mile. The median age of the population is 30.7 years, with a gender ratio of 50.3% male and 49.7% female.
The racial makeup of the city is predominantly white (77.2%), followed by Hispanic or Latino (14.2%), Asian (3.7%), African American (2.3%), and Native American (0.7%). The city has a median household income of $63,945 and a poverty rate of 8.3%.
Conclusion
West Jordan is a city located in Salt Lake County, Utah, United States. It is a suburb of Salt Lake City and was first settled in 1848 by Mormon pioneers. The city has experienced rapid growth in recent years, with the population increasing by over 50% since 2000. West Jordan is a major economic center in the Salt Lake Valley, with several large employers and a thriving retail sector. The city has a population of 111,717, with a median age of 30.7 years and a median household income of $63,945.
Common Questions
What is Per Capita Income in West Jordan?
Per Capita income in West Jordan is $34,765.
What is the Median Family Income in West Jordan?
Median Family Income in West Jordan is $106,097.
What is the Median Household income in West Jordan?
Median Household Income in West Jordan is $99,002.
What is Income or Wage Gap in West Jordan?
Income or Wage Gap in West Jordan is 36.8%.
Women in West Jordan earn 63.2 cents for every dollar earned by a man.
What is Family Income Deficit in West Jordan?
Family Income Deficit in West Jordan is $11,838.
Families that are below poverty line in West Jordan earn $11,838 less on average than the poverty threshold level.
What is Inequality or Gini Index in West Jordan?
Inequality or Gini Index in West Jordan is 0.34.
What is the Total Population of West Jordan?
Total Population of West Jordan is 116,383.
What is the Total Male Population of West Jordan?
Total Male Population of West Jordan is 60,125.
What is the Total Female Population of West Jordan?
Total Female Population of West Jordan is 56,258.
What is the Ratio of Males per 100 Females in West Jordan?
There are 106.87 Males per 100 Females in West Jordan.
What is the Ratio of Females per 100 Males in West Jordan?
There are 93.57 Females per 100 Males in West Jordan.
What is the Median Population Age in West Jordan?
Median Population Age in West Jordan is 32.6 Years.
What is the Average Family Size in West Jordan
Average Family Size in West Jordan is 3.6 People.
What is the Average Household Size in West Jordan
Average Household Size in West Jordan is 3.2 People.
How Large is the Labor Force in West Jordan?
There are 66,059 People in the Labor Forcein in West Jordan.
What is the Percentage of People in the Labor Force in West Jordan?
76.1% of People are in the Labor Force in West Jordan.
What is the Unemployment Rate in West Jordan?
Unemployment Rate in West Jordan is 4.2%.