Washington, UT Map & Demographics
Washington Map
Washington Overview
$41,499
PER CAPITA INCOME
$110,040
AVG FAMILY INCOME
$94,655
AVG HOUSEHOLD INCOME
45.3%
WAGE / INCOME GAP [ % ]
54.7¢/ $1
WAGE / INCOME GAP [ $ ]
0.47
INEQUALITY / GINI INDEX
29,161
TOTAL POPULATION
14,144
MALE POPULATION
15,017
FEMALE POPULATION
94.19
MALES / 100 FEMALES
106.17
FEMALES / 100 MALES
36.8
MEDIAN AGE
3.5
AVG FAMILY SIZE
3.0
AVG HOUSEHOLD SIZE
13,790
LABOR FORCE [ PEOPLE ]
61.8%
PERCENT IN LABOR FORCE
0.8%
UNEMPLOYMENT RATE
Washington Zip Codes
Washington Area Codes
Income in Washington
Income Overview in Washington
Per Capita Income in Washington is $41,499, while median incomes of families and households are $110,040 and $94,655 respectively.
| Characteristic | Number | Measure |
| Per Capita Income | 29,161 | $41,499 |
| Median Family Income | 7,567 | $110,040 |
| Mean Family Income | 7,567 | $138,922 |
| Median Household Income | 9,736 | $94,655 |
| Mean Household Income | 9,736 | $121,527 |
| Income Deficit | 7,567 | $0 |
| Wage / Income Gap (%) | 29,161 | 45.32% |
| Wage / Income Gap ($) | 29,161 | 54.68¢ per $1 |
| Gini / Inequality Index | 29,161 | 0.47 |
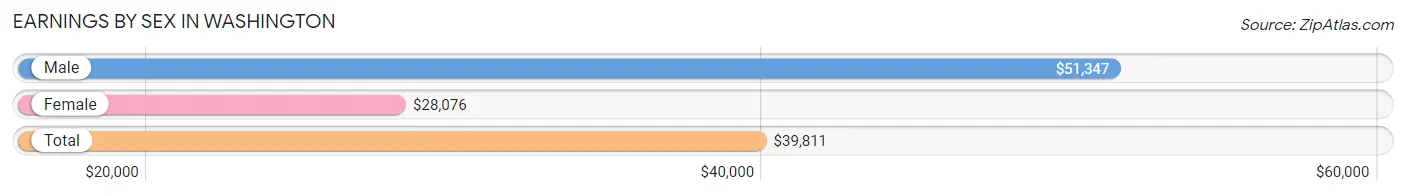
Earnings by Sex in Washington
Average Earnings in Washington are $39,811, $51,347 for men and $28,076 for women, a difference of 45.3%.
| Sex | Number | Average Earnings |
| Male | 7,869 (52.9%) | $51,347 |
| Female | 6,995 (47.1%) | $28,076 |
| Total | 14,864 (100.0%) | $39,811 |
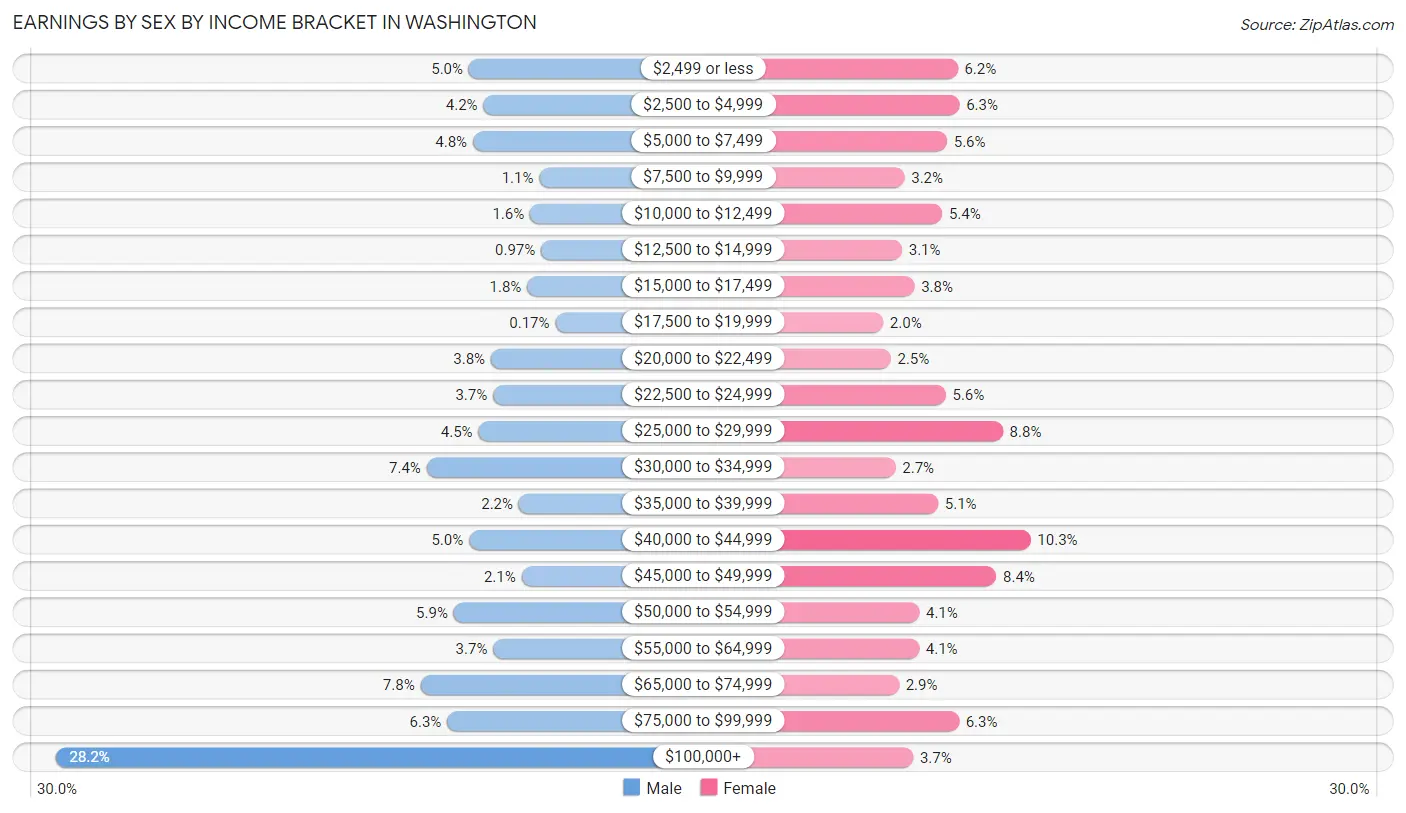
Earnings by Sex by Income Bracket in Washington
The most common earnings brackets in Washington are $100,000+ for men (2,220 | 28.2%) and $40,000 to $44,999 for women (722 | 10.3%).
| Income | Male | Female |
| $2,499 or less | 396 (5.0%) | 435 (6.2%) |
| $2,500 to $4,999 | 331 (4.2%) | 442 (6.3%) |
| $5,000 to $7,499 | 378 (4.8%) | 393 (5.6%) |
| $7,500 to $9,999 | 84 (1.1%) | 226 (3.2%) |
| $10,000 to $12,499 | 125 (1.6%) | 374 (5.3%) |
| $12,500 to $14,999 | 76 (1.0%) | 216 (3.1%) |
| $15,000 to $17,499 | 138 (1.8%) | 265 (3.8%) |
| $17,500 to $19,999 | 13 (0.2%) | 142 (2.0%) |
| $20,000 to $22,499 | 298 (3.8%) | 172 (2.5%) |
| $22,500 to $24,999 | 289 (3.7%) | 388 (5.6%) |
| $25,000 to $29,999 | 353 (4.5%) | 613 (8.8%) |
| $30,000 to $34,999 | 582 (7.4%) | 191 (2.7%) |
| $35,000 to $39,999 | 175 (2.2%) | 358 (5.1%) |
| $40,000 to $44,999 | 395 (5.0%) | 722 (10.3%) |
| $45,000 to $49,999 | 163 (2.1%) | 587 (8.4%) |
| $50,000 to $54,999 | 463 (5.9%) | 284 (4.1%) |
| $55,000 to $64,999 | 288 (3.7%) | 283 (4.1%) |
| $65,000 to $74,999 | 610 (7.7%) | 204 (2.9%) |
| $75,000 to $99,999 | 492 (6.2%) | 440 (6.3%) |
| $100,000+ | 2,220 (28.2%) | 260 (3.7%) |
| Total | 7,869 (100.0%) | 6,995 (100.0%) |
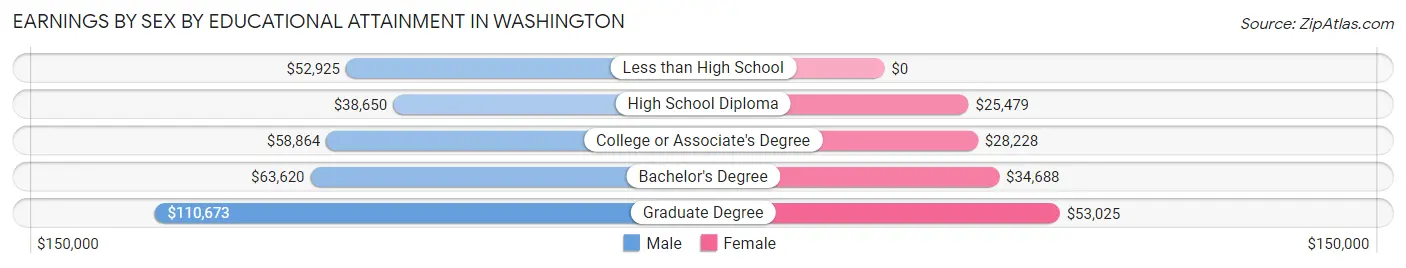
Earnings by Sex by Educational Attainment in Washington
Average earnings in Washington are $64,610 for men and $32,694 for women, a difference of 49.4%. Men with an educational attainment of graduate degree enjoy the highest average annual earnings of $110,673, while those with high school diploma education earn the least with $38,650. Women with an educational attainment of graduate degree earn the most with the average annual earnings of $53,025, while those with high school diploma education have the smallest earnings of $25,479.
| Educational Attainment | Male Income | Female Income |
| Less than High School | $52,925 | $0 |
| High School Diploma | $38,650 | $25,479 |
| College or Associate's Degree | $58,864 | $28,228 |
| Bachelor's Degree | $63,620 | $34,688 |
| Graduate Degree | $110,673 | $53,025 |
| Total | $64,610 | $32,694 |
Family Income in Washington
Family Income Brackets in Washington
According to the Washington family income data, there are 2,474 families falling into the $100,000 to $149,999 income range, which is the most common income bracket and makes up 32.7% of all families. Conversely, the $10,000 to $14,999 income bracket is the least frequent group with only 45 families (0.6%) belonging to this category.
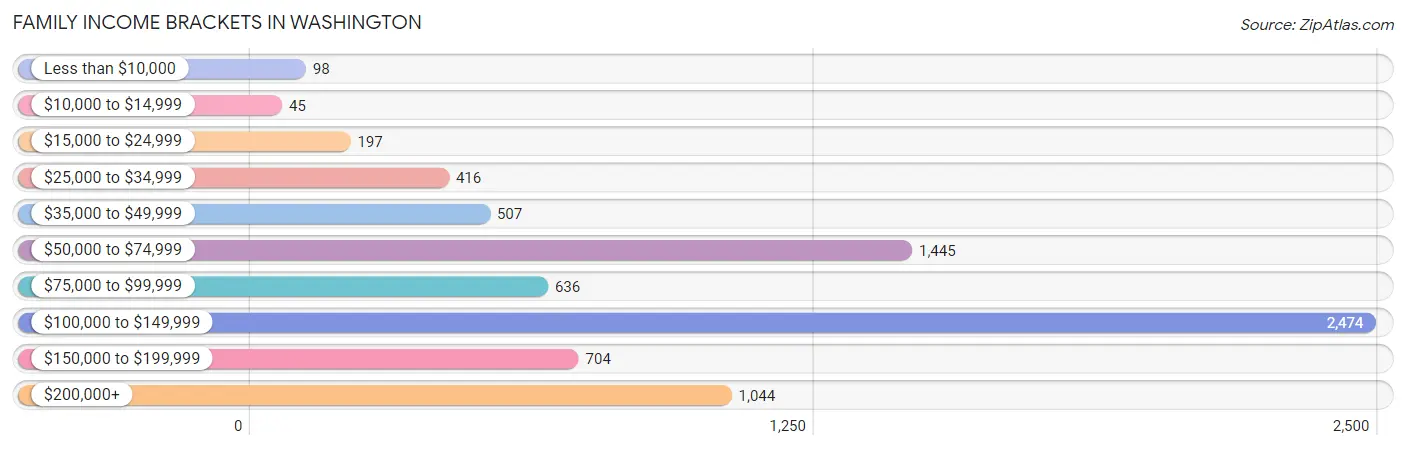
| Income Bracket | # Families | % Families |
| Less than $10,000 | 98 | 1.3% |
| $10,000 to $14,999 | 45 | 0.6% |
| $15,000 to $24,999 | 197 | 2.6% |
| $25,000 to $34,999 | 416 | 5.5% |
| $35,000 to $49,999 | 507 | 6.7% |
| $50,000 to $74,999 | 1,445 | 19.1% |
| $75,000 to $99,999 | 636 | 8.4% |
| $100,000 to $149,999 | 2,474 | 32.7% |
| $150,000 to $199,999 | 704 | 9.3% |
| $200,000+ | 1,044 | 13.8% |
Family Income by Famaliy Size in Washington
7+ person families (309 | 4.1%) account for the highest median family income in Washington with $158,477 per family, while 2-person families (2,991 | 39.5%) have the highest median income of $36,294 per family member.
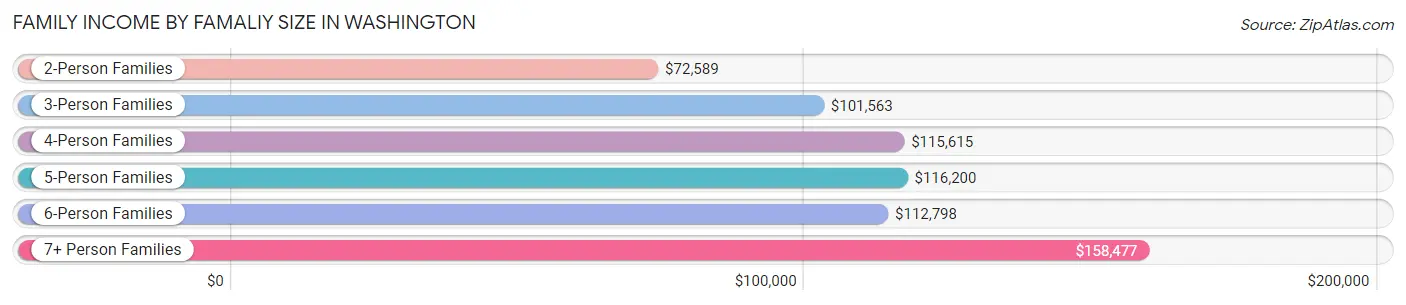
| Income Bracket | # Families | Median Income |
| 2-Person Families | 2,991 (39.5%) | $72,589 |
| 3-Person Families | 1,594 (21.1%) | $101,563 |
| 4-Person Families | 1,379 (18.2%) | $115,615 |
| 5-Person Families | 808 (10.7%) | $116,200 |
| 6-Person Families | 486 (6.4%) | $112,798 |
| 7+ Person Families | 309 (4.1%) | $158,477 |
| Total | 7,567 (100.0%) | $110,040 |
Family Income by Number of Earners in Washington
The median family income in Washington is $110,040, with families comprising 3+ earners (1,169) having the highest median family income of $134,359, while families with no earners (1,313) have the lowest median family income of $58,278, accounting for 15.4% and 17.3% of families, respectively.
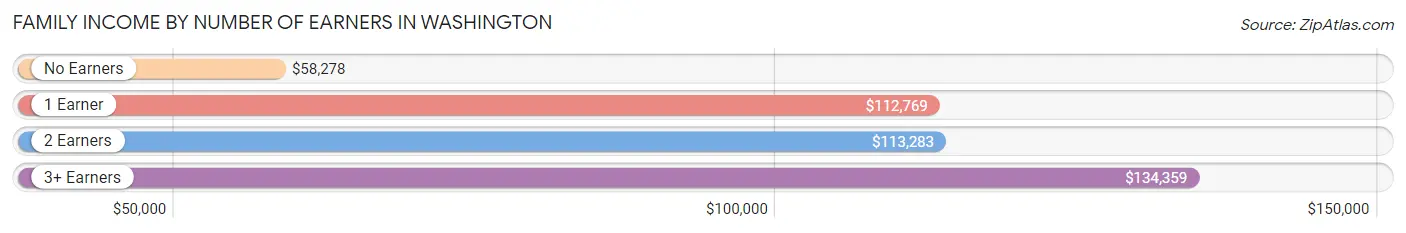
| Number of Earners | # Families | Median Income |
| No Earners | 1,313 (17.3%) | $58,278 |
| 1 Earner | 1,964 (26.0%) | $112,769 |
| 2 Earners | 3,121 (41.2%) | $113,283 |
| 3+ Earners | 1,169 (15.4%) | $134,359 |
| Total | 7,567 (100.0%) | $110,040 |
Household Income in Washington
Household Income Brackets in Washington
With 2,823 households falling in the category, the $100,000 to $149,999 income range is the most frequent in Washington, accounting for 29.0% of all households. In contrast, only 166 households (1.7%) fall into the less than $10,000 income bracket, making it the least populous group.
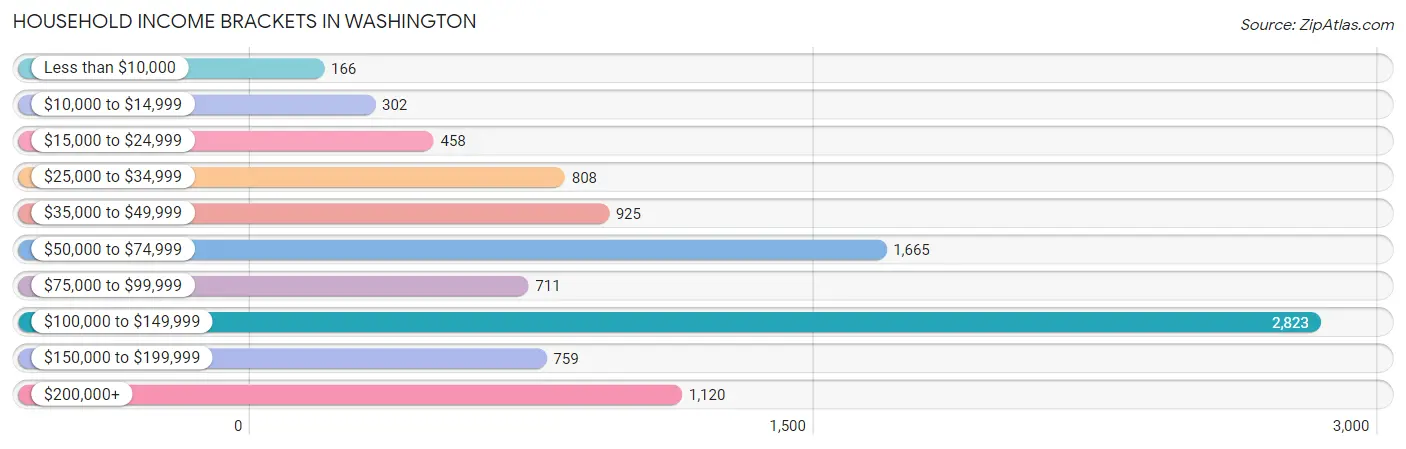
| Income Bracket | # Households | % Households |
| Less than $10,000 | 166 | 1.7% |
| $10,000 to $14,999 | 302 | 3.1% |
| $15,000 to $24,999 | 458 | 4.7% |
| $25,000 to $34,999 | 808 | 8.3% |
| $35,000 to $49,999 | 925 | 9.5% |
| $50,000 to $74,999 | 1,665 | 17.1% |
| $75,000 to $99,999 | 711 | 7.3% |
| $100,000 to $149,999 | 2,823 | 29.0% |
| $150,000 to $199,999 | 759 | 7.8% |
| $200,000+ | 1,120 | 11.5% |
Household Income by Householder Age in Washington
The median household income in Washington is $94,655, with the highest median household income of $119,330 found in the 45 to 64 years age bracket for the primary householder. A total of 2,687 households (27.6%) fall into this category. Meanwhile, the 65+ years age bracket for the primary householder has the lowest median household income of $58,087, with 3,014 households (31.0%) in this group.
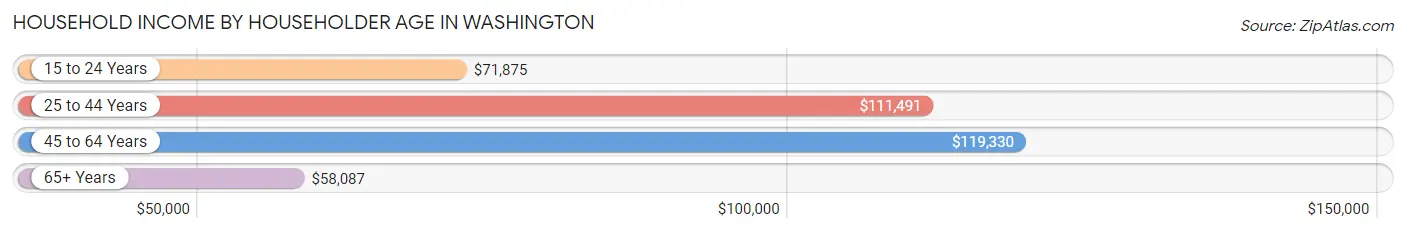
| Income Bracket | # Households | Median Income |
| 15 to 24 Years | 282 (2.9%) | $71,875 |
| 25 to 44 Years | 3,753 (38.6%) | $111,491 |
| 45 to 64 Years | 2,687 (27.6%) | $119,330 |
| 65+ Years | 3,014 (31.0%) | $58,087 |
| Total | 9,736 (100.0%) | $94,655 |
Poverty in Washington
Income Below Poverty by Sex and Age in Washington
With 3.4% poverty level for males and 4.7% for females among the residents of Washington, 75 year old and over males and 25 to 34 year old females are the most vulnerable to poverty, with 176 males (14.5%) and 195 females (9.5%) in their respective age groups living below the poverty level.
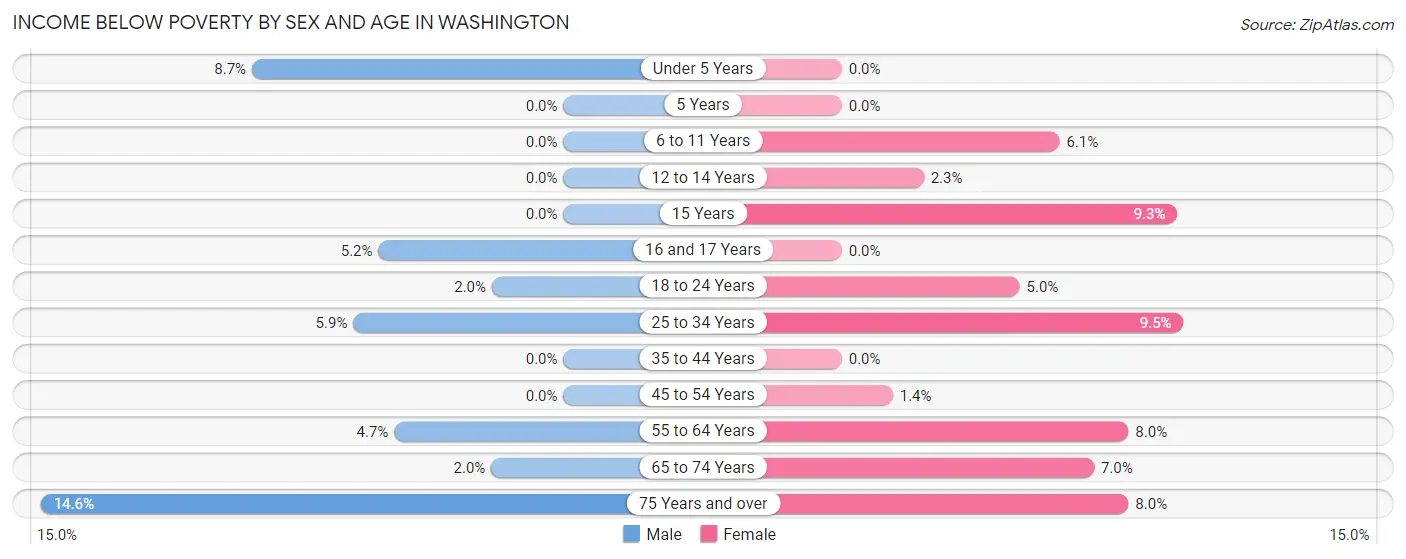
| Age Bracket | Male | Female |
| Under 5 Years | 67 (8.7%) | 0 (0.0%) |
| 5 Years | 0 (0.0%) | 0 (0.0%) |
| 6 to 11 Years | 0 (0.0%) | 85 (6.1%) |
| 12 to 14 Years | 0 (0.0%) | 14 (2.3%) |
| 15 Years | 0 (0.0%) | 17 (9.3%) |
| 16 and 17 Years | 10 (5.1%) | 0 (0.0%) |
| 18 to 24 Years | 25 (2.0%) | 56 (5.0%) |
| 25 to 34 Years | 113 (5.9%) | 195 (9.5%) |
| 35 to 44 Years | 0 (0.0%) | 0 (0.0%) |
| 45 to 54 Years | 0 (0.0%) | 21 (1.4%) |
| 55 to 64 Years | 57 (4.7%) | 108 (8.0%) |
| 65 to 74 Years | 27 (2.0%) | 125 (7.0%) |
| 75 Years and over | 176 (14.5%) | 85 (8.0%) |
| Total | 475 (3.4%) | 706 (4.7%) |
Income Above Poverty by Sex and Age in Washington
According to the poverty statistics in Washington, males aged 5 years and females aged under 5 years are the age groups that are most secure financially, with 100.0% of males and 100.0% of females in these age groups living above the poverty line.
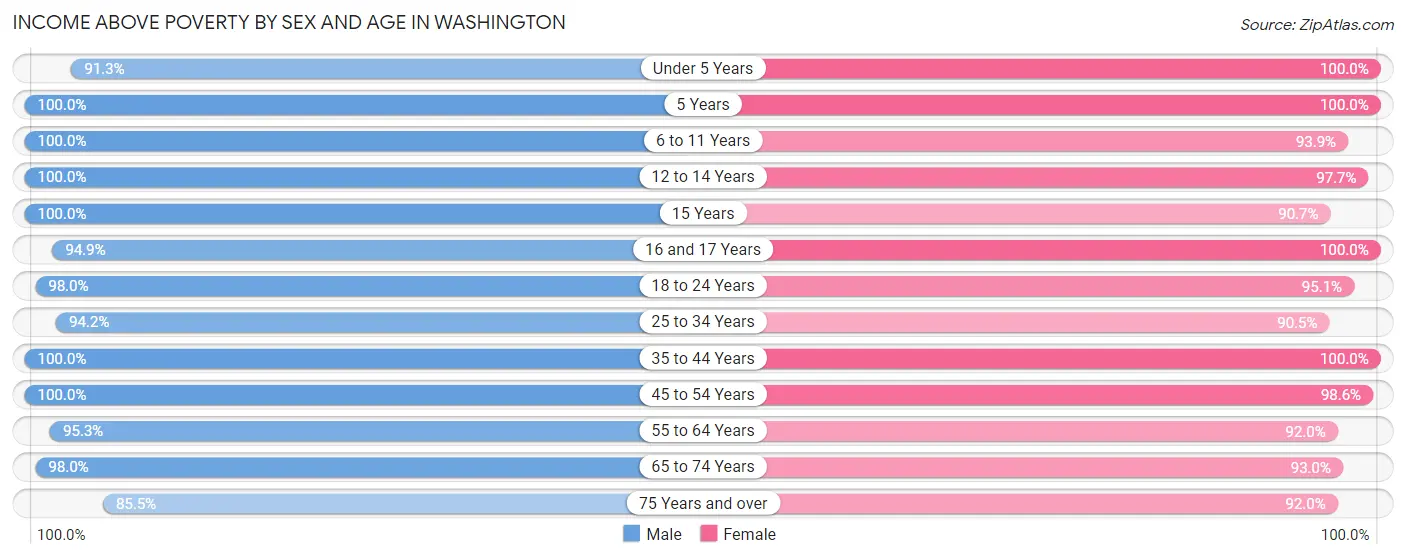
| Age Bracket | Male | Female |
| Under 5 Years | 706 (91.3%) | 1,110 (100.0%) |
| 5 Years | 202 (100.0%) | 88 (100.0%) |
| 6 to 11 Years | 1,417 (100.0%) | 1,318 (93.9%) |
| 12 to 14 Years | 797 (100.0%) | 601 (97.7%) |
| 15 Years | 244 (100.0%) | 165 (90.7%) |
| 16 and 17 Years | 184 (94.9%) | 665 (100.0%) |
| 18 to 24 Years | 1,229 (98.0%) | 1,075 (95.1%) |
| 25 to 34 Years | 1,820 (94.2%) | 1,855 (90.5%) |
| 35 to 44 Years | 2,108 (100.0%) | 2,072 (100.0%) |
| 45 to 54 Years | 1,435 (100.0%) | 1,461 (98.6%) |
| 55 to 64 Years | 1,154 (95.3%) | 1,246 (92.0%) |
| 65 to 74 Years | 1,315 (98.0%) | 1,655 (93.0%) |
| 75 Years and over | 1,034 (85.5%) | 980 (92.0%) |
| Total | 13,645 (96.6%) | 14,291 (95.3%) |
Income Below Poverty Among Married-Couple Families in Washington
The poverty statistics for married-couple families in Washington show that 4.1% or 290 of the total 7,038 families live below the poverty line. Families with 3 or 4 children have the highest poverty rate of 6.5%, comprising of 75 families. On the other hand, families with 1 or 2 children have the lowest poverty rate of 0.0%, which includes 0 families.
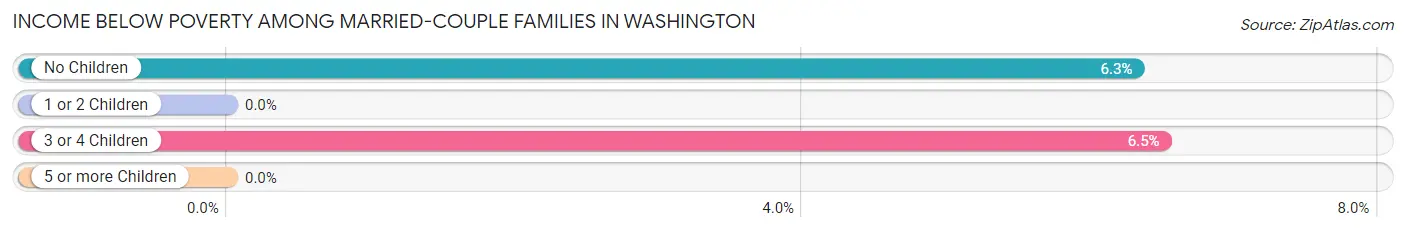
| Children | Above Poverty | Below Poverty |
| No Children | 3,191 (93.7%) | 215 (6.3%) |
| 1 or 2 Children | 2,382 (100.0%) | 0 (0.0%) |
| 3 or 4 Children | 1,079 (93.5%) | 75 (6.5%) |
| 5 or more Children | 96 (100.0%) | 0 (0.0%) |
| Total | 6,748 (95.9%) | 290 (4.1%) |
Income Below Poverty Among Single-Parent Households in Washington
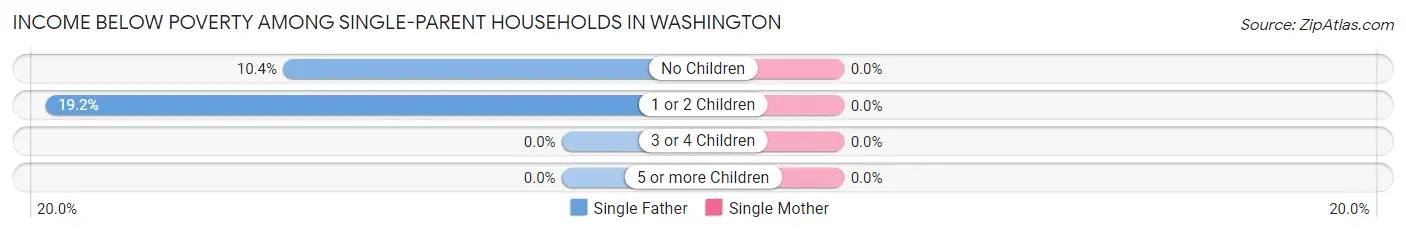
| Children | Single Father | Single Mother |
| No Children | 11 (10.4%) | 0 (0.0%) |
| 1 or 2 Children | 15 (19.2%) | 0 (0.0%) |
| 3 or 4 Children | 0 (0.0%) | 0 (0.0%) |
| 5 or more Children | 0 (0.0%) | 0 (0.0%) |
| Total | 26 (11.9%) | 0 (0.0%) |
Income Below Poverty Among Married-Couple vs Single-Parent Households in Washington
The poverty data for Washington shows that 290 of the married-couple family households (4.1%) and 26 of the single-parent households (4.9%) are living below the poverty level. Within the married-couple family households, those with 3 or 4 children have the highest poverty rate, with 75 households (6.5%) falling below the poverty line. Among the single-parent households, those with 1 or 2 children have the highest poverty rate, with 15 household (7.6%) living below poverty.
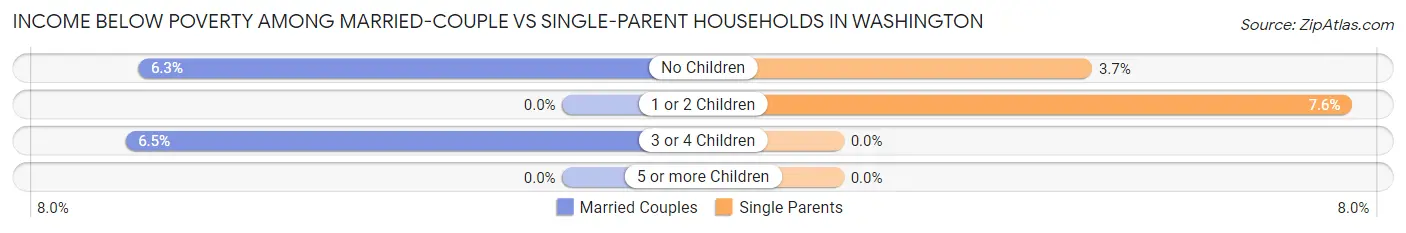
| Children | Married-Couple Families | Single-Parent Households |
| No Children | 215 (6.3%) | 11 (3.7%) |
| 1 or 2 Children | 0 (0.0%) | 15 (7.6%) |
| 3 or 4 Children | 75 (6.5%) | 0 (0.0%) |
| 5 or more Children | 0 (0.0%) | 0 (0.0%) |
| Total | 290 (4.1%) | 26 (4.9%) |
Race in Washington
The most populous races in Washington are White / Caucasian (24,927 | 85.5%), Hispanic or Latino (4,191 | 14.4%), and Two or more Races (1,597 | 5.5%).
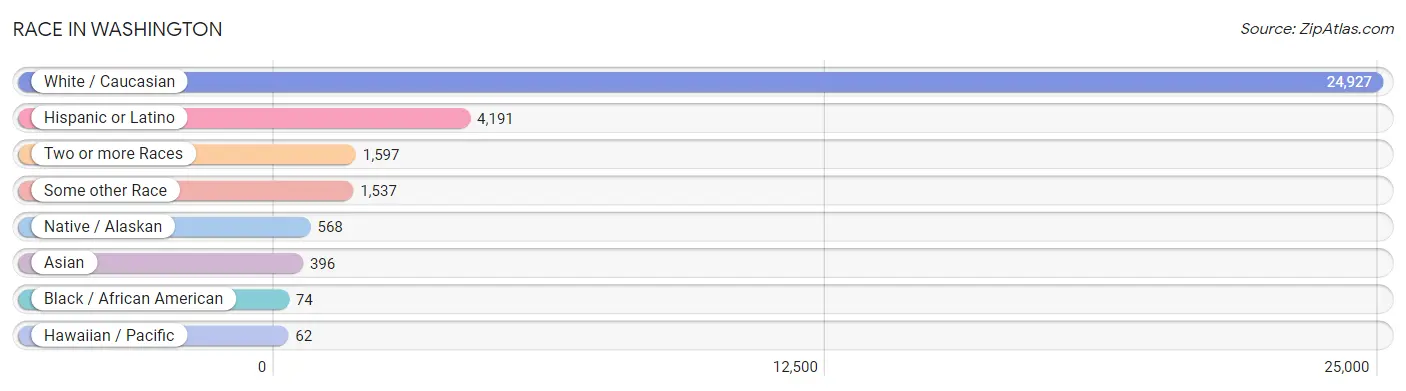
| Race | # Population | % Population |
| Asian | 396 | 1.4% |
| Black / African American | 74 | 0.3% |
| Hawaiian / Pacific | 62 | 0.2% |
| Hispanic or Latino | 4,191 | 14.4% |
| Native / Alaskan | 568 | 1.9% |
| White / Caucasian | 24,927 | 85.5% |
| Two or more Races | 1,597 | 5.5% |
| Some other Race | 1,537 | 5.3% |
| Total | 29,161 | 100.0% |
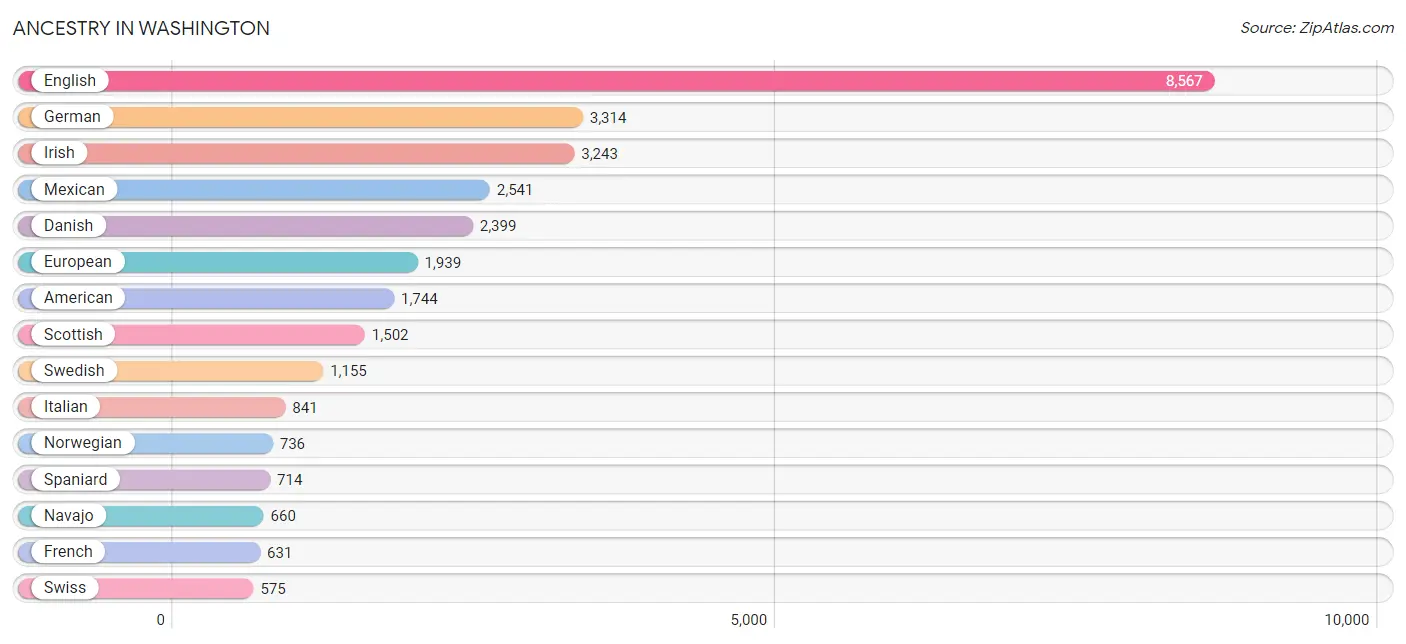
Ancestry in Washington
The most populous ancestries reported in Washington are English (8,567 | 29.4%), German (3,314 | 11.4%), Irish (3,243 | 11.1%), Mexican (2,541 | 8.7%), and Danish (2,399 | 8.2%), together accounting for 68.8% of all Washington residents.
| Ancestry | # Population | % Population |
| African | 18 | 0.1% |
| American | 1,744 | 6.0% |
| Australian | 16 | 0.1% |
| Austrian | 40 | 0.1% |
| Bhutanese | 91 | 0.3% |
| Brazilian | 86 | 0.3% |
| British | 253 | 0.9% |
| Burmese | 25 | 0.1% |
| Canadian | 177 | 0.6% |
| Central American | 107 | 0.4% |
| Colombian | 187 | 0.6% |
| Danish | 2,399 | 8.2% |
| Dutch | 340 | 1.2% |
| English | 8,567 | 29.4% |
| Estonian | 18 | 0.1% |
| European | 1,939 | 6.7% |
| Finnish | 238 | 0.8% |
| French | 631 | 2.2% |
| French Canadian | 163 | 0.6% |
| German | 3,314 | 11.4% |
| Greek | 62 | 0.2% |
| Guatemalan | 97 | 0.3% |
| Hungarian | 11 | 0.0% |
| Indian (Asian) | 201 | 0.7% |
| Irish | 3,243 | 11.1% |
| Italian | 841 | 2.9% |
| Korean | 169 | 0.6% |
| Laotian | 13 | 0.0% |
| Lithuanian | 33 | 0.1% |
| Mexican | 2,541 | 8.7% |
| Native Hawaiian | 76 | 0.3% |
| Navajo | 660 | 2.3% |
| Northern European | 21 | 0.1% |
| Norwegian | 736 | 2.5% |
| Panamanian | 10 | 0.0% |
| Pennsylvania German | 32 | 0.1% |
| Peruvian | 21 | 0.1% |
| Polish | 504 | 1.7% |
| Portuguese | 14 | 0.1% |
| Puerto Rican | 214 | 0.7% |
| Samoan | 158 | 0.5% |
| Scandinavian | 461 | 1.6% |
| Scotch-Irish | 410 | 1.4% |
| Scottish | 1,502 | 5.1% |
| Slovak | 68 | 0.2% |
| Slovene | 14 | 0.1% |
| South American | 208 | 0.7% |
| Spaniard | 714 | 2.5% |
| Spanish | 267 | 0.9% |
| Sri Lankan | 30 | 0.1% |
| Subsaharan African | 18 | 0.1% |
| Swedish | 1,155 | 4.0% |
| Swiss | 575 | 2.0% |
| Tongan | 172 | 0.6% |
| Ukrainian | 19 | 0.1% |
| Welsh | 494 | 1.7% | View All 56 Rows |
Immigrants in Washington
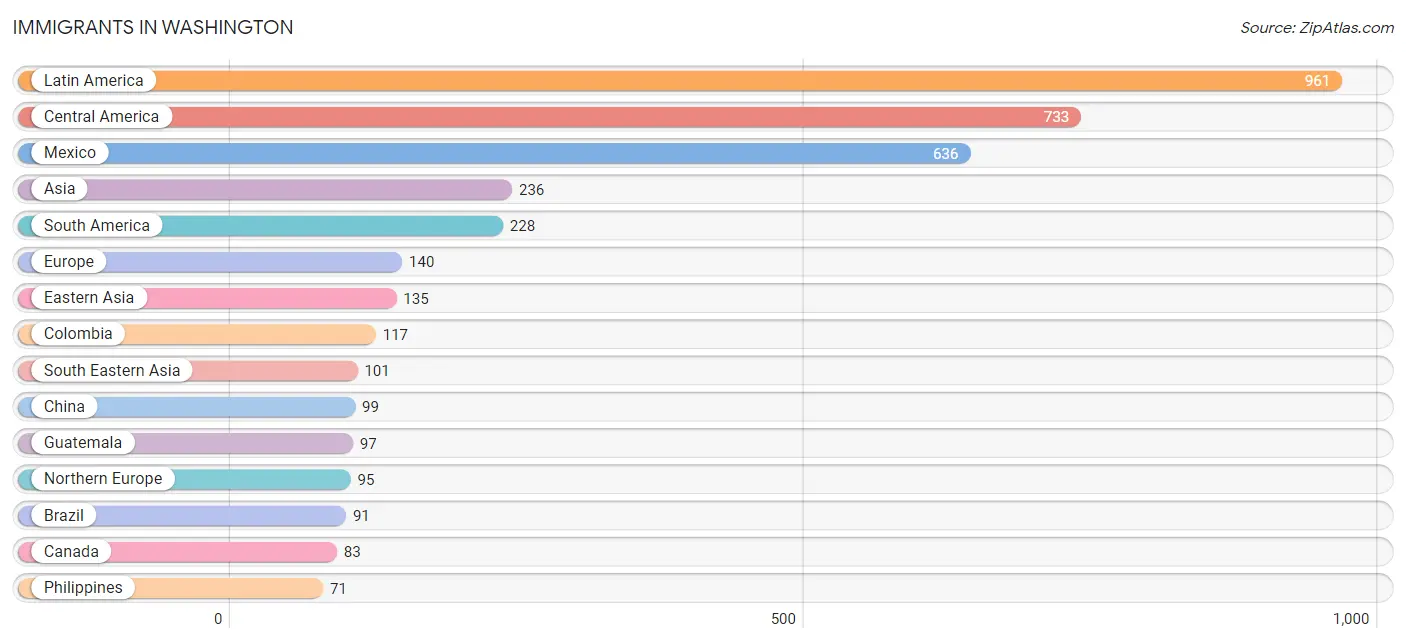
The most numerous immigrant groups reported in Washington came from Latin America (961 | 3.3%), Central America (733 | 2.5%), Mexico (636 | 2.2%), Asia (236 | 0.8%), and South America (228 | 0.8%), together accounting for 9.6% of all Washington residents.
| Immigration Origin | # Population | % Population |
| Asia | 236 | 0.8% |
| Brazil | 91 | 0.3% |
| Canada | 83 | 0.3% |
| Central America | 733 | 2.5% |
| China | 99 | 0.3% |
| Colombia | 117 | 0.4% |
| Denmark | 39 | 0.1% |
| Eastern Asia | 135 | 0.5% |
| Europe | 140 | 0.5% |
| Germany | 16 | 0.1% |
| Guatemala | 97 | 0.3% |
| Indonesia | 13 | 0.0% |
| Japan | 26 | 0.1% |
| Korea | 10 | 0.0% |
| Latin America | 961 | 3.3% |
| Malaysia | 17 | 0.1% |
| Mexico | 636 | 2.2% |
| Netherlands | 29 | 0.1% |
| Northern Europe | 95 | 0.3% |
| Oceania | 44 | 0.2% |
| Philippines | 71 | 0.2% |
| Scotland | 27 | 0.1% |
| South America | 228 | 0.8% |
| South Eastern Asia | 101 | 0.4% |
| Sweden | 19 | 0.1% |
| Venezuela | 20 | 0.1% |
| Western Europe | 45 | 0.2% | View All 27 Rows |
Sex and Age in Washington
Sex and Age in Washington
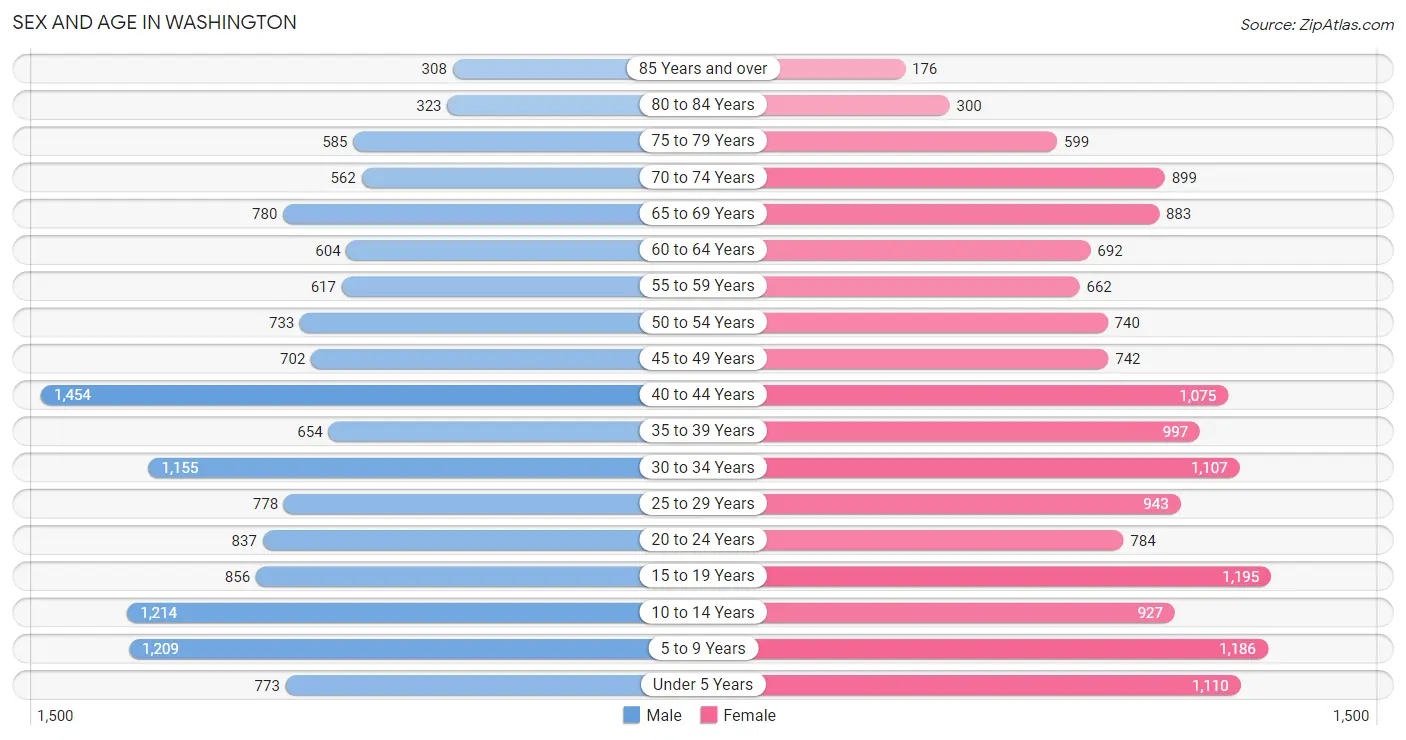
The most populous age groups in Washington are 40 to 44 Years (1,454 | 10.3%) for men and 15 to 19 Years (1,195 | 8.0%) for women.
| Age Bracket | Male | Female |
| Under 5 Years | 773 (5.5%) | 1,110 (7.4%) |
| 5 to 9 Years | 1,209 (8.6%) | 1,186 (7.9%) |
| 10 to 14 Years | 1,214 (8.6%) | 927 (6.2%) |
| 15 to 19 Years | 856 (6.0%) | 1,195 (8.0%) |
| 20 to 24 Years | 837 (5.9%) | 784 (5.2%) |
| 25 to 29 Years | 778 (5.5%) | 943 (6.3%) |
| 30 to 34 Years | 1,155 (8.2%) | 1,107 (7.4%) |
| 35 to 39 Years | 654 (4.6%) | 997 (6.6%) |
| 40 to 44 Years | 1,454 (10.3%) | 1,075 (7.2%) |
| 45 to 49 Years | 702 (5.0%) | 742 (4.9%) |
| 50 to 54 Years | 733 (5.2%) | 740 (4.9%) |
| 55 to 59 Years | 617 (4.4%) | 662 (4.4%) |
| 60 to 64 Years | 604 (4.3%) | 692 (4.6%) |
| 65 to 69 Years | 780 (5.5%) | 883 (5.9%) |
| 70 to 74 Years | 562 (4.0%) | 899 (6.0%) |
| 75 to 79 Years | 585 (4.1%) | 599 (4.0%) |
| 80 to 84 Years | 323 (2.3%) | 300 (2.0%) |
| 85 Years and over | 308 (2.2%) | 176 (1.2%) |
| Total | 14,144 (100.0%) | 15,017 (100.0%) |
Families and Households in Washington
Median Family Size in Washington
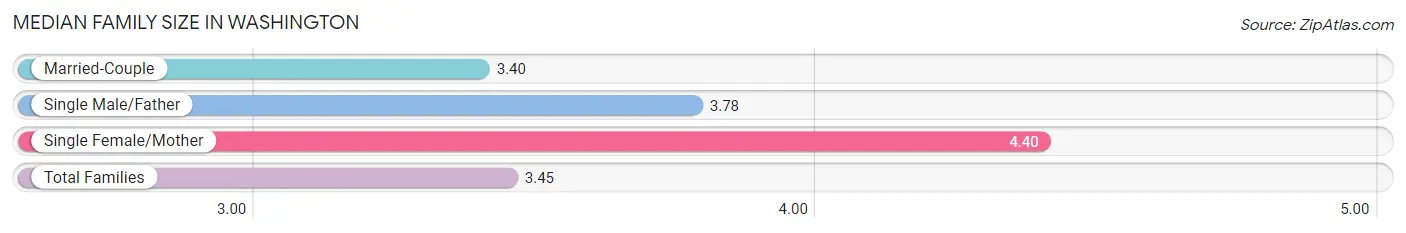
The median family size in Washington is 3.45 persons per family, with single female/mother families (311 | 4.1%) accounting for the largest median family size of 4.4 persons per family. On the other hand, married-couple families (7,038 | 93.0%) represent the smallest median family size with 3.40 persons per family.
| Family Type | # Families | Family Size |
| Married-Couple | 7,038 (93.0%) | 3.40 |
| Single Male/Father | 218 (2.9%) | 3.78 |
| Single Female/Mother | 311 (4.1%) | 4.40 |
| Total Families | 7,567 (100.0%) | 3.45 |
Median Household Size in Washington
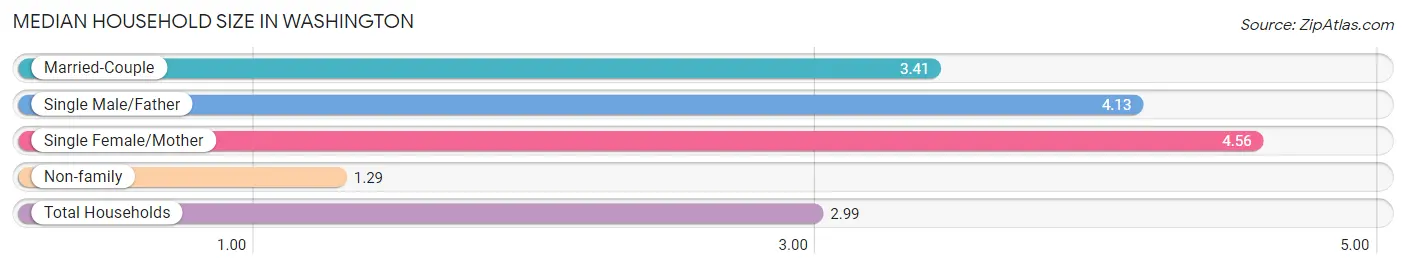
The median household size in Washington is 2.99 persons per household, with single female/mother households (311 | 3.2%) accounting for the largest median household size of 4.56 persons per household. non-family households (2,169 | 22.3%) represent the smallest median household size with 1.29 persons per household.
| Household Type | # Households | Household Size |
| Married-Couple | 7,038 (72.3%) | 3.41 |
| Single Male/Father | 218 (2.2%) | 4.13 |
| Single Female/Mother | 311 (3.2%) | 4.56 |
| Non-family | 2,169 (22.3%) | 1.29 |
| Total Households | 9,736 (100.0%) | 2.99 |
Household Size by Marriage Status in Washington
Out of a total of 9,736 households in Washington, 7,567 (77.7%) are family households, while 2,169 (22.3%) are nonfamily households. The most numerous type of family households are 2-person households, comprising 2,977, and the most common type of nonfamily households are 1-person households, comprising 1,803.
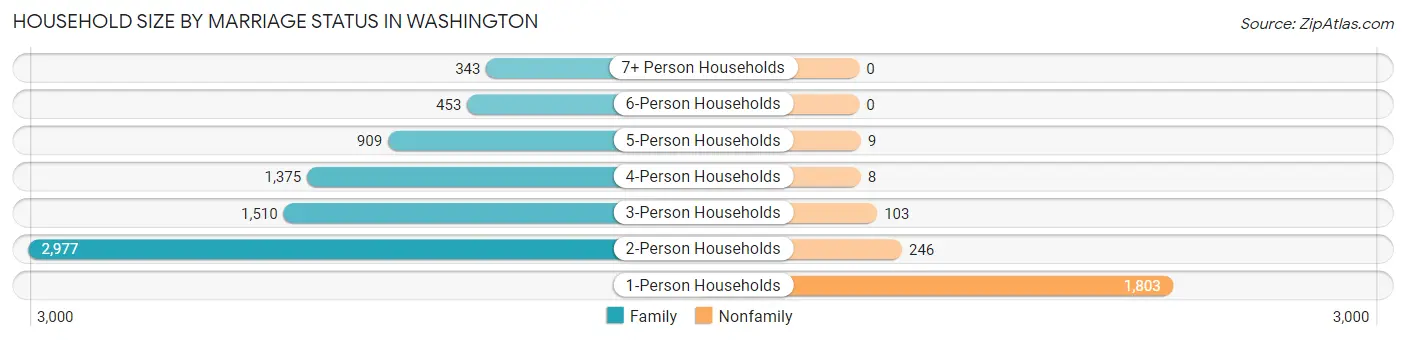
| Household Size | Family Households | Nonfamily Households |
| 1-Person Households | - | 1,803 (18.5%) |
| 2-Person Households | 2,977 (30.6%) | 246 (2.5%) |
| 3-Person Households | 1,510 (15.5%) | 103 (1.1%) |
| 4-Person Households | 1,375 (14.1%) | 8 (0.1%) |
| 5-Person Households | 909 (9.3%) | 9 (0.1%) |
| 6-Person Households | 453 (4.6%) | 0 (0.0%) |
| 7+ Person Households | 343 (3.5%) | 0 (0.0%) |
| Total | 7,567 (77.7%) | 2,169 (22.3%) |
Female Fertility in Washington
Fertility by Age in Washington
Average fertility rate in Washington is 79.0 births per 1,000 women. Women in the age bracket of 20 to 34 years have the highest fertility rate with 124.0 births per 1,000 women. Women in the age bracket of 20 to 34 years acount for 62.4% of all women with births.
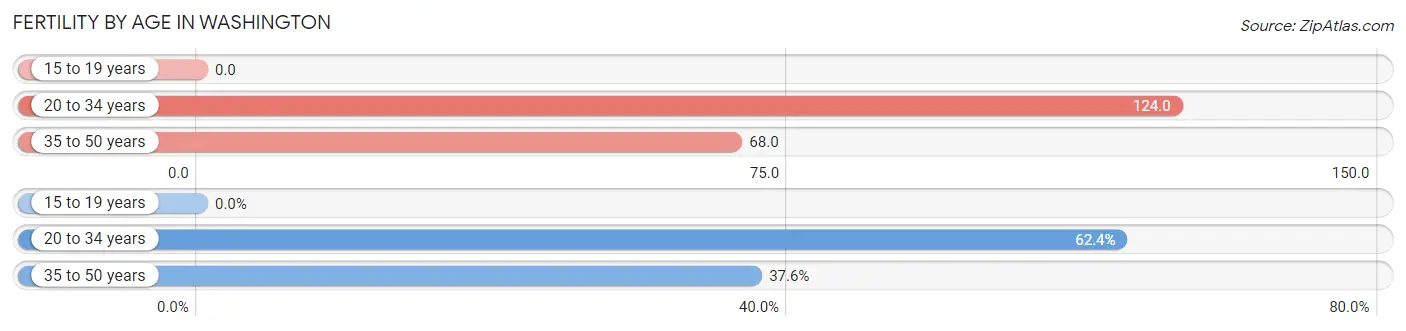
| Age Bracket | Women with Births | Births / 1,000 Women |
| 15 to 19 years | 0 (0.0%) | 0.0 |
| 20 to 34 years | 350 (62.4%) | 124.0 |
| 35 to 50 years | 211 (37.6%) | 68.0 |
| Total | 561 (100.0%) | 79.0 |
Fertility by Age by Marriage Status in Washington
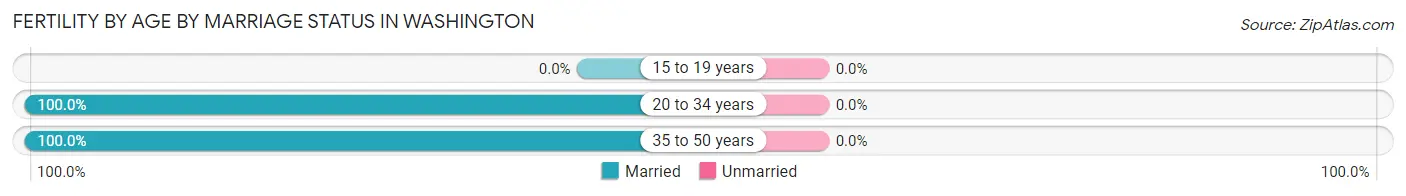
| Age Bracket | Married | Unmarried |
| 15 to 19 years | 0 (0.0%) | 0 (0.0%) |
| 20 to 34 years | 350 (100.0%) | 0 (0.0%) |
| 35 to 50 years | 211 (100.0%) | 0 (0.0%) |
| Total | 561 (100.0%) | 0 (0.0%) |
Fertility by Education in Washington
Average fertility rate in Washington is 79.0 births per 1,000 women. Women with the education attainment of bachelor's degree have the highest fertility rate of 170.0 births per 1,000 women, while women with the education attainment of high school diploma have the lowest fertility at 20.0 births per 1,000 women. Women with the education attainment of college or associate's degree represent 39.8% of all women with births.
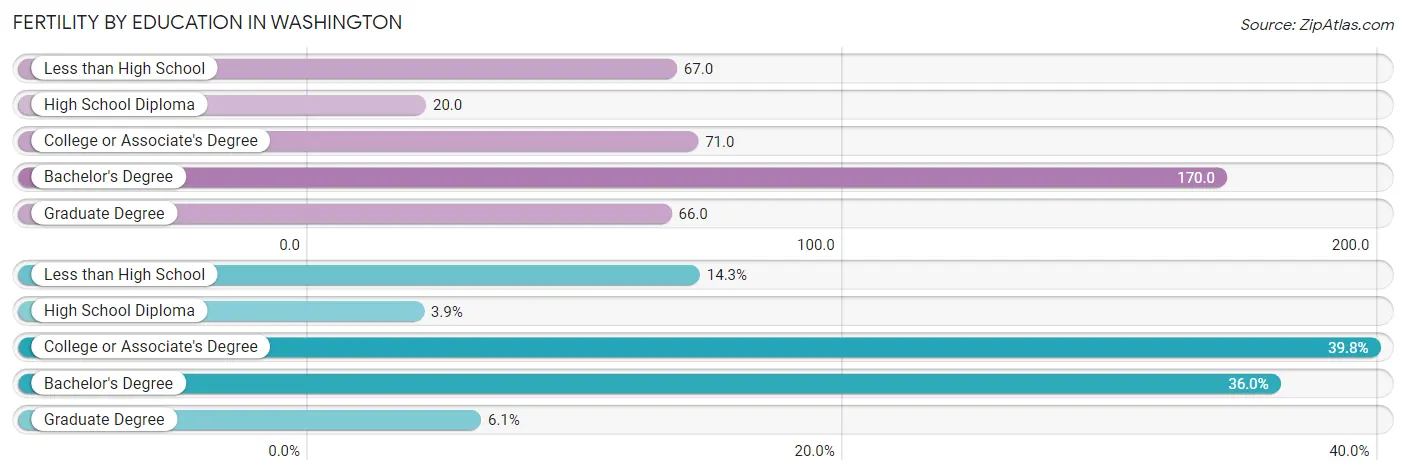
| Educational Attainment | Women with Births | Births / 1,000 Women |
| Less than High School | 80 (14.3%) | 67.0 |
| High School Diploma | 22 (3.9%) | 20.0 |
| College or Associate's Degree | 223 (39.8%) | 71.0 |
| Bachelor's Degree | 202 (36.0%) | 170.0 |
| Graduate Degree | 34 (6.1%) | 66.0 |
| Total | 561 (100.0%) | 79.0 |
Fertility by Education by Marriage Status in Washington
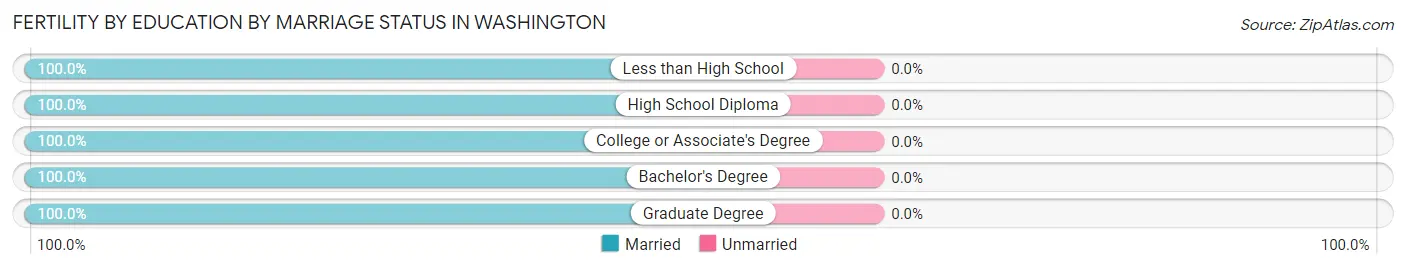
| Educational Attainment | Married | Unmarried |
| Less than High School | 80 (100.0%) | 0 (0.0%) |
| High School Diploma | 22 (100.0%) | 0 (0.0%) |
| College or Associate's Degree | 223 (100.0%) | 0 (0.0%) |
| Bachelor's Degree | 202 (100.0%) | 0 (0.0%) |
| Graduate Degree | 34 (100.0%) | 0 (0.0%) |
| Total | 561 (100.0%) | 0 (0.0%) |
Employment Characteristics in Washington
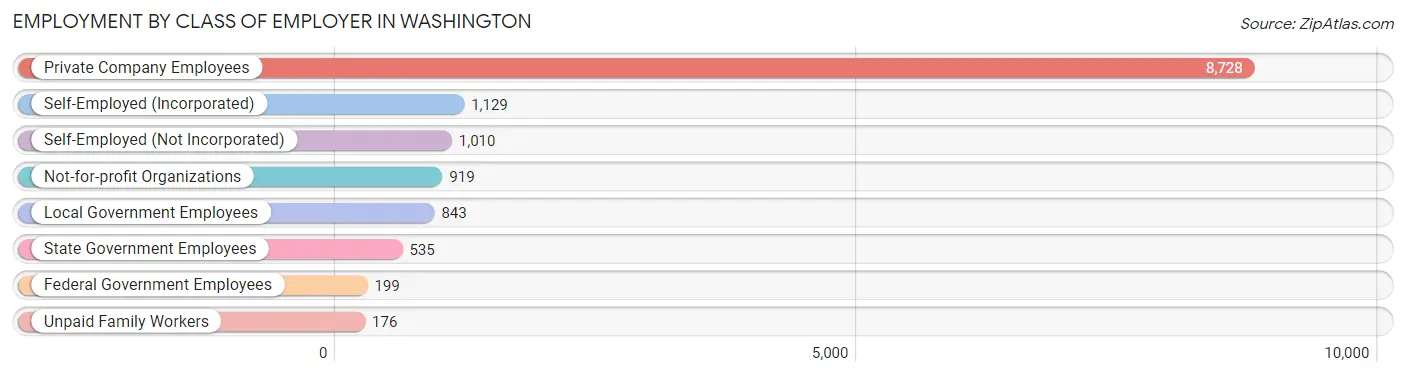
Employment by Class of Employer in Washington
Among the 13,539 employed individuals in Washington, private company employees (8,728 | 64.5%), self-employed (incorporated) (1,129 | 8.3%), and self-employed (not incorporated) (1,010 | 7.5%) make up the most common classes of employment.
| Employer Class | # Employees | % Employees |
| Private Company Employees | 8,728 | 64.5% |
| Self-Employed (Incorporated) | 1,129 | 8.3% |
| Self-Employed (Not Incorporated) | 1,010 | 7.5% |
| Not-for-profit Organizations | 919 | 6.8% |
| Local Government Employees | 843 | 6.2% |
| State Government Employees | 535 | 4.0% |
| Federal Government Employees | 199 | 1.5% |
| Unpaid Family Workers | 176 | 1.3% |
| Total | 13,539 | 100.0% |
Employment Status by Age in Washington
According to the labor force statistics for Washington, out of the total population over 16 years of age (22,314), 61.8% or 13,790 individuals are in the labor force, with 0.8% or 110 of them unemployed. The age group with the highest labor force participation rate is 20 to 24 years, with 94.3% or 1,529 individuals in the labor force. Within the labor force, the 75 years and over age range has the highest percentage of unemployed individuals, with 4.1% or 10 of them being unemployed.
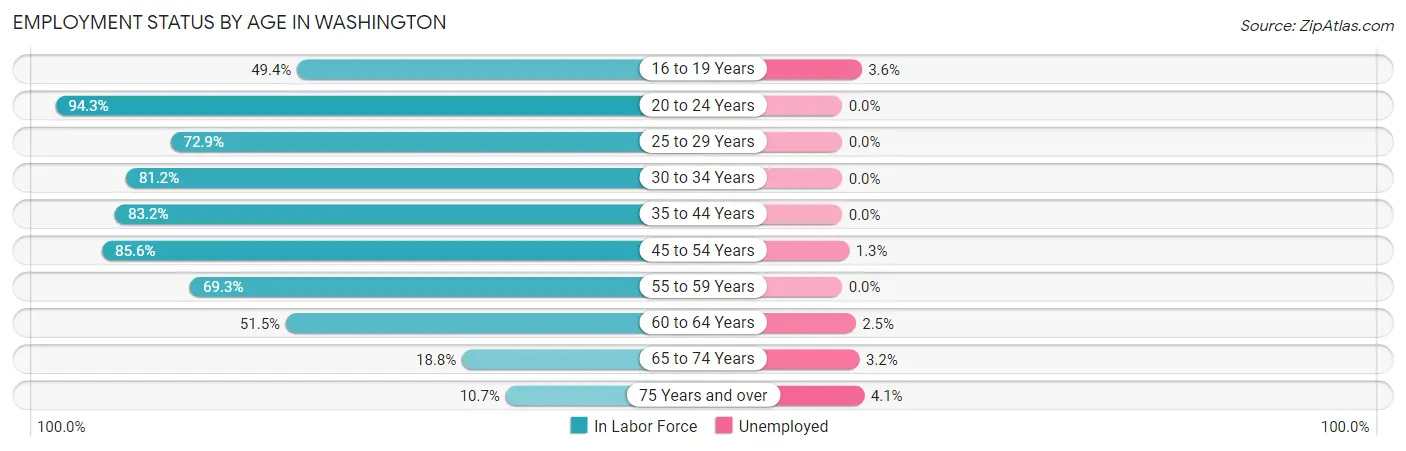
| Age Bracket | In Labor Force | Unemployed |
| 16 to 19 Years | 802 (49.4%) | 29 (3.6%) |
| 20 to 24 Years | 1,529 (94.3%) | 0 (0.0%) |
| 25 to 29 Years | 1,255 (72.9%) | 0 (0.0%) |
| 30 to 34 Years | 1,837 (81.2%) | 0 (0.0%) |
| 35 to 44 Years | 3,478 (83.2%) | 0 (0.0%) |
| 45 to 54 Years | 2,497 (85.6%) | 32 (1.3%) |
| 55 to 59 Years | 886 (69.3%) | 0 (0.0%) |
| 60 to 64 Years | 667 (51.5%) | 17 (2.5%) |
| 65 to 74 Years | 587 (18.8%) | 19 (3.2%) |
| 75 Years and over | 245 (10.7%) | 10 (4.1%) |
| Total | 13,790 (61.8%) | 110 (0.8%) |
Employment Status by Educational Attainment in Washington
According to labor force statistics for Washington, 77.8% of individuals (10,624) out of the total population between 25 and 64 years of age (13,655) are in the labor force, with 0.5% or 53 of them being unemployed. The group with the highest labor force participation rate are those with the educational attainment of bachelor's degree or higher, with 83.0% or 4,118 individuals in the labor force. Within the labor force, individuals with college / associate degree education have the highest percentage of unemployment, with 1.2% or 48 of them being unemployed.
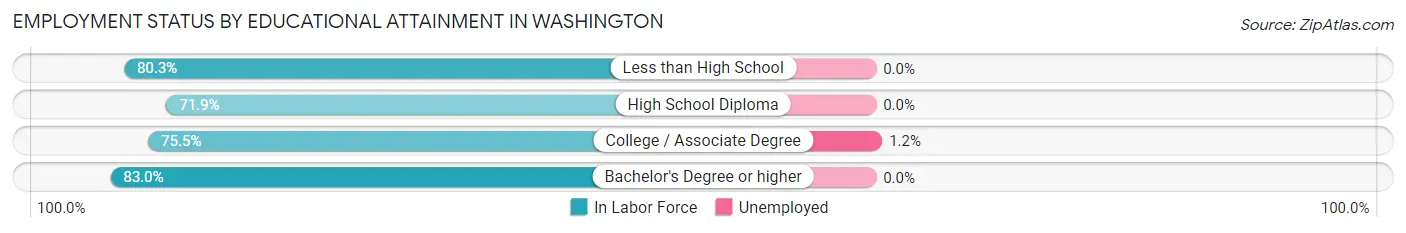
| Educational Attainment | In Labor Force | Unemployed |
| Less than High School | 550 (80.3%) | 0 (0.0%) |
| High School Diploma | 1,917 (71.9%) | 0 (0.0%) |
| College / Associate Degree | 4,033 (75.5%) | 64 (1.2%) |
| Bachelor's Degree or higher | 4,118 (83.0%) | 0 (0.0%) |
| Total | 10,624 (77.8%) | 68 (0.5%) |
Employment Occupations by Sex in Washington
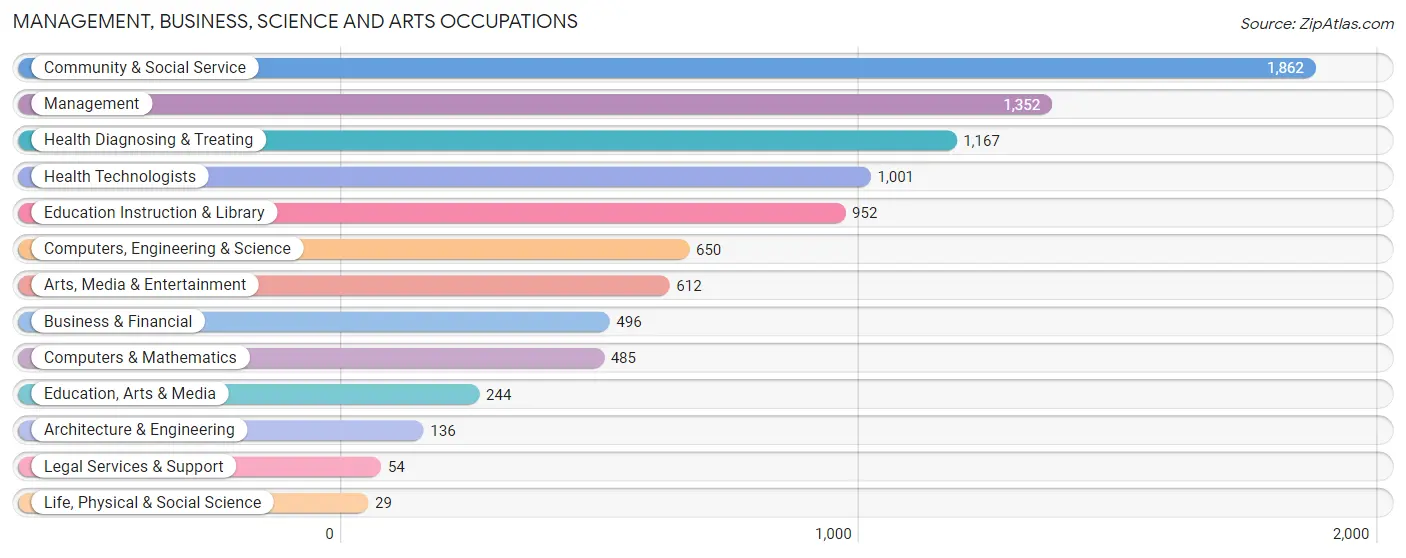
Management, Business, Science and Arts Occupations
The most common Management, Business, Science and Arts occupations in Washington are Community & Social Service (1,862 | 13.6%), Management (1,352 | 9.9%), Health Diagnosing & Treating (1,167 | 8.5%), Health Technologists (1,001 | 7.3%), and Education Instruction & Library (952 | 7.0%).
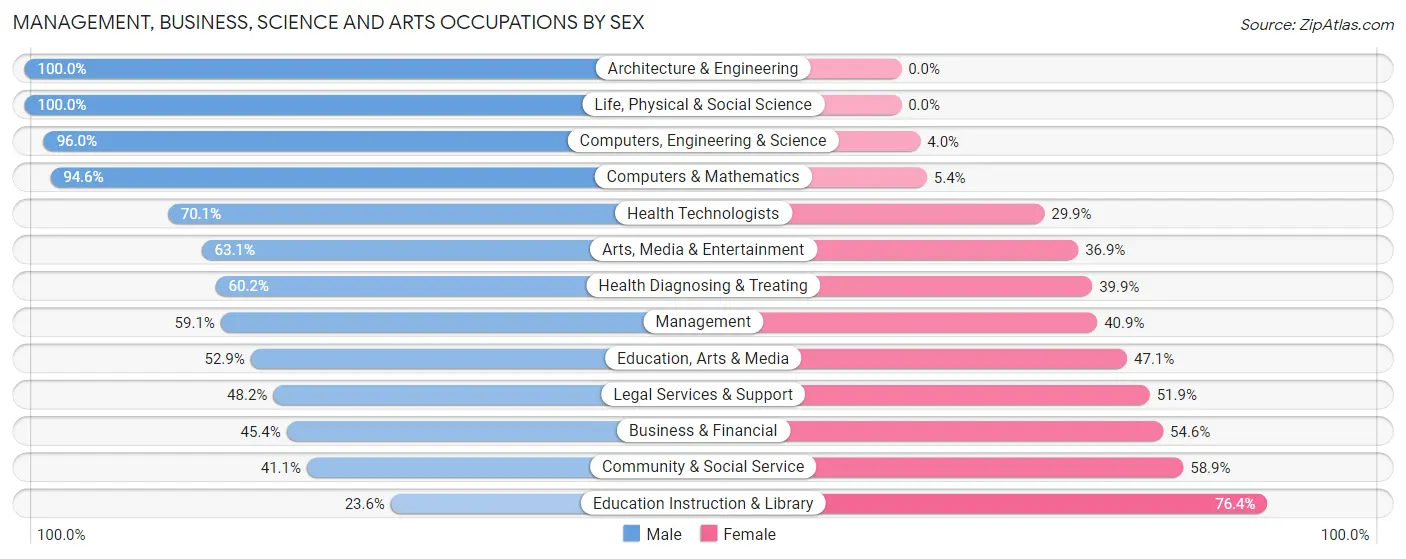
Management, Business, Science and Arts Occupations by Sex
Within the Management, Business, Science and Arts occupations in Washington, the most male-oriented occupations are Architecture & Engineering (100.0%), Life, Physical & Social Science (100.0%), and Computers, Engineering & Science (96.0%), while the most female-oriented occupations are Education Instruction & Library (76.4%), Community & Social Service (58.9%), and Business & Financial (54.6%).
| Occupation | Male | Female |
| Management | 799 (59.1%) | 553 (40.9%) |
| Business & Financial | 225 (45.4%) | 271 (54.6%) |
| Computers, Engineering & Science | 624 (96.0%) | 26 (4.0%) |
| Computers & Mathematics | 459 (94.6%) | 26 (5.4%) |
| Architecture & Engineering | 136 (100.0%) | 0 (0.0%) |
| Life, Physical & Social Science | 29 (100.0%) | 0 (0.0%) |
| Community & Social Service | 766 (41.1%) | 1,096 (58.9%) |
| Education, Arts & Media | 129 (52.9%) | 115 (47.1%) |
| Legal Services & Support | 26 (48.1%) | 28 (51.8%) |
| Education Instruction & Library | 225 (23.6%) | 727 (76.4%) |
| Arts, Media & Entertainment | 386 (63.1%) | 226 (36.9%) |
| Health Diagnosing & Treating | 702 (60.2%) | 465 (39.9%) |
| Health Technologists | 702 (70.1%) | 299 (29.9%) |
| Total (Category) | 3,116 (56.4%) | 2,411 (43.6%) |
| Total (Overall) | 7,228 (52.9%) | 6,447 (47.1%) |
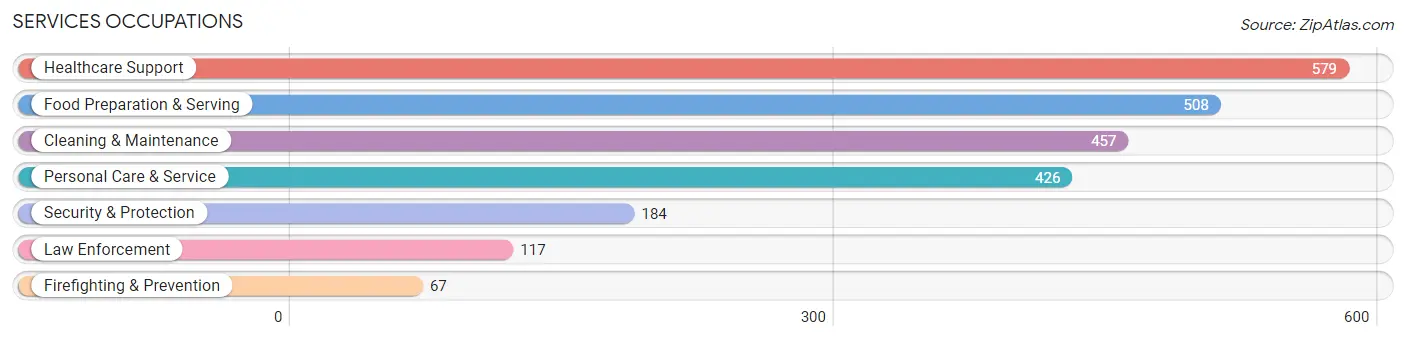
Services Occupations
The most common Services occupations in Washington are Healthcare Support (579 | 4.2%), Food Preparation & Serving (508 | 3.7%), Cleaning & Maintenance (457 | 3.3%), Personal Care & Service (426 | 3.1%), and Security & Protection (184 | 1.3%).
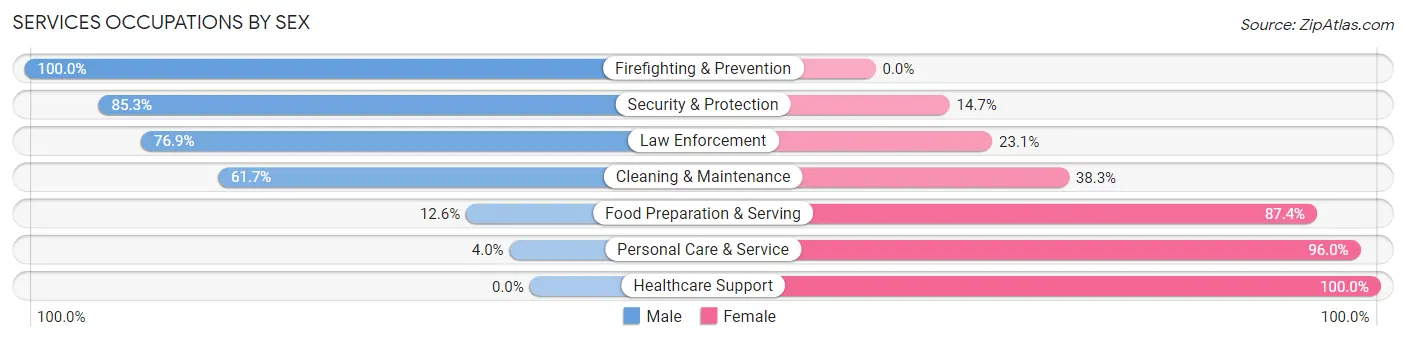
Services Occupations by Sex
Within the Services occupations in Washington, the most male-oriented occupations are Firefighting & Prevention (100.0%), Security & Protection (85.3%), and Law Enforcement (76.9%), while the most female-oriented occupations are Healthcare Support (100.0%), Personal Care & Service (96.0%), and Food Preparation & Serving (87.4%).
| Occupation | Male | Female |
| Healthcare Support | 0 (0.0%) | 579 (100.0%) |
| Security & Protection | 157 (85.3%) | 27 (14.7%) |
| Firefighting & Prevention | 67 (100.0%) | 0 (0.0%) |
| Law Enforcement | 90 (76.9%) | 27 (23.1%) |
| Food Preparation & Serving | 64 (12.6%) | 444 (87.4%) |
| Cleaning & Maintenance | 282 (61.7%) | 175 (38.3%) |
| Personal Care & Service | 17 (4.0%) | 409 (96.0%) |
| Total (Category) | 520 (24.1%) | 1,634 (75.9%) |
| Total (Overall) | 7,228 (52.9%) | 6,447 (47.1%) |
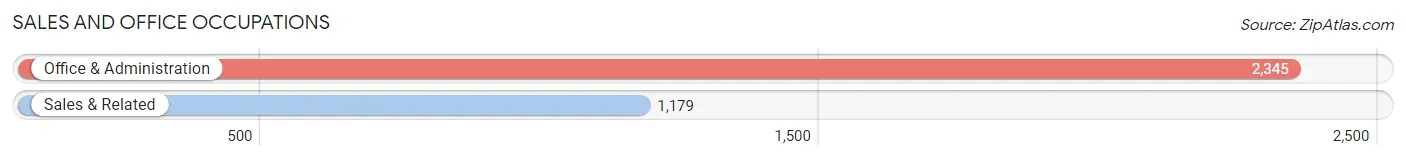
Sales and Office Occupations
The most common Sales and Office occupations in Washington are Office & Administration (2,345 | 17.2%), and Sales & Related (1,179 | 8.6%).
Sales and Office Occupations by Sex
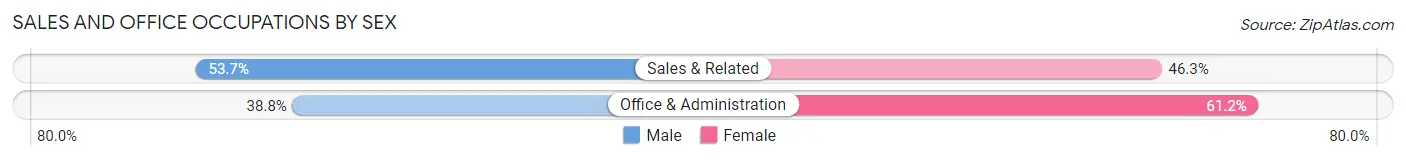
| Occupation | Male | Female |
| Sales & Related | 633 (53.7%) | 546 (46.3%) |
| Office & Administration | 909 (38.8%) | 1,436 (61.2%) |
| Total (Category) | 1,542 (43.8%) | 1,982 (56.2%) |
| Total (Overall) | 7,228 (52.9%) | 6,447 (47.1%) |
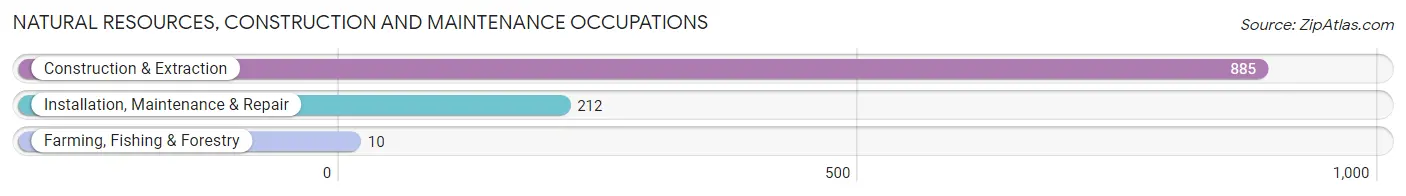
Natural Resources, Construction and Maintenance Occupations
The most common Natural Resources, Construction and Maintenance occupations in Washington are Construction & Extraction (885 | 6.5%), Installation, Maintenance & Repair (212 | 1.5%), and Farming, Fishing & Forestry (10 | 0.1%).
Natural Resources, Construction and Maintenance Occupations by Sex
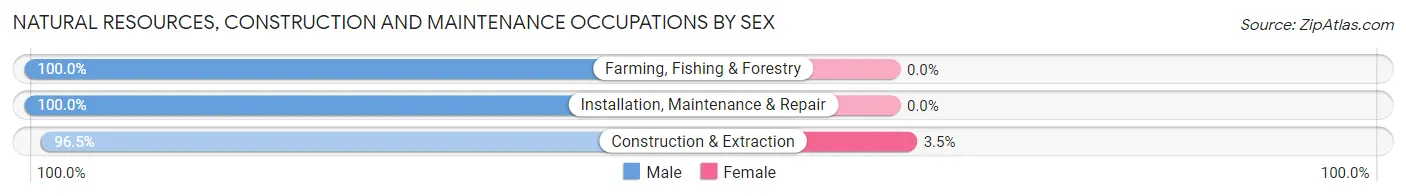
| Occupation | Male | Female |
| Farming, Fishing & Forestry | 10 (100.0%) | 0 (0.0%) |
| Construction & Extraction | 854 (96.5%) | 31 (3.5%) |
| Installation, Maintenance & Repair | 212 (100.0%) | 0 (0.0%) |
| Total (Category) | 1,076 (97.2%) | 31 (2.8%) |
| Total (Overall) | 7,228 (52.9%) | 6,447 (47.1%) |
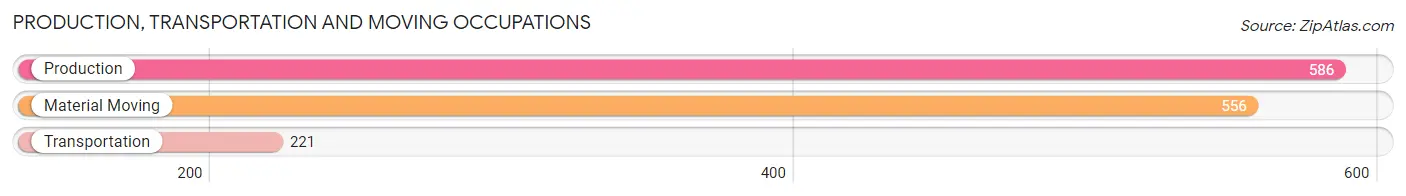
Production, Transportation and Moving Occupations
The most common Production, Transportation and Moving occupations in Washington are Production (586 | 4.3%), Material Moving (556 | 4.1%), and Transportation (221 | 1.6%).
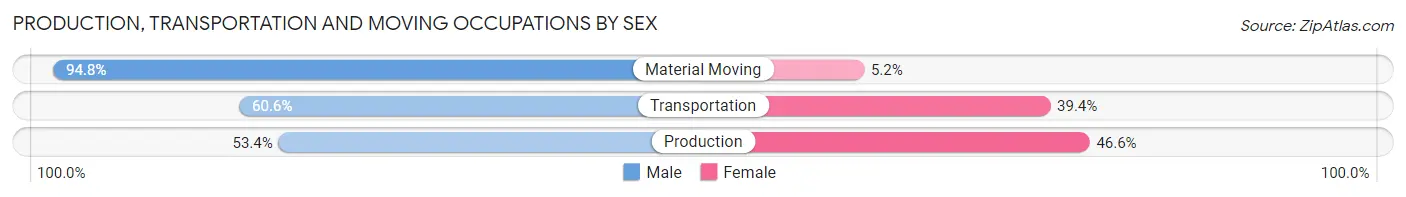
Production, Transportation and Moving Occupations by Sex
| Occupation | Male | Female |
| Production | 313 (53.4%) | 273 (46.6%) |
| Transportation | 134 (60.6%) | 87 (39.4%) |
| Material Moving | 527 (94.8%) | 29 (5.2%) |
| Total (Category) | 974 (71.5%) | 389 (28.5%) |
| Total (Overall) | 7,228 (52.9%) | 6,447 (47.1%) |
Employment Industries by Sex in Washington
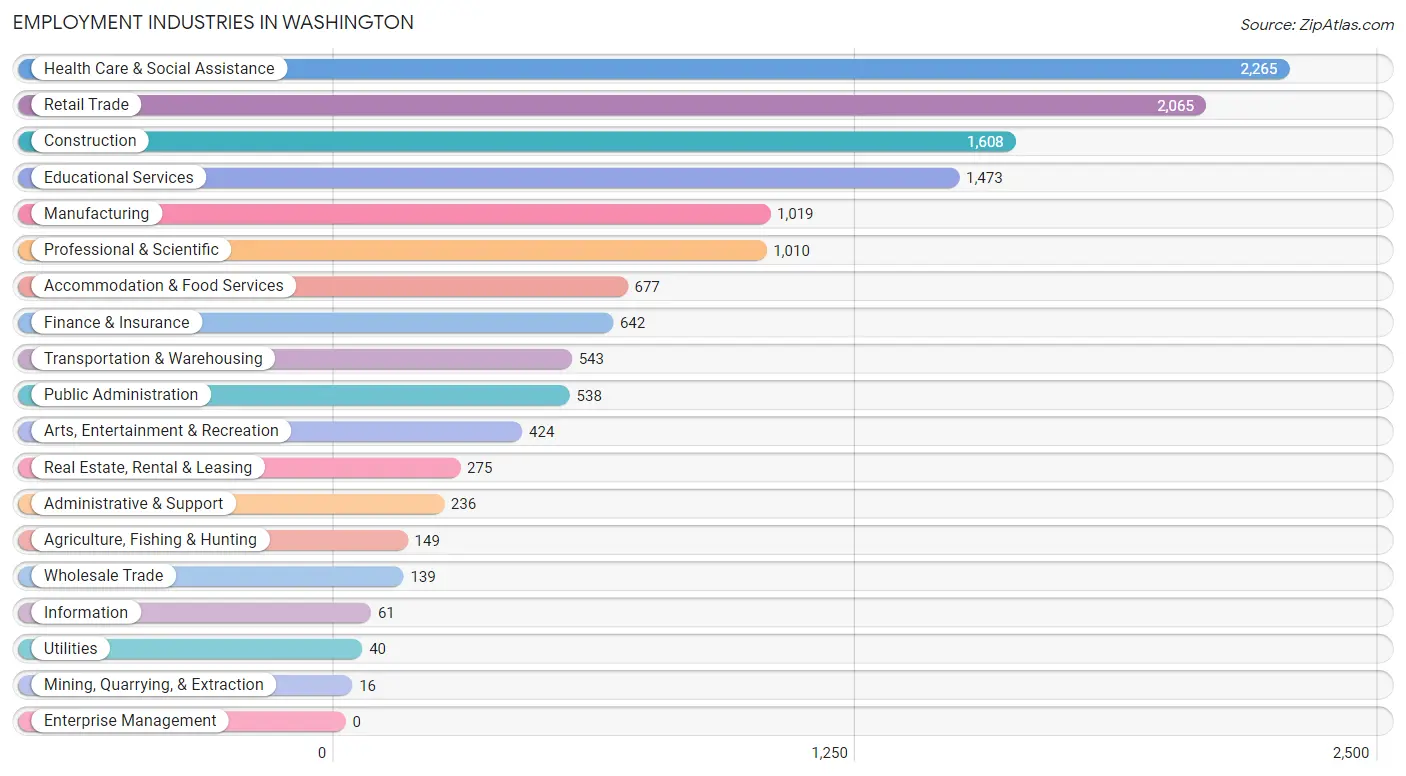
Employment Industries in Washington
The major employment industries in Washington include Health Care & Social Assistance (2,265 | 16.6%), Retail Trade (2,065 | 15.1%), Construction (1,608 | 11.8%), Educational Services (1,473 | 10.8%), and Manufacturing (1,019 | 7.4%).
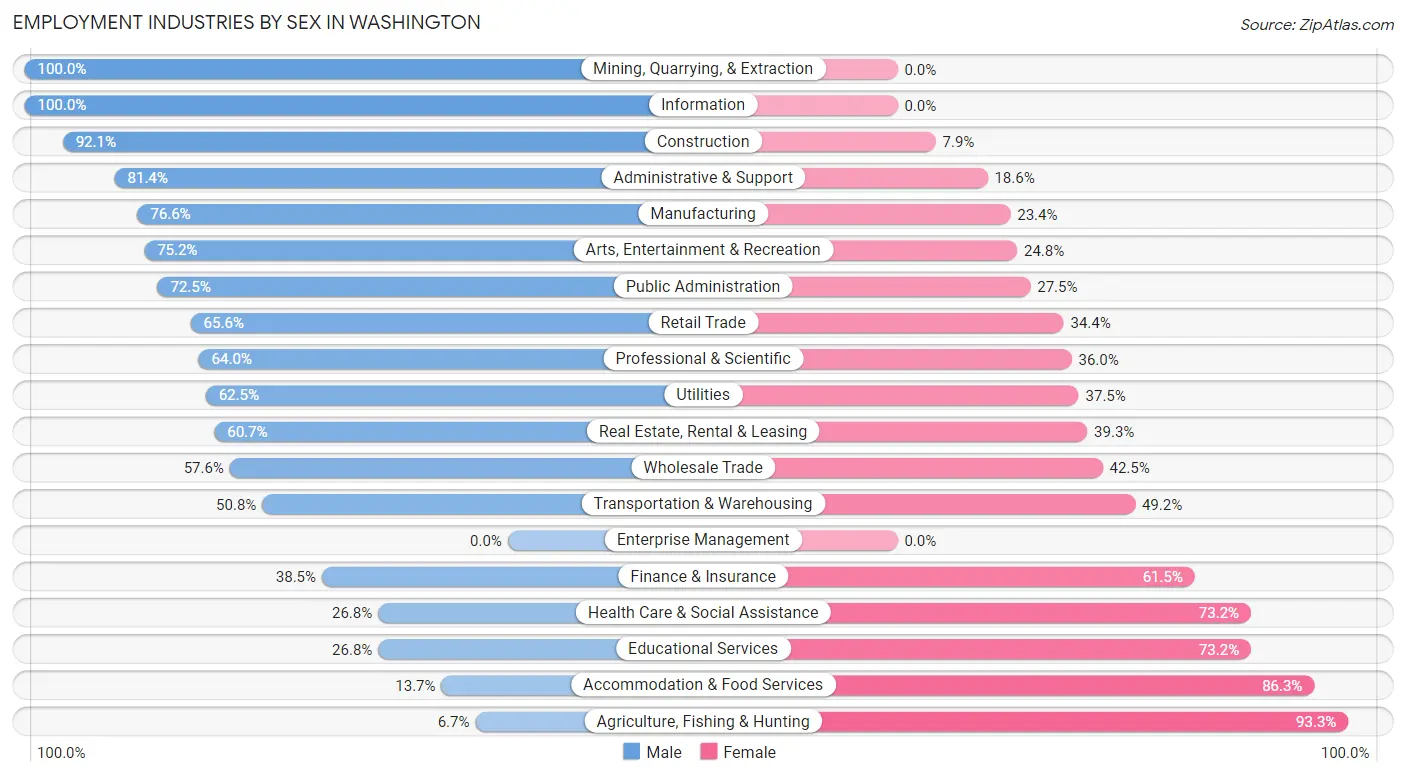
Employment Industries by Sex in Washington
The Washington industries that see more men than women are Mining, Quarrying, & Extraction (100.0%), Information (100.0%), and Construction (92.1%), whereas the industries that tend to have a higher number of women are Agriculture, Fishing & Hunting (93.3%), Accommodation & Food Services (86.3%), and Educational Services (73.2%).
| Industry | Male | Female |
| Agriculture, Fishing & Hunting | 10 (6.7%) | 139 (93.3%) |
| Mining, Quarrying, & Extraction | 16 (100.0%) | 0 (0.0%) |
| Construction | 1,481 (92.1%) | 127 (7.9%) |
| Manufacturing | 781 (76.6%) | 238 (23.4%) |
| Wholesale Trade | 80 (57.6%) | 59 (42.4%) |
| Retail Trade | 1,355 (65.6%) | 710 (34.4%) |
| Transportation & Warehousing | 276 (50.8%) | 267 (49.2%) |
| Utilities | 25 (62.5%) | 15 (37.5%) |
| Information | 61 (100.0%) | 0 (0.0%) |
| Finance & Insurance | 247 (38.5%) | 395 (61.5%) |
| Real Estate, Rental & Leasing | 167 (60.7%) | 108 (39.3%) |
| Professional & Scientific | 646 (64.0%) | 364 (36.0%) |
| Enterprise Management | 0 (0.0%) | 0 (0.0%) |
| Administrative & Support | 192 (81.4%) | 44 (18.6%) |
| Educational Services | 395 (26.8%) | 1,078 (73.2%) |
| Health Care & Social Assistance | 608 (26.8%) | 1,657 (73.2%) |
| Arts, Entertainment & Recreation | 319 (75.2%) | 105 (24.8%) |
| Accommodation & Food Services | 93 (13.7%) | 584 (86.3%) |
| Public Administration | 390 (72.5%) | 148 (27.5%) |
| Total | 7,228 (52.9%) | 6,447 (47.1%) |
Education in Washington
School Enrollment in Washington
The most common levels of schooling among the 7,774 students in Washington are high school (2,036 | 26.2%), elementary school (1,825 | 23.5%), and middle school (1,555 | 20.0%).
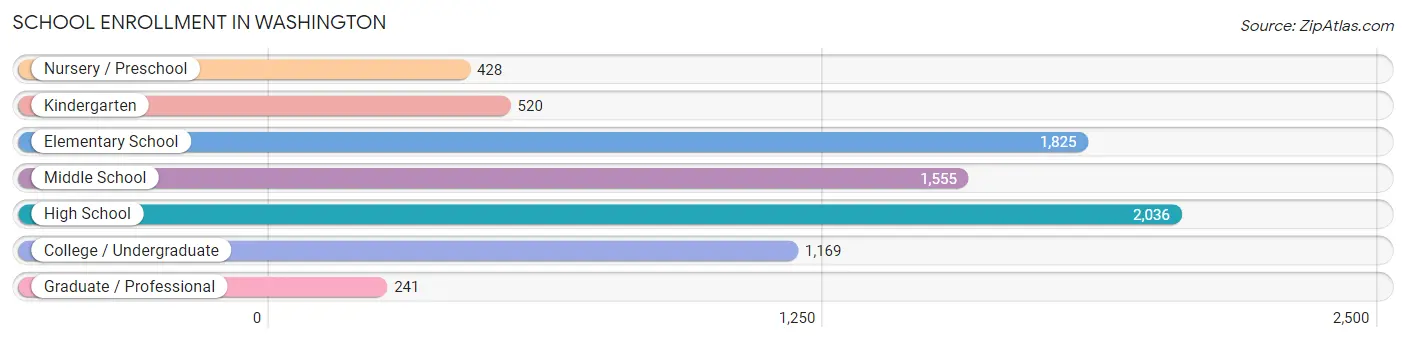
| School Level | # Students | % Students |
| Nursery / Preschool | 428 | 5.5% |
| Kindergarten | 520 | 6.7% |
| Elementary School | 1,825 | 23.5% |
| Middle School | 1,555 | 20.0% |
| High School | 2,036 | 26.2% |
| College / Undergraduate | 1,169 | 15.0% |
| Graduate / Professional | 241 | 3.1% |
| Total | 7,774 | 100.0% |
School Enrollment by Age by Funding Source in Washington
Out of a total of 7,774 students who are enrolled in schools in Washington, 1,042 (13.4%) attend a private institution, while the remaining 6,732 (86.6%) are enrolled in public schools. The age group of 3 to 4 year olds has the highest likelihood of being enrolled in private schools, with 196 (69.8% in the age bracket) enrolled. Conversely, the age group of 25 to 34 year olds has the lowest likelihood of being enrolled in a private school, with 302 (100.0% in the age bracket) attending a public institution.
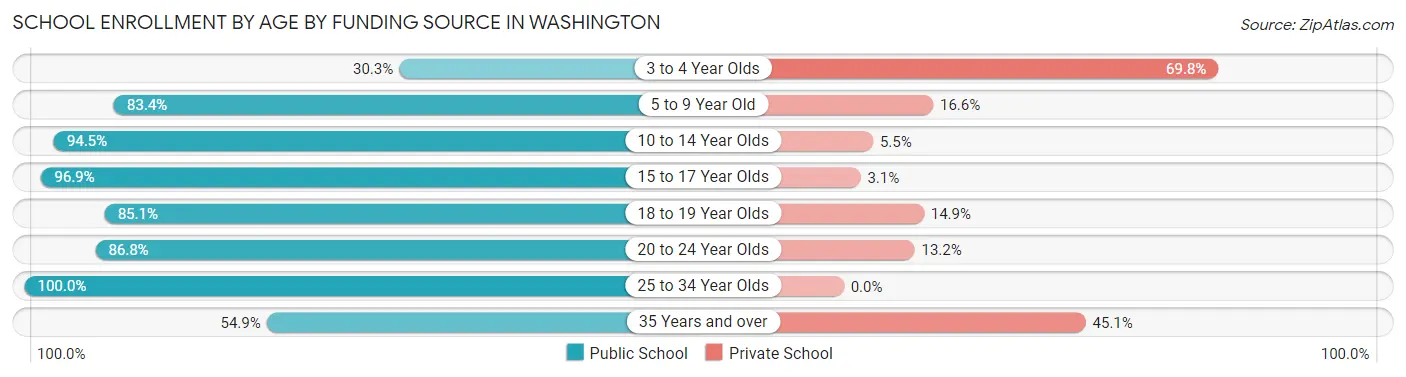
| Age Bracket | Public School | Private School |
| 3 to 4 Year Olds | 85 (30.2%) | 196 (69.8%) |
| 5 to 9 Year Old | 1,863 (83.4%) | 372 (16.6%) |
| 10 to 14 Year Olds | 2,024 (94.5%) | 117 (5.5%) |
| 15 to 17 Year Olds | 1,238 (96.9%) | 40 (3.1%) |
| 18 to 19 Year Olds | 507 (85.1%) | 89 (14.9%) |
| 20 to 24 Year Olds | 526 (86.8%) | 80 (13.2%) |
| 25 to 34 Year Olds | 302 (100.0%) | 0 (0.0%) |
| 35 Years and over | 184 (54.9%) | 151 (45.1%) |
| Total | 6,732 (86.6%) | 1,042 (13.4%) |
Educational Attainment by Field of Study in Washington
Business (1,817 | 23.3%), education (1,192 | 15.2%), science & technology (756 | 9.7%), arts & humanities (614 | 7.9%), and social sciences (499 | 6.4%) are the most common fields of study among 7,816 individuals in Washington who have obtained a bachelor's degree or higher.
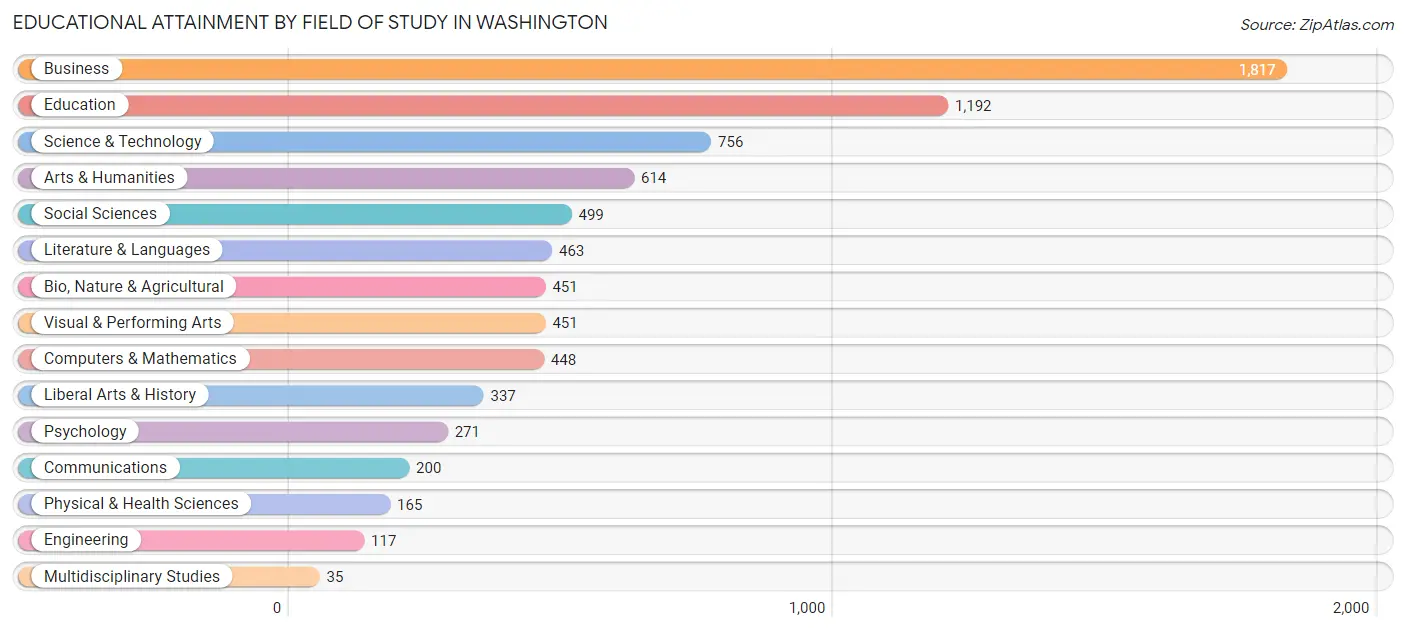
| Field of Study | # Graduates | % Graduates |
| Computers & Mathematics | 448 | 5.7% |
| Bio, Nature & Agricultural | 451 | 5.8% |
| Physical & Health Sciences | 165 | 2.1% |
| Psychology | 271 | 3.5% |
| Social Sciences | 499 | 6.4% |
| Engineering | 117 | 1.5% |
| Multidisciplinary Studies | 35 | 0.4% |
| Science & Technology | 756 | 9.7% |
| Business | 1,817 | 23.3% |
| Education | 1,192 | 15.2% |
| Literature & Languages | 463 | 5.9% |
| Liberal Arts & History | 337 | 4.3% |
| Visual & Performing Arts | 451 | 5.8% |
| Communications | 200 | 2.6% |
| Arts & Humanities | 614 | 7.9% |
| Total | 7,816 | 100.0% |
Transportation & Commute in Washington
Vehicle Availability by Sex in Washington
The most prevalent vehicle ownership categories in Washington are males with 2 vehicles (2,545, accounting for 35.7%) and females with 2 vehicles (1,705, making up 39.8%).
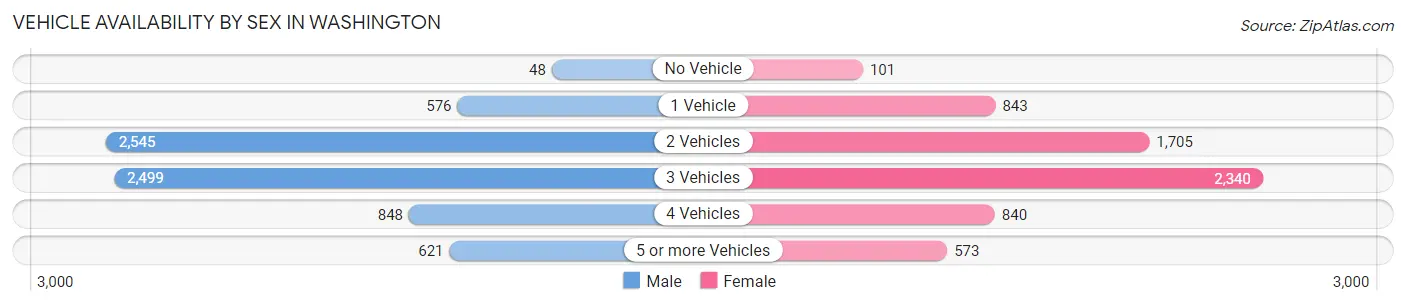
| Vehicles Available | Male | Female |
| No Vehicle | 48 (0.7%) | 101 (1.6%) |
| 1 Vehicle | 576 (8.1%) | 843 (13.2%) |
| 2 Vehicles | 2,545 (35.7%) | 1,705 (26.6%) |
| 3 Vehicles | 2,499 (35.0%) | 2,340 (36.5%) |
| 4 Vehicles | 848 (11.9%) | 840 (13.1%) |
| 5 or more Vehicles | 621 (8.7%) | 573 (8.9%) |
| Total | 7,137 (100.0%) | 6,402 (100.0%) |
Commute Time in Washington
The most frequently occuring commute durations in Washington are 10 to 14 minutes (3,324 commuters, 27.2%), 15 to 19 minutes (2,779 commuters, 22.7%), and 5 to 9 minutes (2,397 commuters, 19.6%).
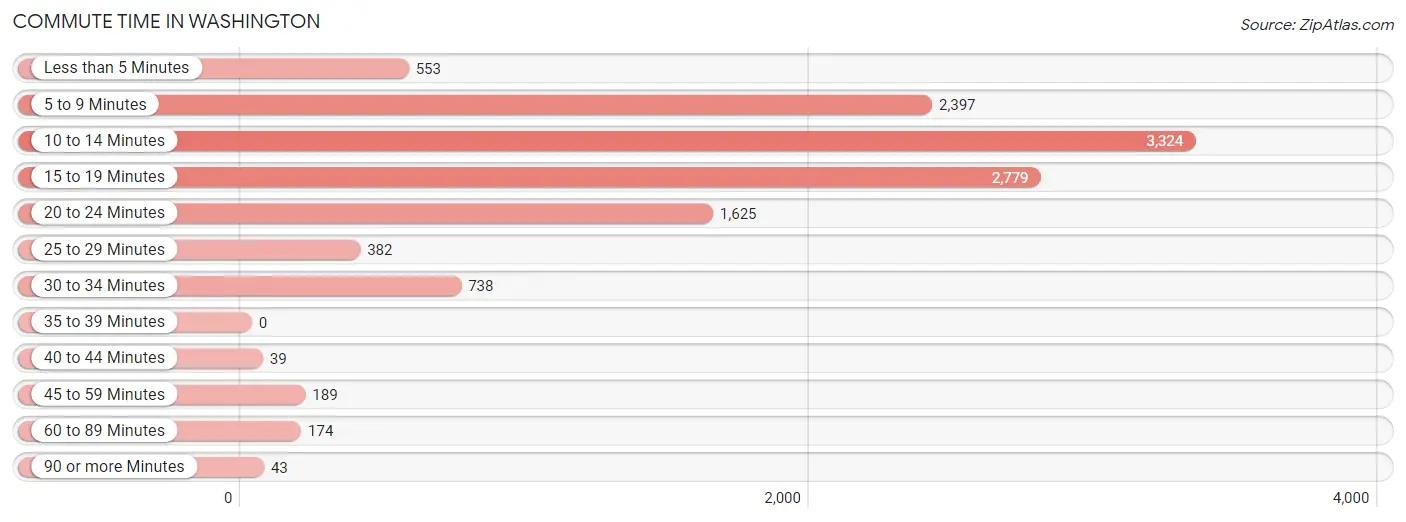
| Commute Time | # Commuters | % Commuters |
| Less than 5 Minutes | 553 | 4.5% |
| 5 to 9 Minutes | 2,397 | 19.6% |
| 10 to 14 Minutes | 3,324 | 27.2% |
| 15 to 19 Minutes | 2,779 | 22.7% |
| 20 to 24 Minutes | 1,625 | 13.3% |
| 25 to 29 Minutes | 382 | 3.1% |
| 30 to 34 Minutes | 738 | 6.0% |
| 35 to 39 Minutes | 0 | 0.0% |
| 40 to 44 Minutes | 39 | 0.3% |
| 45 to 59 Minutes | 189 | 1.5% |
| 60 to 89 Minutes | 174 | 1.4% |
| 90 or more Minutes | 43 | 0.4% |
Commute Time by Sex in Washington
The most common commute times in Washington are 10 to 14 minutes (1,635 commuters, 25.2%) for males and 10 to 14 minutes (1,689 commuters, 29.3%) for females.
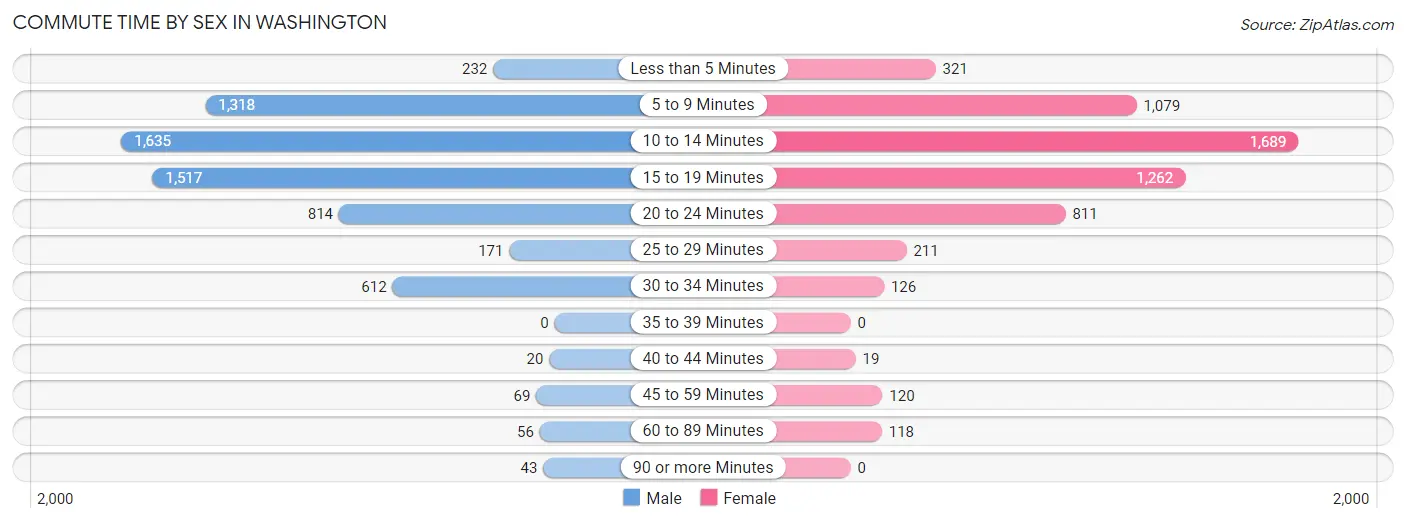
| Commute Time | Male | Female |
| Less than 5 Minutes | 232 (3.6%) | 321 (5.6%) |
| 5 to 9 Minutes | 1,318 (20.3%) | 1,079 (18.8%) |
| 10 to 14 Minutes | 1,635 (25.2%) | 1,689 (29.3%) |
| 15 to 19 Minutes | 1,517 (23.4%) | 1,262 (21.9%) |
| 20 to 24 Minutes | 814 (12.6%) | 811 (14.1%) |
| 25 to 29 Minutes | 171 (2.6%) | 211 (3.7%) |
| 30 to 34 Minutes | 612 (9.4%) | 126 (2.2%) |
| 35 to 39 Minutes | 0 (0.0%) | 0 (0.0%) |
| 40 to 44 Minutes | 20 (0.3%) | 19 (0.3%) |
| 45 to 59 Minutes | 69 (1.1%) | 120 (2.1%) |
| 60 to 89 Minutes | 56 (0.9%) | 118 (2.1%) |
| 90 or more Minutes | 43 (0.7%) | 0 (0.0%) |
Time of Departure to Work by Sex in Washington
The most frequent times of departure to work in Washington are 6:00 AM to 6:29 AM (1,275, 19.7%) for males and 9:00 AM to 9:59 AM (907, 15.8%) for females.
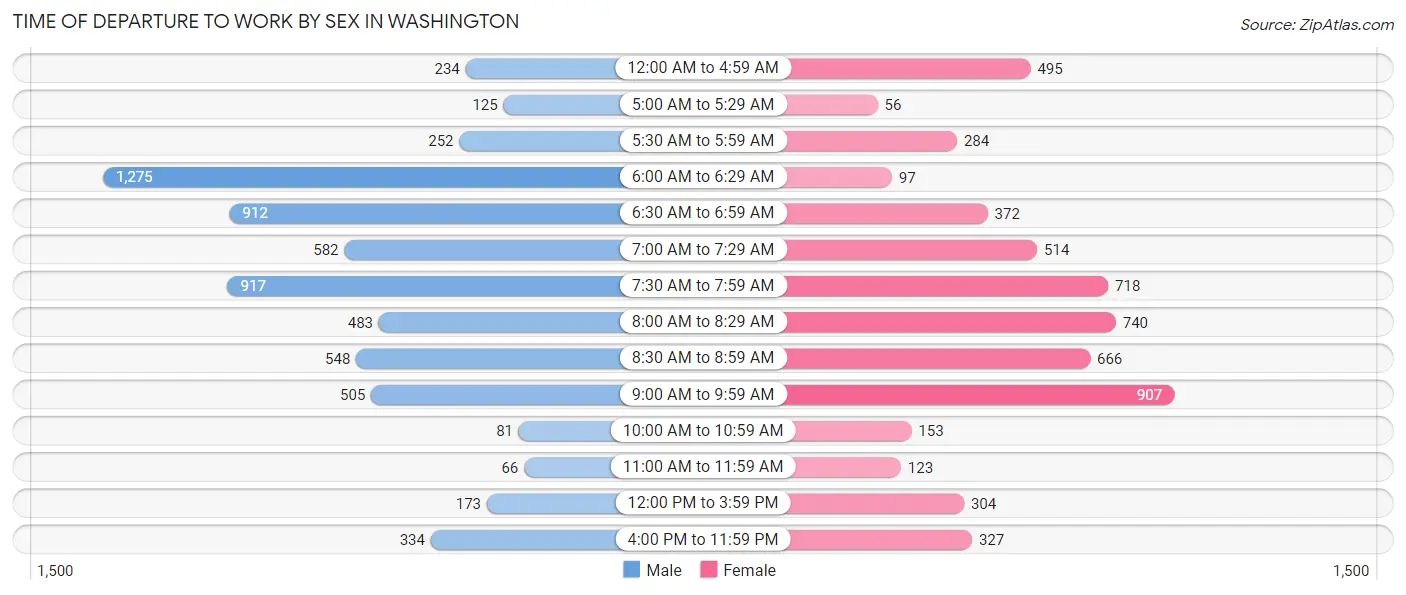
| Time of Departure | Male | Female |
| 12:00 AM to 4:59 AM | 234 (3.6%) | 495 (8.6%) |
| 5:00 AM to 5:29 AM | 125 (1.9%) | 56 (1.0%) |
| 5:30 AM to 5:59 AM | 252 (3.9%) | 284 (4.9%) |
| 6:00 AM to 6:29 AM | 1,275 (19.7%) | 97 (1.7%) |
| 6:30 AM to 6:59 AM | 912 (14.1%) | 372 (6.5%) |
| 7:00 AM to 7:29 AM | 582 (9.0%) | 514 (8.9%) |
| 7:30 AM to 7:59 AM | 917 (14.1%) | 718 (12.5%) |
| 8:00 AM to 8:29 AM | 483 (7.4%) | 740 (12.9%) |
| 8:30 AM to 8:59 AM | 548 (8.5%) | 666 (11.6%) |
| 9:00 AM to 9:59 AM | 505 (7.8%) | 907 (15.8%) |
| 10:00 AM to 10:59 AM | 81 (1.3%) | 153 (2.7%) |
| 11:00 AM to 11:59 AM | 66 (1.0%) | 123 (2.1%) |
| 12:00 PM to 3:59 PM | 173 (2.7%) | 304 (5.3%) |
| 4:00 PM to 11:59 PM | 334 (5.1%) | 327 (5.7%) |
| Total | 6,487 (100.0%) | 5,756 (100.0%) |
Housing Occupancy in Washington
Occupancy by Ownership in Washington
Of the total 9,736 dwellings in Washington, owner-occupied units account for 7,243 (74.4%), while renter-occupied units make up 2,493 (25.6%).
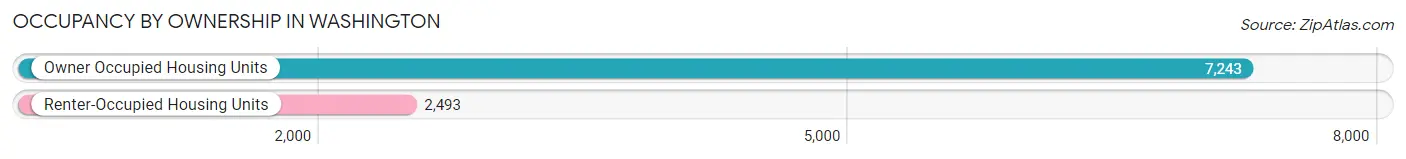
| Occupancy | # Housing Units | % Housing Units |
| Owner Occupied Housing Units | 7,243 | 74.4% |
| Renter-Occupied Housing Units | 2,493 | 25.6% |
| Total Occupied Housing Units | 9,736 | 100.0% |
Occupancy by Household Size in Washington
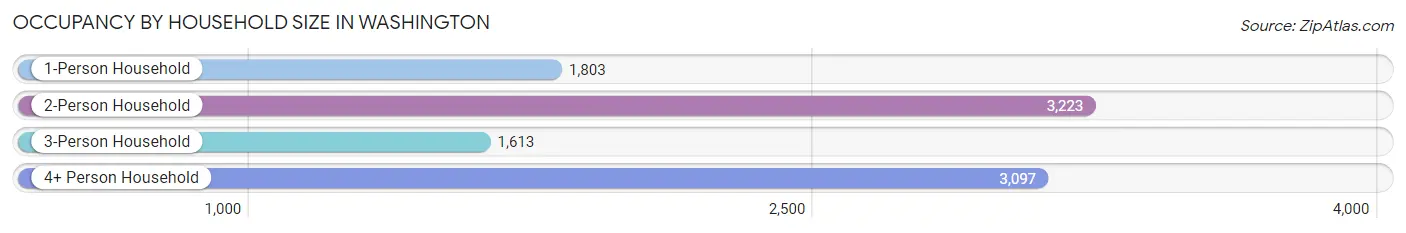
| Household Size | # Housing Units | % Housing Units |
| 1-Person Household | 1,803 | 18.5% |
| 2-Person Household | 3,223 | 33.1% |
| 3-Person Household | 1,613 | 16.6% |
| 4+ Person Household | 3,097 | 31.8% |
| Total Housing Units | 9,736 | 100.0% |
Occupancy by Ownership by Household Size in Washington
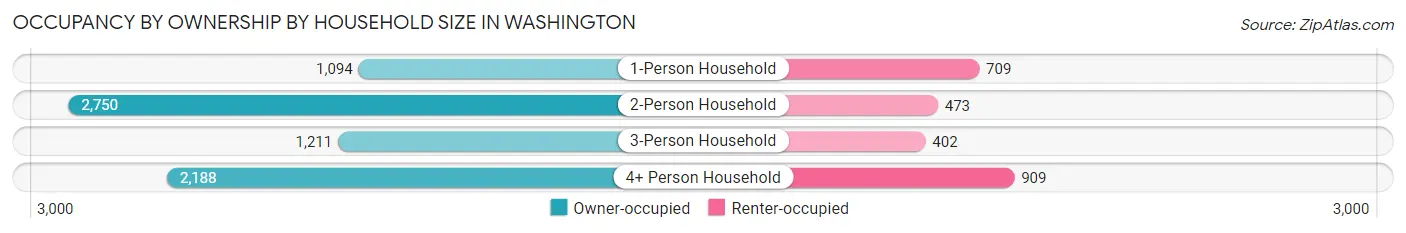
| Household Size | Owner-occupied | Renter-occupied |
| 1-Person Household | 1,094 (60.7%) | 709 (39.3%) |
| 2-Person Household | 2,750 (85.3%) | 473 (14.7%) |
| 3-Person Household | 1,211 (75.1%) | 402 (24.9%) |
| 4+ Person Household | 2,188 (70.7%) | 909 (29.3%) |
| Total Housing Units | 7,243 (74.4%) | 2,493 (25.6%) |
Occupancy by Educational Attainment in Washington
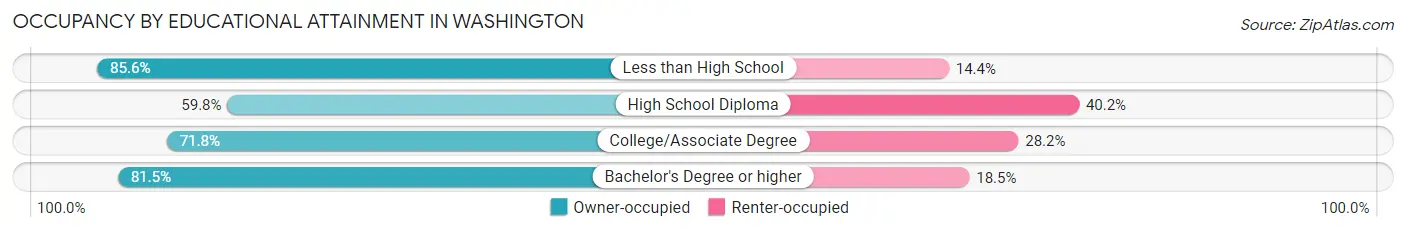
| Household Size | Owner-occupied | Renter-occupied |
| Less than High School | 238 (85.6%) | 40 (14.4%) |
| High School Diploma | 787 (59.8%) | 529 (40.2%) |
| College/Associate Degree | 3,110 (71.8%) | 1,220 (28.2%) |
| Bachelor's Degree or higher | 3,108 (81.5%) | 704 (18.5%) |
Occupancy by Age of Householder in Washington
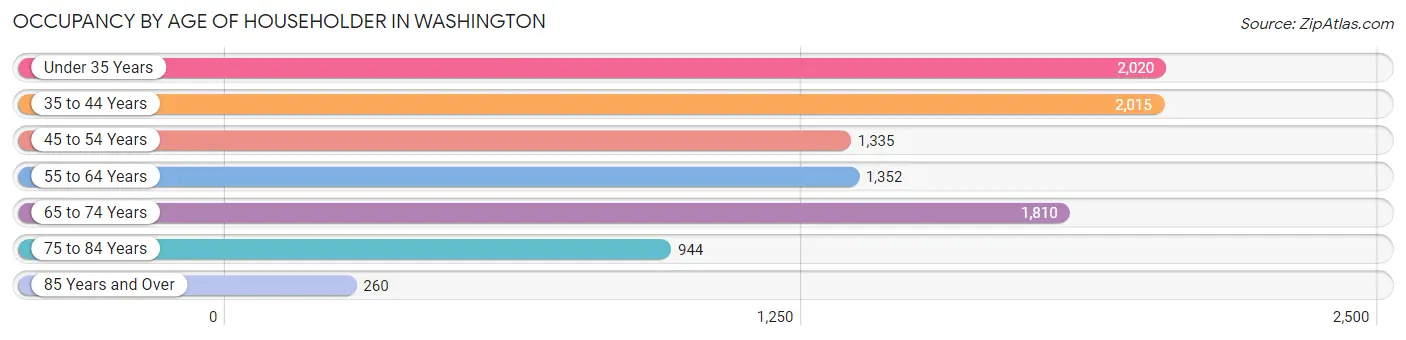
| Age Bracket | # Households | % Households |
| Under 35 Years | 2,020 | 20.7% |
| 35 to 44 Years | 2,015 | 20.7% |
| 45 to 54 Years | 1,335 | 13.7% |
| 55 to 64 Years | 1,352 | 13.9% |
| 65 to 74 Years | 1,810 | 18.6% |
| 75 to 84 Years | 944 | 9.7% |
| 85 Years and Over | 260 | 2.7% |
| Total | 9,736 | 100.0% |
Housing Finances in Washington
Median Income by Occupancy in Washington
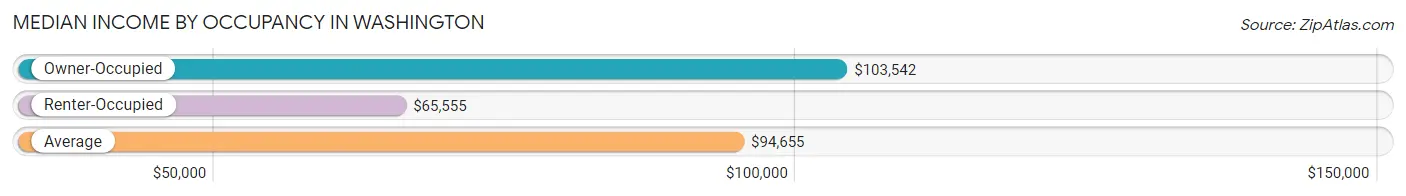
| Occupancy Type | # Households | Median Income |
| Owner-Occupied | 7,243 (74.4%) | $103,542 |
| Renter-Occupied | 2,493 (25.6%) | $65,555 |
| Average | 9,736 (100.0%) | $94,655 |
Occupancy by Householder Income Bracket in Washington
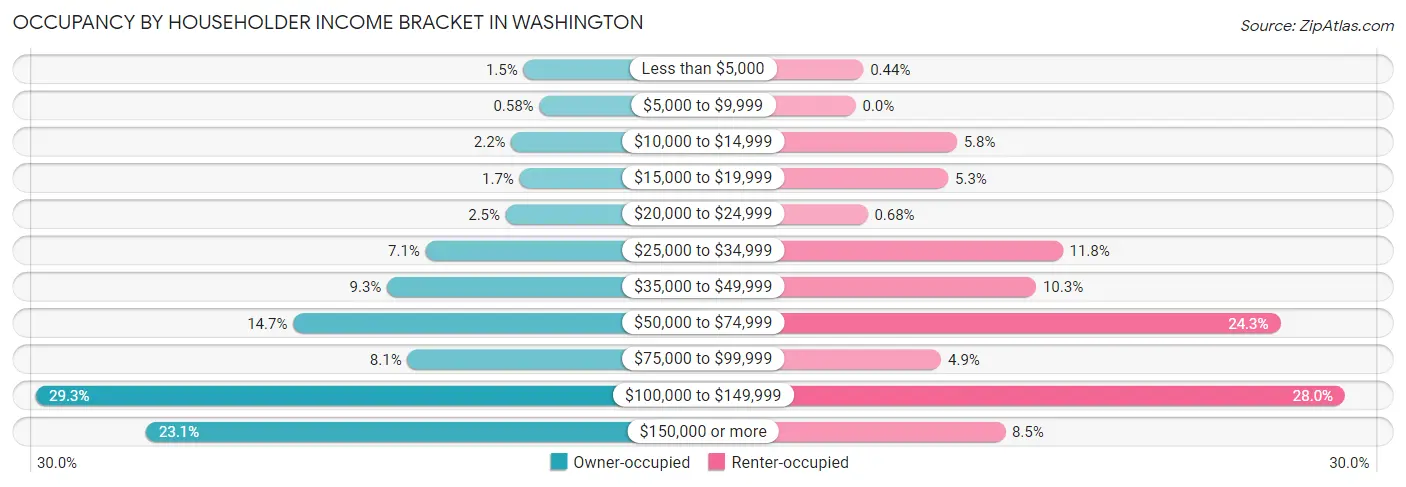
| Income Bracket | Owner-occupied | Renter-occupied |
| Less than $5,000 | 108 (1.5%) | 11 (0.4%) |
| $5,000 to $9,999 | 42 (0.6%) | 0 (0.0%) |
| $10,000 to $14,999 | 158 (2.2%) | 144 (5.8%) |
| $15,000 to $19,999 | 124 (1.7%) | 132 (5.3%) |
| $20,000 to $24,999 | 181 (2.5%) | 17 (0.7%) |
| $25,000 to $34,999 | 513 (7.1%) | 295 (11.8%) |
| $35,000 to $49,999 | 672 (9.3%) | 257 (10.3%) |
| $50,000 to $74,999 | 1,061 (14.6%) | 605 (24.3%) |
| $75,000 to $99,999 | 588 (8.1%) | 122 (4.9%) |
| $100,000 to $149,999 | 2,125 (29.3%) | 697 (28.0%) |
| $150,000 or more | 1,671 (23.1%) | 213 (8.5%) |
| Total | 7,243 (100.0%) | 2,493 (100.0%) |
Monthly Housing Cost Tiers in Washington
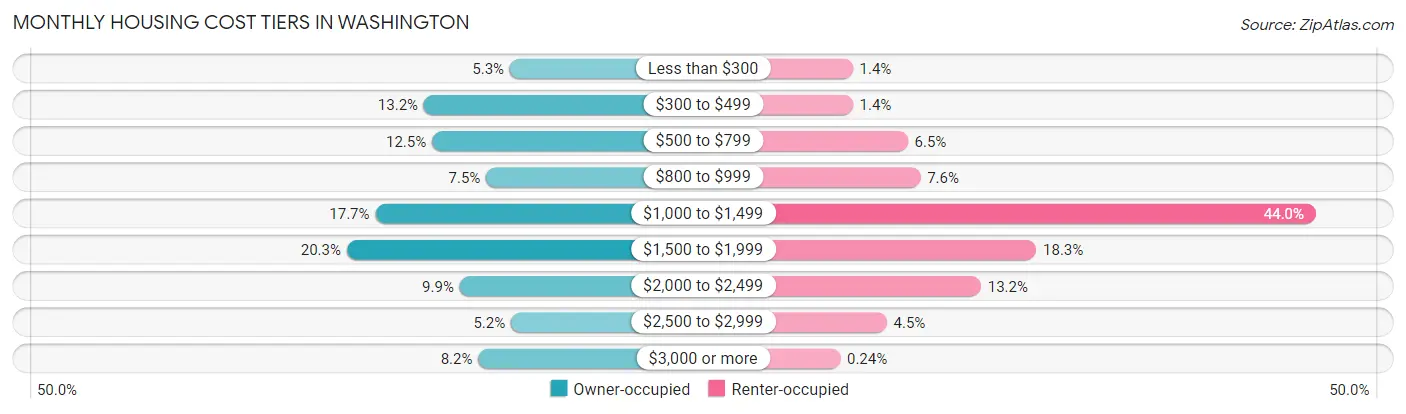
| Monthly Cost | Owner-occupied | Renter-occupied |
| Less than $300 | 385 (5.3%) | 35 (1.4%) |
| $300 to $499 | 959 (13.2%) | 35 (1.4%) |
| $500 to $799 | 905 (12.5%) | 161 (6.5%) |
| $800 to $999 | 544 (7.5%) | 190 (7.6%) |
| $1,000 to $1,499 | 1,283 (17.7%) | 1,098 (44.0%) |
| $1,500 to $1,999 | 1,473 (20.3%) | 456 (18.3%) |
| $2,000 to $2,499 | 720 (9.9%) | 329 (13.2%) |
| $2,500 to $2,999 | 378 (5.2%) | 113 (4.5%) |
| $3,000 or more | 596 (8.2%) | 6 (0.2%) |
| Total | 7,243 (100.0%) | 2,493 (100.0%) |
Physical Housing Characteristics in Washington
Housing Structures in Washington
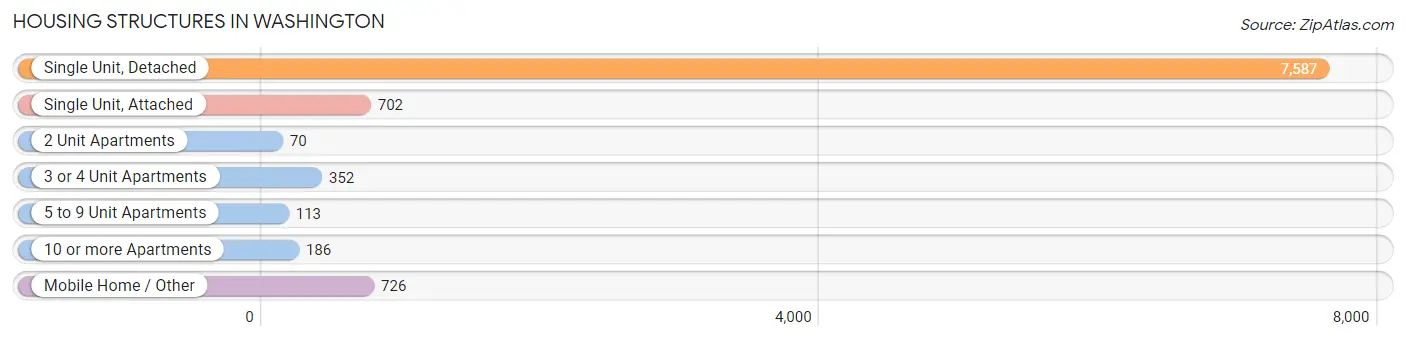
| Structure Type | # Housing Units | % Housing Units |
| Single Unit, Detached | 7,587 | 77.9% |
| Single Unit, Attached | 702 | 7.2% |
| 2 Unit Apartments | 70 | 0.7% |
| 3 or 4 Unit Apartments | 352 | 3.6% |
| 5 to 9 Unit Apartments | 113 | 1.2% |
| 10 or more Apartments | 186 | 1.9% |
| Mobile Home / Other | 726 | 7.5% |
| Total | 9,736 | 100.0% |
Housing Structures by Occupancy in Washington
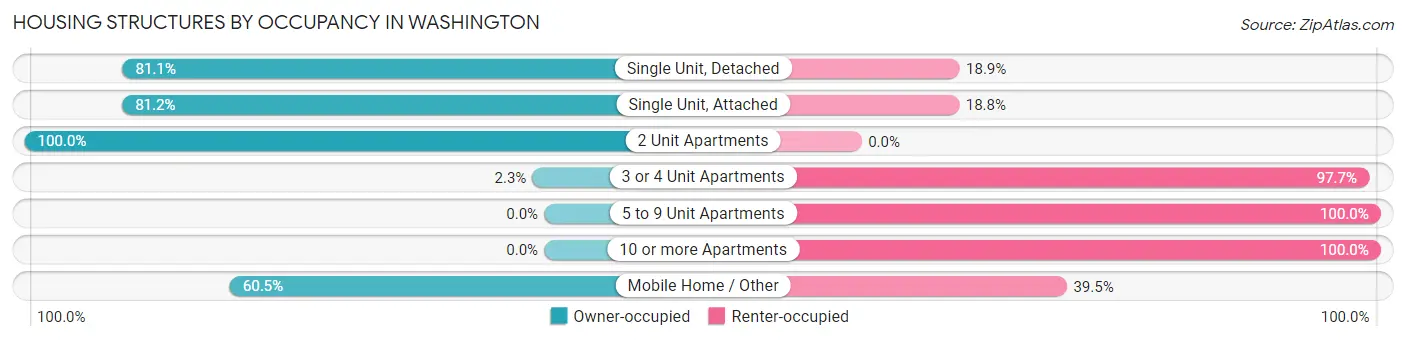
| Structure Type | Owner-occupied | Renter-occupied |
| Single Unit, Detached | 6,156 (81.1%) | 1,431 (18.9%) |
| Single Unit, Attached | 570 (81.2%) | 132 (18.8%) |
| 2 Unit Apartments | 70 (100.0%) | 0 (0.0%) |
| 3 or 4 Unit Apartments | 8 (2.3%) | 344 (97.7%) |
| 5 to 9 Unit Apartments | 0 (0.0%) | 113 (100.0%) |
| 10 or more Apartments | 0 (0.0%) | 186 (100.0%) |
| Mobile Home / Other | 439 (60.5%) | 287 (39.5%) |
| Total | 7,243 (74.4%) | 2,493 (25.6%) |
Housing Structures by Number of Rooms in Washington
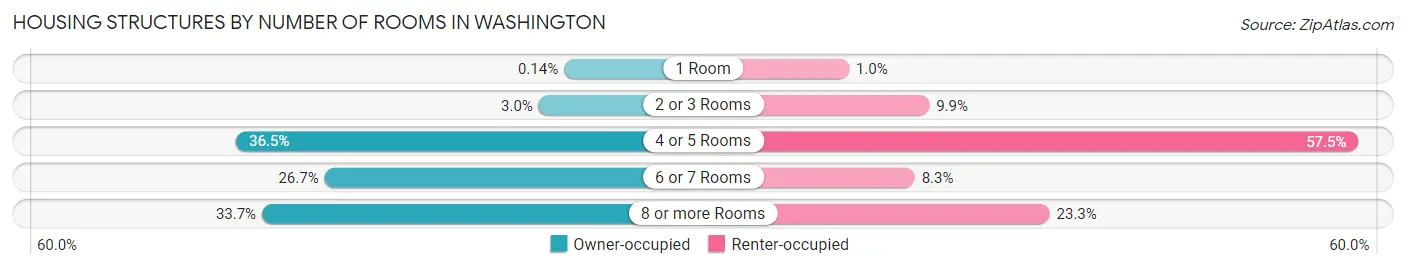
| Number of Rooms | Owner-occupied | Renter-occupied |
| 1 Room | 10 (0.1%) | 25 (1.0%) |
| 2 or 3 Rooms | 214 (2.9%) | 247 (9.9%) |
| 4 or 5 Rooms | 2,646 (36.5%) | 1,434 (57.5%) |
| 6 or 7 Rooms | 1,935 (26.7%) | 207 (8.3%) |
| 8 or more Rooms | 2,438 (33.7%) | 580 (23.3%) |
| Total | 7,243 (100.0%) | 2,493 (100.0%) |
Housing Structure by Heating Type in Washington
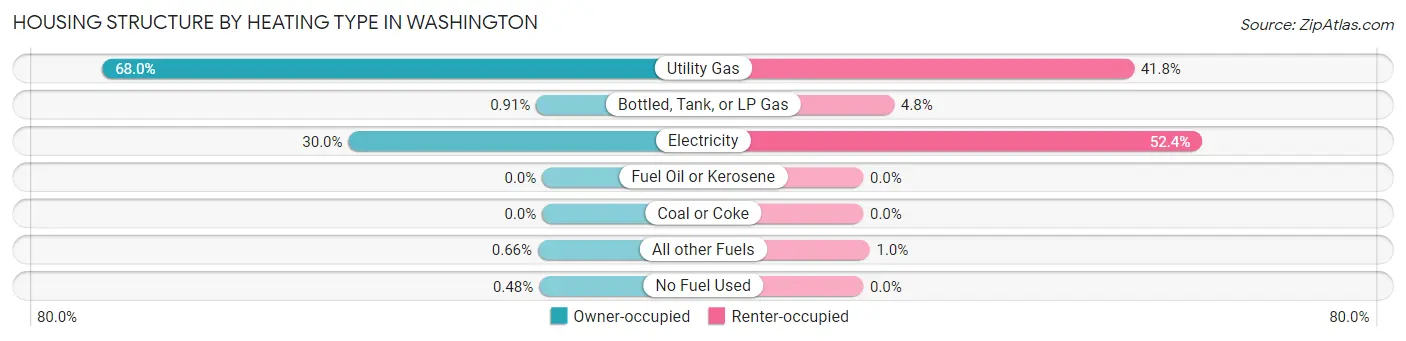
| Heating Type | Owner-occupied | Renter-occupied |
| Utility Gas | 4,925 (68.0%) | 1,043 (41.8%) |
| Bottled, Tank, or LP Gas | 66 (0.9%) | 119 (4.8%) |
| Electricity | 2,169 (29.9%) | 1,306 (52.4%) |
| Fuel Oil or Kerosene | 0 (0.0%) | 0 (0.0%) |
| Coal or Coke | 0 (0.0%) | 0 (0.0%) |
| All other Fuels | 48 (0.7%) | 25 (1.0%) |
| No Fuel Used | 35 (0.5%) | 0 (0.0%) |
| Total | 7,243 (100.0%) | 2,493 (100.0%) |
Household Vehicle Usage in Washington
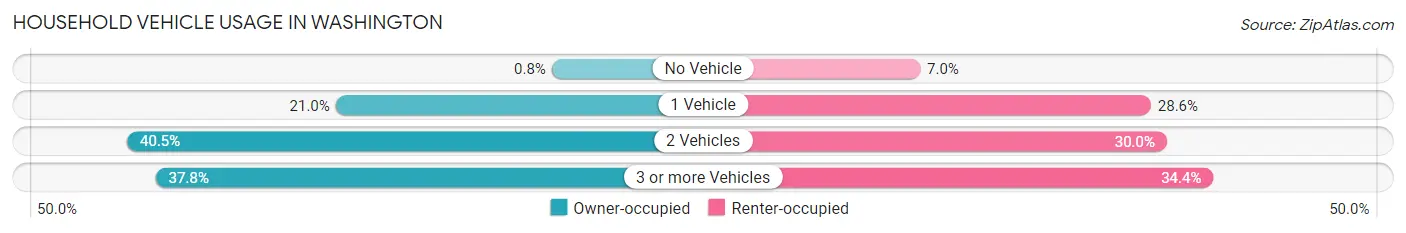
| Vehicles per Household | Owner-occupied | Renter-occupied |
| No Vehicle | 58 (0.8%) | 175 (7.0%) |
| 1 Vehicle | 1,519 (21.0%) | 712 (28.6%) |
| 2 Vehicles | 2,930 (40.5%) | 749 (30.0%) |
| 3 or more Vehicles | 2,736 (37.8%) | 857 (34.4%) |
| Total | 7,243 (100.0%) | 2,493 (100.0%) |
Real Estate & Mortgages in Washington
Real Estate and Mortgage Overview in Washington
| Characteristic | Without Mortgage | With Mortgage |
| Housing Units | 2,654 | 4,589 |
| Median Property Value | $462,300 | $435,900 |
| Median Household Income | $70,526 | $1,205 |
| Monthly Housing Costs | $497 | $596 |
| Real Estate Taxes | $2,302 | $104 |
Property Value by Mortgage Status in Washington
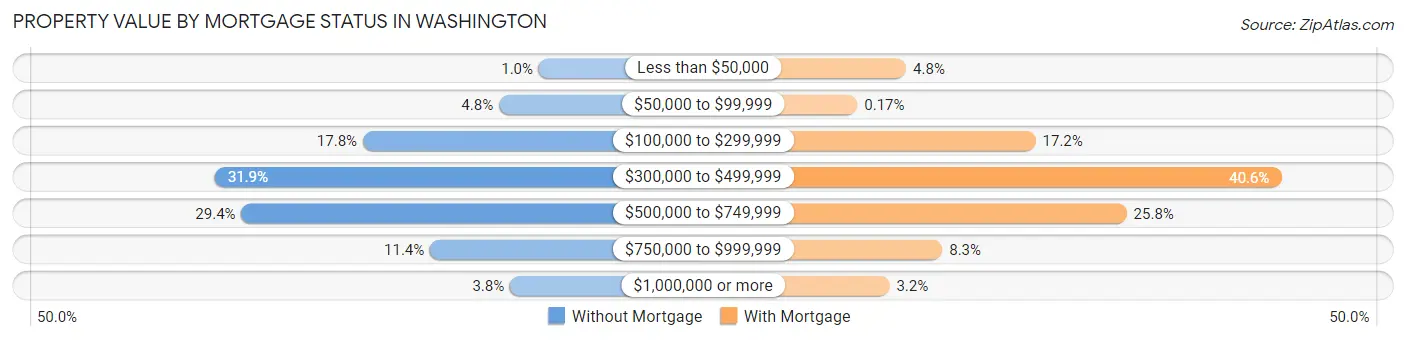
| Property Value | Without Mortgage | With Mortgage |
| Less than $50,000 | 27 (1.0%) | 221 (4.8%) |
| $50,000 to $99,999 | 128 (4.8%) | 8 (0.2%) |
| $100,000 to $299,999 | 472 (17.8%) | 787 (17.2%) |
| $300,000 to $499,999 | 846 (31.9%) | 1,861 (40.6%) |
| $500,000 to $749,999 | 779 (29.3%) | 1,185 (25.8%) |
| $750,000 to $999,999 | 302 (11.4%) | 379 (8.3%) |
| $1,000,000 or more | 100 (3.8%) | 148 (3.2%) |
| Total | 2,654 (100.0%) | 4,589 (100.0%) |
Household Income by Mortgage Status in Washington
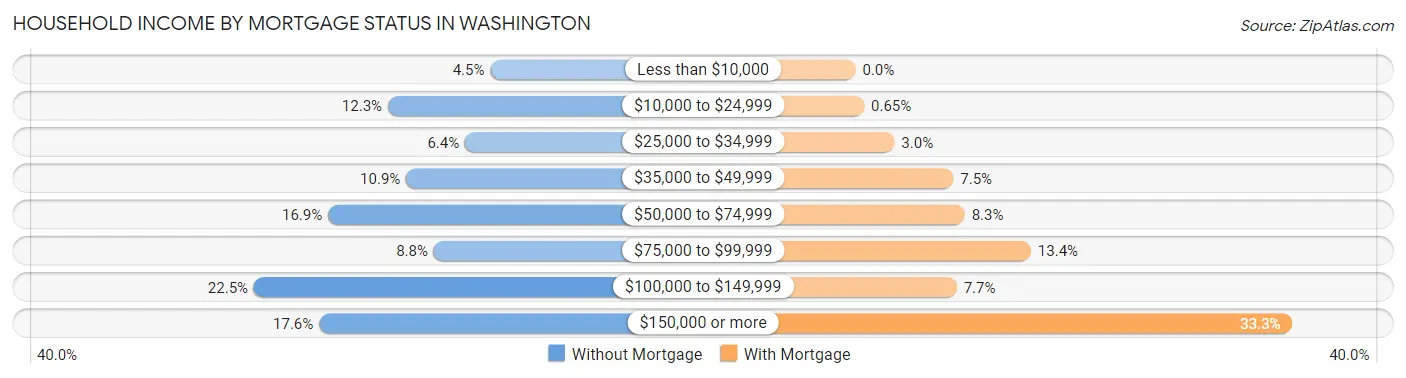
| Household Income | Without Mortgage | With Mortgage |
| Less than $10,000 | 120 (4.5%) | 0 (0.0%) |
| $10,000 to $24,999 | 327 (12.3%) | 30 (0.6%) |
| $25,000 to $34,999 | 171 (6.4%) | 136 (3.0%) |
| $35,000 to $49,999 | 290 (10.9%) | 342 (7.4%) |
| $50,000 to $74,999 | 448 (16.9%) | 382 (8.3%) |
| $75,000 to $99,999 | 234 (8.8%) | 613 (13.4%) |
| $100,000 to $149,999 | 598 (22.5%) | 354 (7.7%) |
| $150,000 or more | 466 (17.6%) | 1,527 (33.3%) |
| Total | 2,654 (100.0%) | 4,589 (100.0%) |
Property Value to Household Income Ratio in Washington
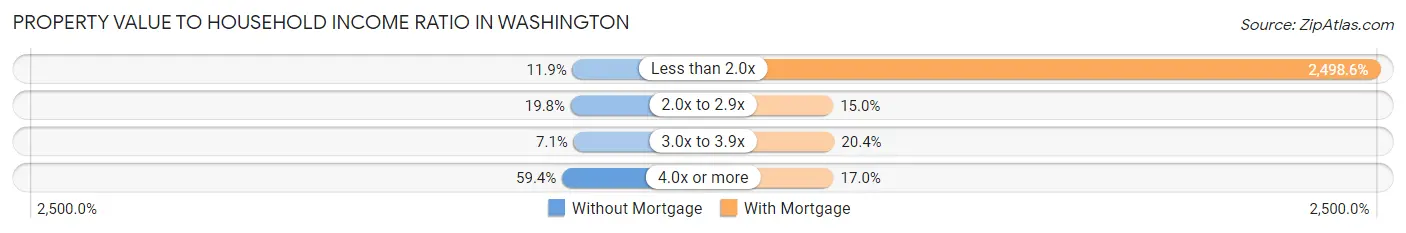
| Value-to-Income Ratio | Without Mortgage | With Mortgage |
| Less than 2.0x | 316 (11.9%) | 114,659 (2,498.6%) |
| 2.0x to 2.9x | 526 (19.8%) | 687 (15.0%) |
| 3.0x to 3.9x | 187 (7.0%) | 937 (20.4%) |
| 4.0x or more | 1,577 (59.4%) | 779 (17.0%) |
| Total | 2,654 (100.0%) | 4,589 (100.0%) |
Real Estate Taxes by Mortgage Status in Washington
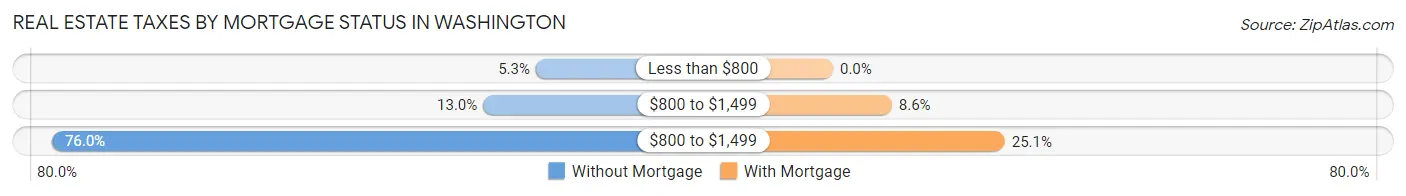
| Property Taxes | Without Mortgage | With Mortgage |
| Less than $800 | 141 (5.3%) | 0 (0.0%) |
| $800 to $1,499 | 345 (13.0%) | 394 (8.6%) |
| $800 to $1,499 | 2,017 (76.0%) | 1,152 (25.1%) |
| Total | 2,654 (100.0%) | 4,589 (100.0%) |
Health & Disability in Washington
Health Insurance Coverage by Age in Washington
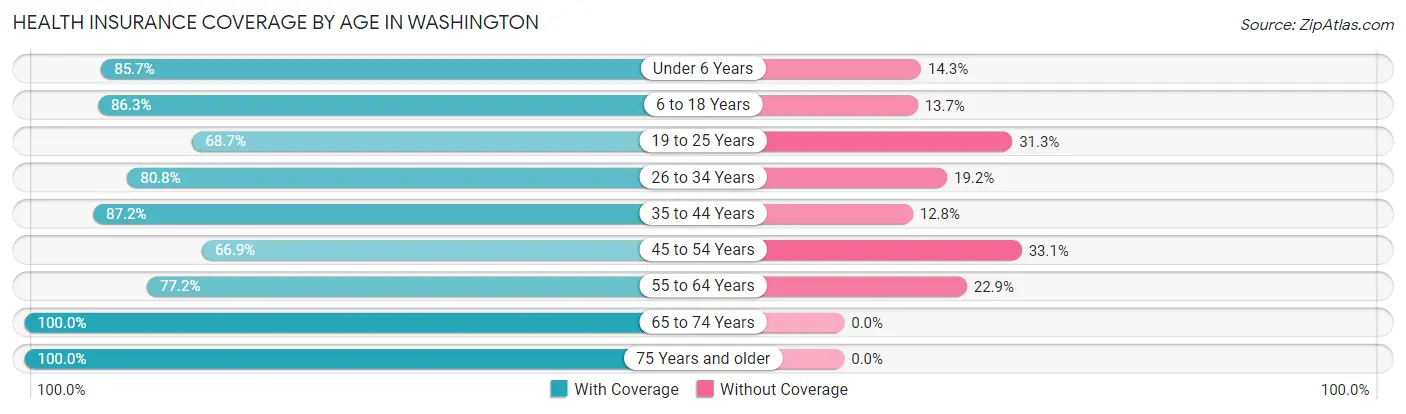
| Age Bracket | With Coverage | Without Coverage |
| Under 6 Years | 1,862 (85.7%) | 311 (14.3%) |
| 6 to 18 Years | 5,328 (86.3%) | 845 (13.7%) |
| 19 to 25 Years | 1,406 (68.7%) | 641 (31.3%) |
| 26 to 34 Years | 2,974 (80.8%) | 705 (19.2%) |
| 35 to 44 Years | 3,646 (87.2%) | 534 (12.8%) |
| 45 to 54 Years | 1,952 (66.9%) | 965 (33.1%) |
| 55 to 64 Years | 1,979 (77.1%) | 586 (22.9%) |
| 65 to 74 Years | 3,122 (100.0%) | 0 (0.0%) |
| 75 Years and older | 2,275 (100.0%) | 0 (0.0%) |
| Total | 24,544 (84.3%) | 4,587 (15.8%) |
Health Insurance Coverage by Citizenship Status in Washington
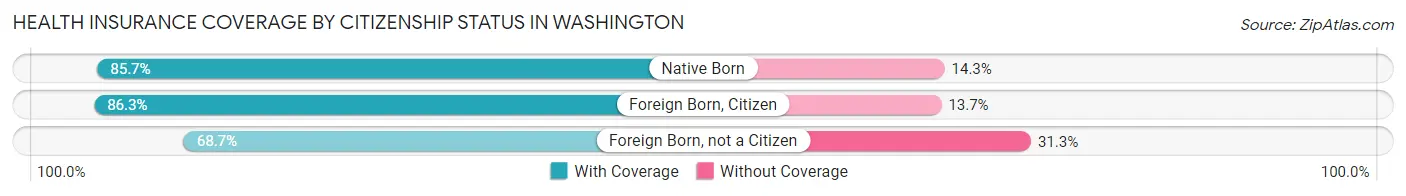
| Citizenship Status | With Coverage | Without Coverage |
| Native Born | 1,862 (85.7%) | 311 (14.3%) |
| Foreign Born, Citizen | 5,328 (86.3%) | 845 (13.7%) |
| Foreign Born, not a Citizen | 1,406 (68.7%) | 641 (31.3%) |
Health Insurance Coverage by Household Income in Washington
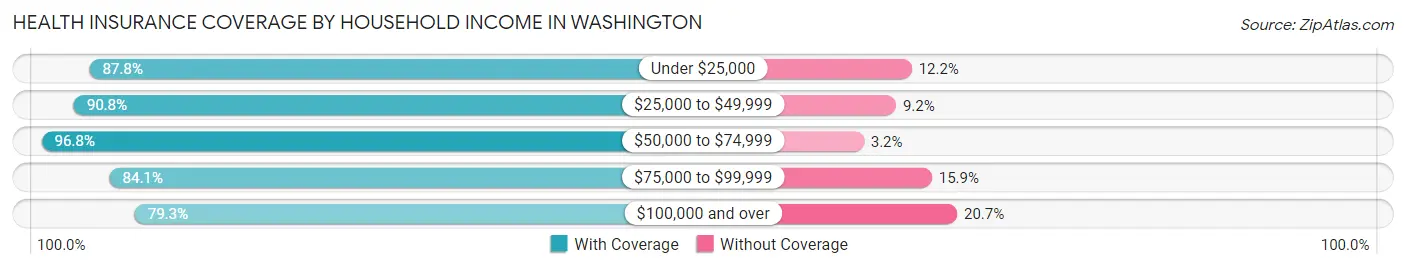
| Household Income | With Coverage | Without Coverage |
| Under $25,000 | 1,178 (87.8%) | 163 (12.2%) |
| $25,000 to $49,999 | 3,141 (90.8%) | 319 (9.2%) |
| $50,000 to $74,999 | 4,508 (96.8%) | 148 (3.2%) |
| $75,000 to $99,999 | 1,890 (84.1%) | 358 (15.9%) |
| $100,000 and over | 13,824 (79.3%) | 3,599 (20.7%) |
Public vs Private Health Insurance Coverage by Age in Washington
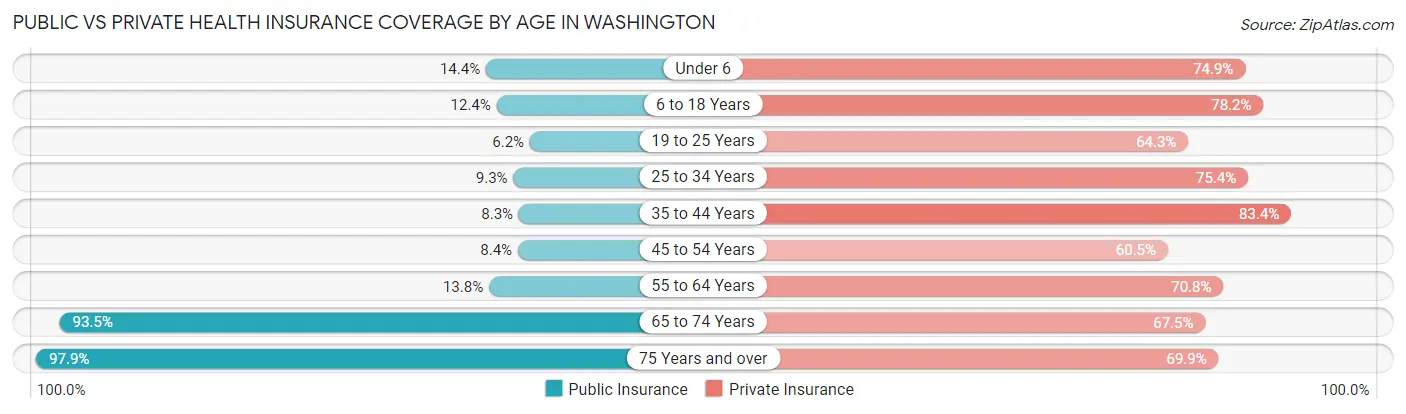
| Age Bracket | Public Insurance | Private Insurance |
| Under 6 | 312 (14.4%) | 1,627 (74.9%) |
| 6 to 18 Years | 765 (12.4%) | 4,830 (78.2%) |
| 19 to 25 Years | 127 (6.2%) | 1,316 (64.3%) |
| 25 to 34 Years | 341 (9.3%) | 2,774 (75.4%) |
| 35 to 44 Years | 345 (8.3%) | 3,486 (83.4%) |
| 45 to 54 Years | 246 (8.4%) | 1,765 (60.5%) |
| 55 to 64 Years | 354 (13.8%) | 1,816 (70.8%) |
| 65 to 74 Years | 2,919 (93.5%) | 2,106 (67.5%) |
| 75 Years and over | 2,226 (97.9%) | 1,591 (69.9%) |
| Total | 7,635 (26.2%) | 21,311 (73.2%) |
Disability Status by Sex by Age in Washington
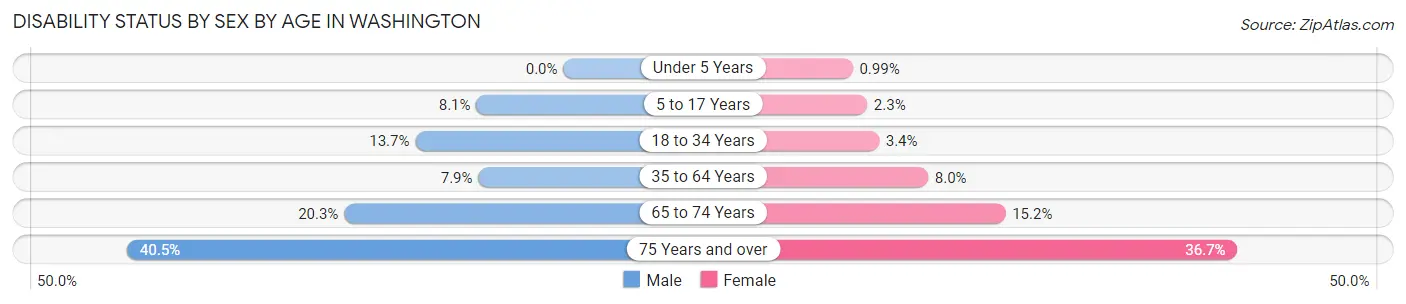
| Age Bracket | Male | Female |
| Under 5 Years | 0 (0.0%) | 11 (1.0%) |
| 5 to 17 Years | 231 (8.1%) | 69 (2.3%) |
| 18 to 34 Years | 438 (13.7%) | 109 (3.4%) |
| 35 to 64 Years | 375 (7.9%) | 392 (8.0%) |
| 65 to 74 Years | 273 (20.3%) | 270 (15.2%) |
| 75 Years and over | 490 (40.5%) | 391 (36.7%) |
Disability Class by Sex by Age in Washington
Disability Class: Hearing Difficulty
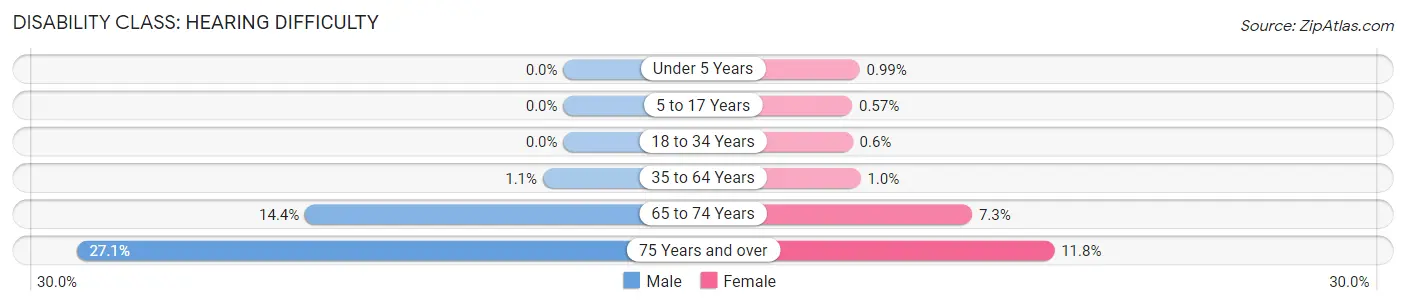
| Age Bracket | Male | Female |
| Under 5 Years | 0 (0.0%) | 11 (1.0%) |
| 5 to 17 Years | 0 (0.0%) | 17 (0.6%) |
| 18 to 34 Years | 0 (0.0%) | 19 (0.6%) |
| 35 to 64 Years | 54 (1.1%) | 51 (1.0%) |
| 65 to 74 Years | 193 (14.4%) | 129 (7.2%) |
| 75 Years and over | 328 (27.1%) | 126 (11.8%) |
Disability Class: Vision Difficulty
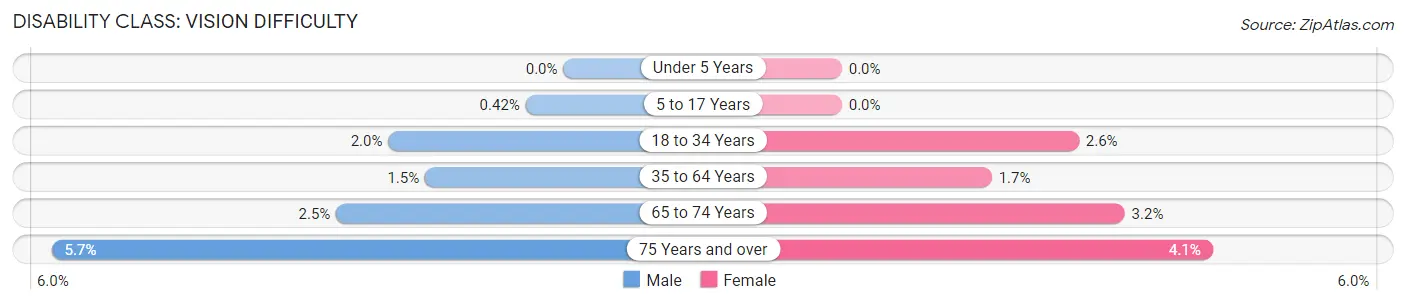
| Age Bracket | Male | Female |
| Under 5 Years | 0 (0.0%) | 0 (0.0%) |
| 5 to 17 Years | 12 (0.4%) | 0 (0.0%) |
| 18 to 34 Years | 62 (1.9%) | 84 (2.6%) |
| 35 to 64 Years | 73 (1.5%) | 82 (1.7%) |
| 65 to 74 Years | 34 (2.5%) | 56 (3.2%) |
| 75 Years and over | 69 (5.7%) | 44 (4.1%) |
Disability Class: Cognitive Difficulty
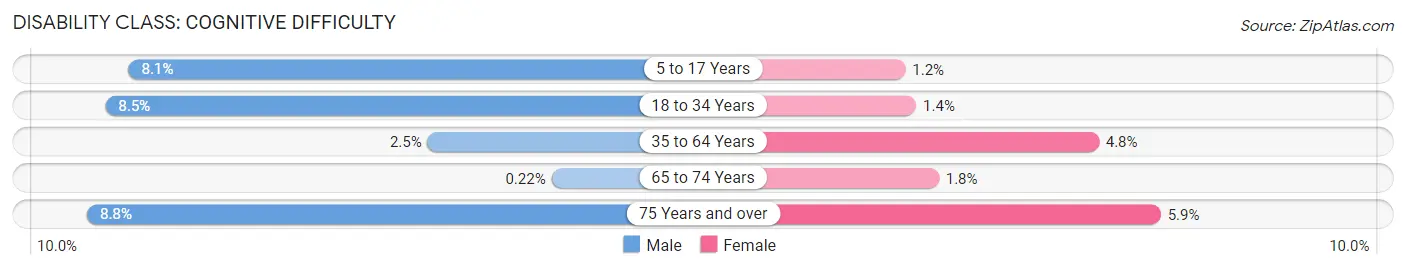
| Age Bracket | Male | Female |
| 5 to 17 Years | 231 (8.1%) | 35 (1.2%) |
| 18 to 34 Years | 271 (8.5%) | 44 (1.4%) |
| 35 to 64 Years | 120 (2.5%) | 234 (4.8%) |
| 65 to 74 Years | 3 (0.2%) | 32 (1.8%) |
| 75 Years and over | 107 (8.8%) | 63 (5.9%) |
Disability Class: Ambulatory Difficulty
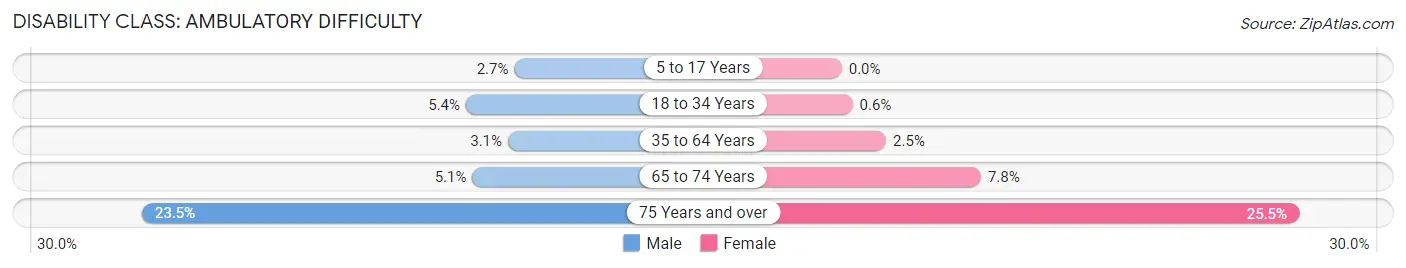
| Age Bracket | Male | Female |
| 5 to 17 Years | 78 (2.7%) | 0 (0.0%) |
| 18 to 34 Years | 173 (5.4%) | 19 (0.6%) |
| 35 to 64 Years | 147 (3.1%) | 121 (2.5%) |
| 65 to 74 Years | 68 (5.1%) | 138 (7.7%) |
| 75 Years and over | 284 (23.5%) | 271 (25.5%) |
Disability Class: Self-Care Difficulty
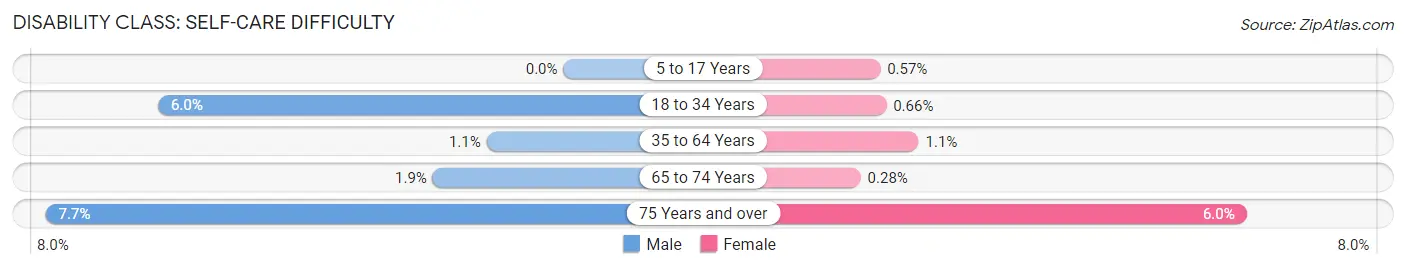
| Age Bracket | Male | Female |
| 5 to 17 Years | 0 (0.0%) | 17 (0.6%) |
| 18 to 34 Years | 192 (6.0%) | 21 (0.7%) |
| 35 to 64 Years | 54 (1.1%) | 56 (1.1%) |
| 65 to 74 Years | 26 (1.9%) | 5 (0.3%) |
| 75 Years and over | 93 (7.7%) | 64 (6.0%) |
Technology Access in Washington
Computing Device Access in Washington
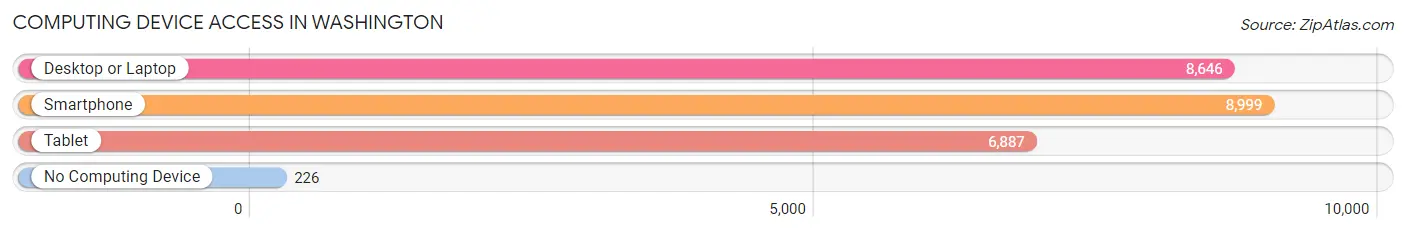
| Device Type | # Households | % Households |
| Desktop or Laptop | 8,646 | 88.8% |
| Smartphone | 8,999 | 92.4% |
| Tablet | 6,887 | 70.7% |
| No Computing Device | 226 | 2.3% |
| Total | 9,736 | 100.0% |
Internet Access in Washington
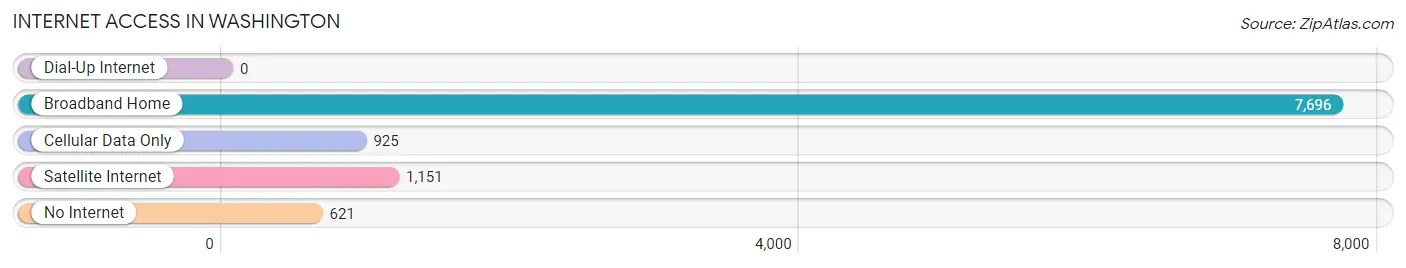
| Internet Type | # Households | % Households |
| Dial-Up Internet | 0 | 0.0% |
| Broadband Home | 7,696 | 79.0% |
| Cellular Data Only | 925 | 9.5% |
| Satellite Internet | 1,151 | 11.8% |
| No Internet | 621 | 6.4% |
| Total | 9,736 | 100.0% |
Washington Summary
Washington is a city located in the southwestern corner of Utah, United States. It is the county seat of Washington County and is part of the St. George Metropolitan Statistical Area. The city is located in the high desert of the Colorado Plateau and is surrounded by red rock formations and sandstone cliffs. The city is known for its mild climate, outdoor recreation opportunities, and its proximity to Zion National Park.
History
The area that is now Washington was first settled in 1857 by Mormon pioneers. The city was originally named "Little Salt Lake City" and was later renamed Washington in 1858 after George Washington. The city was incorporated in 1868 and was the first city in Washington County.
In the late 19th century, the city was a major center for the production of wool and other agricultural products. The city was also a major stop on the Los Angeles and Salt Lake Railroad.
Geography
Washington is located in the southwestern corner of Utah, at the intersection of Interstate 15 and State Route 9. The city is situated at an elevation of 2,890 feet (880 m) and is surrounded by red rock formations and sandstone cliffs. The city is located in the high desert of the Colorado Plateau and is approximately 30 miles (48 km) north of the Arizona border.
The city has a total area of 11.2 square miles (29 km2), of which 11.1 square miles (29 km2) is land and 0.1 square miles (0.26 km2) is water.
Economy
Washington's economy is largely based on tourism, agriculture, and manufacturing. The city is home to several major employers, including the Washington County School District, the Washington County Sheriff's Office, and the Washington County Hospital.
The city is also home to several major tourist attractions, including Zion National Park, Snow Canyon State Park, and the Tuacahn Center for the Arts.
Demographics
As of the 2010 census, Washington had a population of 18,761. The racial makeup of the city was 87.2% White, 0.7% African American, 0.7% Native American, 1.2% Asian, 0.2% Pacific Islander, 8.2% from other races, and 2.0% from two or more races. Hispanic or Latino of any race were 15.2% of the population.
The median income for a household in the city was $45,945, and the median income for a family was $51,945. The per capita income for the city was $20,945. About 8.2% of families and 10.7% of the population were below the poverty line, including 14.2% of those under age 18 and 6.2% of those age 65 or over.
Common Questions
What is Per Capita Income in Washington?
Per Capita income in Washington is $41,499.
What is the Median Family Income in Washington?
Median Family Income in Washington is $110,040.
What is the Median Household income in Washington?
Median Household Income in Washington is $94,655.
What is Income or Wage Gap in Washington?
Income or Wage Gap in Washington is 45.3%.
Women in Washington earn 54.7 cents for every dollar earned by a man.
What is Inequality or Gini Index in Washington?
Inequality or Gini Index in Washington is 0.47.
What is the Total Population of Washington?
Total Population of Washington is 29,161.
What is the Total Male Population of Washington?
Total Male Population of Washington is 14,144.
What is the Total Female Population of Washington?
Total Female Population of Washington is 15,017.
What is the Ratio of Males per 100 Females in Washington?
There are 94.19 Males per 100 Females in Washington.
What is the Ratio of Females per 100 Males in Washington?
There are 106.17 Females per 100 Males in Washington.
What is the Median Population Age in Washington?
Median Population Age in Washington is 36.8 Years.
What is the Average Family Size in Washington
Average Family Size in Washington is 3.5 People.
What is the Average Household Size in Washington
Average Household Size in Washington is 3.0 People.
How Large is the Labor Force in Washington?
There are 13,790 People in the Labor Forcein in Washington.
What is the Percentage of People in the Labor Force in Washington?
61.8% of People are in the Labor Force in Washington.
What is the Unemployment Rate in Washington?
Unemployment Rate in Washington is 0.8%.