Cities with the Largest Northern European Community in Georgia
RELATED REPORTS & OPTIONS
Northern European
Georgia
Compare Cities
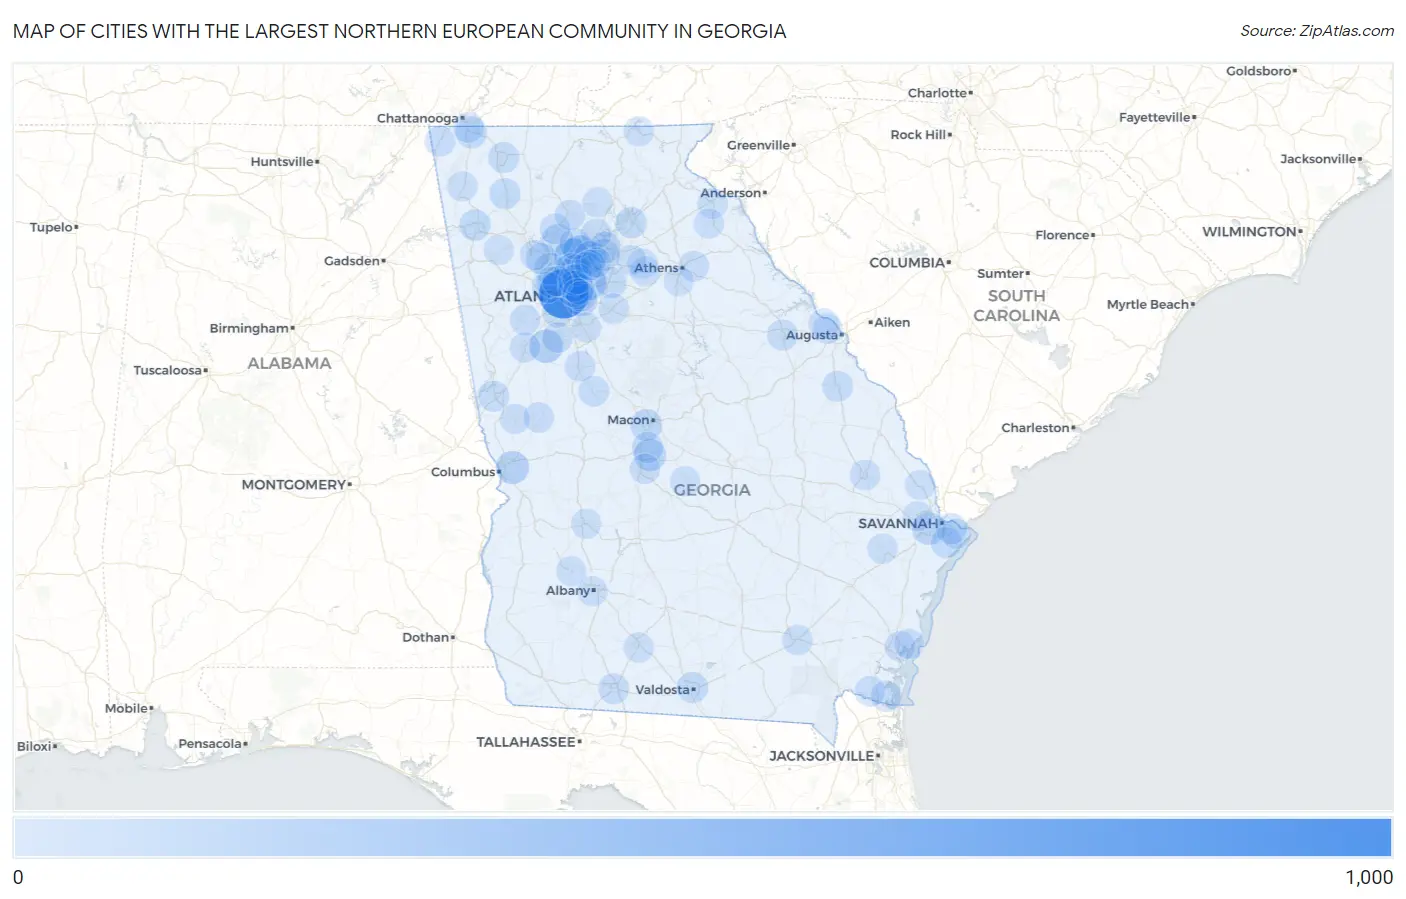
Map of Cities with the Largest Northern European Community in Georgia
0
1,000
Cities with the Largest Northern European Community in Georgia
| City | Northern European | vs State | vs National | |
| 1. | Atlanta | 969 | 11,069(8.75%)#1 | 487,800(0.20%)#29 |
| 2. | Athens-Clarke County Unified Government (Balance) | 282 | 11,069(2.55%)#2 | 487,800(0.06%)#225 |
| 3. | Roswell | 277 | 11,069(2.50%)#3 | 487,800(0.06%)#231 |
| 4. | Tucker | 245 | 11,069(2.21%)#4 | 487,800(0.05%)#274 |
| 5. | Alpharetta | 208 | 11,069(1.88%)#5 | 487,800(0.04%)#336 |
| 6. | Peachtree City | 168 | 11,069(1.52%)#6 | 487,800(0.03%)#436 |
| 7. | Sandy Springs | 164 | 11,069(1.48%)#7 | 487,800(0.03%)#455 |
| 8. | Columbus | 143 | 11,069(1.29%)#8 | 487,800(0.03%)#547 |
| 9. | Johns Creek | 126 | 11,069(1.14%)#9 | 487,800(0.03%)#633 |
| 10. | Savannah | 120 | 11,069(1.08%)#10 | 487,800(0.02%)#670 |
| 11. | Candler Mcafee | 107 | 11,069(0.97%)#11 | 487,800(0.02%)#769 |
| 12. | Warner Robins | 102 | 11,069(0.92%)#12 | 487,800(0.02%)#802 |
| 13. | Suwanee | 88 | 11,069(0.80%)#13 | 487,800(0.02%)#954 |
| 14. | Macon Bibb County | 79 | 11,069(0.71%)#14 | 487,800(0.02%)#1,061 |
| 15. | Holly Springs | 77 | 11,069(0.70%)#15 | 487,800(0.02%)#1,100 |
| 16. | Fort Oglethorpe | 74 | 11,069(0.67%)#16 | 487,800(0.02%)#1,139 |
| 17. | Sugar Hill | 70 | 11,069(0.63%)#17 | 487,800(0.01%)#1,190 |
| 18. | Augusta-Richmond County Consolidated Government (Balance) | 65 | 11,069(0.59%)#18 | 487,800(0.01%)#1,270 |
| 19. | Druid Hills | 64 | 11,069(0.58%)#19 | 487,800(0.01%)#1,300 |
| 20. | Marietta | 63 | 11,069(0.57%)#20 | 487,800(0.01%)#1,310 |
| 21. | Rome | 62 | 11,069(0.56%)#21 | 487,800(0.01%)#1,326 |
| 22. | Smyrna | 61 | 11,069(0.55%)#22 | 487,800(0.01%)#1,340 |
| 23. | Valdosta | 59 | 11,069(0.53%)#23 | 487,800(0.01%)#1,388 |
| 24. | Snellville | 59 | 11,069(0.53%)#24 | 487,800(0.01%)#1,393 |
| 25. | Dunwoody | 58 | 11,069(0.52%)#25 | 487,800(0.01%)#1,408 |
| 26. | Milton | 58 | 11,069(0.52%)#26 | 487,800(0.01%)#1,410 |
| 27. | Centerville | 57 | 11,069(0.51%)#27 | 487,800(0.01%)#1,443 |
| 28. | North Decatur | 54 | 11,069(0.49%)#28 | 487,800(0.01%)#1,505 |
| 29. | Mableton | 53 | 11,069(0.48%)#29 | 487,800(0.01%)#1,524 |
| 30. | Skidaway Island | 53 | 11,069(0.48%)#30 | 487,800(0.01%)#1,531 |
| 31. | Whitemarsh Island | 53 | 11,069(0.48%)#31 | 487,800(0.01%)#1,538 |
| 32. | Gainesville | 52 | 11,069(0.47%)#32 | 487,800(0.01%)#1,548 |
| 33. | Peachtree Corners | 52 | 11,069(0.47%)#33 | 487,800(0.01%)#1,549 |
| 34. | Kennesaw | 50 | 11,069(0.45%)#34 | 487,800(0.01%)#1,618 |
| 35. | Calhoun | 50 | 11,069(0.45%)#35 | 487,800(0.01%)#1,622 |
| 36. | Fairfield Plantation | 47 | 11,069(0.42%)#36 | 487,800(0.01%)#1,718 |
| 37. | North Druid Hills | 45 | 11,069(0.41%)#37 | 487,800(0.01%)#1,776 |
| 38. | Dalton | 43 | 11,069(0.39%)#38 | 487,800(0.01%)#1,831 |
| 39. | Brookhaven | 41 | 11,069(0.37%)#39 | 487,800(0.01%)#1,897 |
| 40. | Thomasville | 35 | 11,069(0.32%)#40 | 487,800(0.01%)#2,125 |
| 41. | Thomson | 35 | 11,069(0.32%)#41 | 487,800(0.01%)#2,139 |
| 42. | Lagrange | 33 | 11,069(0.30%)#42 | 487,800(0.01%)#2,199 |
| 43. | St Marys | 32 | 11,069(0.29%)#43 | 487,800(0.01%)#2,257 |
| 44. | Barnesville | 31 | 11,069(0.28%)#44 | 487,800(0.01%)#2,327 |
| 45. | Waynesboro | 31 | 11,069(0.28%)#45 | 487,800(0.01%)#2,329 |
| 46. | Fayetteville | 30 | 11,069(0.27%)#46 | 487,800(0.01%)#2,369 |
| 47. | Cumming | 29 | 11,069(0.26%)#47 | 487,800(0.01%)#2,447 |
| 48. | Winterville | 29 | 11,069(0.26%)#48 | 487,800(0.01%)#2,461 |
| 49. | Griffin | 28 | 11,069(0.25%)#49 | 487,800(0.01%)#2,480 |
| 50. | Kingsland | 27 | 11,069(0.24%)#50 | 487,800(0.01%)#2,551 |
| 51. | Lakeview | 26 | 11,069(0.23%)#51 | 487,800(0.01%)#2,634 |
| 52. | Trenton | 26 | 11,069(0.23%)#52 | 487,800(0.01%)#2,644 |
| 53. | Evans | 25 | 11,069(0.23%)#53 | 487,800(0.01%)#2,658 |
| 54. | Statesboro | 24 | 11,069(0.22%)#54 | 487,800(0.00%)#2,732 |
| 55. | Manchester | 24 | 11,069(0.22%)#55 | 487,800(0.00%)#2,783 |
| 56. | Everett | 22 | 11,069(0.20%)#56 | 487,800(0.00%)#2,936 |
| 57. | Chamblee | 21 | 11,069(0.19%)#57 | 487,800(0.00%)#2,944 |
| 58. | Waycross | 21 | 11,069(0.19%)#58 | 487,800(0.00%)#2,962 |
| 59. | Canton | 20 | 11,069(0.18%)#59 | 487,800(0.00%)#3,025 |
| 60. | Decatur | 18 | 11,069(0.16%)#60 | 487,800(0.00%)#3,213 |
| 61. | Brunswick | 17 | 11,069(0.15%)#61 | 487,800(0.00%)#3,324 |
| 62. | Chattahoochee Hills | 17 | 11,069(0.15%)#62 | 487,800(0.00%)#3,376 |
| 63. | Sterling | 17 | 11,069(0.15%)#63 | 487,800(0.00%)#3,385 |
| 64. | Perry | 16 | 11,069(0.14%)#64 | 487,800(0.00%)#3,426 |
| 65. | Newnan | 15 | 11,069(0.14%)#65 | 487,800(0.00%)#3,532 |
| 66. | Ball Ground | 14 | 11,069(0.13%)#66 | 487,800(0.00%)#3,740 |
| 67. | Lavonia | 13 | 11,069(0.12%)#67 | 487,800(0.00%)#3,851 |
| 68. | Acworth | 12 | 11,069(0.11%)#68 | 487,800(0.00%)#3,914 |
| 69. | Vinings | 12 | 11,069(0.11%)#69 | 487,800(0.00%)#3,930 |
| 70. | Bemiss | 12 | 11,069(0.11%)#70 | 487,800(0.00%)#3,948 |
| 71. | Winder | 11 | 11,069(0.10%)#71 | 487,800(0.00%)#4,052 |
| 72. | Conyers | 11 | 11,069(0.10%)#72 | 487,800(0.00%)#4,055 |
| 73. | Fort Stewart | 11 | 11,069(0.10%)#73 | 487,800(0.00%)#4,083 |
| 74. | Cusseta Chattahoochee County Unified Government | 10 | 11,069(0.09%)#74 | 487,800(0.00%)#4,251 |
| 75. | Berkeley Lake | 10 | 11,069(0.09%)#75 | 487,800(0.00%)#4,303 |
| 76. | Taylorsville | 10 | 11,069(0.09%)#76 | 487,800(0.00%)#4,358 |
| 77. | Albany | 9 | 11,069(0.08%)#77 | 487,800(0.00%)#4,365 |
| 78. | Martinez | 9 | 11,069(0.08%)#78 | 487,800(0.00%)#4,373 |
| 79. | Duluth | 9 | 11,069(0.08%)#79 | 487,800(0.00%)#4,376 |
| 80. | Belvedere Park | 9 | 11,069(0.08%)#80 | 487,800(0.00%)#4,398 |
| 81. | College Park | 9 | 11,069(0.08%)#81 | 487,800(0.00%)#4,400 |
| 82. | Auburn | 9 | 11,069(0.08%)#82 | 487,800(0.00%)#4,434 |
| 83. | St Simons | 7 | 11,069(0.06%)#83 | 487,800(0.00%)#4,785 |
| 84. | Moultrie | 7 | 11,069(0.06%)#84 | 487,800(0.00%)#4,789 |
| 85. | Dawsonville | 7 | 11,069(0.06%)#85 | 487,800(0.00%)#4,836 |
| 86. | Berry College | 7 | 11,069(0.06%)#86 | 487,800(0.00%)#4,883 |
| 87. | Pine Mountain | 7 | 11,069(0.06%)#87 | 487,800(0.00%)#4,889 |
| 88. | Hiawassee | 7 | 11,069(0.06%)#88 | 487,800(0.00%)#4,901 |
| 89. | Sasser | 7 | 11,069(0.06%)#89 | 487,800(0.00%)#4,941 |
| 90. | Stockbridge | 6 | 11,069(0.05%)#90 | 487,800(0.00%)#4,960 |
| 91. | Wilmington Island | 6 | 11,069(0.05%)#91 | 487,800(0.00%)#4,974 |
| 92. | Cochran | 6 | 11,069(0.05%)#92 | 487,800(0.00%)#5,007 |
| 93. | Watkinsville | 6 | 11,069(0.05%)#93 | 487,800(0.00%)#5,032 |
| 94. | Springfield | 6 | 11,069(0.05%)#94 | 487,800(0.00%)#5,041 |
| 95. | Webster County Unified Government | 6 | 11,069(0.05%)#95 | 487,800(0.00%)#5,055 |
| 96. | Franklin Springs | 6 | 11,069(0.05%)#96 | 487,800(0.00%)#5,112 |
| 97. | Bethlehem | 6 | 11,069(0.05%)#97 | 487,800(0.00%)#5,137 |
| 98. | Americus | 5 | 11,069(0.05%)#98 | 487,800(0.00%)#5,181 |
| 99. | Bloomingdale | 5 | 11,069(0.05%)#99 | 487,800(0.00%)#5,230 |
| 100. | Trion | 5 | 11,069(0.05%)#100 | 487,800(0.00%)#5,249 |
Common Questions
What are the Top 10 Cities with the Largest Northern European Community in Georgia?
Top 10 Cities with the Largest Northern European Community in Georgia are:
#1
969
#2
277
#3
245
#4
208
#5
168
#6
164
#7
143
#8
126
#9
120
#10
107
What city has the Largest Northern European Community in Georgia?
Atlanta has the Largest Northern European Community in Georgia with 969.
What is the Total Northern European Population in the State of Georgia?
Total Northern European Population in Georgia is 11,069.
What is the Total Northern European Population in the United States?
Total Northern European Population in the United States is 487,800.