Fort Collins, CO Map & Demographics
Fort Collins Map
Fort Collins Overview
$43,495
PER CAPITA INCOME
$114,740
AVG FAMILY INCOME
$78,977
AVG HOUSEHOLD INCOME
33.6%
WAGE / INCOME GAP [ % ]
66.4¢/ $1
WAGE / INCOME GAP [ $ ]
$12,039
FAMILY INCOME DEFICIT
0.46
INEQUALITY / GINI INDEX
168,758
TOTAL POPULATION
84,865
MALE POPULATION
83,893
FEMALE POPULATION
101.16
MALES / 100 FEMALES
98.85
FEMALES / 100 MALES
30.1
MEDIAN AGE
2.9
AVG FAMILY SIZE
2.3
AVG HOUSEHOLD SIZE
101,805
LABOR FORCE [ PEOPLE ]
70.8%
PERCENT IN LABOR FORCE
5.3%
UNEMPLOYMENT RATE
Fort Collins Area Codes
Income in Fort Collins
Income Overview in Fort Collins
Per Capita Income in Fort Collins is $43,495, while median incomes of families and households are $114,740 and $78,977 respectively.
| Characteristic | Number | Measure |
| Per Capita Income | 168,758 | $43,495 |
| Median Family Income | 35,870 | $114,740 |
| Mean Family Income | 35,870 | $137,621 |
| Median Household Income | 69,953 | $78,977 |
| Mean Household Income | 69,953 | $105,035 |
| Income Deficit | 35,870 | $12,039 |
| Wage / Income Gap (%) | 168,758 | 33.55% |
| Wage / Income Gap ($) | 168,758 | 66.45¢ per $1 |
| Gini / Inequality Index | 168,758 | 0.46 |
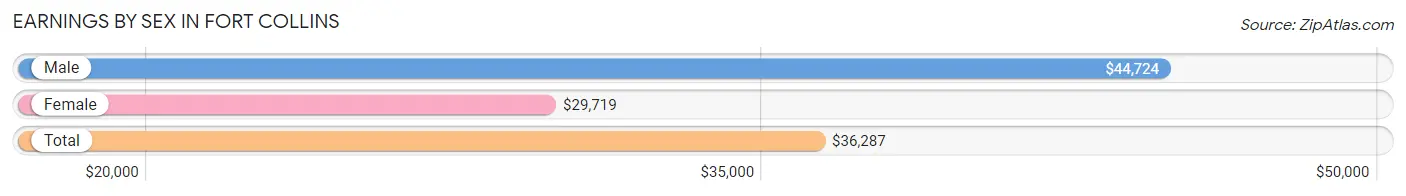
Earnings by Sex in Fort Collins
Average Earnings in Fort Collins are $36,287, $44,724 for men and $29,719 for women, a difference of 33.6%.
| Sex | Number | Average Earnings |
| Male | 57,803 (52.2%) | $44,724 |
| Female | 52,820 (47.7%) | $29,719 |
| Total | 110,623 (100.0%) | $36,287 |
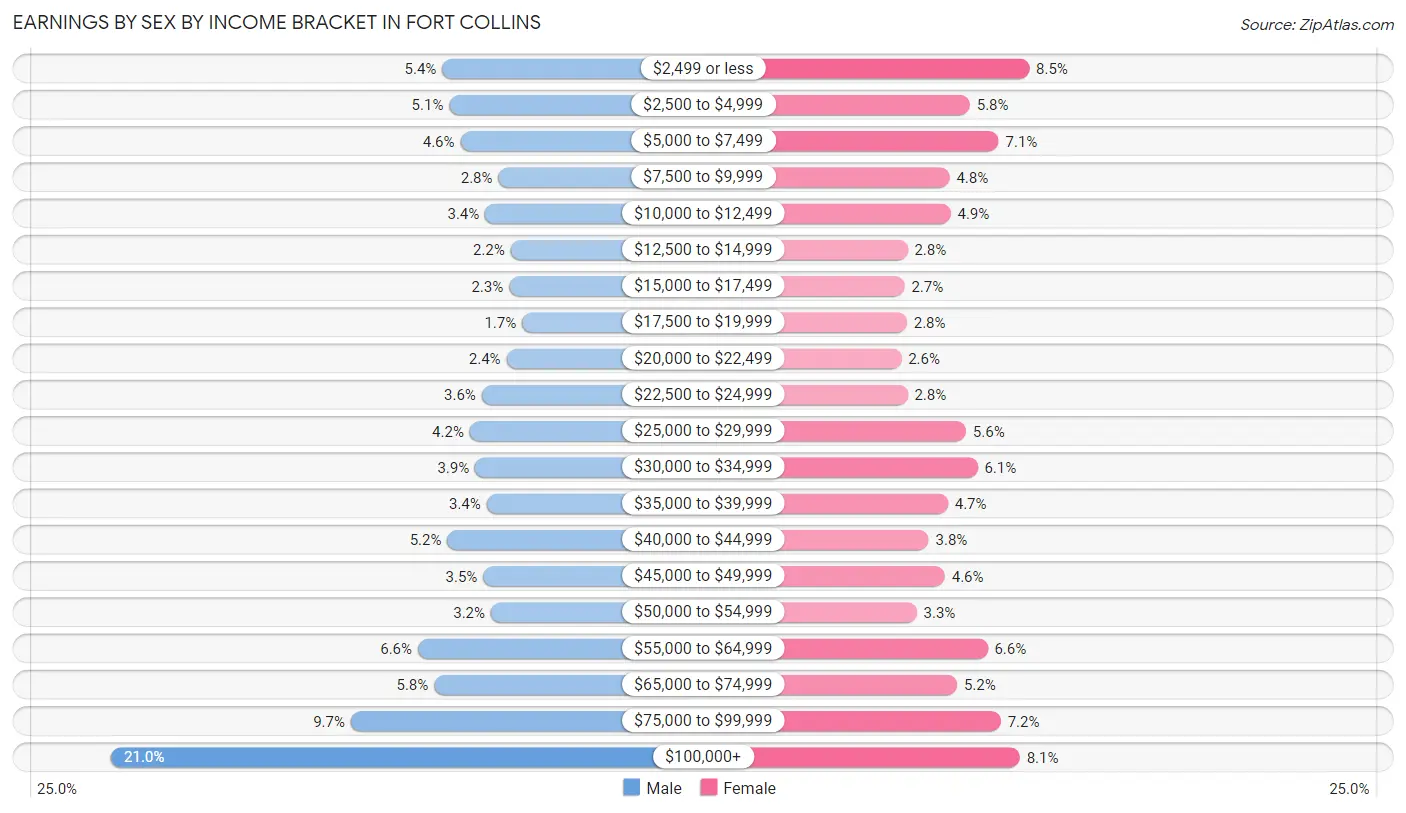
Earnings by Sex by Income Bracket in Fort Collins
The most common earnings brackets in Fort Collins are $100,000+ for men (12,107 | 20.9%) and $2,499 or less for women (4,510 | 8.5%).
| Income | Male | Female |
| $2,499 or less | 3,146 (5.4%) | 4,510 (8.5%) |
| $2,500 to $4,999 | 2,951 (5.1%) | 3,041 (5.8%) |
| $5,000 to $7,499 | 2,655 (4.6%) | 3,755 (7.1%) |
| $7,500 to $9,999 | 1,624 (2.8%) | 2,539 (4.8%) |
| $10,000 to $12,499 | 1,985 (3.4%) | 2,567 (4.9%) |
| $12,500 to $14,999 | 1,293 (2.2%) | 1,502 (2.8%) |
| $15,000 to $17,499 | 1,334 (2.3%) | 1,426 (2.7%) |
| $17,500 to $19,999 | 985 (1.7%) | 1,484 (2.8%) |
| $20,000 to $22,499 | 1,404 (2.4%) | 1,349 (2.5%) |
| $22,500 to $24,999 | 2,075 (3.6%) | 1,502 (2.8%) |
| $25,000 to $29,999 | 2,400 (4.2%) | 2,945 (5.6%) |
| $30,000 to $34,999 | 2,252 (3.9%) | 3,232 (6.1%) |
| $35,000 to $39,999 | 1,941 (3.4%) | 2,500 (4.7%) |
| $40,000 to $44,999 | 3,005 (5.2%) | 2,023 (3.8%) |
| $45,000 to $49,999 | 2,032 (3.5%) | 2,423 (4.6%) |
| $50,000 to $54,999 | 1,828 (3.2%) | 1,728 (3.3%) |
| $55,000 to $64,999 | 3,802 (6.6%) | 3,481 (6.6%) |
| $65,000 to $74,999 | 3,364 (5.8%) | 2,727 (5.2%) |
| $75,000 to $99,999 | 5,620 (9.7%) | 3,806 (7.2%) |
| $100,000+ | 12,107 (20.9%) | 4,280 (8.1%) |
| Total | 57,803 (100.0%) | 52,820 (100.0%) |
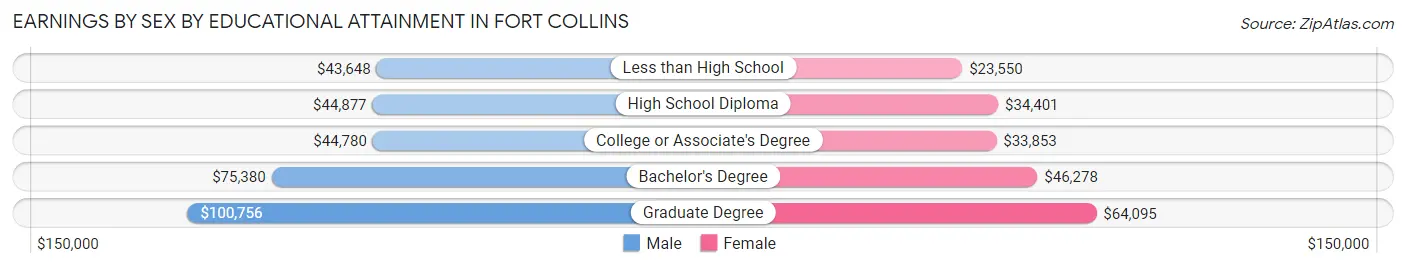
Earnings by Sex by Educational Attainment in Fort Collins
Average earnings in Fort Collins are $64,402 for men and $44,681 for women, a difference of 30.6%. Men with an educational attainment of graduate degree enjoy the highest average annual earnings of $100,756, while those with less than high school education earn the least with $43,648. Women with an educational attainment of graduate degree earn the most with the average annual earnings of $64,095, while those with less than high school education have the smallest earnings of $23,550.
| Educational Attainment | Male Income | Female Income |
| Less than High School | $43,648 | $23,550 |
| High School Diploma | $44,877 | $34,401 |
| College or Associate's Degree | $44,780 | $33,853 |
| Bachelor's Degree | $75,380 | $46,278 |
| Graduate Degree | $100,756 | $64,095 |
| Total | $64,402 | $44,681 |
Family Income in Fort Collins
Family Income Brackets in Fort Collins
According to the Fort Collins family income data, there are 8,358 families falling into the $100,000 to $149,999 income range, which is the most common income bracket and makes up 23.3% of all families. Conversely, the $10,000 to $14,999 income bracket is the least frequent group with only 359 families (1.0%) belonging to this category.
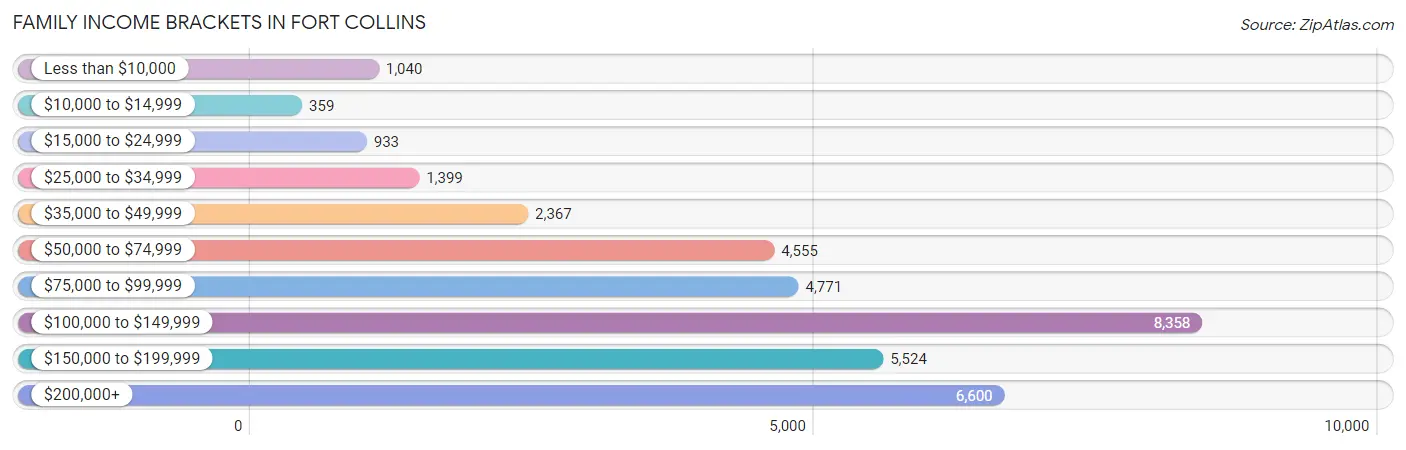
| Income Bracket | # Families | % Families |
| Less than $10,000 | 1,040 | 2.9% |
| $10,000 to $14,999 | 359 | 1.0% |
| $15,000 to $24,999 | 933 | 2.6% |
| $25,000 to $34,999 | 1,399 | 3.9% |
| $35,000 to $49,999 | 2,367 | 6.6% |
| $50,000 to $74,999 | 4,555 | 12.7% |
| $75,000 to $99,999 | 4,771 | 13.3% |
| $100,000 to $149,999 | 8,358 | 23.3% |
| $150,000 to $199,999 | 5,524 | 15.4% |
| $200,000+ | 6,600 | 18.4% |
Family Income by Famaliy Size in Fort Collins
7+ person families (283 | 0.8%) account for the highest median family income in Fort Collins with $155,202 per family, while 2-person families (17,993 | 50.2%) have the highest median income of $47,269 per family member.
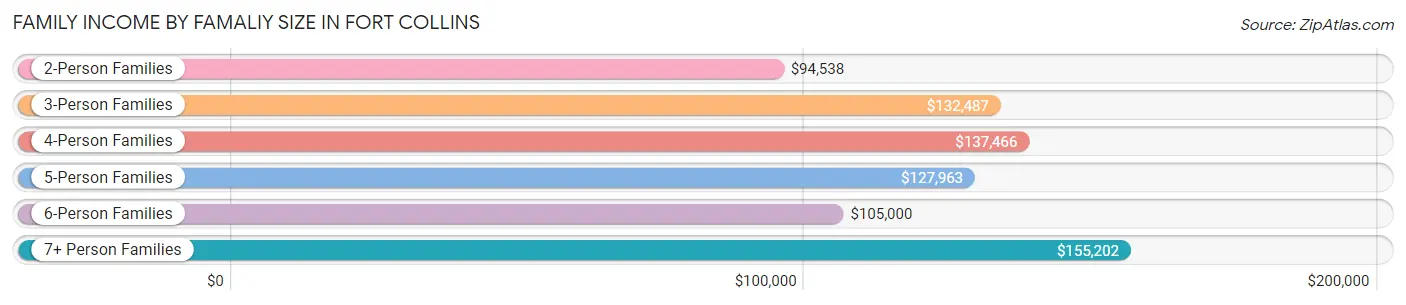
| Income Bracket | # Families | Median Income |
| 2-Person Families | 17,993 (50.2%) | $94,538 |
| 3-Person Families | 7,343 (20.5%) | $132,487 |
| 4-Person Families | 7,291 (20.3%) | $137,466 |
| 5-Person Families | 2,400 (6.7%) | $127,963 |
| 6-Person Families | 560 (1.6%) | $105,000 |
| 7+ Person Families | 283 (0.8%) | $155,202 |
| Total | 35,870 (100.0%) | $114,740 |
Family Income by Number of Earners in Fort Collins
The median family income in Fort Collins is $114,740, with families comprising 3+ earners (3,497) having the highest median family income of $151,733, while families with no earners (4,163) have the lowest median family income of $65,069, accounting for 9.8% and 11.6% of families, respectively.
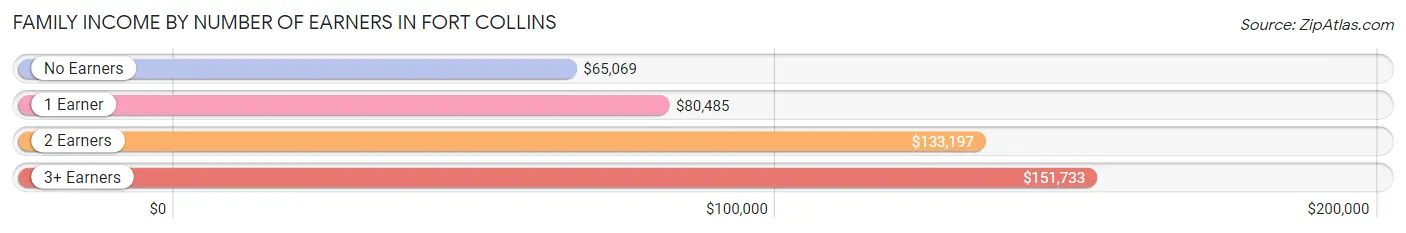
| Number of Earners | # Families | Median Income |
| No Earners | 4,163 (11.6%) | $65,069 |
| 1 Earner | 9,552 (26.6%) | $80,485 |
| 2 Earners | 18,658 (52.0%) | $133,197 |
| 3+ Earners | 3,497 (9.8%) | $151,733 |
| Total | 35,870 (100.0%) | $114,740 |
Household Income in Fort Collins
Household Income Brackets in Fort Collins
With 12,522 households falling in the category, the $100,000 to $149,999 income range is the most frequent in Fort Collins, accounting for 17.9% of all households. In contrast, only 2,378 households (3.4%) fall into the $10,000 to $14,999 income bracket, making it the least populous group.
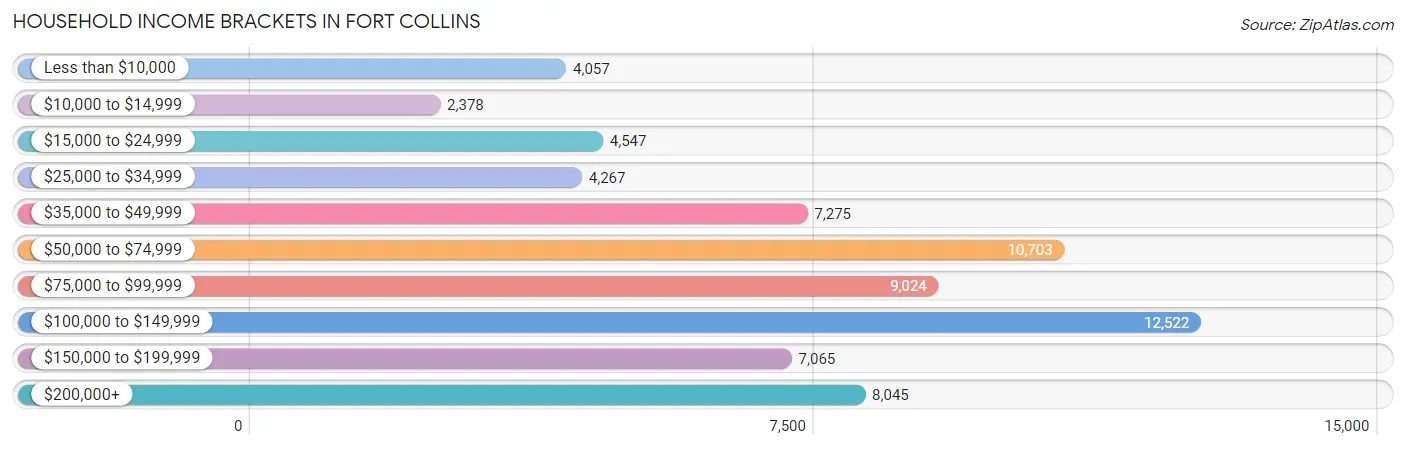
| Income Bracket | # Households | % Households |
| Less than $10,000 | 4,057 | 5.8% |
| $10,000 to $14,999 | 2,378 | 3.4% |
| $15,000 to $24,999 | 4,547 | 6.5% |
| $25,000 to $34,999 | 4,267 | 6.1% |
| $35,000 to $49,999 | 7,275 | 10.4% |
| $50,000 to $74,999 | 10,703 | 15.3% |
| $75,000 to $99,999 | 9,024 | 12.9% |
| $100,000 to $149,999 | 12,522 | 17.9% |
| $150,000 to $199,999 | 7,065 | 10.1% |
| $200,000+ | 8,045 | 11.5% |
Household Income by Householder Age in Fort Collins
The median household income in Fort Collins is $78,977, with the highest median household income of $120,380 found in the 45 to 64 years age bracket for the primary householder. A total of 18,104 households (25.9%) fall into this category. Meanwhile, the 15 to 24 years age bracket for the primary householder has the lowest median household income of $35,584, with 12,360 households (17.7%) in this group.
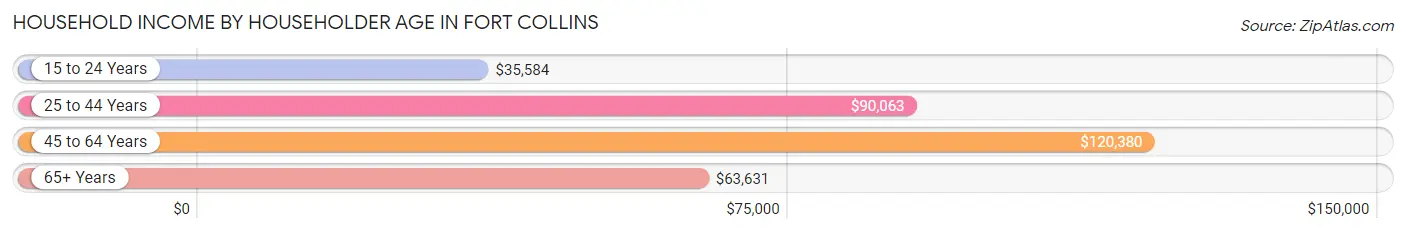
| Income Bracket | # Households | Median Income |
| 15 to 24 Years | 12,360 (17.7%) | $35,584 |
| 25 to 44 Years | 26,802 (38.3%) | $90,063 |
| 45 to 64 Years | 18,104 (25.9%) | $120,380 |
| 65+ Years | 12,687 (18.1%) | $63,631 |
| Total | 69,953 (100.0%) | $78,977 |
Poverty in Fort Collins
Income Below Poverty by Sex and Age in Fort Collins
With 14.7% poverty level for males and 17.8% for females among the residents of Fort Collins, 18 to 24 year old males and 18 to 24 year old females are the most vulnerable to poverty, with 6,647 males (42.9%) and 8,327 females (52.8%) in their respective age groups living below the poverty level.
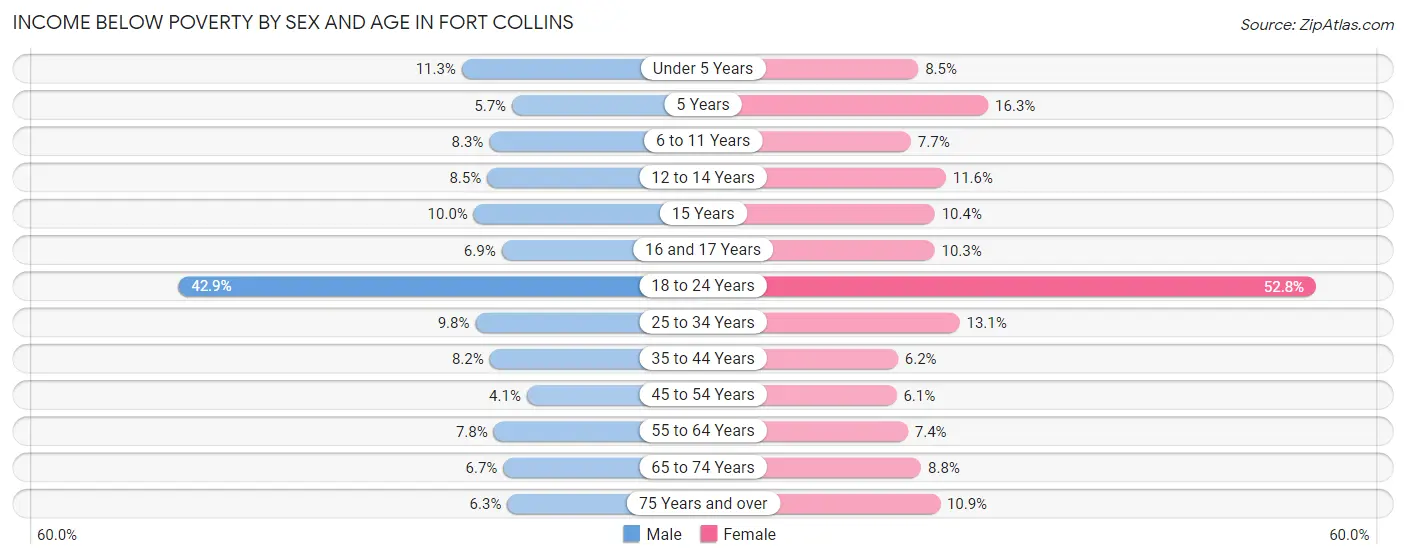
| Age Bracket | Male | Female |
| Under 5 Years | 391 (11.3%) | 270 (8.5%) |
| 5 Years | 48 (5.7%) | 161 (16.3%) |
| 6 to 11 Years | 395 (8.3%) | 341 (7.7%) |
| 12 to 14 Years | 231 (8.5%) | 286 (11.6%) |
| 15 Years | 88 (10.0%) | 89 (10.3%) |
| 16 and 17 Years | 109 (6.9%) | 204 (10.3%) |
| 18 to 24 Years | 6,647 (42.9%) | 8,327 (52.8%) |
| 25 to 34 Years | 1,589 (9.8%) | 1,796 (13.1%) |
| 35 to 44 Years | 879 (8.2%) | 627 (6.2%) |
| 45 to 54 Years | 314 (4.1%) | 455 (6.1%) |
| 55 to 64 Years | 605 (7.8%) | 612 (7.4%) |
| 65 to 74 Years | 360 (6.7%) | 550 (8.8%) |
| 75 Years and over | 181 (6.2%) | 485 (10.9%) |
| Total | 11,837 (14.7%) | 14,203 (17.8%) |
Income Above Poverty by Sex and Age in Fort Collins
According to the poverty statistics in Fort Collins, males aged 45 to 54 years and females aged 45 to 54 years are the age groups that are most secure financially, with 95.9% of males and 93.9% of females in these age groups living above the poverty line.
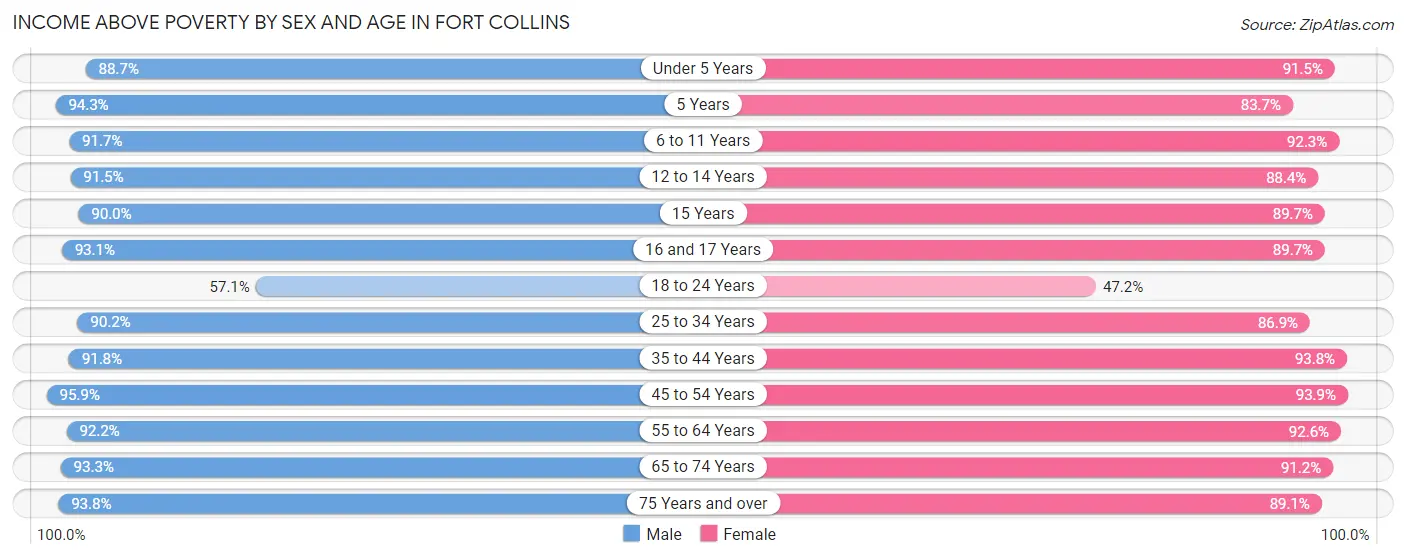
| Age Bracket | Male | Female |
| Under 5 Years | 3,064 (88.7%) | 2,901 (91.5%) |
| 5 Years | 789 (94.3%) | 827 (83.7%) |
| 6 to 11 Years | 4,387 (91.7%) | 4,085 (92.3%) |
| 12 to 14 Years | 2,486 (91.5%) | 2,184 (88.4%) |
| 15 Years | 793 (90.0%) | 771 (89.6%) |
| 16 and 17 Years | 1,474 (93.1%) | 1,771 (89.7%) |
| 18 to 24 Years | 8,856 (57.1%) | 7,443 (47.2%) |
| 25 to 34 Years | 14,611 (90.2%) | 11,908 (86.9%) |
| 35 to 44 Years | 9,816 (91.8%) | 9,414 (93.8%) |
| 45 to 54 Years | 7,382 (95.9%) | 7,021 (93.9%) |
| 55 to 64 Years | 7,186 (92.2%) | 7,703 (92.6%) |
| 65 to 74 Years | 5,011 (93.3%) | 5,677 (91.2%) |
| 75 Years and over | 2,717 (93.8%) | 3,954 (89.1%) |
| Total | 68,572 (85.3%) | 65,659 (82.2%) |
Income Below Poverty Among Married-Couple Families in Fort Collins
The poverty statistics for married-couple families in Fort Collins show that 2.8% or 791 of the total 28,733 families live below the poverty line. Families with 5 or more children have the highest poverty rate of 9.0%, comprising of 13 families. On the other hand, families with no children have the lowest poverty rate of 2.3%, which includes 380 families.
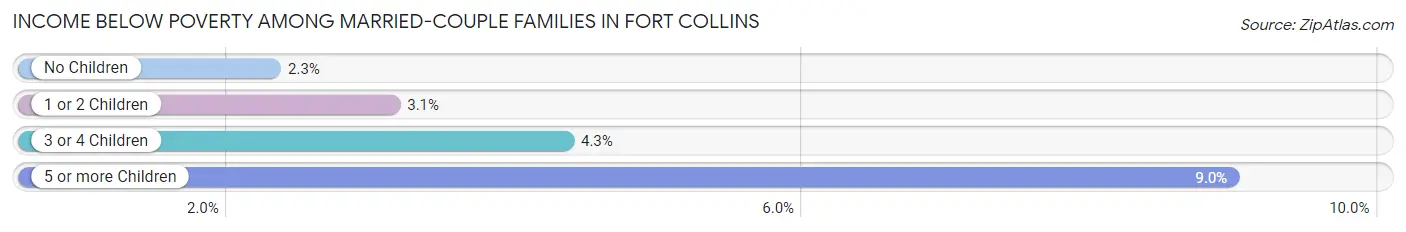
| Children | Above Poverty | Below Poverty |
| No Children | 16,164 (97.7%) | 380 (2.3%) |
| 1 or 2 Children | 9,993 (96.9%) | 323 (3.1%) |
| 3 or 4 Children | 1,653 (95.7%) | 75 (4.3%) |
| 5 or more Children | 132 (91.0%) | 13 (9.0%) |
| Total | 27,942 (97.3%) | 791 (2.8%) |
Income Below Poverty Among Single-Parent Households in Fort Collins
According to the poverty data in Fort Collins, 17.1% or 436 single-father households and 19.0% or 873 single-mother households are living below the poverty line. Among single-father households, those with 1 or 2 children have the highest poverty rate, with 295 households (22.4%) experiencing poverty. Likewise, among single-mother households, those with 3 or 4 children have the highest poverty rate, with 170 households (33.3%) falling below the poverty line.
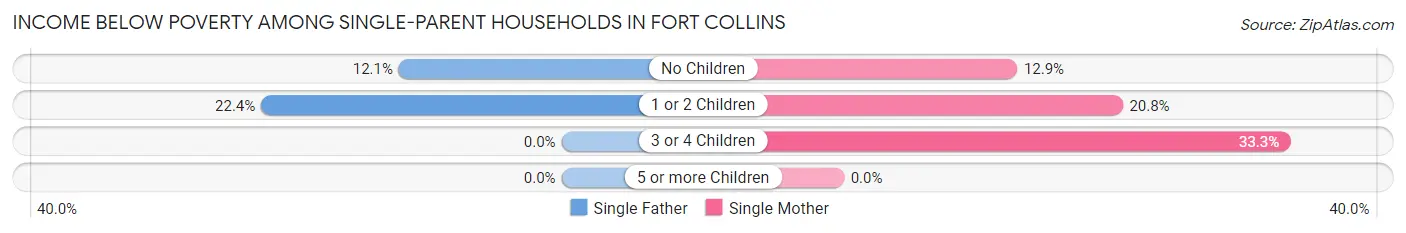
| Children | Single Father | Single Mother |
| No Children | 141 (12.1%) | 231 (12.9%) |
| 1 or 2 Children | 295 (22.4%) | 472 (20.8%) |
| 3 or 4 Children | 0 (0.0%) | 170 (33.3%) |
| 5 or more Children | 0 (0.0%) | 0 (0.0%) |
| Total | 436 (17.1%) | 873 (19.0%) |
Income Below Poverty Among Married-Couple vs Single-Parent Households in Fort Collins
The poverty data for Fort Collins shows that 791 of the married-couple family households (2.8%) and 1,309 of the single-parent households (18.3%) are living below the poverty level. Within the married-couple family households, those with 5 or more children have the highest poverty rate, with 13 households (9.0%) falling below the poverty line. Among the single-parent households, those with 3 or 4 children have the highest poverty rate, with 170 household (29.6%) living below poverty.
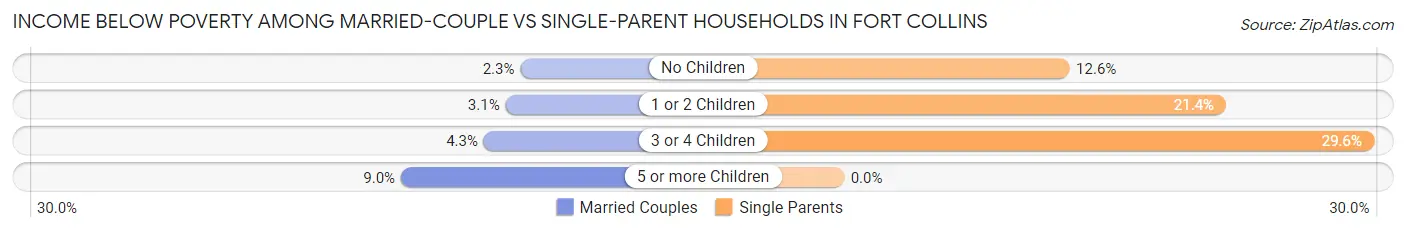
| Children | Married-Couple Families | Single-Parent Households |
| No Children | 380 (2.3%) | 372 (12.6%) |
| 1 or 2 Children | 323 (3.1%) | 767 (21.4%) |
| 3 or 4 Children | 75 (4.3%) | 170 (29.6%) |
| 5 or more Children | 13 (9.0%) | 0 (0.0%) |
| Total | 791 (2.8%) | 1,309 (18.3%) |
Race in Fort Collins
The most populous races in Fort Collins are White / Caucasian (139,687 | 82.8%), Hispanic or Latino (20,870 | 12.4%), and Two or more Races (15,686 | 9.3%).
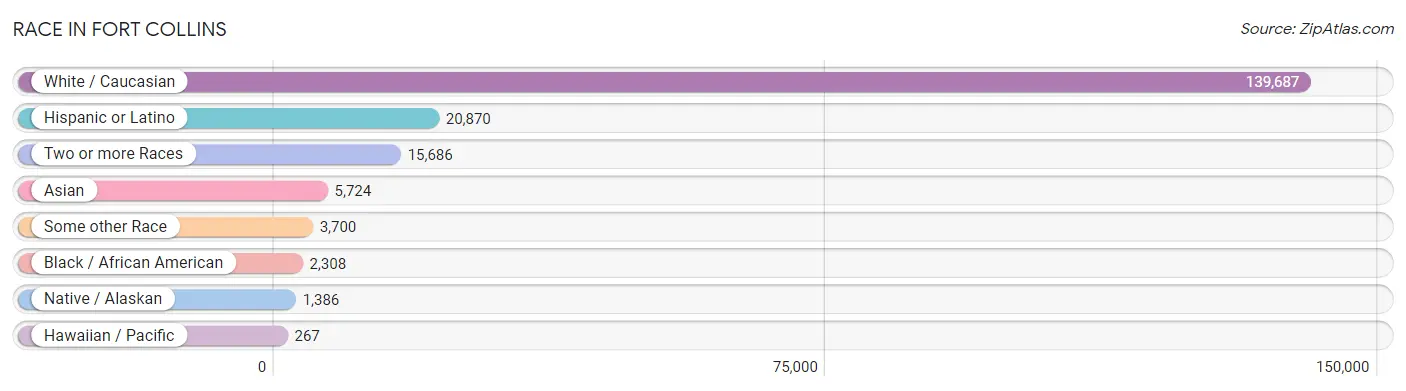
| Race | # Population | % Population |
| Asian | 5,724 | 3.4% |
| Black / African American | 2,308 | 1.4% |
| Hawaiian / Pacific | 267 | 0.2% |
| Hispanic or Latino | 20,870 | 12.4% |
| Native / Alaskan | 1,386 | 0.8% |
| White / Caucasian | 139,687 | 82.8% |
| Two or more Races | 15,686 | 9.3% |
| Some other Race | 3,700 | 2.2% |
| Total | 168,758 | 100.0% |
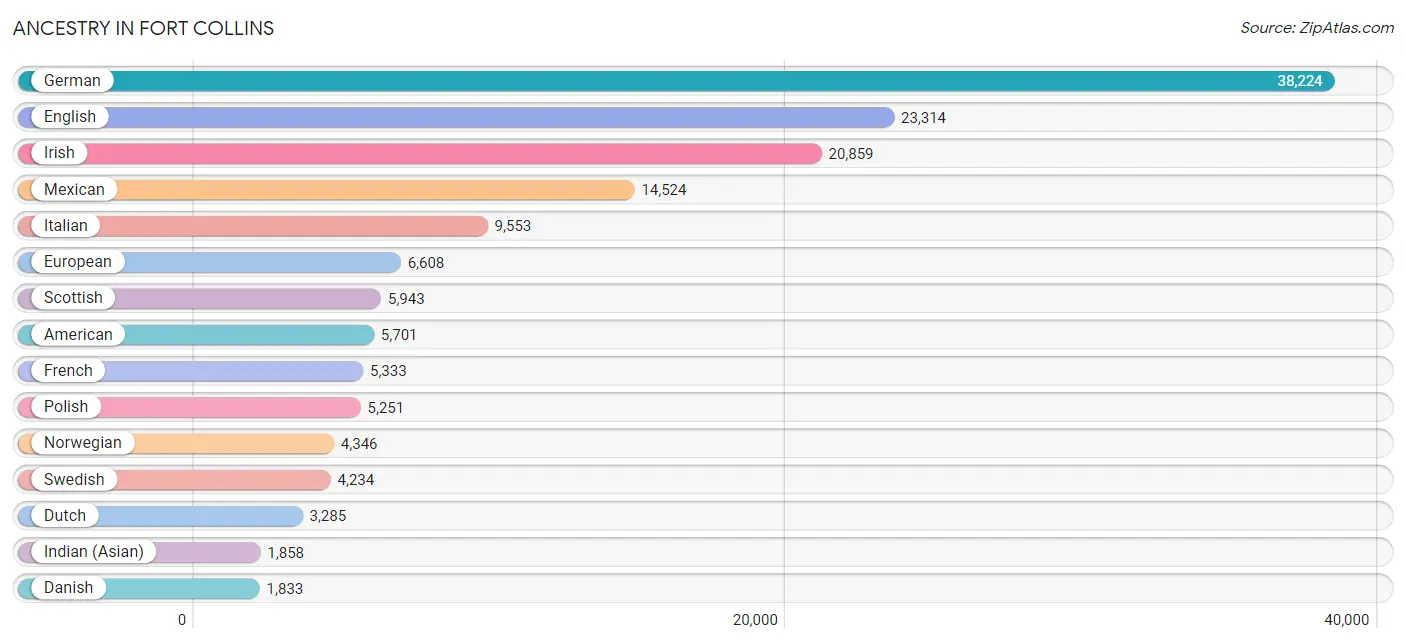
Ancestry in Fort Collins
The most populous ancestries reported in Fort Collins are German (38,224 | 22.7%), English (23,314 | 13.8%), Irish (20,859 | 12.4%), Mexican (14,524 | 8.6%), and Italian (9,553 | 5.7%), together accounting for 63.1% of all Fort Collins residents.
| Ancestry | # Population | % Population |
| Afghan | 96 | 0.1% |
| African | 383 | 0.2% |
| Alaskan Athabascan | 75 | 0.0% |
| Albanian | 23 | 0.0% |
| Aleut | 12 | 0.0% |
| Alsatian | 80 | 0.1% |
| American | 5,701 | 3.4% |
| Apache | 302 | 0.2% |
| Arab | 1,166 | 0.7% |
| Argentinean | 69 | 0.0% |
| Armenian | 131 | 0.1% |
| Australian | 111 | 0.1% |
| Austrian | 483 | 0.3% |
| Bangladeshi | 10 | 0.0% |
| Basque | 57 | 0.0% |
| Belgian | 385 | 0.2% |
| Bhutanese | 1,085 | 0.6% |
| Blackfeet | 2 | 0.0% |
| Bolivian | 73 | 0.0% |
| Brazilian | 451 | 0.3% |
| British | 1,514 | 0.9% |
| Bulgarian | 50 | 0.0% |
| Burmese | 1,283 | 0.8% |
| Canadian | 554 | 0.3% |
| Cape Verdean | 7 | 0.0% |
| Carpatho Rusyn | 5 | 0.0% |
| Celtic | 33 | 0.0% |
| Central American | 1,158 | 0.7% |
| Central American Indian | 18 | 0.0% |
| Cherokee | 525 | 0.3% |
| Chickasaw | 67 | 0.0% |
| Chilean | 133 | 0.1% |
| Chippewa | 42 | 0.0% |
| Choctaw | 75 | 0.0% |
| Colombian | 203 | 0.1% |
| Comanche | 11 | 0.0% |
| Costa Rican | 354 | 0.2% |
| Creek | 60 | 0.0% |
| Croatian | 289 | 0.2% |
| Crow | 6 | 0.0% |
| Cuban | 226 | 0.1% |
| Czech | 1,362 | 0.8% |
| Czechoslovakian | 327 | 0.2% |
| Danish | 1,833 | 1.1% |
| Delaware | 14 | 0.0% |
| Dominican | 93 | 0.1% |
| Dutch | 3,285 | 1.9% |
| Eastern European | 860 | 0.5% |
| Ecuadorian | 117 | 0.1% |
| Egyptian | 38 | 0.0% |
| English | 23,314 | 13.8% |
| Estonian | 6 | 0.0% |
| Ethiopian | 125 | 0.1% |
| European | 6,608 | 3.9% |
| Fijian | 14 | 0.0% |
| Filipino | 89 | 0.1% |
| Finnish | 457 | 0.3% |
| French | 5,333 | 3.2% |
| French American Indian | 3 | 0.0% |
| French Canadian | 889 | 0.5% |
| German | 38,224 | 22.7% |
| German Russian | 77 | 0.1% |
| Ghanaian | 19 | 0.0% |
| Greek | 756 | 0.4% |
| Guamanian / Chamorro | 27 | 0.0% |
| Guatemalan | 170 | 0.1% |
| Haitian | 68 | 0.0% |
| Honduran | 168 | 0.1% |
| Hungarian | 406 | 0.2% |
| Icelander | 72 | 0.0% |
| Indian (Asian) | 1,858 | 1.1% |
| Indonesian | 53 | 0.0% |
| Iranian | 194 | 0.1% |
| Irish | 20,859 | 12.4% |
| Iroquois | 48 | 0.0% |
| Israeli | 54 | 0.0% |
| Italian | 9,553 | 5.7% |
| Jamaican | 99 | 0.1% |
| Japanese | 86 | 0.1% |
| Kenyan | 21 | 0.0% |
| Korean | 899 | 0.5% |
| Laotian | 152 | 0.1% |
| Latvian | 29 | 0.0% |
| Lebanese | 286 | 0.2% |
| Lithuanian | 439 | 0.3% |
| Lumbee | 9 | 0.0% |
| Luxembourger | 85 | 0.1% |
| Maltese | 32 | 0.0% |
| Mexican | 14,524 | 8.6% |
| Mexican American Indian | 191 | 0.1% |
| Mongolian | 134 | 0.1% |
| Moroccan | 6 | 0.0% |
| Native Hawaiian | 370 | 0.2% |
| Navajo | 141 | 0.1% |
| New Zealander | 13 | 0.0% |
| Nicaraguan | 72 | 0.0% |
| Nigerian | 84 | 0.1% |
| Northern European | 711 | 0.4% |
| Norwegian | 4,346 | 2.6% |
| Osage | 6 | 0.0% |
| Pakistani | 280 | 0.2% |
| Panamanian | 185 | 0.1% |
| Pennsylvania German | 37 | 0.0% |
| Peruvian | 232 | 0.1% |
| Polish | 5,251 | 3.1% |
| Portuguese | 536 | 0.3% |
| Potawatomi | 23 | 0.0% |
| Pueblo | 31 | 0.0% |
| Puerto Rican | 912 | 0.5% |
| Romanian | 147 | 0.1% |
| Russian | 1,684 | 1.0% |
| Salvadoran | 193 | 0.1% |
| Scandinavian | 1,171 | 0.7% |
| Scotch-Irish | 1,671 | 1.0% |
| Scottish | 5,943 | 3.5% |
| Seminole | 10 | 0.0% |
| Serbian | 118 | 0.1% |
| Shoshone | 64 | 0.0% |
| Sioux | 348 | 0.2% |
| Slavic | 108 | 0.1% |
| Slovak | 279 | 0.2% |
| Slovene | 98 | 0.1% |
| South African | 46 | 0.0% |
| South American | 1,344 | 0.8% |
| South American Indian | 31 | 0.0% |
| Spaniard | 753 | 0.4% |
| Spanish | 943 | 0.6% |
| Spanish American | 15 | 0.0% |
| Spanish American Indian | 7 | 0.0% |
| Sri Lankan | 605 | 0.4% |
| Subsaharan African | 702 | 0.4% |
| Swedish | 4,234 | 2.5% |
| Swiss | 960 | 0.6% |
| Syrian | 62 | 0.0% |
| Thai | 1,685 | 1.0% |
| Tongan | 12 | 0.0% |
| Trinidadian and Tobagonian | 35 | 0.0% |
| Turkish | 3 | 0.0% |
| Ugandan | 43 | 0.0% |
| Ukrainian | 908 | 0.5% |
| Uruguayan | 23 | 0.0% |
| Ute | 79 | 0.1% |
| Venezuelan | 494 | 0.3% |
| Welsh | 1,582 | 0.9% |
| Yugoslavian | 60 | 0.0% | View All 145 Rows |
Immigrants in Fort Collins
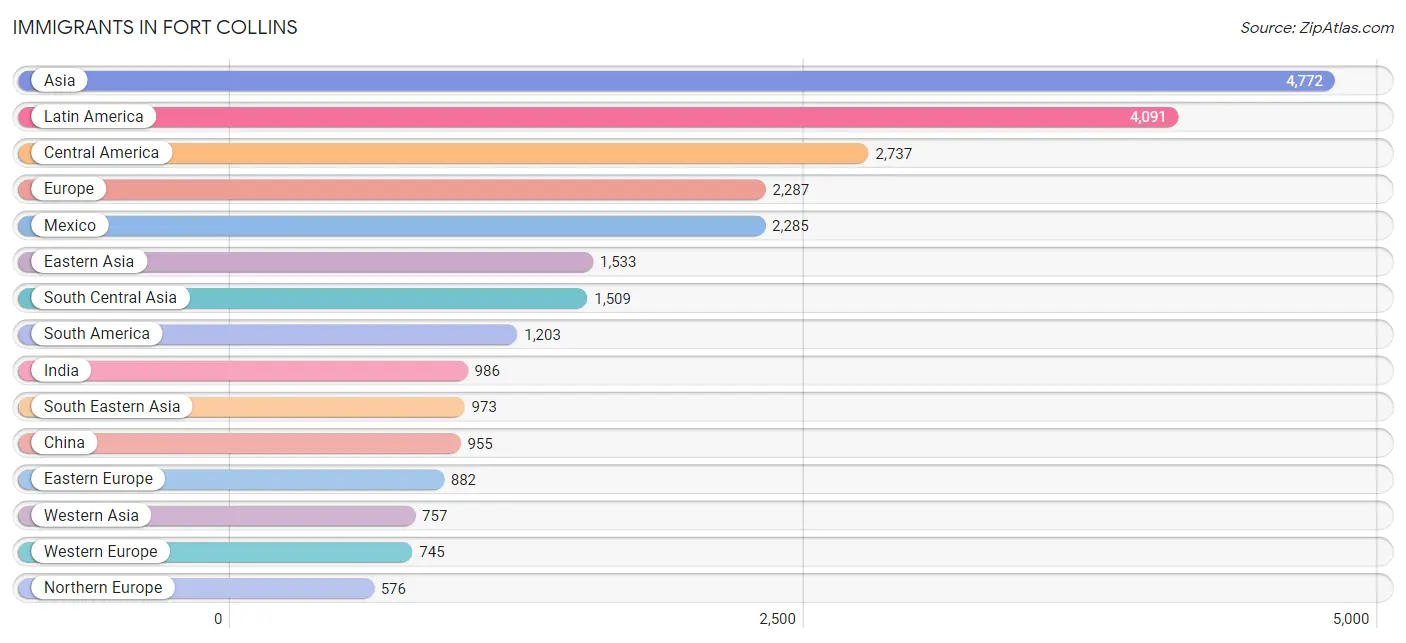
The most numerous immigrant groups reported in Fort Collins came from Asia (4,772 | 2.8%), Latin America (4,091 | 2.4%), Central America (2,737 | 1.6%), Europe (2,287 | 1.4%), and Mexico (2,285 | 1.3%), together accounting for 9.6% of all Fort Collins residents.
| Immigration Origin | # Population | % Population |
| Afghanistan | 94 | 0.1% |
| Africa | 479 | 0.3% |
| Albania | 13 | 0.0% |
| Argentina | 10 | 0.0% |
| Asia | 4,772 | 2.8% |
| Australia | 179 | 0.1% |
| Austria | 23 | 0.0% |
| Bangladesh | 33 | 0.0% |
| Belgium | 60 | 0.0% |
| Bolivia | 82 | 0.1% |
| Bosnia and Herzegovina | 7 | 0.0% |
| Brazil | 502 | 0.3% |
| Cambodia | 76 | 0.1% |
| Canada | 249 | 0.2% |
| Caribbean | 151 | 0.1% |
| Central America | 2,737 | 1.6% |
| Chile | 96 | 0.1% |
| China | 955 | 0.6% |
| Colombia | 68 | 0.0% |
| Costa Rica | 50 | 0.0% |
| Czechoslovakia | 30 | 0.0% |
| Dominican Republic | 37 | 0.0% |
| Eastern Africa | 186 | 0.1% |
| Eastern Asia | 1,533 | 0.9% |
| Eastern Europe | 882 | 0.5% |
| Ecuador | 53 | 0.0% |
| Egypt | 24 | 0.0% |
| El Salvador | 86 | 0.1% |
| England | 206 | 0.1% |
| Ethiopia | 114 | 0.1% |
| Europe | 2,287 | 1.4% |
| France | 272 | 0.2% |
| Germany | 333 | 0.2% |
| Ghana | 91 | 0.1% |
| Greece | 6 | 0.0% |
| Guatemala | 121 | 0.1% |
| Haiti | 68 | 0.0% |
| Honduras | 19 | 0.0% |
| Hungary | 16 | 0.0% |
| India | 986 | 0.6% |
| Indonesia | 49 | 0.0% |
| Iran | 200 | 0.1% |
| Iraq | 35 | 0.0% |
| Ireland | 21 | 0.0% |
| Italy | 49 | 0.0% |
| Japan | 89 | 0.1% |
| Kazakhstan | 23 | 0.0% |
| Kenya | 29 | 0.0% |
| Korea | 489 | 0.3% |
| Kuwait | 240 | 0.1% |
| Latin America | 4,091 | 2.4% |
| Latvia | 22 | 0.0% |
| Lebanon | 61 | 0.0% |
| Lithuania | 39 | 0.0% |
| Malaysia | 139 | 0.1% |
| Mexico | 2,285 | 1.3% |
| Middle Africa | 11 | 0.0% |
| Moldova | 204 | 0.1% |
| Nepal | 134 | 0.1% |
| Netherlands | 23 | 0.0% |
| Nicaragua | 58 | 0.0% |
| Northern Africa | 30 | 0.0% |
| Northern Europe | 576 | 0.3% |
| Norway | 7 | 0.0% |
| Oceania | 181 | 0.1% |
| Pakistan | 19 | 0.0% |
| Panama | 118 | 0.1% |
| Peru | 78 | 0.1% |
| Philippines | 254 | 0.2% |
| Poland | 84 | 0.1% |
| Portugal | 14 | 0.0% |
| Russia | 149 | 0.1% |
| Saudi Arabia | 15 | 0.0% |
| Scotland | 42 | 0.0% |
| Serbia | 23 | 0.0% |
| Singapore | 14 | 0.0% |
| South Africa | 64 | 0.0% |
| South America | 1,203 | 0.7% |
| South Central Asia | 1,509 | 0.9% |
| South Eastern Asia | 973 | 0.6% |
| Southern Europe | 84 | 0.1% |
| Spain | 15 | 0.0% |
| Sri Lanka | 14 | 0.0% |
| Sweden | 30 | 0.0% |
| Switzerland | 34 | 0.0% |
| Taiwan | 107 | 0.1% |
| Thailand | 139 | 0.1% |
| Trinidad and Tobago | 46 | 0.0% |
| Turkey | 69 | 0.0% |
| Uganda | 43 | 0.0% |
| Ukraine | 248 | 0.2% |
| Uruguay | 6 | 0.0% |
| Uzbekistan | 6 | 0.0% |
| Venezuela | 308 | 0.2% |
| Vietnam | 259 | 0.2% |
| Western Africa | 188 | 0.1% |
| Western Asia | 757 | 0.4% |
| Western Europe | 745 | 0.4% | View All 98 Rows |
Sex and Age in Fort Collins
Sex and Age in Fort Collins
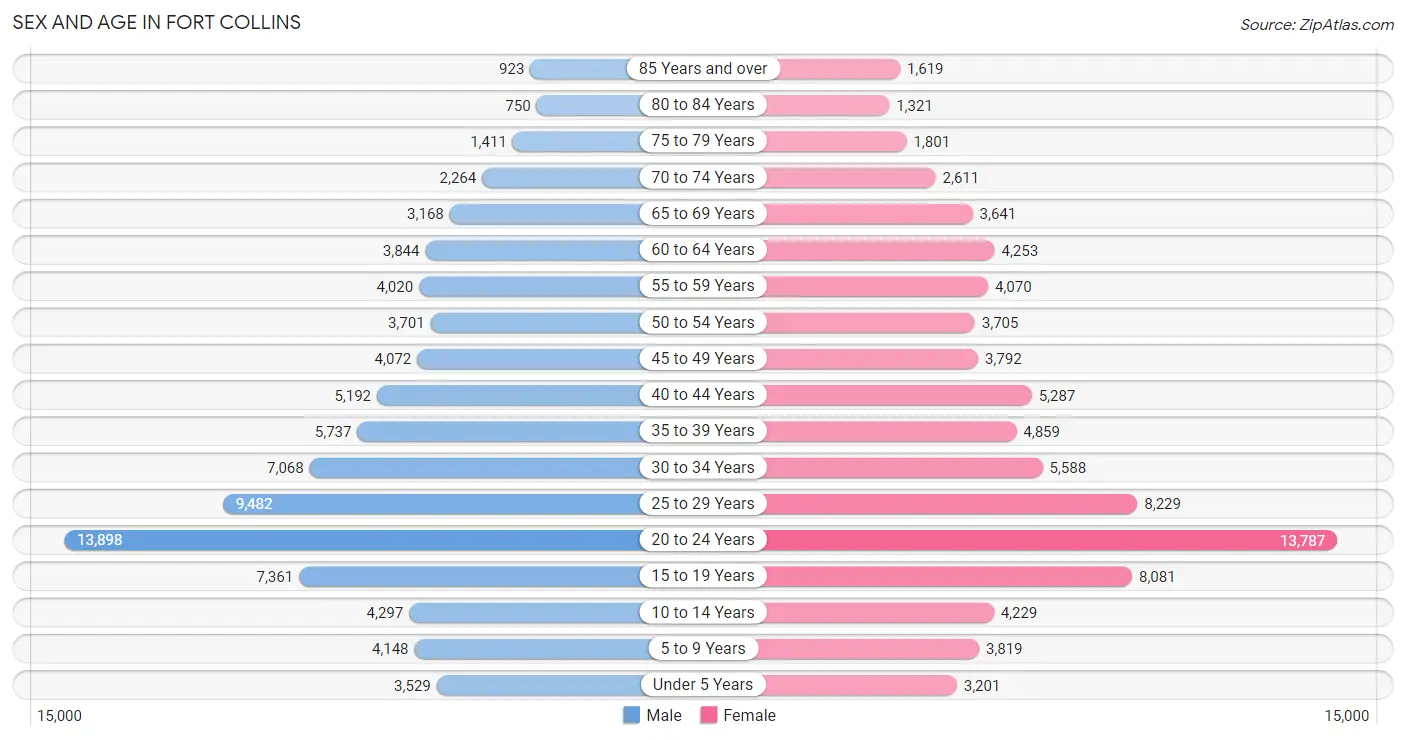
The most populous age groups in Fort Collins are 20 to 24 Years (13,898 | 16.4%) for men and 20 to 24 Years (13,787 | 16.4%) for women.
| Age Bracket | Male | Female |
| Under 5 Years | 3,529 (4.2%) | 3,201 (3.8%) |
| 5 to 9 Years | 4,148 (4.9%) | 3,819 (4.5%) |
| 10 to 14 Years | 4,297 (5.1%) | 4,229 (5.0%) |
| 15 to 19 Years | 7,361 (8.7%) | 8,081 (9.6%) |
| 20 to 24 Years | 13,898 (16.4%) | 13,787 (16.4%) |
| 25 to 29 Years | 9,482 (11.2%) | 8,229 (9.8%) |
| 30 to 34 Years | 7,068 (8.3%) | 5,588 (6.7%) |
| 35 to 39 Years | 5,737 (6.8%) | 4,859 (5.8%) |
| 40 to 44 Years | 5,192 (6.1%) | 5,287 (6.3%) |
| 45 to 49 Years | 4,072 (4.8%) | 3,792 (4.5%) |
| 50 to 54 Years | 3,701 (4.4%) | 3,705 (4.4%) |
| 55 to 59 Years | 4,020 (4.7%) | 4,070 (4.9%) |
| 60 to 64 Years | 3,844 (4.5%) | 4,253 (5.1%) |
| 65 to 69 Years | 3,168 (3.7%) | 3,641 (4.3%) |
| 70 to 74 Years | 2,264 (2.7%) | 2,611 (3.1%) |
| 75 to 79 Years | 1,411 (1.7%) | 1,801 (2.1%) |
| 80 to 84 Years | 750 (0.9%) | 1,321 (1.6%) |
| 85 Years and over | 923 (1.1%) | 1,619 (1.9%) |
| Total | 84,865 (100.0%) | 83,893 (100.0%) |
Families and Households in Fort Collins
Median Family Size in Fort Collins
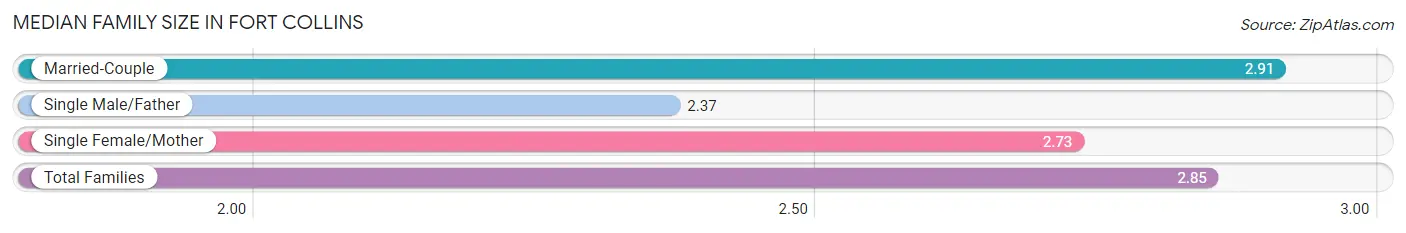
The median family size in Fort Collins is 2.85 persons per family, with married-couple families (28,733 | 80.1%) accounting for the largest median family size of 2.91 persons per family. On the other hand, single male/father families (2,545 | 7.1%) represent the smallest median family size with 2.37 persons per family.
| Family Type | # Families | Family Size |
| Married-Couple | 28,733 (80.1%) | 2.91 |
| Single Male/Father | 2,545 (7.1%) | 2.37 |
| Single Female/Mother | 4,592 (12.8%) | 2.73 |
| Total Families | 35,870 (100.0%) | 2.85 |
Median Household Size in Fort Collins
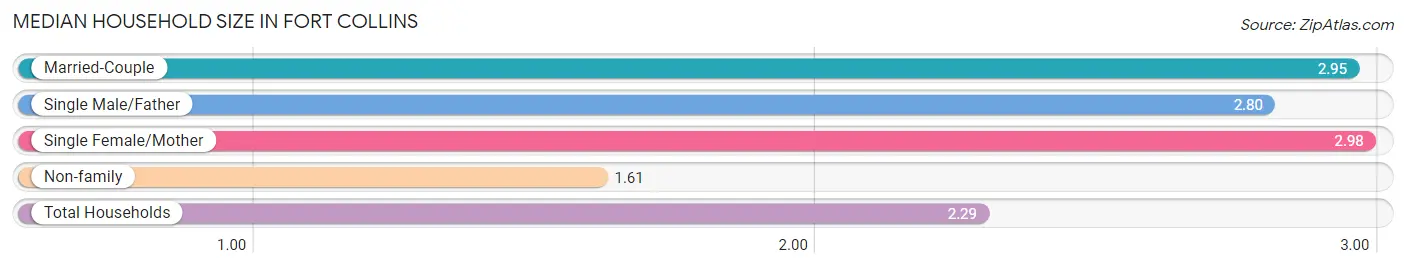
The median household size in Fort Collins is 2.29 persons per household, with single female/mother households (4,592 | 6.6%) accounting for the largest median household size of 2.98 persons per household. non-family households (34,083 | 48.7%) represent the smallest median household size with 1.61 persons per household.
| Household Type | # Households | Household Size |
| Married-Couple | 28,733 (41.1%) | 2.95 |
| Single Male/Father | 2,545 (3.6%) | 2.80 |
| Single Female/Mother | 4,592 (6.6%) | 2.98 |
| Non-family | 34,083 (48.7%) | 1.61 |
| Total Households | 69,953 (100.0%) | 2.29 |
Household Size by Marriage Status in Fort Collins
Out of a total of 69,953 households in Fort Collins, 35,870 (51.3%) are family households, while 34,083 (48.7%) are nonfamily households. The most numerous type of family households are 2-person households, comprising 16,287, and the most common type of nonfamily households are 1-person households, comprising 17,731.
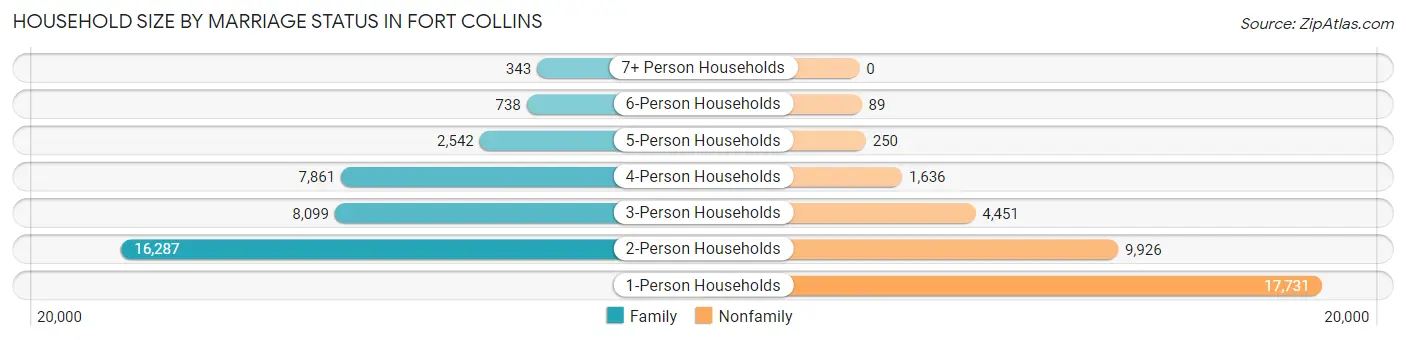
| Household Size | Family Households | Nonfamily Households |
| 1-Person Households | - | 17,731 (25.4%) |
| 2-Person Households | 16,287 (23.3%) | 9,926 (14.2%) |
| 3-Person Households | 8,099 (11.6%) | 4,451 (6.4%) |
| 4-Person Households | 7,861 (11.2%) | 1,636 (2.3%) |
| 5-Person Households | 2,542 (3.6%) | 250 (0.4%) |
| 6-Person Households | 738 (1.1%) | 89 (0.1%) |
| 7+ Person Households | 343 (0.5%) | 0 (0.0%) |
| Total | 35,870 (51.3%) | 34,083 (48.7%) |
Female Fertility in Fort Collins
Fertility by Age in Fort Collins
Average fertility rate in Fort Collins is 39.0 births per 1,000 women. Women in the age bracket of 35 to 50 years have the highest fertility rate with 47.0 births per 1,000 women. Women in the age bracket of 20 to 34 years acount for 60.4% of all women with births.
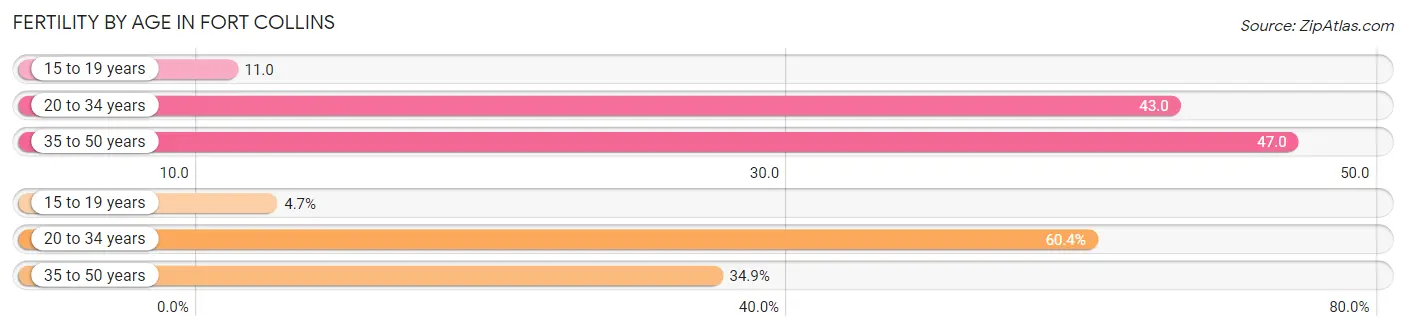
| Age Bracket | Women with Births | Births / 1,000 Women |
| 15 to 19 years | 92 (4.7%) | 11.0 |
| 20 to 34 years | 1,181 (60.4%) | 43.0 |
| 35 to 50 years | 683 (34.9%) | 47.0 |
| Total | 1,956 (100.0%) | 39.0 |
Fertility by Age by Marriage Status in Fort Collins
83.1% of women with births (1,956) in Fort Collins are married. The highest percentage of unmarried women with births falls into 15 to 19 years age bracket with 78.3% of them unmarried at the time of birth, while the lowest percentage of unmarried women with births belong to 35 to 50 years age bracket with 12.2% of them unmarried.
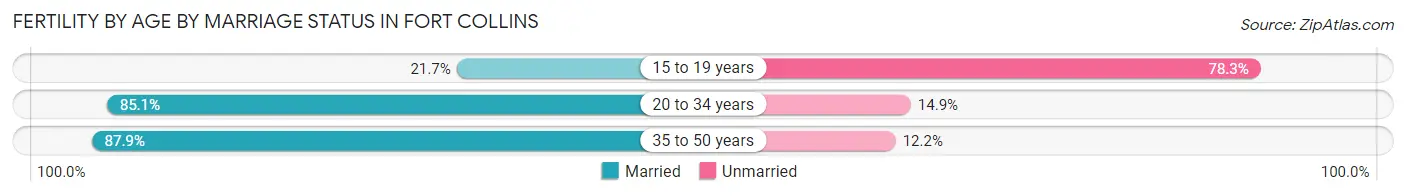
| Age Bracket | Married | Unmarried |
| 15 to 19 years | 20 (21.7%) | 72 (78.3%) |
| 20 to 34 years | 1,005 (85.1%) | 176 (14.9%) |
| 35 to 50 years | 600 (87.8%) | 83 (12.1%) |
| Total | 1,625 (83.1%) | 331 (16.9%) |
Fertility by Education in Fort Collins
Average fertility rate in Fort Collins is 39.0 births per 1,000 women. Women with the education attainment of graduate degree have the highest fertility rate of 73.0 births per 1,000 women, while women with the education attainment of college or associate's degree have the lowest fertility at 21.0 births per 1,000 women. Women with the education attainment of bachelor's degree represent 33.5% of all women with births.
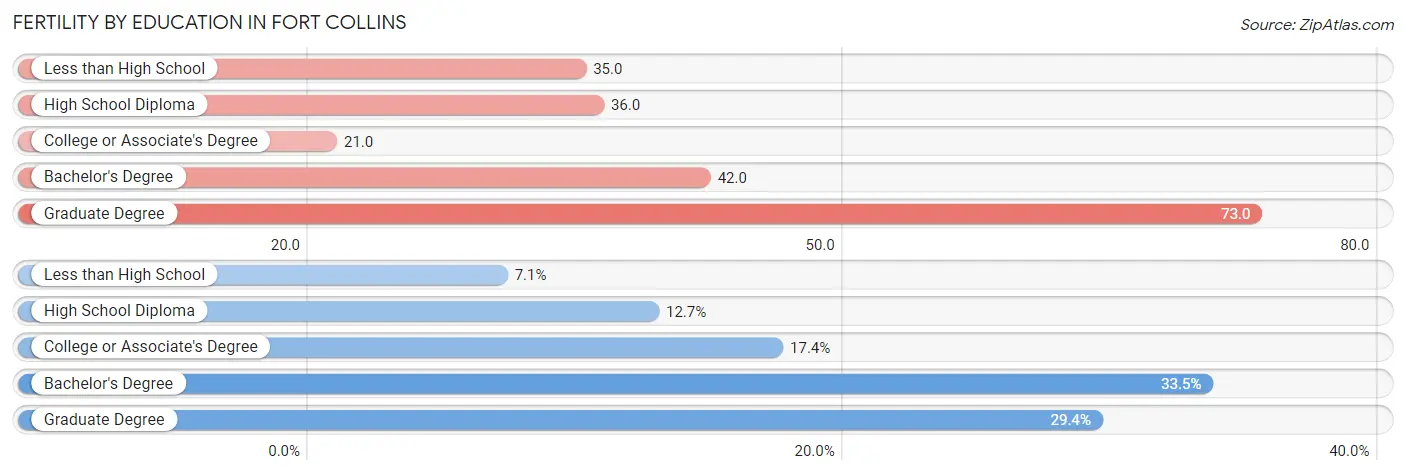
| Educational Attainment | Women with Births | Births / 1,000 Women |
| Less than High School | 138 (7.1%) | 35.0 |
| High School Diploma | 249 (12.7%) | 36.0 |
| College or Associate's Degree | 340 (17.4%) | 21.0 |
| Bachelor's Degree | 655 (33.5%) | 42.0 |
| Graduate Degree | 574 (29.3%) | 73.0 |
| Total | 1,956 (100.0%) | 39.0 |
Fertility by Education by Marriage Status in Fort Collins
16.9% of women with births in Fort Collins are unmarried. Women with the educational attainment of graduate degree are most likely to be married with 96.3% of them married at childbirth, while women with the educational attainment of high school diploma are least likely to be married with 46.2% of them unmarried at childbirth.
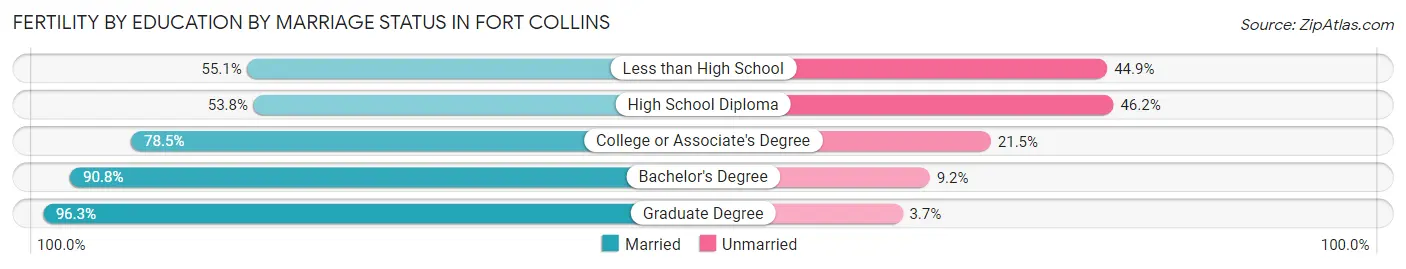
| Educational Attainment | Married | Unmarried |
| Less than High School | 76 (55.1%) | 62 (44.9%) |
| High School Diploma | 134 (53.8%) | 115 (46.2%) |
| College or Associate's Degree | 267 (78.5%) | 73 (21.5%) |
| Bachelor's Degree | 595 (90.8%) | 60 (9.2%) |
| Graduate Degree | 553 (96.3%) | 21 (3.7%) |
| Total | 1,625 (83.1%) | 331 (16.9%) |
Employment Characteristics in Fort Collins
Employment by Class of Employer in Fort Collins
Among the 94,685 employed individuals in Fort Collins, private company employees (59,281 | 62.6%), state government employees (9,074 | 9.6%), and not-for-profit organizations (7,298 | 7.7%) make up the most common classes of employment.
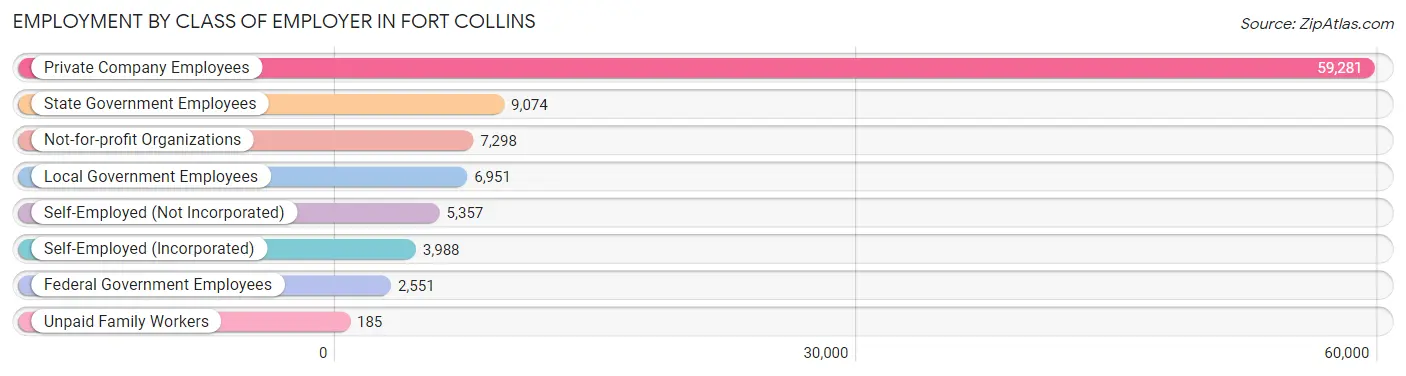
| Employer Class | # Employees | % Employees |
| Private Company Employees | 59,281 | 62.6% |
| Self-Employed (Incorporated) | 3,988 | 4.2% |
| Self-Employed (Not Incorporated) | 5,357 | 5.7% |
| Not-for-profit Organizations | 7,298 | 7.7% |
| Local Government Employees | 6,951 | 7.3% |
| State Government Employees | 9,074 | 9.6% |
| Federal Government Employees | 2,551 | 2.7% |
| Unpaid Family Workers | 185 | 0.2% |
| Total | 94,685 | 100.0% |
Employment Status by Age in Fort Collins
According to the labor force statistics for Fort Collins, out of the total population over 16 years of age (143,792), 70.8% or 101,805 individuals are in the labor force, with 5.3% or 5,396 of them unemployed. The age group with the highest labor force participation rate is 30 to 34 years, with 88.9% or 11,251 individuals in the labor force. Within the labor force, the 16 to 19 years age range has the highest percentage of unemployed individuals, with 18.7% or 1,171 of them being unemployed.
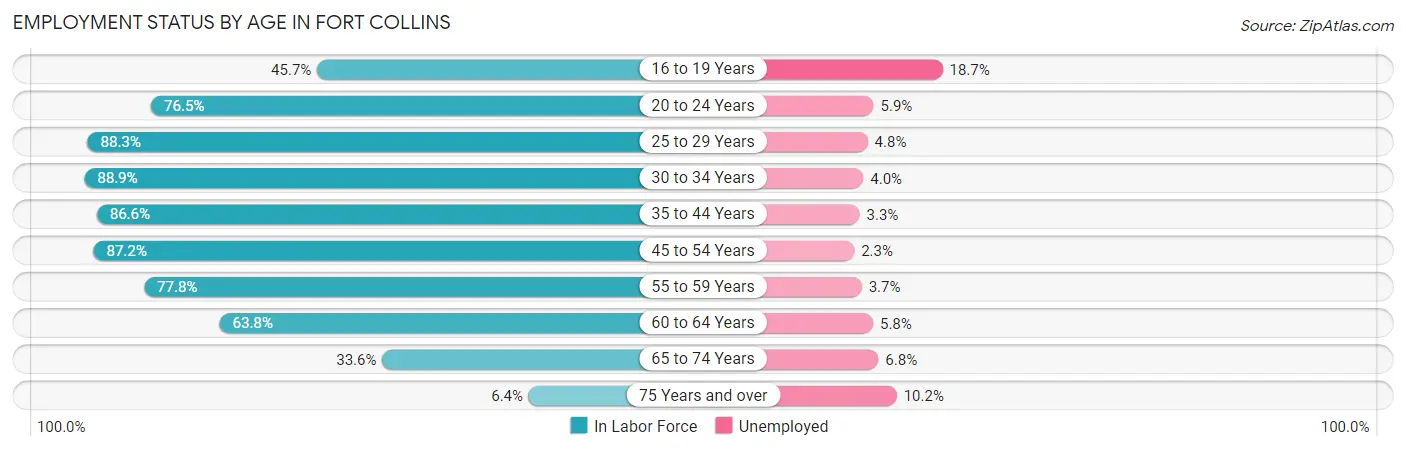
| Age Bracket | In Labor Force | Unemployed |
| 16 to 19 Years | 6,260 (45.7%) | 1,171 (18.7%) |
| 20 to 24 Years | 21,179 (76.5%) | 1,250 (5.9%) |
| 25 to 29 Years | 15,639 (88.3%) | 751 (4.8%) |
| 30 to 34 Years | 11,251 (88.9%) | 450 (4.0%) |
| 35 to 44 Years | 18,251 (86.6%) | 602 (3.3%) |
| 45 to 54 Years | 13,315 (87.2%) | 306 (2.3%) |
| 55 to 59 Years | 6,294 (77.8%) | 233 (3.7%) |
| 60 to 64 Years | 5,166 (63.8%) | 300 (5.8%) |
| 65 to 74 Years | 3,926 (33.6%) | 267 (6.8%) |
| 75 Years and over | 501 (6.4%) | 51 (10.2%) |
| Total | 101,805 (70.8%) | 5,396 (5.3%) |
Employment Status by Educational Attainment in Fort Collins
According to labor force statistics for Fort Collins, 84.3% of individuals (69,884) out of the total population between 25 and 64 years of age (82,899) are in the labor force, with 3.8% or 2,656 of them being unemployed. The group with the highest labor force participation rate are those with the educational attainment of bachelor's degree or higher, with 87.6% or 43,137 individuals in the labor force. Within the labor force, individuals with less than high school education have the highest percentage of unemployment, with 10.4% or 165 of them being unemployed.
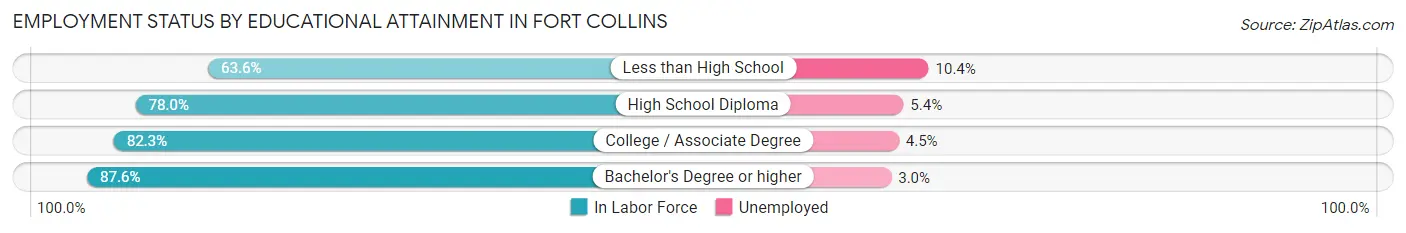
| Educational Attainment | In Labor Force | Unemployed |
| Less than High School | 1,588 (63.6%) | 260 (10.4%) |
| High School Diploma | 8,265 (78.0%) | 572 (5.4%) |
| College / Associate Degree | 16,923 (82.3%) | 925 (4.5%) |
| Bachelor's Degree or higher | 43,137 (87.6%) | 1,477 (3.0%) |
| Total | 69,884 (84.3%) | 3,150 (3.8%) |
Employment Occupations by Sex in Fort Collins
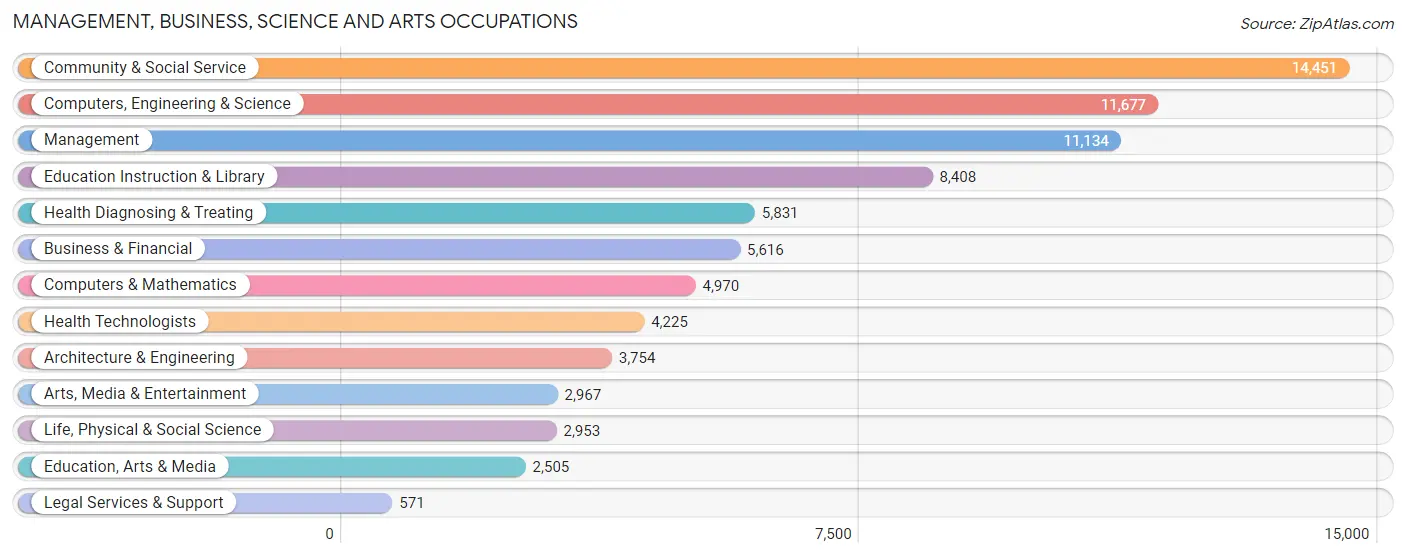
Management, Business, Science and Arts Occupations
The most common Management, Business, Science and Arts occupations in Fort Collins are Community & Social Service (14,451 | 15.1%), Computers, Engineering & Science (11,677 | 12.2%), Management (11,134 | 11.6%), Education Instruction & Library (8,408 | 8.8%), and Health Diagnosing & Treating (5,831 | 6.1%).
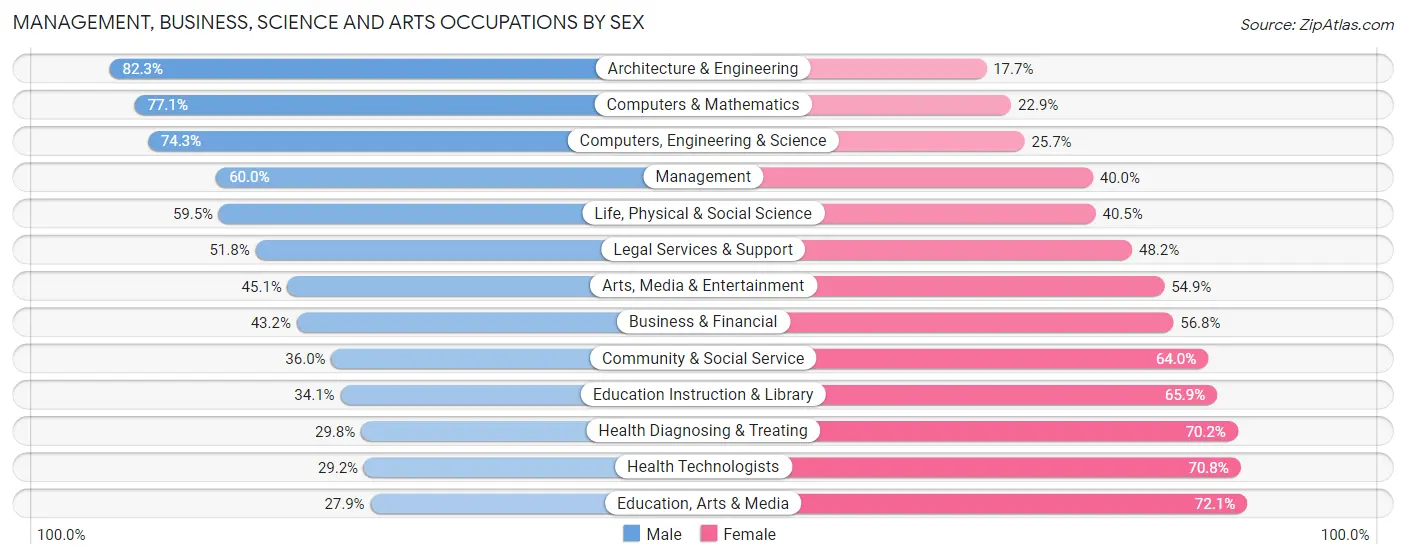
Management, Business, Science and Arts Occupations by Sex
Within the Management, Business, Science and Arts occupations in Fort Collins, the most male-oriented occupations are Architecture & Engineering (82.3%), Computers & Mathematics (77.1%), and Computers, Engineering & Science (74.3%), while the most female-oriented occupations are Education, Arts & Media (72.1%), Health Technologists (70.8%), and Health Diagnosing & Treating (70.2%).
| Occupation | Male | Female |
| Management | 6,683 (60.0%) | 4,451 (40.0%) |
| Business & Financial | 2,428 (43.2%) | 3,188 (56.8%) |
| Computers, Engineering & Science | 8,674 (74.3%) | 3,003 (25.7%) |
| Computers & Mathematics | 3,830 (77.1%) | 1,140 (22.9%) |
| Architecture & Engineering | 3,088 (82.3%) | 666 (17.7%) |
| Life, Physical & Social Science | 1,756 (59.5%) | 1,197 (40.5%) |
| Community & Social Service | 5,202 (36.0%) | 9,249 (64.0%) |
| Education, Arts & Media | 698 (27.9%) | 1,807 (72.1%) |
| Legal Services & Support | 296 (51.8%) | 275 (48.2%) |
| Education Instruction & Library | 2,869 (34.1%) | 5,539 (65.9%) |
| Arts, Media & Entertainment | 1,339 (45.1%) | 1,628 (54.9%) |
| Health Diagnosing & Treating | 1,738 (29.8%) | 4,093 (70.2%) |
| Health Technologists | 1,234 (29.2%) | 2,991 (70.8%) |
| Total (Category) | 24,725 (50.8%) | 23,984 (49.2%) |
| Total (Overall) | 49,916 (52.1%) | 45,915 (47.9%) |
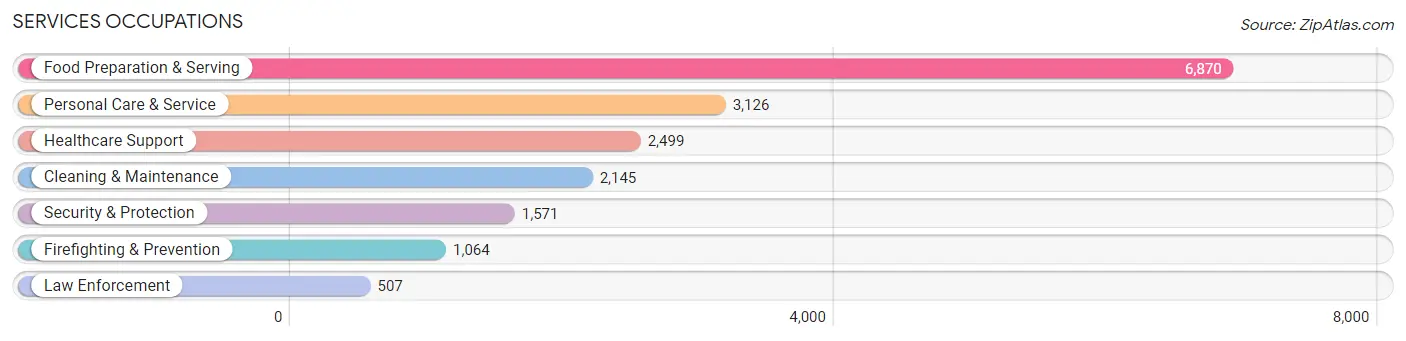
Services Occupations
The most common Services occupations in Fort Collins are Food Preparation & Serving (6,870 | 7.2%), Personal Care & Service (3,126 | 3.3%), Healthcare Support (2,499 | 2.6%), Cleaning & Maintenance (2,145 | 2.2%), and Security & Protection (1,571 | 1.6%).
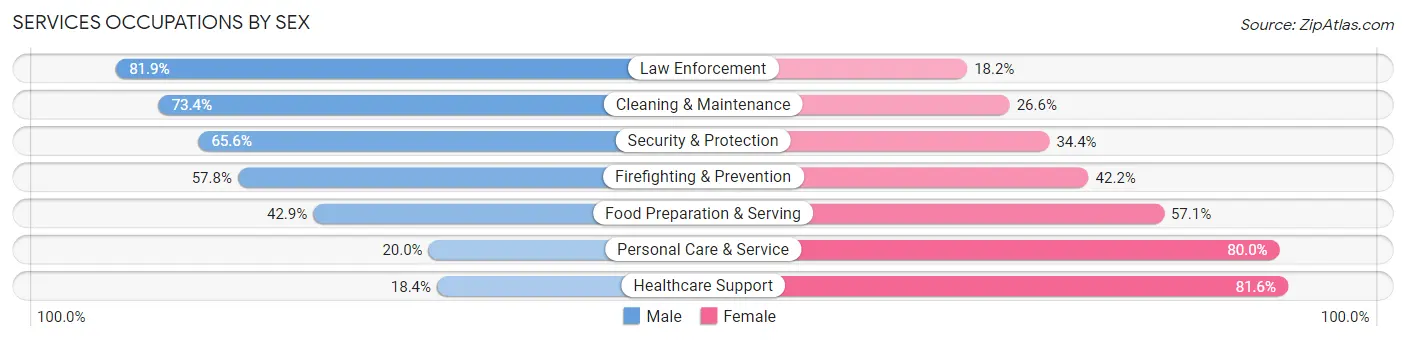
Services Occupations by Sex
Within the Services occupations in Fort Collins, the most male-oriented occupations are Law Enforcement (81.9%), Cleaning & Maintenance (73.4%), and Security & Protection (65.6%), while the most female-oriented occupations are Healthcare Support (81.6%), Personal Care & Service (80.0%), and Food Preparation & Serving (57.1%).
| Occupation | Male | Female |
| Healthcare Support | 459 (18.4%) | 2,040 (81.6%) |
| Security & Protection | 1,030 (65.6%) | 541 (34.4%) |
| Firefighting & Prevention | 615 (57.8%) | 449 (42.2%) |
| Law Enforcement | 415 (81.9%) | 92 (18.1%) |
| Food Preparation & Serving | 2,946 (42.9%) | 3,924 (57.1%) |
| Cleaning & Maintenance | 1,575 (73.4%) | 570 (26.6%) |
| Personal Care & Service | 626 (20.0%) | 2,500 (80.0%) |
| Total (Category) | 6,636 (40.9%) | 9,575 (59.1%) |
| Total (Overall) | 49,916 (52.1%) | 45,915 (47.9%) |
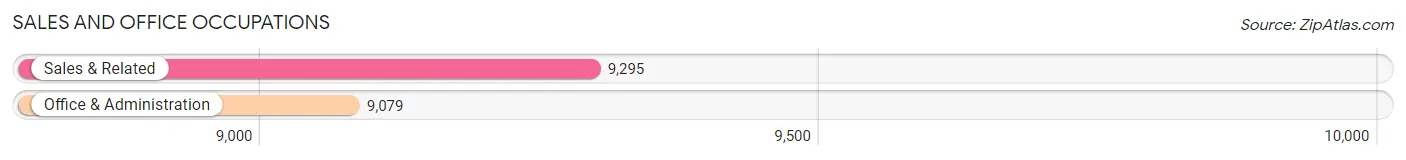
Sales and Office Occupations
The most common Sales and Office occupations in Fort Collins are Sales & Related (9,295 | 9.7%), and Office & Administration (9,079 | 9.5%).
Sales and Office Occupations by Sex
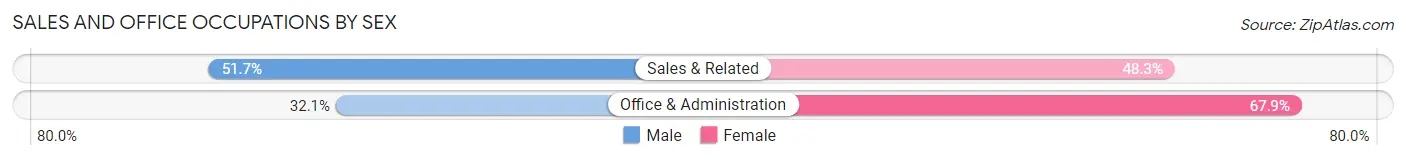
| Occupation | Male | Female |
| Sales & Related | 4,803 (51.7%) | 4,492 (48.3%) |
| Office & Administration | 2,915 (32.1%) | 6,164 (67.9%) |
| Total (Category) | 7,718 (42.0%) | 10,656 (58.0%) |
| Total (Overall) | 49,916 (52.1%) | 45,915 (47.9%) |
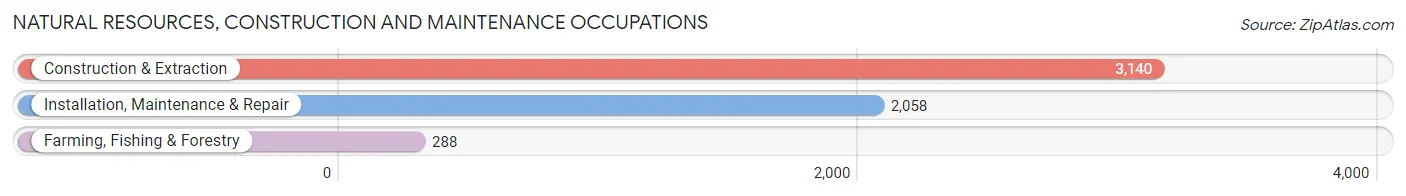
Natural Resources, Construction and Maintenance Occupations
The most common Natural Resources, Construction and Maintenance occupations in Fort Collins are Construction & Extraction (3,140 | 3.3%), Installation, Maintenance & Repair (2,058 | 2.1%), and Farming, Fishing & Forestry (288 | 0.3%).
Natural Resources, Construction and Maintenance Occupations by Sex
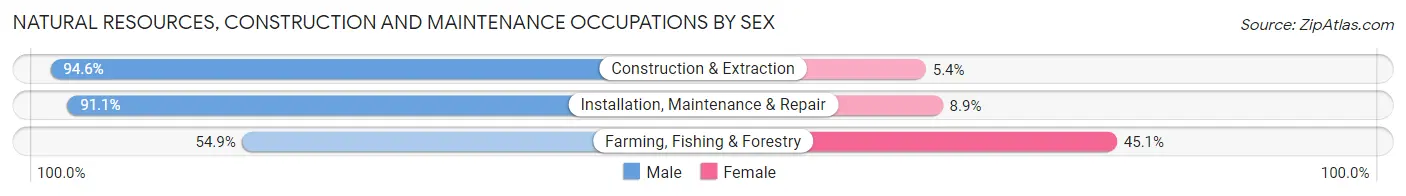
| Occupation | Male | Female |
| Farming, Fishing & Forestry | 158 (54.9%) | 130 (45.1%) |
| Construction & Extraction | 2,971 (94.6%) | 169 (5.4%) |
| Installation, Maintenance & Repair | 1,875 (91.1%) | 183 (8.9%) |
| Total (Category) | 5,004 (91.2%) | 482 (8.8%) |
| Total (Overall) | 49,916 (52.1%) | 45,915 (47.9%) |
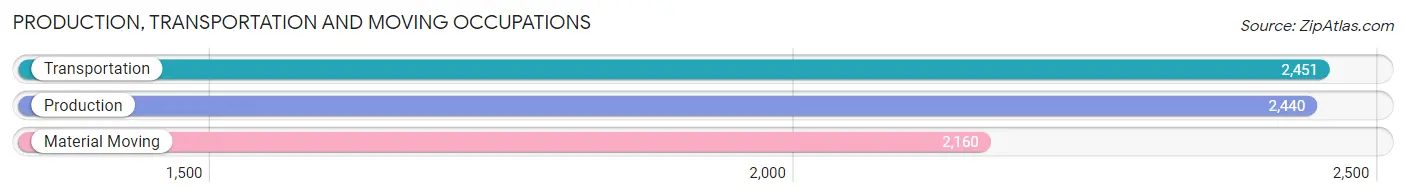
Production, Transportation and Moving Occupations
The most common Production, Transportation and Moving occupations in Fort Collins are Transportation (2,451 | 2.6%), Production (2,440 | 2.5%), and Material Moving (2,160 | 2.2%).
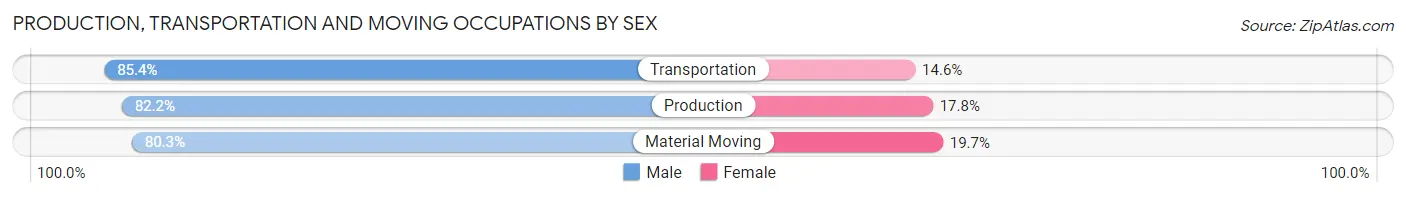
Production, Transportation and Moving Occupations by Sex
| Occupation | Male | Female |
| Production | 2,005 (82.2%) | 435 (17.8%) |
| Transportation | 2,093 (85.4%) | 358 (14.6%) |
| Material Moving | 1,735 (80.3%) | 425 (19.7%) |
| Total (Category) | 5,833 (82.7%) | 1,218 (17.3%) |
| Total (Overall) | 49,916 (52.1%) | 45,915 (47.9%) |
Employment Industries by Sex in Fort Collins
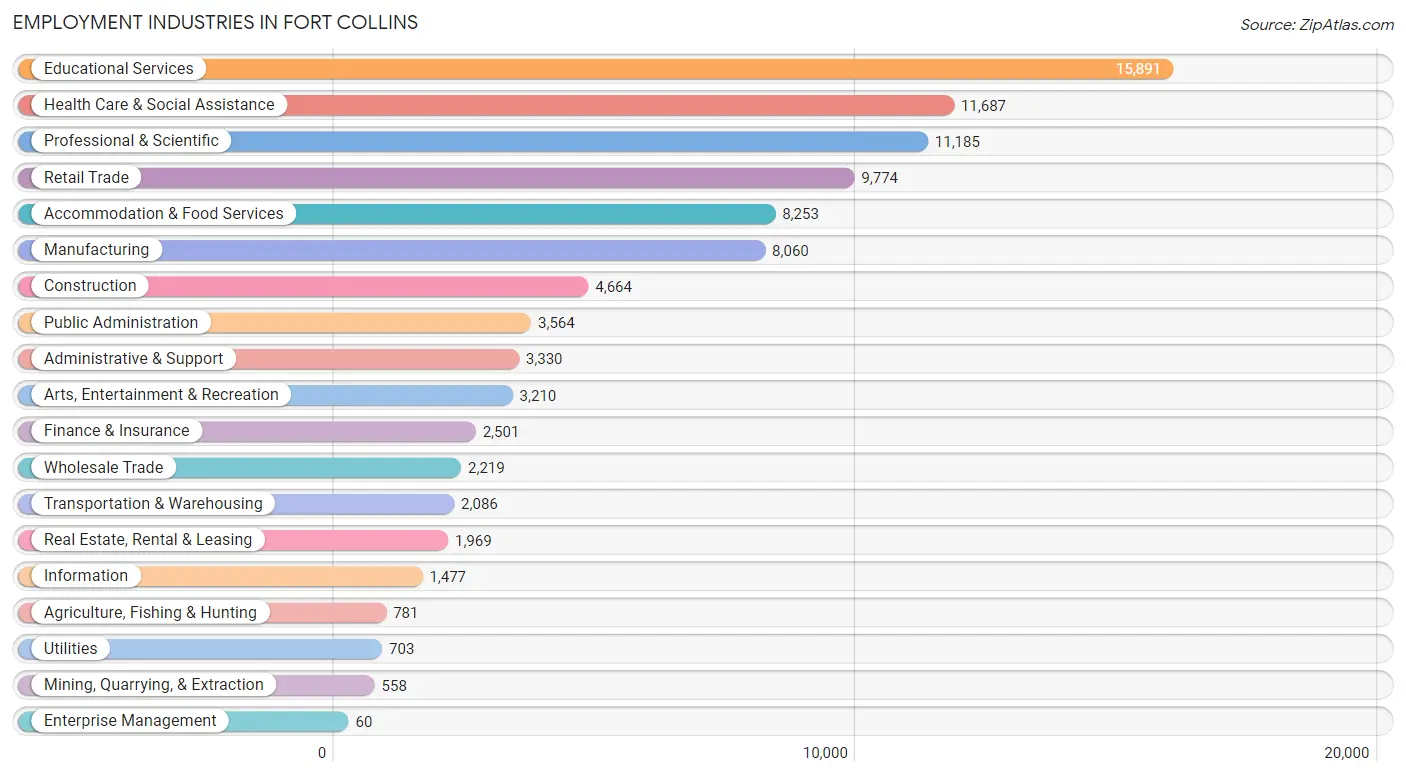
Employment Industries in Fort Collins
The major employment industries in Fort Collins include Educational Services (15,891 | 16.6%), Health Care & Social Assistance (11,687 | 12.2%), Professional & Scientific (11,185 | 11.7%), Retail Trade (9,774 | 10.2%), and Accommodation & Food Services (8,253 | 8.6%).
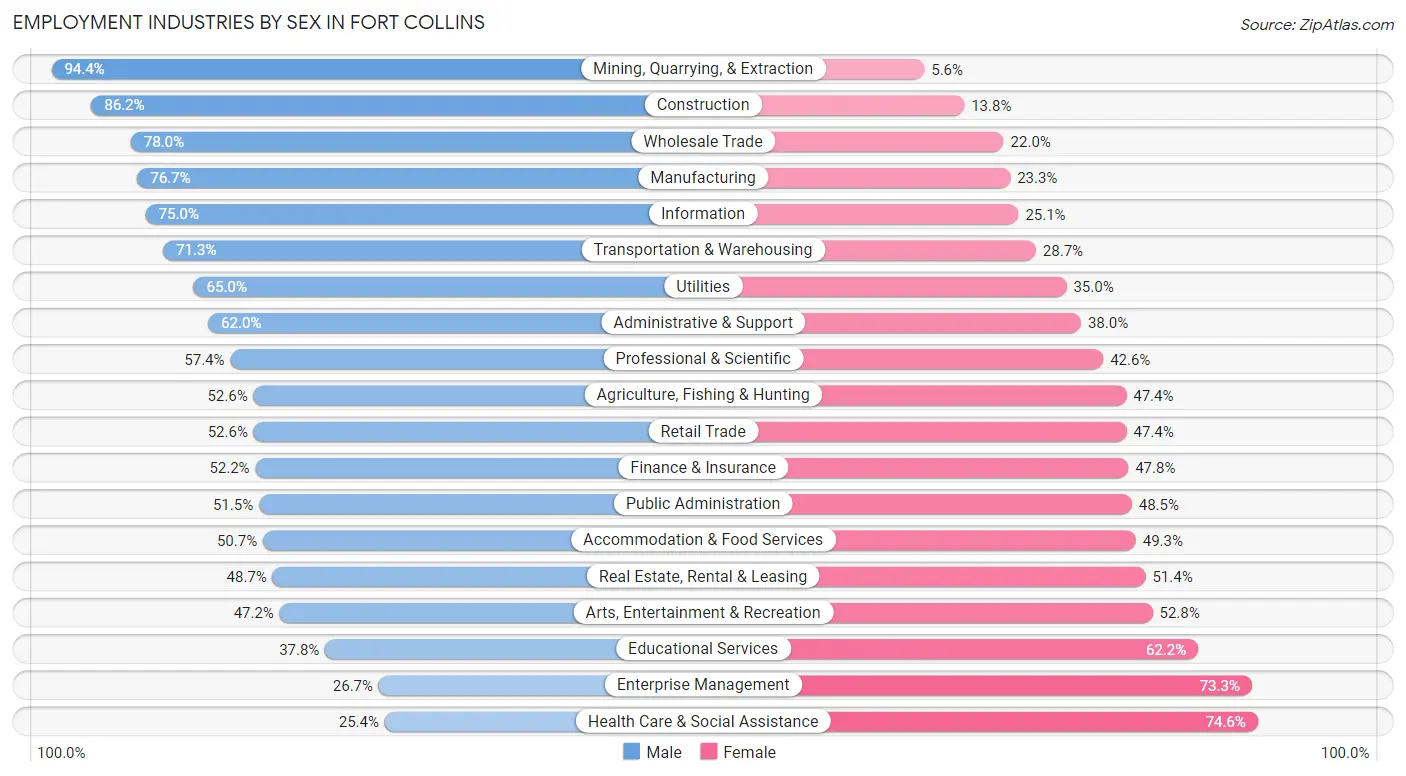
Employment Industries by Sex in Fort Collins
The Fort Collins industries that see more men than women are Mining, Quarrying, & Extraction (94.4%), Construction (86.2%), and Wholesale Trade (78.0%), whereas the industries that tend to have a higher number of women are Health Care & Social Assistance (74.6%), Enterprise Management (73.3%), and Educational Services (62.2%).
| Industry | Male | Female |
| Agriculture, Fishing & Hunting | 411 (52.6%) | 370 (47.4%) |
| Mining, Quarrying, & Extraction | 527 (94.4%) | 31 (5.6%) |
| Construction | 4,019 (86.2%) | 645 (13.8%) |
| Manufacturing | 6,179 (76.7%) | 1,881 (23.3%) |
| Wholesale Trade | 1,731 (78.0%) | 488 (22.0%) |
| Retail Trade | 5,138 (52.6%) | 4,636 (47.4%) |
| Transportation & Warehousing | 1,488 (71.3%) | 598 (28.7%) |
| Utilities | 457 (65.0%) | 246 (35.0%) |
| Information | 1,107 (75.0%) | 370 (25.1%) |
| Finance & Insurance | 1,306 (52.2%) | 1,195 (47.8%) |
| Real Estate, Rental & Leasing | 958 (48.6%) | 1,011 (51.3%) |
| Professional & Scientific | 6,421 (57.4%) | 4,764 (42.6%) |
| Enterprise Management | 16 (26.7%) | 44 (73.3%) |
| Administrative & Support | 2,065 (62.0%) | 1,265 (38.0%) |
| Educational Services | 6,003 (37.8%) | 9,888 (62.2%) |
| Health Care & Social Assistance | 2,973 (25.4%) | 8,714 (74.6%) |
| Arts, Entertainment & Recreation | 1,515 (47.2%) | 1,695 (52.8%) |
| Accommodation & Food Services | 4,181 (50.7%) | 4,072 (49.3%) |
| Public Administration | 1,835 (51.5%) | 1,729 (48.5%) |
| Total | 49,916 (52.1%) | 45,915 (47.9%) |
Education in Fort Collins
School Enrollment in Fort Collins
The most common levels of schooling among the 57,437 students in Fort Collins are college / undergraduate (28,431 | 49.5%), high school (7,154 | 12.5%), and middle school (6,508 | 11.3%).
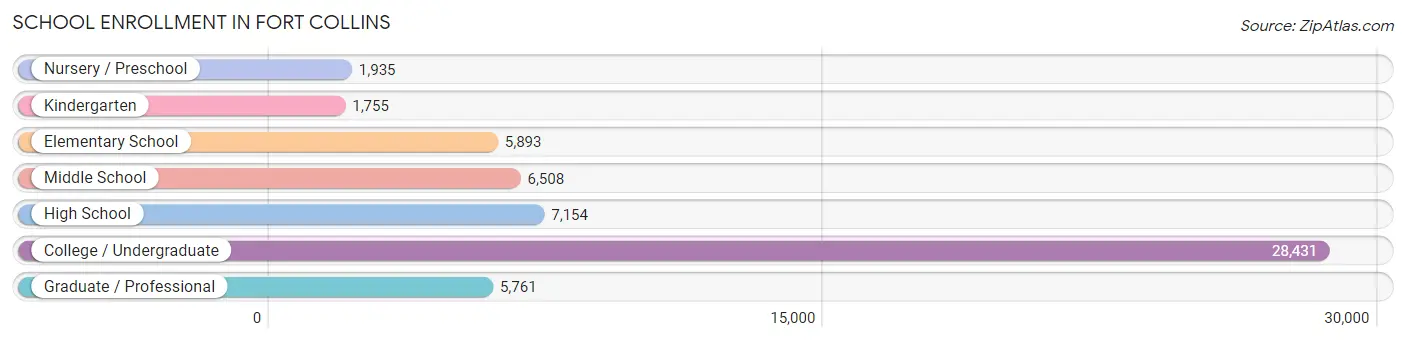
| School Level | # Students | % Students |
| Nursery / Preschool | 1,935 | 3.4% |
| Kindergarten | 1,755 | 3.1% |
| Elementary School | 5,893 | 10.3% |
| Middle School | 6,508 | 11.3% |
| High School | 7,154 | 12.5% |
| College / Undergraduate | 28,431 | 49.5% |
| Graduate / Professional | 5,761 | 10.0% |
| Total | 57,437 | 100.0% |
School Enrollment by Age by Funding Source in Fort Collins
Out of a total of 57,437 students who are enrolled in schools in Fort Collins, 4,365 (7.6%) attend a private institution, while the remaining 53,072 (92.4%) are enrolled in public schools. The age group of 3 to 4 year olds has the highest likelihood of being enrolled in private schools, with 685 (53.1% in the age bracket) enrolled. Conversely, the age group of 18 to 19 year olds has the lowest likelihood of being enrolled in a private school, with 8,762 (96.4% in the age bracket) attending a public institution.
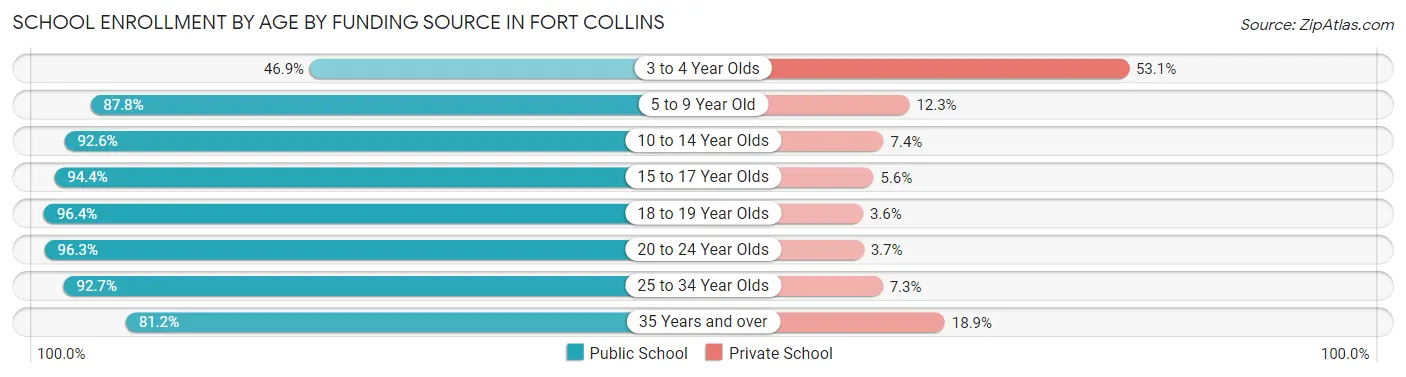
| Age Bracket | Public School | Private School |
| 3 to 4 Year Olds | 604 (46.9%) | 685 (53.1%) |
| 5 to 9 Year Old | 6,610 (87.7%) | 923 (12.2%) |
| 10 to 14 Year Olds | 7,729 (92.6%) | 620 (7.4%) |
| 15 to 17 Year Olds | 4,927 (94.4%) | 290 (5.6%) |
| 18 to 19 Year Olds | 8,762 (96.4%) | 327 (3.6%) |
| 20 to 24 Year Olds | 17,132 (96.3%) | 663 (3.7%) |
| 25 to 34 Year Olds | 5,574 (92.7%) | 437 (7.3%) |
| 35 Years and over | 1,748 (81.1%) | 406 (18.9%) |
| Total | 53,072 (92.4%) | 4,365 (7.6%) |
Educational Attainment by Field of Study in Fort Collins
Business (9,202 | 13.9%), bio, nature & agricultural (8,156 | 12.3%), engineering (6,223 | 9.4%), social sciences (5,086 | 7.7%), and arts & humanities (4,956 | 7.5%) are the most common fields of study among 66,169 individuals in Fort Collins who have obtained a bachelor's degree or higher.
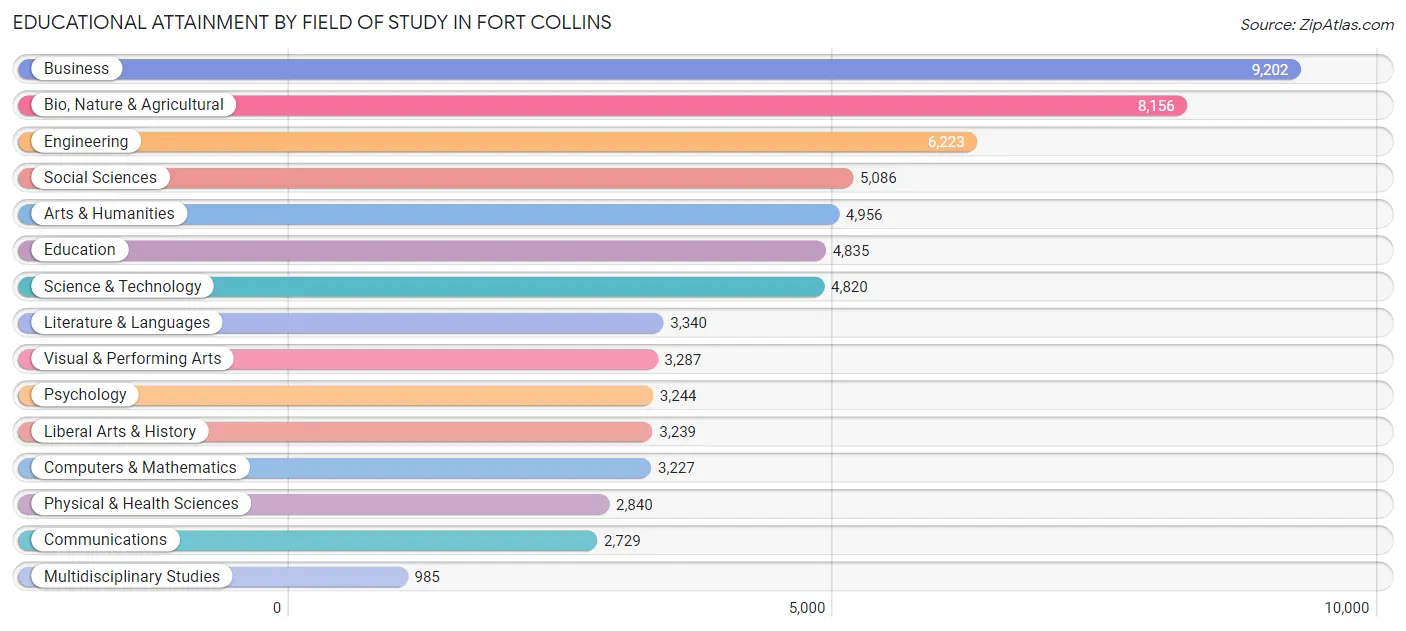
| Field of Study | # Graduates | % Graduates |
| Computers & Mathematics | 3,227 | 4.9% |
| Bio, Nature & Agricultural | 8,156 | 12.3% |
| Physical & Health Sciences | 2,840 | 4.3% |
| Psychology | 3,244 | 4.9% |
| Social Sciences | 5,086 | 7.7% |
| Engineering | 6,223 | 9.4% |
| Multidisciplinary Studies | 985 | 1.5% |
| Science & Technology | 4,820 | 7.3% |
| Business | 9,202 | 13.9% |
| Education | 4,835 | 7.3% |
| Literature & Languages | 3,340 | 5.1% |
| Liberal Arts & History | 3,239 | 4.9% |
| Visual & Performing Arts | 3,287 | 5.0% |
| Communications | 2,729 | 4.1% |
| Arts & Humanities | 4,956 | 7.5% |
| Total | 66,169 | 100.0% |
Transportation & Commute in Fort Collins
Vehicle Availability by Sex in Fort Collins
The most prevalent vehicle ownership categories in Fort Collins are males with 2 vehicles (22,287, accounting for 45.8%) and females with 2 vehicles (19,503, making up 50.8%).
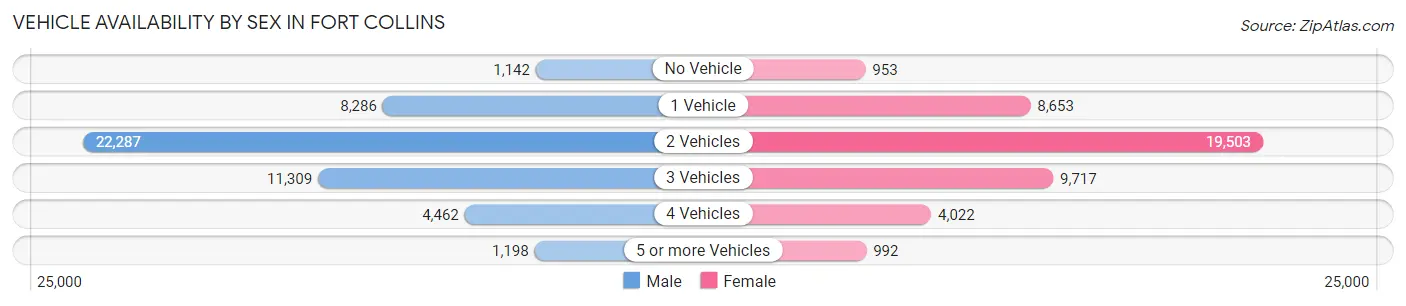
| Vehicles Available | Male | Female |
| No Vehicle | 1,142 (2.4%) | 953 (2.2%) |
| 1 Vehicle | 8,286 (17.0%) | 8,653 (19.7%) |
| 2 Vehicles | 22,287 (45.8%) | 19,503 (44.5%) |
| 3 Vehicles | 11,309 (23.2%) | 9,717 (22.2%) |
| 4 Vehicles | 4,462 (9.2%) | 4,022 (9.2%) |
| 5 or more Vehicles | 1,198 (2.5%) | 992 (2.3%) |
| Total | 48,684 (100.0%) | 43,840 (100.0%) |
Commute Time in Fort Collins
The most frequently occuring commute durations in Fort Collins are 15 to 19 minutes (17,848 commuters, 22.9%), 10 to 14 minutes (17,515 commuters, 22.5%), and 20 to 24 minutes (11,545 commuters, 14.8%).
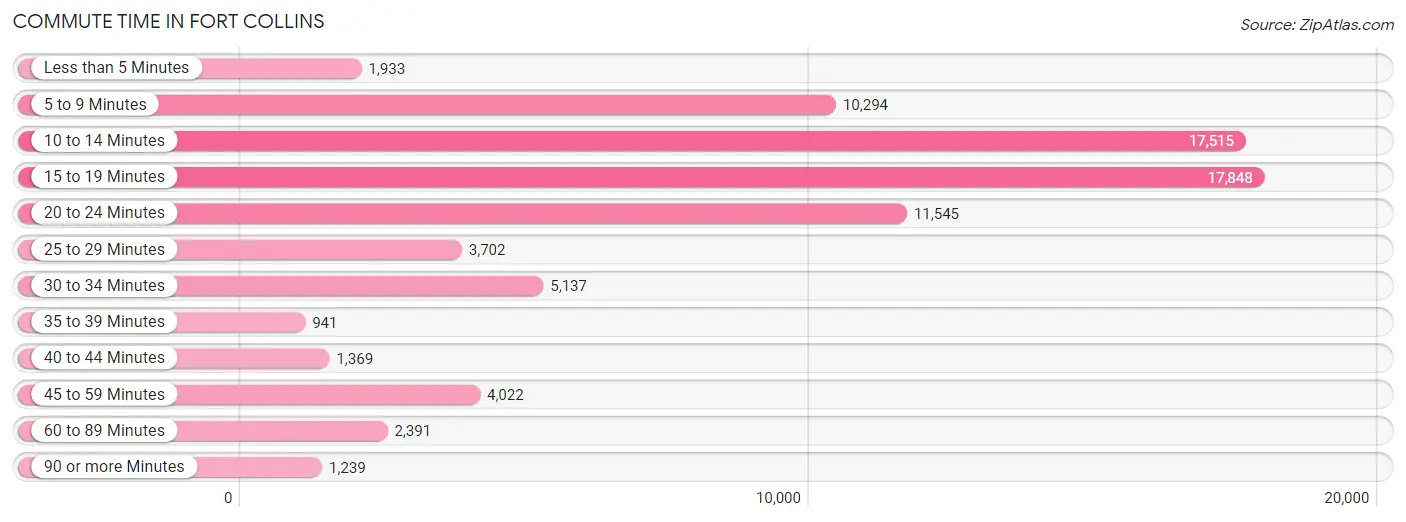
| Commute Time | # Commuters | % Commuters |
| Less than 5 Minutes | 1,933 | 2.5% |
| 5 to 9 Minutes | 10,294 | 13.2% |
| 10 to 14 Minutes | 17,515 | 22.5% |
| 15 to 19 Minutes | 17,848 | 22.9% |
| 20 to 24 Minutes | 11,545 | 14.8% |
| 25 to 29 Minutes | 3,702 | 4.8% |
| 30 to 34 Minutes | 5,137 | 6.6% |
| 35 to 39 Minutes | 941 | 1.2% |
| 40 to 44 Minutes | 1,369 | 1.8% |
| 45 to 59 Minutes | 4,022 | 5.2% |
| 60 to 89 Minutes | 2,391 | 3.1% |
| 90 or more Minutes | 1,239 | 1.6% |
Commute Time by Sex in Fort Collins
The most common commute times in Fort Collins are 15 to 19 minutes (9,229 commuters, 22.4%) for males and 10 to 14 minutes (9,097 commuters, 24.8%) for females.
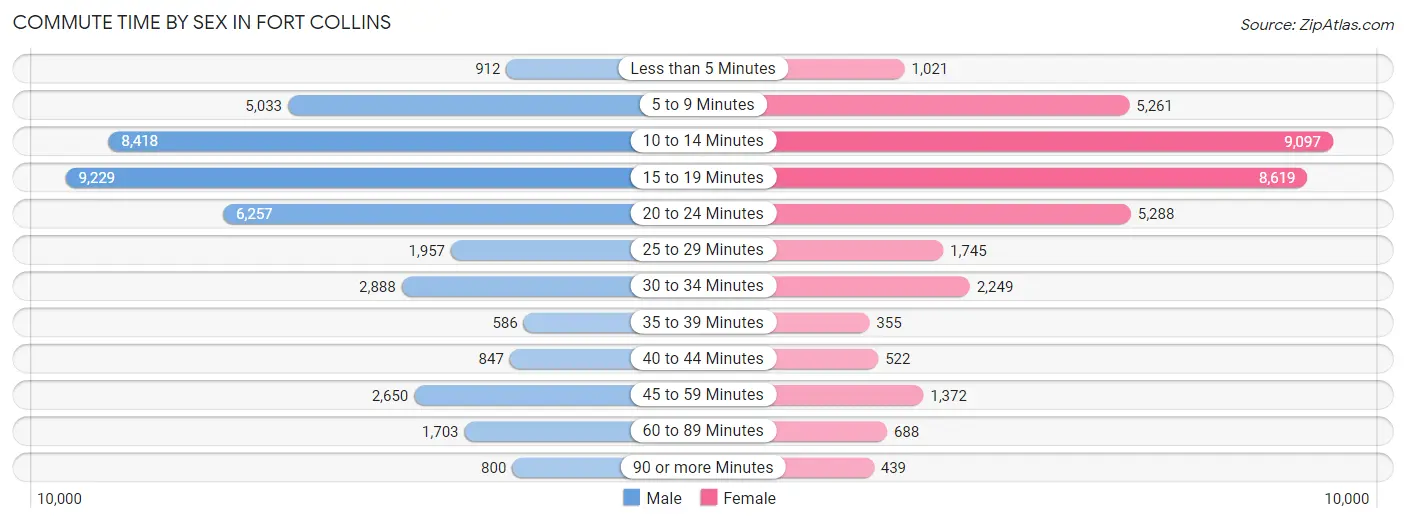
| Commute Time | Male | Female |
| Less than 5 Minutes | 912 (2.2%) | 1,021 (2.8%) |
| 5 to 9 Minutes | 5,033 (12.2%) | 5,261 (14.3%) |
| 10 to 14 Minutes | 8,418 (20.4%) | 9,097 (24.8%) |
| 15 to 19 Minutes | 9,229 (22.4%) | 8,619 (23.5%) |
| 20 to 24 Minutes | 6,257 (15.2%) | 5,288 (14.4%) |
| 25 to 29 Minutes | 1,957 (4.7%) | 1,745 (4.8%) |
| 30 to 34 Minutes | 2,888 (7.0%) | 2,249 (6.1%) |
| 35 to 39 Minutes | 586 (1.4%) | 355 (1.0%) |
| 40 to 44 Minutes | 847 (2.1%) | 522 (1.4%) |
| 45 to 59 Minutes | 2,650 (6.4%) | 1,372 (3.7%) |
| 60 to 89 Minutes | 1,703 (4.1%) | 688 (1.9%) |
| 90 or more Minutes | 800 (1.9%) | 439 (1.2%) |
Time of Departure to Work by Sex in Fort Collins
The most frequent times of departure to work in Fort Collins are 7:00 AM to 7:29 AM (6,066, 14.7%) for males and 7:30 AM to 7:59 AM (6,223, 17.0%) for females.
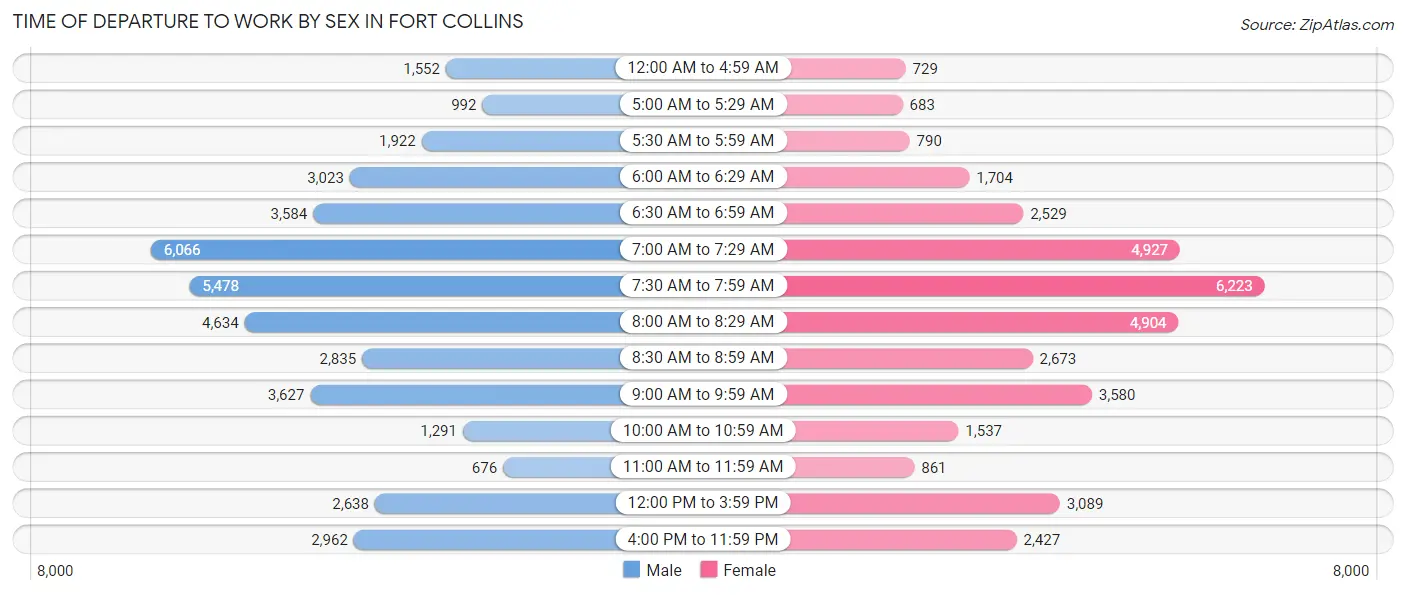
| Time of Departure | Male | Female |
| 12:00 AM to 4:59 AM | 1,552 (3.8%) | 729 (2.0%) |
| 5:00 AM to 5:29 AM | 992 (2.4%) | 683 (1.9%) |
| 5:30 AM to 5:59 AM | 1,922 (4.7%) | 790 (2.2%) |
| 6:00 AM to 6:29 AM | 3,023 (7.3%) | 1,704 (4.6%) |
| 6:30 AM to 6:59 AM | 3,584 (8.7%) | 2,529 (6.9%) |
| 7:00 AM to 7:29 AM | 6,066 (14.7%) | 4,927 (13.4%) |
| 7:30 AM to 7:59 AM | 5,478 (13.3%) | 6,223 (17.0%) |
| 8:00 AM to 8:29 AM | 4,634 (11.2%) | 4,904 (13.4%) |
| 8:30 AM to 8:59 AM | 2,835 (6.9%) | 2,673 (7.3%) |
| 9:00 AM to 9:59 AM | 3,627 (8.8%) | 3,580 (9.8%) |
| 10:00 AM to 10:59 AM | 1,291 (3.1%) | 1,537 (4.2%) |
| 11:00 AM to 11:59 AM | 676 (1.6%) | 861 (2.4%) |
| 12:00 PM to 3:59 PM | 2,638 (6.4%) | 3,089 (8.4%) |
| 4:00 PM to 11:59 PM | 2,962 (7.2%) | 2,427 (6.6%) |
| Total | 41,280 (100.0%) | 36,656 (100.0%) |
Housing Occupancy in Fort Collins
Occupancy by Ownership in Fort Collins
Of the total 69,953 dwellings in Fort Collins, owner-occupied units account for 36,139 (51.7%), while renter-occupied units make up 33,814 (48.3%).
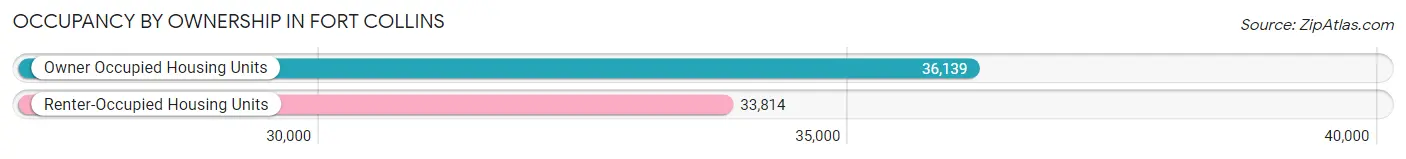
| Occupancy | # Housing Units | % Housing Units |
| Owner Occupied Housing Units | 36,139 | 51.7% |
| Renter-Occupied Housing Units | 33,814 | 48.3% |
| Total Occupied Housing Units | 69,953 | 100.0% |
Occupancy by Household Size in Fort Collins
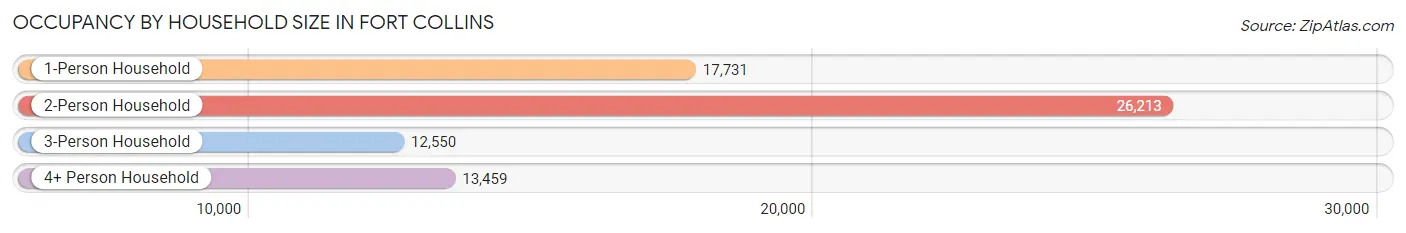
| Household Size | # Housing Units | % Housing Units |
| 1-Person Household | 17,731 | 25.4% |
| 2-Person Household | 26,213 | 37.5% |
| 3-Person Household | 12,550 | 17.9% |
| 4+ Person Household | 13,459 | 19.2% |
| Total Housing Units | 69,953 | 100.0% |
Occupancy by Ownership by Household Size in Fort Collins
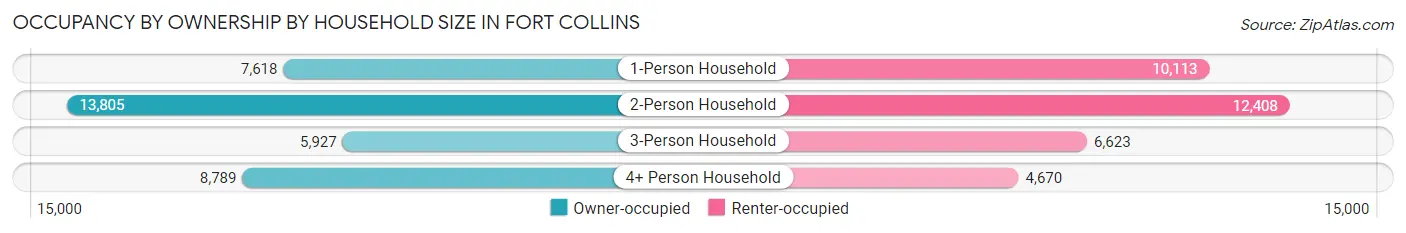
| Household Size | Owner-occupied | Renter-occupied |
| 1-Person Household | 7,618 (43.0%) | 10,113 (57.0%) |
| 2-Person Household | 13,805 (52.7%) | 12,408 (47.3%) |
| 3-Person Household | 5,927 (47.2%) | 6,623 (52.8%) |
| 4+ Person Household | 8,789 (65.3%) | 4,670 (34.7%) |
| Total Housing Units | 36,139 (51.7%) | 33,814 (48.3%) |
Occupancy by Educational Attainment in Fort Collins
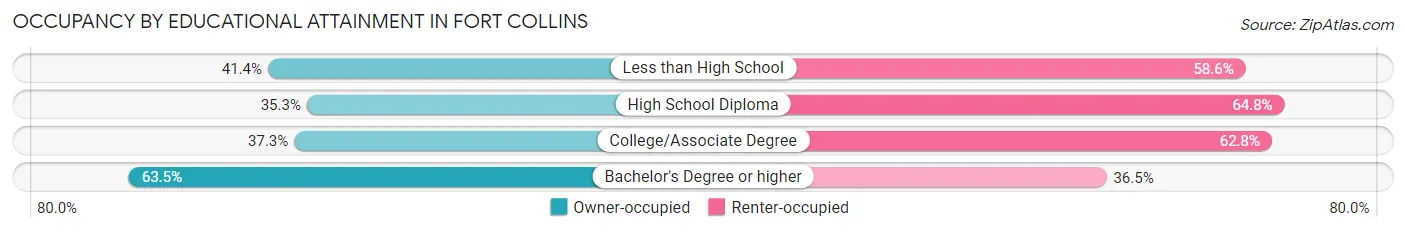
| Household Size | Owner-occupied | Renter-occupied |
| Less than High School | 532 (41.4%) | 752 (58.6%) |
| High School Diploma | 2,933 (35.2%) | 5,387 (64.7%) |
| College/Associate Degree | 7,997 (37.2%) | 13,472 (62.7%) |
| Bachelor's Degree or higher | 24,677 (63.5%) | 14,203 (36.5%) |
Occupancy by Age of Householder in Fort Collins
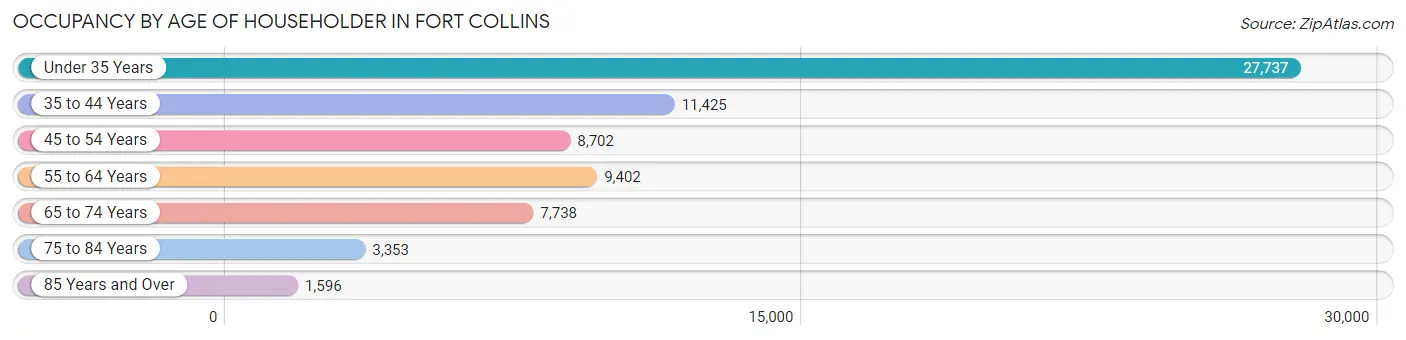
| Age Bracket | # Households | % Households |
| Under 35 Years | 27,737 | 39.7% |
| 35 to 44 Years | 11,425 | 16.3% |
| 45 to 54 Years | 8,702 | 12.4% |
| 55 to 64 Years | 9,402 | 13.4% |
| 65 to 74 Years | 7,738 | 11.1% |
| 75 to 84 Years | 3,353 | 4.8% |
| 85 Years and Over | 1,596 | 2.3% |
| Total | 69,953 | 100.0% |
Housing Finances in Fort Collins
Median Income by Occupancy in Fort Collins
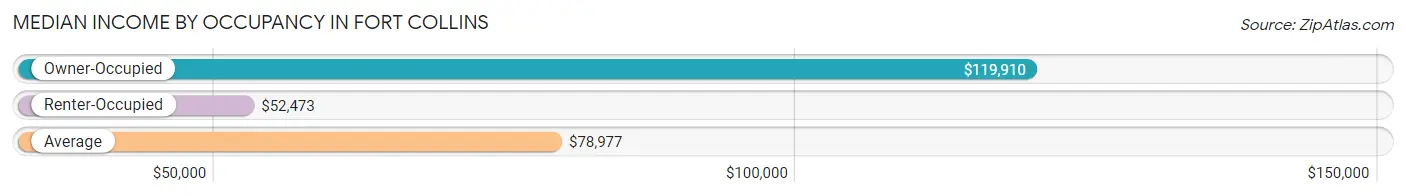
| Occupancy Type | # Households | Median Income |
| Owner-Occupied | 36,139 (51.7%) | $119,910 |
| Renter-Occupied | 33,814 (48.3%) | $52,473 |
| Average | 69,953 (100.0%) | $78,977 |
Occupancy by Householder Income Bracket in Fort Collins
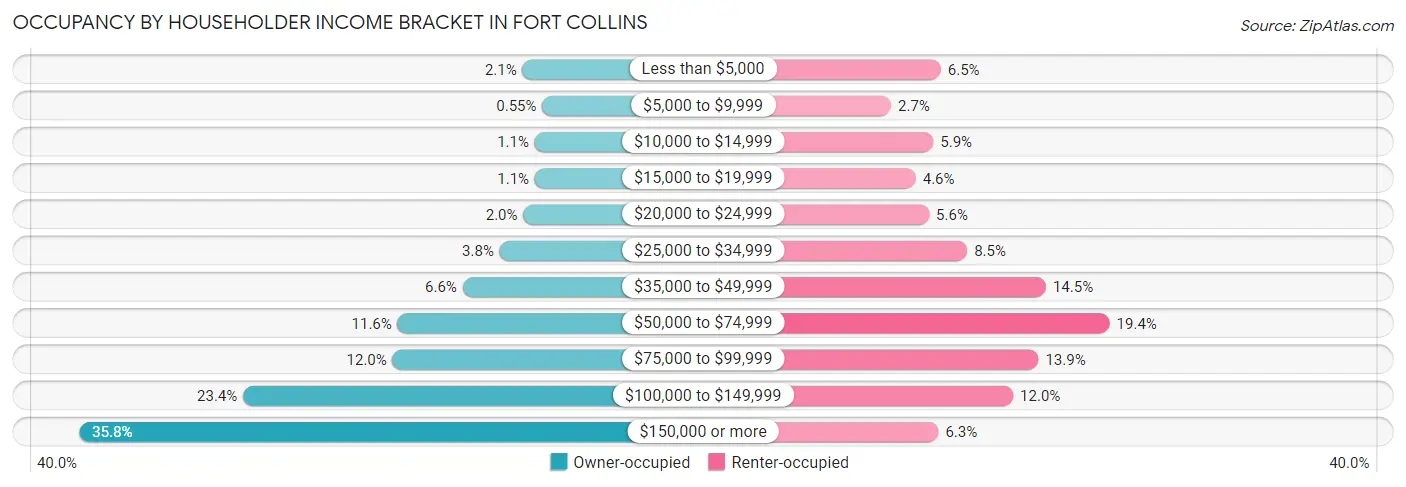
| Income Bracket | Owner-occupied | Renter-occupied |
| Less than $5,000 | 746 (2.1%) | 2,199 (6.5%) |
| $5,000 to $9,999 | 199 (0.5%) | 916 (2.7%) |
| $10,000 to $14,999 | 407 (1.1%) | 2,006 (5.9%) |
| $15,000 to $19,999 | 404 (1.1%) | 1,551 (4.6%) |
| $20,000 to $24,999 | 723 (2.0%) | 1,897 (5.6%) |
| $25,000 to $34,999 | 1,373 (3.8%) | 2,876 (8.5%) |
| $35,000 to $49,999 | 2,392 (6.6%) | 4,907 (14.5%) |
| $50,000 to $74,999 | 4,184 (11.6%) | 6,548 (19.4%) |
| $75,000 to $99,999 | 4,322 (12.0%) | 4,715 (13.9%) |
| $100,000 to $149,999 | 8,437 (23.4%) | 4,061 (12.0%) |
| $150,000 or more | 12,952 (35.8%) | 2,138 (6.3%) |
| Total | 36,139 (100.0%) | 33,814 (100.0%) |
Monthly Housing Cost Tiers in Fort Collins
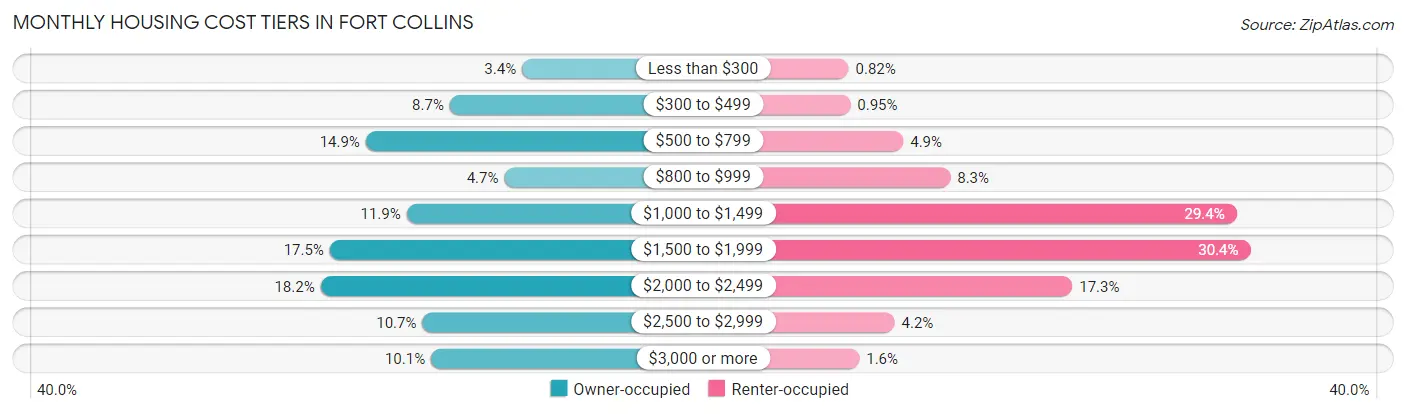
| Monthly Cost | Owner-occupied | Renter-occupied |
| Less than $300 | 1,219 (3.4%) | 277 (0.8%) |
| $300 to $499 | 3,141 (8.7%) | 321 (0.9%) |
| $500 to $799 | 5,378 (14.9%) | 1,640 (4.9%) |
| $800 to $999 | 1,689 (4.7%) | 2,809 (8.3%) |
| $1,000 to $1,499 | 4,288 (11.9%) | 9,938 (29.4%) |
| $1,500 to $1,999 | 6,336 (17.5%) | 10,282 (30.4%) |
| $2,000 to $2,499 | 6,580 (18.2%) | 5,849 (17.3%) |
| $2,500 to $2,999 | 3,870 (10.7%) | 1,423 (4.2%) |
| $3,000 or more | 3,638 (10.1%) | 544 (1.6%) |
| Total | 36,139 (100.0%) | 33,814 (100.0%) |
Physical Housing Characteristics in Fort Collins
Housing Structures in Fort Collins
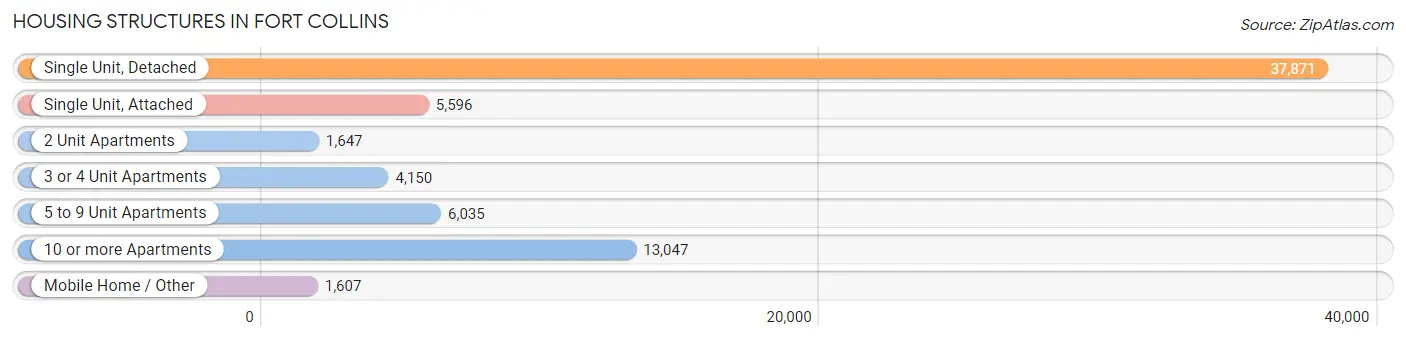
| Structure Type | # Housing Units | % Housing Units |
| Single Unit, Detached | 37,871 | 54.1% |
| Single Unit, Attached | 5,596 | 8.0% |
| 2 Unit Apartments | 1,647 | 2.4% |
| 3 or 4 Unit Apartments | 4,150 | 5.9% |
| 5 to 9 Unit Apartments | 6,035 | 8.6% |
| 10 or more Apartments | 13,047 | 18.6% |
| Mobile Home / Other | 1,607 | 2.3% |
| Total | 69,953 | 100.0% |
Housing Structures by Occupancy in Fort Collins
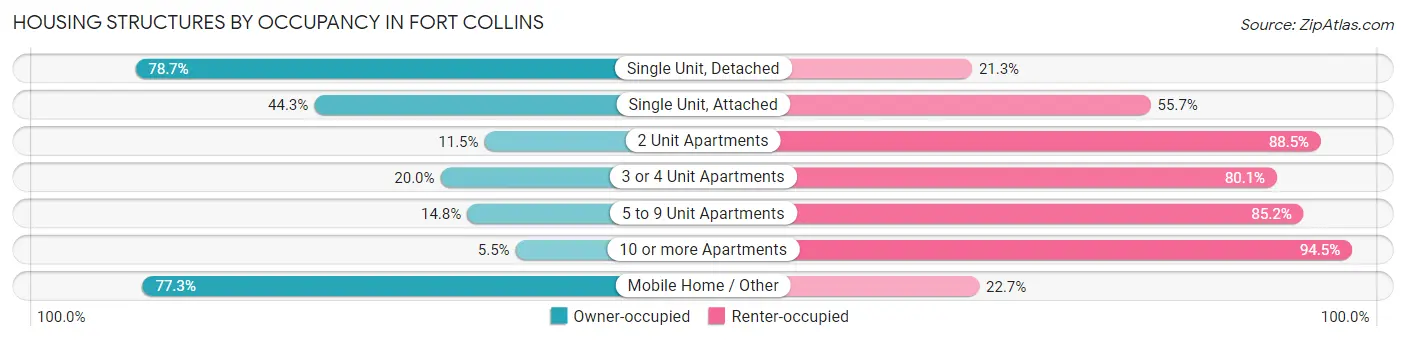
| Structure Type | Owner-occupied | Renter-occupied |
| Single Unit, Detached | 29,792 (78.7%) | 8,079 (21.3%) |
| Single Unit, Attached | 2,477 (44.3%) | 3,119 (55.7%) |
| 2 Unit Apartments | 189 (11.5%) | 1,458 (88.5%) |
| 3 or 4 Unit Apartments | 828 (20.0%) | 3,322 (80.0%) |
| 5 to 9 Unit Apartments | 894 (14.8%) | 5,141 (85.2%) |
| 10 or more Apartments | 717 (5.5%) | 12,330 (94.5%) |
| Mobile Home / Other | 1,242 (77.3%) | 365 (22.7%) |
| Total | 36,139 (51.7%) | 33,814 (48.3%) |
Housing Structures by Number of Rooms in Fort Collins
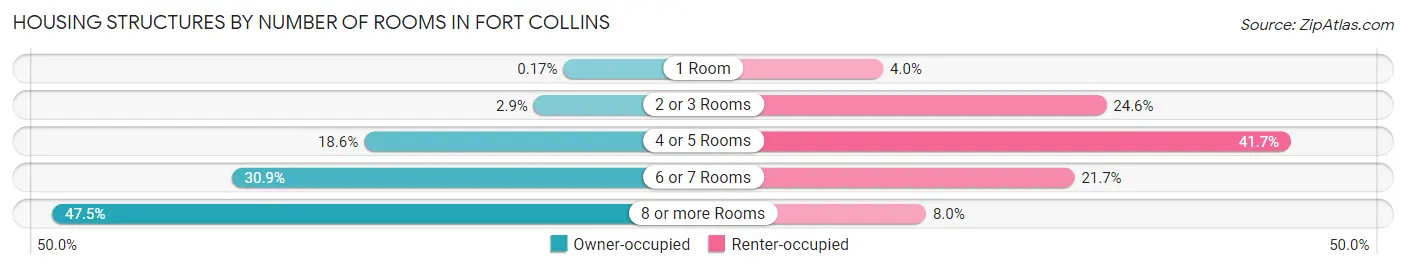
| Number of Rooms | Owner-occupied | Renter-occupied |
| 1 Room | 60 (0.2%) | 1,354 (4.0%) |
| 2 or 3 Rooms | 1,054 (2.9%) | 8,331 (24.6%) |
| 4 or 5 Rooms | 6,725 (18.6%) | 14,103 (41.7%) |
| 6 or 7 Rooms | 11,148 (30.8%) | 7,333 (21.7%) |
| 8 or more Rooms | 17,152 (47.5%) | 2,693 (8.0%) |
| Total | 36,139 (100.0%) | 33,814 (100.0%) |
Housing Structure by Heating Type in Fort Collins
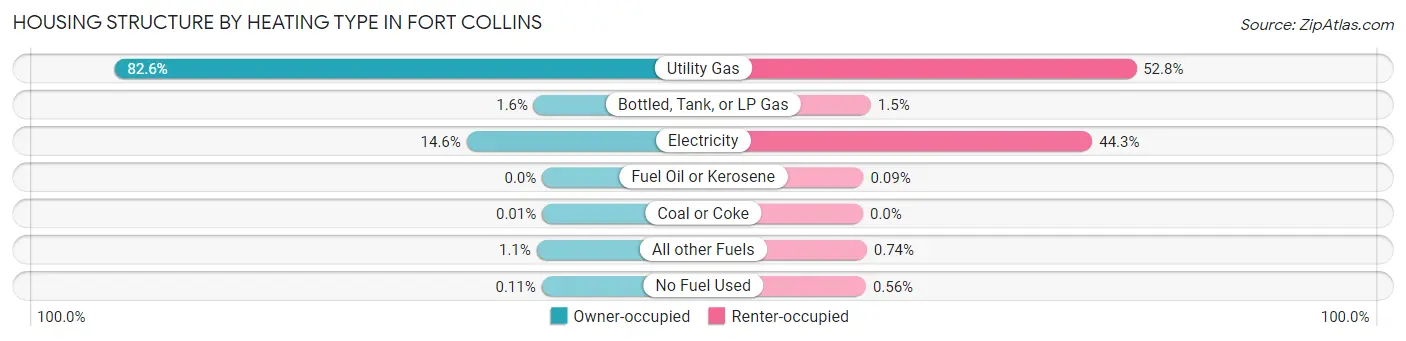
| Heating Type | Owner-occupied | Renter-occupied |
| Utility Gas | 29,866 (82.6%) | 17,851 (52.8%) |
| Bottled, Tank, or LP Gas | 574 (1.6%) | 513 (1.5%) |
| Electricity | 5,273 (14.6%) | 14,979 (44.3%) |
| Fuel Oil or Kerosene | 0 (0.0%) | 29 (0.1%) |
| Coal or Coke | 5 (0.0%) | 0 (0.0%) |
| All other Fuels | 382 (1.1%) | 251 (0.7%) |
| No Fuel Used | 39 (0.1%) | 191 (0.6%) |
| Total | 36,139 (100.0%) | 33,814 (100.0%) |
Household Vehicle Usage in Fort Collins
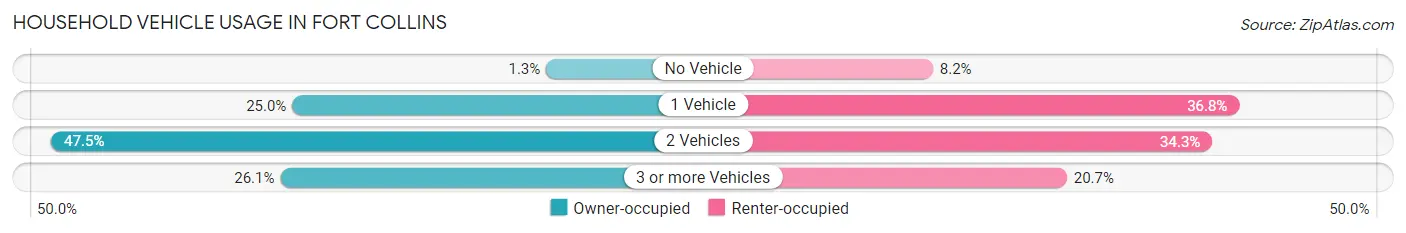
| Vehicles per Household | Owner-occupied | Renter-occupied |
| No Vehicle | 476 (1.3%) | 2,776 (8.2%) |
| 1 Vehicle | 9,042 (25.0%) | 12,443 (36.8%) |
| 2 Vehicles | 17,177 (47.5%) | 11,591 (34.3%) |
| 3 or more Vehicles | 9,444 (26.1%) | 7,004 (20.7%) |
| Total | 36,139 (100.0%) | 33,814 (100.0%) |
Real Estate & Mortgages in Fort Collins
Real Estate and Mortgage Overview in Fort Collins
| Characteristic | Without Mortgage | With Mortgage |
| Housing Units | 11,555 | 24,584 |
| Median Property Value | $458,300 | $523,100 |
| Median Household Income | $85,042 | $10,133 |
| Monthly Housing Costs | $566 | $3,628 |
| Real Estate Taxes | $2,520 | $348 |
Property Value by Mortgage Status in Fort Collins
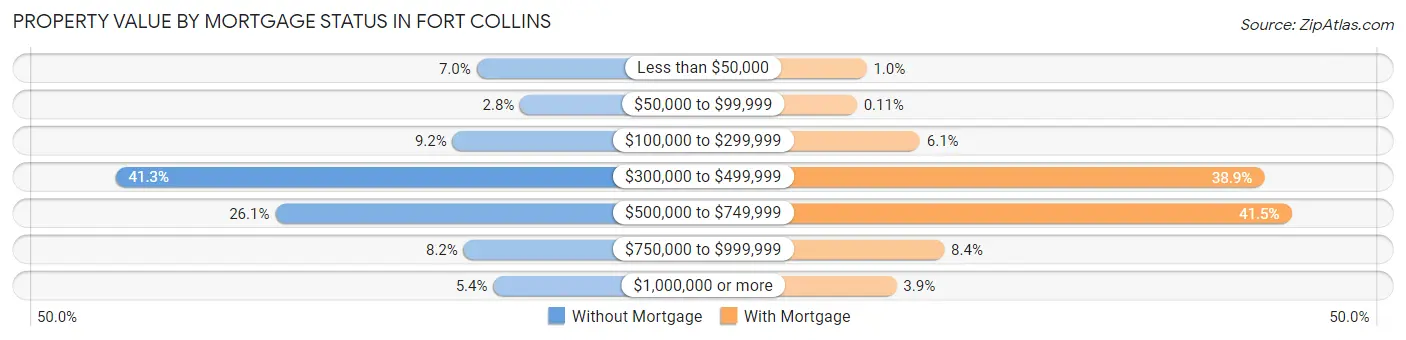
| Property Value | Without Mortgage | With Mortgage |
| Less than $50,000 | 804 (7.0%) | 255 (1.0%) |
| $50,000 to $99,999 | 323 (2.8%) | 26 (0.1%) |
| $100,000 to $299,999 | 1,068 (9.2%) | 1,504 (6.1%) |
| $300,000 to $499,999 | 4,776 (41.3%) | 9,565 (38.9%) |
| $500,000 to $749,999 | 3,019 (26.1%) | 10,202 (41.5%) |
| $750,000 to $999,999 | 946 (8.2%) | 2,075 (8.4%) |
| $1,000,000 or more | 619 (5.4%) | 957 (3.9%) |
| Total | 11,555 (100.0%) | 24,584 (100.0%) |
Household Income by Mortgage Status in Fort Collins
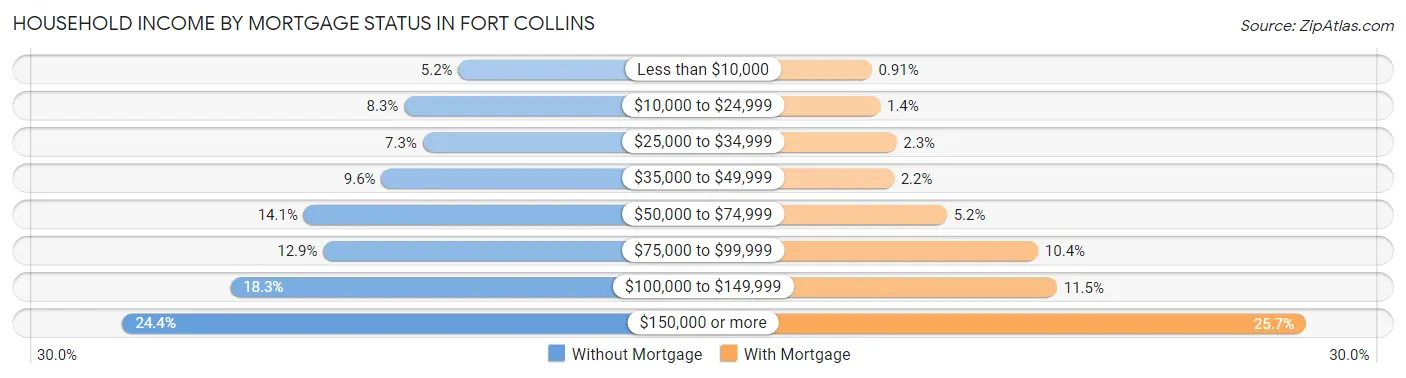
| Household Income | Without Mortgage | With Mortgage |
| Less than $10,000 | 602 (5.2%) | 224 (0.9%) |
| $10,000 to $24,999 | 960 (8.3%) | 343 (1.4%) |
| $25,000 to $34,999 | 838 (7.2%) | 574 (2.3%) |
| $35,000 to $49,999 | 1,110 (9.6%) | 535 (2.2%) |
| $50,000 to $74,999 | 1,623 (14.1%) | 1,282 (5.2%) |
| $75,000 to $99,999 | 1,494 (12.9%) | 2,561 (10.4%) |
| $100,000 to $149,999 | 2,109 (18.2%) | 2,828 (11.5%) |
| $150,000 or more | 2,819 (24.4%) | 6,328 (25.7%) |
| Total | 11,555 (100.0%) | 24,584 (100.0%) |
Property Value to Household Income Ratio in Fort Collins
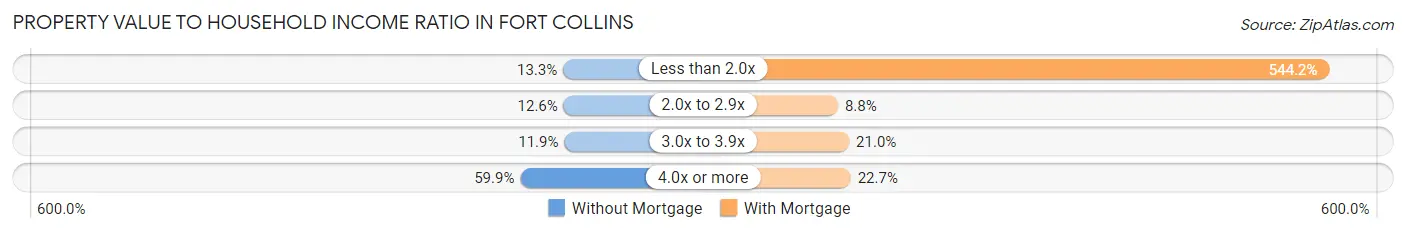
| Value-to-Income Ratio | Without Mortgage | With Mortgage |
| Less than 2.0x | 1,537 (13.3%) | 133,779 (544.2%) |
| 2.0x to 2.9x | 1,460 (12.6%) | 2,159 (8.8%) |
| 3.0x to 3.9x | 1,380 (11.9%) | 5,157 (21.0%) |
| 4.0x or more | 6,925 (59.9%) | 5,575 (22.7%) |
| Total | 11,555 (100.0%) | 24,584 (100.0%) |
Real Estate Taxes by Mortgage Status in Fort Collins
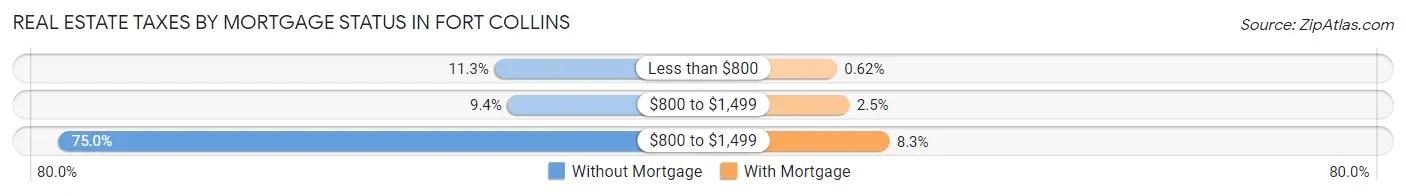
| Property Taxes | Without Mortgage | With Mortgage |
| Less than $800 | 1,308 (11.3%) | 153 (0.6%) |
| $800 to $1,499 | 1,088 (9.4%) | 605 (2.5%) |
| $800 to $1,499 | 8,666 (75.0%) | 2,039 (8.3%) |
| Total | 11,555 (100.0%) | 24,584 (100.0%) |
Health & Disability in Fort Collins
Health Insurance Coverage by Age in Fort Collins
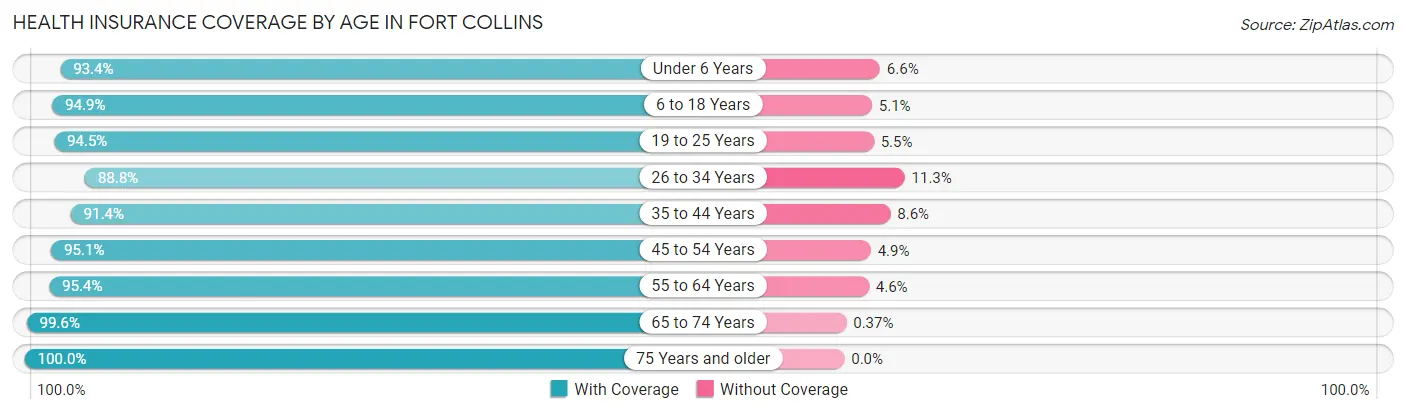
| Age Bracket | With Coverage | Without Coverage |
| Under 6 Years | 8,006 (93.4%) | 569 (6.6%) |
| 6 to 18 Years | 22,796 (94.9%) | 1,235 (5.1%) |
| 19 to 25 Years | 35,481 (94.5%) | 2,056 (5.5%) |
| 26 to 34 Years | 22,785 (88.7%) | 2,887 (11.3%) |
| 35 to 44 Years | 18,977 (91.4%) | 1,784 (8.6%) |
| 45 to 54 Years | 14,422 (95.1%) | 748 (4.9%) |
| 55 to 64 Years | 15,300 (95.4%) | 734 (4.6%) |
| 65 to 74 Years | 11,561 (99.6%) | 43 (0.4%) |
| 75 Years and older | 7,337 (100.0%) | 0 (0.0%) |
| Total | 156,665 (94.0%) | 10,056 (6.0%) |
Health Insurance Coverage by Citizenship Status in Fort Collins
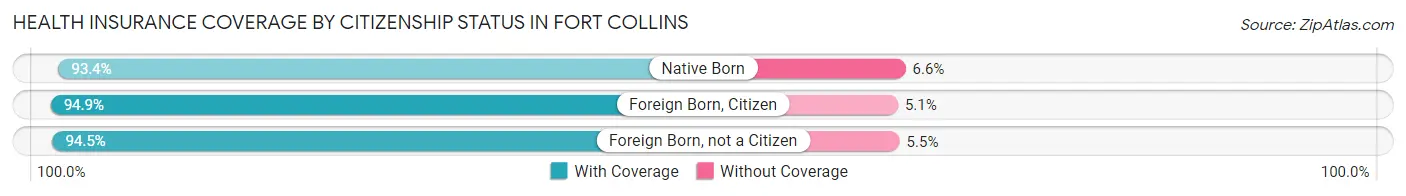
| Citizenship Status | With Coverage | Without Coverage |
| Native Born | 8,006 (93.4%) | 569 (6.6%) |
| Foreign Born, Citizen | 22,796 (94.9%) | 1,235 (5.1%) |
| Foreign Born, not a Citizen | 35,481 (94.5%) | 2,056 (5.5%) |
Health Insurance Coverage by Household Income in Fort Collins
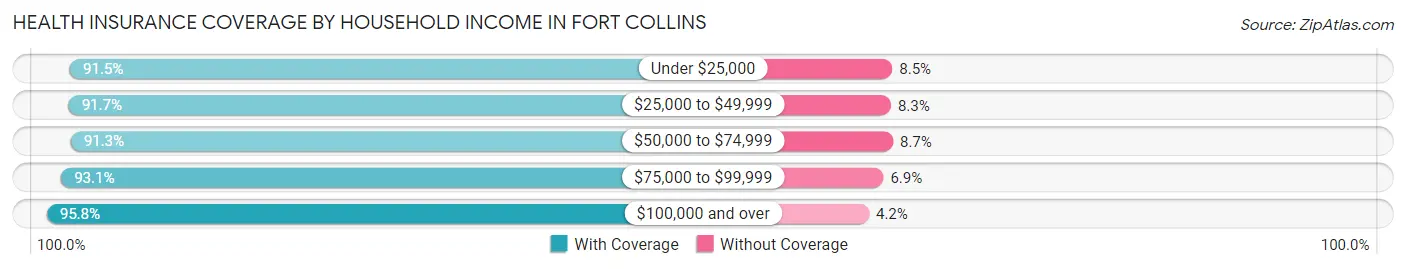
| Household Income | With Coverage | Without Coverage |
| Under $25,000 | 16,987 (91.5%) | 1,584 (8.5%) |
| $25,000 to $49,999 | 19,747 (91.7%) | 1,781 (8.3%) |
| $50,000 to $74,999 | 21,331 (91.3%) | 2,022 (8.7%) |
| $75,000 to $99,999 | 18,657 (93.1%) | 1,377 (6.9%) |
| $100,000 and over | 73,008 (95.8%) | 3,177 (4.2%) |
Public vs Private Health Insurance Coverage by Age in Fort Collins
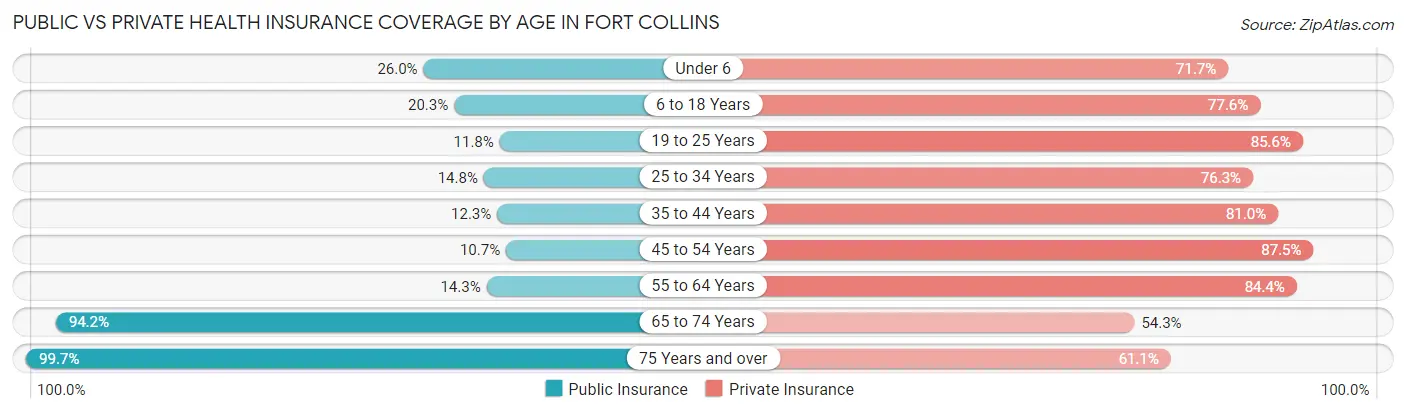
| Age Bracket | Public Insurance | Private Insurance |
| Under 6 | 2,227 (26.0%) | 6,148 (71.7%) |
| 6 to 18 Years | 4,876 (20.3%) | 18,658 (77.6%) |
| 19 to 25 Years | 4,441 (11.8%) | 32,116 (85.6%) |
| 25 to 34 Years | 3,795 (14.8%) | 19,591 (76.3%) |
| 35 to 44 Years | 2,553 (12.3%) | 16,810 (81.0%) |
| 45 to 54 Years | 1,616 (10.6%) | 13,277 (87.5%) |
| 55 to 64 Years | 2,288 (14.3%) | 13,538 (84.4%) |
| 65 to 74 Years | 10,932 (94.2%) | 6,303 (54.3%) |
| 75 Years and over | 7,316 (99.7%) | 4,479 (61.1%) |
| Total | 40,044 (24.0%) | 130,920 (78.5%) |
Disability Status by Sex by Age in Fort Collins
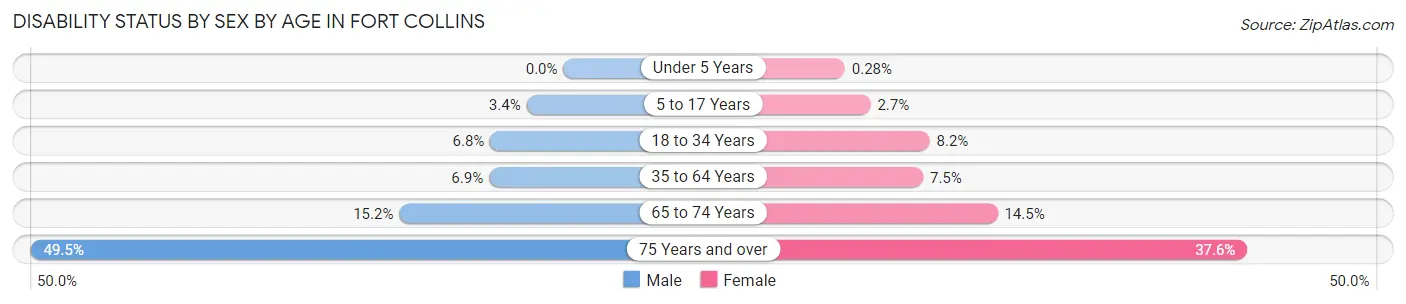
| Age Bracket | Male | Female |
| Under 5 Years | 0 (0.0%) | 9 (0.3%) |
| 5 to 17 Years | 374 (3.4%) | 290 (2.7%) |
| 18 to 34 Years | 2,344 (6.8%) | 2,667 (8.2%) |
| 35 to 64 Years | 1,801 (6.9%) | 1,950 (7.5%) |
| 65 to 74 Years | 819 (15.2%) | 900 (14.4%) |
| 75 Years and over | 1,433 (49.4%) | 1,670 (37.6%) |
Disability Class by Sex by Age in Fort Collins
Disability Class: Hearing Difficulty
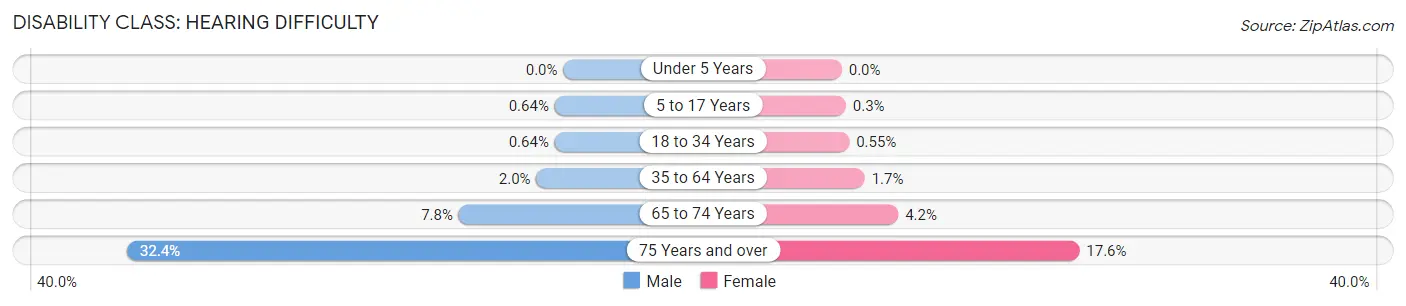
| Age Bracket | Male | Female |
| Under 5 Years | 0 (0.0%) | 0 (0.0%) |
| 5 to 17 Years | 70 (0.6%) | 33 (0.3%) |
| 18 to 34 Years | 221 (0.6%) | 180 (0.5%) |
| 35 to 64 Years | 521 (2.0%) | 439 (1.7%) |
| 65 to 74 Years | 417 (7.8%) | 261 (4.2%) |
| 75 Years and over | 939 (32.4%) | 783 (17.6%) |
Disability Class: Vision Difficulty
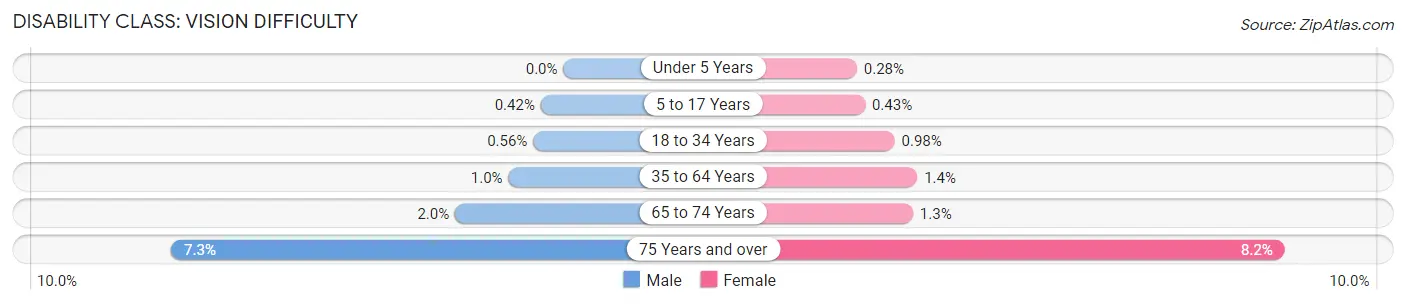
| Age Bracket | Male | Female |
| Under 5 Years | 0 (0.0%) | 9 (0.3%) |
| 5 to 17 Years | 46 (0.4%) | 47 (0.4%) |
| 18 to 34 Years | 194 (0.6%) | 322 (1.0%) |
| 35 to 64 Years | 267 (1.0%) | 362 (1.4%) |
| 65 to 74 Years | 108 (2.0%) | 82 (1.3%) |
| 75 Years and over | 211 (7.3%) | 365 (8.2%) |
Disability Class: Cognitive Difficulty
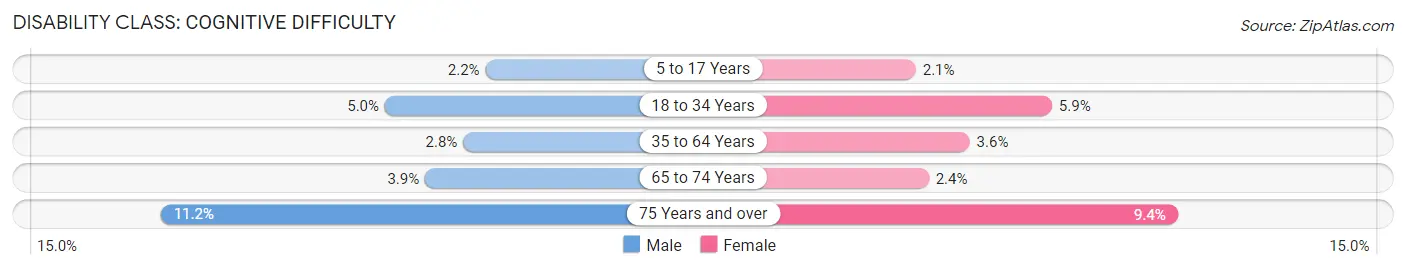
| Age Bracket | Male | Female |
| 5 to 17 Years | 237 (2.2%) | 224 (2.1%) |
| 18 to 34 Years | 1,717 (5.0%) | 1,914 (5.9%) |
| 35 to 64 Years | 729 (2.8%) | 921 (3.6%) |
| 65 to 74 Years | 207 (3.8%) | 151 (2.4%) |
| 75 Years and over | 325 (11.2%) | 415 (9.3%) |
Disability Class: Ambulatory Difficulty
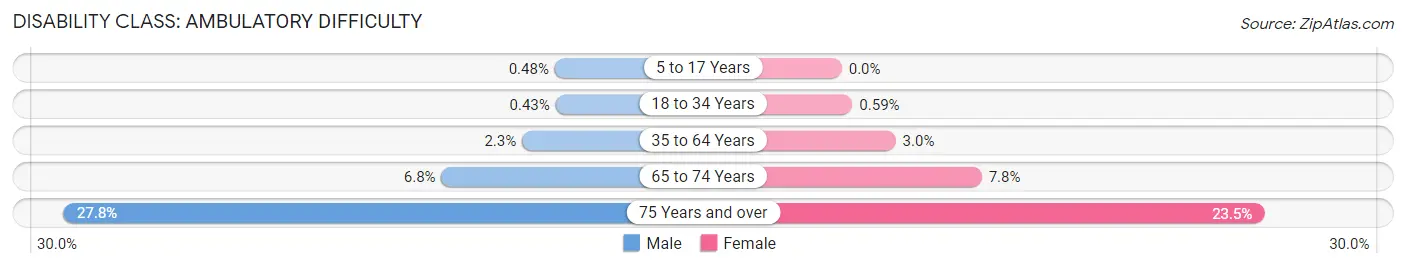
| Age Bracket | Male | Female |
| 5 to 17 Years | 52 (0.5%) | 0 (0.0%) |
| 18 to 34 Years | 147 (0.4%) | 194 (0.6%) |
| 35 to 64 Years | 600 (2.3%) | 776 (3.0%) |
| 65 to 74 Years | 365 (6.8%) | 485 (7.8%) |
| 75 Years and over | 806 (27.8%) | 1,044 (23.5%) |
Disability Class: Self-Care Difficulty
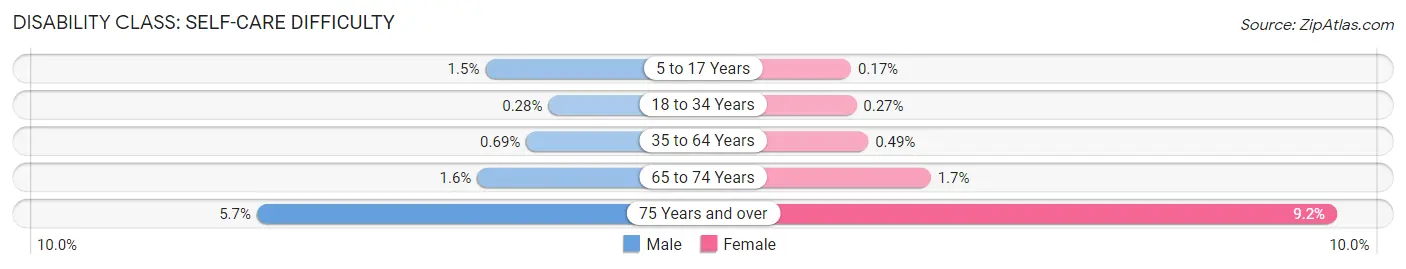
| Age Bracket | Male | Female |
| 5 to 17 Years | 158 (1.5%) | 19 (0.2%) |
| 18 to 34 Years | 95 (0.3%) | 90 (0.3%) |
| 35 to 64 Years | 179 (0.7%) | 126 (0.5%) |
| 65 to 74 Years | 86 (1.6%) | 103 (1.7%) |
| 75 Years and over | 165 (5.7%) | 408 (9.2%) |
Technology Access in Fort Collins
Computing Device Access in Fort Collins
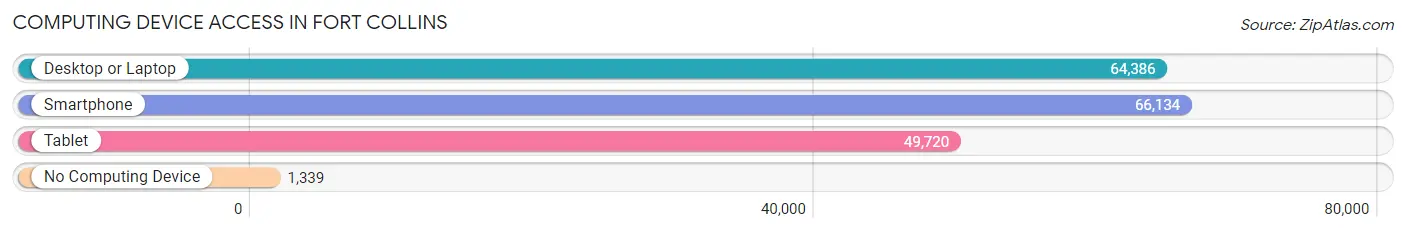
| Device Type | # Households | % Households |
| Desktop or Laptop | 64,386 | 92.0% |
| Smartphone | 66,134 | 94.5% |
| Tablet | 49,720 | 71.1% |
| No Computing Device | 1,339 | 1.9% |
| Total | 69,953 | 100.0% |
Internet Access in Fort Collins
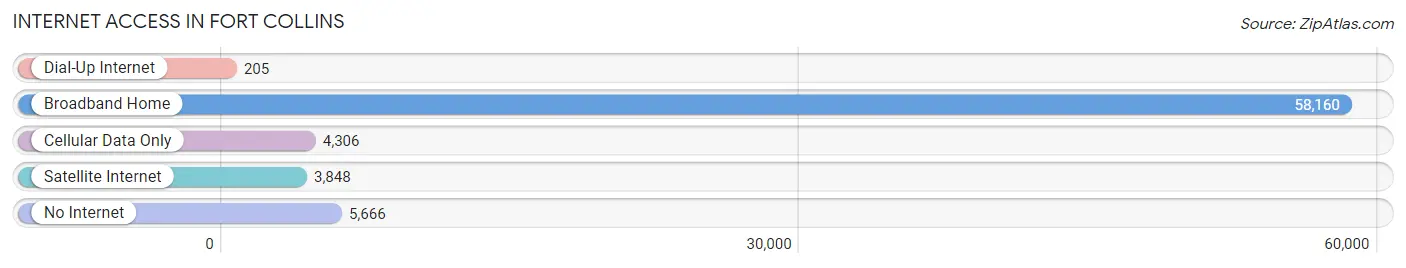
| Internet Type | # Households | % Households |
| Dial-Up Internet | 205 | 0.3% |
| Broadband Home | 58,160 | 83.1% |
| Cellular Data Only | 4,306 | 6.2% |
| Satellite Internet | 3,848 | 5.5% |
| No Internet | 5,666 | 8.1% |
| Total | 69,953 | 100.0% |
Fort Collins Summary
Fort Collins, Colorado is a city located in the northern part of the state, about an hour north of Denver. It is the county seat of Larimer County and the home of Colorado State University. The city has a population of over 165,000 people and is the fourth most populous city in the state.
History
The area that is now Fort Collins was first inhabited by Native American tribes, including the Arapaho, Cheyenne, and Ute. The first Europeans to settle in the area were fur traders in the early 1800s. In 1864, the United States Army established a fort in the area, which was named after Colonel William O. Collins. The fort was used to protect settlers from Native American attacks.
In 1873, the city of Fort Collins was officially incorporated. The city quickly grew and became an important agricultural center in the region. In the late 1800s, the city was home to several large sugar beet factories, which helped to fuel the local economy.
Geography
Fort Collins is located in the foothills of the Rocky Mountains, about an hour north of Denver. The city is situated at an elevation of 5,003 feet and is surrounded by mountains and plains. The Cache la Poudre River runs through the city, providing a source of recreation and irrigation for the area.
The city has a total area of about 40 square miles, with a population density of about 4,000 people per square mile. The climate in Fort Collins is semi-arid, with hot summers and cold winters.
Economy
Fort Collins is home to a diverse economy, with a variety of industries providing employment opportunities. The city is home to several large companies, including Hewlett-Packard, Intel, and Anheuser-Busch. The city is also home to several technology companies, including Avago Technologies, Otterbox, and Advanced Energy.
The city is also home to several educational institutions, including Colorado State University, Front Range Community College, and Aims Community College. These institutions provide a variety of educational opportunities for students and contribute to the local economy.
Demographics
As of the 2010 census, the population of Fort Collins was 165,800. The city has a population density of about 4,000 people per square mile. The median age of the population is 30.7 years, and the median household income is $54,845.
Fort Collins is a diverse city, with a variety of ethnic and racial backgrounds represented. The largest racial group is White (83.3%), followed by Hispanic or Latino (11.2%), Asian (2.7%), African American (1.7%), and Native American (0.7%).
Fort Collins is a vibrant city with a rich history, diverse geography, and a thriving economy. The city is home to a variety of industries, educational institutions, and cultural attractions. The city is a great place to live, work, and play, and is a great example of the beauty and diversity of Colorado.
Common Questions
What is Per Capita Income in Fort Collins?
Per Capita income in Fort Collins is $43,495.
What is the Median Family Income in Fort Collins?
Median Family Income in Fort Collins is $114,740.
What is the Median Household income in Fort Collins?
Median Household Income in Fort Collins is $78,977.
What is Income or Wage Gap in Fort Collins?
Income or Wage Gap in Fort Collins is 33.6%.
Women in Fort Collins earn 66.4 cents for every dollar earned by a man.
What is Family Income Deficit in Fort Collins?
Family Income Deficit in Fort Collins is $12,039.
Families that are below poverty line in Fort Collins earn $12,039 less on average than the poverty threshold level.
What is Inequality or Gini Index in Fort Collins?
Inequality or Gini Index in Fort Collins is 0.46.
What is the Total Population of Fort Collins?
Total Population of Fort Collins is 168,758.
What is the Total Male Population of Fort Collins?
Total Male Population of Fort Collins is 84,865.
What is the Total Female Population of Fort Collins?
Total Female Population of Fort Collins is 83,893.
What is the Ratio of Males per 100 Females in Fort Collins?
There are 101.16 Males per 100 Females in Fort Collins.
What is the Ratio of Females per 100 Males in Fort Collins?
There are 98.85 Females per 100 Males in Fort Collins.
What is the Median Population Age in Fort Collins?
Median Population Age in Fort Collins is 30.1 Years.
What is the Average Family Size in Fort Collins
Average Family Size in Fort Collins is 2.9 People.
What is the Average Household Size in Fort Collins
Average Household Size in Fort Collins is 2.3 People.
How Large is the Labor Force in Fort Collins?
There are 101,805 People in the Labor Forcein in Fort Collins.
What is the Percentage of People in the Labor Force in Fort Collins?
70.8% of People are in the Labor Force in Fort Collins.
What is the Unemployment Rate in Fort Collins?
Unemployment Rate in Fort Collins is 5.3%.