Castle Rock, CO Map & Demographics
Castle Rock Map
Castle Rock Overview
$55,031
PER CAPITA INCOME
$150,875
AVG FAMILY INCOME
$135,985
AVG HOUSEHOLD INCOME
38.9%
WAGE / INCOME GAP [ % ]
61.1¢/ $1
WAGE / INCOME GAP [ $ ]
0.38
INEQUALITY / GINI INDEX
74,065
TOTAL POPULATION
36,786
MALE POPULATION
37,279
FEMALE POPULATION
98.68
MALES / 100 FEMALES
101.34
FEMALES / 100 MALES
35.8
MEDIAN AGE
3.2
AVG FAMILY SIZE
2.8
AVG HOUSEHOLD SIZE
41,422
LABOR FORCE [ PEOPLE ]
73.5%
PERCENT IN LABOR FORCE
4.2%
UNEMPLOYMENT RATE
Castle Rock Area Codes
Income in Castle Rock
Income Overview in Castle Rock
Per Capita Income in Castle Rock is $55,031, while median incomes of families and households are $150,875 and $135,985 respectively.
| Characteristic | Number | Measure |
| Per Capita Income | 74,065 | $55,031 |
| Median Family Income | 19,753 | $150,875 |
| Mean Family Income | 19,753 | $175,628 |
| Median Household Income | 25,946 | $135,985 |
| Mean Household Income | 25,946 | $154,734 |
| Income Deficit | 19,753 | $0 |
| Wage / Income Gap (%) | 74,065 | 38.94% |
| Wage / Income Gap ($) | 74,065 | 61.06¢ per $1 |
| Gini / Inequality Index | 74,065 | 0.38 |
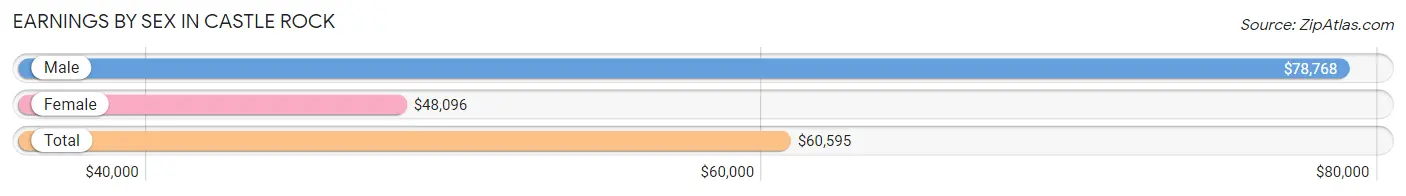
Earnings by Sex in Castle Rock
Average Earnings in Castle Rock are $60,595, $78,768 for men and $48,096 for women, a difference of 38.9%.
| Sex | Number | Average Earnings |
| Male | 23,579 (54.2%) | $78,768 |
| Female | 19,938 (45.8%) | $48,096 |
| Total | 43,517 (100.0%) | $60,595 |
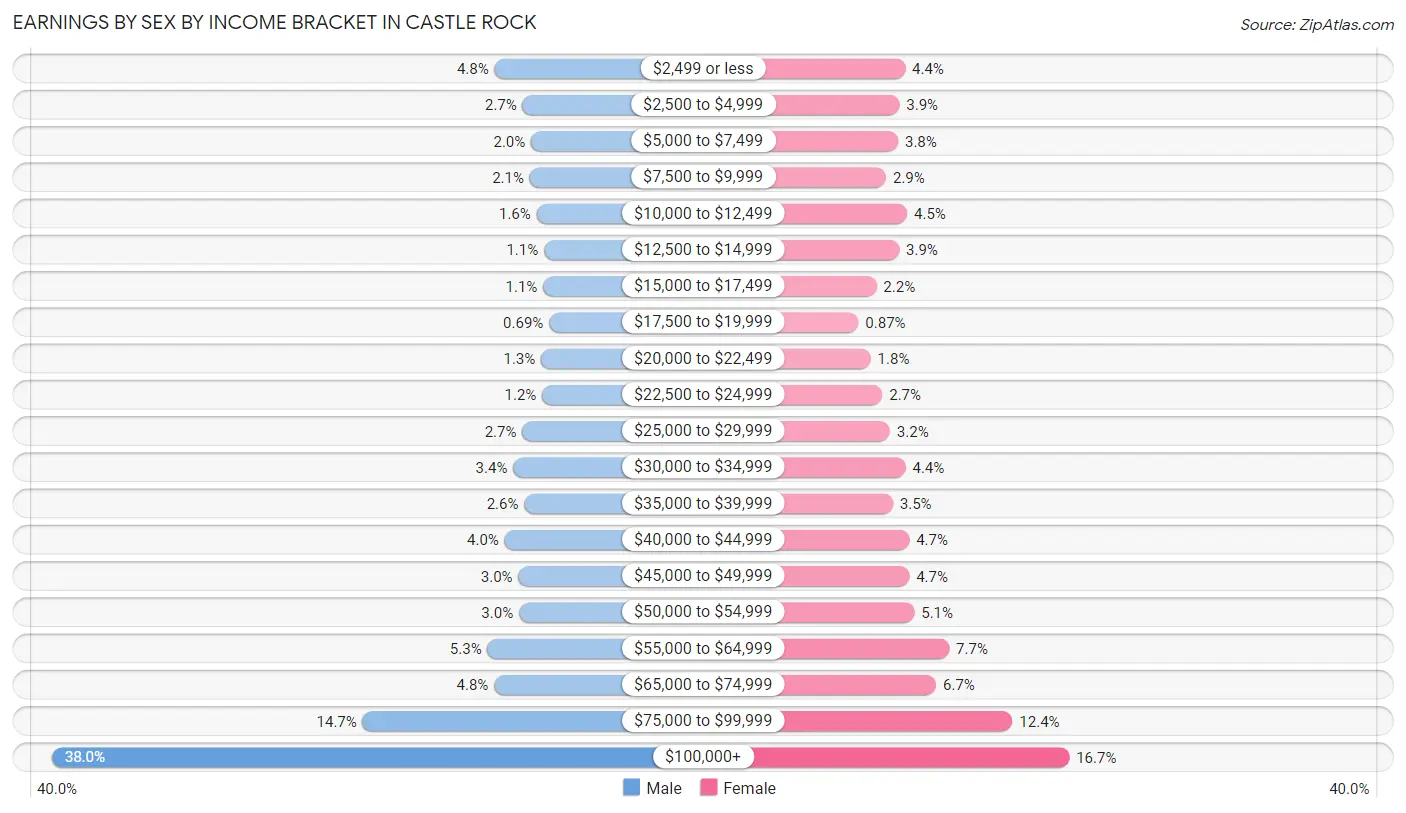
Earnings by Sex by Income Bracket in Castle Rock
The most common earnings brackets in Castle Rock are $100,000+ for men (8,951 | 38.0%) and $100,000+ for women (3,323 | 16.7%).
| Income | Male | Female |
| $2,499 or less | 1,127 (4.8%) | 872 (4.4%) |
| $2,500 to $4,999 | 633 (2.7%) | 786 (3.9%) |
| $5,000 to $7,499 | 481 (2.0%) | 766 (3.8%) |
| $7,500 to $9,999 | 504 (2.1%) | 586 (2.9%) |
| $10,000 to $12,499 | 384 (1.6%) | 901 (4.5%) |
| $12,500 to $14,999 | 252 (1.1%) | 782 (3.9%) |
| $15,000 to $17,499 | 268 (1.1%) | 442 (2.2%) |
| $17,500 to $19,999 | 162 (0.7%) | 173 (0.9%) |
| $20,000 to $22,499 | 303 (1.3%) | 356 (1.8%) |
| $22,500 to $24,999 | 286 (1.2%) | 530 (2.7%) |
| $25,000 to $29,999 | 636 (2.7%) | 644 (3.2%) |
| $30,000 to $34,999 | 798 (3.4%) | 877 (4.4%) |
| $35,000 to $39,999 | 601 (2.5%) | 687 (3.5%) |
| $40,000 to $44,999 | 947 (4.0%) | 933 (4.7%) |
| $45,000 to $49,999 | 705 (3.0%) | 934 (4.7%) |
| $50,000 to $54,999 | 695 (2.9%) | 1,009 (5.1%) |
| $55,000 to $64,999 | 1,253 (5.3%) | 1,529 (7.7%) |
| $65,000 to $74,999 | 1,135 (4.8%) | 1,334 (6.7%) |
| $75,000 to $99,999 | 3,458 (14.7%) | 2,474 (12.4%) |
| $100,000+ | 8,951 (38.0%) | 3,323 (16.7%) |
| Total | 23,579 (100.0%) | 19,938 (100.0%) |
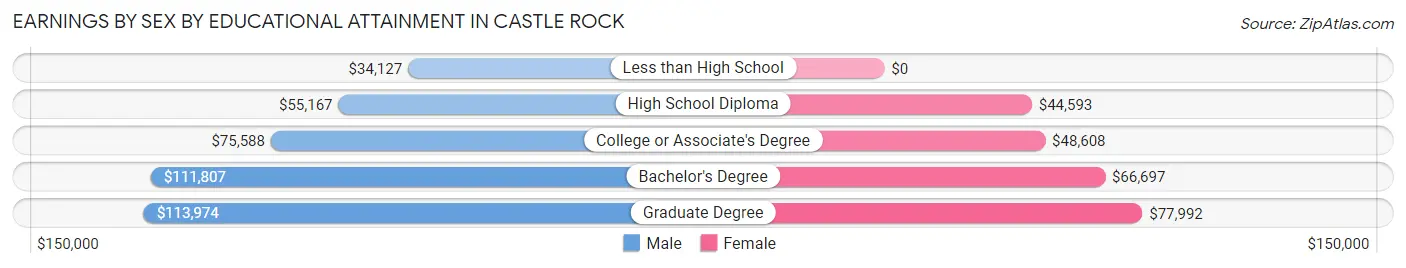
Earnings by Sex by Educational Attainment in Castle Rock
Average earnings in Castle Rock are $92,074 for men and $56,721 for women, a difference of 38.4%. Men with an educational attainment of graduate degree enjoy the highest average annual earnings of $113,974, while those with less than high school education earn the least with $34,127. Women with an educational attainment of graduate degree earn the most with the average annual earnings of $77,992, while those with high school diploma education have the smallest earnings of $44,593.
| Educational Attainment | Male Income | Female Income |
| Less than High School | $34,127 | $0 |
| High School Diploma | $55,167 | $44,593 |
| College or Associate's Degree | $75,588 | $48,608 |
| Bachelor's Degree | $111,807 | $66,697 |
| Graduate Degree | $113,974 | $77,992 |
| Total | $92,074 | $56,721 |
Family Income in Castle Rock
Family Income Brackets in Castle Rock
According to the Castle Rock family income data, there are 5,946 families falling into the $200,000+ income range, which is the most common income bracket and makes up 30.1% of all families. Conversely, the less than $10,000 income bracket is the least frequent group with only 59 families (0.3%) belonging to this category.
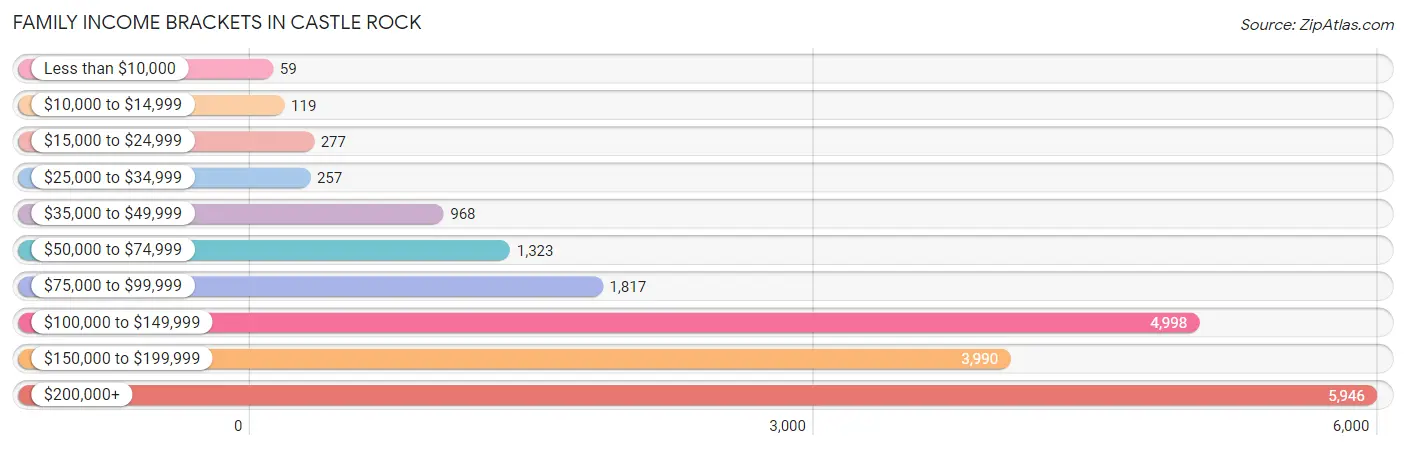
| Income Bracket | # Families | % Families |
| Less than $10,000 | 59 | 0.3% |
| $10,000 to $14,999 | 119 | 0.6% |
| $15,000 to $24,999 | 277 | 1.4% |
| $25,000 to $34,999 | 257 | 1.3% |
| $35,000 to $49,999 | 968 | 4.9% |
| $50,000 to $74,999 | 1,323 | 6.7% |
| $75,000 to $99,999 | 1,817 | 9.2% |
| $100,000 to $149,999 | 4,998 | 25.3% |
| $150,000 to $199,999 | 3,990 | 20.2% |
| $200,000+ | 5,946 | 30.1% |
Family Income by Famaliy Size in Castle Rock
5-person families (1,486 | 7.5%) account for the highest median family income in Castle Rock with $179,318 per family, while 2-person families (7,685 | 38.9%) have the highest median income of $65,373 per family member.
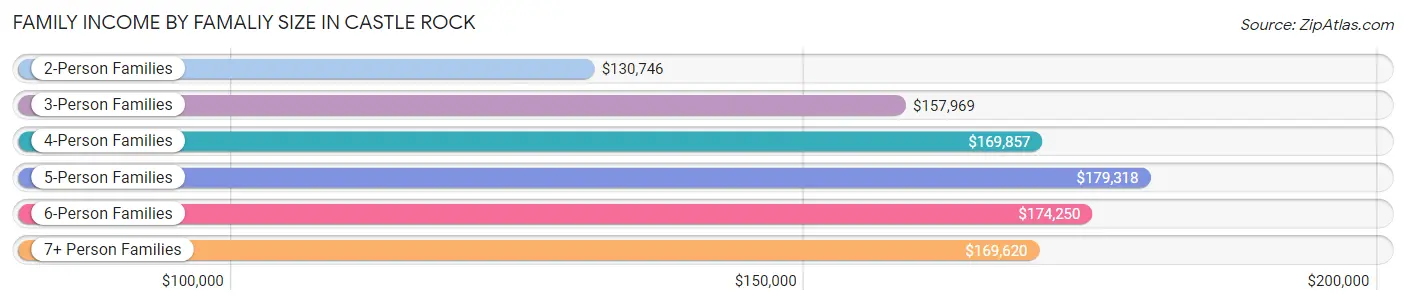
| Income Bracket | # Families | Median Income |
| 2-Person Families | 7,685 (38.9%) | $130,746 |
| 3-Person Families | 4,603 (23.3%) | $157,969 |
| 4-Person Families | 4,697 (23.8%) | $169,857 |
| 5-Person Families | 1,486 (7.5%) | $179,318 |
| 6-Person Families | 981 (5.0%) | $174,250 |
| 7+ Person Families | 301 (1.5%) | $169,620 |
| Total | 19,753 (100.0%) | $150,875 |
Family Income by Number of Earners in Castle Rock
The median family income in Castle Rock is $150,875, with families comprising 3+ earners (2,848) having the highest median family income of $214,000, while families with no earners (1,572) have the lowest median family income of $85,297, accounting for 14.4% and 8.0% of families, respectively.
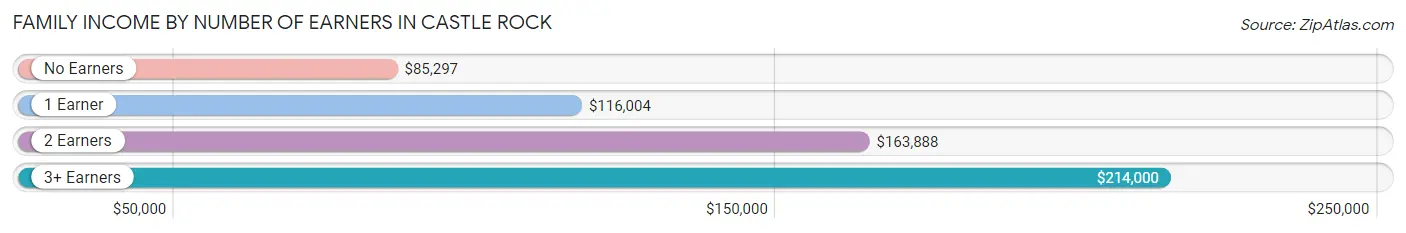
| Number of Earners | # Families | Median Income |
| No Earners | 1,572 (8.0%) | $85,297 |
| 1 Earner | 5,028 (25.5%) | $116,004 |
| 2 Earners | 10,305 (52.2%) | $163,888 |
| 3+ Earners | 2,848 (14.4%) | $214,000 |
| Total | 19,753 (100.0%) | $150,875 |
Household Income in Castle Rock
Household Income Brackets in Castle Rock
With 6,383 households falling in the category, the $200,000+ income range is the most frequent in Castle Rock, accounting for 24.6% of all households. In contrast, only 234 households (0.9%) fall into the $10,000 to $14,999 income bracket, making it the least populous group.
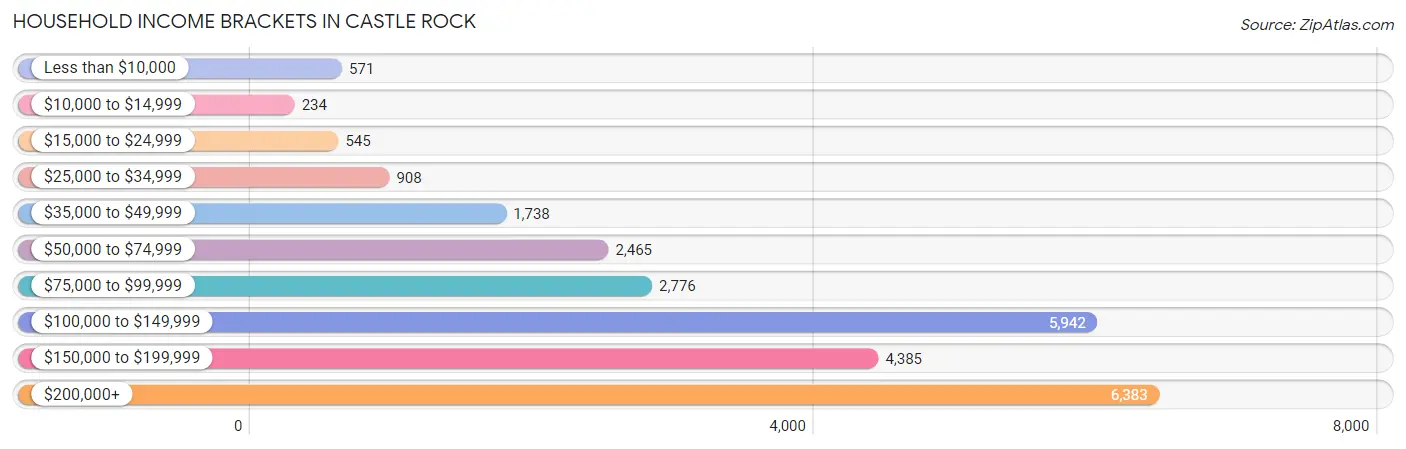
| Income Bracket | # Households | % Households |
| Less than $10,000 | 571 | 2.2% |
| $10,000 to $14,999 | 234 | 0.9% |
| $15,000 to $24,999 | 545 | 2.1% |
| $25,000 to $34,999 | 908 | 3.5% |
| $35,000 to $49,999 | 1,738 | 6.7% |
| $50,000 to $74,999 | 2,465 | 9.5% |
| $75,000 to $99,999 | 2,776 | 10.7% |
| $100,000 to $149,999 | 5,942 | 22.9% |
| $150,000 to $199,999 | 4,385 | 16.9% |
| $200,000+ | 6,383 | 24.6% |
Household Income by Householder Age in Castle Rock
The median household income in Castle Rock is $135,985, with the highest median household income of $147,617 found in the 25 to 44 years age bracket for the primary householder. A total of 10,449 households (40.3%) fall into this category. Meanwhile, the 15 to 24 years age bracket for the primary householder has the lowest median household income of $48,053, with 939 households (3.6%) in this group.
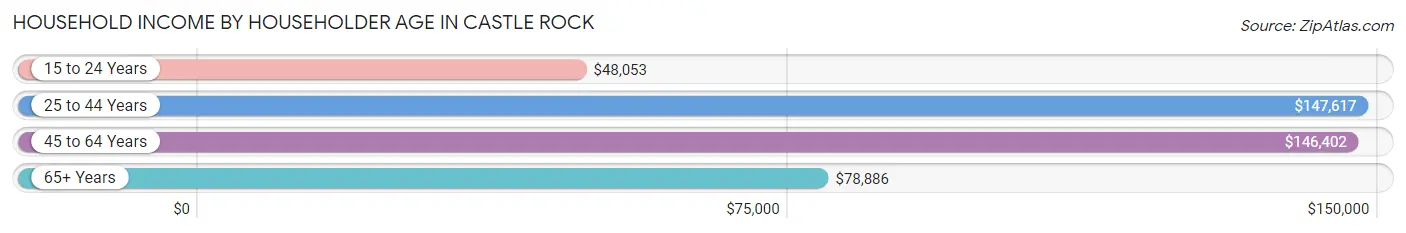
| Income Bracket | # Households | Median Income |
| 15 to 24 Years | 939 (3.6%) | $48,053 |
| 25 to 44 Years | 10,449 (40.3%) | $147,617 |
| 45 to 64 Years | 10,022 (38.6%) | $146,402 |
| 65+ Years | 4,536 (17.5%) | $78,886 |
| Total | 25,946 (100.0%) | $135,985 |
Poverty in Castle Rock
Income Below Poverty by Sex and Age in Castle Rock
With 2.6% poverty level for males and 4.4% for females among the residents of Castle Rock, 16 and 17 year old males and 18 to 24 year old females are the most vulnerable to poverty, with 62 males (5.0%) and 361 females (13.3%) in their respective age groups living below the poverty level.
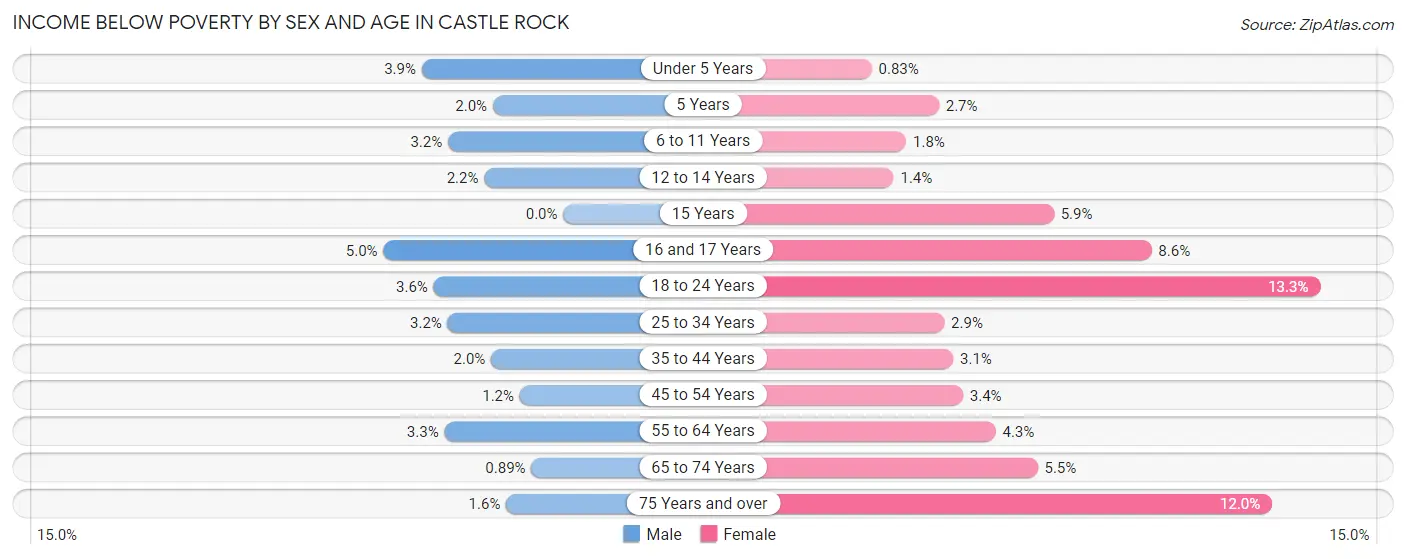
| Age Bracket | Male | Female |
| Under 5 Years | 95 (3.9%) | 24 (0.8%) |
| 5 Years | 10 (2.0%) | 11 (2.7%) |
| 6 to 11 Years | 109 (3.2%) | 67 (1.8%) |
| 12 to 14 Years | 34 (2.2%) | 23 (1.4%) |
| 15 Years | 0 (0.0%) | 35 (5.9%) |
| 16 and 17 Years | 62 (5.0%) | 121 (8.6%) |
| 18 to 24 Years | 118 (3.6%) | 361 (13.3%) |
| 25 to 34 Years | 152 (3.2%) | 134 (2.9%) |
| 35 to 44 Years | 123 (2.0%) | 182 (3.1%) |
| 45 to 54 Years | 67 (1.2%) | 163 (3.4%) |
| 55 to 64 Years | 126 (3.3%) | 175 (4.3%) |
| 65 to 74 Years | 20 (0.9%) | 135 (5.4%) |
| 75 Years and over | 18 (1.6%) | 206 (12.0%) |
| Total | 934 (2.6%) | 1,637 (4.4%) |
Income Above Poverty by Sex and Age in Castle Rock
According to the poverty statistics in Castle Rock, males aged 15 years and females aged under 5 years are the age groups that are most secure financially, with 100.0% of males and 99.2% of females in these age groups living above the poverty line.
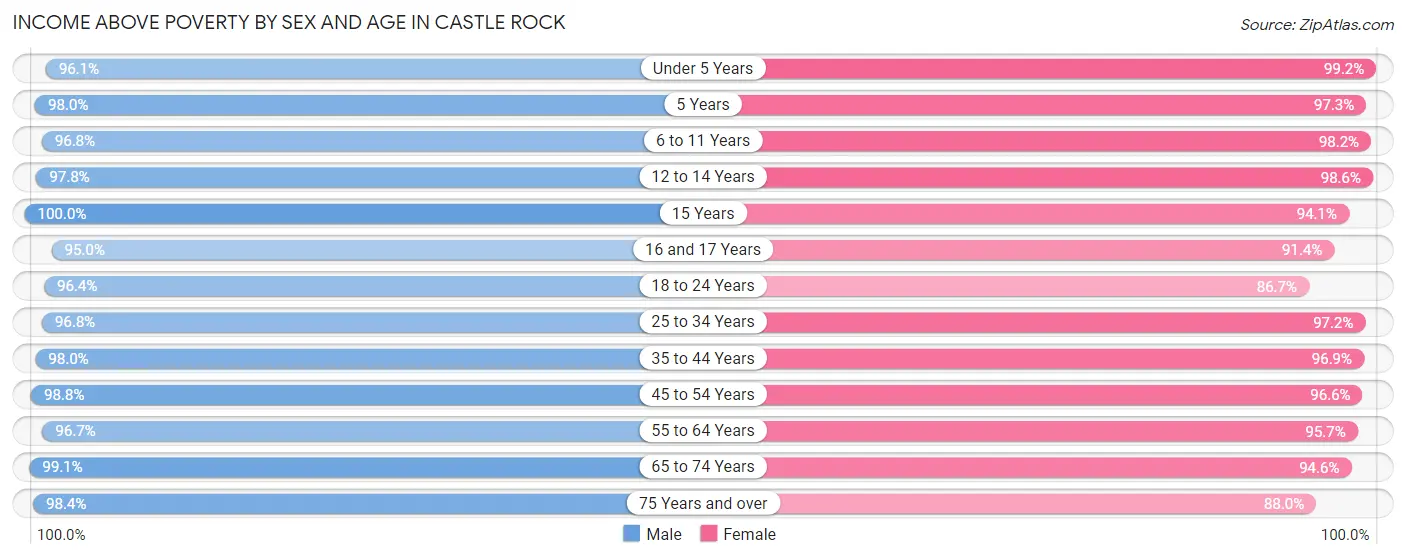
| Age Bracket | Male | Female |
| Under 5 Years | 2,316 (96.1%) | 2,858 (99.2%) |
| 5 Years | 499 (98.0%) | 396 (97.3%) |
| 6 to 11 Years | 3,289 (96.8%) | 3,669 (98.2%) |
| 12 to 14 Years | 1,509 (97.8%) | 1,575 (98.6%) |
| 15 Years | 332 (100.0%) | 558 (94.1%) |
| 16 and 17 Years | 1,176 (95.0%) | 1,283 (91.4%) |
| 18 to 24 Years | 3,148 (96.4%) | 2,349 (86.7%) |
| 25 to 34 Years | 4,563 (96.8%) | 4,563 (97.2%) |
| 35 to 44 Years | 5,986 (98.0%) | 5,683 (96.9%) |
| 45 to 54 Years | 5,486 (98.8%) | 4,670 (96.6%) |
| 55 to 64 Years | 3,682 (96.7%) | 3,915 (95.7%) |
| 65 to 74 Years | 2,233 (99.1%) | 2,341 (94.6%) |
| 75 Years and over | 1,115 (98.4%) | 1,513 (88.0%) |
| Total | 35,334 (97.4%) | 35,373 (95.6%) |
Income Below Poverty Among Married-Couple Families in Castle Rock
The poverty statistics for married-couple families in Castle Rock show that 0.8% or 132 of the total 17,082 families live below the poverty line. Families with 3 or 4 children have the highest poverty rate of 1.3%, comprising of 21 families. On the other hand, families with 5 or more children have the lowest poverty rate of 0.0%, which includes 0 families.
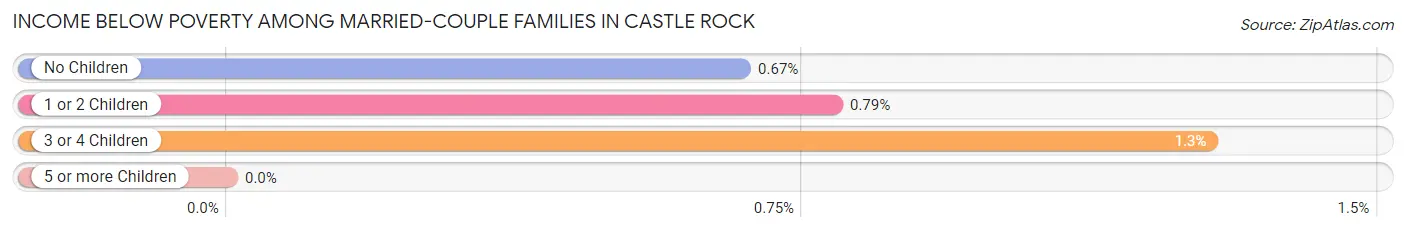
| Children | Above Poverty | Below Poverty |
| No Children | 7,844 (99.3%) | 53 (0.7%) |
| 1 or 2 Children | 7,277 (99.2%) | 58 (0.8%) |
| 3 or 4 Children | 1,624 (98.7%) | 21 (1.3%) |
| 5 or more Children | 205 (100.0%) | 0 (0.0%) |
| Total | 16,950 (99.2%) | 132 (0.8%) |
Income Below Poverty Among Single-Parent Households in Castle Rock
According to the poverty data in Castle Rock, 1.2% or 13 single-father households and 14.7% or 236 single-mother households are living below the poverty line. Among single-father households, those with 1 or 2 children have the highest poverty rate, with 9 households (1.7%) experiencing poverty. Likewise, among single-mother households, those with 3 or 4 children have the highest poverty rate, with 38 households (25.7%) falling below the poverty line.
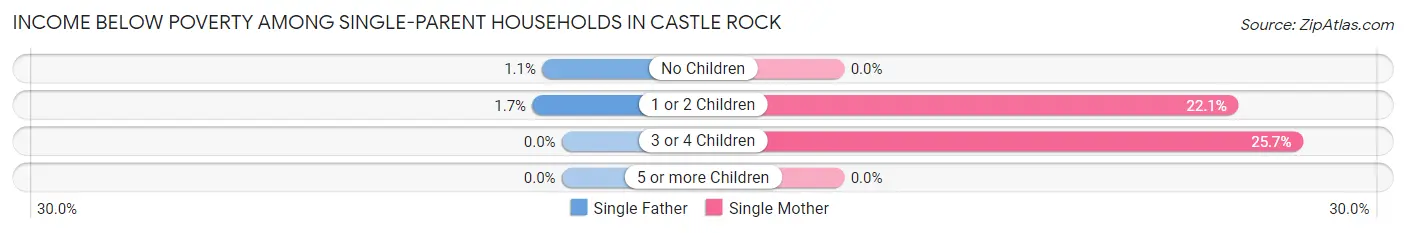
| Children | Single Father | Single Mother |
| No Children | 4 (1.1%) | 0 (0.0%) |
| 1 or 2 Children | 9 (1.7%) | 198 (22.1%) |
| 3 or 4 Children | 0 (0.0%) | 38 (25.7%) |
| 5 or more Children | 0 (0.0%) | 0 (0.0%) |
| Total | 13 (1.2%) | 236 (14.7%) |
Income Below Poverty Among Married-Couple vs Single-Parent Households in Castle Rock
The poverty data for Castle Rock shows that 132 of the married-couple family households (0.8%) and 249 of the single-parent households (9.3%) are living below the poverty level. Within the married-couple family households, those with 3 or 4 children have the highest poverty rate, with 21 households (1.3%) falling below the poverty line. Among the single-parent households, those with 1 or 2 children have the highest poverty rate, with 207 household (14.3%) living below poverty.
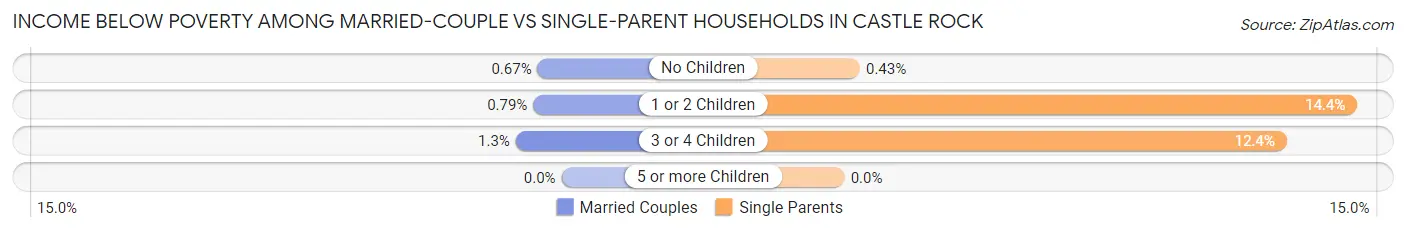
| Children | Married-Couple Families | Single-Parent Households |
| No Children | 53 (0.7%) | 4 (0.4%) |
| 1 or 2 Children | 58 (0.8%) | 207 (14.3%) |
| 3 or 4 Children | 21 (1.3%) | 38 (12.4%) |
| 5 or more Children | 0 (0.0%) | 0 (0.0%) |
| Total | 132 (0.8%) | 249 (9.3%) |
Race in Castle Rock
The most populous races in Castle Rock are White / Caucasian (64,639 | 87.3%), Hispanic or Latino (7,910 | 10.7%), and Two or more Races (5,168 | 7.0%).
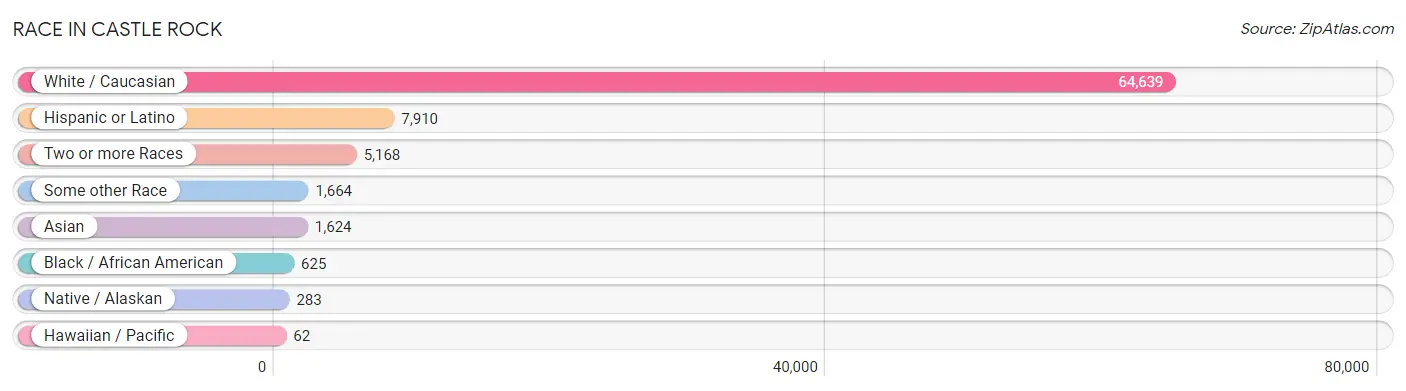
| Race | # Population | % Population |
| Asian | 1,624 | 2.2% |
| Black / African American | 625 | 0.8% |
| Hawaiian / Pacific | 62 | 0.1% |
| Hispanic or Latino | 7,910 | 10.7% |
| Native / Alaskan | 283 | 0.4% |
| White / Caucasian | 64,639 | 87.3% |
| Two or more Races | 5,168 | 7.0% |
| Some other Race | 1,664 | 2.2% |
| Total | 74,065 | 100.0% |
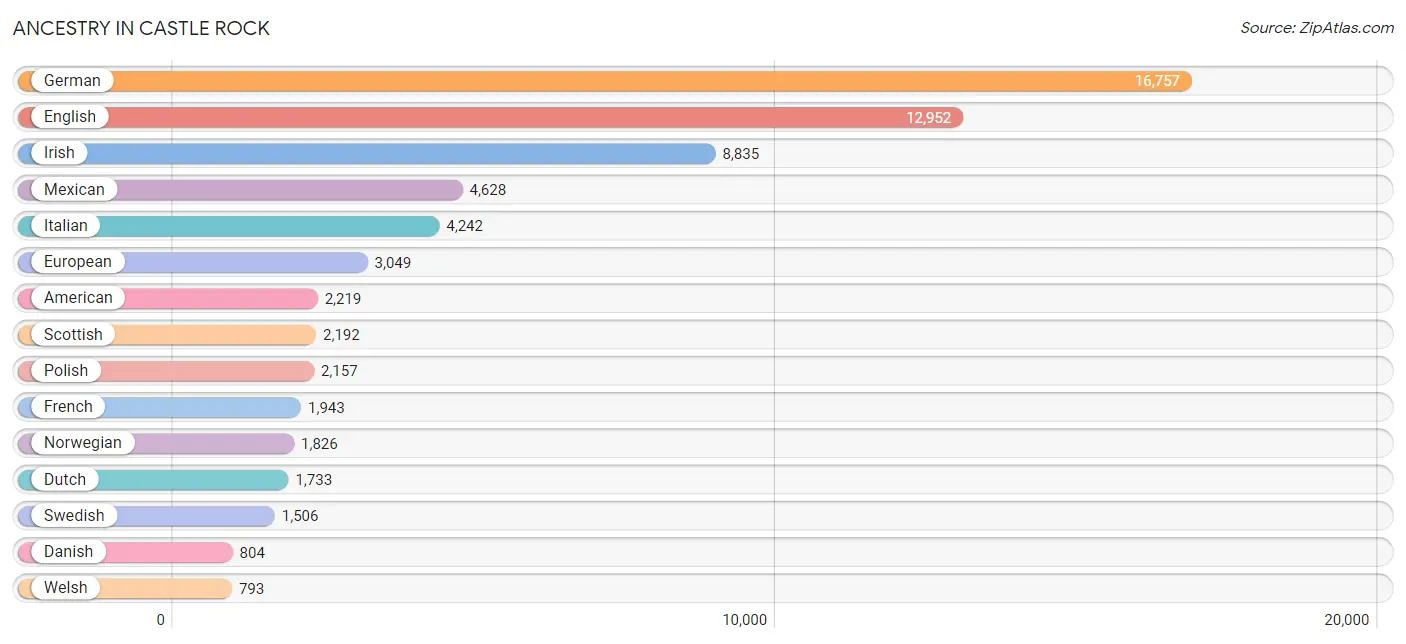
Ancestry in Castle Rock
The most populous ancestries reported in Castle Rock are German (16,757 | 22.6%), English (12,952 | 17.5%), Irish (8,835 | 11.9%), Mexican (4,628 | 6.2%), and Italian (4,242 | 5.7%), together accounting for 64.0% of all Castle Rock residents.
| Ancestry | # Population | % Population |
| African | 53 | 0.1% |
| American | 2,219 | 3.0% |
| Apache | 52 | 0.1% |
| Arab | 317 | 0.4% |
| Argentinean | 58 | 0.1% |
| Armenian | 23 | 0.0% |
| Austrian | 119 | 0.2% |
| Bangladeshi | 179 | 0.2% |
| Basque | 23 | 0.0% |
| Belgian | 105 | 0.1% |
| Bhutanese | 464 | 0.6% |
| Brazilian | 132 | 0.2% |
| British | 453 | 0.6% |
| Burmese | 332 | 0.4% |
| Cambodian | 37 | 0.1% |
| Canadian | 156 | 0.2% |
| Central American | 361 | 0.5% |
| Central American Indian | 20 | 0.0% |
| Cherokee | 199 | 0.3% |
| Chilean | 38 | 0.1% |
| Chippewa | 38 | 0.1% |
| Choctaw | 17 | 0.0% |
| Colombian | 317 | 0.4% |
| Costa Rican | 20 | 0.0% |
| Croatian | 25 | 0.0% |
| Cuban | 266 | 0.4% |
| Czech | 571 | 0.8% |
| Czechoslovakian | 51 | 0.1% |
| Danish | 804 | 1.1% |
| Dominican | 182 | 0.3% |
| Dutch | 1,733 | 2.3% |
| Dutch West Indian | 9 | 0.0% |
| Eastern European | 451 | 0.6% |
| Ecuadorian | 61 | 0.1% |
| Egyptian | 38 | 0.1% |
| English | 12,952 | 17.5% |
| European | 3,049 | 4.1% |
| Filipino | 5 | 0.0% |
| Finnish | 241 | 0.3% |
| French | 1,943 | 2.6% |
| French Canadian | 214 | 0.3% |
| German | 16,757 | 22.6% |
| Greek | 278 | 0.4% |
| Guatemalan | 154 | 0.2% |
| Hungarian | 255 | 0.3% |
| Indian (Asian) | 618 | 0.8% |
| Inupiat | 26 | 0.0% |
| Irish | 8,835 | 11.9% |
| Israeli | 100 | 0.1% |
| Italian | 4,242 | 5.7% |
| Jamaican | 21 | 0.0% |
| Korean | 397 | 0.5% |
| Laotian | 21 | 0.0% |
| Lebanese | 206 | 0.3% |
| Lithuanian | 161 | 0.2% |
| Malaysian | 40 | 0.1% |
| Mexican | 4,628 | 6.2% |
| Mongolian | 30 | 0.0% |
| Moroccan | 26 | 0.0% |
| Native Hawaiian | 91 | 0.1% |
| Navajo | 17 | 0.0% |
| Nicaraguan | 17 | 0.0% |
| Northern European | 463 | 0.6% |
| Norwegian | 1,826 | 2.5% |
| Osage | 8 | 0.0% |
| Ottawa | 24 | 0.0% |
| Pakistani | 8 | 0.0% |
| Panamanian | 37 | 0.1% |
| Pennsylvania German | 24 | 0.0% |
| Peruvian | 261 | 0.4% |
| Polish | 2,157 | 2.9% |
| Portuguese | 195 | 0.3% |
| Pueblo | 53 | 0.1% |
| Puerto Rican | 440 | 0.6% |
| Romanian | 64 | 0.1% |
| Russian | 628 | 0.9% |
| Salvadoran | 133 | 0.2% |
| Samoan | 20 | 0.0% |
| Scandinavian | 341 | 0.5% |
| Scotch-Irish | 615 | 0.8% |
| Scottish | 2,192 | 3.0% |
| Sioux | 119 | 0.2% |
| Slovak | 195 | 0.3% |
| Slovene | 53 | 0.1% |
| South American | 735 | 1.0% |
| South American Indian | 22 | 0.0% |
| Spaniard | 706 | 0.9% |
| Spanish | 350 | 0.5% |
| Spanish American | 65 | 0.1% |
| Sri Lankan | 79 | 0.1% |
| Subsaharan African | 53 | 0.1% |
| Swedish | 1,506 | 2.0% |
| Swiss | 440 | 0.6% |
| Syrian | 47 | 0.1% |
| Thai | 479 | 0.6% |
| Trinidadian and Tobagonian | 76 | 0.1% |
| Turkish | 33 | 0.0% |
| Ukrainian | 339 | 0.5% |
| Welsh | 793 | 1.1% |
| Yugoslavian | 88 | 0.1% | View All 100 Rows |
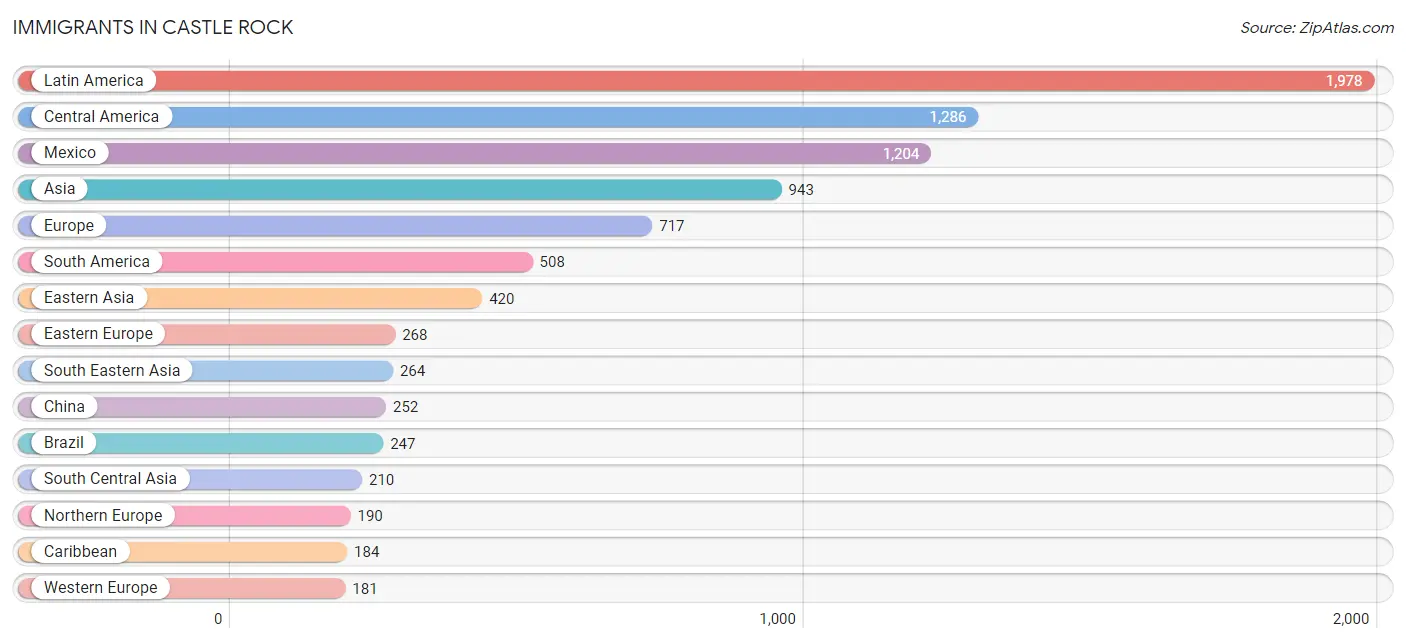
Immigrants in Castle Rock
The most numerous immigrant groups reported in Castle Rock came from Latin America (1,978 | 2.7%), Central America (1,286 | 1.7%), Mexico (1,204 | 1.6%), Asia (943 | 1.3%), and Europe (717 | 1.0%), together accounting for 8.3% of all Castle Rock residents.
| Immigration Origin | # Population | % Population |
| Africa | 118 | 0.2% |
| Argentina | 32 | 0.0% |
| Asia | 943 | 1.3% |
| Australia | 22 | 0.0% |
| Belgium | 24 | 0.0% |
| Bosnia and Herzegovina | 24 | 0.0% |
| Brazil | 247 | 0.3% |
| Canada | 110 | 0.2% |
| Caribbean | 184 | 0.3% |
| Central America | 1,286 | 1.7% |
| Chile | 7 | 0.0% |
| China | 252 | 0.3% |
| Colombia | 150 | 0.2% |
| Costa Rica | 11 | 0.0% |
| Croatia | 13 | 0.0% |
| Cuba | 47 | 0.1% |
| Dominican Republic | 61 | 0.1% |
| Eastern Asia | 420 | 0.6% |
| Eastern Europe | 268 | 0.4% |
| Ecuador | 42 | 0.1% |
| Egypt | 38 | 0.1% |
| El Salvador | 20 | 0.0% |
| England | 72 | 0.1% |
| Europe | 717 | 1.0% |
| France | 15 | 0.0% |
| Germany | 86 | 0.1% |
| Guatemala | 51 | 0.1% |
| Hong Kong | 36 | 0.1% |
| Hungary | 22 | 0.0% |
| India | 119 | 0.2% |
| Iran | 12 | 0.0% |
| Ireland | 32 | 0.0% |
| Israel | 26 | 0.0% |
| Italy | 19 | 0.0% |
| Japan | 28 | 0.0% |
| Kazakhstan | 16 | 0.0% |
| Korea | 122 | 0.2% |
| Laos | 72 | 0.1% |
| Latin America | 1,978 | 2.7% |
| Lebanon | 23 | 0.0% |
| Lithuania | 16 | 0.0% |
| Malaysia | 15 | 0.0% |
| Mexico | 1,204 | 1.6% |
| Netherlands | 56 | 0.1% |
| Nigeria | 35 | 0.1% |
| Northern Africa | 38 | 0.1% |
| Northern Europe | 190 | 0.3% |
| Oceania | 43 | 0.1% |
| Pakistan | 32 | 0.0% |
| Peru | 30 | 0.0% |
| Philippines | 139 | 0.2% |
| Poland | 49 | 0.1% |
| Romania | 26 | 0.0% |
| Russia | 104 | 0.1% |
| South America | 508 | 0.7% |
| South Central Asia | 210 | 0.3% |
| South Eastern Asia | 264 | 0.4% |
| Southern Europe | 78 | 0.1% |
| Spain | 59 | 0.1% |
| Sri Lanka | 19 | 0.0% |
| Taiwan | 13 | 0.0% |
| Thailand | 20 | 0.0% |
| Trinidad and Tobago | 76 | 0.1% |
| Ukraine | 14 | 0.0% |
| Uzbekistan | 12 | 0.0% |
| Vietnam | 18 | 0.0% |
| Western Africa | 35 | 0.1% |
| Western Asia | 49 | 0.1% |
| Western Europe | 181 | 0.2% | View All 69 Rows |
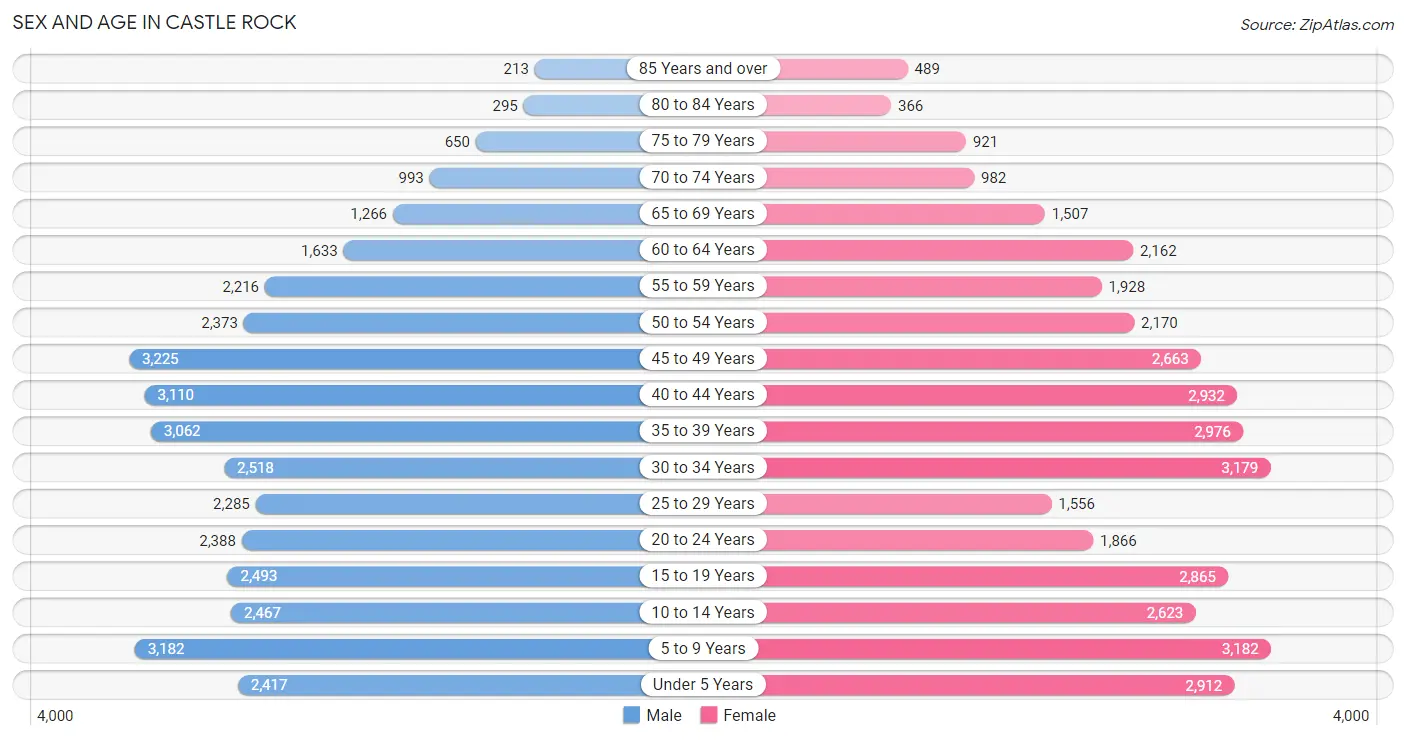
Sex and Age in Castle Rock
Sex and Age in Castle Rock
The most populous age groups in Castle Rock are 45 to 49 Years (3,225 | 8.8%) for men and 5 to 9 Years (3,182 | 8.5%) for women.
| Age Bracket | Male | Female |
| Under 5 Years | 2,417 (6.6%) | 2,912 (7.8%) |
| 5 to 9 Years | 3,182 (8.6%) | 3,182 (8.5%) |
| 10 to 14 Years | 2,467 (6.7%) | 2,623 (7.0%) |
| 15 to 19 Years | 2,493 (6.8%) | 2,865 (7.7%) |
| 20 to 24 Years | 2,388 (6.5%) | 1,866 (5.0%) |
| 25 to 29 Years | 2,285 (6.2%) | 1,556 (4.2%) |
| 30 to 34 Years | 2,518 (6.8%) | 3,179 (8.5%) |
| 35 to 39 Years | 3,062 (8.3%) | 2,976 (8.0%) |
| 40 to 44 Years | 3,110 (8.5%) | 2,932 (7.9%) |
| 45 to 49 Years | 3,225 (8.8%) | 2,663 (7.1%) |
| 50 to 54 Years | 2,373 (6.5%) | 2,170 (5.8%) |
| 55 to 59 Years | 2,216 (6.0%) | 1,928 (5.2%) |
| 60 to 64 Years | 1,633 (4.4%) | 2,162 (5.8%) |
| 65 to 69 Years | 1,266 (3.4%) | 1,507 (4.0%) |
| 70 to 74 Years | 993 (2.7%) | 982 (2.6%) |
| 75 to 79 Years | 650 (1.8%) | 921 (2.5%) |
| 80 to 84 Years | 295 (0.8%) | 366 (1.0%) |
| 85 Years and over | 213 (0.6%) | 489 (1.3%) |
| Total | 36,786 (100.0%) | 37,279 (100.0%) |
Families and Households in Castle Rock
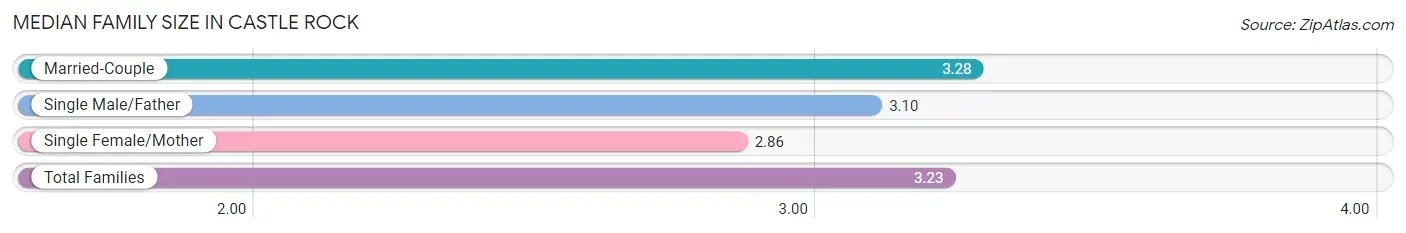
Median Family Size in Castle Rock
The median family size in Castle Rock is 3.23 persons per family, with married-couple families (17,082 | 86.5%) accounting for the largest median family size of 3.28 persons per family. On the other hand, single female/mother families (1,602 | 8.1%) represent the smallest median family size with 2.86 persons per family.
| Family Type | # Families | Family Size |
| Married-Couple | 17,082 (86.5%) | 3.28 |
| Single Male/Father | 1,069 (5.4%) | 3.10 |
| Single Female/Mother | 1,602 (8.1%) | 2.86 |
| Total Families | 19,753 (100.0%) | 3.23 |
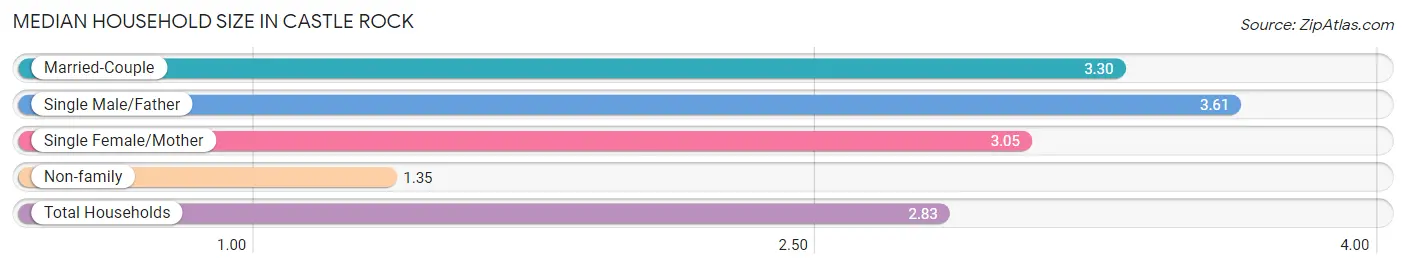
Median Household Size in Castle Rock
The median household size in Castle Rock is 2.83 persons per household, with single male/father households (1,069 | 4.1%) accounting for the largest median household size of 3.61 persons per household. non-family households (6,193 | 23.9%) represent the smallest median household size with 1.35 persons per household.
| Household Type | # Households | Household Size |
| Married-Couple | 17,082 (65.8%) | 3.30 |
| Single Male/Father | 1,069 (4.1%) | 3.61 |
| Single Female/Mother | 1,602 (6.2%) | 3.05 |
| Non-family | 6,193 (23.9%) | 1.35 |
| Total Households | 25,946 (100.0%) | 2.83 |
Household Size by Marriage Status in Castle Rock
Out of a total of 25,946 households in Castle Rock, 19,753 (76.1%) are family households, while 6,193 (23.9%) are nonfamily households. The most numerous type of family households are 2-person households, comprising 7,213, and the most common type of nonfamily households are 1-person households, comprising 4,710.
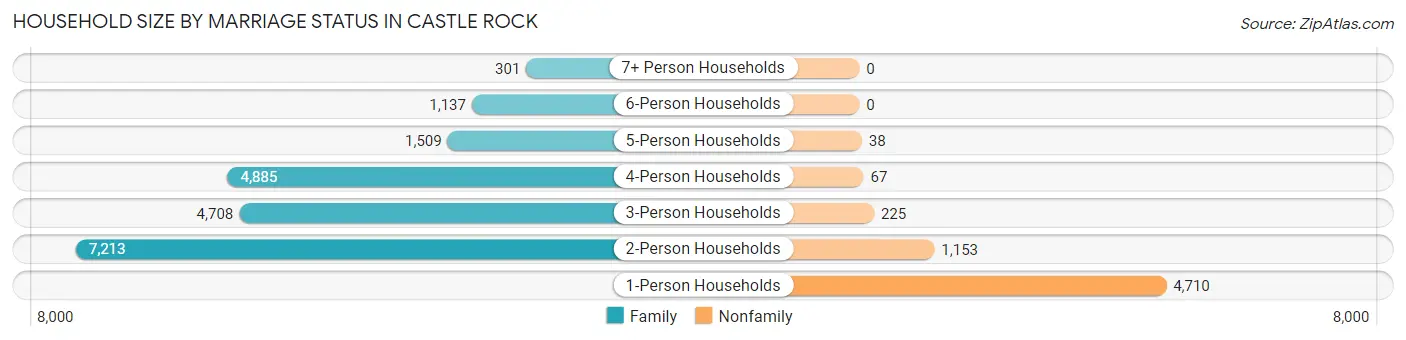
| Household Size | Family Households | Nonfamily Households |
| 1-Person Households | - | 4,710 (18.1%) |
| 2-Person Households | 7,213 (27.8%) | 1,153 (4.4%) |
| 3-Person Households | 4,708 (18.1%) | 225 (0.9%) |
| 4-Person Households | 4,885 (18.8%) | 67 (0.3%) |
| 5-Person Households | 1,509 (5.8%) | 38 (0.2%) |
| 6-Person Households | 1,137 (4.4%) | 0 (0.0%) |
| 7+ Person Households | 301 (1.2%) | 0 (0.0%) |
| Total | 19,753 (76.1%) | 6,193 (23.9%) |
Female Fertility in Castle Rock
Fertility by Age in Castle Rock
Average fertility rate in Castle Rock is 54.0 births per 1,000 women. Women in the age bracket of 20 to 34 years have the highest fertility rate with 79.0 births per 1,000 women. Women in the age bracket of 20 to 34 years acount for 52.3% of all women with births.
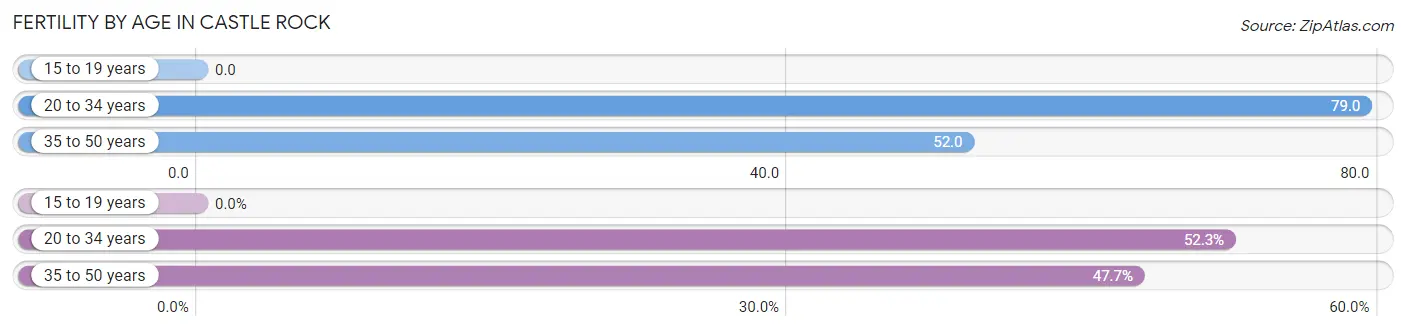
| Age Bracket | Women with Births | Births / 1,000 Women |
| 15 to 19 years | 0 (0.0%) | 0.0 |
| 20 to 34 years | 519 (52.3%) | 79.0 |
| 35 to 50 years | 473 (47.7%) | 52.0 |
| Total | 992 (100.0%) | 54.0 |
Fertility by Age by Marriage Status in Castle Rock
80.0% of women with births (992) in Castle Rock are married. The highest percentage of unmarried women with births falls into 35 to 50 years age bracket with 32.1% of them unmarried at the time of birth, while the lowest percentage of unmarried women with births belong to 20 to 34 years age bracket with 8.9% of them unmarried.
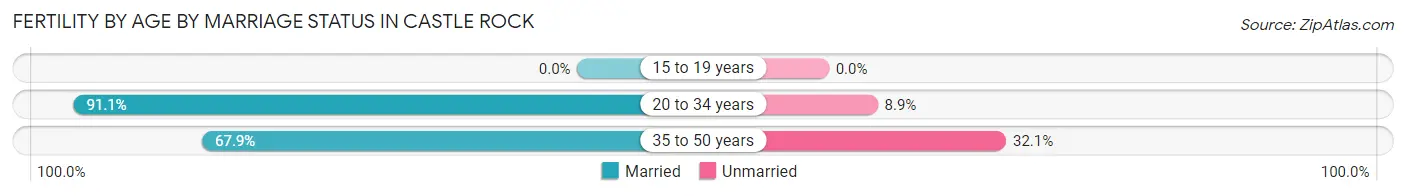
| Age Bracket | Married | Unmarried |
| 15 to 19 years | 0 (0.0%) | 0 (0.0%) |
| 20 to 34 years | 473 (91.1%) | 46 (8.9%) |
| 35 to 50 years | 321 (67.9%) | 152 (32.1%) |
| Total | 794 (80.0%) | 198 (20.0%) |
Fertility by Education in Castle Rock
Average fertility rate in Castle Rock is 54.0 births per 1,000 women. Women with the education attainment of graduate degree have the highest fertility rate of 94.0 births per 1,000 women, while women with the education attainment of less than high school have the lowest fertility at 7.0 births per 1,000 women. Women with the education attainment of bachelor's degree represent 43.8% of all women with births.
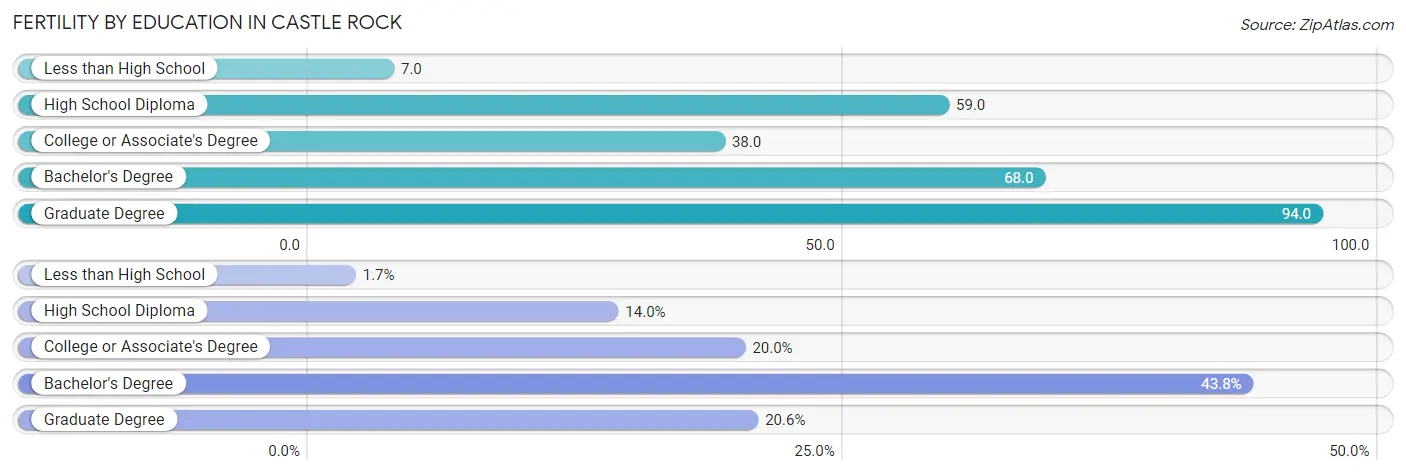
| Educational Attainment | Women with Births | Births / 1,000 Women |
| Less than High School | 17 (1.7%) | 7.0 |
| High School Diploma | 139 (14.0%) | 59.0 |
| College or Associate's Degree | 198 (20.0%) | 38.0 |
| Bachelor's Degree | 434 (43.8%) | 68.0 |
| Graduate Degree | 204 (20.6%) | 94.0 |
| Total | 992 (100.0%) | 54.0 |
Fertility by Education by Marriage Status in Castle Rock
20.0% of women with births in Castle Rock are unmarried. Women with the educational attainment of less than high school are most likely to be married with 100.0% of them married at childbirth, while women with the educational attainment of graduate degree are least likely to be married with 47.5% of them unmarried at childbirth.
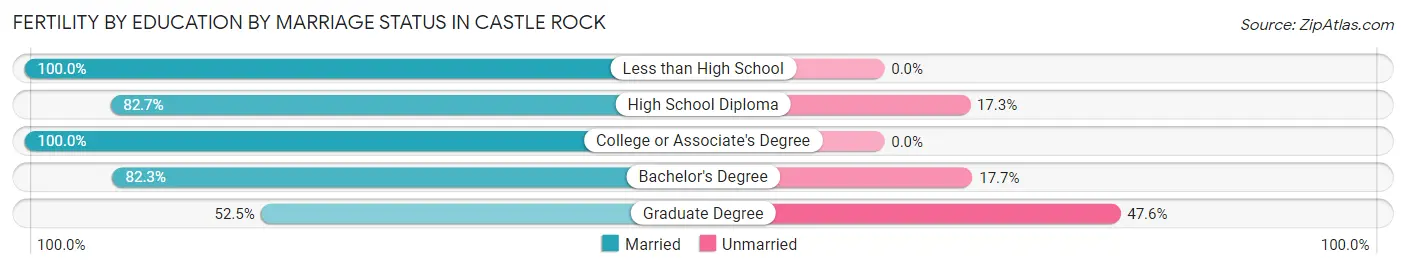
| Educational Attainment | Married | Unmarried |
| Less than High School | 17 (100.0%) | 0 (0.0%) |
| High School Diploma | 115 (82.7%) | 24 (17.3%) |
| College or Associate's Degree | 198 (100.0%) | 0 (0.0%) |
| Bachelor's Degree | 357 (82.3%) | 77 (17.7%) |
| Graduate Degree | 107 (52.4%) | 97 (47.5%) |
| Total | 794 (80.0%) | 198 (20.0%) |
Employment Characteristics in Castle Rock
Employment by Class of Employer in Castle Rock
Among the 39,146 employed individuals in Castle Rock, private company employees (26,990 | 69.0%), local government employees (3,126 | 8.0%), and not-for-profit organizations (2,684 | 6.9%) make up the most common classes of employment.
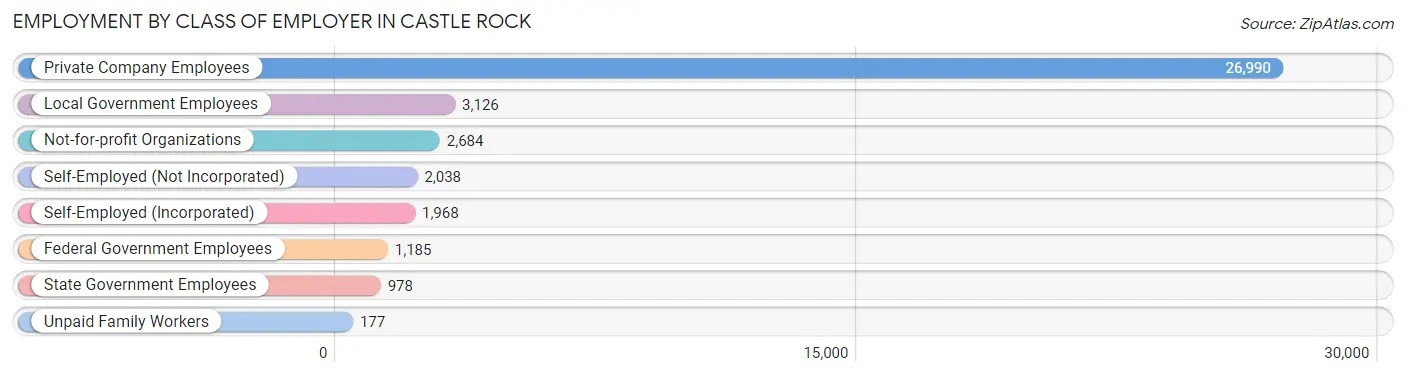
| Employer Class | # Employees | % Employees |
| Private Company Employees | 26,990 | 69.0% |
| Self-Employed (Incorporated) | 1,968 | 5.0% |
| Self-Employed (Not Incorporated) | 2,038 | 5.2% |
| Not-for-profit Organizations | 2,684 | 6.9% |
| Local Government Employees | 3,126 | 8.0% |
| State Government Employees | 978 | 2.5% |
| Federal Government Employees | 1,185 | 3.0% |
| Unpaid Family Workers | 177 | 0.4% |
| Total | 39,146 | 100.0% |
Employment Status by Age in Castle Rock
According to the labor force statistics for Castle Rock, out of the total population over 16 years of age (56,357), 73.5% or 41,422 individuals are in the labor force, with 4.2% or 1,740 of them unemployed. The age group with the highest labor force participation rate is 45 to 54 years, with 89.2% or 9,304 individuals in the labor force. Within the labor force, the 20 to 24 years age range has the highest percentage of unemployed individuals, with 13.6% or 499 of them being unemployed.
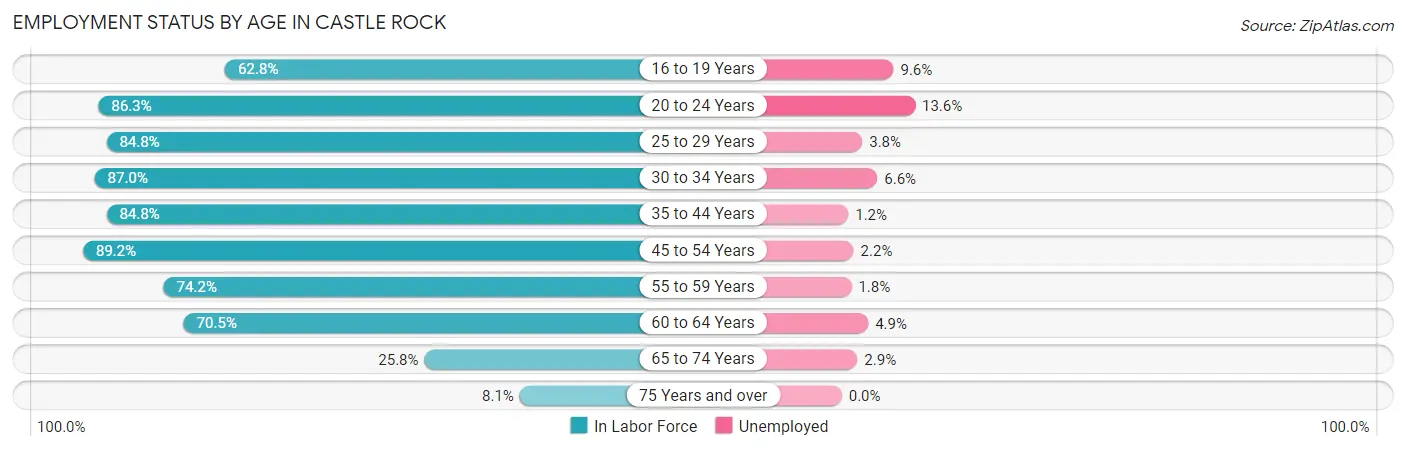
| Age Bracket | In Labor Force | Unemployed |
| 16 to 19 Years | 2,784 (62.8%) | 267 (9.6%) |
| 20 to 24 Years | 3,671 (86.3%) | 499 (13.6%) |
| 25 to 29 Years | 3,257 (84.8%) | 124 (3.8%) |
| 30 to 34 Years | 4,956 (87.0%) | 327 (6.6%) |
| 35 to 44 Years | 10,244 (84.8%) | 123 (1.2%) |
| 45 to 54 Years | 9,304 (89.2%) | 205 (2.2%) |
| 55 to 59 Years | 3,075 (74.2%) | 55 (1.8%) |
| 60 to 64 Years | 2,675 (70.5%) | 131 (4.9%) |
| 65 to 74 Years | 1,225 (25.8%) | 36 (2.9%) |
| 75 Years and over | 238 (8.1%) | 0 (0.0%) |
| Total | 41,422 (73.5%) | 1,740 (4.2%) |
Employment Status by Educational Attainment in Castle Rock
According to labor force statistics for Castle Rock, 83.8% of individuals (33,510) out of the total population between 25 and 64 years of age (39,988) are in the labor force, with 2.9% or 972 of them being unemployed. The group with the highest labor force participation rate are those with the educational attainment of bachelor's degree or higher, with 88.9% or 19,575 individuals in the labor force. Within the labor force, individuals with less than high school education have the highest percentage of unemployment, with 8.2% or 36 of them being unemployed.
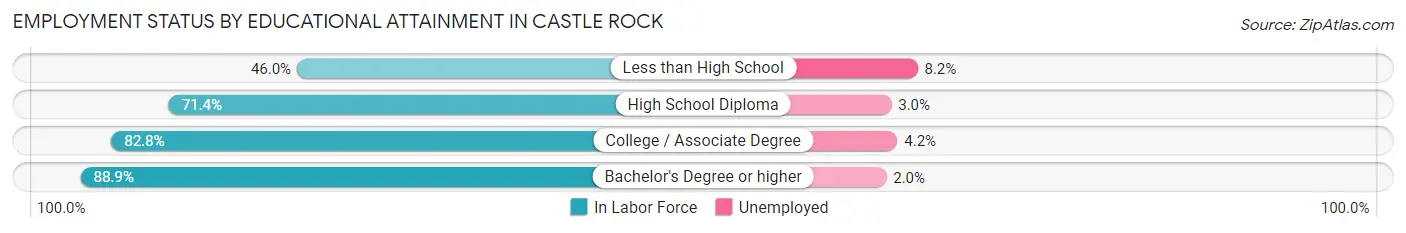
| Educational Attainment | In Labor Force | Unemployed |
| Less than High School | 440 (46.0%) | 78 (8.2%) |
| High School Diploma | 3,691 (71.4%) | 155 (3.0%) |
| College / Associate Degree | 9,806 (82.8%) | 497 (4.2%) |
| Bachelor's Degree or higher | 19,575 (88.9%) | 440 (2.0%) |
| Total | 33,510 (83.8%) | 1,160 (2.9%) |
Employment Occupations by Sex in Castle Rock
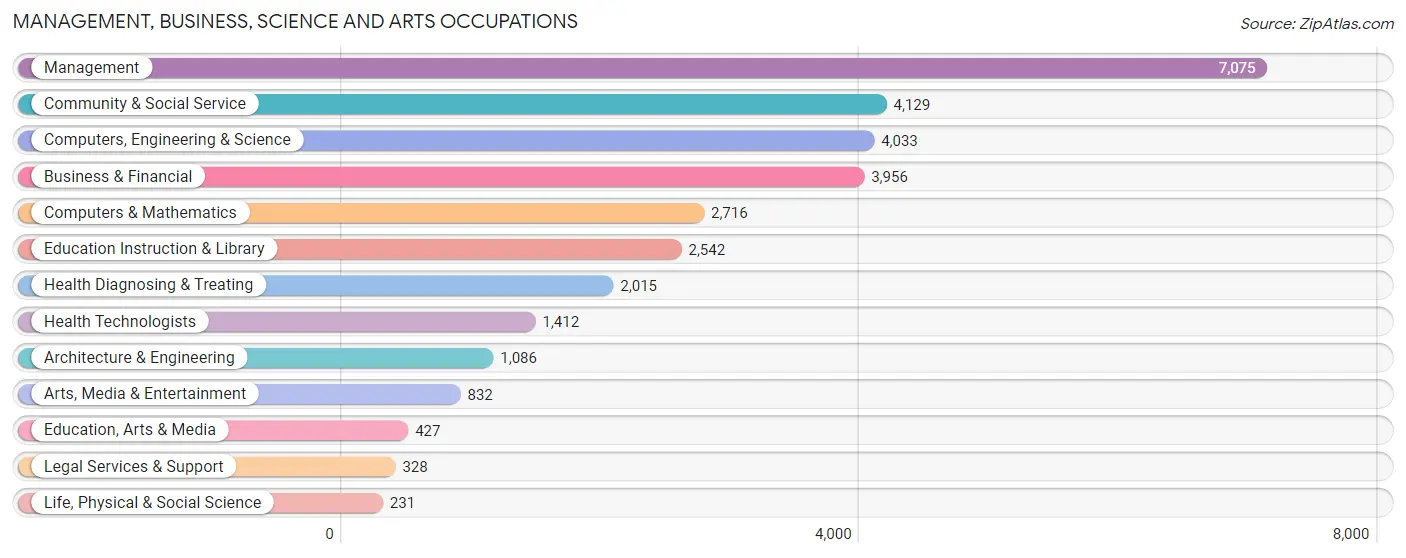
Management, Business, Science and Arts Occupations
The most common Management, Business, Science and Arts occupations in Castle Rock are Management (7,075 | 17.9%), Community & Social Service (4,129 | 10.4%), Computers, Engineering & Science (4,033 | 10.2%), Business & Financial (3,956 | 10.0%), and Computers & Mathematics (2,716 | 6.9%).
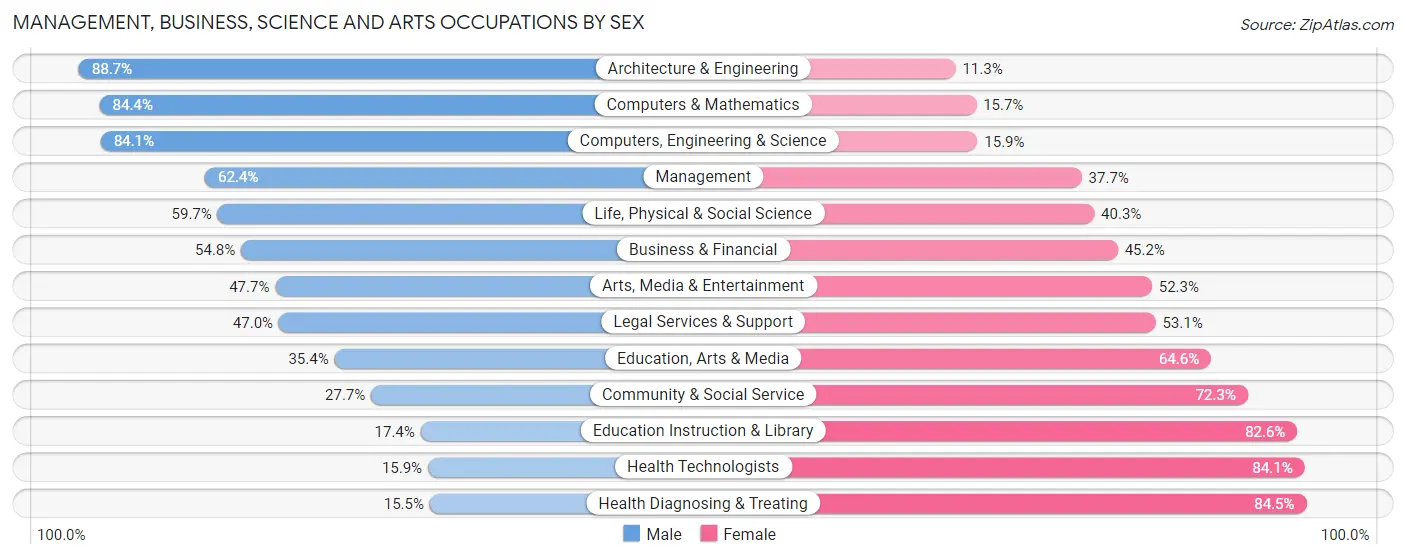
Management, Business, Science and Arts Occupations by Sex
Within the Management, Business, Science and Arts occupations in Castle Rock, the most male-oriented occupations are Architecture & Engineering (88.7%), Computers & Mathematics (84.4%), and Computers, Engineering & Science (84.1%), while the most female-oriented occupations are Health Diagnosing & Treating (84.5%), Health Technologists (84.1%), and Education Instruction & Library (82.6%).
| Occupation | Male | Female |
| Management | 4,411 (62.4%) | 2,664 (37.7%) |
| Business & Financial | 2,169 (54.8%) | 1,787 (45.2%) |
| Computers, Engineering & Science | 3,392 (84.1%) | 641 (15.9%) |
| Computers & Mathematics | 2,291 (84.4%) | 425 (15.7%) |
| Architecture & Engineering | 963 (88.7%) | 123 (11.3%) |
| Life, Physical & Social Science | 138 (59.7%) | 93 (40.3%) |
| Community & Social Service | 1,144 (27.7%) | 2,985 (72.3%) |
| Education, Arts & Media | 151 (35.4%) | 276 (64.6%) |
| Legal Services & Support | 154 (46.9%) | 174 (53.0%) |
| Education Instruction & Library | 442 (17.4%) | 2,100 (82.6%) |
| Arts, Media & Entertainment | 397 (47.7%) | 435 (52.3%) |
| Health Diagnosing & Treating | 312 (15.5%) | 1,703 (84.5%) |
| Health Technologists | 224 (15.9%) | 1,188 (84.1%) |
| Total (Category) | 11,428 (53.9%) | 9,780 (46.1%) |
| Total (Overall) | 21,302 (53.9%) | 18,200 (46.1%) |
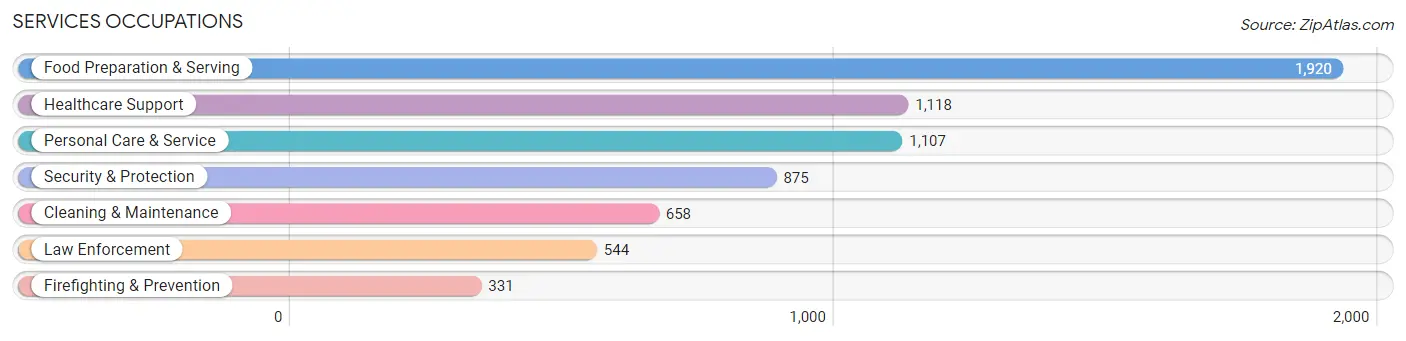
Services Occupations
The most common Services occupations in Castle Rock are Food Preparation & Serving (1,920 | 4.9%), Healthcare Support (1,118 | 2.8%), Personal Care & Service (1,107 | 2.8%), Security & Protection (875 | 2.2%), and Cleaning & Maintenance (658 | 1.7%).
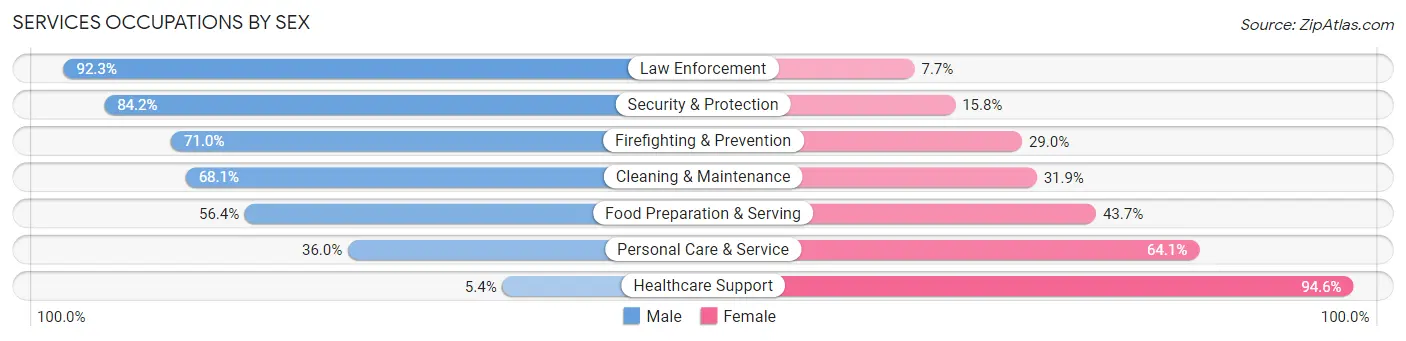
Services Occupations by Sex
Within the Services occupations in Castle Rock, the most male-oriented occupations are Law Enforcement (92.3%), Security & Protection (84.2%), and Firefighting & Prevention (71.0%), while the most female-oriented occupations are Healthcare Support (94.6%), Personal Care & Service (64.0%), and Food Preparation & Serving (43.6%).
| Occupation | Male | Female |
| Healthcare Support | 60 (5.4%) | 1,058 (94.6%) |
| Security & Protection | 737 (84.2%) | 138 (15.8%) |
| Firefighting & Prevention | 235 (71.0%) | 96 (29.0%) |
| Law Enforcement | 502 (92.3%) | 42 (7.7%) |
| Food Preparation & Serving | 1,082 (56.4%) | 838 (43.6%) |
| Cleaning & Maintenance | 448 (68.1%) | 210 (31.9%) |
| Personal Care & Service | 398 (35.9%) | 709 (64.0%) |
| Total (Category) | 2,725 (48.0%) | 2,953 (52.0%) |
| Total (Overall) | 21,302 (53.9%) | 18,200 (46.1%) |
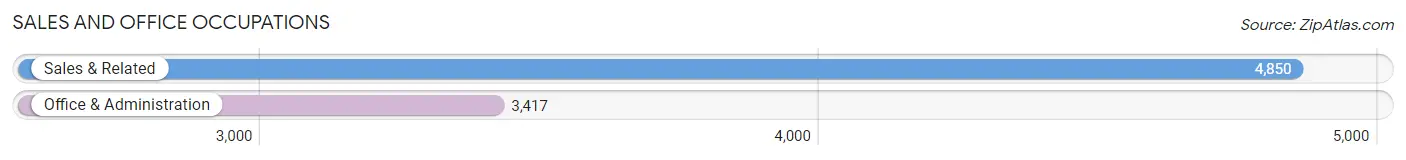
Sales and Office Occupations
The most common Sales and Office occupations in Castle Rock are Sales & Related (4,850 | 12.3%), and Office & Administration (3,417 | 8.6%).
Sales and Office Occupations by Sex
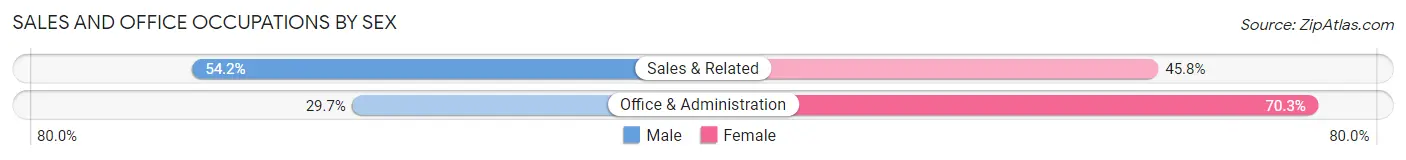
| Occupation | Male | Female |
| Sales & Related | 2,628 (54.2%) | 2,222 (45.8%) |
| Office & Administration | 1,014 (29.7%) | 2,403 (70.3%) |
| Total (Category) | 3,642 (44.1%) | 4,625 (55.9%) |
| Total (Overall) | 21,302 (53.9%) | 18,200 (46.1%) |
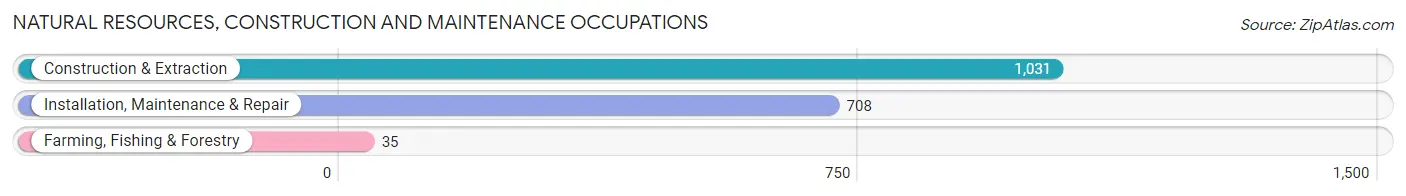
Natural Resources, Construction and Maintenance Occupations
The most common Natural Resources, Construction and Maintenance occupations in Castle Rock are Construction & Extraction (1,031 | 2.6%), Installation, Maintenance & Repair (708 | 1.8%), and Farming, Fishing & Forestry (35 | 0.1%).
Natural Resources, Construction and Maintenance Occupations by Sex
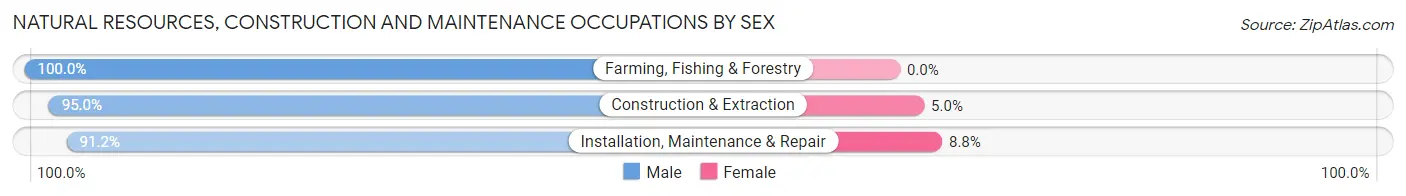
| Occupation | Male | Female |
| Farming, Fishing & Forestry | 35 (100.0%) | 0 (0.0%) |
| Construction & Extraction | 979 (95.0%) | 52 (5.0%) |
| Installation, Maintenance & Repair | 646 (91.2%) | 62 (8.8%) |
| Total (Category) | 1,660 (93.6%) | 114 (6.4%) |
| Total (Overall) | 21,302 (53.9%) | 18,200 (46.1%) |
Production, Transportation and Moving Occupations
The most common Production, Transportation and Moving occupations in Castle Rock are Transportation (874 | 2.2%), Production (859 | 2.2%), and Material Moving (842 | 2.1%).
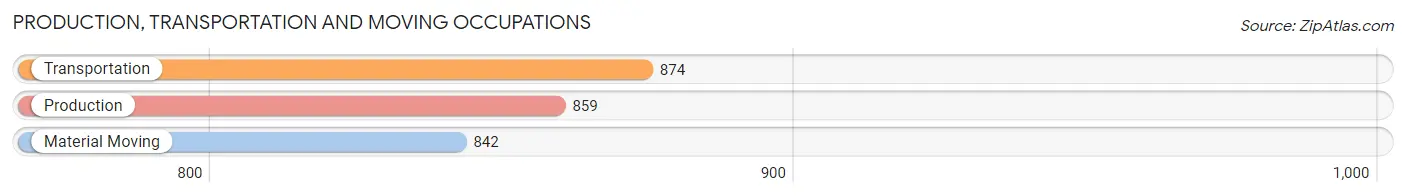
Production, Transportation and Moving Occupations by Sex
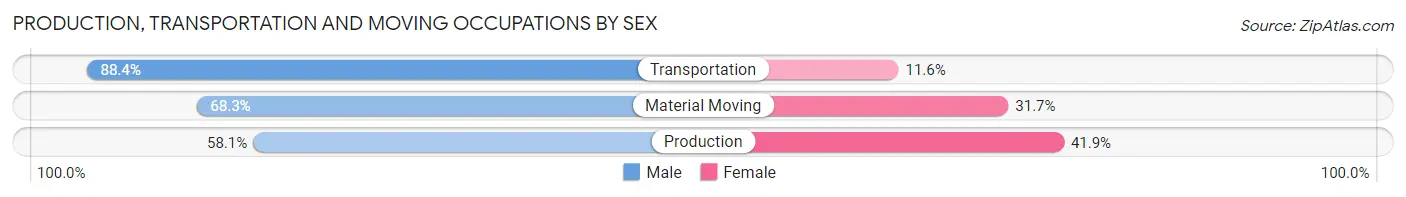
| Occupation | Male | Female |
| Production | 499 (58.1%) | 360 (41.9%) |
| Transportation | 773 (88.4%) | 101 (11.6%) |
| Material Moving | 575 (68.3%) | 267 (31.7%) |
| Total (Category) | 1,847 (71.7%) | 728 (28.3%) |
| Total (Overall) | 21,302 (53.9%) | 18,200 (46.1%) |
Employment Industries by Sex in Castle Rock
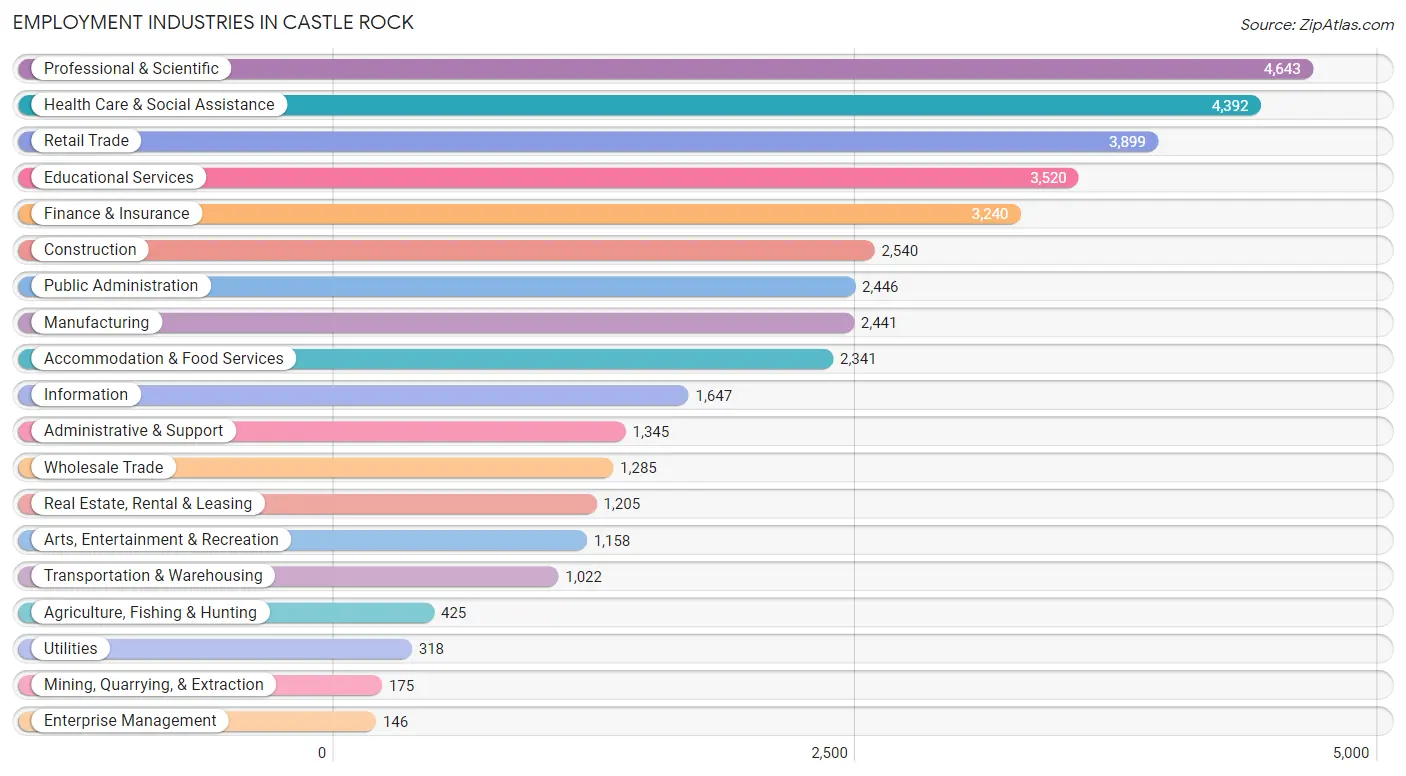
Employment Industries in Castle Rock
The major employment industries in Castle Rock include Professional & Scientific (4,643 | 11.7%), Health Care & Social Assistance (4,392 | 11.1%), Retail Trade (3,899 | 9.9%), Educational Services (3,520 | 8.9%), and Finance & Insurance (3,240 | 8.2%).
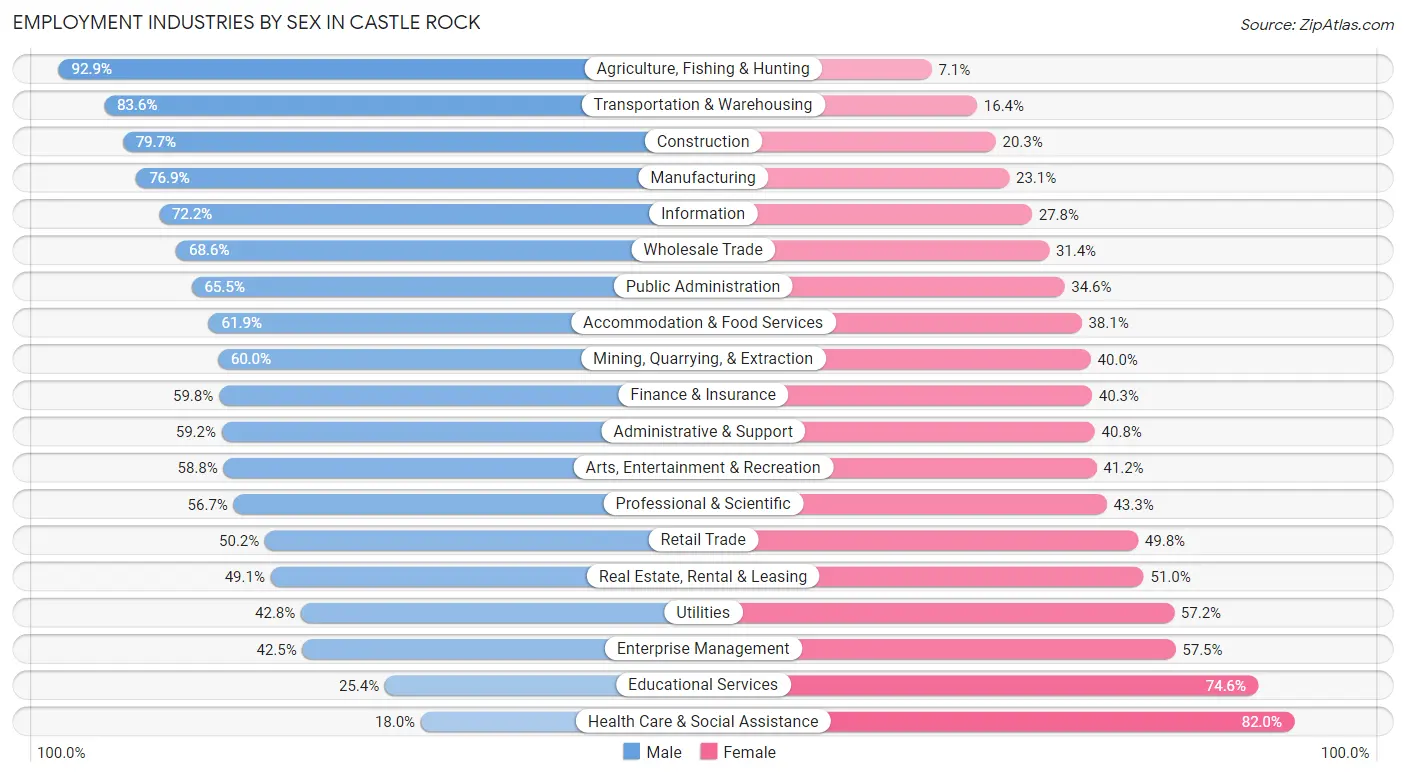
Employment Industries by Sex in Castle Rock
The Castle Rock industries that see more men than women are Agriculture, Fishing & Hunting (92.9%), Transportation & Warehousing (83.6%), and Construction (79.7%), whereas the industries that tend to have a higher number of women are Health Care & Social Assistance (82.0%), Educational Services (74.6%), and Enterprise Management (57.5%).
| Industry | Male | Female |
| Agriculture, Fishing & Hunting | 395 (92.9%) | 30 (7.1%) |
| Mining, Quarrying, & Extraction | 105 (60.0%) | 70 (40.0%) |
| Construction | 2,024 (79.7%) | 516 (20.3%) |
| Manufacturing | 1,877 (76.9%) | 564 (23.1%) |
| Wholesale Trade | 882 (68.6%) | 403 (31.4%) |
| Retail Trade | 1,958 (50.2%) | 1,941 (49.8%) |
| Transportation & Warehousing | 854 (83.6%) | 168 (16.4%) |
| Utilities | 136 (42.8%) | 182 (57.2%) |
| Information | 1,189 (72.2%) | 458 (27.8%) |
| Finance & Insurance | 1,936 (59.8%) | 1,304 (40.3%) |
| Real Estate, Rental & Leasing | 591 (49.0%) | 614 (50.9%) |
| Professional & Scientific | 2,634 (56.7%) | 2,009 (43.3%) |
| Enterprise Management | 62 (42.5%) | 84 (57.5%) |
| Administrative & Support | 796 (59.2%) | 549 (40.8%) |
| Educational Services | 894 (25.4%) | 2,626 (74.6%) |
| Health Care & Social Assistance | 789 (18.0%) | 3,603 (82.0%) |
| Arts, Entertainment & Recreation | 681 (58.8%) | 477 (41.2%) |
| Accommodation & Food Services | 1,449 (61.9%) | 892 (38.1%) |
| Public Administration | 1,601 (65.4%) | 845 (34.5%) |
| Total | 21,302 (53.9%) | 18,200 (46.1%) |
Education in Castle Rock
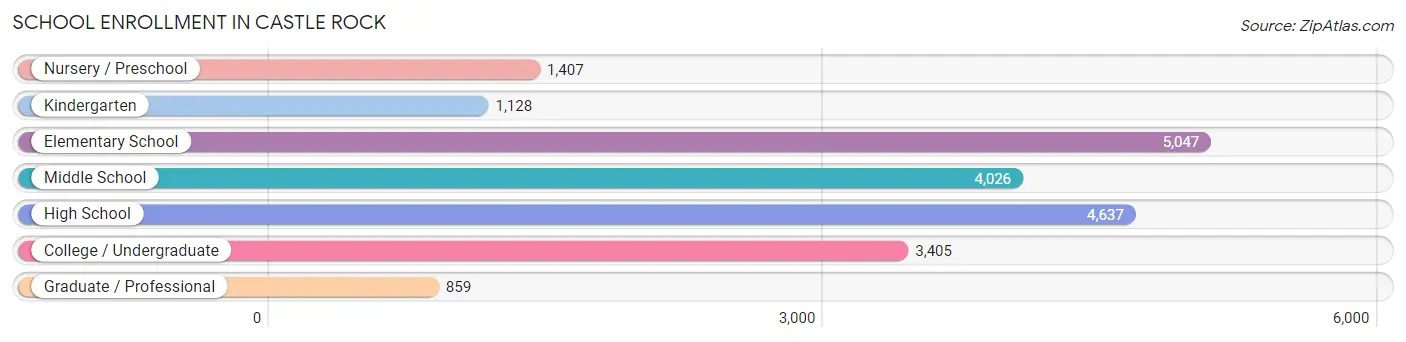
School Enrollment in Castle Rock
The most common levels of schooling among the 20,509 students in Castle Rock are elementary school (5,047 | 24.6%), high school (4,637 | 22.6%), and middle school (4,026 | 19.6%).
| School Level | # Students | % Students |
| Nursery / Preschool | 1,407 | 6.9% |
| Kindergarten | 1,128 | 5.5% |
| Elementary School | 5,047 | 24.6% |
| Middle School | 4,026 | 19.6% |
| High School | 4,637 | 22.6% |
| College / Undergraduate | 3,405 | 16.6% |
| Graduate / Professional | 859 | 4.2% |
| Total | 20,509 | 100.0% |
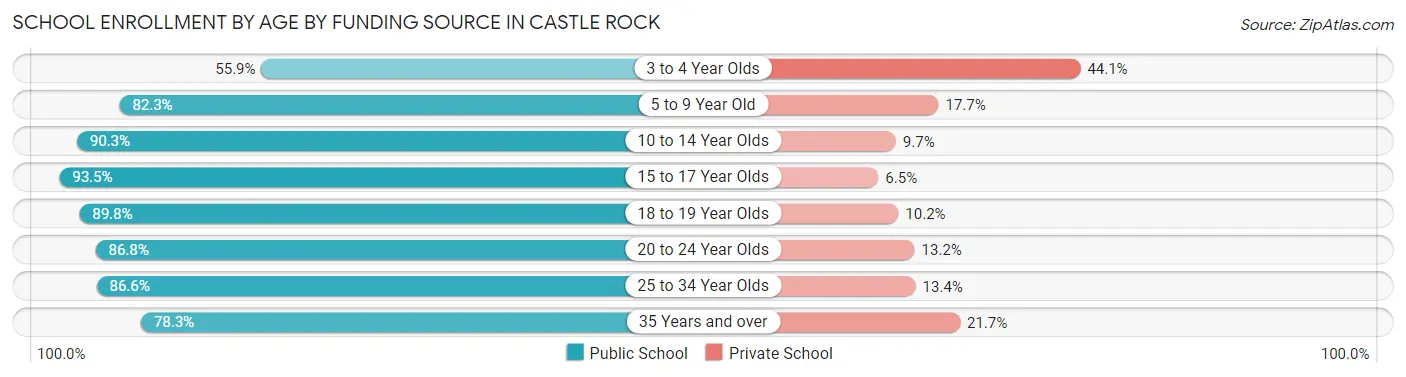
School Enrollment by Age by Funding Source in Castle Rock
Out of a total of 20,509 students who are enrolled in schools in Castle Rock, 2,994 (14.6%) attend a private institution, while the remaining 17,515 (85.4%) are enrolled in public schools. The age group of 3 to 4 year olds has the highest likelihood of being enrolled in private schools, with 534 (44.1% in the age bracket) enrolled. Conversely, the age group of 15 to 17 year olds has the lowest likelihood of being enrolled in a private school, with 3,251 (93.5% in the age bracket) attending a public institution.
| Age Bracket | Public School | Private School |
| 3 to 4 Year Olds | 677 (55.9%) | 534 (44.1%) |
| 5 to 9 Year Old | 4,947 (82.3%) | 1,062 (17.7%) |
| 10 to 14 Year Olds | 4,434 (90.3%) | 478 (9.7%) |
| 15 to 17 Year Olds | 3,251 (93.5%) | 225 (6.5%) |
| 18 to 19 Year Olds | 1,285 (89.8%) | 146 (10.2%) |
| 20 to 24 Year Olds | 1,385 (86.8%) | 211 (13.2%) |
| 25 to 34 Year Olds | 652 (86.6%) | 101 (13.4%) |
| 35 Years and over | 878 (78.3%) | 243 (21.7%) |
| Total | 17,515 (85.4%) | 2,994 (14.6%) |
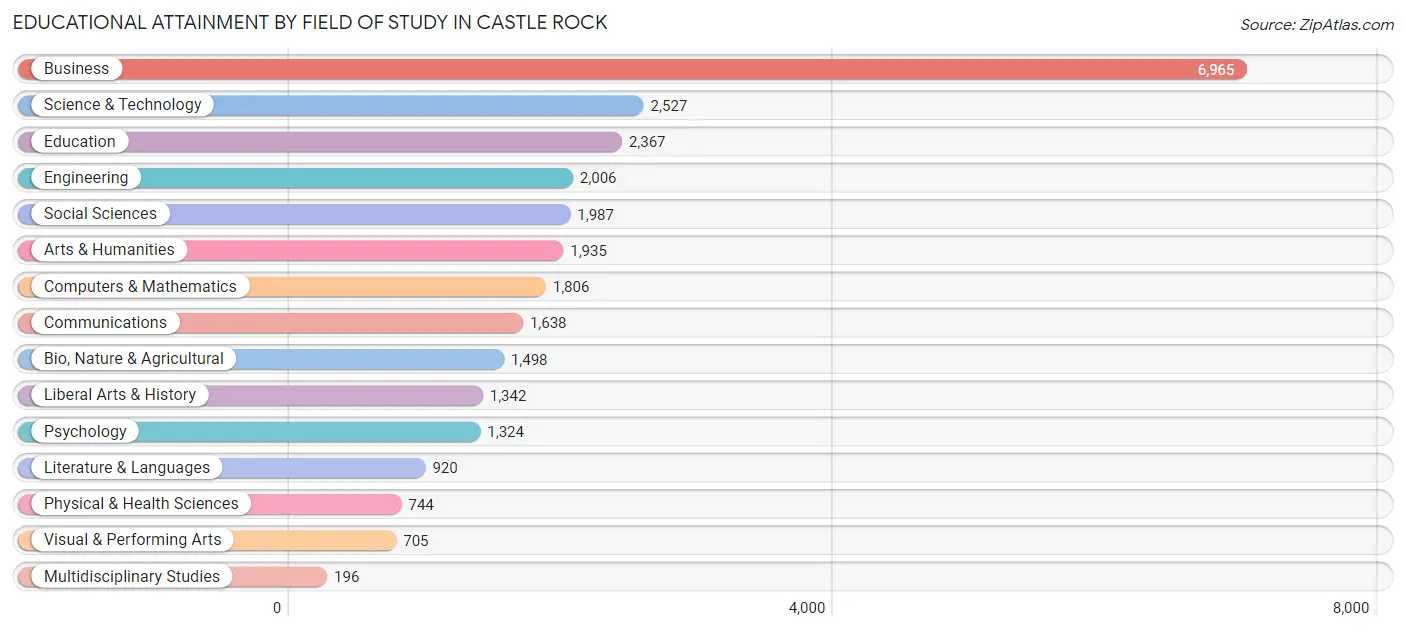
Educational Attainment by Field of Study in Castle Rock
Business (6,965 | 24.9%), science & technology (2,527 | 9.0%), education (2,367 | 8.5%), engineering (2,006 | 7.2%), and social sciences (1,987 | 7.1%) are the most common fields of study among 27,960 individuals in Castle Rock who have obtained a bachelor's degree or higher.
| Field of Study | # Graduates | % Graduates |
| Computers & Mathematics | 1,806 | 6.5% |
| Bio, Nature & Agricultural | 1,498 | 5.4% |
| Physical & Health Sciences | 744 | 2.7% |
| Psychology | 1,324 | 4.7% |
| Social Sciences | 1,987 | 7.1% |
| Engineering | 2,006 | 7.2% |
| Multidisciplinary Studies | 196 | 0.7% |
| Science & Technology | 2,527 | 9.0% |
| Business | 6,965 | 24.9% |
| Education | 2,367 | 8.5% |
| Literature & Languages | 920 | 3.3% |
| Liberal Arts & History | 1,342 | 4.8% |
| Visual & Performing Arts | 705 | 2.5% |
| Communications | 1,638 | 5.9% |
| Arts & Humanities | 1,935 | 6.9% |
| Total | 27,960 | 100.0% |
Transportation & Commute in Castle Rock
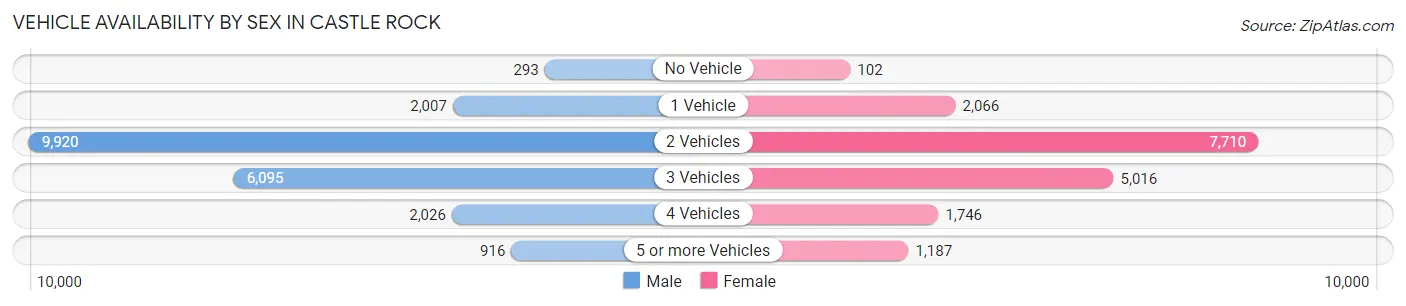
Vehicle Availability by Sex in Castle Rock
The most prevalent vehicle ownership categories in Castle Rock are males with 2 vehicles (9,920, accounting for 46.7%) and females with 2 vehicles (7,710, making up 55.6%).
| Vehicles Available | Male | Female |
| No Vehicle | 293 (1.4%) | 102 (0.6%) |
| 1 Vehicle | 2,007 (9.4%) | 2,066 (11.6%) |
| 2 Vehicles | 9,920 (46.7%) | 7,710 (43.2%) |
| 3 Vehicles | 6,095 (28.7%) | 5,016 (28.1%) |
| 4 Vehicles | 2,026 (9.5%) | 1,746 (9.8%) |
| 5 or more Vehicles | 916 (4.3%) | 1,187 (6.7%) |
| Total | 21,257 (100.0%) | 17,827 (100.0%) |
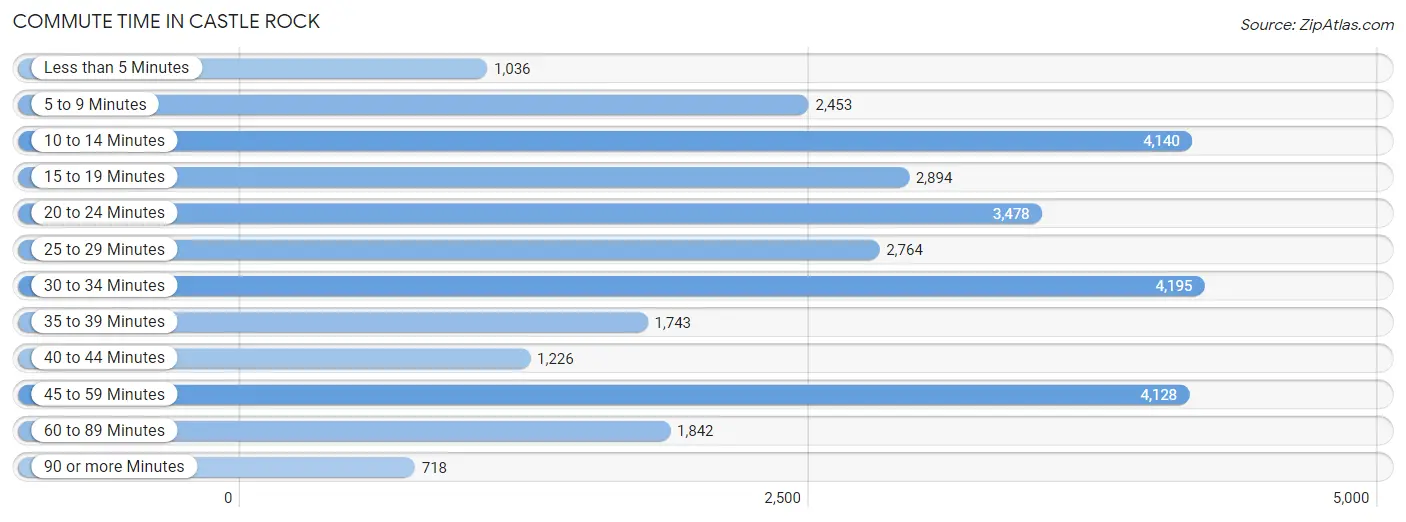
Commute Time in Castle Rock
The most frequently occuring commute durations in Castle Rock are 30 to 34 minutes (4,195 commuters, 13.7%), 10 to 14 minutes (4,140 commuters, 13.5%), and 45 to 59 minutes (4,128 commuters, 13.5%).
| Commute Time | # Commuters | % Commuters |
| Less than 5 Minutes | 1,036 | 3.4% |
| 5 to 9 Minutes | 2,453 | 8.0% |
| 10 to 14 Minutes | 4,140 | 13.5% |
| 15 to 19 Minutes | 2,894 | 9.5% |
| 20 to 24 Minutes | 3,478 | 11.4% |
| 25 to 29 Minutes | 2,764 | 9.0% |
| 30 to 34 Minutes | 4,195 | 13.7% |
| 35 to 39 Minutes | 1,743 | 5.7% |
| 40 to 44 Minutes | 1,226 | 4.0% |
| 45 to 59 Minutes | 4,128 | 13.5% |
| 60 to 89 Minutes | 1,842 | 6.0% |
| 90 or more Minutes | 718 | 2.4% |
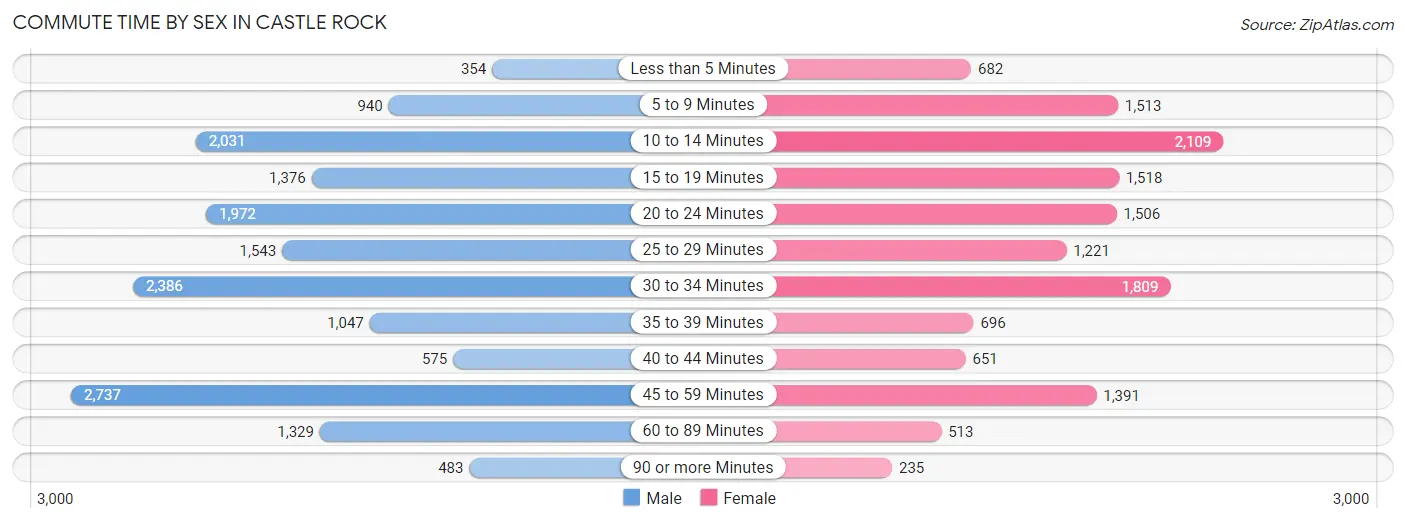
Commute Time by Sex in Castle Rock
The most common commute times in Castle Rock are 45 to 59 minutes (2,737 commuters, 16.3%) for males and 10 to 14 minutes (2,109 commuters, 15.2%) for females.
| Commute Time | Male | Female |
| Less than 5 Minutes | 354 (2.1%) | 682 (4.9%) |
| 5 to 9 Minutes | 940 (5.6%) | 1,513 (10.9%) |
| 10 to 14 Minutes | 2,031 (12.1%) | 2,109 (15.2%) |
| 15 to 19 Minutes | 1,376 (8.2%) | 1,518 (11.0%) |
| 20 to 24 Minutes | 1,972 (11.8%) | 1,506 (10.9%) |
| 25 to 29 Minutes | 1,543 (9.2%) | 1,221 (8.8%) |
| 30 to 34 Minutes | 2,386 (14.2%) | 1,809 (13.1%) |
| 35 to 39 Minutes | 1,047 (6.2%) | 696 (5.0%) |
| 40 to 44 Minutes | 575 (3.4%) | 651 (4.7%) |
| 45 to 59 Minutes | 2,737 (16.3%) | 1,391 (10.1%) |
| 60 to 89 Minutes | 1,329 (7.9%) | 513 (3.7%) |
| 90 or more Minutes | 483 (2.9%) | 235 (1.7%) |
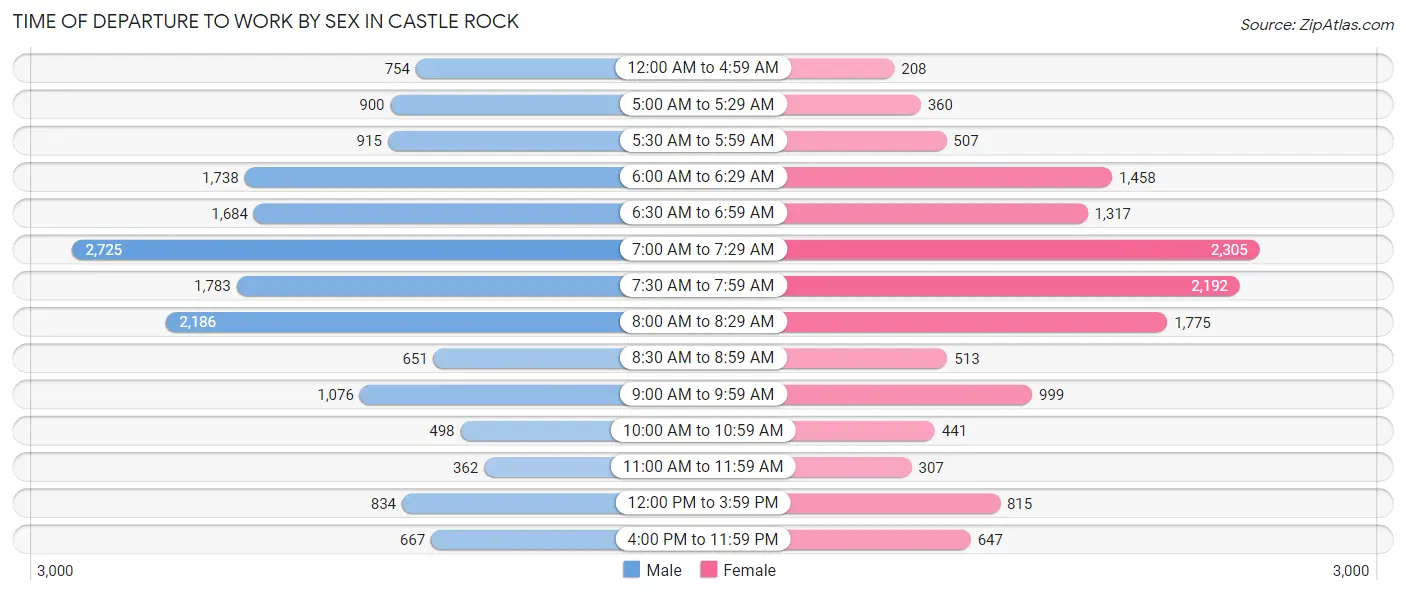
Time of Departure to Work by Sex in Castle Rock
The most frequent times of departure to work in Castle Rock are 7:00 AM to 7:29 AM (2,725, 16.3%) for males and 7:00 AM to 7:29 AM (2,305, 16.7%) for females.
| Time of Departure | Male | Female |
| 12:00 AM to 4:59 AM | 754 (4.5%) | 208 (1.5%) |
| 5:00 AM to 5:29 AM | 900 (5.4%) | 360 (2.6%) |
| 5:30 AM to 5:59 AM | 915 (5.5%) | 507 (3.7%) |
| 6:00 AM to 6:29 AM | 1,738 (10.4%) | 1,458 (10.5%) |
| 6:30 AM to 6:59 AM | 1,684 (10.0%) | 1,317 (9.5%) |
| 7:00 AM to 7:29 AM | 2,725 (16.3%) | 2,305 (16.7%) |
| 7:30 AM to 7:59 AM | 1,783 (10.6%) | 2,192 (15.8%) |
| 8:00 AM to 8:29 AM | 2,186 (13.0%) | 1,775 (12.8%) |
| 8:30 AM to 8:59 AM | 651 (3.9%) | 513 (3.7%) |
| 9:00 AM to 9:59 AM | 1,076 (6.4%) | 999 (7.2%) |
| 10:00 AM to 10:59 AM | 498 (3.0%) | 441 (3.2%) |
| 11:00 AM to 11:59 AM | 362 (2.2%) | 307 (2.2%) |
| 12:00 PM to 3:59 PM | 834 (5.0%) | 815 (5.9%) |
| 4:00 PM to 11:59 PM | 667 (4.0%) | 647 (4.7%) |
| Total | 16,773 (100.0%) | 13,844 (100.0%) |
Housing Occupancy in Castle Rock
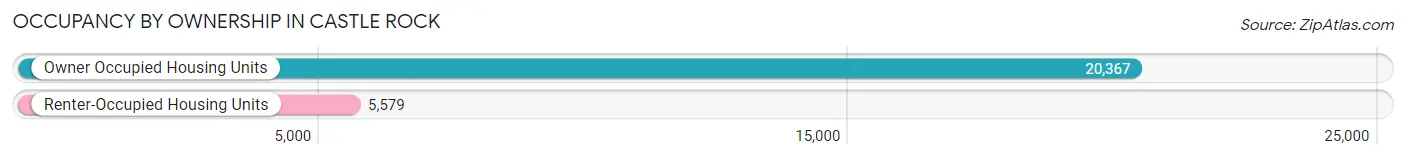
Occupancy by Ownership in Castle Rock
Of the total 25,946 dwellings in Castle Rock, owner-occupied units account for 20,367 (78.5%), while renter-occupied units make up 5,579 (21.5%).
| Occupancy | # Housing Units | % Housing Units |
| Owner Occupied Housing Units | 20,367 | 78.5% |
| Renter-Occupied Housing Units | 5,579 | 21.5% |
| Total Occupied Housing Units | 25,946 | 100.0% |
Occupancy by Household Size in Castle Rock
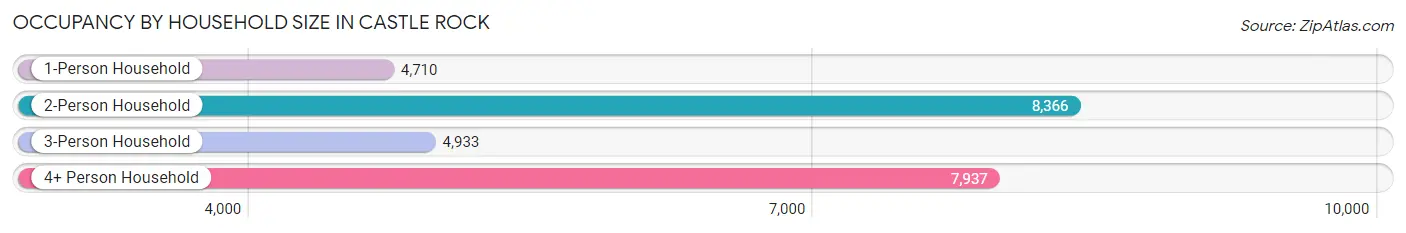
| Household Size | # Housing Units | % Housing Units |
| 1-Person Household | 4,710 | 18.1% |
| 2-Person Household | 8,366 | 32.2% |
| 3-Person Household | 4,933 | 19.0% |
| 4+ Person Household | 7,937 | 30.6% |
| Total Housing Units | 25,946 | 100.0% |
Occupancy by Ownership by Household Size in Castle Rock
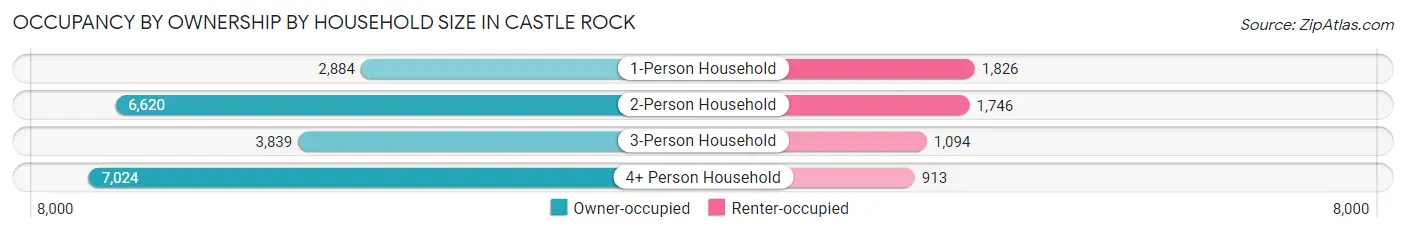
| Household Size | Owner-occupied | Renter-occupied |
| 1-Person Household | 2,884 (61.2%) | 1,826 (38.8%) |
| 2-Person Household | 6,620 (79.1%) | 1,746 (20.9%) |
| 3-Person Household | 3,839 (77.8%) | 1,094 (22.2%) |
| 4+ Person Household | 7,024 (88.5%) | 913 (11.5%) |
| Total Housing Units | 20,367 (78.5%) | 5,579 (21.5%) |
Occupancy by Educational Attainment in Castle Rock
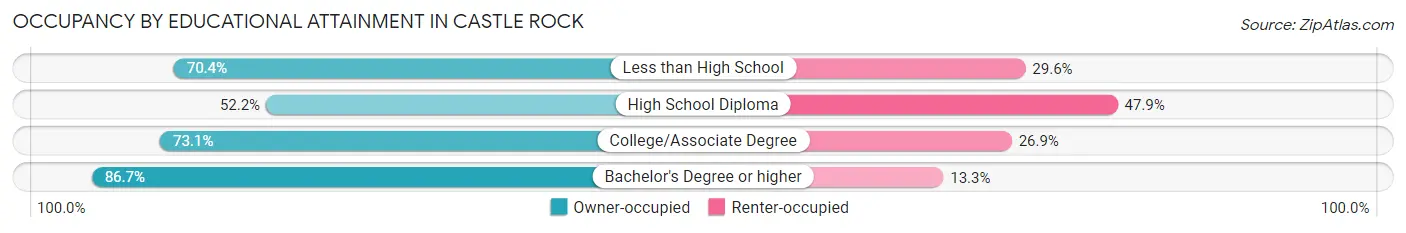
| Household Size | Owner-occupied | Renter-occupied |
| Less than High School | 364 (70.4%) | 153 (29.6%) |
| High School Diploma | 1,467 (52.1%) | 1,346 (47.8%) |
| College/Associate Degree | 5,766 (73.1%) | 2,119 (26.9%) |
| Bachelor's Degree or higher | 12,770 (86.7%) | 1,961 (13.3%) |
Occupancy by Age of Householder in Castle Rock
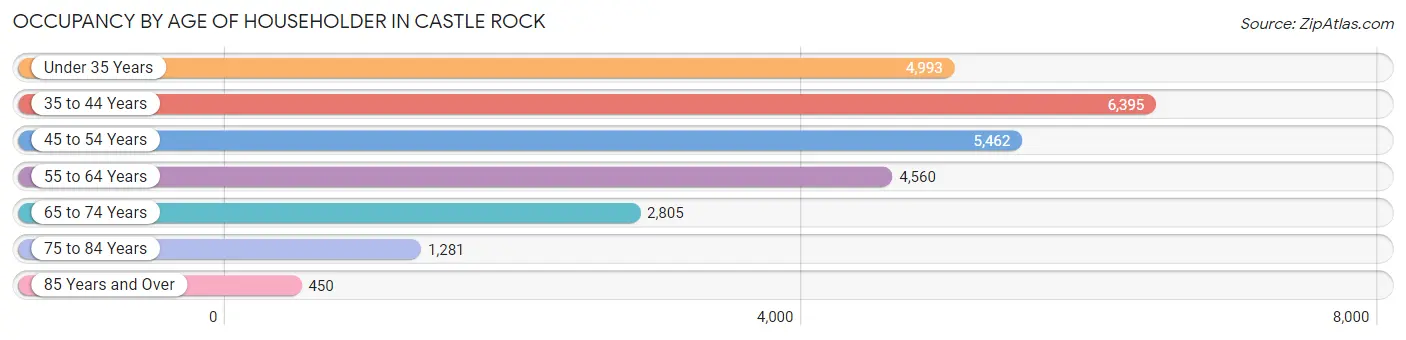
| Age Bracket | # Households | % Households |
| Under 35 Years | 4,993 | 19.2% |
| 35 to 44 Years | 6,395 | 24.6% |
| 45 to 54 Years | 5,462 | 21.0% |
| 55 to 64 Years | 4,560 | 17.6% |
| 65 to 74 Years | 2,805 | 10.8% |
| 75 to 84 Years | 1,281 | 4.9% |
| 85 Years and Over | 450 | 1.7% |
| Total | 25,946 | 100.0% |
Housing Finances in Castle Rock
Median Income by Occupancy in Castle Rock
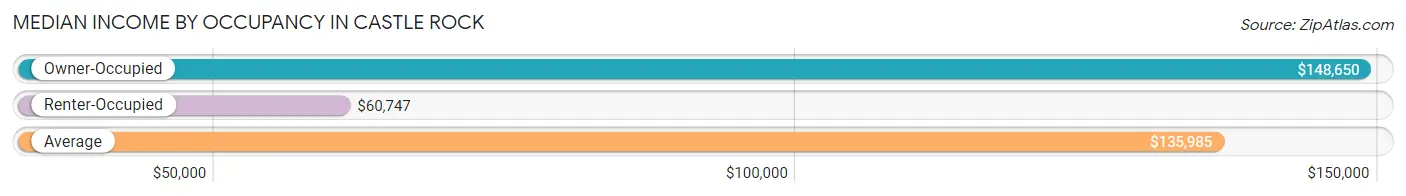
| Occupancy Type | # Households | Median Income |
| Owner-Occupied | 20,367 (78.5%) | $148,650 |
| Renter-Occupied | 5,579 (21.5%) | $60,747 |
| Average | 25,946 (100.0%) | $135,985 |
Occupancy by Householder Income Bracket in Castle Rock
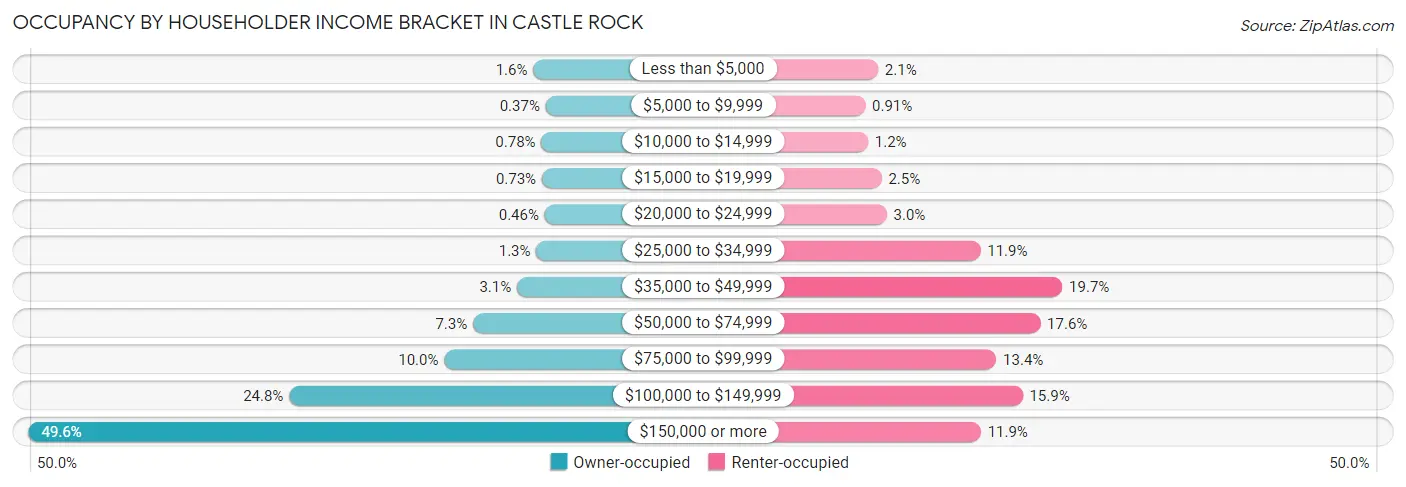
| Income Bracket | Owner-occupied | Renter-occupied |
| Less than $5,000 | 315 (1.5%) | 119 (2.1%) |
| $5,000 to $9,999 | 75 (0.4%) | 51 (0.9%) |
| $10,000 to $14,999 | 158 (0.8%) | 65 (1.2%) |
| $15,000 to $19,999 | 148 (0.7%) | 138 (2.5%) |
| $20,000 to $24,999 | 94 (0.5%) | 165 (3.0%) |
| $25,000 to $34,999 | 257 (1.3%) | 663 (11.9%) |
| $35,000 to $49,999 | 632 (3.1%) | 1,098 (19.7%) |
| $50,000 to $74,999 | 1,485 (7.3%) | 981 (17.6%) |
| $75,000 to $99,999 | 2,042 (10.0%) | 747 (13.4%) |
| $100,000 to $149,999 | 5,052 (24.8%) | 887 (15.9%) |
| $150,000 or more | 10,109 (49.6%) | 665 (11.9%) |
| Total | 20,367 (100.0%) | 5,579 (100.0%) |
Monthly Housing Cost Tiers in Castle Rock
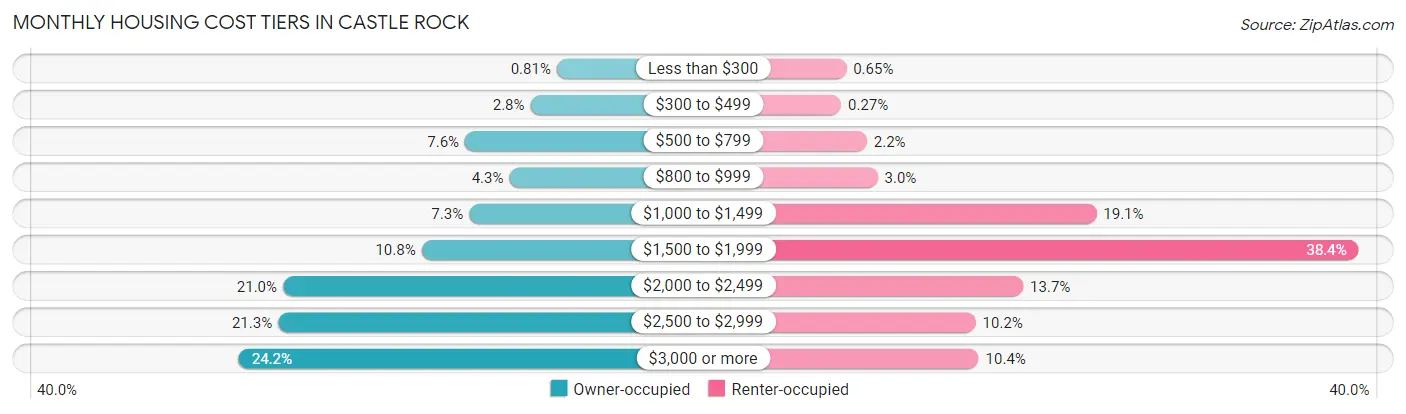
| Monthly Cost | Owner-occupied | Renter-occupied |
| Less than $300 | 164 (0.8%) | 36 (0.6%) |
| $300 to $499 | 561 (2.8%) | 15 (0.3%) |
| $500 to $799 | 1,541 (7.6%) | 121 (2.2%) |
| $800 to $999 | 876 (4.3%) | 165 (3.0%) |
| $1,000 to $1,499 | 1,480 (7.3%) | 1,064 (19.1%) |
| $1,500 to $1,999 | 2,193 (10.8%) | 2,141 (38.4%) |
| $2,000 to $2,499 | 4,274 (21.0%) | 763 (13.7%) |
| $2,500 to $2,999 | 4,346 (21.3%) | 568 (10.2%) |
| $3,000 or more | 4,932 (24.2%) | 580 (10.4%) |
| Total | 20,367 (100.0%) | 5,579 (100.0%) |
Physical Housing Characteristics in Castle Rock
Housing Structures in Castle Rock
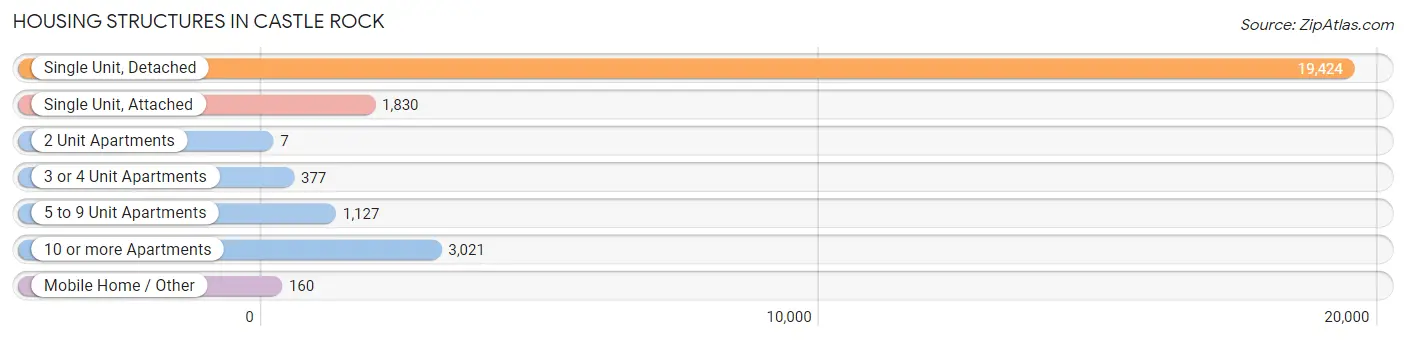
| Structure Type | # Housing Units | % Housing Units |
| Single Unit, Detached | 19,424 | 74.9% |
| Single Unit, Attached | 1,830 | 7.0% |
| 2 Unit Apartments | 7 | 0.0% |
| 3 or 4 Unit Apartments | 377 | 1.5% |
| 5 to 9 Unit Apartments | 1,127 | 4.3% |
| 10 or more Apartments | 3,021 | 11.6% |
| Mobile Home / Other | 160 | 0.6% |
| Total | 25,946 | 100.0% |
Housing Structures by Occupancy in Castle Rock
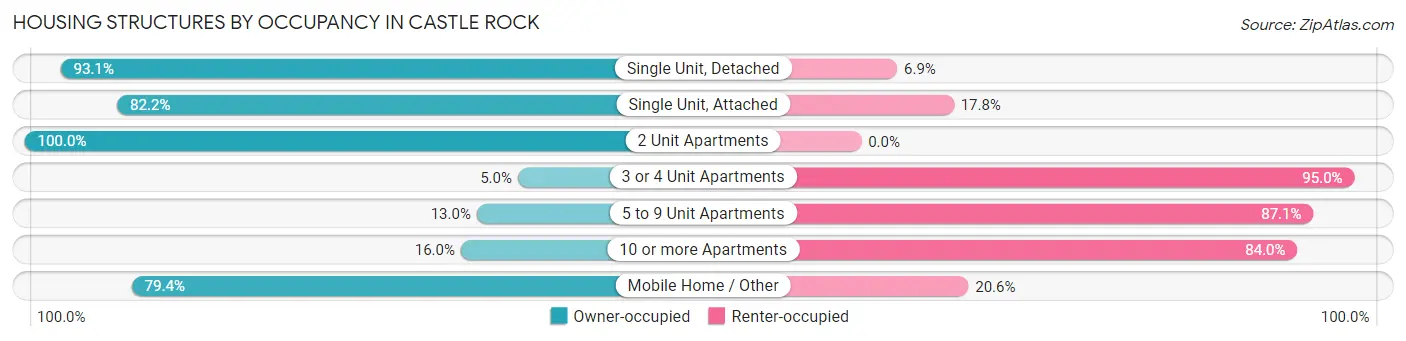
| Structure Type | Owner-occupied | Renter-occupied |
| Single Unit, Detached | 18,080 (93.1%) | 1,344 (6.9%) |
| Single Unit, Attached | 1,504 (82.2%) | 326 (17.8%) |
| 2 Unit Apartments | 7 (100.0%) | 0 (0.0%) |
| 3 or 4 Unit Apartments | 19 (5.0%) | 358 (95.0%) |
| 5 to 9 Unit Apartments | 146 (13.0%) | 981 (87.1%) |
| 10 or more Apartments | 484 (16.0%) | 2,537 (84.0%) |
| Mobile Home / Other | 127 (79.4%) | 33 (20.6%) |
| Total | 20,367 (78.5%) | 5,579 (21.5%) |
Housing Structures by Number of Rooms in Castle Rock
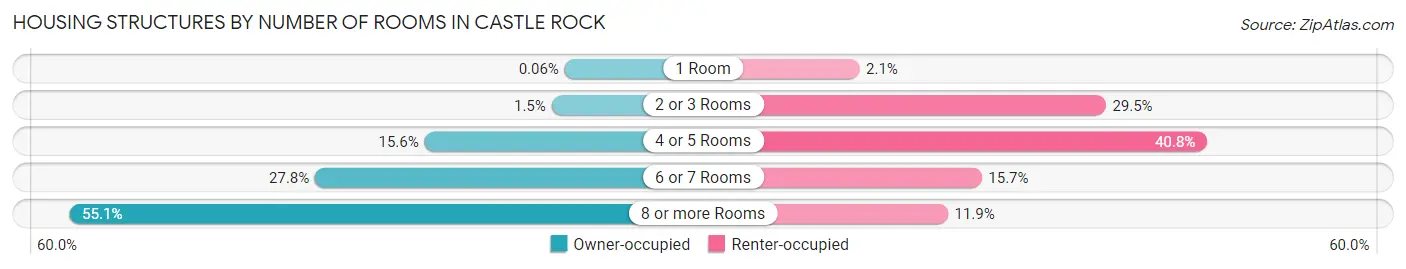
| Number of Rooms | Owner-occupied | Renter-occupied |
| 1 Room | 13 (0.1%) | 119 (2.1%) |
| 2 or 3 Rooms | 307 (1.5%) | 1,644 (29.5%) |
| 4 or 5 Rooms | 3,180 (15.6%) | 2,274 (40.8%) |
| 6 or 7 Rooms | 5,654 (27.8%) | 876 (15.7%) |
| 8 or more Rooms | 11,213 (55.0%) | 666 (11.9%) |
| Total | 20,367 (100.0%) | 5,579 (100.0%) |
Housing Structure by Heating Type in Castle Rock
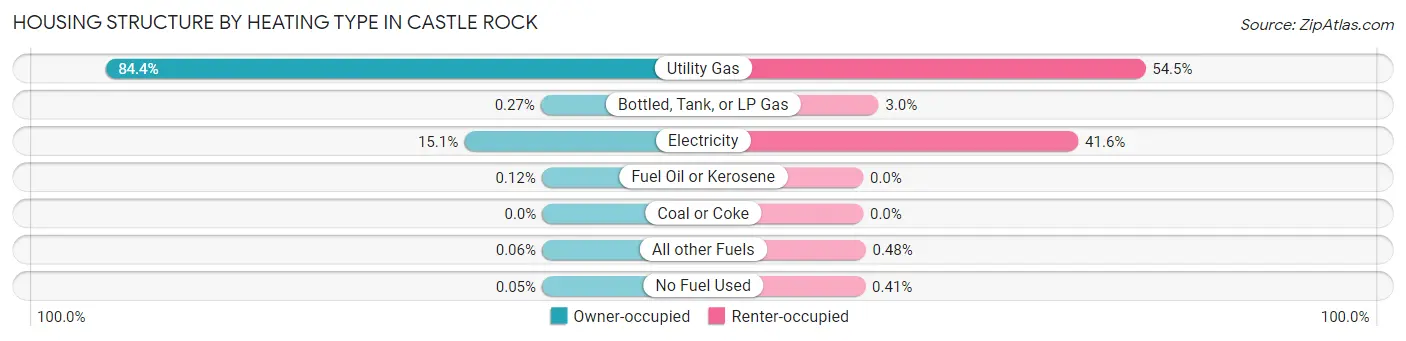
| Heating Type | Owner-occupied | Renter-occupied |
| Utility Gas | 17,191 (84.4%) | 3,043 (54.5%) |
| Bottled, Tank, or LP Gas | 54 (0.3%) | 167 (3.0%) |
| Electricity | 3,075 (15.1%) | 2,319 (41.6%) |
| Fuel Oil or Kerosene | 24 (0.1%) | 0 (0.0%) |
| Coal or Coke | 0 (0.0%) | 0 (0.0%) |
| All other Fuels | 12 (0.1%) | 27 (0.5%) |
| No Fuel Used | 11 (0.1%) | 23 (0.4%) |
| Total | 20,367 (100.0%) | 5,579 (100.0%) |
Household Vehicle Usage in Castle Rock
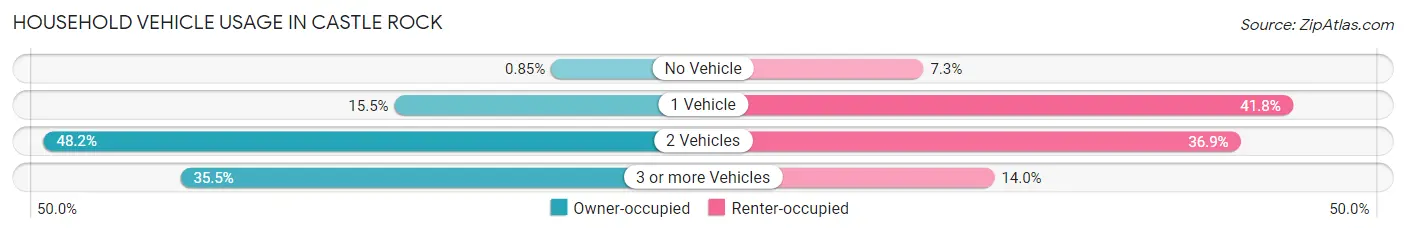
| Vehicles per Household | Owner-occupied | Renter-occupied |
| No Vehicle | 173 (0.9%) | 409 (7.3%) |
| 1 Vehicle | 3,152 (15.5%) | 2,331 (41.8%) |
| 2 Vehicles | 9,822 (48.2%) | 2,060 (36.9%) |
| 3 or more Vehicles | 7,220 (35.4%) | 779 (14.0%) |
| Total | 20,367 (100.0%) | 5,579 (100.0%) |
Real Estate & Mortgages in Castle Rock
Real Estate and Mortgage Overview in Castle Rock
| Characteristic | Without Mortgage | With Mortgage |
| Housing Units | 3,136 | 17,231 |
| Median Property Value | $575,400 | $577,800 |
| Median Household Income | $101,844 | $9,128 |
| Monthly Housing Costs | $673 | $4,932 |
| Real Estate Taxes | $2,932 | $99 |
Property Value by Mortgage Status in Castle Rock
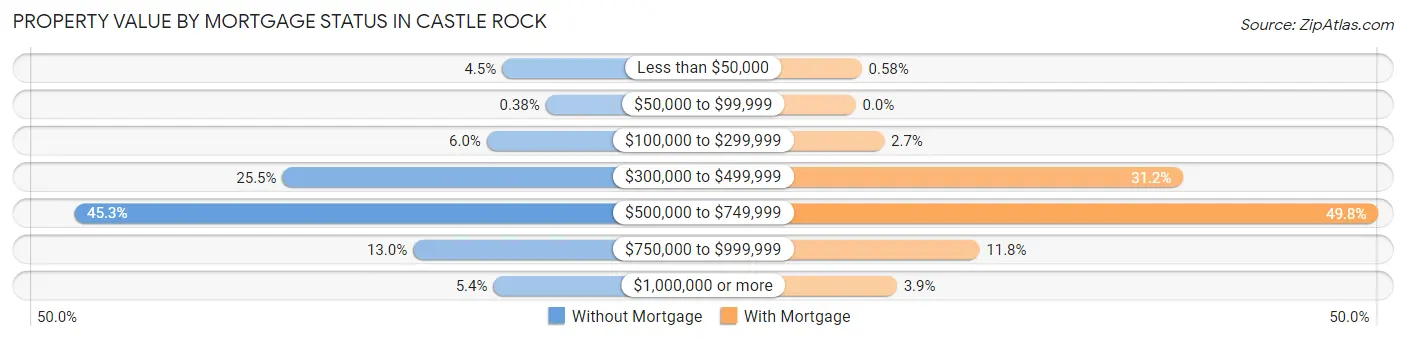
| Property Value | Without Mortgage | With Mortgage |
| Less than $50,000 | 142 (4.5%) | 100 (0.6%) |
| $50,000 to $99,999 | 12 (0.4%) | 0 (0.0%) |
| $100,000 to $299,999 | 188 (6.0%) | 469 (2.7%) |
| $300,000 to $499,999 | 798 (25.5%) | 5,377 (31.2%) |
| $500,000 to $749,999 | 1,420 (45.3%) | 8,577 (49.8%) |
| $750,000 to $999,999 | 408 (13.0%) | 2,032 (11.8%) |
| $1,000,000 or more | 168 (5.4%) | 676 (3.9%) |
| Total | 3,136 (100.0%) | 17,231 (100.0%) |
Household Income by Mortgage Status in Castle Rock
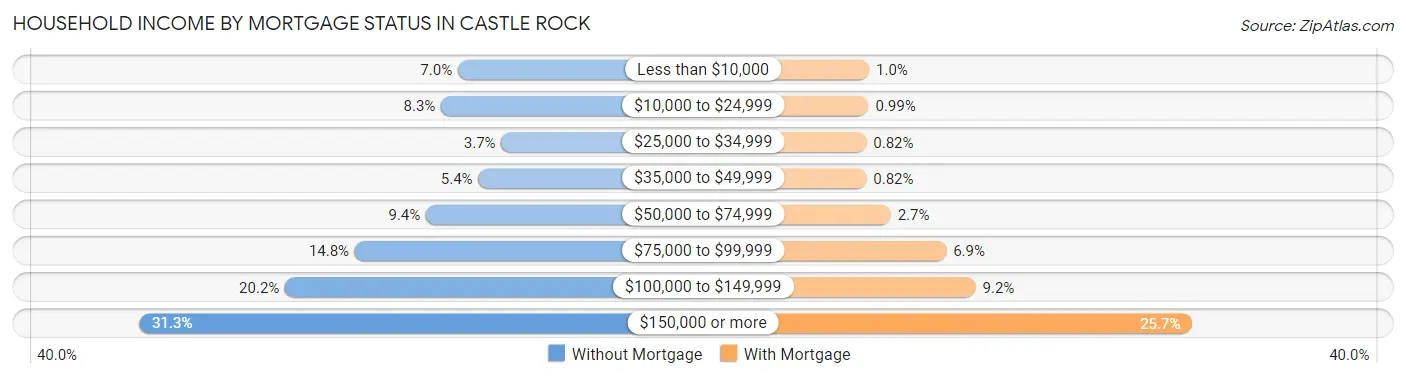
| Household Income | Without Mortgage | With Mortgage |
| Less than $10,000 | 219 (7.0%) | 178 (1.0%) |
| $10,000 to $24,999 | 259 (8.3%) | 171 (1.0%) |
| $25,000 to $34,999 | 115 (3.7%) | 141 (0.8%) |
| $35,000 to $49,999 | 170 (5.4%) | 142 (0.8%) |
| $50,000 to $74,999 | 295 (9.4%) | 462 (2.7%) |
| $75,000 to $99,999 | 465 (14.8%) | 1,190 (6.9%) |
| $100,000 to $149,999 | 632 (20.2%) | 1,577 (9.1%) |
| $150,000 or more | 981 (31.3%) | 4,420 (25.7%) |
| Total | 3,136 (100.0%) | 17,231 (100.0%) |
Property Value to Household Income Ratio in Castle Rock

| Value-to-Income Ratio | Without Mortgage | With Mortgage |
| Less than 2.0x | 436 (13.9%) | 157,203 (912.3%) |
| 2.0x to 2.9x | 401 (12.8%) | 1,742 (10.1%) |
| 3.0x to 3.9x | 385 (12.3%) | 4,114 (23.9%) |
| 4.0x or more | 1,914 (61.0%) | 4,625 (26.8%) |
| Total | 3,136 (100.0%) | 17,231 (100.0%) |
Real Estate Taxes by Mortgage Status in Castle Rock
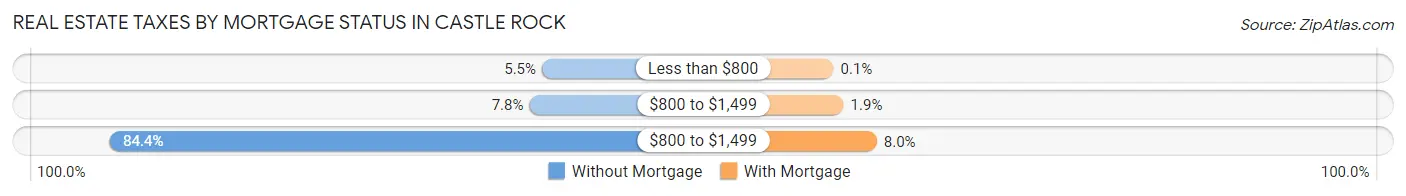
| Property Taxes | Without Mortgage | With Mortgage |
| Less than $800 | 173 (5.5%) | 18 (0.1%) |
| $800 to $1,499 | 245 (7.8%) | 335 (1.9%) |
| $800 to $1,499 | 2,646 (84.4%) | 1,379 (8.0%) |
| Total | 3,136 (100.0%) | 17,231 (100.0%) |
Health & Disability in Castle Rock
Health Insurance Coverage by Age in Castle Rock
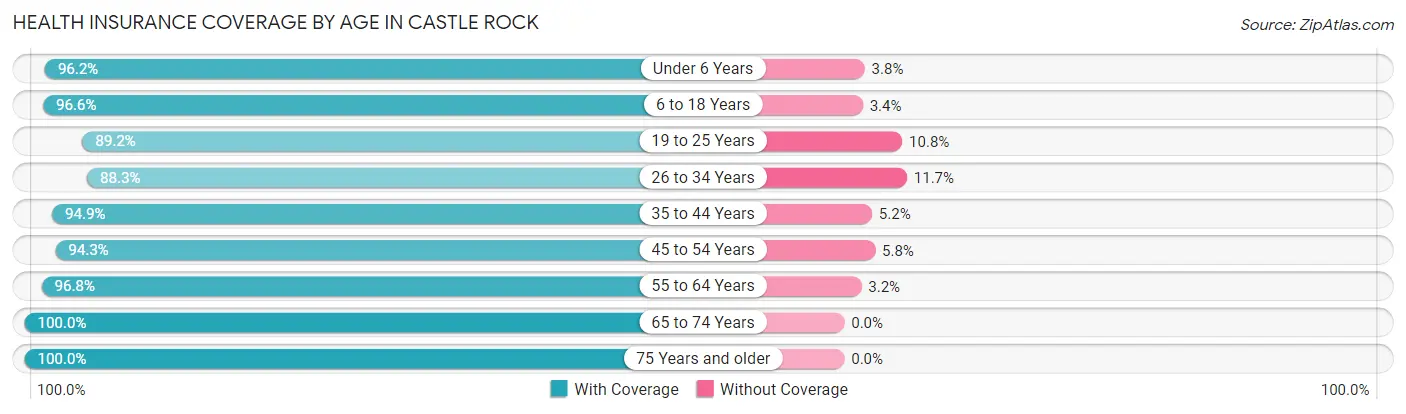
| Age Bracket | With Coverage | Without Coverage |
| Under 6 Years | 6,008 (96.2%) | 237 (3.8%) |
| 6 to 18 Years | 14,503 (96.6%) | 516 (3.4%) |
| 19 to 25 Years | 5,144 (89.2%) | 622 (10.8%) |
| 26 to 34 Years | 7,575 (88.3%) | 1,001 (11.7%) |
| 35 to 44 Years | 11,304 (94.9%) | 614 (5.1%) |
| 45 to 54 Years | 9,789 (94.3%) | 597 (5.8%) |
| 55 to 64 Years | 7,647 (96.8%) | 251 (3.2%) |
| 65 to 74 Years | 4,729 (100.0%) | 0 (0.0%) |
| 75 Years and older | 2,852 (100.0%) | 0 (0.0%) |
| Total | 69,551 (94.8%) | 3,838 (5.2%) |
Health Insurance Coverage by Citizenship Status in Castle Rock
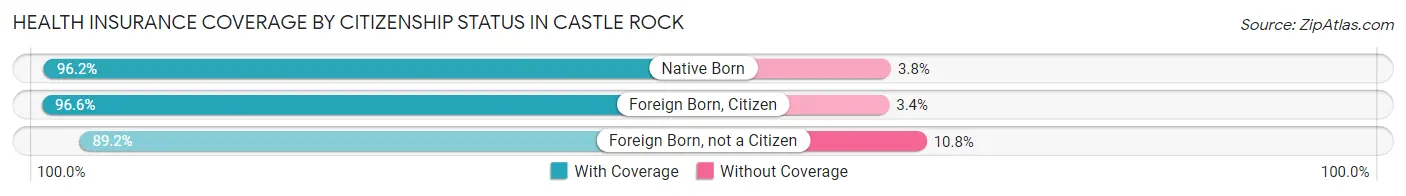
| Citizenship Status | With Coverage | Without Coverage |
| Native Born | 6,008 (96.2%) | 237 (3.8%) |
| Foreign Born, Citizen | 14,503 (96.6%) | 516 (3.4%) |
| Foreign Born, not a Citizen | 5,144 (89.2%) | 622 (10.8%) |
Health Insurance Coverage by Household Income in Castle Rock
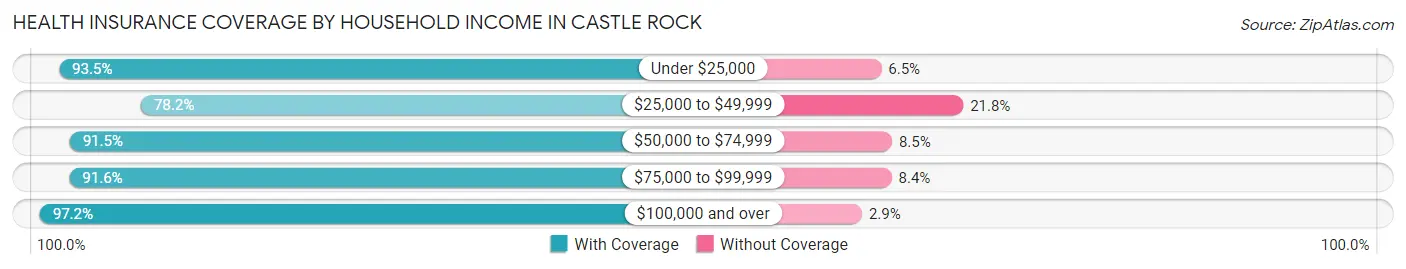
| Household Income | With Coverage | Without Coverage |
| Under $25,000 | 1,893 (93.5%) | 131 (6.5%) |
| $25,000 to $49,999 | 4,009 (78.2%) | 1,118 (21.8%) |
| $50,000 to $74,999 | 5,257 (91.5%) | 486 (8.5%) |
| $75,000 to $99,999 | 6,071 (91.6%) | 557 (8.4%) |
| $100,000 and over | 52,159 (97.2%) | 1,529 (2.9%) |
Public vs Private Health Insurance Coverage by Age in Castle Rock
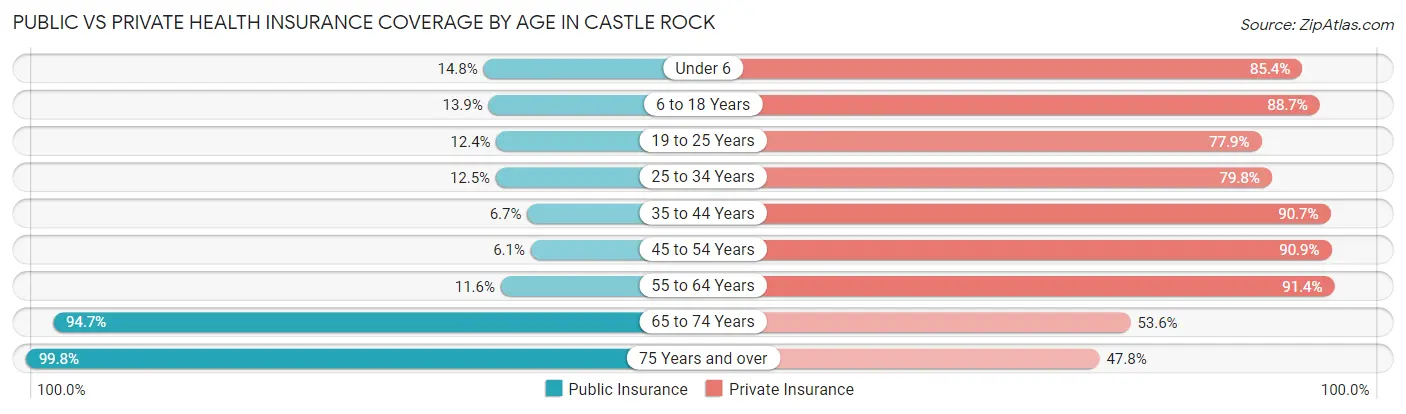
| Age Bracket | Public Insurance | Private Insurance |
| Under 6 | 925 (14.8%) | 5,335 (85.4%) |
| 6 to 18 Years | 2,084 (13.9%) | 13,319 (88.7%) |
| 19 to 25 Years | 717 (12.4%) | 4,490 (77.9%) |
| 25 to 34 Years | 1,073 (12.5%) | 6,842 (79.8%) |
| 35 to 44 Years | 797 (6.7%) | 10,805 (90.7%) |
| 45 to 54 Years | 628 (6.0%) | 9,437 (90.9%) |
| 55 to 64 Years | 917 (11.6%) | 7,220 (91.4%) |
| 65 to 74 Years | 4,480 (94.7%) | 2,534 (53.6%) |
| 75 Years and over | 2,846 (99.8%) | 1,364 (47.8%) |
| Total | 14,467 (19.7%) | 61,346 (83.6%) |
Disability Status by Sex by Age in Castle Rock
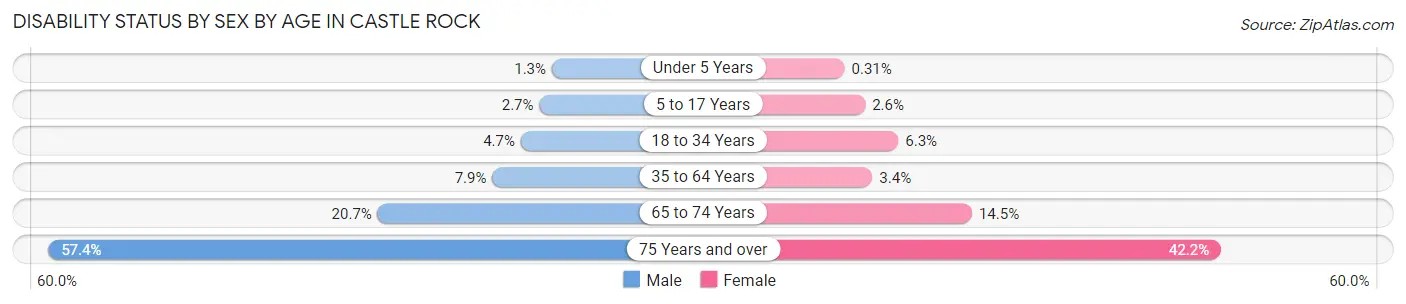
| Age Bracket | Male | Female |
| Under 5 Years | 31 (1.3%) | 9 (0.3%) |
| 5 to 17 Years | 193 (2.7%) | 204 (2.6%) |
| 18 to 34 Years | 372 (4.7%) | 467 (6.3%) |
| 35 to 64 Years | 1,220 (7.9%) | 504 (3.4%) |
| 65 to 74 Years | 466 (20.7%) | 359 (14.5%) |
| 75 Years and over | 650 (57.4%) | 726 (42.2%) |
Disability Class by Sex by Age in Castle Rock
Disability Class: Hearing Difficulty
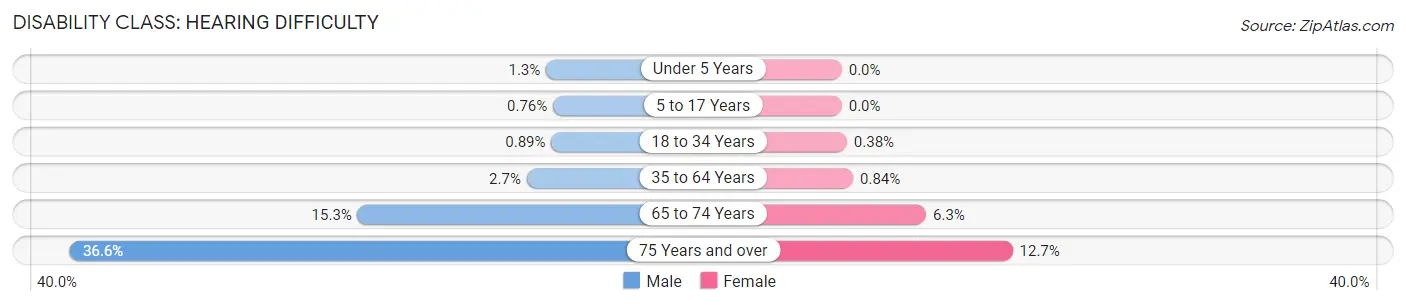
| Age Bracket | Male | Female |
| Under 5 Years | 31 (1.3%) | 0 (0.0%) |
| 5 to 17 Years | 55 (0.8%) | 0 (0.0%) |
| 18 to 34 Years | 70 (0.9%) | 28 (0.4%) |
| 35 to 64 Years | 420 (2.7%) | 124 (0.8%) |
| 65 to 74 Years | 344 (15.3%) | 155 (6.3%) |
| 75 Years and over | 415 (36.6%) | 218 (12.7%) |
Disability Class: Vision Difficulty
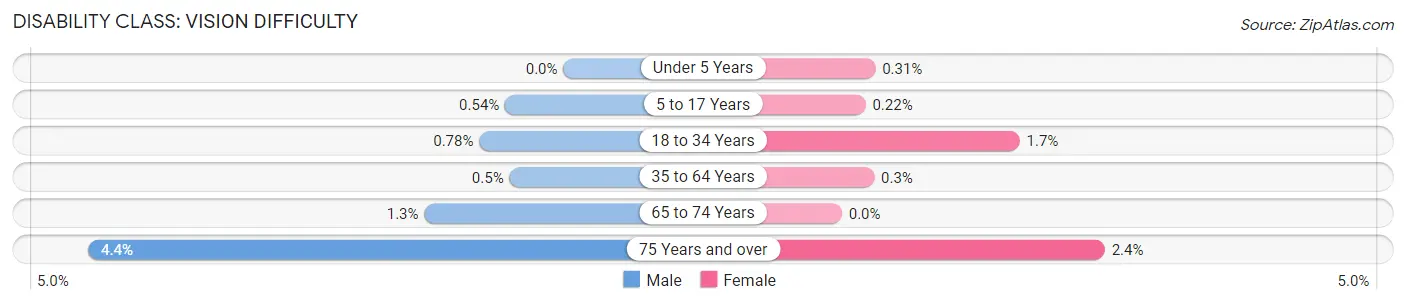
| Age Bracket | Male | Female |
| Under 5 Years | 0 (0.0%) | 9 (0.3%) |
| 5 to 17 Years | 39 (0.5%) | 17 (0.2%) |
| 18 to 34 Years | 61 (0.8%) | 122 (1.7%) |
| 35 to 64 Years | 77 (0.5%) | 44 (0.3%) |
| 65 to 74 Years | 29 (1.3%) | 0 (0.0%) |
| 75 Years and over | 50 (4.4%) | 42 (2.4%) |
Disability Class: Cognitive Difficulty
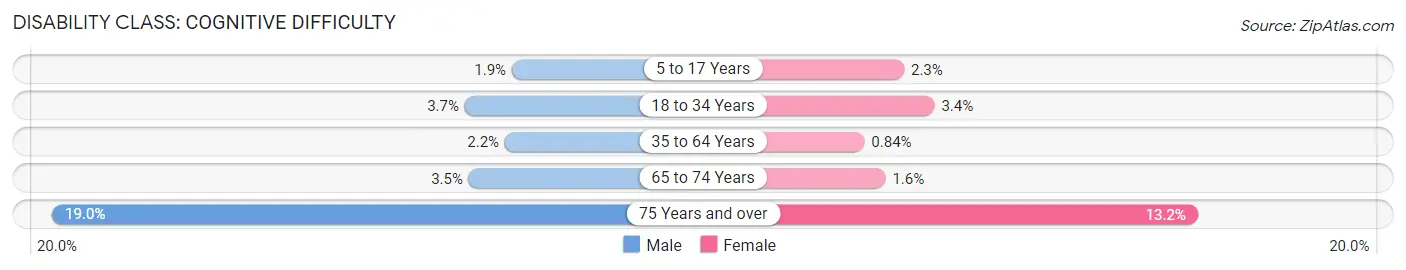
| Age Bracket | Male | Female |
| 5 to 17 Years | 138 (1.9%) | 180 (2.3%) |
| 18 to 34 Years | 287 (3.7%) | 255 (3.4%) |
| 35 to 64 Years | 335 (2.2%) | 124 (0.8%) |
| 65 to 74 Years | 79 (3.5%) | 40 (1.6%) |
| 75 Years and over | 215 (19.0%) | 227 (13.2%) |
Disability Class: Ambulatory Difficulty
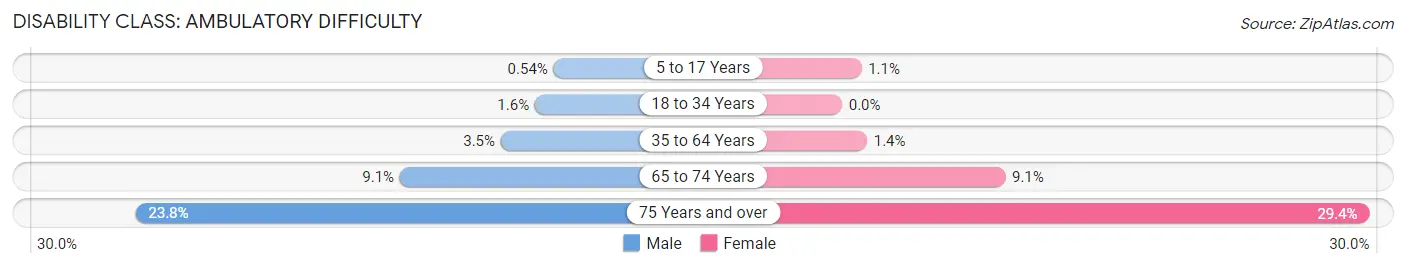
| Age Bracket | Male | Female |
| 5 to 17 Years | 39 (0.5%) | 84 (1.1%) |
| 18 to 34 Years | 124 (1.6%) | 0 (0.0%) |
| 35 to 64 Years | 537 (3.5%) | 206 (1.4%) |
| 65 to 74 Years | 205 (9.1%) | 225 (9.1%) |
| 75 Years and over | 270 (23.8%) | 505 (29.4%) |
Disability Class: Self-Care Difficulty
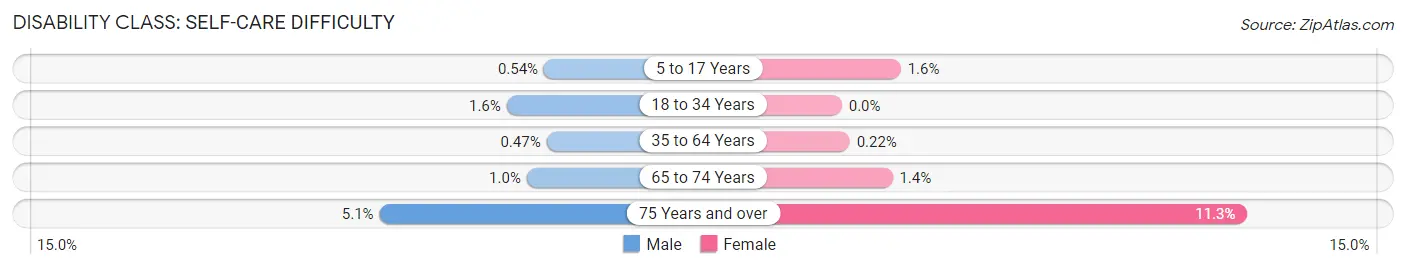
| Age Bracket | Male | Female |
| 5 to 17 Years | 39 (0.5%) | 128 (1.6%) |
| 18 to 34 Years | 124 (1.6%) | 0 (0.0%) |
| 35 to 64 Years | 72 (0.5%) | 32 (0.2%) |
| 65 to 74 Years | 23 (1.0%) | 35 (1.4%) |
| 75 Years and over | 58 (5.1%) | 194 (11.3%) |
Technology Access in Castle Rock
Computing Device Access in Castle Rock
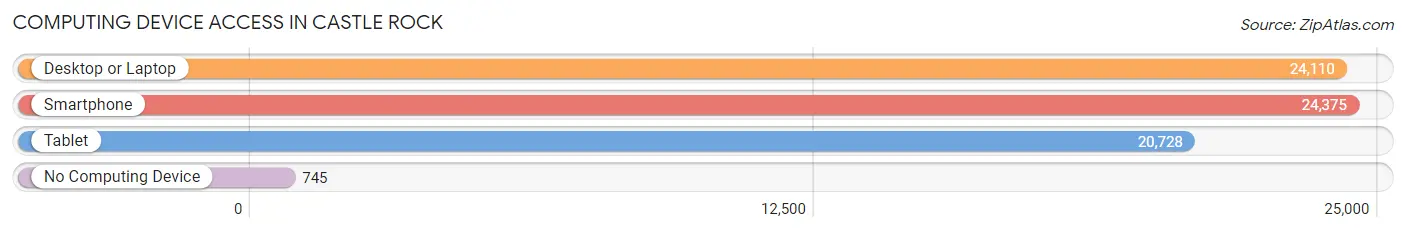
| Device Type | # Households | % Households |
| Desktop or Laptop | 24,110 | 92.9% |
| Smartphone | 24,375 | 94.0% |
| Tablet | 20,728 | 79.9% |
| No Computing Device | 745 | 2.9% |
| Total | 25,946 | 100.0% |
Internet Access in Castle Rock
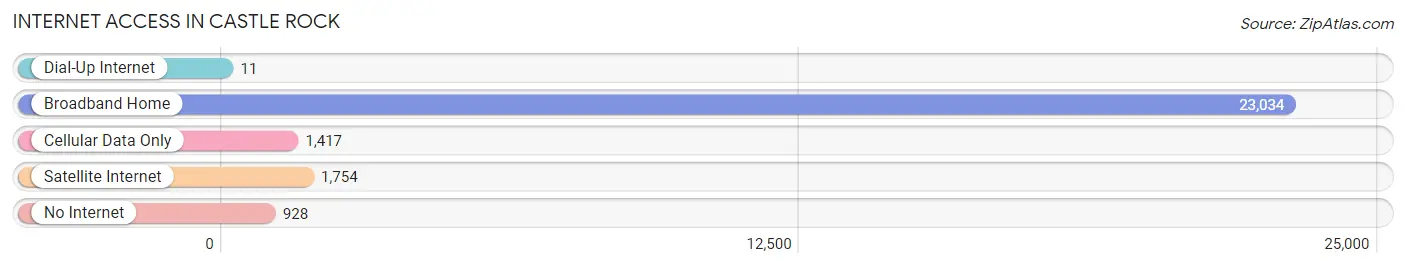
| Internet Type | # Households | % Households |
| Dial-Up Internet | 11 | 0.0% |
| Broadband Home | 23,034 | 88.8% |
| Cellular Data Only | 1,417 | 5.5% |
| Satellite Internet | 1,754 | 6.8% |
| No Internet | 928 | 3.6% |
| Total | 25,946 | 100.0% |
Castle Rock Summary
Castle Rock is a town located in Douglas County, Colorado, United States. The town is situated at the base of the Rocky Mountains, approximately 25 miles south of Denver. The town was founded in 1874 and incorporated in 1881. As of the 2010 census, the population of Castle Rock was 48,231.
History
The area that is now Castle Rock was originally inhabited by the Ute people. The first Europeans to settle in the area were miners and ranchers in the late 1800s. The town was named after a large rock formation that was located near the original homestead. The rock formation was used as a landmark by travelers and settlers.
In 1874, the town was officially founded and named Castle Rock. The town was incorporated in 1881 and was the first town in Douglas County. The town was originally a farming and ranching community, but in the late 1800s, the town began to grow as a result of the Denver and Rio Grande Railroad.
Geography
Castle Rock is located in Douglas County, Colorado, at the base of the Rocky Mountains. The town is situated at an elevation of 6,224 feet above sea level. The town is located approximately 25 miles south of Denver and is bordered by the towns of Parker, Franktown, and Larkspur.
The town is located in the Denver-Aurora-Lakewood Metropolitan Statistical Area. The town is located in the South Platte River Valley and is surrounded by rolling hills and open plains. The town is located in a semi-arid climate, with hot summers and cold winters.
Economy
The economy of Castle Rock is largely based on the service industry. The town is home to several large employers, including the Douglas County School District, the Town of Castle Rock, and the Castle Rock Adventist Hospital. The town is also home to several retail stores, restaurants, and other businesses.
The town is also home to several technology companies, including Oracle, IBM, and Microsoft. The town is also home to several manufacturing companies, including Lockheed Martin and Ball Aerospace.
Demographics
As of the 2010 census, the population of Castle Rock was 48,231. The population is made up of a diverse mix of people, including Caucasians, African Americans, Hispanics, Asians, and Native Americans. The median household income in the town is $90,845, and the median age is 37.
The town is home to several religious denominations, including Christianity, Judaism, Islam, and Buddhism. The town is also home to several educational institutions, including the University of Colorado Denver, the University of Denver, and the Colorado School of Mines.
Conclusion
Castle Rock is a town located in Douglas County, Colorado, United States. The town is situated at the base of the Rocky Mountains, approximately 25 miles south of Denver. The town was founded in 1874 and incorporated in 1881. As of the 2010 census, the population of Castle Rock was 48,231. The town is largely based on the service industry, with several large employers, retail stores, restaurants, and other businesses. The population is made up of a diverse mix of people, including Caucasians, African Americans, Hispanics, Asians, and Native Americans. The town is home to several religious denominations, educational institutions, and technology companies. Castle Rock is a vibrant and diverse community that offers a variety of opportunities for its residents.
Common Questions
What is Per Capita Income in Castle Rock?
Per Capita income in Castle Rock is $55,031.
What is the Median Family Income in Castle Rock?
Median Family Income in Castle Rock is $150,875.
What is the Median Household income in Castle Rock?
Median Household Income in Castle Rock is $135,985.
What is Income or Wage Gap in Castle Rock?
Income or Wage Gap in Castle Rock is 38.9%.
Women in Castle Rock earn 61.1 cents for every dollar earned by a man.
What is Inequality or Gini Index in Castle Rock?
Inequality or Gini Index in Castle Rock is 0.38.
What is the Total Population of Castle Rock?
Total Population of Castle Rock is 74,065.
What is the Total Male Population of Castle Rock?
Total Male Population of Castle Rock is 36,786.
What is the Total Female Population of Castle Rock?
Total Female Population of Castle Rock is 37,279.
What is the Ratio of Males per 100 Females in Castle Rock?
There are 98.68 Males per 100 Females in Castle Rock.
What is the Ratio of Females per 100 Males in Castle Rock?
There are 101.34 Females per 100 Males in Castle Rock.
What is the Median Population Age in Castle Rock?
Median Population Age in Castle Rock is 35.8 Years.
What is the Average Family Size in Castle Rock
Average Family Size in Castle Rock is 3.2 People.
What is the Average Household Size in Castle Rock
Average Household Size in Castle Rock is 2.8 People.
How Large is the Labor Force in Castle Rock?
There are 41,422 People in the Labor Forcein in Castle Rock.
What is the Percentage of People in the Labor Force in Castle Rock?
73.5% of People are in the Labor Force in Castle Rock.
What is the Unemployment Rate in Castle Rock?
Unemployment Rate in Castle Rock is 4.2%.