Carmel, IN Map & Demographics
Carmel Map
Carmel Overview
$70,093
PER CAPITA INCOME
$173,106
AVG FAMILY INCOME
$132,859
AVG HOUSEHOLD INCOME
45.7%
WAGE / INCOME GAP [ % ]
54.3¢/ $1
WAGE / INCOME GAP [ $ ]
$14,775
FAMILY INCOME DEFICIT
0.46
INEQUALITY / GINI INDEX
99,453
TOTAL POPULATION
47,618
MALE POPULATION
51,835
FEMALE POPULATION
91.86
MALES / 100 FEMALES
108.86
FEMALES / 100 MALES
40.6
MEDIAN AGE
3.1
AVG FAMILY SIZE
2.6
AVG HOUSEHOLD SIZE
54,483
LABOR FORCE [ PEOPLE ]
69.7%
PERCENT IN LABOR FORCE
2.6%
UNEMPLOYMENT RATE
Carmel Area Codes
Income in Carmel
Income Overview in Carmel
Per Capita Income in Carmel is $70,093, while median incomes of families and households are $173,106 and $132,859 respectively.
| Characteristic | Number | Measure |
| Per Capita Income | 99,453 | $70,093 |
| Median Family Income | 27,567 | $173,106 |
| Mean Family Income | 27,567 | $218,049 |
| Median Household Income | 37,888 | $132,859 |
| Mean Household Income | 37,888 | $181,667 |
| Income Deficit | 27,567 | $14,775 |
| Wage / Income Gap (%) | 99,453 | 45.67% |
| Wage / Income Gap ($) | 99,453 | 54.33¢ per $1 |
| Gini / Inequality Index | 99,453 | 0.46 |
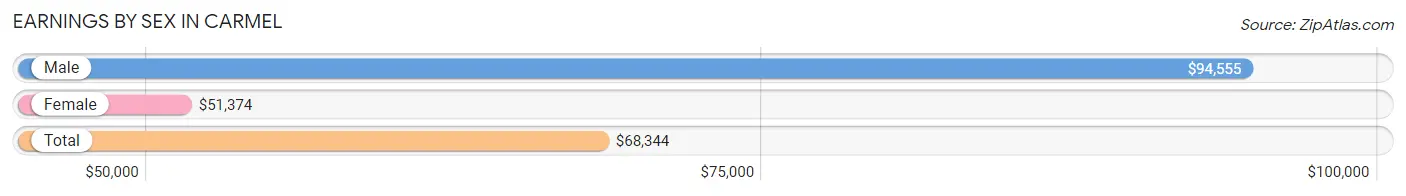
Earnings by Sex in Carmel
Average Earnings in Carmel are $68,344, $94,555 for men and $51,374 for women, a difference of 45.7%.
| Sex | Number | Average Earnings |
| Male | 30,020 (52.3%) | $94,555 |
| Female | 27,368 (47.7%) | $51,374 |
| Total | 57,388 (100.0%) | $68,344 |
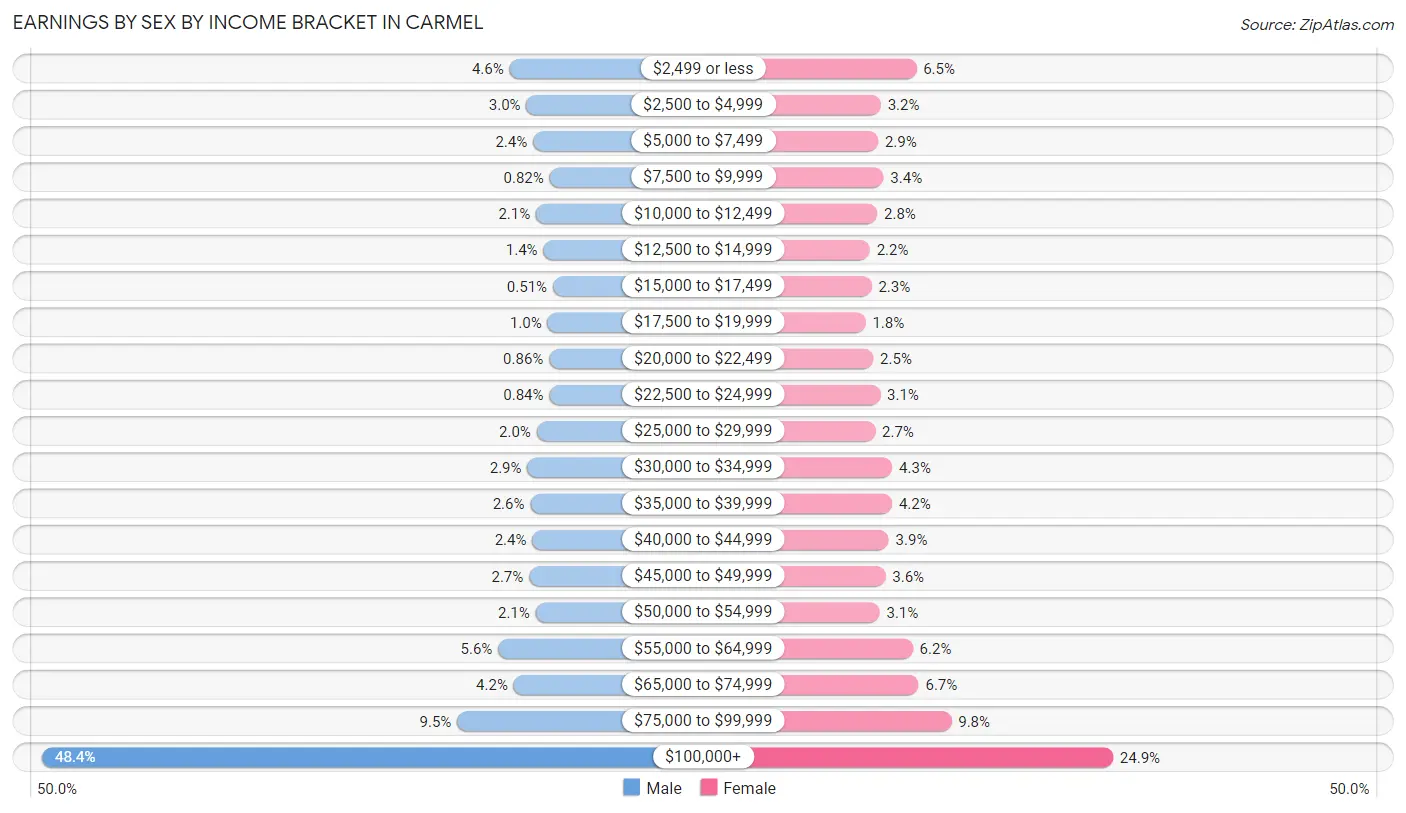
Earnings by Sex by Income Bracket in Carmel
The most common earnings brackets in Carmel are $100,000+ for men (14,519 | 48.4%) and $100,000+ for women (6,822 | 24.9%).
| Income | Male | Female |
| $2,499 or less | 1,371 (4.6%) | 1,780 (6.5%) |
| $2,500 to $4,999 | 899 (3.0%) | 869 (3.2%) |
| $5,000 to $7,499 | 711 (2.4%) | 798 (2.9%) |
| $7,500 to $9,999 | 246 (0.8%) | 938 (3.4%) |
| $10,000 to $12,499 | 628 (2.1%) | 777 (2.8%) |
| $12,500 to $14,999 | 419 (1.4%) | 589 (2.1%) |
| $15,000 to $17,499 | 153 (0.5%) | 631 (2.3%) |
| $17,500 to $19,999 | 304 (1.0%) | 480 (1.8%) |
| $20,000 to $22,499 | 259 (0.9%) | 676 (2.5%) |
| $22,500 to $24,999 | 253 (0.8%) | 855 (3.1%) |
| $25,000 to $29,999 | 609 (2.0%) | 724 (2.6%) |
| $30,000 to $34,999 | 870 (2.9%) | 1,163 (4.3%) |
| $35,000 to $39,999 | 791 (2.6%) | 1,158 (4.2%) |
| $40,000 to $44,999 | 732 (2.4%) | 1,074 (3.9%) |
| $45,000 to $49,999 | 824 (2.7%) | 989 (3.6%) |
| $50,000 to $54,999 | 638 (2.1%) | 839 (3.1%) |
| $55,000 to $64,999 | 1,692 (5.6%) | 1,688 (6.2%) |
| $65,000 to $74,999 | 1,255 (4.2%) | 1,840 (6.7%) |
| $75,000 to $99,999 | 2,847 (9.5%) | 2,678 (9.8%) |
| $100,000+ | 14,519 (48.4%) | 6,822 (24.9%) |
| Total | 30,020 (100.0%) | 27,368 (100.0%) |
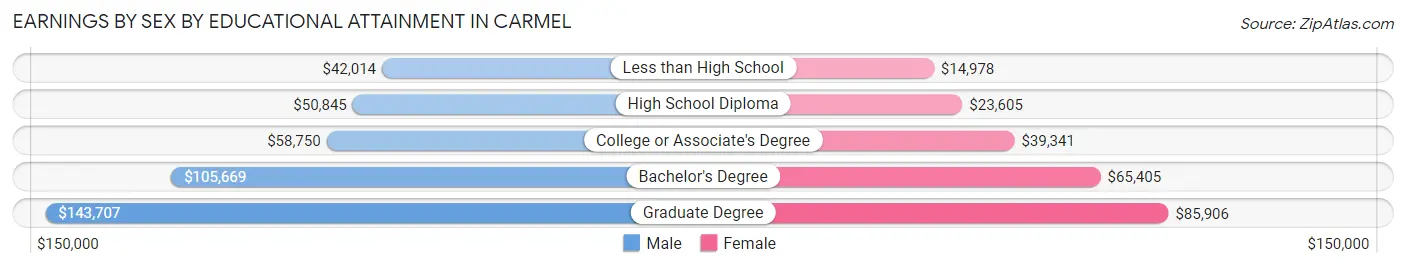
Earnings by Sex by Educational Attainment in Carmel
Average earnings in Carmel are $109,140 for men and $60,049 for women, a difference of 45.0%. Men with an educational attainment of graduate degree enjoy the highest average annual earnings of $143,707, while those with less than high school education earn the least with $42,014. Women with an educational attainment of graduate degree earn the most with the average annual earnings of $85,906, while those with less than high school education have the smallest earnings of $14,978.
| Educational Attainment | Male Income | Female Income |
| Less than High School | $42,014 | $14,978 |
| High School Diploma | $50,845 | $23,605 |
| College or Associate's Degree | $58,750 | $39,341 |
| Bachelor's Degree | $105,669 | $65,405 |
| Graduate Degree | $143,707 | $85,906 |
| Total | $109,140 | $60,049 |
Family Income in Carmel
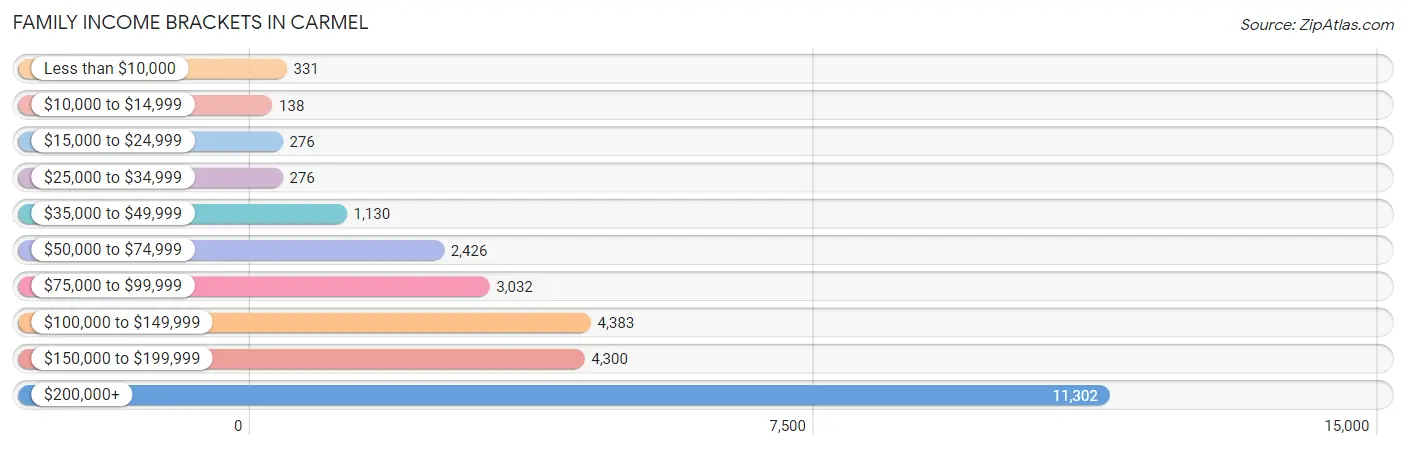
Family Income Brackets in Carmel
According to the Carmel family income data, there are 11,302 families falling into the $200,000+ income range, which is the most common income bracket and makes up 41.0% of all families. Conversely, the $10,000 to $14,999 income bracket is the least frequent group with only 138 families (0.5%) belonging to this category.
| Income Bracket | # Families | % Families |
| Less than $10,000 | 331 | 1.2% |
| $10,000 to $14,999 | 138 | 0.5% |
| $15,000 to $24,999 | 276 | 1.0% |
| $25,000 to $34,999 | 276 | 1.0% |
| $35,000 to $49,999 | 1,130 | 4.1% |
| $50,000 to $74,999 | 2,426 | 8.8% |
| $75,000 to $99,999 | 3,032 | 11.0% |
| $100,000 to $149,999 | 4,383 | 15.9% |
| $150,000 to $199,999 | 4,300 | 15.6% |
| $200,000+ | 11,302 | 41.0% |
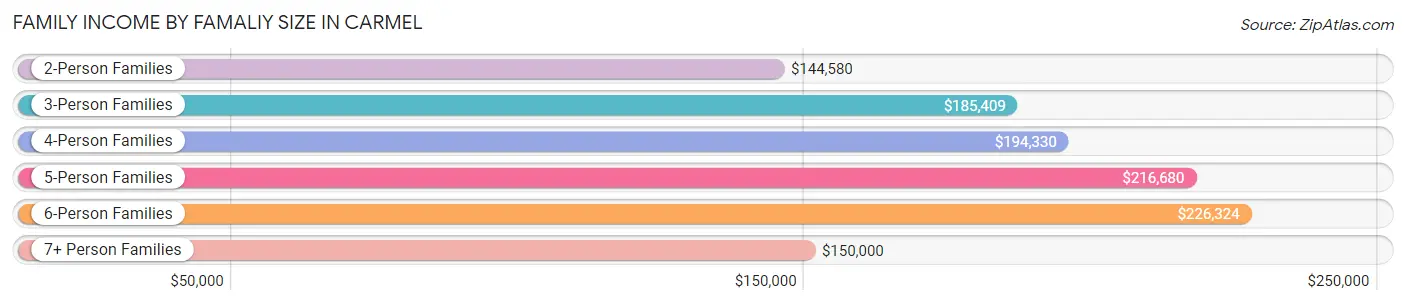
Family Income by Famaliy Size in Carmel
6-person families (634 | 2.3%) account for the highest median family income in Carmel with $226,324 per family, while 2-person families (11,827 | 42.9%) have the highest median income of $72,290 per family member.
| Income Bracket | # Families | Median Income |
| 2-Person Families | 11,827 (42.9%) | $144,580 |
| 3-Person Families | 5,719 (20.7%) | $185,409 |
| 4-Person Families | 6,907 (25.1%) | $194,330 |
| 5-Person Families | 2,314 (8.4%) | $216,680 |
| 6-Person Families | 634 (2.3%) | $226,324 |
| 7+ Person Families | 166 (0.6%) | $150,000 |
| Total | 27,567 (100.0%) | $173,106 |
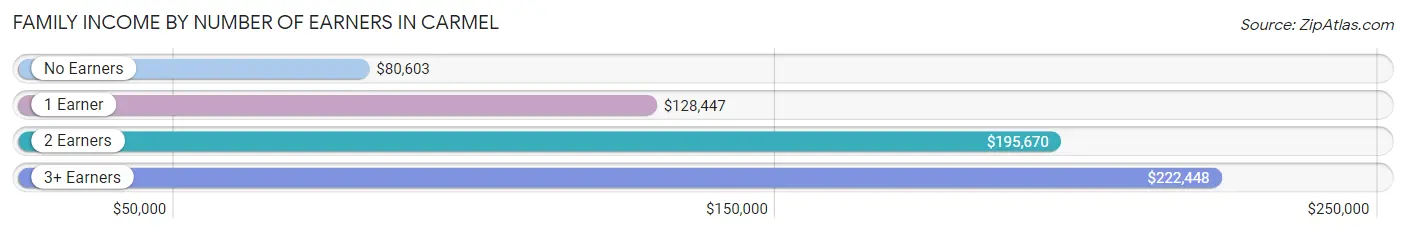
Family Income by Number of Earners in Carmel
The median family income in Carmel is $173,106, with families comprising 3+ earners (3,011) having the highest median family income of $222,448, while families with no earners (2,573) have the lowest median family income of $80,603, accounting for 10.9% and 9.3% of families, respectively.
| Number of Earners | # Families | Median Income |
| No Earners | 2,573 (9.3%) | $80,603 |
| 1 Earner | 7,114 (25.8%) | $128,447 |
| 2 Earners | 14,869 (53.9%) | $195,670 |
| 3+ Earners | 3,011 (10.9%) | $222,448 |
| Total | 27,567 (100.0%) | $173,106 |
Household Income in Carmel
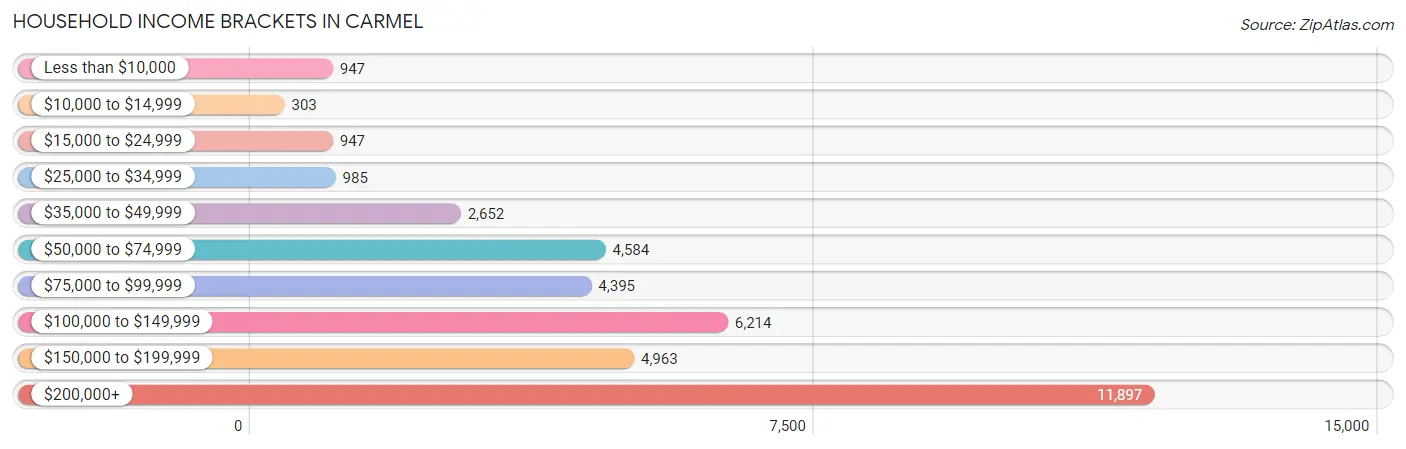
Household Income Brackets in Carmel
With 11,897 households falling in the category, the $200,000+ income range is the most frequent in Carmel, accounting for 31.4% of all households. In contrast, only 303 households (0.8%) fall into the $10,000 to $14,999 income bracket, making it the least populous group.
| Income Bracket | # Households | % Households |
| Less than $10,000 | 947 | 2.5% |
| $10,000 to $14,999 | 303 | 0.8% |
| $15,000 to $24,999 | 947 | 2.5% |
| $25,000 to $34,999 | 985 | 2.6% |
| $35,000 to $49,999 | 2,652 | 7.0% |
| $50,000 to $74,999 | 4,584 | 12.1% |
| $75,000 to $99,999 | 4,395 | 11.6% |
| $100,000 to $149,999 | 6,214 | 16.4% |
| $150,000 to $199,999 | 4,963 | 13.1% |
| $200,000+ | 11,897 | 31.4% |
Household Income by Householder Age in Carmel
The median household income in Carmel is $132,859, with the highest median household income of $180,057 found in the 45 to 64 years age bracket for the primary householder. A total of 15,672 households (41.4%) fall into this category. Meanwhile, the 15 to 24 years age bracket for the primary householder has the lowest median household income of $57,125, with 1,018 households (2.7%) in this group.
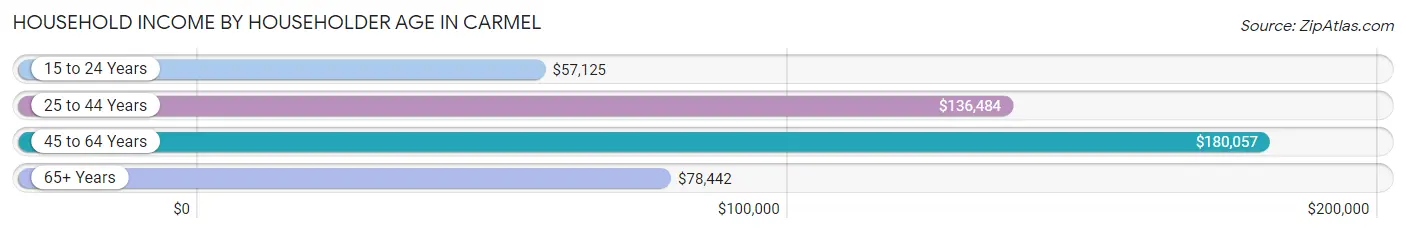
| Income Bracket | # Households | Median Income |
| 15 to 24 Years | 1,018 (2.7%) | $57,125 |
| 25 to 44 Years | 12,346 (32.6%) | $136,484 |
| 45 to 64 Years | 15,672 (41.4%) | $180,057 |
| 65+ Years | 8,852 (23.4%) | $78,442 |
| Total | 37,888 (100.0%) | $132,859 |
Poverty in Carmel
Income Below Poverty by Sex and Age in Carmel
With 3.0% poverty level for males and 4.2% for females among the residents of Carmel, 5 year old males and 5 year old females are the most vulnerable to poverty, with 128 males (15.7%) and 67 females (13.0%) in their respective age groups living below the poverty level.
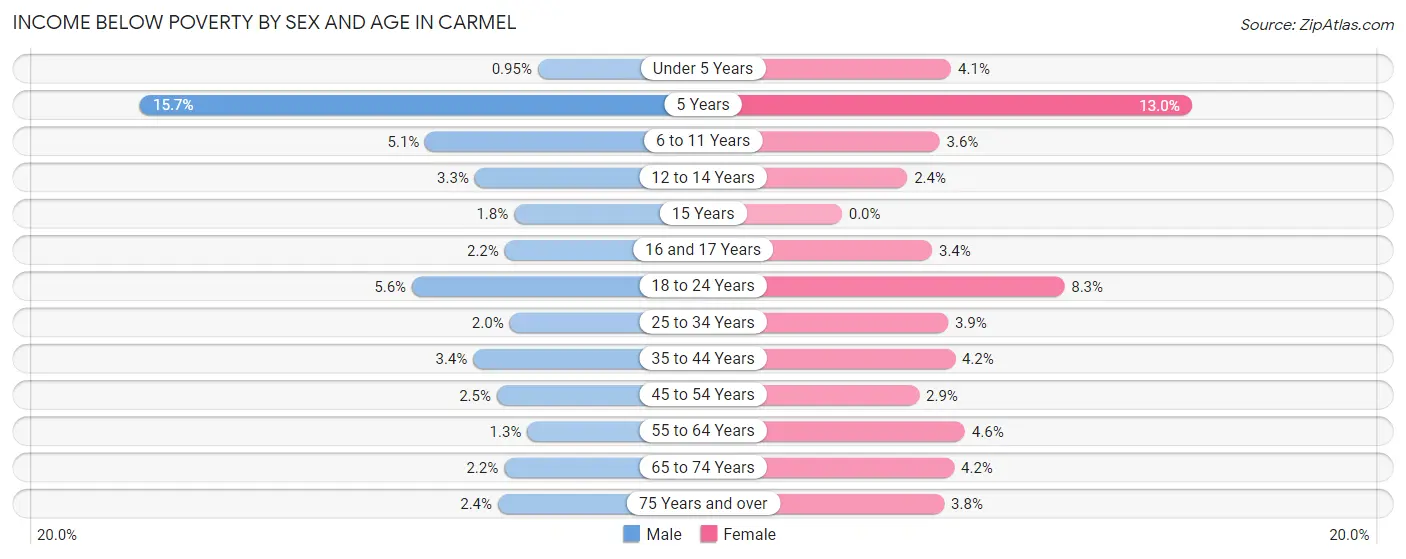
| Age Bracket | Male | Female |
| Under 5 Years | 23 (0.9%) | 104 (4.1%) |
| 5 Years | 128 (15.7%) | 67 (13.0%) |
| 6 to 11 Years | 213 (5.1%) | 157 (3.6%) |
| 12 to 14 Years | 83 (3.3%) | 55 (2.4%) |
| 15 Years | 12 (1.8%) | 0 (0.0%) |
| 16 and 17 Years | 38 (2.2%) | 54 (3.4%) |
| 18 to 24 Years | 196 (5.6%) | 344 (8.3%) |
| 25 to 34 Years | 99 (2.0%) | 202 (3.9%) |
| 35 to 44 Years | 207 (3.4%) | 323 (4.2%) |
| 45 to 54 Years | 192 (2.5%) | 217 (2.9%) |
| 55 to 64 Years | 83 (1.3%) | 317 (4.6%) |
| 65 to 74 Years | 90 (2.2%) | 188 (4.2%) |
| 75 Years and over | 59 (2.4%) | 126 (3.8%) |
| Total | 1,423 (3.0%) | 2,154 (4.2%) |
Income Above Poverty by Sex and Age in Carmel
According to the poverty statistics in Carmel, males aged under 5 years and females aged 15 years are the age groups that are most secure financially, with 99.1% of males and 100.0% of females in these age groups living above the poverty line.
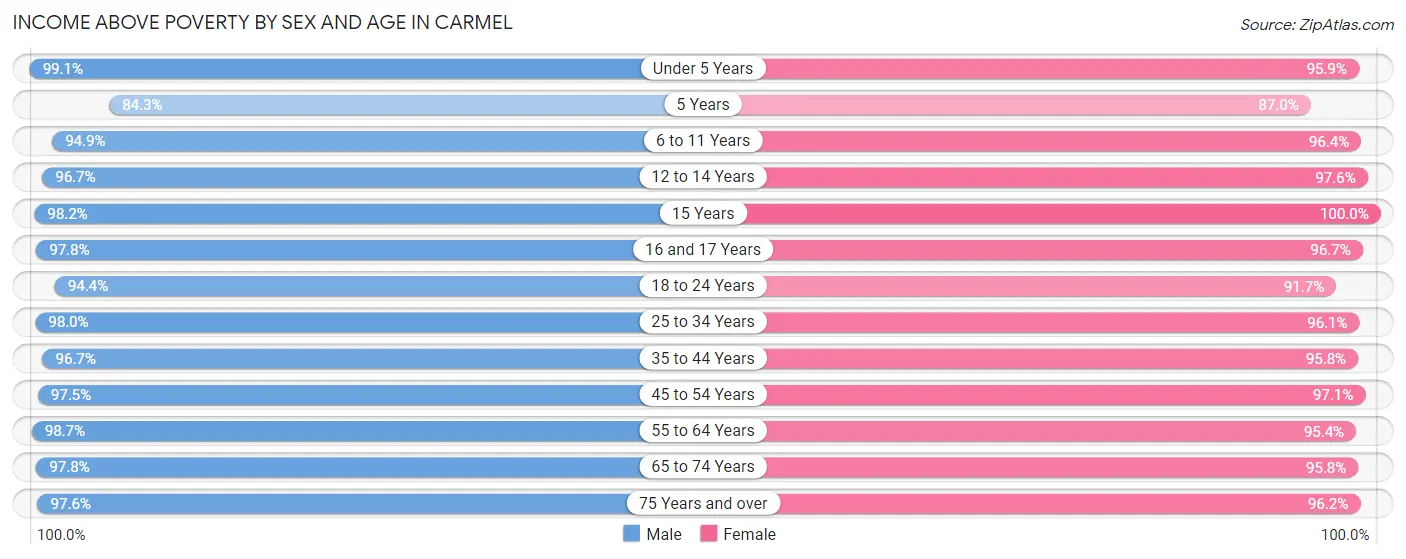
| Age Bracket | Male | Female |
| Under 5 Years | 2,401 (99.1%) | 2,457 (95.9%) |
| 5 Years | 687 (84.3%) | 449 (87.0%) |
| 6 to 11 Years | 3,942 (94.9%) | 4,163 (96.4%) |
| 12 to 14 Years | 2,440 (96.7%) | 2,208 (97.6%) |
| 15 Years | 643 (98.2%) | 891 (100.0%) |
| 16 and 17 Years | 1,707 (97.8%) | 1,558 (96.7%) |
| 18 to 24 Years | 3,290 (94.4%) | 3,819 (91.7%) |
| 25 to 34 Years | 4,860 (98.0%) | 4,930 (96.1%) |
| 35 to 44 Years | 5,979 (96.7%) | 7,367 (95.8%) |
| 45 to 54 Years | 7,567 (97.5%) | 7,339 (97.1%) |
| 55 to 64 Years | 6,131 (98.7%) | 6,614 (95.4%) |
| 65 to 74 Years | 4,003 (97.8%) | 4,324 (95.8%) |
| 75 Years and over | 2,372 (97.6%) | 3,187 (96.2%) |
| Total | 46,022 (97.0%) | 49,306 (95.8%) |
Income Below Poverty Among Married-Couple Families in Carmel
The poverty statistics for married-couple families in Carmel show that 1.2% or 297 of the total 24,309 families live below the poverty line. Families with 3 or 4 children have the highest poverty rate of 1.8%, comprising of 43 families. On the other hand, families with 5 or more children have the lowest poverty rate of 0.0%, which includes 0 families.
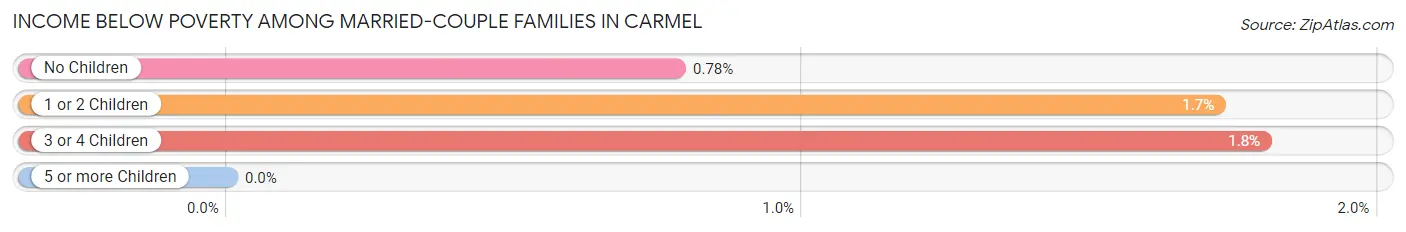
| Children | Above Poverty | Below Poverty |
| No Children | 12,829 (99.2%) | 101 (0.8%) |
| 1 or 2 Children | 8,726 (98.3%) | 153 (1.7%) |
| 3 or 4 Children | 2,347 (98.2%) | 43 (1.8%) |
| 5 or more Children | 110 (100.0%) | 0 (0.0%) |
| Total | 24,012 (98.8%) | 297 (1.2%) |
Income Below Poverty Among Single-Parent Households in Carmel
According to the poverty data in Carmel, 10.8% or 65 single-father households and 10.6% or 283 single-mother households are living below the poverty line. Among single-father households, those with no children have the highest poverty rate, with 38 households (13.1%) experiencing poverty. Likewise, among single-mother households, those with 3 or 4 children have the highest poverty rate, with 68 households (20.6%) falling below the poverty line.
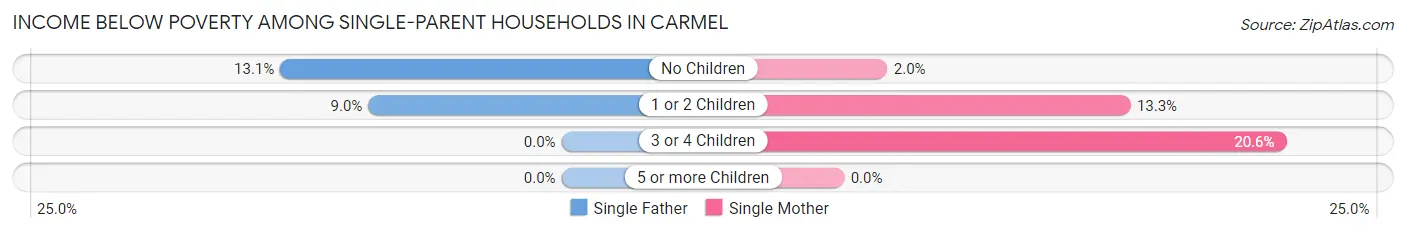
| Children | Single Father | Single Mother |
| No Children | 38 (13.1%) | 17 (2.0%) |
| 1 or 2 Children | 27 (9.0%) | 198 (13.3%) |
| 3 or 4 Children | 0 (0.0%) | 68 (20.6%) |
| 5 or more Children | 0 (0.0%) | 0 (0.0%) |
| Total | 65 (10.8%) | 283 (10.6%) |
Income Below Poverty Among Married-Couple vs Single-Parent Households in Carmel
The poverty data for Carmel shows that 297 of the married-couple family households (1.2%) and 348 of the single-parent households (10.7%) are living below the poverty level. Within the married-couple family households, those with 3 or 4 children have the highest poverty rate, with 43 households (1.8%) falling below the poverty line. Among the single-parent households, those with 3 or 4 children have the highest poverty rate, with 68 household (20.1%) living below poverty.
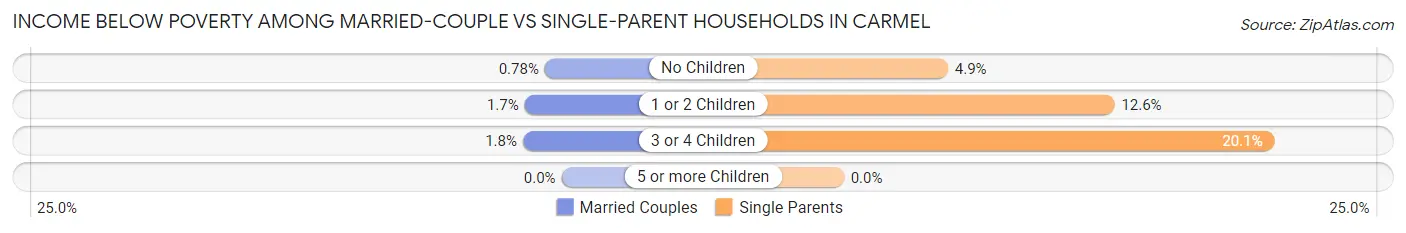
| Children | Married-Couple Families | Single-Parent Households |
| No Children | 101 (0.8%) | 55 (4.9%) |
| 1 or 2 Children | 153 (1.7%) | 225 (12.6%) |
| 3 or 4 Children | 43 (1.8%) | 68 (20.1%) |
| 5 or more Children | 0 (0.0%) | 0 (0.0%) |
| Total | 297 (1.2%) | 348 (10.7%) |
Race in Carmel
The most populous races in Carmel are White / Caucasian (78,340 | 78.8%), Asian (11,276 | 11.3%), and Two or more Races (5,030 | 5.1%).
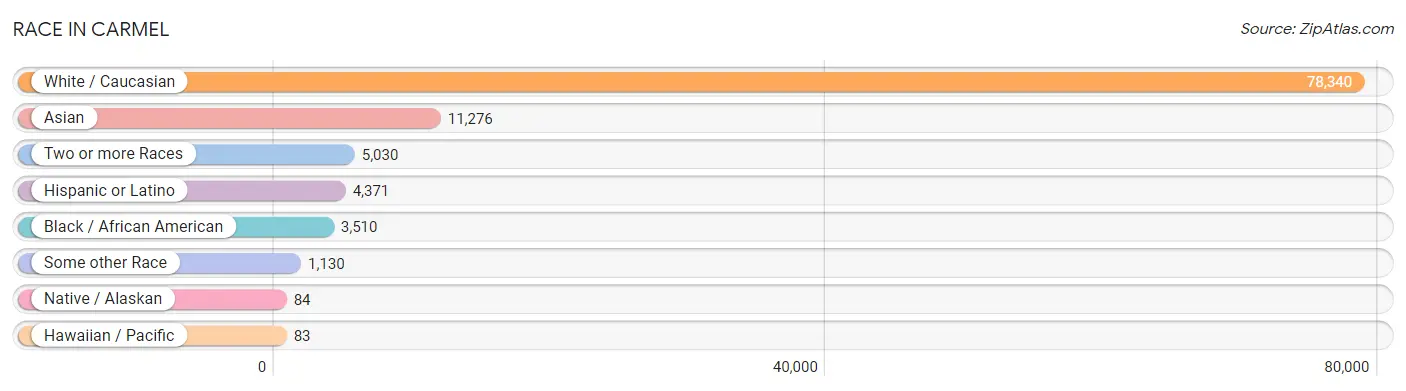
| Race | # Population | % Population |
| Asian | 11,276 | 11.3% |
| Black / African American | 3,510 | 3.5% |
| Hawaiian / Pacific | 83 | 0.1% |
| Hispanic or Latino | 4,371 | 4.4% |
| Native / Alaskan | 84 | 0.1% |
| White / Caucasian | 78,340 | 78.8% |
| Two or more Races | 5,030 | 5.1% |
| Some other Race | 1,130 | 1.1% |
| Total | 99,453 | 100.0% |
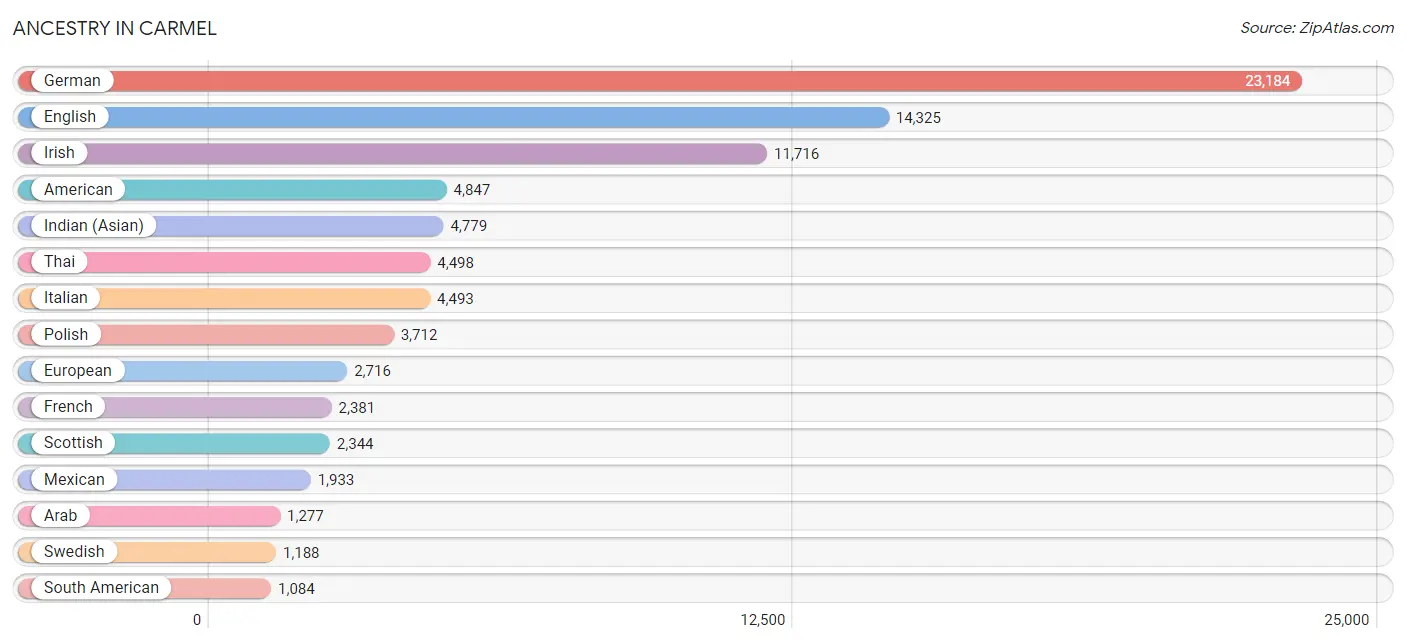
Ancestry in Carmel
The most populous ancestries reported in Carmel are German (23,184 | 23.3%), English (14,325 | 14.4%), Irish (11,716 | 11.8%), American (4,847 | 4.9%), and Indian (Asian) (4,779 | 4.8%), together accounting for 59.2% of all Carmel residents.
| Ancestry | # Population | % Population |
| African | 80 | 0.1% |
| Alsatian | 9 | 0.0% |
| American | 4,847 | 4.9% |
| Arab | 1,277 | 1.3% |
| Arapaho | 6 | 0.0% |
| Argentinean | 53 | 0.1% |
| Armenian | 60 | 0.1% |
| Assyrian / Chaldean / Syriac | 15 | 0.0% |
| Australian | 10 | 0.0% |
| Austrian | 372 | 0.4% |
| Bangladeshi | 26 | 0.0% |
| Belgian | 188 | 0.2% |
| Bhutanese | 542 | 0.5% |
| Blackfeet | 7 | 0.0% |
| Brazilian | 128 | 0.1% |
| British | 1,080 | 1.1% |
| Bulgarian | 56 | 0.1% |
| Burmese | 960 | 1.0% |
| Canadian | 286 | 0.3% |
| Central American | 338 | 0.3% |
| Central American Indian | 69 | 0.1% |
| Cherokee | 52 | 0.1% |
| Chilean | 22 | 0.0% |
| Chippewa | 2 | 0.0% |
| Colombian | 230 | 0.2% |
| Croatian | 95 | 0.1% |
| Cuban | 374 | 0.4% |
| Czech | 299 | 0.3% |
| Czechoslovakian | 130 | 0.1% |
| Danish | 246 | 0.3% |
| Dominican | 17 | 0.0% |
| Dutch | 911 | 0.9% |
| Eastern European | 642 | 0.6% |
| Ecuadorian | 122 | 0.1% |
| Egyptian | 687 | 0.7% |
| English | 14,325 | 14.4% |
| European | 2,716 | 2.7% |
| Fijian | 59 | 0.1% |
| Filipino | 132 | 0.1% |
| Finnish | 270 | 0.3% |
| French | 2,381 | 2.4% |
| French Canadian | 331 | 0.3% |
| German | 23,184 | 23.3% |
| Greek | 656 | 0.7% |
| Guatemalan | 183 | 0.2% |
| Haitian | 26 | 0.0% |
| Honduran | 45 | 0.1% |
| Hungarian | 259 | 0.3% |
| Icelander | 3 | 0.0% |
| Indian (Asian) | 4,779 | 4.8% |
| Iranian | 14 | 0.0% |
| Iraqi | 38 | 0.0% |
| Irish | 11,716 | 11.8% |
| Iroquois | 43 | 0.0% |
| Italian | 4,493 | 4.5% |
| Jamaican | 17 | 0.0% |
| Jordanian | 47 | 0.1% |
| Korean | 670 | 0.7% |
| Laotian | 10 | 0.0% |
| Latvian | 75 | 0.1% |
| Lebanese | 190 | 0.2% |
| Lithuanian | 268 | 0.3% |
| Luxembourger | 35 | 0.0% |
| Macedonian | 88 | 0.1% |
| Mexican | 1,933 | 1.9% |
| Mexican American Indian | 48 | 0.1% |
| Moroccan | 9 | 0.0% |
| Native Hawaiian | 67 | 0.1% |
| Nicaraguan | 81 | 0.1% |
| Nigerian | 380 | 0.4% |
| Northern European | 508 | 0.5% |
| Norwegian | 1,012 | 1.0% |
| Osage | 5 | 0.0% |
| Ottawa | 16 | 0.0% |
| Pakistani | 146 | 0.2% |
| Palestinian | 166 | 0.2% |
| Panamanian | 29 | 0.0% |
| Pennsylvania German | 63 | 0.1% |
| Peruvian | 120 | 0.1% |
| Polish | 3,712 | 3.7% |
| Portuguese | 176 | 0.2% |
| Puerto Rican | 202 | 0.2% |
| Romanian | 173 | 0.2% |
| Russian | 768 | 0.8% |
| Samoan | 10 | 0.0% |
| Scandinavian | 256 | 0.3% |
| Scotch-Irish | 905 | 0.9% |
| Scottish | 2,344 | 2.4% |
| Serbian | 194 | 0.2% |
| Sierra Leonean | 92 | 0.1% |
| Sioux | 4 | 0.0% |
| Slavic | 93 | 0.1% |
| Slovak | 622 | 0.6% |
| Slovene | 126 | 0.1% |
| Somali | 47 | 0.1% |
| South African | 184 | 0.2% |
| South American | 1,084 | 1.1% |
| Spaniard | 138 | 0.1% |
| Spanish | 55 | 0.1% |
| Sri Lankan | 424 | 0.4% |
| Subsaharan African | 783 | 0.8% |
| Swedish | 1,188 | 1.2% |
| Swiss | 794 | 0.8% |
| Syrian | 47 | 0.1% |
| Thai | 4,498 | 4.5% |
| Turkish | 179 | 0.2% |
| Ukrainian | 543 | 0.5% |
| Venezuelan | 537 | 0.5% |
| Vietnamese | 35 | 0.0% |
| Welsh | 695 | 0.7% | View All 110 Rows |
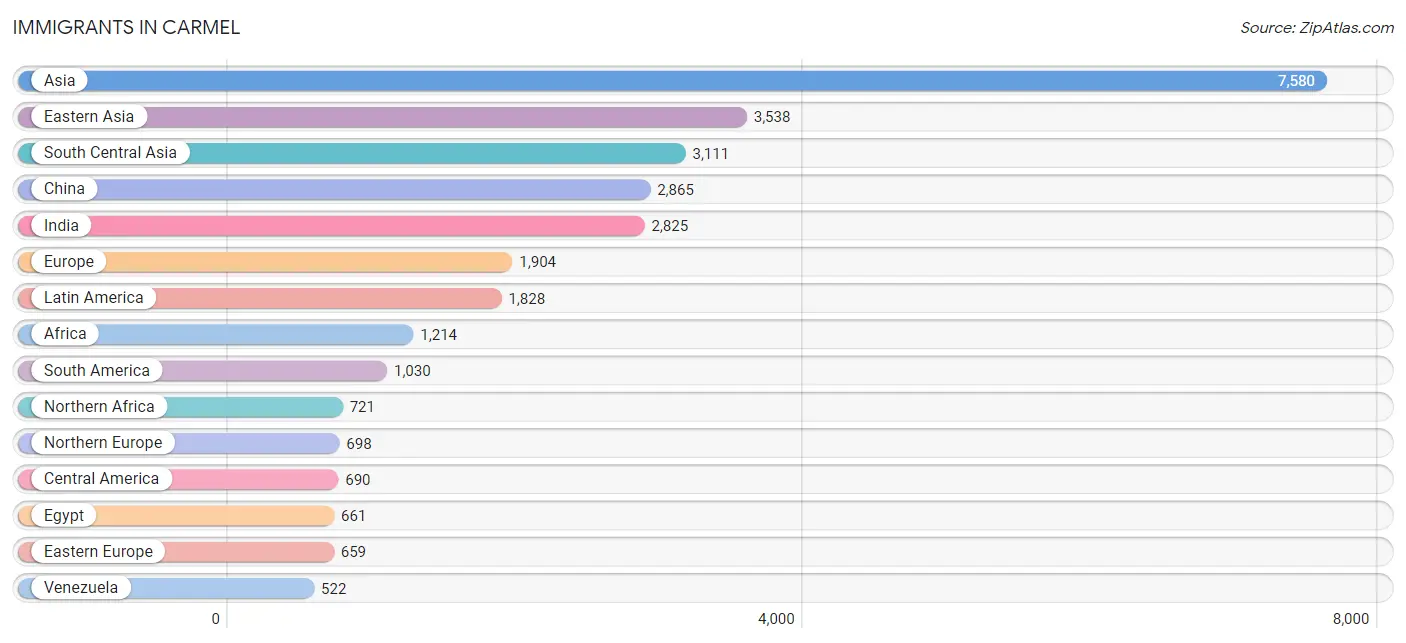
Immigrants in Carmel
The most numerous immigrant groups reported in Carmel came from Asia (7,580 | 7.6%), Eastern Asia (3,538 | 3.6%), South Central Asia (3,111 | 3.1%), China (2,865 | 2.9%), and India (2,825 | 2.8%), together accounting for 20.0% of all Carmel residents.
| Immigration Origin | # Population | % Population |
| Africa | 1,214 | 1.2% |
| Argentina | 13 | 0.0% |
| Armenia | 26 | 0.0% |
| Asia | 7,580 | 7.6% |
| Australia | 33 | 0.0% |
| Bangladesh | 70 | 0.1% |
| Belarus | 9 | 0.0% |
| Brazil | 166 | 0.2% |
| Bulgaria | 33 | 0.0% |
| Canada | 478 | 0.5% |
| Caribbean | 108 | 0.1% |
| Central America | 690 | 0.7% |
| Chile | 18 | 0.0% |
| China | 2,865 | 2.9% |
| Colombia | 187 | 0.2% |
| Costa Rica | 9 | 0.0% |
| Croatia | 15 | 0.0% |
| Cuba | 43 | 0.0% |
| Dominican Republic | 8 | 0.0% |
| Eastern Africa | 56 | 0.1% |
| Eastern Asia | 3,538 | 3.6% |
| Eastern Europe | 659 | 0.7% |
| Egypt | 661 | 0.7% |
| England | 304 | 0.3% |
| Ethiopia | 13 | 0.0% |
| Europe | 1,904 | 1.9% |
| France | 89 | 0.1% |
| Germany | 315 | 0.3% |
| Greece | 49 | 0.1% |
| Guatemala | 124 | 0.1% |
| Haiti | 49 | 0.1% |
| Hong Kong | 240 | 0.2% |
| Hungary | 58 | 0.1% |
| India | 2,825 | 2.8% |
| Indonesia | 16 | 0.0% |
| Iran | 30 | 0.0% |
| Iraq | 103 | 0.1% |
| Ireland | 21 | 0.0% |
| Israel | 23 | 0.0% |
| Italy | 14 | 0.0% |
| Jamaica | 8 | 0.0% |
| Japan | 227 | 0.2% |
| Jordan | 93 | 0.1% |
| Kenya | 16 | 0.0% |
| Korea | 446 | 0.4% |
| Kuwait | 7 | 0.0% |
| Laos | 26 | 0.0% |
| Latin America | 1,828 | 1.8% |
| Latvia | 64 | 0.1% |
| Lebanon | 31 | 0.0% |
| Lithuania | 39 | 0.0% |
| Malaysia | 31 | 0.0% |
| Mexico | 482 | 0.5% |
| Morocco | 9 | 0.0% |
| Nepal | 30 | 0.0% |
| Netherlands | 20 | 0.0% |
| Nicaragua | 52 | 0.1% |
| Nigeria | 365 | 0.4% |
| Northern Africa | 721 | 0.7% |
| Northern Europe | 698 | 0.7% |
| Oceania | 92 | 0.1% |
| Pakistan | 119 | 0.1% |
| Panama | 23 | 0.0% |
| Peru | 92 | 0.1% |
| Philippines | 170 | 0.2% |
| Poland | 13 | 0.0% |
| Portugal | 10 | 0.0% |
| Romania | 24 | 0.0% |
| Russia | 330 | 0.3% |
| Saudi Arabia | 9 | 0.0% |
| Scotland | 94 | 0.1% |
| Sierra Leone | 59 | 0.1% |
| Singapore | 29 | 0.0% |
| South Africa | 13 | 0.0% |
| South America | 1,030 | 1.0% |
| South Central Asia | 3,111 | 3.1% |
| South Eastern Asia | 515 | 0.5% |
| Southern Europe | 86 | 0.1% |
| Spain | 13 | 0.0% |
| Sweden | 55 | 0.1% |
| Switzerland | 37 | 0.0% |
| Taiwan | 231 | 0.2% |
| Thailand | 61 | 0.1% |
| Turkey | 58 | 0.1% |
| Ukraine | 65 | 0.1% |
| Uzbekistan | 37 | 0.0% |
| Venezuela | 522 | 0.5% |
| Vietnam | 182 | 0.2% |
| Western Africa | 424 | 0.4% |
| Western Asia | 369 | 0.4% |
| Western Europe | 461 | 0.5% |
| Zimbabwe | 13 | 0.0% | View All 92 Rows |
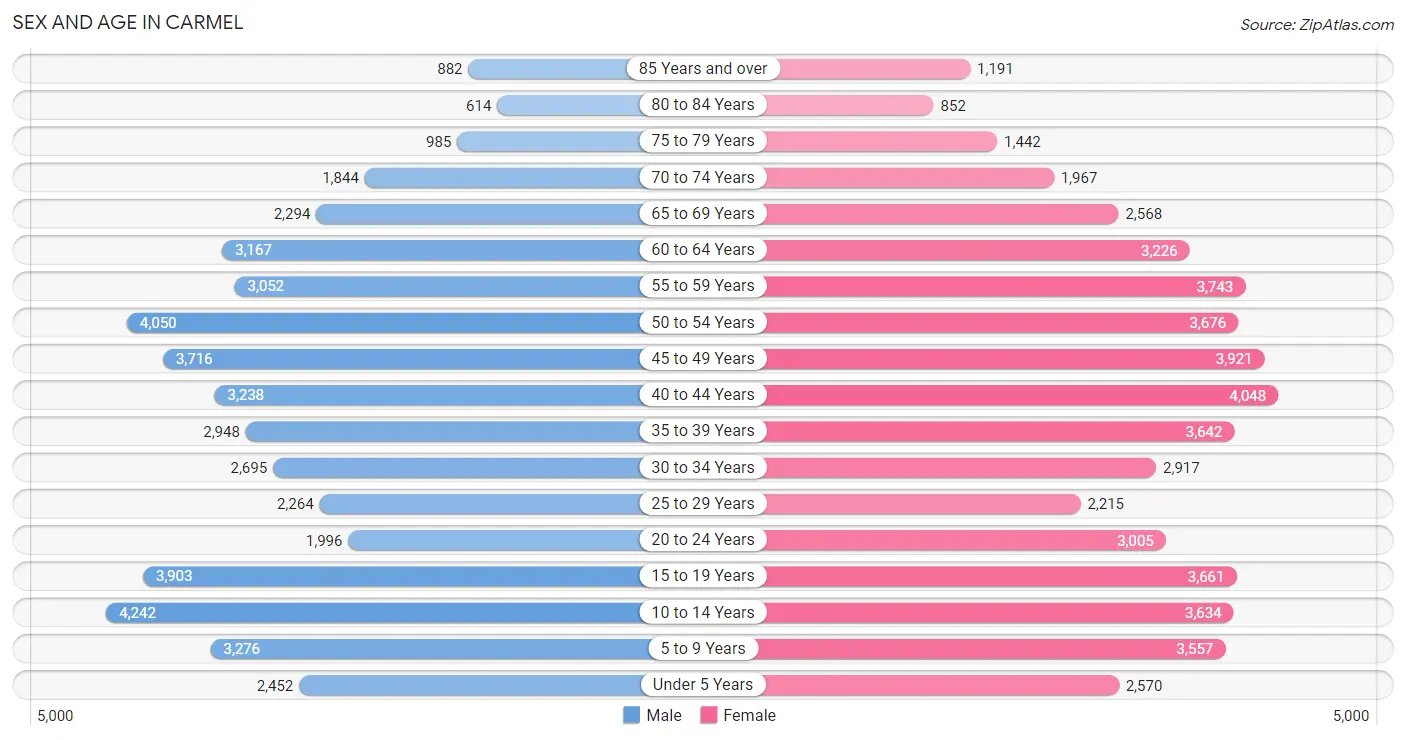
Sex and Age in Carmel
Sex and Age in Carmel
The most populous age groups in Carmel are 10 to 14 Years (4,242 | 8.9%) for men and 40 to 44 Years (4,048 | 7.8%) for women.
| Age Bracket | Male | Female |
| Under 5 Years | 2,452 (5.1%) | 2,570 (5.0%) |
| 5 to 9 Years | 3,276 (6.9%) | 3,557 (6.9%) |
| 10 to 14 Years | 4,242 (8.9%) | 3,634 (7.0%) |
| 15 to 19 Years | 3,903 (8.2%) | 3,661 (7.1%) |
| 20 to 24 Years | 1,996 (4.2%) | 3,005 (5.8%) |
| 25 to 29 Years | 2,264 (4.8%) | 2,215 (4.3%) |
| 30 to 34 Years | 2,695 (5.7%) | 2,917 (5.6%) |
| 35 to 39 Years | 2,948 (6.2%) | 3,642 (7.0%) |
| 40 to 44 Years | 3,238 (6.8%) | 4,048 (7.8%) |
| 45 to 49 Years | 3,716 (7.8%) | 3,921 (7.6%) |
| 50 to 54 Years | 4,050 (8.5%) | 3,676 (7.1%) |
| 55 to 59 Years | 3,052 (6.4%) | 3,743 (7.2%) |
| 60 to 64 Years | 3,167 (6.7%) | 3,226 (6.2%) |
| 65 to 69 Years | 2,294 (4.8%) | 2,568 (5.0%) |
| 70 to 74 Years | 1,844 (3.9%) | 1,967 (3.8%) |
| 75 to 79 Years | 985 (2.1%) | 1,442 (2.8%) |
| 80 to 84 Years | 614 (1.3%) | 852 (1.6%) |
| 85 Years and over | 882 (1.8%) | 1,191 (2.3%) |
| Total | 47,618 (100.0%) | 51,835 (100.0%) |
Families and Households in Carmel
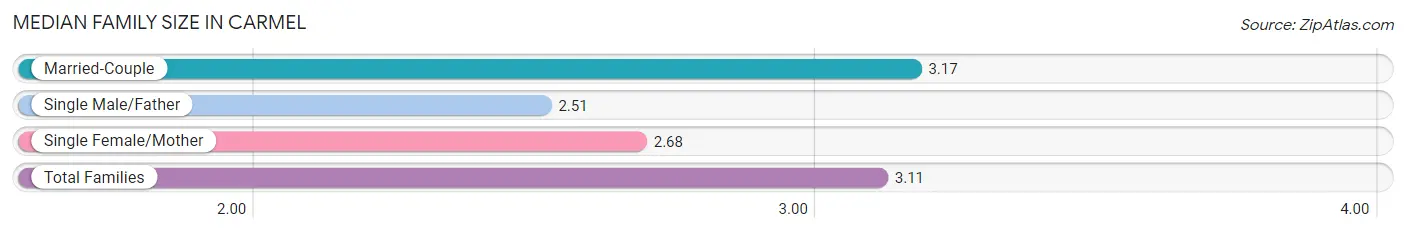
Median Family Size in Carmel
The median family size in Carmel is 3.11 persons per family, with married-couple families (24,309 | 88.2%) accounting for the largest median family size of 3.17 persons per family. On the other hand, single male/father families (599 | 2.2%) represent the smallest median family size with 2.51 persons per family.
| Family Type | # Families | Family Size |
| Married-Couple | 24,309 (88.2%) | 3.17 |
| Single Male/Father | 599 (2.2%) | 2.51 |
| Single Female/Mother | 2,659 (9.7%) | 2.68 |
| Total Families | 27,567 (100.0%) | 3.11 |
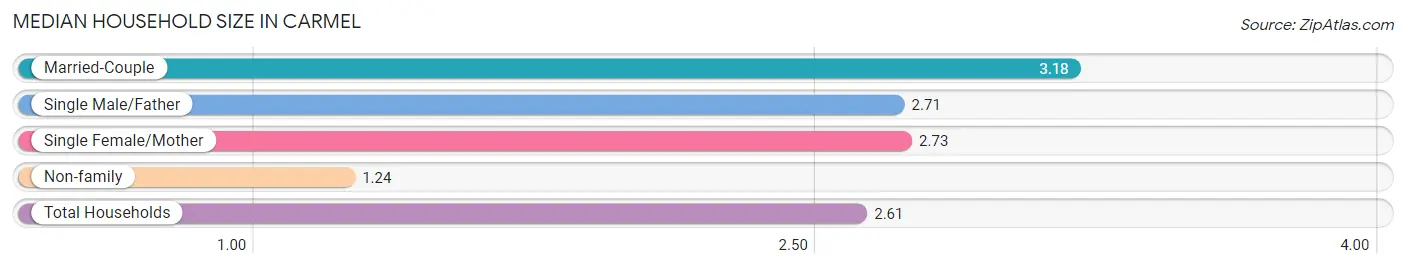
Median Household Size in Carmel
The median household size in Carmel is 2.61 persons per household, with married-couple households (24,309 | 64.2%) accounting for the largest median household size of 3.18 persons per household. non-family households (10,321 | 27.2%) represent the smallest median household size with 1.24 persons per household.
| Household Type | # Households | Household Size |
| Married-Couple | 24,309 (64.2%) | 3.18 |
| Single Male/Father | 599 (1.6%) | 2.71 |
| Single Female/Mother | 2,659 (7.0%) | 2.73 |
| Non-family | 10,321 (27.2%) | 1.24 |
| Total Households | 37,888 (100.0%) | 2.61 |
Household Size by Marriage Status in Carmel
Out of a total of 37,888 households in Carmel, 27,567 (72.8%) are family households, while 10,321 (27.2%) are nonfamily households. The most numerous type of family households are 2-person households, comprising 11,672, and the most common type of nonfamily households are 1-person households, comprising 8,348.
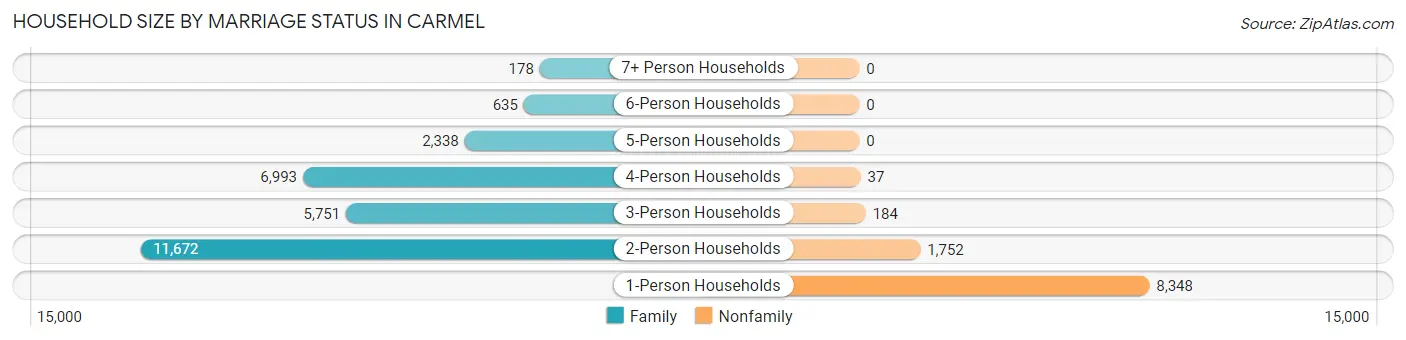
| Household Size | Family Households | Nonfamily Households |
| 1-Person Households | - | 8,348 (22.0%) |
| 2-Person Households | 11,672 (30.8%) | 1,752 (4.6%) |
| 3-Person Households | 5,751 (15.2%) | 184 (0.5%) |
| 4-Person Households | 6,993 (18.5%) | 37 (0.1%) |
| 5-Person Households | 2,338 (6.2%) | 0 (0.0%) |
| 6-Person Households | 635 (1.7%) | 0 (0.0%) |
| 7+ Person Households | 178 (0.5%) | 0 (0.0%) |
| Total | 27,567 (72.8%) | 10,321 (27.2%) |
Female Fertility in Carmel
Fertility by Age in Carmel
Average fertility rate in Carmel is 46.0 births per 1,000 women. Women in the age bracket of 20 to 34 years have the highest fertility rate with 67.0 births per 1,000 women. Women in the age bracket of 35 to 50 years acount for 51.1% of all women with births.
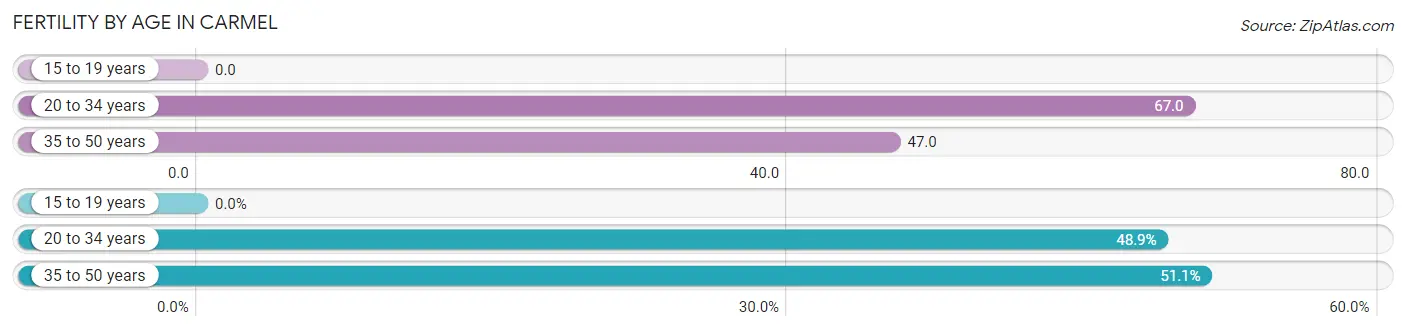
| Age Bracket | Women with Births | Births / 1,000 Women |
| 15 to 19 years | 0 (0.0%) | 0.0 |
| 20 to 34 years | 545 (48.9%) | 67.0 |
| 35 to 50 years | 570 (51.1%) | 47.0 |
| Total | 1,115 (100.0%) | 46.0 |
Fertility by Age by Marriage Status in Carmel
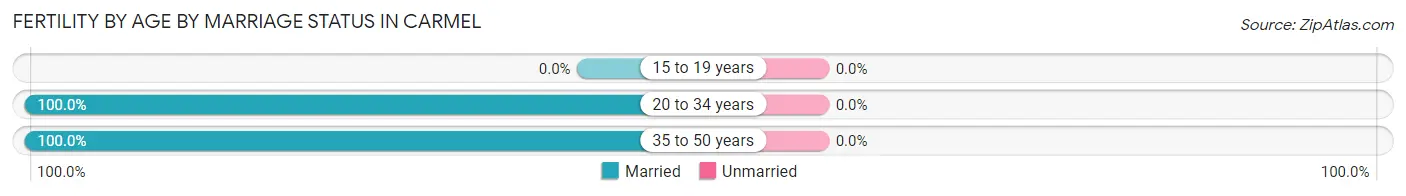
| Age Bracket | Married | Unmarried |
| 15 to 19 years | 0 (0.0%) | 0 (0.0%) |
| 20 to 34 years | 545 (100.0%) | 0 (0.0%) |
| 35 to 50 years | 570 (100.0%) | 0 (0.0%) |
| Total | 1,115 (100.0%) | 0 (0.0%) |
Fertility by Education in Carmel
Average fertility rate in Carmel is 46.0 births per 1,000 women. Women with the education attainment of graduate degree have the highest fertility rate of 94.0 births per 1,000 women, while women with the education attainment of college or associate's degree have the lowest fertility at 3.0 births per 1,000 women. Women with the education attainment of graduate degree represent 51.4% of all women with births.
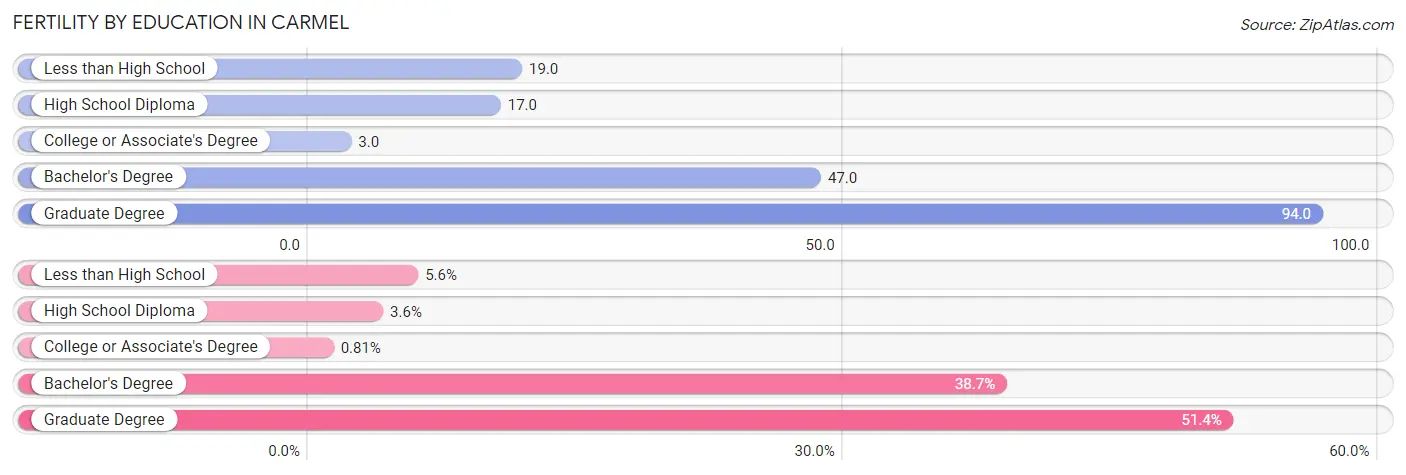
| Educational Attainment | Women with Births | Births / 1,000 Women |
| Less than High School | 62 (5.6%) | 19.0 |
| High School Diploma | 40 (3.6%) | 17.0 |
| College or Associate's Degree | 9 (0.8%) | 3.0 |
| Bachelor's Degree | 431 (38.7%) | 47.0 |
| Graduate Degree | 573 (51.4%) | 94.0 |
| Total | 1,115 (100.0%) | 46.0 |
Fertility by Education by Marriage Status in Carmel
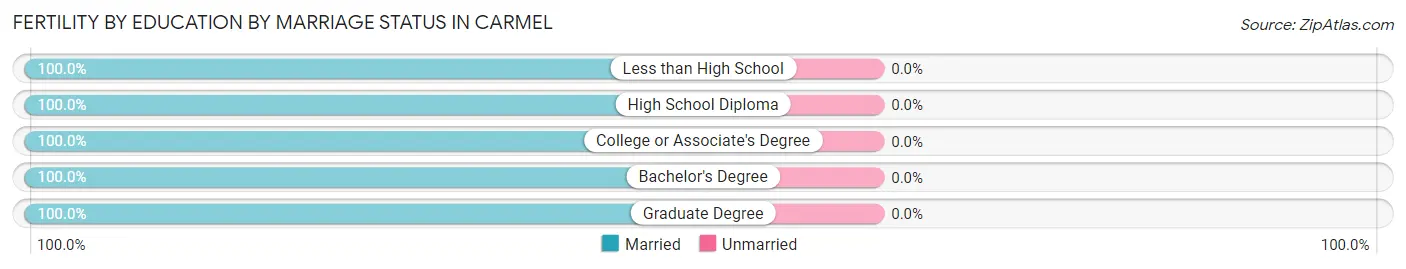
| Educational Attainment | Married | Unmarried |
| Less than High School | 62 (100.0%) | 0 (0.0%) |
| High School Diploma | 40 (100.0%) | 0 (0.0%) |
| College or Associate's Degree | 9 (100.0%) | 0 (0.0%) |
| Bachelor's Degree | 431 (100.0%) | 0 (0.0%) |
| Graduate Degree | 573 (100.0%) | 0 (0.0%) |
| Total | 1,115 (100.0%) | 0 (0.0%) |
Employment Characteristics in Carmel
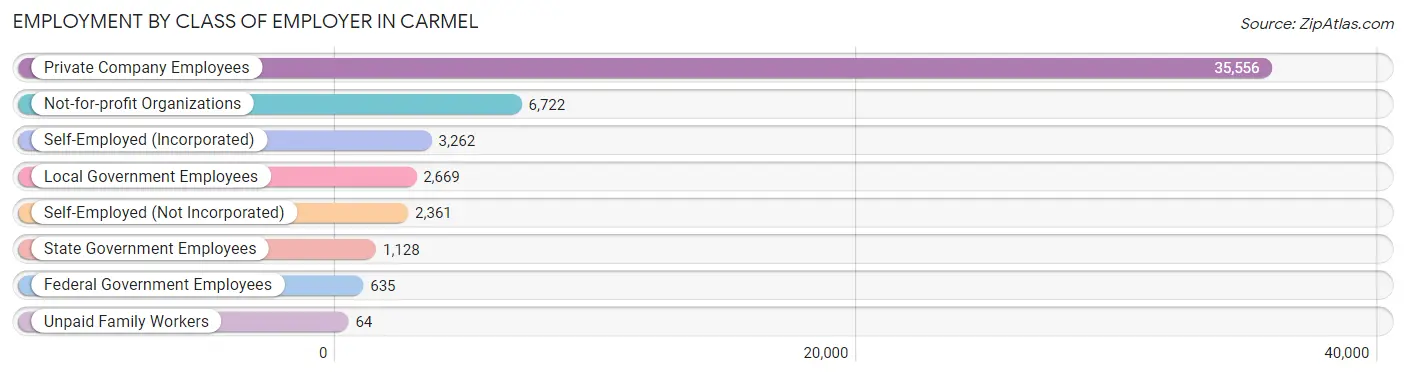
Employment by Class of Employer in Carmel
Among the 52,397 employed individuals in Carmel, private company employees (35,556 | 67.9%), not-for-profit organizations (6,722 | 12.8%), and self-employed (incorporated) (3,262 | 6.2%) make up the most common classes of employment.
| Employer Class | # Employees | % Employees |
| Private Company Employees | 35,556 | 67.9% |
| Self-Employed (Incorporated) | 3,262 | 6.2% |
| Self-Employed (Not Incorporated) | 2,361 | 4.5% |
| Not-for-profit Organizations | 6,722 | 12.8% |
| Local Government Employees | 2,669 | 5.1% |
| State Government Employees | 1,128 | 2.1% |
| Federal Government Employees | 635 | 1.2% |
| Unpaid Family Workers | 64 | 0.1% |
| Total | 52,397 | 100.0% |
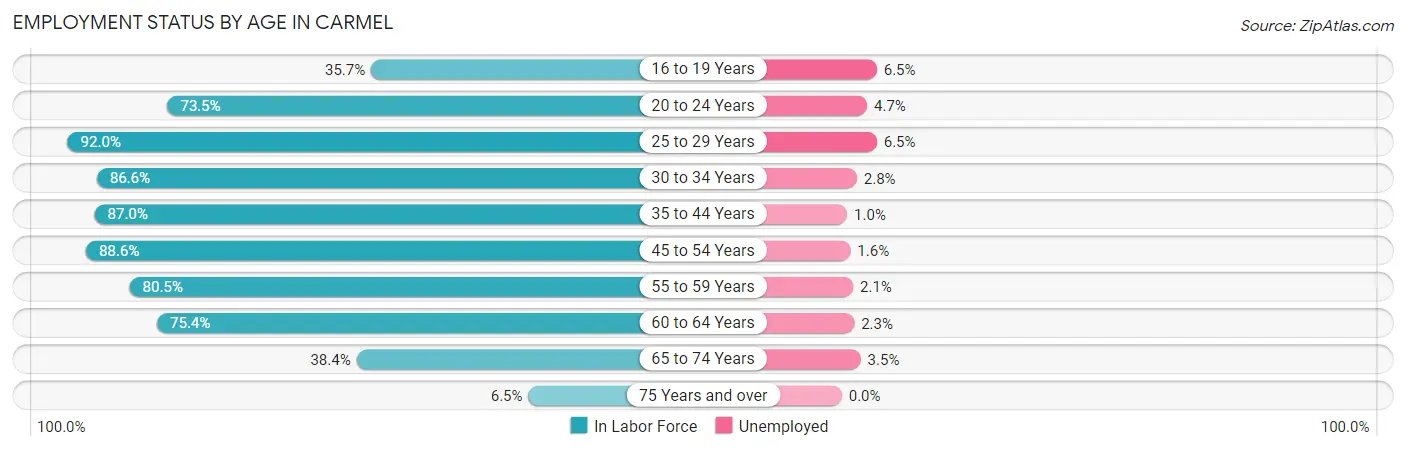
Employment Status by Age in Carmel
According to the labor force statistics for Carmel, out of the total population over 16 years of age (78,168), 69.7% or 54,483 individuals are in the labor force, with 2.6% or 1,417 of them unemployed. The age group with the highest labor force participation rate is 25 to 29 years, with 92.0% or 4,121 individuals in the labor force. Within the labor force, the 16 to 19 years age range has the highest percentage of unemployed individuals, with 6.5% or 139 of them being unemployed.
| Age Bracket | In Labor Force | Unemployed |
| 16 to 19 Years | 2,146 (35.7%) | 139 (6.5%) |
| 20 to 24 Years | 3,676 (73.5%) | 173 (4.7%) |
| 25 to 29 Years | 4,121 (92.0%) | 268 (6.5%) |
| 30 to 34 Years | 4,860 (86.6%) | 136 (2.8%) |
| 35 to 44 Years | 12,072 (87.0%) | 121 (1.0%) |
| 45 to 54 Years | 13,612 (88.6%) | 218 (1.6%) |
| 55 to 59 Years | 5,470 (80.5%) | 115 (2.1%) |
| 60 to 64 Years | 4,820 (75.4%) | 111 (2.3%) |
| 65 to 74 Years | 3,330 (38.4%) | 117 (3.5%) |
| 75 Years and over | 388 (6.5%) | 0 (0.0%) |
| Total | 54,483 (69.7%) | 1,417 (2.6%) |
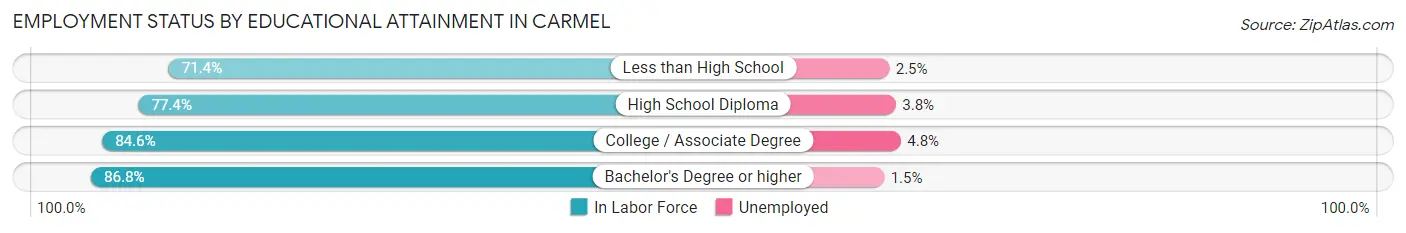
Employment Status by Educational Attainment in Carmel
According to labor force statistics for Carmel, 85.6% of individuals (44,955) out of the total population between 25 and 64 years of age (52,518) are in the labor force, with 2.2% or 989 of them being unemployed. The group with the highest labor force participation rate are those with the educational attainment of bachelor's degree or higher, with 86.8% or 35,065 individuals in the labor force. Within the labor force, individuals with college / associate degree education have the highest percentage of unemployment, with 4.8% or 308 of them being unemployed.
| Educational Attainment | In Labor Force | Unemployed |
| Less than High School | 668 (71.4%) | 23 (2.5%) |
| High School Diploma | 2,795 (77.4%) | 137 (3.8%) |
| College / Associate Degree | 6,408 (84.6%) | 364 (4.8%) |
| Bachelor's Degree or higher | 35,065 (86.8%) | 606 (1.5%) |
| Total | 44,955 (85.6%) | 1,155 (2.2%) |
Employment Occupations by Sex in Carmel
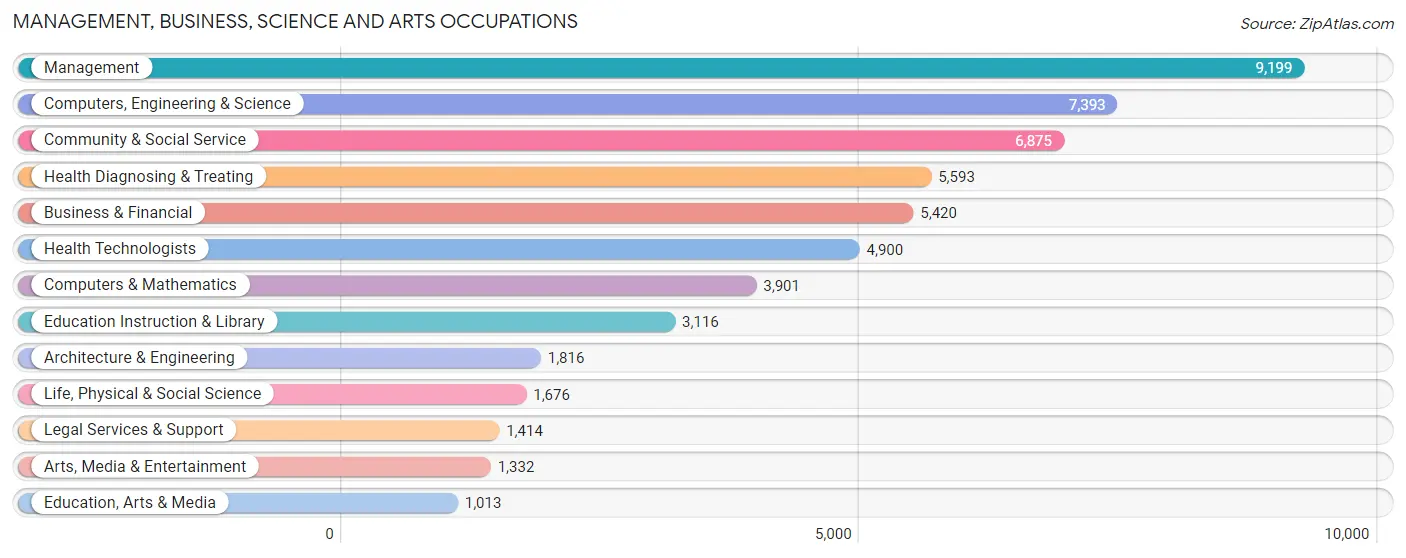
Management, Business, Science and Arts Occupations
The most common Management, Business, Science and Arts occupations in Carmel are Management (9,199 | 17.3%), Computers, Engineering & Science (7,393 | 13.9%), Community & Social Service (6,875 | 13.0%), Health Diagnosing & Treating (5,593 | 10.5%), and Business & Financial (5,420 | 10.2%).
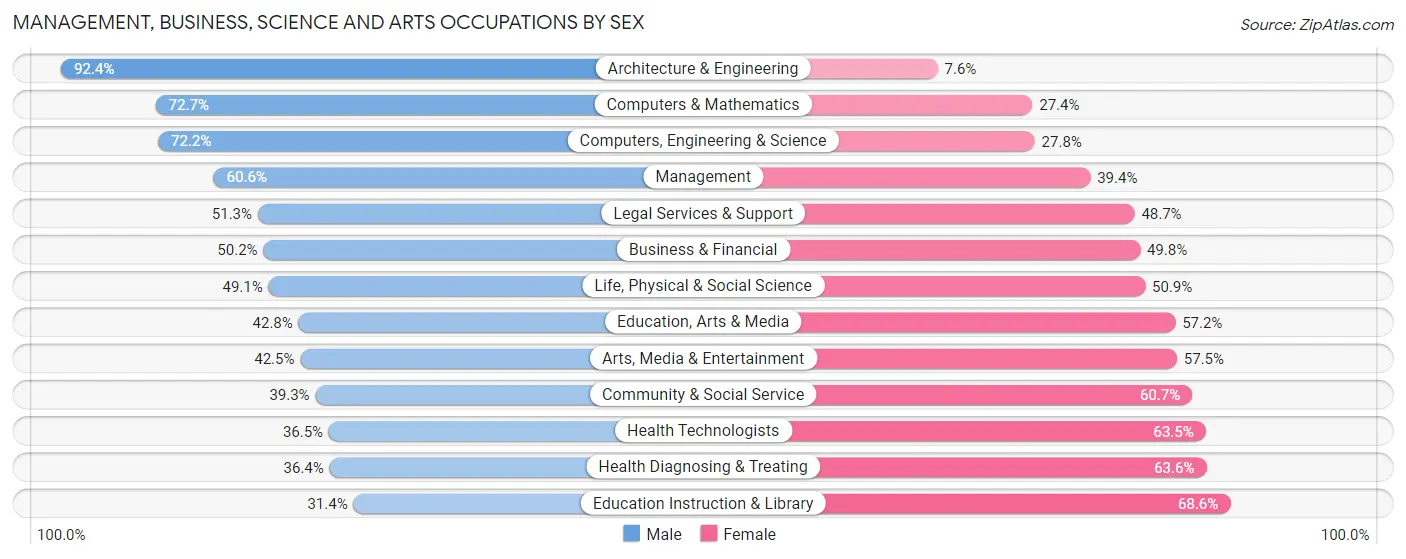
Management, Business, Science and Arts Occupations by Sex
Within the Management, Business, Science and Arts occupations in Carmel, the most male-oriented occupations are Architecture & Engineering (92.4%), Computers & Mathematics (72.7%), and Computers, Engineering & Science (72.2%), while the most female-oriented occupations are Education Instruction & Library (68.6%), Health Diagnosing & Treating (63.6%), and Health Technologists (63.5%).
| Occupation | Male | Female |
| Management | 5,571 (60.6%) | 3,628 (39.4%) |
| Business & Financial | 2,720 (50.2%) | 2,700 (49.8%) |
| Computers, Engineering & Science | 5,335 (72.2%) | 2,058 (27.8%) |
| Computers & Mathematics | 2,834 (72.7%) | 1,067 (27.4%) |
| Architecture & Engineering | 1,678 (92.4%) | 138 (7.6%) |
| Life, Physical & Social Science | 823 (49.1%) | 853 (50.9%) |
| Community & Social Service | 2,704 (39.3%) | 4,171 (60.7%) |
| Education, Arts & Media | 434 (42.8%) | 579 (57.2%) |
| Legal Services & Support | 726 (51.3%) | 688 (48.7%) |
| Education Instruction & Library | 978 (31.4%) | 2,138 (68.6%) |
| Arts, Media & Entertainment | 566 (42.5%) | 766 (57.5%) |
| Health Diagnosing & Treating | 2,034 (36.4%) | 3,559 (63.6%) |
| Health Technologists | 1,789 (36.5%) | 3,111 (63.5%) |
| Total (Category) | 18,364 (53.3%) | 16,116 (46.7%) |
| Total (Overall) | 27,876 (52.5%) | 25,195 (47.5%) |
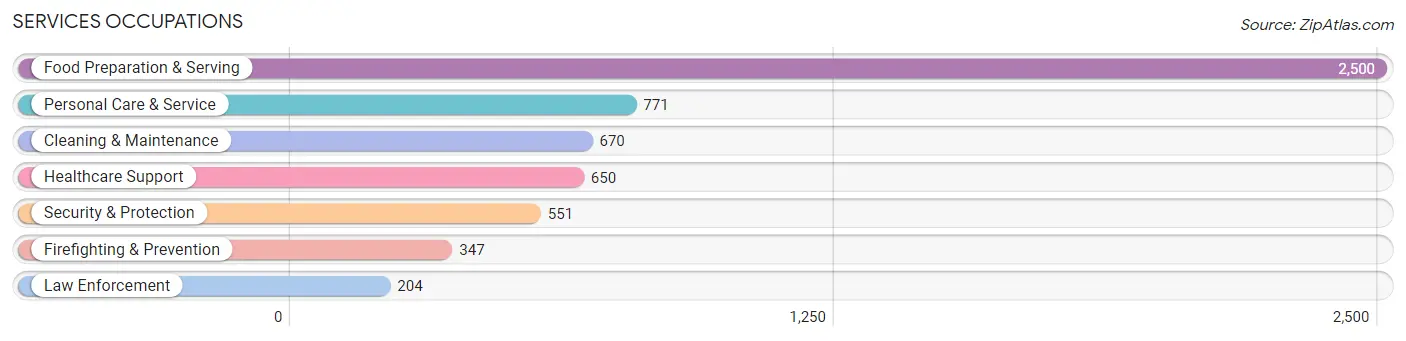
Services Occupations
The most common Services occupations in Carmel are Food Preparation & Serving (2,500 | 4.7%), Personal Care & Service (771 | 1.5%), Cleaning & Maintenance (670 | 1.3%), Healthcare Support (650 | 1.2%), and Security & Protection (551 | 1.0%).
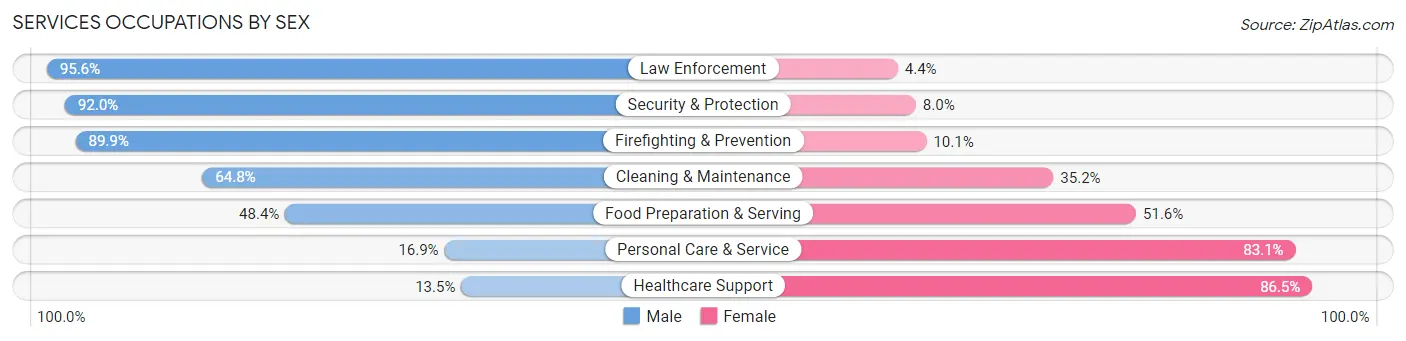
Services Occupations by Sex
Within the Services occupations in Carmel, the most male-oriented occupations are Law Enforcement (95.6%), Security & Protection (92.0%), and Firefighting & Prevention (89.9%), while the most female-oriented occupations are Healthcare Support (86.5%), Personal Care & Service (83.1%), and Food Preparation & Serving (51.6%).
| Occupation | Male | Female |
| Healthcare Support | 88 (13.5%) | 562 (86.5%) |
| Security & Protection | 507 (92.0%) | 44 (8.0%) |
| Firefighting & Prevention | 312 (89.9%) | 35 (10.1%) |
| Law Enforcement | 195 (95.6%) | 9 (4.4%) |
| Food Preparation & Serving | 1,210 (48.4%) | 1,290 (51.6%) |
| Cleaning & Maintenance | 434 (64.8%) | 236 (35.2%) |
| Personal Care & Service | 130 (16.9%) | 641 (83.1%) |
| Total (Category) | 2,369 (46.1%) | 2,773 (53.9%) |
| Total (Overall) | 27,876 (52.5%) | 25,195 (47.5%) |
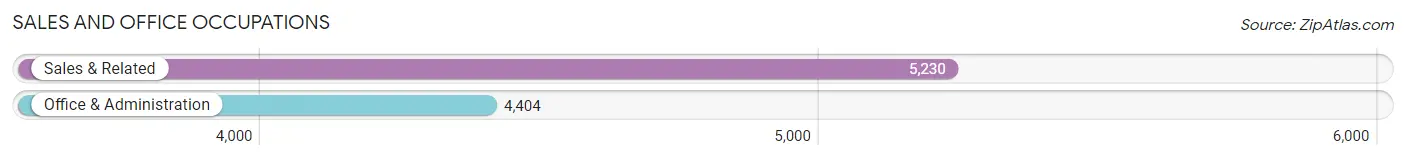
Sales and Office Occupations
The most common Sales and Office occupations in Carmel are Sales & Related (5,230 | 9.9%), and Office & Administration (4,404 | 8.3%).
Sales and Office Occupations by Sex
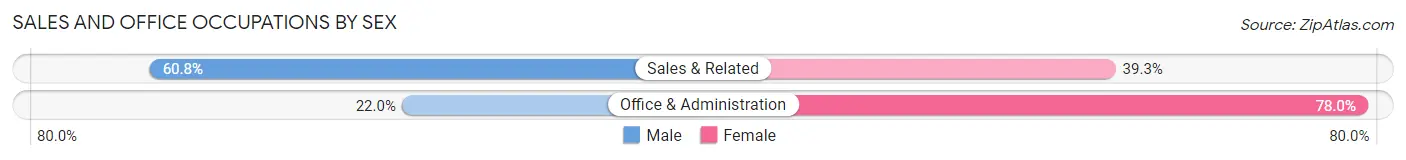
| Occupation | Male | Female |
| Sales & Related | 3,177 (60.8%) | 2,053 (39.3%) |
| Office & Administration | 968 (22.0%) | 3,436 (78.0%) |
| Total (Category) | 4,145 (43.0%) | 5,489 (57.0%) |
| Total (Overall) | 27,876 (52.5%) | 25,195 (47.5%) |
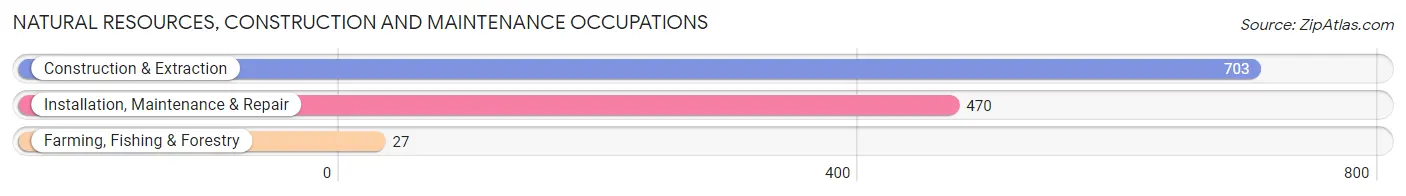
Natural Resources, Construction and Maintenance Occupations
The most common Natural Resources, Construction and Maintenance occupations in Carmel are Construction & Extraction (703 | 1.3%), Installation, Maintenance & Repair (470 | 0.9%), and Farming, Fishing & Forestry (27 | 0.1%).
Natural Resources, Construction and Maintenance Occupations by Sex
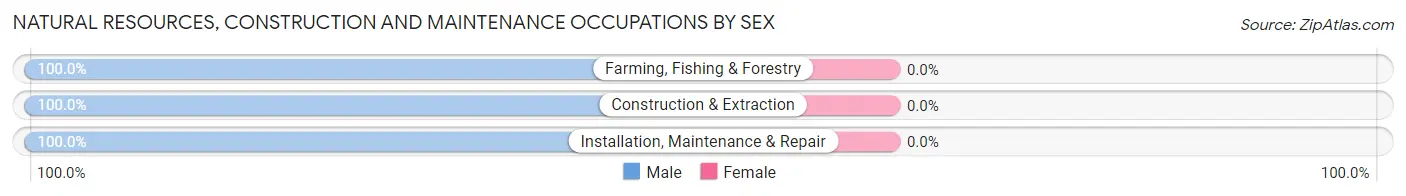
| Occupation | Male | Female |
| Farming, Fishing & Forestry | 27 (100.0%) | 0 (0.0%) |
| Construction & Extraction | 703 (100.0%) | 0 (0.0%) |
| Installation, Maintenance & Repair | 470 (100.0%) | 0 (0.0%) |
| Total (Category) | 1,200 (100.0%) | 0 (0.0%) |
| Total (Overall) | 27,876 (52.5%) | 25,195 (47.5%) |
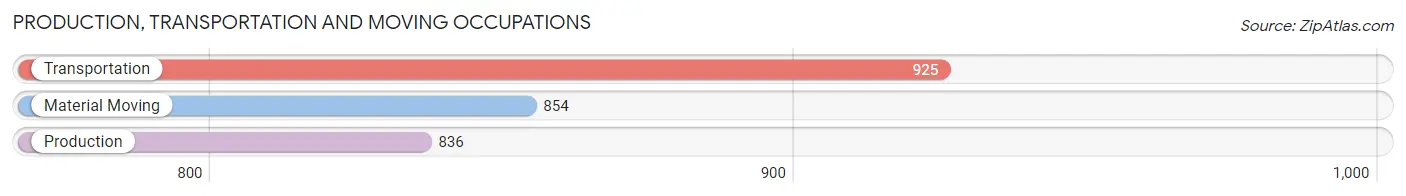
Production, Transportation and Moving Occupations
The most common Production, Transportation and Moving occupations in Carmel are Transportation (925 | 1.7%), Material Moving (854 | 1.6%), and Production (836 | 1.6%).
Production, Transportation and Moving Occupations by Sex
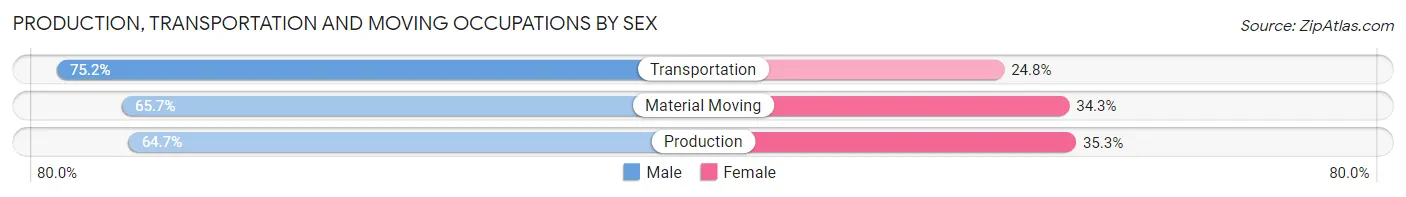
| Occupation | Male | Female |
| Production | 541 (64.7%) | 295 (35.3%) |
| Transportation | 696 (75.2%) | 229 (24.8%) |
| Material Moving | 561 (65.7%) | 293 (34.3%) |
| Total (Category) | 1,798 (68.8%) | 817 (31.2%) |
| Total (Overall) | 27,876 (52.5%) | 25,195 (47.5%) |
Employment Industries by Sex in Carmel
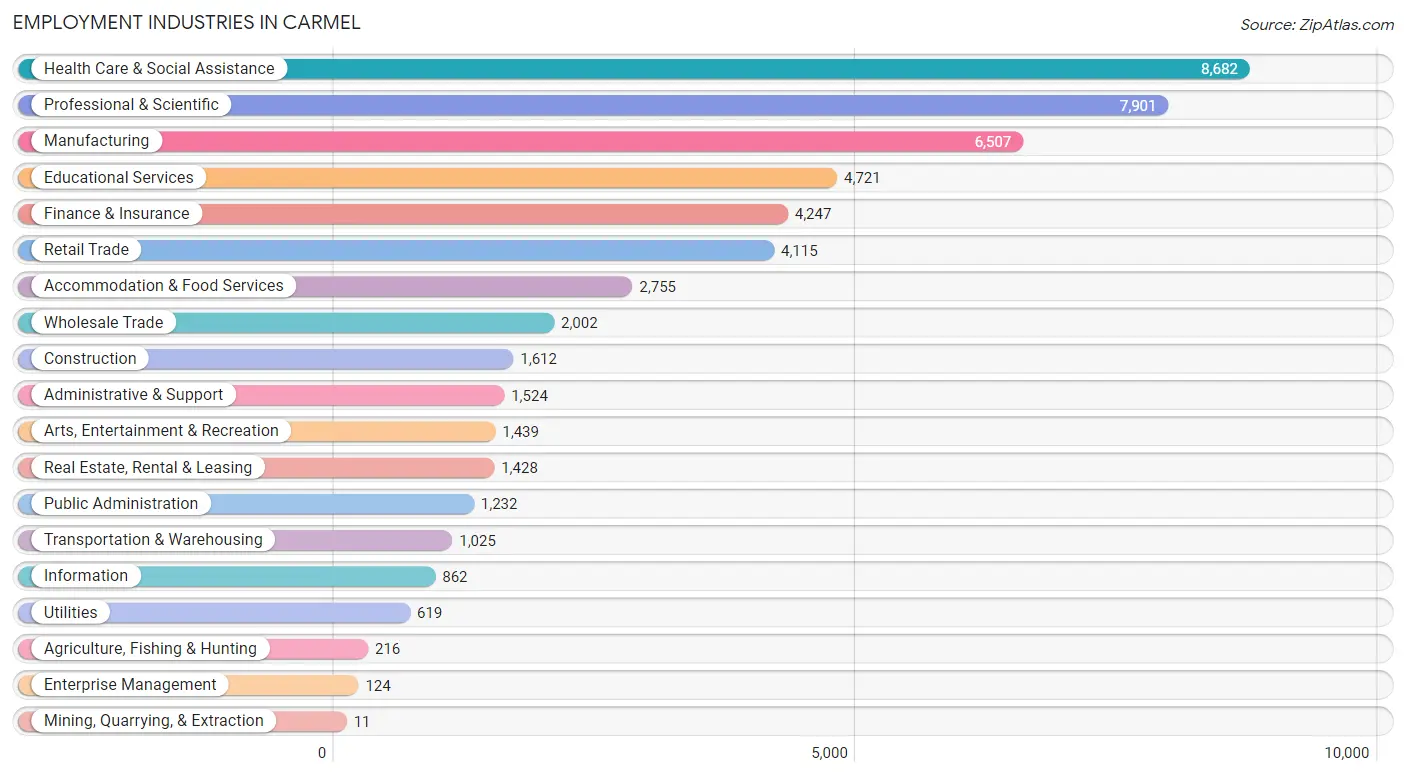
Employment Industries in Carmel
The major employment industries in Carmel include Health Care & Social Assistance (8,682 | 16.4%), Professional & Scientific (7,901 | 14.9%), Manufacturing (6,507 | 12.3%), Educational Services (4,721 | 8.9%), and Finance & Insurance (4,247 | 8.0%).
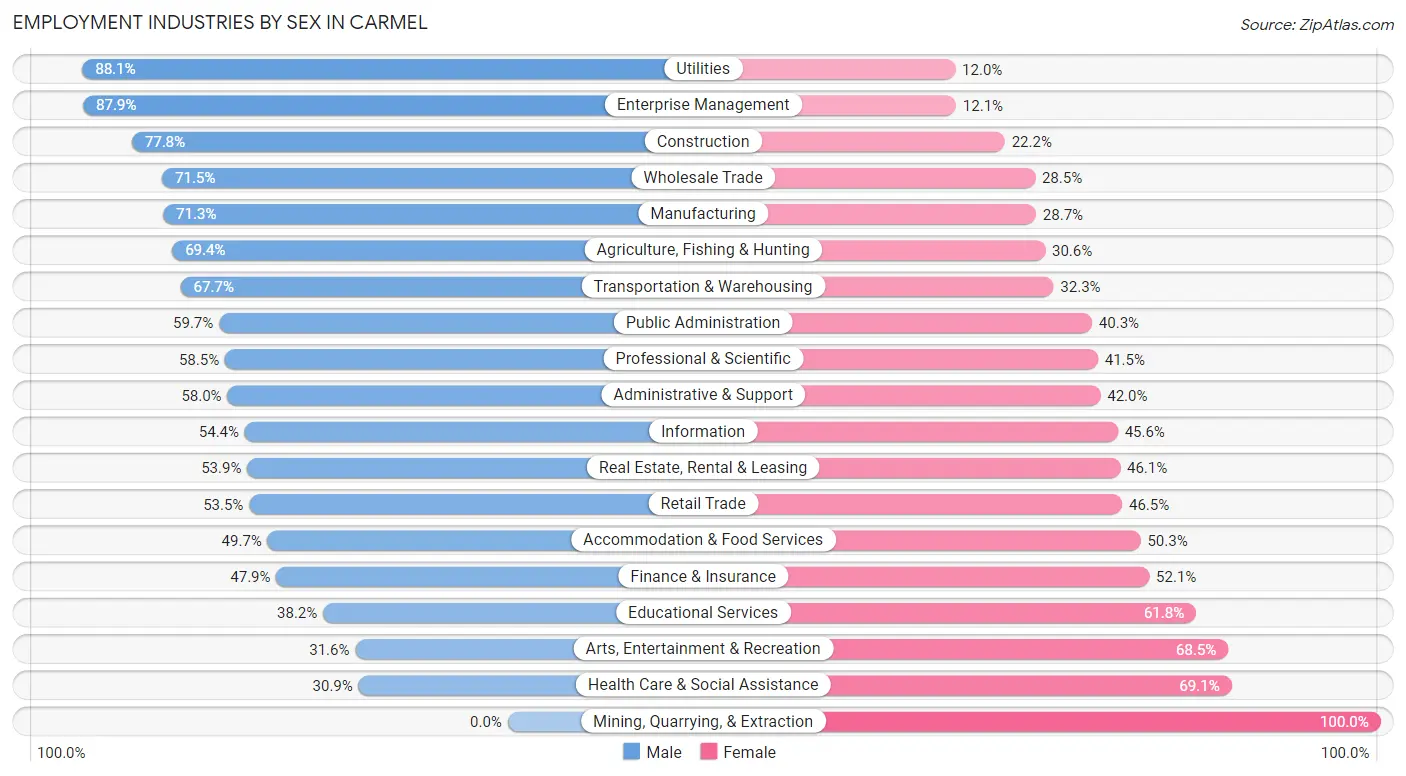
Employment Industries by Sex in Carmel
The Carmel industries that see more men than women are Utilities (88.0%), Enterprise Management (87.9%), and Construction (77.8%), whereas the industries that tend to have a higher number of women are Mining, Quarrying, & Extraction (100.0%), Health Care & Social Assistance (69.1%), and Arts, Entertainment & Recreation (68.4%).
| Industry | Male | Female |
| Agriculture, Fishing & Hunting | 150 (69.4%) | 66 (30.6%) |
| Mining, Quarrying, & Extraction | 0 (0.0%) | 11 (100.0%) |
| Construction | 1,254 (77.8%) | 358 (22.2%) |
| Manufacturing | 4,642 (71.3%) | 1,865 (28.7%) |
| Wholesale Trade | 1,432 (71.5%) | 570 (28.5%) |
| Retail Trade | 2,202 (53.5%) | 1,913 (46.5%) |
| Transportation & Warehousing | 694 (67.7%) | 331 (32.3%) |
| Utilities | 545 (88.0%) | 74 (11.9%) |
| Information | 469 (54.4%) | 393 (45.6%) |
| Finance & Insurance | 2,034 (47.9%) | 2,213 (52.1%) |
| Real Estate, Rental & Leasing | 770 (53.9%) | 658 (46.1%) |
| Professional & Scientific | 4,624 (58.5%) | 3,277 (41.5%) |
| Enterprise Management | 109 (87.9%) | 15 (12.1%) |
| Administrative & Support | 884 (58.0%) | 640 (42.0%) |
| Educational Services | 1,804 (38.2%) | 2,917 (61.8%) |
| Health Care & Social Assistance | 2,679 (30.9%) | 6,003 (69.1%) |
| Arts, Entertainment & Recreation | 454 (31.6%) | 985 (68.4%) |
| Accommodation & Food Services | 1,369 (49.7%) | 1,386 (50.3%) |
| Public Administration | 736 (59.7%) | 496 (40.3%) |
| Total | 27,876 (52.5%) | 25,195 (47.5%) |
Education in Carmel
School Enrollment in Carmel
The most common levels of schooling among the 26,860 students in Carmel are high school (7,264 | 27.0%), middle school (6,330 | 23.6%), and elementary school (5,286 | 19.7%).
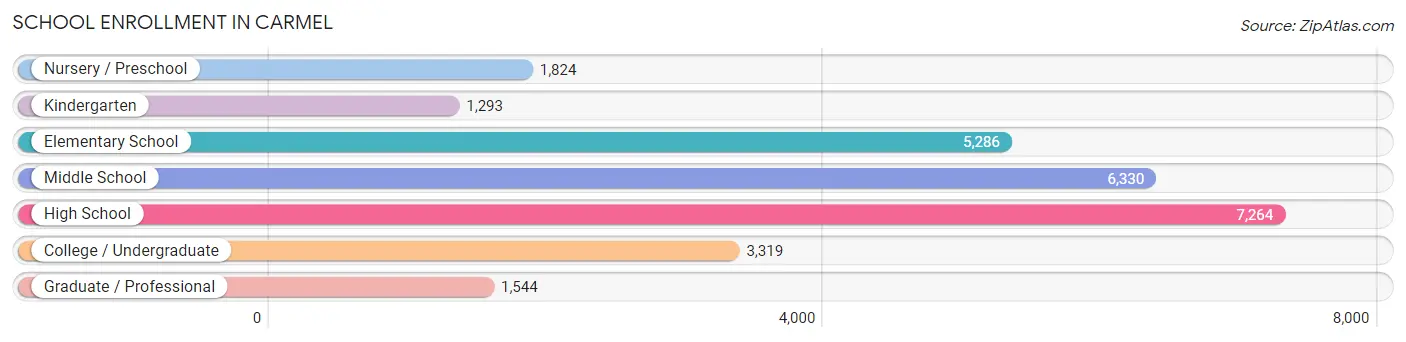
| School Level | # Students | % Students |
| Nursery / Preschool | 1,824 | 6.8% |
| Kindergarten | 1,293 | 4.8% |
| Elementary School | 5,286 | 19.7% |
| Middle School | 6,330 | 23.6% |
| High School | 7,264 | 27.0% |
| College / Undergraduate | 3,319 | 12.4% |
| Graduate / Professional | 1,544 | 5.8% |
| Total | 26,860 | 100.0% |
School Enrollment by Age by Funding Source in Carmel
Out of a total of 26,860 students who are enrolled in schools in Carmel, 6,178 (23.0%) attend a private institution, while the remaining 20,682 (77.0%) are enrolled in public schools. The age group of 3 to 4 year olds has the highest likelihood of being enrolled in private schools, with 1,058 (80.0% in the age bracket) enrolled. Conversely, the age group of 10 to 14 year olds has the lowest likelihood of being enrolled in a private school, with 6,686 (85.6% in the age bracket) attending a public institution.
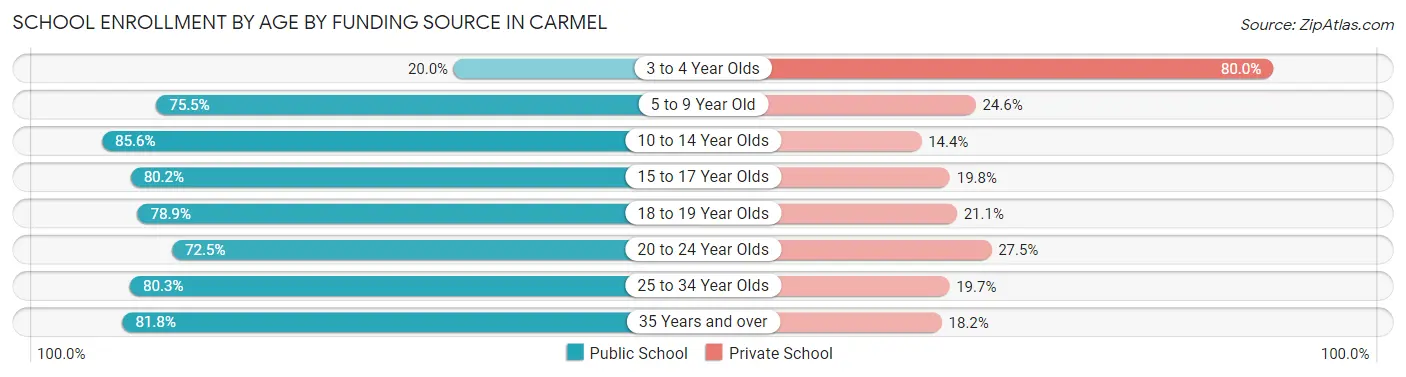
| Age Bracket | Public School | Private School |
| 3 to 4 Year Olds | 265 (20.0%) | 1,058 (80.0%) |
| 5 to 9 Year Old | 4,809 (75.4%) | 1,565 (24.5%) |
| 10 to 14 Year Olds | 6,686 (85.6%) | 1,128 (14.4%) |
| 15 to 17 Year Olds | 3,863 (80.2%) | 952 (19.8%) |
| 18 to 19 Year Olds | 1,829 (78.9%) | 488 (21.1%) |
| 20 to 24 Year Olds | 1,565 (72.5%) | 593 (27.5%) |
| 25 to 34 Year Olds | 760 (80.3%) | 186 (19.7%) |
| 35 Years and over | 910 (81.8%) | 203 (18.2%) |
| Total | 20,682 (77.0%) | 6,178 (23.0%) |
Educational Attainment by Field of Study in Carmel
Business (11,707 | 22.2%), science & technology (6,290 | 11.9%), education (5,348 | 10.1%), engineering (4,597 | 8.7%), and bio, nature & agricultural (4,067 | 7.7%) are the most common fields of study among 52,816 individuals in Carmel who have obtained a bachelor's degree or higher.
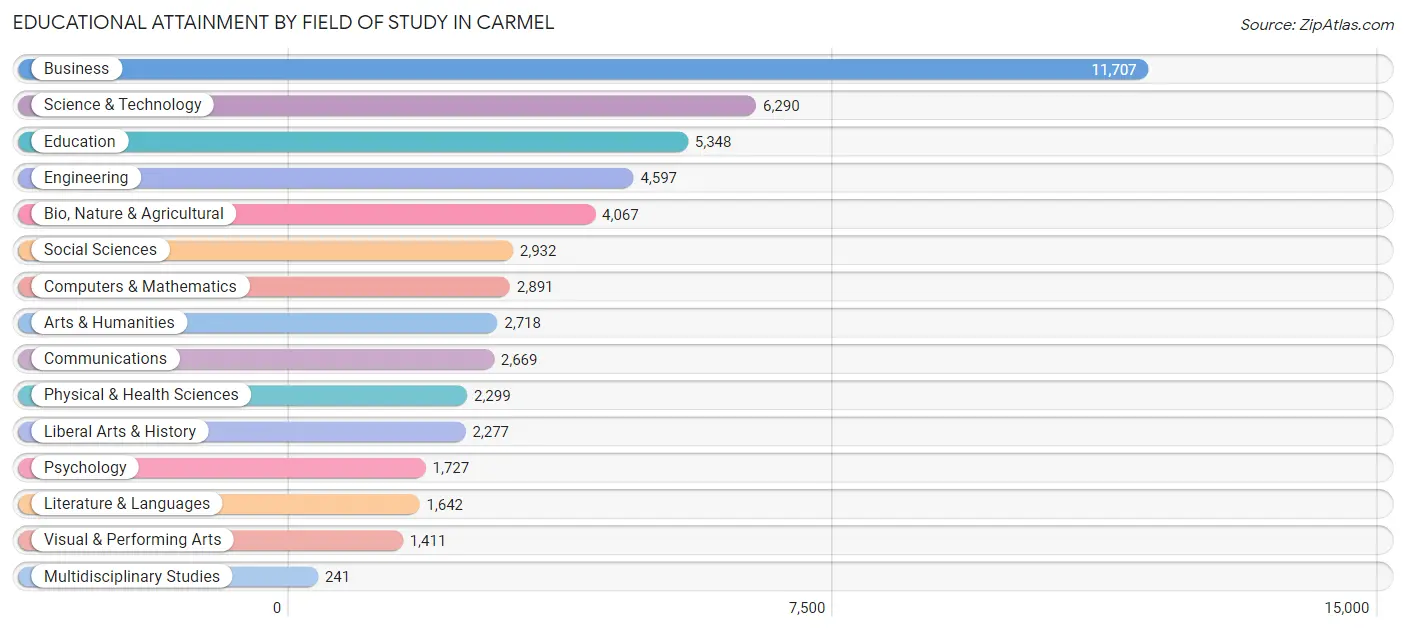
| Field of Study | # Graduates | % Graduates |
| Computers & Mathematics | 2,891 | 5.5% |
| Bio, Nature & Agricultural | 4,067 | 7.7% |
| Physical & Health Sciences | 2,299 | 4.3% |
| Psychology | 1,727 | 3.3% |
| Social Sciences | 2,932 | 5.6% |
| Engineering | 4,597 | 8.7% |
| Multidisciplinary Studies | 241 | 0.5% |
| Science & Technology | 6,290 | 11.9% |
| Business | 11,707 | 22.2% |
| Education | 5,348 | 10.1% |
| Literature & Languages | 1,642 | 3.1% |
| Liberal Arts & History | 2,277 | 4.3% |
| Visual & Performing Arts | 1,411 | 2.7% |
| Communications | 2,669 | 5.1% |
| Arts & Humanities | 2,718 | 5.1% |
| Total | 52,816 | 100.0% |
Transportation & Commute in Carmel
Vehicle Availability by Sex in Carmel
The most prevalent vehicle ownership categories in Carmel are males with 2 vehicles (14,253, accounting for 51.7%) and females with 2 vehicles (12,917, making up 57.4%).
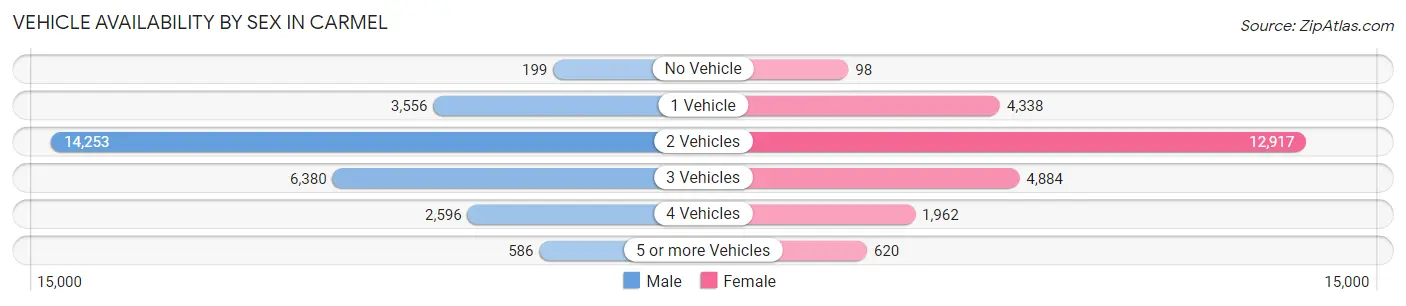
| Vehicles Available | Male | Female |
| No Vehicle | 199 (0.7%) | 98 (0.4%) |
| 1 Vehicle | 3,556 (12.9%) | 4,338 (17.5%) |
| 2 Vehicles | 14,253 (51.7%) | 12,917 (52.0%) |
| 3 Vehicles | 6,380 (23.1%) | 4,884 (19.7%) |
| 4 Vehicles | 2,596 (9.4%) | 1,962 (7.9%) |
| 5 or more Vehicles | 586 (2.1%) | 620 (2.5%) |
| Total | 27,570 (100.0%) | 24,819 (100.0%) |
Commute Time in Carmel
The most frequently occuring commute durations in Carmel are 15 to 19 minutes (7,312 commuters, 17.7%), 30 to 34 minutes (6,059 commuters, 14.7%), and 10 to 14 minutes (6,007 commuters, 14.6%).
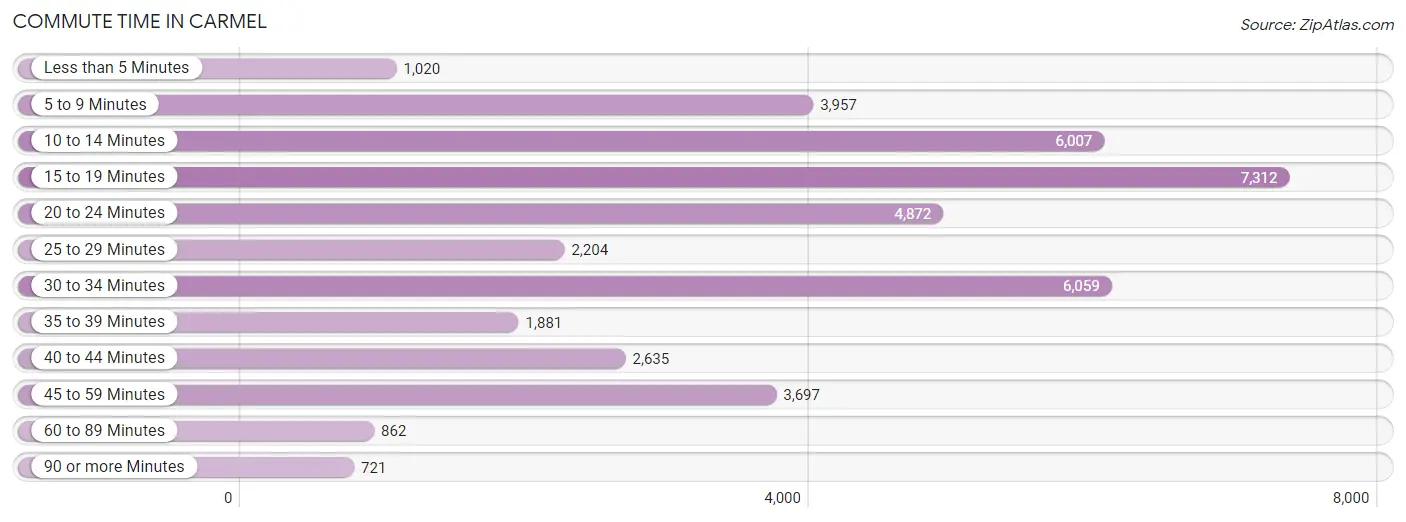
| Commute Time | # Commuters | % Commuters |
| Less than 5 Minutes | 1,020 | 2.5% |
| 5 to 9 Minutes | 3,957 | 9.6% |
| 10 to 14 Minutes | 6,007 | 14.6% |
| 15 to 19 Minutes | 7,312 | 17.7% |
| 20 to 24 Minutes | 4,872 | 11.8% |
| 25 to 29 Minutes | 2,204 | 5.3% |
| 30 to 34 Minutes | 6,059 | 14.7% |
| 35 to 39 Minutes | 1,881 | 4.6% |
| 40 to 44 Minutes | 2,635 | 6.4% |
| 45 to 59 Minutes | 3,697 | 9.0% |
| 60 to 89 Minutes | 862 | 2.1% |
| 90 or more Minutes | 721 | 1.8% |
Commute Time by Sex in Carmel
The most common commute times in Carmel are 30 to 34 minutes (3,502 commuters, 16.2%) for males and 15 to 19 minutes (4,120 commuters, 21.0%) for females.
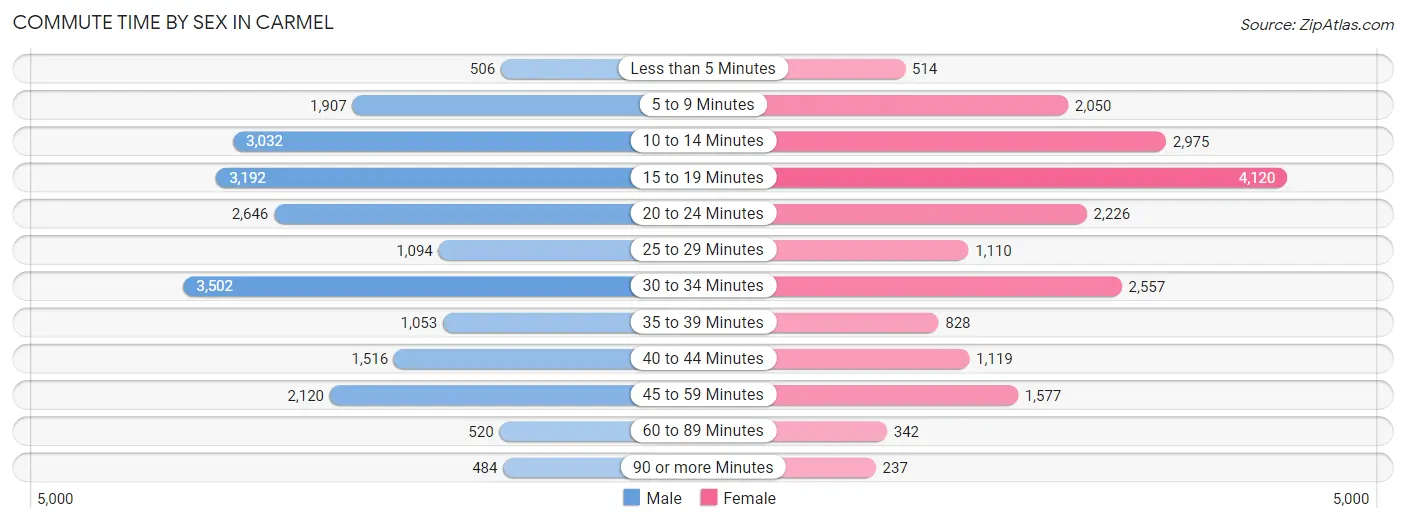
| Commute Time | Male | Female |
| Less than 5 Minutes | 506 (2.4%) | 514 (2.6%) |
| 5 to 9 Minutes | 1,907 (8.8%) | 2,050 (10.4%) |
| 10 to 14 Minutes | 3,032 (14.1%) | 2,975 (15.1%) |
| 15 to 19 Minutes | 3,192 (14.8%) | 4,120 (21.0%) |
| 20 to 24 Minutes | 2,646 (12.3%) | 2,226 (11.3%) |
| 25 to 29 Minutes | 1,094 (5.1%) | 1,110 (5.7%) |
| 30 to 34 Minutes | 3,502 (16.2%) | 2,557 (13.0%) |
| 35 to 39 Minutes | 1,053 (4.9%) | 828 (4.2%) |
| 40 to 44 Minutes | 1,516 (7.0%) | 1,119 (5.7%) |
| 45 to 59 Minutes | 2,120 (9.8%) | 1,577 (8.0%) |
| 60 to 89 Minutes | 520 (2.4%) | 342 (1.7%) |
| 90 or more Minutes | 484 (2.2%) | 237 (1.2%) |
Time of Departure to Work by Sex in Carmel
The most frequent times of departure to work in Carmel are 7:00 AM to 7:29 AM (4,303, 20.0%) for males and 8:00 AM to 8:29 AM (3,930, 20.0%) for females.
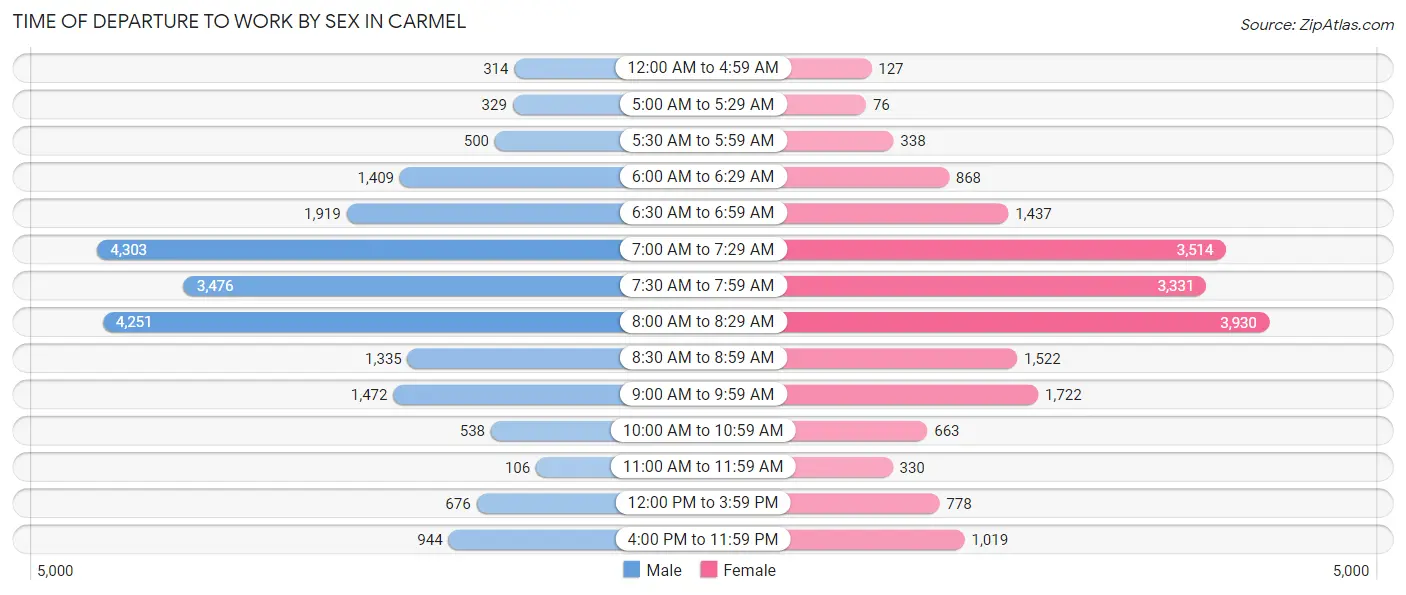
| Time of Departure | Male | Female |
| 12:00 AM to 4:59 AM | 314 (1.5%) | 127 (0.6%) |
| 5:00 AM to 5:29 AM | 329 (1.5%) | 76 (0.4%) |
| 5:30 AM to 5:59 AM | 500 (2.3%) | 338 (1.7%) |
| 6:00 AM to 6:29 AM | 1,409 (6.5%) | 868 (4.4%) |
| 6:30 AM to 6:59 AM | 1,919 (8.9%) | 1,437 (7.3%) |
| 7:00 AM to 7:29 AM | 4,303 (20.0%) | 3,514 (17.9%) |
| 7:30 AM to 7:59 AM | 3,476 (16.1%) | 3,331 (17.0%) |
| 8:00 AM to 8:29 AM | 4,251 (19.7%) | 3,930 (20.0%) |
| 8:30 AM to 8:59 AM | 1,335 (6.2%) | 1,522 (7.7%) |
| 9:00 AM to 9:59 AM | 1,472 (6.8%) | 1,722 (8.8%) |
| 10:00 AM to 10:59 AM | 538 (2.5%) | 663 (3.4%) |
| 11:00 AM to 11:59 AM | 106 (0.5%) | 330 (1.7%) |
| 12:00 PM to 3:59 PM | 676 (3.1%) | 778 (4.0%) |
| 4:00 PM to 11:59 PM | 944 (4.4%) | 1,019 (5.2%) |
| Total | 21,572 (100.0%) | 19,655 (100.0%) |
Housing Occupancy in Carmel
Occupancy by Ownership in Carmel
Of the total 37,888 dwellings in Carmel, owner-occupied units account for 28,270 (74.6%), while renter-occupied units make up 9,618 (25.4%).
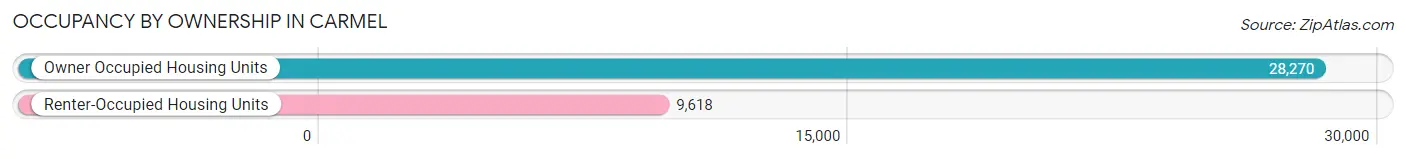
| Occupancy | # Housing Units | % Housing Units |
| Owner Occupied Housing Units | 28,270 | 74.6% |
| Renter-Occupied Housing Units | 9,618 | 25.4% |
| Total Occupied Housing Units | 37,888 | 100.0% |
Occupancy by Household Size in Carmel
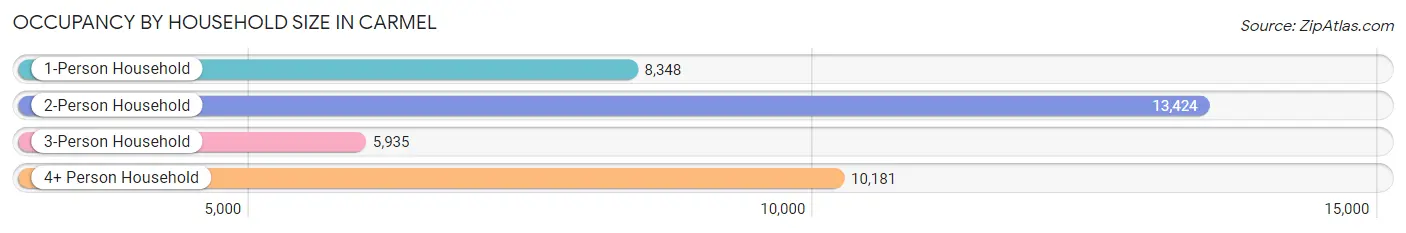
| Household Size | # Housing Units | % Housing Units |
| 1-Person Household | 8,348 | 22.0% |
| 2-Person Household | 13,424 | 35.4% |
| 3-Person Household | 5,935 | 15.7% |
| 4+ Person Household | 10,181 | 26.9% |
| Total Housing Units | 37,888 | 100.0% |
Occupancy by Ownership by Household Size in Carmel
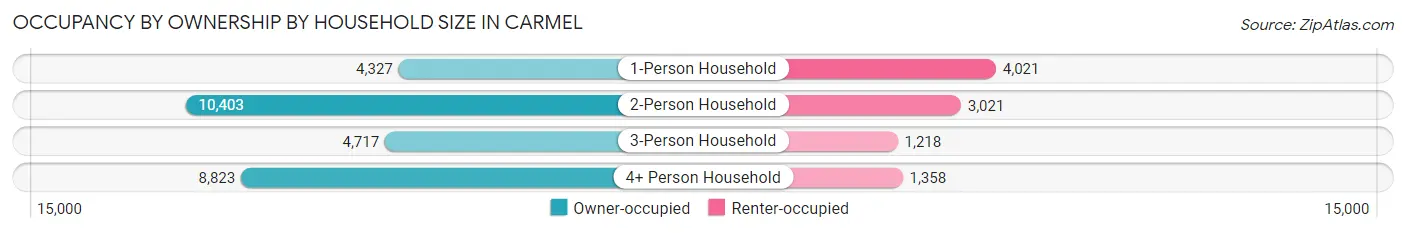
| Household Size | Owner-occupied | Renter-occupied |
| 1-Person Household | 4,327 (51.8%) | 4,021 (48.2%) |
| 2-Person Household | 10,403 (77.5%) | 3,021 (22.5%) |
| 3-Person Household | 4,717 (79.5%) | 1,218 (20.5%) |
| 4+ Person Household | 8,823 (86.7%) | 1,358 (13.3%) |
| Total Housing Units | 28,270 (74.6%) | 9,618 (25.4%) |
Occupancy by Educational Attainment in Carmel
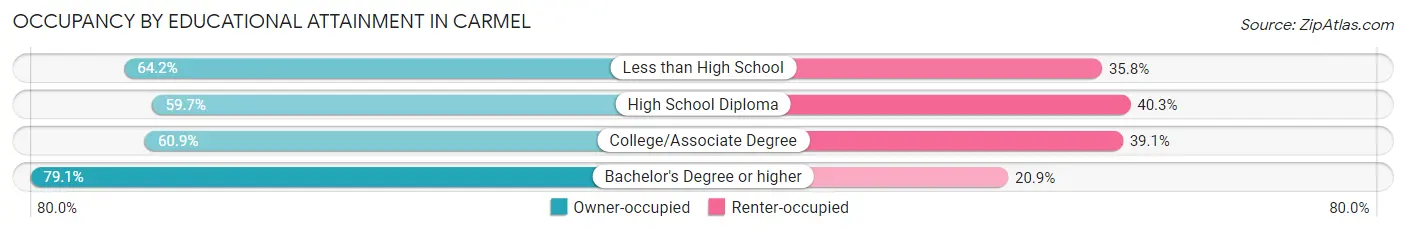
| Household Size | Owner-occupied | Renter-occupied |
| Less than High School | 430 (64.2%) | 240 (35.8%) |
| High School Diploma | 1,644 (59.7%) | 1,110 (40.3%) |
| College/Associate Degree | 3,542 (60.9%) | 2,274 (39.1%) |
| Bachelor's Degree or higher | 22,654 (79.1%) | 5,994 (20.9%) |
Occupancy by Age of Householder in Carmel
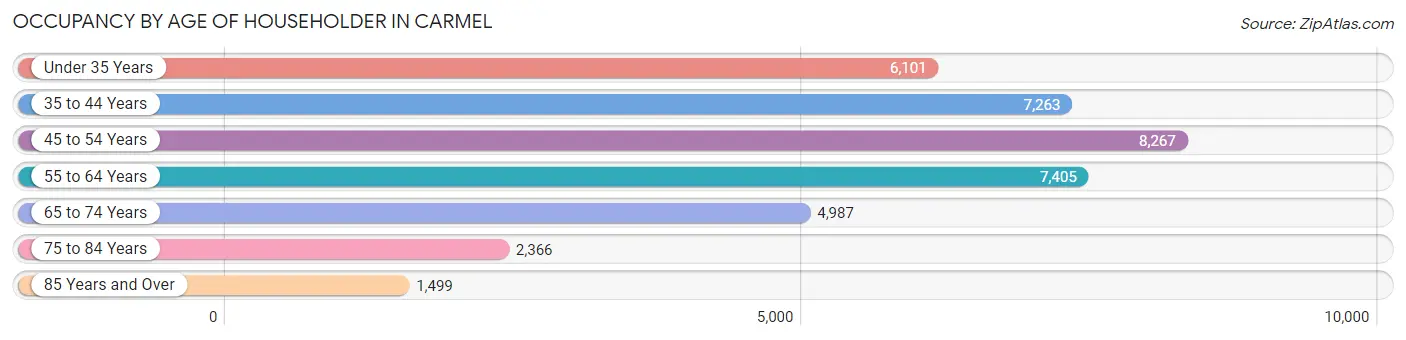
| Age Bracket | # Households | % Households |
| Under 35 Years | 6,101 | 16.1% |
| 35 to 44 Years | 7,263 | 19.2% |
| 45 to 54 Years | 8,267 | 21.8% |
| 55 to 64 Years | 7,405 | 19.5% |
| 65 to 74 Years | 4,987 | 13.2% |
| 75 to 84 Years | 2,366 | 6.2% |
| 85 Years and Over | 1,499 | 4.0% |
| Total | 37,888 | 100.0% |
Housing Finances in Carmel
Median Income by Occupancy in Carmel
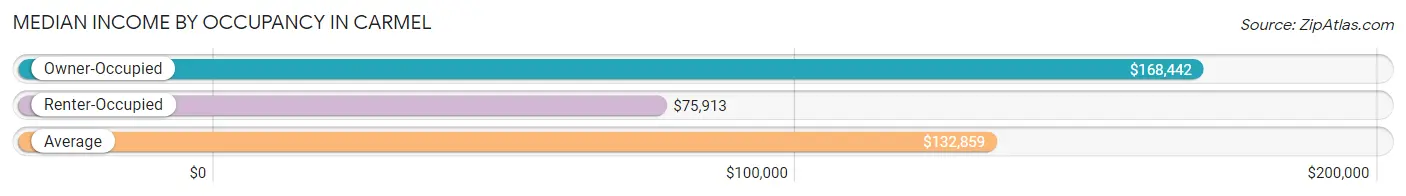
| Occupancy Type | # Households | Median Income |
| Owner-Occupied | 28,270 (74.6%) | $168,442 |
| Renter-Occupied | 9,618 (25.4%) | $75,913 |
| Average | 37,888 (100.0%) | $132,859 |
Occupancy by Householder Income Bracket in Carmel
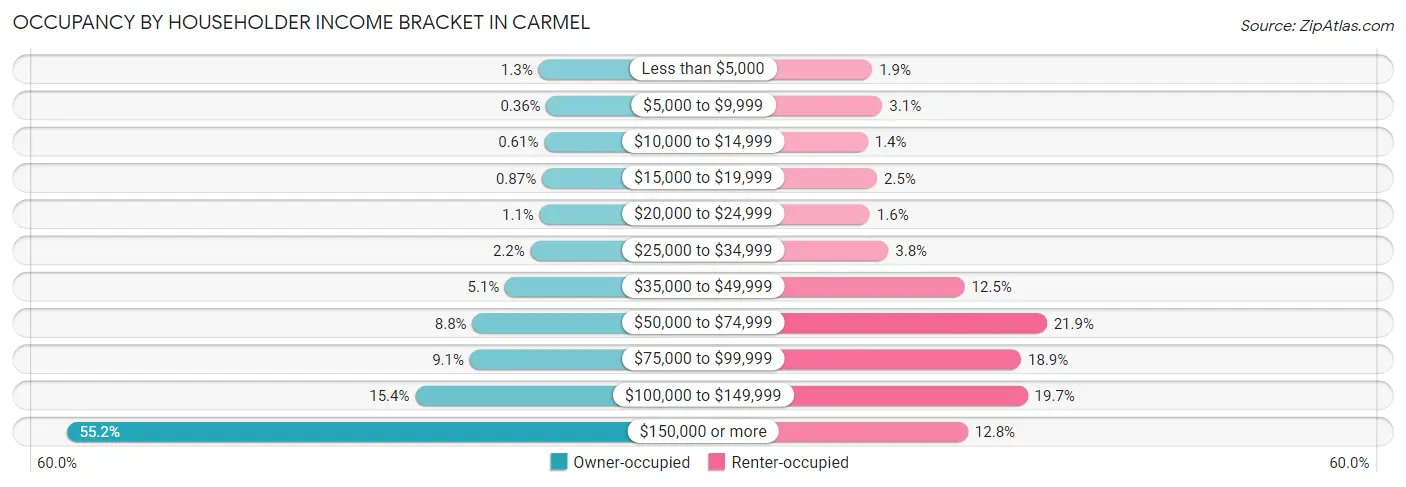
| Income Bracket | Owner-occupied | Renter-occupied |
| Less than $5,000 | 359 (1.3%) | 184 (1.9%) |
| $5,000 to $9,999 | 102 (0.4%) | 295 (3.1%) |
| $10,000 to $14,999 | 173 (0.6%) | 135 (1.4%) |
| $15,000 to $19,999 | 246 (0.9%) | 237 (2.5%) |
| $20,000 to $24,999 | 319 (1.1%) | 158 (1.6%) |
| $25,000 to $34,999 | 614 (2.2%) | 361 (3.7%) |
| $35,000 to $49,999 | 1,435 (5.1%) | 1,199 (12.5%) |
| $50,000 to $74,999 | 2,494 (8.8%) | 2,102 (21.8%) |
| $75,000 to $99,999 | 2,579 (9.1%) | 1,820 (18.9%) |
| $100,000 to $149,999 | 4,340 (15.3%) | 1,892 (19.7%) |
| $150,000 or more | 15,609 (55.2%) | 1,235 (12.8%) |
| Total | 28,270 (100.0%) | 9,618 (100.0%) |
Monthly Housing Cost Tiers in Carmel
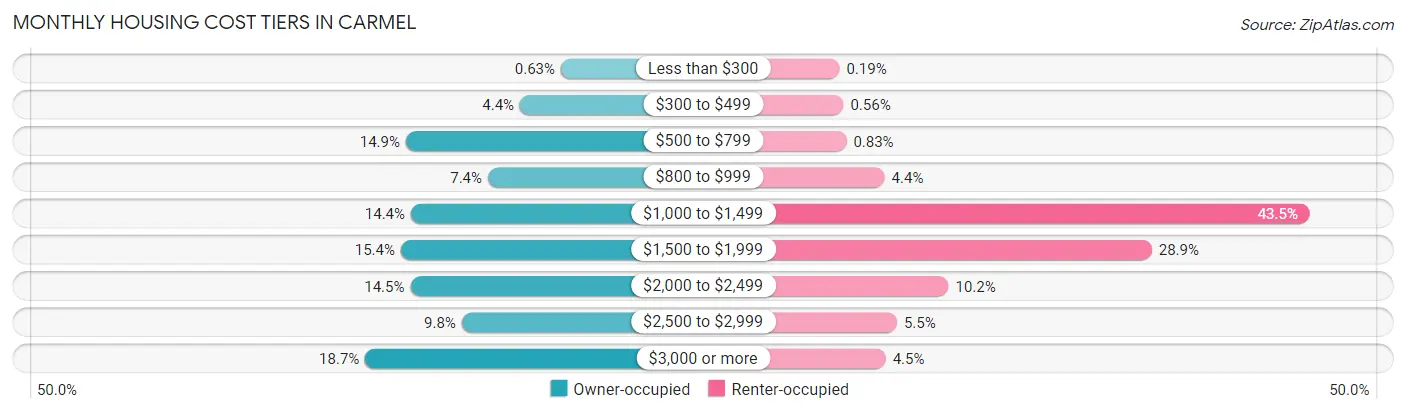
| Monthly Cost | Owner-occupied | Renter-occupied |
| Less than $300 | 177 (0.6%) | 18 (0.2%) |
| $300 to $499 | 1,243 (4.4%) | 54 (0.6%) |
| $500 to $799 | 4,216 (14.9%) | 80 (0.8%) |
| $800 to $999 | 2,079 (7.3%) | 418 (4.3%) |
| $1,000 to $1,499 | 4,083 (14.4%) | 4,182 (43.5%) |
| $1,500 to $1,999 | 4,346 (15.4%) | 2,783 (28.9%) |
| $2,000 to $2,499 | 4,095 (14.5%) | 984 (10.2%) |
| $2,500 to $2,999 | 2,760 (9.8%) | 527 (5.5%) |
| $3,000 or more | 5,271 (18.6%) | 428 (4.4%) |
| Total | 28,270 (100.0%) | 9,618 (100.0%) |
Physical Housing Characteristics in Carmel
Housing Structures in Carmel
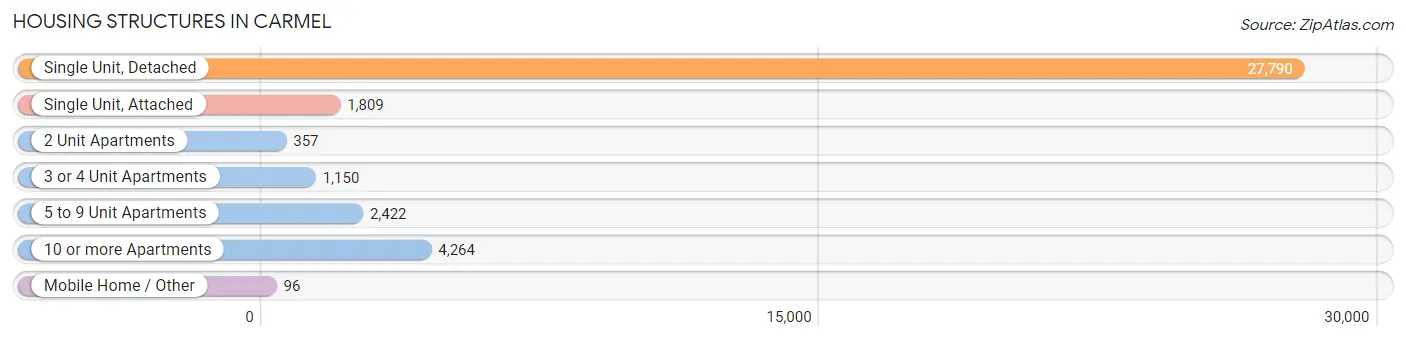
| Structure Type | # Housing Units | % Housing Units |
| Single Unit, Detached | 27,790 | 73.4% |
| Single Unit, Attached | 1,809 | 4.8% |
| 2 Unit Apartments | 357 | 0.9% |
| 3 or 4 Unit Apartments | 1,150 | 3.0% |
| 5 to 9 Unit Apartments | 2,422 | 6.4% |
| 10 or more Apartments | 4,264 | 11.3% |
| Mobile Home / Other | 96 | 0.3% |
| Total | 37,888 | 100.0% |
Housing Structures by Occupancy in Carmel
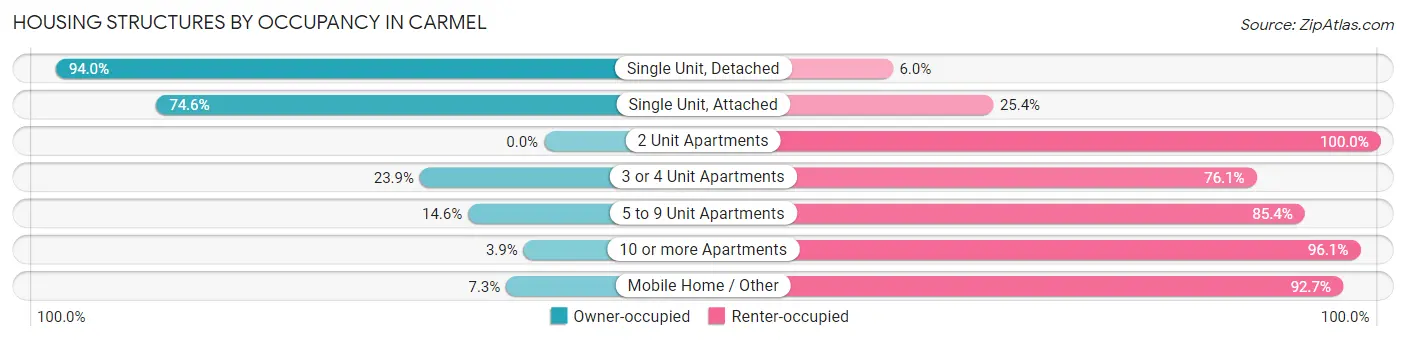
| Structure Type | Owner-occupied | Renter-occupied |
| Single Unit, Detached | 26,116 (94.0%) | 1,674 (6.0%) |
| Single Unit, Attached | 1,350 (74.6%) | 459 (25.4%) |
| 2 Unit Apartments | 0 (0.0%) | 357 (100.0%) |
| 3 or 4 Unit Apartments | 275 (23.9%) | 875 (76.1%) |
| 5 to 9 Unit Apartments | 354 (14.6%) | 2,068 (85.4%) |
| 10 or more Apartments | 168 (3.9%) | 4,096 (96.1%) |
| Mobile Home / Other | 7 (7.3%) | 89 (92.7%) |
| Total | 28,270 (74.6%) | 9,618 (25.4%) |
Housing Structures by Number of Rooms in Carmel
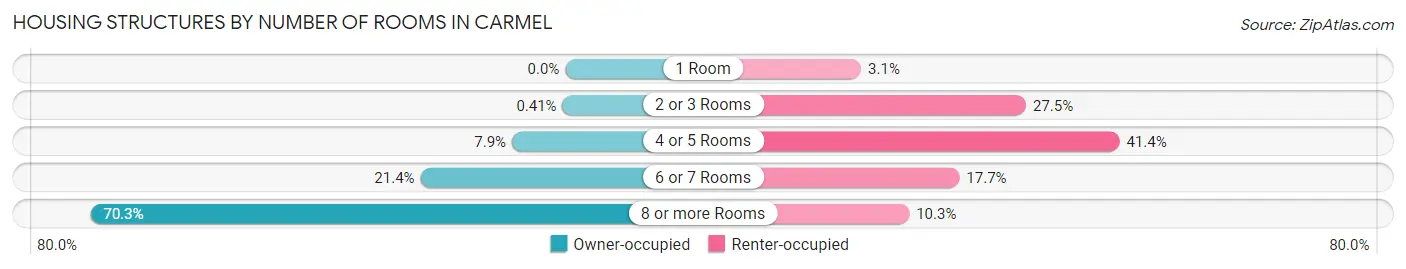
| Number of Rooms | Owner-occupied | Renter-occupied |
| 1 Room | 0 (0.0%) | 302 (3.1%) |
| 2 or 3 Rooms | 115 (0.4%) | 2,649 (27.5%) |
| 4 or 5 Rooms | 2,231 (7.9%) | 3,980 (41.4%) |
| 6 or 7 Rooms | 6,058 (21.4%) | 1,700 (17.7%) |
| 8 or more Rooms | 19,866 (70.3%) | 987 (10.3%) |
| Total | 28,270 (100.0%) | 9,618 (100.0%) |
Housing Structure by Heating Type in Carmel
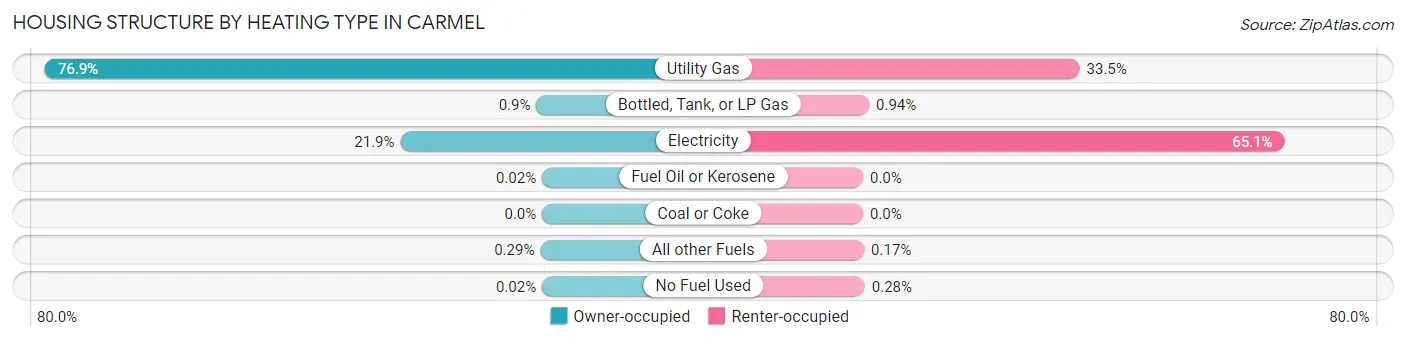
| Heating Type | Owner-occupied | Renter-occupied |
| Utility Gas | 21,725 (76.8%) | 3,220 (33.5%) |
| Bottled, Tank, or LP Gas | 255 (0.9%) | 90 (0.9%) |
| Electricity | 6,194 (21.9%) | 6,265 (65.1%) |
| Fuel Oil or Kerosene | 7 (0.0%) | 0 (0.0%) |
| Coal or Coke | 0 (0.0%) | 0 (0.0%) |
| All other Fuels | 82 (0.3%) | 16 (0.2%) |
| No Fuel Used | 7 (0.0%) | 27 (0.3%) |
| Total | 28,270 (100.0%) | 9,618 (100.0%) |
Household Vehicle Usage in Carmel
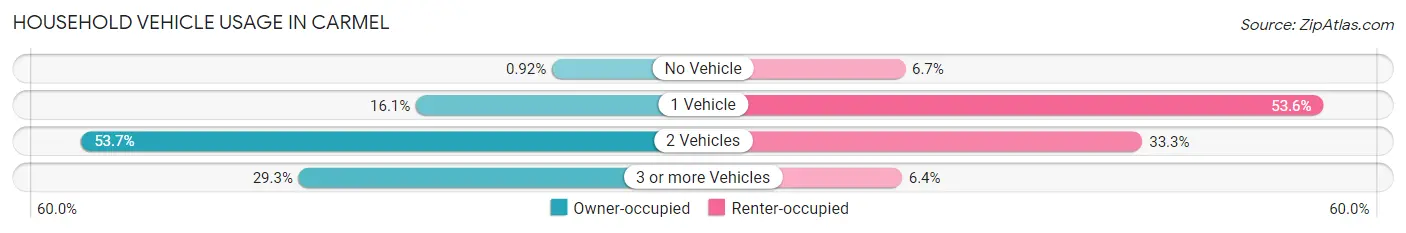
| Vehicles per Household | Owner-occupied | Renter-occupied |
| No Vehicle | 259 (0.9%) | 647 (6.7%) |
| 1 Vehicle | 4,564 (16.1%) | 5,154 (53.6%) |
| 2 Vehicles | 15,166 (53.6%) | 3,204 (33.3%) |
| 3 or more Vehicles | 8,281 (29.3%) | 613 (6.4%) |
| Total | 28,270 (100.0%) | 9,618 (100.0%) |
Real Estate & Mortgages in Carmel
Real Estate and Mortgage Overview in Carmel
| Characteristic | Without Mortgage | With Mortgage |
| Housing Units | 8,639 | 19,631 |
| Median Property Value | $396,100 | $438,100 |
| Median Household Income | $113,076 | $12,383 |
| Monthly Housing Costs | $720 | $5,194 |
| Real Estate Taxes | $3,631 | $138 |
Property Value by Mortgage Status in Carmel
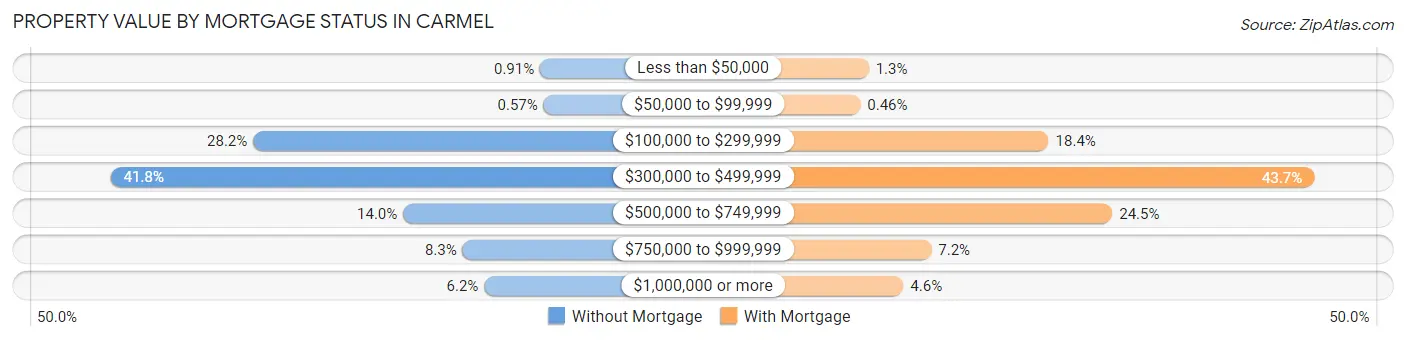
| Property Value | Without Mortgage | With Mortgage |
| Less than $50,000 | 79 (0.9%) | 245 (1.3%) |
| $50,000 to $99,999 | 49 (0.6%) | 90 (0.5%) |
| $100,000 to $299,999 | 2,440 (28.2%) | 3,610 (18.4%) |
| $300,000 to $499,999 | 3,612 (41.8%) | 8,573 (43.7%) |
| $500,000 to $749,999 | 1,205 (14.0%) | 4,799 (24.4%) |
| $750,000 to $999,999 | 716 (8.3%) | 1,418 (7.2%) |
| $1,000,000 or more | 538 (6.2%) | 896 (4.6%) |
| Total | 8,639 (100.0%) | 19,631 (100.0%) |
Household Income by Mortgage Status in Carmel
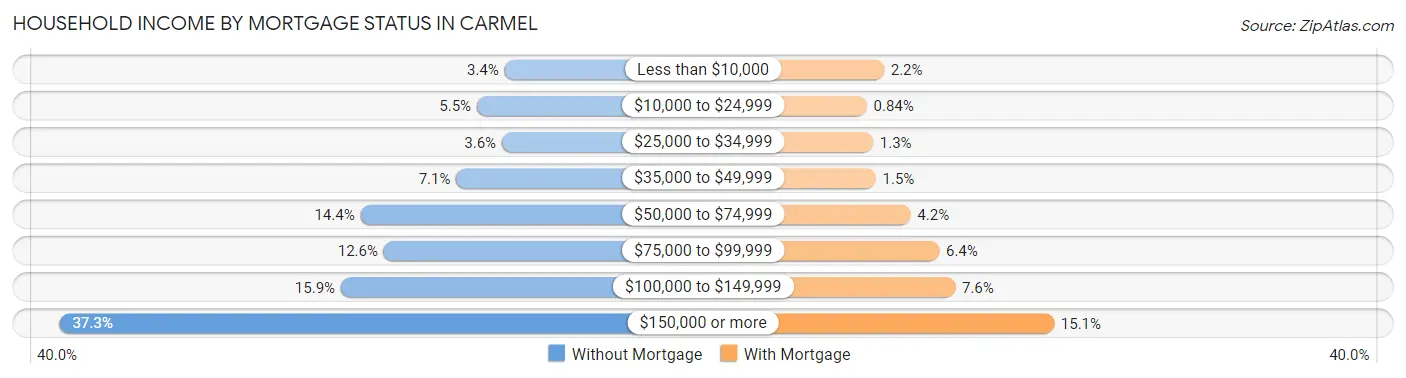
| Household Income | Without Mortgage | With Mortgage |
| Less than $10,000 | 296 (3.4%) | 423 (2.1%) |
| $10,000 to $24,999 | 479 (5.5%) | 165 (0.8%) |
| $25,000 to $34,999 | 314 (3.6%) | 259 (1.3%) |
| $35,000 to $49,999 | 614 (7.1%) | 300 (1.5%) |
| $50,000 to $74,999 | 1,245 (14.4%) | 821 (4.2%) |
| $75,000 to $99,999 | 1,091 (12.6%) | 1,249 (6.4%) |
| $100,000 to $149,999 | 1,374 (15.9%) | 1,488 (7.6%) |
| $150,000 or more | 3,226 (37.3%) | 2,966 (15.1%) |
| Total | 8,639 (100.0%) | 19,631 (100.0%) |
Property Value to Household Income Ratio in Carmel
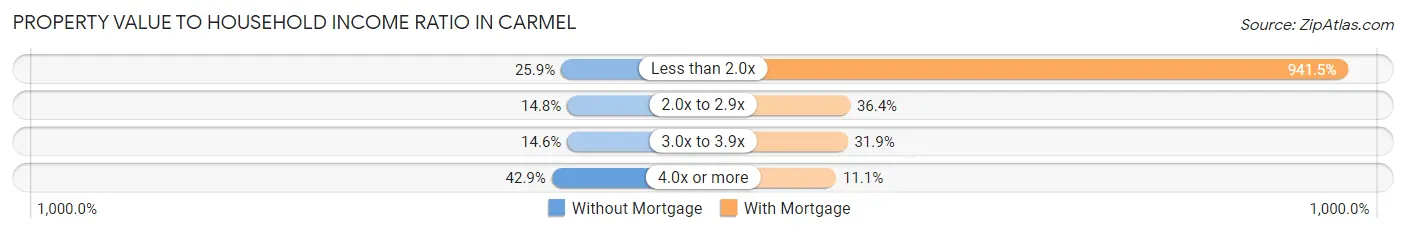
| Value-to-Income Ratio | Without Mortgage | With Mortgage |
| Less than 2.0x | 2,235 (25.9%) | 184,822 (941.5%) |
| 2.0x to 2.9x | 1,276 (14.8%) | 7,136 (36.3%) |
| 3.0x to 3.9x | 1,265 (14.6%) | 6,255 (31.9%) |
| 4.0x or more | 3,706 (42.9%) | 2,184 (11.1%) |
| Total | 8,639 (100.0%) | 19,631 (100.0%) |
Real Estate Taxes by Mortgage Status in Carmel
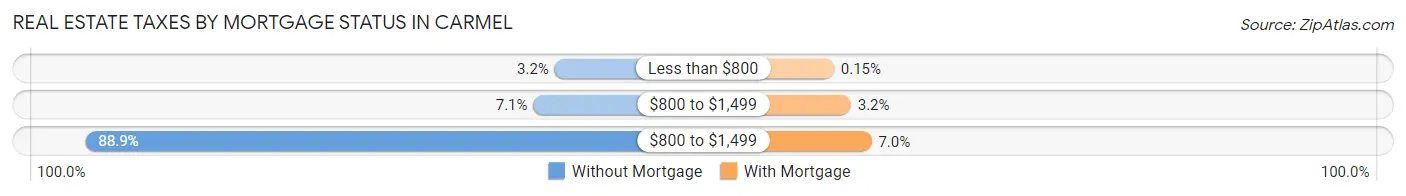
| Property Taxes | Without Mortgage | With Mortgage |
| Less than $800 | 275 (3.2%) | 29 (0.2%) |
| $800 to $1,499 | 612 (7.1%) | 636 (3.2%) |
| $800 to $1,499 | 7,679 (88.9%) | 1,376 (7.0%) |
| Total | 8,639 (100.0%) | 19,631 (100.0%) |
Health & Disability in Carmel
Health Insurance Coverage by Age in Carmel
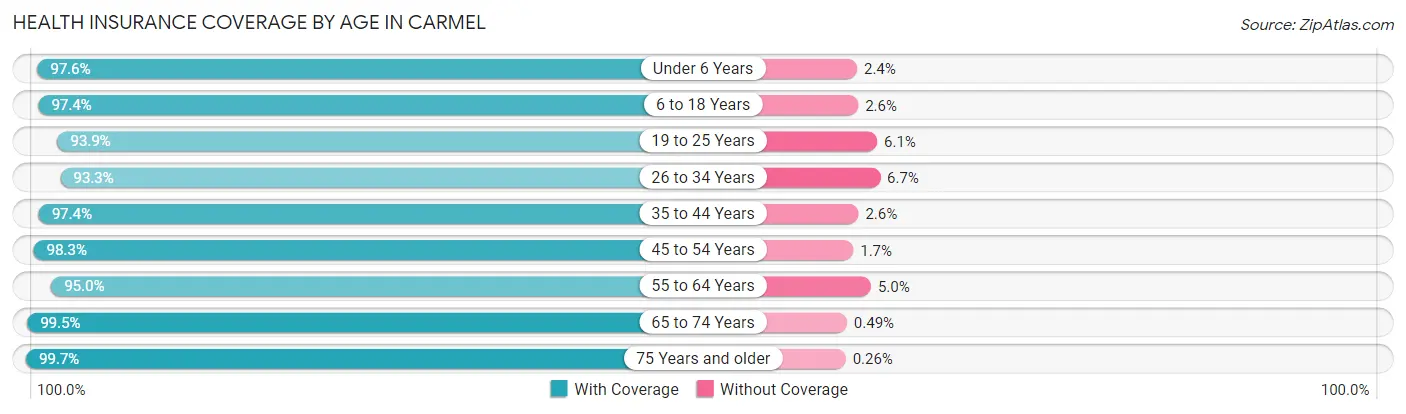
| Age Bracket | With Coverage | Without Coverage |
| Under 6 Years | 6,226 (97.6%) | 152 (2.4%) |
| 6 to 18 Years | 19,576 (97.4%) | 520 (2.6%) |
| 19 to 25 Years | 6,090 (93.9%) | 397 (6.1%) |
| 26 to 34 Years | 8,773 (93.3%) | 627 (6.7%) |
| 35 to 44 Years | 13,510 (97.4%) | 366 (2.6%) |
| 45 to 54 Years | 15,058 (98.3%) | 257 (1.7%) |
| 55 to 64 Years | 12,492 (95.0%) | 653 (5.0%) |
| 65 to 74 Years | 8,563 (99.5%) | 42 (0.5%) |
| 75 Years and older | 5,729 (99.7%) | 15 (0.3%) |
| Total | 96,017 (96.9%) | 3,029 (3.1%) |
Health Insurance Coverage by Citizenship Status in Carmel
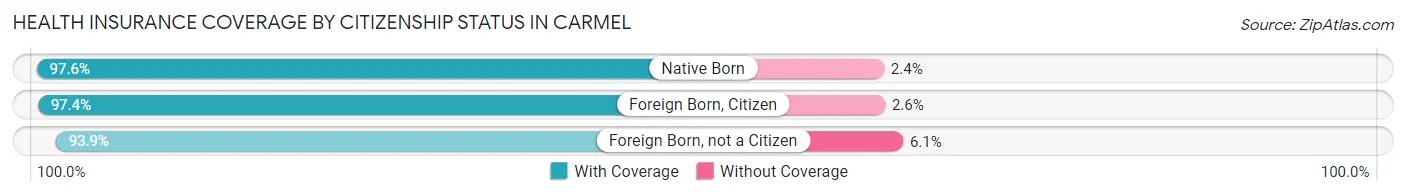
| Citizenship Status | With Coverage | Without Coverage |
| Native Born | 6,226 (97.6%) | 152 (2.4%) |
| Foreign Born, Citizen | 19,576 (97.4%) | 520 (2.6%) |
| Foreign Born, not a Citizen | 6,090 (93.9%) | 397 (6.1%) |
Health Insurance Coverage by Household Income in Carmel
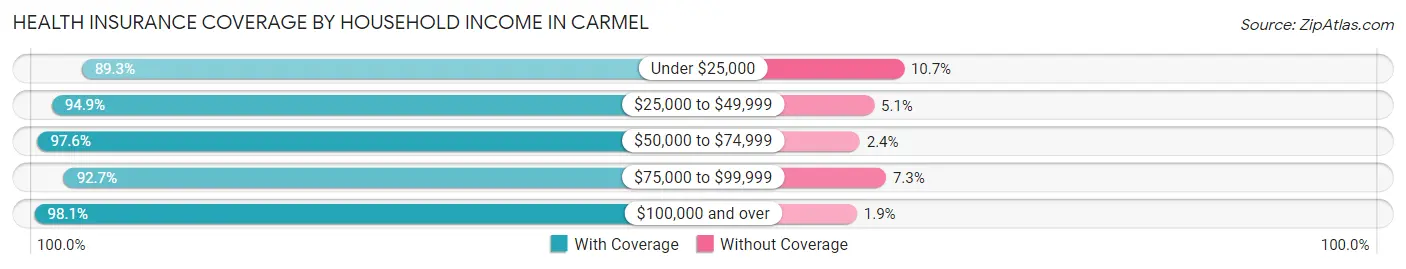
| Household Income | With Coverage | Without Coverage |
| Under $25,000 | 3,427 (89.3%) | 411 (10.7%) |
| $25,000 to $49,999 | 6,131 (94.9%) | 330 (5.1%) |
| $50,000 to $74,999 | 8,325 (97.6%) | 207 (2.4%) |
| $75,000 to $99,999 | 9,619 (92.7%) | 762 (7.3%) |
| $100,000 and over | 68,472 (98.1%) | 1,319 (1.9%) |
Public vs Private Health Insurance Coverage by Age in Carmel
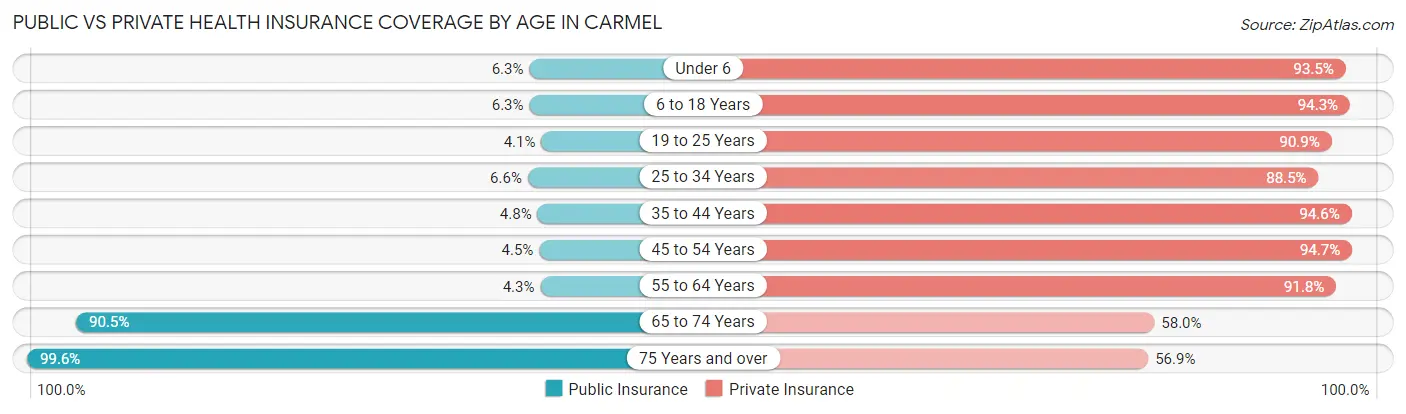
| Age Bracket | Public Insurance | Private Insurance |
| Under 6 | 403 (6.3%) | 5,965 (93.5%) |
| 6 to 18 Years | 1,268 (6.3%) | 18,953 (94.3%) |
| 19 to 25 Years | 266 (4.1%) | 5,896 (90.9%) |
| 25 to 34 Years | 621 (6.6%) | 8,315 (88.5%) |
| 35 to 44 Years | 666 (4.8%) | 13,128 (94.6%) |
| 45 to 54 Years | 687 (4.5%) | 14,505 (94.7%) |
| 55 to 64 Years | 562 (4.3%) | 12,061 (91.7%) |
| 65 to 74 Years | 7,783 (90.4%) | 4,993 (58.0%) |
| 75 Years and over | 5,719 (99.6%) | 3,267 (56.9%) |
| Total | 17,975 (18.1%) | 87,083 (87.9%) |
Disability Status by Sex by Age in Carmel
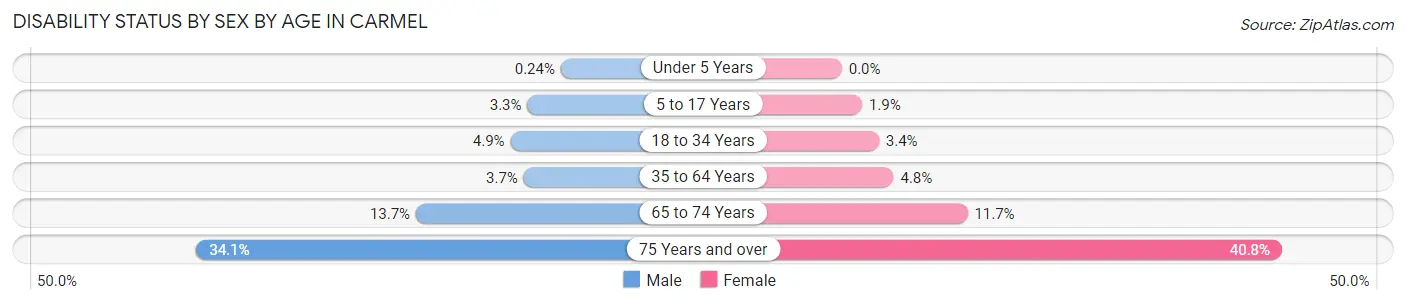
| Age Bracket | Male | Female |
| Under 5 Years | 6 (0.2%) | 0 (0.0%) |
| 5 to 17 Years | 331 (3.3%) | 181 (1.9%) |
| 18 to 34 Years | 414 (4.9%) | 320 (3.4%) |
| 35 to 64 Years | 742 (3.7%) | 1,064 (4.8%) |
| 65 to 74 Years | 560 (13.7%) | 526 (11.7%) |
| 75 Years and over | 828 (34.1%) | 1,353 (40.8%) |
Disability Class by Sex by Age in Carmel
Disability Class: Hearing Difficulty
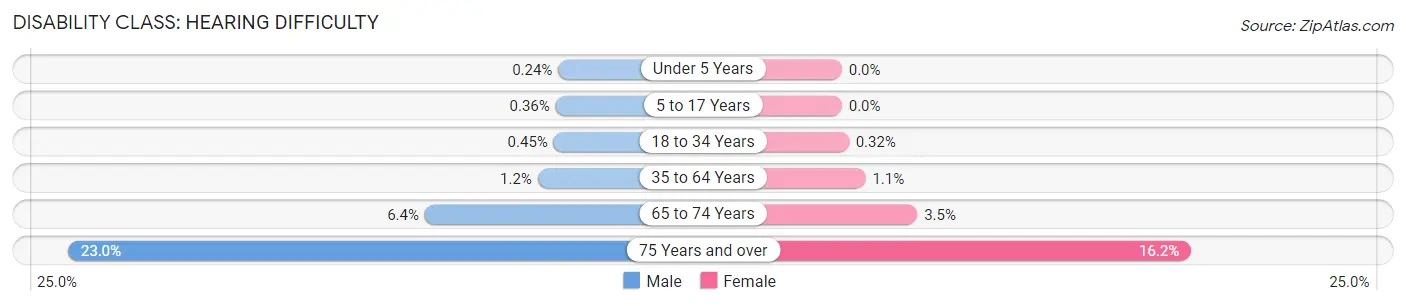
| Age Bracket | Male | Female |
| Under 5 Years | 6 (0.2%) | 0 (0.0%) |
| 5 to 17 Years | 36 (0.4%) | 0 (0.0%) |
| 18 to 34 Years | 38 (0.4%) | 30 (0.3%) |
| 35 to 64 Years | 239 (1.2%) | 245 (1.1%) |
| 65 to 74 Years | 263 (6.4%) | 158 (3.5%) |
| 75 Years and over | 559 (23.0%) | 537 (16.2%) |
Disability Class: Vision Difficulty
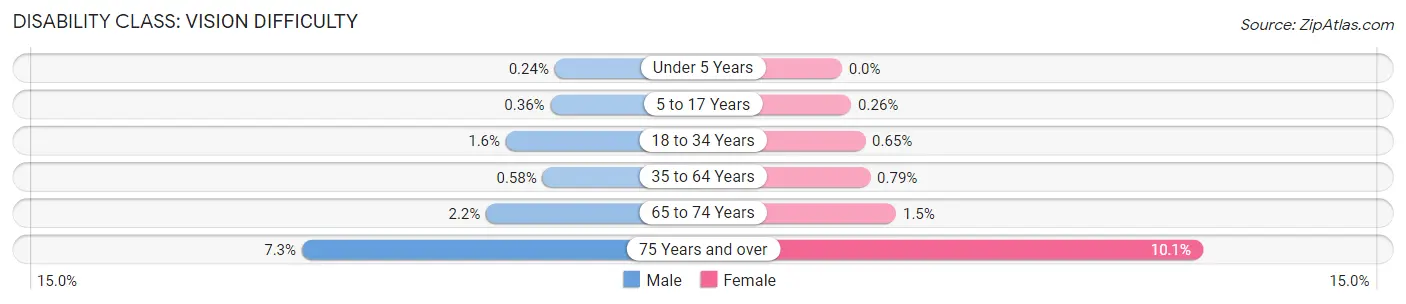
| Age Bracket | Male | Female |
| Under 5 Years | 6 (0.2%) | 0 (0.0%) |
| 5 to 17 Years | 36 (0.4%) | 25 (0.3%) |
| 18 to 34 Years | 135 (1.6%) | 60 (0.6%) |
| 35 to 64 Years | 117 (0.6%) | 175 (0.8%) |
| 65 to 74 Years | 88 (2.1%) | 68 (1.5%) |
| 75 Years and over | 177 (7.3%) | 333 (10.1%) |
Disability Class: Cognitive Difficulty
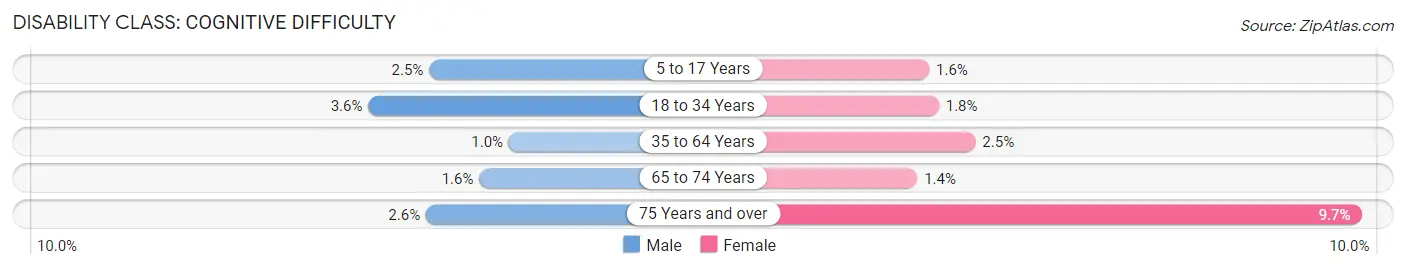
| Age Bracket | Male | Female |
| 5 to 17 Years | 247 (2.5%) | 157 (1.6%) |
| 18 to 34 Years | 305 (3.6%) | 167 (1.8%) |
| 35 to 64 Years | 204 (1.0%) | 551 (2.5%) |
| 65 to 74 Years | 64 (1.6%) | 63 (1.4%) |
| 75 Years and over | 62 (2.5%) | 320 (9.7%) |
Disability Class: Ambulatory Difficulty
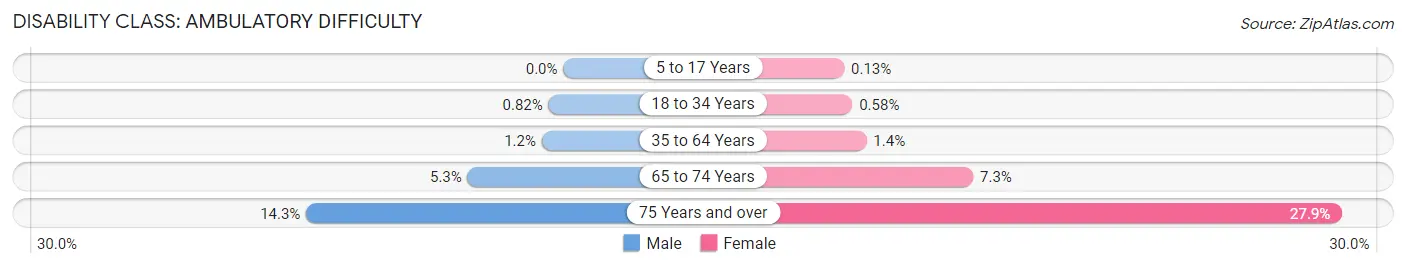
| Age Bracket | Male | Female |
| 5 to 17 Years | 0 (0.0%) | 13 (0.1%) |
| 18 to 34 Years | 69 (0.8%) | 54 (0.6%) |
| 35 to 64 Years | 242 (1.2%) | 303 (1.4%) |
| 65 to 74 Years | 218 (5.3%) | 330 (7.3%) |
| 75 Years and over | 348 (14.3%) | 923 (27.9%) |
Disability Class: Self-Care Difficulty
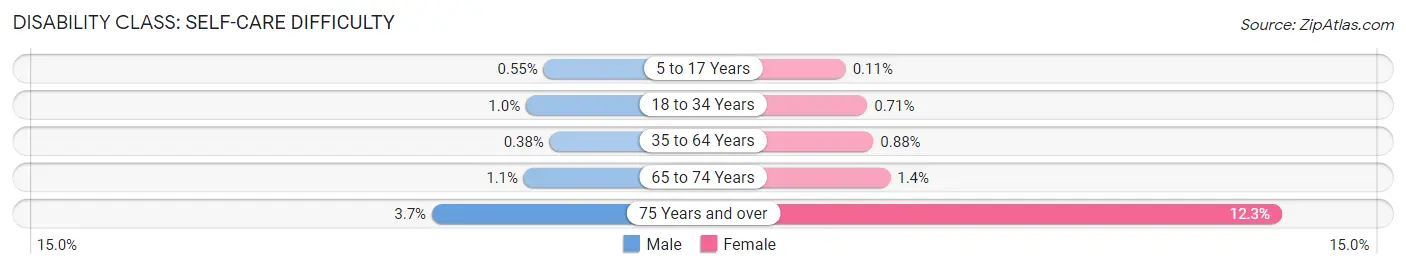
| Age Bracket | Male | Female |
| 5 to 17 Years | 55 (0.5%) | 11 (0.1%) |
| 18 to 34 Years | 88 (1.0%) | 66 (0.7%) |
| 35 to 64 Years | 77 (0.4%) | 195 (0.9%) |
| 65 to 74 Years | 45 (1.1%) | 61 (1.3%) |
| 75 Years and over | 89 (3.7%) | 406 (12.2%) |
Technology Access in Carmel
Computing Device Access in Carmel
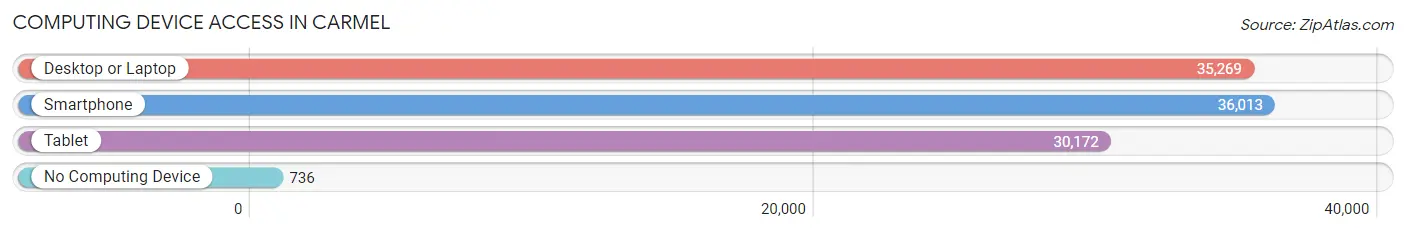
| Device Type | # Households | % Households |
| Desktop or Laptop | 35,269 | 93.1% |
| Smartphone | 36,013 | 95.1% |
| Tablet | 30,172 | 79.6% |
| No Computing Device | 736 | 1.9% |
| Total | 37,888 | 100.0% |
Internet Access in Carmel
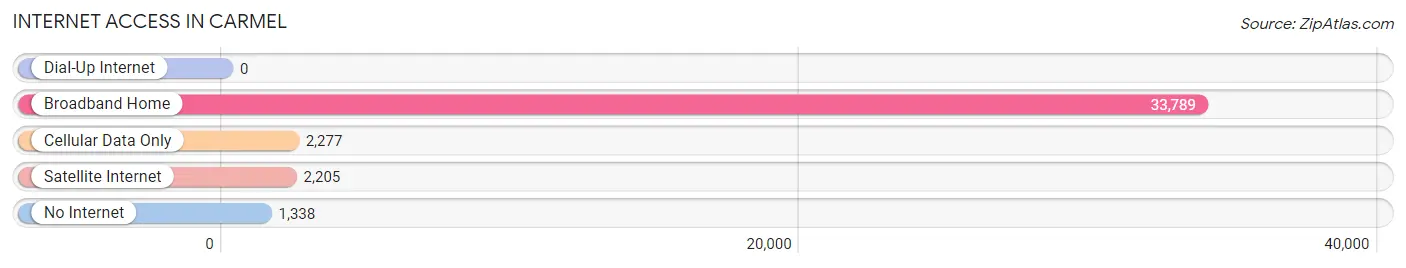
| Internet Type | # Households | % Households |
| Dial-Up Internet | 0 | 0.0% |
| Broadband Home | 33,789 | 89.2% |
| Cellular Data Only | 2,277 | 6.0% |
| Satellite Internet | 2,205 | 5.8% |
| No Internet | 1,338 | 3.5% |
| Total | 37,888 | 100.0% |
Carmel Summary
Carmel, Indiana is a city located in Hamilton County, Indiana, United States. It is located in the northern part of the state, about 20 miles north of Indianapolis. The city has a population of approximately 91,065 people, making it the fifth-largest city in Indiana. The city is known for its high quality of life, excellent schools, and vibrant economy.
History
Carmel was founded in 1837 by settlers from the nearby town of Noblesville. The town was originally called Bethlehem, but the name was changed to Carmel in 1874. The name was chosen to honor the Carmelite Monastery that was located nearby. The town grew slowly over the years, and by the early 1900s, it had become a popular summer resort destination for wealthy families from Indianapolis.
In the 1950s, the city began to experience rapid growth as more people moved to the area. This growth was fueled by the construction of the interstate highway system, which made it easier for people to commute to and from Indianapolis. By the 1970s, Carmel had become a thriving suburb of Indianapolis.
Geography
Carmel is located in the northern part of Hamilton County, Indiana. It is situated on the White River, which flows through the city. The city is bordered by the towns of Fishers, Westfield, Noblesville, and Zionsville. The city covers an area of approximately 48 square miles.
The city is located in the Central Till Plains region of Indiana, which is characterized by flat terrain and fertile soil. The climate in Carmel is humid continental, with hot summers and cold winters. The average annual temperature is around 50 degrees Fahrenheit.
Economy
Carmel has a strong and diverse economy. The city is home to a number of large corporations, including the headquarters of the global software company, Salesforce. Other major employers in the city include the pharmaceutical company Eli Lilly, the health care provider IU Health, and the financial services company OneAmerica.
The city also has a thriving retail sector, with a number of shopping centers and malls. The city is also home to a number of restaurants, bars, and entertainment venues.
Demographics
As of the 2020 census, the population of Carmel was 91,065. The city has a population density of 1,845 people per square mile. The median age in the city is 38.7 years, and the median household income is $97,845.
The racial makeup of the city is 87.3% White, 4.2% African American, 4.2% Asian, and 4.3% other. The city is also home to a large Hispanic population, with 8.3% of the population identifying as Hispanic or Latino.
Conclusion
Carmel, Indiana is a vibrant city located in Hamilton County, Indiana. The city has a population of approximately 91,065 people and is known for its high quality of life, excellent schools, and vibrant economy. The city is home to a number of large corporations, as well as a thriving retail sector. The city also has a diverse population, with a median age of 38.7 years and a median household income of $97,845.
Common Questions
What is Per Capita Income in Carmel?
Per Capita income in Carmel is $70,093.
What is the Median Family Income in Carmel?
Median Family Income in Carmel is $173,106.
What is the Median Household income in Carmel?
Median Household Income in Carmel is $132,859.
What is Income or Wage Gap in Carmel?
Income or Wage Gap in Carmel is 45.7%.
Women in Carmel earn 54.3 cents for every dollar earned by a man.
What is Family Income Deficit in Carmel?
Family Income Deficit in Carmel is $14,775.
Families that are below poverty line in Carmel earn $14,775 less on average than the poverty threshold level.
What is Inequality or Gini Index in Carmel?
Inequality or Gini Index in Carmel is 0.46.
What is the Total Population of Carmel?
Total Population of Carmel is 99,453.
What is the Total Male Population of Carmel?
Total Male Population of Carmel is 47,618.
What is the Total Female Population of Carmel?
Total Female Population of Carmel is 51,835.
What is the Ratio of Males per 100 Females in Carmel?
There are 91.86 Males per 100 Females in Carmel.
What is the Ratio of Females per 100 Males in Carmel?
There are 108.86 Females per 100 Males in Carmel.
What is the Median Population Age in Carmel?
Median Population Age in Carmel is 40.6 Years.
What is the Average Family Size in Carmel
Average Family Size in Carmel is 3.1 People.
What is the Average Household Size in Carmel
Average Household Size in Carmel is 2.6 People.
How Large is the Labor Force in Carmel?
There are 54,483 People in the Labor Forcein in Carmel.
What is the Percentage of People in the Labor Force in Carmel?
69.7% of People are in the Labor Force in Carmel.
What is the Unemployment Rate in Carmel?
Unemployment Rate in Carmel is 2.6%.