Rock Hill, MO Map & Demographics
Rock Hill Map
Rock Hill Overview
$55,894
PER CAPITA INCOME
$106,111
AVG FAMILY INCOME
$85,155
AVG HOUSEHOLD INCOME
29.0%
WAGE / INCOME GAP [ % ]
71.0¢/ $1
WAGE / INCOME GAP [ $ ]
0.43
INEQUALITY / GINI INDEX
4,728
TOTAL POPULATION
2,394
MALE POPULATION
2,334
FEMALE POPULATION
102.57
MALES / 100 FEMALES
97.49
FEMALES / 100 MALES
38.2
MEDIAN AGE
2.7
AVG FAMILY SIZE
2.0
AVG HOUSEHOLD SIZE
2,905
LABOR FORCE [ PEOPLE ]
70.3%
PERCENT IN LABOR FORCE
1.8%
UNEMPLOYMENT RATE
Income in Rock Hill
Income Overview in Rock Hill
Per Capita Income in Rock Hill is $55,894, while median incomes of families and households are $106,111 and $85,155 respectively.
| Characteristic | Number | Measure |
| Per Capita Income | 4,728 | $55,894 |
| Median Family Income | 1,200 | $106,111 |
| Mean Family Income | 1,200 | $129,026 |
| Median Household Income | 2,352 | $85,155 |
| Mean Household Income | 2,352 | $110,295 |
| Income Deficit | 1,200 | $0 |
| Wage / Income Gap (%) | 4,728 | 29.05% |
| Wage / Income Gap ($) | 4,728 | 70.95¢ per $1 |
| Gini / Inequality Index | 4,728 | 0.43 |
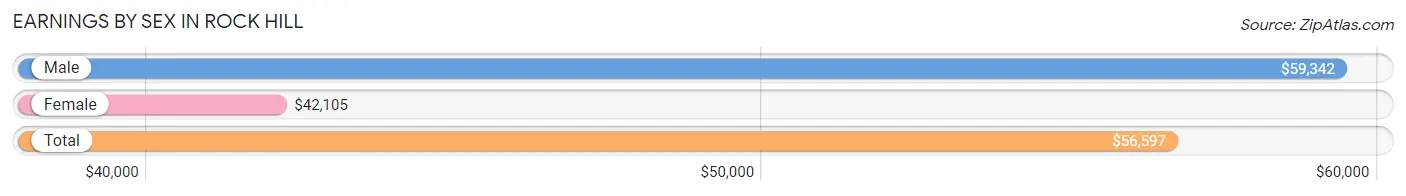
Earnings by Sex in Rock Hill
Average Earnings in Rock Hill are $56,597, $59,342 for men and $42,105 for women, a difference of 29.0%.
| Sex | Number | Average Earnings |
| Male | 1,622 (52.1%) | $59,342 |
| Female | 1,490 (47.9%) | $42,105 |
| Total | 3,112 (100.0%) | $56,597 |
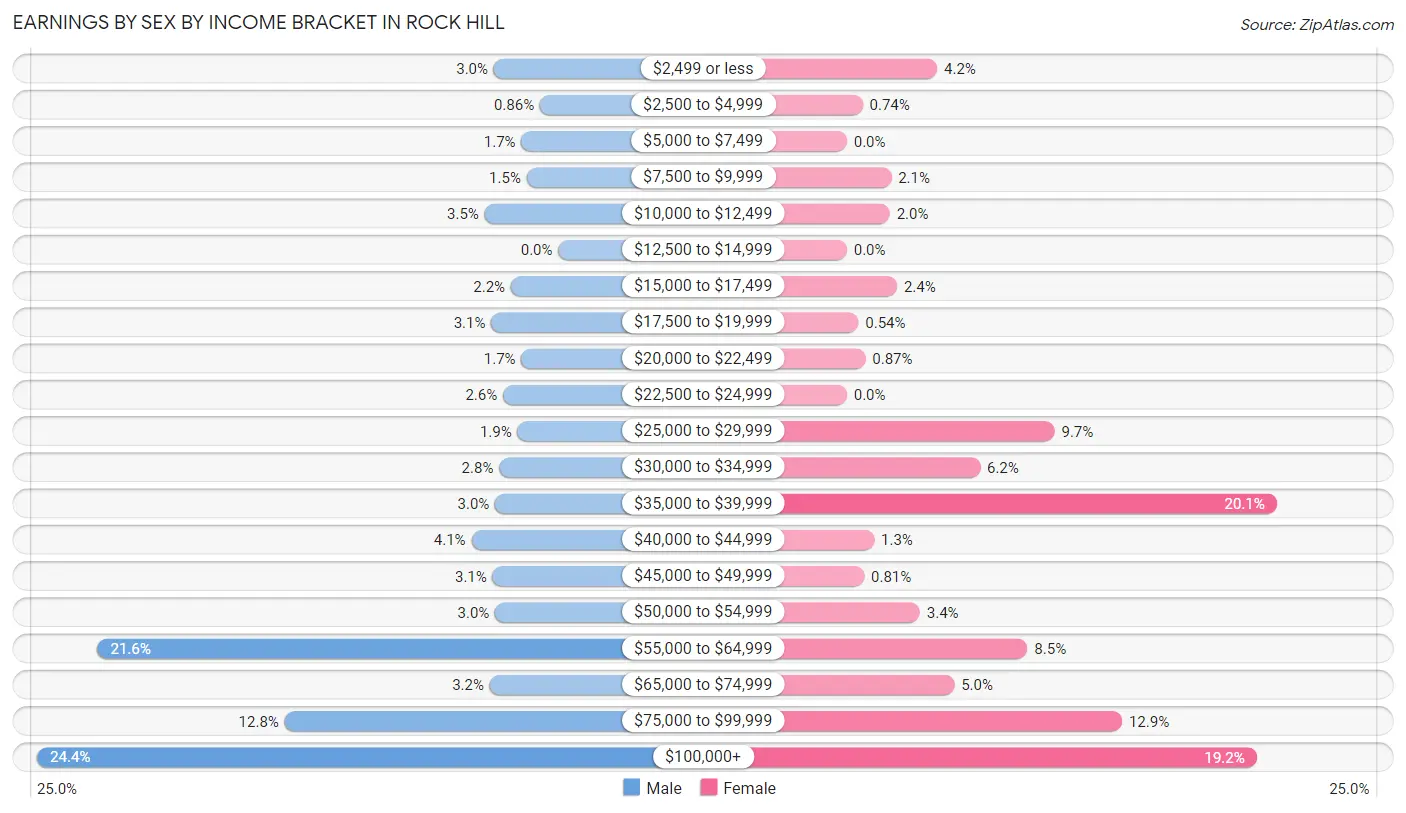
Earnings by Sex by Income Bracket in Rock Hill
The most common earnings brackets in Rock Hill are $100,000+ for men (396 | 24.4%) and $35,000 to $39,999 for women (300 | 20.1%).
| Income | Male | Female |
| $2,499 or less | 49 (3.0%) | 63 (4.2%) |
| $2,500 to $4,999 | 14 (0.9%) | 11 (0.7%) |
| $5,000 to $7,499 | 28 (1.7%) | 0 (0.0%) |
| $7,500 to $9,999 | 24 (1.5%) | 31 (2.1%) |
| $10,000 to $12,499 | 56 (3.5%) | 30 (2.0%) |
| $12,500 to $14,999 | 0 (0.0%) | 0 (0.0%) |
| $15,000 to $17,499 | 36 (2.2%) | 35 (2.4%) |
| $17,500 to $19,999 | 51 (3.1%) | 8 (0.5%) |
| $20,000 to $22,499 | 28 (1.7%) | 13 (0.9%) |
| $22,500 to $24,999 | 42 (2.6%) | 0 (0.0%) |
| $25,000 to $29,999 | 31 (1.9%) | 145 (9.7%) |
| $30,000 to $34,999 | 45 (2.8%) | 93 (6.2%) |
| $35,000 to $39,999 | 48 (3.0%) | 300 (20.1%) |
| $40,000 to $44,999 | 66 (4.1%) | 19 (1.3%) |
| $45,000 to $49,999 | 50 (3.1%) | 12 (0.8%) |
| $50,000 to $54,999 | 48 (3.0%) | 51 (3.4%) |
| $55,000 to $64,999 | 350 (21.6%) | 126 (8.5%) |
| $65,000 to $74,999 | 52 (3.2%) | 75 (5.0%) |
| $75,000 to $99,999 | 208 (12.8%) | 192 (12.9%) |
| $100,000+ | 396 (24.4%) | 286 (19.2%) |
| Total | 1,622 (100.0%) | 1,490 (100.0%) |
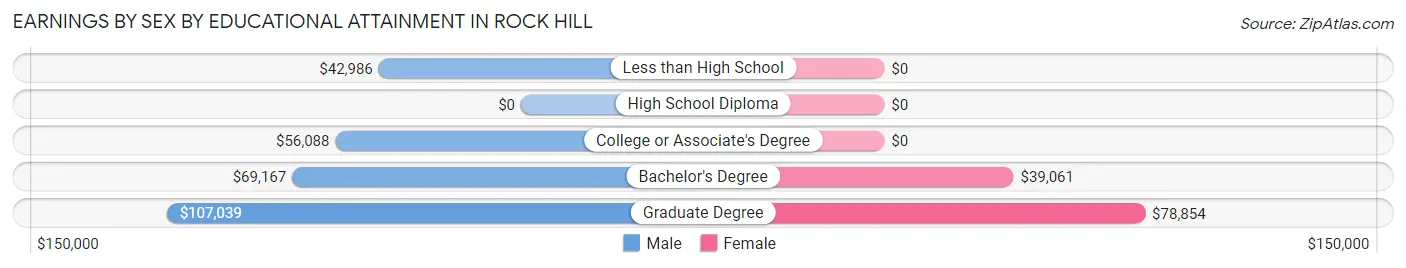
Earnings by Sex by Educational Attainment in Rock Hill
Average earnings in Rock Hill are $64,470 for men and $54,708 for women, a difference of 15.1%. Men with an educational attainment of graduate degree enjoy the highest average annual earnings of $107,039, while those with less than high school education earn the least with $42,986. Women with an educational attainment of graduate degree earn the most with the average annual earnings of $78,854, while those with bachelor's degree education have the smallest earnings of $39,061.
| Educational Attainment | Male Income | Female Income |
| Less than High School | $42,986 | $0 |
| High School Diploma | - | - |
| College or Associate's Degree | $56,088 | $0 |
| Bachelor's Degree | $69,167 | $39,061 |
| Graduate Degree | $107,039 | $78,854 |
| Total | $64,470 | $54,708 |
Family Income in Rock Hill
Family Income Brackets in Rock Hill
According to the Rock Hill family income data, there are 248 families falling into the $75,000 to $99,999 income range, which is the most common income bracket and makes up 20.7% of all families.
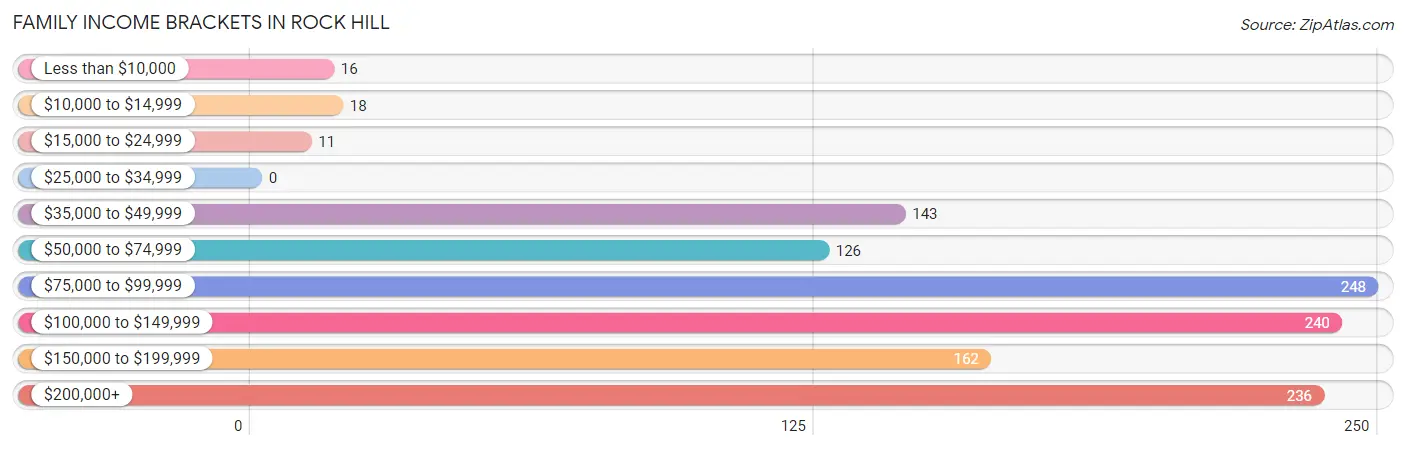
| Income Bracket | # Families | % Families |
| Less than $10,000 | 16 | 1.3% |
| $10,000 to $14,999 | 18 | 1.5% |
| $15,000 to $24,999 | 11 | 0.9% |
| $25,000 to $34,999 | 0 | 0.0% |
| $35,000 to $49,999 | 143 | 11.9% |
| $50,000 to $74,999 | 126 | 10.5% |
| $75,000 to $99,999 | 248 | 20.7% |
| $100,000 to $149,999 | 240 | 20.0% |
| $150,000 to $199,999 | 162 | 13.5% |
| $200,000+ | 236 | 19.7% |
Family Income by Famaliy Size in Rock Hill
4-person families (131 | 10.9%) account for the highest median family income in Rock Hill with $182,137 per family, while 2-person families (761 | 63.4%) have the highest median income of $49,418 per family member.
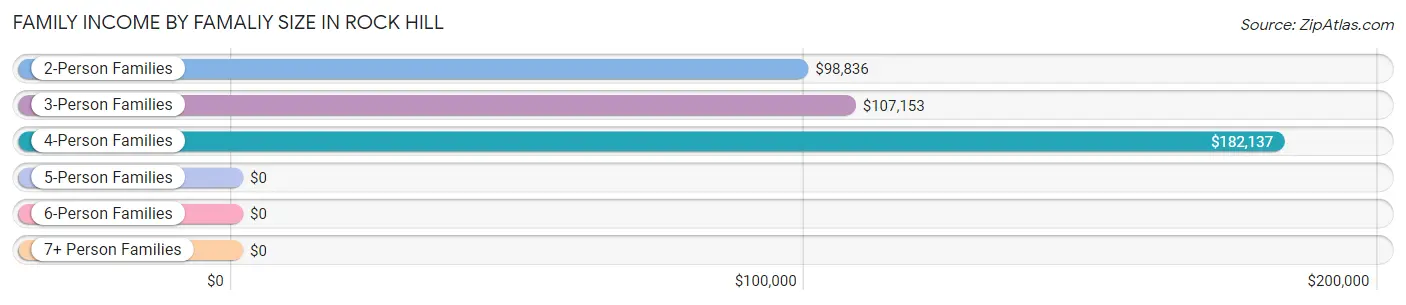
| Income Bracket | # Families | Median Income |
| 2-Person Families | 761 (63.4%) | $98,836 |
| 3-Person Families | 231 (19.3%) | $107,153 |
| 4-Person Families | 131 (10.9%) | $182,137 |
| 5-Person Families | 62 (5.2%) | $0 |
| 6-Person Families | 15 (1.3%) | $0 |
| 7+ Person Families | 0 (0.0%) | $0 |
| Total | 1,200 (100.0%) | $106,111 |
Family Income by Number of Earners in Rock Hill
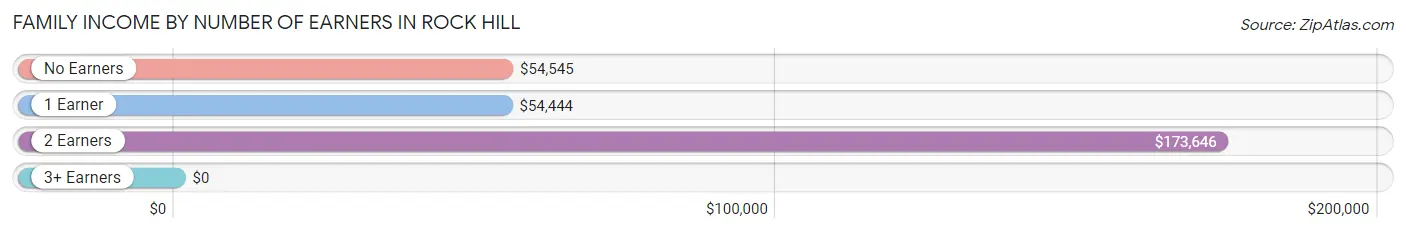
| Number of Earners | # Families | Median Income |
| No Earners | 176 (14.7%) | $54,545 |
| 1 Earner | 300 (25.0%) | $54,444 |
| 2 Earners | 623 (51.9%) | $173,646 |
| 3+ Earners | 101 (8.4%) | $0 |
| Total | 1,200 (100.0%) | $106,111 |
Household Income in Rock Hill
Household Income Brackets in Rock Hill
With 543 households falling in the category, the $35,000 to $49,999 income range is the most frequent in Rock Hill, accounting for 23.1% of all households. In contrast, only 12 households (0.5%) fall into the $15,000 to $24,999 income bracket, making it the least populous group.
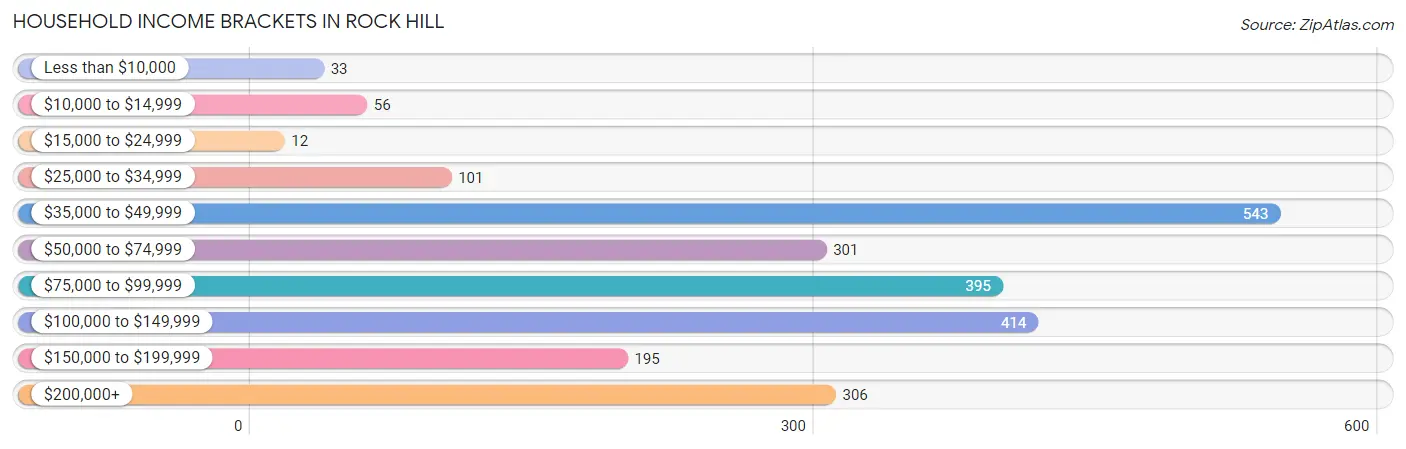
| Income Bracket | # Households | % Households |
| Less than $10,000 | 33 | 1.4% |
| $10,000 to $14,999 | 56 | 2.4% |
| $15,000 to $24,999 | 12 | 0.5% |
| $25,000 to $34,999 | 101 | 4.3% |
| $35,000 to $49,999 | 543 | 23.1% |
| $50,000 to $74,999 | 301 | 12.8% |
| $75,000 to $99,999 | 395 | 16.8% |
| $100,000 to $149,999 | 414 | 17.6% |
| $150,000 to $199,999 | 195 | 8.3% |
| $200,000+ | 306 | 13.0% |
Household Income by Householder Age in Rock Hill
The median household income in Rock Hill is $85,155, with the highest median household income of $125,714 found in the 45 to 64 years age bracket for the primary householder. A total of 534 households (22.7%) fall into this category. Meanwhile, the 15 to 24 years age bracket for the primary householder has the lowest median household income of $0, with 72 households (3.1%) in this group.
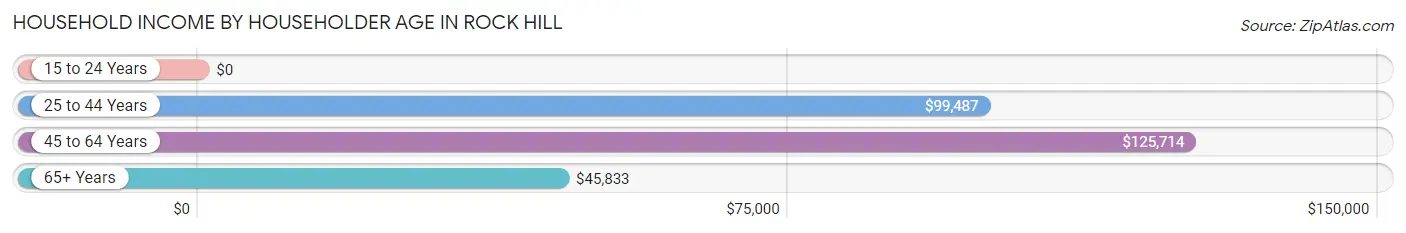
| Income Bracket | # Households | Median Income |
| 15 to 24 Years | 72 (3.1%) | $0 |
| 25 to 44 Years | 1,138 (48.4%) | $99,487 |
| 45 to 64 Years | 534 (22.7%) | $125,714 |
| 65+ Years | 608 (25.9%) | $45,833 |
| Total | 2,352 (100.0%) | $85,155 |
Poverty in Rock Hill
Income Below Poverty by Sex and Age in Rock Hill
With 7.7% poverty level for males and 5.7% for females among the residents of Rock Hill, 18 to 24 year old males and 15 year old females are the most vulnerable to poverty, with 99 males (40.2%) and 12 females (70.6%) in their respective age groups living below the poverty level.
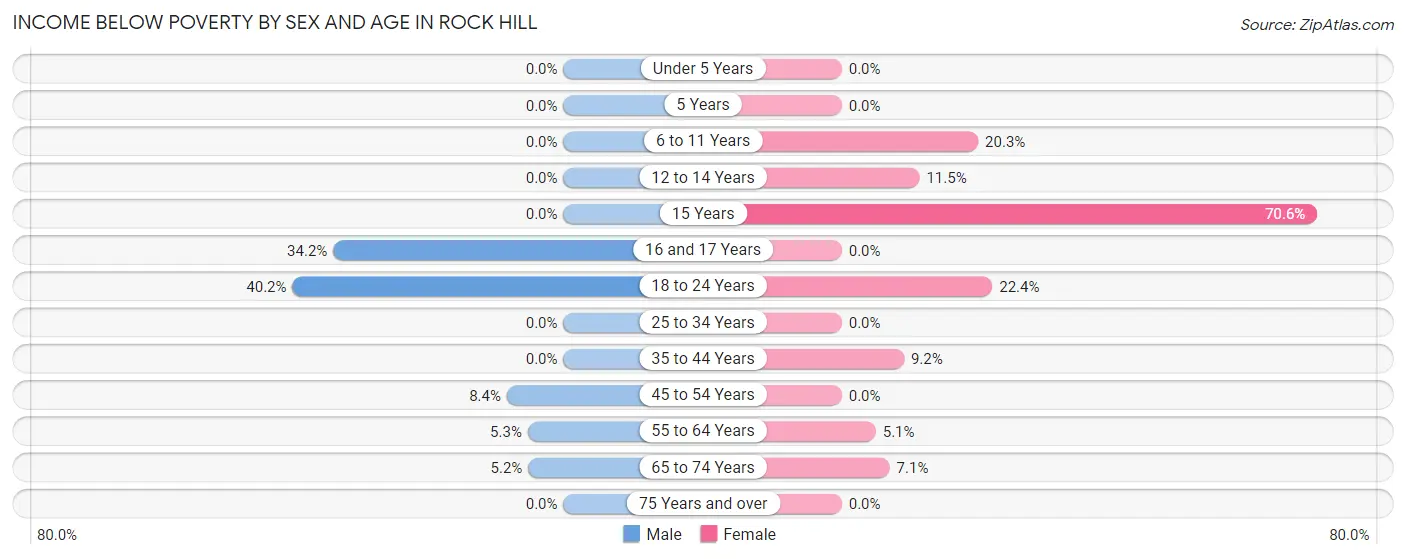
| Age Bracket | Male | Female |
| Under 5 Years | 0 (0.0%) | 0 (0.0%) |
| 5 Years | 0 (0.0%) | 0 (0.0%) |
| 6 to 11 Years | 0 (0.0%) | 16 (20.3%) |
| 12 to 14 Years | 0 (0.0%) | 12 (11.5%) |
| 15 Years | 0 (0.0%) | 12 (70.6%) |
| 16 and 17 Years | 27 (34.2%) | 0 (0.0%) |
| 18 to 24 Years | 99 (40.2%) | 38 (22.4%) |
| 25 to 34 Years | 0 (0.0%) | 0 (0.0%) |
| 35 to 44 Years | 0 (0.0%) | 24 (9.2%) |
| 45 to 54 Years | 32 (8.4%) | 0 (0.0%) |
| 55 to 64 Years | 12 (5.3%) | 16 (5.1%) |
| 65 to 74 Years | 14 (5.2%) | 16 (7.1%) |
| 75 Years and over | 0 (0.0%) | 0 (0.0%) |
| Total | 184 (7.7%) | 134 (5.7%) |
Income Above Poverty by Sex and Age in Rock Hill
According to the poverty statistics in Rock Hill, males aged under 5 years and females aged under 5 years are the age groups that are most secure financially, with 100.0% of males and 100.0% of females in these age groups living above the poverty line.
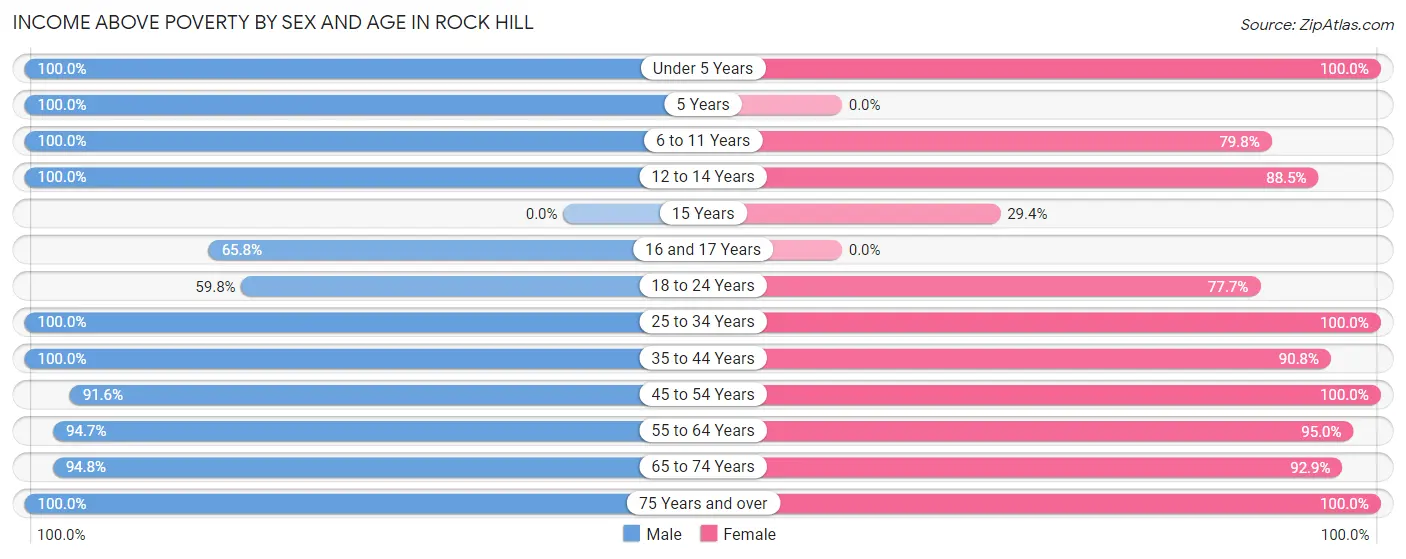
| Age Bracket | Male | Female |
| Under 5 Years | 210 (100.0%) | 85 (100.0%) |
| 5 Years | 27 (100.0%) | 0 (0.0%) |
| 6 to 11 Years | 28 (100.0%) | 63 (79.7%) |
| 12 to 14 Years | 45 (100.0%) | 92 (88.5%) |
| 15 Years | 0 (0.0%) | 5 (29.4%) |
| 16 and 17 Years | 52 (65.8%) | 0 (0.0%) |
| 18 to 24 Years | 147 (59.8%) | 132 (77.6%) |
| 25 to 34 Years | 481 (100.0%) | 660 (100.0%) |
| 35 to 44 Years | 242 (100.0%) | 236 (90.8%) |
| 45 to 54 Years | 349 (91.6%) | 195 (100.0%) |
| 55 to 64 Years | 215 (94.7%) | 301 (95.0%) |
| 65 to 74 Years | 254 (94.8%) | 209 (92.9%) |
| 75 Years and over | 160 (100.0%) | 222 (100.0%) |
| Total | 2,210 (92.3%) | 2,200 (94.3%) |
Income Below Poverty Among Married-Couple Families in Rock Hill
The poverty statistics for married-couple families in Rock Hill show that 1.5% or 14 of the total 938 families live below the poverty line. Families with 1 or 2 children have the highest poverty rate of 4.5%, comprising of 14 families. On the other hand, families with no children have the lowest poverty rate of 0.0%, which includes 0 families.
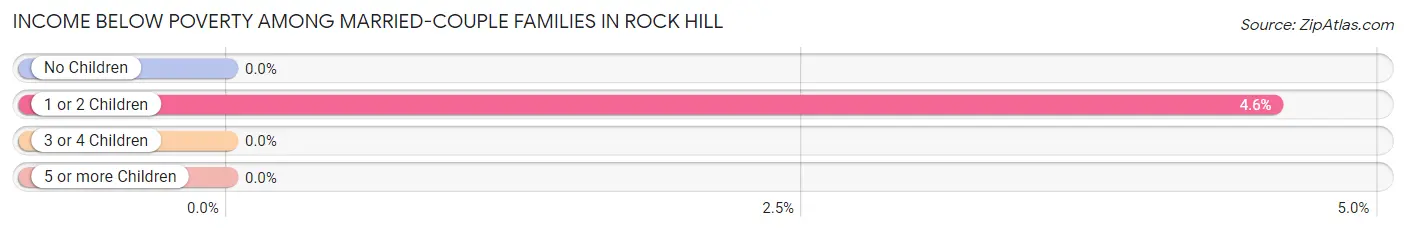
| Children | Above Poverty | Below Poverty |
| No Children | 605 (100.0%) | 0 (0.0%) |
| 1 or 2 Children | 294 (95.5%) | 14 (4.5%) |
| 3 or 4 Children | 25 (100.0%) | 0 (0.0%) |
| 5 or more Children | 0 (0.0%) | 0 (0.0%) |
| Total | 924 (98.5%) | 14 (1.5%) |
Income Below Poverty Among Single-Parent Households in Rock Hill
According to the poverty data in Rock Hill, 34.6% or 18 single-father households and 12.9% or 27 single-mother households are living below the poverty line. Among single-father households, those with 1 or 2 children have the highest poverty rate, with 18 households (50.0%) experiencing poverty. Likewise, among single-mother households, those with 3 or 4 children have the highest poverty rate, with 11 households (100.0%) falling below the poverty line.
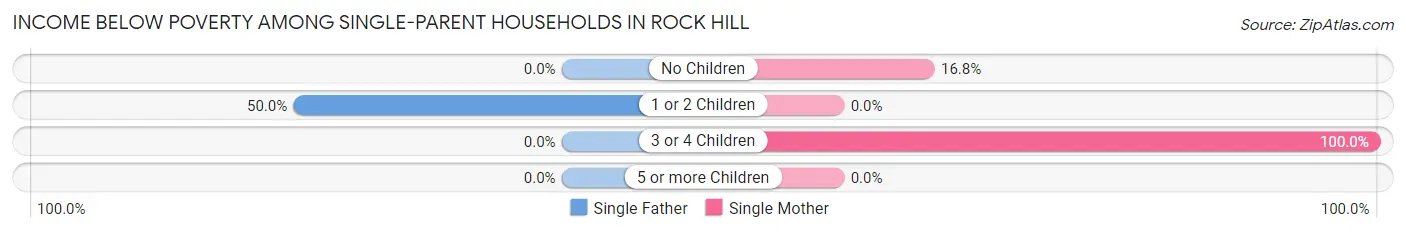
| Children | Single Father | Single Mother |
| No Children | 0 (0.0%) | 16 (16.8%) |
| 1 or 2 Children | 18 (50.0%) | 0 (0.0%) |
| 3 or 4 Children | 0 (0.0%) | 11 (100.0%) |
| 5 or more Children | 0 (0.0%) | 0 (0.0%) |
| Total | 18 (34.6%) | 27 (12.9%) |
Income Below Poverty Among Married-Couple vs Single-Parent Households in Rock Hill
The poverty data for Rock Hill shows that 14 of the married-couple family households (1.5%) and 45 of the single-parent households (17.2%) are living below the poverty level. Within the married-couple family households, those with 1 or 2 children have the highest poverty rate, with 14 households (4.5%) falling below the poverty line. Among the single-parent households, those with 3 or 4 children have the highest poverty rate, with 11 household (40.7%) living below poverty.
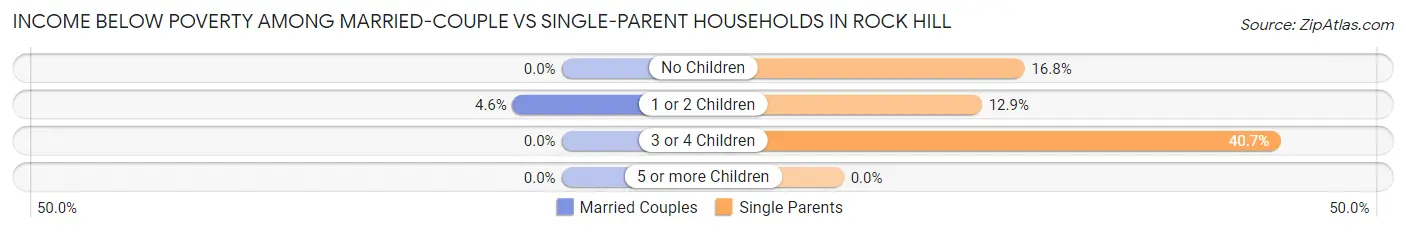
| Children | Married-Couple Families | Single-Parent Households |
| No Children | 0 (0.0%) | 16 (16.8%) |
| 1 or 2 Children | 14 (4.5%) | 18 (12.9%) |
| 3 or 4 Children | 0 (0.0%) | 11 (40.7%) |
| 5 or more Children | 0 (0.0%) | 0 (0.0%) |
| Total | 14 (1.5%) | 45 (17.2%) |
Race in Rock Hill
The most populous races in Rock Hill are White / Caucasian (3,213 | 68.0%), Black / African American (1,209 | 25.6%), and Hispanic or Latino (294 | 6.2%).
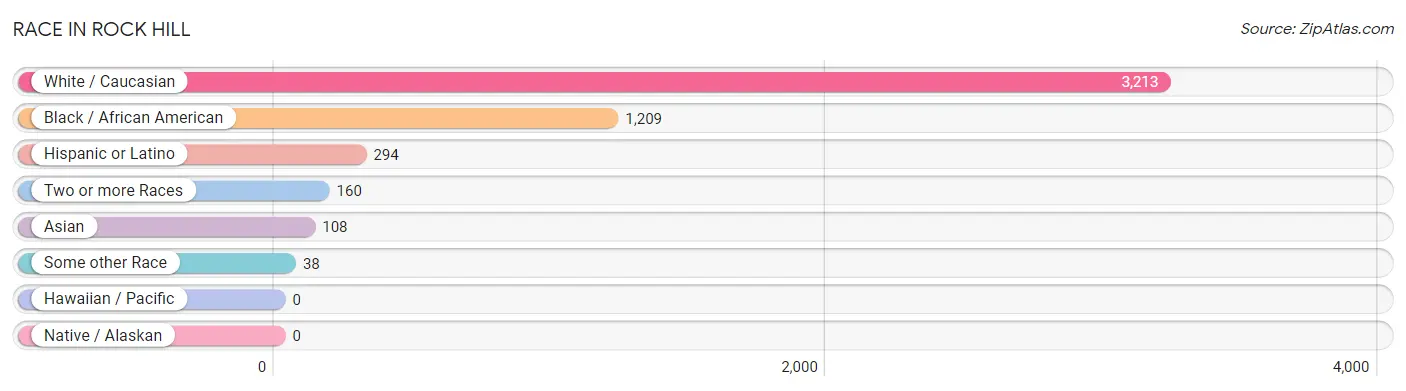
| Race | # Population | % Population |
| Asian | 108 | 2.3% |
| Black / African American | 1,209 | 25.6% |
| Hawaiian / Pacific | 0 | 0.0% |
| Hispanic or Latino | 294 | 6.2% |
| Native / Alaskan | 0 | 0.0% |
| White / Caucasian | 3,213 | 68.0% |
| Two or more Races | 160 | 3.4% |
| Some other Race | 38 | 0.8% |
| Total | 4,728 | 100.0% |
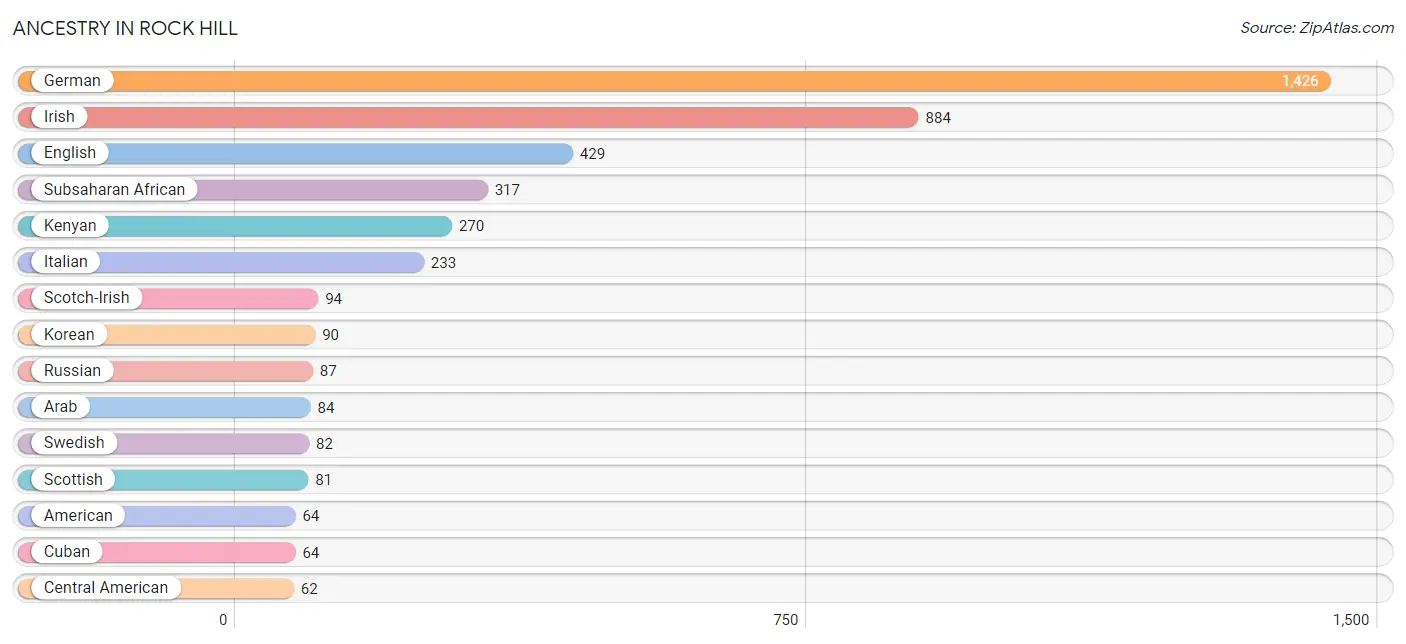
Ancestry in Rock Hill
The most populous ancestries reported in Rock Hill are German (1,426 | 30.2%), Irish (884 | 18.7%), English (429 | 9.1%), Subsaharan African (317 | 6.7%), and Kenyan (270 | 5.7%), together accounting for 70.3% of all Rock Hill residents.
| Ancestry | # Population | % Population |
| African | 19 | 0.4% |
| American | 64 | 1.3% |
| Arab | 84 | 1.8% |
| Bhutanese | 31 | 0.7% |
| British | 34 | 0.7% |
| Bulgarian | 11 | 0.2% |
| Burmese | 16 | 0.3% |
| Central American | 62 | 1.3% |
| Colombian | 23 | 0.5% |
| Croatian | 20 | 0.4% |
| Cuban | 64 | 1.3% |
| Czech | 22 | 0.5% |
| Danish | 40 | 0.9% |
| Egyptian | 34 | 0.7% |
| English | 429 | 9.1% |
| European | 11 | 0.2% |
| Filipino | 28 | 0.6% |
| Finnish | 19 | 0.4% |
| French | 19 | 0.4% |
| German | 1,426 | 30.2% |
| Greek | 31 | 0.7% |
| Guatemalan | 19 | 0.4% |
| Hungarian | 54 | 1.1% |
| Indian (Asian) | 20 | 0.4% |
| Iraqi | 50 | 1.1% |
| Irish | 884 | 18.7% |
| Italian | 233 | 4.9% |
| Kenyan | 270 | 5.7% |
| Korean | 90 | 1.9% |
| Latvian | 18 | 0.4% |
| Mexican | 59 | 1.3% |
| Nicaraguan | 43 | 0.9% |
| Nigerian | 28 | 0.6% |
| Northern European | 38 | 0.8% |
| Norwegian | 14 | 0.3% |
| Peruvian | 17 | 0.4% |
| Polish | 36 | 0.8% |
| Portuguese | 19 | 0.4% |
| Puerto Rican | 52 | 1.1% |
| Russian | 87 | 1.8% |
| Scotch-Irish | 94 | 2.0% |
| Scottish | 81 | 1.7% |
| South American | 40 | 0.9% |
| Spaniard | 17 | 0.4% |
| Sri Lankan | 8 | 0.2% |
| Subsaharan African | 317 | 6.7% |
| Swedish | 82 | 1.7% |
| Swiss | 16 | 0.3% | View All 48 Rows |
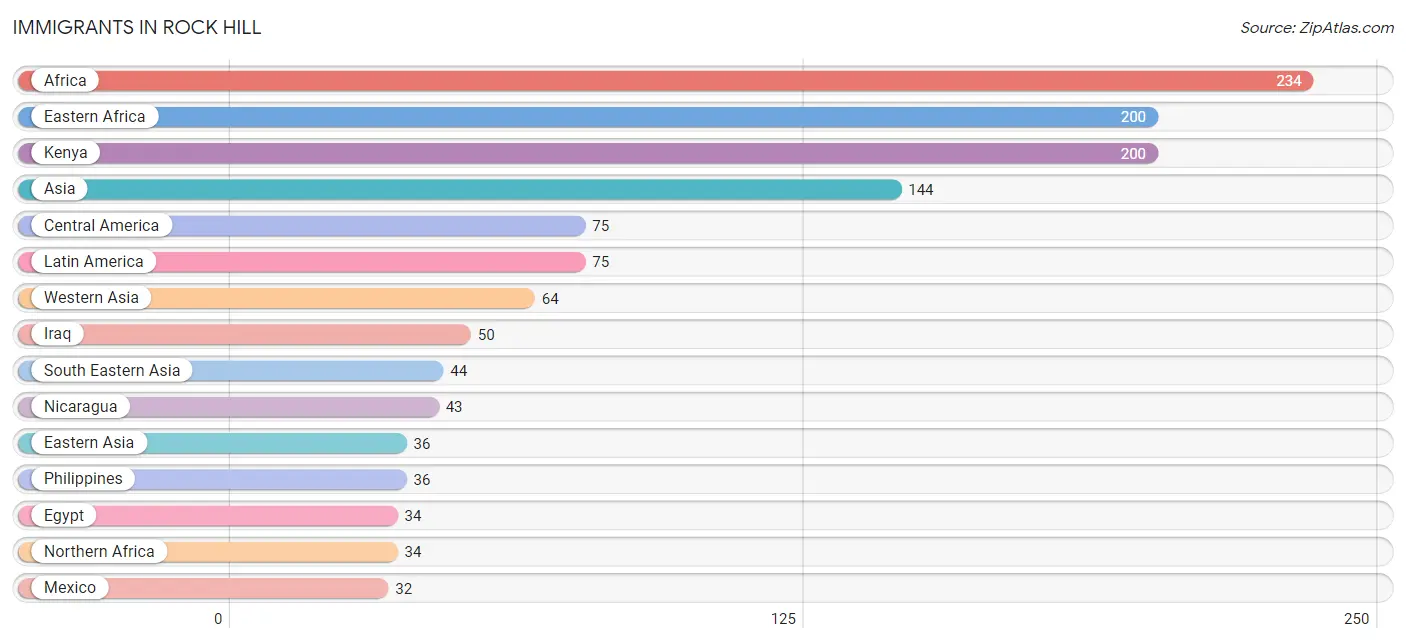
Immigrants in Rock Hill
The most numerous immigrant groups reported in Rock Hill came from Africa (234 | 5.0%), Eastern Africa (200 | 4.2%), Kenya (200 | 4.2%), Asia (144 | 3.0%), and Central America (75 | 1.6%), together accounting for 18.0% of all Rock Hill residents.
| Immigration Origin | # Population | % Population |
| Africa | 234 | 5.0% |
| Asia | 144 | 3.0% |
| Bulgaria | 11 | 0.2% |
| Central America | 75 | 1.6% |
| China | 20 | 0.4% |
| Eastern Africa | 200 | 4.2% |
| Eastern Asia | 36 | 0.8% |
| Eastern Europe | 11 | 0.2% |
| Egypt | 34 | 0.7% |
| Europe | 11 | 0.2% |
| Iraq | 50 | 1.1% |
| Jordan | 14 | 0.3% |
| Kenya | 200 | 4.2% |
| Korea | 16 | 0.3% |
| Latin America | 75 | 1.6% |
| Mexico | 32 | 0.7% |
| Nicaragua | 43 | 0.9% |
| Northern Africa | 34 | 0.7% |
| Philippines | 36 | 0.8% |
| South Eastern Asia | 44 | 0.9% |
| Vietnam | 8 | 0.2% |
| Western Asia | 64 | 1.3% | View All 22 Rows |
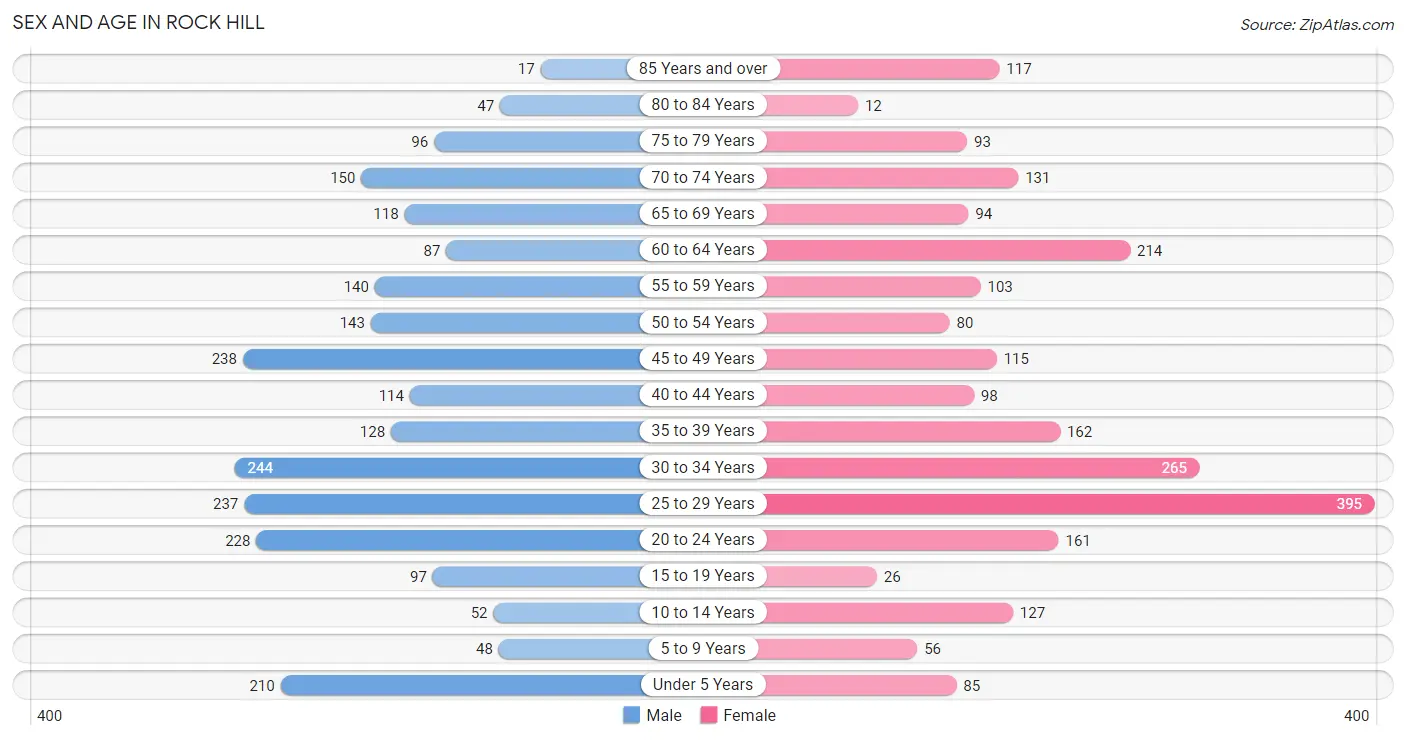
Sex and Age in Rock Hill
Sex and Age in Rock Hill
The most populous age groups in Rock Hill are 30 to 34 Years (244 | 10.2%) for men and 25 to 29 Years (395 | 16.9%) for women.
| Age Bracket | Male | Female |
| Under 5 Years | 210 (8.8%) | 85 (3.6%) |
| 5 to 9 Years | 48 (2.0%) | 56 (2.4%) |
| 10 to 14 Years | 52 (2.2%) | 127 (5.4%) |
| 15 to 19 Years | 97 (4.1%) | 26 (1.1%) |
| 20 to 24 Years | 228 (9.5%) | 161 (6.9%) |
| 25 to 29 Years | 237 (9.9%) | 395 (16.9%) |
| 30 to 34 Years | 244 (10.2%) | 265 (11.4%) |
| 35 to 39 Years | 128 (5.3%) | 162 (6.9%) |
| 40 to 44 Years | 114 (4.8%) | 98 (4.2%) |
| 45 to 49 Years | 238 (9.9%) | 115 (4.9%) |
| 50 to 54 Years | 143 (6.0%) | 80 (3.4%) |
| 55 to 59 Years | 140 (5.9%) | 103 (4.4%) |
| 60 to 64 Years | 87 (3.6%) | 214 (9.2%) |
| 65 to 69 Years | 118 (4.9%) | 94 (4.0%) |
| 70 to 74 Years | 150 (6.3%) | 131 (5.6%) |
| 75 to 79 Years | 96 (4.0%) | 93 (4.0%) |
| 80 to 84 Years | 47 (2.0%) | 12 (0.5%) |
| 85 Years and over | 17 (0.7%) | 117 (5.0%) |
| Total | 2,394 (100.0%) | 2,334 (100.0%) |
Families and Households in Rock Hill
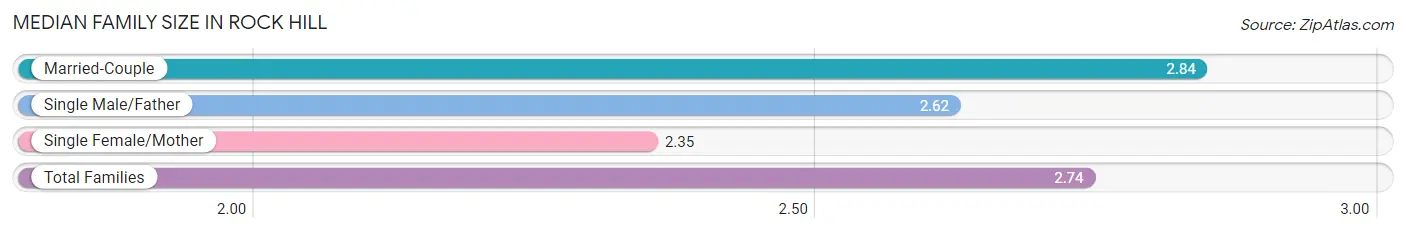
Median Family Size in Rock Hill
The median family size in Rock Hill is 2.74 persons per family, with married-couple families (938 | 78.2%) accounting for the largest median family size of 2.84 persons per family. On the other hand, single female/mother families (210 | 17.5%) represent the smallest median family size with 2.35 persons per family.
| Family Type | # Families | Family Size |
| Married-Couple | 938 (78.2%) | 2.84 |
| Single Male/Father | 52 (4.3%) | 2.62 |
| Single Female/Mother | 210 (17.5%) | 2.35 |
| Total Families | 1,200 (100.0%) | 2.74 |
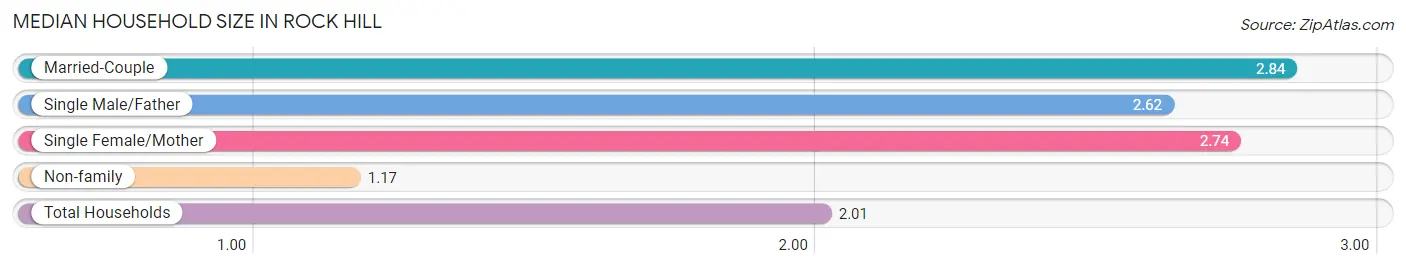
Median Household Size in Rock Hill
The median household size in Rock Hill is 2.01 persons per household, with married-couple households (938 | 39.9%) accounting for the largest median household size of 2.84 persons per household. non-family households (1,152 | 49.0%) represent the smallest median household size with 1.17 persons per household.
| Household Type | # Households | Household Size |
| Married-Couple | 938 (39.9%) | 2.84 |
| Single Male/Father | 52 (2.2%) | 2.62 |
| Single Female/Mother | 210 (8.9%) | 2.74 |
| Non-family | 1,152 (49.0%) | 1.17 |
| Total Households | 2,352 (100.0%) | 2.01 |
Household Size by Marriage Status in Rock Hill
Out of a total of 2,352 households in Rock Hill, 1,200 (51.0%) are family households, while 1,152 (49.0%) are nonfamily households. The most numerous type of family households are 2-person households, comprising 713, and the most common type of nonfamily households are 1-person households, comprising 938.
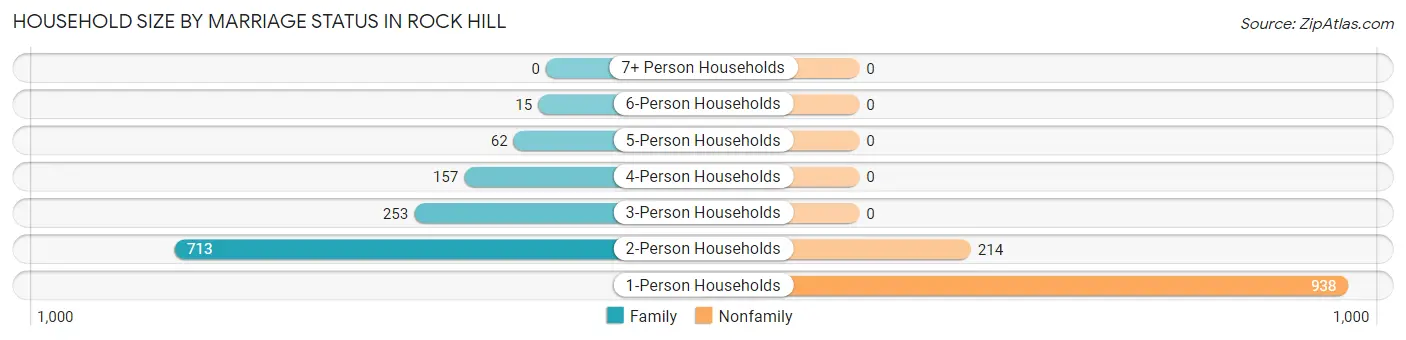
| Household Size | Family Households | Nonfamily Households |
| 1-Person Households | - | 938 (39.9%) |
| 2-Person Households | 713 (30.3%) | 214 (9.1%) |
| 3-Person Households | 253 (10.8%) | 0 (0.0%) |
| 4-Person Households | 157 (6.7%) | 0 (0.0%) |
| 5-Person Households | 62 (2.6%) | 0 (0.0%) |
| 6-Person Households | 15 (0.6%) | 0 (0.0%) |
| 7+ Person Households | 0 (0.0%) | 0 (0.0%) |
| Total | 1,200 (51.0%) | 1,152 (49.0%) |
Female Fertility in Rock Hill
Fertility by Age in Rock Hill
Average fertility rate in Rock Hill is 157.0 births per 1,000 women. Women in the age bracket of 35 to 50 years have the highest fertility rate with 229.0 births per 1,000 women. Women in the age bracket of 20 to 34 years acount for 55.2% of all women with births.
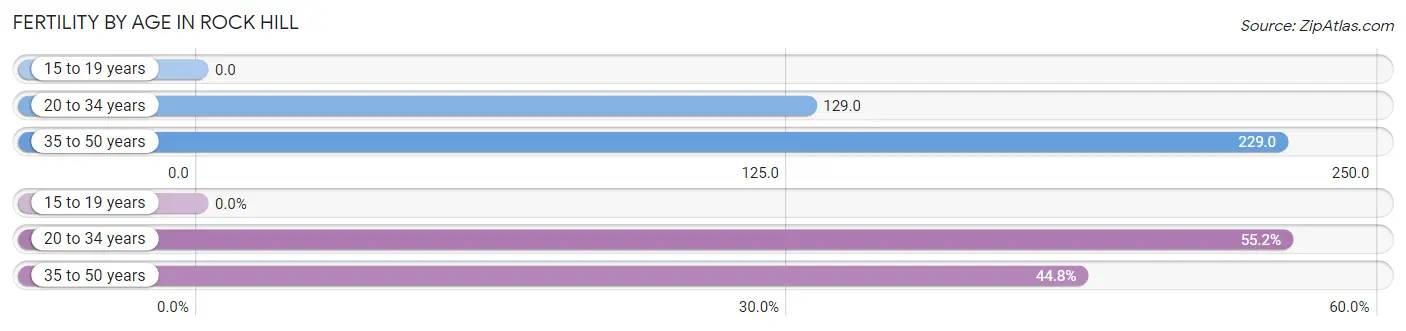
| Age Bracket | Women with Births | Births / 1,000 Women |
| 15 to 19 years | 0 (0.0%) | 0.0 |
| 20 to 34 years | 106 (55.2%) | 129.0 |
| 35 to 50 years | 86 (44.8%) | 229.0 |
| Total | 192 (100.0%) | 157.0 |
Fertility by Age by Marriage Status in Rock Hill
72.4% of women with births (192) in Rock Hill are married. The highest percentage of unmarried women with births falls into 20 to 34 years age bracket with 34.0% of them unmarried at the time of birth, while the lowest percentage of unmarried women with births belong to 35 to 50 years age bracket with 19.8% of them unmarried.
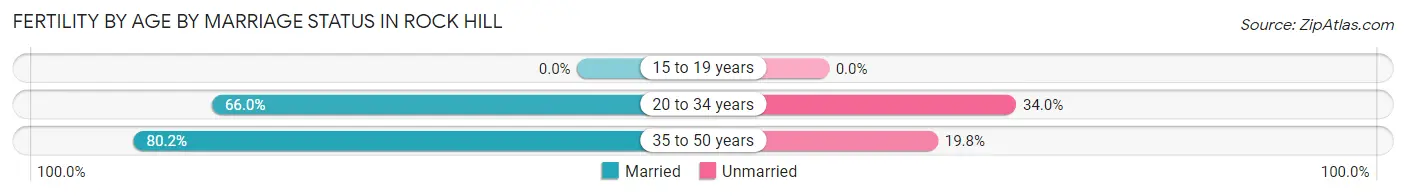
| Age Bracket | Married | Unmarried |
| 15 to 19 years | 0 (0.0%) | 0 (0.0%) |
| 20 to 34 years | 70 (66.0%) | 36 (34.0%) |
| 35 to 50 years | 69 (80.2%) | 17 (19.8%) |
| Total | 139 (72.4%) | 53 (27.6%) |
Fertility by Education in Rock Hill
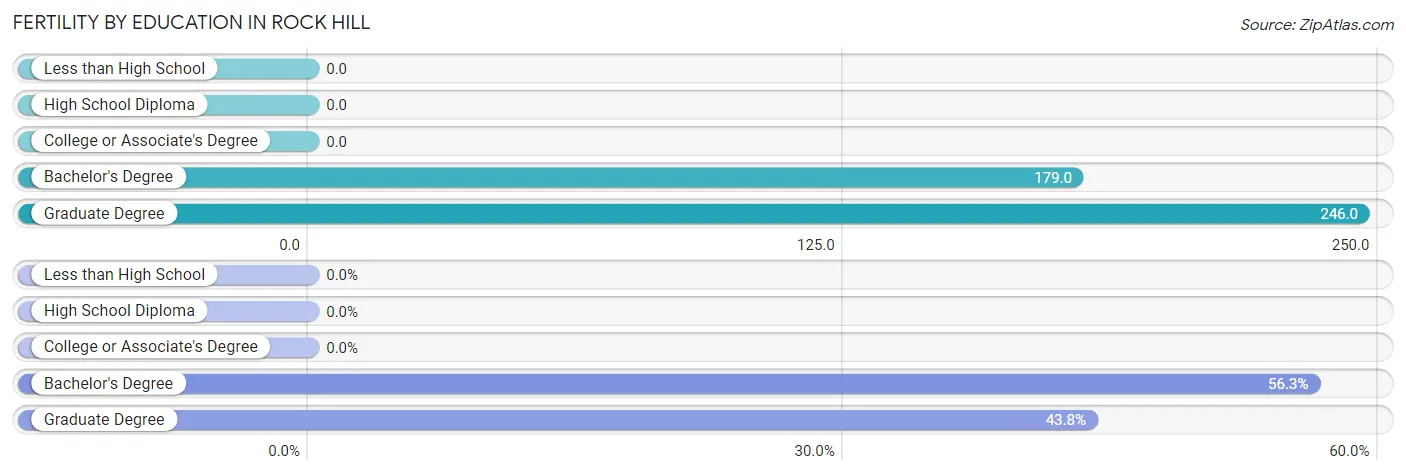
| Educational Attainment | Women with Births | Births / 1,000 Women |
| Less than High School | 0 (0.0%) | 0.0 |
| High School Diploma | 0 (0.0%) | 0.0 |
| College or Associate's Degree | 0 (0.0%) | 0.0 |
| Bachelor's Degree | 108 (56.2%) | 179.0 |
| Graduate Degree | 84 (43.8%) | 246.0 |
| Total | 192 (100.0%) | 157.0 |
Fertility by Education by Marriage Status in Rock Hill
27.6% of women with births in Rock Hill are unmarried. Women with the educational attainment of bachelor's degree are most likely to be married with 100.0% of them married at childbirth, while women with the educational attainment of graduate degree are least likely to be married with 63.1% of them unmarried at childbirth.
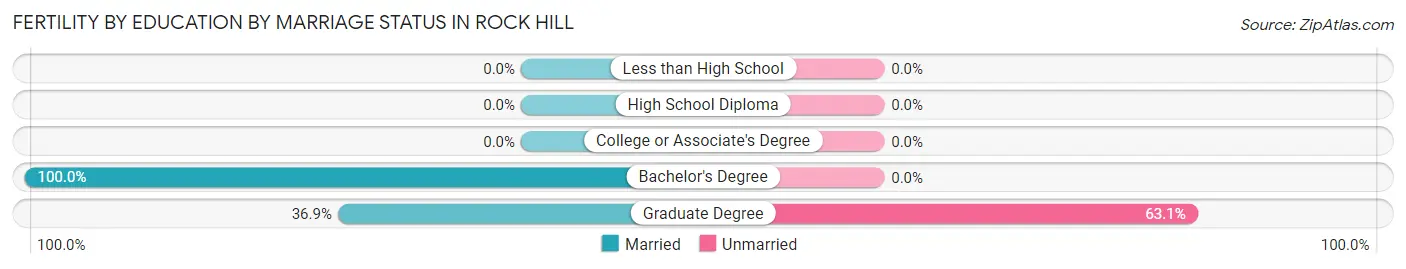
| Educational Attainment | Married | Unmarried |
| Less than High School | 0 (0.0%) | 0 (0.0%) |
| High School Diploma | 0 (0.0%) | 0 (0.0%) |
| College or Associate's Degree | 0 (0.0%) | 0 (0.0%) |
| Bachelor's Degree | 108 (100.0%) | 0 (0.0%) |
| Graduate Degree | 31 (36.9%) | 53 (63.1%) |
| Total | 139 (72.4%) | 53 (27.6%) |
Employment Characteristics in Rock Hill
Employment by Class of Employer in Rock Hill
Among the 2,835 employed individuals in Rock Hill, private company employees (1,638 | 57.8%), not-for-profit organizations (442 | 15.6%), and self-employed (not incorporated) (204 | 7.2%) make up the most common classes of employment.
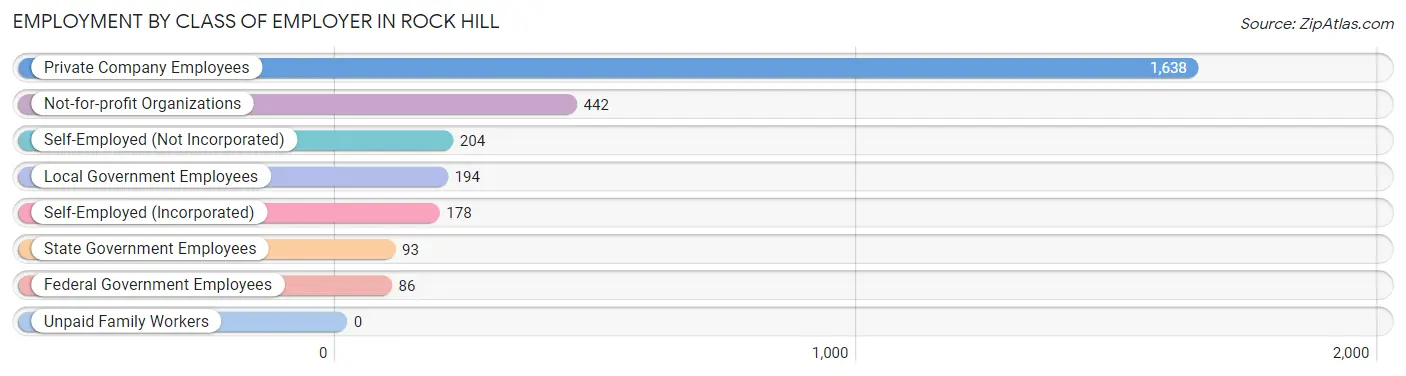
| Employer Class | # Employees | % Employees |
| Private Company Employees | 1,638 | 57.8% |
| Self-Employed (Incorporated) | 178 | 6.3% |
| Self-Employed (Not Incorporated) | 204 | 7.2% |
| Not-for-profit Organizations | 442 | 15.6% |
| Local Government Employees | 194 | 6.8% |
| State Government Employees | 93 | 3.3% |
| Federal Government Employees | 86 | 3.0% |
| Unpaid Family Workers | 0 | 0.0% |
| Total | 2,835 | 100.0% |
Employment Status by Age in Rock Hill
According to the labor force statistics for Rock Hill, out of the total population over 16 years of age (4,133), 70.3% or 2,905 individuals are in the labor force, with 1.8% or 52 of them unemployed. The age group with the highest labor force participation rate is 25 to 29 years, with 100.0% or 632 individuals in the labor force. Within the labor force, the 60 to 64 years age range has the highest percentage of unemployed individuals, with 8.4% or 12 of them being unemployed.
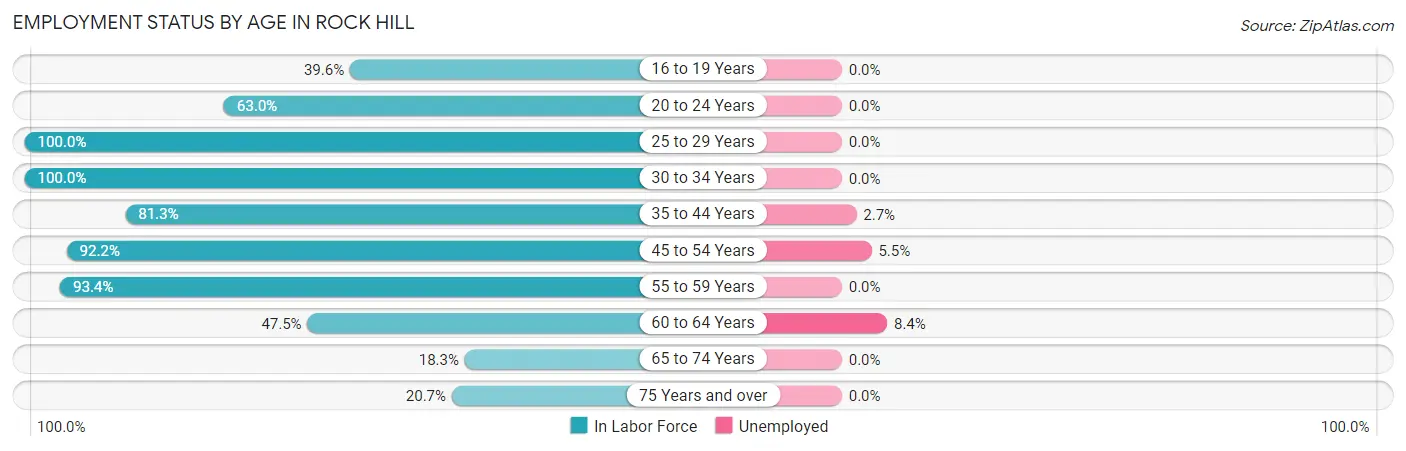
| Age Bracket | In Labor Force | Unemployed |
| 16 to 19 Years | 42 (39.6%) | 0 (0.0%) |
| 20 to 24 Years | 245 (63.0%) | 0 (0.0%) |
| 25 to 29 Years | 632 (100.0%) | 0 (0.0%) |
| 30 to 34 Years | 509 (100.0%) | 0 (0.0%) |
| 35 to 44 Years | 408 (81.3%) | 11 (2.7%) |
| 45 to 54 Years | 531 (92.2%) | 29 (5.5%) |
| 55 to 59 Years | 227 (93.4%) | 0 (0.0%) |
| 60 to 64 Years | 143 (47.5%) | 12 (8.4%) |
| 65 to 74 Years | 90 (18.3%) | 0 (0.0%) |
| 75 Years and over | 79 (20.7%) | 0 (0.0%) |
| Total | 2,905 (70.3%) | 52 (1.8%) |
Employment Status by Educational Attainment in Rock Hill
According to labor force statistics for Rock Hill, 88.7% of individuals (2,451) out of the total population between 25 and 64 years of age (2,763) are in the labor force, with 2.1% or 51 of them being unemployed. The group with the highest labor force participation rate are those with the educational attainment of bachelor's degree or higher, with 92.1% or 1,900 individuals in the labor force. Within the labor force, individuals with less than high school education have the highest percentage of unemployment, with 18.9% or 18 of them being unemployed.
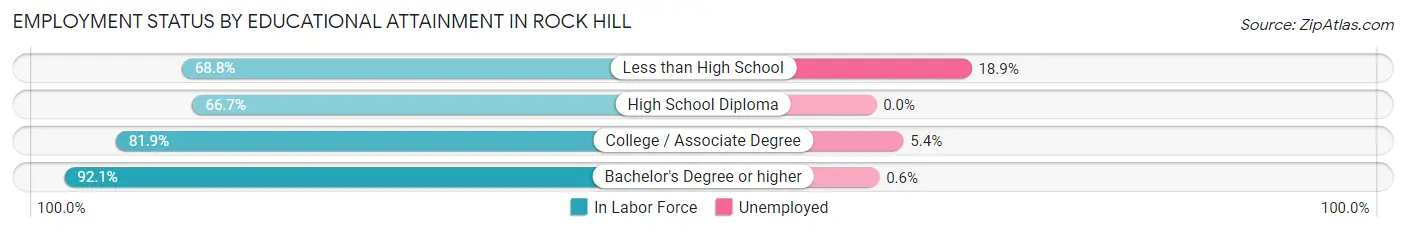
| Educational Attainment | In Labor Force | Unemployed |
| Less than High School | 95 (68.8%) | 26 (18.9%) |
| High School Diploma | 28 (66.7%) | 0 (0.0%) |
| College / Associate Degree | 426 (81.9%) | 28 (5.4%) |
| Bachelor's Degree or higher | 1,900 (92.1%) | 12 (0.6%) |
| Total | 2,451 (88.7%) | 58 (2.1%) |
Employment Occupations by Sex in Rock Hill
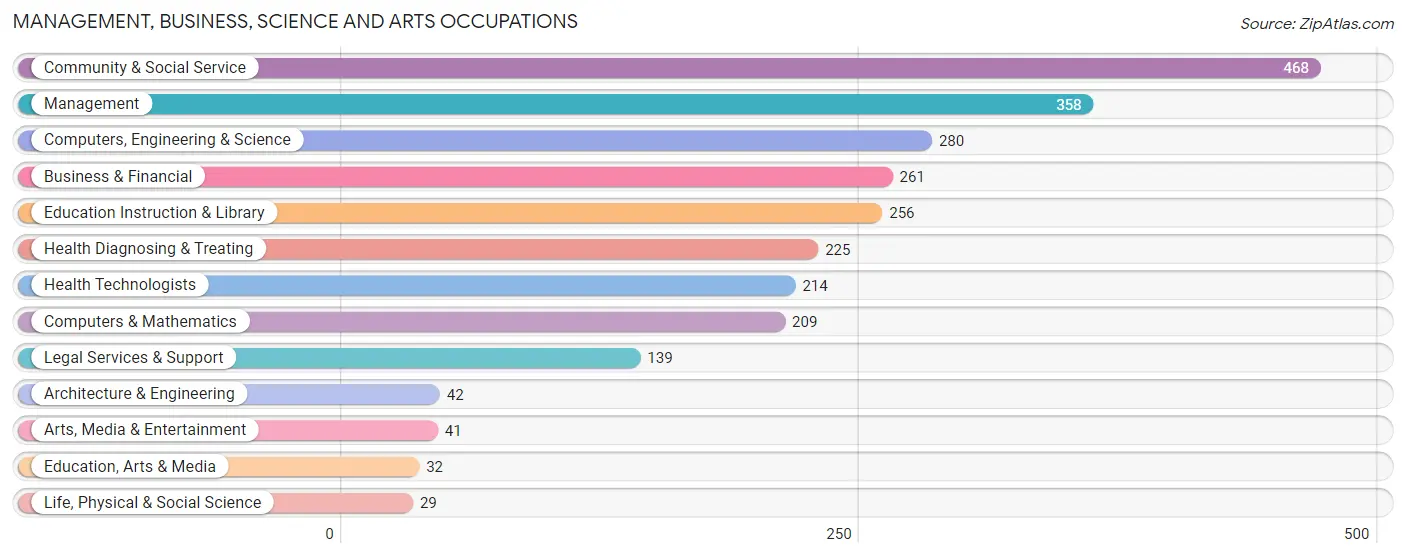
Management, Business, Science and Arts Occupations
The most common Management, Business, Science and Arts occupations in Rock Hill are Community & Social Service (468 | 16.4%), Management (358 | 12.5%), Computers, Engineering & Science (280 | 9.8%), Business & Financial (261 | 9.1%), and Education Instruction & Library (256 | 9.0%).
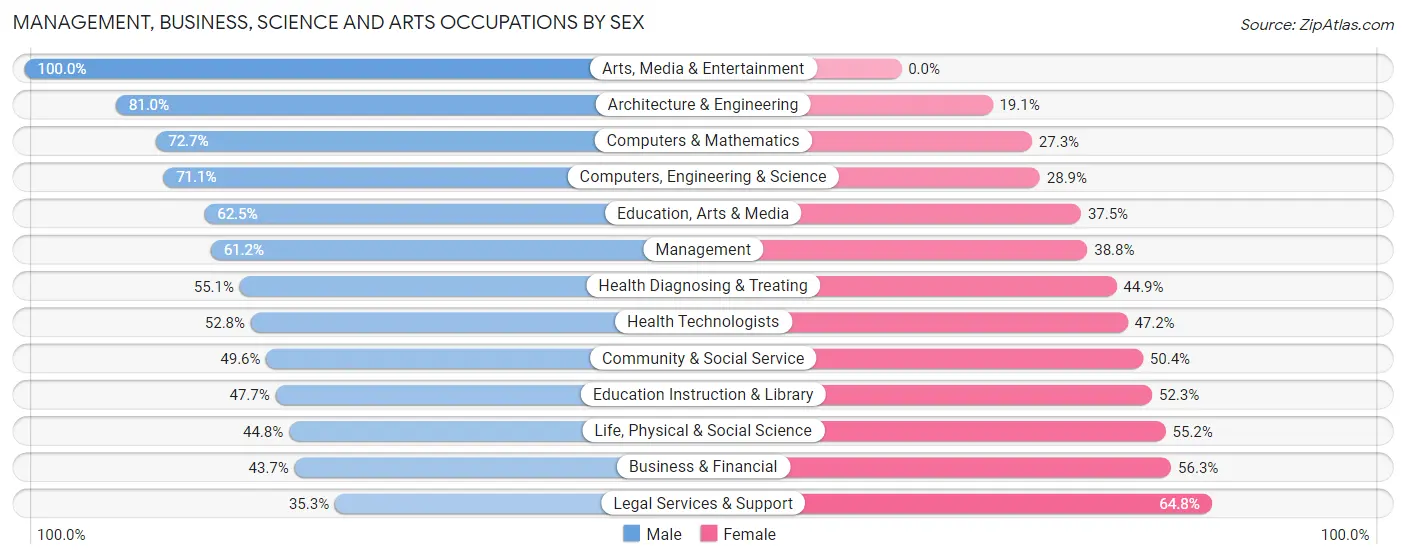
Management, Business, Science and Arts Occupations by Sex
Within the Management, Business, Science and Arts occupations in Rock Hill, the most male-oriented occupations are Arts, Media & Entertainment (100.0%), Architecture & Engineering (80.9%), and Computers & Mathematics (72.7%), while the most female-oriented occupations are Legal Services & Support (64.7%), Business & Financial (56.3%), and Life, Physical & Social Science (55.2%).
| Occupation | Male | Female |
| Management | 219 (61.2%) | 139 (38.8%) |
| Business & Financial | 114 (43.7%) | 147 (56.3%) |
| Computers, Engineering & Science | 199 (71.1%) | 81 (28.9%) |
| Computers & Mathematics | 152 (72.7%) | 57 (27.3%) |
| Architecture & Engineering | 34 (80.9%) | 8 (19.1%) |
| Life, Physical & Social Science | 13 (44.8%) | 16 (55.2%) |
| Community & Social Service | 232 (49.6%) | 236 (50.4%) |
| Education, Arts & Media | 20 (62.5%) | 12 (37.5%) |
| Legal Services & Support | 49 (35.2%) | 90 (64.7%) |
| Education Instruction & Library | 122 (47.7%) | 134 (52.3%) |
| Arts, Media & Entertainment | 41 (100.0%) | 0 (0.0%) |
| Health Diagnosing & Treating | 124 (55.1%) | 101 (44.9%) |
| Health Technologists | 113 (52.8%) | 101 (47.2%) |
| Total (Category) | 888 (55.8%) | 704 (44.2%) |
| Total (Overall) | 1,488 (52.1%) | 1,366 (47.9%) |
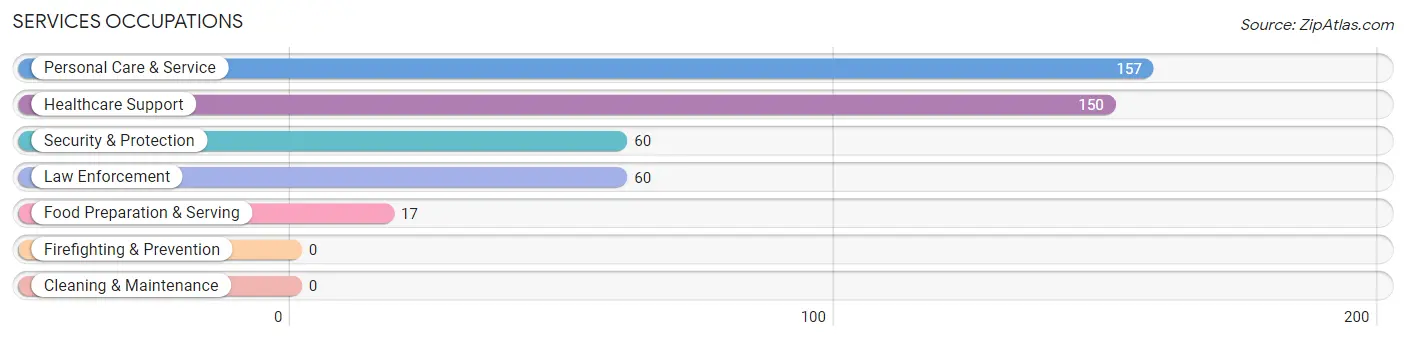
Services Occupations
The most common Services occupations in Rock Hill are Personal Care & Service (157 | 5.5%), Healthcare Support (150 | 5.3%), Security & Protection (60 | 2.1%), Law Enforcement (60 | 2.1%), and Food Preparation & Serving (17 | 0.6%).
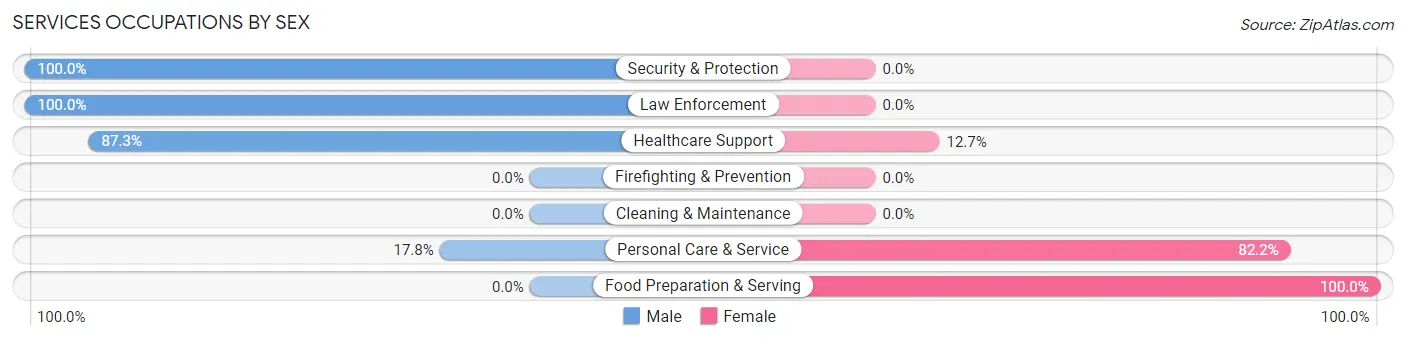
Services Occupations by Sex
Within the Services occupations in Rock Hill, the most male-oriented occupations are Security & Protection (100.0%), Law Enforcement (100.0%), and Healthcare Support (87.3%), while the most female-oriented occupations are Food Preparation & Serving (100.0%), Personal Care & Service (82.2%), and Healthcare Support (12.7%).
| Occupation | Male | Female |
| Healthcare Support | 131 (87.3%) | 19 (12.7%) |
| Security & Protection | 60 (100.0%) | 0 (0.0%) |
| Firefighting & Prevention | 0 (0.0%) | 0 (0.0%) |
| Law Enforcement | 60 (100.0%) | 0 (0.0%) |
| Food Preparation & Serving | 0 (0.0%) | 17 (100.0%) |
| Cleaning & Maintenance | 0 (0.0%) | 0 (0.0%) |
| Personal Care & Service | 28 (17.8%) | 129 (82.2%) |
| Total (Category) | 219 (57.0%) | 165 (43.0%) |
| Total (Overall) | 1,488 (52.1%) | 1,366 (47.9%) |
Sales and Office Occupations
The most common Sales and Office occupations in Rock Hill are Office & Administration (442 | 15.5%), and Sales & Related (300 | 10.5%).

Sales and Office Occupations by Sex

| Occupation | Male | Female |
| Sales & Related | 173 (57.7%) | 127 (42.3%) |
| Office & Administration | 72 (16.3%) | 370 (83.7%) |
| Total (Category) | 245 (33.0%) | 497 (67.0%) |
| Total (Overall) | 1,488 (52.1%) | 1,366 (47.9%) |
Natural Resources, Construction and Maintenance Occupations
The most common Natural Resources, Construction and Maintenance occupations in Rock Hill are Construction & Extraction (24 | 0.8%), and Installation, Maintenance & Repair (12 | 0.4%).
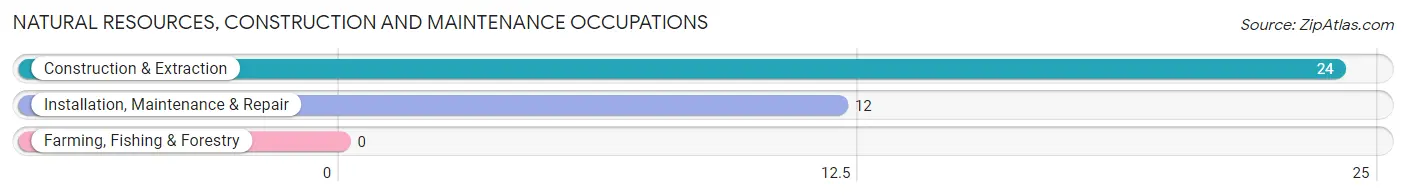
Natural Resources, Construction and Maintenance Occupations by Sex
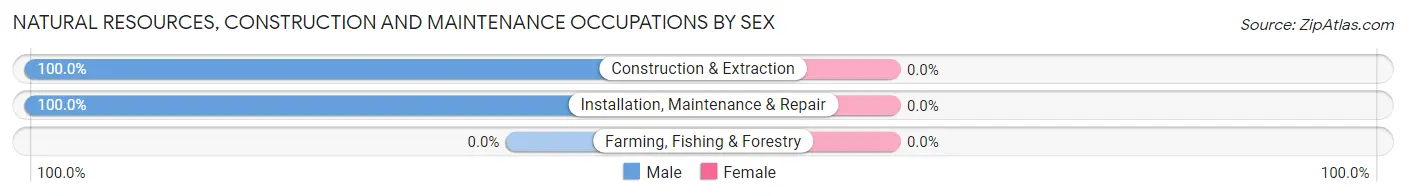
| Occupation | Male | Female |
| Farming, Fishing & Forestry | 0 (0.0%) | 0 (0.0%) |
| Construction & Extraction | 24 (100.0%) | 0 (0.0%) |
| Installation, Maintenance & Repair | 12 (100.0%) | 0 (0.0%) |
| Total (Category) | 36 (100.0%) | 0 (0.0%) |
| Total (Overall) | 1,488 (52.1%) | 1,366 (47.9%) |
Production, Transportation and Moving Occupations
The most common Production, Transportation and Moving occupations in Rock Hill are Production (68 | 2.4%), Material Moving (19 | 0.7%), and Transportation (13 | 0.5%).
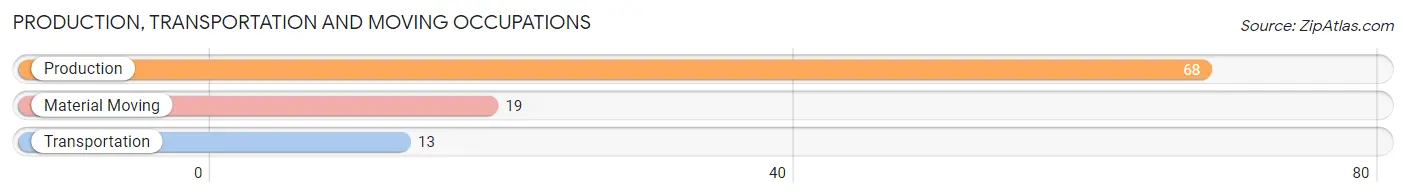
Production, Transportation and Moving Occupations by Sex
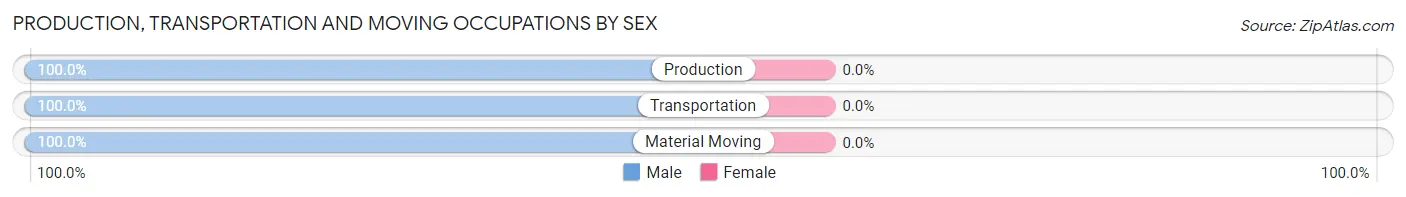
| Occupation | Male | Female |
| Production | 68 (100.0%) | 0 (0.0%) |
| Transportation | 13 (100.0%) | 0 (0.0%) |
| Material Moving | 19 (100.0%) | 0 (0.0%) |
| Total (Category) | 100 (100.0%) | 0 (0.0%) |
| Total (Overall) | 1,488 (52.1%) | 1,366 (47.9%) |
Employment Industries by Sex in Rock Hill
Employment Industries in Rock Hill
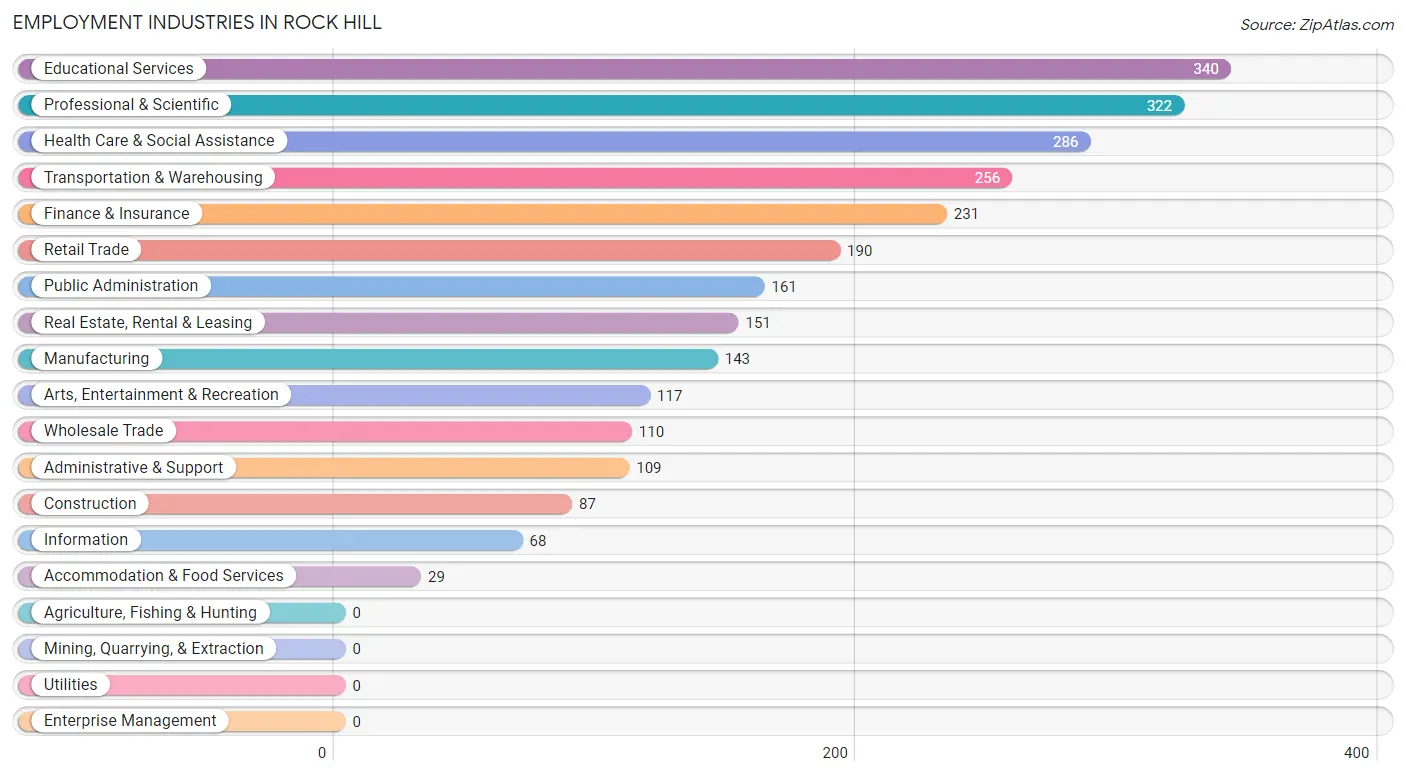
The major employment industries in Rock Hill include Educational Services (340 | 11.9%), Professional & Scientific (322 | 11.3%), Health Care & Social Assistance (286 | 10.0%), Transportation & Warehousing (256 | 9.0%), and Finance & Insurance (231 | 8.1%).
Employment Industries by Sex in Rock Hill
The Rock Hill industries that see more men than women are Construction (100.0%), Retail Trade (86.8%), and Manufacturing (83.2%), whereas the industries that tend to have a higher number of women are Accommodation & Food Services (100.0%), Transportation & Warehousing (89.4%), and Arts, Entertainment & Recreation (80.3%).
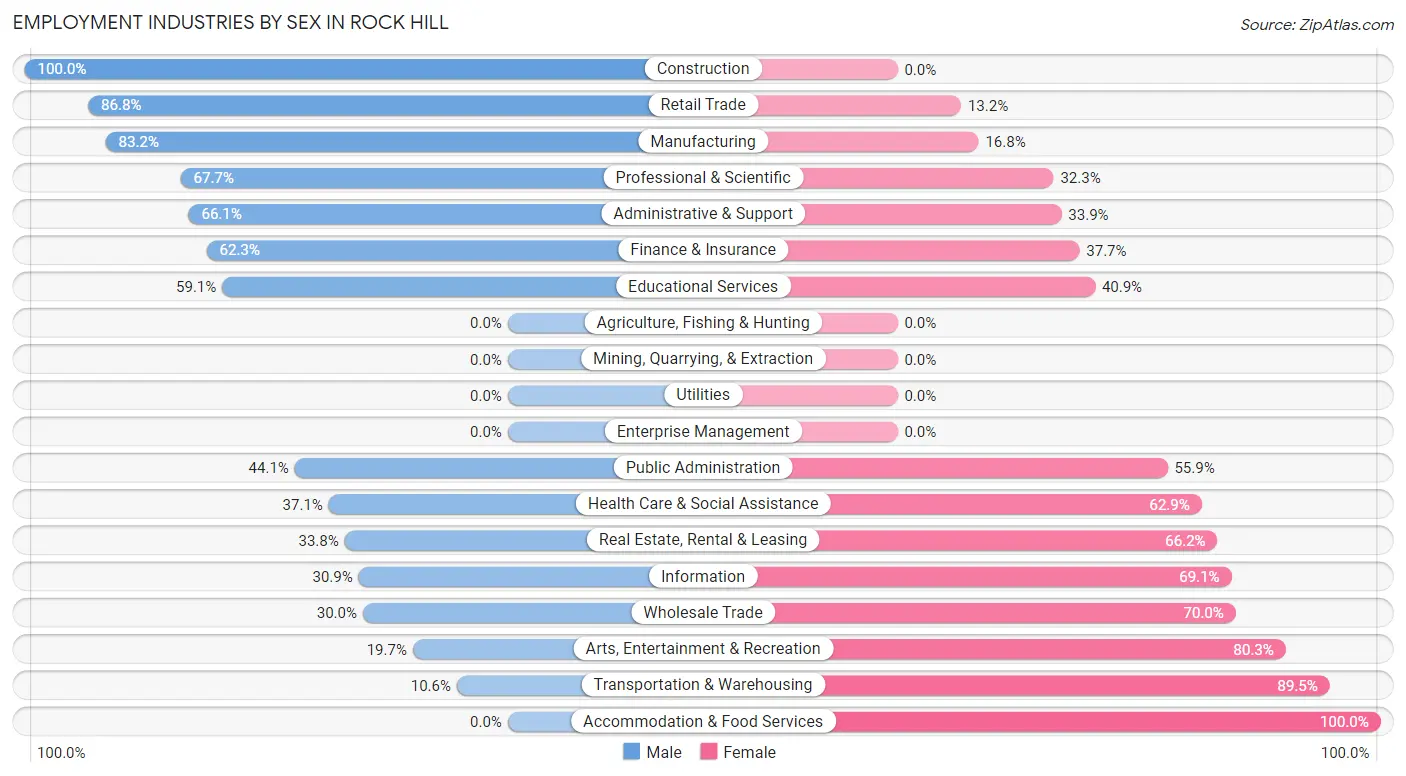
| Industry | Male | Female |
| Agriculture, Fishing & Hunting | 0 (0.0%) | 0 (0.0%) |
| Mining, Quarrying, & Extraction | 0 (0.0%) | 0 (0.0%) |
| Construction | 87 (100.0%) | 0 (0.0%) |
| Manufacturing | 119 (83.2%) | 24 (16.8%) |
| Wholesale Trade | 33 (30.0%) | 77 (70.0%) |
| Retail Trade | 165 (86.8%) | 25 (13.2%) |
| Transportation & Warehousing | 27 (10.5%) | 229 (89.4%) |
| Utilities | 0 (0.0%) | 0 (0.0%) |
| Information | 21 (30.9%) | 47 (69.1%) |
| Finance & Insurance | 144 (62.3%) | 87 (37.7%) |
| Real Estate, Rental & Leasing | 51 (33.8%) | 100 (66.2%) |
| Professional & Scientific | 218 (67.7%) | 104 (32.3%) |
| Enterprise Management | 0 (0.0%) | 0 (0.0%) |
| Administrative & Support | 72 (66.1%) | 37 (33.9%) |
| Educational Services | 201 (59.1%) | 139 (40.9%) |
| Health Care & Social Assistance | 106 (37.1%) | 180 (62.9%) |
| Arts, Entertainment & Recreation | 23 (19.7%) | 94 (80.3%) |
| Accommodation & Food Services | 0 (0.0%) | 29 (100.0%) |
| Public Administration | 71 (44.1%) | 90 (55.9%) |
| Total | 1,488 (52.1%) | 1,366 (47.9%) |
Education in Rock Hill
School Enrollment in Rock Hill
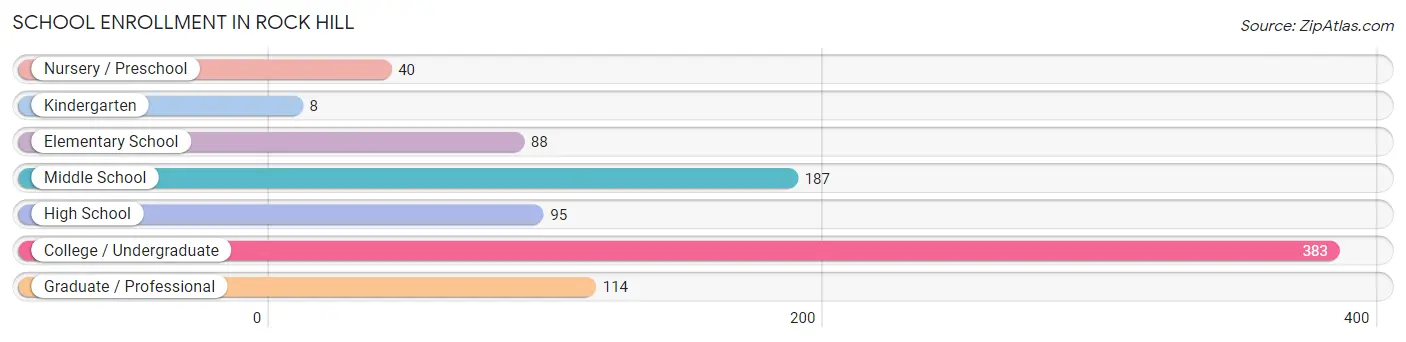
The most common levels of schooling among the 915 students in Rock Hill are college / undergraduate (383 | 41.9%), middle school (187 | 20.4%), and graduate / professional (114 | 12.5%).
| School Level | # Students | % Students |
| Nursery / Preschool | 40 | 4.4% |
| Kindergarten | 8 | 0.9% |
| Elementary School | 88 | 9.6% |
| Middle School | 187 | 20.4% |
| High School | 95 | 10.4% |
| College / Undergraduate | 383 | 41.9% |
| Graduate / Professional | 114 | 12.5% |
| Total | 915 | 100.0% |
School Enrollment by Age by Funding Source in Rock Hill
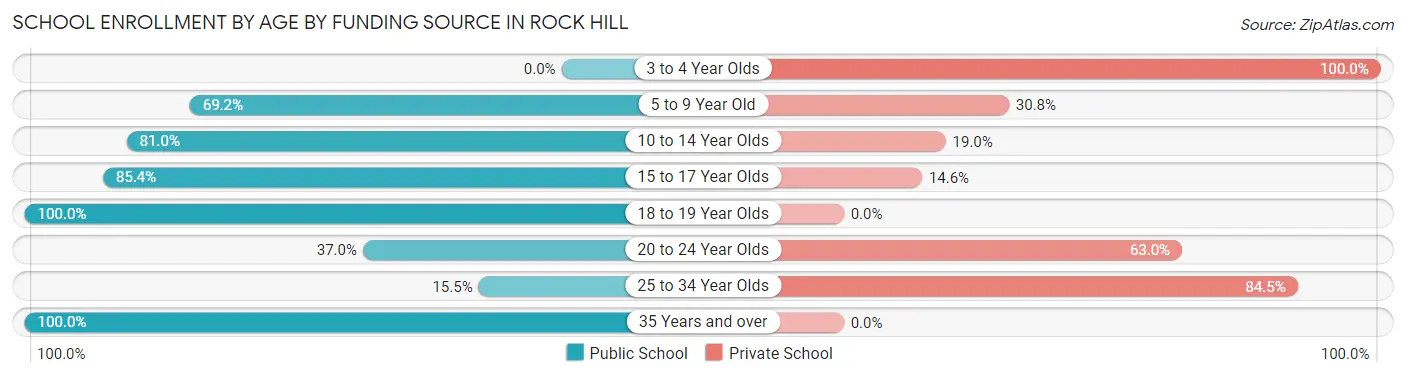
Out of a total of 915 students who are enrolled in schools in Rock Hill, 309 (33.8%) attend a private institution, while the remaining 606 (66.2%) are enrolled in public schools. The age group of 3 to 4 year olds has the highest likelihood of being enrolled in private schools, with 21 (100.0% in the age bracket) enrolled. Conversely, the age group of 18 to 19 year olds has the lowest likelihood of being enrolled in a private school, with 27 (100.0% in the age bracket) attending a public institution.
| Age Bracket | Public School | Private School |
| 3 to 4 Year Olds | 0 (0.0%) | 21 (100.0%) |
| 5 to 9 Year Old | 72 (69.2%) | 32 (30.8%) |
| 10 to 14 Year Olds | 145 (81.0%) | 34 (19.0%) |
| 15 to 17 Year Olds | 82 (85.4%) | 14 (14.6%) |
| 18 to 19 Year Olds | 27 (100.0%) | 0 (0.0%) |
| 20 to 24 Year Olds | 74 (37.0%) | 126 (63.0%) |
| 25 to 34 Year Olds | 15 (15.5%) | 82 (84.5%) |
| 35 Years and over | 191 (100.0%) | 0 (0.0%) |
| Total | 606 (66.2%) | 309 (33.8%) |
Educational Attainment by Field of Study in Rock Hill
Business (793 | 31.2%), communications (241 | 9.5%), social sciences (201 | 7.9%), science & technology (198 | 7.8%), and engineering (171 | 6.7%) are the most common fields of study among 2,541 individuals in Rock Hill who have obtained a bachelor's degree or higher.
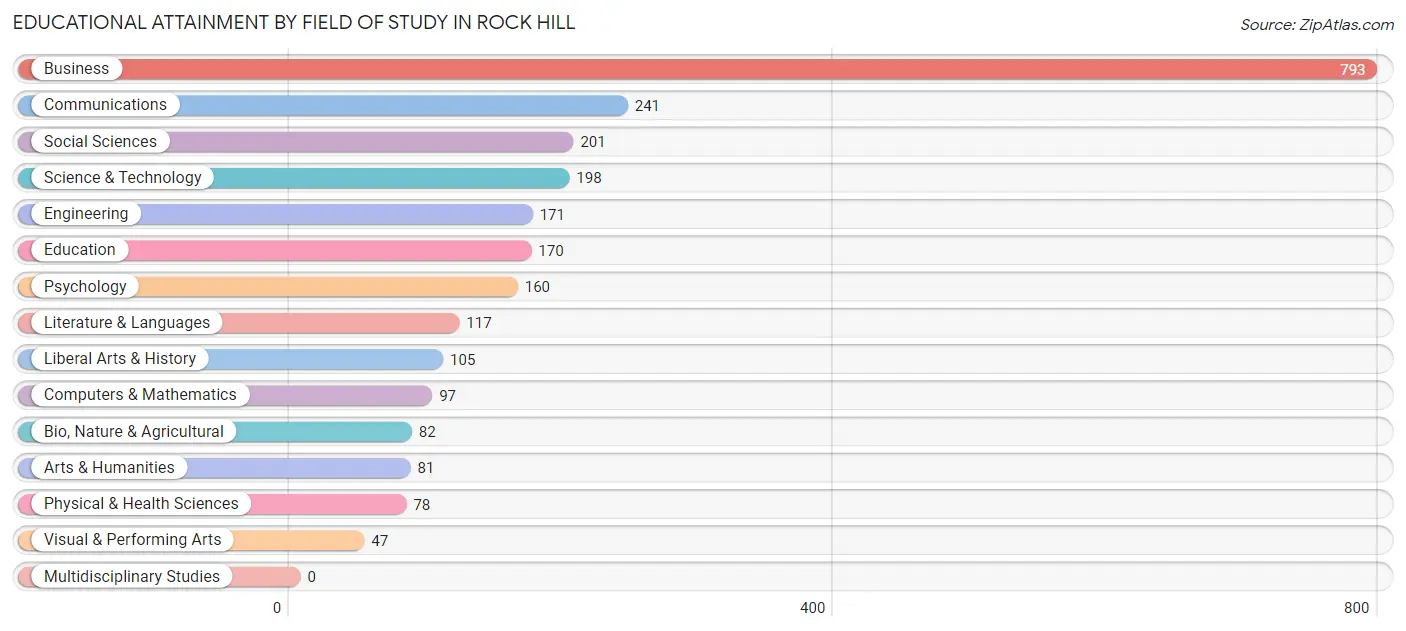
| Field of Study | # Graduates | % Graduates |
| Computers & Mathematics | 97 | 3.8% |
| Bio, Nature & Agricultural | 82 | 3.2% |
| Physical & Health Sciences | 78 | 3.1% |
| Psychology | 160 | 6.3% |
| Social Sciences | 201 | 7.9% |
| Engineering | 171 | 6.7% |
| Multidisciplinary Studies | 0 | 0.0% |
| Science & Technology | 198 | 7.8% |
| Business | 793 | 31.2% |
| Education | 170 | 6.7% |
| Literature & Languages | 117 | 4.6% |
| Liberal Arts & History | 105 | 4.1% |
| Visual & Performing Arts | 47 | 1.8% |
| Communications | 241 | 9.5% |
| Arts & Humanities | 81 | 3.2% |
| Total | 2,541 | 100.0% |
Transportation & Commute in Rock Hill
Vehicle Availability by Sex in Rock Hill
The most prevalent vehicle ownership categories in Rock Hill are males with 2 vehicles (1,048, accounting for 70.4%) and females with 2 vehicles (562, making up 77.8%).
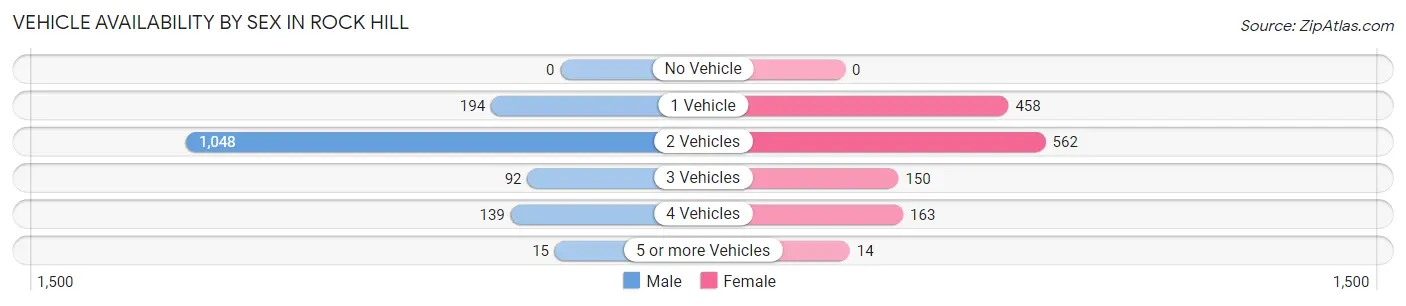
| Vehicles Available | Male | Female |
| No Vehicle | 0 (0.0%) | 0 (0.0%) |
| 1 Vehicle | 194 (13.0%) | 458 (34.0%) |
| 2 Vehicles | 1,048 (70.4%) | 562 (41.7%) |
| 3 Vehicles | 92 (6.2%) | 150 (11.1%) |
| 4 Vehicles | 139 (9.3%) | 163 (12.1%) |
| 5 or more Vehicles | 15 (1.0%) | 14 (1.0%) |
| Total | 1,488 (100.0%) | 1,347 (100.0%) |
Commute Time in Rock Hill
The most frequently occuring commute durations in Rock Hill are 20 to 24 minutes (790 commuters, 32.1%), 15 to 19 minutes (399 commuters, 16.2%), and 10 to 14 minutes (351 commuters, 14.3%).
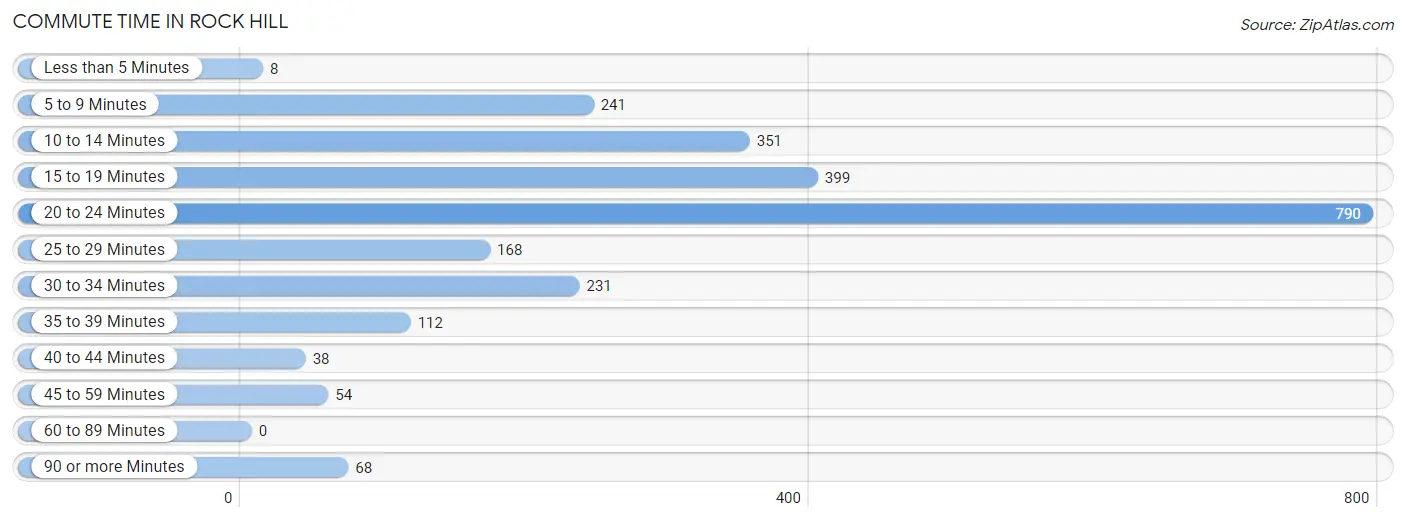
| Commute Time | # Commuters | % Commuters |
| Less than 5 Minutes | 8 | 0.3% |
| 5 to 9 Minutes | 241 | 9.8% |
| 10 to 14 Minutes | 351 | 14.3% |
| 15 to 19 Minutes | 399 | 16.2% |
| 20 to 24 Minutes | 790 | 32.1% |
| 25 to 29 Minutes | 168 | 6.8% |
| 30 to 34 Minutes | 231 | 9.4% |
| 35 to 39 Minutes | 112 | 4.5% |
| 40 to 44 Minutes | 38 | 1.5% |
| 45 to 59 Minutes | 54 | 2.2% |
| 60 to 89 Minutes | 0 | 0.0% |
| 90 or more Minutes | 68 | 2.8% |
Commute Time by Sex in Rock Hill
The most common commute times in Rock Hill are 20 to 24 minutes (360 commuters, 27.1%) for males and 20 to 24 minutes (430 commuters, 38.0%) for females.
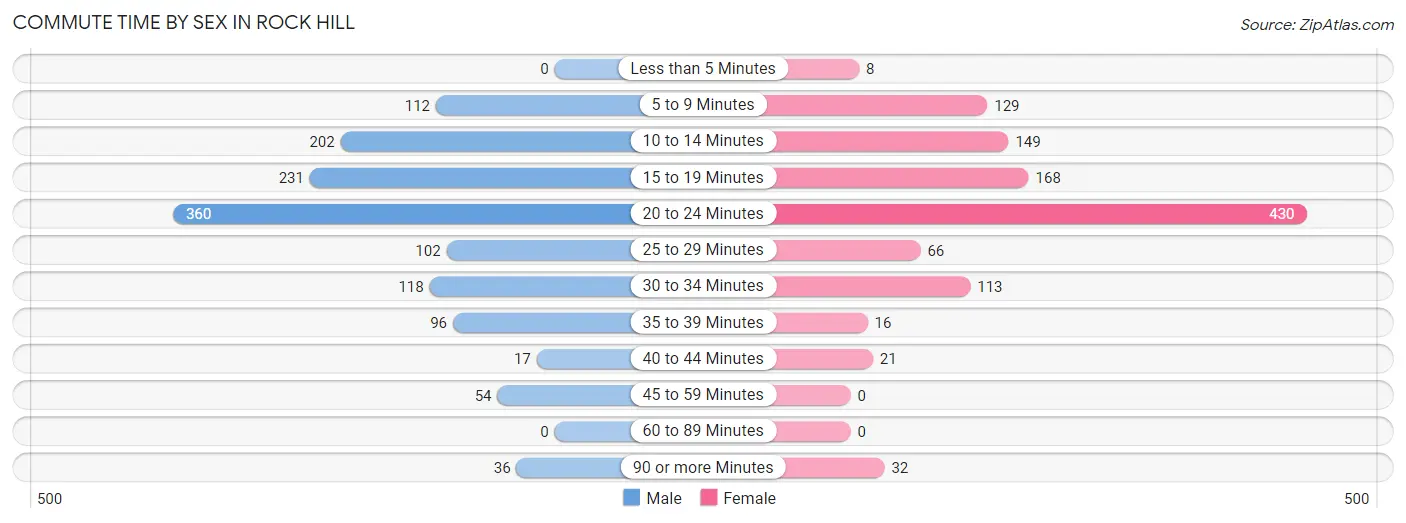
| Commute Time | Male | Female |
| Less than 5 Minutes | 0 (0.0%) | 8 (0.7%) |
| 5 to 9 Minutes | 112 (8.4%) | 129 (11.4%) |
| 10 to 14 Minutes | 202 (15.2%) | 149 (13.2%) |
| 15 to 19 Minutes | 231 (17.4%) | 168 (14.8%) |
| 20 to 24 Minutes | 360 (27.1%) | 430 (38.0%) |
| 25 to 29 Minutes | 102 (7.7%) | 66 (5.8%) |
| 30 to 34 Minutes | 118 (8.9%) | 113 (10.0%) |
| 35 to 39 Minutes | 96 (7.2%) | 16 (1.4%) |
| 40 to 44 Minutes | 17 (1.3%) | 21 (1.9%) |
| 45 to 59 Minutes | 54 (4.1%) | 0 (0.0%) |
| 60 to 89 Minutes | 0 (0.0%) | 0 (0.0%) |
| 90 or more Minutes | 36 (2.7%) | 32 (2.8%) |
Time of Departure to Work by Sex in Rock Hill
The most frequent times of departure to work in Rock Hill are 6:30 AM to 6:59 AM (190, 14.3%) for males and 6:30 AM to 6:59 AM (296, 26.2%) for females.
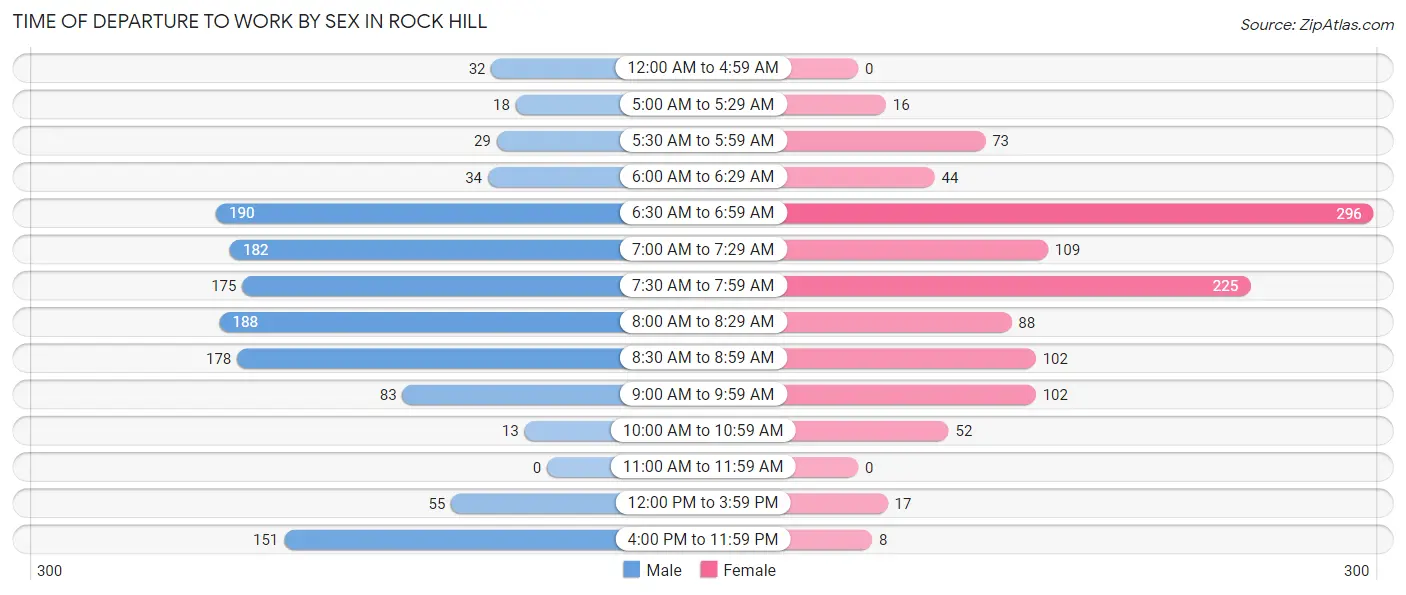
| Time of Departure | Male | Female |
| 12:00 AM to 4:59 AM | 32 (2.4%) | 0 (0.0%) |
| 5:00 AM to 5:29 AM | 18 (1.4%) | 16 (1.4%) |
| 5:30 AM to 5:59 AM | 29 (2.2%) | 73 (6.5%) |
| 6:00 AM to 6:29 AM | 34 (2.6%) | 44 (3.9%) |
| 6:30 AM to 6:59 AM | 190 (14.3%) | 296 (26.2%) |
| 7:00 AM to 7:29 AM | 182 (13.7%) | 109 (9.6%) |
| 7:30 AM to 7:59 AM | 175 (13.2%) | 225 (19.9%) |
| 8:00 AM to 8:29 AM | 188 (14.2%) | 88 (7.8%) |
| 8:30 AM to 8:59 AM | 178 (13.4%) | 102 (9.0%) |
| 9:00 AM to 9:59 AM | 83 (6.2%) | 102 (9.0%) |
| 10:00 AM to 10:59 AM | 13 (1.0%) | 52 (4.6%) |
| 11:00 AM to 11:59 AM | 0 (0.0%) | 0 (0.0%) |
| 12:00 PM to 3:59 PM | 55 (4.1%) | 17 (1.5%) |
| 4:00 PM to 11:59 PM | 151 (11.4%) | 8 (0.7%) |
| Total | 1,328 (100.0%) | 1,132 (100.0%) |
Housing Occupancy in Rock Hill
Occupancy by Ownership in Rock Hill
Of the total 2,352 dwellings in Rock Hill, owner-occupied units account for 1,937 (82.4%), while renter-occupied units make up 415 (17.6%).
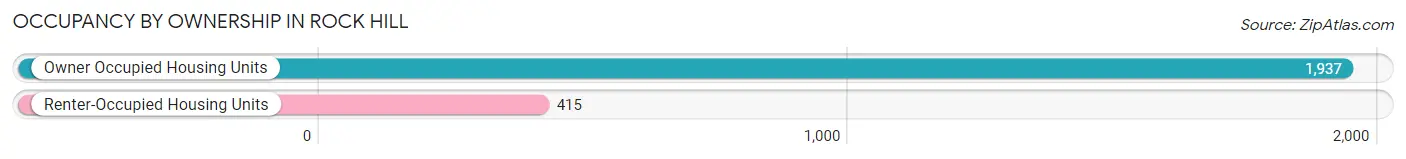
| Occupancy | # Housing Units | % Housing Units |
| Owner Occupied Housing Units | 1,937 | 82.4% |
| Renter-Occupied Housing Units | 415 | 17.6% |
| Total Occupied Housing Units | 2,352 | 100.0% |
Occupancy by Household Size in Rock Hill
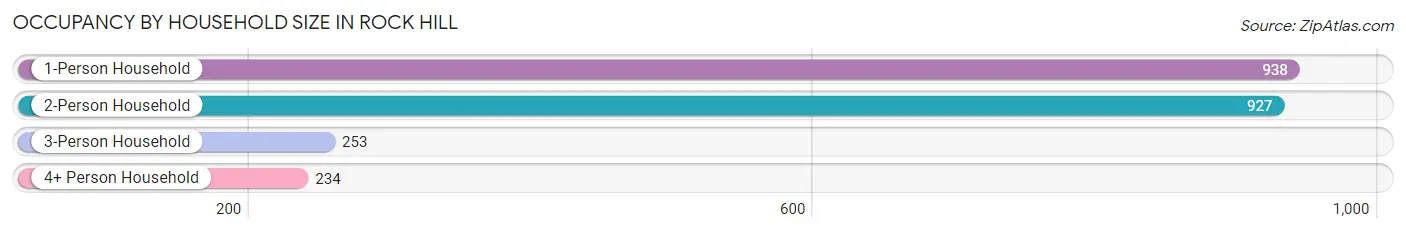
| Household Size | # Housing Units | % Housing Units |
| 1-Person Household | 938 | 39.9% |
| 2-Person Household | 927 | 39.4% |
| 3-Person Household | 253 | 10.8% |
| 4+ Person Household | 234 | 10.0% |
| Total Housing Units | 2,352 | 100.0% |
Occupancy by Ownership by Household Size in Rock Hill
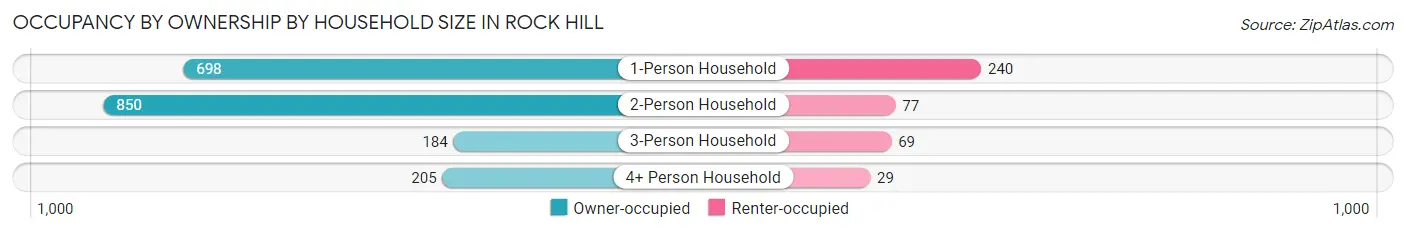
| Household Size | Owner-occupied | Renter-occupied |
| 1-Person Household | 698 (74.4%) | 240 (25.6%) |
| 2-Person Household | 850 (91.7%) | 77 (8.3%) |
| 3-Person Household | 184 (72.7%) | 69 (27.3%) |
| 4+ Person Household | 205 (87.6%) | 29 (12.4%) |
| Total Housing Units | 1,937 (82.4%) | 415 (17.6%) |
Occupancy by Educational Attainment in Rock Hill
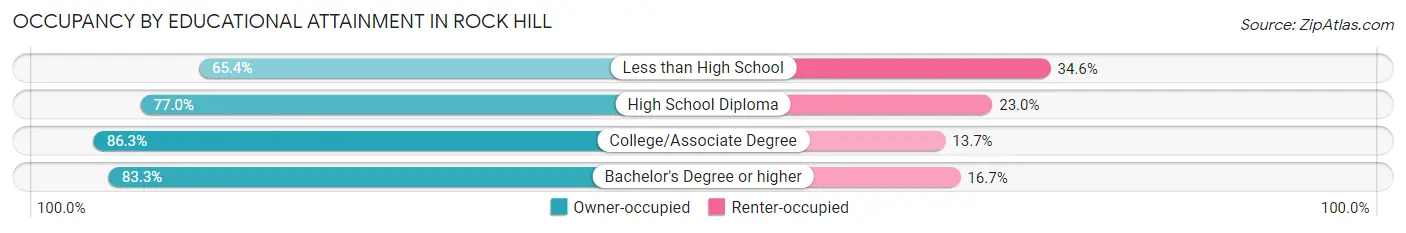
| Household Size | Owner-occupied | Renter-occupied |
| Less than High School | 104 (65.4%) | 55 (34.6%) |
| High School Diploma | 107 (77.0%) | 32 (23.0%) |
| College/Associate Degree | 446 (86.3%) | 71 (13.7%) |
| Bachelor's Degree or higher | 1,280 (83.3%) | 257 (16.7%) |
Occupancy by Age of Householder in Rock Hill
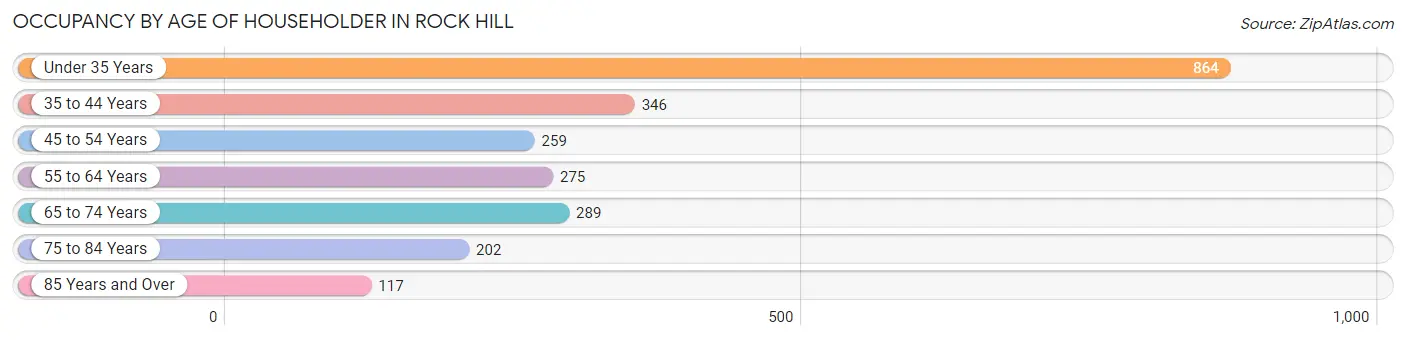
| Age Bracket | # Households | % Households |
| Under 35 Years | 864 | 36.7% |
| 35 to 44 Years | 346 | 14.7% |
| 45 to 54 Years | 259 | 11.0% |
| 55 to 64 Years | 275 | 11.7% |
| 65 to 74 Years | 289 | 12.3% |
| 75 to 84 Years | 202 | 8.6% |
| 85 Years and Over | 117 | 5.0% |
| Total | 2,352 | 100.0% |
Housing Finances in Rock Hill
Median Income by Occupancy in Rock Hill
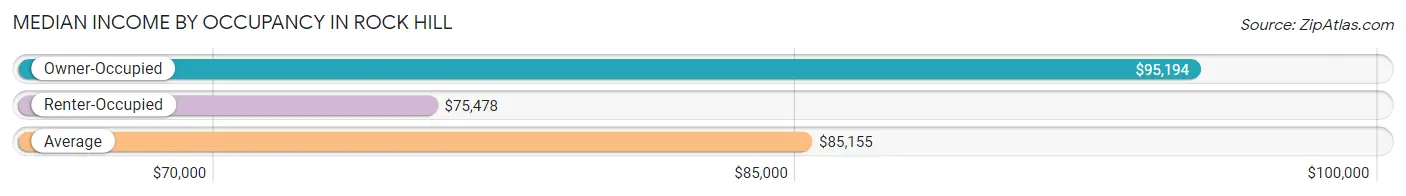
| Occupancy Type | # Households | Median Income |
| Owner-Occupied | 1,937 (82.4%) | $95,194 |
| Renter-Occupied | 415 (17.6%) | $75,478 |
| Average | 2,352 (100.0%) | $85,155 |
Occupancy by Householder Income Bracket in Rock Hill
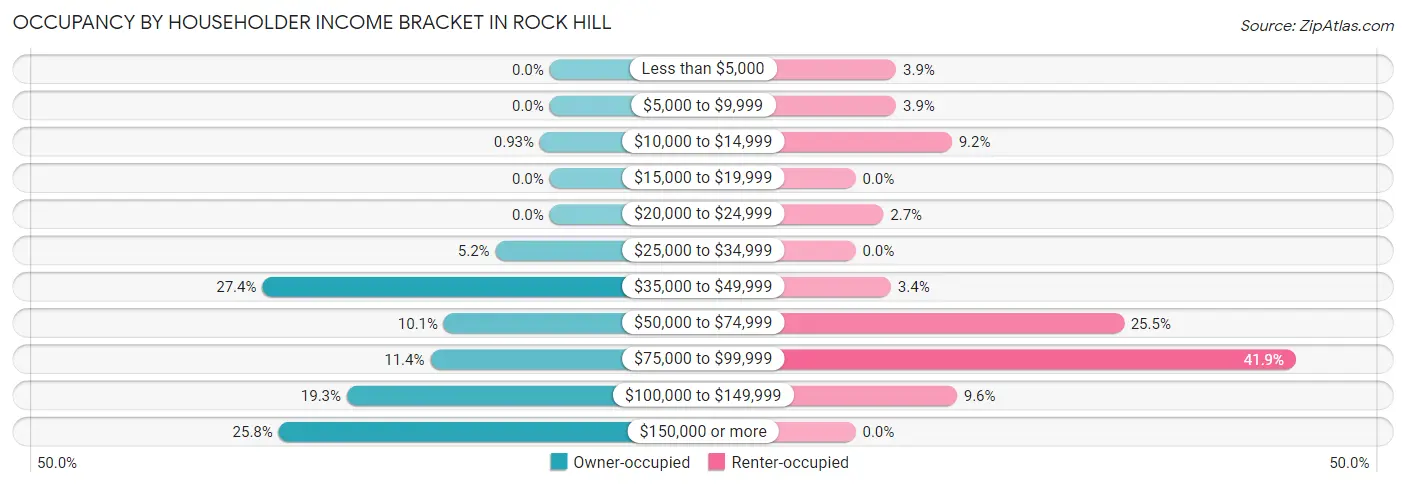
| Income Bracket | Owner-occupied | Renter-occupied |
| Less than $5,000 | 0 (0.0%) | 16 (3.9%) |
| $5,000 to $9,999 | 0 (0.0%) | 16 (3.9%) |
| $10,000 to $14,999 | 18 (0.9%) | 38 (9.2%) |
| $15,000 to $19,999 | 0 (0.0%) | 0 (0.0%) |
| $20,000 to $24,999 | 0 (0.0%) | 11 (2.6%) |
| $25,000 to $34,999 | 100 (5.2%) | 0 (0.0%) |
| $35,000 to $49,999 | 530 (27.4%) | 14 (3.4%) |
| $50,000 to $74,999 | 195 (10.1%) | 106 (25.5%) |
| $75,000 to $99,999 | 220 (11.4%) | 174 (41.9%) |
| $100,000 to $149,999 | 374 (19.3%) | 40 (9.6%) |
| $150,000 or more | 500 (25.8%) | 0 (0.0%) |
| Total | 1,937 (100.0%) | 415 (100.0%) |
Monthly Housing Cost Tiers in Rock Hill
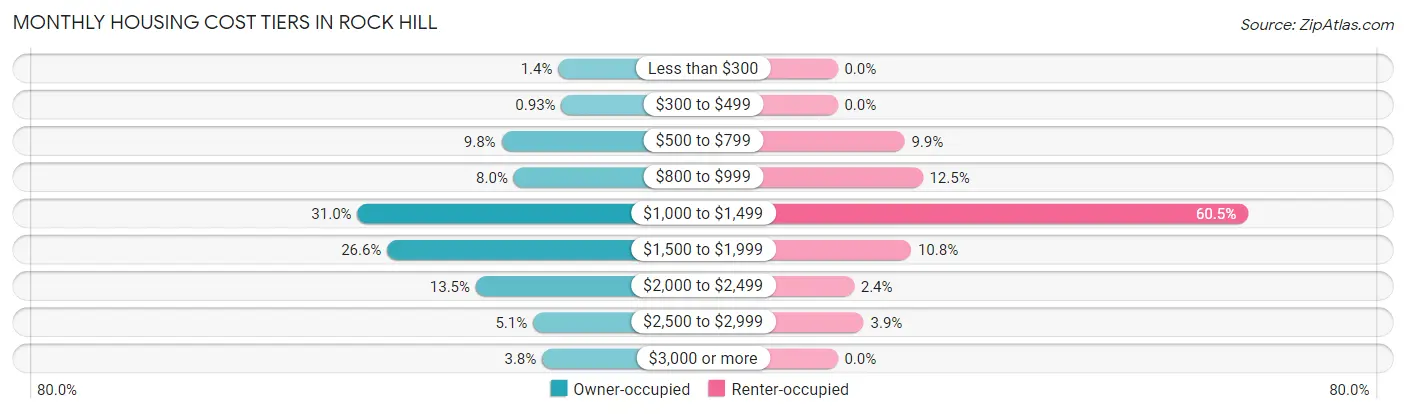
| Monthly Cost | Owner-occupied | Renter-occupied |
| Less than $300 | 27 (1.4%) | 0 (0.0%) |
| $300 to $499 | 18 (0.9%) | 0 (0.0%) |
| $500 to $799 | 189 (9.8%) | 41 (9.9%) |
| $800 to $999 | 154 (8.0%) | 52 (12.5%) |
| $1,000 to $1,499 | 600 (31.0%) | 251 (60.5%) |
| $1,500 to $1,999 | 515 (26.6%) | 45 (10.8%) |
| $2,000 to $2,499 | 262 (13.5%) | 10 (2.4%) |
| $2,500 to $2,999 | 99 (5.1%) | 16 (3.9%) |
| $3,000 or more | 73 (3.8%) | 0 (0.0%) |
| Total | 1,937 (100.0%) | 415 (100.0%) |
Physical Housing Characteristics in Rock Hill
Housing Structures in Rock Hill
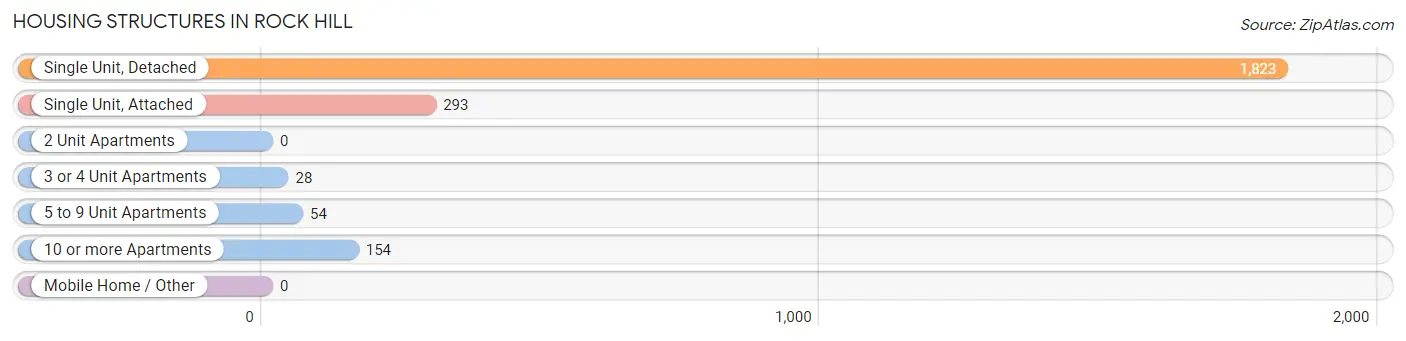
| Structure Type | # Housing Units | % Housing Units |
| Single Unit, Detached | 1,823 | 77.5% |
| Single Unit, Attached | 293 | 12.5% |
| 2 Unit Apartments | 0 | 0.0% |
| 3 or 4 Unit Apartments | 28 | 1.2% |
| 5 to 9 Unit Apartments | 54 | 2.3% |
| 10 or more Apartments | 154 | 6.6% |
| Mobile Home / Other | 0 | 0.0% |
| Total | 2,352 | 100.0% |
Housing Structures by Occupancy in Rock Hill
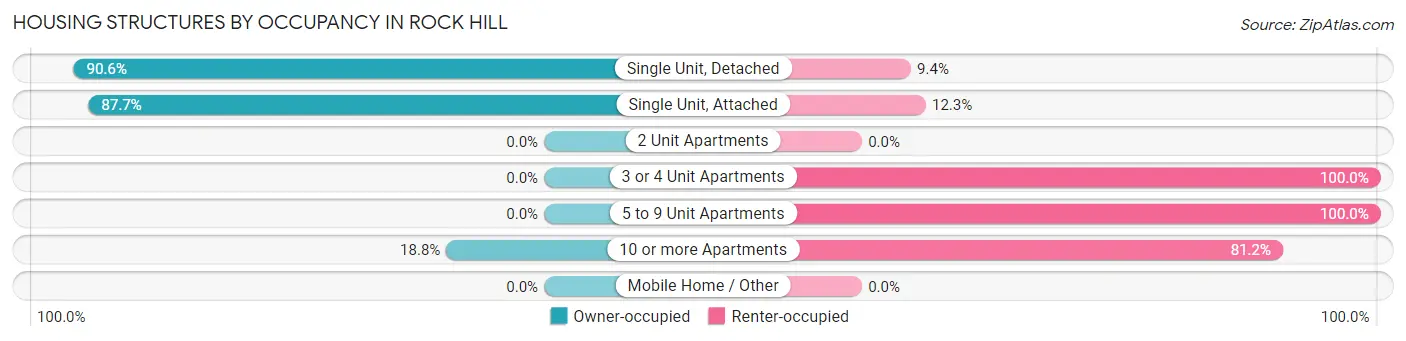
| Structure Type | Owner-occupied | Renter-occupied |
| Single Unit, Detached | 1,651 (90.6%) | 172 (9.4%) |
| Single Unit, Attached | 257 (87.7%) | 36 (12.3%) |
| 2 Unit Apartments | 0 (0.0%) | 0 (0.0%) |
| 3 or 4 Unit Apartments | 0 (0.0%) | 28 (100.0%) |
| 5 to 9 Unit Apartments | 0 (0.0%) | 54 (100.0%) |
| 10 or more Apartments | 29 (18.8%) | 125 (81.2%) |
| Mobile Home / Other | 0 (0.0%) | 0 (0.0%) |
| Total | 1,937 (82.4%) | 415 (17.6%) |
Housing Structures by Number of Rooms in Rock Hill
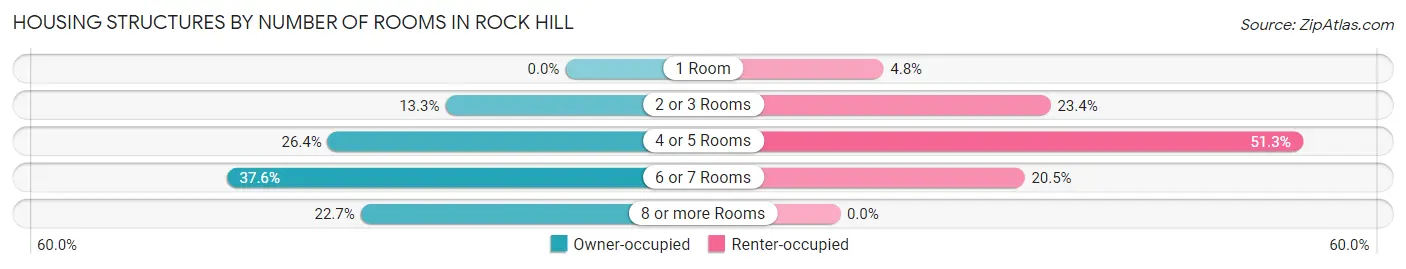
| Number of Rooms | Owner-occupied | Renter-occupied |
| 1 Room | 0 (0.0%) | 20 (4.8%) |
| 2 or 3 Rooms | 258 (13.3%) | 97 (23.4%) |
| 4 or 5 Rooms | 511 (26.4%) | 213 (51.3%) |
| 6 or 7 Rooms | 728 (37.6%) | 85 (20.5%) |
| 8 or more Rooms | 440 (22.7%) | 0 (0.0%) |
| Total | 1,937 (100.0%) | 415 (100.0%) |
Housing Structure by Heating Type in Rock Hill
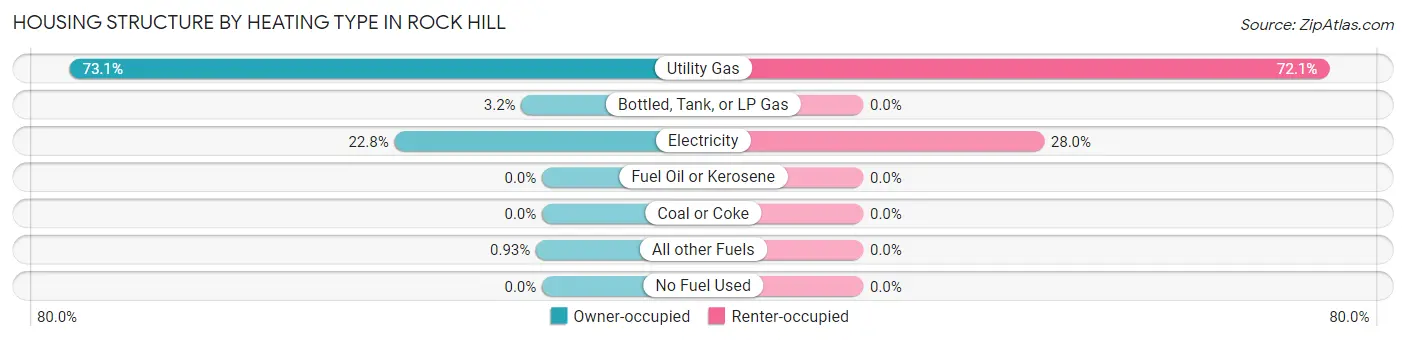
| Heating Type | Owner-occupied | Renter-occupied |
| Utility Gas | 1,415 (73.1%) | 299 (72.1%) |
| Bottled, Tank, or LP Gas | 62 (3.2%) | 0 (0.0%) |
| Electricity | 442 (22.8%) | 116 (28.0%) |
| Fuel Oil or Kerosene | 0 (0.0%) | 0 (0.0%) |
| Coal or Coke | 0 (0.0%) | 0 (0.0%) |
| All other Fuels | 18 (0.9%) | 0 (0.0%) |
| No Fuel Used | 0 (0.0%) | 0 (0.0%) |
| Total | 1,937 (100.0%) | 415 (100.0%) |
Household Vehicle Usage in Rock Hill
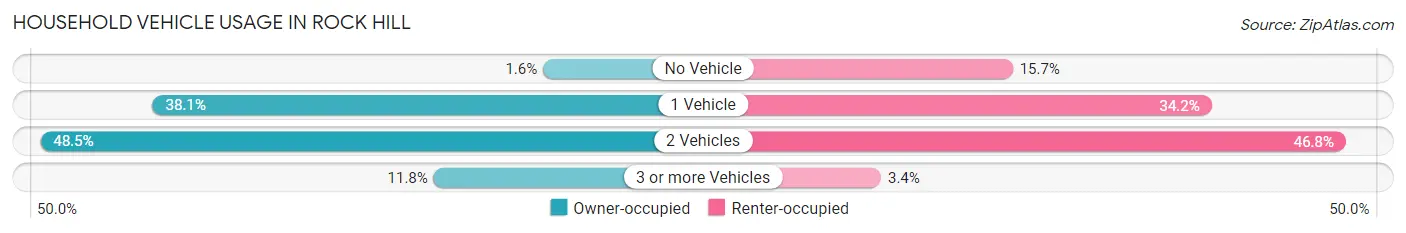
| Vehicles per Household | Owner-occupied | Renter-occupied |
| No Vehicle | 31 (1.6%) | 65 (15.7%) |
| 1 Vehicle | 737 (38.1%) | 142 (34.2%) |
| 2 Vehicles | 940 (48.5%) | 194 (46.8%) |
| 3 or more Vehicles | 229 (11.8%) | 14 (3.4%) |
| Total | 1,937 (100.0%) | 415 (100.0%) |
Real Estate & Mortgages in Rock Hill
Real Estate and Mortgage Overview in Rock Hill
| Characteristic | Without Mortgage | With Mortgage |
| Housing Units | 390 | 1,547 |
| Median Property Value | $231,300 | $241,100 |
| Median Household Income | $39,576 | $429 |
| Monthly Housing Costs | $728 | $73 |
| Real Estate Taxes | $3,440 | $44 |
Property Value by Mortgage Status in Rock Hill
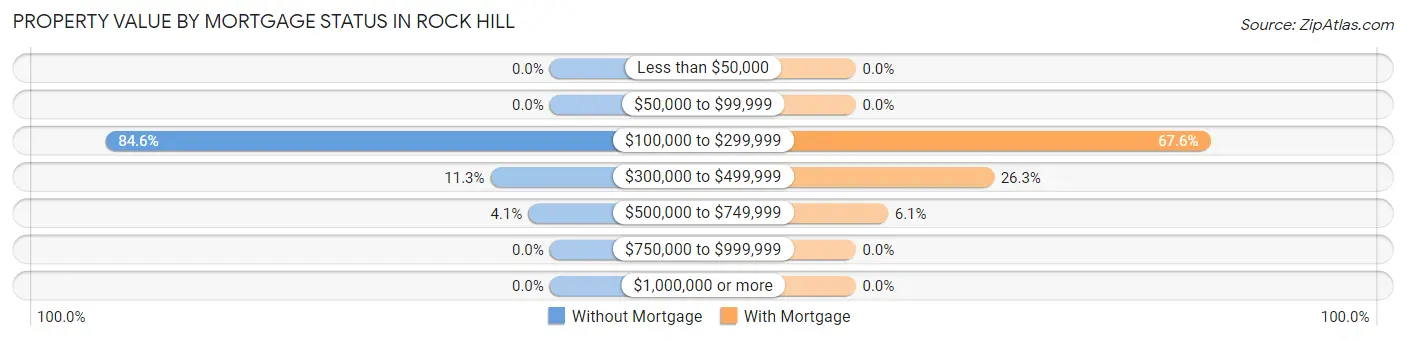
| Property Value | Without Mortgage | With Mortgage |
| Less than $50,000 | 0 (0.0%) | 0 (0.0%) |
| $50,000 to $99,999 | 0 (0.0%) | 0 (0.0%) |
| $100,000 to $299,999 | 330 (84.6%) | 1,045 (67.5%) |
| $300,000 to $499,999 | 44 (11.3%) | 407 (26.3%) |
| $500,000 to $749,999 | 16 (4.1%) | 95 (6.1%) |
| $750,000 to $999,999 | 0 (0.0%) | 0 (0.0%) |
| $1,000,000 or more | 0 (0.0%) | 0 (0.0%) |
| Total | 390 (100.0%) | 1,547 (100.0%) |
Household Income by Mortgage Status in Rock Hill
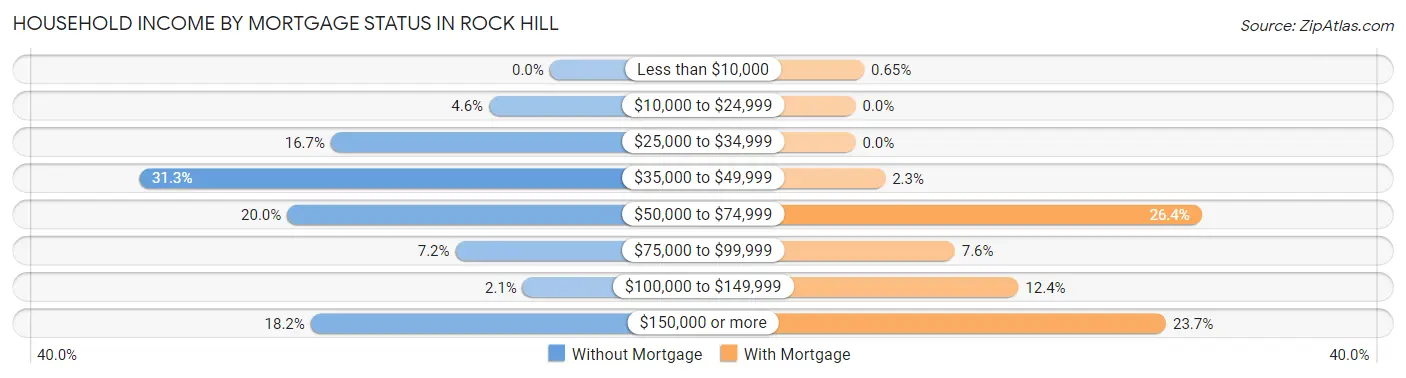
| Household Income | Without Mortgage | With Mortgage |
| Less than $10,000 | 0 (0.0%) | 10 (0.6%) |
| $10,000 to $24,999 | 18 (4.6%) | 0 (0.0%) |
| $25,000 to $34,999 | 65 (16.7%) | 0 (0.0%) |
| $35,000 to $49,999 | 122 (31.3%) | 35 (2.3%) |
| $50,000 to $74,999 | 78 (20.0%) | 408 (26.4%) |
| $75,000 to $99,999 | 28 (7.2%) | 117 (7.6%) |
| $100,000 to $149,999 | 8 (2.1%) | 192 (12.4%) |
| $150,000 or more | 71 (18.2%) | 366 (23.7%) |
| Total | 390 (100.0%) | 1,547 (100.0%) |
Property Value to Household Income Ratio in Rock Hill
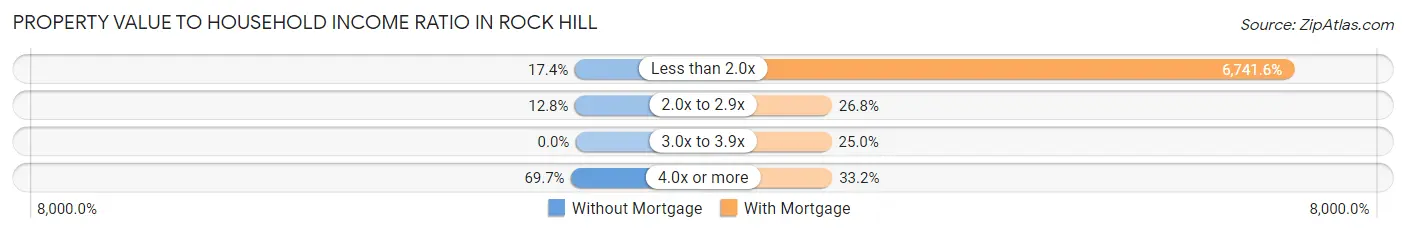
| Value-to-Income Ratio | Without Mortgage | With Mortgage |
| Less than 2.0x | 68 (17.4%) | 104,292 (6,741.6%) |
| 2.0x to 2.9x | 50 (12.8%) | 414 (26.8%) |
| 3.0x to 3.9x | 0 (0.0%) | 386 (24.9%) |
| 4.0x or more | 272 (69.7%) | 514 (33.2%) |
| Total | 390 (100.0%) | 1,547 (100.0%) |
Real Estate Taxes by Mortgage Status in Rock Hill
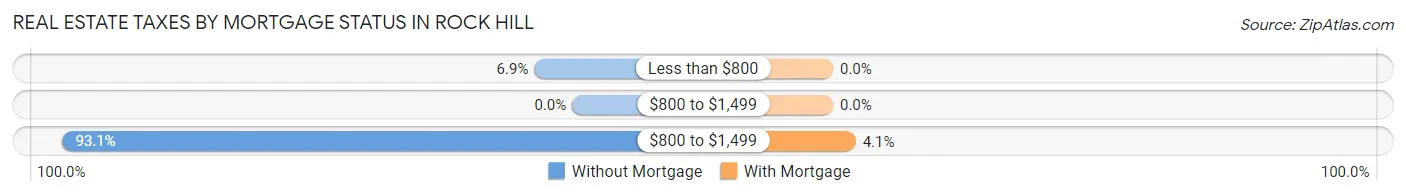
| Property Taxes | Without Mortgage | With Mortgage |
| Less than $800 | 27 (6.9%) | 0 (0.0%) |
| $800 to $1,499 | 0 (0.0%) | 0 (0.0%) |
| $800 to $1,499 | 363 (93.1%) | 64 (4.1%) |
| Total | 390 (100.0%) | 1,547 (100.0%) |
Health & Disability in Rock Hill
Health Insurance Coverage by Age in Rock Hill
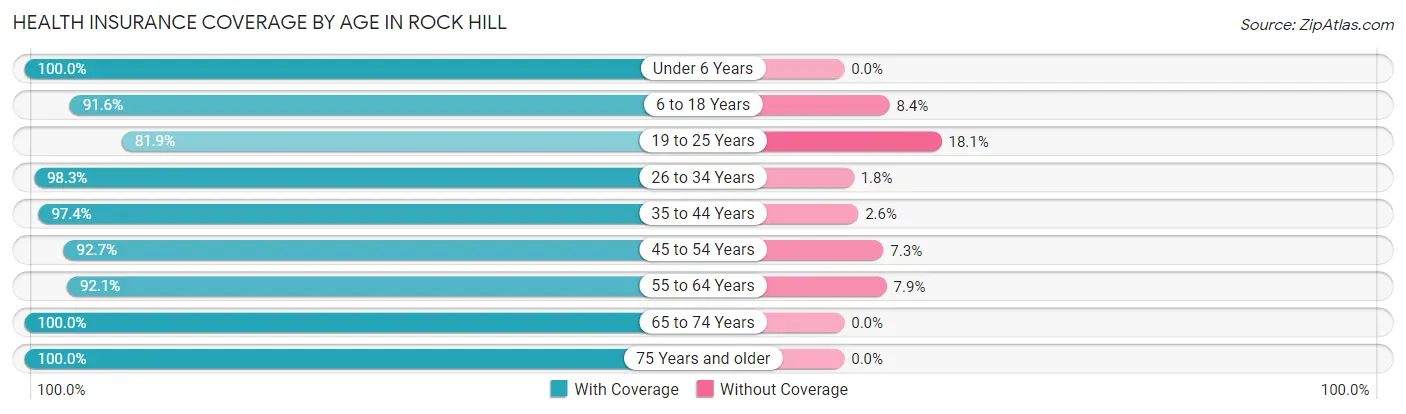
| Age Bracket | With Coverage | Without Coverage |
| Under 6 Years | 322 (100.0%) | 0 (0.0%) |
| 6 to 18 Years | 347 (91.6%) | 32 (8.4%) |
| 19 to 25 Years | 411 (81.9%) | 91 (18.1%) |
| 26 to 34 Years | 1,010 (98.3%) | 18 (1.8%) |
| 35 to 44 Years | 489 (97.4%) | 13 (2.6%) |
| 45 to 54 Years | 534 (92.7%) | 42 (7.3%) |
| 55 to 64 Years | 501 (92.1%) | 43 (7.9%) |
| 65 to 74 Years | 493 (100.0%) | 0 (0.0%) |
| 75 Years and older | 382 (100.0%) | 0 (0.0%) |
| Total | 4,489 (95.0%) | 239 (5.1%) |
Health Insurance Coverage by Citizenship Status in Rock Hill
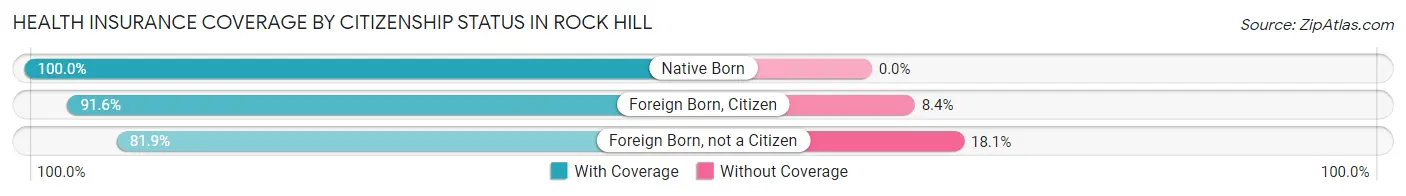
| Citizenship Status | With Coverage | Without Coverage |
| Native Born | 322 (100.0%) | 0 (0.0%) |
| Foreign Born, Citizen | 347 (91.6%) | 32 (8.4%) |
| Foreign Born, not a Citizen | 411 (81.9%) | 91 (18.1%) |
Health Insurance Coverage by Household Income in Rock Hill
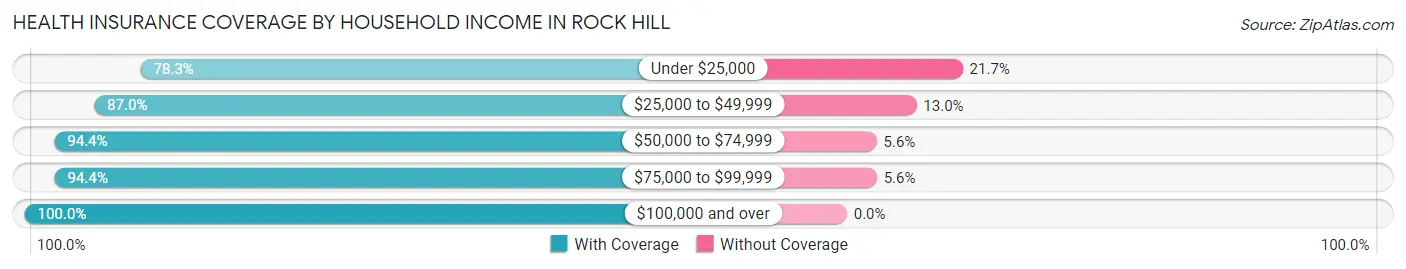
| Household Income | With Coverage | Without Coverage |
| Under $25,000 | 137 (78.3%) | 38 (21.7%) |
| $25,000 to $49,999 | 807 (87.0%) | 121 (13.0%) |
| $50,000 to $74,999 | 474 (94.4%) | 28 (5.6%) |
| $75,000 to $99,999 | 875 (94.4%) | 52 (5.6%) |
| $100,000 and over | 2,195 (100.0%) | 0 (0.0%) |
Public vs Private Health Insurance Coverage by Age in Rock Hill
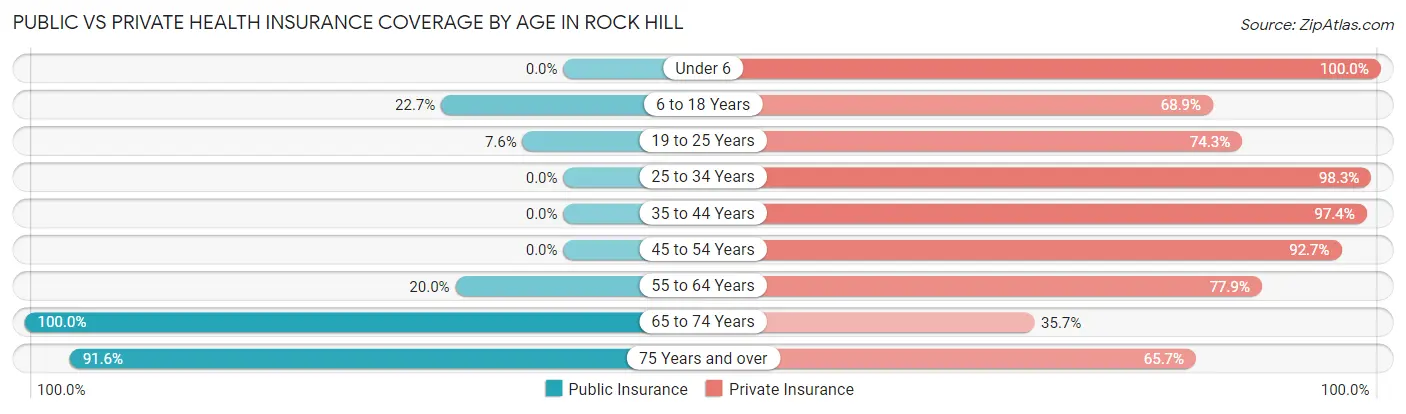
| Age Bracket | Public Insurance | Private Insurance |
| Under 6 | 0 (0.0%) | 322 (100.0%) |
| 6 to 18 Years | 86 (22.7%) | 261 (68.9%) |
| 19 to 25 Years | 38 (7.6%) | 373 (74.3%) |
| 25 to 34 Years | 0 (0.0%) | 1,010 (98.3%) |
| 35 to 44 Years | 0 (0.0%) | 489 (97.4%) |
| 45 to 54 Years | 0 (0.0%) | 534 (92.7%) |
| 55 to 64 Years | 109 (20.0%) | 424 (77.9%) |
| 65 to 74 Years | 493 (100.0%) | 176 (35.7%) |
| 75 Years and over | 350 (91.6%) | 251 (65.7%) |
| Total | 1,076 (22.8%) | 3,840 (81.2%) |
Disability Status by Sex by Age in Rock Hill
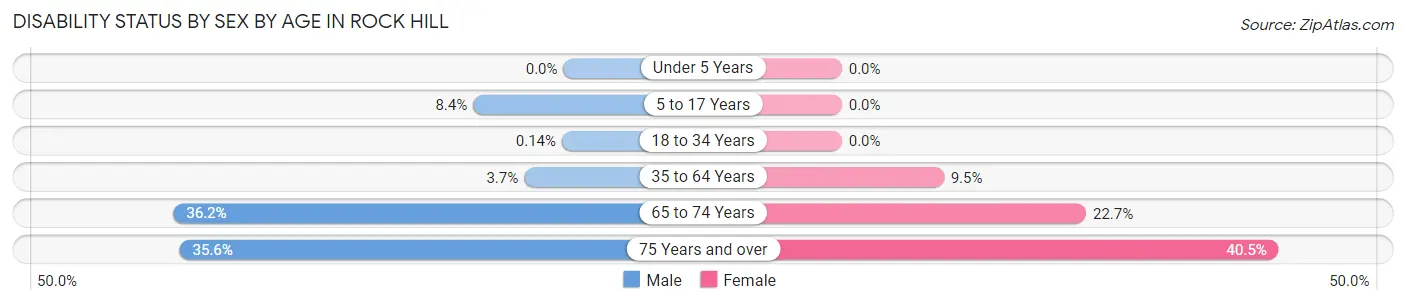
| Age Bracket | Male | Female |
| Under 5 Years | 0 (0.0%) | 0 (0.0%) |
| 5 to 17 Years | 15 (8.4%) | 0 (0.0%) |
| 18 to 34 Years | 1 (0.1%) | 0 (0.0%) |
| 35 to 64 Years | 31 (3.6%) | 73 (9.5%) |
| 65 to 74 Years | 97 (36.2%) | 51 (22.7%) |
| 75 Years and over | 57 (35.6%) | 90 (40.5%) |
Disability Class by Sex by Age in Rock Hill
Disability Class: Hearing Difficulty
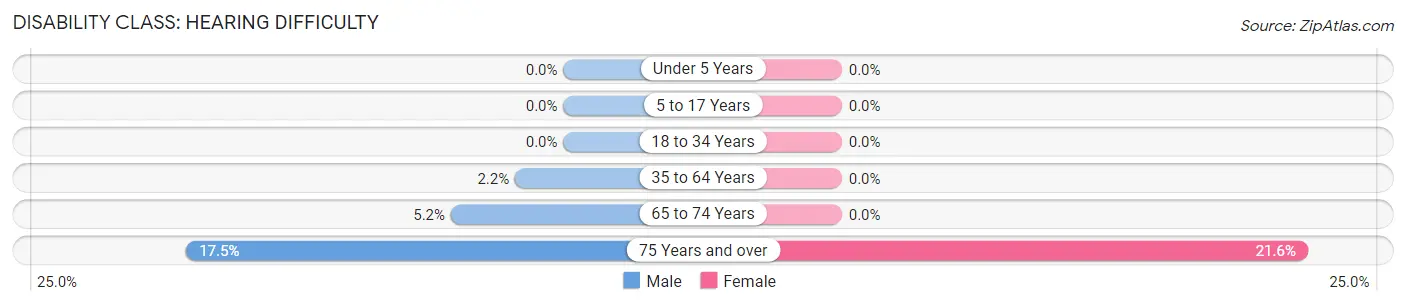
| Age Bracket | Male | Female |
| Under 5 Years | 0 (0.0%) | 0 (0.0%) |
| 5 to 17 Years | 0 (0.0%) | 0 (0.0%) |
| 18 to 34 Years | 0 (0.0%) | 0 (0.0%) |
| 35 to 64 Years | 19 (2.2%) | 0 (0.0%) |
| 65 to 74 Years | 14 (5.2%) | 0 (0.0%) |
| 75 Years and over | 28 (17.5%) | 48 (21.6%) |
Disability Class: Vision Difficulty
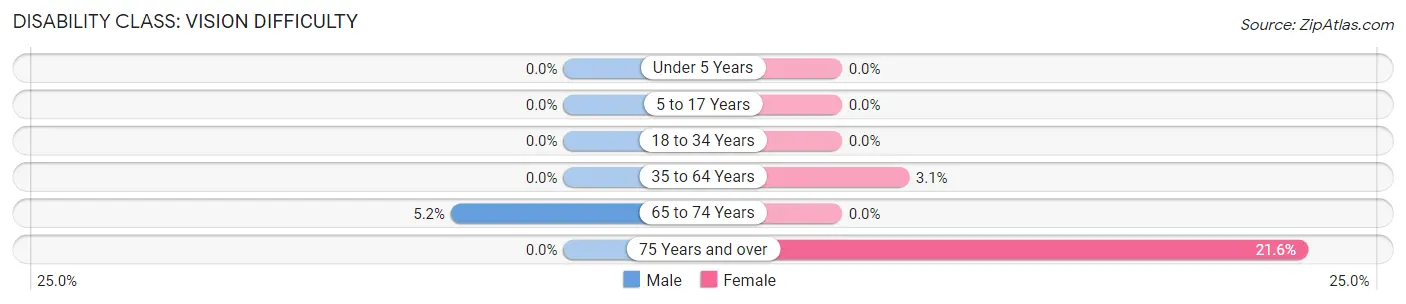
| Age Bracket | Male | Female |
| Under 5 Years | 0 (0.0%) | 0 (0.0%) |
| 5 to 17 Years | 0 (0.0%) | 0 (0.0%) |
| 18 to 34 Years | 0 (0.0%) | 0 (0.0%) |
| 35 to 64 Years | 0 (0.0%) | 24 (3.1%) |
| 65 to 74 Years | 14 (5.2%) | 0 (0.0%) |
| 75 Years and over | 0 (0.0%) | 48 (21.6%) |
Disability Class: Cognitive Difficulty
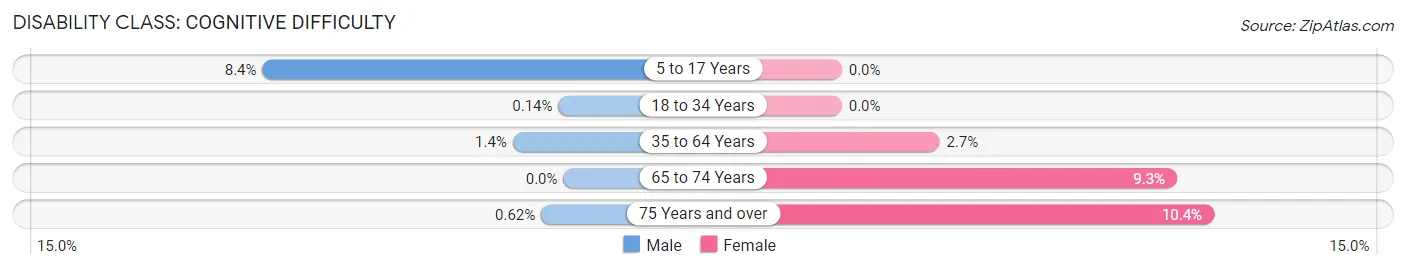
| Age Bracket | Male | Female |
| 5 to 17 Years | 15 (8.4%) | 0 (0.0%) |
| 18 to 34 Years | 1 (0.1%) | 0 (0.0%) |
| 35 to 64 Years | 12 (1.4%) | 21 (2.7%) |
| 65 to 74 Years | 0 (0.0%) | 21 (9.3%) |
| 75 Years and over | 1 (0.6%) | 23 (10.4%) |
Disability Class: Ambulatory Difficulty
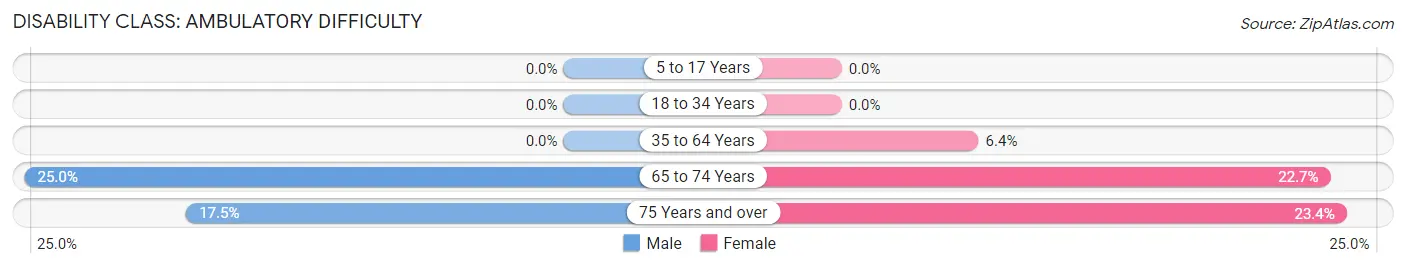
| Age Bracket | Male | Female |
| 5 to 17 Years | 0 (0.0%) | 0 (0.0%) |
| 18 to 34 Years | 0 (0.0%) | 0 (0.0%) |
| 35 to 64 Years | 0 (0.0%) | 49 (6.4%) |
| 65 to 74 Years | 67 (25.0%) | 51 (22.7%) |
| 75 Years and over | 28 (17.5%) | 52 (23.4%) |
Disability Class: Self-Care Difficulty
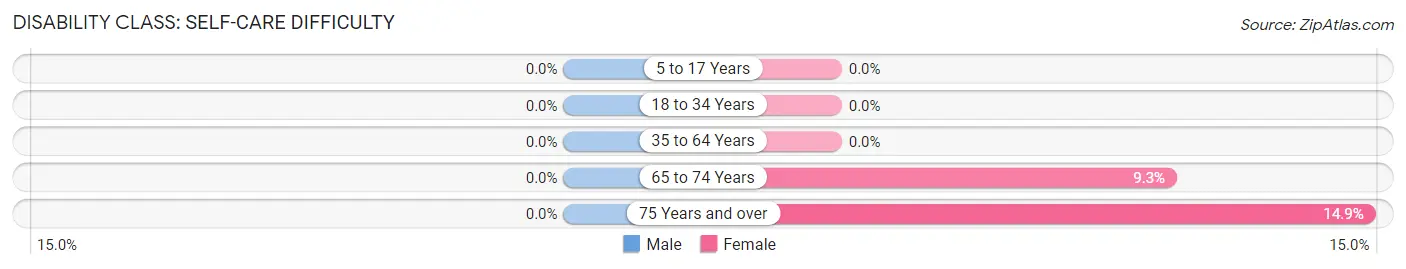
| Age Bracket | Male | Female |
| 5 to 17 Years | 0 (0.0%) | 0 (0.0%) |
| 18 to 34 Years | 0 (0.0%) | 0 (0.0%) |
| 35 to 64 Years | 0 (0.0%) | 0 (0.0%) |
| 65 to 74 Years | 0 (0.0%) | 21 (9.3%) |
| 75 Years and over | 0 (0.0%) | 33 (14.9%) |
Technology Access in Rock Hill
Computing Device Access in Rock Hill
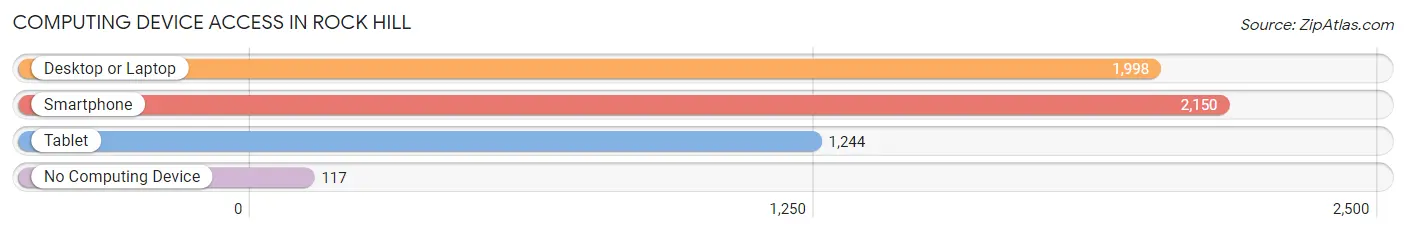
| Device Type | # Households | % Households |
| Desktop or Laptop | 1,998 | 85.0% |
| Smartphone | 2,150 | 91.4% |
| Tablet | 1,244 | 52.9% |
| No Computing Device | 117 | 5.0% |
| Total | 2,352 | 100.0% |
Internet Access in Rock Hill
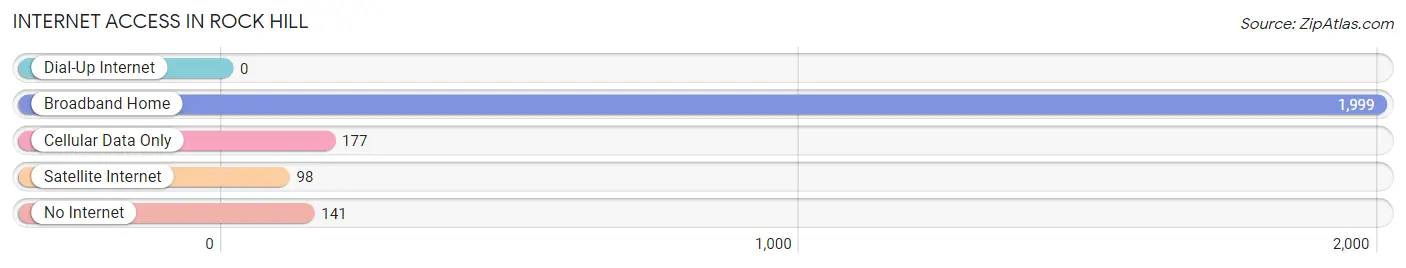
| Internet Type | # Households | % Households |
| Dial-Up Internet | 0 | 0.0% |
| Broadband Home | 1,999 | 85.0% |
| Cellular Data Only | 177 | 7.5% |
| Satellite Internet | 98 | 4.2% |
| No Internet | 141 | 6.0% |
| Total | 2,352 | 100.0% |
Rock Hill Summary
Introduction
Rock Hill is a small city located in St. Louis County, Missouri. It is situated on the banks of the Meramec River, about 20 miles west of downtown St. Louis. The city has a population of approximately 4,000 people and is known for its small-town charm and friendly atmosphere. Rock Hill is a great place to live, work, and play, and it has a rich history and culture that make it a unique and special place.
History
Rock Hill was founded in 1837 by a group of settlers from Kentucky. The town was named after a large rock formation that was located near the original settlement. The settlers were attracted to the area due to its fertile soil and abundant natural resources. The town quickly grew and by the late 1800s, it had become a thriving community with a variety of businesses, including a flour mill, a sawmill, and a brickyard.
In the early 1900s, Rock Hill experienced a period of growth and prosperity. The town was home to several factories, including a shoe factory, a furniture factory, and a canning factory. The town also had a thriving agricultural industry, with many local farmers growing corn, wheat, and other crops.
In the 1950s, Rock Hill began to experience a decline in population and economic activity. The factories and businesses that had once been the lifeblood of the town began to close, and many of the residents moved away in search of better opportunities. In the late 1970s, the city began to experience a resurgence, as new businesses and industries moved into the area.
Geography
Rock Hill is located in St. Louis County, Missouri, about 20 miles west of downtown St. Louis. The city is situated on the banks of the Meramec River, and it is surrounded by rolling hills and lush forests. The city has a total area of 2.2 square miles, and it is located at an elevation of 645 feet above sea level.
The climate in Rock Hill is classified as humid continental, with hot, humid summers and cold, snowy winters. The average annual temperature is around 54 degrees Fahrenheit, and the average annual precipitation is around 40 inches.
Economy
Rock Hill has a diverse economy, with a variety of businesses and industries. The city is home to several manufacturing companies, including a furniture factory, a shoe factory, and a canning factory. The city also has a thriving agricultural industry, with many local farmers growing corn, wheat, and other crops.
The city is also home to several retail stores, restaurants, and other businesses. The city is served by several major highways, including Interstate 44 and U.S. Route 50.
Demographics
As of the 2010 census, Rock Hill had a population of 4,000 people. The racial makeup of the city was 94.2% White, 2.2% African American, 0.7% Native American, 0.7% Asian, 0.2% Pacific Islander, and 1.9% from other races. The median household income was $45,000, and the median family income was $50,000.
Conclusion
Rock Hill is a small city located in St. Louis County, Missouri. It is situated on the banks of the Meramec River, about 20 miles west of downtown St. Louis. The city has a population of approximately 4,000 people and is known for its small-town charm and friendly atmosphere. Rock Hill has a rich history and culture, and it has a diverse economy with a variety of businesses and industries. The city is also home to several retail stores, restaurants, and other businesses. The city is served by several major highways, including Interstate 44 and U.S. Route 50. Rock Hill is a great place to live, work, and play, and it is a unique and special place.
Common Questions
What is Per Capita Income in Rock Hill?
Per Capita income in Rock Hill is $55,894.
What is the Median Family Income in Rock Hill?
Median Family Income in Rock Hill is $106,111.
What is the Median Household income in Rock Hill?
Median Household Income in Rock Hill is $85,155.
What is Income or Wage Gap in Rock Hill?
Income or Wage Gap in Rock Hill is 29.0%.
Women in Rock Hill earn 71.0 cents for every dollar earned by a man.
What is Inequality or Gini Index in Rock Hill?
Inequality or Gini Index in Rock Hill is 0.43.
What is the Total Population of Rock Hill?
Total Population of Rock Hill is 4,728.
What is the Total Male Population of Rock Hill?
Total Male Population of Rock Hill is 2,394.
What is the Total Female Population of Rock Hill?
Total Female Population of Rock Hill is 2,334.
What is the Ratio of Males per 100 Females in Rock Hill?
There are 102.57 Males per 100 Females in Rock Hill.
What is the Ratio of Females per 100 Males in Rock Hill?
There are 97.49 Females per 100 Males in Rock Hill.
What is the Median Population Age in Rock Hill?
Median Population Age in Rock Hill is 38.2 Years.
What is the Average Family Size in Rock Hill
Average Family Size in Rock Hill is 2.7 People.
What is the Average Household Size in Rock Hill
Average Household Size in Rock Hill is 2.0 People.
How Large is the Labor Force in Rock Hill?
There are 2,905 People in the Labor Forcein in Rock Hill.
What is the Percentage of People in the Labor Force in Rock Hill?
70.3% of People are in the Labor Force in Rock Hill.
What is the Unemployment Rate in Rock Hill?
Unemployment Rate in Rock Hill is 1.8%.