Westchase, FL Map & Demographics
Westchase Map
Westchase Overview
$59,363
PER CAPITA INCOME
$134,970
AVG FAMILY INCOME
$114,434
AVG HOUSEHOLD INCOME
32.6%
WAGE / INCOME GAP [ % ]
67.4¢/ $1
WAGE / INCOME GAP [ $ ]
$10,679
FAMILY INCOME DEFICIT
0.45
INEQUALITY / GINI INDEX
24,891
TOTAL POPULATION
12,365
MALE POPULATION
12,526
FEMALE POPULATION
98.71
MALES / 100 FEMALES
101.30
FEMALES / 100 MALES
38.7
MEDIAN AGE
3.0
AVG FAMILY SIZE
2.5
AVG HOUSEHOLD SIZE
13,511
LABOR FORCE [ PEOPLE ]
67.9%
PERCENT IN LABOR FORCE
2.6%
UNEMPLOYMENT RATE
Westchase Area Codes
Income in Westchase
Income Overview in Westchase
Per Capita Income in Westchase is $59,363, while median incomes of families and households are $134,970 and $114,434 respectively.
| Characteristic | Number | Measure |
| Per Capita Income | 24,891 | $59,363 |
| Median Family Income | 6,817 | $134,970 |
| Mean Family Income | 6,817 | $172,686 |
| Median Household Income | 9,809 | $114,434 |
| Mean Household Income | 9,809 | $148,432 |
| Income Deficit | 6,817 | $10,679 |
| Wage / Income Gap (%) | 24,891 | 32.65% |
| Wage / Income Gap ($) | 24,891 | 67.35¢ per $1 |
| Gini / Inequality Index | 24,891 | 0.45 |
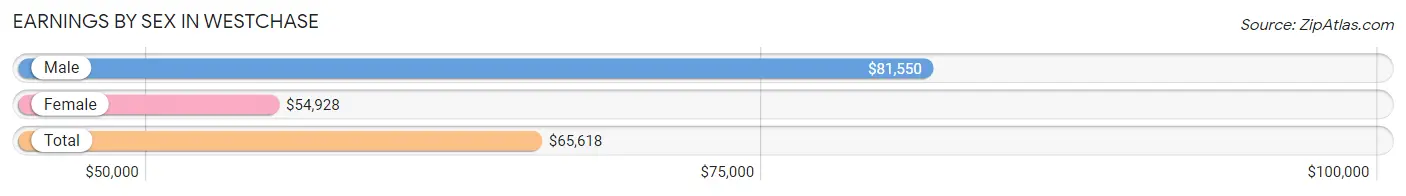
Earnings by Sex in Westchase
Average Earnings in Westchase are $65,618, $81,550 for men and $54,928 for women, a difference of 32.7%.
| Sex | Number | Average Earnings |
| Male | 7,403 (52.8%) | $81,550 |
| Female | 6,612 (47.2%) | $54,928 |
| Total | 14,015 (100.0%) | $65,618 |
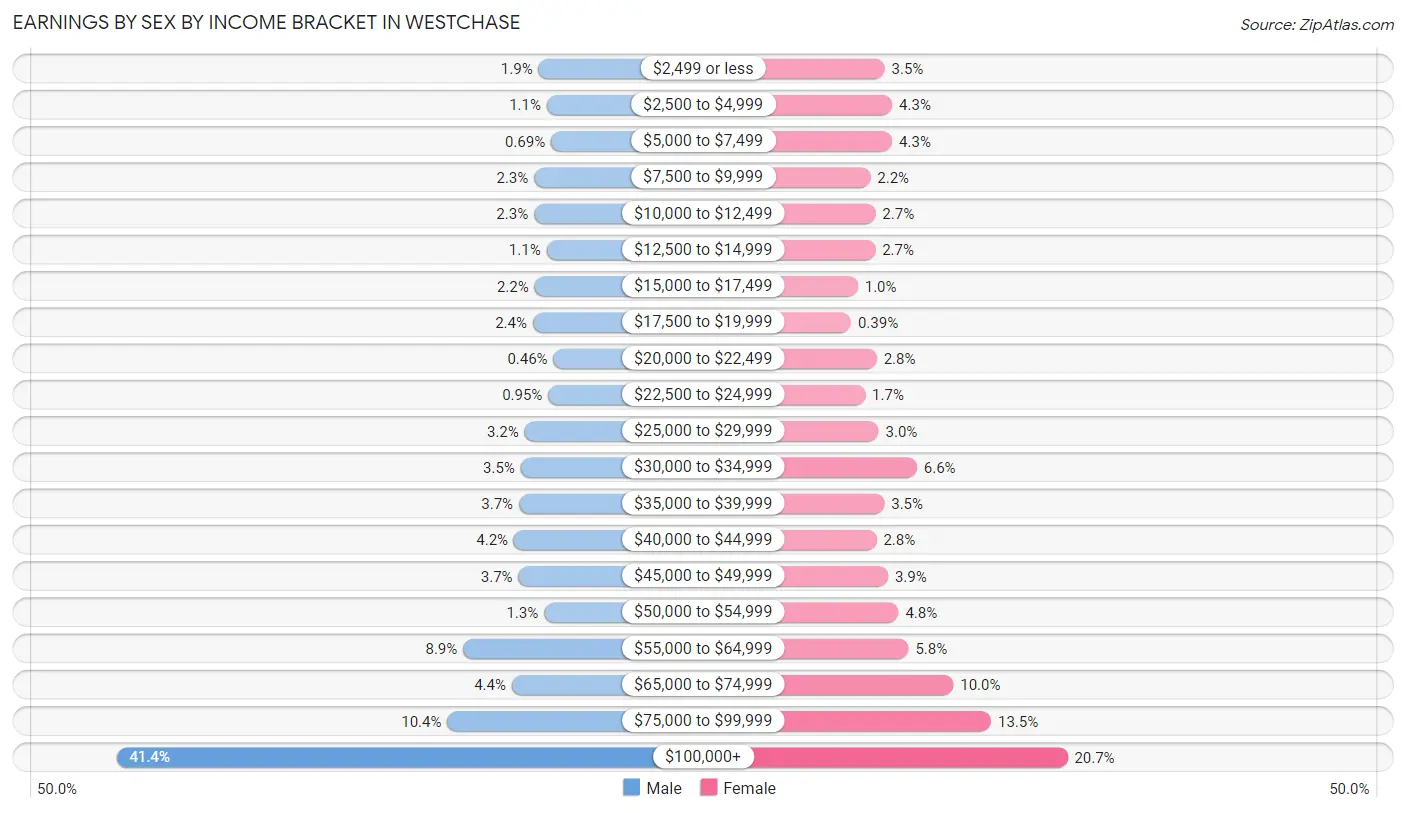
Earnings by Sex by Income Bracket in Westchase
The most common earnings brackets in Westchase are $100,000+ for men (3,064 | 41.4%) and $100,000+ for women (1,367 | 20.7%).
| Income | Male | Female |
| $2,499 or less | 138 (1.9%) | 234 (3.5%) |
| $2,500 to $4,999 | 80 (1.1%) | 281 (4.3%) |
| $5,000 to $7,499 | 51 (0.7%) | 281 (4.3%) |
| $7,500 to $9,999 | 168 (2.3%) | 146 (2.2%) |
| $10,000 to $12,499 | 169 (2.3%) | 177 (2.7%) |
| $12,500 to $14,999 | 82 (1.1%) | 176 (2.7%) |
| $15,000 to $17,499 | 165 (2.2%) | 68 (1.0%) |
| $17,500 to $19,999 | 177 (2.4%) | 26 (0.4%) |
| $20,000 to $22,499 | 34 (0.5%) | 185 (2.8%) |
| $22,500 to $24,999 | 70 (0.9%) | 114 (1.7%) |
| $25,000 to $29,999 | 234 (3.2%) | 197 (3.0%) |
| $30,000 to $34,999 | 261 (3.5%) | 434 (6.6%) |
| $35,000 to $39,999 | 273 (3.7%) | 232 (3.5%) |
| $40,000 to $44,999 | 308 (4.2%) | 184 (2.8%) |
| $45,000 to $49,999 | 277 (3.7%) | 255 (3.9%) |
| $50,000 to $54,999 | 99 (1.3%) | 320 (4.8%) |
| $55,000 to $64,999 | 660 (8.9%) | 382 (5.8%) |
| $65,000 to $74,999 | 323 (4.4%) | 660 (10.0%) |
| $75,000 to $99,999 | 770 (10.4%) | 893 (13.5%) |
| $100,000+ | 3,064 (41.4%) | 1,367 (20.7%) |
| Total | 7,403 (100.0%) | 6,612 (100.0%) |
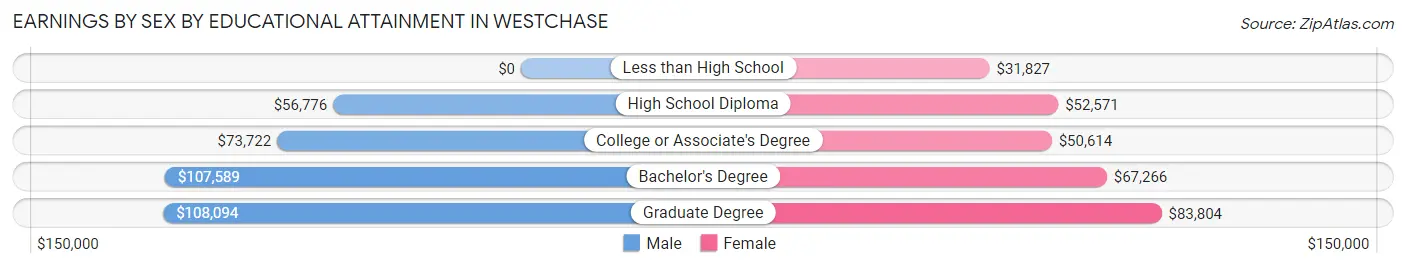
Earnings by Sex by Educational Attainment in Westchase
Average earnings in Westchase are $92,869 for men and $62,341 for women, a difference of 32.9%. Men with an educational attainment of graduate degree enjoy the highest average annual earnings of $108,094, while those with high school diploma education earn the least with $56,776. Women with an educational attainment of graduate degree earn the most with the average annual earnings of $83,804, while those with less than high school education have the smallest earnings of $31,827.
| Educational Attainment | Male Income | Female Income |
| Less than High School | - | - |
| High School Diploma | $56,776 | $52,571 |
| College or Associate's Degree | $73,722 | $50,614 |
| Bachelor's Degree | $107,589 | $67,266 |
| Graduate Degree | $108,094 | $83,804 |
| Total | $92,869 | $62,341 |
Family Income in Westchase
Family Income Brackets in Westchase
According to the Westchase family income data, there are 1,916 families falling into the $200,000+ income range, which is the most common income bracket and makes up 28.1% of all families. Conversely, the $10,000 to $14,999 income bracket is the least frequent group with only 27 families (0.4%) belonging to this category.
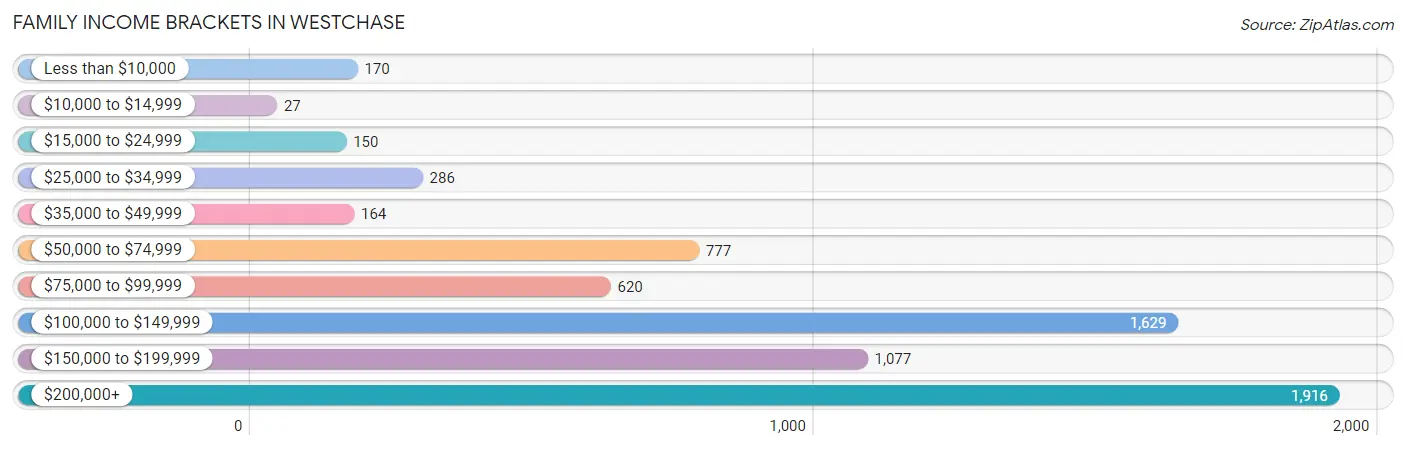
| Income Bracket | # Families | % Families |
| Less than $10,000 | 170 | 2.5% |
| $10,000 to $14,999 | 27 | 0.4% |
| $15,000 to $24,999 | 150 | 2.2% |
| $25,000 to $34,999 | 286 | 4.2% |
| $35,000 to $49,999 | 164 | 2.4% |
| $50,000 to $74,999 | 777 | 11.4% |
| $75,000 to $99,999 | 620 | 9.1% |
| $100,000 to $149,999 | 1,629 | 23.9% |
| $150,000 to $199,999 | 1,077 | 15.8% |
| $200,000+ | 1,916 | 28.1% |
Family Income by Famaliy Size in Westchase
6-person families (58 | 0.9%) account for the highest median family income in Westchase with $250,001 per family, while 2-person families (2,990 | 43.9%) have the highest median income of $57,590 per family member.
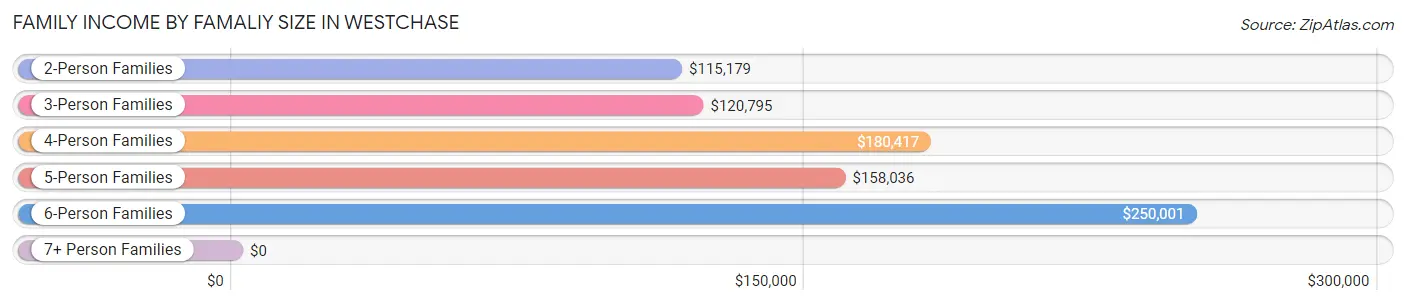
| Income Bracket | # Families | Median Income |
| 2-Person Families | 2,990 (43.9%) | $115,179 |
| 3-Person Families | 1,817 (26.7%) | $120,795 |
| 4-Person Families | 1,539 (22.6%) | $180,417 |
| 5-Person Families | 407 (6.0%) | $158,036 |
| 6-Person Families | 58 (0.9%) | $250,001 |
| 7+ Person Families | 6 (0.1%) | $0 |
| Total | 6,817 (100.0%) | $134,970 |
Family Income by Number of Earners in Westchase
The median family income in Westchase is $134,970, with families comprising 3+ earners (717) having the highest median family income of $196,421, while families with no earners (546) have the lowest median family income of $57,647, accounting for 10.5% and 8.0% of families, respectively.
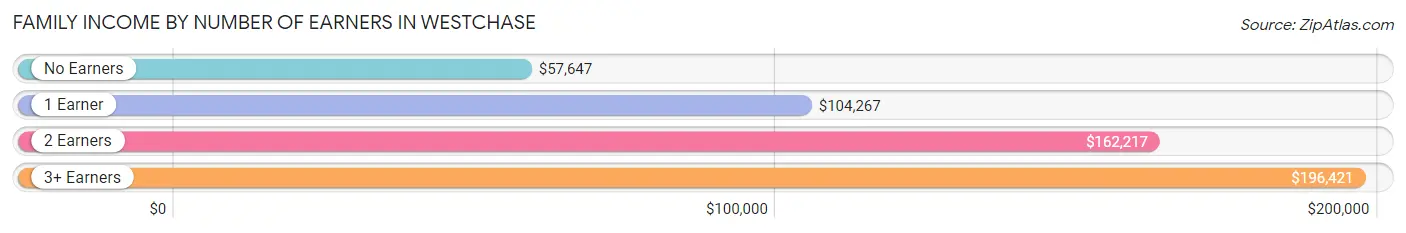
| Number of Earners | # Families | Median Income |
| No Earners | 546 (8.0%) | $57,647 |
| 1 Earner | 2,596 (38.1%) | $104,267 |
| 2 Earners | 2,958 (43.4%) | $162,217 |
| 3+ Earners | 717 (10.5%) | $196,421 |
| Total | 6,817 (100.0%) | $134,970 |
Household Income in Westchase
Household Income Brackets in Westchase
With 2,295 households falling in the category, the $200,000+ income range is the most frequent in Westchase, accounting for 23.4% of all households. In contrast, only 98 households (1.0%) fall into the $10,000 to $14,999 income bracket, making it the least populous group.
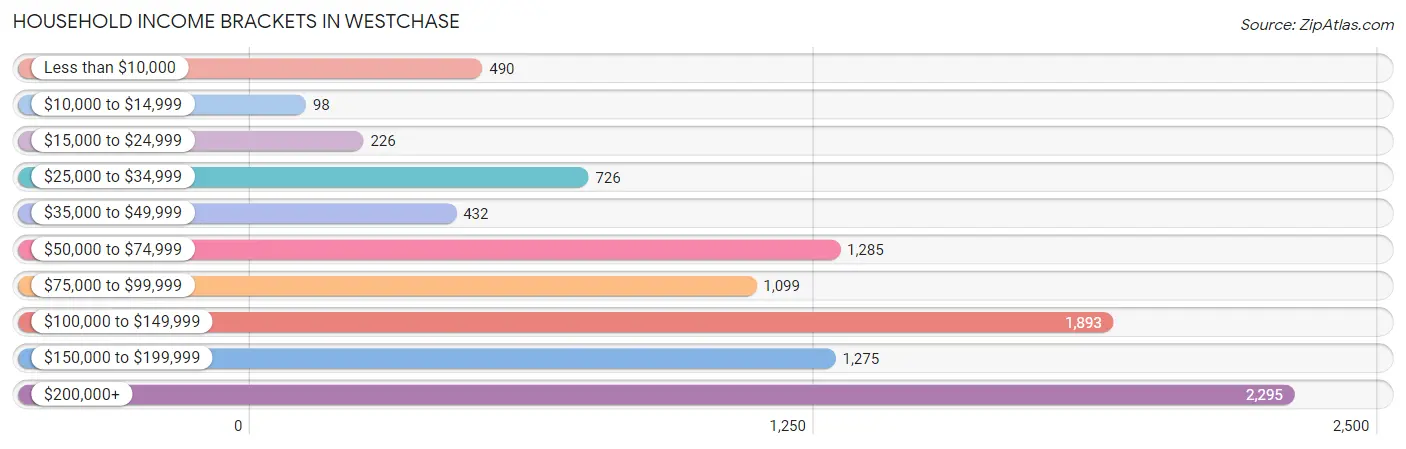
| Income Bracket | # Households | % Households |
| Less than $10,000 | 490 | 5.0% |
| $10,000 to $14,999 | 98 | 1.0% |
| $15,000 to $24,999 | 226 | 2.3% |
| $25,000 to $34,999 | 726 | 7.4% |
| $35,000 to $49,999 | 432 | 4.4% |
| $50,000 to $74,999 | 1,285 | 13.1% |
| $75,000 to $99,999 | 1,099 | 11.2% |
| $100,000 to $149,999 | 1,893 | 19.3% |
| $150,000 to $199,999 | 1,275 | 13.0% |
| $200,000+ | 2,295 | 23.4% |
Household Income by Householder Age in Westchase
The median household income in Westchase is $114,434, with the highest median household income of $151,490 found in the 45 to 64 years age bracket for the primary householder. A total of 3,722 households (37.9%) fall into this category. Meanwhile, the 65+ years age bracket for the primary householder has the lowest median household income of $57,014, with 2,149 households (21.9%) in this group.
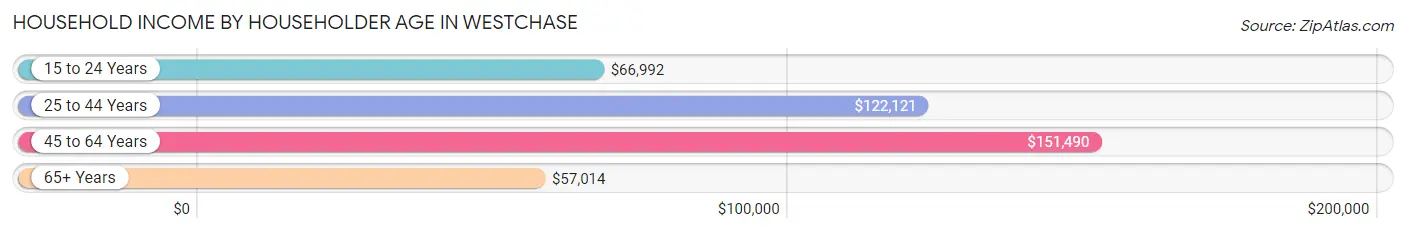
| Income Bracket | # Households | Median Income |
| 15 to 24 Years | 268 (2.7%) | $66,992 |
| 25 to 44 Years | 3,670 (37.4%) | $122,121 |
| 45 to 64 Years | 3,722 (37.9%) | $151,490 |
| 65+ Years | 2,149 (21.9%) | $57,014 |
| Total | 9,809 (100.0%) | $114,434 |
Poverty in Westchase
Income Below Poverty by Sex and Age in Westchase
With 5.4% poverty level for males and 7.3% for females among the residents of Westchase, 16 and 17 year old males and 75 year old and over females are the most vulnerable to poverty, with 80 males (21.7%) and 171 females (18.9%) in their respective age groups living below the poverty level.
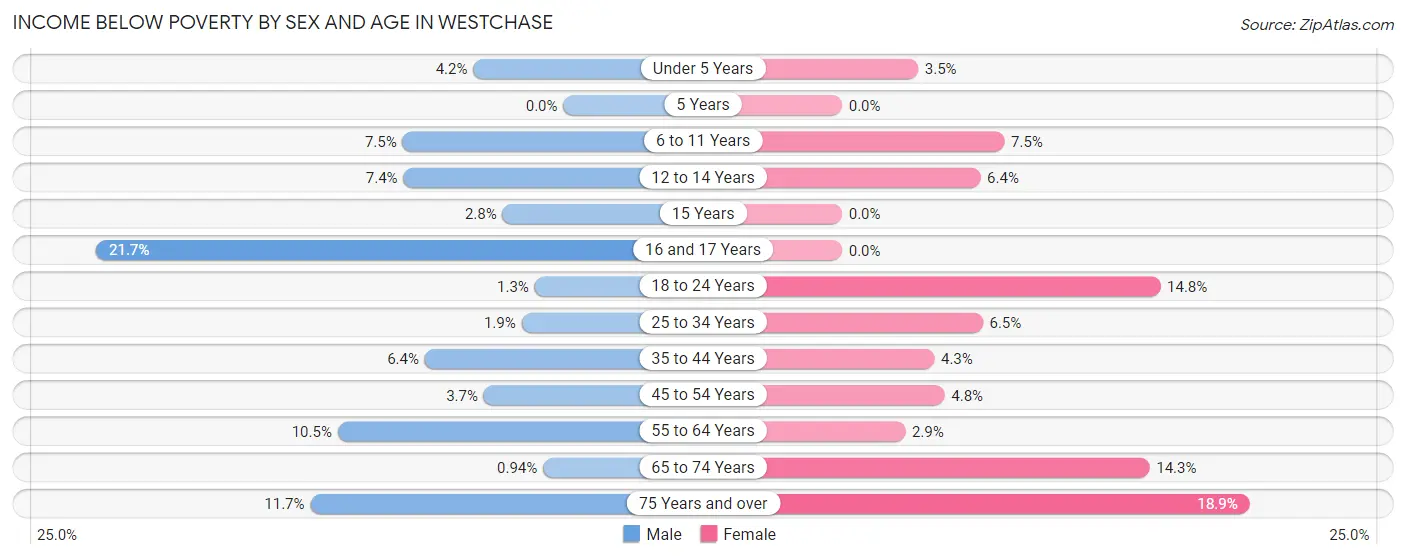
| Age Bracket | Male | Female |
| Under 5 Years | 38 (4.2%) | 24 (3.5%) |
| 5 Years | 0 (0.0%) | 0 (0.0%) |
| 6 to 11 Years | 78 (7.5%) | 66 (7.5%) |
| 12 to 14 Years | 29 (7.4%) | 28 (6.4%) |
| 15 Years | 6 (2.8%) | 0 (0.0%) |
| 16 and 17 Years | 80 (21.7%) | 0 (0.0%) |
| 18 to 24 Years | 11 (1.3%) | 166 (14.8%) |
| 25 to 34 Years | 36 (1.9%) | 115 (6.5%) |
| 35 to 44 Years | 112 (6.4%) | 86 (4.3%) |
| 45 to 54 Years | 69 (3.7%) | 90 (4.8%) |
| 55 to 64 Years | 143 (10.5%) | 45 (2.9%) |
| 65 to 74 Years | 10 (0.9%) | 124 (14.3%) |
| 75 Years and over | 52 (11.7%) | 171 (18.9%) |
| Total | 664 (5.4%) | 915 (7.3%) |
Income Above Poverty by Sex and Age in Westchase
According to the poverty statistics in Westchase, males aged 5 years and females aged 5 years are the age groups that are most secure financially, with 100.0% of males and 100.0% of females in these age groups living above the poverty line.
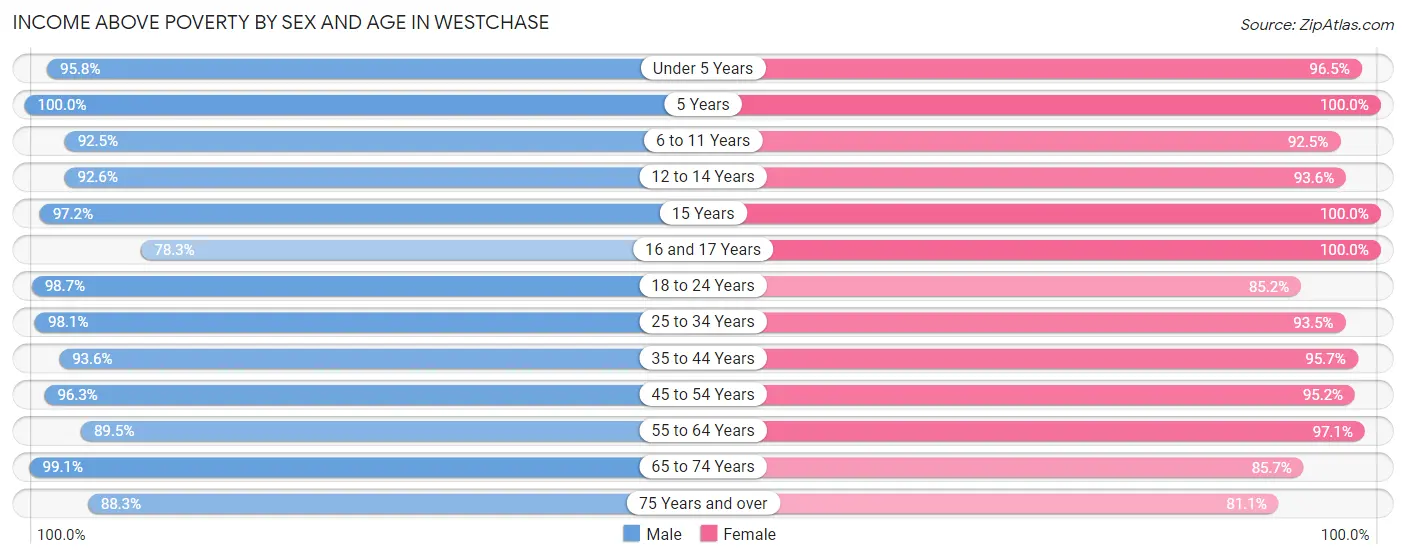
| Age Bracket | Male | Female |
| Under 5 Years | 872 (95.8%) | 655 (96.5%) |
| 5 Years | 264 (100.0%) | 104 (100.0%) |
| 6 to 11 Years | 967 (92.5%) | 811 (92.5%) |
| 12 to 14 Years | 362 (92.6%) | 408 (93.6%) |
| 15 Years | 207 (97.2%) | 74 (100.0%) |
| 16 and 17 Years | 289 (78.3%) | 249 (100.0%) |
| 18 to 24 Years | 817 (98.7%) | 958 (85.2%) |
| 25 to 34 Years | 1,820 (98.1%) | 1,647 (93.5%) |
| 35 to 44 Years | 1,630 (93.6%) | 1,925 (95.7%) |
| 45 to 54 Years | 1,802 (96.3%) | 1,801 (95.2%) |
| 55 to 64 Years | 1,223 (89.5%) | 1,492 (97.1%) |
| 65 to 74 Years | 1,057 (99.1%) | 745 (85.7%) |
| 75 Years and over | 391 (88.3%) | 733 (81.1%) |
| Total | 11,701 (94.6%) | 11,602 (92.7%) |
Income Below Poverty Among Married-Couple Families in Westchase
The poverty statistics for married-couple families in Westchase show that 1.3% or 71 of the total 5,258 families live below the poverty line. Families with 3 or 4 children have the highest poverty rate of 1.6%, comprising of 5 families. On the other hand, families with 1 or 2 children have the lowest poverty rate of 1.1%, which includes 22 families.
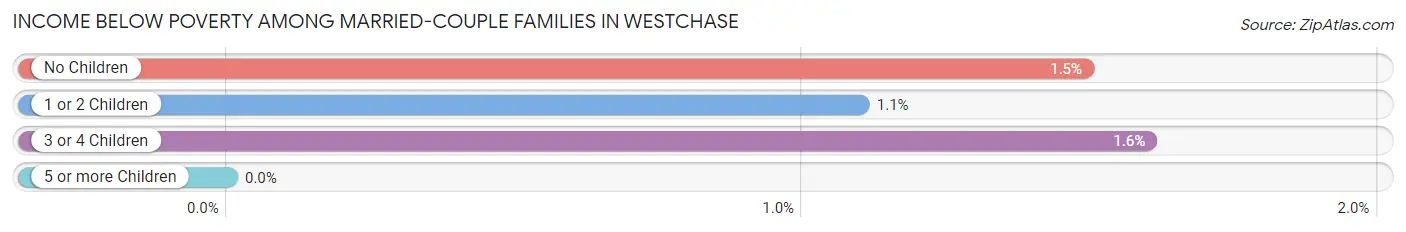
| Children | Above Poverty | Below Poverty |
| No Children | 2,904 (98.5%) | 44 (1.5%) |
| 1 or 2 Children | 1,975 (98.9%) | 22 (1.1%) |
| 3 or 4 Children | 308 (98.4%) | 5 (1.6%) |
| 5 or more Children | 0 (0.0%) | 0 (0.0%) |
| Total | 5,187 (98.7%) | 71 (1.3%) |
Income Below Poverty Among Single-Parent Households in Westchase
According to the poverty data in Westchase, 32.6% or 182 single-father households and 8.5% or 85 single-mother households are living below the poverty line. Among single-father households, those with 3 or 4 children have the highest poverty rate, with 16 households (64.0%) experiencing poverty. Likewise, among single-mother households, those with 1 or 2 children have the highest poverty rate, with 85 households (13.6%) falling below the poverty line.
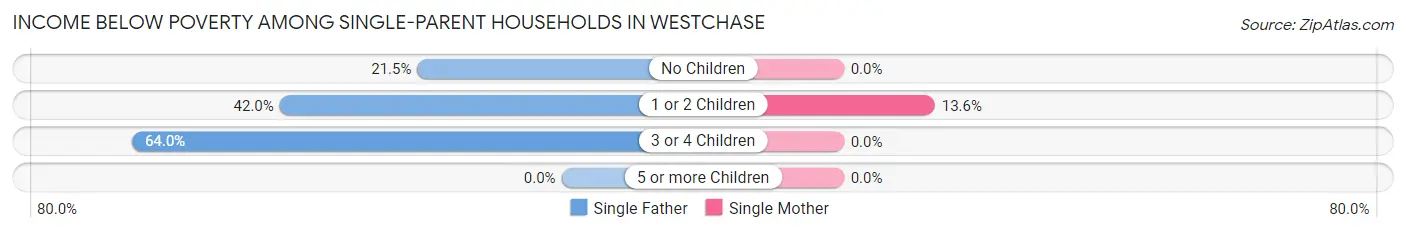
| Children | Single Father | Single Mother |
| No Children | 61 (21.5%) | 0 (0.0%) |
| 1 or 2 Children | 105 (42.0%) | 85 (13.6%) |
| 3 or 4 Children | 16 (64.0%) | 0 (0.0%) |
| 5 or more Children | 0 (0.0%) | 0 (0.0%) |
| Total | 182 (32.6%) | 85 (8.5%) |
Income Below Poverty Among Married-Couple vs Single-Parent Households in Westchase
The poverty data for Westchase shows that 71 of the married-couple family households (1.3%) and 267 of the single-parent households (17.1%) are living below the poverty level. Within the married-couple family households, those with 3 or 4 children have the highest poverty rate, with 5 households (1.6%) falling below the poverty line. Among the single-parent households, those with 3 or 4 children have the highest poverty rate, with 16 household (64.0%) living below poverty.
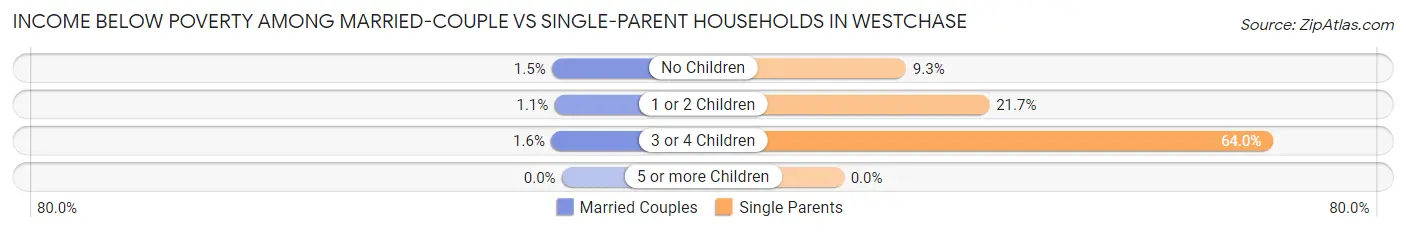
| Children | Married-Couple Families | Single-Parent Households |
| No Children | 44 (1.5%) | 61 (9.3%) |
| 1 or 2 Children | 22 (1.1%) | 190 (21.7%) |
| 3 or 4 Children | 5 (1.6%) | 16 (64.0%) |
| 5 or more Children | 0 (0.0%) | 0 (0.0%) |
| Total | 71 (1.3%) | 267 (17.1%) |
Race in Westchase
The most populous races in Westchase are White / Caucasian (17,340 | 69.7%), Hispanic or Latino (5,244 | 21.1%), and Two or more Races (3,423 | 13.8%).
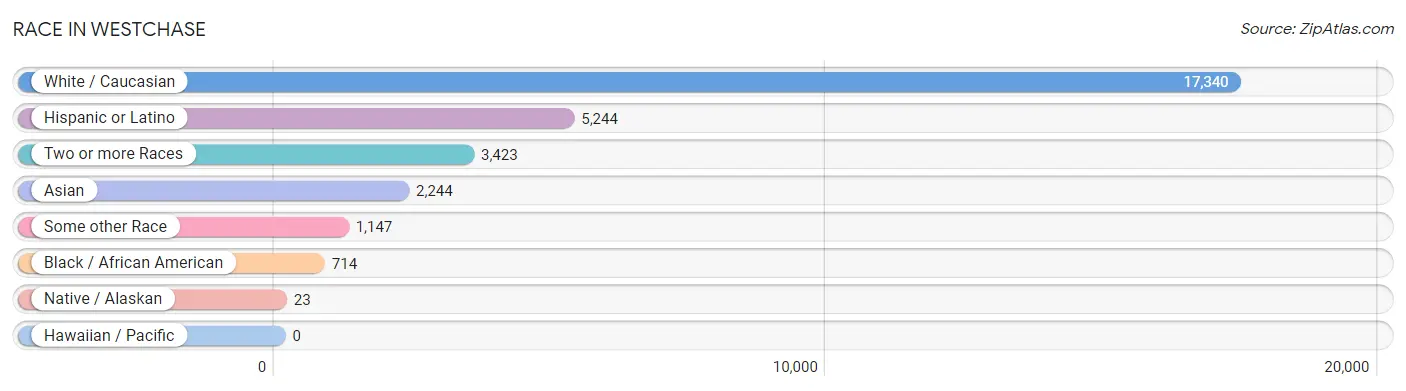
| Race | # Population | % Population |
| Asian | 2,244 | 9.0% |
| Black / African American | 714 | 2.9% |
| Hawaiian / Pacific | 0 | 0.0% |
| Hispanic or Latino | 5,244 | 21.1% |
| Native / Alaskan | 23 | 0.1% |
| White / Caucasian | 17,340 | 69.7% |
| Two or more Races | 3,423 | 13.8% |
| Some other Race | 1,147 | 4.6% |
| Total | 24,891 | 100.0% |
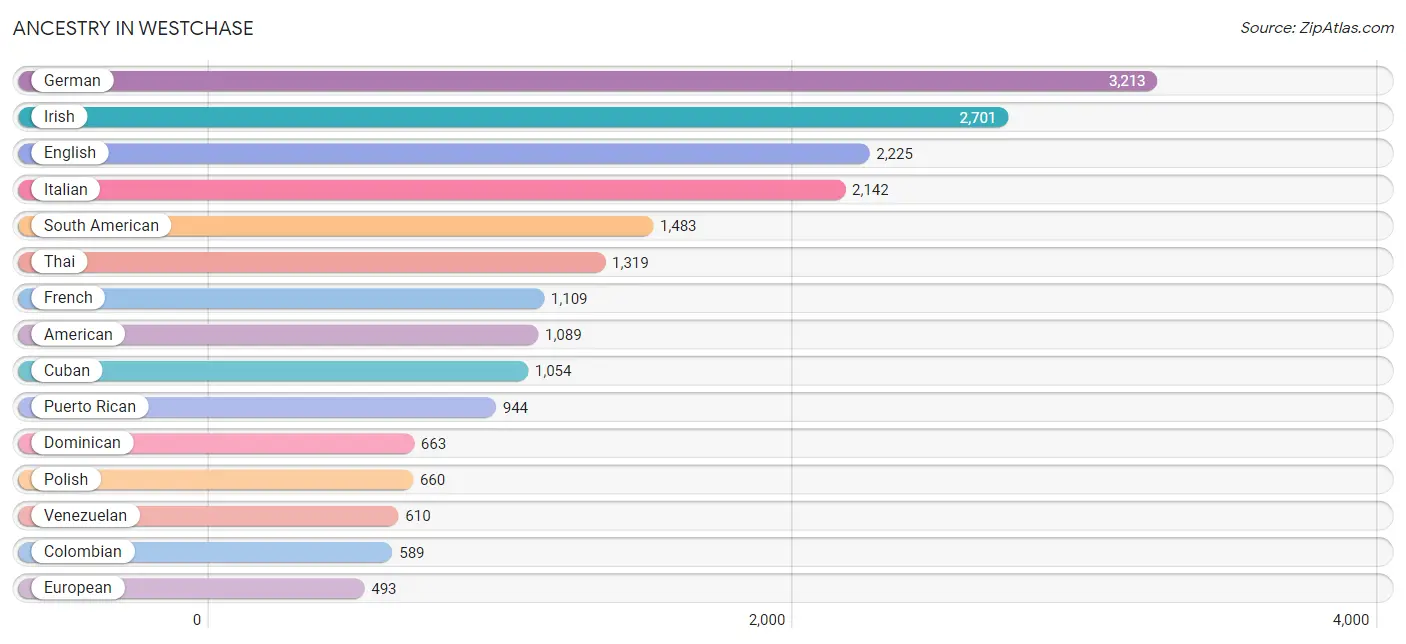
Ancestry in Westchase
The most populous ancestries reported in Westchase are German (3,213 | 12.9%), Irish (2,701 | 10.8%), English (2,225 | 8.9%), Italian (2,142 | 8.6%), and South American (1,483 | 6.0%), together accounting for 47.3% of all Westchase residents.
| Ancestry | # Population | % Population |
| Albanian | 160 | 0.6% |
| American | 1,089 | 4.4% |
| Arab | 124 | 0.5% |
| Argentinean | 51 | 0.2% |
| Australian | 37 | 0.2% |
| Austrian | 65 | 0.3% |
| Belgian | 8 | 0.0% |
| Bhutanese | 104 | 0.4% |
| Brazilian | 54 | 0.2% |
| British | 400 | 1.6% |
| British West Indian | 134 | 0.5% |
| Bulgarian | 12 | 0.1% |
| Burmese | 9 | 0.0% |
| Canadian | 140 | 0.6% |
| Carpatho Rusyn | 26 | 0.1% |
| Central American | 271 | 1.1% |
| Central American Indian | 71 | 0.3% |
| Cherokee | 5 | 0.0% |
| Chickasaw | 50 | 0.2% |
| Chilean | 7 | 0.0% |
| Colombian | 589 | 2.4% |
| Costa Rican | 156 | 0.6% |
| Croatian | 39 | 0.2% |
| Cuban | 1,054 | 4.2% |
| Czech | 118 | 0.5% |
| Czechoslovakian | 13 | 0.1% |
| Danish | 57 | 0.2% |
| Dominican | 663 | 2.7% |
| Dutch | 234 | 0.9% |
| Eastern European | 154 | 0.6% |
| Ecuadorian | 177 | 0.7% |
| Egyptian | 36 | 0.1% |
| English | 2,225 | 8.9% |
| Ethiopian | 21 | 0.1% |
| European | 493 | 2.0% |
| Filipino | 136 | 0.5% |
| Finnish | 17 | 0.1% |
| French | 1,109 | 4.5% |
| French Canadian | 77 | 0.3% |
| German | 3,213 | 12.9% |
| Greek | 245 | 1.0% |
| Guatemalan | 7 | 0.0% |
| Guyanese | 119 | 0.5% |
| Honduran | 66 | 0.3% |
| Hungarian | 213 | 0.9% |
| Indian (Asian) | 292 | 1.2% |
| Iranian | 88 | 0.4% |
| Irish | 2,701 | 10.8% |
| Israeli | 146 | 0.6% |
| Italian | 2,142 | 8.6% |
| Jamaican | 190 | 0.8% |
| Kenyan | 260 | 1.0% |
| Korean | 137 | 0.5% |
| Lebanese | 88 | 0.4% |
| Lithuanian | 114 | 0.5% |
| Macedonian | 61 | 0.3% |
| Mexican | 246 | 1.0% |
| Nicaraguan | 42 | 0.2% |
| Norwegian | 281 | 1.1% |
| Pakistani | 88 | 0.4% |
| Peruvian | 49 | 0.2% |
| Polish | 660 | 2.6% |
| Portuguese | 176 | 0.7% |
| Puerto Rican | 944 | 3.8% |
| Romanian | 39 | 0.2% |
| Russian | 470 | 1.9% |
| Scotch-Irish | 162 | 0.6% |
| Scottish | 338 | 1.4% |
| Serbian | 47 | 0.2% |
| Sierra Leonean | 89 | 0.4% |
| Slavic | 12 | 0.1% |
| Slovak | 117 | 0.5% |
| Slovene | 20 | 0.1% |
| South American | 1,483 | 6.0% |
| Spaniard | 466 | 1.9% |
| Spanish | 23 | 0.1% |
| Sri Lankan | 175 | 0.7% |
| Subsaharan African | 370 | 1.5% |
| Swedish | 292 | 1.2% |
| Swiss | 45 | 0.2% |
| Thai | 1,319 | 5.3% |
| Trinidadian and Tobagonian | 85 | 0.3% |
| Turkish | 45 | 0.2% |
| Ukrainian | 131 | 0.5% |
| Venezuelan | 610 | 2.5% |
| Welsh | 156 | 0.6% |
| West Indian | 131 | 0.5% |
| Yugoslavian | 393 | 1.6% | View All 88 Rows |
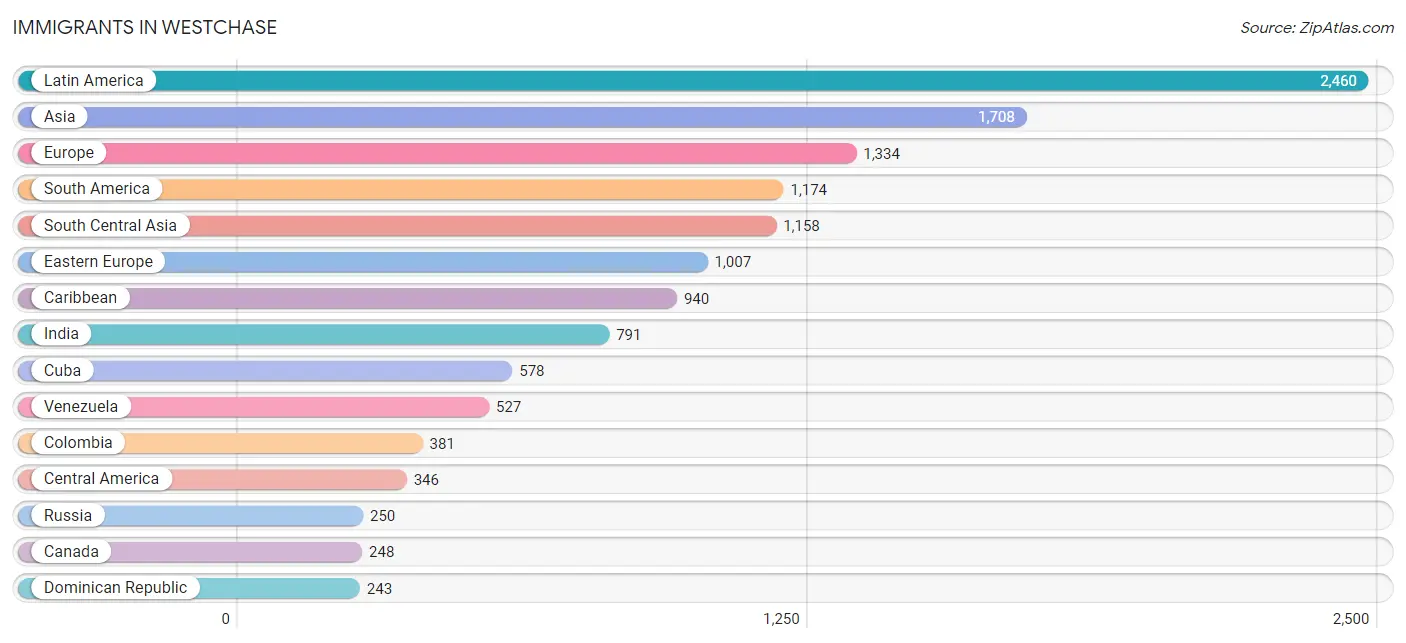
Immigrants in Westchase
The most numerous immigrant groups reported in Westchase came from Latin America (2,460 | 9.9%), Asia (1,708 | 6.9%), Europe (1,334 | 5.4%), South America (1,174 | 4.7%), and South Central Asia (1,158 | 4.6%), together accounting for 31.5% of all Westchase residents.
| Immigration Origin | # Population | % Population |
| Africa | 145 | 0.6% |
| Albania | 81 | 0.3% |
| Argentina | 45 | 0.2% |
| Asia | 1,708 | 6.9% |
| Australia | 10 | 0.0% |
| Belarus | 85 | 0.3% |
| Bosnia and Herzegovina | 201 | 0.8% |
| Brazil | 155 | 0.6% |
| Bulgaria | 39 | 0.2% |
| Canada | 248 | 1.0% |
| Caribbean | 940 | 3.8% |
| Central America | 346 | 1.4% |
| China | 97 | 0.4% |
| Colombia | 381 | 1.5% |
| Costa Rica | 104 | 0.4% |
| Croatia | 7 | 0.0% |
| Cuba | 578 | 2.3% |
| Czechoslovakia | 67 | 0.3% |
| Dominican Republic | 243 | 1.0% |
| Eastern Africa | 84 | 0.3% |
| Eastern Asia | 139 | 0.6% |
| Eastern Europe | 1,007 | 4.1% |
| Ecuador | 17 | 0.1% |
| Egypt | 34 | 0.1% |
| England | 107 | 0.4% |
| Europe | 1,334 | 5.4% |
| Germany | 25 | 0.1% |
| Honduras | 42 | 0.2% |
| Hungary | 14 | 0.1% |
| India | 791 | 3.2% |
| Indonesia | 8 | 0.0% |
| Iran | 111 | 0.4% |
| Israel | 135 | 0.5% |
| Italy | 16 | 0.1% |
| Jamaica | 118 | 0.5% |
| Japan | 37 | 0.2% |
| Kazakhstan | 63 | 0.3% |
| Kenya | 74 | 0.3% |
| Korea | 5 | 0.0% |
| Latin America | 2,460 | 9.9% |
| Lebanon | 12 | 0.1% |
| Lithuania | 25 | 0.1% |
| Mexico | 166 | 0.7% |
| Morocco | 21 | 0.1% |
| Netherlands | 10 | 0.0% |
| Nicaragua | 34 | 0.1% |
| Northern Africa | 55 | 0.2% |
| Northern Europe | 206 | 0.8% |
| Oceania | 10 | 0.0% |
| Pakistan | 88 | 0.4% |
| Peru | 49 | 0.2% |
| Philippines | 66 | 0.3% |
| Poland | 126 | 0.5% |
| Portugal | 5 | 0.0% |
| Romania | 28 | 0.1% |
| Russia | 250 | 1.0% |
| Scotland | 15 | 0.1% |
| Serbia | 8 | 0.0% |
| South Africa | 6 | 0.0% |
| South America | 1,174 | 4.7% |
| South Central Asia | 1,158 | 4.6% |
| South Eastern Asia | 219 | 0.9% |
| Southern Europe | 86 | 0.4% |
| Spain | 65 | 0.3% |
| Sri Lanka | 105 | 0.4% |
| Sweden | 48 | 0.2% |
| Thailand | 27 | 0.1% |
| Trinidad and Tobago | 1 | 0.0% |
| Turkey | 45 | 0.2% |
| Venezuela | 527 | 2.1% |
| Vietnam | 118 | 0.5% |
| Western Asia | 192 | 0.8% |
| Western Europe | 35 | 0.1% | View All 73 Rows |
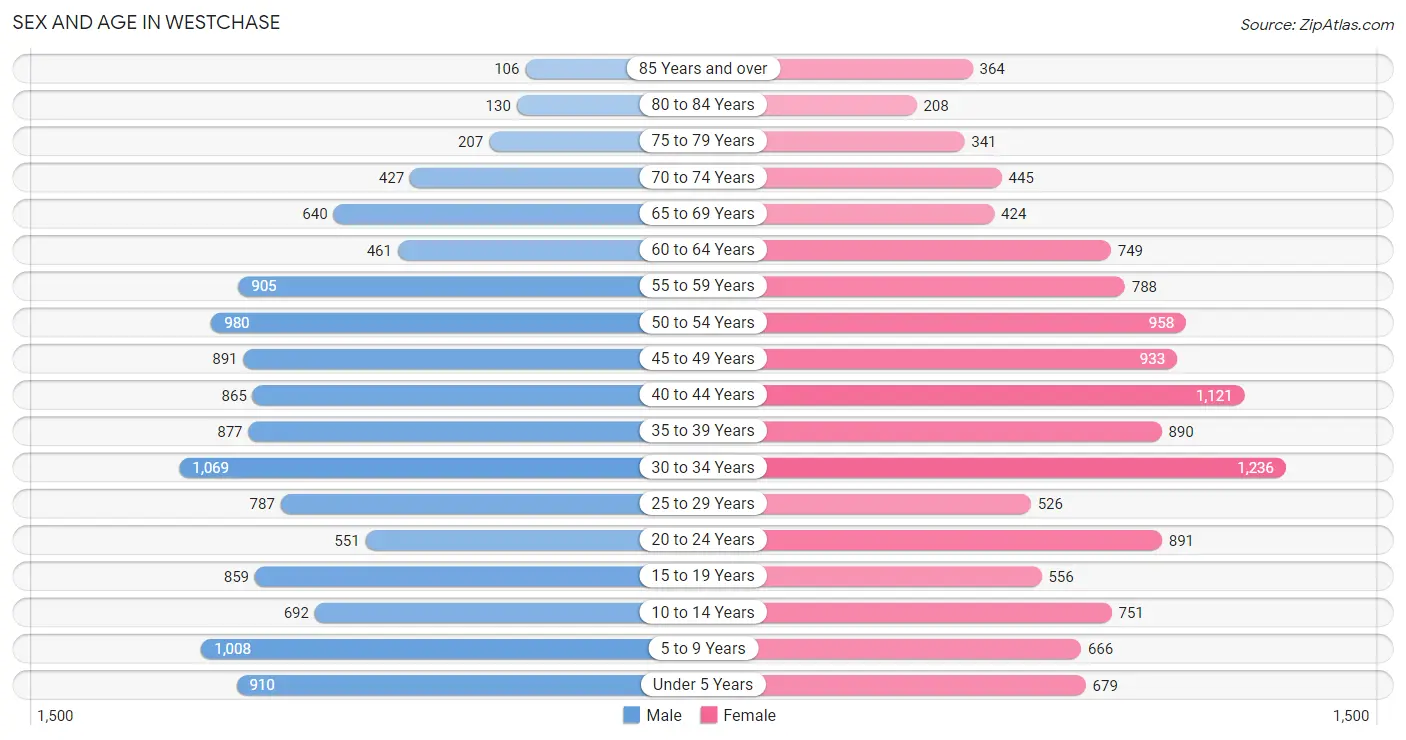
Sex and Age in Westchase
Sex and Age in Westchase
The most populous age groups in Westchase are 30 to 34 Years (1,069 | 8.6%) for men and 30 to 34 Years (1,236 | 9.9%) for women.
| Age Bracket | Male | Female |
| Under 5 Years | 910 (7.4%) | 679 (5.4%) |
| 5 to 9 Years | 1,008 (8.2%) | 666 (5.3%) |
| 10 to 14 Years | 692 (5.6%) | 751 (6.0%) |
| 15 to 19 Years | 859 (7.0%) | 556 (4.4%) |
| 20 to 24 Years | 551 (4.5%) | 891 (7.1%) |
| 25 to 29 Years | 787 (6.4%) | 526 (4.2%) |
| 30 to 34 Years | 1,069 (8.6%) | 1,236 (9.9%) |
| 35 to 39 Years | 877 (7.1%) | 890 (7.1%) |
| 40 to 44 Years | 865 (7.0%) | 1,121 (8.9%) |
| 45 to 49 Years | 891 (7.2%) | 933 (7.4%) |
| 50 to 54 Years | 980 (7.9%) | 958 (7.6%) |
| 55 to 59 Years | 905 (7.3%) | 788 (6.3%) |
| 60 to 64 Years | 461 (3.7%) | 749 (6.0%) |
| 65 to 69 Years | 640 (5.2%) | 424 (3.4%) |
| 70 to 74 Years | 427 (3.5%) | 445 (3.5%) |
| 75 to 79 Years | 207 (1.7%) | 341 (2.7%) |
| 80 to 84 Years | 130 (1.1%) | 208 (1.7%) |
| 85 Years and over | 106 (0.9%) | 364 (2.9%) |
| Total | 12,365 (100.0%) | 12,526 (100.0%) |
Families and Households in Westchase
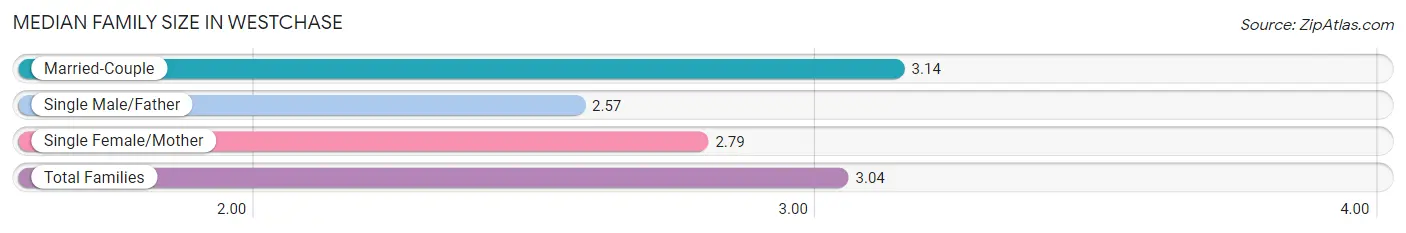
Median Family Size in Westchase
The median family size in Westchase is 3.04 persons per family, with married-couple families (5,258 | 77.1%) accounting for the largest median family size of 3.14 persons per family. On the other hand, single male/father families (559 | 8.2%) represent the smallest median family size with 2.57 persons per family.
| Family Type | # Families | Family Size |
| Married-Couple | 5,258 (77.1%) | 3.14 |
| Single Male/Father | 559 (8.2%) | 2.57 |
| Single Female/Mother | 1,000 (14.7%) | 2.79 |
| Total Families | 6,817 (100.0%) | 3.04 |
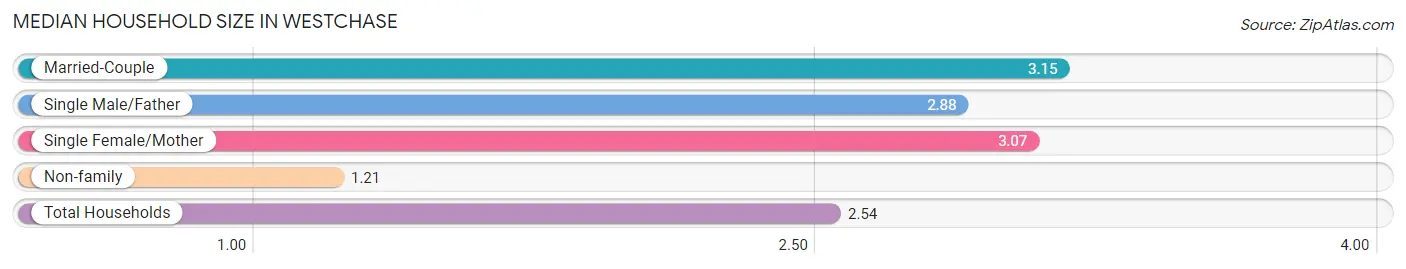
Median Household Size in Westchase
The median household size in Westchase is 2.54 persons per household, with married-couple households (5,258 | 53.6%) accounting for the largest median household size of 3.15 persons per household. non-family households (2,992 | 30.5%) represent the smallest median household size with 1.21 persons per household.
| Household Type | # Households | Household Size |
| Married-Couple | 5,258 (53.6%) | 3.15 |
| Single Male/Father | 559 (5.7%) | 2.88 |
| Single Female/Mother | 1,000 (10.2%) | 3.07 |
| Non-family | 2,992 (30.5%) | 1.21 |
| Total Households | 9,809 (100.0%) | 2.54 |
Household Size by Marriage Status in Westchase
Out of a total of 9,809 households in Westchase, 6,817 (69.5%) are family households, while 2,992 (30.5%) are nonfamily households. The most numerous type of family households are 2-person households, comprising 2,766, and the most common type of nonfamily households are 1-person households, comprising 2,461.
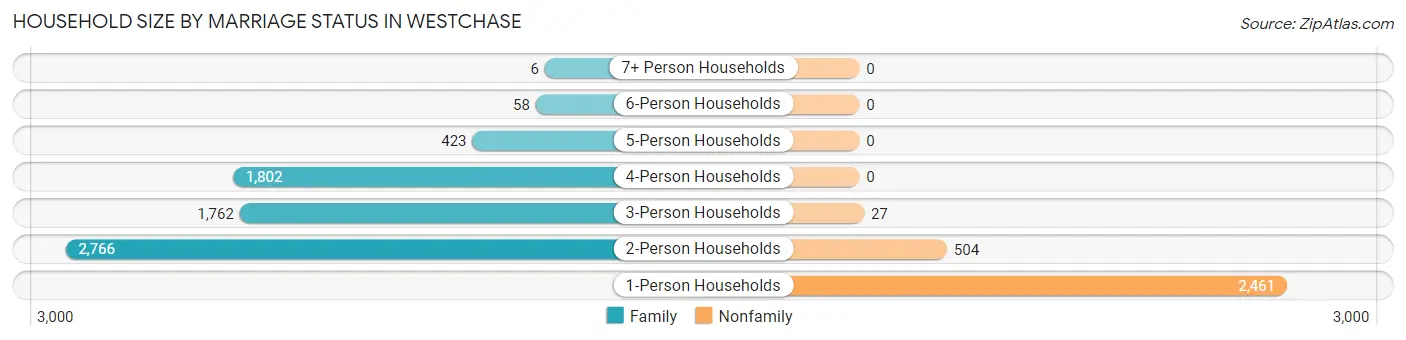
| Household Size | Family Households | Nonfamily Households |
| 1-Person Households | - | 2,461 (25.1%) |
| 2-Person Households | 2,766 (28.2%) | 504 (5.1%) |
| 3-Person Households | 1,762 (18.0%) | 27 (0.3%) |
| 4-Person Households | 1,802 (18.4%) | 0 (0.0%) |
| 5-Person Households | 423 (4.3%) | 0 (0.0%) |
| 6-Person Households | 58 (0.6%) | 0 (0.0%) |
| 7+ Person Households | 6 (0.1%) | 0 (0.0%) |
| Total | 6,817 (69.5%) | 2,992 (30.5%) |
Female Fertility in Westchase
Fertility by Age in Westchase
Average fertility rate in Westchase is 53.0 births per 1,000 women. Women in the age bracket of 20 to 34 years have the highest fertility rate with 77.0 births per 1,000 women. Women in the age bracket of 20 to 34 years acount for 60.4% of all women with births.
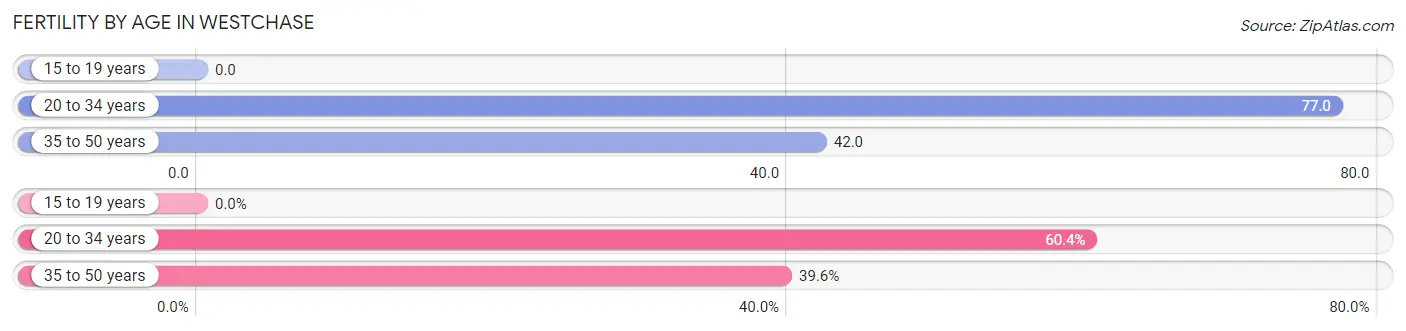
| Age Bracket | Women with Births | Births / 1,000 Women |
| 15 to 19 years | 0 (0.0%) | 0.0 |
| 20 to 34 years | 204 (60.4%) | 77.0 |
| 35 to 50 years | 134 (39.6%) | 42.0 |
| Total | 338 (100.0%) | 53.0 |
Fertility by Age by Marriage Status in Westchase
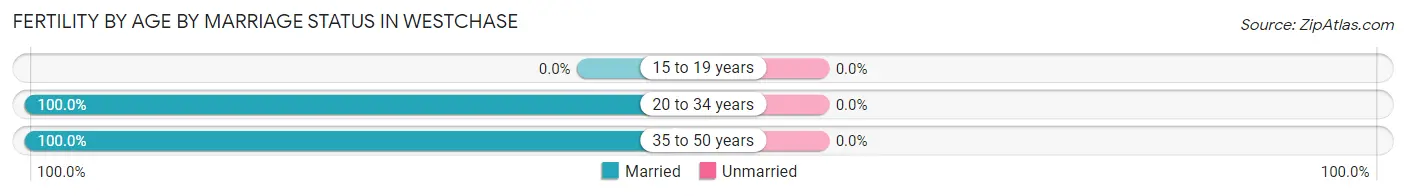
| Age Bracket | Married | Unmarried |
| 15 to 19 years | 0 (0.0%) | 0 (0.0%) |
| 20 to 34 years | 204 (100.0%) | 0 (0.0%) |
| 35 to 50 years | 134 (100.0%) | 0 (0.0%) |
| Total | 338 (100.0%) | 0 (0.0%) |
Fertility by Education in Westchase
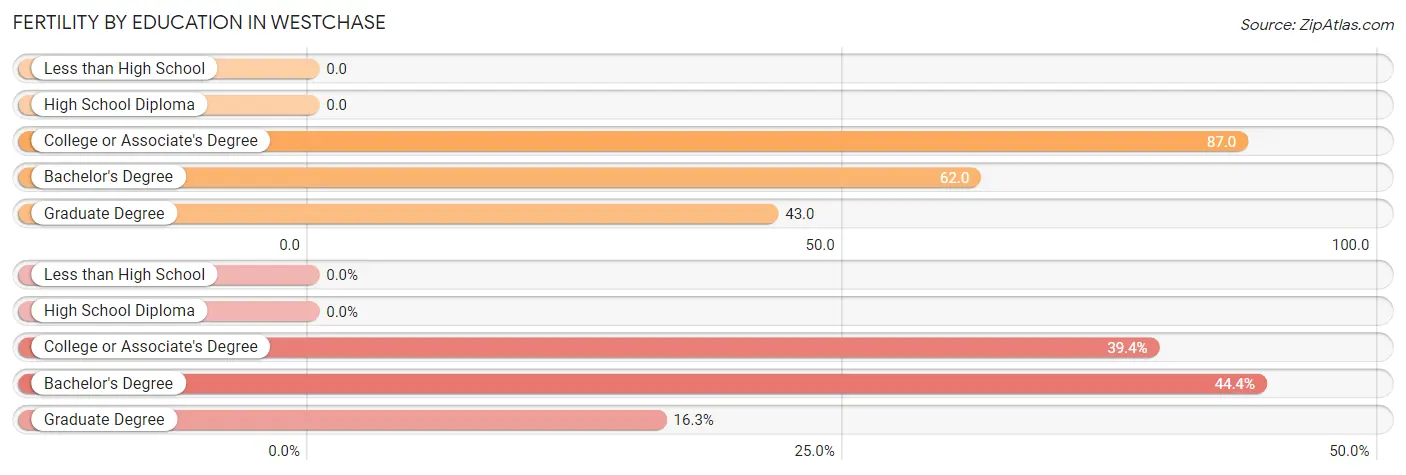
| Educational Attainment | Women with Births | Births / 1,000 Women |
| Less than High School | 0 (0.0%) | 0.0 |
| High School Diploma | 0 (0.0%) | 0.0 |
| College or Associate's Degree | 133 (39.4%) | 87.0 |
| Bachelor's Degree | 150 (44.4%) | 62.0 |
| Graduate Degree | 55 (16.3%) | 43.0 |
| Total | 338 (100.0%) | 53.0 |
Fertility by Education by Marriage Status in Westchase
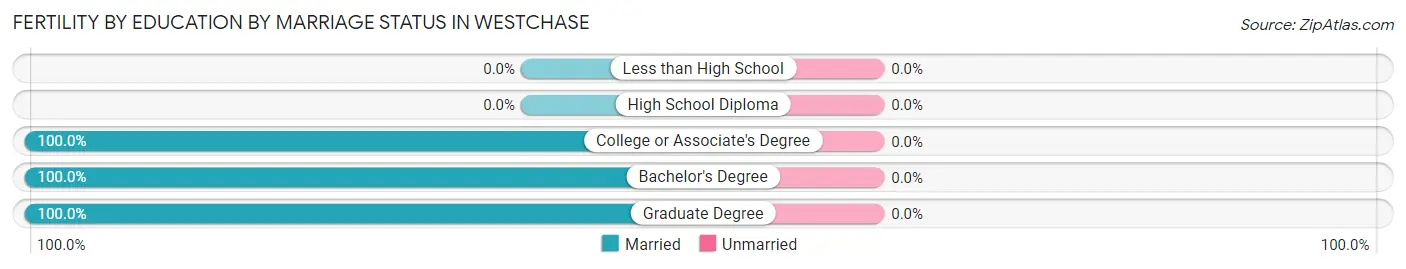
| Educational Attainment | Married | Unmarried |
| Less than High School | 0 (0.0%) | 0 (0.0%) |
| High School Diploma | 0 (0.0%) | 0 (0.0%) |
| College or Associate's Degree | 133 (100.0%) | 0 (0.0%) |
| Bachelor's Degree | 150 (100.0%) | 0 (0.0%) |
| Graduate Degree | 55 (100.0%) | 0 (0.0%) |
| Total | 338 (100.0%) | 0 (0.0%) |
Employment Characteristics in Westchase
Employment by Class of Employer in Westchase
Among the 12,980 employed individuals in Westchase, private company employees (9,320 | 71.8%), self-employed (incorporated) (1,018 | 7.8%), and not-for-profit organizations (780 | 6.0%) make up the most common classes of employment.
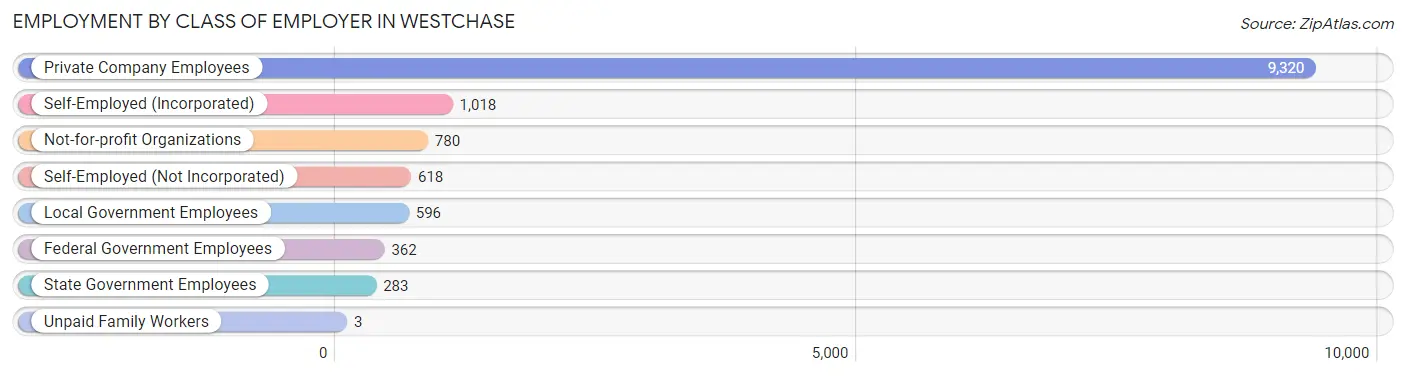
| Employer Class | # Employees | % Employees |
| Private Company Employees | 9,320 | 71.8% |
| Self-Employed (Incorporated) | 1,018 | 7.8% |
| Self-Employed (Not Incorporated) | 618 | 4.8% |
| Not-for-profit Organizations | 780 | 6.0% |
| Local Government Employees | 596 | 4.6% |
| State Government Employees | 283 | 2.2% |
| Federal Government Employees | 362 | 2.8% |
| Unpaid Family Workers | 3 | 0.0% |
| Total | 12,980 | 100.0% |
Employment Status by Age in Westchase
According to the labor force statistics for Westchase, out of the total population over 16 years of age (19,898), 67.9% or 13,511 individuals are in the labor force, with 2.6% or 351 of them unemployed. The age group with the highest labor force participation rate is 25 to 29 years, with 90.6% or 1,190 individuals in the labor force. Within the labor force, the 75 years and over age range has the highest percentage of unemployed individuals, with 14.0% or 8 of them being unemployed.
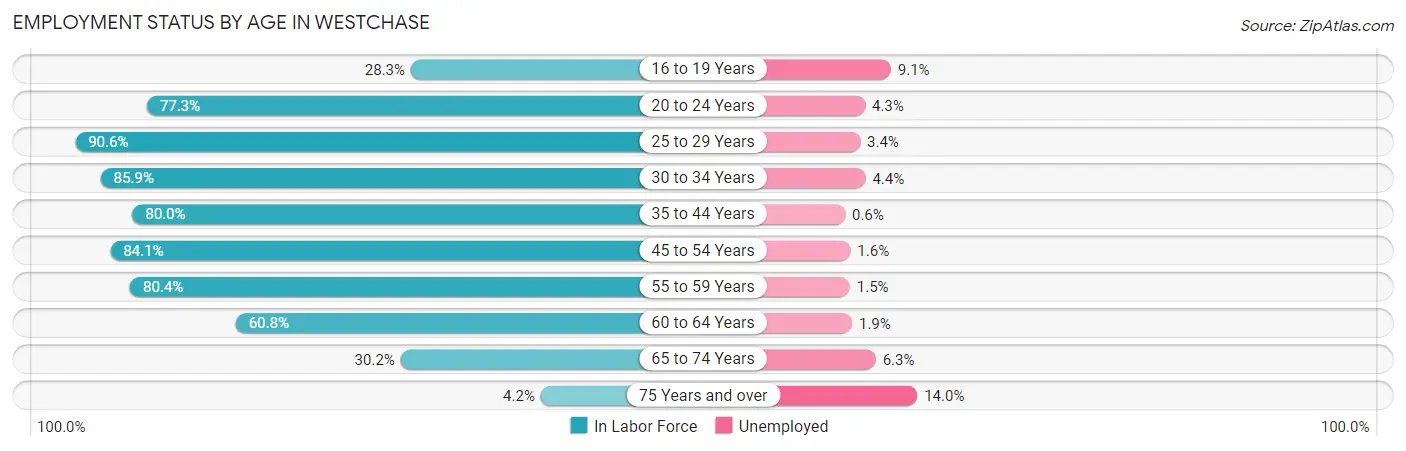
| Age Bracket | In Labor Force | Unemployed |
| 16 to 19 Years | 319 (28.3%) | 29 (9.1%) |
| 20 to 24 Years | 1,115 (77.3%) | 48 (4.3%) |
| 25 to 29 Years | 1,190 (90.6%) | 40 (3.4%) |
| 30 to 34 Years | 1,980 (85.9%) | 87 (4.4%) |
| 35 to 44 Years | 3,002 (80.0%) | 18 (0.6%) |
| 45 to 54 Years | 3,164 (84.1%) | 51 (1.6%) |
| 55 to 59 Years | 1,361 (80.4%) | 20 (1.5%) |
| 60 to 64 Years | 736 (60.8%) | 14 (1.9%) |
| 65 to 74 Years | 585 (30.2%) | 37 (6.3%) |
| 75 Years and over | 57 (4.2%) | 8 (14.0%) |
| Total | 13,511 (67.9%) | 351 (2.6%) |
Employment Status by Educational Attainment in Westchase
According to labor force statistics for Westchase, 81.5% of individuals (11,439) out of the total population between 25 and 64 years of age (14,036) are in the labor force, with 2.0% or 229 of them being unemployed. The group with the highest labor force participation rate are those with the educational attainment of bachelor's degree or higher, with 85.9% or 7,877 individuals in the labor force. Within the labor force, individuals with high school diploma education have the highest percentage of unemployment, with 2.7% or 28 of them being unemployed.
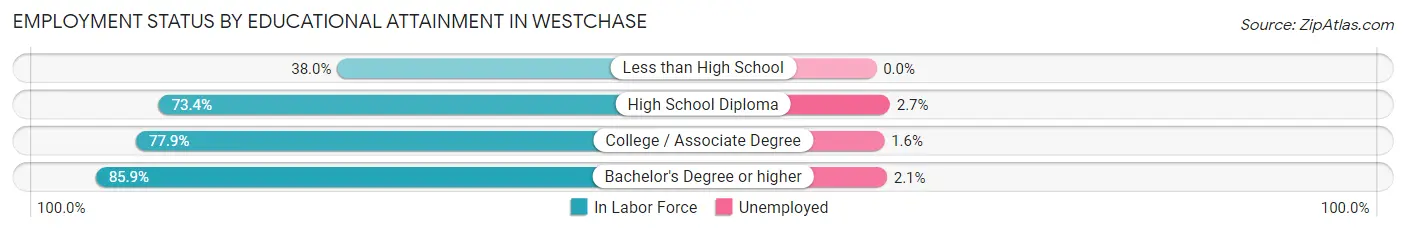
| Educational Attainment | In Labor Force | Unemployed |
| Less than High School | 157 (38.0%) | 0 (0.0%) |
| High School Diploma | 1,020 (73.4%) | 38 (2.7%) |
| College / Associate Degree | 2,387 (77.9%) | 49 (1.6%) |
| Bachelor's Degree or higher | 7,877 (85.9%) | 193 (2.1%) |
| Total | 11,439 (81.5%) | 281 (2.0%) |
Employment Occupations by Sex in Westchase
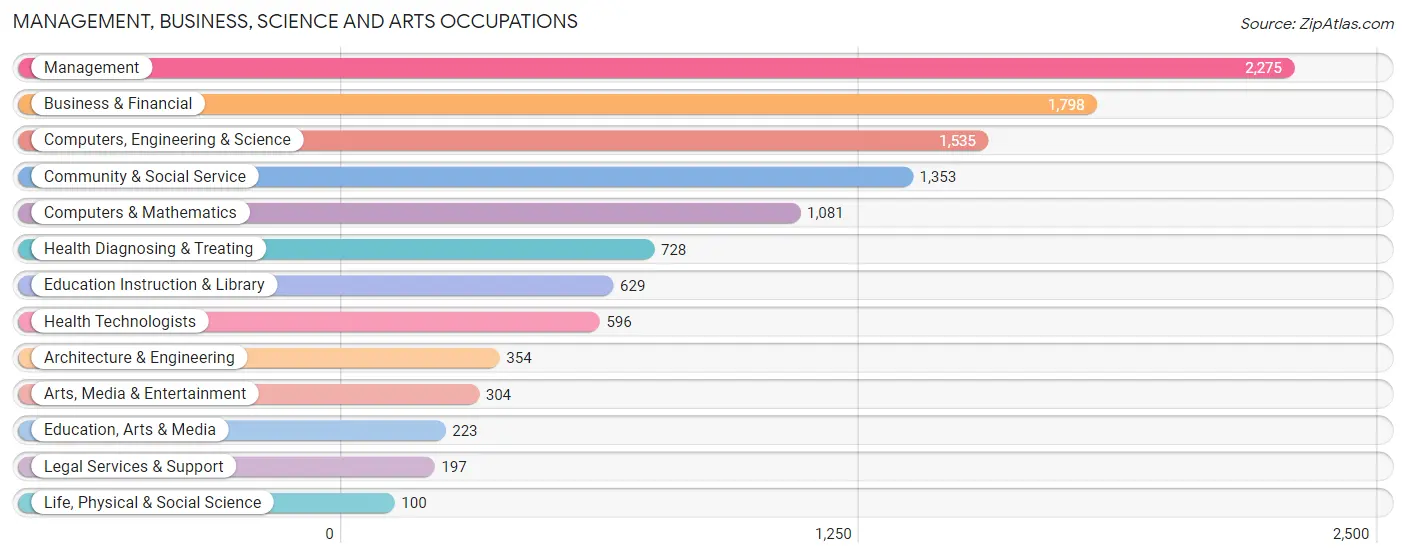
Management, Business, Science and Arts Occupations
The most common Management, Business, Science and Arts occupations in Westchase are Management (2,275 | 17.3%), Business & Financial (1,798 | 13.7%), Computers, Engineering & Science (1,535 | 11.7%), Community & Social Service (1,353 | 10.3%), and Computers & Mathematics (1,081 | 8.2%).
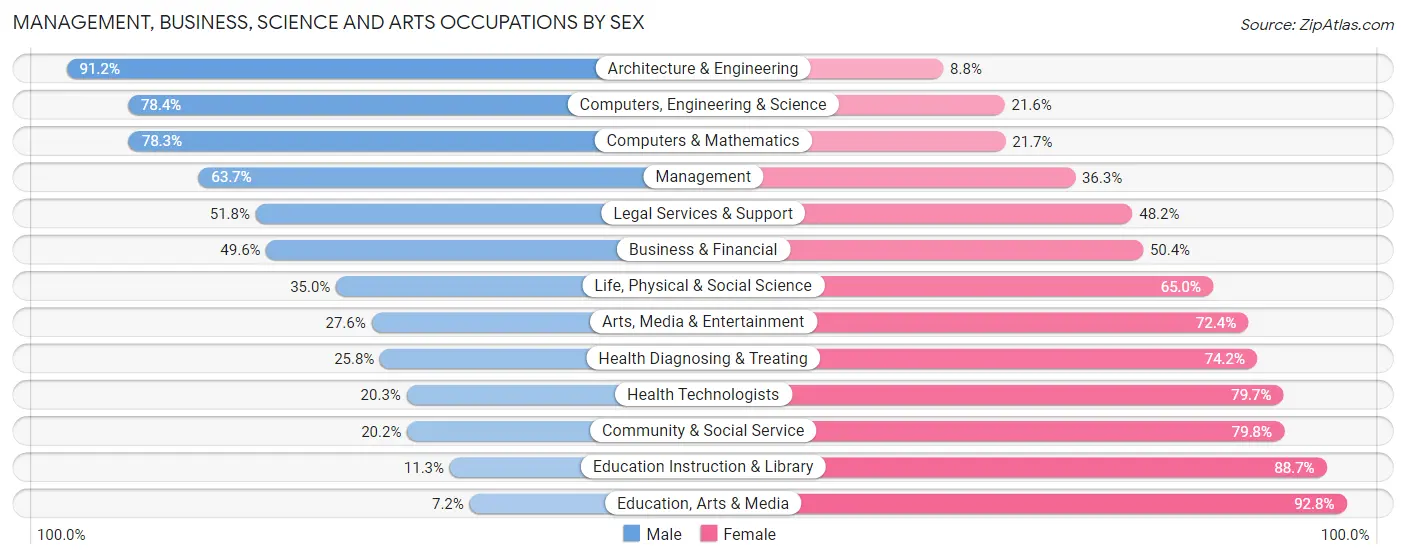
Management, Business, Science and Arts Occupations by Sex
Within the Management, Business, Science and Arts occupations in Westchase, the most male-oriented occupations are Architecture & Engineering (91.2%), Computers, Engineering & Science (78.4%), and Computers & Mathematics (78.3%), while the most female-oriented occupations are Education, Arts & Media (92.8%), Education Instruction & Library (88.7%), and Community & Social Service (79.8%).
| Occupation | Male | Female |
| Management | 1,450 (63.7%) | 825 (36.3%) |
| Business & Financial | 891 (49.6%) | 907 (50.4%) |
| Computers, Engineering & Science | 1,204 (78.4%) | 331 (21.6%) |
| Computers & Mathematics | 846 (78.3%) | 235 (21.7%) |
| Architecture & Engineering | 323 (91.2%) | 31 (8.8%) |
| Life, Physical & Social Science | 35 (35.0%) | 65 (65.0%) |
| Community & Social Service | 273 (20.2%) | 1,080 (79.8%) |
| Education, Arts & Media | 16 (7.2%) | 207 (92.8%) |
| Legal Services & Support | 102 (51.8%) | 95 (48.2%) |
| Education Instruction & Library | 71 (11.3%) | 558 (88.7%) |
| Arts, Media & Entertainment | 84 (27.6%) | 220 (72.4%) |
| Health Diagnosing & Treating | 188 (25.8%) | 540 (74.2%) |
| Health Technologists | 121 (20.3%) | 475 (79.7%) |
| Total (Category) | 4,006 (52.1%) | 3,683 (47.9%) |
| Total (Overall) | 6,943 (52.9%) | 6,179 (47.1%) |
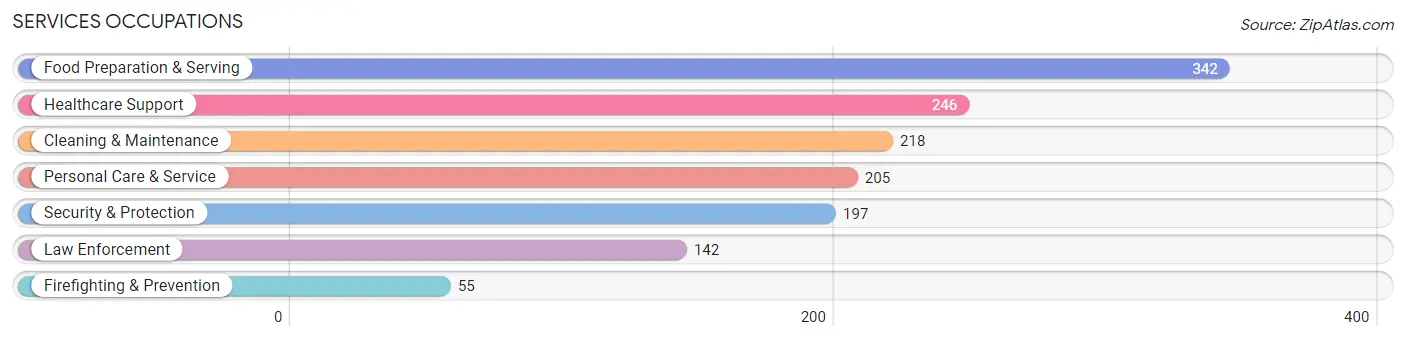
Services Occupations
The most common Services occupations in Westchase are Food Preparation & Serving (342 | 2.6%), Healthcare Support (246 | 1.9%), Cleaning & Maintenance (218 | 1.7%), Personal Care & Service (205 | 1.6%), and Security & Protection (197 | 1.5%).
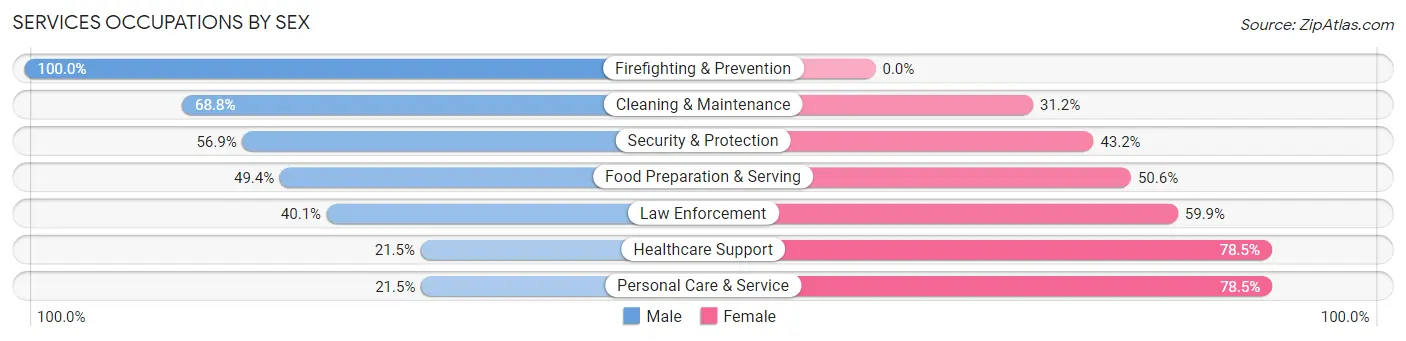
Services Occupations by Sex
Within the Services occupations in Westchase, the most male-oriented occupations are Firefighting & Prevention (100.0%), Cleaning & Maintenance (68.8%), and Security & Protection (56.9%), while the most female-oriented occupations are Personal Care & Service (78.5%), Healthcare Support (78.5%), and Law Enforcement (59.9%).
| Occupation | Male | Female |
| Healthcare Support | 53 (21.5%) | 193 (78.5%) |
| Security & Protection | 112 (56.9%) | 85 (43.1%) |
| Firefighting & Prevention | 55 (100.0%) | 0 (0.0%) |
| Law Enforcement | 57 (40.1%) | 85 (59.9%) |
| Food Preparation & Serving | 169 (49.4%) | 173 (50.6%) |
| Cleaning & Maintenance | 150 (68.8%) | 68 (31.2%) |
| Personal Care & Service | 44 (21.5%) | 161 (78.5%) |
| Total (Category) | 528 (43.7%) | 680 (56.3%) |
| Total (Overall) | 6,943 (52.9%) | 6,179 (47.1%) |
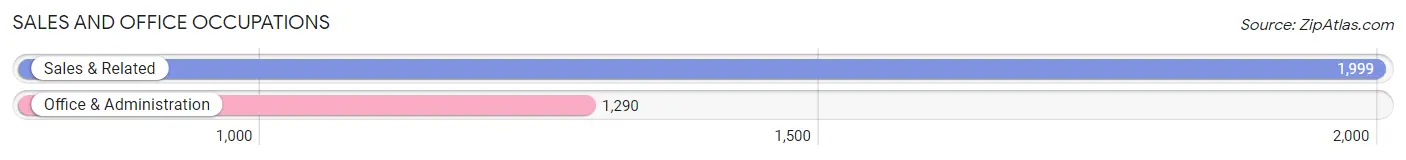
Sales and Office Occupations
The most common Sales and Office occupations in Westchase are Sales & Related (1,999 | 15.2%), and Office & Administration (1,290 | 9.8%).
Sales and Office Occupations by Sex
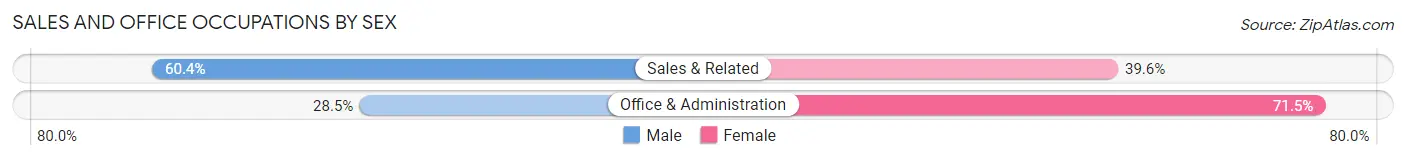
| Occupation | Male | Female |
| Sales & Related | 1,207 (60.4%) | 792 (39.6%) |
| Office & Administration | 368 (28.5%) | 922 (71.5%) |
| Total (Category) | 1,575 (47.9%) | 1,714 (52.1%) |
| Total (Overall) | 6,943 (52.9%) | 6,179 (47.1%) |
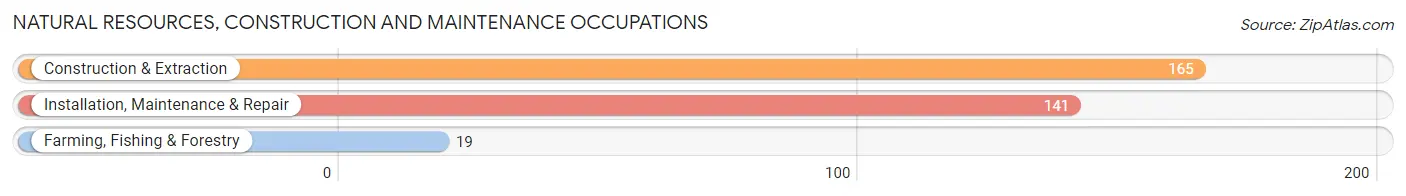
Natural Resources, Construction and Maintenance Occupations
The most common Natural Resources, Construction and Maintenance occupations in Westchase are Construction & Extraction (165 | 1.3%), Installation, Maintenance & Repair (141 | 1.1%), and Farming, Fishing & Forestry (19 | 0.1%).
Natural Resources, Construction and Maintenance Occupations by Sex
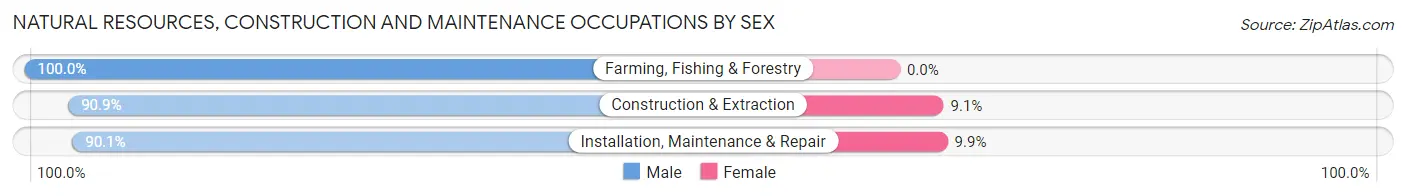
| Occupation | Male | Female |
| Farming, Fishing & Forestry | 19 (100.0%) | 0 (0.0%) |
| Construction & Extraction | 150 (90.9%) | 15 (9.1%) |
| Installation, Maintenance & Repair | 127 (90.1%) | 14 (9.9%) |
| Total (Category) | 296 (91.1%) | 29 (8.9%) |
| Total (Overall) | 6,943 (52.9%) | 6,179 (47.1%) |
Production, Transportation and Moving Occupations
The most common Production, Transportation and Moving occupations in Westchase are Transportation (333 | 2.5%), Material Moving (148 | 1.1%), and Production (130 | 1.0%).
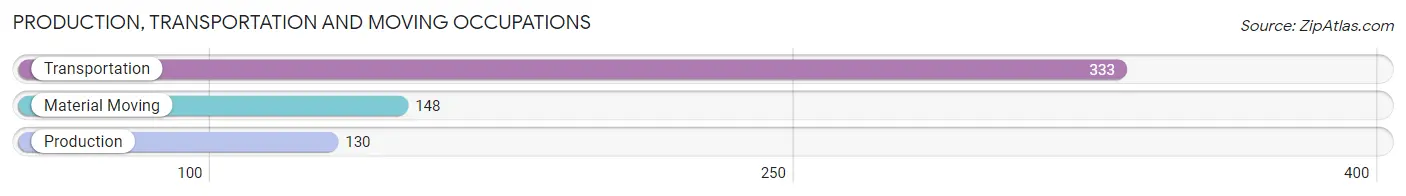
Production, Transportation and Moving Occupations by Sex
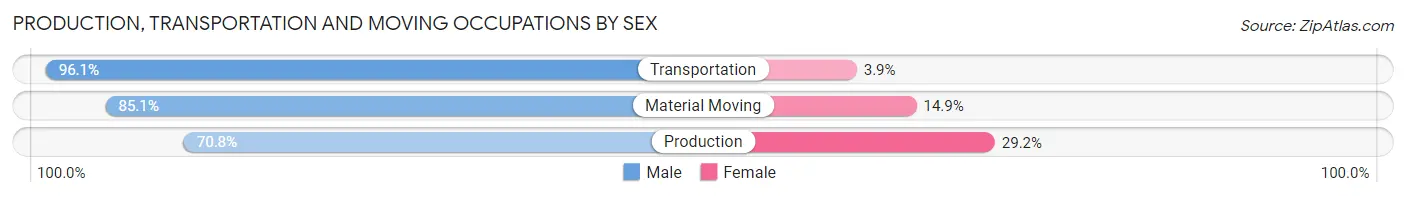
| Occupation | Male | Female |
| Production | 92 (70.8%) | 38 (29.2%) |
| Transportation | 320 (96.1%) | 13 (3.9%) |
| Material Moving | 126 (85.1%) | 22 (14.9%) |
| Total (Category) | 538 (88.0%) | 73 (11.9%) |
| Total (Overall) | 6,943 (52.9%) | 6,179 (47.1%) |
Employment Industries by Sex in Westchase
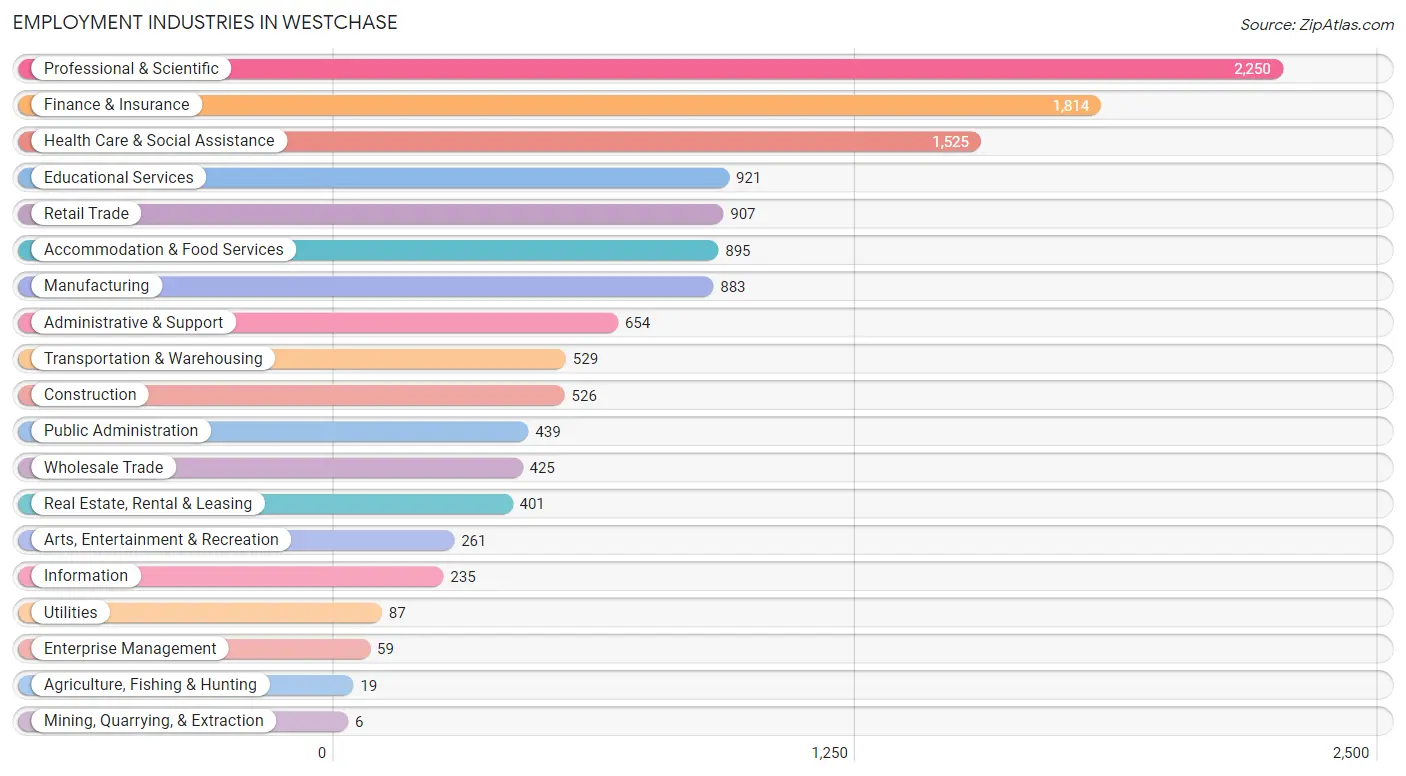
Employment Industries in Westchase
The major employment industries in Westchase include Professional & Scientific (2,250 | 17.2%), Finance & Insurance (1,814 | 13.8%), Health Care & Social Assistance (1,525 | 11.6%), Educational Services (921 | 7.0%), and Retail Trade (907 | 6.9%).
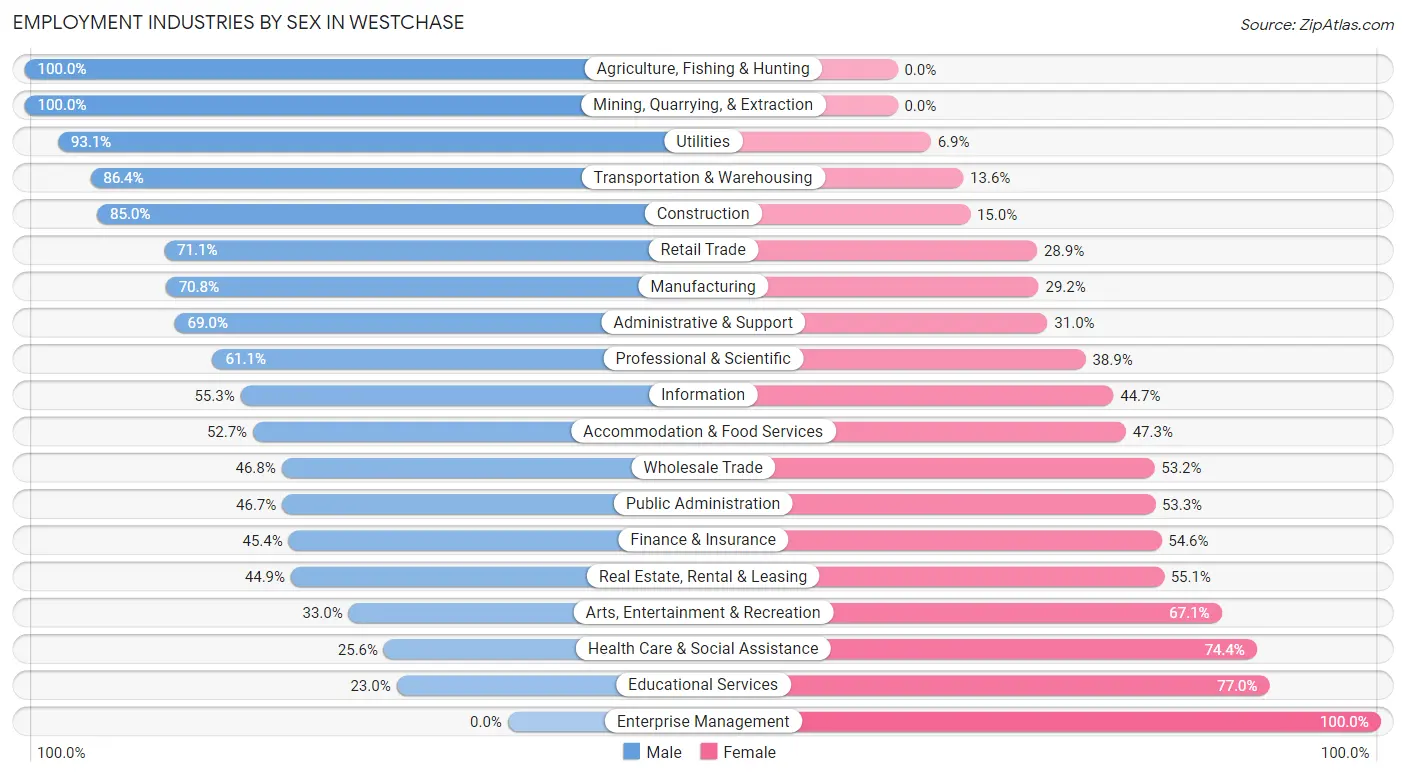
Employment Industries by Sex in Westchase
The Westchase industries that see more men than women are Agriculture, Fishing & Hunting (100.0%), Mining, Quarrying, & Extraction (100.0%), and Utilities (93.1%), whereas the industries that tend to have a higher number of women are Enterprise Management (100.0%), Educational Services (77.0%), and Health Care & Social Assistance (74.4%).
| Industry | Male | Female |
| Agriculture, Fishing & Hunting | 19 (100.0%) | 0 (0.0%) |
| Mining, Quarrying, & Extraction | 6 (100.0%) | 0 (0.0%) |
| Construction | 447 (85.0%) | 79 (15.0%) |
| Manufacturing | 625 (70.8%) | 258 (29.2%) |
| Wholesale Trade | 199 (46.8%) | 226 (53.2%) |
| Retail Trade | 645 (71.1%) | 262 (28.9%) |
| Transportation & Warehousing | 457 (86.4%) | 72 (13.6%) |
| Utilities | 81 (93.1%) | 6 (6.9%) |
| Information | 130 (55.3%) | 105 (44.7%) |
| Finance & Insurance | 823 (45.4%) | 991 (54.6%) |
| Real Estate, Rental & Leasing | 180 (44.9%) | 221 (55.1%) |
| Professional & Scientific | 1,374 (61.1%) | 876 (38.9%) |
| Enterprise Management | 0 (0.0%) | 59 (100.0%) |
| Administrative & Support | 451 (69.0%) | 203 (31.0%) |
| Educational Services | 212 (23.0%) | 709 (77.0%) |
| Health Care & Social Assistance | 391 (25.6%) | 1,134 (74.4%) |
| Arts, Entertainment & Recreation | 86 (33.0%) | 175 (67.0%) |
| Accommodation & Food Services | 472 (52.7%) | 423 (47.3%) |
| Public Administration | 205 (46.7%) | 234 (53.3%) |
| Total | 6,943 (52.9%) | 6,179 (47.1%) |
Education in Westchase
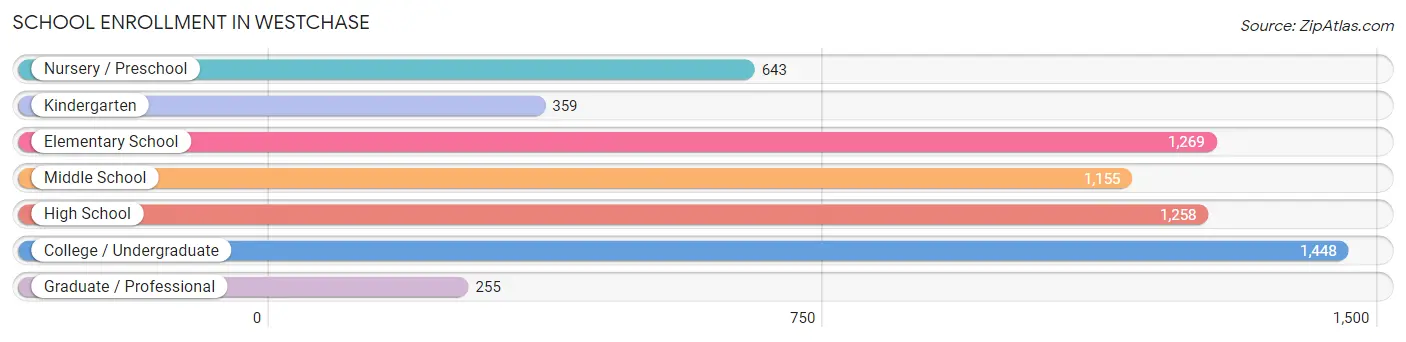
School Enrollment in Westchase
The most common levels of schooling among the 6,387 students in Westchase are college / undergraduate (1,448 | 22.7%), elementary school (1,269 | 19.9%), and high school (1,258 | 19.7%).
| School Level | # Students | % Students |
| Nursery / Preschool | 643 | 10.1% |
| Kindergarten | 359 | 5.6% |
| Elementary School | 1,269 | 19.9% |
| Middle School | 1,155 | 18.1% |
| High School | 1,258 | 19.7% |
| College / Undergraduate | 1,448 | 22.7% |
| Graduate / Professional | 255 | 4.0% |
| Total | 6,387 | 100.0% |
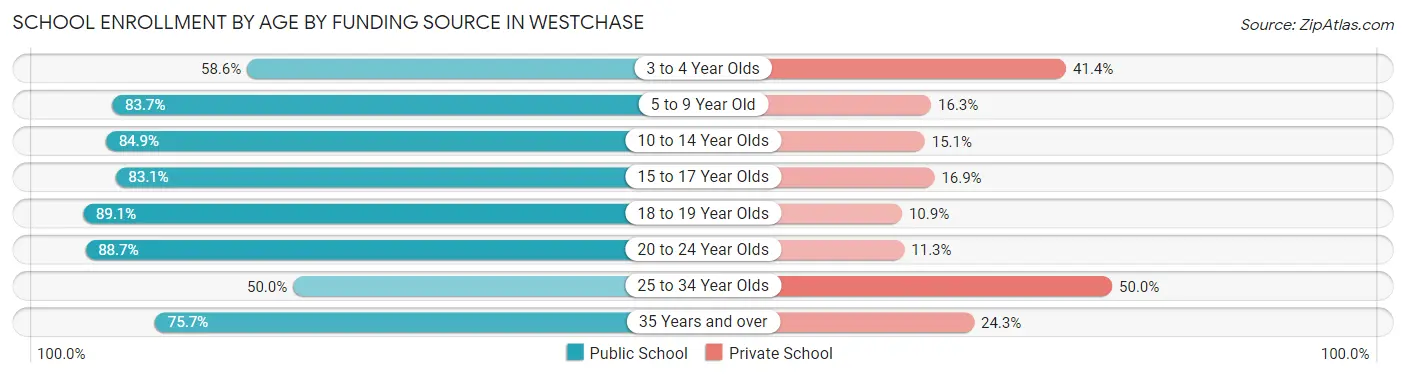
School Enrollment by Age by Funding Source in Westchase
Out of a total of 6,387 students who are enrolled in schools in Westchase, 1,233 (19.3%) attend a private institution, while the remaining 5,154 (80.7%) are enrolled in public schools. The age group of 25 to 34 year olds has the highest likelihood of being enrolled in private schools, with 160 (50.0% in the age bracket) enrolled. Conversely, the age group of 18 to 19 year olds has the lowest likelihood of being enrolled in a private school, with 394 (89.1% in the age bracket) attending a public institution.
| Age Bracket | Public School | Private School |
| 3 to 4 Year Olds | 311 (58.6%) | 220 (41.4%) |
| 5 to 9 Year Old | 1,357 (83.7%) | 264 (16.3%) |
| 10 to 14 Year Olds | 1,225 (84.9%) | 218 (15.1%) |
| 15 to 17 Year Olds | 752 (83.1%) | 153 (16.9%) |
| 18 to 19 Year Olds | 394 (89.1%) | 48 (10.9%) |
| 20 to 24 Year Olds | 691 (88.7%) | 88 (11.3%) |
| 25 to 34 Year Olds | 160 (50.0%) | 160 (50.0%) |
| 35 Years and over | 262 (75.7%) | 84 (24.3%) |
| Total | 5,154 (80.7%) | 1,233 (19.3%) |
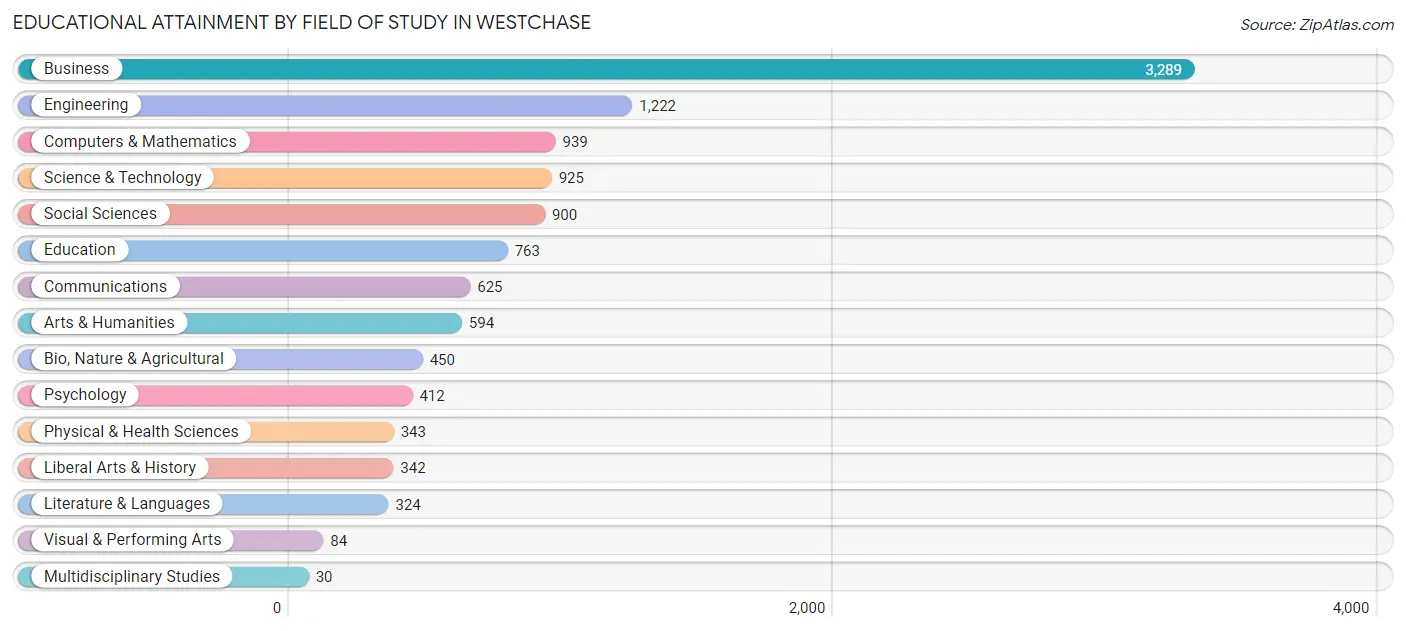
Educational Attainment by Field of Study in Westchase
Business (3,289 | 29.3%), engineering (1,222 | 10.9%), computers & mathematics (939 | 8.4%), science & technology (925 | 8.2%), and social sciences (900 | 8.0%) are the most common fields of study among 11,242 individuals in Westchase who have obtained a bachelor's degree or higher.
| Field of Study | # Graduates | % Graduates |
| Computers & Mathematics | 939 | 8.4% |
| Bio, Nature & Agricultural | 450 | 4.0% |
| Physical & Health Sciences | 343 | 3.0% |
| Psychology | 412 | 3.7% |
| Social Sciences | 900 | 8.0% |
| Engineering | 1,222 | 10.9% |
| Multidisciplinary Studies | 30 | 0.3% |
| Science & Technology | 925 | 8.2% |
| Business | 3,289 | 29.3% |
| Education | 763 | 6.8% |
| Literature & Languages | 324 | 2.9% |
| Liberal Arts & History | 342 | 3.0% |
| Visual & Performing Arts | 84 | 0.7% |
| Communications | 625 | 5.6% |
| Arts & Humanities | 594 | 5.3% |
| Total | 11,242 | 100.0% |
Transportation & Commute in Westchase
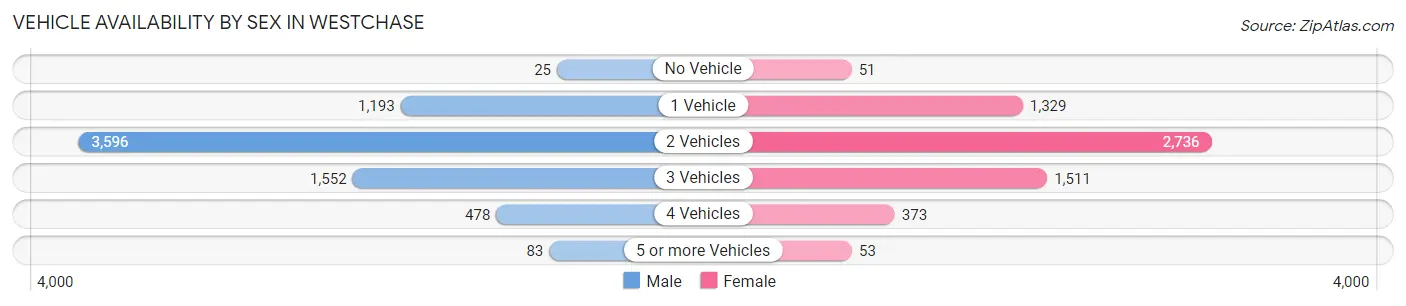
Vehicle Availability by Sex in Westchase
The most prevalent vehicle ownership categories in Westchase are males with 2 vehicles (3,596, accounting for 51.9%) and females with 2 vehicles (2,736, making up 59.4%).
| Vehicles Available | Male | Female |
| No Vehicle | 25 (0.4%) | 51 (0.8%) |
| 1 Vehicle | 1,193 (17.2%) | 1,329 (22.0%) |
| 2 Vehicles | 3,596 (51.9%) | 2,736 (45.2%) |
| 3 Vehicles | 1,552 (22.4%) | 1,511 (25.0%) |
| 4 Vehicles | 478 (6.9%) | 373 (6.2%) |
| 5 or more Vehicles | 83 (1.2%) | 53 (0.9%) |
| Total | 6,927 (100.0%) | 6,053 (100.0%) |
Commute Time in Westchase
The most frequently occuring commute durations in Westchase are 30 to 34 minutes (1,509 commuters, 16.0%), 45 to 59 minutes (1,434 commuters, 15.2%), and 15 to 19 minutes (1,423 commuters, 15.1%).
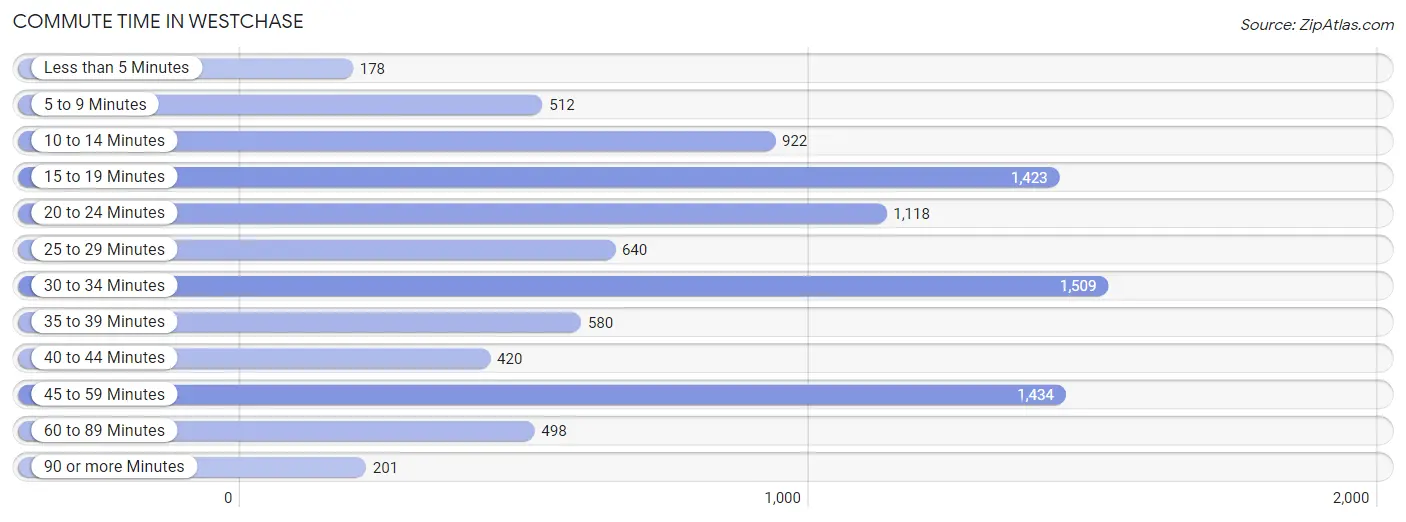
| Commute Time | # Commuters | % Commuters |
| Less than 5 Minutes | 178 | 1.9% |
| 5 to 9 Minutes | 512 | 5.4% |
| 10 to 14 Minutes | 922 | 9.8% |
| 15 to 19 Minutes | 1,423 | 15.1% |
| 20 to 24 Minutes | 1,118 | 11.8% |
| 25 to 29 Minutes | 640 | 6.8% |
| 30 to 34 Minutes | 1,509 | 16.0% |
| 35 to 39 Minutes | 580 | 6.1% |
| 40 to 44 Minutes | 420 | 4.4% |
| 45 to 59 Minutes | 1,434 | 15.2% |
| 60 to 89 Minutes | 498 | 5.3% |
| 90 or more Minutes | 201 | 2.1% |
Commute Time by Sex in Westchase
The most common commute times in Westchase are 30 to 34 minutes (781 commuters, 16.0%) for males and 15 to 19 minutes (728 commuters, 16.0%) for females.
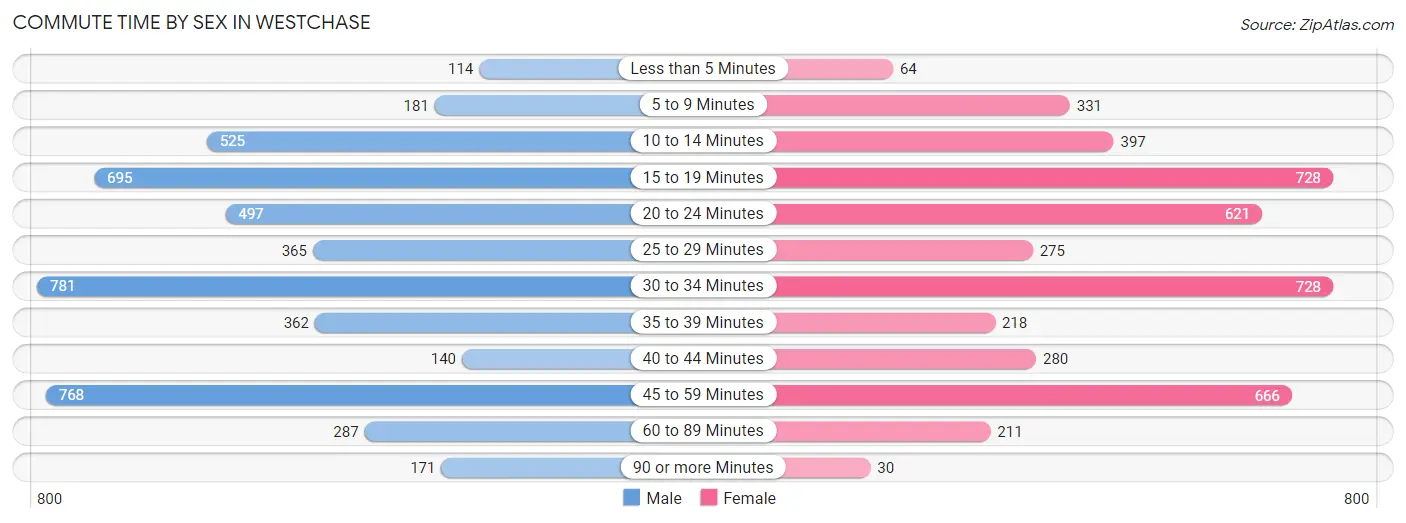
| Commute Time | Male | Female |
| Less than 5 Minutes | 114 (2.3%) | 64 (1.4%) |
| 5 to 9 Minutes | 181 (3.7%) | 331 (7.3%) |
| 10 to 14 Minutes | 525 (10.7%) | 397 (8.7%) |
| 15 to 19 Minutes | 695 (14.2%) | 728 (16.0%) |
| 20 to 24 Minutes | 497 (10.2%) | 621 (13.7%) |
| 25 to 29 Minutes | 365 (7.5%) | 275 (6.0%) |
| 30 to 34 Minutes | 781 (16.0%) | 728 (16.0%) |
| 35 to 39 Minutes | 362 (7.4%) | 218 (4.8%) |
| 40 to 44 Minutes | 140 (2.9%) | 280 (6.2%) |
| 45 to 59 Minutes | 768 (15.7%) | 666 (14.6%) |
| 60 to 89 Minutes | 287 (5.9%) | 211 (4.6%) |
| 90 or more Minutes | 171 (3.5%) | 30 (0.7%) |
Time of Departure to Work by Sex in Westchase
The most frequent times of departure to work in Westchase are 7:00 AM to 7:29 AM (1,305, 26.7%) for males and 8:00 AM to 8:29 AM (982, 21.6%) for females.
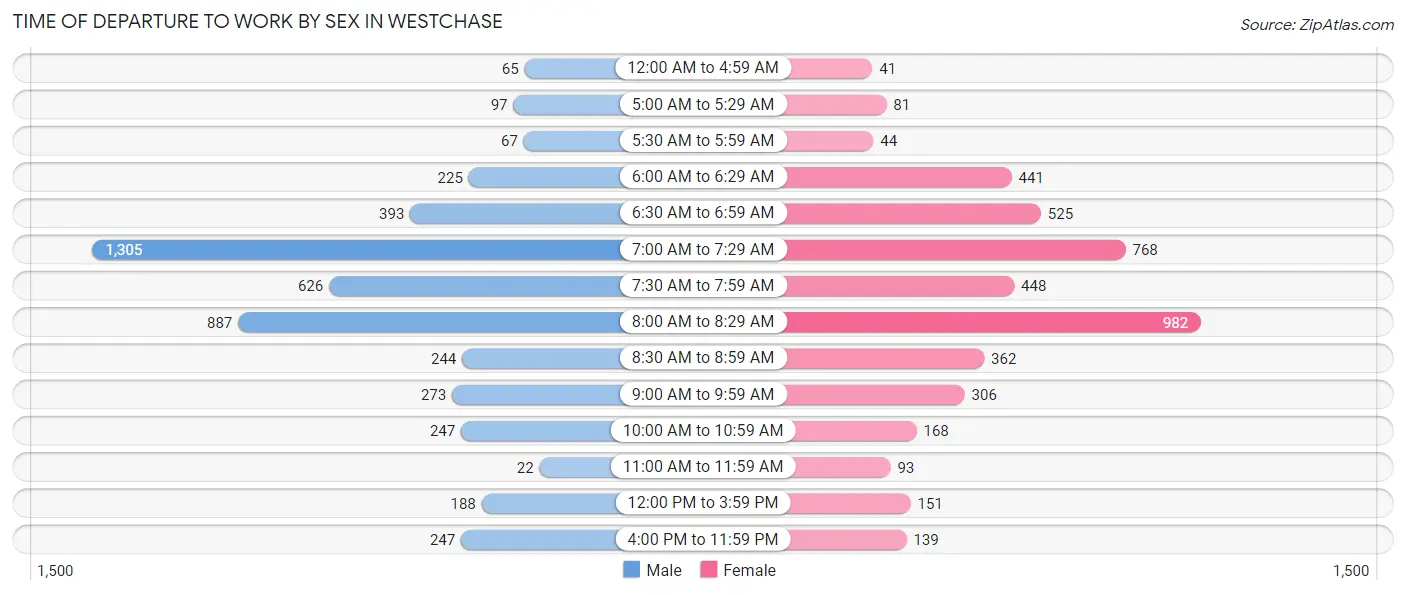
| Time of Departure | Male | Female |
| 12:00 AM to 4:59 AM | 65 (1.3%) | 41 (0.9%) |
| 5:00 AM to 5:29 AM | 97 (2.0%) | 81 (1.8%) |
| 5:30 AM to 5:59 AM | 67 (1.4%) | 44 (1.0%) |
| 6:00 AM to 6:29 AM | 225 (4.6%) | 441 (9.7%) |
| 6:30 AM to 6:59 AM | 393 (8.0%) | 525 (11.5%) |
| 7:00 AM to 7:29 AM | 1,305 (26.7%) | 768 (16.9%) |
| 7:30 AM to 7:59 AM | 626 (12.8%) | 448 (9.9%) |
| 8:00 AM to 8:29 AM | 887 (18.1%) | 982 (21.6%) |
| 8:30 AM to 8:59 AM | 244 (5.0%) | 362 (8.0%) |
| 9:00 AM to 9:59 AM | 273 (5.6%) | 306 (6.7%) |
| 10:00 AM to 10:59 AM | 247 (5.1%) | 168 (3.7%) |
| 11:00 AM to 11:59 AM | 22 (0.4%) | 93 (2.0%) |
| 12:00 PM to 3:59 PM | 188 (3.8%) | 151 (3.3%) |
| 4:00 PM to 11:59 PM | 247 (5.1%) | 139 (3.1%) |
| Total | 4,886 (100.0%) | 4,549 (100.0%) |
Housing Occupancy in Westchase
Occupancy by Ownership in Westchase
Of the total 9,809 dwellings in Westchase, owner-occupied units account for 6,204 (63.2%), while renter-occupied units make up 3,605 (36.7%).
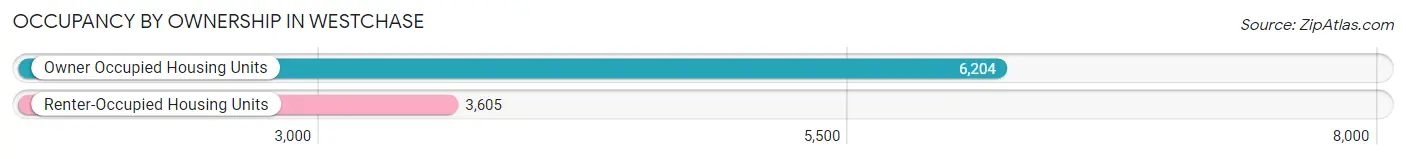
| Occupancy | # Housing Units | % Housing Units |
| Owner Occupied Housing Units | 6,204 | 63.2% |
| Renter-Occupied Housing Units | 3,605 | 36.7% |
| Total Occupied Housing Units | 9,809 | 100.0% |
Occupancy by Household Size in Westchase
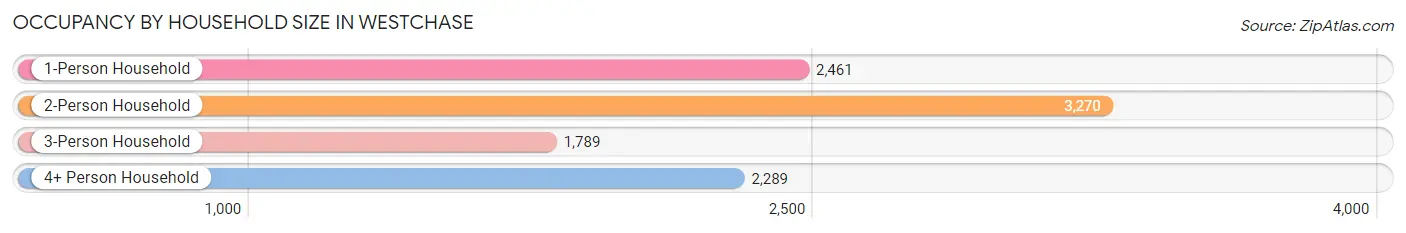
| Household Size | # Housing Units | % Housing Units |
| 1-Person Household | 2,461 | 25.1% |
| 2-Person Household | 3,270 | 33.3% |
| 3-Person Household | 1,789 | 18.2% |
| 4+ Person Household | 2,289 | 23.3% |
| Total Housing Units | 9,809 | 100.0% |
Occupancy by Ownership by Household Size in Westchase
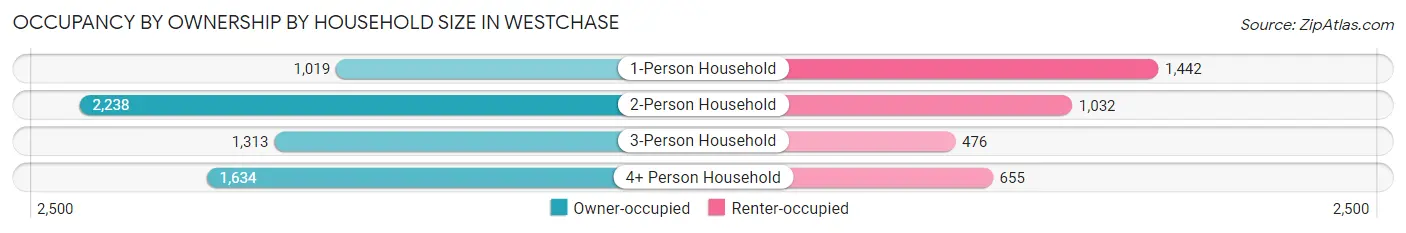
| Household Size | Owner-occupied | Renter-occupied |
| 1-Person Household | 1,019 (41.4%) | 1,442 (58.6%) |
| 2-Person Household | 2,238 (68.4%) | 1,032 (31.6%) |
| 3-Person Household | 1,313 (73.4%) | 476 (26.6%) |
| 4+ Person Household | 1,634 (71.4%) | 655 (28.6%) |
| Total Housing Units | 6,204 (63.2%) | 3,605 (36.7%) |
Occupancy by Educational Attainment in Westchase
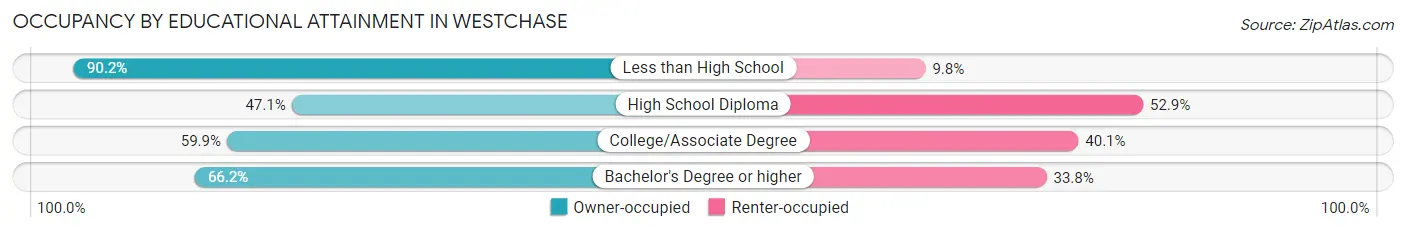
| Household Size | Owner-occupied | Renter-occupied |
| Less than High School | 203 (90.2%) | 22 (9.8%) |
| High School Diploma | 517 (47.1%) | 581 (52.9%) |
| College/Associate Degree | 1,285 (59.9%) | 860 (40.1%) |
| Bachelor's Degree or higher | 4,199 (66.2%) | 2,142 (33.8%) |
Occupancy by Age of Householder in Westchase
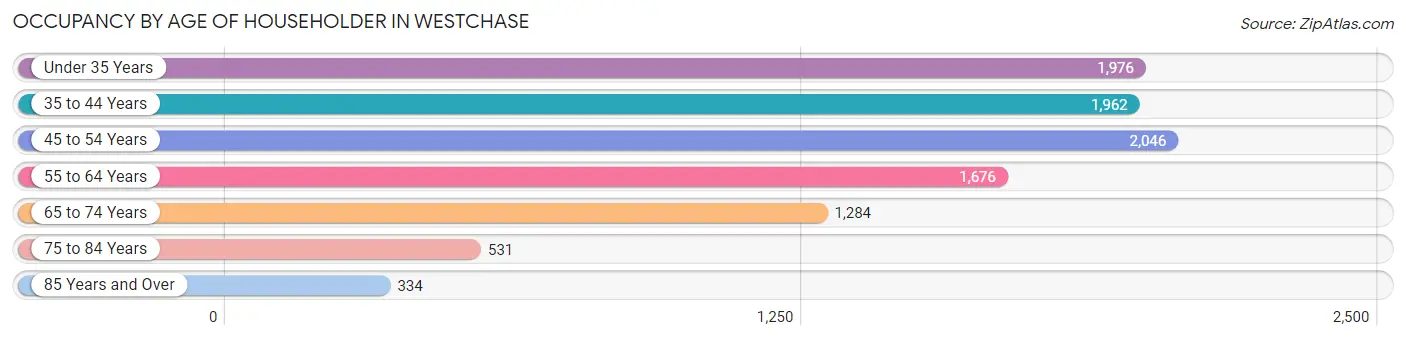
| Age Bracket | # Households | % Households |
| Under 35 Years | 1,976 | 20.1% |
| 35 to 44 Years | 1,962 | 20.0% |
| 45 to 54 Years | 2,046 | 20.9% |
| 55 to 64 Years | 1,676 | 17.1% |
| 65 to 74 Years | 1,284 | 13.1% |
| 75 to 84 Years | 531 | 5.4% |
| 85 Years and Over | 334 | 3.4% |
| Total | 9,809 | 100.0% |
Housing Finances in Westchase
Median Income by Occupancy in Westchase
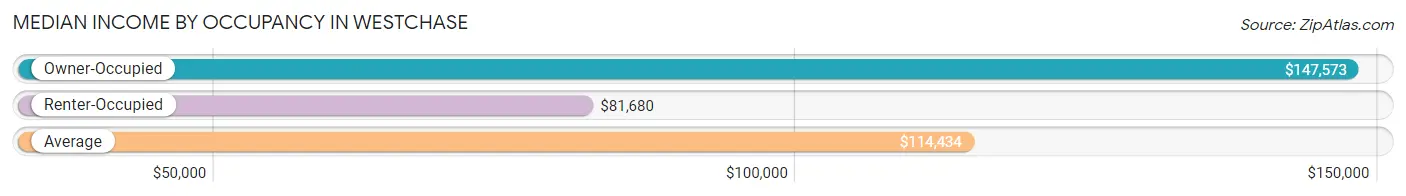
| Occupancy Type | # Households | Median Income |
| Owner-Occupied | 6,204 (63.2%) | $147,573 |
| Renter-Occupied | 3,605 (36.7%) | $81,680 |
| Average | 9,809 (100.0%) | $114,434 |
Occupancy by Householder Income Bracket in Westchase
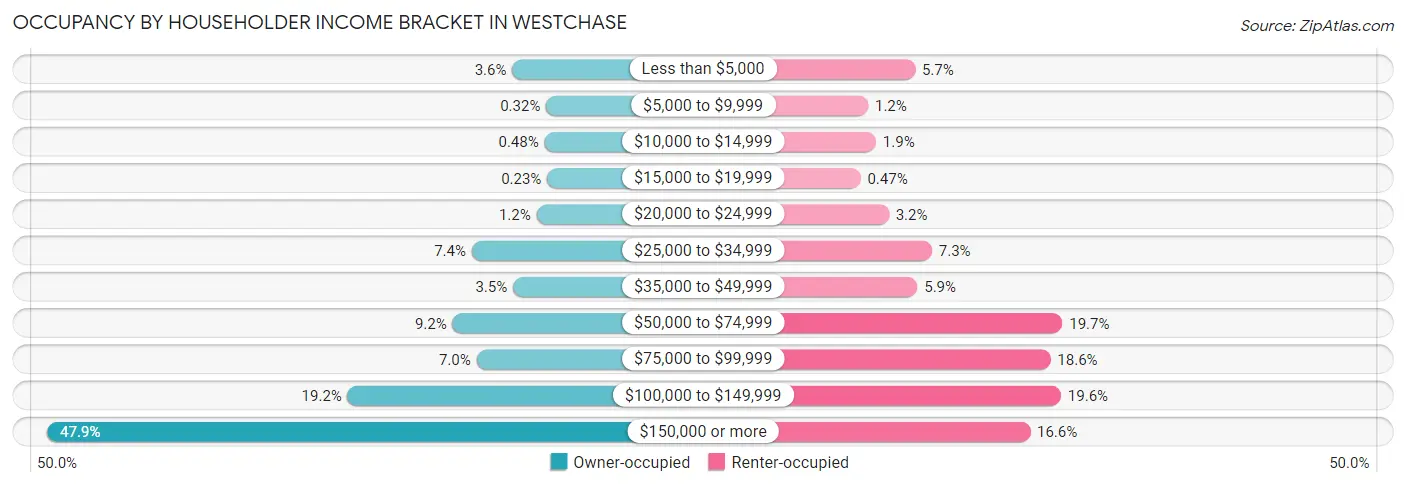
| Income Bracket | Owner-occupied | Renter-occupied |
| Less than $5,000 | 220 (3.5%) | 204 (5.7%) |
| $5,000 to $9,999 | 20 (0.3%) | 43 (1.2%) |
| $10,000 to $14,999 | 30 (0.5%) | 70 (1.9%) |
| $15,000 to $19,999 | 14 (0.2%) | 17 (0.5%) |
| $20,000 to $24,999 | 77 (1.2%) | 114 (3.2%) |
| $25,000 to $34,999 | 460 (7.4%) | 262 (7.3%) |
| $35,000 to $49,999 | 216 (3.5%) | 212 (5.9%) |
| $50,000 to $74,999 | 573 (9.2%) | 710 (19.7%) |
| $75,000 to $99,999 | 432 (7.0%) | 669 (18.6%) |
| $100,000 to $149,999 | 1,193 (19.2%) | 705 (19.6%) |
| $150,000 or more | 2,969 (47.9%) | 599 (16.6%) |
| Total | 6,204 (100.0%) | 3,605 (100.0%) |
Monthly Housing Cost Tiers in Westchase
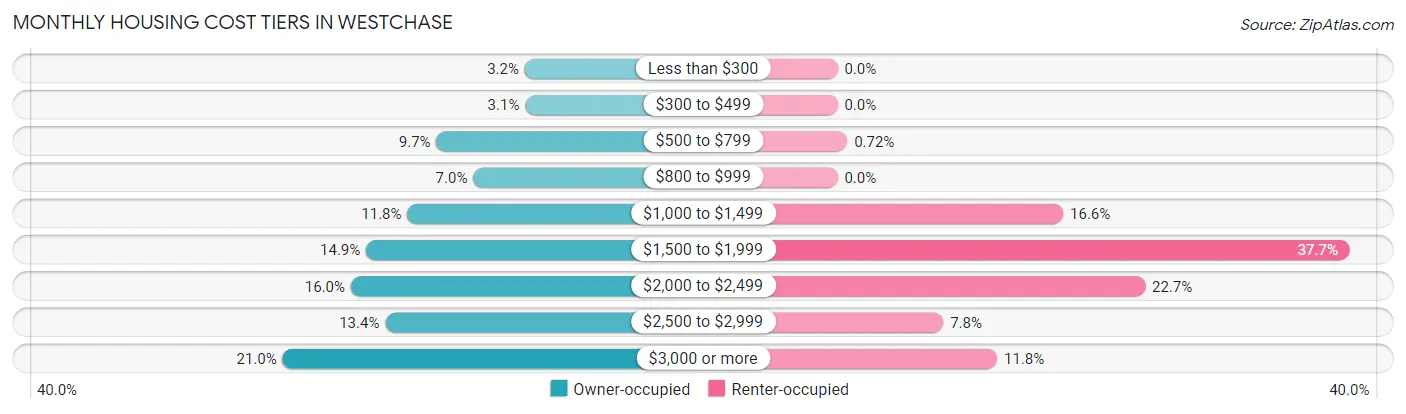
| Monthly Cost | Owner-occupied | Renter-occupied |
| Less than $300 | 196 (3.2%) | 0 (0.0%) |
| $300 to $499 | 194 (3.1%) | 0 (0.0%) |
| $500 to $799 | 600 (9.7%) | 26 (0.7%) |
| $800 to $999 | 432 (7.0%) | 0 (0.0%) |
| $1,000 to $1,499 | 733 (11.8%) | 599 (16.6%) |
| $1,500 to $1,999 | 921 (14.8%) | 1,360 (37.7%) |
| $2,000 to $2,499 | 991 (16.0%) | 817 (22.7%) |
| $2,500 to $2,999 | 834 (13.4%) | 281 (7.8%) |
| $3,000 or more | 1,303 (21.0%) | 424 (11.8%) |
| Total | 6,204 (100.0%) | 3,605 (100.0%) |
Physical Housing Characteristics in Westchase
Housing Structures in Westchase
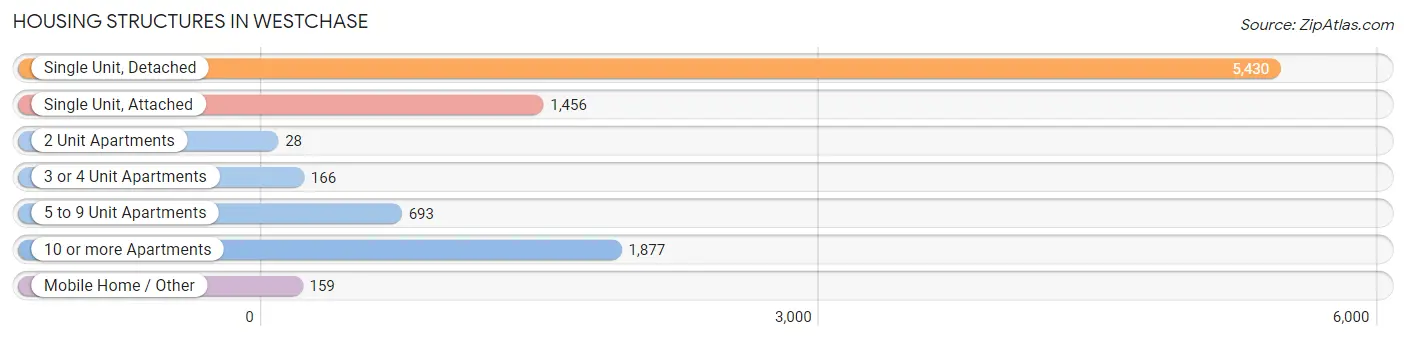
| Structure Type | # Housing Units | % Housing Units |
| Single Unit, Detached | 5,430 | 55.4% |
| Single Unit, Attached | 1,456 | 14.8% |
| 2 Unit Apartments | 28 | 0.3% |
| 3 or 4 Unit Apartments | 166 | 1.7% |
| 5 to 9 Unit Apartments | 693 | 7.1% |
| 10 or more Apartments | 1,877 | 19.1% |
| Mobile Home / Other | 159 | 1.6% |
| Total | 9,809 | 100.0% |
Housing Structures by Occupancy in Westchase
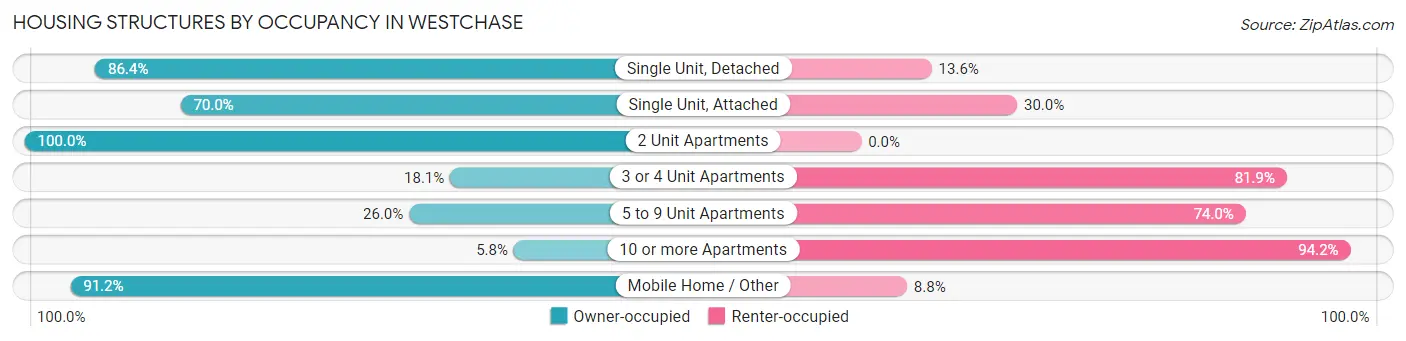
| Structure Type | Owner-occupied | Renter-occupied |
| Single Unit, Detached | 4,693 (86.4%) | 737 (13.6%) |
| Single Unit, Attached | 1,019 (70.0%) | 437 (30.0%) |
| 2 Unit Apartments | 28 (100.0%) | 0 (0.0%) |
| 3 or 4 Unit Apartments | 30 (18.1%) | 136 (81.9%) |
| 5 to 9 Unit Apartments | 180 (26.0%) | 513 (74.0%) |
| 10 or more Apartments | 109 (5.8%) | 1,768 (94.2%) |
| Mobile Home / Other | 145 (91.2%) | 14 (8.8%) |
| Total | 6,204 (63.2%) | 3,605 (36.7%) |
Housing Structures by Number of Rooms in Westchase
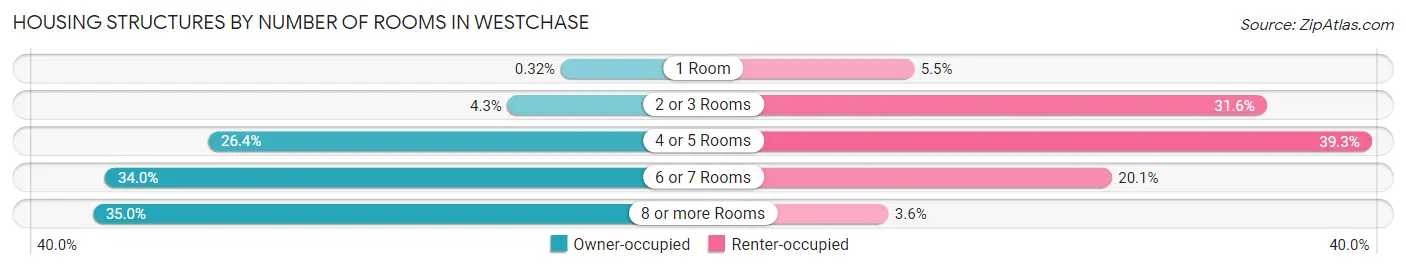
| Number of Rooms | Owner-occupied | Renter-occupied |
| 1 Room | 20 (0.3%) | 197 (5.5%) |
| 2 or 3 Rooms | 264 (4.3%) | 1,138 (31.6%) |
| 4 or 5 Rooms | 1,639 (26.4%) | 1,418 (39.3%) |
| 6 or 7 Rooms | 2,112 (34.0%) | 724 (20.1%) |
| 8 or more Rooms | 2,169 (35.0%) | 128 (3.5%) |
| Total | 6,204 (100.0%) | 3,605 (100.0%) |
Housing Structure by Heating Type in Westchase
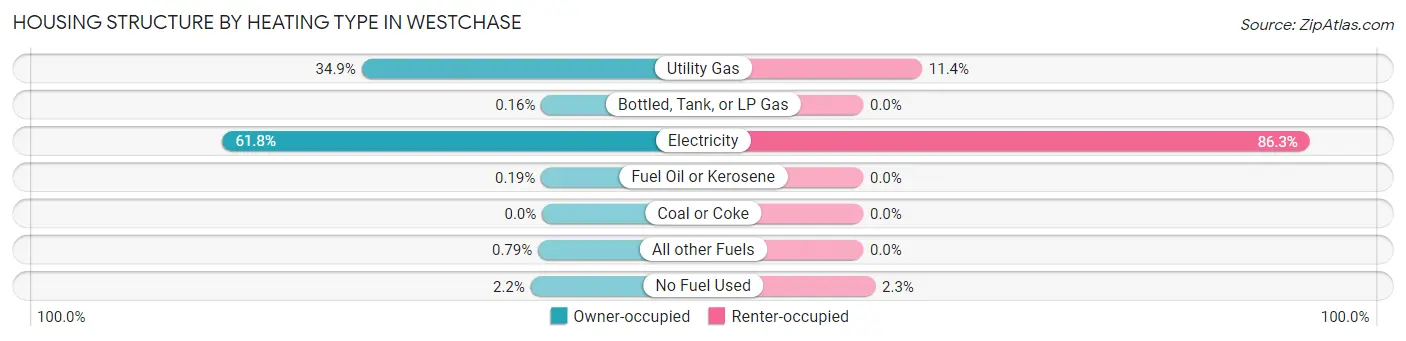
| Heating Type | Owner-occupied | Renter-occupied |
| Utility Gas | 2,164 (34.9%) | 410 (11.4%) |
| Bottled, Tank, or LP Gas | 10 (0.2%) | 0 (0.0%) |
| Electricity | 3,831 (61.8%) | 3,111 (86.3%) |
| Fuel Oil or Kerosene | 12 (0.2%) | 0 (0.0%) |
| Coal or Coke | 0 (0.0%) | 0 (0.0%) |
| All other Fuels | 49 (0.8%) | 0 (0.0%) |
| No Fuel Used | 138 (2.2%) | 84 (2.3%) |
| Total | 6,204 (100.0%) | 3,605 (100.0%) |
Household Vehicle Usage in Westchase
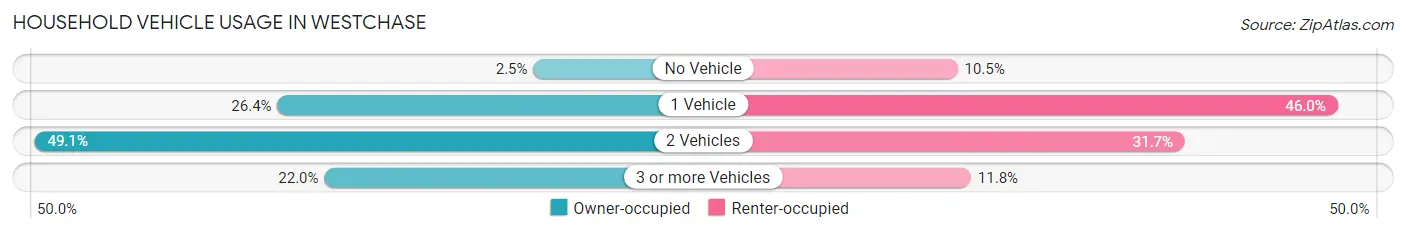
| Vehicles per Household | Owner-occupied | Renter-occupied |
| No Vehicle | 156 (2.5%) | 379 (10.5%) |
| 1 Vehicle | 1,638 (26.4%) | 1,658 (46.0%) |
| 2 Vehicles | 3,044 (49.1%) | 1,144 (31.7%) |
| 3 or more Vehicles | 1,366 (22.0%) | 424 (11.8%) |
| Total | 6,204 (100.0%) | 3,605 (100.0%) |
Real Estate & Mortgages in Westchase
Real Estate and Mortgage Overview in Westchase
| Characteristic | Without Mortgage | With Mortgage |
| Housing Units | 1,730 | 4,474 |
| Median Property Value | $400,000 | $456,300 |
| Median Household Income | $92,273 | $2,349 |
| Monthly Housing Costs | $783 | $1,297 |
| Real Estate Taxes | $4,050 | $15 |
Property Value by Mortgage Status in Westchase
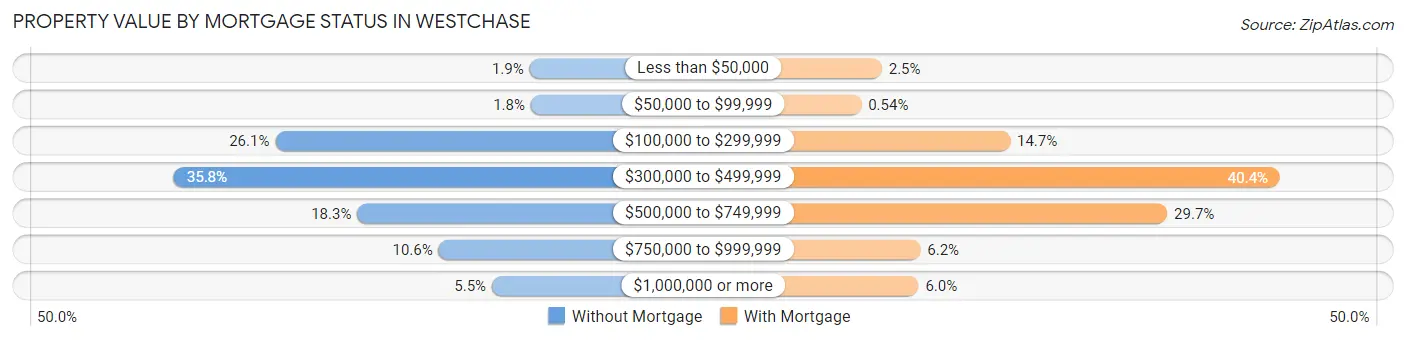
| Property Value | Without Mortgage | With Mortgage |
| Less than $50,000 | 33 (1.9%) | 112 (2.5%) |
| $50,000 to $99,999 | 31 (1.8%) | 24 (0.5%) |
| $100,000 to $299,999 | 452 (26.1%) | 658 (14.7%) |
| $300,000 to $499,999 | 619 (35.8%) | 1,808 (40.4%) |
| $500,000 to $749,999 | 317 (18.3%) | 1,328 (29.7%) |
| $750,000 to $999,999 | 183 (10.6%) | 276 (6.2%) |
| $1,000,000 or more | 95 (5.5%) | 268 (6.0%) |
| Total | 1,730 (100.0%) | 4,474 (100.0%) |
Household Income by Mortgage Status in Westchase
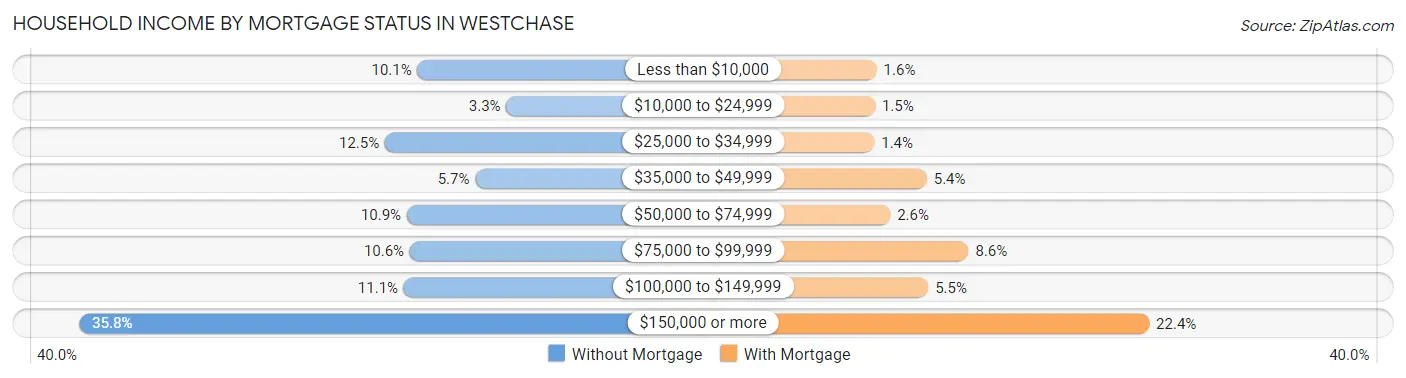
| Household Income | Without Mortgage | With Mortgage |
| Less than $10,000 | 174 (10.1%) | 72 (1.6%) |
| $10,000 to $24,999 | 57 (3.3%) | 66 (1.5%) |
| $25,000 to $34,999 | 217 (12.5%) | 64 (1.4%) |
| $35,000 to $49,999 | 98 (5.7%) | 243 (5.4%) |
| $50,000 to $74,999 | 188 (10.9%) | 118 (2.6%) |
| $75,000 to $99,999 | 184 (10.6%) | 385 (8.6%) |
| $100,000 to $149,999 | 192 (11.1%) | 248 (5.5%) |
| $150,000 or more | 620 (35.8%) | 1,001 (22.4%) |
| Total | 1,730 (100.0%) | 4,474 (100.0%) |
Property Value to Household Income Ratio in Westchase
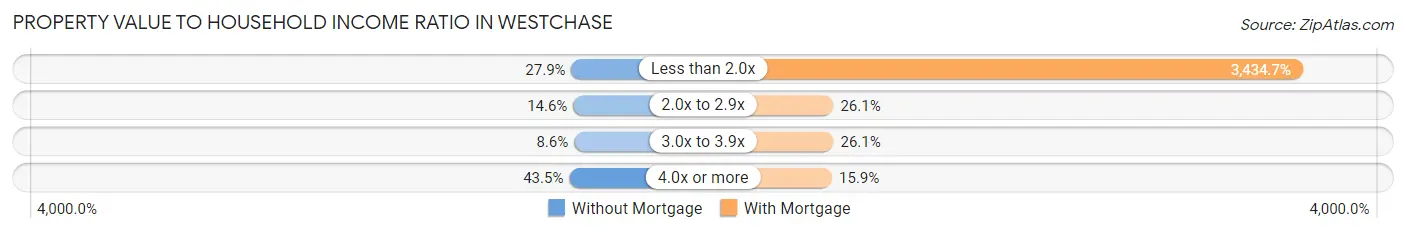
| Value-to-Income Ratio | Without Mortgage | With Mortgage |
| Less than 2.0x | 483 (27.9%) | 153,670 (3,434.7%) |
| 2.0x to 2.9x | 253 (14.6%) | 1,166 (26.1%) |
| 3.0x to 3.9x | 148 (8.6%) | 1,169 (26.1%) |
| 4.0x or more | 752 (43.5%) | 713 (15.9%) |
| Total | 1,730 (100.0%) | 4,474 (100.0%) |
Real Estate Taxes by Mortgage Status in Westchase
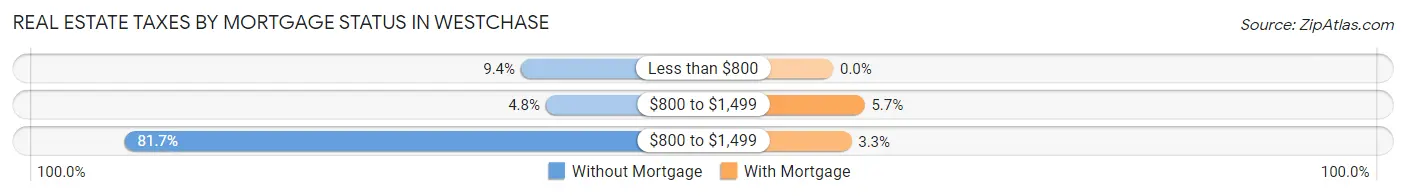
| Property Taxes | Without Mortgage | With Mortgage |
| Less than $800 | 162 (9.4%) | 0 (0.0%) |
| $800 to $1,499 | 83 (4.8%) | 257 (5.7%) |
| $800 to $1,499 | 1,414 (81.7%) | 149 (3.3%) |
| Total | 1,730 (100.0%) | 4,474 (100.0%) |
Health & Disability in Westchase
Health Insurance Coverage by Age in Westchase
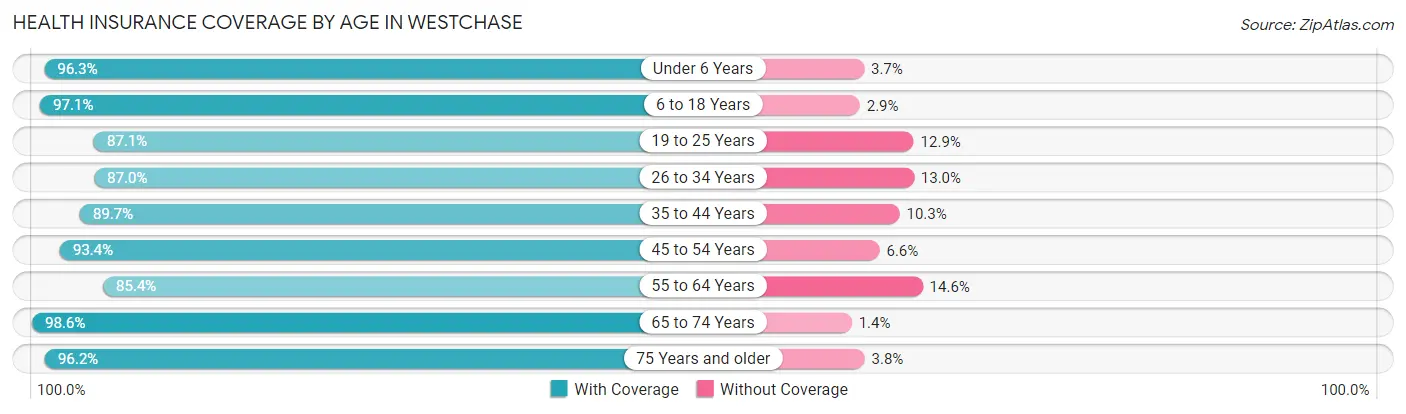
| Age Bracket | With Coverage | Without Coverage |
| Under 6 Years | 1,885 (96.3%) | 72 (3.7%) |
| 6 to 18 Years | 3,801 (97.1%) | 113 (2.9%) |
| 19 to 25 Years | 1,683 (87.1%) | 250 (12.9%) |
| 26 to 34 Years | 2,939 (87.0%) | 438 (13.0%) |
| 35 to 44 Years | 3,349 (89.7%) | 385 (10.3%) |
| 45 to 54 Years | 3,497 (93.4%) | 246 (6.6%) |
| 55 to 64 Years | 2,479 (85.4%) | 424 (14.6%) |
| 65 to 74 Years | 1,909 (98.6%) | 27 (1.4%) |
| 75 Years and older | 1,296 (96.2%) | 51 (3.8%) |
| Total | 22,838 (91.9%) | 2,006 (8.1%) |
Health Insurance Coverage by Citizenship Status in Westchase
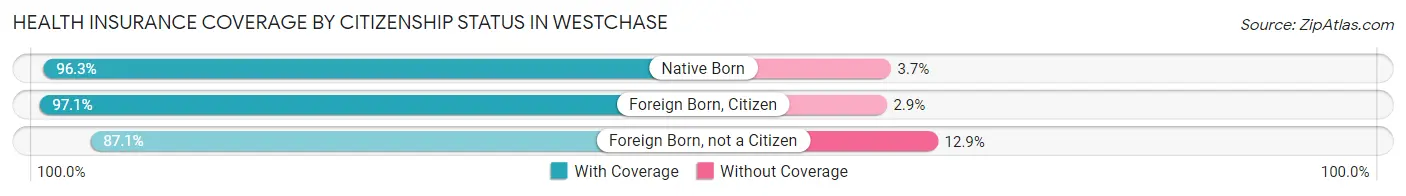
| Citizenship Status | With Coverage | Without Coverage |
| Native Born | 1,885 (96.3%) | 72 (3.7%) |
| Foreign Born, Citizen | 3,801 (97.1%) | 113 (2.9%) |
| Foreign Born, not a Citizen | 1,683 (87.1%) | 250 (12.9%) |
Health Insurance Coverage by Household Income in Westchase
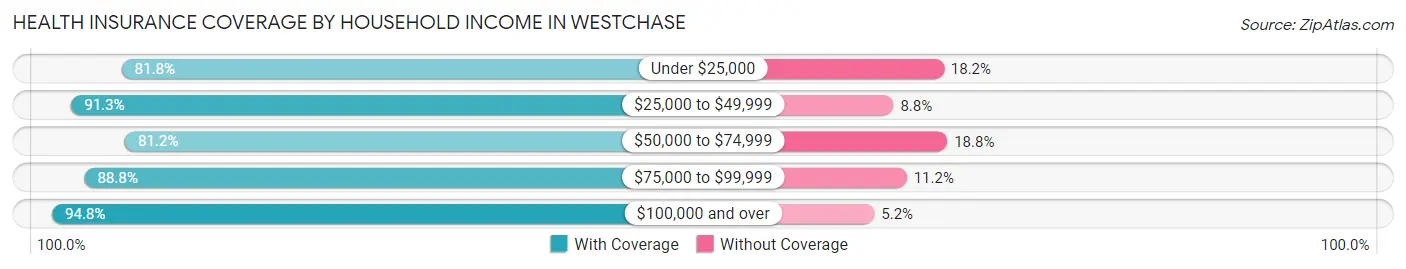
| Household Income | With Coverage | Without Coverage |
| Under $25,000 | 958 (81.8%) | 213 (18.2%) |
| $25,000 to $49,999 | 1,824 (91.2%) | 175 (8.7%) |
| $50,000 to $74,999 | 2,066 (81.2%) | 479 (18.8%) |
| $75,000 to $99,999 | 2,221 (88.8%) | 281 (11.2%) |
| $100,000 and over | 15,769 (94.8%) | 858 (5.2%) |
Public vs Private Health Insurance Coverage by Age in Westchase
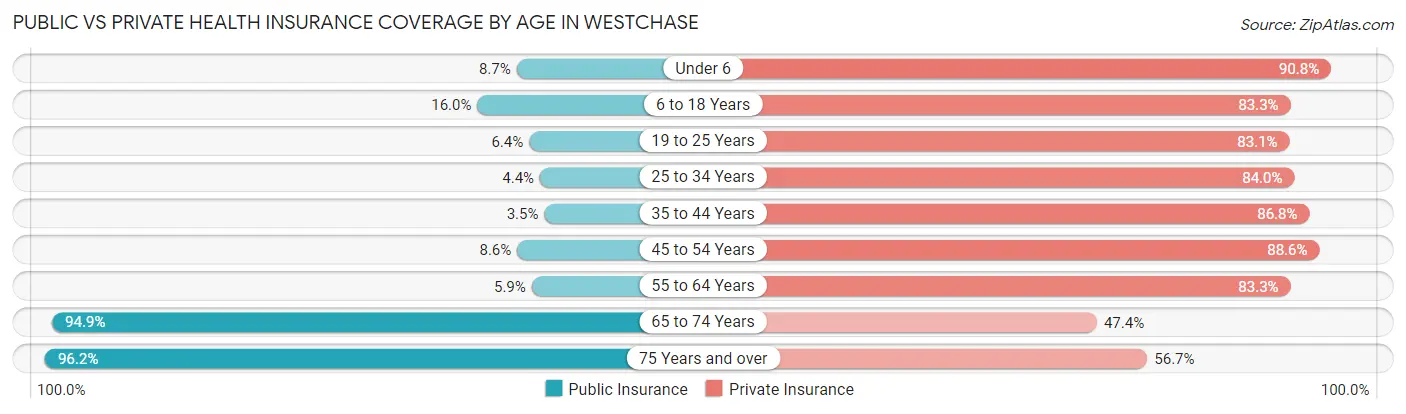
| Age Bracket | Public Insurance | Private Insurance |
| Under 6 | 170 (8.7%) | 1,777 (90.8%) |
| 6 to 18 Years | 625 (16.0%) | 3,259 (83.3%) |
| 19 to 25 Years | 123 (6.4%) | 1,606 (83.1%) |
| 25 to 34 Years | 147 (4.3%) | 2,836 (84.0%) |
| 35 to 44 Years | 132 (3.5%) | 3,240 (86.8%) |
| 45 to 54 Years | 321 (8.6%) | 3,317 (88.6%) |
| 55 to 64 Years | 171 (5.9%) | 2,417 (83.3%) |
| 65 to 74 Years | 1,837 (94.9%) | 917 (47.4%) |
| 75 Years and over | 1,296 (96.2%) | 764 (56.7%) |
| Total | 4,822 (19.4%) | 20,133 (81.0%) |
Disability Status by Sex by Age in Westchase
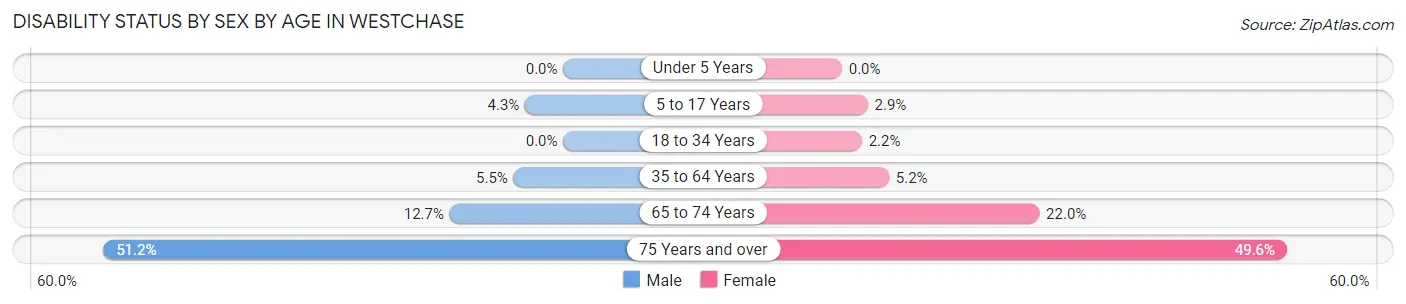
| Age Bracket | Male | Female |
| Under 5 Years | 0 (0.0%) | 0 (0.0%) |
| 5 to 17 Years | 97 (4.3%) | 50 (2.9%) |
| 18 to 34 Years | 0 (0.0%) | 64 (2.2%) |
| 35 to 64 Years | 273 (5.5%) | 285 (5.2%) |
| 65 to 74 Years | 135 (12.7%) | 191 (22.0%) |
| 75 Years and over | 227 (51.2%) | 448 (49.6%) |
Disability Class by Sex by Age in Westchase
Disability Class: Hearing Difficulty
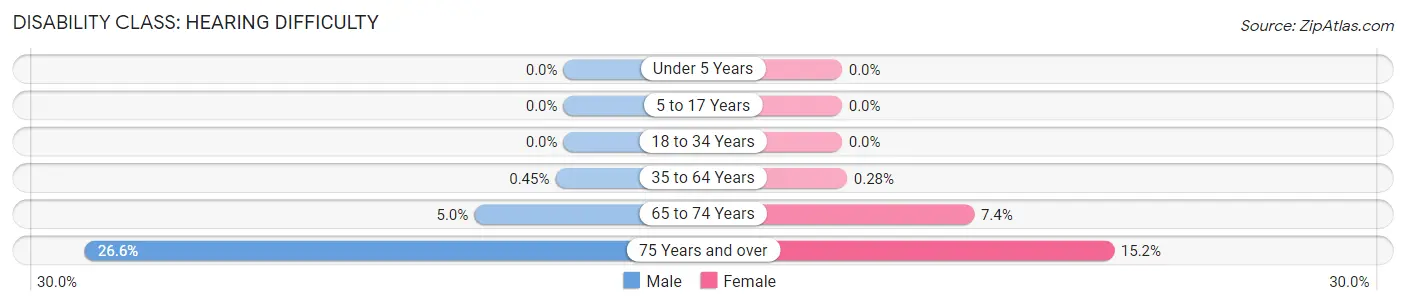
| Age Bracket | Male | Female |
| Under 5 Years | 0 (0.0%) | 0 (0.0%) |
| 5 to 17 Years | 0 (0.0%) | 0 (0.0%) |
| 18 to 34 Years | 0 (0.0%) | 0 (0.0%) |
| 35 to 64 Years | 22 (0.4%) | 15 (0.3%) |
| 65 to 74 Years | 53 (5.0%) | 64 (7.4%) |
| 75 Years and over | 118 (26.6%) | 137 (15.1%) |
Disability Class: Vision Difficulty
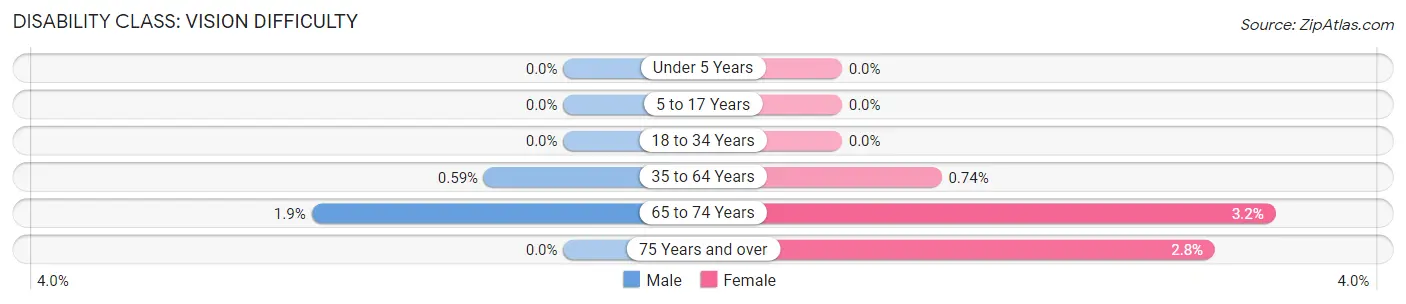
| Age Bracket | Male | Female |
| Under 5 Years | 0 (0.0%) | 0 (0.0%) |
| 5 to 17 Years | 0 (0.0%) | 0 (0.0%) |
| 18 to 34 Years | 0 (0.0%) | 0 (0.0%) |
| 35 to 64 Years | 29 (0.6%) | 40 (0.7%) |
| 65 to 74 Years | 20 (1.9%) | 28 (3.2%) |
| 75 Years and over | 0 (0.0%) | 25 (2.8%) |
Disability Class: Cognitive Difficulty
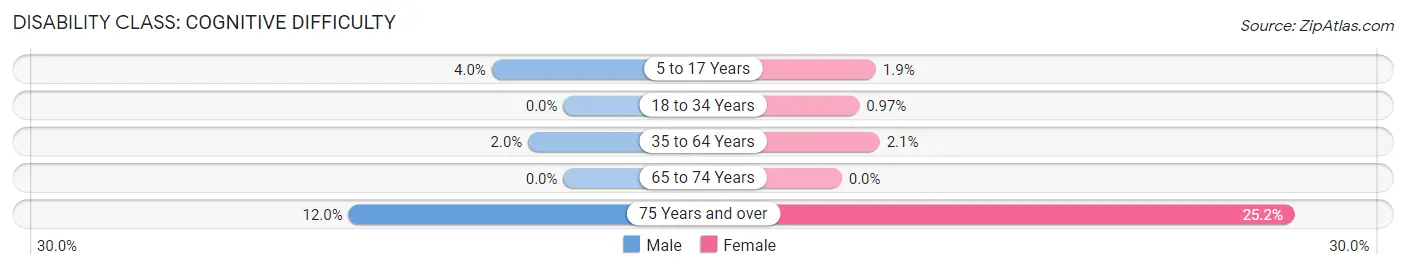
| Age Bracket | Male | Female |
| 5 to 17 Years | 91 (4.0%) | 33 (1.9%) |
| 18 to 34 Years | 0 (0.0%) | 28 (1.0%) |
| 35 to 64 Years | 97 (2.0%) | 115 (2.1%) |
| 65 to 74 Years | 0 (0.0%) | 0 (0.0%) |
| 75 Years and over | 53 (12.0%) | 228 (25.2%) |
Disability Class: Ambulatory Difficulty
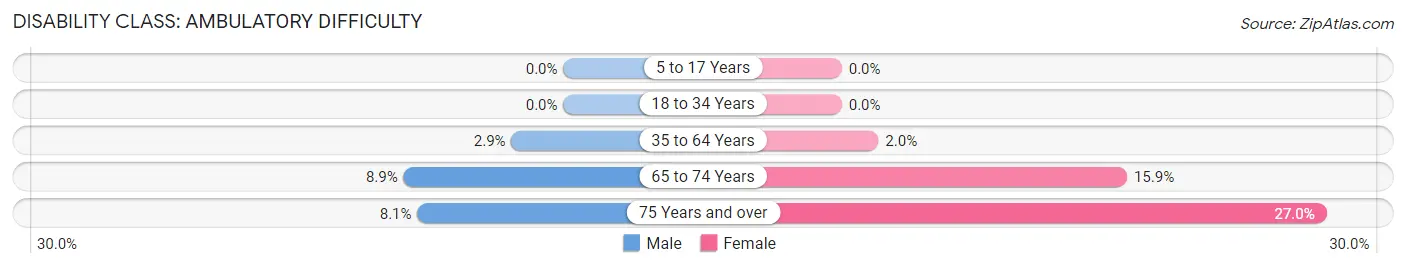
| Age Bracket | Male | Female |
| 5 to 17 Years | 0 (0.0%) | 0 (0.0%) |
| 18 to 34 Years | 0 (0.0%) | 0 (0.0%) |
| 35 to 64 Years | 143 (2.9%) | 111 (2.0%) |
| 65 to 74 Years | 95 (8.9%) | 138 (15.9%) |
| 75 Years and over | 36 (8.1%) | 244 (27.0%) |
Disability Class: Self-Care Difficulty
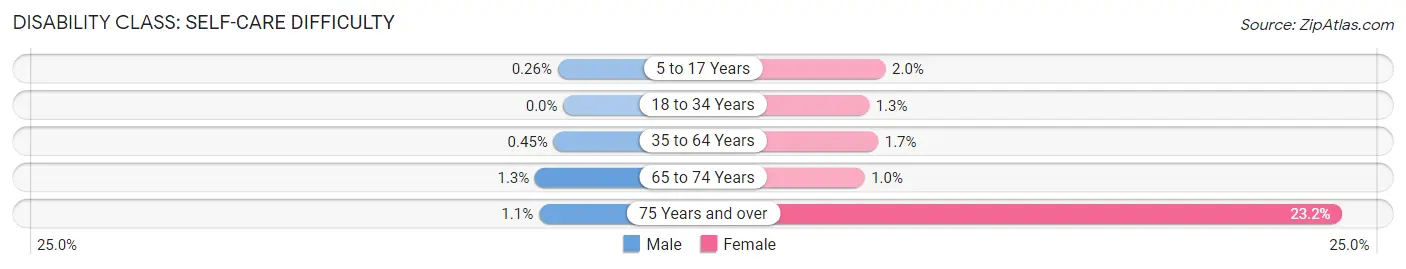
| Age Bracket | Male | Female |
| 5 to 17 Years | 6 (0.3%) | 35 (2.0%) |
| 18 to 34 Years | 0 (0.0%) | 36 (1.3%) |
| 35 to 64 Years | 22 (0.4%) | 91 (1.7%) |
| 65 to 74 Years | 14 (1.3%) | 9 (1.0%) |
| 75 Years and over | 5 (1.1%) | 210 (23.2%) |
Technology Access in Westchase
Computing Device Access in Westchase
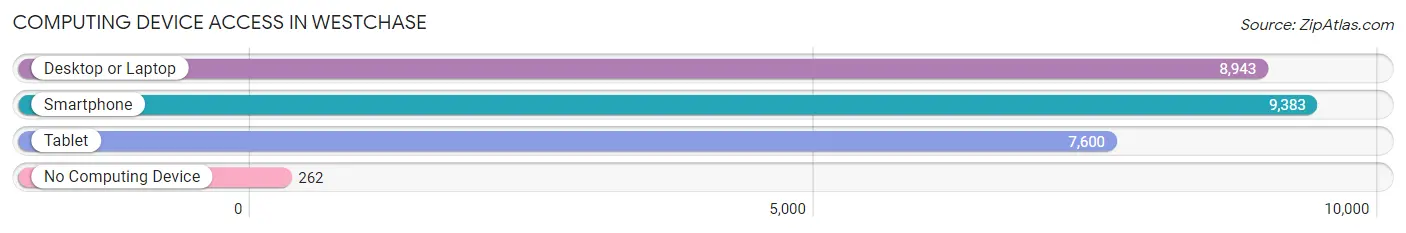
| Device Type | # Households | % Households |
| Desktop or Laptop | 8,943 | 91.2% |
| Smartphone | 9,383 | 95.7% |
| Tablet | 7,600 | 77.5% |
| No Computing Device | 262 | 2.7% |
| Total | 9,809 | 100.0% |
Internet Access in Westchase
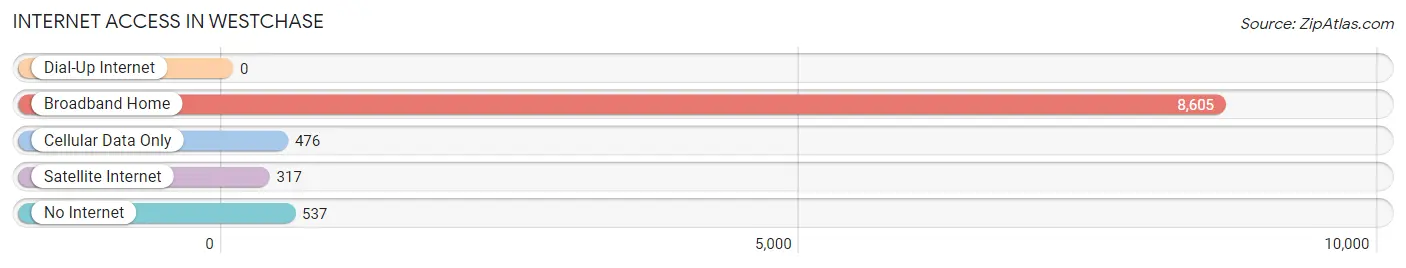
| Internet Type | # Households | % Households |
| Dial-Up Internet | 0 | 0.0% |
| Broadband Home | 8,605 | 87.7% |
| Cellular Data Only | 476 | 4.9% |
| Satellite Internet | 317 | 3.2% |
| No Internet | 537 | 5.5% |
| Total | 9,809 | 100.0% |
Westchase Summary
Westchase is a census-designated place (CDP) located in Hillsborough County, Florida, United States. It is an unincorporated community located in the northwest corner of the county, just south of Tampa. The population was 24,447 at the 2010 census.
History
Westchase was founded in 1991 by developer John Cheezem. The community was designed to be a master-planned community with a variety of housing options, including single-family homes, townhomes, and condominiums. The community was designed to be a self-contained community with its own shopping, dining, and recreational amenities.
The community was named after the nearby Westchase Golf Club, which was established in the late 1970s. The golf course was designed by golf course architect Ron Garl and is one of the most popular courses in the Tampa Bay area.
Geography
Westchase is located at 28°3'25" North, 82°35'25" West (28.056944, -82.590278). According to the United States Census Bureau, the CDP has a total area of 8.3 square miles (21.5 km2), of which 8.2 square miles (21.3 km2) is land and 0.1 square miles (0.2 km2) (1.17%) is water.
Economy
Westchase is home to a variety of businesses, including retail stores, restaurants, and professional services. The community is also home to several corporate offices, including the headquarters of Raymond James Financial, Inc. and the regional offices of several national companies.
Demographics
As of the census of 2000, there were 24,447 people, 9,945 households, and 6,945 families residing in the CDP. The population density was 2,945.3 people per square mile (1,137.2/km2). There were 10,541 housing units at an average density of 1,272.3/sq mi (491.2/km2). The racial makeup of the CDP was 87.2% White, 4.2% African American, 0.2% Native American, 4.7% Asian, 0.1% Pacific Islander, 1.7% from other races, and 2.1% from two or more races. Hispanic or Latino of any race were 6.7% of the population.
There were 9,945 households, out of which 33.2% had children under the age of 18 living with them, 59.2% were married couples living together, 8.2% had a female householder with no husband present, and 29.2% were non-families. 22.7% of all households were made up of individuals, and 4.2% had someone living alone who was 65 years of age or older. The average household size was 2.45 and the average family size was 2.90.
In the CDP, the population was spread out, with 24.2% under the age of 18, 5.7% from 18 to 24, 33.2% from 25 to 44, 26.2% from 45 to 64, and 10.7% who were 65 years of age or older. The median age was 38 years. For every 100 females, there were 94.2 males. For every 100 females age 18 and over, there were 91.2 males.
The median income for a household in the CDP was $68,945, and the median income for a family was $76,945. Males had a median income of $50,945 versus $35,945 for females. The per capita income for the CDP was $32,945. About 2.2% of families and 3.2% of the population were below the poverty line, including 3.2% of those under age 18 and 4.2% of those age 65 or over.
Common Questions
What is Per Capita Income in Westchase?
Per Capita income in Westchase is $59,363.
What is the Median Family Income in Westchase?
Median Family Income in Westchase is $134,970.
What is the Median Household income in Westchase?
Median Household Income in Westchase is $114,434.
What is Income or Wage Gap in Westchase?
Income or Wage Gap in Westchase is 32.6%.
Women in Westchase earn 67.4 cents for every dollar earned by a man.
What is Family Income Deficit in Westchase?
Family Income Deficit in Westchase is $10,679.
Families that are below poverty line in Westchase earn $10,679 less on average than the poverty threshold level.
What is Inequality or Gini Index in Westchase?
Inequality or Gini Index in Westchase is 0.45.
What is the Total Population of Westchase?
Total Population of Westchase is 24,891.
What is the Total Male Population of Westchase?
Total Male Population of Westchase is 12,365.
What is the Total Female Population of Westchase?
Total Female Population of Westchase is 12,526.
What is the Ratio of Males per 100 Females in Westchase?
There are 98.71 Males per 100 Females in Westchase.
What is the Ratio of Females per 100 Males in Westchase?
There are 101.30 Females per 100 Males in Westchase.
What is the Median Population Age in Westchase?
Median Population Age in Westchase is 38.7 Years.
What is the Average Family Size in Westchase
Average Family Size in Westchase is 3.0 People.
What is the Average Household Size in Westchase
Average Household Size in Westchase is 2.5 People.
How Large is the Labor Force in Westchase?
There are 13,511 People in the Labor Forcein in Westchase.
What is the Percentage of People in the Labor Force in Westchase?
67.9% of People are in the Labor Force in Westchase.
What is the Unemployment Rate in Westchase?
Unemployment Rate in Westchase is 2.6%.