Shreveport, LA Map & Demographics
Shreveport Map
Shreveport Overview
$32,291
PER CAPITA INCOME
$63,112
AVG FAMILY INCOME
$45,967
AVG HOUSEHOLD INCOME
30.1%
WAGE / INCOME GAP [ % ]
69.9¢/ $1
WAGE / INCOME GAP [ $ ]
$11,311
FAMILY INCOME DEFICIT
0.54
INEQUALITY / GINI INDEX
186,183
TOTAL POPULATION
87,763
MALE POPULATION
98,420
FEMALE POPULATION
89.17
MALES / 100 FEMALES
112.14
FEMALES / 100 MALES
37.1
MEDIAN AGE
3.3
AVG FAMILY SIZE
2.4
AVG HOUSEHOLD SIZE
84,930
LABOR FORCE [ PEOPLE ]
57.7%
PERCENT IN LABOR FORCE
9.2%
UNEMPLOYMENT RATE
Shreveport Zip Codes
Shreveport Area Codes
Income in Shreveport
Income Overview in Shreveport
Per Capita Income in Shreveport is $32,291, while median incomes of families and households are $63,112 and $45,967 respectively.
| Characteristic | Number | Measure |
| Per Capita Income | 186,183 | $32,291 |
| Median Family Income | 42,710 | $63,112 |
| Mean Family Income | 42,710 | $94,710 |
| Median Household Income | 75,184 | $45,967 |
| Mean Household Income | 75,184 | $75,485 |
| Income Deficit | 42,710 | $11,311 |
| Wage / Income Gap (%) | 186,183 | 30.10% |
| Wage / Income Gap ($) | 186,183 | 69.90¢ per $1 |
| Gini / Inequality Index | 186,183 | 0.54 |
Earnings by Sex in Shreveport
Average Earnings in Shreveport are $32,795, $39,677 for men and $27,736 for women, a difference of 30.1%.
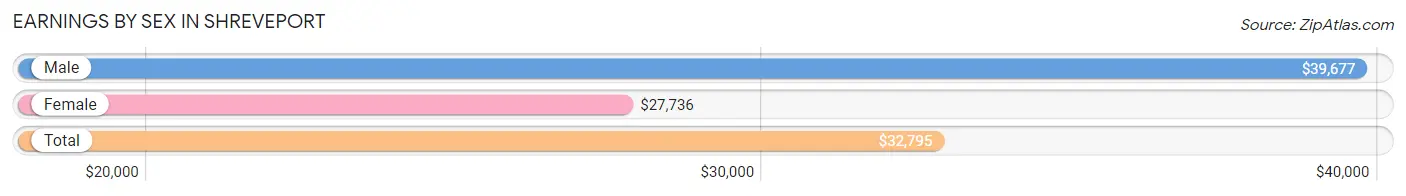
| Sex | Number | Average Earnings |
| Male | 41,975 (48.4%) | $39,677 |
| Female | 44,679 (51.6%) | $27,736 |
| Total | 86,654 (100.0%) | $32,795 |
Earnings by Sex by Income Bracket in Shreveport
The most common earnings brackets in Shreveport are $100,000+ for men (6,399 | 15.2%) and $25,000 to $29,999 for women (4,686 | 10.5%).
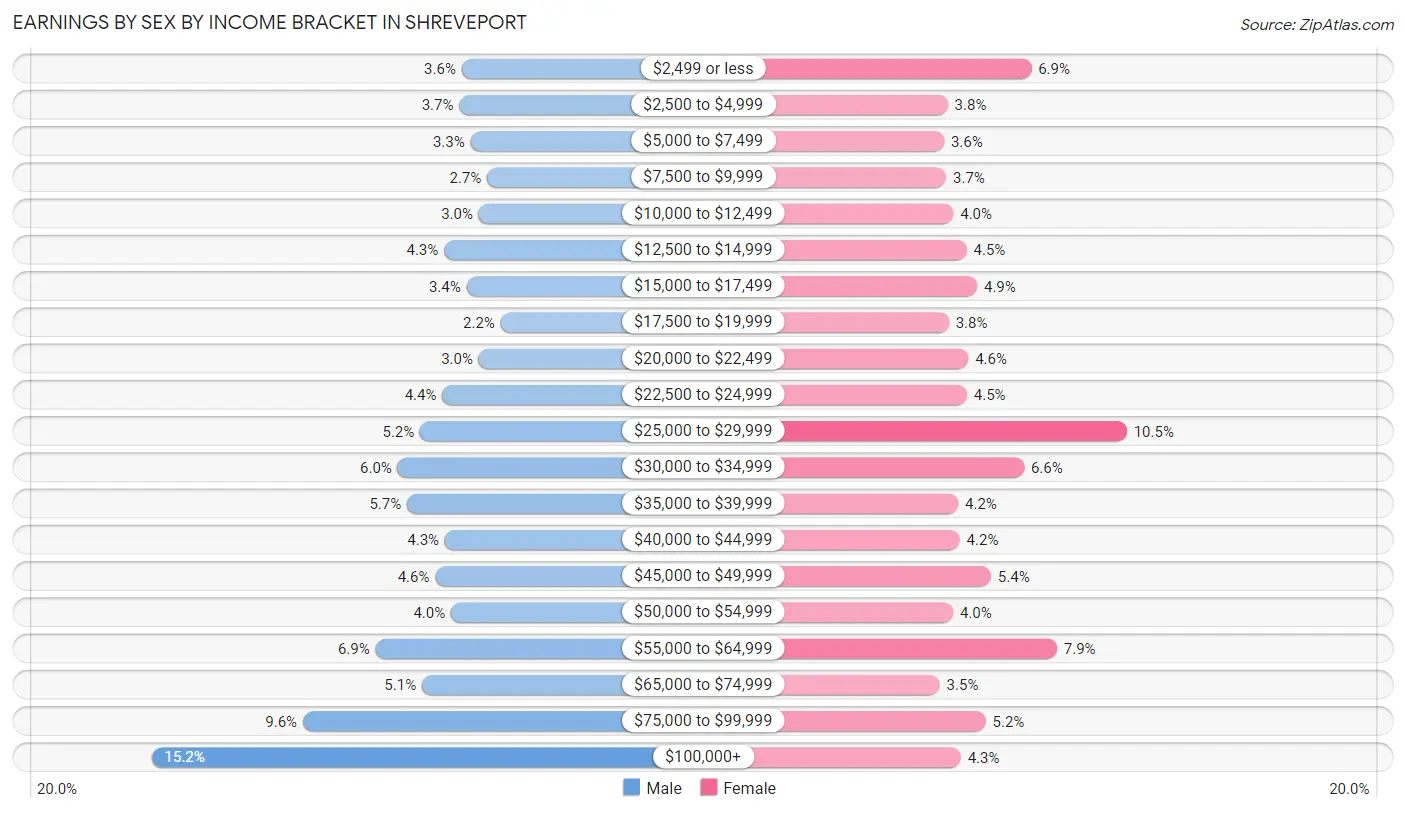
| Income | Male | Female |
| $2,499 or less | 1,520 (3.6%) | 3,089 (6.9%) |
| $2,500 to $4,999 | 1,558 (3.7%) | 1,689 (3.8%) |
| $5,000 to $7,499 | 1,382 (3.3%) | 1,625 (3.6%) |
| $7,500 to $9,999 | 1,119 (2.7%) | 1,660 (3.7%) |
| $10,000 to $12,499 | 1,251 (3.0%) | 1,782 (4.0%) |
| $12,500 to $14,999 | 1,795 (4.3%) | 2,006 (4.5%) |
| $15,000 to $17,499 | 1,445 (3.4%) | 2,179 (4.9%) |
| $17,500 to $19,999 | 905 (2.2%) | 1,705 (3.8%) |
| $20,000 to $22,499 | 1,251 (3.0%) | 2,033 (4.5%) |
| $22,500 to $24,999 | 1,827 (4.3%) | 2,012 (4.5%) |
| $25,000 to $29,999 | 2,173 (5.2%) | 4,686 (10.5%) |
| $30,000 to $34,999 | 2,527 (6.0%) | 2,965 (6.6%) |
| $35,000 to $39,999 | 2,379 (5.7%) | 1,863 (4.2%) |
| $40,000 to $44,999 | 1,784 (4.3%) | 1,890 (4.2%) |
| $45,000 to $49,999 | 1,935 (4.6%) | 2,411 (5.4%) |
| $50,000 to $54,999 | 1,686 (4.0%) | 1,779 (4.0%) |
| $55,000 to $64,999 | 2,877 (6.9%) | 3,518 (7.9%) |
| $65,000 to $74,999 | 2,143 (5.1%) | 1,555 (3.5%) |
| $75,000 to $99,999 | 4,019 (9.6%) | 2,322 (5.2%) |
| $100,000+ | 6,399 (15.2%) | 1,910 (4.3%) |
| Total | 41,975 (100.0%) | 44,679 (100.0%) |
Earnings by Sex by Educational Attainment in Shreveport
Average earnings in Shreveport are $44,109 for men and $30,115 for women, a difference of 31.7%. Men with an educational attainment of graduate degree enjoy the highest average annual earnings of $84,245, while those with less than high school education earn the least with $24,533. Women with an educational attainment of graduate degree earn the most with the average annual earnings of $57,233, while those with less than high school education have the smallest earnings of $17,457.
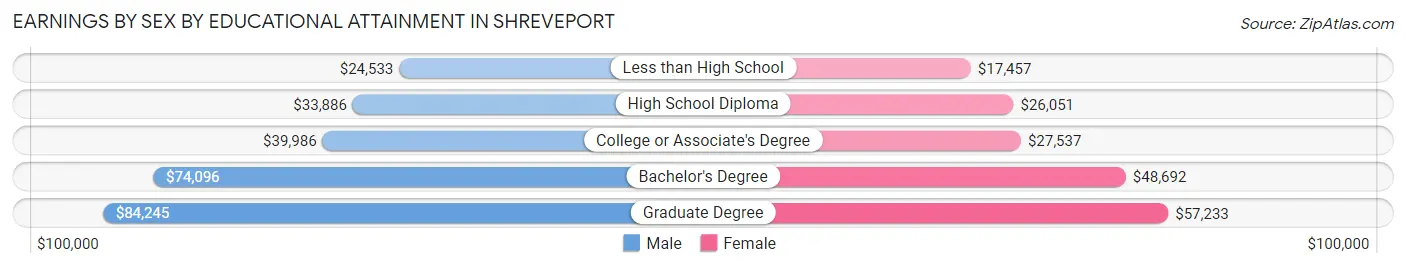
| Educational Attainment | Male Income | Female Income |
| Less than High School | $24,533 | $17,457 |
| High School Diploma | $33,886 | $26,051 |
| College or Associate's Degree | $39,986 | $27,537 |
| Bachelor's Degree | $74,096 | $48,692 |
| Graduate Degree | $84,245 | $57,233 |
| Total | $44,109 | $30,115 |
Family Income in Shreveport
Family Income Brackets in Shreveport
According to the Shreveport family income data, there are 6,791 families falling into the $50,000 to $74,999 income range, which is the most common income bracket and makes up 15.9% of all families. Conversely, the $10,000 to $14,999 income bracket is the least frequent group with only 1,580 families (3.7%) belonging to this category.
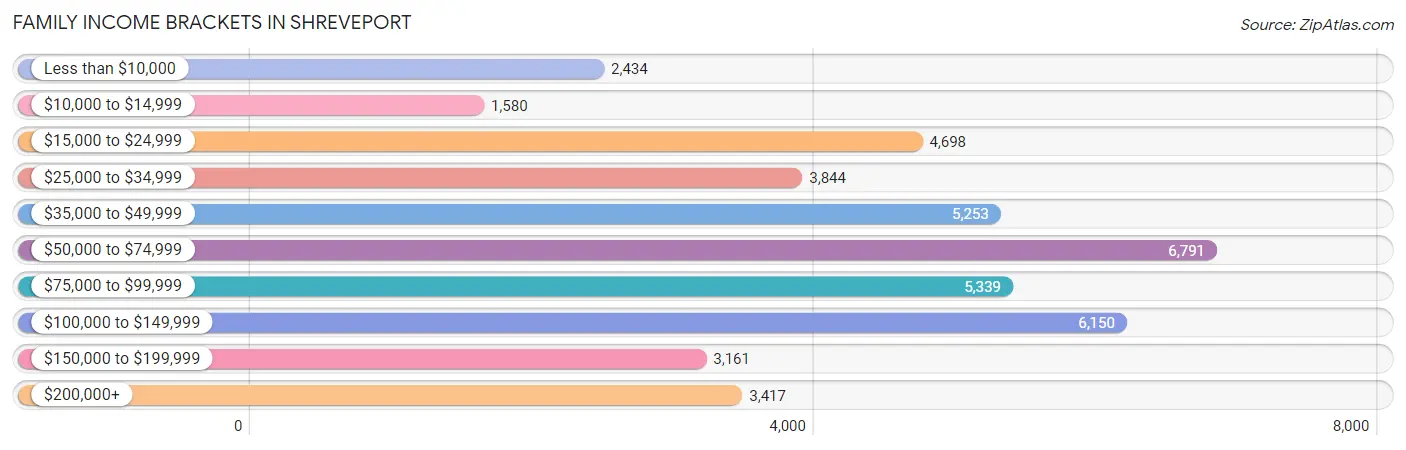
| Income Bracket | # Families | % Families |
| Less than $10,000 | 2,434 | 5.7% |
| $10,000 to $14,999 | 1,580 | 3.7% |
| $15,000 to $24,999 | 4,698 | 11.0% |
| $25,000 to $34,999 | 3,844 | 9.0% |
| $35,000 to $49,999 | 5,253 | 12.3% |
| $50,000 to $74,999 | 6,791 | 15.9% |
| $75,000 to $99,999 | 5,339 | 12.5% |
| $100,000 to $149,999 | 6,150 | 14.4% |
| $150,000 to $199,999 | 3,161 | 7.4% |
| $200,000+ | 3,417 | 8.0% |
Family Income by Famaliy Size in Shreveport
5-person families (3,414 | 8.0%) account for the highest median family income in Shreveport with $76,463 per family, while 2-person families (21,411 | 50.1%) have the highest median income of $30,236 per family member.
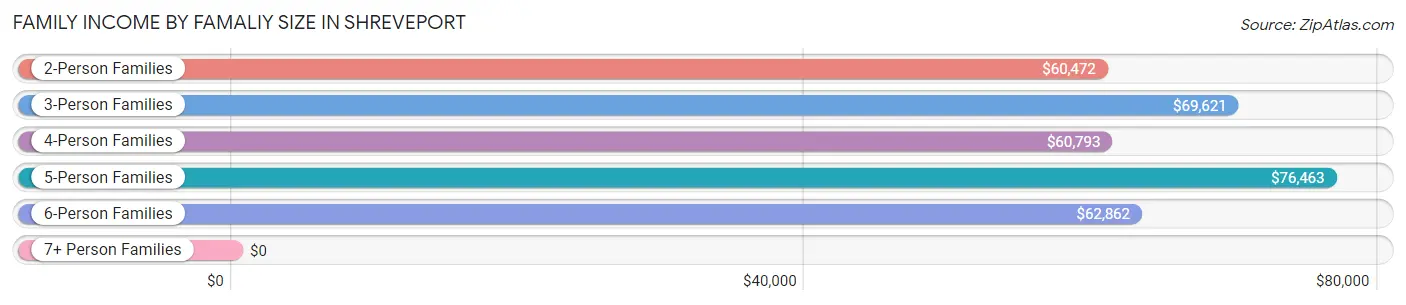
| Income Bracket | # Families | Median Income |
| 2-Person Families | 21,411 (50.1%) | $60,472 |
| 3-Person Families | 10,143 (23.7%) | $69,621 |
| 4-Person Families | 6,677 (15.6%) | $60,793 |
| 5-Person Families | 3,414 (8.0%) | $76,463 |
| 6-Person Families | 654 (1.5%) | $62,862 |
| 7+ Person Families | 411 (1.0%) | $0 |
| Total | 42,710 (100.0%) | $63,112 |
Family Income by Number of Earners in Shreveport
The median family income in Shreveport is $63,112, with families comprising 3+ earners (2,821) having the highest median family income of $113,103, while families with no earners (7,851) have the lowest median family income of $27,402, accounting for 6.6% and 18.4% of families, respectively.
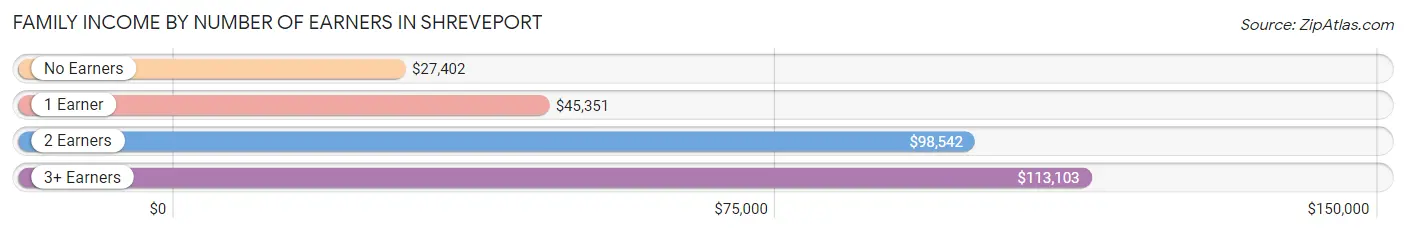
| Number of Earners | # Families | Median Income |
| No Earners | 7,851 (18.4%) | $27,402 |
| 1 Earner | 16,969 (39.7%) | $45,351 |
| 2 Earners | 15,069 (35.3%) | $98,542 |
| 3+ Earners | 2,821 (6.6%) | $113,103 |
| Total | 42,710 (100.0%) | $63,112 |
Household Income in Shreveport
Household Income Brackets in Shreveport
With 11,428 households falling in the category, the $50,000 to $74,999 income range is the most frequent in Shreveport, accounting for 15.2% of all households. In contrast, only 3,985 households (5.3%) fall into the $150,000 to $199,999 income bracket, making it the least populous group.
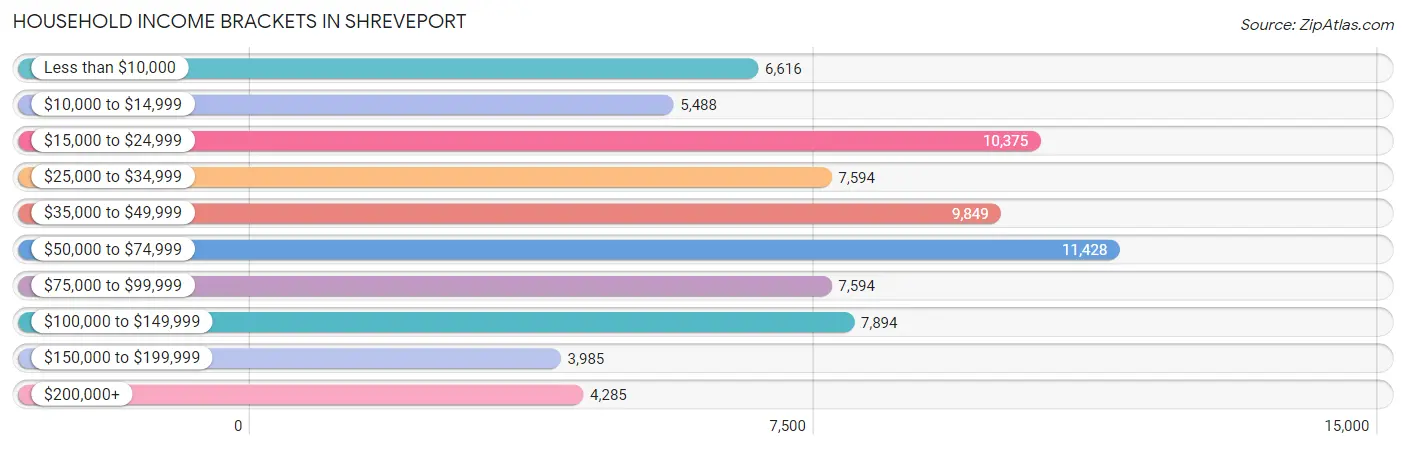
| Income Bracket | # Households | % Households |
| Less than $10,000 | 6,616 | 8.8% |
| $10,000 to $14,999 | 5,488 | 7.3% |
| $15,000 to $24,999 | 10,375 | 13.8% |
| $25,000 to $34,999 | 7,594 | 10.1% |
| $35,000 to $49,999 | 9,849 | 13.1% |
| $50,000 to $74,999 | 11,428 | 15.2% |
| $75,000 to $99,999 | 7,594 | 10.1% |
| $100,000 to $149,999 | 7,894 | 10.5% |
| $150,000 to $199,999 | 3,985 | 5.3% |
| $200,000+ | 4,285 | 5.7% |
Household Income by Householder Age in Shreveport
The median household income in Shreveport is $45,967, with the highest median household income of $51,378 found in the 45 to 64 years age bracket for the primary householder. A total of 25,573 households (34.0%) fall into this category. Meanwhile, the 15 to 24 years age bracket for the primary householder has the lowest median household income of $26,218, with 2,927 households (3.9%) in this group.
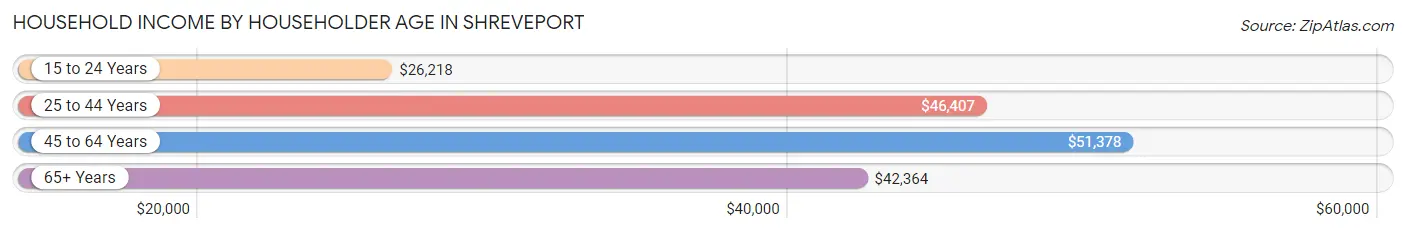
| Income Bracket | # Households | Median Income |
| 15 to 24 Years | 2,927 (3.9%) | $26,218 |
| 25 to 44 Years | 26,413 (35.1%) | $46,407 |
| 45 to 64 Years | 25,573 (34.0%) | $51,378 |
| 65+ Years | 20,271 (27.0%) | $42,364 |
| Total | 75,184 (100.0%) | $45,967 |
Poverty in Shreveport
Income Below Poverty by Sex and Age in Shreveport
With 21.3% poverty level for males and 25.3% for females among the residents of Shreveport, under 5 year old males and 5 year old females are the most vulnerable to poverty, with 2,472 males (41.8%) and 677 females (45.5%) in their respective age groups living below the poverty level.
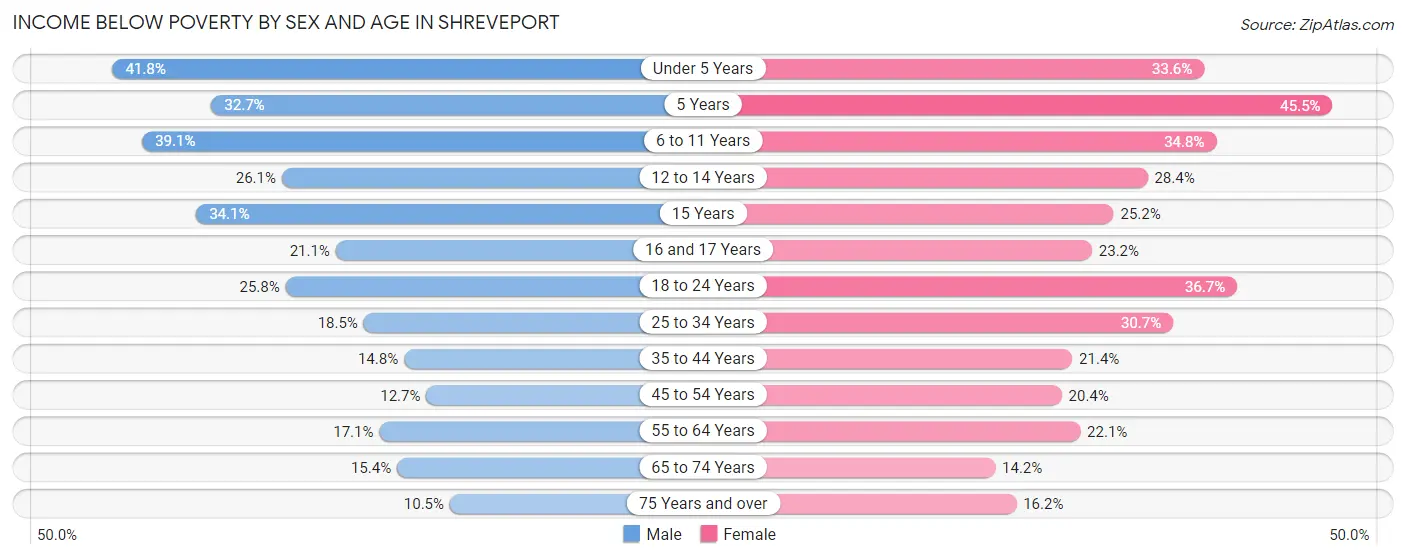
| Age Bracket | Male | Female |
| Under 5 Years | 2,472 (41.8%) | 1,979 (33.6%) |
| 5 Years | 259 (32.7%) | 677 (45.5%) |
| 6 to 11 Years | 2,729 (39.1%) | 2,404 (34.7%) |
| 12 to 14 Years | 1,181 (26.1%) | 1,085 (28.4%) |
| 15 Years | 419 (34.1%) | 285 (25.2%) |
| 16 and 17 Years | 537 (21.1%) | 641 (23.2%) |
| 18 to 24 Years | 1,908 (25.8%) | 2,928 (36.7%) |
| 25 to 34 Years | 2,348 (18.5%) | 4,271 (30.7%) |
| 35 to 44 Years | 1,608 (14.8%) | 2,557 (21.4%) |
| 45 to 54 Years | 1,195 (12.7%) | 2,185 (20.4%) |
| 55 to 64 Years | 1,711 (17.1%) | 2,808 (22.1%) |
| 65 to 74 Years | 1,291 (15.4%) | 1,402 (14.2%) |
| 75 Years and over | 475 (10.5%) | 1,213 (16.2%) |
| Total | 18,133 (21.3%) | 24,435 (25.3%) |
Income Above Poverty by Sex and Age in Shreveport
According to the poverty statistics in Shreveport, males aged 75 years and over and females aged 65 to 74 years are the age groups that are most secure financially, with 89.5% of males and 85.8% of females in these age groups living above the poverty line.
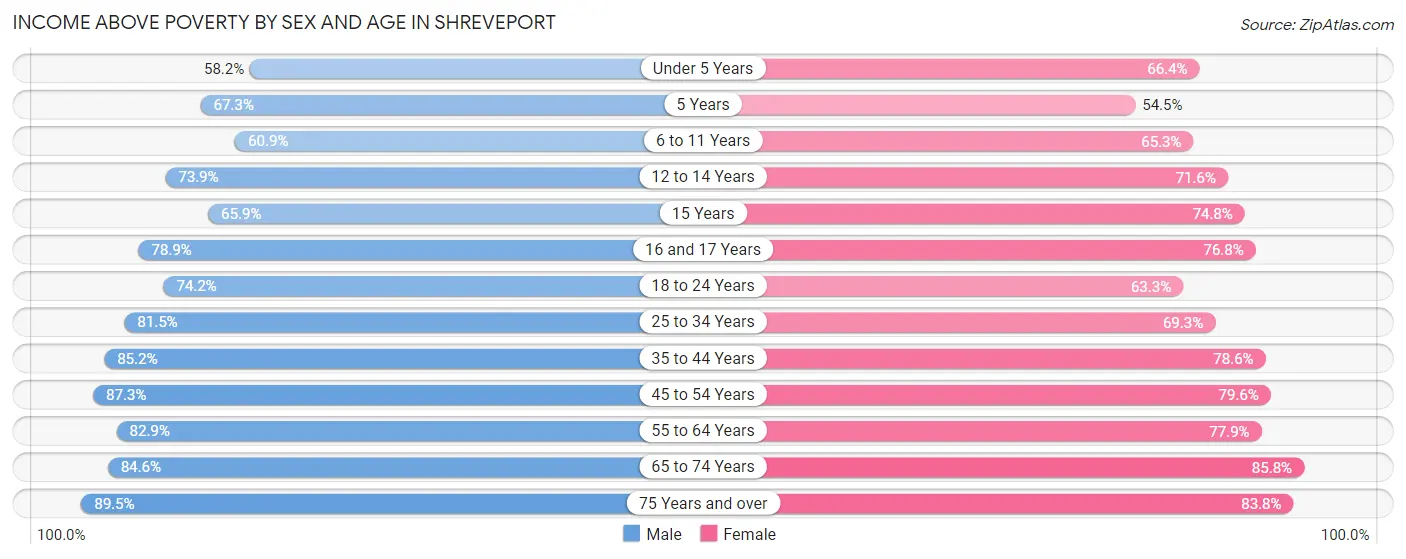
| Age Bracket | Male | Female |
| Under 5 Years | 3,436 (58.2%) | 3,908 (66.4%) |
| 5 Years | 534 (67.3%) | 810 (54.5%) |
| 6 to 11 Years | 4,253 (60.9%) | 4,513 (65.2%) |
| 12 to 14 Years | 3,339 (73.9%) | 2,739 (71.6%) |
| 15 Years | 811 (65.9%) | 845 (74.8%) |
| 16 and 17 Years | 2,004 (78.9%) | 2,121 (76.8%) |
| 18 to 24 Years | 5,493 (74.2%) | 5,055 (63.3%) |
| 25 to 34 Years | 10,320 (81.5%) | 9,622 (69.3%) |
| 35 to 44 Years | 9,262 (85.2%) | 9,401 (78.6%) |
| 45 to 54 Years | 8,199 (87.3%) | 8,524 (79.6%) |
| 55 to 64 Years | 8,309 (82.9%) | 9,887 (77.9%) |
| 65 to 74 Years | 7,071 (84.6%) | 8,450 (85.8%) |
| 75 Years and over | 4,035 (89.5%) | 6,281 (83.8%) |
| Total | 67,066 (78.7%) | 72,156 (74.7%) |
Income Below Poverty Among Married-Couple Families in Shreveport
The poverty statistics for married-couple families in Shreveport show that 5.7% or 1,355 of the total 23,928 families live below the poverty line. Families with 5 or more children have the highest poverty rate of 36.8%, comprising of 39 families. On the other hand, families with no children have the lowest poverty rate of 4.7%, which includes 724 families.
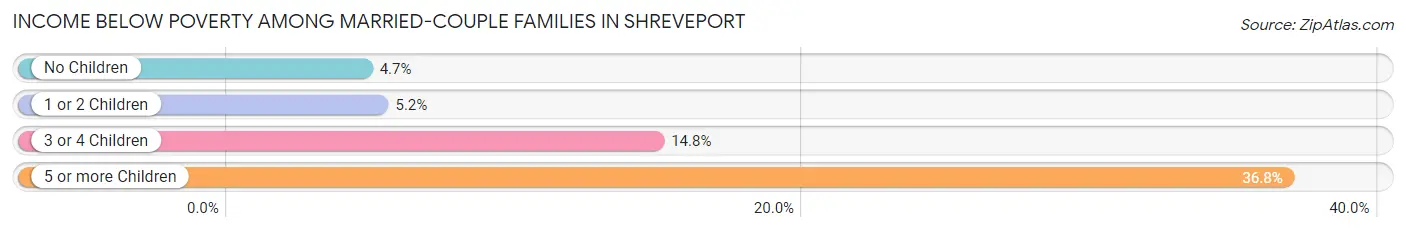
| Children | Above Poverty | Below Poverty |
| No Children | 14,714 (95.3%) | 724 (4.7%) |
| 1 or 2 Children | 6,438 (94.8%) | 356 (5.2%) |
| 3 or 4 Children | 1,354 (85.2%) | 236 (14.8%) |
| 5 or more Children | 67 (63.2%) | 39 (36.8%) |
| Total | 22,573 (94.3%) | 1,355 (5.7%) |
Income Below Poverty Among Single-Parent Households in Shreveport
According to the poverty data in Shreveport, 24.5% or 872 single-father households and 35.5% or 5,397 single-mother households are living below the poverty line. Among single-father households, those with 3 or 4 children have the highest poverty rate, with 203 households (58.0%) experiencing poverty. Likewise, among single-mother households, those with 5 or more children have the highest poverty rate, with 103 households (69.1%) falling below the poverty line.
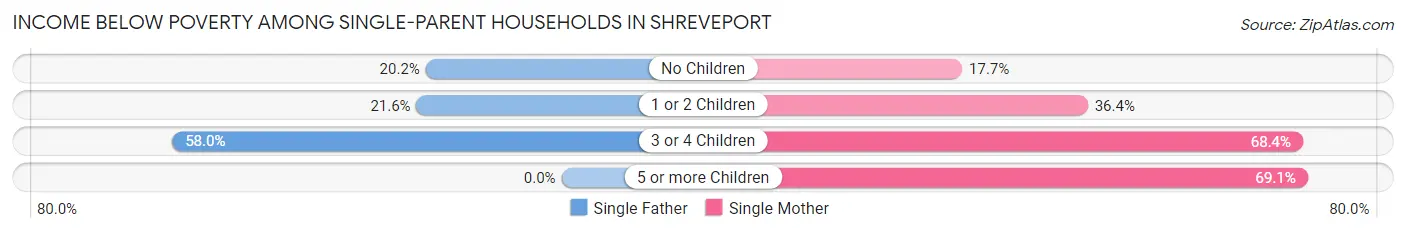
| Children | Single Father | Single Mother |
| No Children | 374 (20.2%) | 922 (17.6%) |
| 1 or 2 Children | 295 (21.6%) | 2,684 (36.4%) |
| 3 or 4 Children | 203 (58.0%) | 1,688 (68.4%) |
| 5 or more Children | 0 (0.0%) | 103 (69.1%) |
| Total | 872 (24.5%) | 5,397 (35.5%) |
Income Below Poverty Among Married-Couple vs Single-Parent Households in Shreveport
The poverty data for Shreveport shows that 1,355 of the married-couple family households (5.7%) and 6,269 of the single-parent households (33.4%) are living below the poverty level. Within the married-couple family households, those with 5 or more children have the highest poverty rate, with 39 households (36.8%) falling below the poverty line. Among the single-parent households, those with 5 or more children have the highest poverty rate, with 103 household (69.1%) living below poverty.
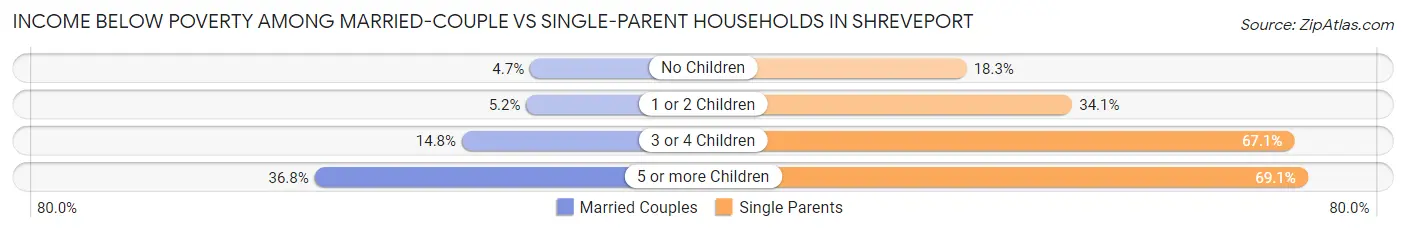
| Children | Married-Couple Families | Single-Parent Households |
| No Children | 724 (4.7%) | 1,296 (18.3%) |
| 1 or 2 Children | 356 (5.2%) | 2,979 (34.1%) |
| 3 or 4 Children | 236 (14.8%) | 1,891 (67.1%) |
| 5 or more Children | 39 (36.8%) | 103 (69.1%) |
| Total | 1,355 (5.7%) | 6,269 (33.4%) |
Race in Shreveport
The most populous races in Shreveport are Black / African American (105,368 | 56.6%), White / Caucasian (69,089 | 37.1%), and Two or more Races (6,329 | 3.4%).
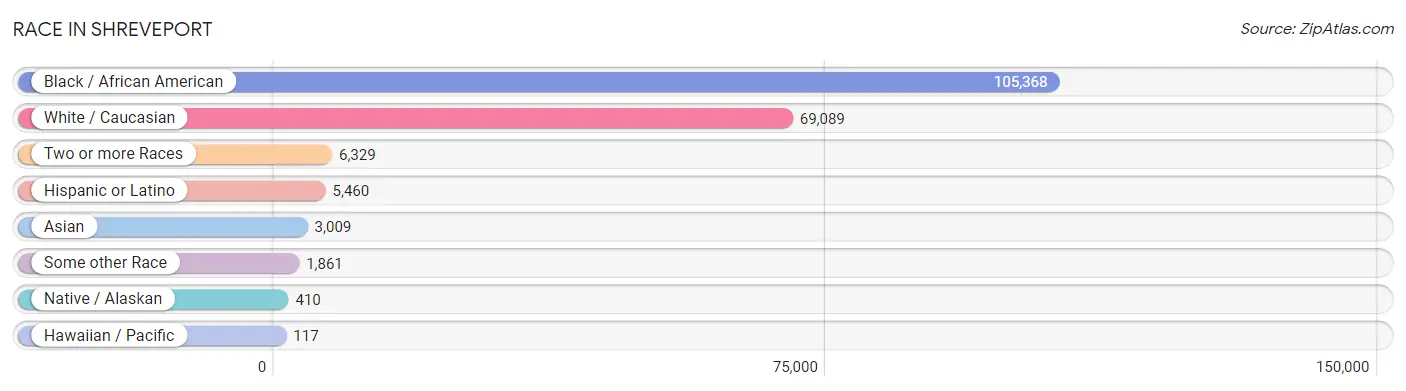
| Race | # Population | % Population |
| Asian | 3,009 | 1.6% |
| Black / African American | 105,368 | 56.6% |
| Hawaiian / Pacific | 117 | 0.1% |
| Hispanic or Latino | 5,460 | 2.9% |
| Native / Alaskan | 410 | 0.2% |
| White / Caucasian | 69,089 | 37.1% |
| Two or more Races | 6,329 | 3.4% |
| Some other Race | 1,861 | 1.0% |
| Total | 186,183 | 100.0% |
Ancestry in Shreveport
The most populous ancestries reported in Shreveport are American (13,526 | 7.3%), English (11,789 | 6.3%), Irish (8,419 | 4.5%), German (7,518 | 4.0%), and French (3,922 | 2.1%), together accounting for 24.3% of all Shreveport residents.
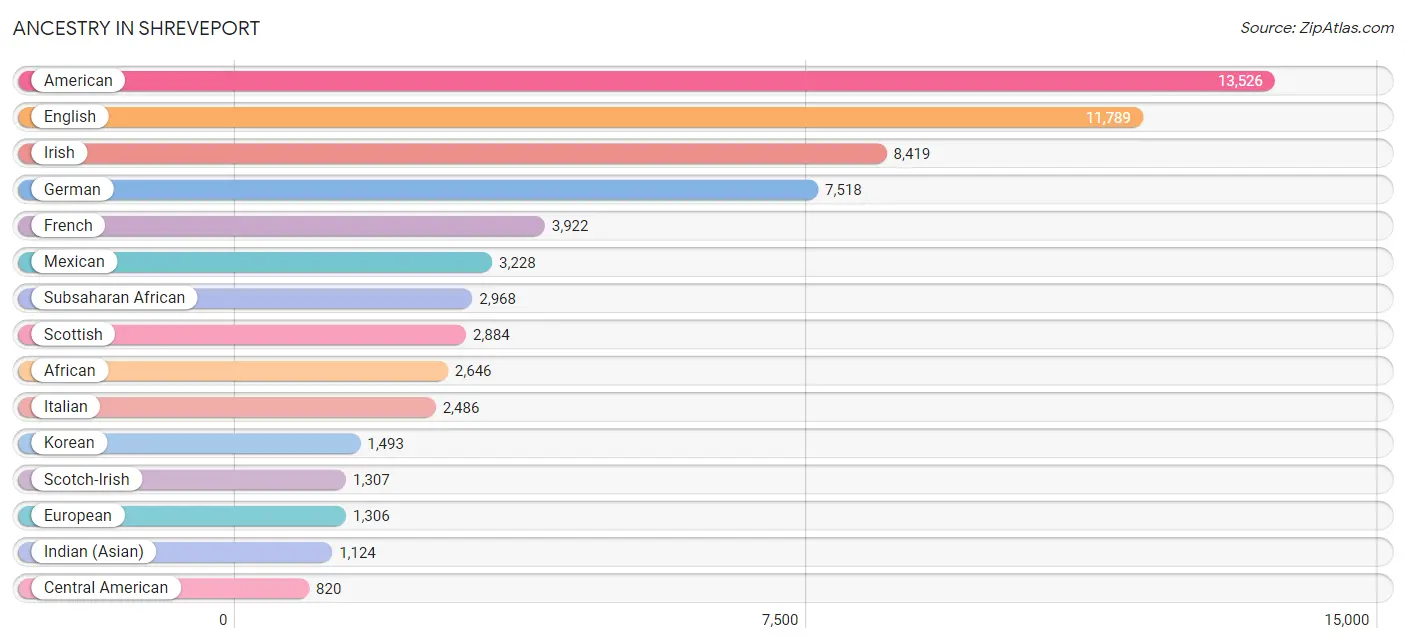
| Ancestry | # Population | % Population |
| African | 2,646 | 1.4% |
| American | 13,526 | 7.3% |
| Apache | 35 | 0.0% |
| Arab | 166 | 0.1% |
| Argentinean | 55 | 0.0% |
| Armenian | 17 | 0.0% |
| Austrian | 22 | 0.0% |
| Basque | 14 | 0.0% |
| Belgian | 87 | 0.1% |
| Bhutanese | 80 | 0.0% |
| Blackfeet | 40 | 0.0% |
| Brazilian | 3 | 0.0% |
| British | 581 | 0.3% |
| Bulgarian | 20 | 0.0% |
| Burmese | 232 | 0.1% |
| Cajun | 467 | 0.3% |
| Central American | 820 | 0.4% |
| Central American Indian | 24 | 0.0% |
| Cherokee | 280 | 0.2% |
| Chickasaw | 38 | 0.0% |
| Choctaw | 63 | 0.0% |
| Colombian | 40 | 0.0% |
| Comanche | 12 | 0.0% |
| Costa Rican | 116 | 0.1% |
| Creek | 46 | 0.0% |
| Croatian | 69 | 0.0% |
| Cuban | 60 | 0.0% |
| Czech | 71 | 0.0% |
| Czechoslovakian | 42 | 0.0% |
| Danish | 132 | 0.1% |
| Dominican | 42 | 0.0% |
| Dutch | 580 | 0.3% |
| Dutch West Indian | 9 | 0.0% |
| Eastern European | 128 | 0.1% |
| Ecuadorian | 20 | 0.0% |
| English | 11,789 | 6.3% |
| European | 1,306 | 0.7% |
| Finnish | 18 | 0.0% |
| French | 3,922 | 2.1% |
| French American Indian | 52 | 0.0% |
| French Canadian | 792 | 0.4% |
| German | 7,518 | 4.0% |
| Ghanaian | 4 | 0.0% |
| Greek | 129 | 0.1% |
| Guamanian / Chamorro | 116 | 0.1% |
| Guatemalan | 106 | 0.1% |
| Guyanese | 25 | 0.0% |
| Haitian | 98 | 0.1% |
| Honduran | 394 | 0.2% |
| Houma | 46 | 0.0% |
| Hungarian | 92 | 0.1% |
| Icelander | 38 | 0.0% |
| Indian (Asian) | 1,124 | 0.6% |
| Iranian | 48 | 0.0% |
| Irish | 8,419 | 4.5% |
| Israeli | 23 | 0.0% |
| Italian | 2,486 | 1.3% |
| Jamaican | 61 | 0.0% |
| Japanese | 95 | 0.1% |
| Jordanian | 9 | 0.0% |
| Kenyan | 257 | 0.1% |
| Korean | 1,493 | 0.8% |
| Lebanese | 66 | 0.0% |
| Lithuanian | 21 | 0.0% |
| Maltese | 13 | 0.0% |
| Mexican | 3,228 | 1.7% |
| Mexican American Indian | 7 | 0.0% |
| Native Hawaiian | 174 | 0.1% |
| Navajo | 50 | 0.0% |
| Nicaraguan | 53 | 0.0% |
| Nigerian | 32 | 0.0% |
| Northern European | 173 | 0.1% |
| Norwegian | 264 | 0.1% |
| Osage | 31 | 0.0% |
| Pakistani | 32 | 0.0% |
| Palestinian | 76 | 0.0% |
| Panamanian | 128 | 0.1% |
| Peruvian | 12 | 0.0% |
| Polish | 441 | 0.2% |
| Portuguese | 130 | 0.1% |
| Puerto Rican | 366 | 0.2% |
| Romanian | 80 | 0.0% |
| Russian | 264 | 0.1% |
| Salvadoran | 23 | 0.0% |
| Samoan | 162 | 0.1% |
| Scandinavian | 498 | 0.3% |
| Scotch-Irish | 1,307 | 0.7% |
| Scottish | 2,884 | 1.5% |
| Sioux | 5 | 0.0% |
| Slavic | 5 | 0.0% |
| Slovak | 37 | 0.0% |
| Slovene | 22 | 0.0% |
| South American | 171 | 0.1% |
| Spaniard | 189 | 0.1% |
| Spanish | 381 | 0.2% |
| Spanish American | 10 | 0.0% |
| Sri Lankan | 634 | 0.3% |
| Subsaharan African | 2,968 | 1.6% |
| Swedish | 443 | 0.2% |
| Swiss | 75 | 0.0% |
| Syrian | 7 | 0.0% |
| Thai | 351 | 0.2% |
| Trinidadian and Tobagonian | 35 | 0.0% |
| Turkish | 19 | 0.0% |
| Ukrainian | 40 | 0.0% |
| Uruguayan | 44 | 0.0% |
| Vietnamese | 62 | 0.0% |
| Welsh | 682 | 0.4% |
| West Indian | 130 | 0.1% |
| Yugoslavian | 40 | 0.0% | View All 110 Rows |
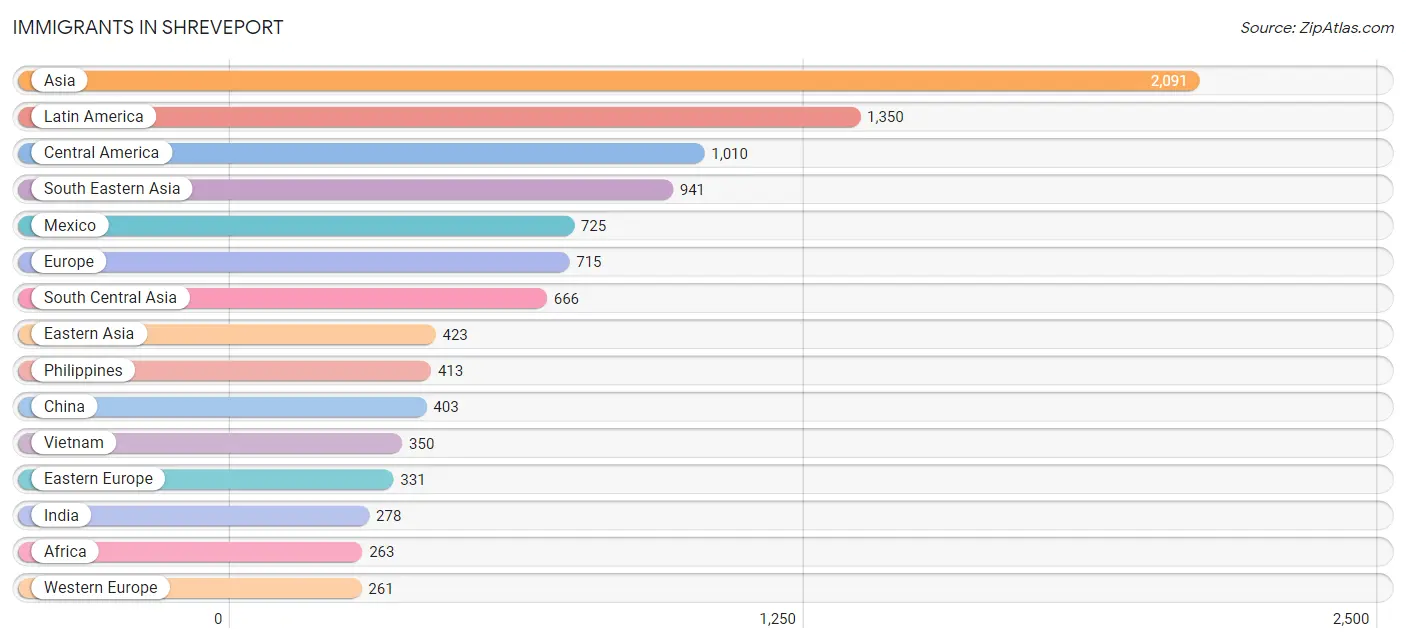
Immigrants in Shreveport
The most numerous immigrant groups reported in Shreveport came from Asia (2,091 | 1.1%), Latin America (1,350 | 0.7%), Central America (1,010 | 0.5%), South Eastern Asia (941 | 0.5%), and Mexico (725 | 0.4%), together accounting for 3.3% of all Shreveport residents.
| Immigration Origin | # Population | % Population |
| Africa | 263 | 0.1% |
| Argentina | 61 | 0.0% |
| Asia | 2,091 | 1.1% |
| Bahamas | 11 | 0.0% |
| Bangladesh | 68 | 0.0% |
| Belgium | 21 | 0.0% |
| Brazil | 3 | 0.0% |
| Canada | 62 | 0.0% |
| Caribbean | 175 | 0.1% |
| Central America | 1,010 | 0.5% |
| China | 403 | 0.2% |
| Colombia | 14 | 0.0% |
| Costa Rica | 71 | 0.0% |
| Cuba | 36 | 0.0% |
| Dominican Republic | 33 | 0.0% |
| Eastern Africa | 215 | 0.1% |
| Eastern Asia | 423 | 0.2% |
| Eastern Europe | 331 | 0.2% |
| Ecuador | 10 | 0.0% |
| El Salvador | 23 | 0.0% |
| England | 42 | 0.0% |
| Europe | 715 | 0.4% |
| France | 26 | 0.0% |
| Germany | 179 | 0.1% |
| Ghana | 17 | 0.0% |
| Greece | 13 | 0.0% |
| Guatemala | 92 | 0.1% |
| Haiti | 11 | 0.0% |
| Honduras | 25 | 0.0% |
| Hong Kong | 69 | 0.0% |
| India | 278 | 0.2% |
| Iran | 39 | 0.0% |
| Italy | 14 | 0.0% |
| Jamaica | 29 | 0.0% |
| Japan | 20 | 0.0% |
| Kenya | 197 | 0.1% |
| Kuwait | 9 | 0.0% |
| Latin America | 1,350 | 0.7% |
| Mexico | 725 | 0.4% |
| Nepal | 116 | 0.1% |
| Netherlands | 35 | 0.0% |
| Nicaragua | 63 | 0.0% |
| Northern Europe | 88 | 0.1% |
| Oceania | 11 | 0.0% |
| Pakistan | 165 | 0.1% |
| Panama | 11 | 0.0% |
| Philippines | 413 | 0.2% |
| Poland | 8 | 0.0% |
| Romania | 103 | 0.1% |
| Russia | 211 | 0.1% |
| Saudi Arabia | 18 | 0.0% |
| Singapore | 152 | 0.1% |
| South America | 165 | 0.1% |
| South Central Asia | 666 | 0.4% |
| South Eastern Asia | 941 | 0.5% |
| Southern Europe | 35 | 0.0% |
| Spain | 8 | 0.0% |
| Sweden | 18 | 0.0% |
| Taiwan | 26 | 0.0% |
| Thailand | 26 | 0.0% |
| Trinidad and Tobago | 6 | 0.0% |
| Turkey | 19 | 0.0% |
| Uruguay | 77 | 0.0% |
| Vietnam | 350 | 0.2% |
| Western Africa | 17 | 0.0% |
| Western Asia | 46 | 0.0% |
| Western Europe | 261 | 0.1% |
| Zimbabwe | 18 | 0.0% | View All 68 Rows |
Sex and Age in Shreveport
Sex and Age in Shreveport
The most populous age groups in Shreveport are 10 to 14 Years (7,087 | 8.1%) for men and 25 to 29 Years (7,210 | 7.3%) for women.
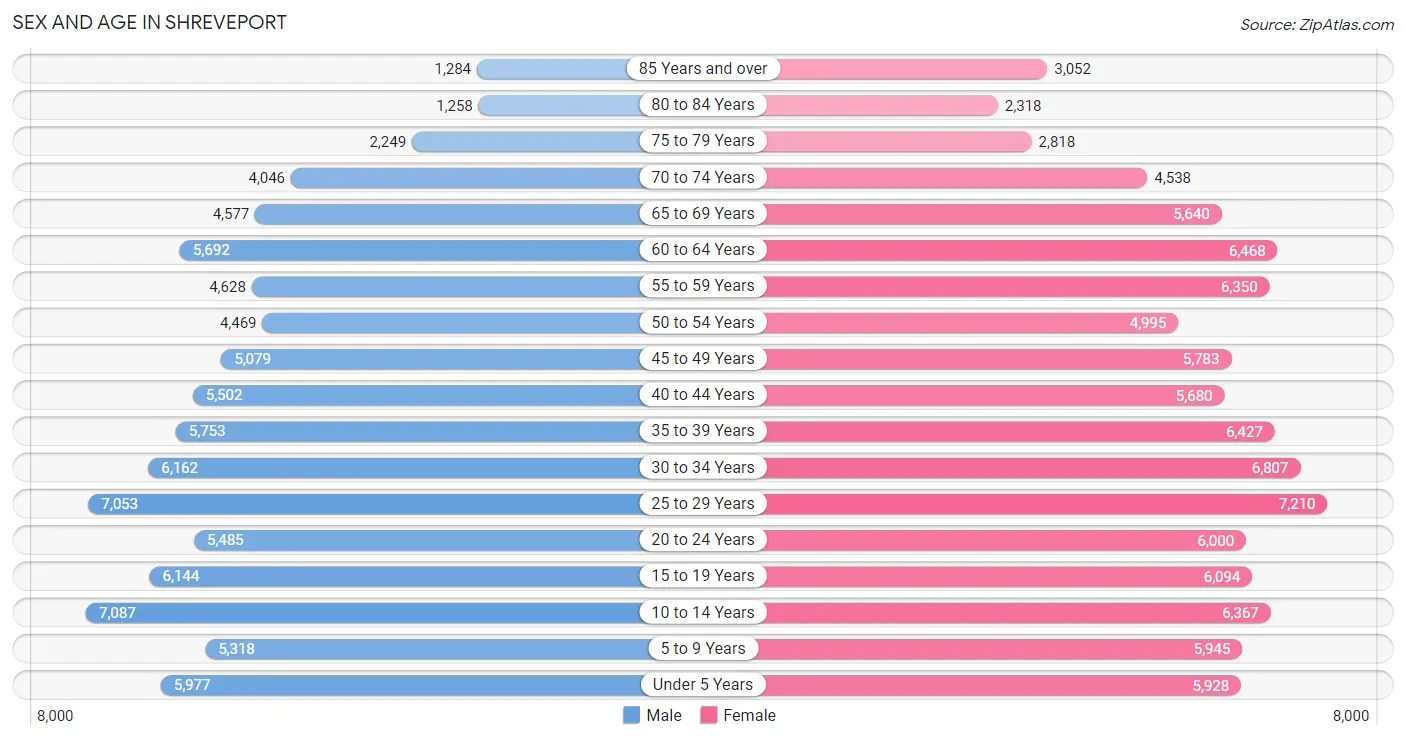
| Age Bracket | Male | Female |
| Under 5 Years | 5,977 (6.8%) | 5,928 (6.0%) |
| 5 to 9 Years | 5,318 (6.1%) | 5,945 (6.0%) |
| 10 to 14 Years | 7,087 (8.1%) | 6,367 (6.5%) |
| 15 to 19 Years | 6,144 (7.0%) | 6,094 (6.2%) |
| 20 to 24 Years | 5,485 (6.2%) | 6,000 (6.1%) |
| 25 to 29 Years | 7,053 (8.0%) | 7,210 (7.3%) |
| 30 to 34 Years | 6,162 (7.0%) | 6,807 (6.9%) |
| 35 to 39 Years | 5,753 (6.6%) | 6,427 (6.5%) |
| 40 to 44 Years | 5,502 (6.3%) | 5,680 (5.8%) |
| 45 to 49 Years | 5,079 (5.8%) | 5,783 (5.9%) |
| 50 to 54 Years | 4,469 (5.1%) | 4,995 (5.1%) |
| 55 to 59 Years | 4,628 (5.3%) | 6,350 (6.5%) |
| 60 to 64 Years | 5,692 (6.5%) | 6,468 (6.6%) |
| 65 to 69 Years | 4,577 (5.2%) | 5,640 (5.7%) |
| 70 to 74 Years | 4,046 (4.6%) | 4,538 (4.6%) |
| 75 to 79 Years | 2,249 (2.6%) | 2,818 (2.9%) |
| 80 to 84 Years | 1,258 (1.4%) | 2,318 (2.4%) |
| 85 Years and over | 1,284 (1.5%) | 3,052 (3.1%) |
| Total | 87,763 (100.0%) | 98,420 (100.0%) |
Families and Households in Shreveport
Median Family Size in Shreveport
The median family size in Shreveport is 3.28 persons per family, with single female/mother families (15,219 | 35.6%) accounting for the largest median family size of 3.59 persons per family. On the other hand, single male/father families (3,563 | 8.3%) represent the smallest median family size with 2.97 persons per family.
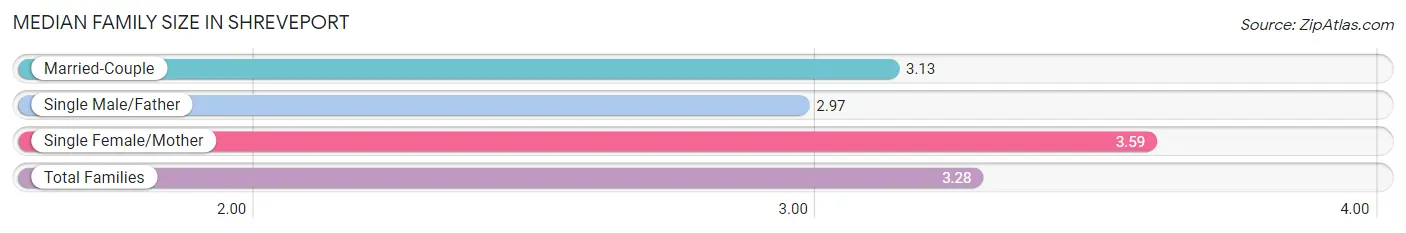
| Family Type | # Families | Family Size |
| Married-Couple | 23,928 (56.0%) | 3.13 |
| Single Male/Father | 3,563 (8.3%) | 2.97 |
| Single Female/Mother | 15,219 (35.6%) | 3.59 |
| Total Families | 42,710 (100.0%) | 3.28 |
Median Household Size in Shreveport
The median household size in Shreveport is 2.41 persons per household, with single female/mother households (15,219 | 20.2%) accounting for the largest median household size of 3.7 persons per household. non-family households (32,474 | 43.2%) represent the smallest median household size with 1.16 persons per household.
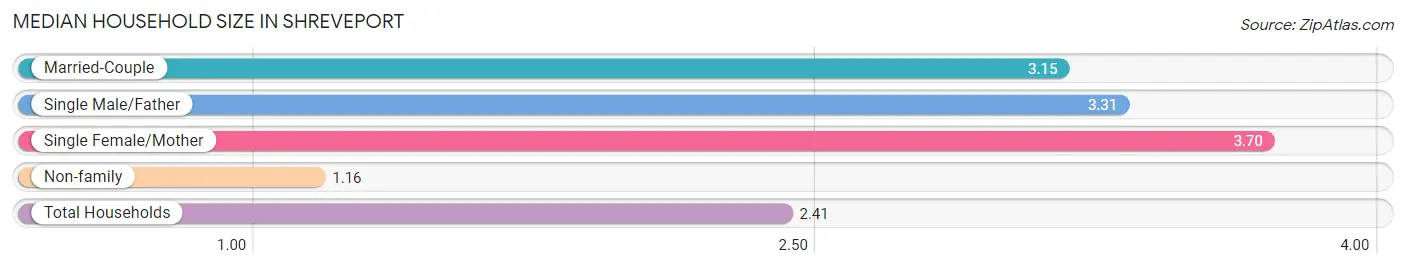
| Household Type | # Households | Household Size |
| Married-Couple | 23,928 (31.8%) | 3.15 |
| Single Male/Father | 3,563 (4.7%) | 3.31 |
| Single Female/Mother | 15,219 (20.2%) | 3.70 |
| Non-family | 32,474 (43.2%) | 1.16 |
| Total Households | 75,184 (100.0%) | 2.41 |
Household Size by Marriage Status in Shreveport
Out of a total of 75,184 households in Shreveport, 42,710 (56.8%) are family households, while 32,474 (43.2%) are nonfamily households. The most numerous type of family households are 2-person households, comprising 20,372, and the most common type of nonfamily households are 1-person households, comprising 28,160.
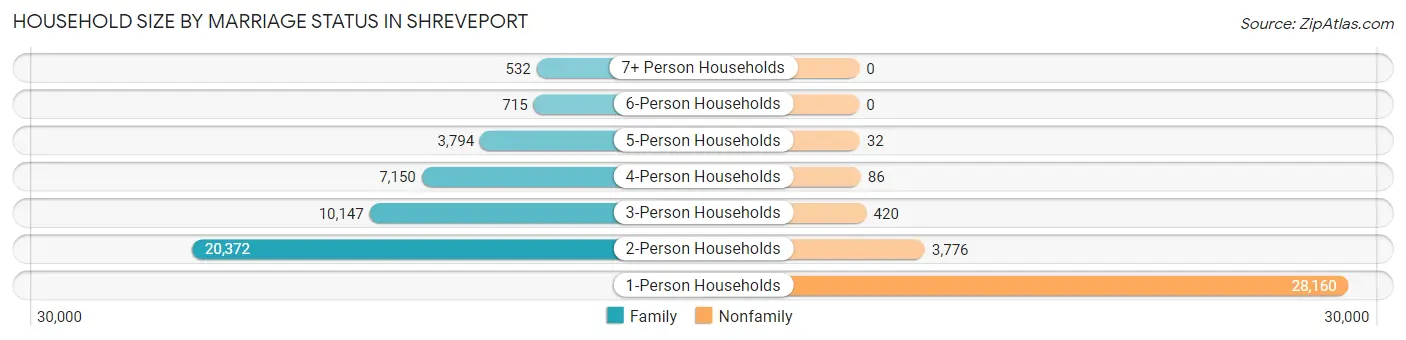
| Household Size | Family Households | Nonfamily Households |
| 1-Person Households | - | 28,160 (37.4%) |
| 2-Person Households | 20,372 (27.1%) | 3,776 (5.0%) |
| 3-Person Households | 10,147 (13.5%) | 420 (0.6%) |
| 4-Person Households | 7,150 (9.5%) | 86 (0.1%) |
| 5-Person Households | 3,794 (5.1%) | 32 (0.0%) |
| 6-Person Households | 715 (0.9%) | 0 (0.0%) |
| 7+ Person Households | 532 (0.7%) | 0 (0.0%) |
| Total | 42,710 (56.8%) | 32,474 (43.2%) |
Female Fertility in Shreveport
Fertility by Age in Shreveport
Average fertility rate in Shreveport is 47.0 births per 1,000 women. Women in the age bracket of 20 to 34 years have the highest fertility rate with 84.0 births per 1,000 women. Women in the age bracket of 20 to 34 years acount for 79.0% of all women with births.
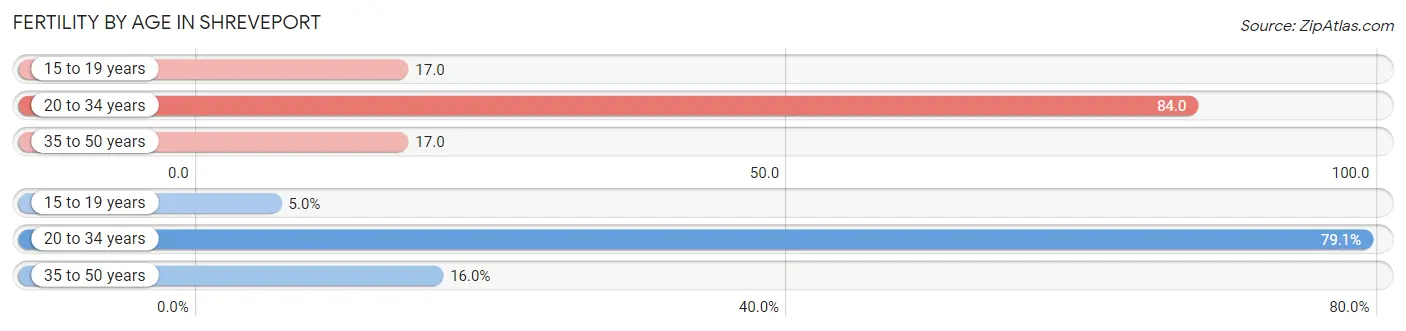
| Age Bracket | Women with Births | Births / 1,000 Women |
| 15 to 19 years | 106 (5.0%) | 17.0 |
| 20 to 34 years | 1,679 (79.0%) | 84.0 |
| 35 to 50 years | 339 (16.0%) | 17.0 |
| Total | 2,124 (100.0%) | 47.0 |
Fertility by Age by Marriage Status in Shreveport
45.5% of women with births (2,124) in Shreveport are married. The highest percentage of unmarried women with births falls into 15 to 19 years age bracket with 100.0% of them unmarried at the time of birth, while the lowest percentage of unmarried women with births belong to 35 to 50 years age bracket with 34.2% of them unmarried.
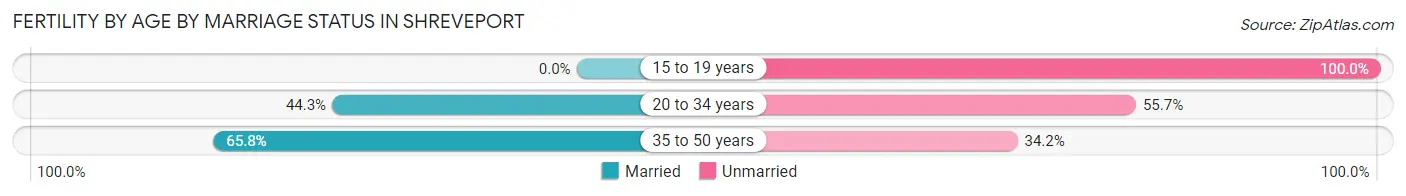
| Age Bracket | Married | Unmarried |
| 15 to 19 years | 0 (0.0%) | 106 (100.0%) |
| 20 to 34 years | 744 (44.3%) | 935 (55.7%) |
| 35 to 50 years | 223 (65.8%) | 116 (34.2%) |
| Total | 966 (45.5%) | 1,158 (54.5%) |
Fertility by Education in Shreveport
Average fertility rate in Shreveport is 47.0 births per 1,000 women. Women with the education attainment of college or associate's degree have the highest fertility rate of 52.0 births per 1,000 women, while women with the education attainment of less than high school have the lowest fertility at 37.0 births per 1,000 women. Women with the education attainment of college or associate's degree represent 39.9% of all women with births.
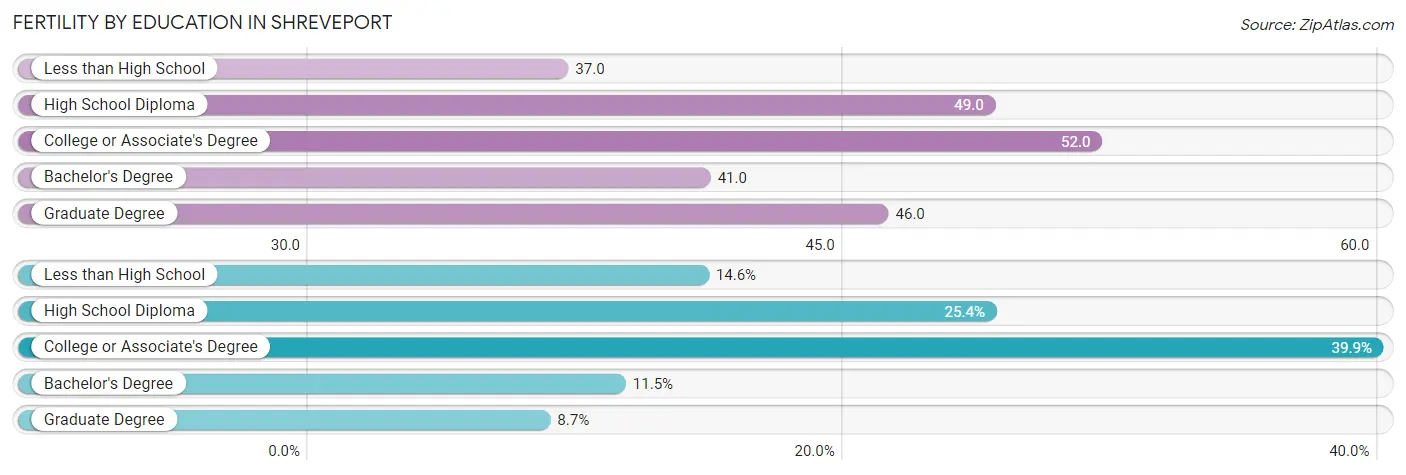
| Educational Attainment | Women with Births | Births / 1,000 Women |
| Less than High School | 310 (14.6%) | 37.0 |
| High School Diploma | 539 (25.4%) | 49.0 |
| College or Associate's Degree | 847 (39.9%) | 52.0 |
| Bachelor's Degree | 244 (11.5%) | 41.0 |
| Graduate Degree | 184 (8.7%) | 46.0 |
| Total | 2,124 (100.0%) | 47.0 |
Fertility by Education by Marriage Status in Shreveport
54.5% of women with births in Shreveport are unmarried. Women with the educational attainment of bachelor's degree are most likely to be married with 100.0% of them married at childbirth, while women with the educational attainment of less than high school are least likely to be married with 100.0% of them unmarried at childbirth.
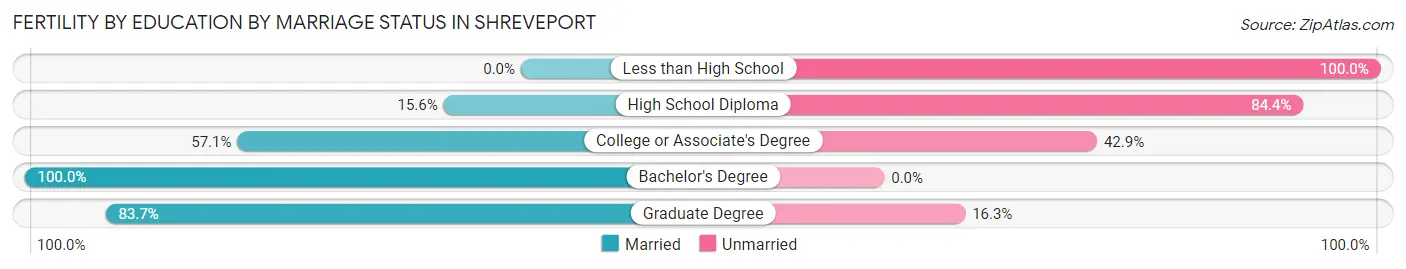
| Educational Attainment | Married | Unmarried |
| Less than High School | 0 (0.0%) | 310 (100.0%) |
| High School Diploma | 84 (15.6%) | 455 (84.4%) |
| College or Associate's Degree | 484 (57.1%) | 363 (42.9%) |
| Bachelor's Degree | 244 (100.0%) | 0 (0.0%) |
| Graduate Degree | 154 (83.7%) | 30 (16.3%) |
| Total | 966 (45.5%) | 1,158 (54.5%) |
Employment Characteristics in Shreveport
Employment by Class of Employer in Shreveport
Among the 75,823 employed individuals in Shreveport, private company employees (48,660 | 64.2%), not-for-profit organizations (7,242 | 9.6%), and local government employees (5,682 | 7.5%) make up the most common classes of employment.
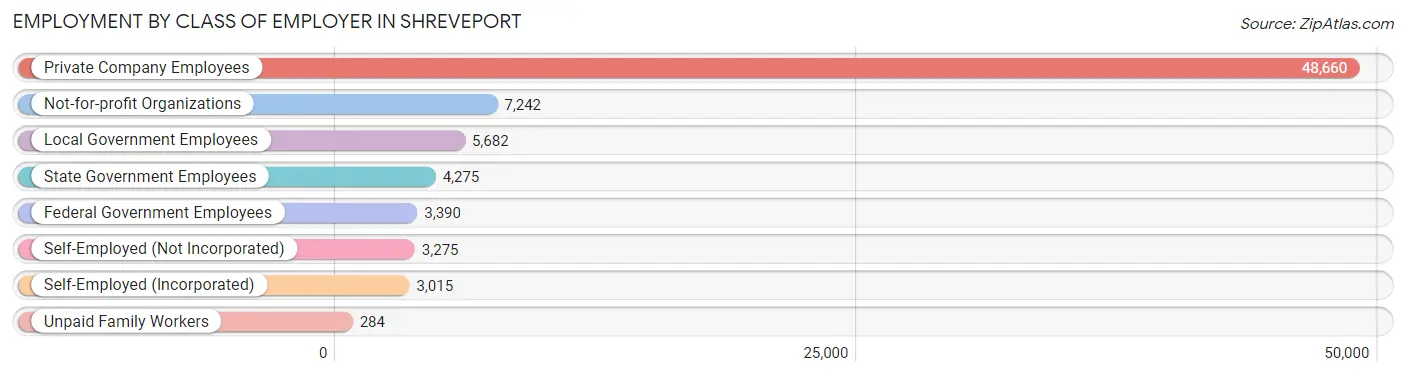
| Employer Class | # Employees | % Employees |
| Private Company Employees | 48,660 | 64.2% |
| Self-Employed (Incorporated) | 3,015 | 4.0% |
| Self-Employed (Not Incorporated) | 3,275 | 4.3% |
| Not-for-profit Organizations | 7,242 | 9.6% |
| Local Government Employees | 5,682 | 7.5% |
| State Government Employees | 4,275 | 5.6% |
| Federal Government Employees | 3,390 | 4.5% |
| Unpaid Family Workers | 284 | 0.4% |
| Total | 75,823 | 100.0% |
Employment Status by Age in Shreveport
According to the labor force statistics for Shreveport, out of the total population over 16 years of age (147,193), 57.7% or 84,930 individuals are in the labor force, with 9.2% or 7,814 of them unemployed. The age group with the highest labor force participation rate is 35 to 44 years, with 80.9% or 18,900 individuals in the labor force. Within the labor force, the 16 to 19 years age range has the highest percentage of unemployed individuals, with 37.0% or 1,033 of them being unemployed.
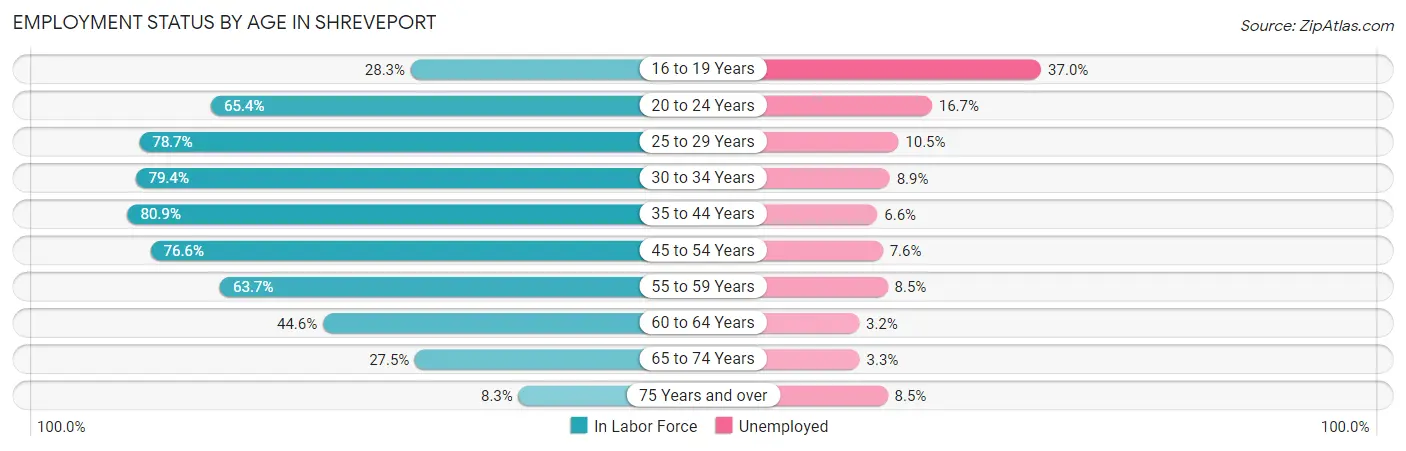
| Age Bracket | In Labor Force | Unemployed |
| 16 to 19 Years | 2,793 (28.3%) | 1,033 (37.0%) |
| 20 to 24 Years | 7,511 (65.4%) | 1,254 (16.7%) |
| 25 to 29 Years | 11,225 (78.7%) | 1,179 (10.5%) |
| 30 to 34 Years | 10,297 (79.4%) | 916 (8.9%) |
| 35 to 44 Years | 18,900 (80.9%) | 1,247 (6.6%) |
| 45 to 54 Years | 15,570 (76.6%) | 1,183 (7.6%) |
| 55 to 59 Years | 6,993 (63.7%) | 594 (8.5%) |
| 60 to 64 Years | 5,423 (44.6%) | 174 (3.2%) |
| 65 to 74 Years | 5,170 (27.5%) | 171 (3.3%) |
| 75 Years and over | 1,077 (8.3%) | 92 (8.5%) |
| Total | 84,930 (57.7%) | 7,814 (9.2%) |
Employment Status by Educational Attainment in Shreveport
According to labor force statistics for Shreveport, 72.7% of individuals (68,380) out of the total population between 25 and 64 years of age (94,058) are in the labor force, with 7.7% or 5,265 of them being unemployed. The group with the highest labor force participation rate are those with the educational attainment of bachelor's degree or higher, with 84.7% or 20,342 individuals in the labor force. Within the labor force, individuals with less than high school education have the highest percentage of unemployment, with 21.5% or 1,271 of them being unemployed.
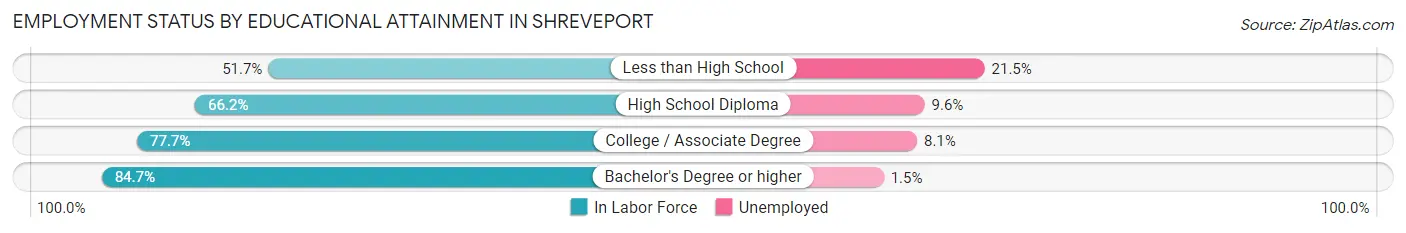
| Educational Attainment | In Labor Force | Unemployed |
| Less than High School | 5,912 (51.7%) | 2,459 (21.5%) |
| High School Diploma | 19,417 (66.2%) | 2,816 (9.6%) |
| College / Associate Degree | 22,746 (77.7%) | 2,371 (8.1%) |
| Bachelor's Degree or higher | 20,342 (84.7%) | 360 (1.5%) |
| Total | 68,380 (72.7%) | 7,242 (7.7%) |
Employment Occupations by Sex in Shreveport
Management, Business, Science and Arts Occupations
The most common Management, Business, Science and Arts occupations in Shreveport are Community & Social Service (9,912 | 13.0%), Health Diagnosing & Treating (6,731 | 8.8%), Management (6,716 | 8.8%), Education Instruction & Library (5,681 | 7.4%), and Health Technologists (4,014 | 5.2%).
Management, Business, Science and Arts Occupations by Sex
Within the Management, Business, Science and Arts occupations in Shreveport, the most male-oriented occupations are Architecture & Engineering (89.0%), Computers, Engineering & Science (71.8%), and Life, Physical & Social Science (62.8%), while the most female-oriented occupations are Education Instruction & Library (73.4%), Health Diagnosing & Treating (70.1%), and Community & Social Service (67.7%).
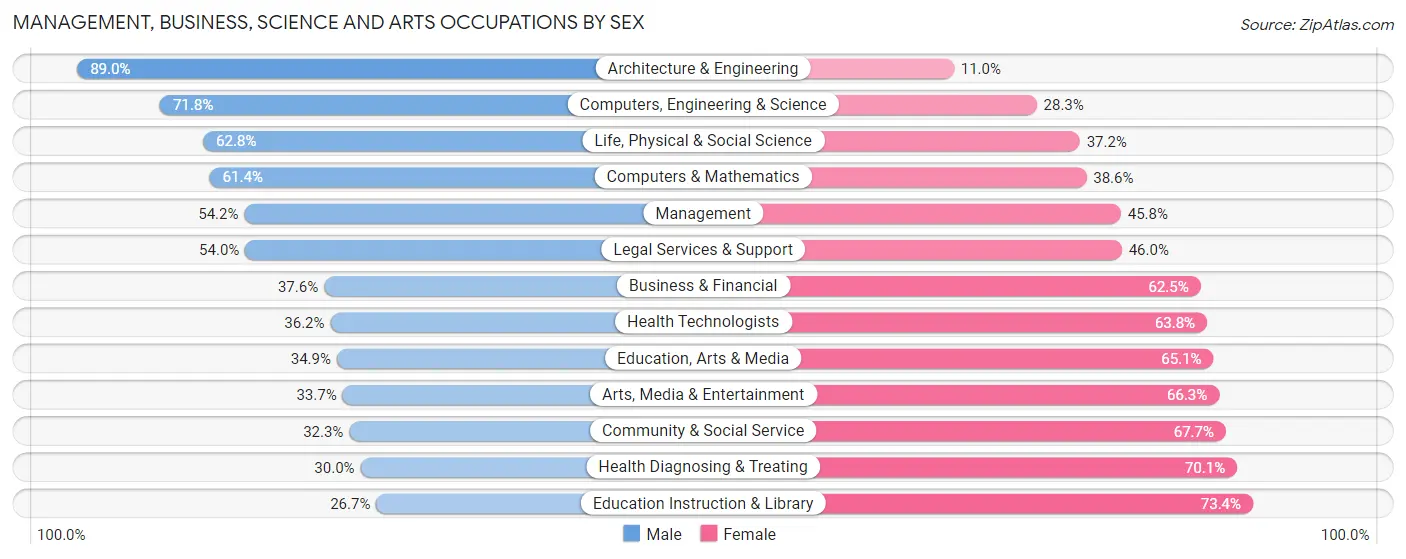
| Occupation | Male | Female |
| Management | 3,639 (54.2%) | 3,077 (45.8%) |
| Business & Financial | 976 (37.6%) | 1,623 (62.5%) |
| Computers, Engineering & Science | 2,080 (71.8%) | 819 (28.2%) |
| Computers & Mathematics | 744 (61.4%) | 468 (38.6%) |
| Architecture & Engineering | 940 (89.0%) | 116 (11.0%) |
| Life, Physical & Social Science | 396 (62.8%) | 235 (37.2%) |
| Community & Social Service | 3,201 (32.3%) | 6,711 (67.7%) |
| Education, Arts & Media | 739 (34.9%) | 1,380 (65.1%) |
| Legal Services & Support | 629 (54.0%) | 536 (46.0%) |
| Education Instruction & Library | 1,514 (26.7%) | 4,167 (73.4%) |
| Arts, Media & Entertainment | 319 (33.7%) | 628 (66.3%) |
| Health Diagnosing & Treating | 2,016 (29.9%) | 4,715 (70.1%) |
| Health Technologists | 1,454 (36.2%) | 2,560 (63.8%) |
| Total (Category) | 11,912 (41.3%) | 16,945 (58.7%) |
| Total (Overall) | 36,794 (48.2%) | 39,606 (51.8%) |
Services Occupations
The most common Services occupations in Shreveport are Food Preparation & Serving (4,916 | 6.4%), Healthcare Support (4,130 | 5.4%), Cleaning & Maintenance (3,098 | 4.1%), Personal Care & Service (2,909 | 3.8%), and Security & Protection (2,495 | 3.3%).
Services Occupations by Sex
Within the Services occupations in Shreveport, the most male-oriented occupations are Law Enforcement (88.1%), Security & Protection (74.7%), and Firefighting & Prevention (65.1%), while the most female-oriented occupations are Healthcare Support (86.7%), Personal Care & Service (62.1%), and Food Preparation & Serving (50.0%).
| Occupation | Male | Female |
| Healthcare Support | 551 (13.3%) | 3,579 (86.7%) |
| Security & Protection | 1,863 (74.7%) | 632 (25.3%) |
| Firefighting & Prevention | 949 (65.1%) | 509 (34.9%) |
| Law Enforcement | 914 (88.1%) | 123 (11.9%) |
| Food Preparation & Serving | 2,460 (50.0%) | 2,456 (50.0%) |
| Cleaning & Maintenance | 1,591 (51.4%) | 1,507 (48.6%) |
| Personal Care & Service | 1,103 (37.9%) | 1,806 (62.1%) |
| Total (Category) | 7,568 (43.1%) | 9,980 (56.9%) |
| Total (Overall) | 36,794 (48.2%) | 39,606 (51.8%) |
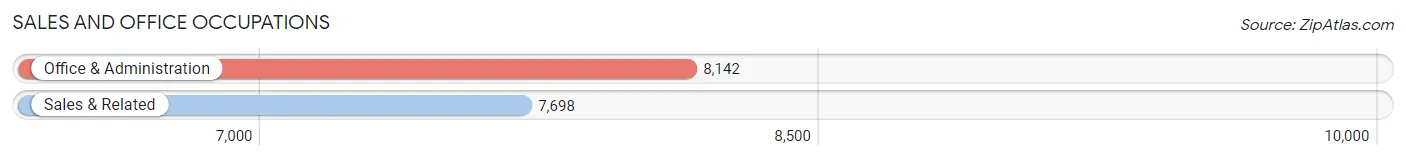
Sales and Office Occupations
The most common Sales and Office occupations in Shreveport are Office & Administration (8,142 | 10.7%), and Sales & Related (7,698 | 10.1%).
Sales and Office Occupations by Sex
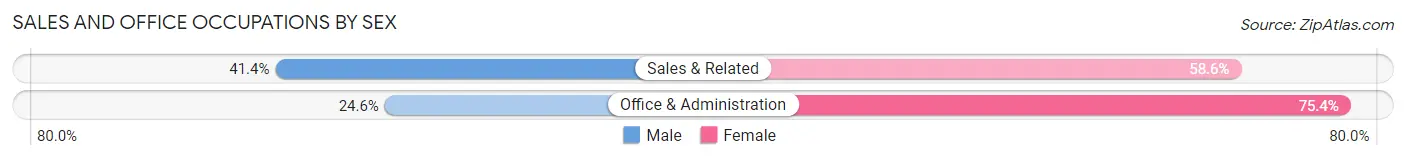
| Occupation | Male | Female |
| Sales & Related | 3,189 (41.4%) | 4,509 (58.6%) |
| Office & Administration | 2,003 (24.6%) | 6,139 (75.4%) |
| Total (Category) | 5,192 (32.8%) | 10,648 (67.2%) |
| Total (Overall) | 36,794 (48.2%) | 39,606 (51.8%) |
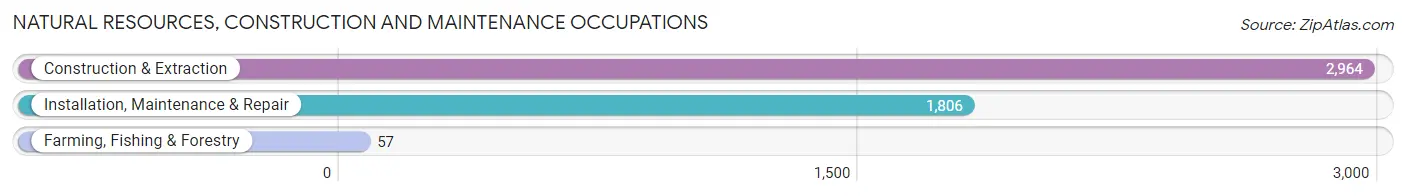
Natural Resources, Construction and Maintenance Occupations
The most common Natural Resources, Construction and Maintenance occupations in Shreveport are Construction & Extraction (2,964 | 3.9%), Installation, Maintenance & Repair (1,806 | 2.4%), and Farming, Fishing & Forestry (57 | 0.1%).
Natural Resources, Construction and Maintenance Occupations by Sex
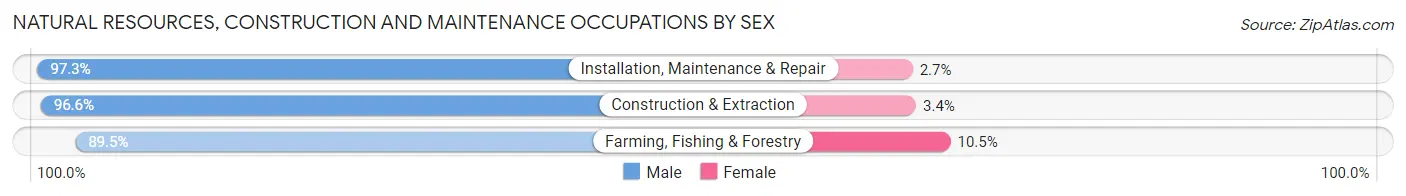
| Occupation | Male | Female |
| Farming, Fishing & Forestry | 51 (89.5%) | 6 (10.5%) |
| Construction & Extraction | 2,864 (96.6%) | 100 (3.4%) |
| Installation, Maintenance & Repair | 1,758 (97.3%) | 48 (2.7%) |
| Total (Category) | 4,673 (96.8%) | 154 (3.2%) |
| Total (Overall) | 36,794 (48.2%) | 39,606 (51.8%) |
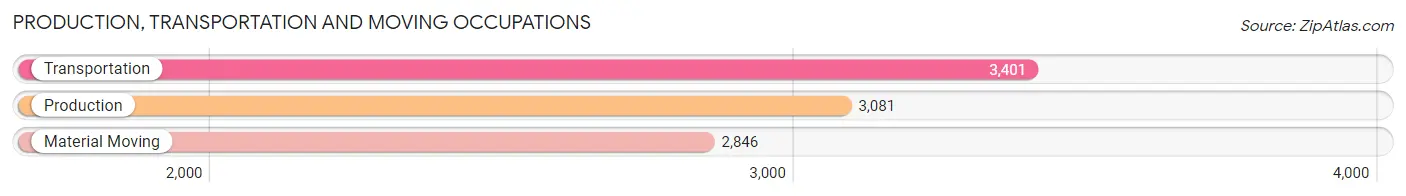
Production, Transportation and Moving Occupations
The most common Production, Transportation and Moving occupations in Shreveport are Transportation (3,401 | 4.4%), Production (3,081 | 4.0%), and Material Moving (2,846 | 3.7%).
Production, Transportation and Moving Occupations by Sex
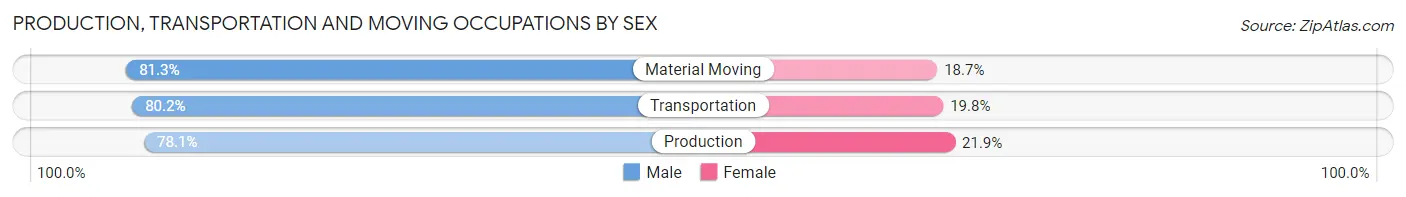
| Occupation | Male | Female |
| Production | 2,405 (78.1%) | 676 (21.9%) |
| Transportation | 2,729 (80.2%) | 672 (19.8%) |
| Material Moving | 2,315 (81.3%) | 531 (18.7%) |
| Total (Category) | 7,449 (79.9%) | 1,879 (20.1%) |
| Total (Overall) | 36,794 (48.2%) | 39,606 (51.8%) |
Employment Industries by Sex in Shreveport
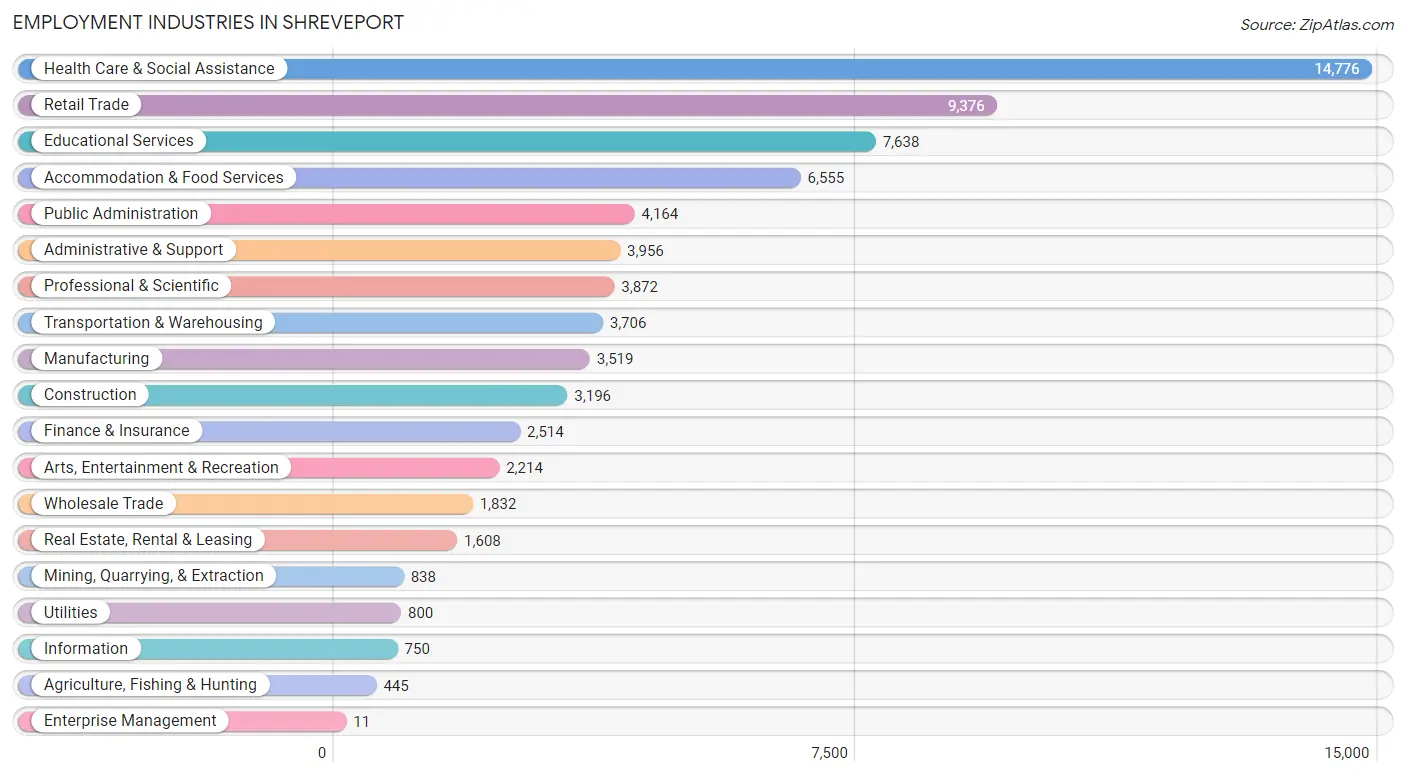
Employment Industries in Shreveport
The major employment industries in Shreveport include Health Care & Social Assistance (14,776 | 19.3%), Retail Trade (9,376 | 12.3%), Educational Services (7,638 | 10.0%), Accommodation & Food Services (6,555 | 8.6%), and Public Administration (4,164 | 5.4%).
Employment Industries by Sex in Shreveport
The Shreveport industries that see more men than women are Agriculture, Fishing & Hunting (96.6%), Mining, Quarrying, & Extraction (95.2%), and Construction (88.1%), whereas the industries that tend to have a higher number of women are Enterprise Management (100.0%), Health Care & Social Assistance (77.6%), and Educational Services (68.2%).
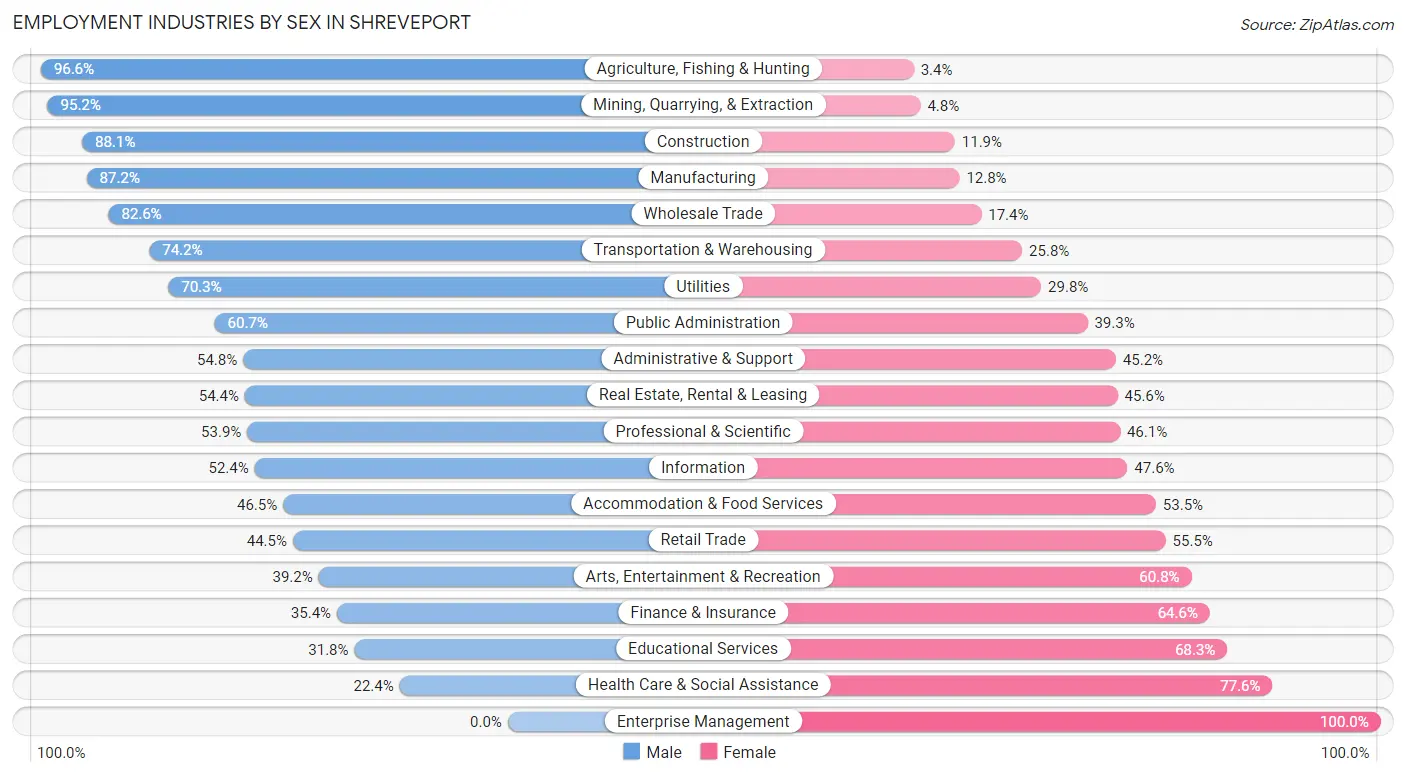
| Industry | Male | Female |
| Agriculture, Fishing & Hunting | 430 (96.6%) | 15 (3.4%) |
| Mining, Quarrying, & Extraction | 798 (95.2%) | 40 (4.8%) |
| Construction | 2,816 (88.1%) | 380 (11.9%) |
| Manufacturing | 3,067 (87.2%) | 452 (12.8%) |
| Wholesale Trade | 1,514 (82.6%) | 318 (17.4%) |
| Retail Trade | 4,170 (44.5%) | 5,206 (55.5%) |
| Transportation & Warehousing | 2,749 (74.2%) | 957 (25.8%) |
| Utilities | 562 (70.3%) | 238 (29.7%) |
| Information | 393 (52.4%) | 357 (47.6%) |
| Finance & Insurance | 889 (35.4%) | 1,625 (64.6%) |
| Real Estate, Rental & Leasing | 875 (54.4%) | 733 (45.6%) |
| Professional & Scientific | 2,088 (53.9%) | 1,784 (46.1%) |
| Enterprise Management | 0 (0.0%) | 11 (100.0%) |
| Administrative & Support | 2,167 (54.8%) | 1,789 (45.2%) |
| Educational Services | 2,425 (31.8%) | 5,213 (68.2%) |
| Health Care & Social Assistance | 3,310 (22.4%) | 11,466 (77.6%) |
| Arts, Entertainment & Recreation | 867 (39.2%) | 1,347 (60.8%) |
| Accommodation & Food Services | 3,048 (46.5%) | 3,507 (53.5%) |
| Public Administration | 2,526 (60.7%) | 1,638 (39.3%) |
| Total | 36,794 (48.2%) | 39,606 (51.8%) |
Education in Shreveport
School Enrollment in Shreveport
The most common levels of schooling among the 46,266 students in Shreveport are middle school (10,635 | 23.0%), high school (10,502 | 22.7%), and elementary school (9,216 | 19.9%).
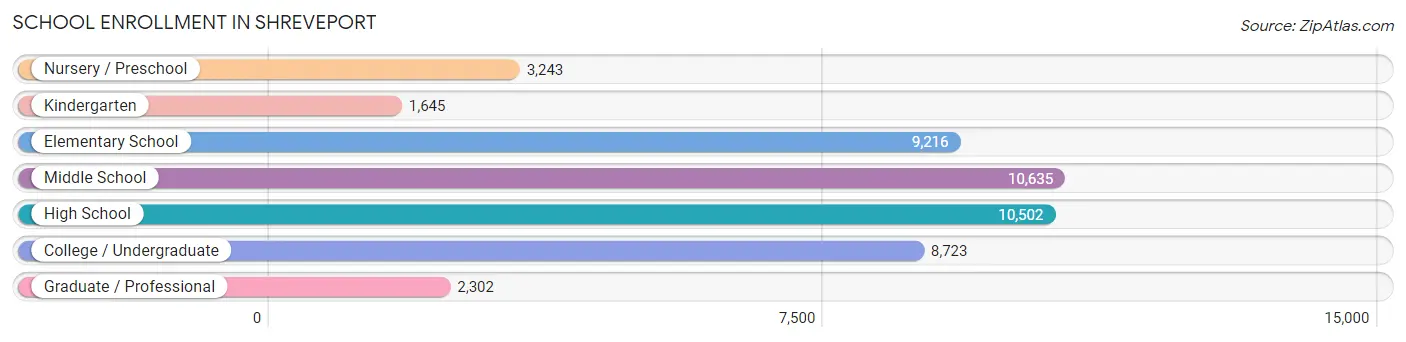
| School Level | # Students | % Students |
| Nursery / Preschool | 3,243 | 7.0% |
| Kindergarten | 1,645 | 3.6% |
| Elementary School | 9,216 | 19.9% |
| Middle School | 10,635 | 23.0% |
| High School | 10,502 | 22.7% |
| College / Undergraduate | 8,723 | 18.9% |
| Graduate / Professional | 2,302 | 5.0% |
| Total | 46,266 | 100.0% |
School Enrollment by Age by Funding Source in Shreveport
Out of a total of 46,266 students who are enrolled in schools in Shreveport, 6,153 (13.3%) attend a private institution, while the remaining 40,113 (86.7%) are enrolled in public schools. The age group of 3 to 4 year olds has the highest likelihood of being enrolled in private schools, with 657 (26.0% in the age bracket) enrolled. Conversely, the age group of 18 to 19 year olds has the lowest likelihood of being enrolled in a private school, with 2,313 (93.4% in the age bracket) attending a public institution.
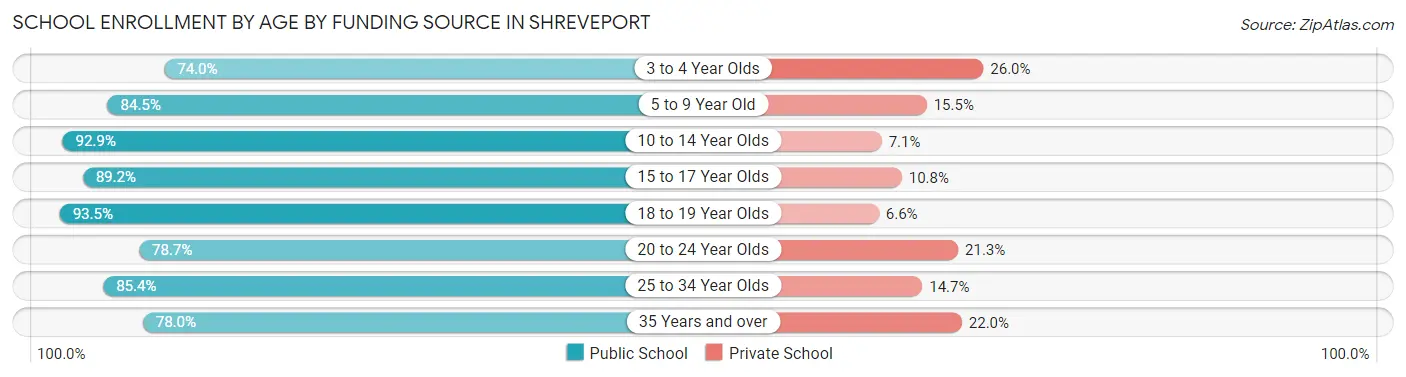
| Age Bracket | Public School | Private School |
| 3 to 4 Year Olds | 1,868 (74.0%) | 657 (26.0%) |
| 5 to 9 Year Old | 8,997 (84.5%) | 1,646 (15.5%) |
| 10 to 14 Year Olds | 11,827 (92.9%) | 901 (7.1%) |
| 15 to 17 Year Olds | 6,801 (89.2%) | 826 (10.8%) |
| 18 to 19 Year Olds | 2,313 (93.4%) | 162 (6.6%) |
| 20 to 24 Year Olds | 3,034 (78.7%) | 822 (21.3%) |
| 25 to 34 Year Olds | 2,942 (85.4%) | 505 (14.6%) |
| 35 Years and over | 2,312 (78.0%) | 653 (22.0%) |
| Total | 40,113 (86.7%) | 6,153 (13.3%) |
Educational Attainment by Field of Study in Shreveport
Business (6,624 | 18.6%), education (5,148 | 14.4%), science & technology (3,965 | 11.1%), liberal arts & history (3,323 | 9.3%), and bio, nature & agricultural (2,870 | 8.0%) are the most common fields of study among 35,677 individuals in Shreveport who have obtained a bachelor's degree or higher.
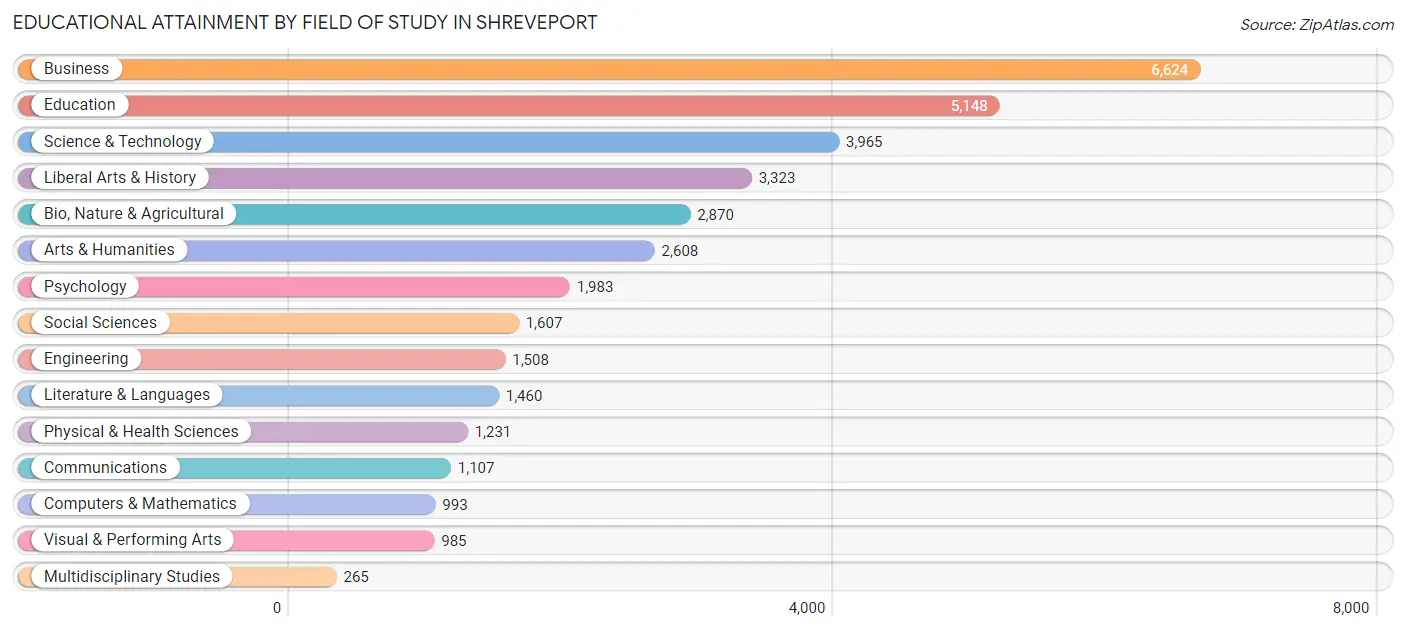
| Field of Study | # Graduates | % Graduates |
| Computers & Mathematics | 993 | 2.8% |
| Bio, Nature & Agricultural | 2,870 | 8.0% |
| Physical & Health Sciences | 1,231 | 3.5% |
| Psychology | 1,983 | 5.6% |
| Social Sciences | 1,607 | 4.5% |
| Engineering | 1,508 | 4.2% |
| Multidisciplinary Studies | 265 | 0.7% |
| Science & Technology | 3,965 | 11.1% |
| Business | 6,624 | 18.6% |
| Education | 5,148 | 14.4% |
| Literature & Languages | 1,460 | 4.1% |
| Liberal Arts & History | 3,323 | 9.3% |
| Visual & Performing Arts | 985 | 2.8% |
| Communications | 1,107 | 3.1% |
| Arts & Humanities | 2,608 | 7.3% |
| Total | 35,677 | 100.0% |
Transportation & Commute in Shreveport
Vehicle Availability by Sex in Shreveport
The most prevalent vehicle ownership categories in Shreveport are males with 2 vehicles (15,391, accounting for 41.9%) and females with 2 vehicles (14,793, making up 39.5%).
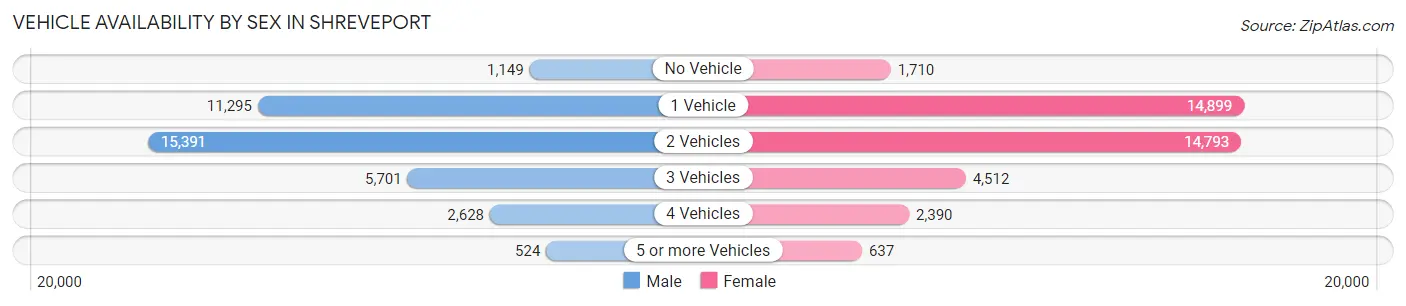
| Vehicles Available | Male | Female |
| No Vehicle | 1,149 (3.1%) | 1,710 (4.4%) |
| 1 Vehicle | 11,295 (30.8%) | 14,899 (38.3%) |
| 2 Vehicles | 15,391 (41.9%) | 14,793 (38.0%) |
| 3 Vehicles | 5,701 (15.5%) | 4,512 (11.6%) |
| 4 Vehicles | 2,628 (7.2%) | 2,390 (6.1%) |
| 5 or more Vehicles | 524 (1.4%) | 637 (1.6%) |
| Total | 36,688 (100.0%) | 38,941 (100.0%) |
Commute Time in Shreveport
The most frequently occuring commute durations in Shreveport are 15 to 19 minutes (20,359 commuters, 28.2%), 20 to 24 minutes (14,323 commuters, 19.8%), and 10 to 14 minutes (13,820 commuters, 19.1%).
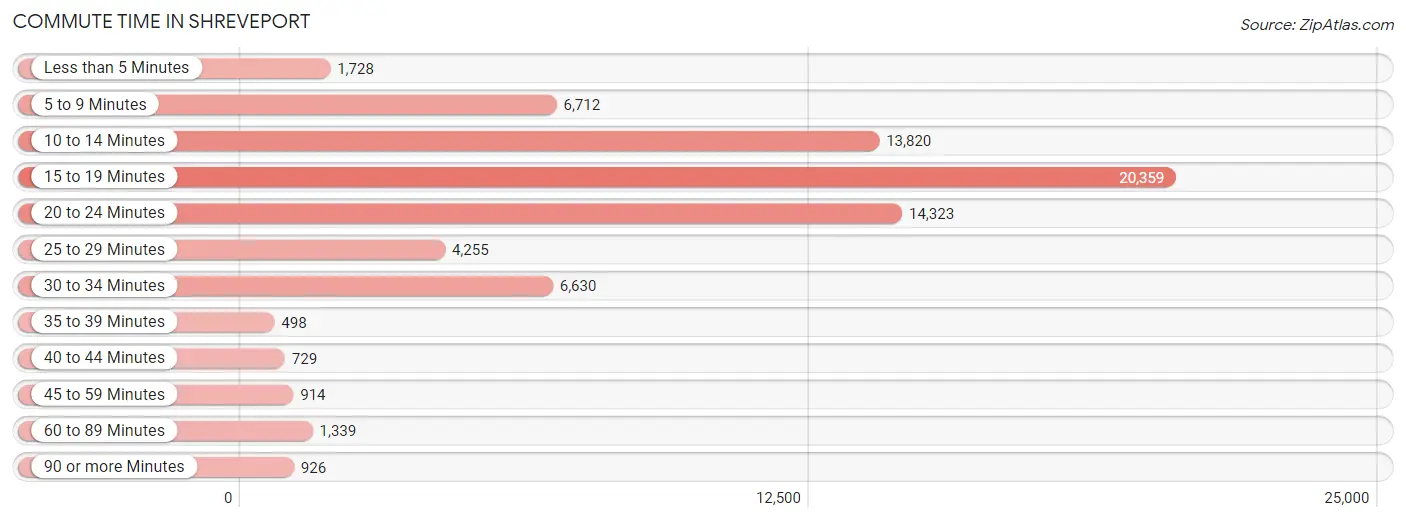
| Commute Time | # Commuters | % Commuters |
| Less than 5 Minutes | 1,728 | 2.4% |
| 5 to 9 Minutes | 6,712 | 9.3% |
| 10 to 14 Minutes | 13,820 | 19.1% |
| 15 to 19 Minutes | 20,359 | 28.2% |
| 20 to 24 Minutes | 14,323 | 19.8% |
| 25 to 29 Minutes | 4,255 | 5.9% |
| 30 to 34 Minutes | 6,630 | 9.2% |
| 35 to 39 Minutes | 498 | 0.7% |
| 40 to 44 Minutes | 729 | 1.0% |
| 45 to 59 Minutes | 914 | 1.3% |
| 60 to 89 Minutes | 1,339 | 1.8% |
| 90 or more Minutes | 926 | 1.3% |
Commute Time by Sex in Shreveport
The most common commute times in Shreveport are 15 to 19 minutes (9,434 commuters, 26.8%) for males and 15 to 19 minutes (10,925 commuters, 29.5%) for females.
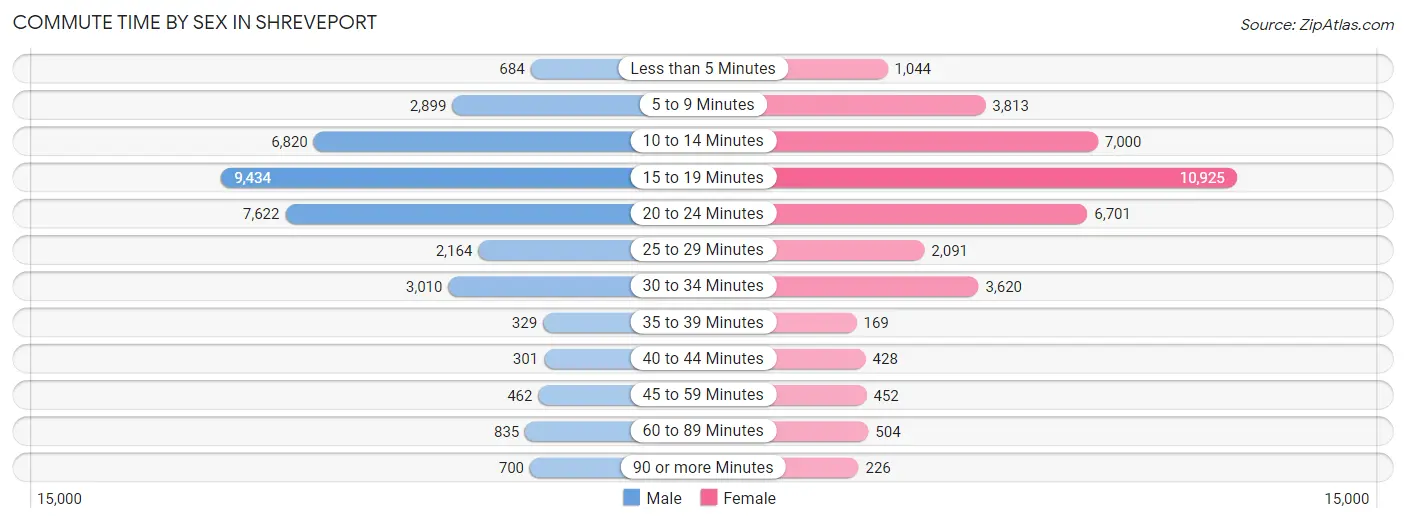
| Commute Time | Male | Female |
| Less than 5 Minutes | 684 (1.9%) | 1,044 (2.8%) |
| 5 to 9 Minutes | 2,899 (8.2%) | 3,813 (10.3%) |
| 10 to 14 Minutes | 6,820 (19.3%) | 7,000 (18.9%) |
| 15 to 19 Minutes | 9,434 (26.8%) | 10,925 (29.5%) |
| 20 to 24 Minutes | 7,622 (21.6%) | 6,701 (18.1%) |
| 25 to 29 Minutes | 2,164 (6.1%) | 2,091 (5.7%) |
| 30 to 34 Minutes | 3,010 (8.5%) | 3,620 (9.8%) |
| 35 to 39 Minutes | 329 (0.9%) | 169 (0.5%) |
| 40 to 44 Minutes | 301 (0.9%) | 428 (1.2%) |
| 45 to 59 Minutes | 462 (1.3%) | 452 (1.2%) |
| 60 to 89 Minutes | 835 (2.4%) | 504 (1.4%) |
| 90 or more Minutes | 700 (2.0%) | 226 (0.6%) |
Time of Departure to Work by Sex in Shreveport
The most frequent times of departure to work in Shreveport are 12:00 AM to 4:59 AM (5,207, 14.8%) for males and 7:30 AM to 7:59 AM (5,503, 14.9%) for females.
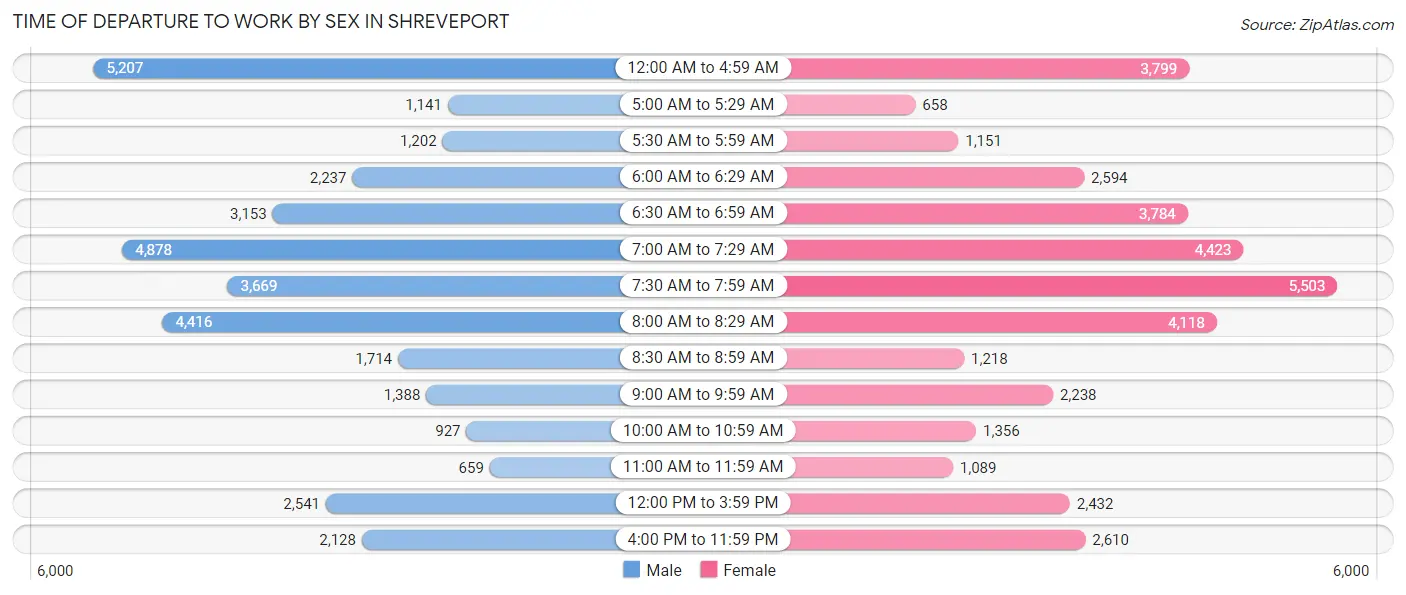
| Time of Departure | Male | Female |
| 12:00 AM to 4:59 AM | 5,207 (14.8%) | 3,799 (10.3%) |
| 5:00 AM to 5:29 AM | 1,141 (3.2%) | 658 (1.8%) |
| 5:30 AM to 5:59 AM | 1,202 (3.4%) | 1,151 (3.1%) |
| 6:00 AM to 6:29 AM | 2,237 (6.3%) | 2,594 (7.0%) |
| 6:30 AM to 6:59 AM | 3,153 (8.9%) | 3,784 (10.2%) |
| 7:00 AM to 7:29 AM | 4,878 (13.8%) | 4,423 (12.0%) |
| 7:30 AM to 7:59 AM | 3,669 (10.4%) | 5,503 (14.9%) |
| 8:00 AM to 8:29 AM | 4,416 (12.5%) | 4,118 (11.1%) |
| 8:30 AM to 8:59 AM | 1,714 (4.9%) | 1,218 (3.3%) |
| 9:00 AM to 9:59 AM | 1,388 (3.9%) | 2,238 (6.0%) |
| 10:00 AM to 10:59 AM | 927 (2.6%) | 1,356 (3.7%) |
| 11:00 AM to 11:59 AM | 659 (1.9%) | 1,089 (2.9%) |
| 12:00 PM to 3:59 PM | 2,541 (7.2%) | 2,432 (6.6%) |
| 4:00 PM to 11:59 PM | 2,128 (6.0%) | 2,610 (7.1%) |
| Total | 35,260 (100.0%) | 36,973 (100.0%) |
Housing Occupancy in Shreveport
Occupancy by Ownership in Shreveport
Of the total 75,184 dwellings in Shreveport, owner-occupied units account for 40,452 (53.8%), while renter-occupied units make up 34,732 (46.2%).
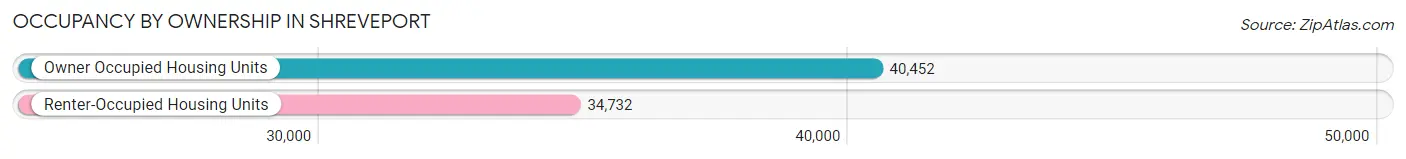
| Occupancy | # Housing Units | % Housing Units |
| Owner Occupied Housing Units | 40,452 | 53.8% |
| Renter-Occupied Housing Units | 34,732 | 46.2% |
| Total Occupied Housing Units | 75,184 | 100.0% |
Occupancy by Household Size in Shreveport
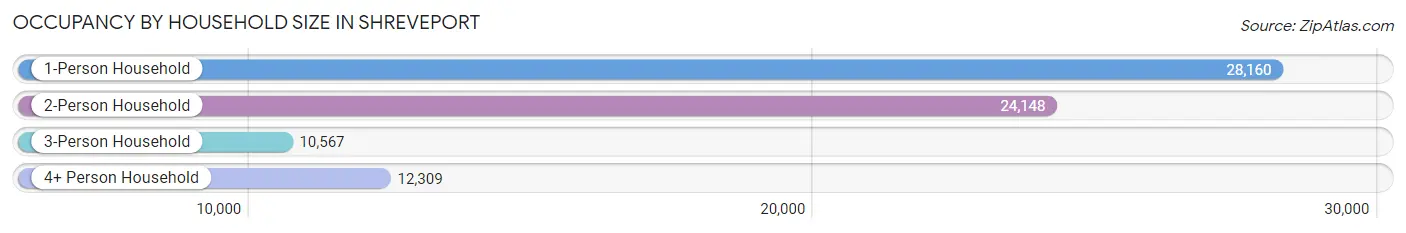
| Household Size | # Housing Units | % Housing Units |
| 1-Person Household | 28,160 | 37.4% |
| 2-Person Household | 24,148 | 32.1% |
| 3-Person Household | 10,567 | 14.1% |
| 4+ Person Household | 12,309 | 16.4% |
| Total Housing Units | 75,184 | 100.0% |
Occupancy by Ownership by Household Size in Shreveport
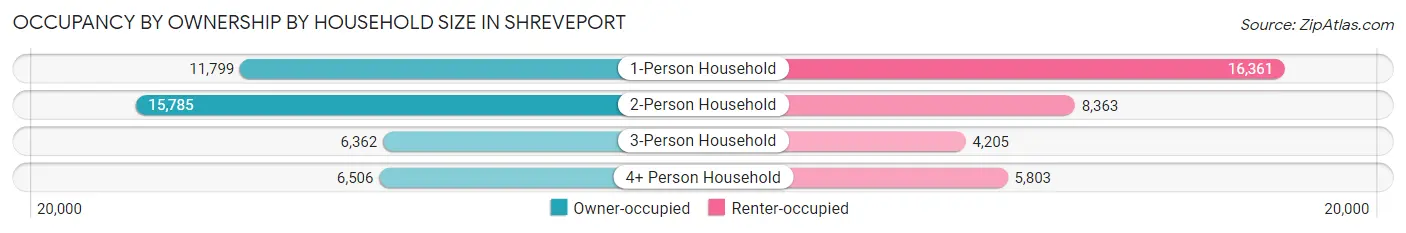
| Household Size | Owner-occupied | Renter-occupied |
| 1-Person Household | 11,799 (41.9%) | 16,361 (58.1%) |
| 2-Person Household | 15,785 (65.4%) | 8,363 (34.6%) |
| 3-Person Household | 6,362 (60.2%) | 4,205 (39.8%) |
| 4+ Person Household | 6,506 (52.9%) | 5,803 (47.1%) |
| Total Housing Units | 40,452 (53.8%) | 34,732 (46.2%) |
Occupancy by Educational Attainment in Shreveport
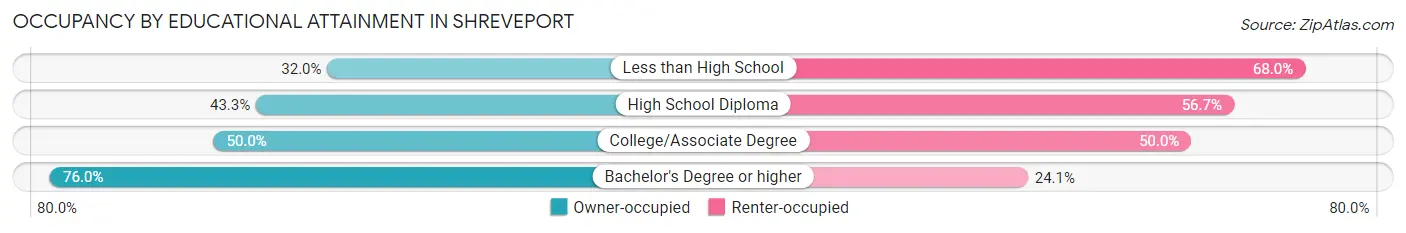
| Household Size | Owner-occupied | Renter-occupied |
| Less than High School | 2,748 (32.0%) | 5,846 (68.0%) |
| High School Diploma | 8,877 (43.3%) | 11,630 (56.7%) |
| College/Associate Degree | 11,924 (50.0%) | 11,905 (50.0%) |
| Bachelor's Degree or higher | 16,903 (75.9%) | 5,351 (24.0%) |
Occupancy by Age of Householder in Shreveport
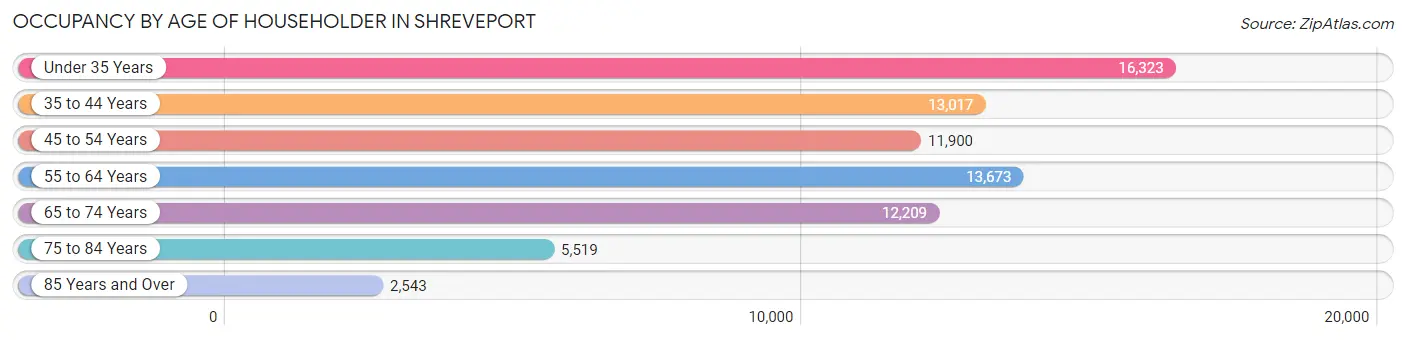
| Age Bracket | # Households | % Households |
| Under 35 Years | 16,323 | 21.7% |
| 35 to 44 Years | 13,017 | 17.3% |
| 45 to 54 Years | 11,900 | 15.8% |
| 55 to 64 Years | 13,673 | 18.2% |
| 65 to 74 Years | 12,209 | 16.2% |
| 75 to 84 Years | 5,519 | 7.3% |
| 85 Years and Over | 2,543 | 3.4% |
| Total | 75,184 | 100.0% |
Housing Finances in Shreveport
Median Income by Occupancy in Shreveport
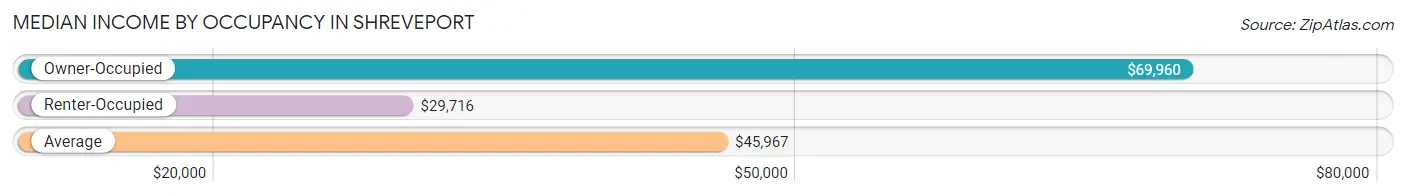
| Occupancy Type | # Households | Median Income |
| Owner-Occupied | 40,452 (53.8%) | $69,960 |
| Renter-Occupied | 34,732 (46.2%) | $29,716 |
| Average | 75,184 (100.0%) | $45,967 |
Occupancy by Householder Income Bracket in Shreveport
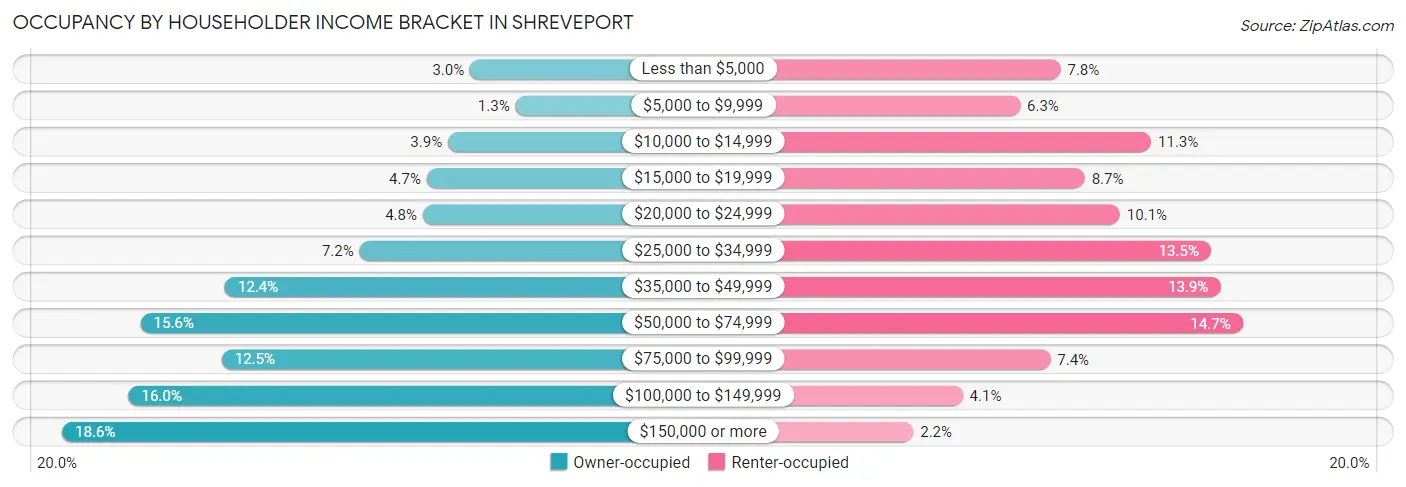
| Income Bracket | Owner-occupied | Renter-occupied |
| Less than $5,000 | 1,224 (3.0%) | 2,712 (7.8%) |
| $5,000 to $9,999 | 524 (1.3%) | 2,177 (6.3%) |
| $10,000 to $14,999 | 1,566 (3.9%) | 3,910 (11.3%) |
| $15,000 to $19,999 | 1,893 (4.7%) | 3,031 (8.7%) |
| $20,000 to $24,999 | 1,952 (4.8%) | 3,499 (10.1%) |
| $25,000 to $34,999 | 2,930 (7.2%) | 4,700 (13.5%) |
| $35,000 to $49,999 | 5,005 (12.4%) | 4,826 (13.9%) |
| $50,000 to $74,999 | 6,303 (15.6%) | 5,121 (14.7%) |
| $75,000 to $99,999 | 5,053 (12.5%) | 2,576 (7.4%) |
| $100,000 to $149,999 | 6,489 (16.0%) | 1,416 (4.1%) |
| $150,000 or more | 7,513 (18.6%) | 764 (2.2%) |
| Total | 40,452 (100.0%) | 34,732 (100.0%) |
Monthly Housing Cost Tiers in Shreveport
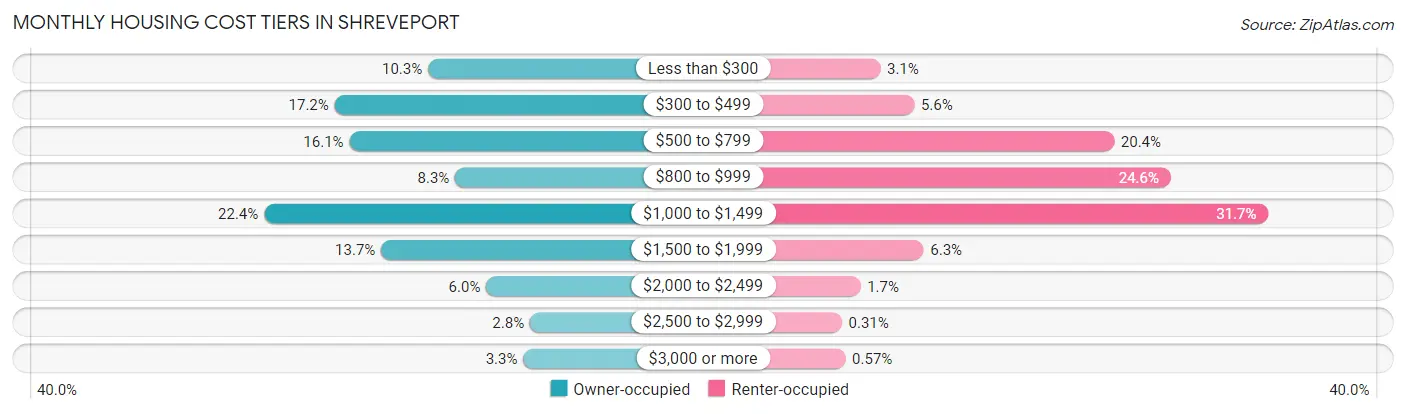
| Monthly Cost | Owner-occupied | Renter-occupied |
| Less than $300 | 4,164 (10.3%) | 1,089 (3.1%) |
| $300 to $499 | 6,947 (17.2%) | 1,960 (5.6%) |
| $500 to $799 | 6,505 (16.1%) | 7,070 (20.4%) |
| $800 to $999 | 3,355 (8.3%) | 8,525 (24.5%) |
| $1,000 to $1,499 | 9,047 (22.4%) | 11,019 (31.7%) |
| $1,500 to $1,999 | 5,560 (13.7%) | 2,198 (6.3%) |
| $2,000 to $2,499 | 2,429 (6.0%) | 584 (1.7%) |
| $2,500 to $2,999 | 1,123 (2.8%) | 108 (0.3%) |
| $3,000 or more | 1,322 (3.3%) | 199 (0.6%) |
| Total | 40,452 (100.0%) | 34,732 (100.0%) |
Physical Housing Characteristics in Shreveport
Housing Structures in Shreveport
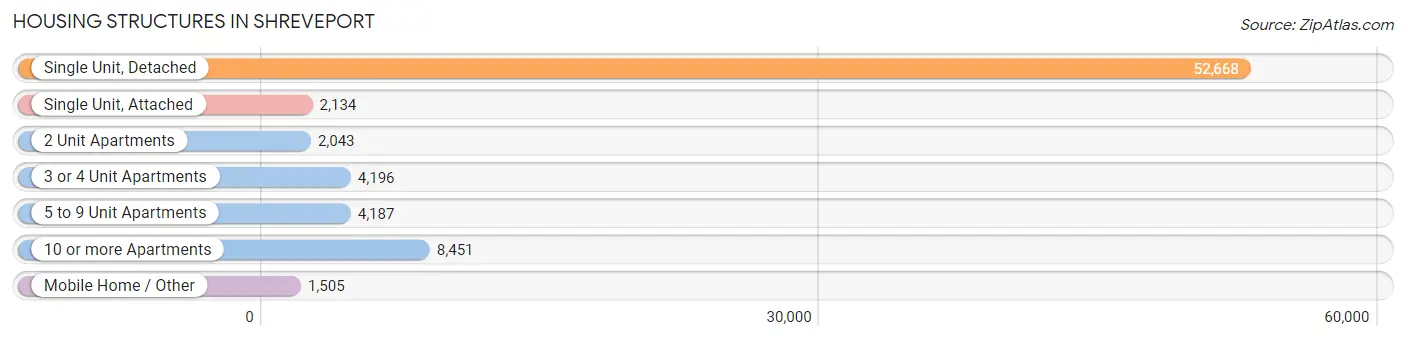
| Structure Type | # Housing Units | % Housing Units |
| Single Unit, Detached | 52,668 | 70.1% |
| Single Unit, Attached | 2,134 | 2.8% |
| 2 Unit Apartments | 2,043 | 2.7% |
| 3 or 4 Unit Apartments | 4,196 | 5.6% |
| 5 to 9 Unit Apartments | 4,187 | 5.6% |
| 10 or more Apartments | 8,451 | 11.2% |
| Mobile Home / Other | 1,505 | 2.0% |
| Total | 75,184 | 100.0% |
Housing Structures by Occupancy in Shreveport
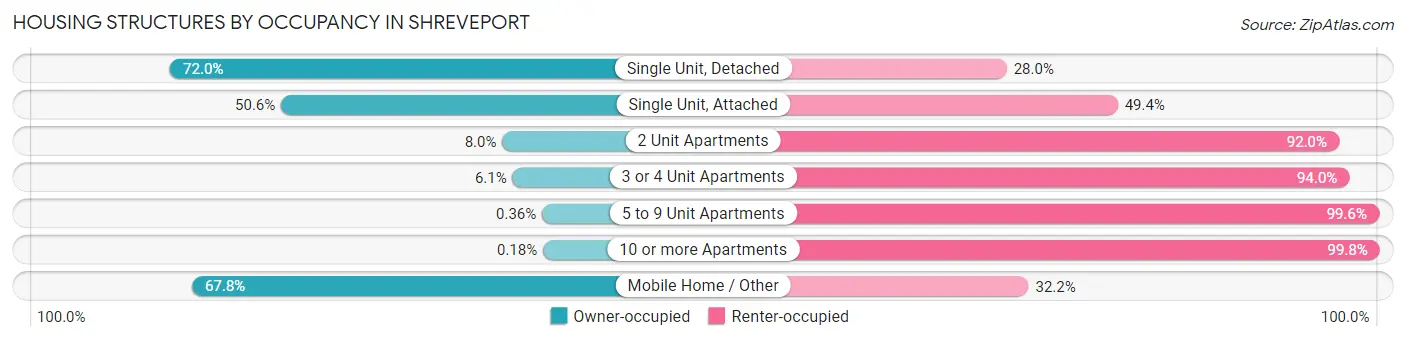
| Structure Type | Owner-occupied | Renter-occupied |
| Single Unit, Detached | 37,904 (72.0%) | 14,764 (28.0%) |
| Single Unit, Attached | 1,080 (50.6%) | 1,054 (49.4%) |
| 2 Unit Apartments | 164 (8.0%) | 1,879 (92.0%) |
| 3 or 4 Unit Apartments | 254 (6.0%) | 3,942 (94.0%) |
| 5 to 9 Unit Apartments | 15 (0.4%) | 4,172 (99.6%) |
| 10 or more Apartments | 15 (0.2%) | 8,436 (99.8%) |
| Mobile Home / Other | 1,020 (67.8%) | 485 (32.2%) |
| Total | 40,452 (53.8%) | 34,732 (46.2%) |
Housing Structures by Number of Rooms in Shreveport
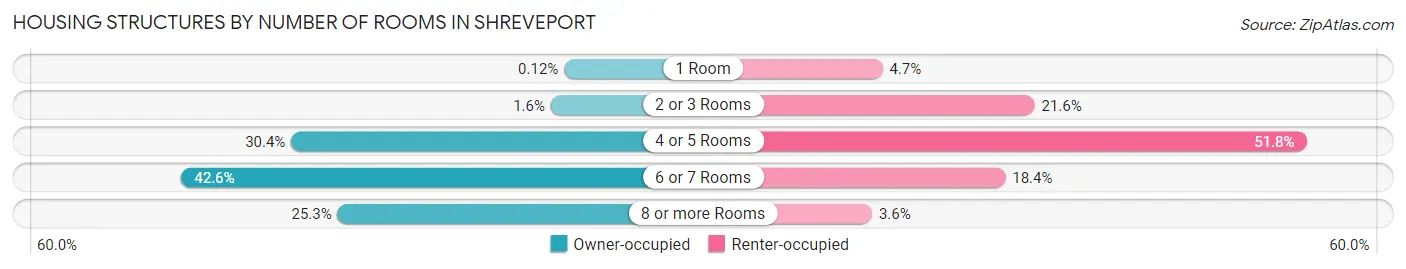
| Number of Rooms | Owner-occupied | Renter-occupied |
| 1 Room | 49 (0.1%) | 1,640 (4.7%) |
| 2 or 3 Rooms | 648 (1.6%) | 7,503 (21.6%) |
| 4 or 5 Rooms | 12,301 (30.4%) | 17,978 (51.8%) |
| 6 or 7 Rooms | 17,231 (42.6%) | 6,375 (18.3%) |
| 8 or more Rooms | 10,223 (25.3%) | 1,236 (3.6%) |
| Total | 40,452 (100.0%) | 34,732 (100.0%) |
Housing Structure by Heating Type in Shreveport
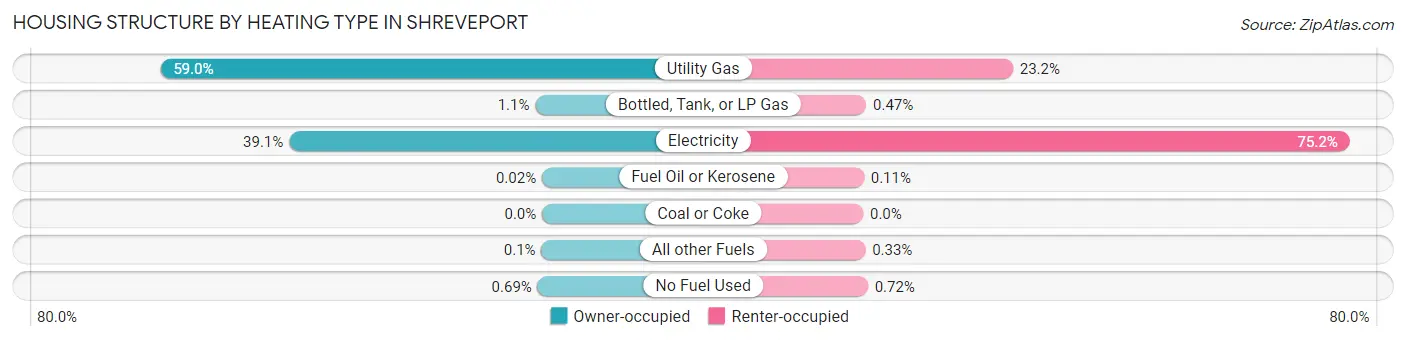
| Heating Type | Owner-occupied | Renter-occupied |
| Utility Gas | 23,880 (59.0%) | 8,041 (23.2%) |
| Bottled, Tank, or LP Gas | 424 (1.1%) | 162 (0.5%) |
| Electricity | 15,822 (39.1%) | 26,127 (75.2%) |
| Fuel Oil or Kerosene | 8 (0.0%) | 39 (0.1%) |
| Coal or Coke | 0 (0.0%) | 0 (0.0%) |
| All other Fuels | 40 (0.1%) | 114 (0.3%) |
| No Fuel Used | 278 (0.7%) | 249 (0.7%) |
| Total | 40,452 (100.0%) | 34,732 (100.0%) |
Household Vehicle Usage in Shreveport
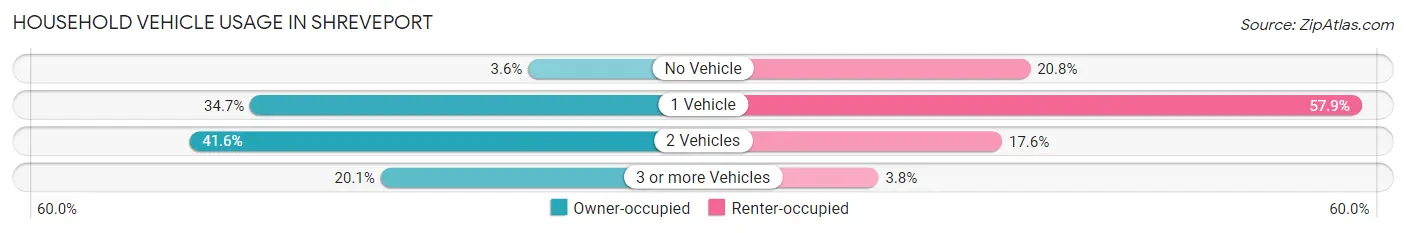
| Vehicles per Household | Owner-occupied | Renter-occupied |
| No Vehicle | 1,454 (3.6%) | 7,211 (20.8%) |
| 1 Vehicle | 14,054 (34.7%) | 20,100 (57.9%) |
| 2 Vehicles | 16,807 (41.5%) | 6,114 (17.6%) |
| 3 or more Vehicles | 8,137 (20.1%) | 1,307 (3.8%) |
| Total | 40,452 (100.0%) | 34,732 (100.0%) |
Real Estate & Mortgages in Shreveport
Real Estate and Mortgage Overview in Shreveport
| Characteristic | Without Mortgage | With Mortgage |
| Housing Units | 17,033 | 23,419 |
| Median Property Value | $137,700 | $182,100 |
| Median Household Income | $50,668 | $5,185 |
| Monthly Housing Costs | $429 | $1,286 |
| Real Estate Taxes | $815 | $2,026 |
Property Value by Mortgage Status in Shreveport
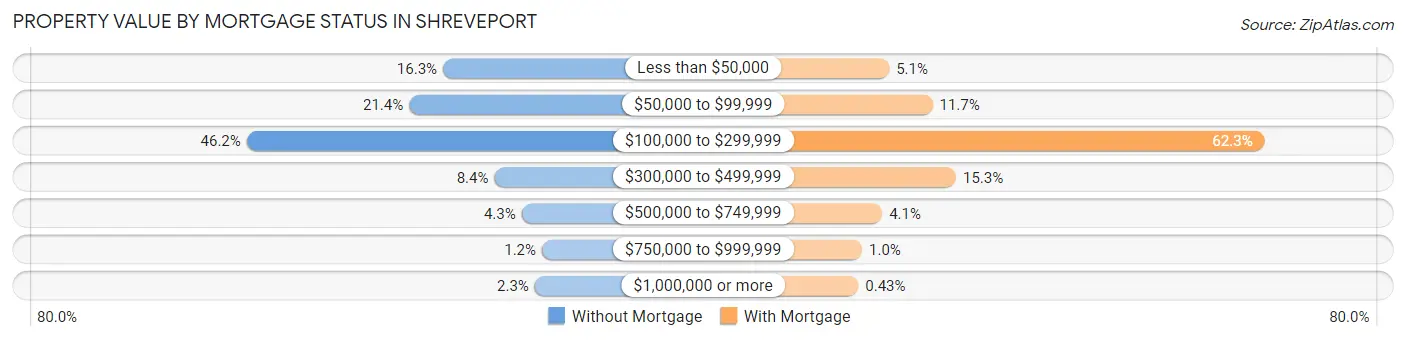
| Property Value | Without Mortgage | With Mortgage |
| Less than $50,000 | 2,770 (16.3%) | 1,202 (5.1%) |
| $50,000 to $99,999 | 3,648 (21.4%) | 2,747 (11.7%) |
| $100,000 to $299,999 | 7,864 (46.2%) | 14,595 (62.3%) |
| $300,000 to $499,999 | 1,436 (8.4%) | 3,588 (15.3%) |
| $500,000 to $749,999 | 728 (4.3%) | 953 (4.1%) |
| $750,000 to $999,999 | 201 (1.2%) | 234 (1.0%) |
| $1,000,000 or more | 386 (2.3%) | 100 (0.4%) |
| Total | 17,033 (100.0%) | 23,419 (100.0%) |
Household Income by Mortgage Status in Shreveport
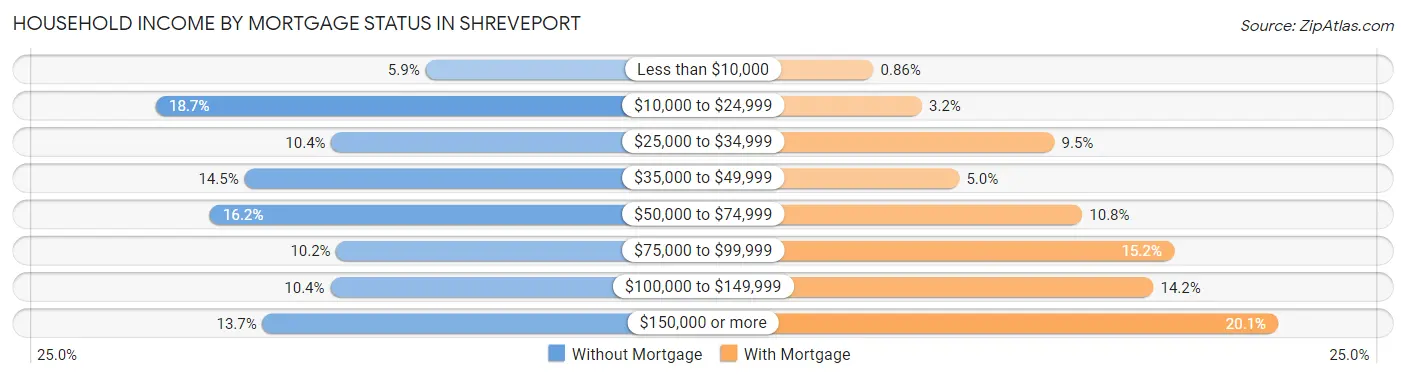
| Household Income | Without Mortgage | With Mortgage |
| Less than $10,000 | 1,006 (5.9%) | 201 (0.9%) |
| $10,000 to $24,999 | 3,192 (18.7%) | 742 (3.2%) |
| $25,000 to $34,999 | 1,770 (10.4%) | 2,219 (9.5%) |
| $35,000 to $49,999 | 2,475 (14.5%) | 1,160 (5.0%) |
| $50,000 to $74,999 | 2,754 (16.2%) | 2,530 (10.8%) |
| $75,000 to $99,999 | 1,729 (10.2%) | 3,549 (15.1%) |
| $100,000 to $149,999 | 1,779 (10.4%) | 3,324 (14.2%) |
| $150,000 or more | 2,328 (13.7%) | 4,710 (20.1%) |
| Total | 17,033 (100.0%) | 23,419 (100.0%) |
Property Value to Household Income Ratio in Shreveport
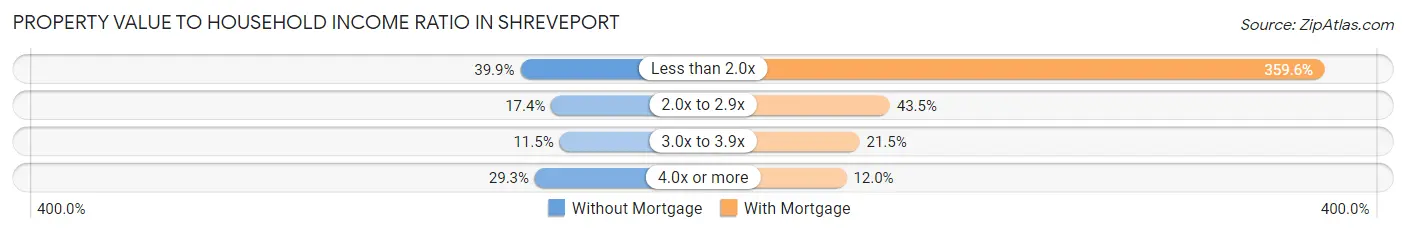
| Value-to-Income Ratio | Without Mortgage | With Mortgage |
| Less than 2.0x | 6,792 (39.9%) | 84,205 (359.6%) |
| 2.0x to 2.9x | 2,965 (17.4%) | 10,194 (43.5%) |
| 3.0x to 3.9x | 1,950 (11.5%) | 5,043 (21.5%) |
| 4.0x or more | 4,997 (29.3%) | 2,811 (12.0%) |
| Total | 17,033 (100.0%) | 23,419 (100.0%) |
Real Estate Taxes by Mortgage Status in Shreveport
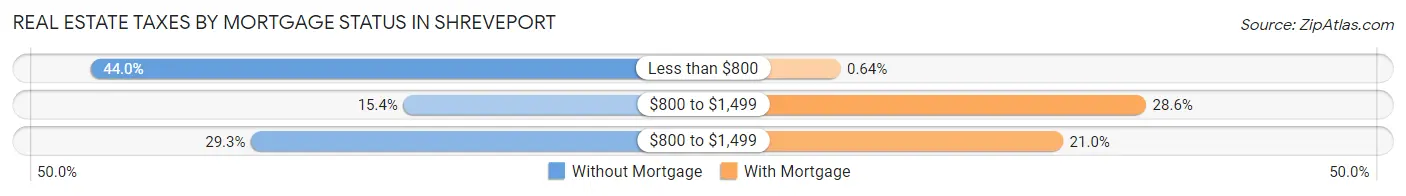
| Property Taxes | Without Mortgage | With Mortgage |
| Less than $800 | 7,494 (44.0%) | 149 (0.6%) |
| $800 to $1,499 | 2,619 (15.4%) | 6,687 (28.5%) |
| $800 to $1,499 | 4,990 (29.3%) | 4,910 (21.0%) |
| Total | 17,033 (100.0%) | 23,419 (100.0%) |
Health & Disability in Shreveport
Health Insurance Coverage by Age in Shreveport
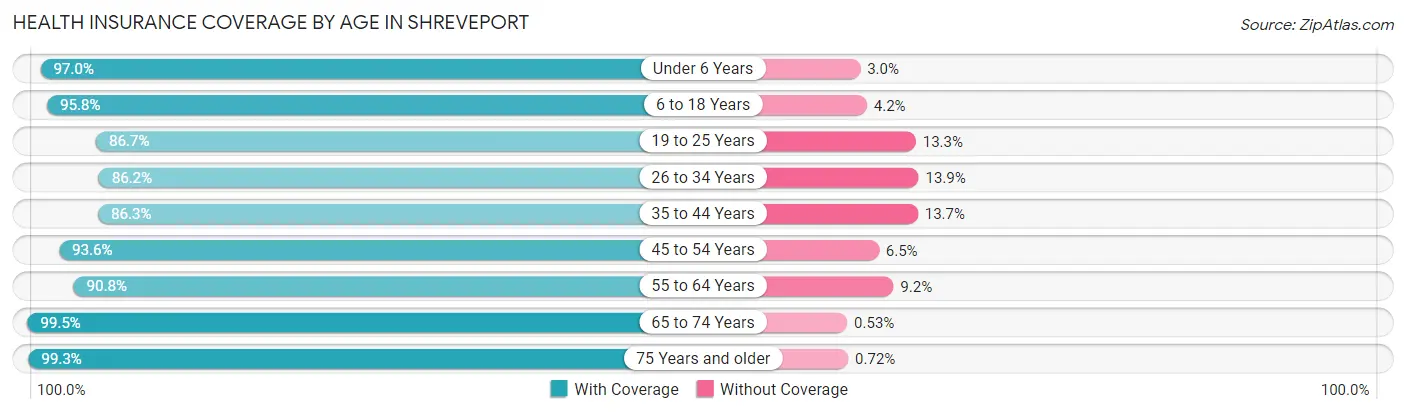
| Age Bracket | With Coverage | Without Coverage |
| Under 6 Years | 13,763 (97.0%) | 422 (3.0%) |
| 6 to 18 Years | 31,031 (95.8%) | 1,362 (4.2%) |
| 19 to 25 Years | 13,845 (86.7%) | 2,130 (13.3%) |
| 26 to 34 Years | 20,065 (86.2%) | 3,225 (13.9%) |
| 35 to 44 Years | 19,646 (86.3%) | 3,121 (13.7%) |
| 45 to 54 Years | 18,780 (93.5%) | 1,295 (6.5%) |
| 55 to 64 Years | 20,609 (90.8%) | 2,079 (9.2%) |
| 65 to 74 Years | 18,118 (99.5%) | 96 (0.5%) |
| 75 Years and older | 11,917 (99.3%) | 87 (0.7%) |
| Total | 167,774 (92.4%) | 13,817 (7.6%) |
Health Insurance Coverage by Citizenship Status in Shreveport
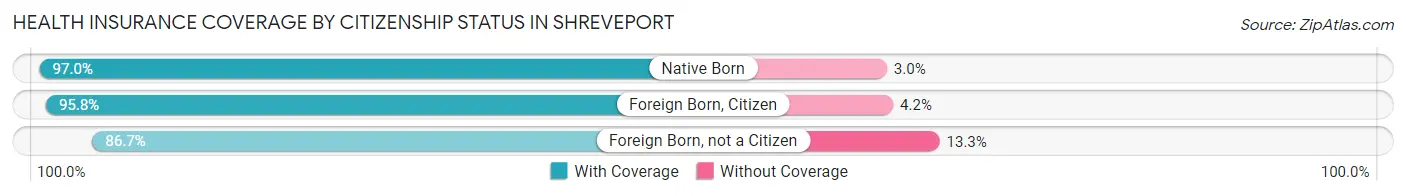
| Citizenship Status | With Coverage | Without Coverage |
| Native Born | 13,763 (97.0%) | 422 (3.0%) |
| Foreign Born, Citizen | 31,031 (95.8%) | 1,362 (4.2%) |
| Foreign Born, not a Citizen | 13,845 (86.7%) | 2,130 (13.3%) |
Health Insurance Coverage by Household Income in Shreveport
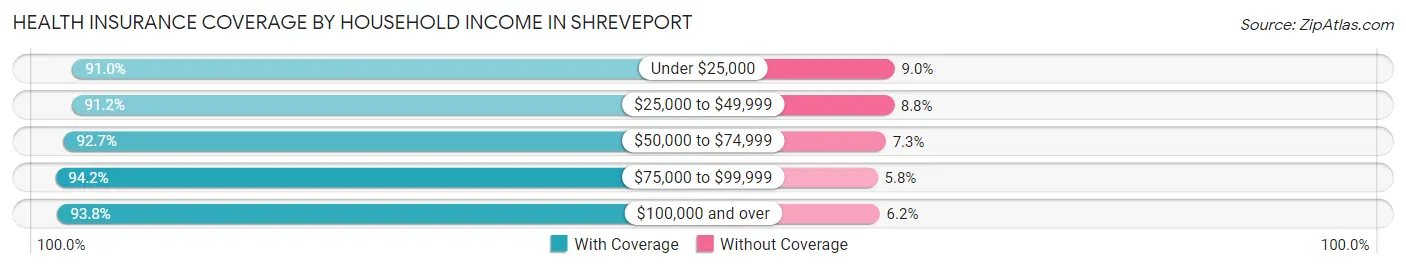
| Household Income | With Coverage | Without Coverage |
| Under $25,000 | 39,904 (91.0%) | 3,928 (9.0%) |
| $25,000 to $49,999 | 37,223 (91.2%) | 3,593 (8.8%) |
| $50,000 to $74,999 | 26,065 (92.7%) | 2,054 (7.3%) |
| $75,000 to $99,999 | 19,634 (94.2%) | 1,203 (5.8%) |
| $100,000 and over | 43,992 (93.8%) | 2,890 (6.2%) |
Public vs Private Health Insurance Coverage by Age in Shreveport
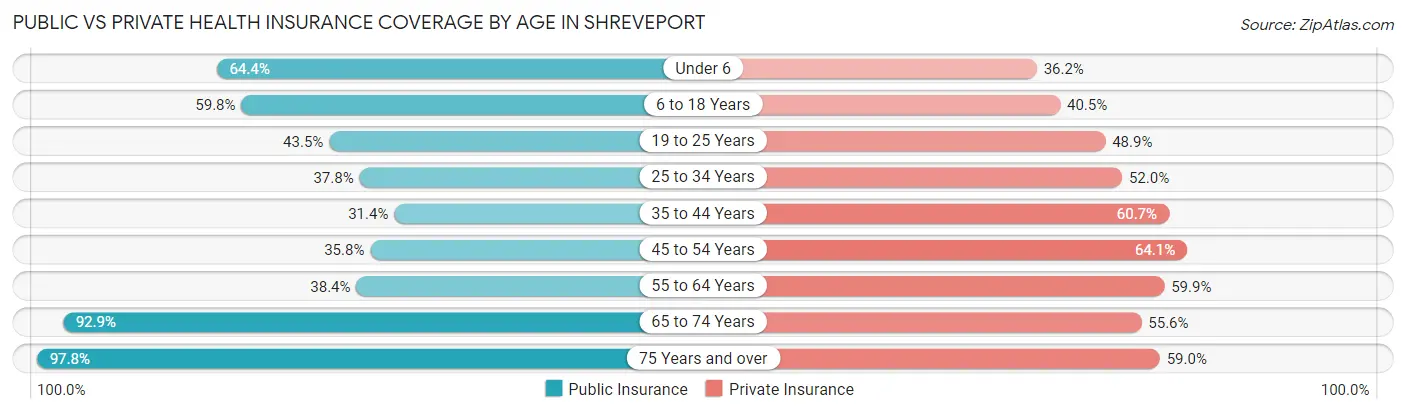
| Age Bracket | Public Insurance | Private Insurance |
| Under 6 | 9,132 (64.4%) | 5,132 (36.2%) |
| 6 to 18 Years | 19,362 (59.8%) | 13,121 (40.5%) |
| 19 to 25 Years | 6,944 (43.5%) | 7,811 (48.9%) |
| 25 to 34 Years | 8,812 (37.8%) | 12,113 (52.0%) |
| 35 to 44 Years | 7,146 (31.4%) | 13,820 (60.7%) |
| 45 to 54 Years | 7,194 (35.8%) | 12,862 (64.1%) |
| 55 to 64 Years | 8,717 (38.4%) | 13,579 (59.9%) |
| 65 to 74 Years | 16,924 (92.9%) | 10,127 (55.6%) |
| 75 Years and over | 11,734 (97.8%) | 7,084 (59.0%) |
| Total | 95,965 (52.8%) | 95,649 (52.7%) |
Disability Status by Sex by Age in Shreveport
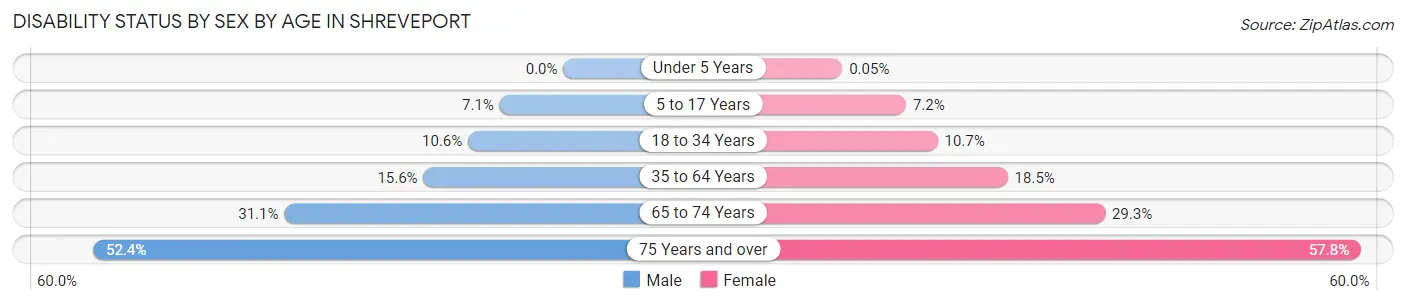
| Age Bracket | Male | Female |
| Under 5 Years | 0 (0.0%) | 3 (0.1%) |
| 5 to 17 Years | 1,146 (7.1%) | 1,160 (7.1%) |
| 18 to 34 Years | 2,082 (10.6%) | 2,338 (10.7%) |
| 35 to 64 Years | 4,701 (15.6%) | 6,528 (18.5%) |
| 65 to 74 Years | 2,599 (31.1%) | 2,888 (29.3%) |
| 75 Years and over | 2,362 (52.4%) | 4,333 (57.8%) |
Disability Class by Sex by Age in Shreveport
Disability Class: Hearing Difficulty
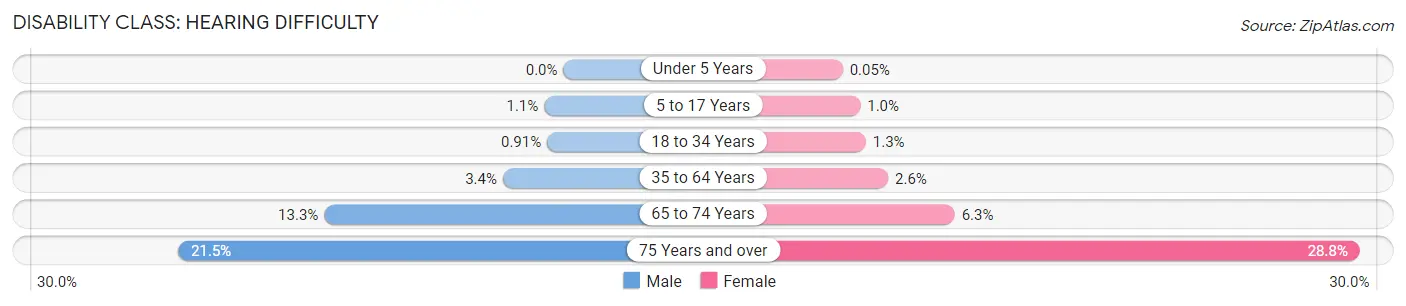
| Age Bracket | Male | Female |
| Under 5 Years | 0 (0.0%) | 3 (0.1%) |
| 5 to 17 Years | 173 (1.1%) | 167 (1.0%) |
| 18 to 34 Years | 178 (0.9%) | 293 (1.3%) |
| 35 to 64 Years | 1,016 (3.4%) | 912 (2.6%) |
| 65 to 74 Years | 1,114 (13.3%) | 620 (6.3%) |
| 75 Years and over | 968 (21.5%) | 2,161 (28.8%) |
Disability Class: Vision Difficulty
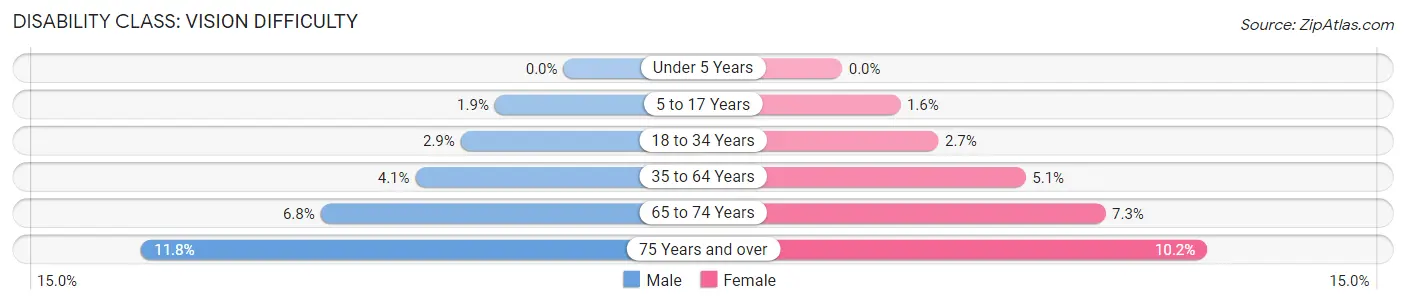
| Age Bracket | Male | Female |
| Under 5 Years | 0 (0.0%) | 0 (0.0%) |
| 5 to 17 Years | 309 (1.9%) | 262 (1.6%) |
| 18 to 34 Years | 561 (2.9%) | 588 (2.7%) |
| 35 to 64 Years | 1,243 (4.1%) | 1,807 (5.1%) |
| 65 to 74 Years | 565 (6.8%) | 722 (7.3%) |
| 75 Years and over | 530 (11.7%) | 762 (10.2%) |
Disability Class: Cognitive Difficulty
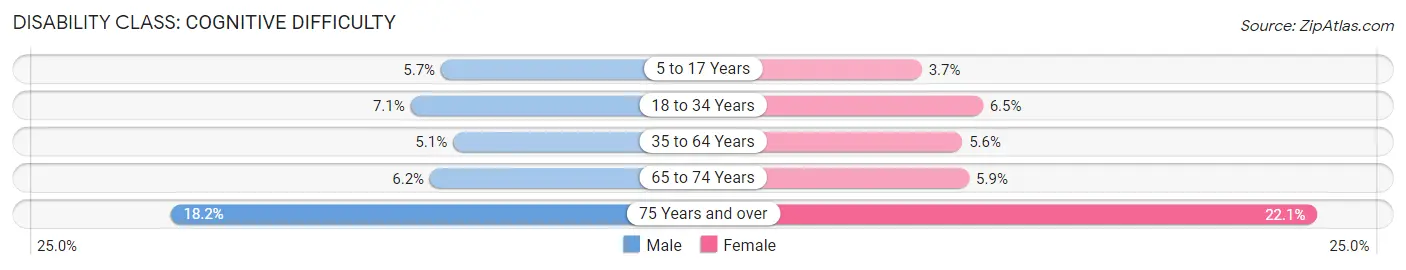
| Age Bracket | Male | Female |
| 5 to 17 Years | 919 (5.7%) | 601 (3.7%) |
| 18 to 34 Years | 1,391 (7.1%) | 1,434 (6.5%) |
| 35 to 64 Years | 1,546 (5.1%) | 1,977 (5.6%) |
| 65 to 74 Years | 518 (6.2%) | 582 (5.9%) |
| 75 Years and over | 822 (18.2%) | 1,653 (22.1%) |
Disability Class: Ambulatory Difficulty
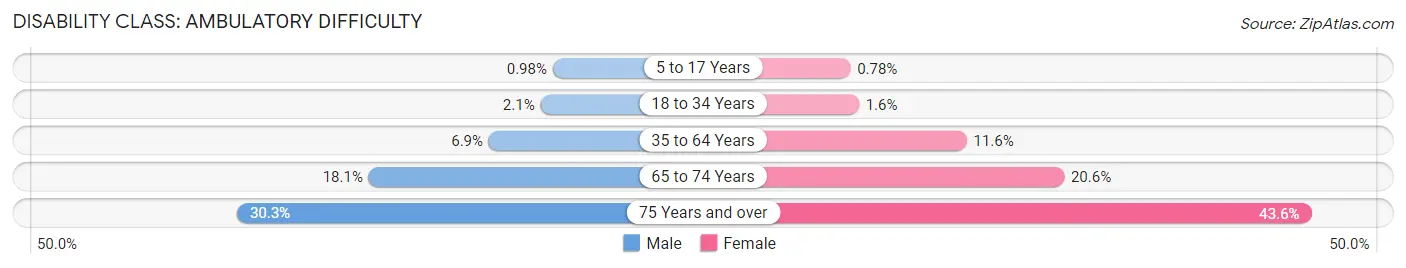
| Age Bracket | Male | Female |
| 5 to 17 Years | 158 (1.0%) | 126 (0.8%) |
| 18 to 34 Years | 417 (2.1%) | 345 (1.6%) |
| 35 to 64 Years | 2,086 (6.9%) | 4,094 (11.6%) |
| 65 to 74 Years | 1,510 (18.1%) | 2,031 (20.6%) |
| 75 Years and over | 1,366 (30.3%) | 3,266 (43.6%) |
Disability Class: Self-Care Difficulty
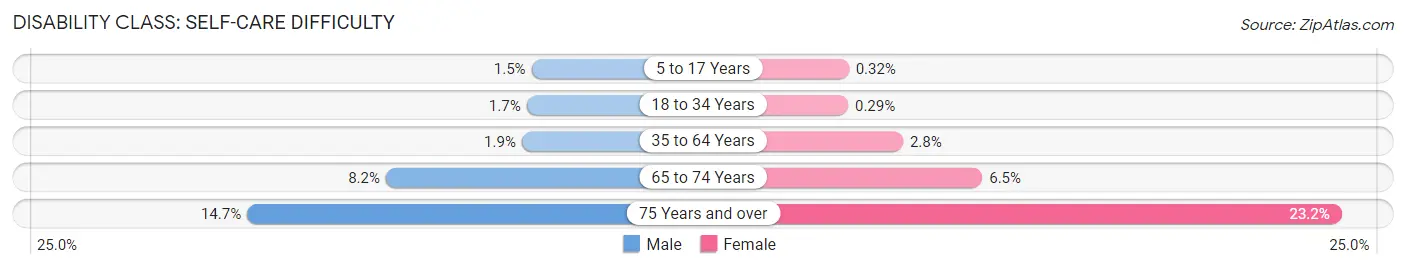
| Age Bracket | Male | Female |
| 5 to 17 Years | 240 (1.5%) | 52 (0.3%) |
| 18 to 34 Years | 335 (1.7%) | 63 (0.3%) |
| 35 to 64 Years | 581 (1.9%) | 1,005 (2.8%) |
| 65 to 74 Years | 689 (8.2%) | 642 (6.5%) |
| 75 Years and over | 662 (14.7%) | 1,738 (23.2%) |
Technology Access in Shreveport
Computing Device Access in Shreveport
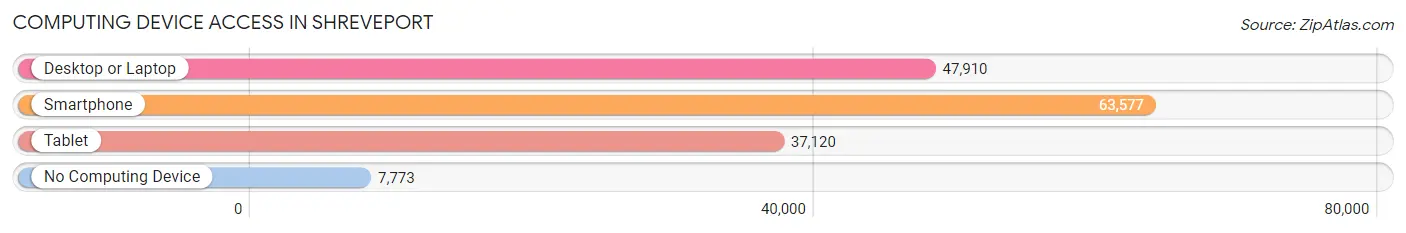
| Device Type | # Households | % Households |
| Desktop or Laptop | 47,910 | 63.7% |
| Smartphone | 63,577 | 84.6% |
| Tablet | 37,120 | 49.4% |
| No Computing Device | 7,773 | 10.3% |
| Total | 75,184 | 100.0% |
Internet Access in Shreveport
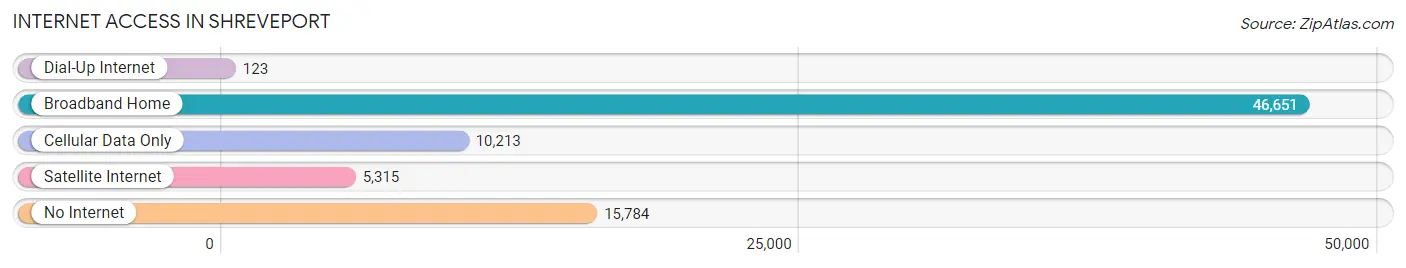
| Internet Type | # Households | % Households |
| Dial-Up Internet | 123 | 0.2% |
| Broadband Home | 46,651 | 62.1% |
| Cellular Data Only | 10,213 | 13.6% |
| Satellite Internet | 5,315 | 7.1% |
| No Internet | 15,784 | 21.0% |
| Total | 75,184 | 100.0% |
Shreveport Summary
Shreveport is a city located in the northwestern corner of Louisiana, United States. It is the third-largest city in the state and the seat of Caddo Parish. It is located on the Red River and is the commercial, cultural, and educational center of the Ark-La-Tex region, which includes parts of Arkansas, Louisiana, and Texas.
History
Shreveport was founded in 1836 by the Shreve Town Company, a group of investors led by Captain Henry Miller Shreve, who cleared the Red River to make way for steamboat navigation. The city was named after Shreve, who was responsible for the removal of the Great Raft, a vast logjam on the Red River that had previously blocked navigation.
The city quickly grew and became a major port and railroad center. During the Civil War, Shreveport was the capital of Louisiana from 1863 to 1865, and the Confederate Army had a strong presence in the city. After the war, the city experienced a period of economic growth, and by the early 20th century, it had become a major center for oil and gas production.
Geography
Shreveport is located in the northwestern corner of Louisiana, at the intersection of the Red River and the Texas border. The city covers an area of approximately 97 square miles and is situated at an elevation of approximately 200 feet above sea level. The climate is humid subtropical, with hot, humid summers and mild winters.
The city is divided into four distinct geographic regions: the downtown area, the north side, the south side, and the west side. The downtown area is the commercial and cultural center of the city, while the north side is primarily residential. The south side is home to the city's industrial and manufacturing centers, and the west side is largely rural.
Economy
Shreveport's economy is largely based on the oil and gas industry, which has been a major source of employment and economic growth for the city since the early 20th century. The city is also home to a number of manufacturing and service-based businesses, including a large medical center and a number of casinos.
The city is also home to a number of educational institutions, including Louisiana State University Shreveport, Centenary College of Louisiana, and Southern University at Shreveport. These institutions provide a number of educational and research opportunities for the city's residents.
Demographics
As of the 2010 census, Shreveport had a population of 199,311. The racial makeup of the city was 57.2% African American, 37.2% White, 1.2% Asian, 0.7% Native American, 0.1% Pacific Islander, and 3.6% from other races. The median household income was $33,922, and the median family income was $41,945.
Shreveport is home to a number of religious denominations, including Baptist, Catholic, Methodist, and Presbyterian. The city is also home to a number of cultural institutions, including the Shreveport Symphony Orchestra, the Shreveport Opera, and the Shreveport Little Theatre.
Conclusion
Shreveport is a vibrant city located in the northwestern corner of Louisiana. It is the third-largest city in the state and the seat of Caddo Parish. The city is home to a number of industries, educational institutions, and cultural institutions, and its economy is largely based on the oil and gas industry. The city has a diverse population, with a majority of African Americans and a significant minority of Whites, Asians, and other races.
Common Questions
What is Per Capita Income in Shreveport?
Per Capita income in Shreveport is $32,291.
What is the Median Family Income in Shreveport?
Median Family Income in Shreveport is $63,112.
What is the Median Household income in Shreveport?
Median Household Income in Shreveport is $45,967.
What is Income or Wage Gap in Shreveport?
Income or Wage Gap in Shreveport is 30.1%.
Women in Shreveport earn 69.9 cents for every dollar earned by a man.
What is Family Income Deficit in Shreveport?
Family Income Deficit in Shreveport is $11,311.
Families that are below poverty line in Shreveport earn $11,311 less on average than the poverty threshold level.
What is Inequality or Gini Index in Shreveport?
Inequality or Gini Index in Shreveport is 0.54.
What is the Total Population of Shreveport?
Total Population of Shreveport is 186,183.
What is the Total Male Population of Shreveport?
Total Male Population of Shreveport is 87,763.
What is the Total Female Population of Shreveport?
Total Female Population of Shreveport is 98,420.
What is the Ratio of Males per 100 Females in Shreveport?
There are 89.17 Males per 100 Females in Shreveport.
What is the Ratio of Females per 100 Males in Shreveport?
There are 112.14 Females per 100 Males in Shreveport.
What is the Median Population Age in Shreveport?
Median Population Age in Shreveport is 37.1 Years.
What is the Average Family Size in Shreveport
Average Family Size in Shreveport is 3.3 People.
What is the Average Household Size in Shreveport
Average Household Size in Shreveport is 2.4 People.
How Large is the Labor Force in Shreveport?
There are 84,930 People in the Labor Forcein in Shreveport.
What is the Percentage of People in the Labor Force in Shreveport?
57.7% of People are in the Labor Force in Shreveport.
What is the Unemployment Rate in Shreveport?
Unemployment Rate in Shreveport is 9.2%.