St Anthony city Hennepin and Ramsey Counties, MN Map & Demographics
St Anthony city Hennepin and Ramsey Counties Overview
$56,563
PER CAPITA INCOME
$120,227
AVG FAMILY INCOME
$91,955
AVG HOUSEHOLD INCOME
25.2%
WAGE / INCOME GAP [ % ]
74.8¢/ $1
WAGE / INCOME GAP [ $ ]
0.48
INEQUALITY / GINI INDEX
9,332
TOTAL POPULATION
4,881
MALE POPULATION
4,451
FEMALE POPULATION
109.66
MALES / 100 FEMALES
91.19
FEMALES / 100 MALES
41.0
MEDIAN AGE
3.1
AVG FAMILY SIZE
2.3
AVG HOUSEHOLD SIZE
4,675
LABOR FORCE [ PEOPLE ]
64.1%
PERCENT IN LABOR FORCE
1.8%
UNEMPLOYMENT RATE
Income in St Anthony city Hennepin and Ramsey Counties
Income Overview in St Anthony city Hennepin and Ramsey Counties
Per Capita Income in St Anthony city Hennepin and Ramsey Counties is $56,563, while median incomes of families and households are $120,227 and $91,955 respectively.
| Characteristic | Number | Measure |
| Per Capita Income | 9,332 | $56,563 |
| Median Family Income | 2,222 | $120,227 |
| Mean Family Income | 2,222 | $177,708 |
| Median Household Income | 4,022 | $91,955 |
| Mean Household Income | 4,022 | $129,922 |
| Income Deficit | 2,222 | $0 |
| Wage / Income Gap (%) | 9,332 | 25.16% |
| Wage / Income Gap ($) | 9,332 | 74.84¢ per $1 |
| Gini / Inequality Index | 9,332 | 0.48 |
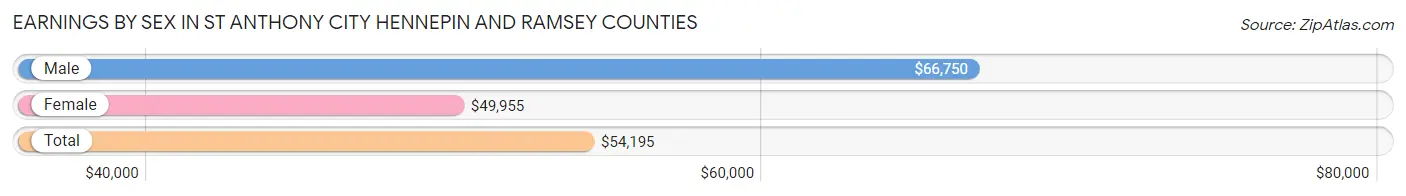
Earnings by Sex in St Anthony city Hennepin and Ramsey Counties
Average Earnings in St Anthony city Hennepin and Ramsey Counties are $54,195, $66,750 for men and $49,955 for women, a difference of 25.2%.
| Sex | Number | Average Earnings |
| Male | 2,568 (52.0%) | $66,750 |
| Female | 2,368 (48.0%) | $49,955 |
| Total | 4,936 (100.0%) | $54,195 |
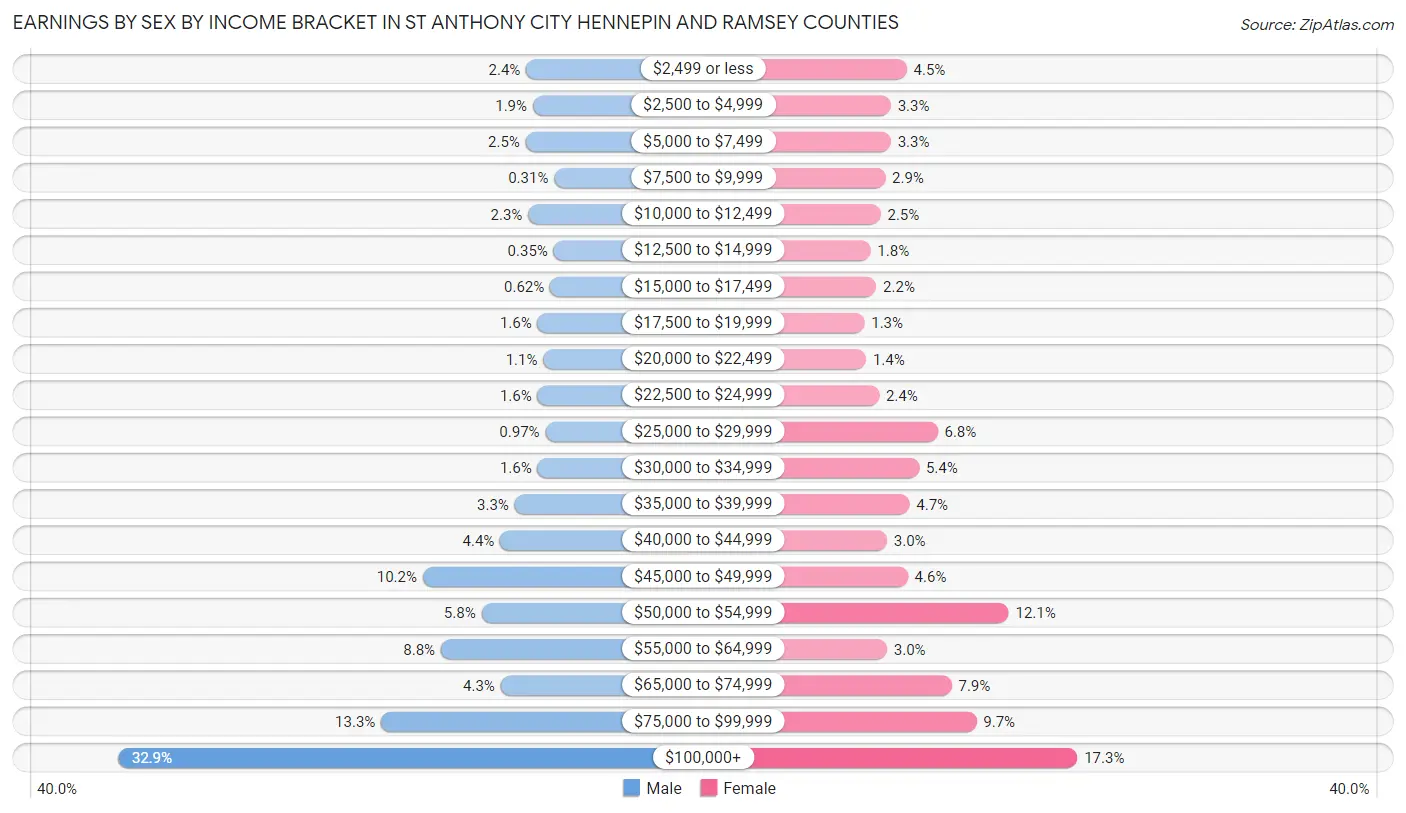
Earnings by Sex by Income Bracket in St Anthony city Hennepin and Ramsey Counties
The most common earnings brackets in St Anthony city Hennepin and Ramsey Counties are $100,000+ for men (846 | 32.9%) and $100,000+ for women (409 | 17.3%).
| Income | Male | Female |
| $2,499 or less | 62 (2.4%) | 106 (4.5%) |
| $2,500 to $4,999 | 49 (1.9%) | 78 (3.3%) |
| $5,000 to $7,499 | 63 (2.5%) | 78 (3.3%) |
| $7,500 to $9,999 | 8 (0.3%) | 68 (2.9%) |
| $10,000 to $12,499 | 58 (2.3%) | 60 (2.5%) |
| $12,500 to $14,999 | 9 (0.4%) | 42 (1.8%) |
| $15,000 to $17,499 | 16 (0.6%) | 52 (2.2%) |
| $17,500 to $19,999 | 40 (1.6%) | 31 (1.3%) |
| $20,000 to $22,499 | 29 (1.1%) | 34 (1.4%) |
| $22,500 to $24,999 | 40 (1.6%) | 57 (2.4%) |
| $25,000 to $29,999 | 25 (1.0%) | 161 (6.8%) |
| $30,000 to $34,999 | 40 (1.6%) | 128 (5.4%) |
| $35,000 to $39,999 | 84 (3.3%) | 111 (4.7%) |
| $40,000 to $44,999 | 112 (4.4%) | 71 (3.0%) |
| $45,000 to $49,999 | 261 (10.2%) | 108 (4.6%) |
| $50,000 to $54,999 | 148 (5.8%) | 287 (12.1%) |
| $55,000 to $64,999 | 226 (8.8%) | 71 (3.0%) |
| $65,000 to $74,999 | 111 (4.3%) | 186 (7.9%) |
| $75,000 to $99,999 | 341 (13.3%) | 230 (9.7%) |
| $100,000+ | 846 (32.9%) | 409 (17.3%) |
| Total | 2,568 (100.0%) | 2,368 (100.0%) |
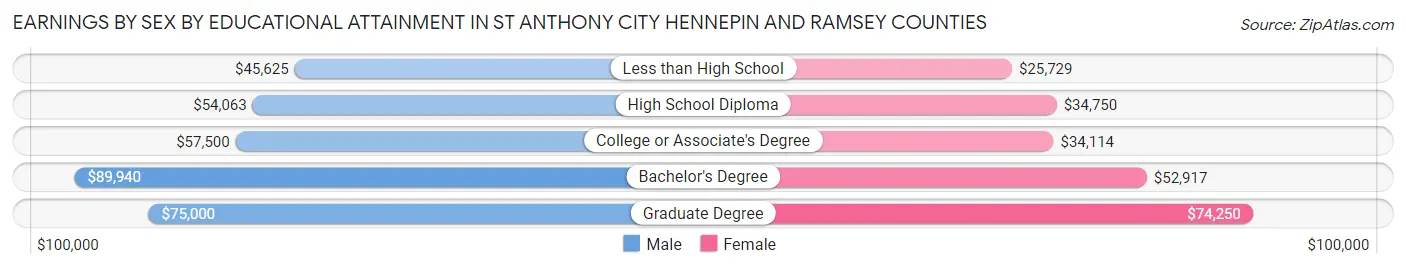
Earnings by Sex by Educational Attainment in St Anthony city Hennepin and Ramsey Counties
Average earnings in St Anthony city Hennepin and Ramsey Counties are $68,224 for men and $51,753 for women, a difference of 24.1%. Men with an educational attainment of bachelor's degree enjoy the highest average annual earnings of $89,940, while those with less than high school education earn the least with $45,625. Women with an educational attainment of graduate degree earn the most with the average annual earnings of $74,250, while those with less than high school education have the smallest earnings of $25,729.
| Educational Attainment | Male Income | Female Income |
| Less than High School | $45,625 | $25,729 |
| High School Diploma | $54,063 | $34,750 |
| College or Associate's Degree | $57,500 | $34,114 |
| Bachelor's Degree | $89,940 | $52,917 |
| Graduate Degree | $75,000 | $74,250 |
| Total | $68,224 | $51,753 |
Family Income in St Anthony city Hennepin and Ramsey Counties
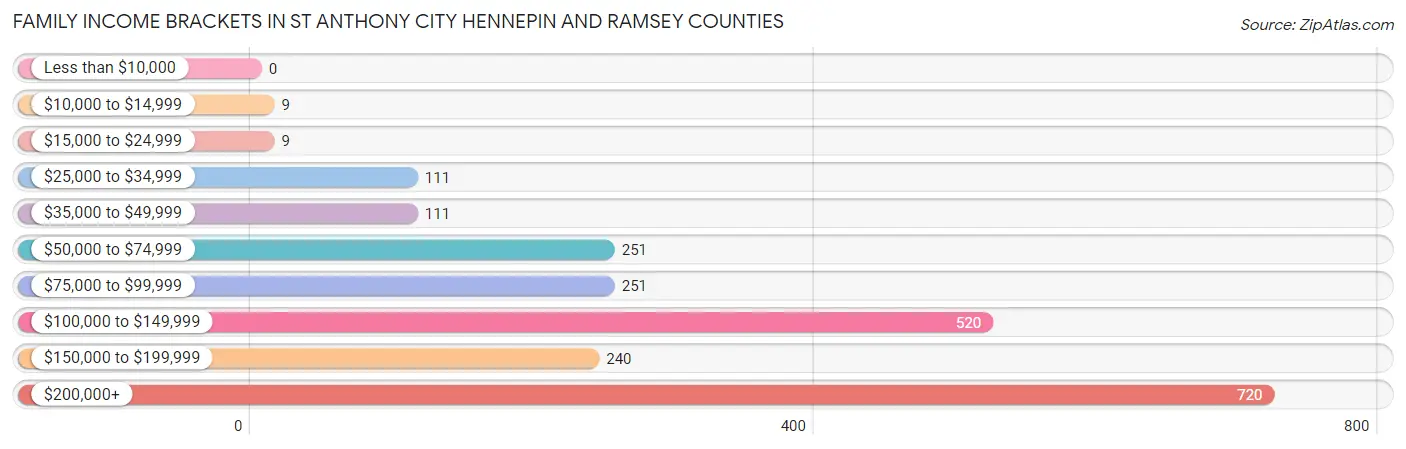
Family Income Brackets in St Anthony city Hennepin and Ramsey Counties
According to the St Anthony city Hennepin and Ramsey Counties family income data, there are 720 families falling into the $200,000+ income range, which is the most common income bracket and makes up 32.4% of all families.
| Income Bracket | # Families | % Families |
| Less than $10,000 | 0 | 0.0% |
| $10,000 to $14,999 | 9 | 0.4% |
| $15,000 to $24,999 | 9 | 0.4% |
| $25,000 to $34,999 | 111 | 5.0% |
| $35,000 to $49,999 | 111 | 5.0% |
| $50,000 to $74,999 | 251 | 11.3% |
| $75,000 to $99,999 | 251 | 11.3% |
| $100,000 to $149,999 | 520 | 23.4% |
| $150,000 to $199,999 | 240 | 10.8% |
| $200,000+ | 720 | 32.4% |
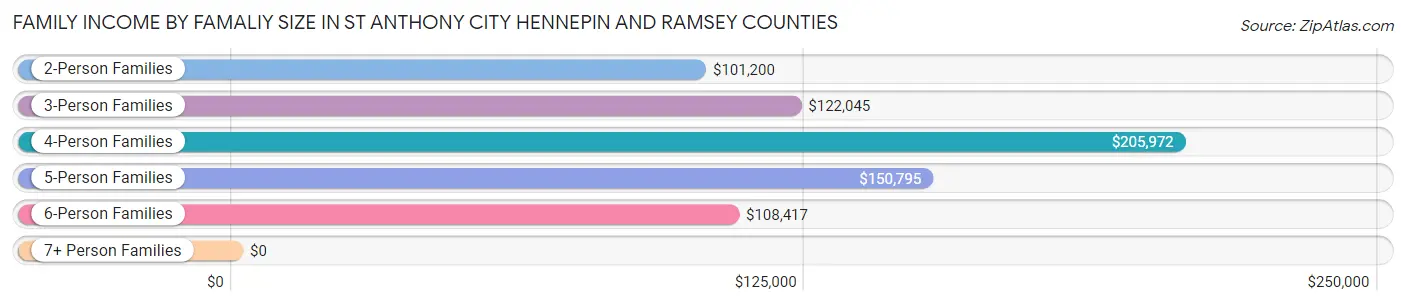
Family Income by Famaliy Size in St Anthony city Hennepin and Ramsey Counties
4-person families (441 | 19.9%) account for the highest median family income in St Anthony city Hennepin and Ramsey Counties with $205,972 per family, while 4-person families (441 | 19.9%) have the highest median income of $51,493 per family member.
| Income Bracket | # Families | Median Income |
| 2-Person Families | 1,144 (51.5%) | $101,200 |
| 3-Person Families | 316 (14.2%) | $122,045 |
| 4-Person Families | 441 (19.9%) | $205,972 |
| 5-Person Families | 291 (13.1%) | $150,795 |
| 6-Person Families | 25 (1.1%) | $108,417 |
| 7+ Person Families | 5 (0.2%) | $0 |
| Total | 2,222 (100.0%) | $120,227 |
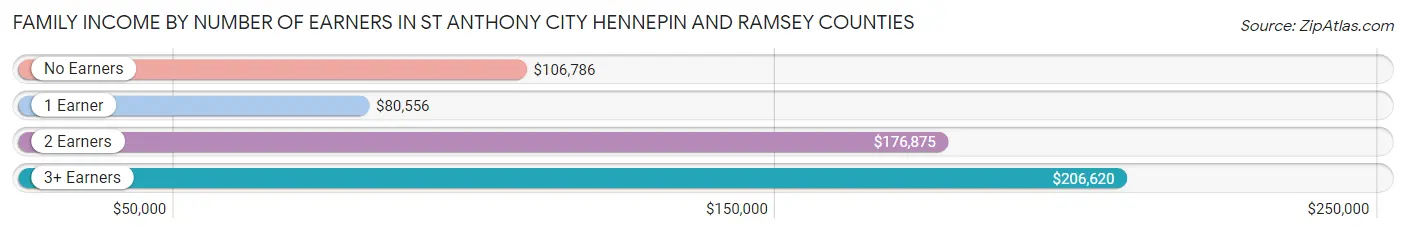
Family Income by Number of Earners in St Anthony city Hennepin and Ramsey Counties
The median family income in St Anthony city Hennepin and Ramsey Counties is $120,227, with families comprising 3+ earners (193) having the highest median family income of $206,620, while families with 1 earner (624) have the lowest median family income of $80,556, accounting for 8.7% and 28.1% of families, respectively.
| Number of Earners | # Families | Median Income |
| No Earners | 362 (16.3%) | $106,786 |
| 1 Earner | 624 (28.1%) | $80,556 |
| 2 Earners | 1,043 (46.9%) | $176,875 |
| 3+ Earners | 193 (8.7%) | $206,620 |
| Total | 2,222 (100.0%) | $120,227 |
Household Income in St Anthony city Hennepin and Ramsey Counties
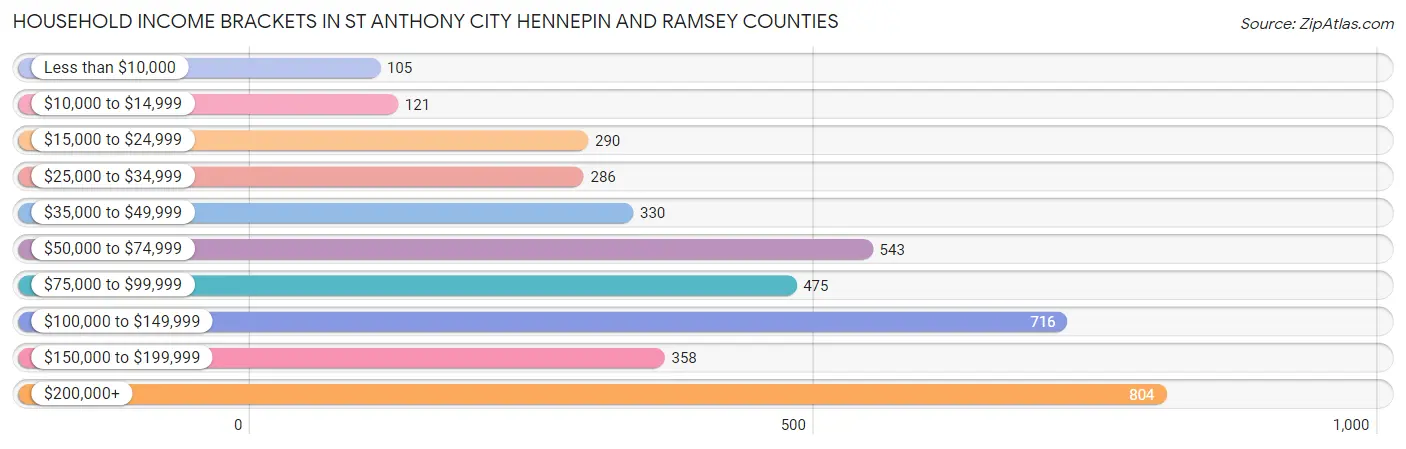
Household Income Brackets in St Anthony city Hennepin and Ramsey Counties
With 804 households falling in the category, the $200,000+ income range is the most frequent in St Anthony city Hennepin and Ramsey Counties, accounting for 20.0% of all households. In contrast, only 105 households (2.6%) fall into the less than $10,000 income bracket, making it the least populous group.
| Income Bracket | # Households | % Households |
| Less than $10,000 | 105 | 2.6% |
| $10,000 to $14,999 | 121 | 3.0% |
| $15,000 to $24,999 | 290 | 7.2% |
| $25,000 to $34,999 | 286 | 7.1% |
| $35,000 to $49,999 | 330 | 8.2% |
| $50,000 to $74,999 | 543 | 13.5% |
| $75,000 to $99,999 | 475 | 11.8% |
| $100,000 to $149,999 | 716 | 17.8% |
| $150,000 to $199,999 | 358 | 8.9% |
| $200,000+ | 804 | 20.0% |
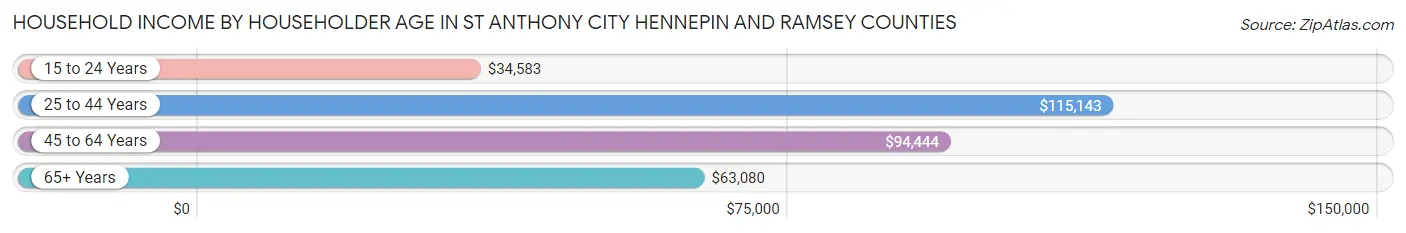
Household Income by Householder Age in St Anthony city Hennepin and Ramsey Counties
The median household income in St Anthony city Hennepin and Ramsey Counties is $91,955, with the highest median household income of $115,143 found in the 25 to 44 years age bracket for the primary householder. A total of 1,336 households (33.2%) fall into this category. Meanwhile, the 15 to 24 years age bracket for the primary householder has the lowest median household income of $34,583, with 35 households (0.9%) in this group.
| Income Bracket | # Households | Median Income |
| 15 to 24 Years | 35 (0.9%) | $34,583 |
| 25 to 44 Years | 1,336 (33.2%) | $115,143 |
| 45 to 64 Years | 1,136 (28.2%) | $94,444 |
| 65+ Years | 1,515 (37.7%) | $63,080 |
| Total | 4,022 (100.0%) | $91,955 |
Poverty in St Anthony city Hennepin and Ramsey Counties
Income Below Poverty by Sex and Age in St Anthony city Hennepin and Ramsey Counties
With 1.0% poverty level for males and 3.6% for females among the residents of St Anthony city Hennepin and Ramsey Counties, 65 to 74 year old males and 75 year old and over females are the most vulnerable to poverty, with 22 males (3.8%) and 41 females (6.7%) in their respective age groups living below the poverty level.
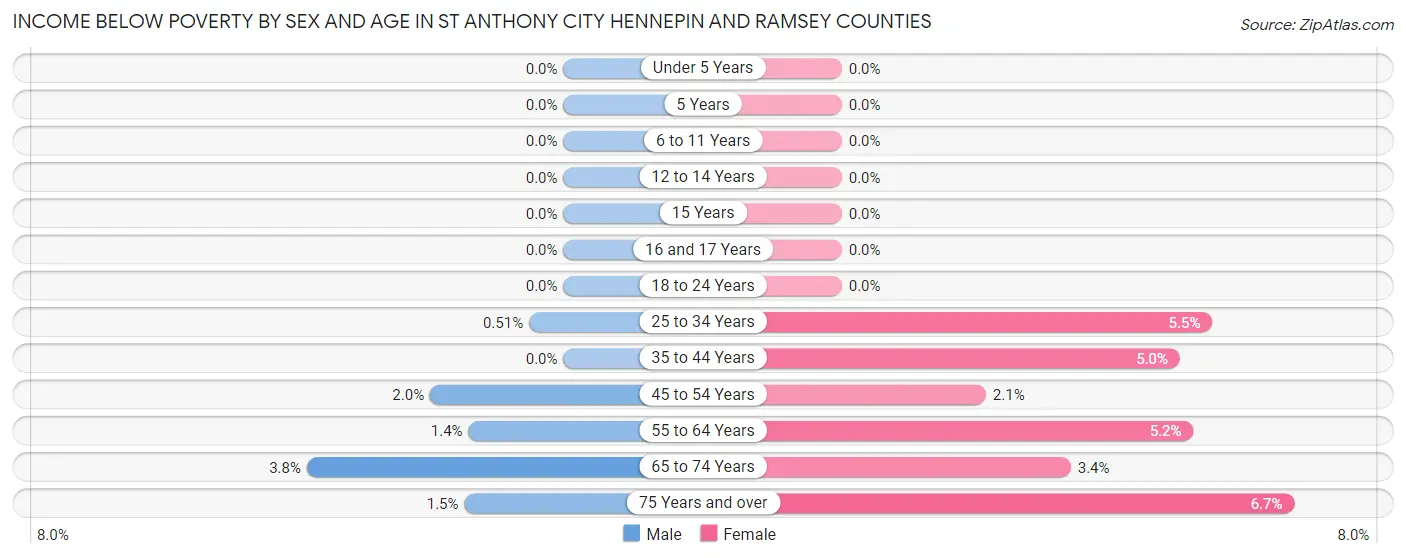
| Age Bracket | Male | Female |
| Under 5 Years | 0 (0.0%) | 0 (0.0%) |
| 5 Years | 0 (0.0%) | 0 (0.0%) |
| 6 to 11 Years | 0 (0.0%) | 0 (0.0%) |
| 12 to 14 Years | 0 (0.0%) | 0 (0.0%) |
| 15 Years | 0 (0.0%) | 0 (0.0%) |
| 16 and 17 Years | 0 (0.0%) | 0 (0.0%) |
| 18 to 24 Years | 0 (0.0%) | 0 (0.0%) |
| 25 to 34 Years | 3 (0.5%) | 33 (5.5%) |
| 35 to 44 Years | 0 (0.0%) | 30 (5.0%) |
| 45 to 54 Years | 9 (2.0%) | 10 (2.1%) |
| 55 to 64 Years | 6 (1.4%) | 28 (5.2%) |
| 65 to 74 Years | 22 (3.8%) | 18 (3.4%) |
| 75 Years and over | 6 (1.5%) | 41 (6.7%) |
| Total | 46 (1.0%) | 160 (3.6%) |
Income Above Poverty by Sex and Age in St Anthony city Hennepin and Ramsey Counties
According to the poverty statistics in St Anthony city Hennepin and Ramsey Counties, males aged under 5 years and females aged under 5 years are the age groups that are most secure financially, with 100.0% of males and 100.0% of females in these age groups living above the poverty line.
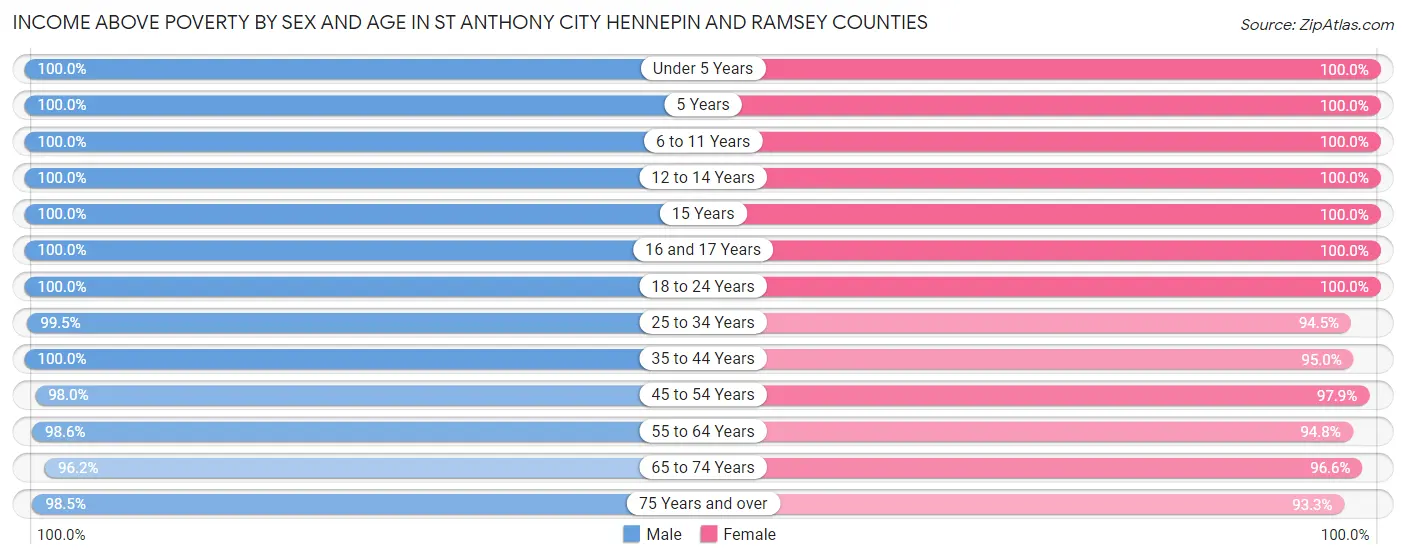
| Age Bracket | Male | Female |
| Under 5 Years | 596 (100.0%) | 255 (100.0%) |
| 5 Years | 44 (100.0%) | 11 (100.0%) |
| 6 to 11 Years | 322 (100.0%) | 227 (100.0%) |
| 12 to 14 Years | 229 (100.0%) | 198 (100.0%) |
| 15 Years | 86 (100.0%) | 71 (100.0%) |
| 16 and 17 Years | 33 (100.0%) | 116 (100.0%) |
| 18 to 24 Years | 74 (100.0%) | 178 (100.0%) |
| 25 to 34 Years | 590 (99.5%) | 567 (94.5%) |
| 35 to 44 Years | 947 (100.0%) | 568 (95.0%) |
| 45 to 54 Years | 445 (98.0%) | 458 (97.9%) |
| 55 to 64 Years | 419 (98.6%) | 508 (94.8%) |
| 65 to 74 Years | 556 (96.2%) | 511 (96.6%) |
| 75 Years and over | 401 (98.5%) | 569 (93.3%) |
| Total | 4,742 (99.0%) | 4,237 (96.4%) |
Income Below Poverty Among Married-Couple Families in St Anthony city Hennepin and Ramsey Counties
The poverty statistics for married-couple families in St Anthony city Hennepin and Ramsey Counties show that 0.9% or 17 of the total 1,802 families live below the poverty line. Families with no children have the highest poverty rate of 1.8%, comprising of 17 families. On the other hand, families with 1 or 2 children have the lowest poverty rate of 0.0%, which includes 0 families.
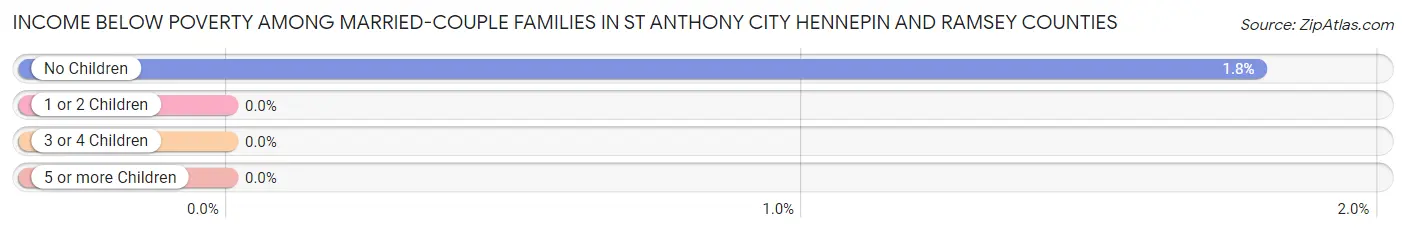
| Children | Above Poverty | Below Poverty |
| No Children | 933 (98.2%) | 17 (1.8%) |
| 1 or 2 Children | 556 (100.0%) | 0 (0.0%) |
| 3 or 4 Children | 291 (100.0%) | 0 (0.0%) |
| 5 or more Children | 5 (100.0%) | 0 (0.0%) |
| Total | 1,785 (99.1%) | 17 (0.9%) |
Income Below Poverty Among Single-Parent Households in St Anthony city Hennepin and Ramsey Counties
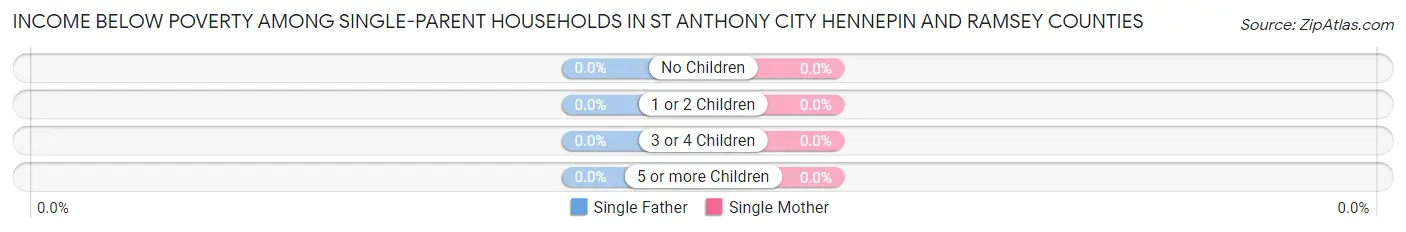
| Children | Single Father | Single Mother |
| No Children | 0 (0.0%) | 0 (0.0%) |
| 1 or 2 Children | 0 (0.0%) | 0 (0.0%) |
| 3 or 4 Children | 0 (0.0%) | 0 (0.0%) |
| 5 or more Children | 0 (0.0%) | 0 (0.0%) |
| Total | 0 (0.0%) | 0 (0.0%) |
Income Below Poverty Among Married-Couple vs Single-Parent Households in St Anthony city Hennepin and Ramsey Counties
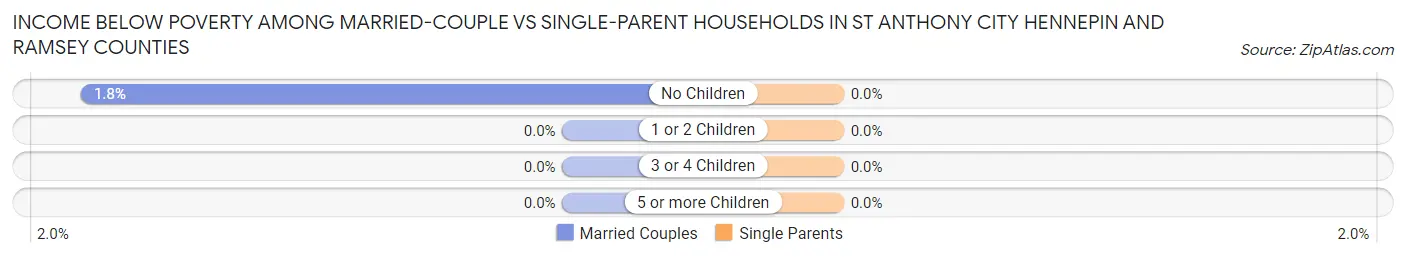
| Children | Married-Couple Families | Single-Parent Households |
| No Children | 17 (1.8%) | 0 (0.0%) |
| 1 or 2 Children | 0 (0.0%) | 0 (0.0%) |
| 3 or 4 Children | 0 (0.0%) | 0 (0.0%) |
| 5 or more Children | 0 (0.0%) | 0 (0.0%) |
| Total | 17 (0.9%) | 0 (0.0%) |
Race in St Anthony city Hennepin and Ramsey Counties
The most populous races in St Anthony city Hennepin and Ramsey Counties are White / Caucasian (7,324 | 78.5%), Black / African American (878 | 9.4%), and Asian (599 | 6.4%).
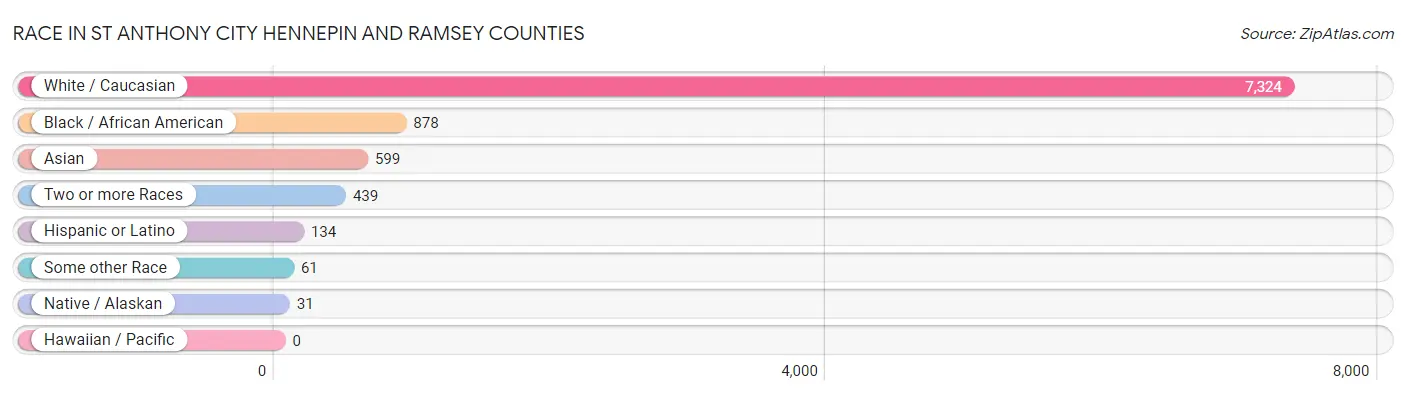
| Race | # Population | % Population |
| Asian | 599 | 6.4% |
| Black / African American | 878 | 9.4% |
| Hawaiian / Pacific | 0 | 0.0% |
| Hispanic or Latino | 134 | 1.4% |
| Native / Alaskan | 31 | 0.3% |
| White / Caucasian | 7,324 | 78.5% |
| Two or more Races | 439 | 4.7% |
| Some other Race | 61 | 0.6% |
| Total | 9,332 | 100.0% |
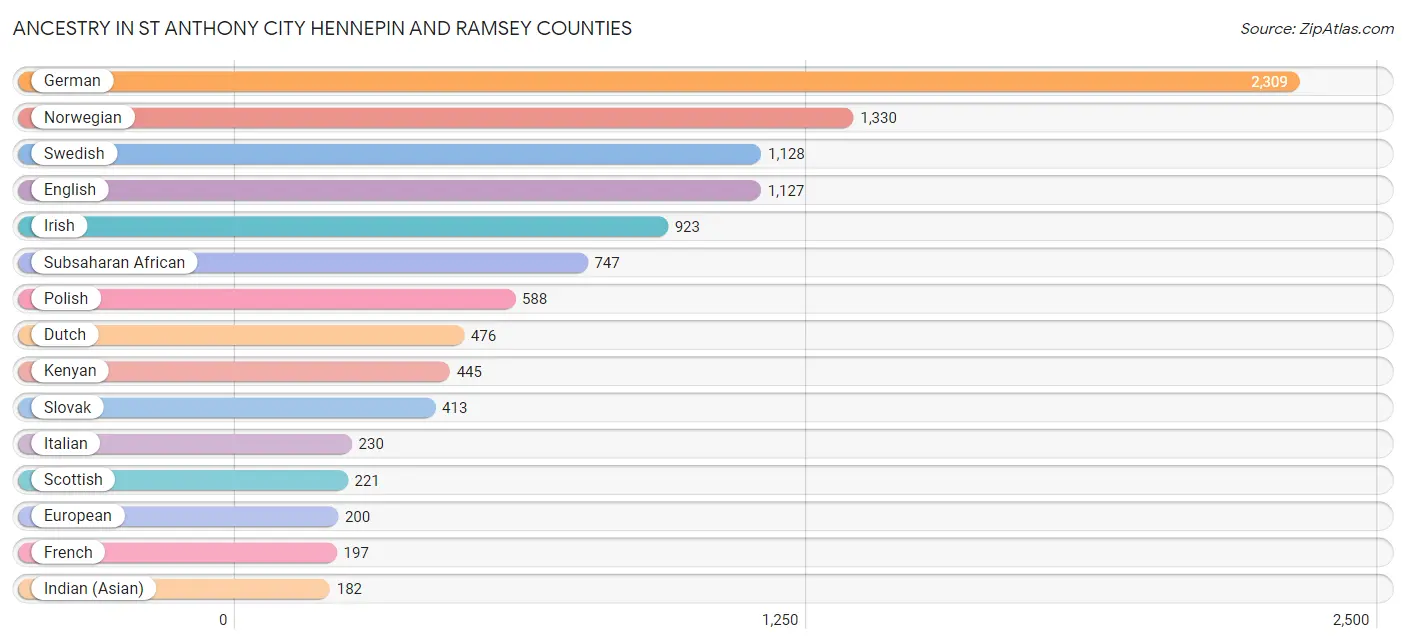
Ancestry in St Anthony city Hennepin and Ramsey Counties
The most populous ancestries reported in St Anthony city Hennepin and Ramsey Counties are German (2,309 | 24.7%), Norwegian (1,330 | 14.2%), Swedish (1,128 | 12.1%), English (1,127 | 12.1%), and Irish (923 | 9.9%), together accounting for 73.1% of all St Anthony city Hennepin and Ramsey Counties residents.
| Ancestry | # Population | % Population |
| African | 131 | 1.4% |
| Albanian | 8 | 0.1% |
| American | 127 | 1.4% |
| Arab | 103 | 1.1% |
| Austrian | 19 | 0.2% |
| Bangladeshi | 35 | 0.4% |
| Belgian | 20 | 0.2% |
| Bhutanese | 63 | 0.7% |
| Brazilian | 36 | 0.4% |
| British | 17 | 0.2% |
| Bulgarian | 7 | 0.1% |
| Burmese | 12 | 0.1% |
| Canadian | 12 | 0.1% |
| Celtic | 12 | 0.1% |
| Central American | 21 | 0.2% |
| Chilean | 13 | 0.1% |
| Chippewa | 34 | 0.4% |
| Colombian | 30 | 0.3% |
| Croatian | 24 | 0.3% |
| Czech | 79 | 0.9% |
| Danish | 144 | 1.5% |
| Dutch | 476 | 5.1% |
| Eastern European | 6 | 0.1% |
| English | 1,127 | 12.1% |
| Ethiopian | 105 | 1.1% |
| European | 200 | 2.1% |
| Filipino | 8 | 0.1% |
| Finnish | 33 | 0.4% |
| French | 197 | 2.1% |
| French Canadian | 58 | 0.6% |
| German | 2,309 | 24.7% |
| Ghanaian | 12 | 0.1% |
| Greek | 112 | 1.2% |
| Honduran | 21 | 0.2% |
| Hungarian | 4 | 0.0% |
| Indian (Asian) | 182 | 1.9% |
| Inupiat | 9 | 0.1% |
| Irish | 923 | 9.9% |
| Italian | 230 | 2.5% |
| Kenyan | 445 | 4.8% |
| Korean | 120 | 1.3% |
| Lebanese | 80 | 0.9% |
| Liberian | 48 | 0.5% |
| Luxembourger | 16 | 0.2% |
| Mexican | 70 | 0.7% |
| Northern European | 64 | 0.7% |
| Norwegian | 1,330 | 14.2% |
| Polish | 588 | 6.3% |
| Portuguese | 6 | 0.1% |
| Russian | 41 | 0.4% |
| Scandinavian | 164 | 1.8% |
| Scotch-Irish | 83 | 0.9% |
| Scottish | 221 | 2.4% |
| Slavic | 3 | 0.0% |
| Slovak | 413 | 4.4% |
| Slovene | 39 | 0.4% |
| Somali | 18 | 0.2% |
| South American | 43 | 0.5% |
| Sri Lankan | 31 | 0.3% |
| Subsaharan African | 747 | 8.0% |
| Swedish | 1,128 | 12.1% |
| Swiss | 20 | 0.2% |
| Syrian | 8 | 0.1% |
| Thai | 153 | 1.6% |
| Ukrainian | 115 | 1.2% | View All 65 Rows |
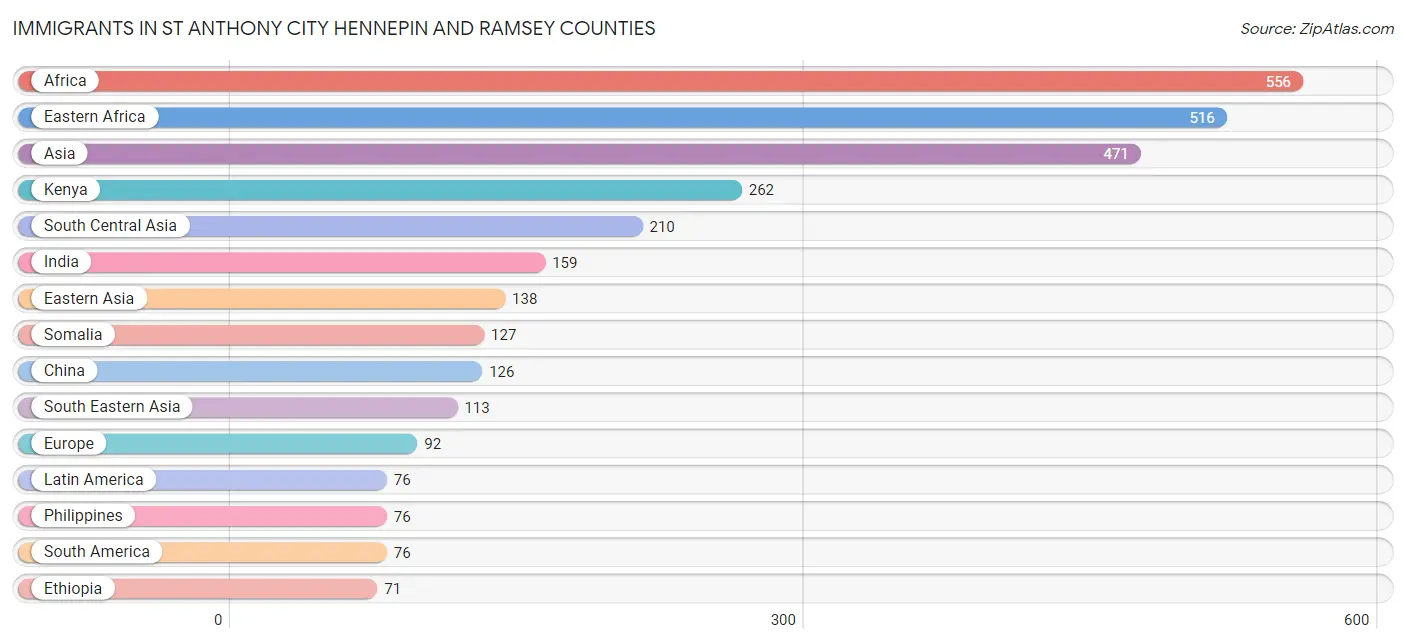
Immigrants in St Anthony city Hennepin and Ramsey Counties
The most numerous immigrant groups reported in St Anthony city Hennepin and Ramsey Counties came from Africa (556 | 6.0%), Eastern Africa (516 | 5.5%), Asia (471 | 5.1%), Kenya (262 | 2.8%), and South Central Asia (210 | 2.2%), together accounting for 21.6% of all St Anthony city Hennepin and Ramsey Counties residents.
| Immigration Origin | # Population | % Population |
| Africa | 556 | 6.0% |
| Asia | 471 | 5.1% |
| Brazil | 36 | 0.4% |
| Canada | 20 | 0.2% |
| Chile | 13 | 0.1% |
| China | 126 | 1.3% |
| Colombia | 21 | 0.2% |
| Eastern Africa | 516 | 5.5% |
| Eastern Asia | 138 | 1.5% |
| Eastern Europe | 31 | 0.3% |
| Eritrea | 11 | 0.1% |
| Ethiopia | 71 | 0.8% |
| Europe | 92 | 1.0% |
| France | 9 | 0.1% |
| Germany | 25 | 0.3% |
| Guyana | 6 | 0.1% |
| India | 159 | 1.7% |
| Ireland | 27 | 0.3% |
| Kenya | 262 | 2.8% |
| Korea | 12 | 0.1% |
| Latin America | 76 | 0.8% |
| Liberia | 17 | 0.2% |
| Northern Europe | 27 | 0.3% |
| Pakistan | 17 | 0.2% |
| Philippines | 76 | 0.8% |
| Poland | 7 | 0.1% |
| Russia | 14 | 0.2% |
| Somalia | 127 | 1.4% |
| South Africa | 12 | 0.1% |
| South America | 76 | 0.8% |
| South Central Asia | 210 | 2.2% |
| South Eastern Asia | 113 | 1.2% |
| Sri Lanka | 34 | 0.4% |
| Taiwan | 8 | 0.1% |
| Thailand | 12 | 0.1% |
| Ukraine | 10 | 0.1% |
| Vietnam | 25 | 0.3% |
| Western Africa | 17 | 0.2% |
| Western Asia | 10 | 0.1% |
| Western Europe | 34 | 0.4% | View All 40 Rows |
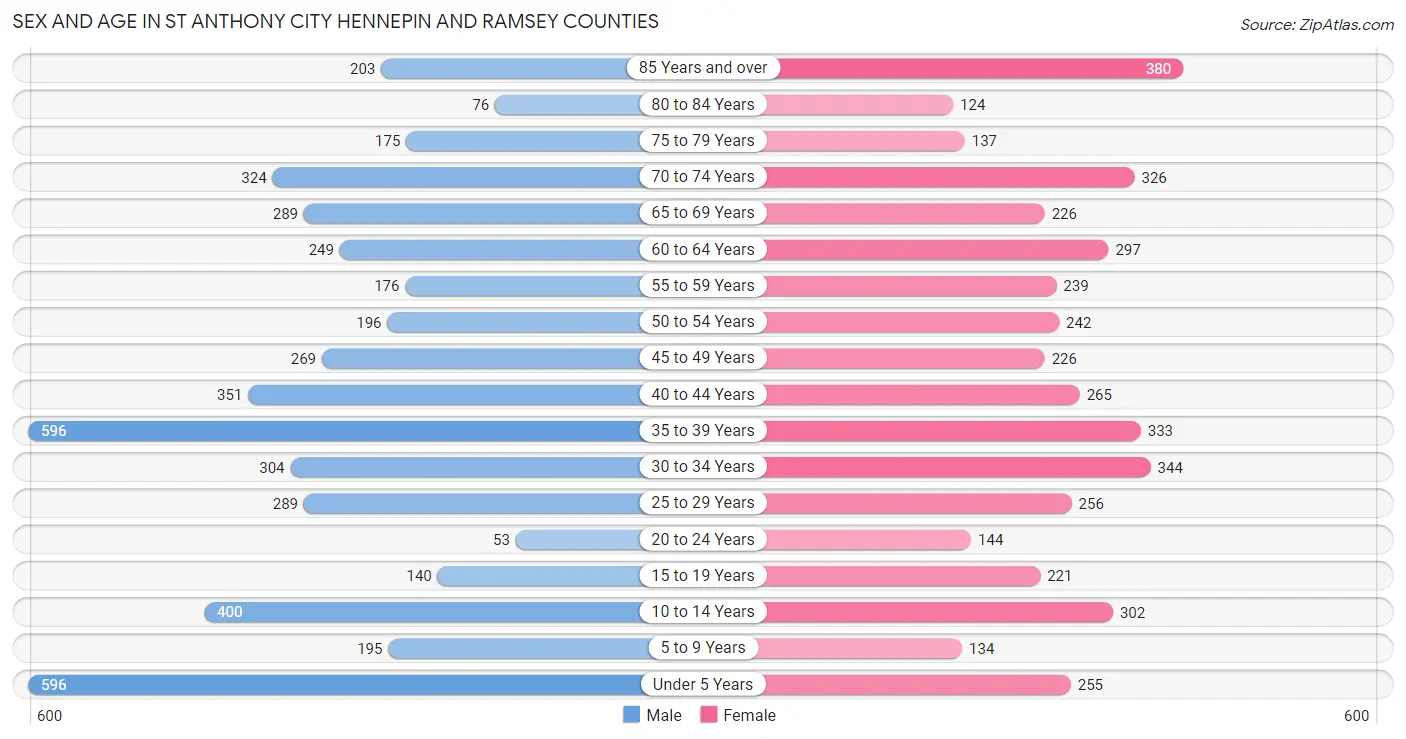
Sex and Age in St Anthony city Hennepin and Ramsey Counties
Sex and Age in St Anthony city Hennepin and Ramsey Counties
The most populous age groups in St Anthony city Hennepin and Ramsey Counties are Under 5 Years (596 | 12.2%) for men and 85 Years and over (380 | 8.5%) for women.
| Age Bracket | Male | Female |
| Under 5 Years | 596 (12.2%) | 255 (5.7%) |
| 5 to 9 Years | 195 (4.0%) | 134 (3.0%) |
| 10 to 14 Years | 400 (8.2%) | 302 (6.8%) |
| 15 to 19 Years | 140 (2.9%) | 221 (5.0%) |
| 20 to 24 Years | 53 (1.1%) | 144 (3.2%) |
| 25 to 29 Years | 289 (5.9%) | 256 (5.8%) |
| 30 to 34 Years | 304 (6.2%) | 344 (7.7%) |
| 35 to 39 Years | 596 (12.2%) | 333 (7.5%) |
| 40 to 44 Years | 351 (7.2%) | 265 (5.9%) |
| 45 to 49 Years | 269 (5.5%) | 226 (5.1%) |
| 50 to 54 Years | 196 (4.0%) | 242 (5.4%) |
| 55 to 59 Years | 176 (3.6%) | 239 (5.4%) |
| 60 to 64 Years | 249 (5.1%) | 297 (6.7%) |
| 65 to 69 Years | 289 (5.9%) | 226 (5.1%) |
| 70 to 74 Years | 324 (6.6%) | 326 (7.3%) |
| 75 to 79 Years | 175 (3.6%) | 137 (3.1%) |
| 80 to 84 Years | 76 (1.6%) | 124 (2.8%) |
| 85 Years and over | 203 (4.2%) | 380 (8.5%) |
| Total | 4,881 (100.0%) | 4,451 (100.0%) |
Families and Households in St Anthony city Hennepin and Ramsey Counties
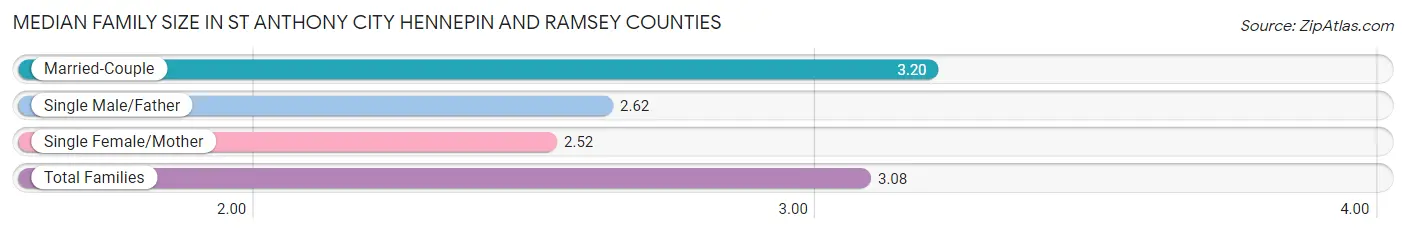
Median Family Size in St Anthony city Hennepin and Ramsey Counties
The median family size in St Anthony city Hennepin and Ramsey Counties is 3.08 persons per family, with married-couple families (1,802 | 81.1%) accounting for the largest median family size of 3.2 persons per family. On the other hand, single female/mother families (349 | 15.7%) represent the smallest median family size with 2.52 persons per family.
| Family Type | # Families | Family Size |
| Married-Couple | 1,802 (81.1%) | 3.20 |
| Single Male/Father | 71 (3.2%) | 2.62 |
| Single Female/Mother | 349 (15.7%) | 2.52 |
| Total Families | 2,222 (100.0%) | 3.08 |
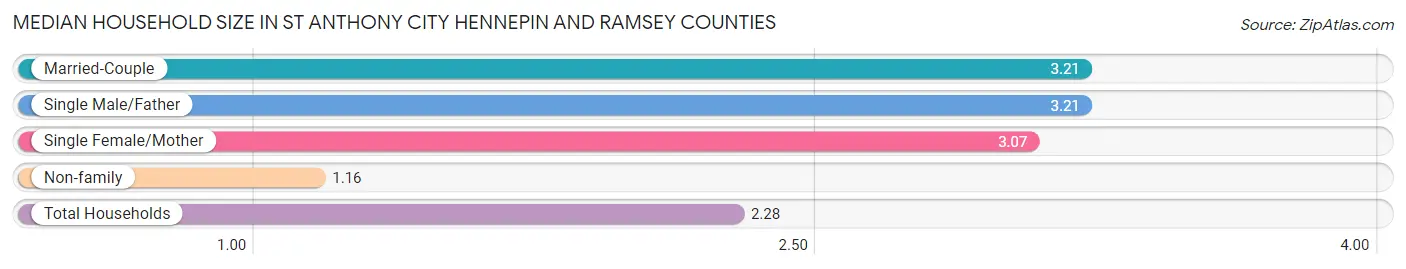
Median Household Size in St Anthony city Hennepin and Ramsey Counties
The median household size in St Anthony city Hennepin and Ramsey Counties is 2.28 persons per household, with married-couple households (1,802 | 44.8%) accounting for the largest median household size of 3.21 persons per household. non-family households (1,800 | 44.8%) represent the smallest median household size with 1.16 persons per household.
| Household Type | # Households | Household Size |
| Married-Couple | 1,802 (44.8%) | 3.21 |
| Single Male/Father | 71 (1.8%) | 3.21 |
| Single Female/Mother | 349 (8.7%) | 3.07 |
| Non-family | 1,800 (44.8%) | 1.16 |
| Total Households | 4,022 (100.0%) | 2.28 |
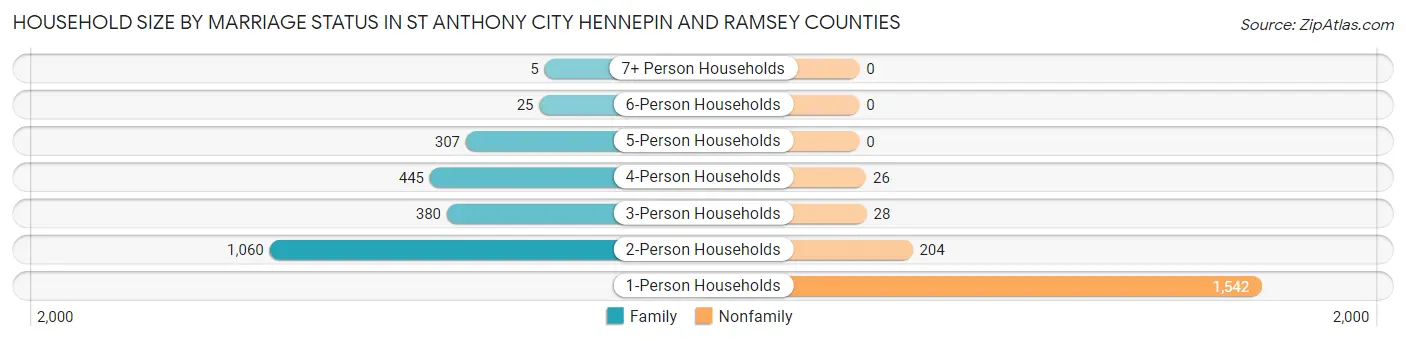
Household Size by Marriage Status in St Anthony city Hennepin and Ramsey Counties
Out of a total of 4,022 households in St Anthony city Hennepin and Ramsey Counties, 2,222 (55.2%) are family households, while 1,800 (44.8%) are nonfamily households. The most numerous type of family households are 2-person households, comprising 1,060, and the most common type of nonfamily households are 1-person households, comprising 1,542.
| Household Size | Family Households | Nonfamily Households |
| 1-Person Households | - | 1,542 (38.3%) |
| 2-Person Households | 1,060 (26.4%) | 204 (5.1%) |
| 3-Person Households | 380 (9.5%) | 28 (0.7%) |
| 4-Person Households | 445 (11.1%) | 26 (0.6%) |
| 5-Person Households | 307 (7.6%) | 0 (0.0%) |
| 6-Person Households | 25 (0.6%) | 0 (0.0%) |
| 7+ Person Households | 5 (0.1%) | 0 (0.0%) |
| Total | 2,222 (55.2%) | 1,800 (44.8%) |
Female Fertility in St Anthony city Hennepin and Ramsey Counties
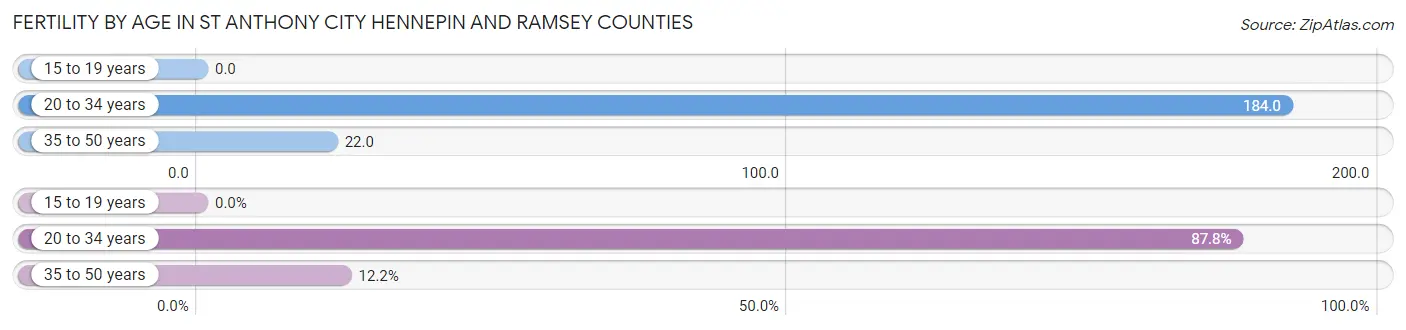
Fertility by Age in St Anthony city Hennepin and Ramsey Counties
Average fertility rate in St Anthony city Hennepin and Ramsey Counties is 86.0 births per 1,000 women. Women in the age bracket of 20 to 34 years have the highest fertility rate with 184.0 births per 1,000 women. Women in the age bracket of 20 to 34 years acount for 87.8% of all women with births.
| Age Bracket | Women with Births | Births / 1,000 Women |
| 15 to 19 years | 0 (0.0%) | 0.0 |
| 20 to 34 years | 137 (87.8%) | 184.0 |
| 35 to 50 years | 19 (12.2%) | 22.0 |
| Total | 156 (100.0%) | 86.0 |
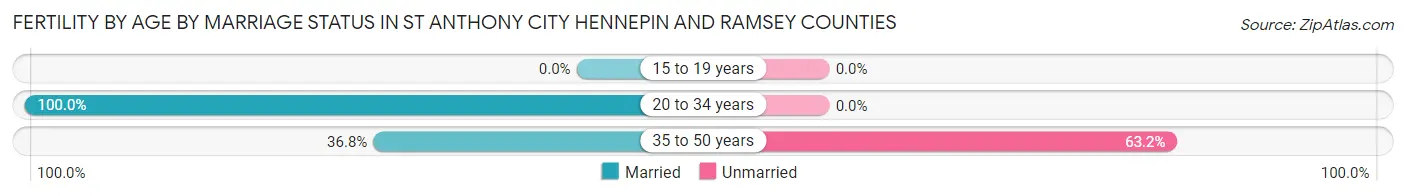
Fertility by Age by Marriage Status in St Anthony city Hennepin and Ramsey Counties
92.3% of women with births (156) in St Anthony city Hennepin and Ramsey Counties are married. The highest percentage of unmarried women with births falls into 35 to 50 years age bracket with 63.2% of them unmarried at the time of birth, while the lowest percentage of unmarried women with births belong to 20 to 34 years age bracket with 0.0% of them unmarried.
| Age Bracket | Married | Unmarried |
| 15 to 19 years | 0 (0.0%) | 0 (0.0%) |
| 20 to 34 years | 137 (100.0%) | 0 (0.0%) |
| 35 to 50 years | 7 (36.8%) | 12 (63.2%) |
| Total | 144 (92.3%) | 12 (7.7%) |
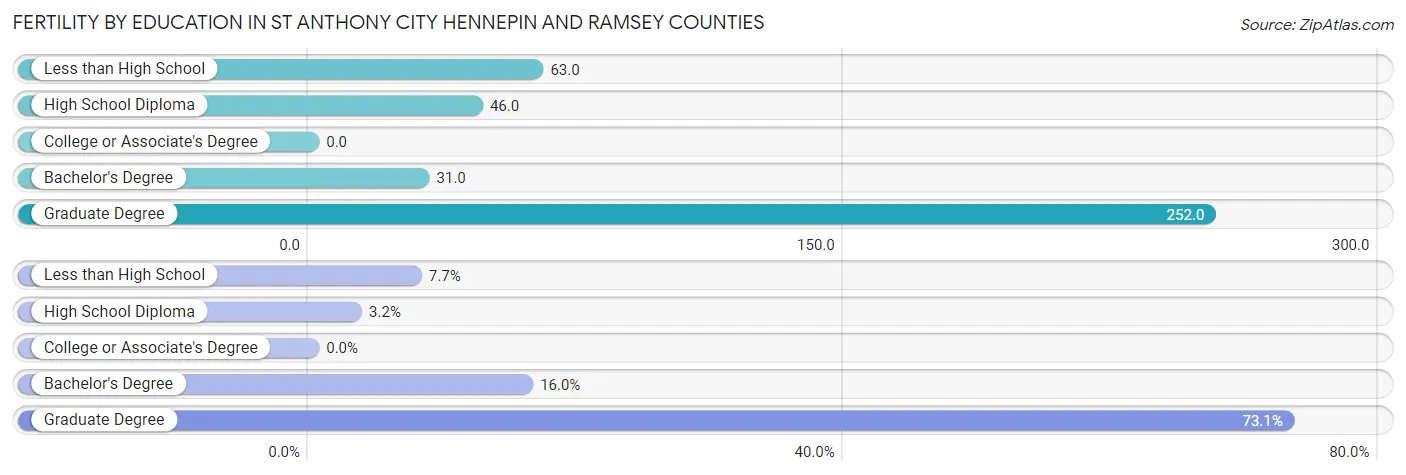
Fertility by Education in St Anthony city Hennepin and Ramsey Counties
| Educational Attainment | Women with Births | Births / 1,000 Women |
| Less than High School | 12 (7.7%) | 63.0 |
| High School Diploma | 5 (3.2%) | 46.0 |
| College or Associate's Degree | 0 (0.0%) | 0.0 |
| Bachelor's Degree | 25 (16.0%) | 31.0 |
| Graduate Degree | 114 (73.1%) | 252.0 |
| Total | 156 (100.0%) | 86.0 |
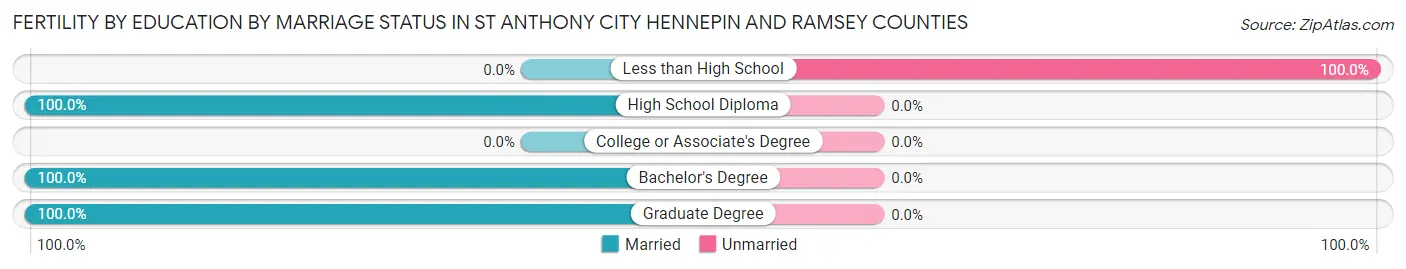
Fertility by Education by Marriage Status in St Anthony city Hennepin and Ramsey Counties
7.7% of women with births in St Anthony city Hennepin and Ramsey Counties are unmarried. Women with the educational attainment of high school diploma are most likely to be married with 100.0% of them married at childbirth, while women with the educational attainment of less than high school are least likely to be married with 100.0% of them unmarried at childbirth.
| Educational Attainment | Married | Unmarried |
| Less than High School | 0 (0.0%) | 12 (100.0%) |
| High School Diploma | 5 (100.0%) | 0 (0.0%) |
| College or Associate's Degree | 0 (0.0%) | 0 (0.0%) |
| Bachelor's Degree | 25 (100.0%) | 0 (0.0%) |
| Graduate Degree | 114 (100.0%) | 0 (0.0%) |
| Total | 144 (92.3%) | 12 (7.7%) |
Employment Characteristics in St Anthony city Hennepin and Ramsey Counties
Employment by Class of Employer in St Anthony city Hennepin and Ramsey Counties
Among the 4,526 employed individuals in St Anthony city Hennepin and Ramsey Counties, private company employees (2,705 | 59.8%), not-for-profit organizations (793 | 17.5%), and local government employees (517 | 11.4%) make up the most common classes of employment.
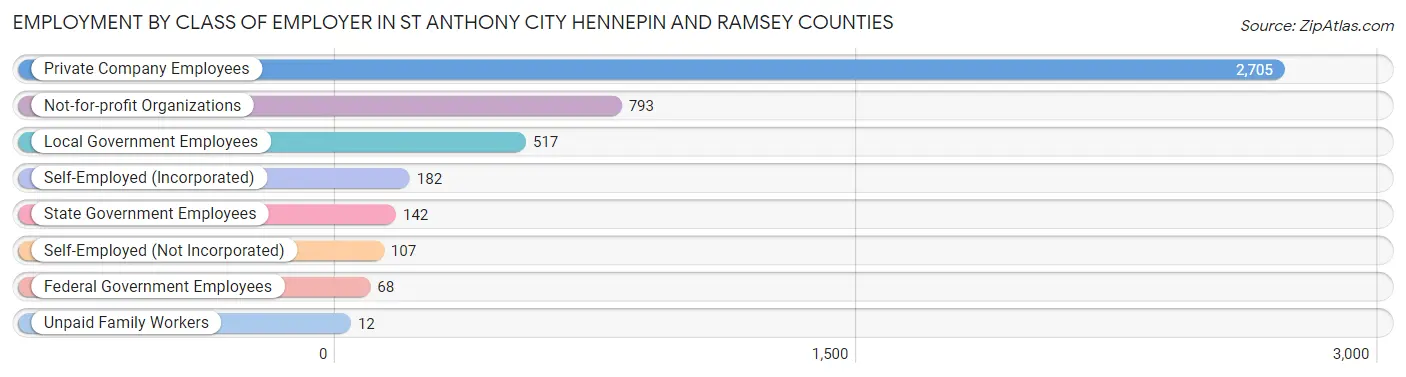
| Employer Class | # Employees | % Employees |
| Private Company Employees | 2,705 | 59.8% |
| Self-Employed (Incorporated) | 182 | 4.0% |
| Self-Employed (Not Incorporated) | 107 | 2.4% |
| Not-for-profit Organizations | 793 | 17.5% |
| Local Government Employees | 517 | 11.4% |
| State Government Employees | 142 | 3.1% |
| Federal Government Employees | 68 | 1.5% |
| Unpaid Family Workers | 12 | 0.3% |
| Total | 4,526 | 100.0% |
Employment Status by Age in St Anthony city Hennepin and Ramsey Counties
According to the labor force statistics for St Anthony city Hennepin and Ramsey Counties, out of the total population over 16 years of age (7,293), 64.1% or 4,675 individuals are in the labor force, with 1.8% or 84 of them unemployed. The age group with the highest labor force participation rate is 30 to 34 years, with 99.2% or 643 individuals in the labor force. Within the labor force, the 20 to 24 years age range has the highest percentage of unemployed individuals, with 13.2% or 25 of them being unemployed.
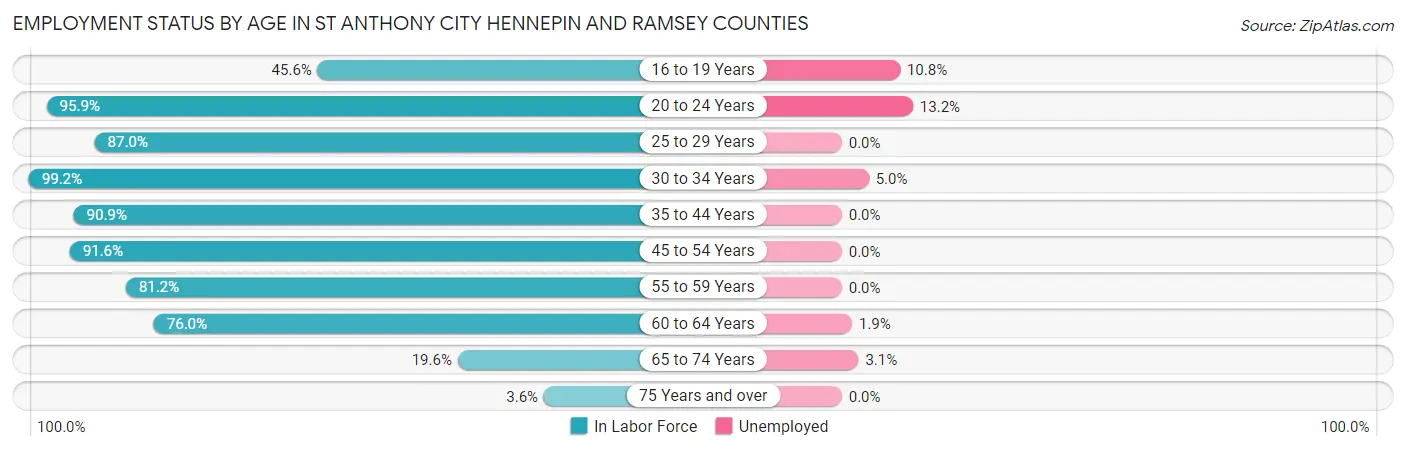
| Age Bracket | In Labor Force | Unemployed |
| 16 to 19 Years | 93 (45.6%) | 10 (10.8%) |
| 20 to 24 Years | 189 (95.9%) | 25 (13.2%) |
| 25 to 29 Years | 474 (87.0%) | 0 (0.0%) |
| 30 to 34 Years | 643 (99.2%) | 32 (5.0%) |
| 35 to 44 Years | 1,404 (90.9%) | 0 (0.0%) |
| 45 to 54 Years | 855 (91.6%) | 0 (0.0%) |
| 55 to 59 Years | 337 (81.2%) | 0 (0.0%) |
| 60 to 64 Years | 415 (76.0%) | 8 (1.9%) |
| 65 to 74 Years | 228 (19.6%) | 7 (3.1%) |
| 75 Years and over | 39 (3.6%) | 0 (0.0%) |
| Total | 4,675 (64.1%) | 84 (1.8%) |
Employment Status by Educational Attainment in St Anthony city Hennepin and Ramsey Counties
According to labor force statistics for St Anthony city Hennepin and Ramsey Counties, 89.1% of individuals (4,127) out of the total population between 25 and 64 years of age (4,632) are in the labor force, with 1.0% or 41 of them being unemployed. The group with the highest labor force participation rate are those with the educational attainment of bachelor's degree or higher, with 92.7% or 2,851 individuals in the labor force. Within the labor force, individuals with bachelor's degree or higher education have the highest percentage of unemployment, with 1.4% or 40 of them being unemployed.
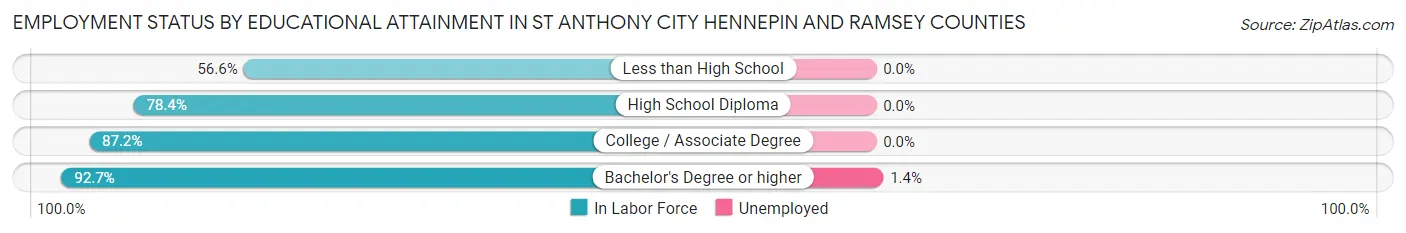
| Educational Attainment | In Labor Force | Unemployed |
| Less than High School | 69 (56.6%) | 0 (0.0%) |
| High School Diploma | 363 (78.4%) | 0 (0.0%) |
| College / Associate Degree | 847 (87.2%) | 0 (0.0%) |
| Bachelor's Degree or higher | 2,851 (92.7%) | 43 (1.4%) |
| Total | 4,127 (89.1%) | 46 (1.0%) |
Employment Occupations by Sex in St Anthony city Hennepin and Ramsey Counties
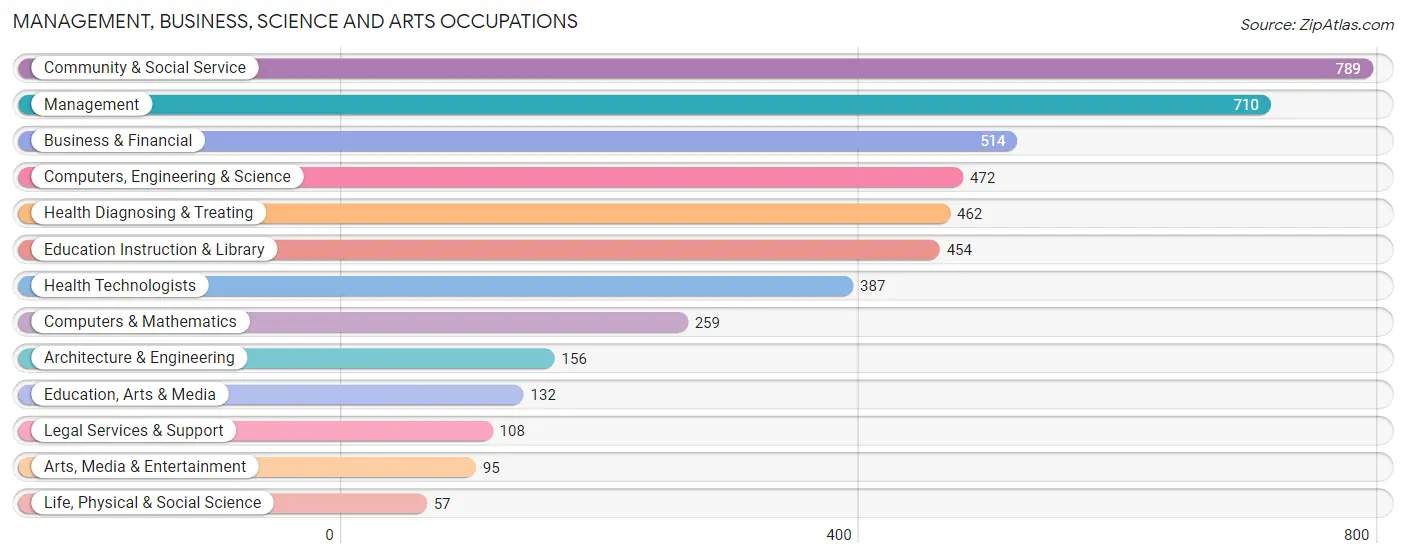
Management, Business, Science and Arts Occupations
The most common Management, Business, Science and Arts occupations in St Anthony city Hennepin and Ramsey Counties are Community & Social Service (789 | 17.2%), Management (710 | 15.4%), Business & Financial (514 | 11.2%), Computers, Engineering & Science (472 | 10.3%), and Health Diagnosing & Treating (462 | 10.1%).
Management, Business, Science and Arts Occupations by Sex
Within the Management, Business, Science and Arts occupations in St Anthony city Hennepin and Ramsey Counties, the most male-oriented occupations are Computers & Mathematics (81.9%), Computers, Engineering & Science (73.5%), and Architecture & Engineering (73.1%), while the most female-oriented occupations are Education, Arts & Media (84.9%), Health Technologists (77.0%), and Health Diagnosing & Treating (74.5%).
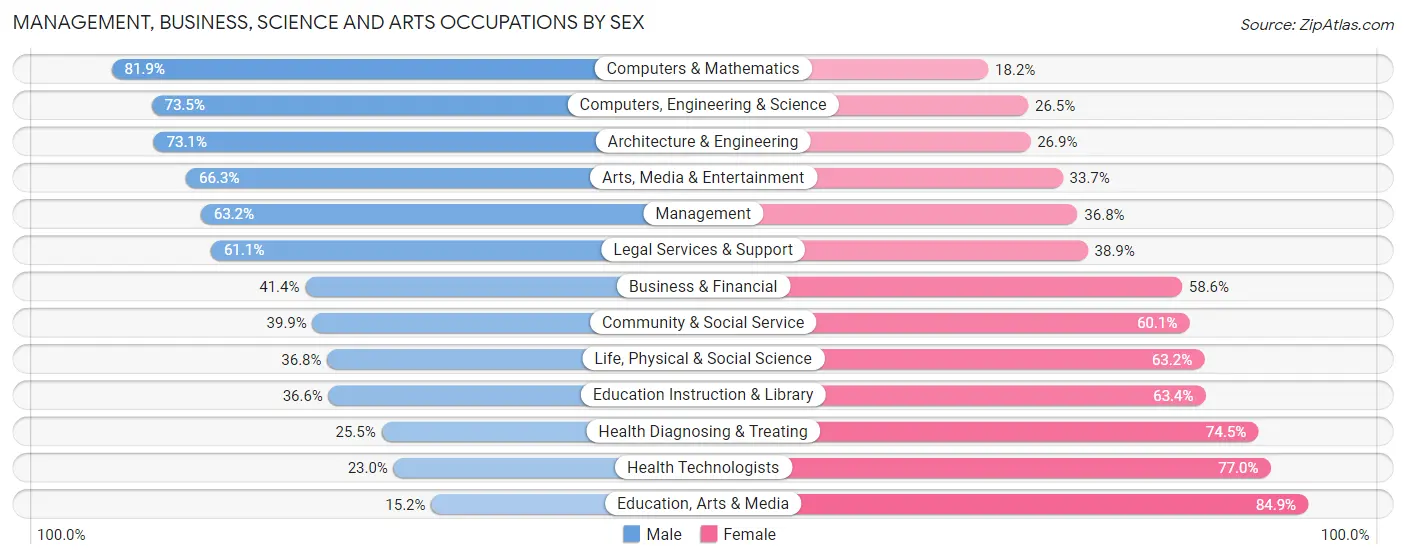
| Occupation | Male | Female |
| Management | 449 (63.2%) | 261 (36.8%) |
| Business & Financial | 213 (41.4%) | 301 (58.6%) |
| Computers, Engineering & Science | 347 (73.5%) | 125 (26.5%) |
| Computers & Mathematics | 212 (81.9%) | 47 (18.1%) |
| Architecture & Engineering | 114 (73.1%) | 42 (26.9%) |
| Life, Physical & Social Science | 21 (36.8%) | 36 (63.2%) |
| Community & Social Service | 315 (39.9%) | 474 (60.1%) |
| Education, Arts & Media | 20 (15.1%) | 112 (84.9%) |
| Legal Services & Support | 66 (61.1%) | 42 (38.9%) |
| Education Instruction & Library | 166 (36.6%) | 288 (63.4%) |
| Arts, Media & Entertainment | 63 (66.3%) | 32 (33.7%) |
| Health Diagnosing & Treating | 118 (25.5%) | 344 (74.5%) |
| Health Technologists | 89 (23.0%) | 298 (77.0%) |
| Total (Category) | 1,442 (48.9%) | 1,505 (51.1%) |
| Total (Overall) | 2,427 (52.8%) | 2,169 (47.2%) |
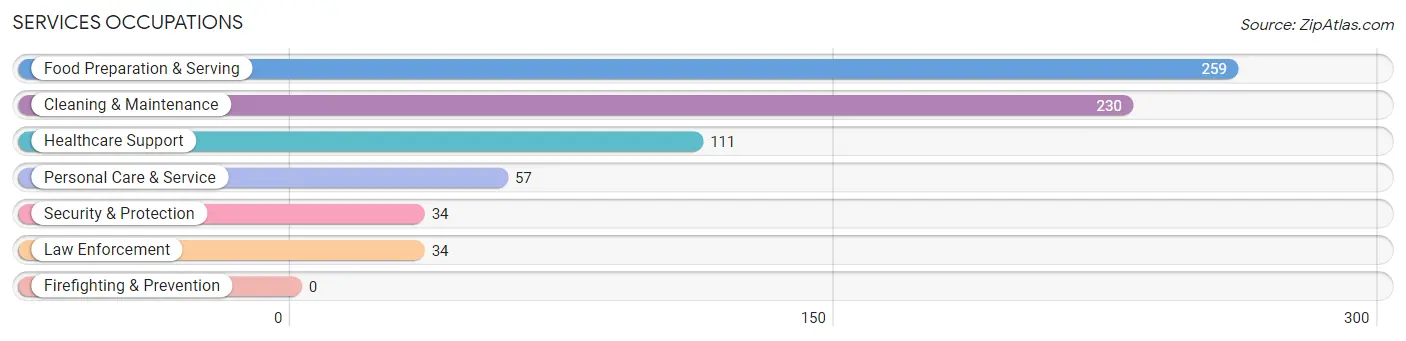
Services Occupations
The most common Services occupations in St Anthony city Hennepin and Ramsey Counties are Food Preparation & Serving (259 | 5.6%), Cleaning & Maintenance (230 | 5.0%), Healthcare Support (111 | 2.4%), Personal Care & Service (57 | 1.2%), and Security & Protection (34 | 0.7%).
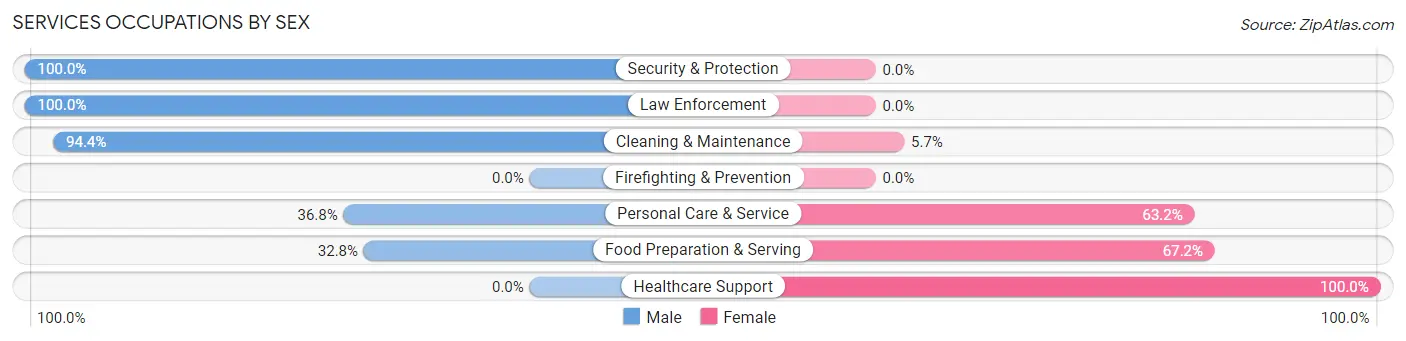
Services Occupations by Sex
Within the Services occupations in St Anthony city Hennepin and Ramsey Counties, the most male-oriented occupations are Security & Protection (100.0%), Law Enforcement (100.0%), and Cleaning & Maintenance (94.4%), while the most female-oriented occupations are Healthcare Support (100.0%), Food Preparation & Serving (67.2%), and Personal Care & Service (63.2%).
| Occupation | Male | Female |
| Healthcare Support | 0 (0.0%) | 111 (100.0%) |
| Security & Protection | 34 (100.0%) | 0 (0.0%) |
| Firefighting & Prevention | 0 (0.0%) | 0 (0.0%) |
| Law Enforcement | 34 (100.0%) | 0 (0.0%) |
| Food Preparation & Serving | 85 (32.8%) | 174 (67.2%) |
| Cleaning & Maintenance | 217 (94.4%) | 13 (5.7%) |
| Personal Care & Service | 21 (36.8%) | 36 (63.2%) |
| Total (Category) | 357 (51.7%) | 334 (48.3%) |
| Total (Overall) | 2,427 (52.8%) | 2,169 (47.2%) |
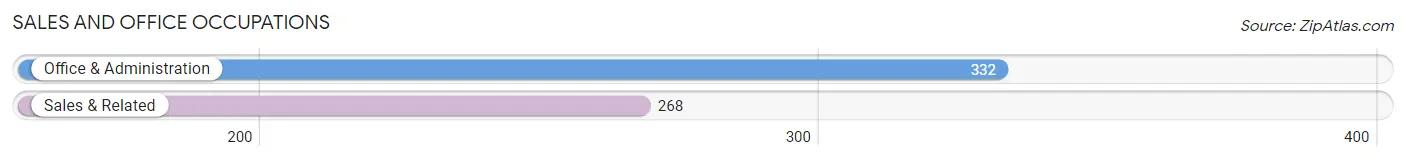
Sales and Office Occupations
The most common Sales and Office occupations in St Anthony city Hennepin and Ramsey Counties are Office & Administration (332 | 7.2%), and Sales & Related (268 | 5.8%).
Sales and Office Occupations by Sex
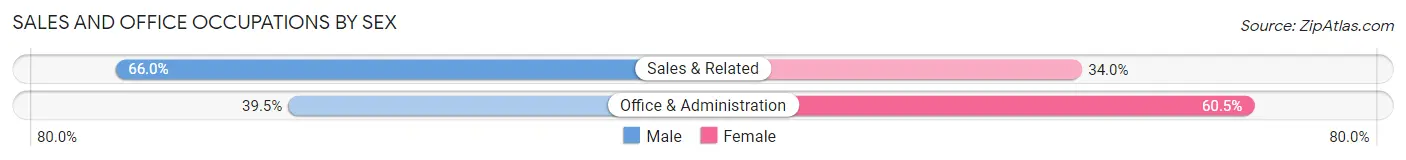
| Occupation | Male | Female |
| Sales & Related | 177 (66.0%) | 91 (34.0%) |
| Office & Administration | 131 (39.5%) | 201 (60.5%) |
| Total (Category) | 308 (51.3%) | 292 (48.7%) |
| Total (Overall) | 2,427 (52.8%) | 2,169 (47.2%) |
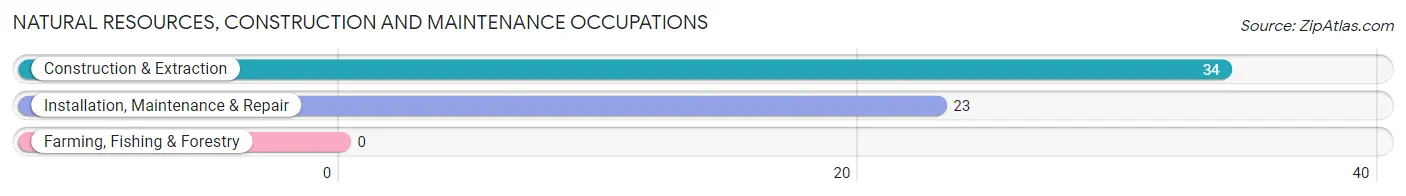
Natural Resources, Construction and Maintenance Occupations
The most common Natural Resources, Construction and Maintenance occupations in St Anthony city Hennepin and Ramsey Counties are Construction & Extraction (34 | 0.7%), and Installation, Maintenance & Repair (23 | 0.5%).
Natural Resources, Construction and Maintenance Occupations by Sex
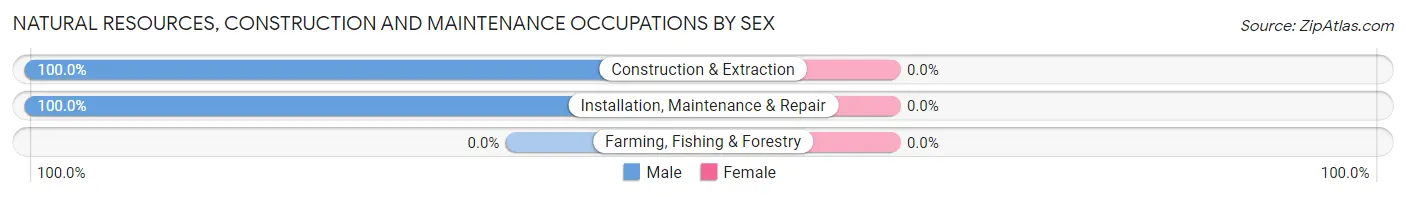
| Occupation | Male | Female |
| Farming, Fishing & Forestry | 0 (0.0%) | 0 (0.0%) |
| Construction & Extraction | 34 (100.0%) | 0 (0.0%) |
| Installation, Maintenance & Repair | 23 (100.0%) | 0 (0.0%) |
| Total (Category) | 57 (100.0%) | 0 (0.0%) |
| Total (Overall) | 2,427 (52.8%) | 2,169 (47.2%) |
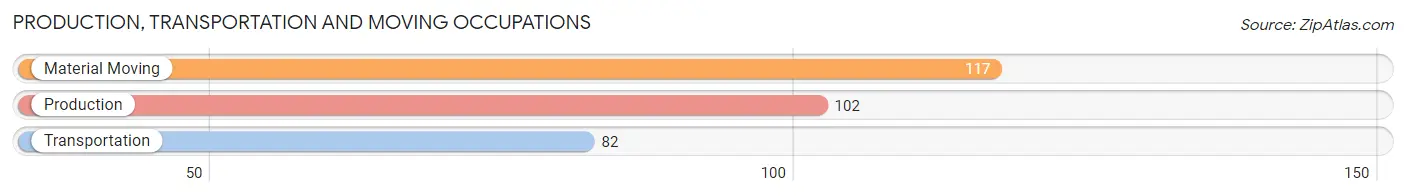
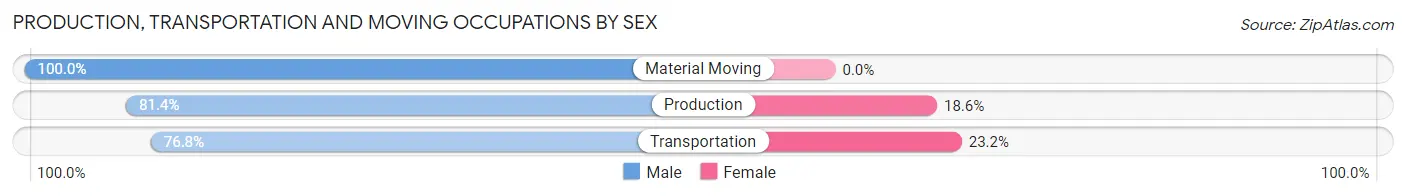
Production, Transportation and Moving Occupations
The most common Production, Transportation and Moving occupations in St Anthony city Hennepin and Ramsey Counties are Material Moving (117 | 2.5%), Production (102 | 2.2%), and Transportation (82 | 1.8%).
Production, Transportation and Moving Occupations by Sex
| Occupation | Male | Female |
| Production | 83 (81.4%) | 19 (18.6%) |
| Transportation | 63 (76.8%) | 19 (23.2%) |
| Material Moving | 117 (100.0%) | 0 (0.0%) |
| Total (Category) | 263 (87.4%) | 38 (12.6%) |
| Total (Overall) | 2,427 (52.8%) | 2,169 (47.2%) |
Employment Industries by Sex in St Anthony city Hennepin and Ramsey Counties
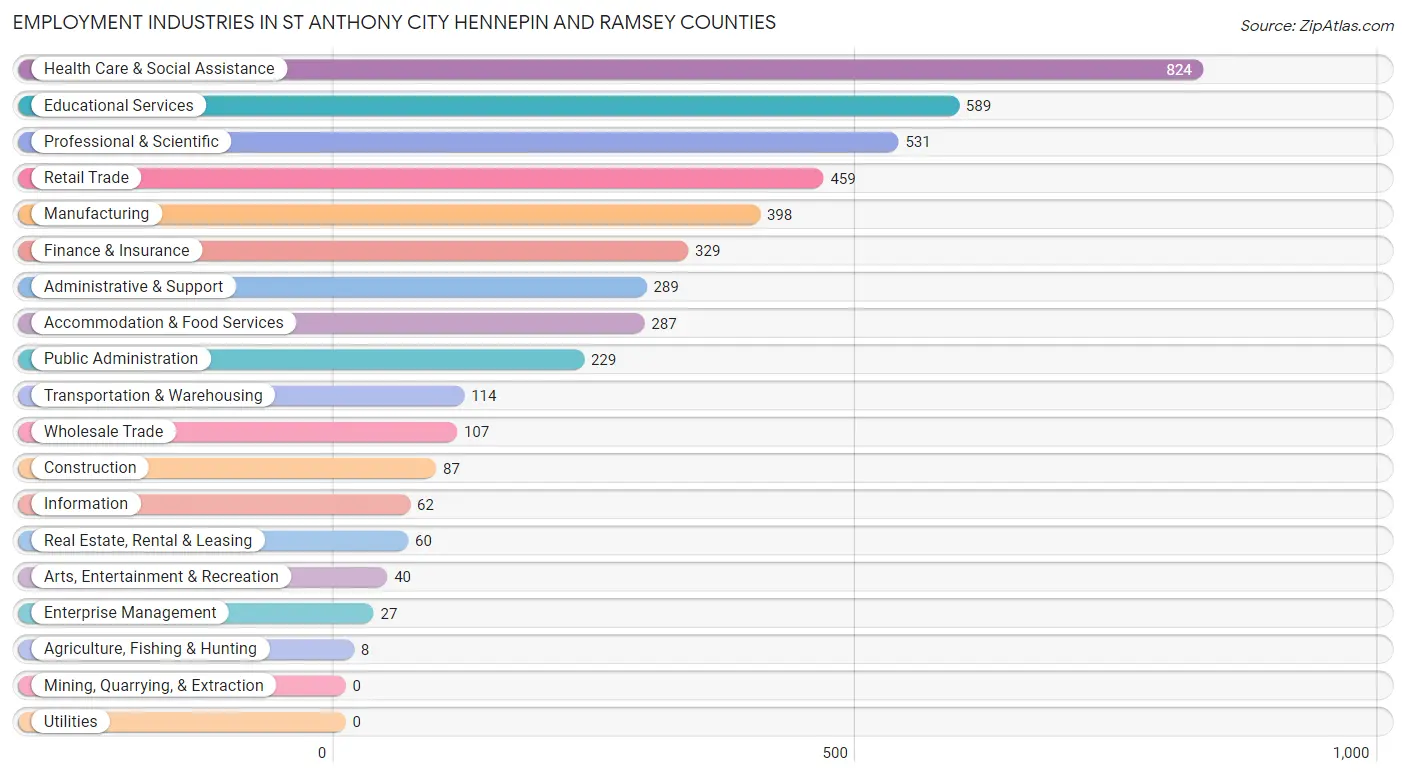
Employment Industries in St Anthony city Hennepin and Ramsey Counties
The major employment industries in St Anthony city Hennepin and Ramsey Counties include Health Care & Social Assistance (824 | 17.9%), Educational Services (589 | 12.8%), Professional & Scientific (531 | 11.6%), Retail Trade (459 | 10.0%), and Manufacturing (398 | 8.7%).
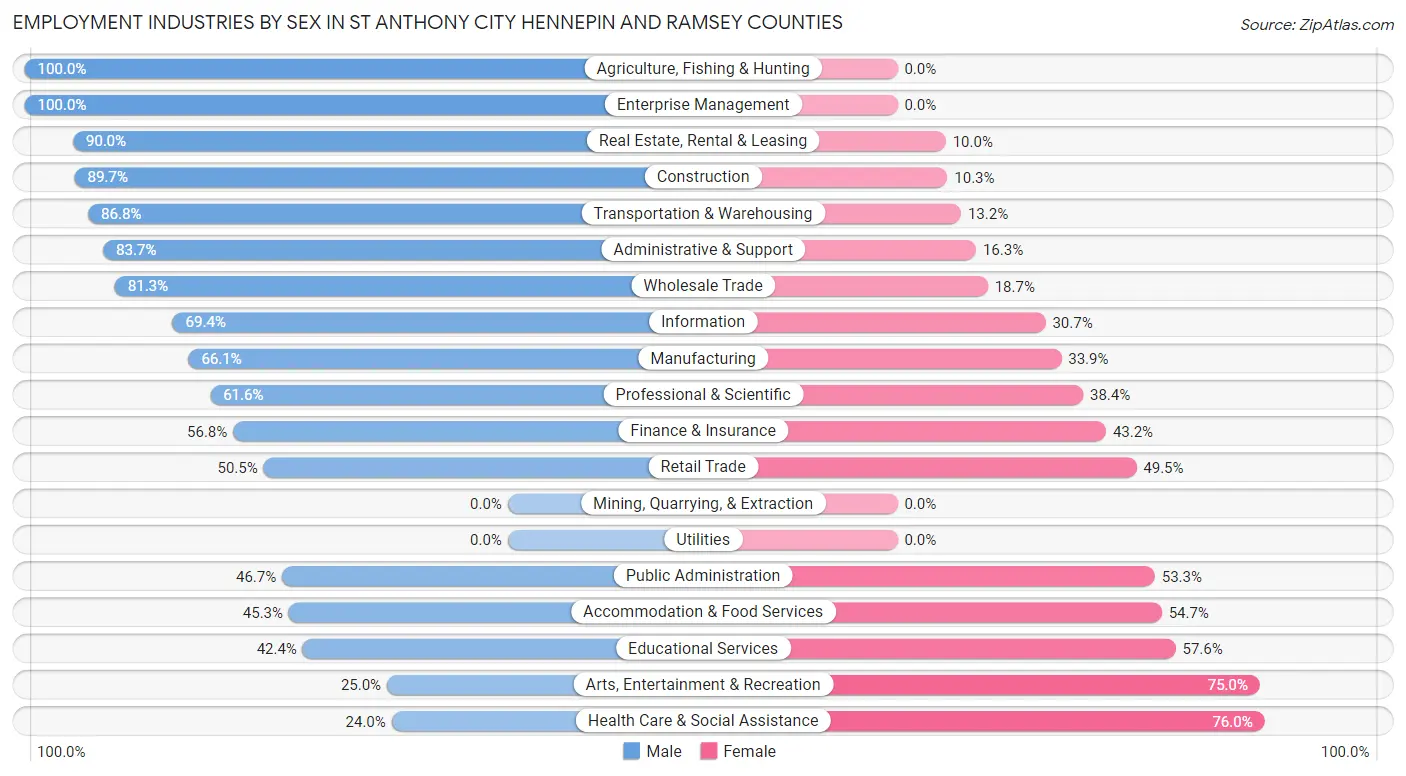
Employment Industries by Sex in St Anthony city Hennepin and Ramsey Counties
The St Anthony city Hennepin and Ramsey Counties industries that see more men than women are Agriculture, Fishing & Hunting (100.0%), Enterprise Management (100.0%), and Real Estate, Rental & Leasing (90.0%), whereas the industries that tend to have a higher number of women are Health Care & Social Assistance (76.0%), Arts, Entertainment & Recreation (75.0%), and Educational Services (57.6%).
| Industry | Male | Female |
| Agriculture, Fishing & Hunting | 8 (100.0%) | 0 (0.0%) |
| Mining, Quarrying, & Extraction | 0 (0.0%) | 0 (0.0%) |
| Construction | 78 (89.7%) | 9 (10.3%) |
| Manufacturing | 263 (66.1%) | 135 (33.9%) |
| Wholesale Trade | 87 (81.3%) | 20 (18.7%) |
| Retail Trade | 232 (50.5%) | 227 (49.5%) |
| Transportation & Warehousing | 99 (86.8%) | 15 (13.2%) |
| Utilities | 0 (0.0%) | 0 (0.0%) |
| Information | 43 (69.4%) | 19 (30.6%) |
| Finance & Insurance | 187 (56.8%) | 142 (43.2%) |
| Real Estate, Rental & Leasing | 54 (90.0%) | 6 (10.0%) |
| Professional & Scientific | 327 (61.6%) | 204 (38.4%) |
| Enterprise Management | 27 (100.0%) | 0 (0.0%) |
| Administrative & Support | 242 (83.7%) | 47 (16.3%) |
| Educational Services | 250 (42.4%) | 339 (57.6%) |
| Health Care & Social Assistance | 198 (24.0%) | 626 (76.0%) |
| Arts, Entertainment & Recreation | 10 (25.0%) | 30 (75.0%) |
| Accommodation & Food Services | 130 (45.3%) | 157 (54.7%) |
| Public Administration | 107 (46.7%) | 122 (53.3%) |
| Total | 2,427 (52.8%) | 2,169 (47.2%) |
Education in St Anthony city Hennepin and Ramsey Counties
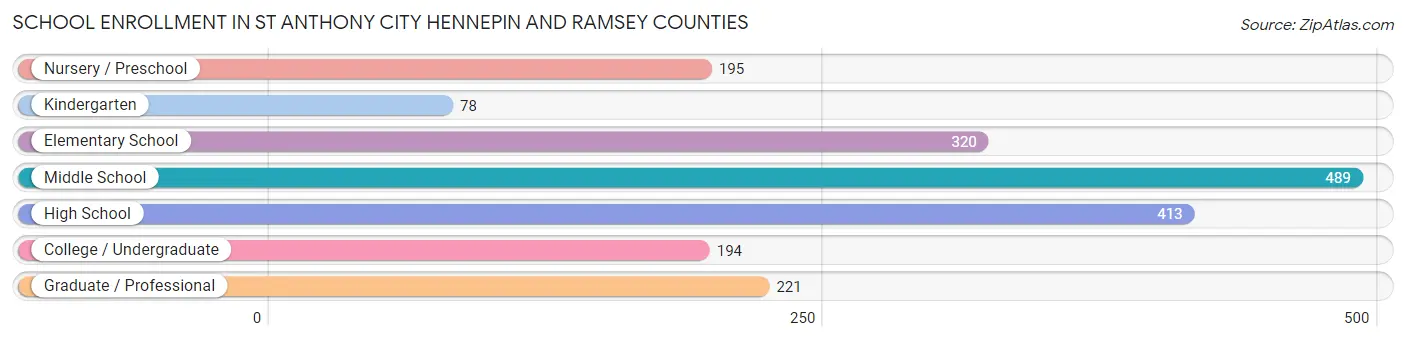
School Enrollment in St Anthony city Hennepin and Ramsey Counties
The most common levels of schooling among the 1,910 students in St Anthony city Hennepin and Ramsey Counties are middle school (489 | 25.6%), high school (413 | 21.6%), and elementary school (320 | 16.8%).
| School Level | # Students | % Students |
| Nursery / Preschool | 195 | 10.2% |
| Kindergarten | 78 | 4.1% |
| Elementary School | 320 | 16.8% |
| Middle School | 489 | 25.6% |
| High School | 413 | 21.6% |
| College / Undergraduate | 194 | 10.2% |
| Graduate / Professional | 221 | 11.6% |
| Total | 1,910 | 100.0% |
School Enrollment by Age by Funding Source in St Anthony city Hennepin and Ramsey Counties
Out of a total of 1,910 students who are enrolled in schools in St Anthony city Hennepin and Ramsey Counties, 309 (16.2%) attend a private institution, while the remaining 1,601 (83.8%) are enrolled in public schools. The age group of 3 to 4 year olds has the highest likelihood of being enrolled in private schools, with 142 (82.6% in the age bracket) enrolled. Conversely, the age group of 18 to 19 year olds has the lowest likelihood of being enrolled in a private school, with 36 (100.0% in the age bracket) attending a public institution.
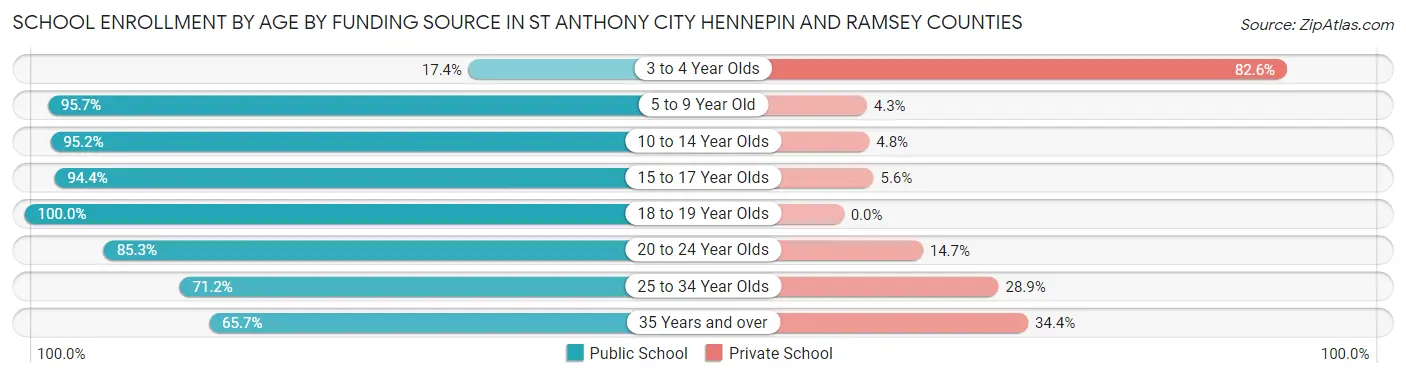
| Age Bracket | Public School | Private School |
| 3 to 4 Year Olds | 30 (17.4%) | 142 (82.6%) |
| 5 to 9 Year Old | 310 (95.7%) | 14 (4.3%) |
| 10 to 14 Year Olds | 657 (95.2%) | 33 (4.8%) |
| 15 to 17 Year Olds | 289 (94.4%) | 17 (5.6%) |
| 18 to 19 Year Olds | 36 (100.0%) | 0 (0.0%) |
| 20 to 24 Year Olds | 81 (85.3%) | 14 (14.7%) |
| 25 to 34 Year Olds | 111 (71.2%) | 45 (28.8%) |
| 35 Years and over | 86 (65.6%) | 45 (34.4%) |
| Total | 1,601 (83.8%) | 309 (16.2%) |
Educational Attainment by Field of Study in St Anthony city Hennepin and Ramsey Counties
Business (705 | 15.2%), communications (504 | 10.9%), science & technology (471 | 10.2%), social sciences (407 | 8.8%), and education (364 | 7.9%) are the most common fields of study among 4,630 individuals in St Anthony city Hennepin and Ramsey Counties who have obtained a bachelor's degree or higher.
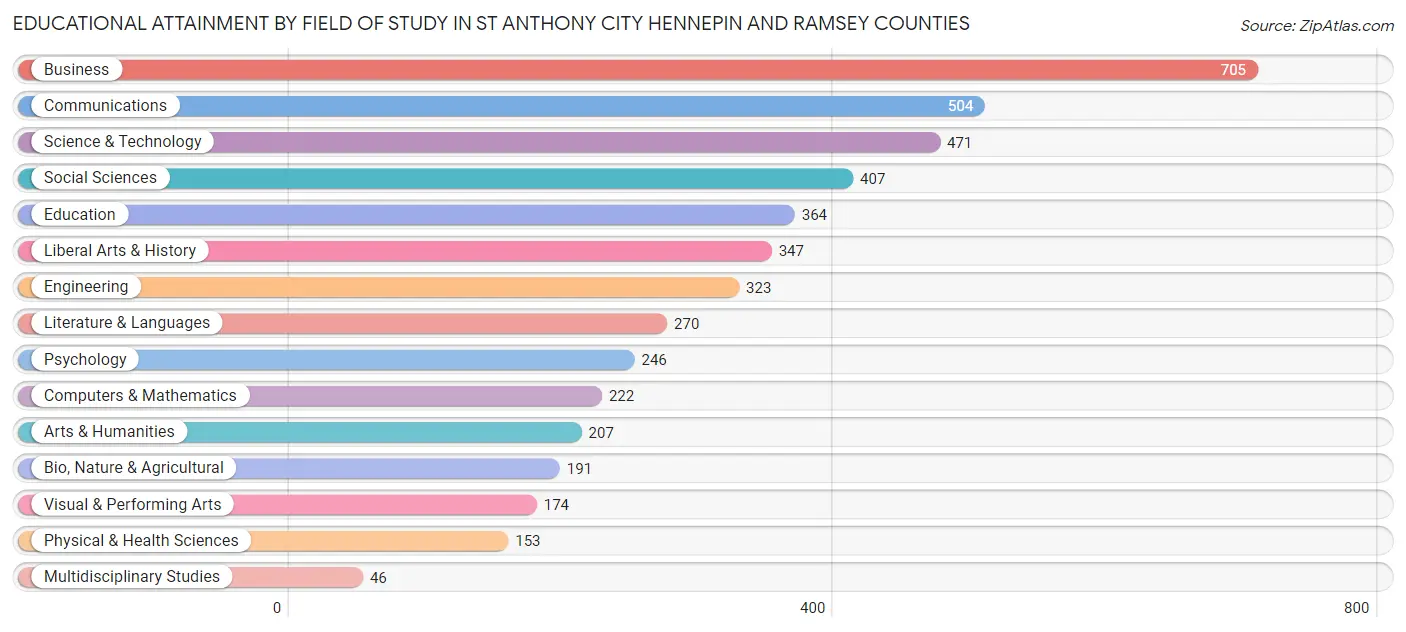
| Field of Study | # Graduates | % Graduates |
| Computers & Mathematics | 222 | 4.8% |
| Bio, Nature & Agricultural | 191 | 4.1% |
| Physical & Health Sciences | 153 | 3.3% |
| Psychology | 246 | 5.3% |
| Social Sciences | 407 | 8.8% |
| Engineering | 323 | 7.0% |
| Multidisciplinary Studies | 46 | 1.0% |
| Science & Technology | 471 | 10.2% |
| Business | 705 | 15.2% |
| Education | 364 | 7.9% |
| Literature & Languages | 270 | 5.8% |
| Liberal Arts & History | 347 | 7.5% |
| Visual & Performing Arts | 174 | 3.8% |
| Communications | 504 | 10.9% |
| Arts & Humanities | 207 | 4.5% |
| Total | 4,630 | 100.0% |
Transportation & Commute in St Anthony city Hennepin and Ramsey Counties
Vehicle Availability by Sex in St Anthony city Hennepin and Ramsey Counties
The most prevalent vehicle ownership categories in St Anthony city Hennepin and Ramsey Counties are males with 2 vehicles (1,136, accounting for 46.8%) and females with 2 vehicles (1,045, making up 54.2%).
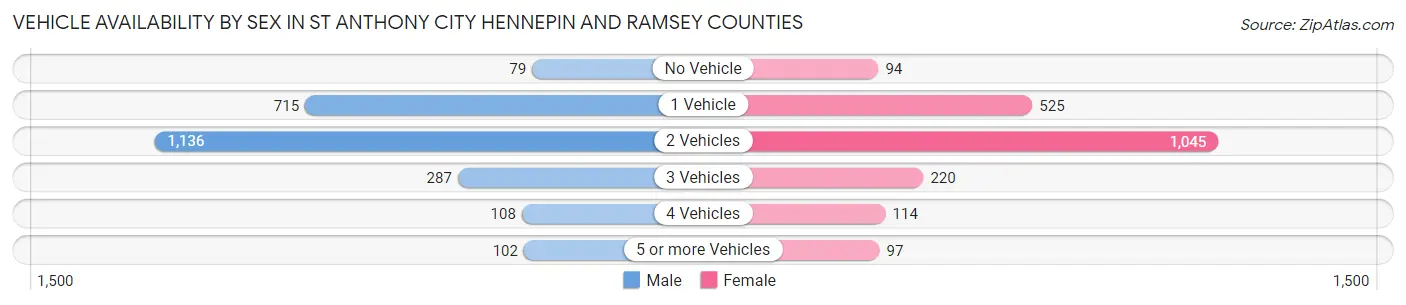
| Vehicles Available | Male | Female |
| No Vehicle | 79 (3.3%) | 94 (4.5%) |
| 1 Vehicle | 715 (29.5%) | 525 (25.1%) |
| 2 Vehicles | 1,136 (46.8%) | 1,045 (49.9%) |
| 3 Vehicles | 287 (11.8%) | 220 (10.5%) |
| 4 Vehicles | 108 (4.4%) | 114 (5.4%) |
| 5 or more Vehicles | 102 (4.2%) | 97 (4.6%) |
| Total | 2,427 (100.0%) | 2,095 (100.0%) |
Commute Time in St Anthony city Hennepin and Ramsey Counties
The most frequently occuring commute durations in St Anthony city Hennepin and Ramsey Counties are 15 to 19 minutes (850 commuters, 23.6%), 20 to 24 minutes (764 commuters, 21.2%), and 30 to 34 minutes (426 commuters, 11.8%).
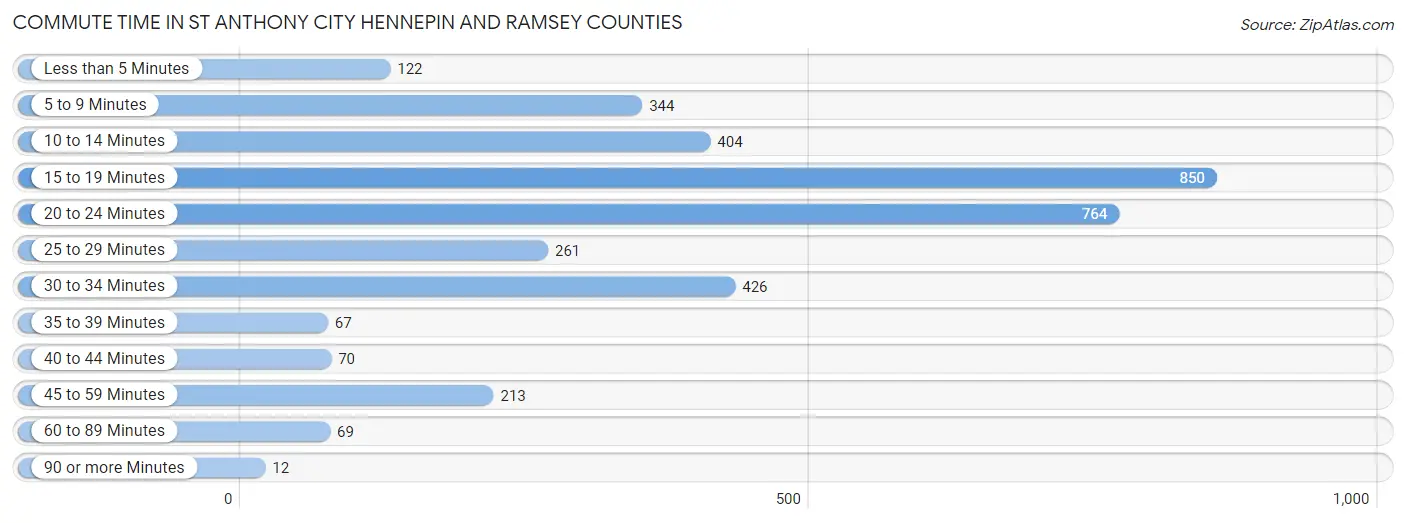
| Commute Time | # Commuters | % Commuters |
| Less than 5 Minutes | 122 | 3.4% |
| 5 to 9 Minutes | 344 | 9.6% |
| 10 to 14 Minutes | 404 | 11.2% |
| 15 to 19 Minutes | 850 | 23.6% |
| 20 to 24 Minutes | 764 | 21.2% |
| 25 to 29 Minutes | 261 | 7.2% |
| 30 to 34 Minutes | 426 | 11.8% |
| 35 to 39 Minutes | 67 | 1.9% |
| 40 to 44 Minutes | 70 | 1.9% |
| 45 to 59 Minutes | 213 | 5.9% |
| 60 to 89 Minutes | 69 | 1.9% |
| 90 or more Minutes | 12 | 0.3% |
Commute Time by Sex in St Anthony city Hennepin and Ramsey Counties
The most common commute times in St Anthony city Hennepin and Ramsey Counties are 15 to 19 minutes (543 commuters, 27.9%) for males and 20 to 24 minutes (338 commuters, 20.4%) for females.
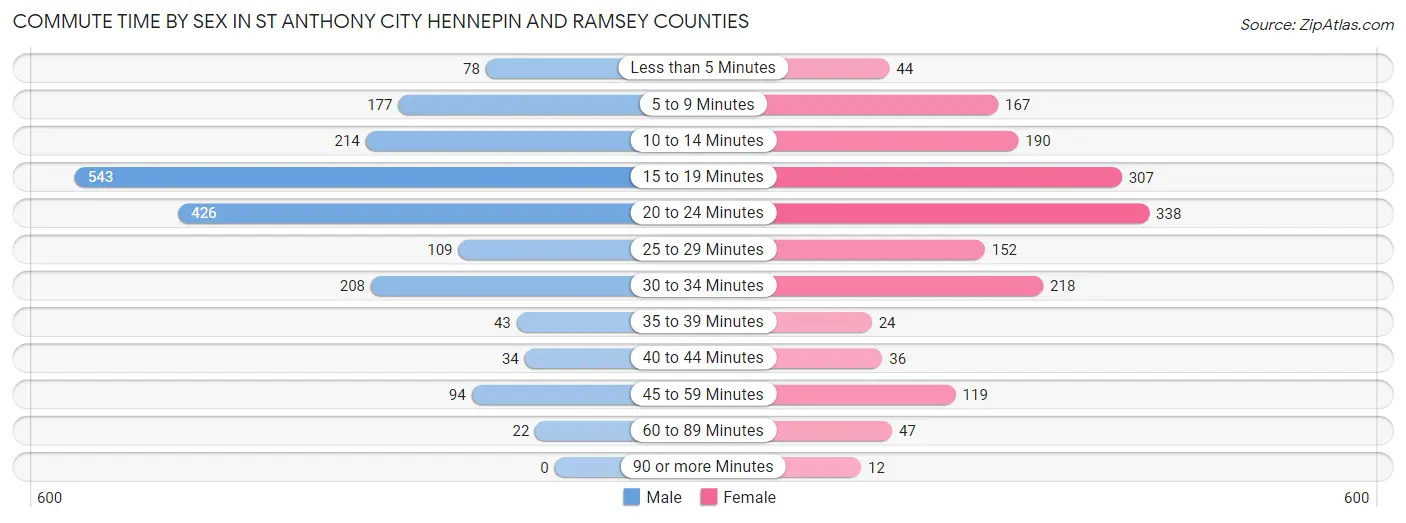
| Commute Time | Male | Female |
| Less than 5 Minutes | 78 (4.0%) | 44 (2.7%) |
| 5 to 9 Minutes | 177 (9.1%) | 167 (10.1%) |
| 10 to 14 Minutes | 214 (11.0%) | 190 (11.5%) |
| 15 to 19 Minutes | 543 (27.9%) | 307 (18.6%) |
| 20 to 24 Minutes | 426 (21.9%) | 338 (20.4%) |
| 25 to 29 Minutes | 109 (5.6%) | 152 (9.2%) |
| 30 to 34 Minutes | 208 (10.7%) | 218 (13.2%) |
| 35 to 39 Minutes | 43 (2.2%) | 24 (1.5%) |
| 40 to 44 Minutes | 34 (1.8%) | 36 (2.2%) |
| 45 to 59 Minutes | 94 (4.8%) | 119 (7.2%) |
| 60 to 89 Minutes | 22 (1.1%) | 47 (2.8%) |
| 90 or more Minutes | 0 (0.0%) | 12 (0.7%) |
Time of Departure to Work by Sex in St Anthony city Hennepin and Ramsey Counties
The most frequent times of departure to work in St Anthony city Hennepin and Ramsey Counties are 7:30 AM to 7:59 AM (453, 23.3%) for males and 6:30 AM to 6:59 AM (326, 19.7%) for females.
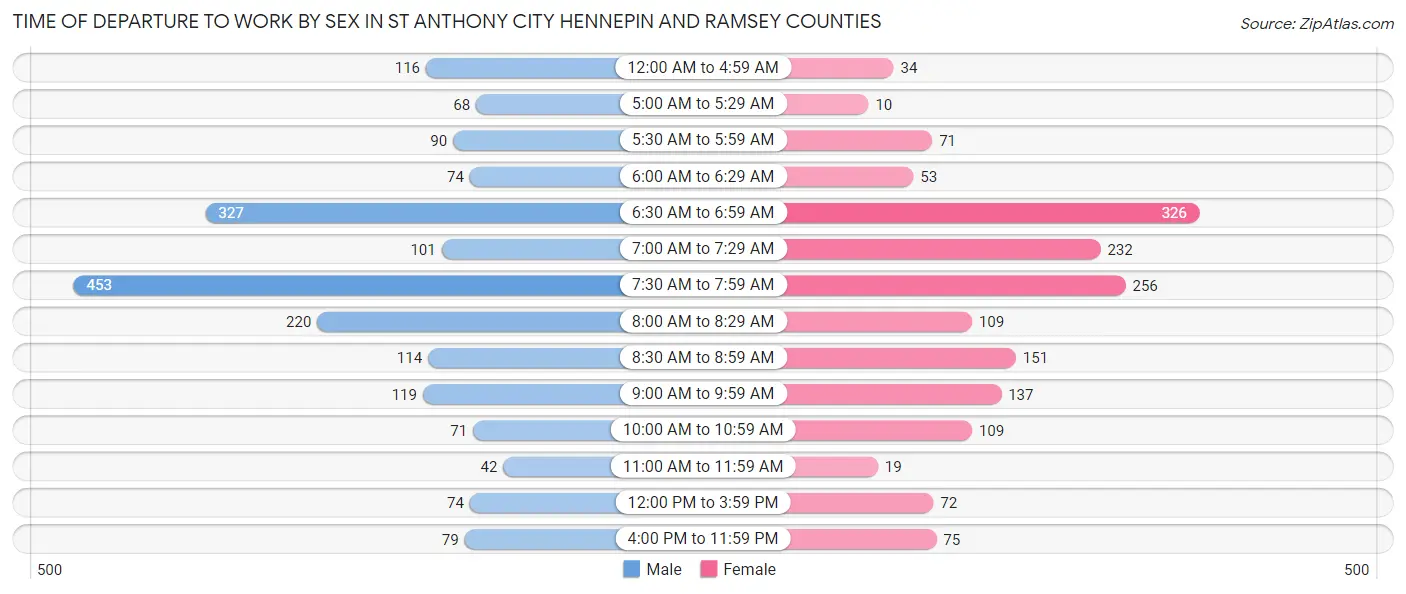
| Time of Departure | Male | Female |
| 12:00 AM to 4:59 AM | 116 (5.9%) | 34 (2.1%) |
| 5:00 AM to 5:29 AM | 68 (3.5%) | 10 (0.6%) |
| 5:30 AM to 5:59 AM | 90 (4.6%) | 71 (4.3%) |
| 6:00 AM to 6:29 AM | 74 (3.8%) | 53 (3.2%) |
| 6:30 AM to 6:59 AM | 327 (16.8%) | 326 (19.7%) |
| 7:00 AM to 7:29 AM | 101 (5.2%) | 232 (14.0%) |
| 7:30 AM to 7:59 AM | 453 (23.3%) | 256 (15.5%) |
| 8:00 AM to 8:29 AM | 220 (11.3%) | 109 (6.6%) |
| 8:30 AM to 8:59 AM | 114 (5.9%) | 151 (9.1%) |
| 9:00 AM to 9:59 AM | 119 (6.1%) | 137 (8.3%) |
| 10:00 AM to 10:59 AM | 71 (3.6%) | 109 (6.6%) |
| 11:00 AM to 11:59 AM | 42 (2.2%) | 19 (1.1%) |
| 12:00 PM to 3:59 PM | 74 (3.8%) | 72 (4.3%) |
| 4:00 PM to 11:59 PM | 79 (4.1%) | 75 (4.5%) |
| Total | 1,948 (100.0%) | 1,654 (100.0%) |
Housing Occupancy in St Anthony city Hennepin and Ramsey Counties
Occupancy by Ownership in St Anthony city Hennepin and Ramsey Counties
Of the total 4,022 dwellings in St Anthony city Hennepin and Ramsey Counties, owner-occupied units account for 2,409 (59.9%), while renter-occupied units make up 1,613 (40.1%).
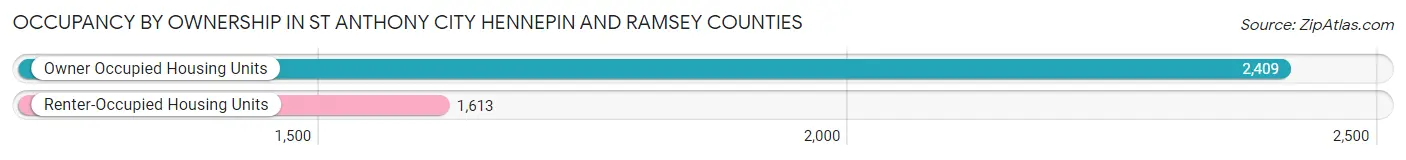
| Occupancy | # Housing Units | % Housing Units |
| Owner Occupied Housing Units | 2,409 | 59.9% |
| Renter-Occupied Housing Units | 1,613 | 40.1% |
| Total Occupied Housing Units | 4,022 | 100.0% |
Occupancy by Household Size in St Anthony city Hennepin and Ramsey Counties
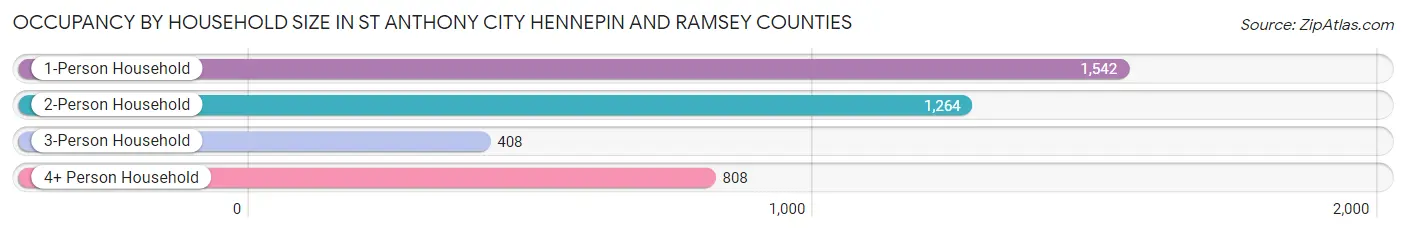
| Household Size | # Housing Units | % Housing Units |
| 1-Person Household | 1,542 | 38.3% |
| 2-Person Household | 1,264 | 31.4% |
| 3-Person Household | 408 | 10.1% |
| 4+ Person Household | 808 | 20.1% |
| Total Housing Units | 4,022 | 100.0% |
Occupancy by Ownership by Household Size in St Anthony city Hennepin and Ramsey Counties
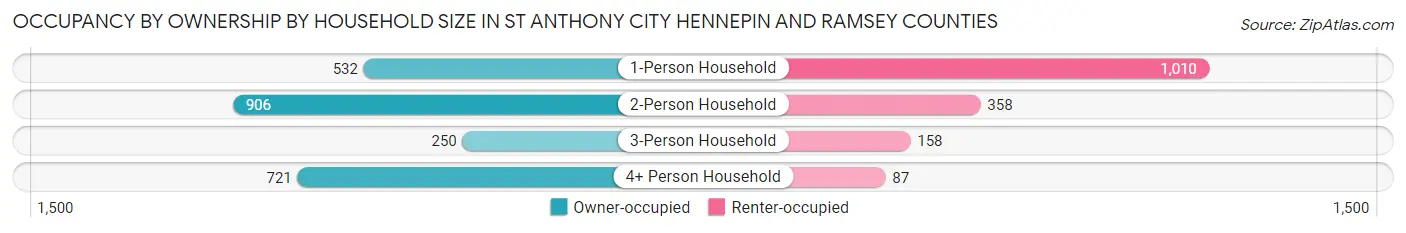
| Household Size | Owner-occupied | Renter-occupied |
| 1-Person Household | 532 (34.5%) | 1,010 (65.5%) |
| 2-Person Household | 906 (71.7%) | 358 (28.3%) |
| 3-Person Household | 250 (61.3%) | 158 (38.7%) |
| 4+ Person Household | 721 (89.2%) | 87 (10.8%) |
| Total Housing Units | 2,409 (59.9%) | 1,613 (40.1%) |
Occupancy by Educational Attainment in St Anthony city Hennepin and Ramsey Counties
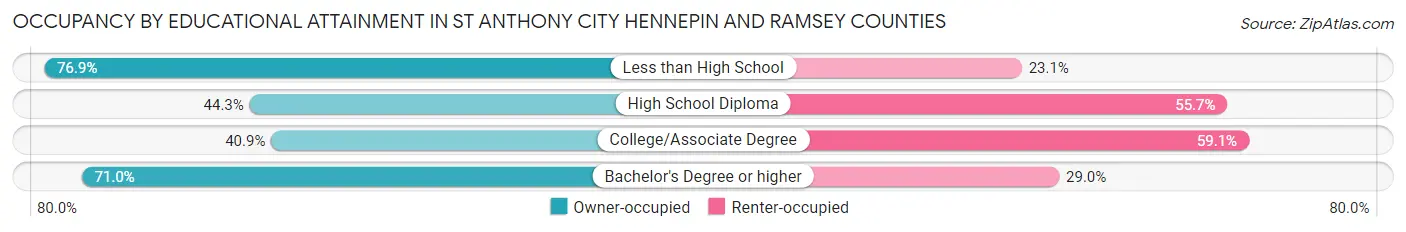
| Household Size | Owner-occupied | Renter-occupied |
| Less than High School | 60 (76.9%) | 18 (23.1%) |
| High School Diploma | 296 (44.3%) | 372 (55.7%) |
| College/Associate Degree | 370 (40.9%) | 535 (59.1%) |
| Bachelor's Degree or higher | 1,683 (71.0%) | 688 (29.0%) |
Occupancy by Age of Householder in St Anthony city Hennepin and Ramsey Counties
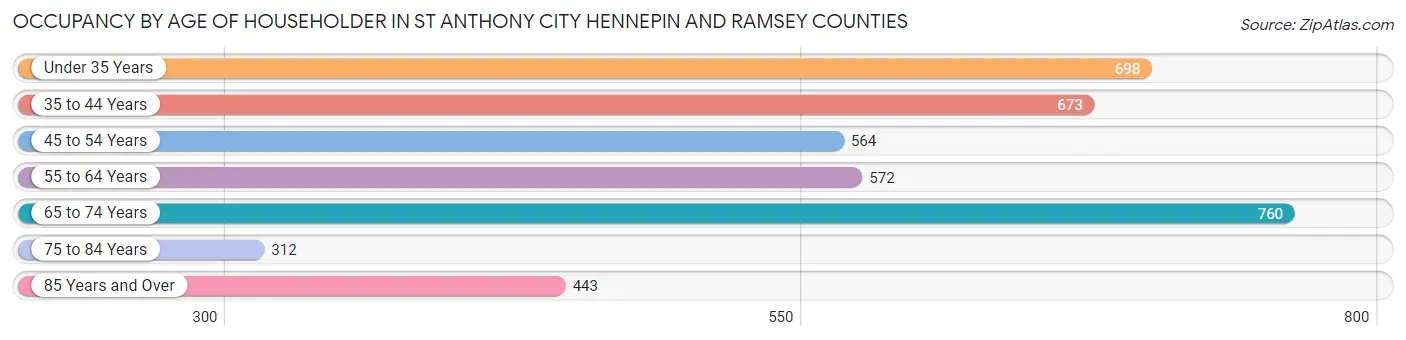
| Age Bracket | # Households | % Households |
| Under 35 Years | 698 | 17.3% |
| 35 to 44 Years | 673 | 16.7% |
| 45 to 54 Years | 564 | 14.0% |
| 55 to 64 Years | 572 | 14.2% |
| 65 to 74 Years | 760 | 18.9% |
| 75 to 84 Years | 312 | 7.8% |
| 85 Years and Over | 443 | 11.0% |
| Total | 4,022 | 100.0% |
Housing Finances in St Anthony city Hennepin and Ramsey Counties
Median Income by Occupancy in St Anthony city Hennepin and Ramsey Counties
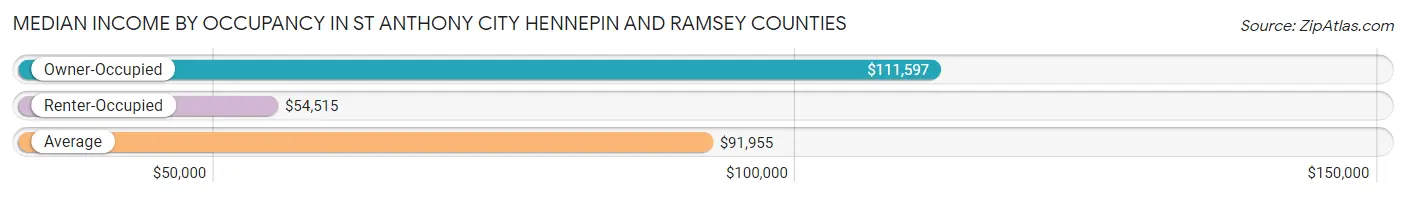
| Occupancy Type | # Households | Median Income |
| Owner-Occupied | 2,409 (59.9%) | $111,597 |
| Renter-Occupied | 1,613 (40.1%) | $54,515 |
| Average | 4,022 (100.0%) | $91,955 |
Occupancy by Householder Income Bracket in St Anthony city Hennepin and Ramsey Counties
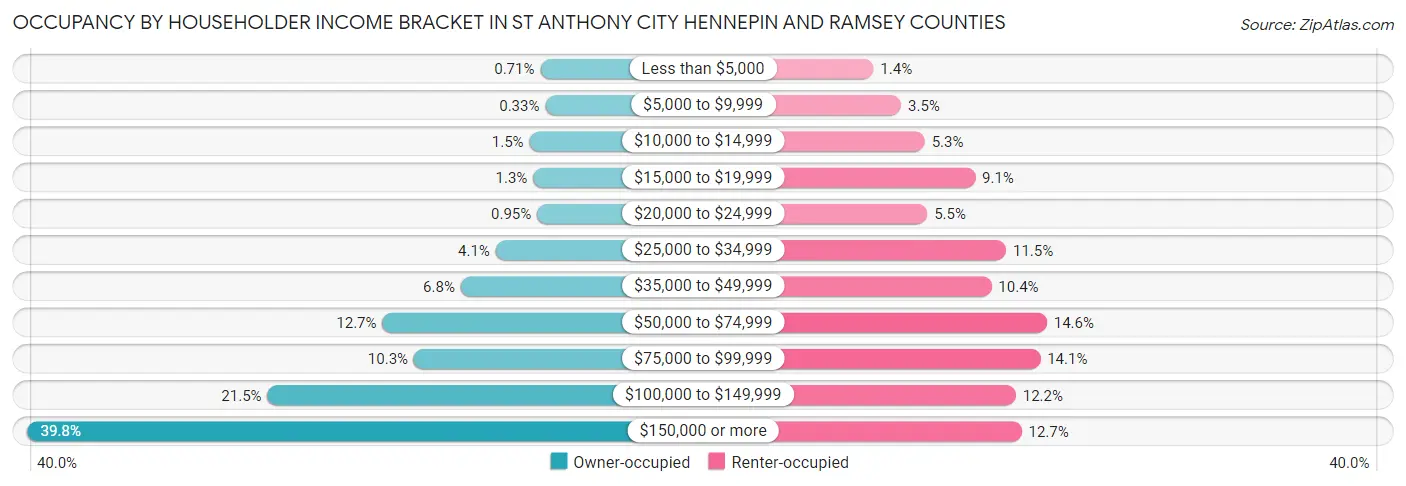
| Income Bracket | Owner-occupied | Renter-occupied |
| Less than $5,000 | 17 (0.7%) | 22 (1.4%) |
| $5,000 to $9,999 | 8 (0.3%) | 56 (3.5%) |
| $10,000 to $14,999 | 37 (1.5%) | 85 (5.3%) |
| $15,000 to $19,999 | 30 (1.3%) | 147 (9.1%) |
| $20,000 to $24,999 | 23 (0.9%) | 88 (5.5%) |
| $25,000 to $34,999 | 99 (4.1%) | 185 (11.5%) |
| $35,000 to $49,999 | 163 (6.8%) | 167 (10.3%) |
| $50,000 to $74,999 | 307 (12.7%) | 235 (14.6%) |
| $75,000 to $99,999 | 249 (10.3%) | 227 (14.1%) |
| $100,000 to $149,999 | 518 (21.5%) | 197 (12.2%) |
| $150,000 or more | 958 (39.8%) | 204 (12.7%) |
| Total | 2,409 (100.0%) | 1,613 (100.0%) |
Monthly Housing Cost Tiers in St Anthony city Hennepin and Ramsey Counties
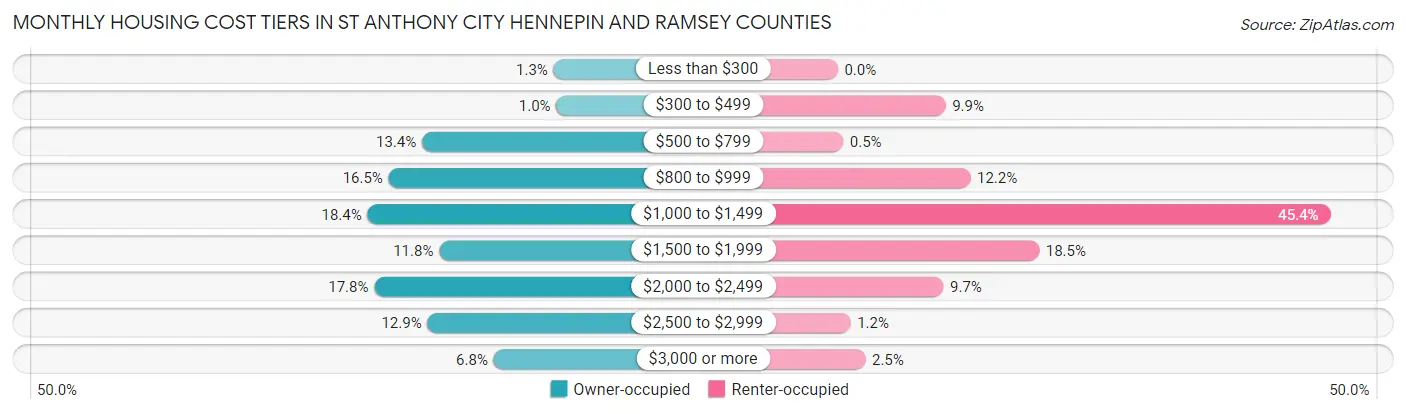
| Monthly Cost | Owner-occupied | Renter-occupied |
| Less than $300 | 31 (1.3%) | 0 (0.0%) |
| $300 to $499 | 25 (1.0%) | 160 (9.9%) |
| $500 to $799 | 323 (13.4%) | 8 (0.5%) |
| $800 to $999 | 397 (16.5%) | 197 (12.2%) |
| $1,000 to $1,499 | 444 (18.4%) | 732 (45.4%) |
| $1,500 to $1,999 | 285 (11.8%) | 299 (18.5%) |
| $2,000 to $2,499 | 429 (17.8%) | 157 (9.7%) |
| $2,500 to $2,999 | 311 (12.9%) | 19 (1.2%) |
| $3,000 or more | 164 (6.8%) | 41 (2.5%) |
| Total | 2,409 (100.0%) | 1,613 (100.0%) |
Physical Housing Characteristics in St Anthony city Hennepin and Ramsey Counties
Housing Structures in St Anthony city Hennepin and Ramsey Counties
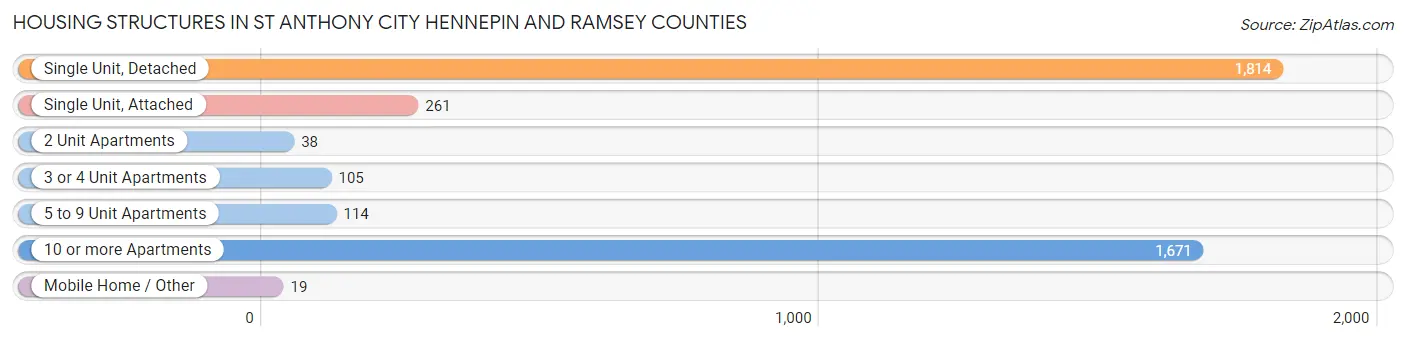
| Structure Type | # Housing Units | % Housing Units |
| Single Unit, Detached | 1,814 | 45.1% |
| Single Unit, Attached | 261 | 6.5% |
| 2 Unit Apartments | 38 | 0.9% |
| 3 or 4 Unit Apartments | 105 | 2.6% |
| 5 to 9 Unit Apartments | 114 | 2.8% |
| 10 or more Apartments | 1,671 | 41.5% |
| Mobile Home / Other | 19 | 0.5% |
| Total | 4,022 | 100.0% |
Housing Structures by Occupancy in St Anthony city Hennepin and Ramsey Counties
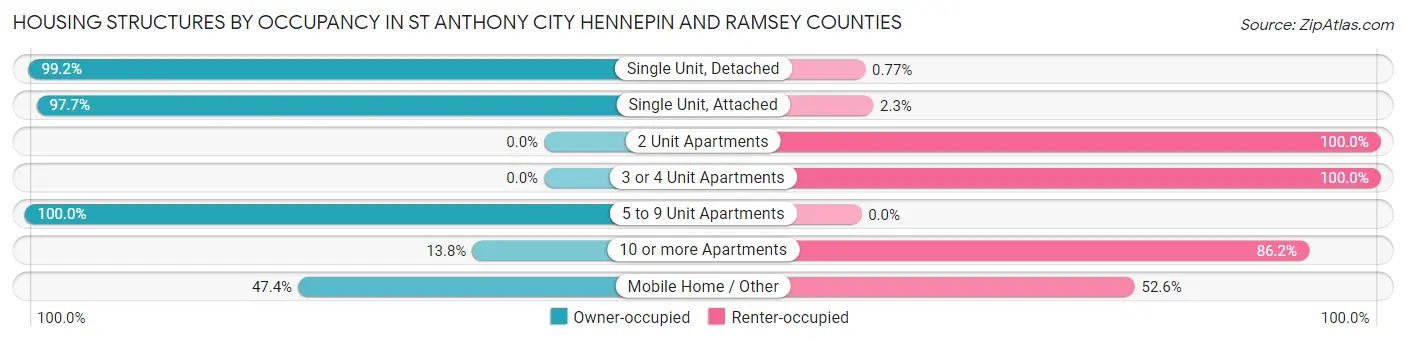
| Structure Type | Owner-occupied | Renter-occupied |
| Single Unit, Detached | 1,800 (99.2%) | 14 (0.8%) |
| Single Unit, Attached | 255 (97.7%) | 6 (2.3%) |
| 2 Unit Apartments | 0 (0.0%) | 38 (100.0%) |
| 3 or 4 Unit Apartments | 0 (0.0%) | 105 (100.0%) |
| 5 to 9 Unit Apartments | 114 (100.0%) | 0 (0.0%) |
| 10 or more Apartments | 231 (13.8%) | 1,440 (86.2%) |
| Mobile Home / Other | 9 (47.4%) | 10 (52.6%) |
| Total | 2,409 (59.9%) | 1,613 (40.1%) |
Housing Structures by Number of Rooms in St Anthony city Hennepin and Ramsey Counties
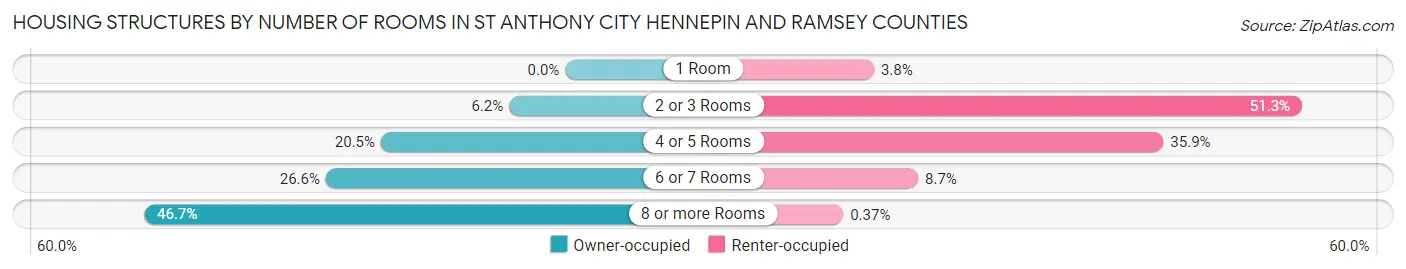
| Number of Rooms | Owner-occupied | Renter-occupied |
| 1 Room | 0 (0.0%) | 61 (3.8%) |
| 2 or 3 Rooms | 150 (6.2%) | 827 (51.3%) |
| 4 or 5 Rooms | 493 (20.5%) | 579 (35.9%) |
| 6 or 7 Rooms | 640 (26.6%) | 140 (8.7%) |
| 8 or more Rooms | 1,126 (46.7%) | 6 (0.4%) |
| Total | 2,409 (100.0%) | 1,613 (100.0%) |
Housing Structure by Heating Type in St Anthony city Hennepin and Ramsey Counties
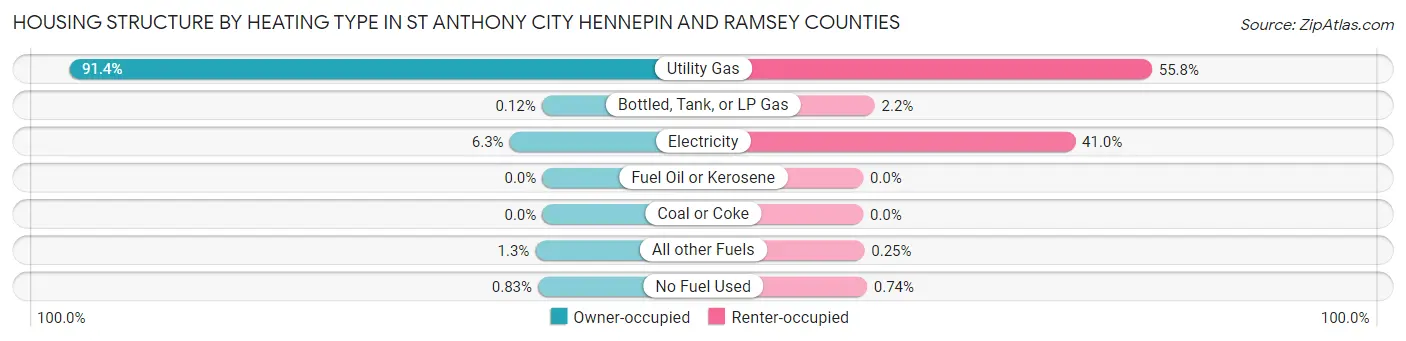
| Heating Type | Owner-occupied | Renter-occupied |
| Utility Gas | 2,202 (91.4%) | 900 (55.8%) |
| Bottled, Tank, or LP Gas | 3 (0.1%) | 36 (2.2%) |
| Electricity | 152 (6.3%) | 661 (41.0%) |
| Fuel Oil or Kerosene | 0 (0.0%) | 0 (0.0%) |
| Coal or Coke | 0 (0.0%) | 0 (0.0%) |
| All other Fuels | 32 (1.3%) | 4 (0.3%) |
| No Fuel Used | 20 (0.8%) | 12 (0.7%) |
| Total | 2,409 (100.0%) | 1,613 (100.0%) |
Household Vehicle Usage in St Anthony city Hennepin and Ramsey Counties
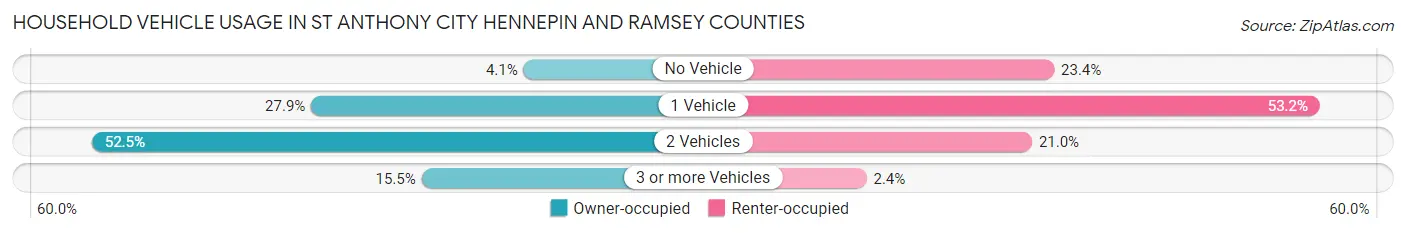
| Vehicles per Household | Owner-occupied | Renter-occupied |
| No Vehicle | 99 (4.1%) | 378 (23.4%) |
| 1 Vehicle | 672 (27.9%) | 858 (53.2%) |
| 2 Vehicles | 1,264 (52.5%) | 338 (20.9%) |
| 3 or more Vehicles | 374 (15.5%) | 39 (2.4%) |
| Total | 2,409 (100.0%) | 1,613 (100.0%) |
Real Estate & Mortgages in St Anthony city Hennepin and Ramsey Counties
Real Estate and Mortgage Overview in St Anthony city Hennepin and Ramsey Counties
| Characteristic | Without Mortgage | With Mortgage |
| Housing Units | 911 | 1,498 |
| Median Property Value | $336,900 | $360,400 |
| Median Household Income | $83,869 | $725 |
| Monthly Housing Costs | $894 | $164 |
| Real Estate Taxes | $5,699 | $29 |
Property Value by Mortgage Status in St Anthony city Hennepin and Ramsey Counties
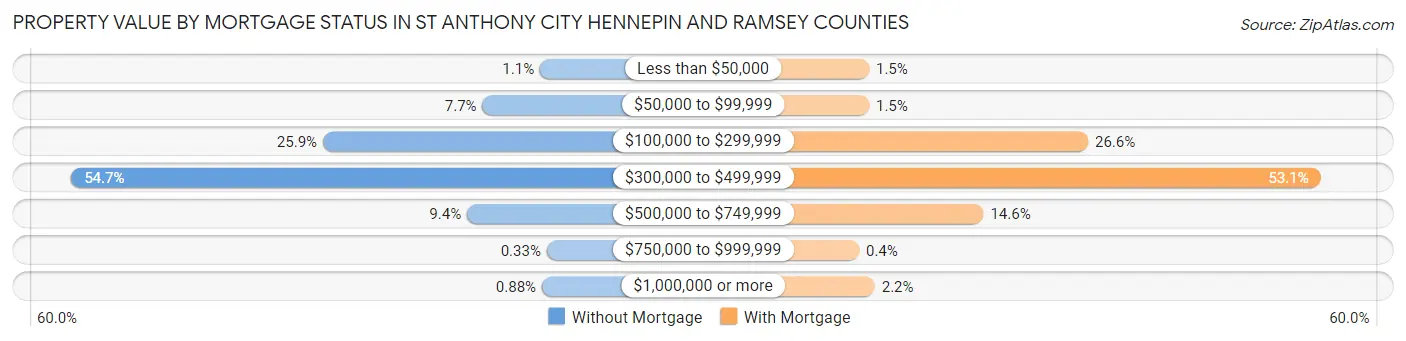
| Property Value | Without Mortgage | With Mortgage |
| Less than $50,000 | 10 (1.1%) | 23 (1.5%) |
| $50,000 to $99,999 | 70 (7.7%) | 23 (1.5%) |
| $100,000 to $299,999 | 236 (25.9%) | 398 (26.6%) |
| $300,000 to $499,999 | 498 (54.7%) | 796 (53.1%) |
| $500,000 to $749,999 | 86 (9.4%) | 219 (14.6%) |
| $750,000 to $999,999 | 3 (0.3%) | 6 (0.4%) |
| $1,000,000 or more | 8 (0.9%) | 33 (2.2%) |
| Total | 911 (100.0%) | 1,498 (100.0%) |
Household Income by Mortgage Status in St Anthony city Hennepin and Ramsey Counties
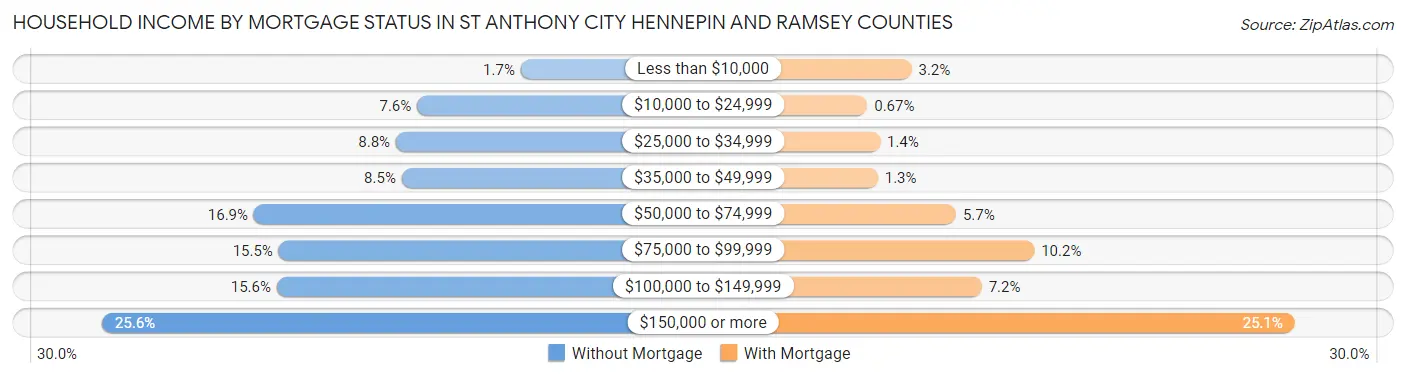
| Household Income | Without Mortgage | With Mortgage |
| Less than $10,000 | 15 (1.7%) | 48 (3.2%) |
| $10,000 to $24,999 | 69 (7.6%) | 10 (0.7%) |
| $25,000 to $34,999 | 80 (8.8%) | 21 (1.4%) |
| $35,000 to $49,999 | 77 (8.5%) | 19 (1.3%) |
| $50,000 to $74,999 | 154 (16.9%) | 86 (5.7%) |
| $75,000 to $99,999 | 141 (15.5%) | 153 (10.2%) |
| $100,000 to $149,999 | 142 (15.6%) | 108 (7.2%) |
| $150,000 or more | 233 (25.6%) | 376 (25.1%) |
| Total | 911 (100.0%) | 1,498 (100.0%) |
Property Value to Household Income Ratio in St Anthony city Hennepin and Ramsey Counties
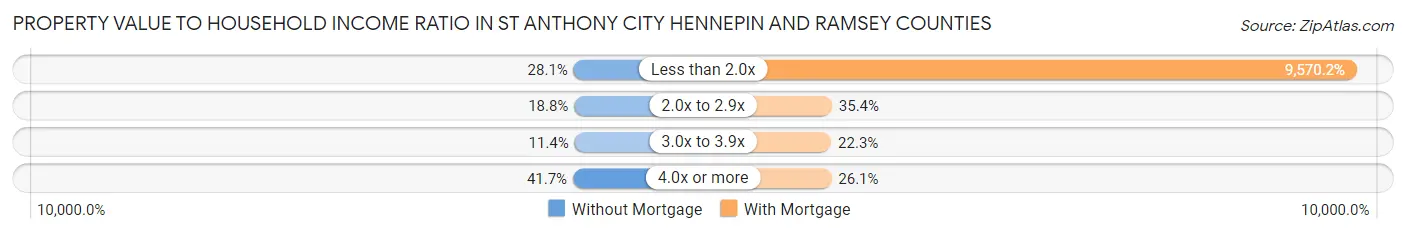
| Value-to-Income Ratio | Without Mortgage | With Mortgage |
| Less than 2.0x | 256 (28.1%) | 143,362 (9,570.2%) |
| 2.0x to 2.9x | 171 (18.8%) | 530 (35.4%) |
| 3.0x to 3.9x | 104 (11.4%) | 334 (22.3%) |
| 4.0x or more | 380 (41.7%) | 391 (26.1%) |
| Total | 911 (100.0%) | 1,498 (100.0%) |
Real Estate Taxes by Mortgage Status in St Anthony city Hennepin and Ramsey Counties
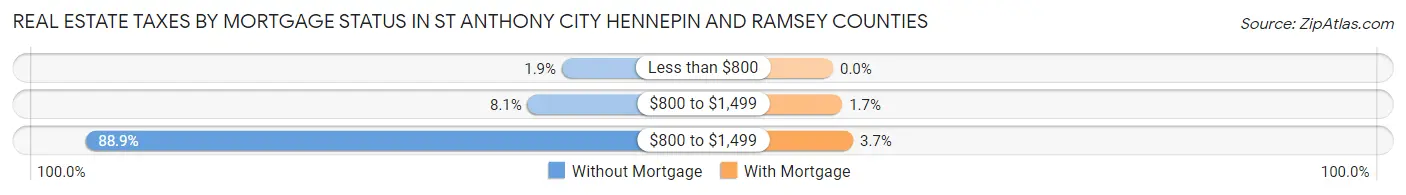
| Property Taxes | Without Mortgage | With Mortgage |
| Less than $800 | 17 (1.9%) | 0 (0.0%) |
| $800 to $1,499 | 74 (8.1%) | 25 (1.7%) |
| $800 to $1,499 | 810 (88.9%) | 55 (3.7%) |
| Total | 911 (100.0%) | 1,498 (100.0%) |
Health & Disability in St Anthony city Hennepin and Ramsey Counties
Health Insurance Coverage by Age in St Anthony city Hennepin and Ramsey Counties
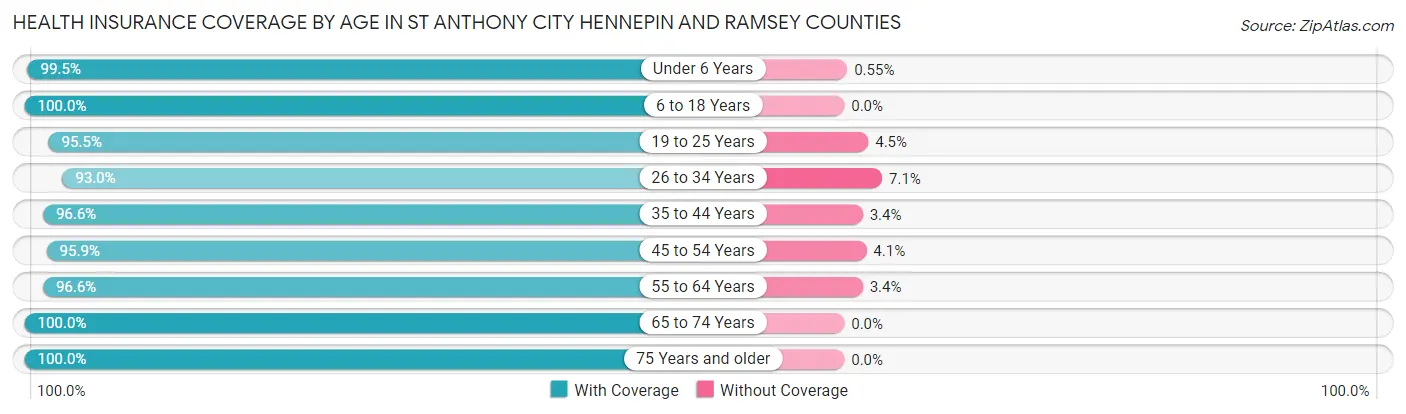
| Age Bracket | With Coverage | Without Coverage |
| Under 6 Years | 901 (99.5%) | 5 (0.5%) |
| 6 to 18 Years | 1,294 (100.0%) | 0 (0.0%) |
| 19 to 25 Years | 299 (95.5%) | 14 (4.5%) |
| 26 to 34 Years | 1,041 (92.9%) | 79 (7.0%) |
| 35 to 44 Years | 1,492 (96.6%) | 53 (3.4%) |
| 45 to 54 Years | 884 (95.9%) | 38 (4.1%) |
| 55 to 64 Years | 928 (96.6%) | 33 (3.4%) |
| 65 to 74 Years | 1,107 (100.0%) | 0 (0.0%) |
| 75 Years and older | 1,017 (100.0%) | 0 (0.0%) |
| Total | 8,963 (97.6%) | 222 (2.4%) |
Health Insurance Coverage by Citizenship Status in St Anthony city Hennepin and Ramsey Counties
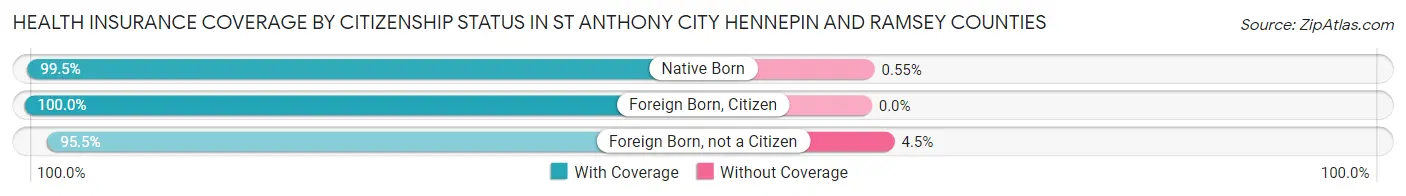
| Citizenship Status | With Coverage | Without Coverage |
| Native Born | 901 (99.5%) | 5 (0.5%) |
| Foreign Born, Citizen | 1,294 (100.0%) | 0 (0.0%) |
| Foreign Born, not a Citizen | 299 (95.5%) | 14 (4.5%) |
Health Insurance Coverage by Household Income in St Anthony city Hennepin and Ramsey Counties
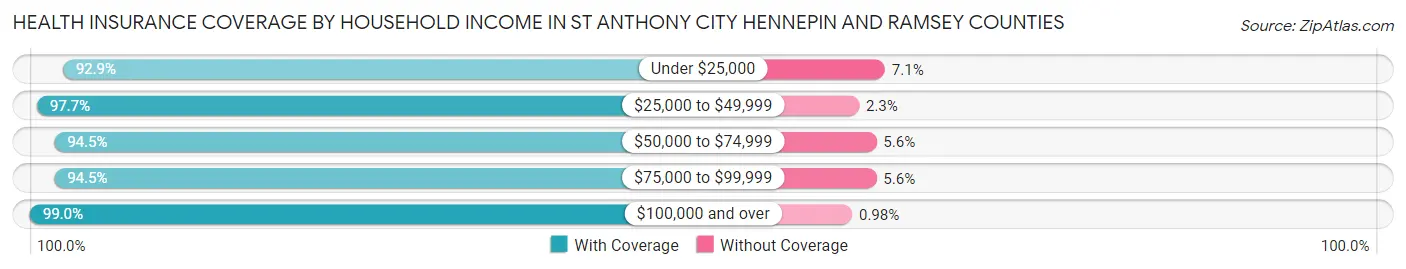
| Household Income | With Coverage | Without Coverage |
| Under $25,000 | 494 (92.9%) | 38 (7.1%) |
| $25,000 to $49,999 | 855 (97.7%) | 20 (2.3%) |
| $50,000 to $74,999 | 817 (94.5%) | 48 (5.6%) |
| $75,000 to $99,999 | 1,005 (94.5%) | 59 (5.6%) |
| $100,000 and over | 5,776 (99.0%) | 57 (1.0%) |
Public vs Private Health Insurance Coverage by Age in St Anthony city Hennepin and Ramsey Counties
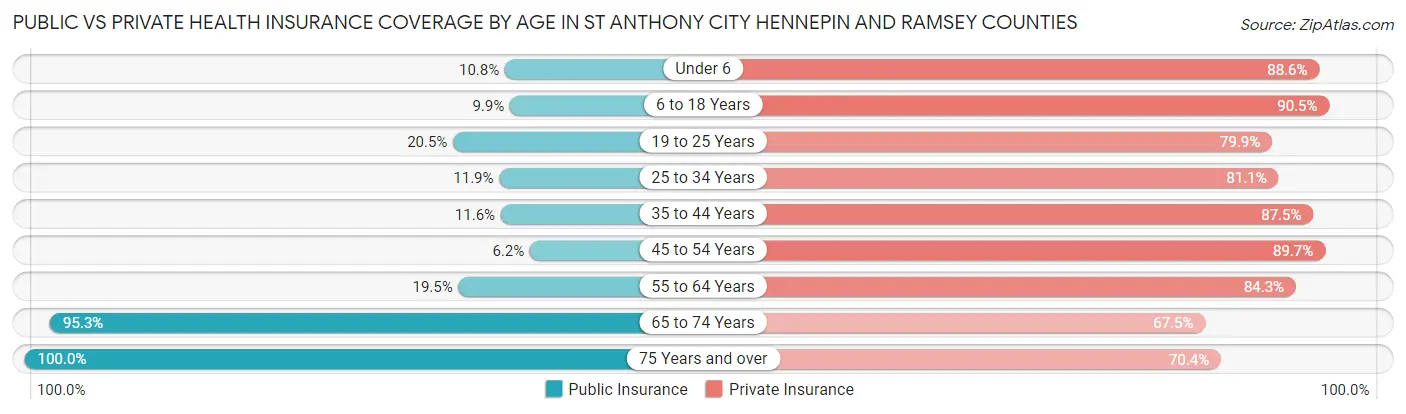
| Age Bracket | Public Insurance | Private Insurance |
| Under 6 | 98 (10.8%) | 803 (88.6%) |
| 6 to 18 Years | 128 (9.9%) | 1,171 (90.5%) |
| 19 to 25 Years | 64 (20.4%) | 250 (79.9%) |
| 25 to 34 Years | 133 (11.9%) | 908 (81.1%) |
| 35 to 44 Years | 179 (11.6%) | 1,352 (87.5%) |
| 45 to 54 Years | 57 (6.2%) | 827 (89.7%) |
| 55 to 64 Years | 187 (19.5%) | 810 (84.3%) |
| 65 to 74 Years | 1,055 (95.3%) | 747 (67.5%) |
| 75 Years and over | 1,017 (100.0%) | 716 (70.4%) |
| Total | 2,918 (31.8%) | 7,584 (82.6%) |
Disability Status by Sex by Age in St Anthony city Hennepin and Ramsey Counties
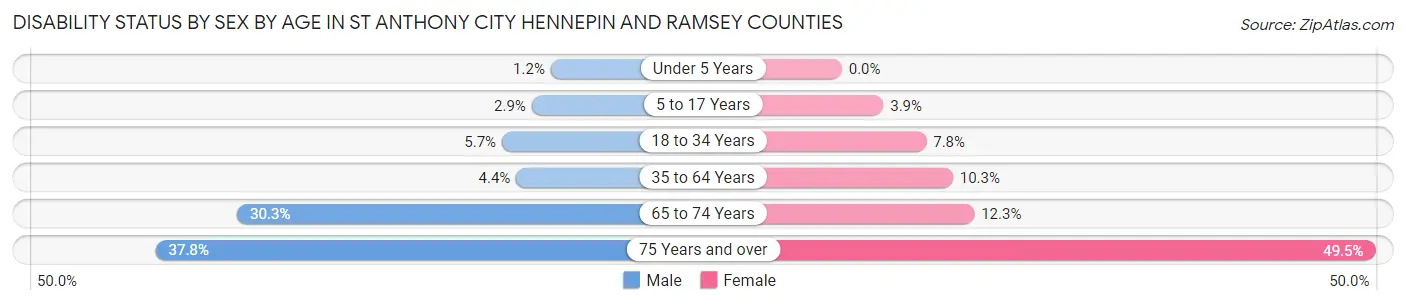
| Age Bracket | Male | Female |
| Under 5 Years | 7 (1.2%) | 0 (0.0%) |
| 5 to 17 Years | 21 (2.9%) | 24 (3.8%) |
| 18 to 34 Years | 38 (5.7%) | 61 (7.8%) |
| 35 to 64 Years | 80 (4.4%) | 165 (10.3%) |
| 65 to 74 Years | 175 (30.3%) | 65 (12.3%) |
| 75 Years and over | 154 (37.8%) | 302 (49.5%) |
Disability Class by Sex by Age in St Anthony city Hennepin and Ramsey Counties
Disability Class: Hearing Difficulty
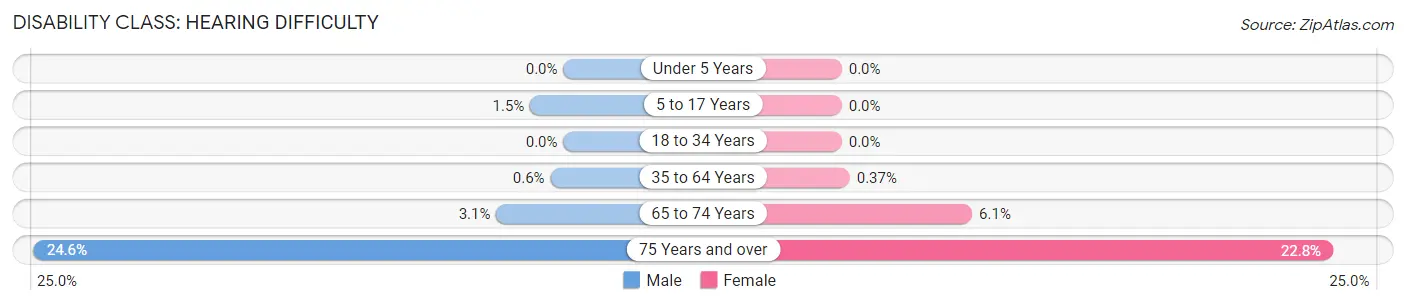
| Age Bracket | Male | Female |
| Under 5 Years | 0 (0.0%) | 0 (0.0%) |
| 5 to 17 Years | 11 (1.5%) | 0 (0.0%) |
| 18 to 34 Years | 0 (0.0%) | 0 (0.0%) |
| 35 to 64 Years | 11 (0.6%) | 6 (0.4%) |
| 65 to 74 Years | 18 (3.1%) | 32 (6.0%) |
| 75 Years and over | 100 (24.6%) | 139 (22.8%) |
Disability Class: Vision Difficulty
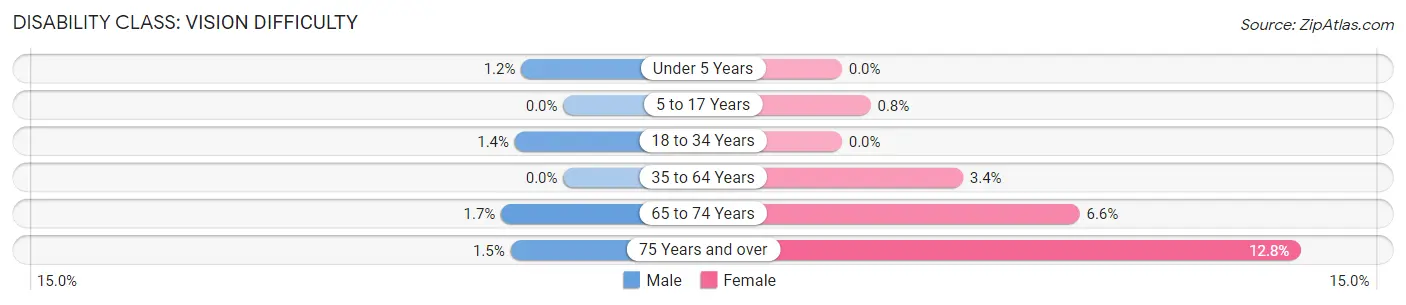
| Age Bracket | Male | Female |
| Under 5 Years | 7 (1.2%) | 0 (0.0%) |
| 5 to 17 Years | 0 (0.0%) | 5 (0.8%) |
| 18 to 34 Years | 9 (1.3%) | 0 (0.0%) |
| 35 to 64 Years | 0 (0.0%) | 54 (3.4%) |
| 65 to 74 Years | 10 (1.7%) | 35 (6.6%) |
| 75 Years and over | 6 (1.5%) | 78 (12.8%) |
Disability Class: Cognitive Difficulty
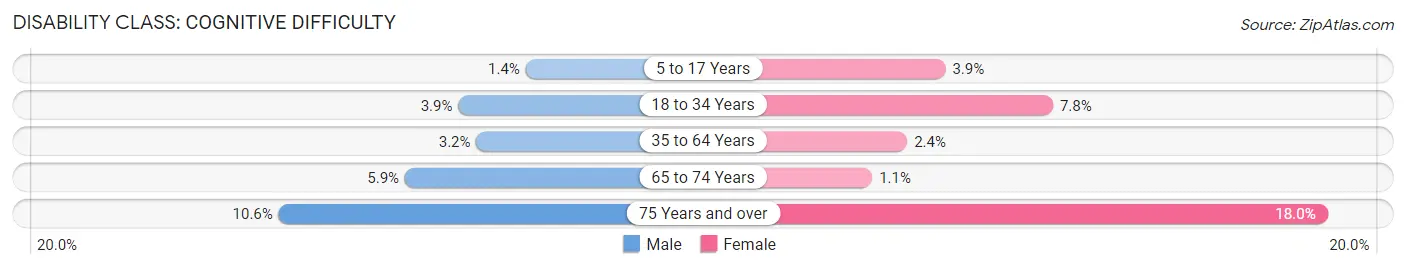
| Age Bracket | Male | Female |
| 5 to 17 Years | 10 (1.4%) | 24 (3.8%) |
| 18 to 34 Years | 26 (3.9%) | 61 (7.8%) |
| 35 to 64 Years | 59 (3.2%) | 39 (2.4%) |
| 65 to 74 Years | 34 (5.9%) | 6 (1.1%) |
| 75 Years and over | 43 (10.6%) | 110 (18.0%) |
Disability Class: Ambulatory Difficulty
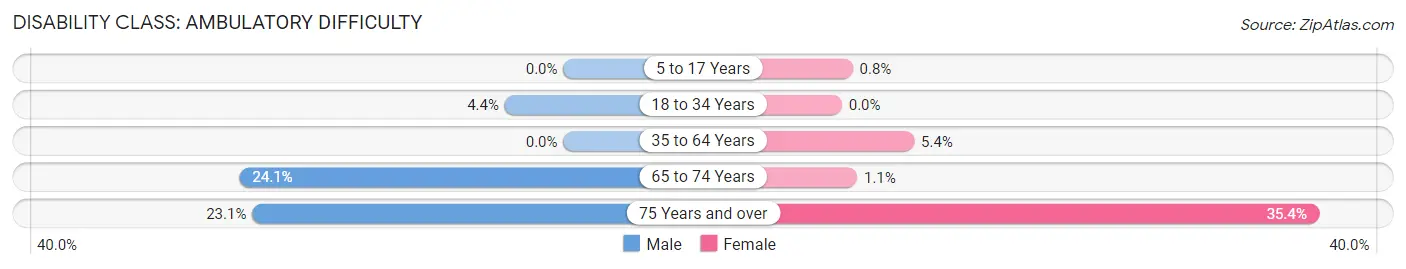
| Age Bracket | Male | Female |
| 5 to 17 Years | 0 (0.0%) | 5 (0.8%) |
| 18 to 34 Years | 29 (4.3%) | 0 (0.0%) |
| 35 to 64 Years | 0 (0.0%) | 86 (5.4%) |
| 65 to 74 Years | 139 (24.0%) | 6 (1.1%) |
| 75 Years and over | 94 (23.1%) | 216 (35.4%) |
Disability Class: Self-Care Difficulty
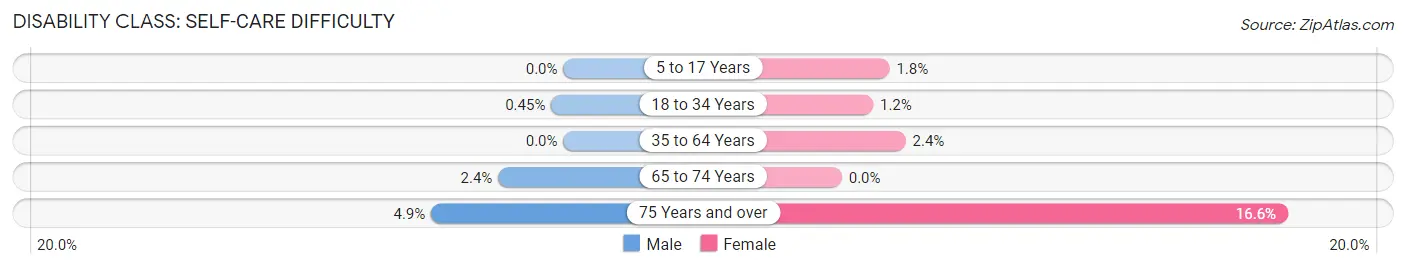
| Age Bracket | Male | Female |
| 5 to 17 Years | 0 (0.0%) | 11 (1.8%) |
| 18 to 34 Years | 3 (0.4%) | 9 (1.2%) |
| 35 to 64 Years | 0 (0.0%) | 38 (2.4%) |
| 65 to 74 Years | 14 (2.4%) | 0 (0.0%) |
| 75 Years and over | 20 (4.9%) | 101 (16.6%) |
Technology Access in St Anthony city Hennepin and Ramsey Counties
Computing Device Access in St Anthony city Hennepin and Ramsey Counties
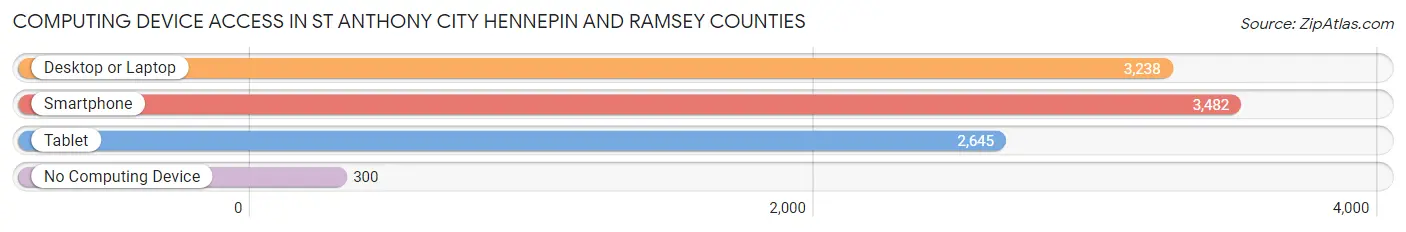
| Device Type | # Households | % Households |
| Desktop or Laptop | 3,238 | 80.5% |
| Smartphone | 3,482 | 86.6% |
| Tablet | 2,645 | 65.8% |
| No Computing Device | 300 | 7.5% |
| Total | 4,022 | 100.0% |
Internet Access in St Anthony city Hennepin and Ramsey Counties
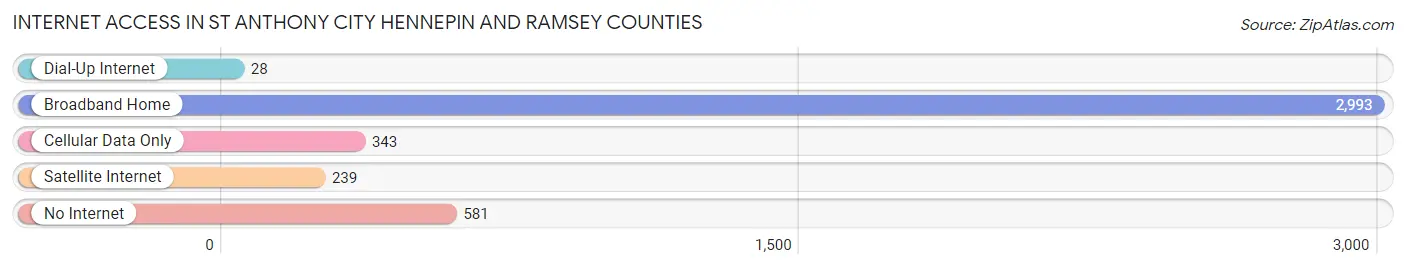
| Internet Type | # Households | % Households |
| Dial-Up Internet | 28 | 0.7% |
| Broadband Home | 2,993 | 74.4% |
| Cellular Data Only | 343 | 8.5% |
| Satellite Internet | 239 | 5.9% |
| No Internet | 581 | 14.4% |
| Total | 4,022 | 100.0% |
St Anthony city Hennepin and Ramsey Counties Summary
Introduction
St Anthony City is a small city located in the Twin Cities metropolitan area of Minnesota. It is located in both Hennepin and Ramsey Counties, and is part of the larger Minneapolis-St. Paul-Bloomington metropolitan statistical area. The city is home to a population of 8,226 people, according to the 2010 census. St Anthony City is a vibrant and diverse community, with a rich history and a bright future.
History
St Anthony City was founded in 1849 by a group of settlers from the nearby city of St. Paul. The city was named after the patron saint of St. Paul, St. Anthony of Padua. The city was originally a farming community, and the settlers built a small mill on the banks of the Mississippi River. The mill was used to grind grain and produce flour, and the city quickly grew into a thriving community.
In 1872, the city was incorporated as a village, and in 1887 it was incorporated as a city. The city continued to grow and prosper, and by the early 1900s it had become a popular destination for tourists and vacationers. The city was home to a number of resorts and hotels, and it was also home to a number of factories and businesses.
In the 1950s, the city began to experience a period of decline. Many of the factories and businesses closed, and the population began to decline. In the 1970s, the city began to experience a period of revitalization, and the population began to grow again. Today, St Anthony City is a vibrant and diverse community, with a strong economy and a bright future.
Geography
St Anthony City is located in both Hennepin and Ramsey Counties, in the Twin Cities metropolitan area of Minnesota. The city is situated on the banks of the Mississippi River, and is bordered by the cities of Minneapolis and St. Paul. The city covers an area of 4.2 square miles, and has a population density of 1,945 people per square mile.
The city is home to a number of parks and green spaces, including the St. Anthony Falls Heritage Trail, which is a popular destination for hikers and cyclists. The city is also home to a number of historic sites, including the St. Anthony Falls Historic District, which is listed on the National Register of Historic Places.
Economy
St Anthony City has a strong and diverse economy. The city is home to a number of businesses and industries, including manufacturing, retail, healthcare, and education. The city is also home to a number of corporate headquarters, including the headquarters of Target Corporation and the headquarters of the Minnesota Timberwolves.
The city is also home to a number of educational institutions, including the University of Minnesota, St. Thomas University, and the University of St. Thomas. The city is also home to a number of healthcare facilities, including the St. Anthony Medical Center and the St. Paul Children’s Hospital.
Demographics
According to the 2010 census, St Anthony City has a population of 8,226 people. The population is made up of a diverse mix of ethnicities, including White (76.2%), African American (10.2%), Asian (4.7%), and Hispanic or Latino (7.9%). The median household income in the city is $50,945, and the median home value is $179,400.
Conclusion
St Anthony City is a vibrant and diverse community located in the Twin Cities metropolitan area of Minnesota. The city has a rich history and a bright future, and is home to a strong and diverse economy. The city is also home to a diverse population, with a mix of ethnicities and backgrounds. St Anthony City is a great place to live, work, and play, and is sure to continue to grow and prosper in the years to come.
Common Questions
What is Per Capita Income in St Anthony city Hennepin and Ramsey Counties?
Per Capita income in St Anthony city Hennepin and Ramsey Counties is $56,563.
What is the Median Family Income in St Anthony city Hennepin and Ramsey Counties?
Median Family Income in St Anthony city Hennepin and Ramsey Counties is $120,227.
What is the Median Household income in St Anthony city Hennepin and Ramsey Counties?
Median Household Income in St Anthony city Hennepin and Ramsey Counties is $91,955.
What is Income or Wage Gap in St Anthony city Hennepin and Ramsey Counties?
Income or Wage Gap in St Anthony city Hennepin and Ramsey Counties is 25.2%.
Women in St Anthony city Hennepin and Ramsey Counties earn 74.8 cents for every dollar earned by a man.
What is Inequality or Gini Index in St Anthony city Hennepin and Ramsey Counties?
Inequality or Gini Index in St Anthony city Hennepin and Ramsey Counties is 0.48.
What is the Total Population of St Anthony city Hennepin and Ramsey Counties?
Total Population of St Anthony city Hennepin and Ramsey Counties is 9,332.
What is the Total Male Population of St Anthony city Hennepin and Ramsey Counties?
Total Male Population of St Anthony city Hennepin and Ramsey Counties is 4,881.
What is the Total Female Population of St Anthony city Hennepin and Ramsey Counties?
Total Female Population of St Anthony city Hennepin and Ramsey Counties is 4,451.
What is the Ratio of Males per 100 Females in St Anthony city Hennepin and Ramsey Counties?
There are 109.66 Males per 100 Females in St Anthony city Hennepin and Ramsey Counties.
What is the Ratio of Females per 100 Males in St Anthony city Hennepin and Ramsey Counties?
There are 91.19 Females per 100 Males in St Anthony city Hennepin and Ramsey Counties.
What is the Median Population Age in St Anthony city Hennepin and Ramsey Counties?
Median Population Age in St Anthony city Hennepin and Ramsey Counties is 41.0 Years.
What is the Average Family Size in St Anthony city Hennepin and Ramsey Counties
Average Family Size in St Anthony city Hennepin and Ramsey Counties is 3.1 People.
What is the Average Household Size in St Anthony city Hennepin and Ramsey Counties
Average Household Size in St Anthony city Hennepin and Ramsey Counties is 2.3 People.
How Large is the Labor Force in St Anthony city Hennepin and Ramsey Counties?
There are 4,675 People in the Labor Forcein in St Anthony city Hennepin and Ramsey Counties.
What is the Percentage of People in the Labor Force in St Anthony city Hennepin and Ramsey Counties?
64.1% of People are in the Labor Force in St Anthony city Hennepin and Ramsey Counties.
What is the Unemployment Rate in St Anthony city Hennepin and Ramsey Counties?
Unemployment Rate in St Anthony city Hennepin and Ramsey Counties is 1.8%.