Knightdale, NC Map & Demographics
Knightdale Map
Knightdale Overview
$37,980
PER CAPITA INCOME
$97,183
AVG FAMILY INCOME
$79,364
AVG HOUSEHOLD INCOME
26.8%
WAGE / INCOME GAP [ % ]
73.2¢/ $1
WAGE / INCOME GAP [ $ ]
$11,437
FAMILY INCOME DEFICIT
0.38
INEQUALITY / GINI INDEX
19,127
TOTAL POPULATION
9,240
MALE POPULATION
9,887
FEMALE POPULATION
93.46
MALES / 100 FEMALES
107.00
FEMALES / 100 MALES
35.5
MEDIAN AGE
3.1
AVG FAMILY SIZE
2.6
AVG HOUSEHOLD SIZE
11,278
LABOR FORCE [ PEOPLE ]
77.0%
PERCENT IN LABOR FORCE
5.9%
UNEMPLOYMENT RATE
Knightdale Zip Codes
Knightdale Area Codes
Income in Knightdale
Income Overview in Knightdale
Per Capita Income in Knightdale is $37,980, while median incomes of families and households are $97,183 and $79,364 respectively.
| Characteristic | Number | Measure |
| Per Capita Income | 19,127 | $37,980 |
| Median Family Income | 5,208 | $97,183 |
| Mean Family Income | 5,208 | $103,670 |
| Median Household Income | 7,436 | $79,364 |
| Mean Household Income | 7,436 | $95,297 |
| Income Deficit | 5,208 | $11,437 |
| Wage / Income Gap (%) | 19,127 | 26.81% |
| Wage / Income Gap ($) | 19,127 | 73.19¢ per $1 |
| Gini / Inequality Index | 19,127 | 0.38 |
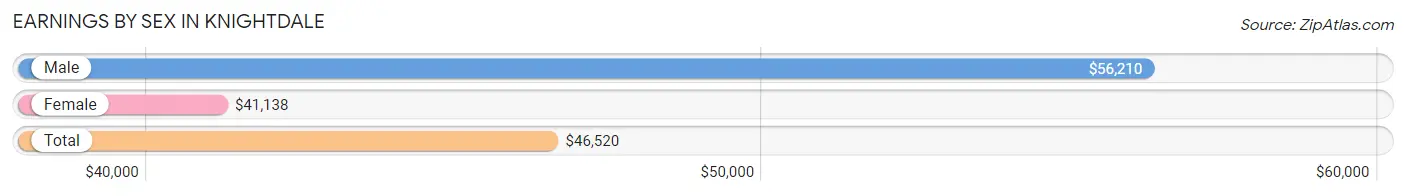
Earnings by Sex in Knightdale
Average Earnings in Knightdale are $46,520, $56,210 for men and $41,138 for women, a difference of 26.8%.
| Sex | Number | Average Earnings |
| Male | 5,342 (46.2%) | $56,210 |
| Female | 6,219 (53.8%) | $41,138 |
| Total | 11,561 (100.0%) | $46,520 |
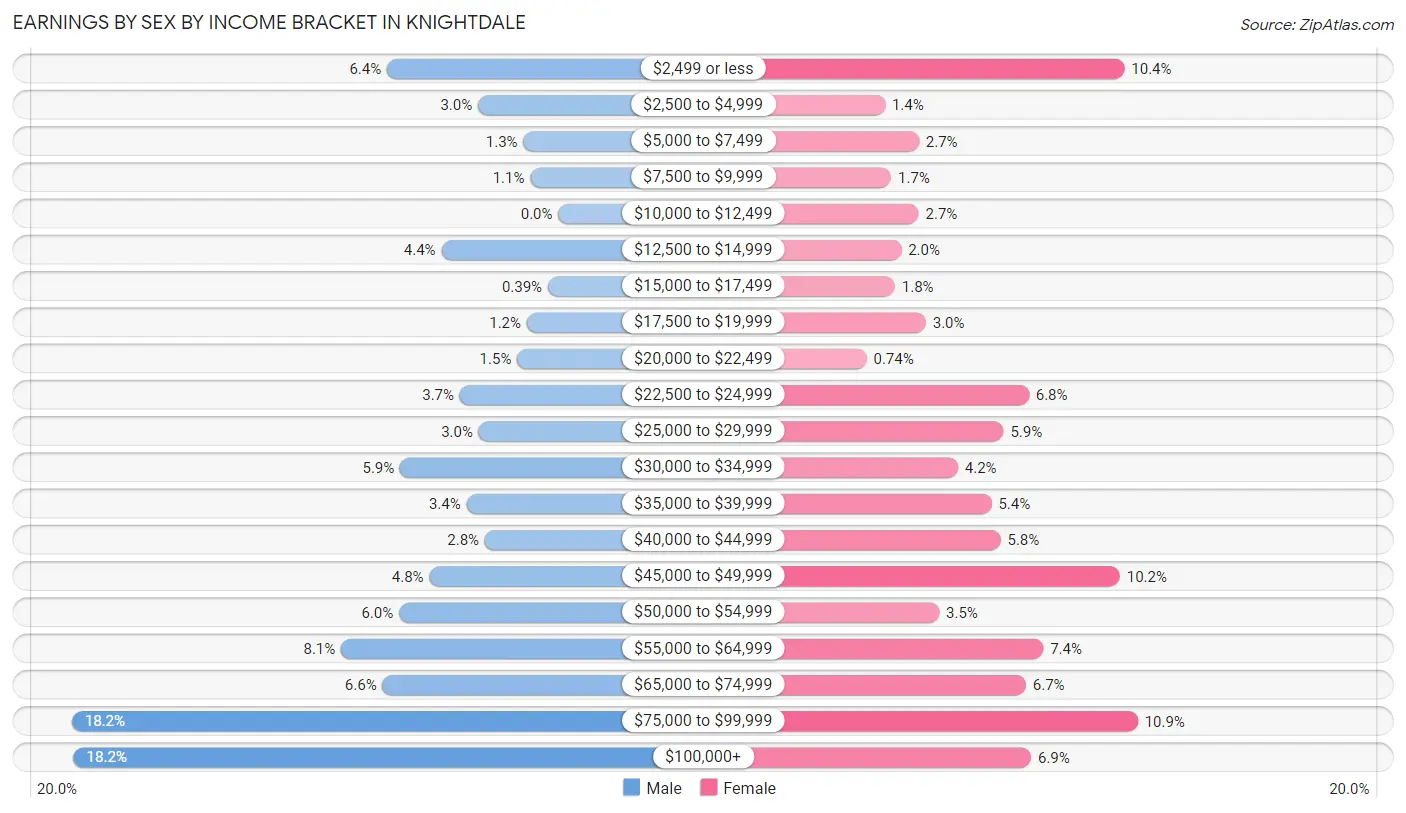
Earnings by Sex by Income Bracket in Knightdale
The most common earnings brackets in Knightdale are $75,000 to $99,999 for men (974 | 18.2%) and $75,000 to $99,999 for women (678 | 10.9%).
| Income | Male | Female |
| $2,499 or less | 343 (6.4%) | 647 (10.4%) |
| $2,500 to $4,999 | 161 (3.0%) | 89 (1.4%) |
| $5,000 to $7,499 | 70 (1.3%) | 168 (2.7%) |
| $7,500 to $9,999 | 56 (1.1%) | 103 (1.7%) |
| $10,000 to $12,499 | 0 (0.0%) | 167 (2.7%) |
| $12,500 to $14,999 | 234 (4.4%) | 127 (2.0%) |
| $15,000 to $17,499 | 21 (0.4%) | 112 (1.8%) |
| $17,500 to $19,999 | 63 (1.2%) | 184 (3.0%) |
| $20,000 to $22,499 | 82 (1.5%) | 46 (0.7%) |
| $22,500 to $24,999 | 197 (3.7%) | 424 (6.8%) |
| $25,000 to $29,999 | 159 (3.0%) | 365 (5.9%) |
| $30,000 to $34,999 | 317 (5.9%) | 259 (4.2%) |
| $35,000 to $39,999 | 184 (3.4%) | 337 (5.4%) |
| $40,000 to $44,999 | 147 (2.8%) | 358 (5.8%) |
| $45,000 to $49,999 | 258 (4.8%) | 636 (10.2%) |
| $50,000 to $54,999 | 319 (6.0%) | 215 (3.5%) |
| $55,000 to $64,999 | 435 (8.1%) | 458 (7.4%) |
| $65,000 to $74,999 | 352 (6.6%) | 417 (6.7%) |
| $75,000 to $99,999 | 974 (18.2%) | 678 (10.9%) |
| $100,000+ | 970 (18.2%) | 429 (6.9%) |
| Total | 5,342 (100.0%) | 6,219 (100.0%) |
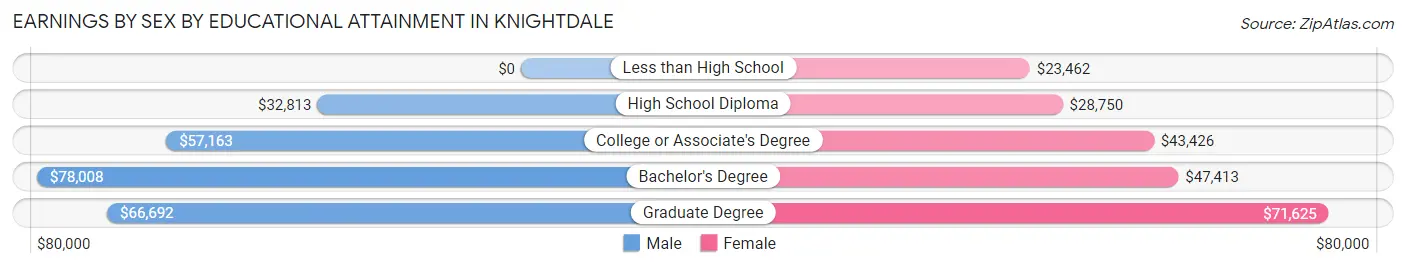
Earnings by Sex by Educational Attainment in Knightdale
Average earnings in Knightdale are $61,716 for men and $45,345 for women, a difference of 26.5%. Men with an educational attainment of bachelor's degree enjoy the highest average annual earnings of $78,008, while those with high school diploma education earn the least with $32,813. Women with an educational attainment of graduate degree earn the most with the average annual earnings of $71,625, while those with less than high school education have the smallest earnings of $23,462.
| Educational Attainment | Male Income | Female Income |
| Less than High School | - | - |
| High School Diploma | $32,813 | $28,750 |
| College or Associate's Degree | $57,163 | $43,426 |
| Bachelor's Degree | $78,008 | $47,413 |
| Graduate Degree | $66,692 | $71,625 |
| Total | $61,716 | $45,345 |
Family Income in Knightdale
Family Income Brackets in Knightdale
According to the Knightdale family income data, there are 1,370 families falling into the $100,000 to $149,999 income range, which is the most common income bracket and makes up 26.3% of all families. Conversely, the $10,000 to $14,999 income bracket is the least frequent group with only 31 families (0.6%) belonging to this category.

| Income Bracket | # Families | % Families |
| Less than $10,000 | 203 | 3.9% |
| $10,000 to $14,999 | 31 | 0.6% |
| $15,000 to $24,999 | 115 | 2.2% |
| $25,000 to $34,999 | 432 | 8.3% |
| $35,000 to $49,999 | 505 | 9.7% |
| $50,000 to $74,999 | 1,010 | 19.4% |
| $75,000 to $99,999 | 385 | 7.4% |
| $100,000 to $149,999 | 1,370 | 26.3% |
| $150,000 to $199,999 | 833 | 16.0% |
| $200,000+ | 318 | 6.1% |
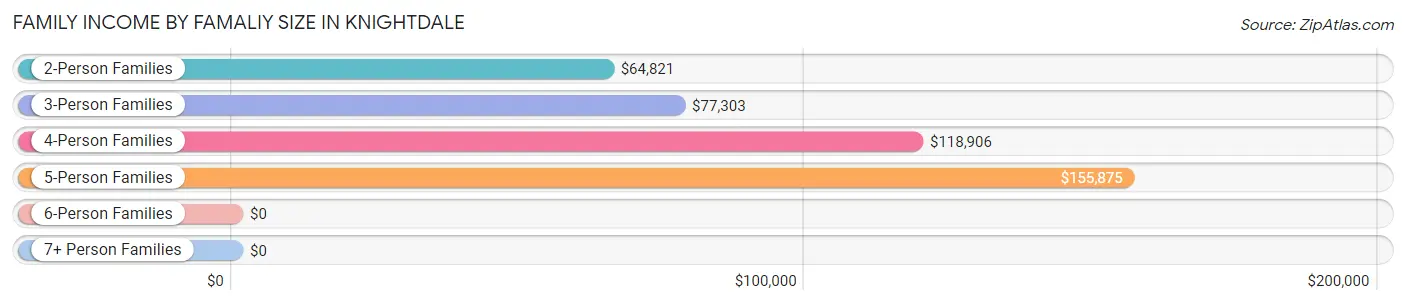
Family Income by Famaliy Size in Knightdale
5-person families (417 | 8.0%) account for the highest median family income in Knightdale with $155,875 per family, while 2-person families (2,118 | 40.7%) have the highest median income of $32,410 per family member.
| Income Bracket | # Families | Median Income |
| 2-Person Families | 2,118 (40.7%) | $64,821 |
| 3-Person Families | 1,684 (32.3%) | $77,303 |
| 4-Person Families | 952 (18.3%) | $118,906 |
| 5-Person Families | 417 (8.0%) | $155,875 |
| 6-Person Families | 11 (0.2%) | $0 |
| 7+ Person Families | 26 (0.5%) | $0 |
| Total | 5,208 (100.0%) | $97,183 |
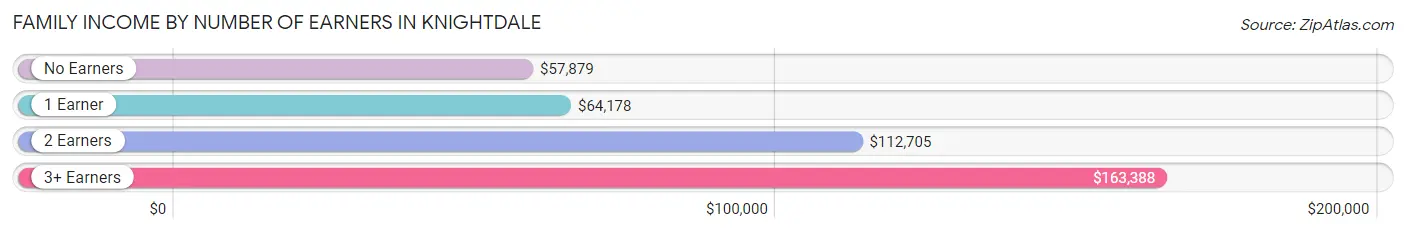
Family Income by Number of Earners in Knightdale
The median family income in Knightdale is $97,183, with families comprising 3+ earners (651) having the highest median family income of $163,388, while families with no earners (530) have the lowest median family income of $57,879, accounting for 12.5% and 10.2% of families, respectively.
| Number of Earners | # Families | Median Income |
| No Earners | 530 (10.2%) | $57,879 |
| 1 Earner | 1,506 (28.9%) | $64,178 |
| 2 Earners | 2,521 (48.4%) | $112,705 |
| 3+ Earners | 651 (12.5%) | $163,388 |
| Total | 5,208 (100.0%) | $97,183 |
Household Income in Knightdale
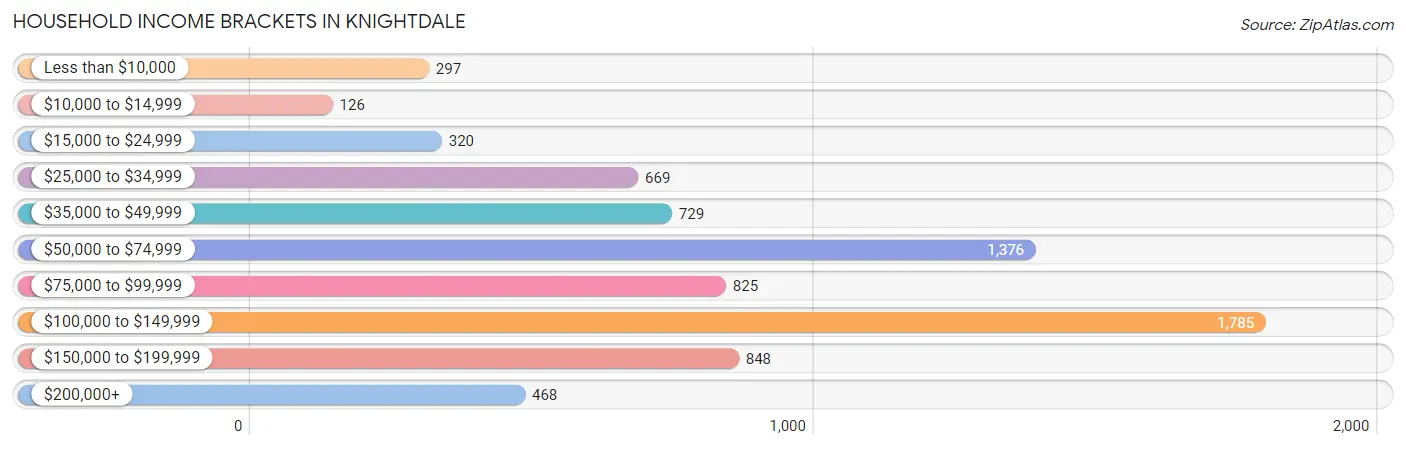
Household Income Brackets in Knightdale
With 1,785 households falling in the category, the $100,000 to $149,999 income range is the most frequent in Knightdale, accounting for 24.0% of all households. In contrast, only 126 households (1.7%) fall into the $10,000 to $14,999 income bracket, making it the least populous group.
| Income Bracket | # Households | % Households |
| Less than $10,000 | 297 | 4.0% |
| $10,000 to $14,999 | 126 | 1.7% |
| $15,000 to $24,999 | 320 | 4.3% |
| $25,000 to $34,999 | 669 | 9.0% |
| $35,000 to $49,999 | 729 | 9.8% |
| $50,000 to $74,999 | 1,376 | 18.5% |
| $75,000 to $99,999 | 825 | 11.1% |
| $100,000 to $149,999 | 1,785 | 24.0% |
| $150,000 to $199,999 | 848 | 11.4% |
| $200,000+ | 468 | 6.3% |
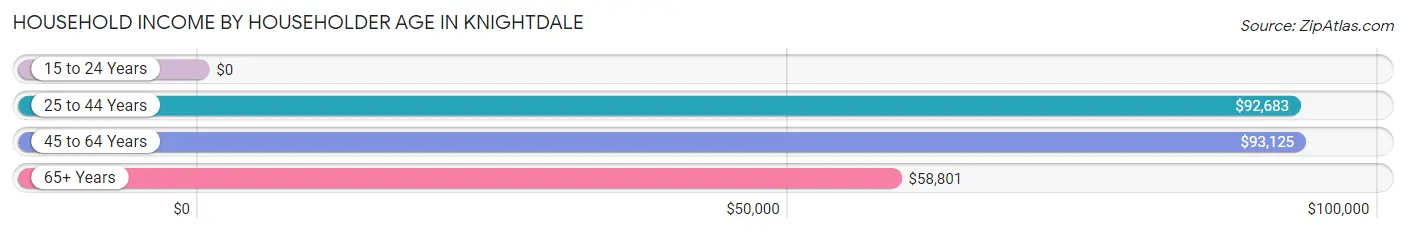
Household Income by Householder Age in Knightdale
The median household income in Knightdale is $79,364, with the highest median household income of $93,125 found in the 45 to 64 years age bracket for the primary householder. A total of 2,940 households (39.5%) fall into this category. Meanwhile, the 15 to 24 years age bracket for the primary householder has the lowest median household income of $0, with 177 households (2.4%) in this group.
| Income Bracket | # Households | Median Income |
| 15 to 24 Years | 177 (2.4%) | $0 |
| 25 to 44 Years | 3,374 (45.4%) | $92,683 |
| 45 to 64 Years | 2,940 (39.5%) | $93,125 |
| 65+ Years | 945 (12.7%) | $58,801 |
| Total | 7,436 (100.0%) | $79,364 |
Poverty in Knightdale
Income Below Poverty by Sex and Age in Knightdale
With 5.6% poverty level for males and 8.1% for females among the residents of Knightdale, 15 year old males and 12 to 14 year old females are the most vulnerable to poverty, with 35 males (23.3%) and 82 females (18.1%) in their respective age groups living below the poverty level.
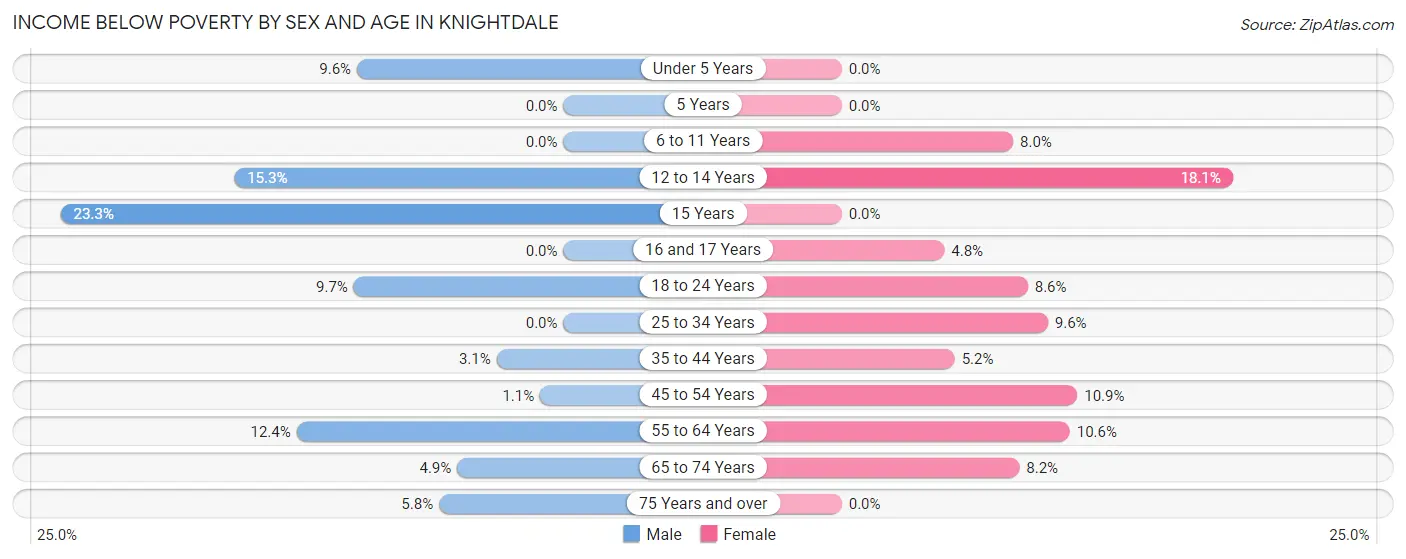
| Age Bracket | Male | Female |
| Under 5 Years | 87 (9.6%) | 0 (0.0%) |
| 5 Years | 0 (0.0%) | 0 (0.0%) |
| 6 to 11 Years | 0 (0.0%) | 53 (8.0%) |
| 12 to 14 Years | 95 (15.3%) | 82 (18.1%) |
| 15 Years | 35 (23.3%) | 0 (0.0%) |
| 16 and 17 Years | 0 (0.0%) | 15 (4.8%) |
| 18 to 24 Years | 51 (9.7%) | 61 (8.6%) |
| 25 to 34 Years | 0 (0.0%) | 167 (9.6%) |
| 35 to 44 Years | 47 (3.1%) | 84 (5.2%) |
| 45 to 54 Years | 10 (1.1%) | 152 (10.9%) |
| 55 to 64 Years | 143 (12.4%) | 125 (10.6%) |
| 65 to 74 Years | 22 (4.9%) | 57 (8.2%) |
| 75 Years and over | 22 (5.8%) | 0 (0.0%) |
| Total | 512 (5.6%) | 796 (8.1%) |
Income Above Poverty by Sex and Age in Knightdale
According to the poverty statistics in Knightdale, males aged 5 years and females aged under 5 years are the age groups that are most secure financially, with 100.0% of males and 100.0% of females in these age groups living above the poverty line.
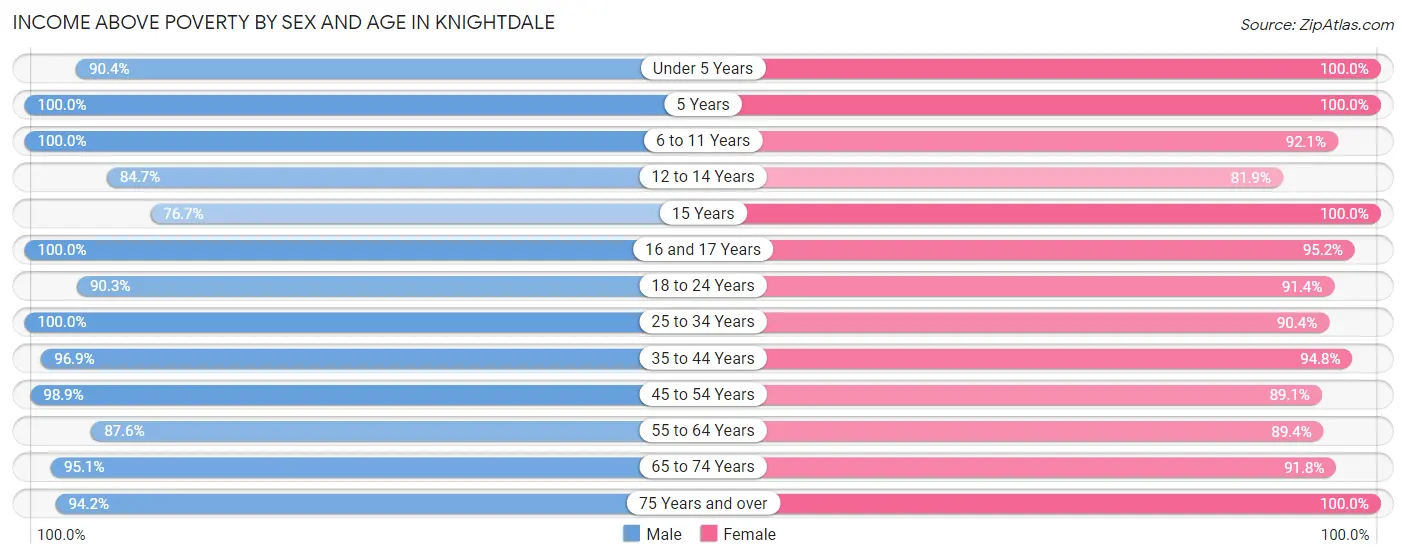
| Age Bracket | Male | Female |
| Under 5 Years | 821 (90.4%) | 539 (100.0%) |
| 5 Years | 55 (100.0%) | 150 (100.0%) |
| 6 to 11 Years | 866 (100.0%) | 614 (92.0%) |
| 12 to 14 Years | 527 (84.7%) | 370 (81.9%) |
| 15 Years | 115 (76.7%) | 57 (100.0%) |
| 16 and 17 Years | 254 (100.0%) | 300 (95.2%) |
| 18 to 24 Years | 473 (90.3%) | 646 (91.4%) |
| 25 to 34 Years | 1,396 (100.0%) | 1,580 (90.4%) |
| 35 to 44 Years | 1,470 (96.9%) | 1,519 (94.8%) |
| 45 to 54 Years | 919 (98.9%) | 1,239 (89.1%) |
| 55 to 64 Years | 1,012 (87.6%) | 1,057 (89.4%) |
| 65 to 74 Years | 424 (95.1%) | 635 (91.8%) |
| 75 Years and over | 359 (94.2%) | 322 (100.0%) |
| Total | 8,691 (94.4%) | 9,028 (91.9%) |
Income Below Poverty Among Married-Couple Families in Knightdale
The poverty statistics for married-couple families in Knightdale show that 5.0% or 181 of the total 3,614 families live below the poverty line. Families with no children have the highest poverty rate of 8.9%, comprising of 153 families. On the other hand, families with 1 or 2 children have the lowest poverty rate of 0.5%, which includes 8 families.
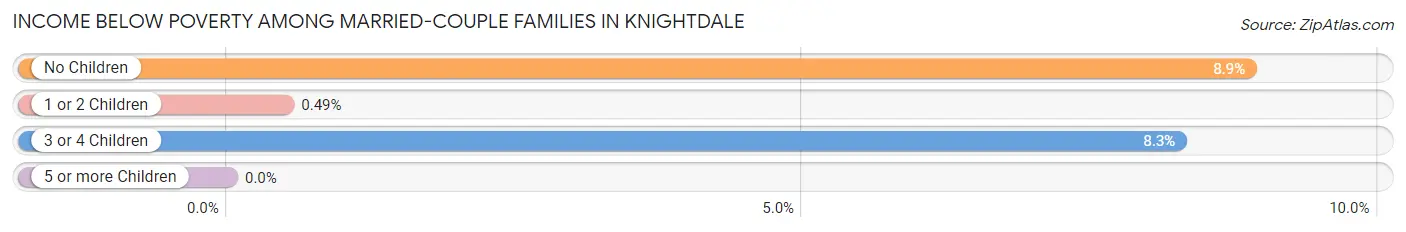
| Children | Above Poverty | Below Poverty |
| No Children | 1,571 (91.1%) | 153 (8.9%) |
| 1 or 2 Children | 1,640 (99.5%) | 8 (0.5%) |
| 3 or 4 Children | 222 (91.7%) | 20 (8.3%) |
| 5 or more Children | 0 (0.0%) | 0 (0.0%) |
| Total | 3,433 (95.0%) | 181 (5.0%) |
Income Below Poverty Among Single-Parent Households in Knightdale
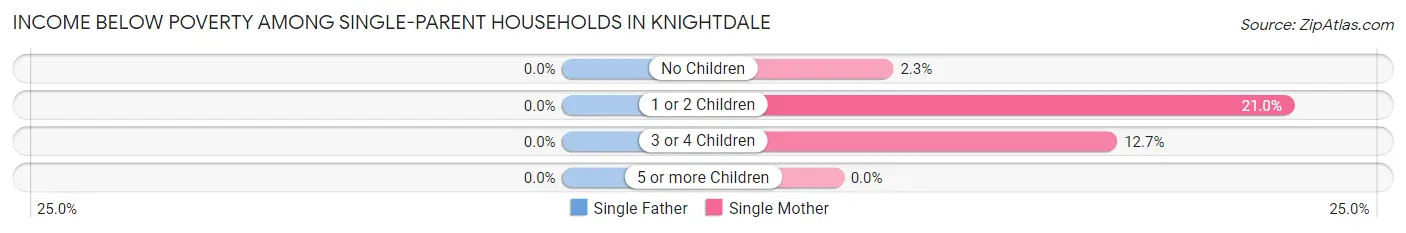
| Children | Single Father | Single Mother |
| No Children | 0 (0.0%) | 11 (2.3%) |
| 1 or 2 Children | 0 (0.0%) | 135 (21.0%) |
| 3 or 4 Children | 0 (0.0%) | 20 (12.7%) |
| 5 or more Children | 0 (0.0%) | 0 (0.0%) |
| Total | 0 (0.0%) | 166 (13.0%) |
Income Below Poverty Among Married-Couple vs Single-Parent Households in Knightdale
The poverty data for Knightdale shows that 181 of the married-couple family households (5.0%) and 166 of the single-parent households (10.4%) are living below the poverty level. Within the married-couple family households, those with no children have the highest poverty rate, with 153 households (8.9%) falling below the poverty line. Among the single-parent households, those with 1 or 2 children have the highest poverty rate, with 135 household (18.5%) living below poverty.
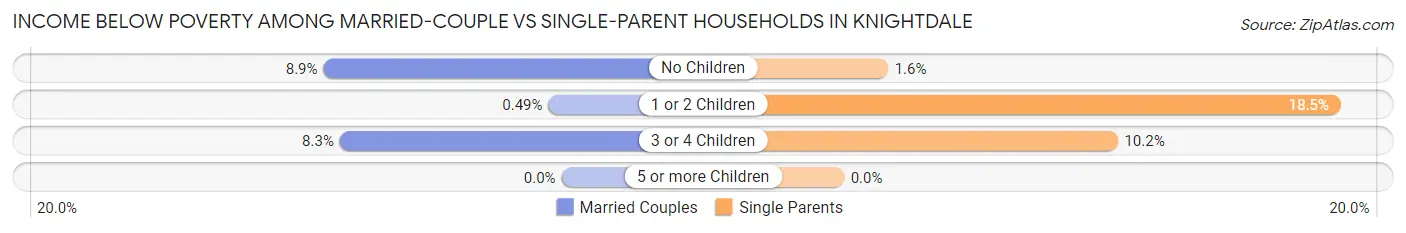
| Children | Married-Couple Families | Single-Parent Households |
| No Children | 153 (8.9%) | 11 (1.6%) |
| 1 or 2 Children | 8 (0.5%) | 135 (18.5%) |
| 3 or 4 Children | 20 (8.3%) | 20 (10.2%) |
| 5 or more Children | 0 (0.0%) | 0 (0.0%) |
| Total | 181 (5.0%) | 166 (10.4%) |
Race in Knightdale
The most populous races in Knightdale are Black / African American (9,030 | 47.2%), White / Caucasian (7,178 | 37.5%), and Hispanic or Latino (1,653 | 8.6%).
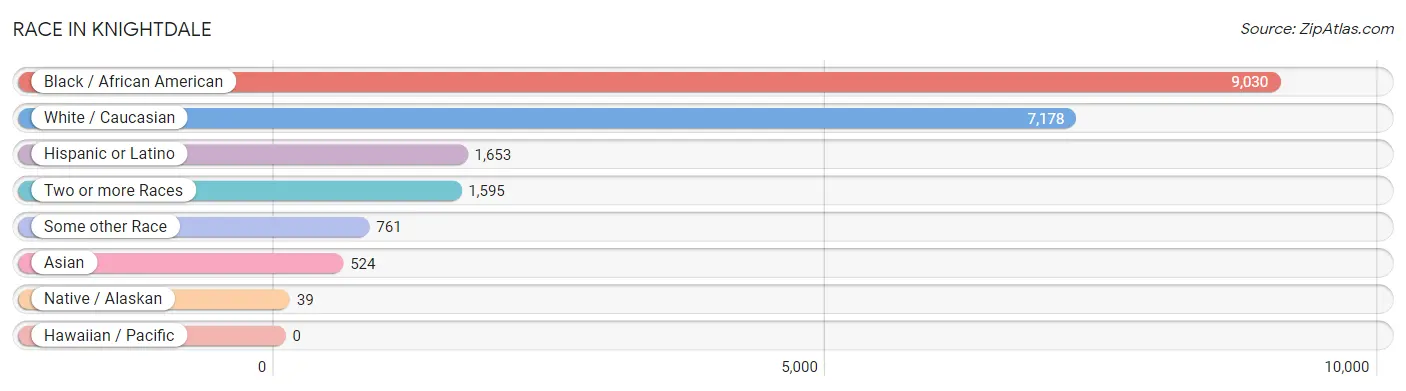
| Race | # Population | % Population |
| Asian | 524 | 2.7% |
| Black / African American | 9,030 | 47.2% |
| Hawaiian / Pacific | 0 | 0.0% |
| Hispanic or Latino | 1,653 | 8.6% |
| Native / Alaskan | 39 | 0.2% |
| White / Caucasian | 7,178 | 37.5% |
| Two or more Races | 1,595 | 8.3% |
| Some other Race | 761 | 4.0% |
| Total | 19,127 | 100.0% |
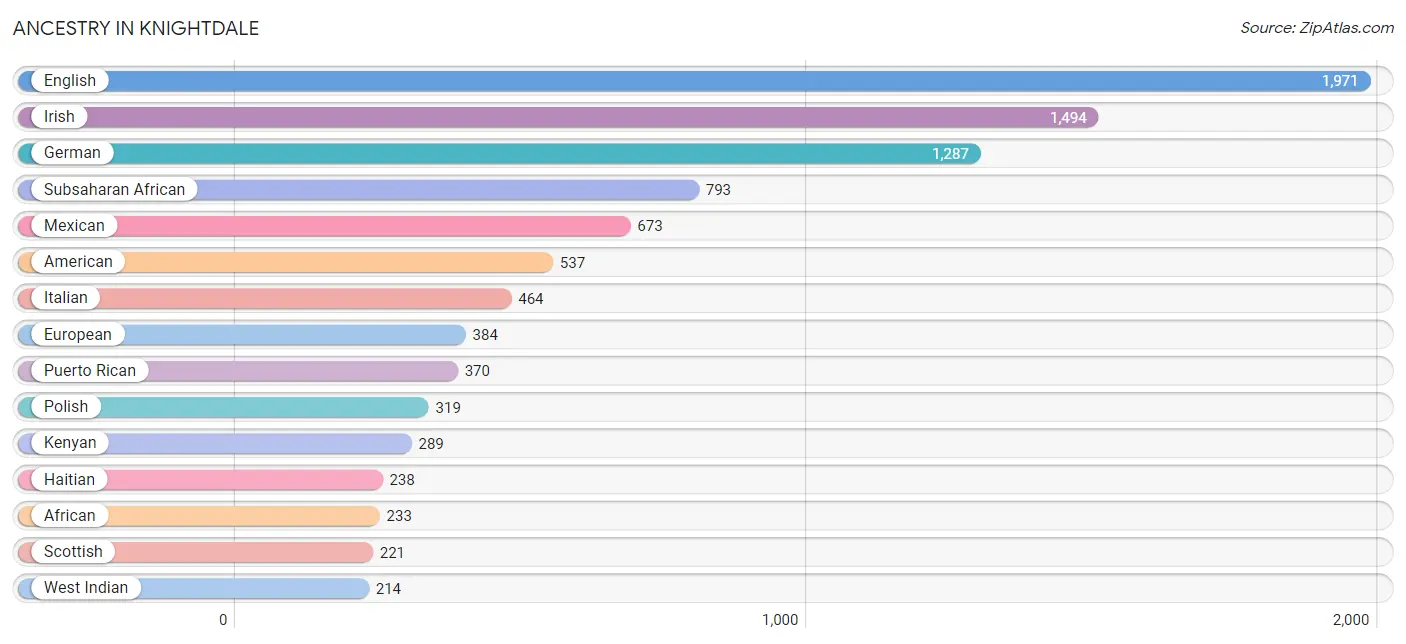
Ancestry in Knightdale
The most populous ancestries reported in Knightdale are English (1,971 | 10.3%), Irish (1,494 | 7.8%), German (1,287 | 6.7%), Subsaharan African (793 | 4.2%), and Mexican (673 | 3.5%), together accounting for 32.5% of all Knightdale residents.
| Ancestry | # Population | % Population |
| African | 233 | 1.2% |
| American | 537 | 2.8% |
| Arab | 13 | 0.1% |
| Bahamian | 13 | 0.1% |
| Blackfeet | 35 | 0.2% |
| British | 30 | 0.2% |
| Burmese | 31 | 0.2% |
| Cajun | 22 | 0.1% |
| Central American | 195 | 1.0% |
| Cherokee | 33 | 0.2% |
| Colombian | 17 | 0.1% |
| Costa Rican | 20 | 0.1% |
| Cuban | 23 | 0.1% |
| Czech | 68 | 0.4% |
| Danish | 10 | 0.1% |
| Dominican | 74 | 0.4% |
| Dutch | 15 | 0.1% |
| English | 1,971 | 10.3% |
| European | 384 | 2.0% |
| French | 140 | 0.7% |
| French Canadian | 207 | 1.1% |
| German | 1,287 | 6.7% |
| Greek | 16 | 0.1% |
| Haitian | 238 | 1.2% |
| Honduran | 103 | 0.5% |
| Hungarian | 202 | 1.1% |
| Indian (Asian) | 130 | 0.7% |
| Indonesian | 39 | 0.2% |
| Irish | 1,494 | 7.8% |
| Italian | 464 | 2.4% |
| Jamaican | 46 | 0.2% |
| Kenyan | 289 | 1.5% |
| Korean | 198 | 1.0% |
| Lebanese | 13 | 0.1% |
| Lithuanian | 16 | 0.1% |
| Mexican | 673 | 3.5% |
| Nigerian | 53 | 0.3% |
| Norwegian | 21 | 0.1% |
| Pakistani | 80 | 0.4% |
| Peruvian | 148 | 0.8% |
| Polish | 319 | 1.7% |
| Portuguese | 25 | 0.1% |
| Puerto Rican | 370 | 1.9% |
| Russian | 24 | 0.1% |
| Salvadoran | 72 | 0.4% |
| Scandinavian | 57 | 0.3% |
| Scotch-Irish | 79 | 0.4% |
| Scottish | 221 | 1.2% |
| Slovak | 11 | 0.1% |
| South American | 171 | 0.9% |
| South American Indian | 39 | 0.2% |
| Sri Lankan | 78 | 0.4% |
| Subsaharan African | 793 | 4.2% |
| Swedish | 82 | 0.4% |
| Swiss | 14 | 0.1% |
| Thai | 18 | 0.1% |
| Venezuelan | 6 | 0.0% |
| Welsh | 67 | 0.4% |
| West Indian | 214 | 1.1% | View All 59 Rows |
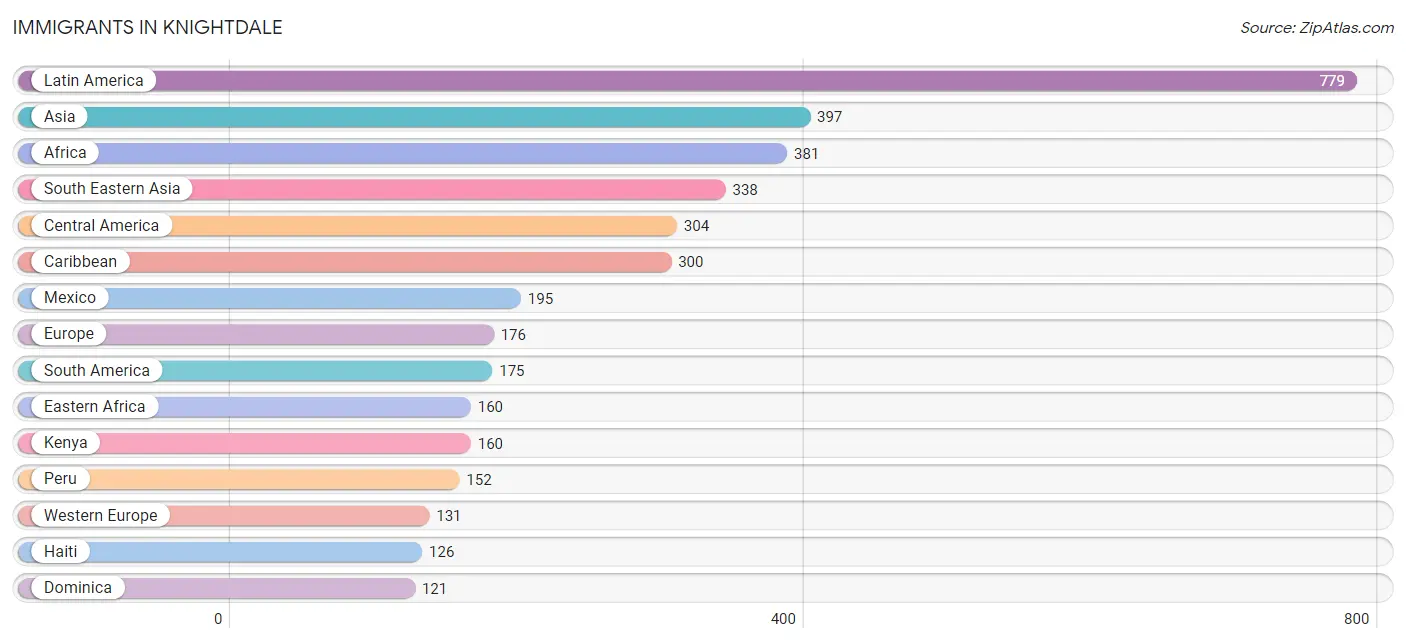
Immigrants in Knightdale
The most numerous immigrant groups reported in Knightdale came from Latin America (779 | 4.1%), Asia (397 | 2.1%), Africa (381 | 2.0%), South Eastern Asia (338 | 1.8%), and Central America (304 | 1.6%), together accounting for 11.5% of all Knightdale residents.
| Immigration Origin | # Population | % Population |
| Africa | 381 | 2.0% |
| Asia | 397 | 2.1% |
| Cameroon | 21 | 0.1% |
| Canada | 90 | 0.5% |
| Caribbean | 300 | 1.6% |
| Central America | 304 | 1.6% |
| China | 29 | 0.2% |
| Colombia | 17 | 0.1% |
| Congo | 93 | 0.5% |
| Costa Rica | 15 | 0.1% |
| Dominica | 121 | 0.6% |
| Eastern Africa | 160 | 0.8% |
| Eastern Asia | 59 | 0.3% |
| El Salvador | 39 | 0.2% |
| England | 16 | 0.1% |
| Europe | 176 | 0.9% |
| France | 31 | 0.2% |
| Germany | 100 | 0.5% |
| Haiti | 126 | 0.7% |
| Honduras | 55 | 0.3% |
| Italy | 23 | 0.1% |
| Kenya | 160 | 0.8% |
| Korea | 30 | 0.2% |
| Latin America | 779 | 4.1% |
| Malaysia | 23 | 0.1% |
| Mexico | 195 | 1.0% |
| Middle Africa | 114 | 0.6% |
| Northern Europe | 22 | 0.1% |
| Peru | 152 | 0.8% |
| Philippines | 35 | 0.2% |
| South Africa | 33 | 0.2% |
| South America | 175 | 0.9% |
| South Eastern Asia | 338 | 1.8% |
| Southern Europe | 23 | 0.1% |
| Taiwan | 7 | 0.0% |
| Thailand | 23 | 0.1% |
| Trinidad and Tobago | 53 | 0.3% |
| Venezuela | 6 | 0.0% |
| Vietnam | 54 | 0.3% |
| Western Africa | 53 | 0.3% |
| Western Europe | 131 | 0.7% | View All 41 Rows |
Sex and Age in Knightdale
Sex and Age in Knightdale
The most populous age groups in Knightdale are 35 to 39 Years (913 | 9.9%) for men and 30 to 34 Years (895 | 9.0%) for women.
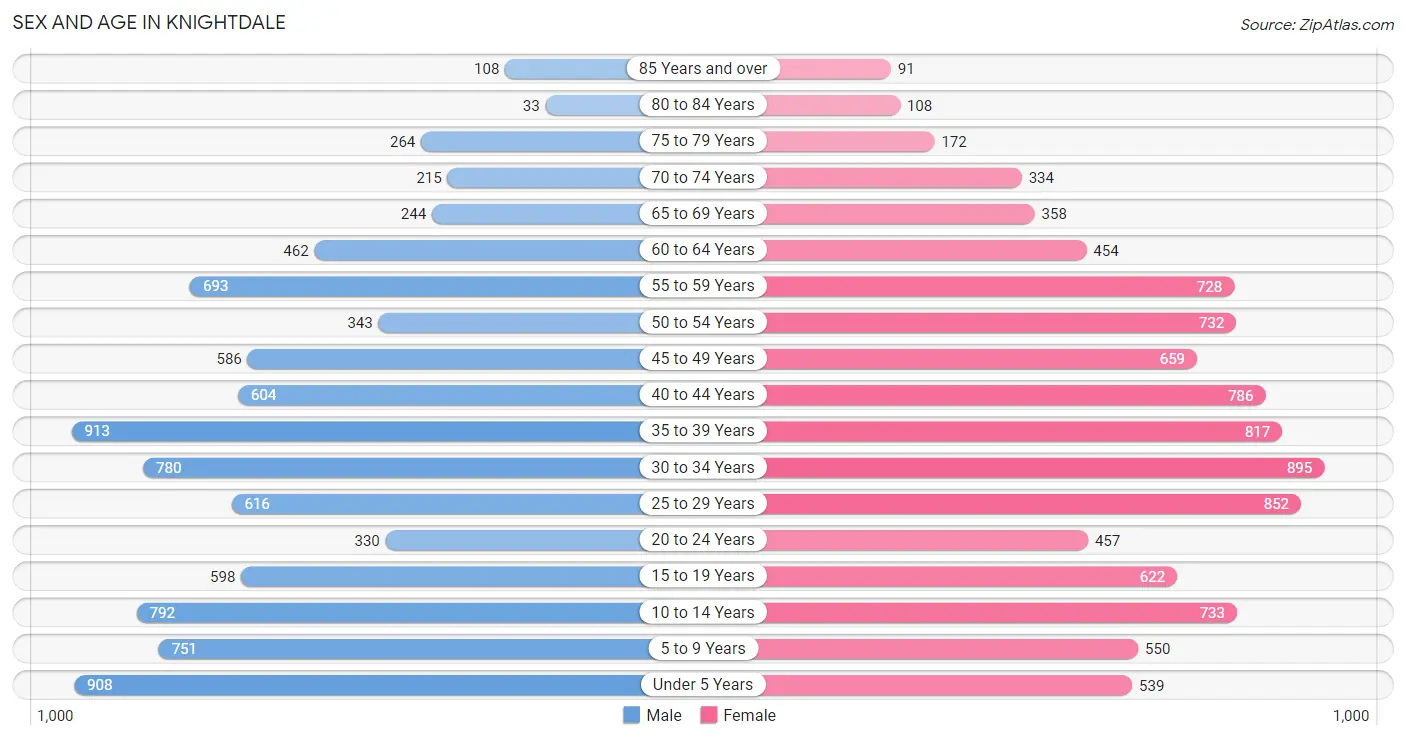
| Age Bracket | Male | Female |
| Under 5 Years | 908 (9.8%) | 539 (5.4%) |
| 5 to 9 Years | 751 (8.1%) | 550 (5.6%) |
| 10 to 14 Years | 792 (8.6%) | 733 (7.4%) |
| 15 to 19 Years | 598 (6.5%) | 622 (6.3%) |
| 20 to 24 Years | 330 (3.6%) | 457 (4.6%) |
| 25 to 29 Years | 616 (6.7%) | 852 (8.6%) |
| 30 to 34 Years | 780 (8.4%) | 895 (9.0%) |
| 35 to 39 Years | 913 (9.9%) | 817 (8.3%) |
| 40 to 44 Years | 604 (6.5%) | 786 (8.0%) |
| 45 to 49 Years | 586 (6.3%) | 659 (6.7%) |
| 50 to 54 Years | 343 (3.7%) | 732 (7.4%) |
| 55 to 59 Years | 693 (7.5%) | 728 (7.4%) |
| 60 to 64 Years | 462 (5.0%) | 454 (4.6%) |
| 65 to 69 Years | 244 (2.6%) | 358 (3.6%) |
| 70 to 74 Years | 215 (2.3%) | 334 (3.4%) |
| 75 to 79 Years | 264 (2.9%) | 172 (1.7%) |
| 80 to 84 Years | 33 (0.4%) | 108 (1.1%) |
| 85 Years and over | 108 (1.2%) | 91 (0.9%) |
| Total | 9,240 (100.0%) | 9,887 (100.0%) |
Families and Households in Knightdale
Median Family Size in Knightdale
The median family size in Knightdale is 3.13 persons per family, with married-couple families (3,614 | 69.4%) accounting for the largest median family size of 3.23 persons per family. On the other hand, single female/mother families (1,275 | 24.5%) represent the smallest median family size with 2.85 persons per family.
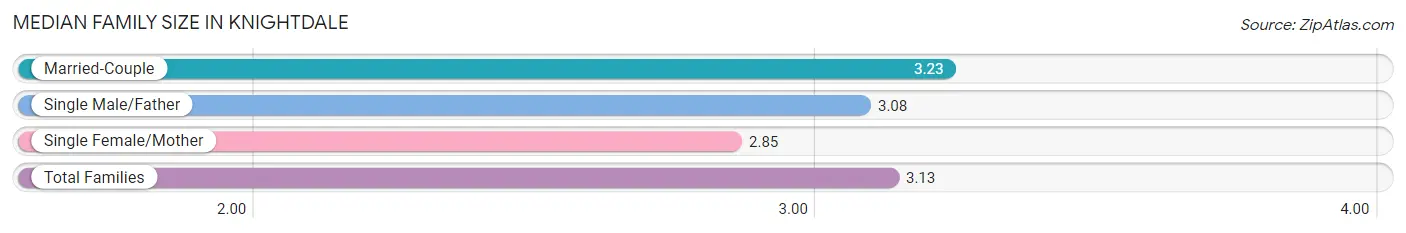
| Family Type | # Families | Family Size |
| Married-Couple | 3,614 (69.4%) | 3.23 |
| Single Male/Father | 319 (6.1%) | 3.08 |
| Single Female/Mother | 1,275 (24.5%) | 2.85 |
| Total Families | 5,208 (100.0%) | 3.13 |
Median Household Size in Knightdale
The median household size in Knightdale is 2.56 persons per household, with single male/father households (319 | 4.3%) accounting for the largest median household size of 3.31 persons per household. non-family households (2,228 | 30.0%) represent the smallest median household size with 1.12 persons per household.
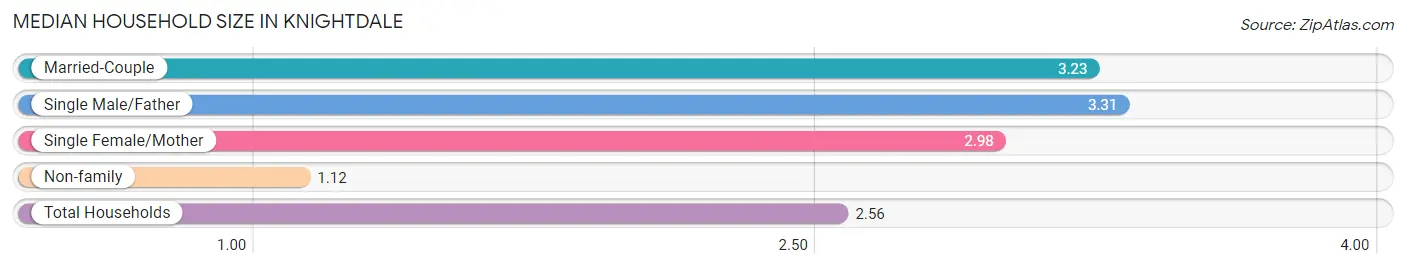
| Household Type | # Households | Household Size |
| Married-Couple | 3,614 (48.6%) | 3.23 |
| Single Male/Father | 319 (4.3%) | 3.31 |
| Single Female/Mother | 1,275 (17.2%) | 2.98 |
| Non-family | 2,228 (30.0%) | 1.12 |
| Total Households | 7,436 (100.0%) | 2.56 |
Household Size by Marriage Status in Knightdale
Out of a total of 7,436 households in Knightdale, 5,208 (70.0%) are family households, while 2,228 (30.0%) are nonfamily households. The most numerous type of family households are 2-person households, comprising 2,046, and the most common type of nonfamily households are 1-person households, comprising 1,976.
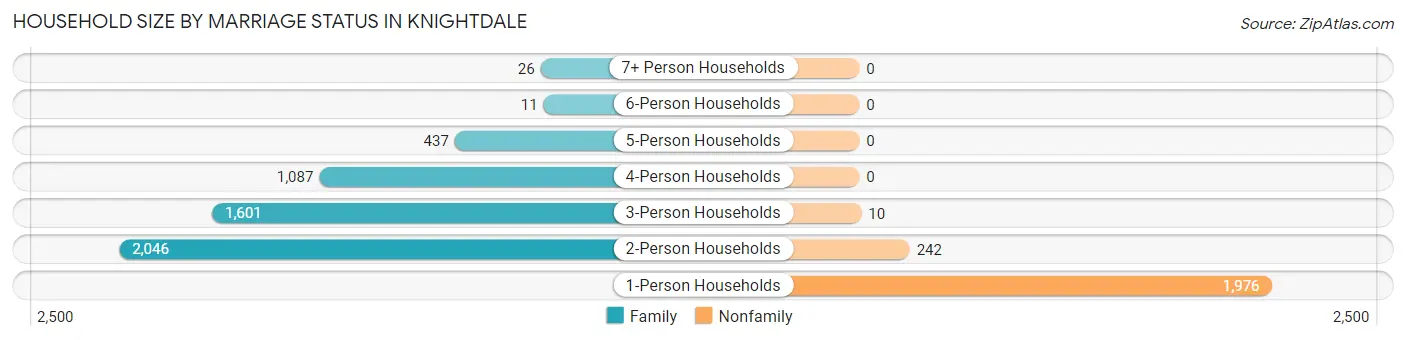
| Household Size | Family Households | Nonfamily Households |
| 1-Person Households | - | 1,976 (26.6%) |
| 2-Person Households | 2,046 (27.5%) | 242 (3.3%) |
| 3-Person Households | 1,601 (21.5%) | 10 (0.1%) |
| 4-Person Households | 1,087 (14.6%) | 0 (0.0%) |
| 5-Person Households | 437 (5.9%) | 0 (0.0%) |
| 6-Person Households | 11 (0.2%) | 0 (0.0%) |
| 7+ Person Households | 26 (0.4%) | 0 (0.0%) |
| Total | 5,208 (70.0%) | 2,228 (30.0%) |
Female Fertility in Knightdale
Fertility by Age in Knightdale
Average fertility rate in Knightdale is 49.0 births per 1,000 women. Women in the age bracket of 20 to 34 years have the highest fertility rate with 92.0 births per 1,000 women. Women in the age bracket of 20 to 34 years acount for 78.7% of all women with births.
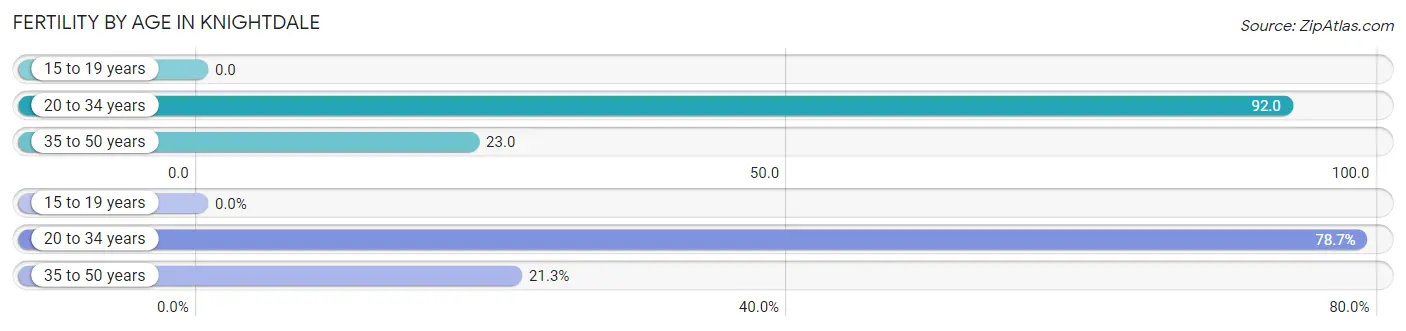
| Age Bracket | Women with Births | Births / 1,000 Women |
| 15 to 19 years | 0 (0.0%) | 0.0 |
| 20 to 34 years | 203 (78.7%) | 92.0 |
| 35 to 50 years | 55 (21.3%) | 23.0 |
| Total | 258 (100.0%) | 49.0 |
Fertility by Age by Marriage Status in Knightdale
66.3% of women with births (258) in Knightdale are married. The highest percentage of unmarried women with births falls into 20 to 34 years age bracket with 42.9% of them unmarried at the time of birth, while the lowest percentage of unmarried women with births belong to 35 to 50 years age bracket with 0.0% of them unmarried.
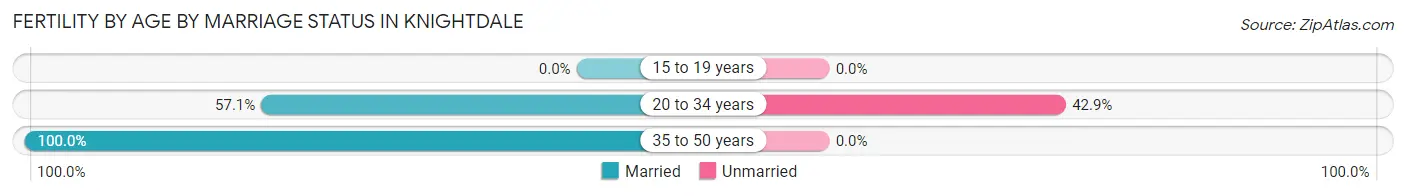
| Age Bracket | Married | Unmarried |
| 15 to 19 years | 0 (0.0%) | 0 (0.0%) |
| 20 to 34 years | 116 (57.1%) | 87 (42.9%) |
| 35 to 50 years | 55 (100.0%) | 0 (0.0%) |
| Total | 171 (66.3%) | 87 (33.7%) |
Fertility by Education in Knightdale
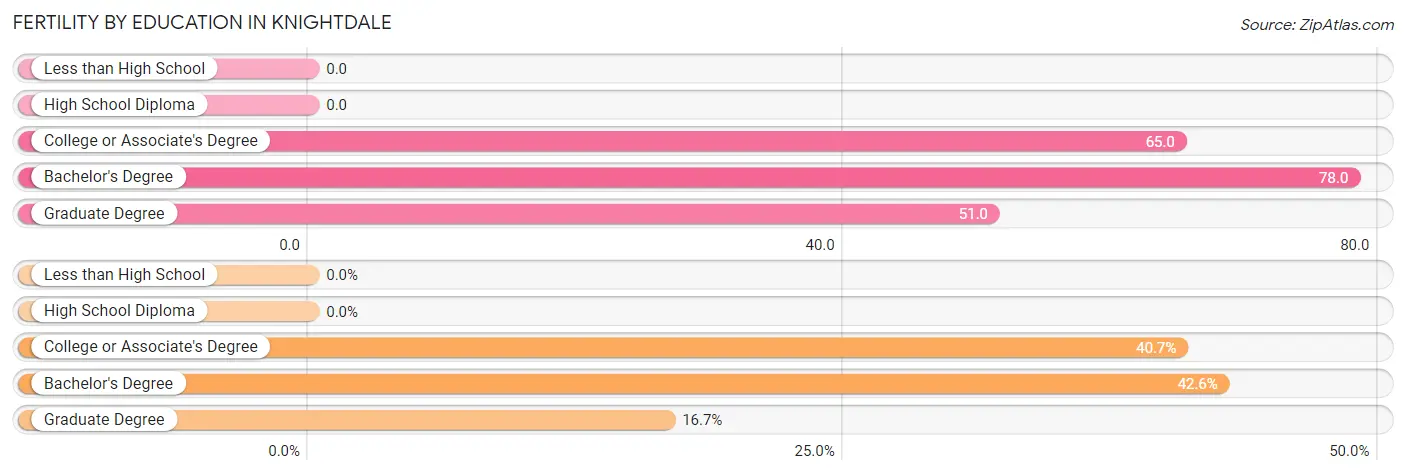
| Educational Attainment | Women with Births | Births / 1,000 Women |
| Less than High School | 0 (0.0%) | 0.0 |
| High School Diploma | 0 (0.0%) | 0.0 |
| College or Associate's Degree | 105 (40.7%) | 65.0 |
| Bachelor's Degree | 110 (42.6%) | 78.0 |
| Graduate Degree | 43 (16.7%) | 51.0 |
| Total | 258 (100.0%) | 49.0 |
Fertility by Education by Marriage Status in Knightdale
33.7% of women with births in Knightdale are unmarried. Women with the educational attainment of bachelor's degree are most likely to be married with 100.0% of them married at childbirth, while women with the educational attainment of college or associate's degree are least likely to be married with 82.9% of them unmarried at childbirth.
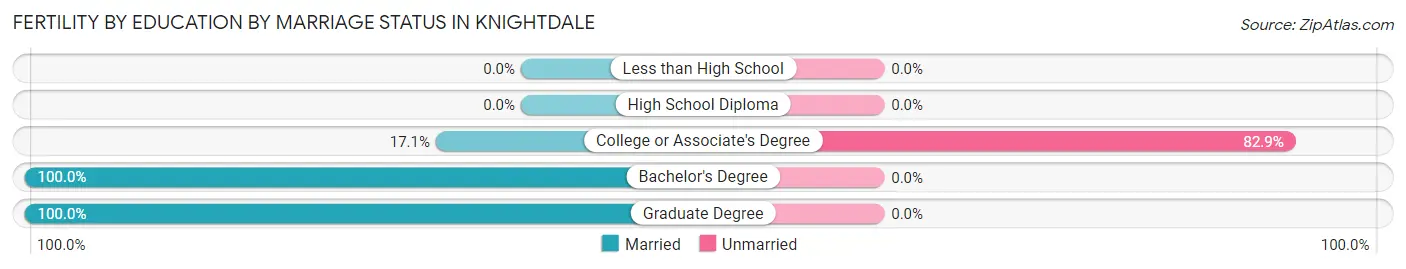
| Educational Attainment | Married | Unmarried |
| Less than High School | 0 (0.0%) | 0 (0.0%) |
| High School Diploma | 0 (0.0%) | 0 (0.0%) |
| College or Associate's Degree | 18 (17.1%) | 87 (82.9%) |
| Bachelor's Degree | 110 (100.0%) | 0 (0.0%) |
| Graduate Degree | 43 (100.0%) | 0 (0.0%) |
| Total | 171 (66.3%) | 87 (33.7%) |
Employment Characteristics in Knightdale
Employment by Class of Employer in Knightdale
Among the 10,587 employed individuals in Knightdale, private company employees (7,381 | 69.7%), state government employees (1,029 | 9.7%), and not-for-profit organizations (672 | 6.4%) make up the most common classes of employment.
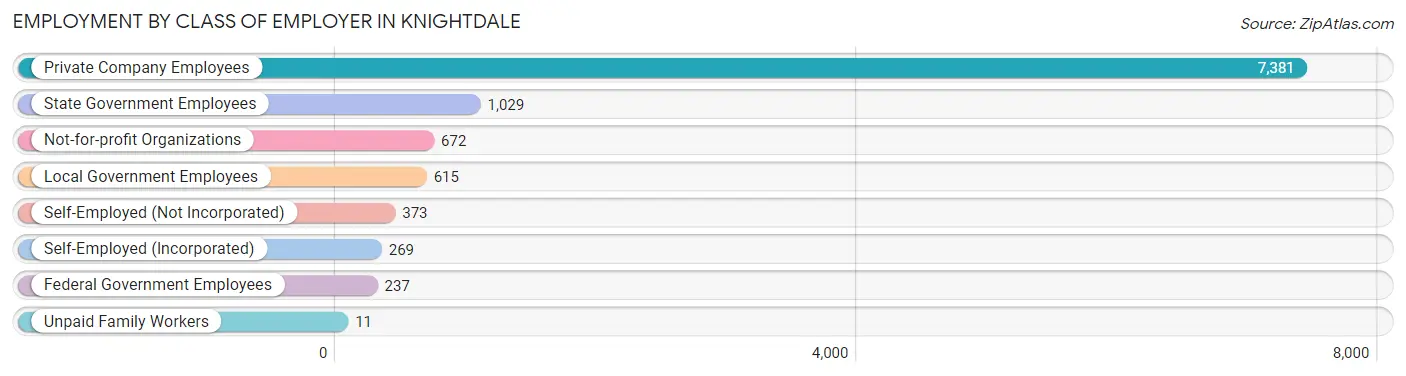
| Employer Class | # Employees | % Employees |
| Private Company Employees | 7,381 | 69.7% |
| Self-Employed (Incorporated) | 269 | 2.5% |
| Self-Employed (Not Incorporated) | 373 | 3.5% |
| Not-for-profit Organizations | 672 | 6.4% |
| Local Government Employees | 615 | 5.8% |
| State Government Employees | 1,029 | 9.7% |
| Federal Government Employees | 237 | 2.2% |
| Unpaid Family Workers | 11 | 0.1% |
| Total | 10,587 | 100.0% |
Employment Status by Age in Knightdale
According to the labor force statistics for Knightdale, out of the total population over 16 years of age (14,647), 77.0% or 11,278 individuals are in the labor force, with 5.9% or 665 of them unemployed. The age group with the highest labor force participation rate is 45 to 54 years, with 94.6% or 2,195 individuals in the labor force. Within the labor force, the 75 years and over age range has the highest percentage of unemployed individuals, with 82.9% or 97 of them being unemployed.
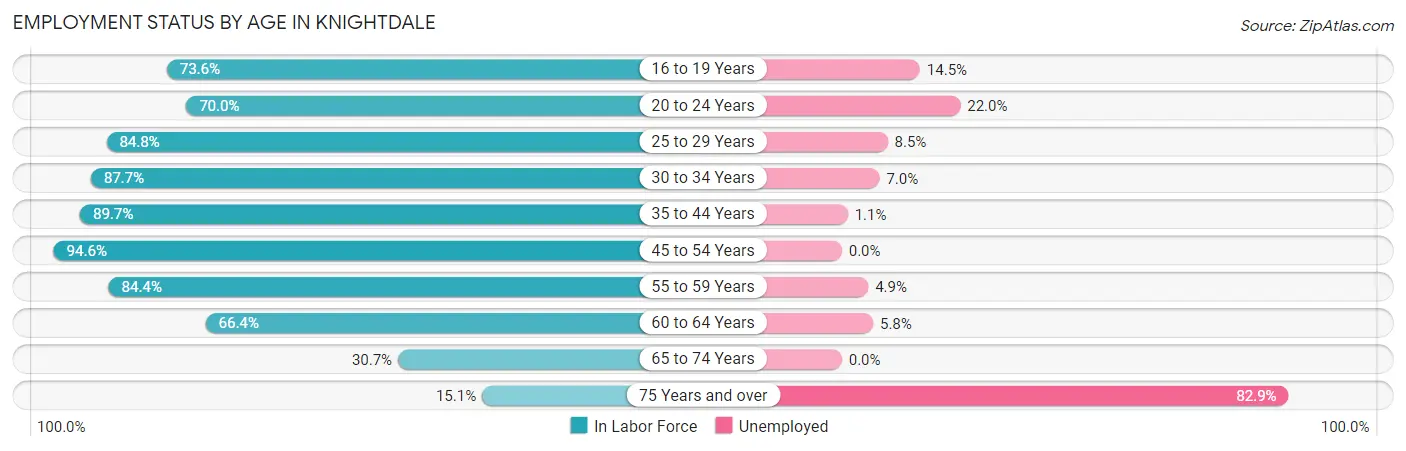
| Age Bracket | In Labor Force | Unemployed |
| 16 to 19 Years | 746 (73.6%) | 108 (14.5%) |
| 20 to 24 Years | 551 (70.0%) | 121 (22.0%) |
| 25 to 29 Years | 1,245 (84.8%) | 106 (8.5%) |
| 30 to 34 Years | 1,469 (87.7%) | 103 (7.0%) |
| 35 to 44 Years | 2,799 (89.7%) | 31 (1.1%) |
| 45 to 54 Years | 2,195 (94.6%) | 0 (0.0%) |
| 55 to 59 Years | 1,199 (84.4%) | 59 (4.9%) |
| 60 to 64 Years | 608 (66.4%) | 35 (5.8%) |
| 65 to 74 Years | 353 (30.7%) | 0 (0.0%) |
| 75 Years and over | 117 (15.1%) | 97 (82.9%) |
| Total | 11,278 (77.0%) | 665 (5.9%) |
Employment Status by Educational Attainment in Knightdale
According to labor force statistics for Knightdale, 87.1% of individuals (9,511) out of the total population between 25 and 64 years of age (10,920) are in the labor force, with 3.5% or 333 of them being unemployed. The group with the highest labor force participation rate are those with the educational attainment of bachelor's degree or higher, with 89.7% or 4,456 individuals in the labor force. Within the labor force, individuals with less than high school education have the highest percentage of unemployment, with 8.1% or 37 of them being unemployed.
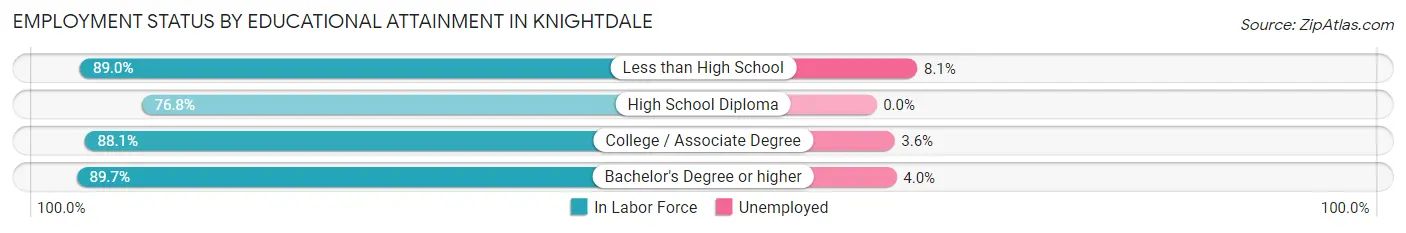
| Educational Attainment | In Labor Force | Unemployed |
| Less than High School | 459 (89.0%) | 42 (8.1%) |
| High School Diploma | 1,297 (76.8%) | 0 (0.0%) |
| College / Associate Degree | 3,301 (88.1%) | 135 (3.6%) |
| Bachelor's Degree or higher | 4,456 (89.7%) | 199 (4.0%) |
| Total | 9,511 (87.1%) | 382 (3.5%) |
Employment Occupations by Sex in Knightdale
Management, Business, Science and Arts Occupations
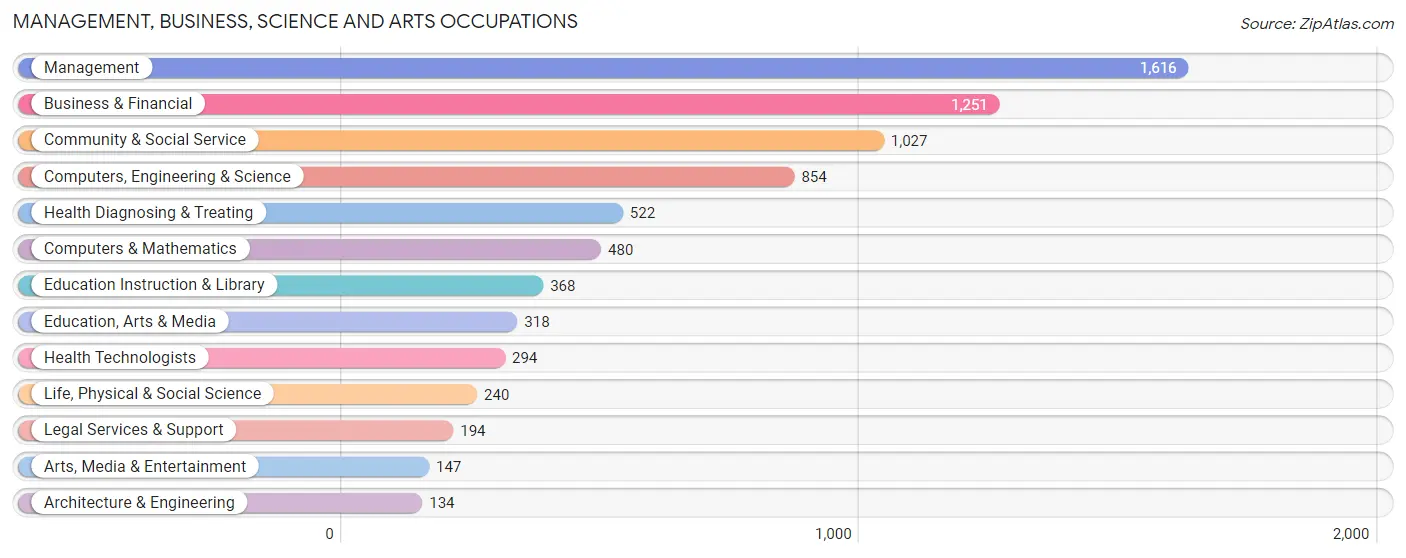
The most common Management, Business, Science and Arts occupations in Knightdale are Management (1,616 | 15.2%), Business & Financial (1,251 | 11.8%), Community & Social Service (1,027 | 9.7%), Computers, Engineering & Science (854 | 8.1%), and Health Diagnosing & Treating (522 | 4.9%).
Management, Business, Science and Arts Occupations by Sex
Within the Management, Business, Science and Arts occupations in Knightdale, the most male-oriented occupations are Architecture & Engineering (80.6%), Computers & Mathematics (73.3%), and Computers, Engineering & Science (66.5%), while the most female-oriented occupations are Education Instruction & Library (82.6%), Education, Arts & Media (80.5%), and Health Technologists (76.9%).
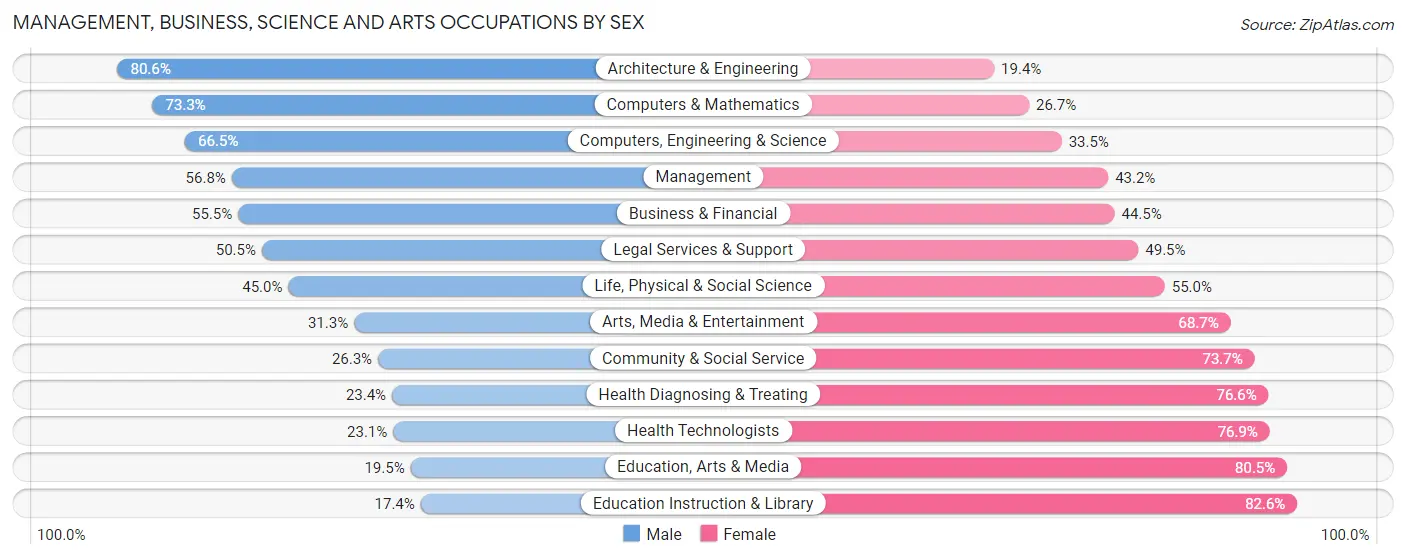
| Occupation | Male | Female |
| Management | 918 (56.8%) | 698 (43.2%) |
| Business & Financial | 694 (55.5%) | 557 (44.5%) |
| Computers, Engineering & Science | 568 (66.5%) | 286 (33.5%) |
| Computers & Mathematics | 352 (73.3%) | 128 (26.7%) |
| Architecture & Engineering | 108 (80.6%) | 26 (19.4%) |
| Life, Physical & Social Science | 108 (45.0%) | 132 (55.0%) |
| Community & Social Service | 270 (26.3%) | 757 (73.7%) |
| Education, Arts & Media | 62 (19.5%) | 256 (80.5%) |
| Legal Services & Support | 98 (50.5%) | 96 (49.5%) |
| Education Instruction & Library | 64 (17.4%) | 304 (82.6%) |
| Arts, Media & Entertainment | 46 (31.3%) | 101 (68.7%) |
| Health Diagnosing & Treating | 122 (23.4%) | 400 (76.6%) |
| Health Technologists | 68 (23.1%) | 226 (76.9%) |
| Total (Category) | 2,572 (48.8%) | 2,698 (51.2%) |
| Total (Overall) | 4,968 (46.8%) | 5,647 (53.2%) |
Services Occupations
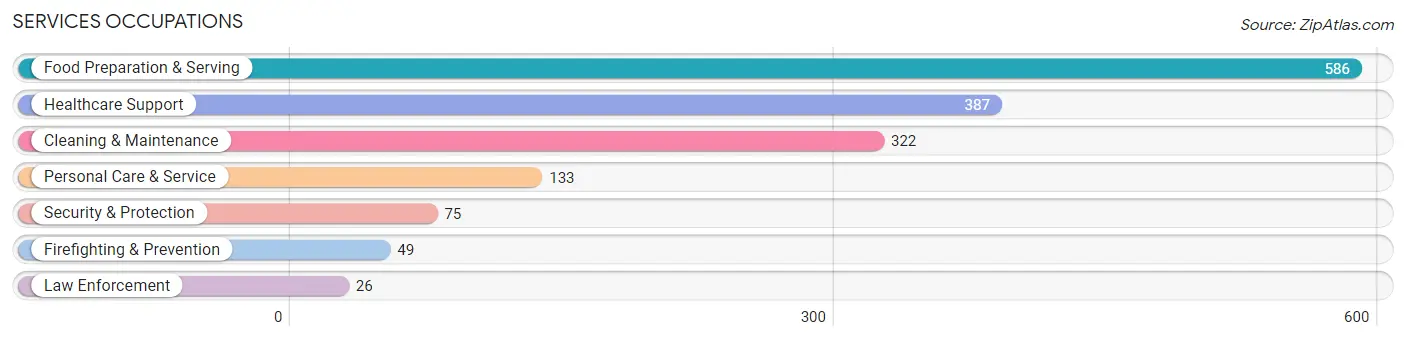
The most common Services occupations in Knightdale are Food Preparation & Serving (586 | 5.5%), Healthcare Support (387 | 3.6%), Cleaning & Maintenance (322 | 3.0%), Personal Care & Service (133 | 1.3%), and Security & Protection (75 | 0.7%).
Services Occupations by Sex
Within the Services occupations in Knightdale, the most male-oriented occupations are Law Enforcement (61.5%), Security & Protection (61.3%), and Firefighting & Prevention (61.2%), while the most female-oriented occupations are Personal Care & Service (89.5%), Food Preparation & Serving (76.8%), and Healthcare Support (63.8%).
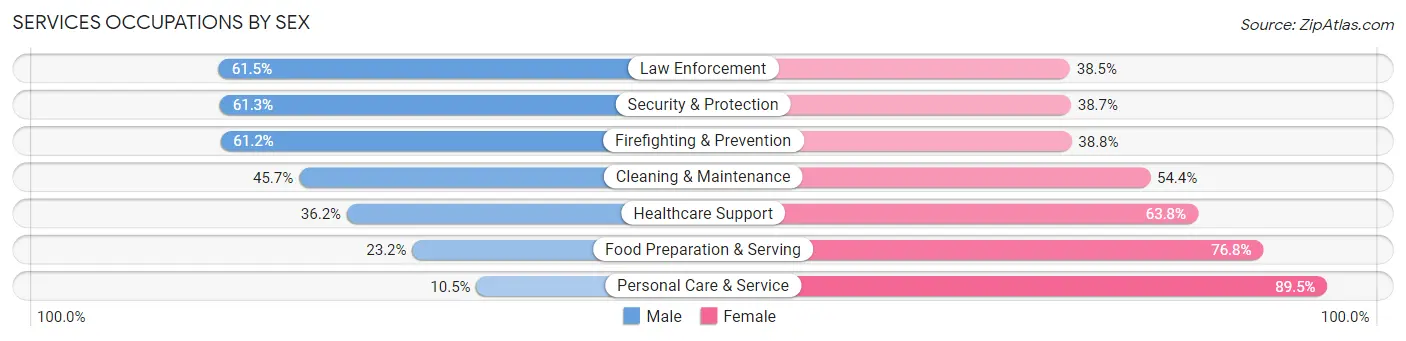
| Occupation | Male | Female |
| Healthcare Support | 140 (36.2%) | 247 (63.8%) |
| Security & Protection | 46 (61.3%) | 29 (38.7%) |
| Firefighting & Prevention | 30 (61.2%) | 19 (38.8%) |
| Law Enforcement | 16 (61.5%) | 10 (38.5%) |
| Food Preparation & Serving | 136 (23.2%) | 450 (76.8%) |
| Cleaning & Maintenance | 147 (45.7%) | 175 (54.3%) |
| Personal Care & Service | 14 (10.5%) | 119 (89.5%) |
| Total (Category) | 483 (32.1%) | 1,020 (67.9%) |
| Total (Overall) | 4,968 (46.8%) | 5,647 (53.2%) |
Sales and Office Occupations
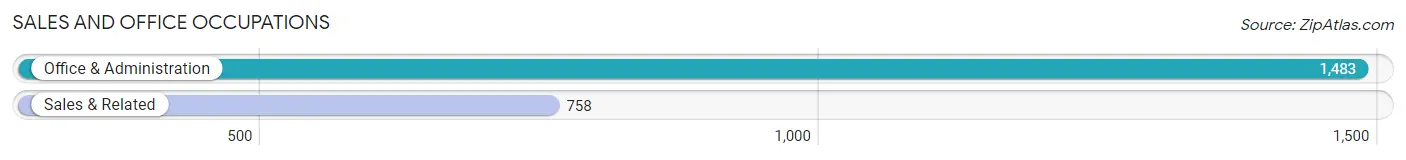
The most common Sales and Office occupations in Knightdale are Office & Administration (1,483 | 14.0%), and Sales & Related (758 | 7.1%).
Sales and Office Occupations by Sex
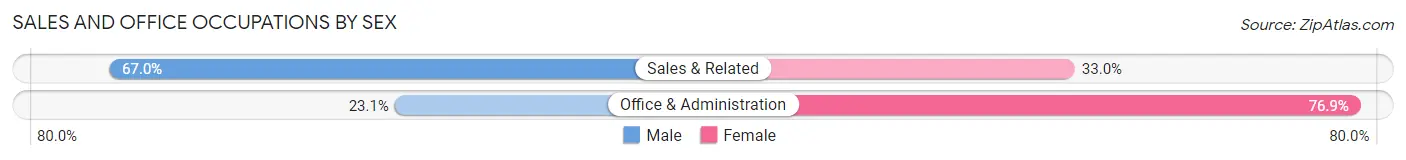
| Occupation | Male | Female |
| Sales & Related | 508 (67.0%) | 250 (33.0%) |
| Office & Administration | 342 (23.1%) | 1,141 (76.9%) |
| Total (Category) | 850 (37.9%) | 1,391 (62.1%) |
| Total (Overall) | 4,968 (46.8%) | 5,647 (53.2%) |
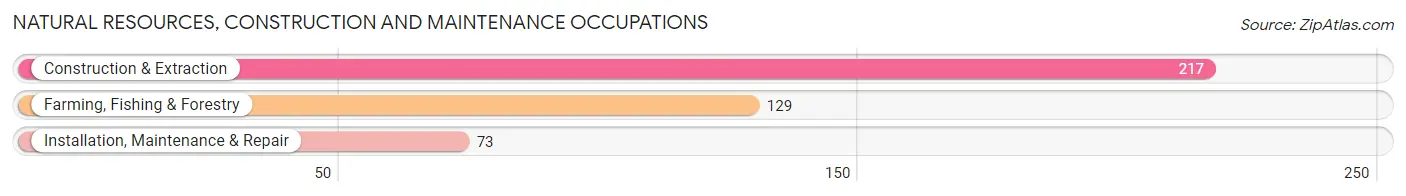
Natural Resources, Construction and Maintenance Occupations
The most common Natural Resources, Construction and Maintenance occupations in Knightdale are Construction & Extraction (217 | 2.0%), Farming, Fishing & Forestry (129 | 1.2%), and Installation, Maintenance & Repair (73 | 0.7%).
Natural Resources, Construction and Maintenance Occupations by Sex
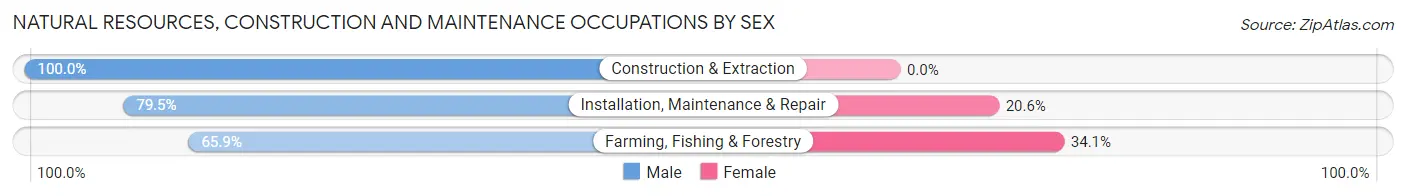
| Occupation | Male | Female |
| Farming, Fishing & Forestry | 85 (65.9%) | 44 (34.1%) |
| Construction & Extraction | 217 (100.0%) | 0 (0.0%) |
| Installation, Maintenance & Repair | 58 (79.4%) | 15 (20.5%) |
| Total (Category) | 360 (85.9%) | 59 (14.1%) |
| Total (Overall) | 4,968 (46.8%) | 5,647 (53.2%) |
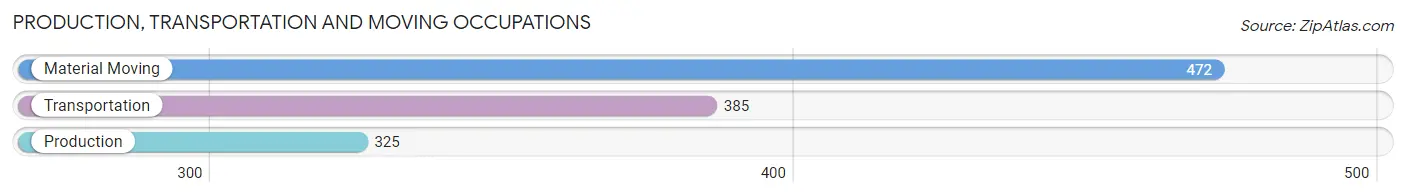
Production, Transportation and Moving Occupations
The most common Production, Transportation and Moving occupations in Knightdale are Material Moving (472 | 4.4%), Transportation (385 | 3.6%), and Production (325 | 3.1%).
Production, Transportation and Moving Occupations by Sex
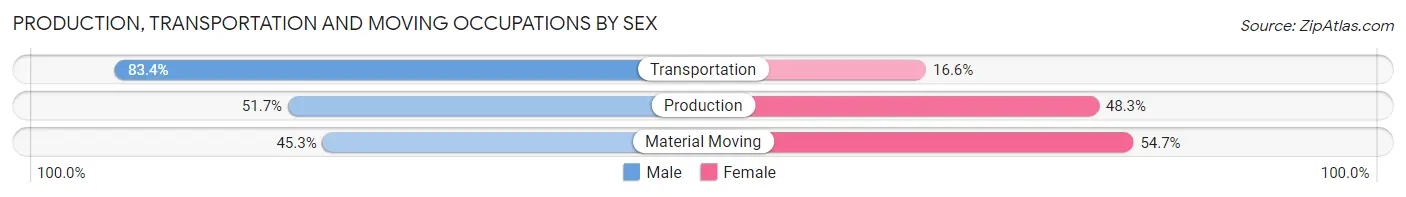
| Occupation | Male | Female |
| Production | 168 (51.7%) | 157 (48.3%) |
| Transportation | 321 (83.4%) | 64 (16.6%) |
| Material Moving | 214 (45.3%) | 258 (54.7%) |
| Total (Category) | 703 (59.5%) | 479 (40.5%) |
| Total (Overall) | 4,968 (46.8%) | 5,647 (53.2%) |
Employment Industries by Sex in Knightdale
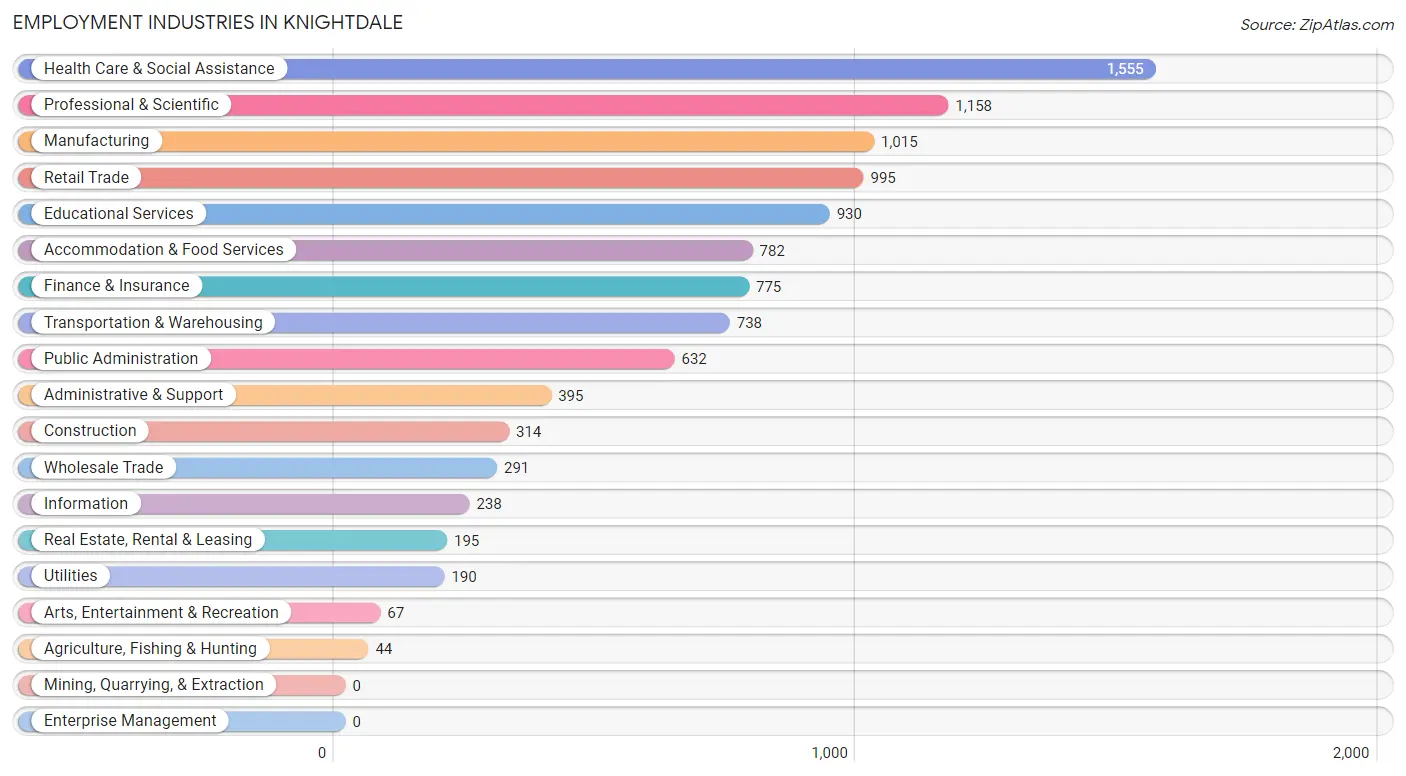
Employment Industries in Knightdale
The major employment industries in Knightdale include Health Care & Social Assistance (1,555 | 14.6%), Professional & Scientific (1,158 | 10.9%), Manufacturing (1,015 | 9.6%), Retail Trade (995 | 9.4%), and Educational Services (930 | 8.8%).
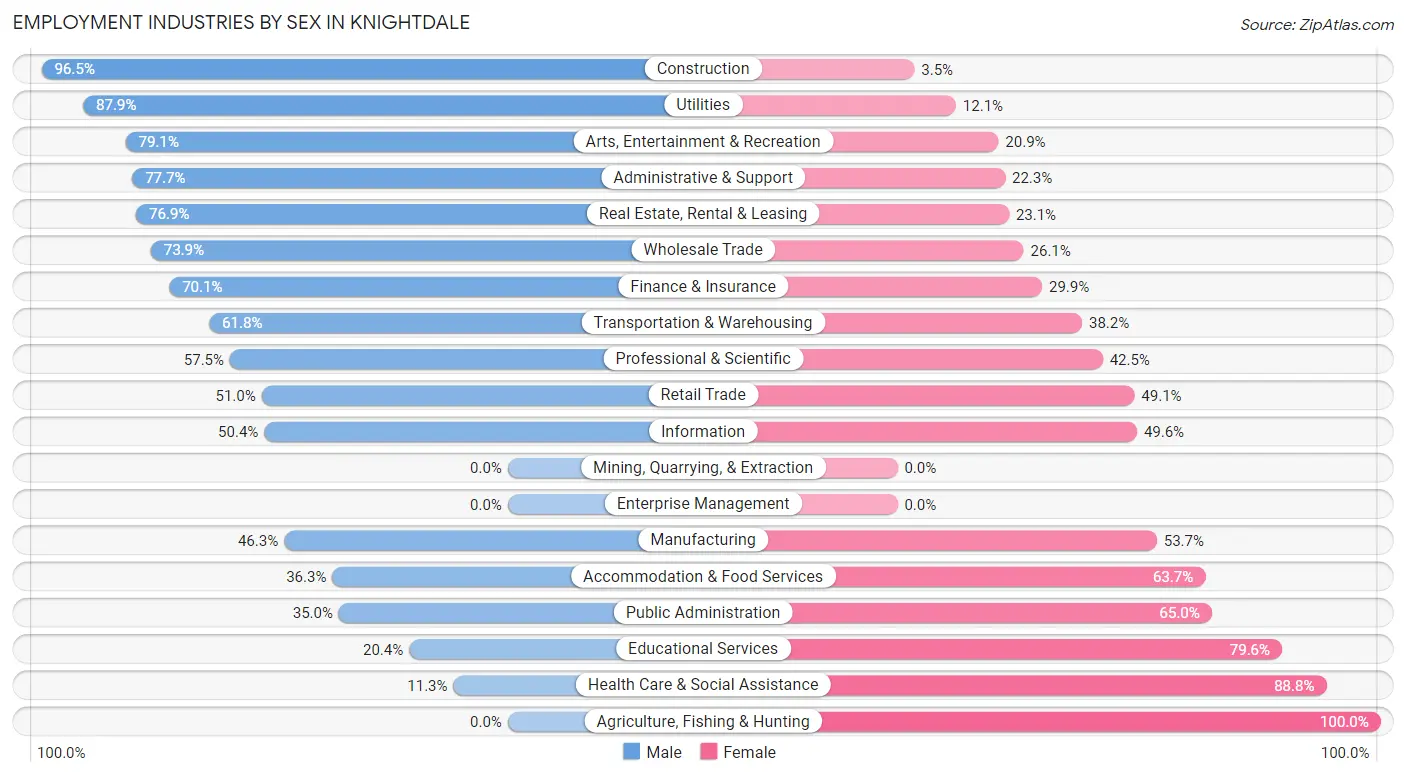
Employment Industries by Sex in Knightdale
The Knightdale industries that see more men than women are Construction (96.5%), Utilities (87.9%), and Arts, Entertainment & Recreation (79.1%), whereas the industries that tend to have a higher number of women are Agriculture, Fishing & Hunting (100.0%), Health Care & Social Assistance (88.7%), and Educational Services (79.6%).
| Industry | Male | Female |
| Agriculture, Fishing & Hunting | 0 (0.0%) | 44 (100.0%) |
| Mining, Quarrying, & Extraction | 0 (0.0%) | 0 (0.0%) |
| Construction | 303 (96.5%) | 11 (3.5%) |
| Manufacturing | 470 (46.3%) | 545 (53.7%) |
| Wholesale Trade | 215 (73.9%) | 76 (26.1%) |
| Retail Trade | 507 (50.9%) | 488 (49.0%) |
| Transportation & Warehousing | 456 (61.8%) | 282 (38.2%) |
| Utilities | 167 (87.9%) | 23 (12.1%) |
| Information | 120 (50.4%) | 118 (49.6%) |
| Finance & Insurance | 543 (70.1%) | 232 (29.9%) |
| Real Estate, Rental & Leasing | 150 (76.9%) | 45 (23.1%) |
| Professional & Scientific | 666 (57.5%) | 492 (42.5%) |
| Enterprise Management | 0 (0.0%) | 0 (0.0%) |
| Administrative & Support | 307 (77.7%) | 88 (22.3%) |
| Educational Services | 190 (20.4%) | 740 (79.6%) |
| Health Care & Social Assistance | 175 (11.3%) | 1,380 (88.7%) |
| Arts, Entertainment & Recreation | 53 (79.1%) | 14 (20.9%) |
| Accommodation & Food Services | 284 (36.3%) | 498 (63.7%) |
| Public Administration | 221 (35.0%) | 411 (65.0%) |
| Total | 4,968 (46.8%) | 5,647 (53.2%) |
Education in Knightdale
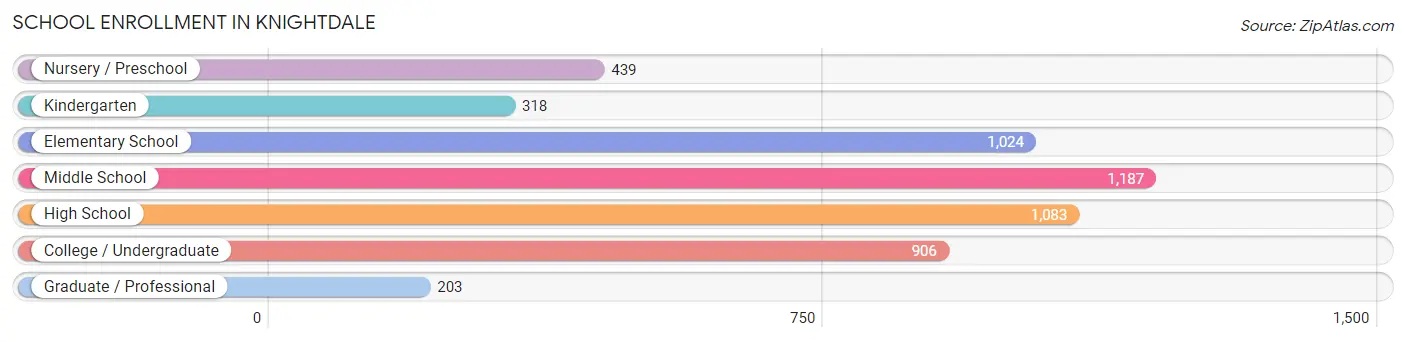
School Enrollment in Knightdale
The most common levels of schooling among the 5,160 students in Knightdale are middle school (1,187 | 23.0%), high school (1,083 | 21.0%), and elementary school (1,024 | 19.8%).
| School Level | # Students | % Students |
| Nursery / Preschool | 439 | 8.5% |
| Kindergarten | 318 | 6.2% |
| Elementary School | 1,024 | 19.8% |
| Middle School | 1,187 | 23.0% |
| High School | 1,083 | 21.0% |
| College / Undergraduate | 906 | 17.6% |
| Graduate / Professional | 203 | 3.9% |
| Total | 5,160 | 100.0% |
School Enrollment by Age by Funding Source in Knightdale
Out of a total of 5,160 students who are enrolled in schools in Knightdale, 1,244 (24.1%) attend a private institution, while the remaining 3,916 (75.9%) are enrolled in public schools. The age group of 3 to 4 year olds has the highest likelihood of being enrolled in private schools, with 235 (59.3% in the age bracket) enrolled. Conversely, the age group of 15 to 17 year olds has the lowest likelihood of being enrolled in a private school, with 730 (97.7% in the age bracket) attending a public institution.
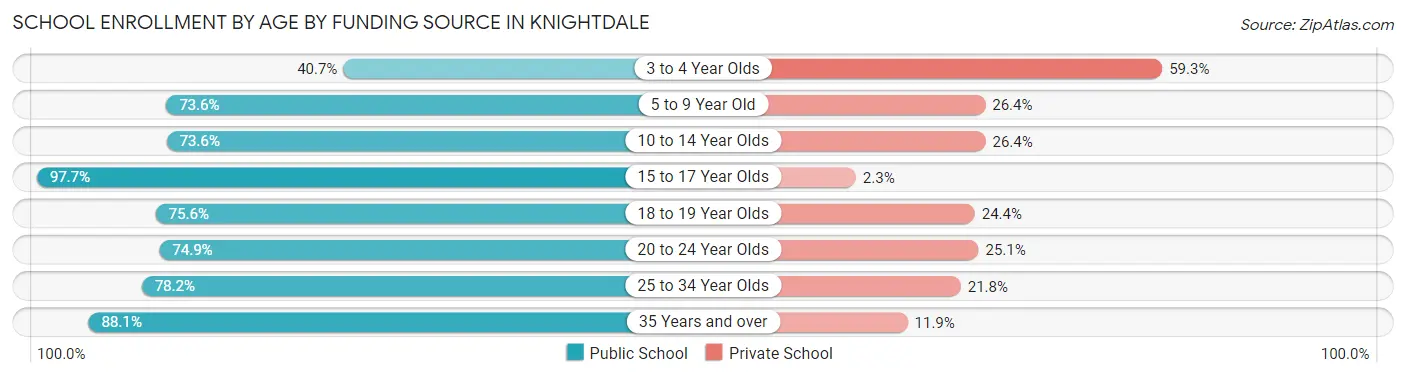
| Age Bracket | Public School | Private School |
| 3 to 4 Year Olds | 161 (40.7%) | 235 (59.3%) |
| 5 to 9 Year Old | 932 (73.6%) | 334 (26.4%) |
| 10 to 14 Year Olds | 1,122 (73.6%) | 403 (26.4%) |
| 15 to 17 Year Olds | 730 (97.7%) | 17 (2.3%) |
| 18 to 19 Year Olds | 291 (75.6%) | 94 (24.4%) |
| 20 to 24 Year Olds | 161 (74.9%) | 54 (25.1%) |
| 25 to 34 Year Olds | 240 (78.2%) | 67 (21.8%) |
| 35 Years and over | 281 (88.1%) | 38 (11.9%) |
| Total | 3,916 (75.9%) | 1,244 (24.1%) |
Educational Attainment by Field of Study in Knightdale
Business (1,622 | 27.1%), education (641 | 10.7%), social sciences (459 | 7.6%), computers & mathematics (458 | 7.6%), and bio, nature & agricultural (403 | 6.7%) are the most common fields of study among 5,997 individuals in Knightdale who have obtained a bachelor's degree or higher.
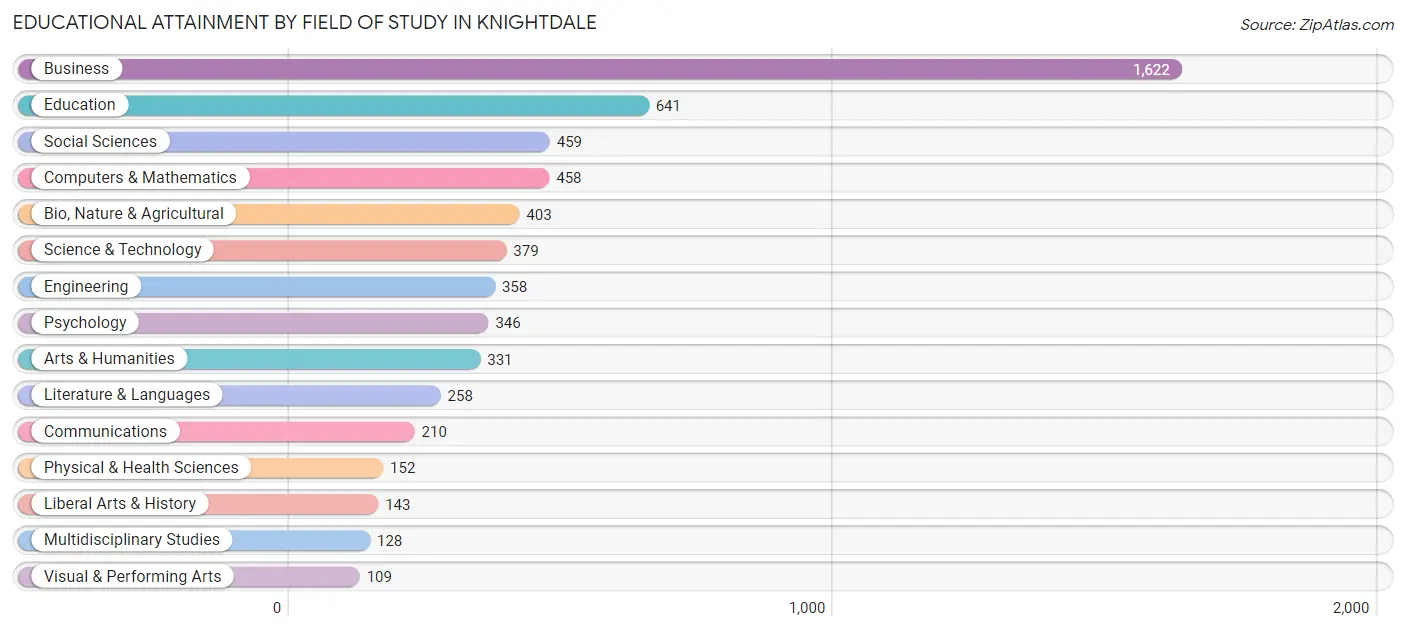
| Field of Study | # Graduates | % Graduates |
| Computers & Mathematics | 458 | 7.6% |
| Bio, Nature & Agricultural | 403 | 6.7% |
| Physical & Health Sciences | 152 | 2.5% |
| Psychology | 346 | 5.8% |
| Social Sciences | 459 | 7.6% |
| Engineering | 358 | 6.0% |
| Multidisciplinary Studies | 128 | 2.1% |
| Science & Technology | 379 | 6.3% |
| Business | 1,622 | 27.1% |
| Education | 641 | 10.7% |
| Literature & Languages | 258 | 4.3% |
| Liberal Arts & History | 143 | 2.4% |
| Visual & Performing Arts | 109 | 1.8% |
| Communications | 210 | 3.5% |
| Arts & Humanities | 331 | 5.5% |
| Total | 5,997 | 100.0% |
Transportation & Commute in Knightdale
Vehicle Availability by Sex in Knightdale
The most prevalent vehicle ownership categories in Knightdale are males with 2 vehicles (2,875, accounting for 57.8%) and females with 2 vehicles (2,376, making up 51.2%).
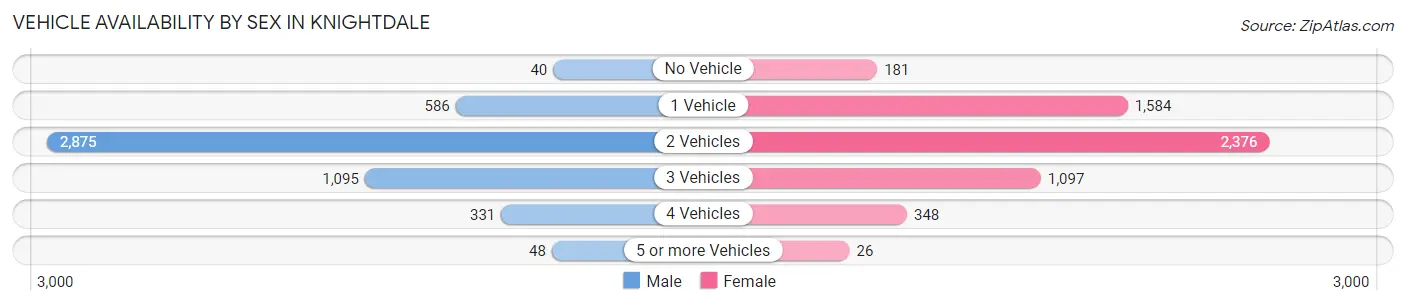
| Vehicles Available | Male | Female |
| No Vehicle | 40 (0.8%) | 181 (3.2%) |
| 1 Vehicle | 586 (11.8%) | 1,584 (28.2%) |
| 2 Vehicles | 2,875 (57.8%) | 2,376 (42.3%) |
| 3 Vehicles | 1,095 (22.0%) | 1,097 (19.6%) |
| 4 Vehicles | 331 (6.7%) | 348 (6.2%) |
| 5 or more Vehicles | 48 (1.0%) | 26 (0.5%) |
| Total | 4,975 (100.0%) | 5,612 (100.0%) |
Commute Time in Knightdale
The most frequently occuring commute durations in Knightdale are 20 to 24 minutes (1,660 commuters, 18.6%), 15 to 19 minutes (1,562 commuters, 17.5%), and 25 to 29 minutes (1,257 commuters, 14.1%).
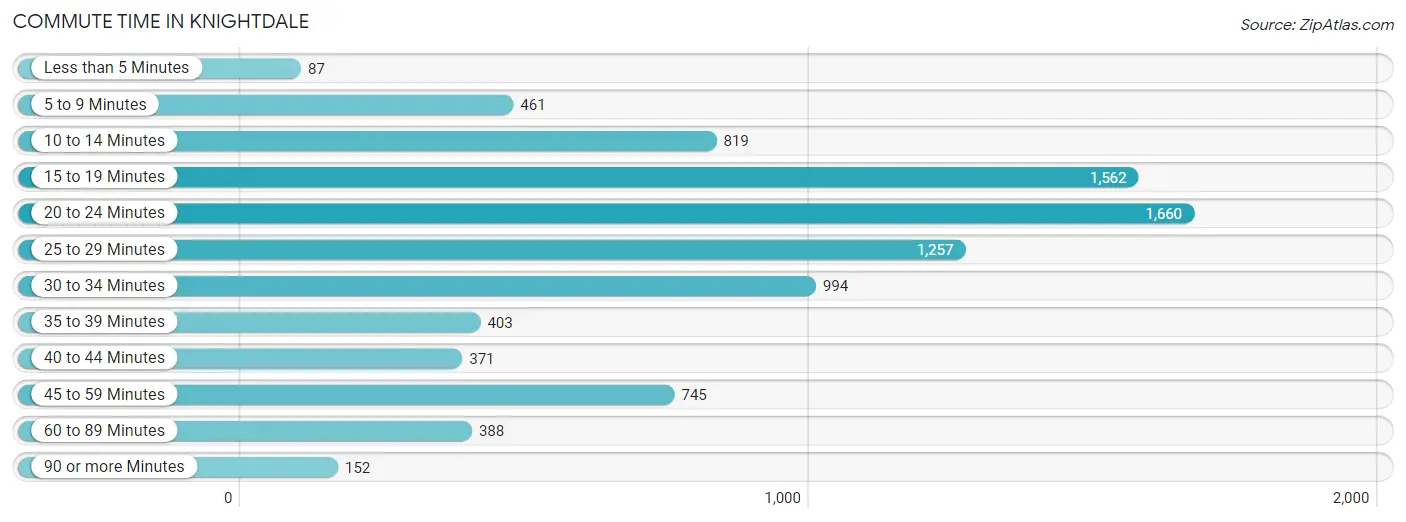
| Commute Time | # Commuters | % Commuters |
| Less than 5 Minutes | 87 | 1.0% |
| 5 to 9 Minutes | 461 | 5.2% |
| 10 to 14 Minutes | 819 | 9.2% |
| 15 to 19 Minutes | 1,562 | 17.5% |
| 20 to 24 Minutes | 1,660 | 18.6% |
| 25 to 29 Minutes | 1,257 | 14.1% |
| 30 to 34 Minutes | 994 | 11.2% |
| 35 to 39 Minutes | 403 | 4.5% |
| 40 to 44 Minutes | 371 | 4.2% |
| 45 to 59 Minutes | 745 | 8.4% |
| 60 to 89 Minutes | 388 | 4.4% |
| 90 or more Minutes | 152 | 1.7% |
Commute Time by Sex in Knightdale
The most common commute times in Knightdale are 15 to 19 minutes (1,034 commuters, 25.6%) for males and 20 to 24 minutes (1,033 commuters, 21.2%) for females.
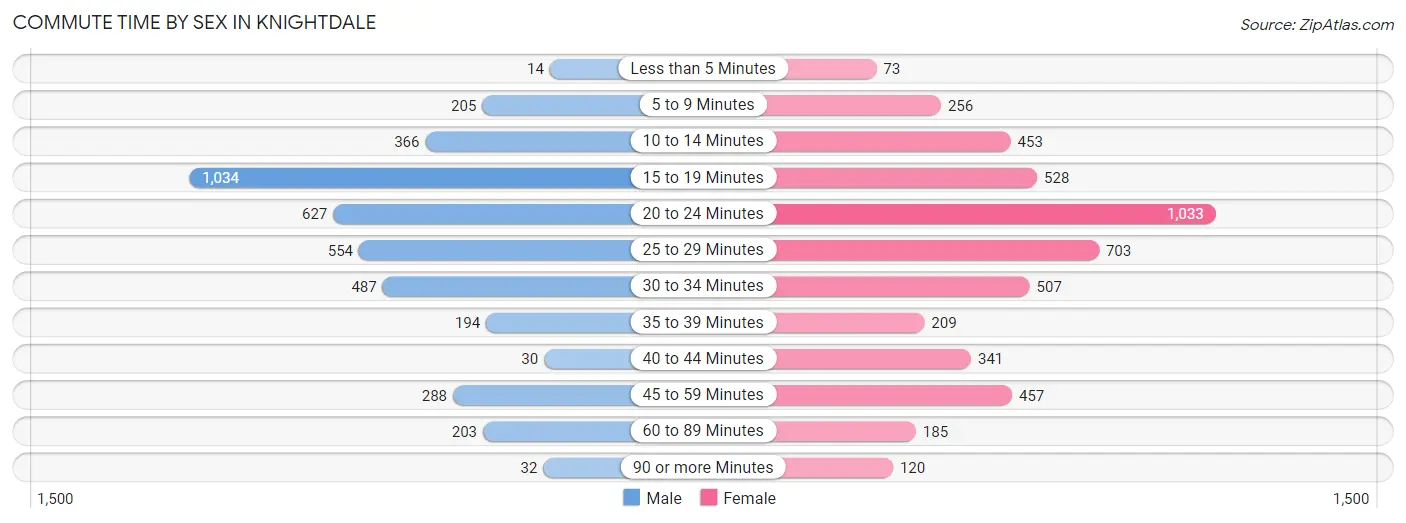
| Commute Time | Male | Female |
| Less than 5 Minutes | 14 (0.4%) | 73 (1.5%) |
| 5 to 9 Minutes | 205 (5.1%) | 256 (5.3%) |
| 10 to 14 Minutes | 366 (9.1%) | 453 (9.3%) |
| 15 to 19 Minutes | 1,034 (25.6%) | 528 (10.8%) |
| 20 to 24 Minutes | 627 (15.5%) | 1,033 (21.2%) |
| 25 to 29 Minutes | 554 (13.7%) | 703 (14.4%) |
| 30 to 34 Minutes | 487 (12.1%) | 507 (10.4%) |
| 35 to 39 Minutes | 194 (4.8%) | 209 (4.3%) |
| 40 to 44 Minutes | 30 (0.7%) | 341 (7.0%) |
| 45 to 59 Minutes | 288 (7.1%) | 457 (9.4%) |
| 60 to 89 Minutes | 203 (5.0%) | 185 (3.8%) |
| 90 or more Minutes | 32 (0.8%) | 120 (2.5%) |
Time of Departure to Work by Sex in Knightdale
The most frequent times of departure to work in Knightdale are 7:00 AM to 7:29 AM (732, 18.1%) for males and 7:00 AM to 7:29 AM (1,041, 21.4%) for females.
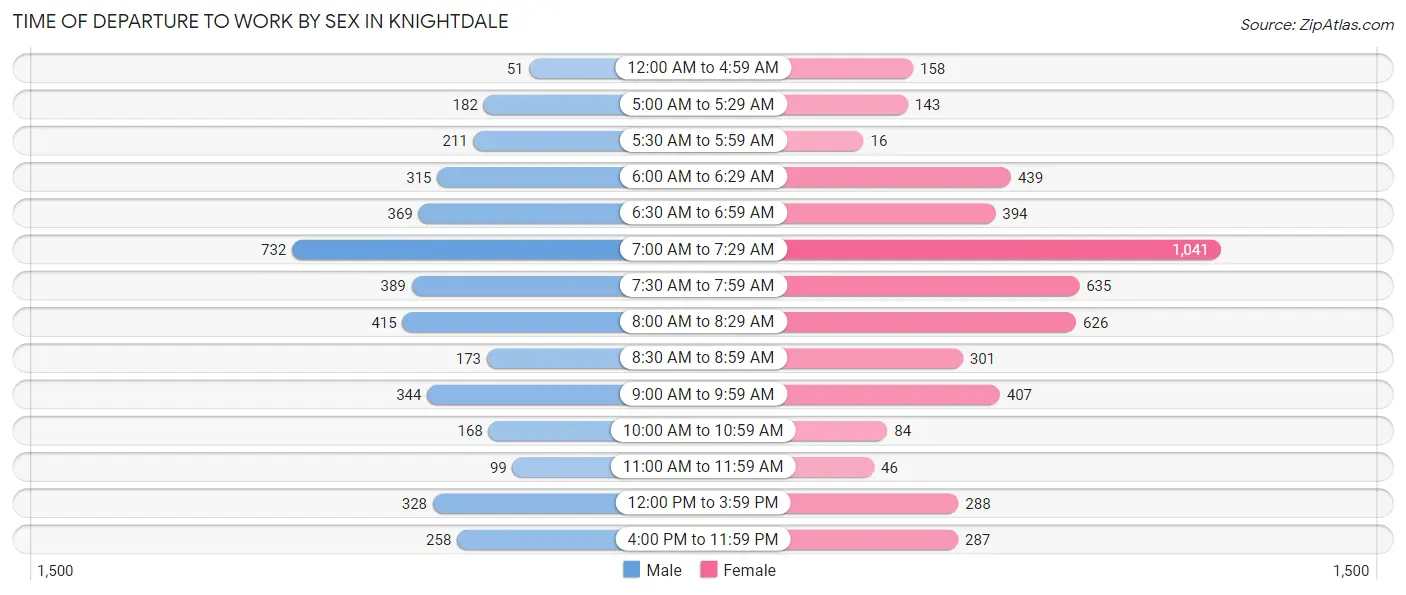
| Time of Departure | Male | Female |
| 12:00 AM to 4:59 AM | 51 (1.3%) | 158 (3.3%) |
| 5:00 AM to 5:29 AM | 182 (4.5%) | 143 (2.9%) |
| 5:30 AM to 5:59 AM | 211 (5.2%) | 16 (0.3%) |
| 6:00 AM to 6:29 AM | 315 (7.8%) | 439 (9.0%) |
| 6:30 AM to 6:59 AM | 369 (9.1%) | 394 (8.1%) |
| 7:00 AM to 7:29 AM | 732 (18.1%) | 1,041 (21.4%) |
| 7:30 AM to 7:59 AM | 389 (9.6%) | 635 (13.1%) |
| 8:00 AM to 8:29 AM | 415 (10.3%) | 626 (12.9%) |
| 8:30 AM to 8:59 AM | 173 (4.3%) | 301 (6.2%) |
| 9:00 AM to 9:59 AM | 344 (8.5%) | 407 (8.4%) |
| 10:00 AM to 10:59 AM | 168 (4.2%) | 84 (1.7%) |
| 11:00 AM to 11:59 AM | 99 (2.5%) | 46 (0.9%) |
| 12:00 PM to 3:59 PM | 328 (8.1%) | 288 (5.9%) |
| 4:00 PM to 11:59 PM | 258 (6.4%) | 287 (5.9%) |
| Total | 4,034 (100.0%) | 4,865 (100.0%) |
Housing Occupancy in Knightdale
Occupancy by Ownership in Knightdale
Of the total 7,436 dwellings in Knightdale, owner-occupied units account for 4,869 (65.5%), while renter-occupied units make up 2,567 (34.5%).
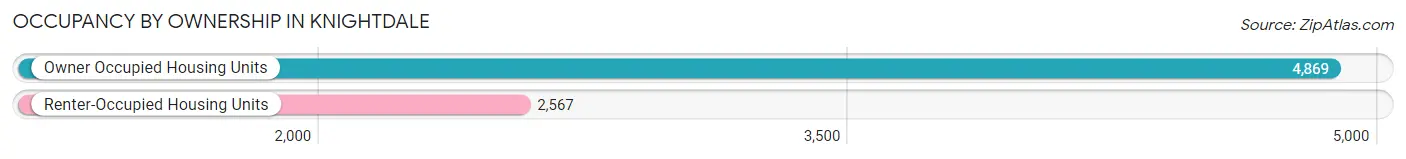
| Occupancy | # Housing Units | % Housing Units |
| Owner Occupied Housing Units | 4,869 | 65.5% |
| Renter-Occupied Housing Units | 2,567 | 34.5% |
| Total Occupied Housing Units | 7,436 | 100.0% |
Occupancy by Household Size in Knightdale
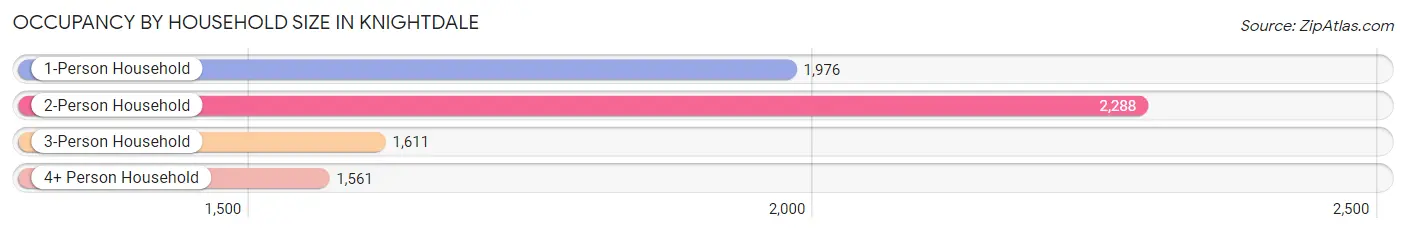
| Household Size | # Housing Units | % Housing Units |
| 1-Person Household | 1,976 | 26.6% |
| 2-Person Household | 2,288 | 30.8% |
| 3-Person Household | 1,611 | 21.7% |
| 4+ Person Household | 1,561 | 21.0% |
| Total Housing Units | 7,436 | 100.0% |
Occupancy by Ownership by Household Size in Knightdale
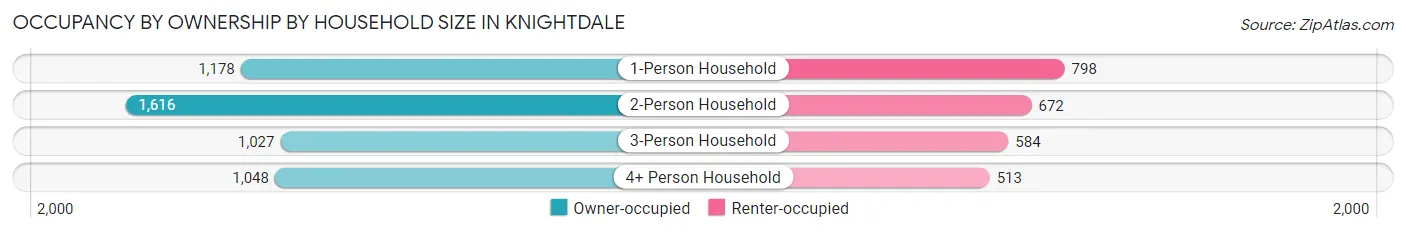
| Household Size | Owner-occupied | Renter-occupied |
| 1-Person Household | 1,178 (59.6%) | 798 (40.4%) |
| 2-Person Household | 1,616 (70.6%) | 672 (29.4%) |
| 3-Person Household | 1,027 (63.7%) | 584 (36.2%) |
| 4+ Person Household | 1,048 (67.1%) | 513 (32.9%) |
| Total Housing Units | 4,869 (65.5%) | 2,567 (34.5%) |
Occupancy by Educational Attainment in Knightdale
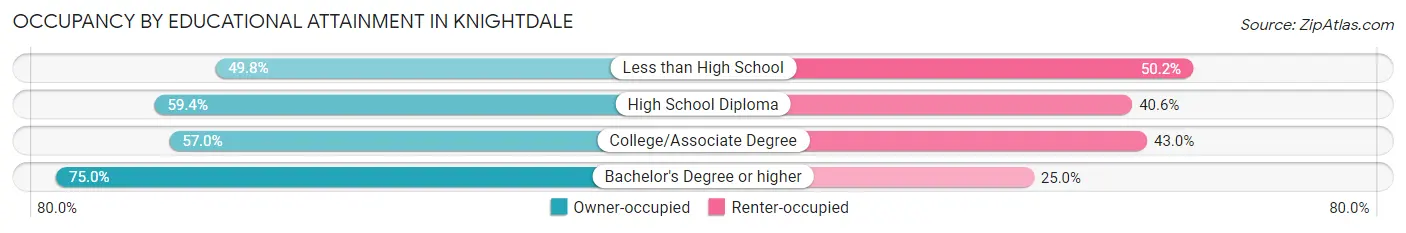
| Household Size | Owner-occupied | Renter-occupied |
| Less than High School | 104 (49.8%) | 105 (50.2%) |
| High School Diploma | 819 (59.4%) | 560 (40.6%) |
| College/Associate Degree | 1,397 (57.0%) | 1,052 (43.0%) |
| Bachelor's Degree or higher | 2,549 (75.0%) | 850 (25.0%) |
Occupancy by Age of Householder in Knightdale
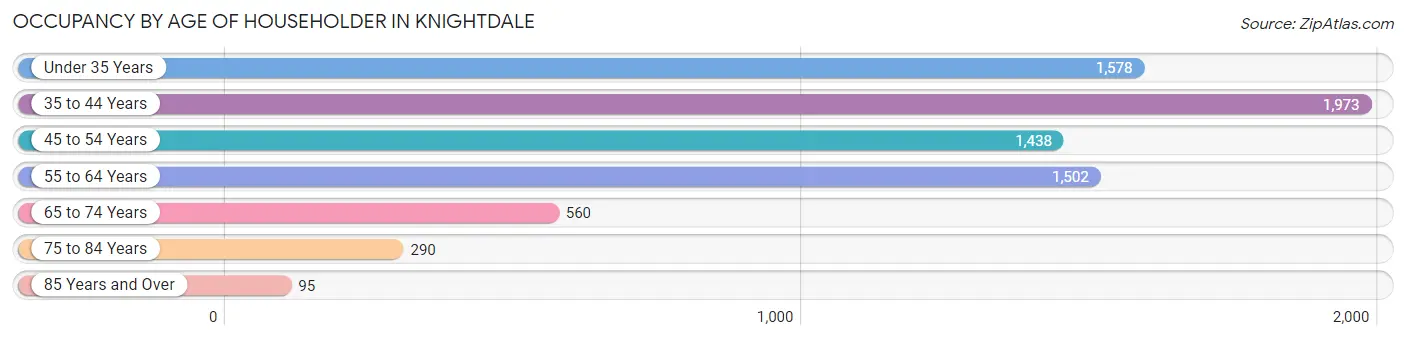
| Age Bracket | # Households | % Households |
| Under 35 Years | 1,578 | 21.2% |
| 35 to 44 Years | 1,973 | 26.5% |
| 45 to 54 Years | 1,438 | 19.3% |
| 55 to 64 Years | 1,502 | 20.2% |
| 65 to 74 Years | 560 | 7.5% |
| 75 to 84 Years | 290 | 3.9% |
| 85 Years and Over | 95 | 1.3% |
| Total | 7,436 | 100.0% |
Housing Finances in Knightdale
Median Income by Occupancy in Knightdale
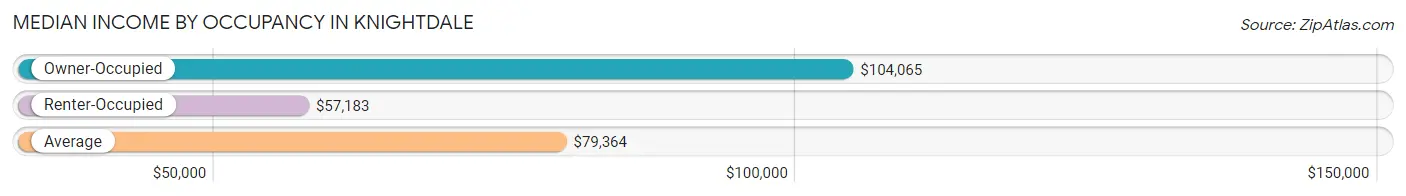
| Occupancy Type | # Households | Median Income |
| Owner-Occupied | 4,869 (65.5%) | $104,065 |
| Renter-Occupied | 2,567 (34.5%) | $57,183 |
| Average | 7,436 (100.0%) | $79,364 |
Occupancy by Householder Income Bracket in Knightdale
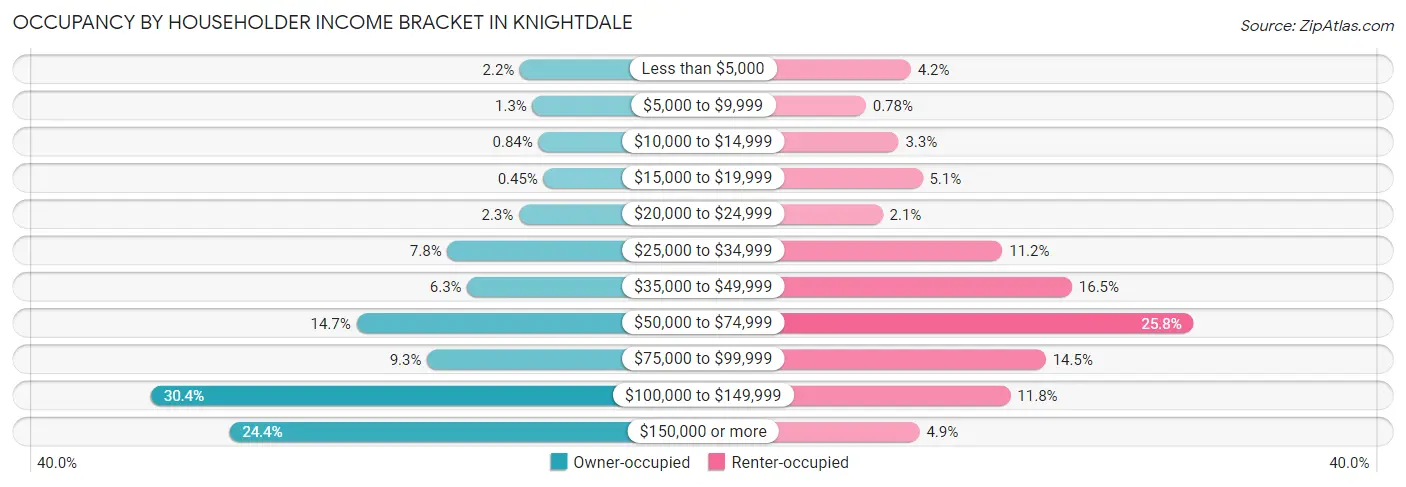
| Income Bracket | Owner-occupied | Renter-occupied |
| Less than $5,000 | 109 (2.2%) | 108 (4.2%) |
| $5,000 to $9,999 | 63 (1.3%) | 20 (0.8%) |
| $10,000 to $14,999 | 41 (0.8%) | 84 (3.3%) |
| $15,000 to $19,999 | 22 (0.4%) | 131 (5.1%) |
| $20,000 to $24,999 | 113 (2.3%) | 53 (2.1%) |
| $25,000 to $34,999 | 379 (7.8%) | 287 (11.2%) |
| $35,000 to $49,999 | 305 (6.3%) | 423 (16.5%) |
| $50,000 to $74,999 | 716 (14.7%) | 661 (25.8%) |
| $75,000 to $99,999 | 454 (9.3%) | 372 (14.5%) |
| $100,000 to $149,999 | 1,479 (30.4%) | 303 (11.8%) |
| $150,000 or more | 1,188 (24.4%) | 125 (4.9%) |
| Total | 4,869 (100.0%) | 2,567 (100.0%) |
Monthly Housing Cost Tiers in Knightdale
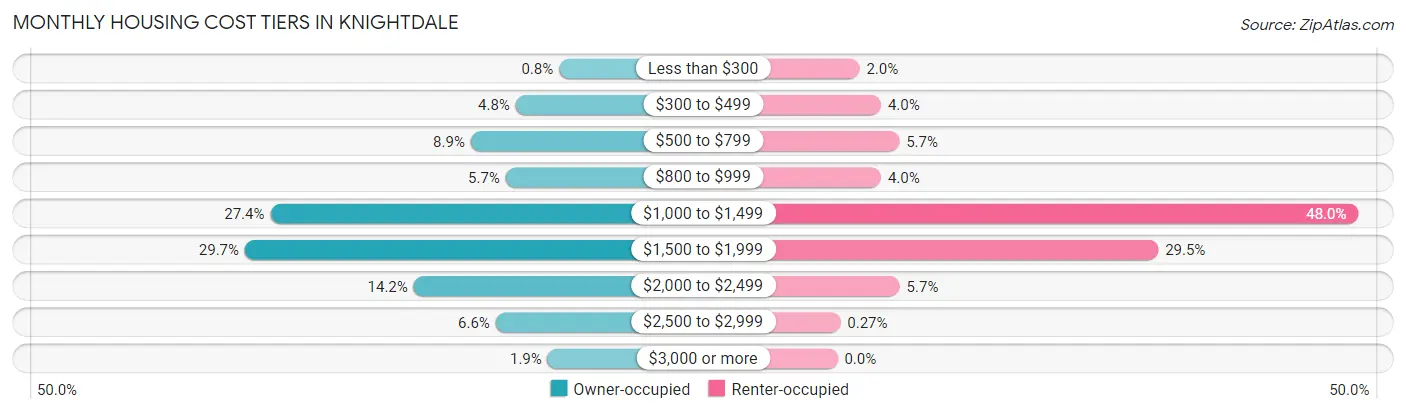
| Monthly Cost | Owner-occupied | Renter-occupied |
| Less than $300 | 39 (0.8%) | 52 (2.0%) |
| $300 to $499 | 233 (4.8%) | 103 (4.0%) |
| $500 to $799 | 435 (8.9%) | 146 (5.7%) |
| $800 to $999 | 278 (5.7%) | 103 (4.0%) |
| $1,000 to $1,499 | 1,333 (27.4%) | 1,231 (47.9%) |
| $1,500 to $1,999 | 1,447 (29.7%) | 758 (29.5%) |
| $2,000 to $2,499 | 691 (14.2%) | 147 (5.7%) |
| $2,500 to $2,999 | 323 (6.6%) | 7 (0.3%) |
| $3,000 or more | 90 (1.8%) | 0 (0.0%) |
| Total | 4,869 (100.0%) | 2,567 (100.0%) |
Physical Housing Characteristics in Knightdale
Housing Structures in Knightdale
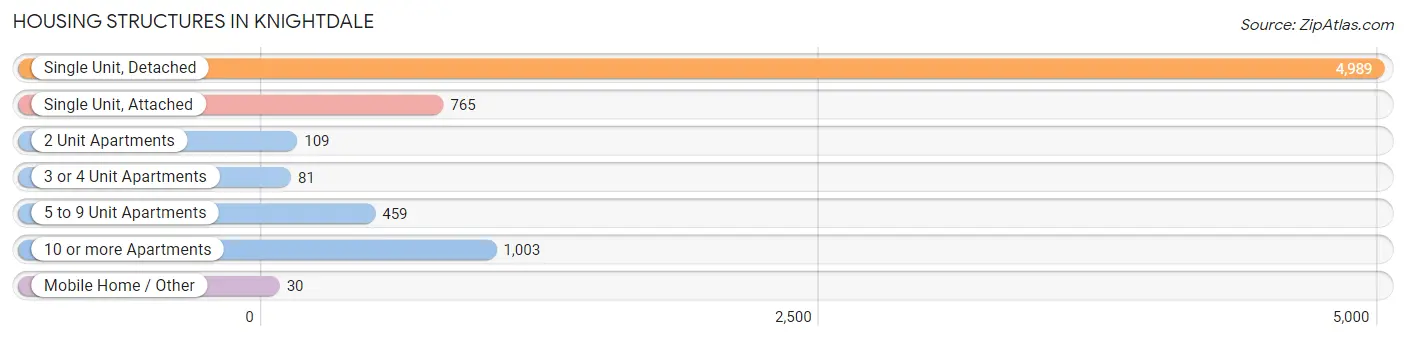
| Structure Type | # Housing Units | % Housing Units |
| Single Unit, Detached | 4,989 | 67.1% |
| Single Unit, Attached | 765 | 10.3% |
| 2 Unit Apartments | 109 | 1.5% |
| 3 or 4 Unit Apartments | 81 | 1.1% |
| 5 to 9 Unit Apartments | 459 | 6.2% |
| 10 or more Apartments | 1,003 | 13.5% |
| Mobile Home / Other | 30 | 0.4% |
| Total | 7,436 | 100.0% |
Housing Structures by Occupancy in Knightdale
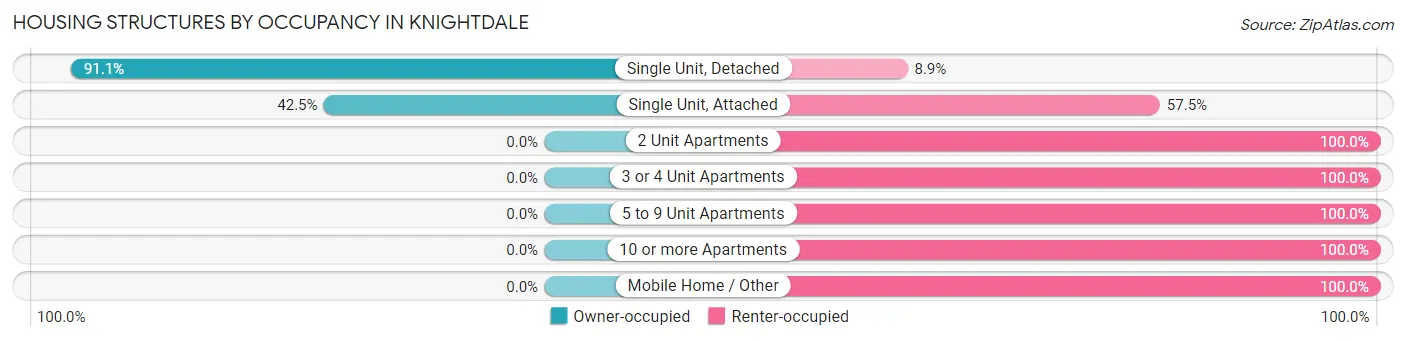
| Structure Type | Owner-occupied | Renter-occupied |
| Single Unit, Detached | 4,544 (91.1%) | 445 (8.9%) |
| Single Unit, Attached | 325 (42.5%) | 440 (57.5%) |
| 2 Unit Apartments | 0 (0.0%) | 109 (100.0%) |
| 3 or 4 Unit Apartments | 0 (0.0%) | 81 (100.0%) |
| 5 to 9 Unit Apartments | 0 (0.0%) | 459 (100.0%) |
| 10 or more Apartments | 0 (0.0%) | 1,003 (100.0%) |
| Mobile Home / Other | 0 (0.0%) | 30 (100.0%) |
| Total | 4,869 (65.5%) | 2,567 (34.5%) |
Housing Structures by Number of Rooms in Knightdale
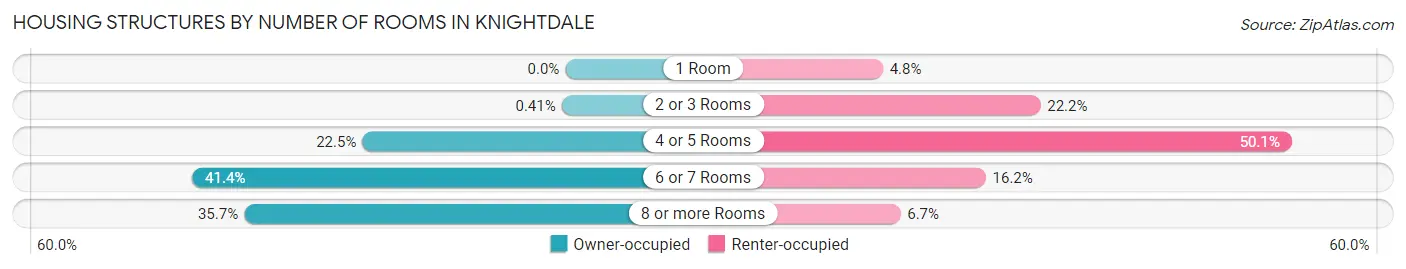
| Number of Rooms | Owner-occupied | Renter-occupied |
| 1 Room | 0 (0.0%) | 122 (4.8%) |
| 2 or 3 Rooms | 20 (0.4%) | 571 (22.2%) |
| 4 or 5 Rooms | 1,097 (22.5%) | 1,287 (50.1%) |
| 6 or 7 Rooms | 2,016 (41.4%) | 415 (16.2%) |
| 8 or more Rooms | 1,736 (35.6%) | 172 (6.7%) |
| Total | 4,869 (100.0%) | 2,567 (100.0%) |
Housing Structure by Heating Type in Knightdale
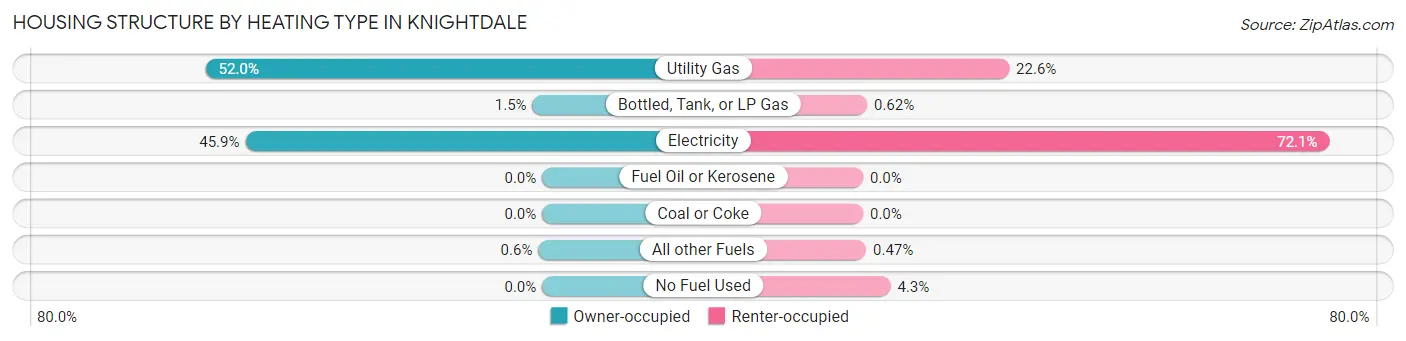
| Heating Type | Owner-occupied | Renter-occupied |
| Utility Gas | 2,533 (52.0%) | 580 (22.6%) |
| Bottled, Tank, or LP Gas | 73 (1.5%) | 16 (0.6%) |
| Electricity | 2,234 (45.9%) | 1,850 (72.1%) |
| Fuel Oil or Kerosene | 0 (0.0%) | 0 (0.0%) |
| Coal or Coke | 0 (0.0%) | 0 (0.0%) |
| All other Fuels | 29 (0.6%) | 12 (0.5%) |
| No Fuel Used | 0 (0.0%) | 109 (4.3%) |
| Total | 4,869 (100.0%) | 2,567 (100.0%) |
Household Vehicle Usage in Knightdale
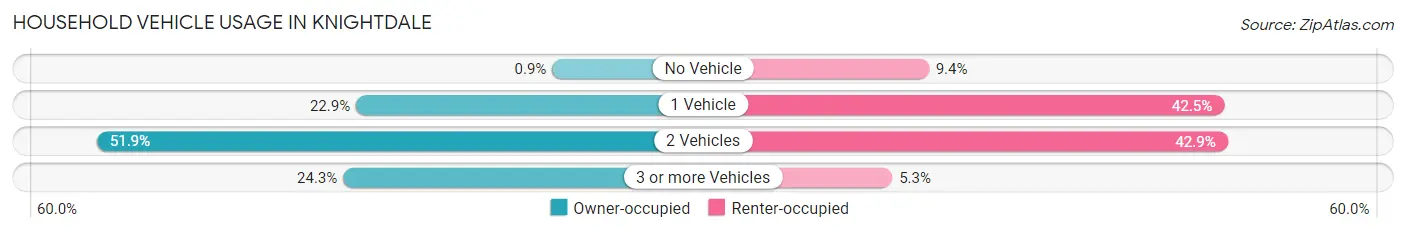
| Vehicles per Household | Owner-occupied | Renter-occupied |
| No Vehicle | 44 (0.9%) | 241 (9.4%) |
| 1 Vehicle | 1,114 (22.9%) | 1,090 (42.5%) |
| 2 Vehicles | 2,527 (51.9%) | 1,100 (42.8%) |
| 3 or more Vehicles | 1,184 (24.3%) | 136 (5.3%) |
| Total | 4,869 (100.0%) | 2,567 (100.0%) |
Real Estate & Mortgages in Knightdale
Real Estate and Mortgage Overview in Knightdale
| Characteristic | Without Mortgage | With Mortgage |
| Housing Units | 822 | 4,047 |
| Median Property Value | $288,700 | $308,900 |
| Median Household Income | $70,769 | $1,024 |
| Monthly Housing Costs | $604 | $90 |
| Real Estate Taxes | $2,531 | $5 |
Property Value by Mortgage Status in Knightdale
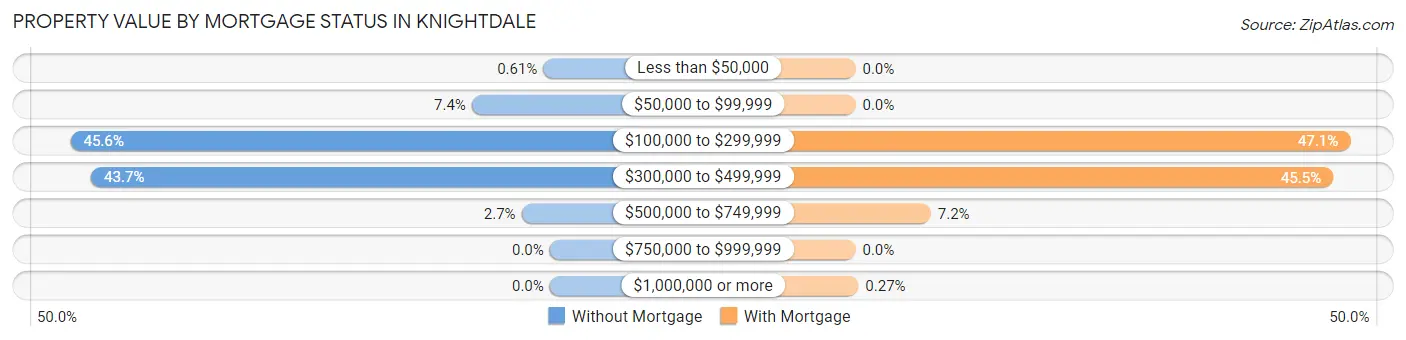
| Property Value | Without Mortgage | With Mortgage |
| Less than $50,000 | 5 (0.6%) | 0 (0.0%) |
| $50,000 to $99,999 | 61 (7.4%) | 0 (0.0%) |
| $100,000 to $299,999 | 375 (45.6%) | 1,906 (47.1%) |
| $300,000 to $499,999 | 359 (43.7%) | 1,840 (45.5%) |
| $500,000 to $749,999 | 22 (2.7%) | 290 (7.2%) |
| $750,000 to $999,999 | 0 (0.0%) | 0 (0.0%) |
| $1,000,000 or more | 0 (0.0%) | 11 (0.3%) |
| Total | 822 (100.0%) | 4,047 (100.0%) |
Household Income by Mortgage Status in Knightdale
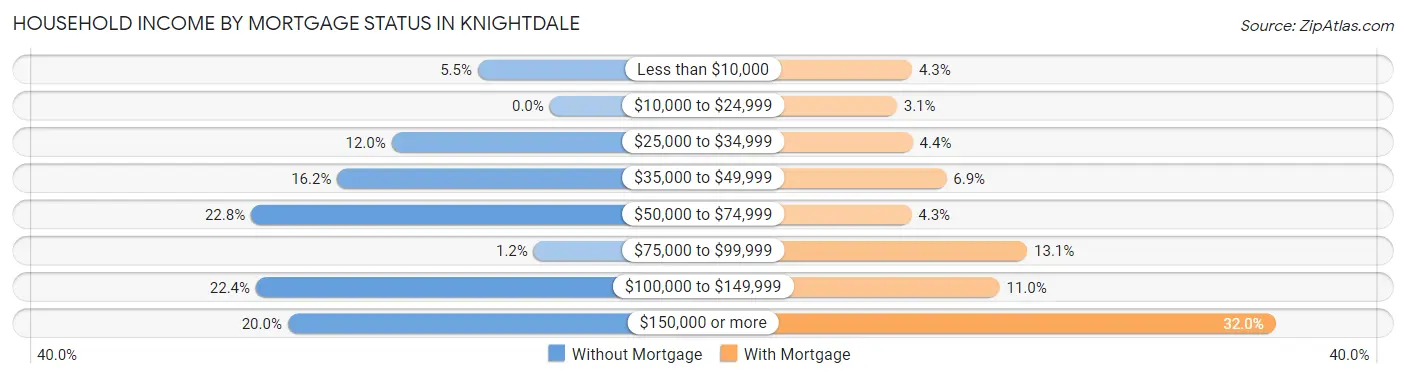
| Household Income | Without Mortgage | With Mortgage |
| Less than $10,000 | 45 (5.5%) | 174 (4.3%) |
| $10,000 to $24,999 | 0 (0.0%) | 127 (3.1%) |
| $25,000 to $34,999 | 99 (12.0%) | 176 (4.3%) |
| $35,000 to $49,999 | 133 (16.2%) | 280 (6.9%) |
| $50,000 to $74,999 | 187 (22.8%) | 172 (4.3%) |
| $75,000 to $99,999 | 10 (1.2%) | 529 (13.1%) |
| $100,000 to $149,999 | 184 (22.4%) | 444 (11.0%) |
| $150,000 or more | 164 (20.0%) | 1,295 (32.0%) |
| Total | 822 (100.0%) | 4,047 (100.0%) |
Property Value to Household Income Ratio in Knightdale
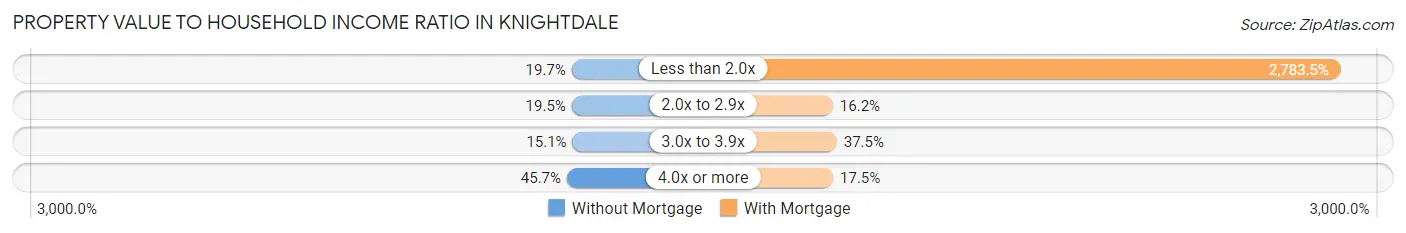
| Value-to-Income Ratio | Without Mortgage | With Mortgage |
| Less than 2.0x | 162 (19.7%) | 112,647 (2,783.5%) |
| 2.0x to 2.9x | 160 (19.5%) | 656 (16.2%) |
| 3.0x to 3.9x | 124 (15.1%) | 1,519 (37.5%) |
| 4.0x or more | 376 (45.7%) | 709 (17.5%) |
| Total | 822 (100.0%) | 4,047 (100.0%) |
Real Estate Taxes by Mortgage Status in Knightdale
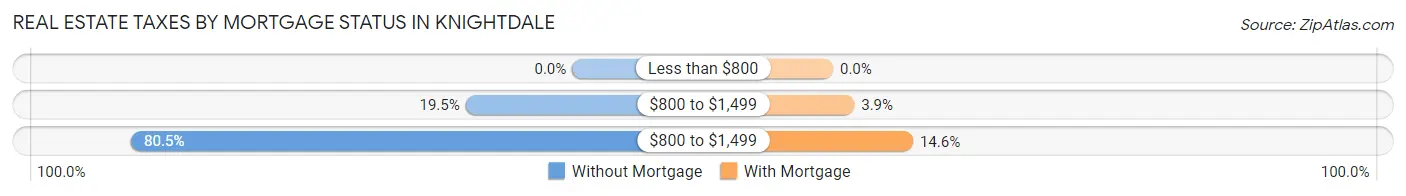
| Property Taxes | Without Mortgage | With Mortgage |
| Less than $800 | 0 (0.0%) | 0 (0.0%) |
| $800 to $1,499 | 160 (19.5%) | 157 (3.9%) |
| $800 to $1,499 | 662 (80.5%) | 591 (14.6%) |
| Total | 822 (100.0%) | 4,047 (100.0%) |
Health & Disability in Knightdale
Health Insurance Coverage by Age in Knightdale
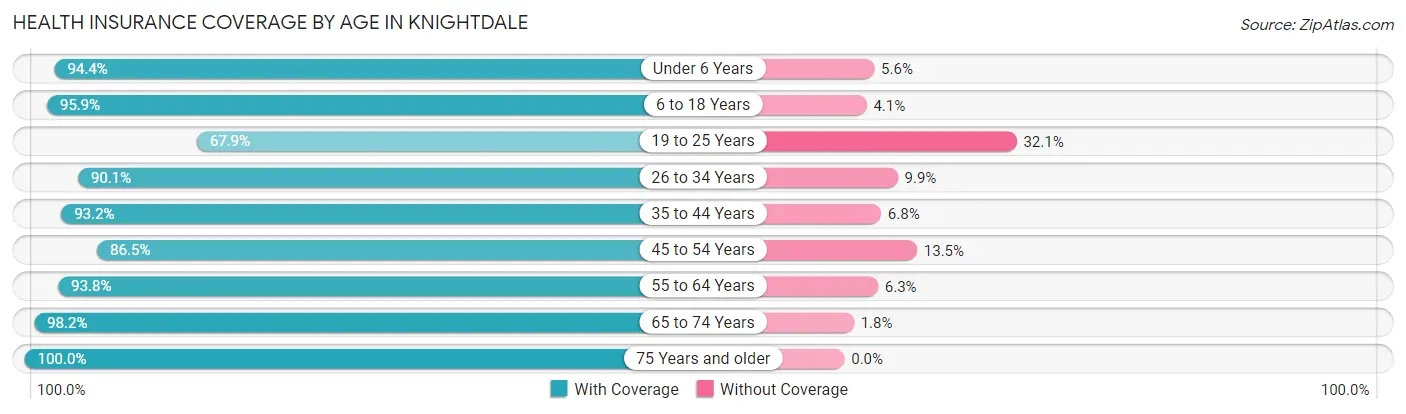
| Age Bracket | With Coverage | Without Coverage |
| Under 6 Years | 1,560 (94.4%) | 92 (5.6%) |
| 6 to 18 Years | 3,517 (95.9%) | 152 (4.1%) |
| 19 to 25 Years | 759 (67.9%) | 359 (32.1%) |
| 26 to 34 Years | 2,681 (90.1%) | 296 (9.9%) |
| 35 to 44 Years | 2,907 (93.2%) | 213 (6.8%) |
| 45 to 54 Years | 2,006 (86.5%) | 314 (13.5%) |
| 55 to 64 Years | 2,191 (93.8%) | 146 (6.2%) |
| 65 to 74 Years | 1,118 (98.2%) | 20 (1.8%) |
| 75 Years and older | 703 (100.0%) | 0 (0.0%) |
| Total | 17,442 (91.6%) | 1,592 (8.4%) |
Health Insurance Coverage by Citizenship Status in Knightdale
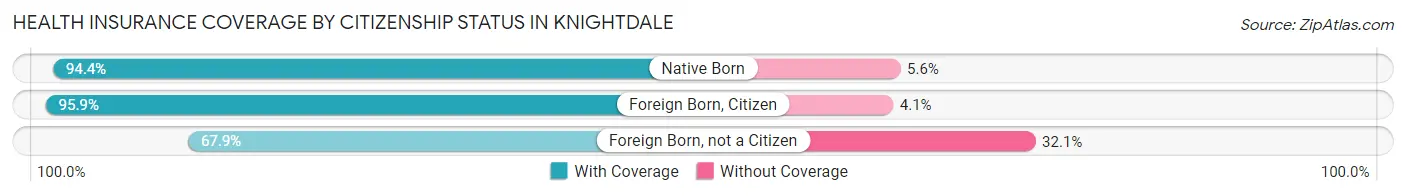
| Citizenship Status | With Coverage | Without Coverage |
| Native Born | 1,560 (94.4%) | 92 (5.6%) |
| Foreign Born, Citizen | 3,517 (95.9%) | 152 (4.1%) |
| Foreign Born, not a Citizen | 759 (67.9%) | 359 (32.1%) |
Health Insurance Coverage by Household Income in Knightdale
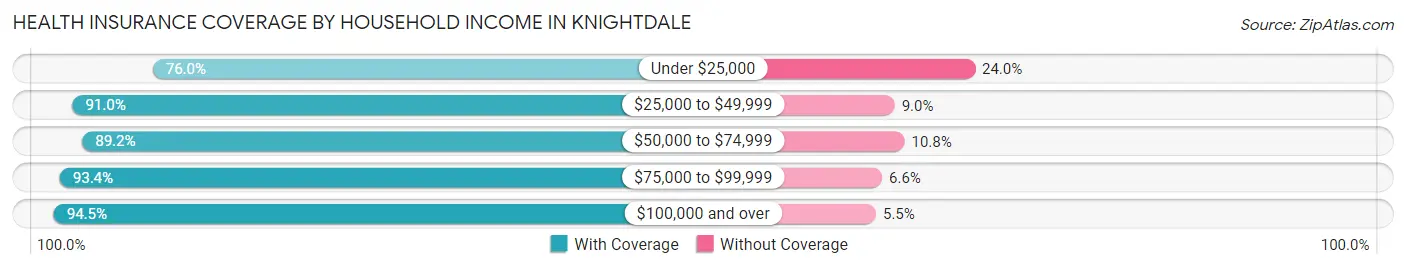
| Household Income | With Coverage | Without Coverage |
| Under $25,000 | 949 (76.0%) | 300 (24.0%) |
| $25,000 to $49,999 | 2,949 (91.0%) | 291 (9.0%) |
| $50,000 to $74,999 | 3,066 (89.2%) | 372 (10.8%) |
| $75,000 to $99,999 | 1,710 (93.4%) | 121 (6.6%) |
| $100,000 and over | 8,754 (94.5%) | 508 (5.5%) |
Public vs Private Health Insurance Coverage by Age in Knightdale
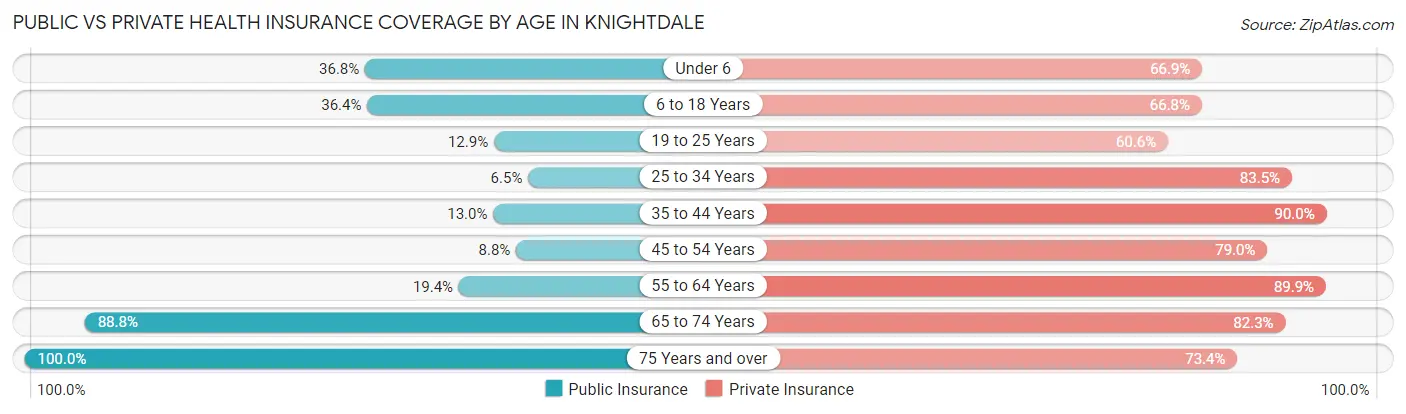
| Age Bracket | Public Insurance | Private Insurance |
| Under 6 | 608 (36.8%) | 1,105 (66.9%) |
| 6 to 18 Years | 1,335 (36.4%) | 2,452 (66.8%) |
| 19 to 25 Years | 144 (12.9%) | 677 (60.6%) |
| 25 to 34 Years | 194 (6.5%) | 2,487 (83.5%) |
| 35 to 44 Years | 406 (13.0%) | 2,807 (90.0%) |
| 45 to 54 Years | 203 (8.7%) | 1,832 (79.0%) |
| 55 to 64 Years | 453 (19.4%) | 2,100 (89.9%) |
| 65 to 74 Years | 1,011 (88.8%) | 937 (82.3%) |
| 75 Years and over | 703 (100.0%) | 516 (73.4%) |
| Total | 5,057 (26.6%) | 14,913 (78.3%) |
Disability Status by Sex by Age in Knightdale
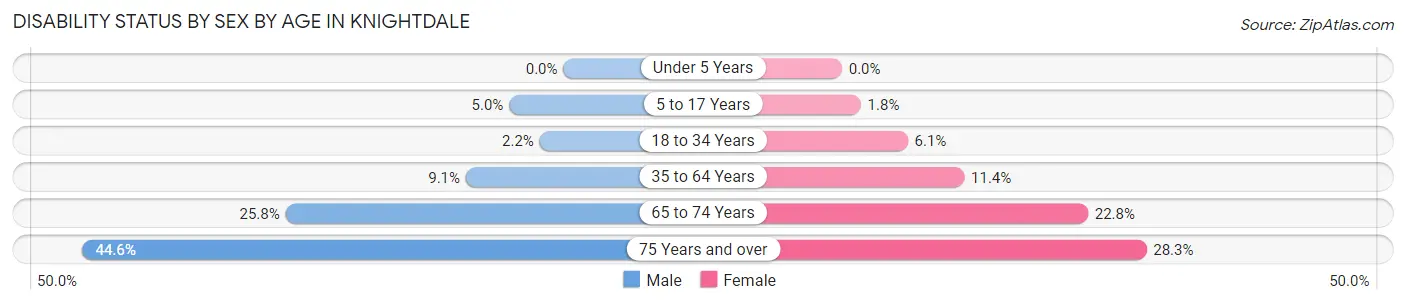
| Age Bracket | Male | Female |
| Under 5 Years | 0 (0.0%) | 0 (0.0%) |
| 5 to 17 Years | 98 (5.0%) | 29 (1.8%) |
| 18 to 34 Years | 42 (2.2%) | 150 (6.1%) |
| 35 to 64 Years | 326 (9.0%) | 474 (11.4%) |
| 65 to 74 Years | 115 (25.8%) | 158 (22.8%) |
| 75 Years and over | 170 (44.6%) | 91 (28.3%) |
Disability Class by Sex by Age in Knightdale
Disability Class: Hearing Difficulty
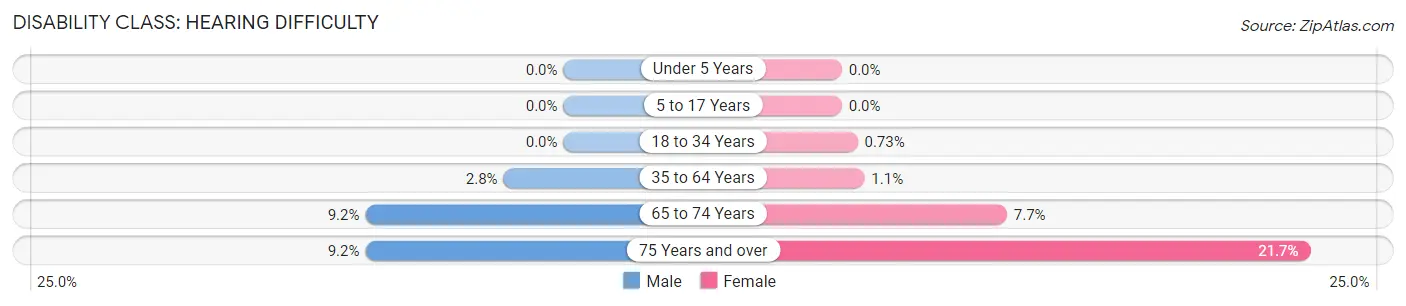
| Age Bracket | Male | Female |
| Under 5 Years | 0 (0.0%) | 0 (0.0%) |
| 5 to 17 Years | 0 (0.0%) | 0 (0.0%) |
| 18 to 34 Years | 0 (0.0%) | 18 (0.7%) |
| 35 to 64 Years | 100 (2.8%) | 44 (1.1%) |
| 65 to 74 Years | 41 (9.2%) | 53 (7.7%) |
| 75 Years and over | 35 (9.2%) | 70 (21.7%) |
Disability Class: Vision Difficulty
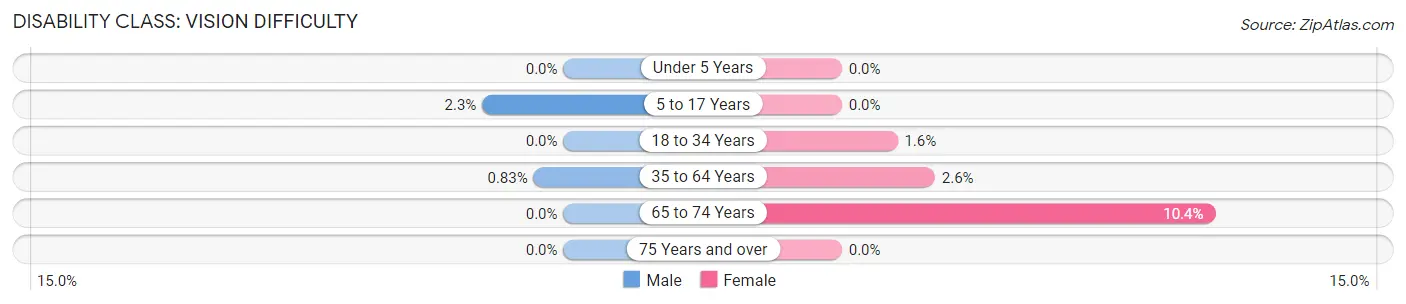
| Age Bracket | Male | Female |
| Under 5 Years | 0 (0.0%) | 0 (0.0%) |
| 5 to 17 Years | 44 (2.3%) | 0 (0.0%) |
| 18 to 34 Years | 0 (0.0%) | 38 (1.5%) |
| 35 to 64 Years | 30 (0.8%) | 108 (2.6%) |
| 65 to 74 Years | 0 (0.0%) | 72 (10.4%) |
| 75 Years and over | 0 (0.0%) | 0 (0.0%) |
Disability Class: Cognitive Difficulty
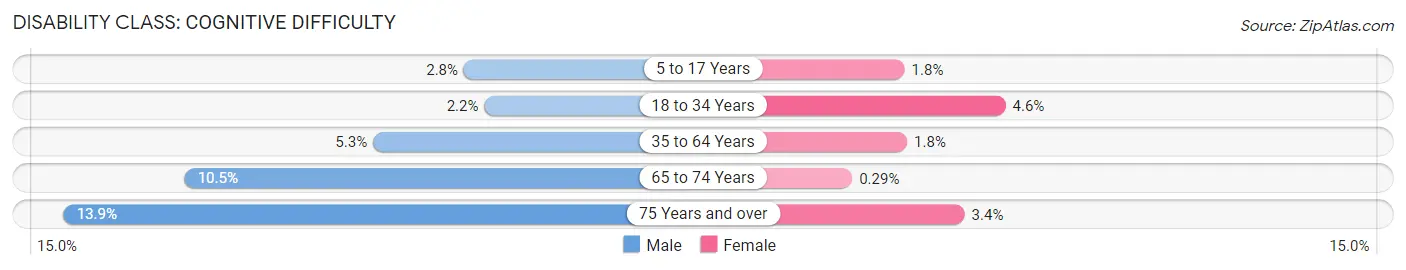
| Age Bracket | Male | Female |
| 5 to 17 Years | 54 (2.8%) | 29 (1.8%) |
| 18 to 34 Years | 42 (2.2%) | 112 (4.6%) |
| 35 to 64 Years | 191 (5.3%) | 76 (1.8%) |
| 65 to 74 Years | 47 (10.5%) | 2 (0.3%) |
| 75 Years and over | 53 (13.9%) | 11 (3.4%) |
Disability Class: Ambulatory Difficulty
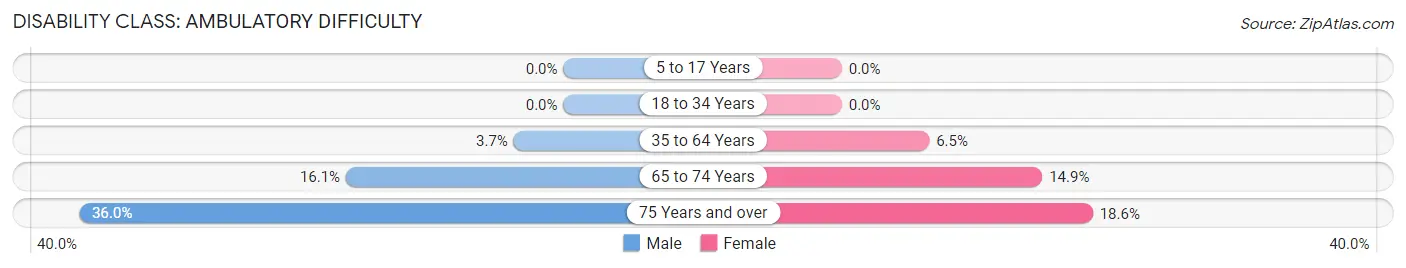
| Age Bracket | Male | Female |
| 5 to 17 Years | 0 (0.0%) | 0 (0.0%) |
| 18 to 34 Years | 0 (0.0%) | 0 (0.0%) |
| 35 to 64 Years | 133 (3.7%) | 271 (6.5%) |
| 65 to 74 Years | 72 (16.1%) | 103 (14.9%) |
| 75 Years and over | 137 (36.0%) | 60 (18.6%) |
Disability Class: Self-Care Difficulty
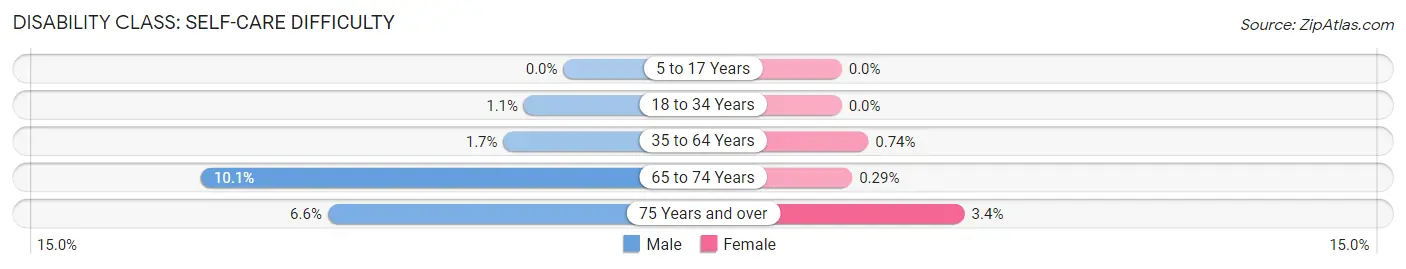
| Age Bracket | Male | Female |
| 5 to 17 Years | 0 (0.0%) | 0 (0.0%) |
| 18 to 34 Years | 21 (1.1%) | 0 (0.0%) |
| 35 to 64 Years | 60 (1.7%) | 31 (0.7%) |
| 65 to 74 Years | 45 (10.1%) | 2 (0.3%) |
| 75 Years and over | 25 (6.6%) | 11 (3.4%) |
Technology Access in Knightdale
Computing Device Access in Knightdale
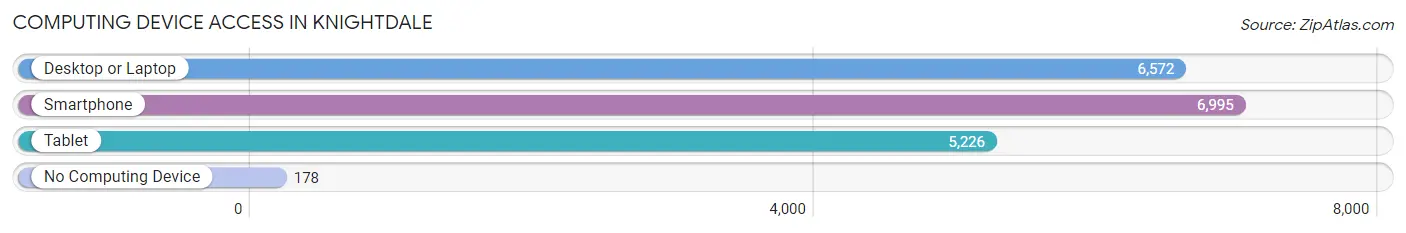
| Device Type | # Households | % Households |
| Desktop or Laptop | 6,572 | 88.4% |
| Smartphone | 6,995 | 94.1% |
| Tablet | 5,226 | 70.3% |
| No Computing Device | 178 | 2.4% |
| Total | 7,436 | 100.0% |
Internet Access in Knightdale
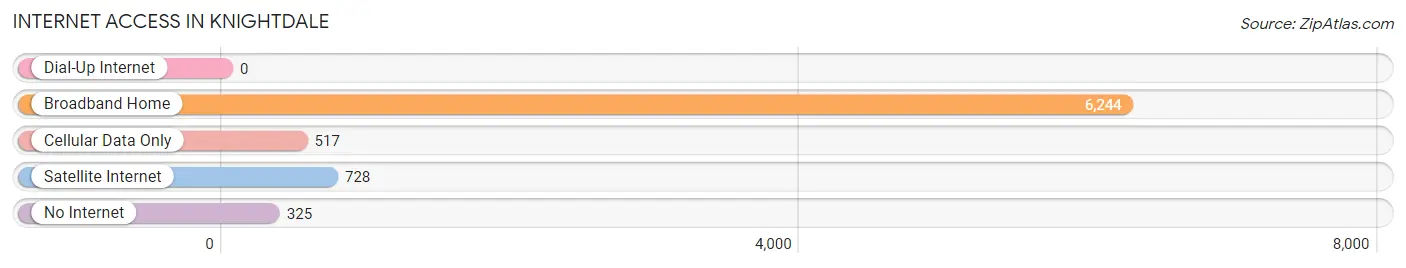
| Internet Type | # Households | % Households |
| Dial-Up Internet | 0 | 0.0% |
| Broadband Home | 6,244 | 84.0% |
| Cellular Data Only | 517 | 7.0% |
| Satellite Internet | 728 | 9.8% |
| No Internet | 325 | 4.4% |
| Total | 7,436 | 100.0% |
Knightdale Summary
Knightdale, NC is a small town located in Wake County, North Carolina. It is situated just east of Raleigh, the state capital, and is part of the Research Triangle metropolitan area. The town has a population of approximately 11,000 people and is known for its small-town charm and friendly atmosphere.
History
The area that is now Knightdale was first settled in the late 1700s by a group of Quakers from Pennsylvania. The town was originally known as “Knight’s Crossroads” after the family that owned the land. In 1891, the town was officially incorporated as Knightdale.
The town grew slowly over the years, but experienced a period of rapid growth in the 1950s and 1960s. This was due to the expansion of nearby Raleigh and the development of Research Triangle Park. The town’s population increased from just over 1,000 in 1950 to nearly 11,000 in 2000.
Geography
Knightdale is located in Wake County, North Carolina. It is situated just east of Raleigh, the state capital, and is part of the Research Triangle metropolitan area. The town is located in the Piedmont region of North Carolina, which is characterized by rolling hills and forests. The town is situated on the Neuse River, which provides a natural border between Knightdale and the neighboring town of Wendell.
The town covers an area of approximately 8.5 square miles and has an elevation of approximately 300 feet. The climate in Knightdale is humid subtropical, with hot, humid summers and mild winters.
Economy
Knightdale’s economy is largely based on the service industry. The town is home to several large employers, including WakeMed Health & Hospitals, Wake County Public Schools, and the North Carolina Department of Transportation. The town is also home to several small businesses, including restaurants, retail stores, and professional services.
The town is also home to several industrial parks, which provide employment opportunities for local residents. The town is served by the Raleigh-Durham International Airport, which is located just a few miles away.
Demographics
As of the 2010 census, the population of Knightdale was 11,401. The racial makeup of the town was 79.3% White, 14.2% African American, 0.4% Native American, 2.2% Asian, and 3.9% from other races. The median household income was $50,945, and the median family income was $60,945.
The town is served by the Wake County Public School System, which includes five elementary schools, two middle schools, and one high school. The town is also home to several private schools, including Knightdale Christian Academy and Knightdale Montessori School.
Conclusion
Knightdale, NC is a small town located in Wake County, North Carolina. It is situated just east of Raleigh, the state capital, and is part of the Research Triangle metropolitan area. The town has a population of approximately 11,000 people and is known for its small-town charm and friendly atmosphere. The town’s economy is largely based on the service industry, and the town is served by the Wake County Public School System. Knightdale is a great place to live, work, and raise a family.
Common Questions
What is Per Capita Income in Knightdale?
Per Capita income in Knightdale is $37,980.
What is the Median Family Income in Knightdale?
Median Family Income in Knightdale is $97,183.
What is the Median Household income in Knightdale?
Median Household Income in Knightdale is $79,364.
What is Income or Wage Gap in Knightdale?
Income or Wage Gap in Knightdale is 26.8%.
Women in Knightdale earn 73.2 cents for every dollar earned by a man.
What is Family Income Deficit in Knightdale?
Family Income Deficit in Knightdale is $11,437.
Families that are below poverty line in Knightdale earn $11,437 less on average than the poverty threshold level.
What is Inequality or Gini Index in Knightdale?
Inequality or Gini Index in Knightdale is 0.38.
What is the Total Population of Knightdale?
Total Population of Knightdale is 19,127.
What is the Total Male Population of Knightdale?
Total Male Population of Knightdale is 9,240.
What is the Total Female Population of Knightdale?
Total Female Population of Knightdale is 9,887.
What is the Ratio of Males per 100 Females in Knightdale?
There are 93.46 Males per 100 Females in Knightdale.
What is the Ratio of Females per 100 Males in Knightdale?
There are 107.00 Females per 100 Males in Knightdale.
What is the Median Population Age in Knightdale?
Median Population Age in Knightdale is 35.5 Years.
What is the Average Family Size in Knightdale
Average Family Size in Knightdale is 3.1 People.
What is the Average Household Size in Knightdale
Average Household Size in Knightdale is 2.6 People.
How Large is the Labor Force in Knightdale?
There are 11,278 People in the Labor Forcein in Knightdale.
What is the Percentage of People in the Labor Force in Knightdale?
77.0% of People are in the Labor Force in Knightdale.
What is the Unemployment Rate in Knightdale?
Unemployment Rate in Knightdale is 5.9%.