Overland Park, KS Map & Demographics
Overland Park Map
Overland Park Overview
$57,411
PER CAPITA INCOME
$131,868
AVG FAMILY INCOME
$100,876
AVG HOUSEHOLD INCOME
29.9%
WAGE / INCOME GAP [ % ]
70.1¢/ $1
WAGE / INCOME GAP [ $ ]
$10,185
FAMILY INCOME DEFICIT
0.44
INEQUALITY / GINI INDEX
196,676
TOTAL POPULATION
97,729
MALE POPULATION
98,947
FEMALE POPULATION
98.77
MALES / 100 FEMALES
101.25
FEMALES / 100 MALES
38.4
MEDIAN AGE
3.0
AVG FAMILY SIZE
2.4
AVG HOUSEHOLD SIZE
114,277
LABOR FORCE [ PEOPLE ]
71.8%
PERCENT IN LABOR FORCE
3.2%
UNEMPLOYMENT RATE
Overland Park Area Codes
Income in Overland Park
Income Overview in Overland Park
Per Capita Income in Overland Park is $57,411, while median incomes of families and households are $131,868 and $100,876 respectively.
| Characteristic | Number | Measure |
| Per Capita Income | 196,676 | $57,411 |
| Median Family Income | 50,672 | $131,868 |
| Mean Family Income | 50,672 | $167,687 |
| Median Household Income | 82,211 | $100,876 |
| Mean Household Income | 82,211 | $134,857 |
| Income Deficit | 50,672 | $10,185 |
| Wage / Income Gap (%) | 196,676 | 29.89% |
| Wage / Income Gap ($) | 196,676 | 70.11¢ per $1 |
| Gini / Inequality Index | 196,676 | 0.44 |
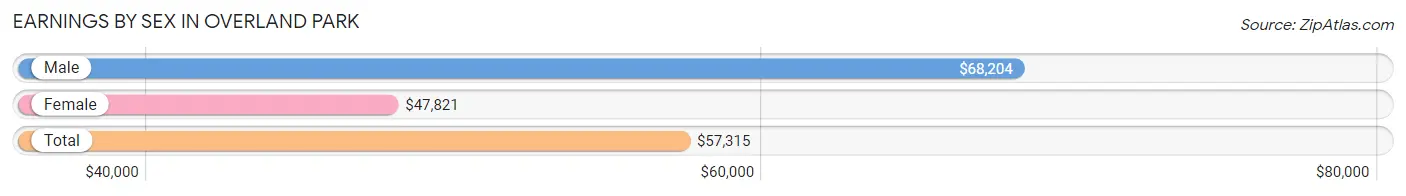
Earnings by Sex in Overland Park
Average Earnings in Overland Park are $57,315, $68,204 for men and $47,821 for women, a difference of 29.9%.
| Sex | Number | Average Earnings |
| Male | 63,660 (53.5%) | $68,204 |
| Female | 55,303 (46.5%) | $47,821 |
| Total | 118,963 (100.0%) | $57,315 |
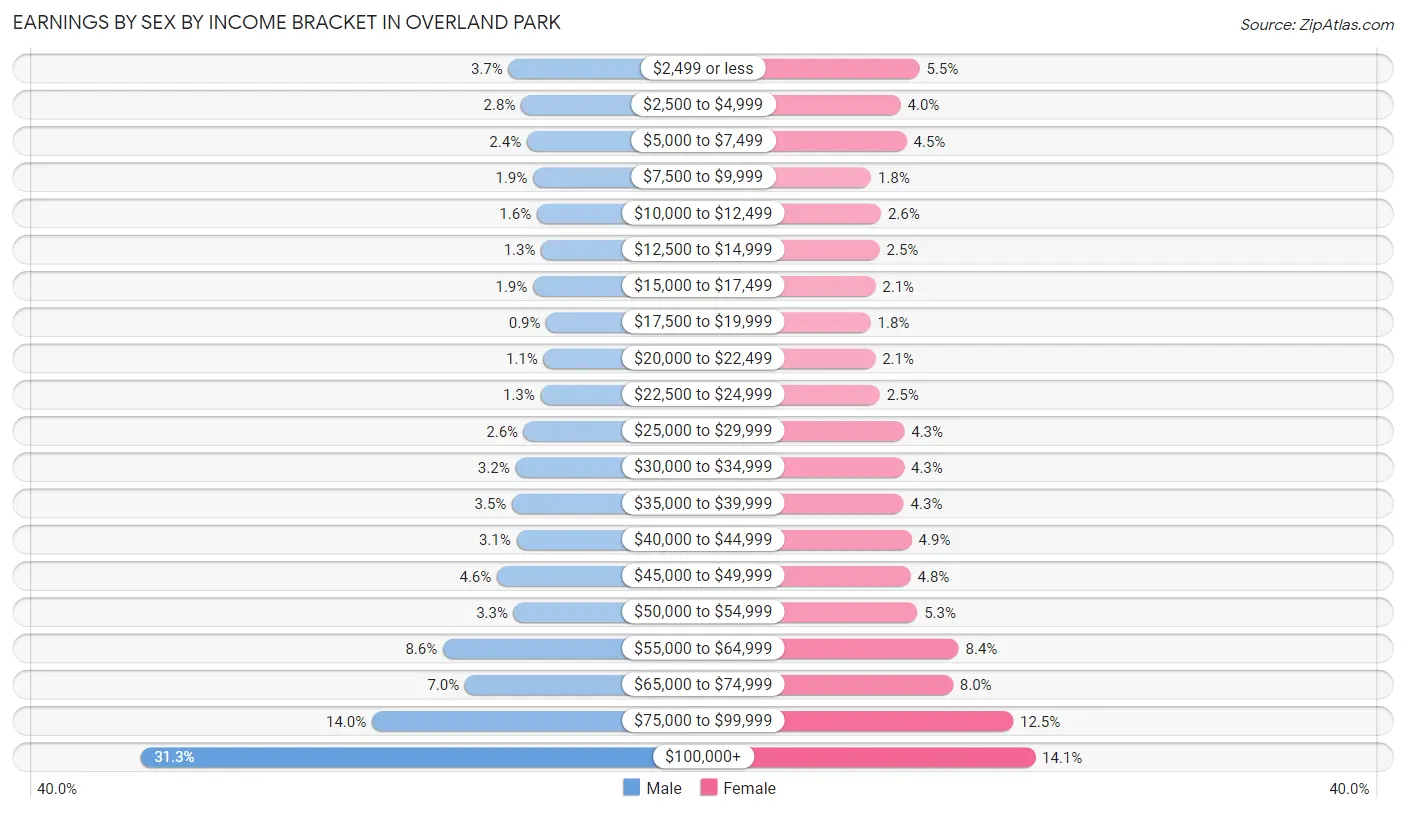
Earnings by Sex by Income Bracket in Overland Park
The most common earnings brackets in Overland Park are $100,000+ for men (19,902 | 31.3%) and $100,000+ for women (7,801 | 14.1%).
| Income | Male | Female |
| $2,499 or less | 2,376 (3.7%) | 3,013 (5.4%) |
| $2,500 to $4,999 | 1,767 (2.8%) | 2,231 (4.0%) |
| $5,000 to $7,499 | 1,497 (2.4%) | 2,475 (4.5%) |
| $7,500 to $9,999 | 1,202 (1.9%) | 1,003 (1.8%) |
| $10,000 to $12,499 | 1,017 (1.6%) | 1,413 (2.6%) |
| $12,500 to $14,999 | 812 (1.3%) | 1,360 (2.5%) |
| $15,000 to $17,499 | 1,201 (1.9%) | 1,185 (2.1%) |
| $17,500 to $19,999 | 572 (0.9%) | 990 (1.8%) |
| $20,000 to $22,499 | 709 (1.1%) | 1,177 (2.1%) |
| $22,500 to $24,999 | 845 (1.3%) | 1,374 (2.5%) |
| $25,000 to $29,999 | 1,642 (2.6%) | 2,383 (4.3%) |
| $30,000 to $34,999 | 2,043 (3.2%) | 2,373 (4.3%) |
| $35,000 to $39,999 | 2,202 (3.5%) | 2,356 (4.3%) |
| $40,000 to $44,999 | 1,993 (3.1%) | 2,688 (4.9%) |
| $45,000 to $49,999 | 2,921 (4.6%) | 2,646 (4.8%) |
| $50,000 to $54,999 | 2,124 (3.3%) | 2,918 (5.3%) |
| $55,000 to $64,999 | 5,499 (8.6%) | 4,635 (8.4%) |
| $65,000 to $74,999 | 4,447 (7.0%) | 4,394 (8.0%) |
| $75,000 to $99,999 | 8,889 (14.0%) | 6,888 (12.5%) |
| $100,000+ | 19,902 (31.3%) | 7,801 (14.1%) |
| Total | 63,660 (100.0%) | 55,303 (100.0%) |
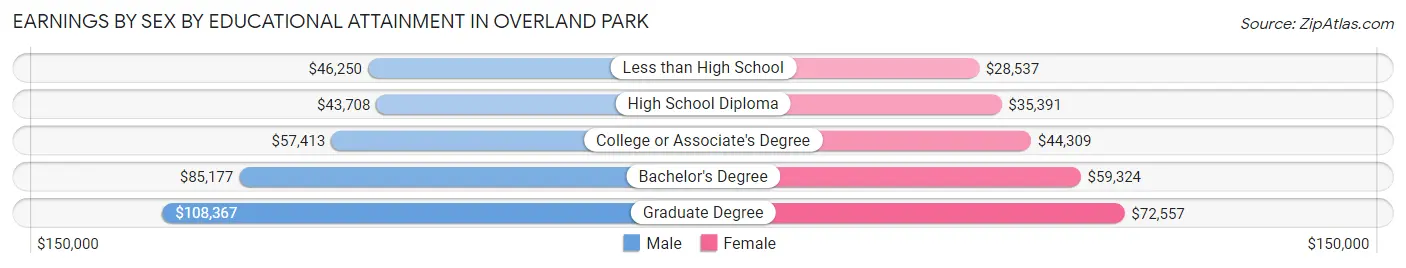
Earnings by Sex by Educational Attainment in Overland Park
Average earnings in Overland Park are $78,355 for men and $54,930 for women, a difference of 29.9%. Men with an educational attainment of graduate degree enjoy the highest average annual earnings of $108,367, while those with high school diploma education earn the least with $43,708. Women with an educational attainment of graduate degree earn the most with the average annual earnings of $72,557, while those with less than high school education have the smallest earnings of $28,537.
| Educational Attainment | Male Income | Female Income |
| Less than High School | $46,250 | $28,537 |
| High School Diploma | $43,708 | $35,391 |
| College or Associate's Degree | $57,413 | $44,309 |
| Bachelor's Degree | $85,177 | $59,324 |
| Graduate Degree | $108,367 | $72,557 |
| Total | $78,355 | $54,930 |
Family Income in Overland Park
Family Income Brackets in Overland Park
According to the Overland Park family income data, there are 13,529 families falling into the $200,000+ income range, which is the most common income bracket and makes up 26.7% of all families. Conversely, the $10,000 to $14,999 income bracket is the least frequent group with only 253 families (0.5%) belonging to this category.
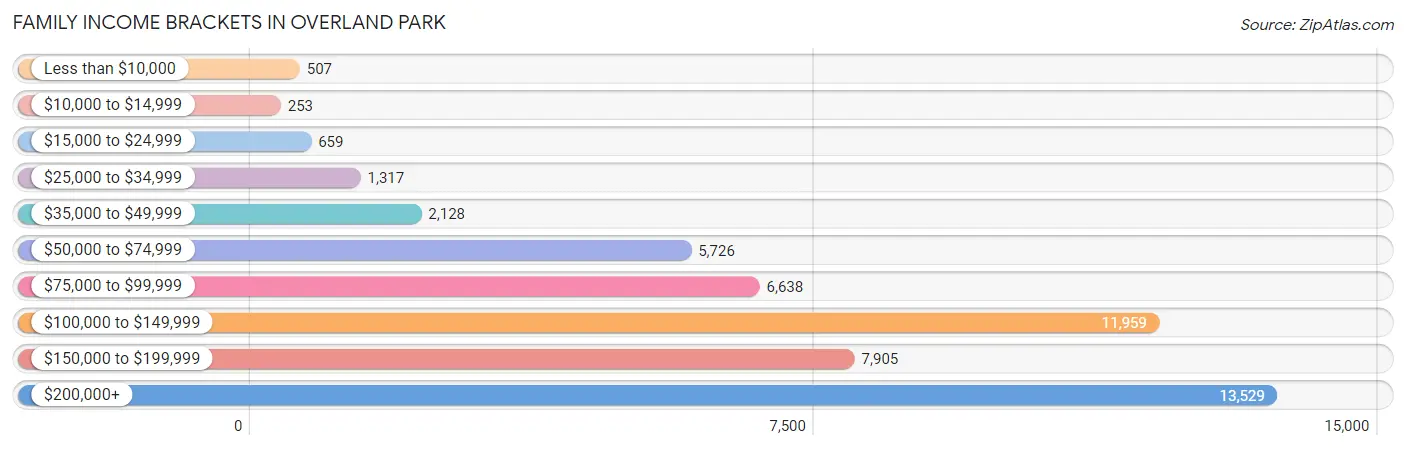
| Income Bracket | # Families | % Families |
| Less than $10,000 | 507 | 1.0% |
| $10,000 to $14,999 | 253 | 0.5% |
| $15,000 to $24,999 | 659 | 1.3% |
| $25,000 to $34,999 | 1,317 | 2.6% |
| $35,000 to $49,999 | 2,128 | 4.2% |
| $50,000 to $74,999 | 5,726 | 11.3% |
| $75,000 to $99,999 | 6,638 | 13.1% |
| $100,000 to $149,999 | 11,959 | 23.6% |
| $150,000 to $199,999 | 7,905 | 15.6% |
| $200,000+ | 13,529 | 26.7% |
Family Income by Famaliy Size in Overland Park
4-person families (9,779 | 19.3%) account for the highest median family income in Overland Park with $173,839 per family, while 2-person families (24,448 | 48.2%) have the highest median income of $53,990 per family member.
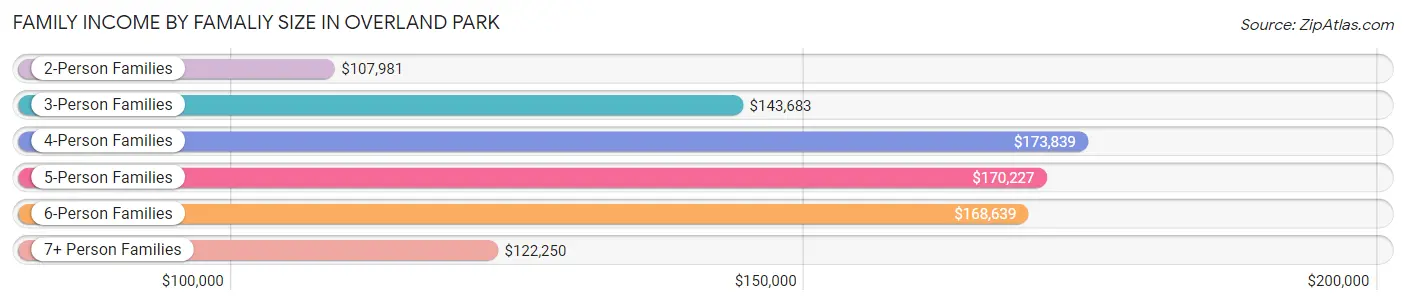
| Income Bracket | # Families | Median Income |
| 2-Person Families | 24,448 (48.2%) | $107,981 |
| 3-Person Families | 10,663 (21.0%) | $143,683 |
| 4-Person Families | 9,779 (19.3%) | $173,839 |
| 5-Person Families | 4,292 (8.5%) | $170,227 |
| 6-Person Families | 1,181 (2.3%) | $168,639 |
| 7+ Person Families | 309 (0.6%) | $122,250 |
| Total | 50,672 (100.0%) | $131,868 |
Family Income by Number of Earners in Overland Park
The median family income in Overland Park is $131,868, with families comprising 3+ earners (6,428) having the highest median family income of $185,674, while families with no earners (5,531) have the lowest median family income of $79,653, accounting for 12.7% and 10.9% of families, respectively.
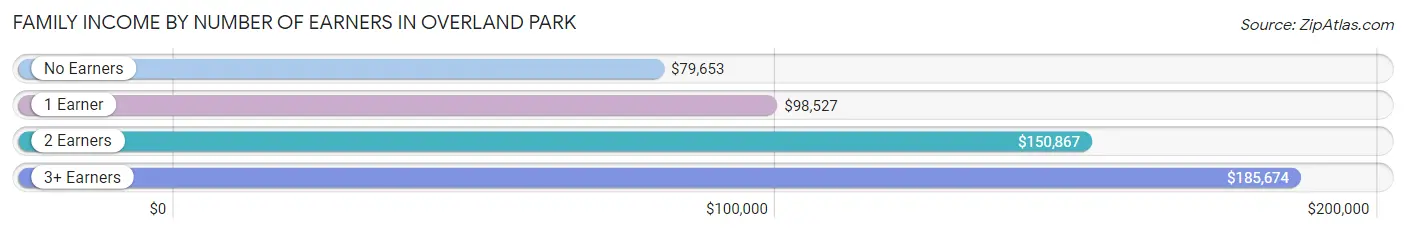
| Number of Earners | # Families | Median Income |
| No Earners | 5,531 (10.9%) | $79,653 |
| 1 Earner | 14,292 (28.2%) | $98,527 |
| 2 Earners | 24,421 (48.2%) | $150,867 |
| 3+ Earners | 6,428 (12.7%) | $185,674 |
| Total | 50,672 (100.0%) | $131,868 |
Household Income in Overland Park
Household Income Brackets in Overland Park
With 16,442 households falling in the category, the $100,000 to $149,999 income range is the most frequent in Overland Park, accounting for 20.0% of all households. In contrast, only 1,151 households (1.4%) fall into the $10,000 to $14,999 income bracket, making it the least populous group.
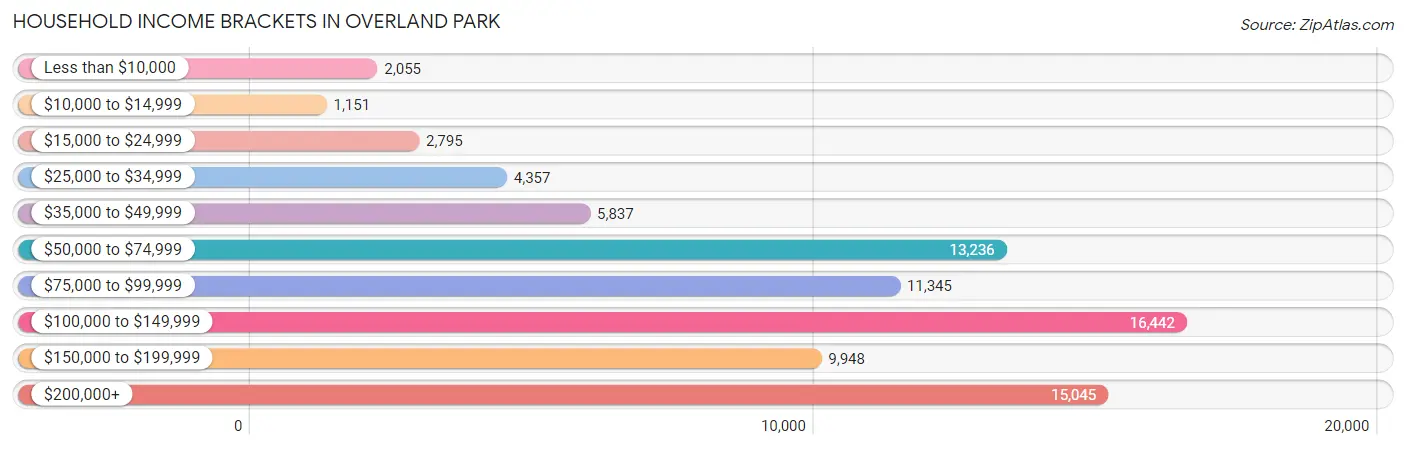
| Income Bracket | # Households | % Households |
| Less than $10,000 | 2,055 | 2.5% |
| $10,000 to $14,999 | 1,151 | 1.4% |
| $15,000 to $24,999 | 2,795 | 3.4% |
| $25,000 to $34,999 | 4,357 | 5.3% |
| $35,000 to $49,999 | 5,837 | 7.1% |
| $50,000 to $74,999 | 13,236 | 16.1% |
| $75,000 to $99,999 | 11,345 | 13.8% |
| $100,000 to $149,999 | 16,442 | 20.0% |
| $150,000 to $199,999 | 9,948 | 12.1% |
| $200,000+ | 15,045 | 18.3% |
Household Income by Householder Age in Overland Park
The median household income in Overland Park is $100,876, with the highest median household income of $129,922 found in the 45 to 64 years age bracket for the primary householder. A total of 28,847 households (35.1%) fall into this category. Meanwhile, the 15 to 24 years age bracket for the primary householder has the lowest median household income of $60,808, with 3,716 households (4.5%) in this group.
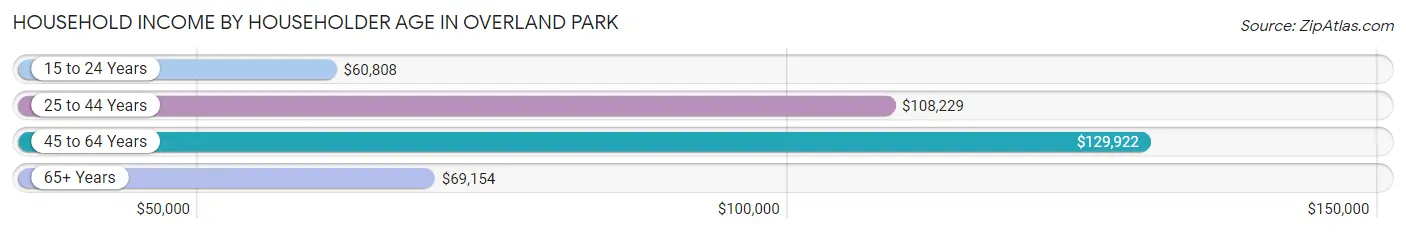
| Income Bracket | # Households | Median Income |
| 15 to 24 Years | 3,716 (4.5%) | $60,808 |
| 25 to 44 Years | 29,421 (35.8%) | $108,229 |
| 45 to 64 Years | 28,847 (35.1%) | $129,922 |
| 65+ Years | 20,227 (24.6%) | $69,154 |
| Total | 82,211 (100.0%) | $100,876 |
Poverty in Overland Park
Income Below Poverty by Sex and Age in Overland Park
With 3.5% poverty level for males and 4.9% for females among the residents of Overland Park, 18 to 24 year old males and 18 to 24 year old females are the most vulnerable to poverty, with 621 males (7.0%) and 1,050 females (12.8%) in their respective age groups living below the poverty level.
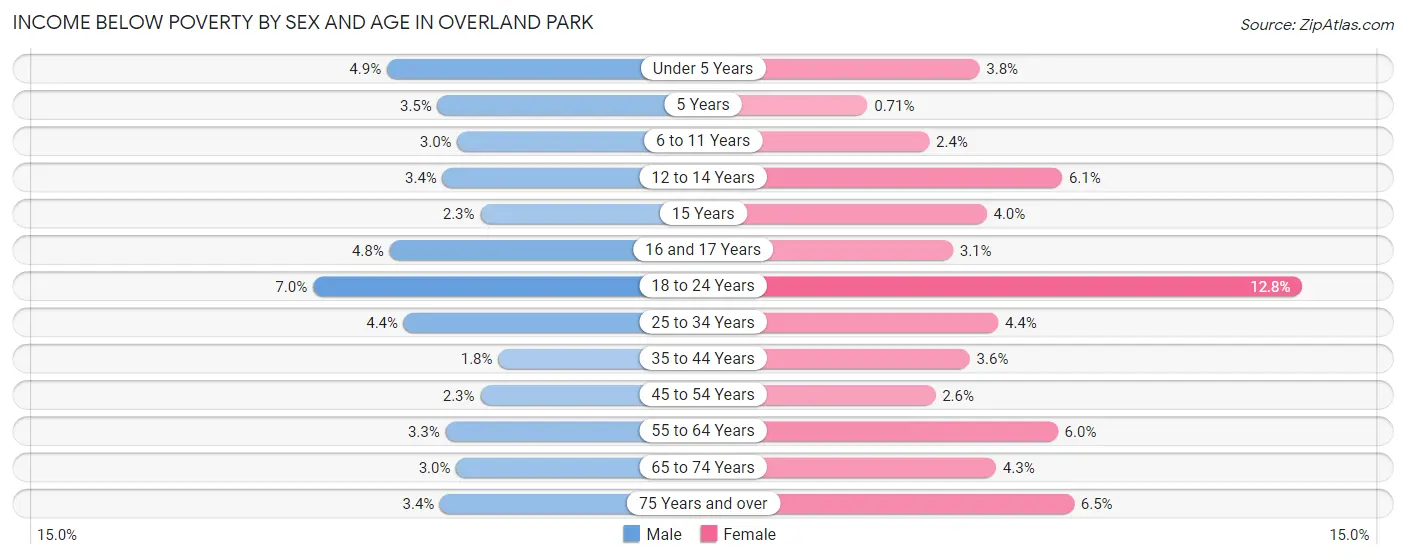
| Age Bracket | Male | Female |
| Under 5 Years | 275 (4.9%) | 209 (3.8%) |
| 5 Years | 42 (3.5%) | 7 (0.7%) |
| 6 to 11 Years | 203 (2.9%) | 159 (2.4%) |
| 12 to 14 Years | 136 (3.4%) | 245 (6.1%) |
| 15 Years | 33 (2.3%) | 43 (4.0%) |
| 16 and 17 Years | 134 (4.8%) | 94 (3.1%) |
| 18 to 24 Years | 621 (7.0%) | 1,050 (12.8%) |
| 25 to 34 Years | 658 (4.4%) | 576 (4.3%) |
| 35 to 44 Years | 250 (1.8%) | 481 (3.6%) |
| 45 to 54 Years | 283 (2.3%) | 319 (2.6%) |
| 55 to 64 Years | 388 (3.3%) | 757 (6.0%) |
| 65 to 74 Years | 254 (3.0%) | 418 (4.3%) |
| 75 Years and over | 175 (3.4%) | 485 (6.5%) |
| Total | 3,452 (3.5%) | 4,843 (4.9%) |
Income Above Poverty by Sex and Age in Overland Park
According to the poverty statistics in Overland Park, males aged 35 to 44 years and females aged 5 years are the age groups that are most secure financially, with 98.2% of males and 99.3% of females in these age groups living above the poverty line.
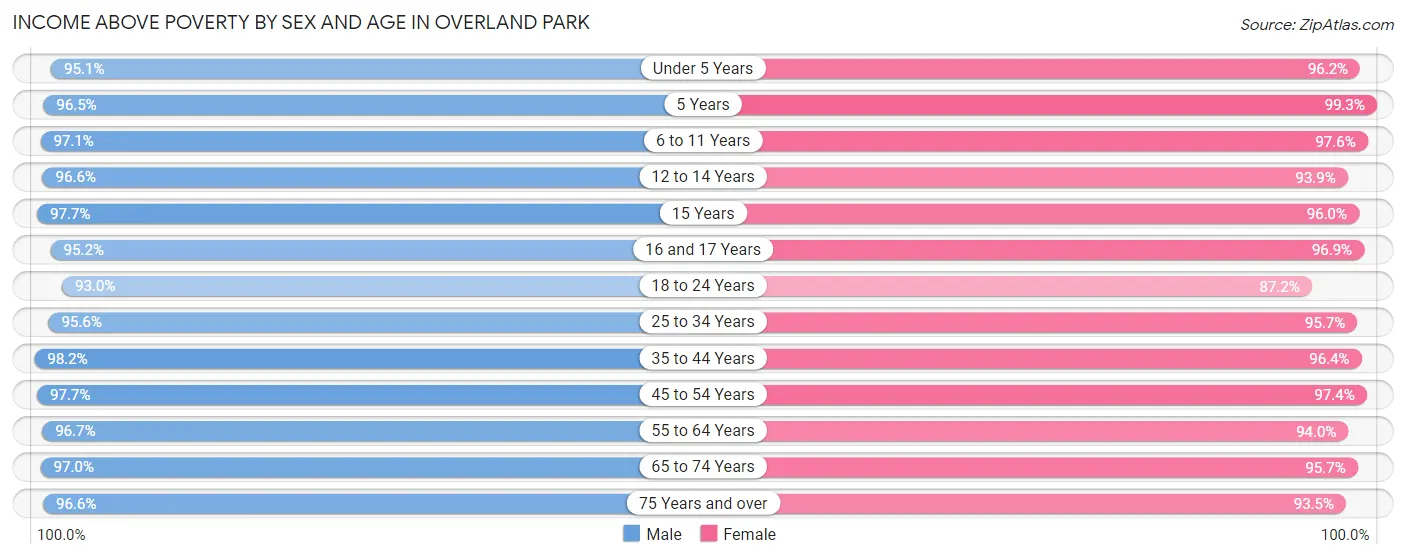
| Age Bracket | Male | Female |
| Under 5 Years | 5,328 (95.1%) | 5,242 (96.2%) |
| 5 Years | 1,159 (96.5%) | 975 (99.3%) |
| 6 to 11 Years | 6,686 (97.1%) | 6,375 (97.6%) |
| 12 to 14 Years | 3,909 (96.6%) | 3,753 (93.9%) |
| 15 Years | 1,395 (97.7%) | 1,024 (96.0%) |
| 16 and 17 Years | 2,634 (95.2%) | 2,945 (96.9%) |
| 18 to 24 Years | 8,288 (93.0%) | 7,139 (87.2%) |
| 25 to 34 Years | 14,163 (95.6%) | 12,652 (95.7%) |
| 35 to 44 Years | 13,542 (98.2%) | 13,017 (96.4%) |
| 45 to 54 Years | 11,968 (97.7%) | 11,967 (97.4%) |
| 55 to 64 Years | 11,433 (96.7%) | 11,840 (94.0%) |
| 65 to 74 Years | 8,263 (97.0%) | 9,321 (95.7%) |
| 75 Years and over | 4,926 (96.6%) | 7,026 (93.5%) |
| Total | 93,694 (96.5%) | 93,276 (95.1%) |
Income Below Poverty Among Married-Couple Families in Overland Park
The poverty statistics for married-couple families in Overland Park show that 1.2% or 485 of the total 41,792 families live below the poverty line. Families with 3 or 4 children have the highest poverty rate of 3.1%, comprising of 103 families. On the other hand, families with 5 or more children have the lowest poverty rate of 0.0%, which includes 0 families.
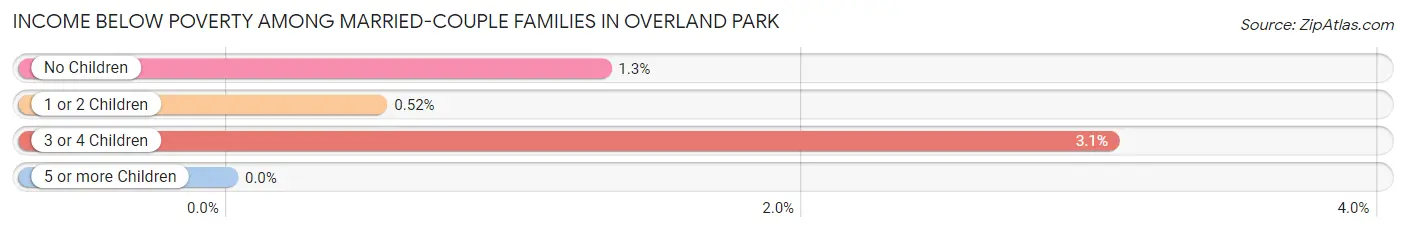
| Children | Above Poverty | Below Poverty |
| No Children | 23,220 (98.7%) | 305 (1.3%) |
| 1 or 2 Children | 14,645 (99.5%) | 77 (0.5%) |
| 3 or 4 Children | 3,247 (96.9%) | 103 (3.1%) |
| 5 or more Children | 195 (100.0%) | 0 (0.0%) |
| Total | 41,307 (98.8%) | 485 (1.2%) |
Income Below Poverty Among Single-Parent Households in Overland Park
According to the poverty data in Overland Park, 6.1% or 161 single-father households and 9.0% or 563 single-mother households are living below the poverty line. Among single-father households, those with 3 or 4 children have the highest poverty rate, with 73 households (29.1%) experiencing poverty. Likewise, among single-mother households, those with 3 or 4 children have the highest poverty rate, with 114 households (20.4%) falling below the poverty line.
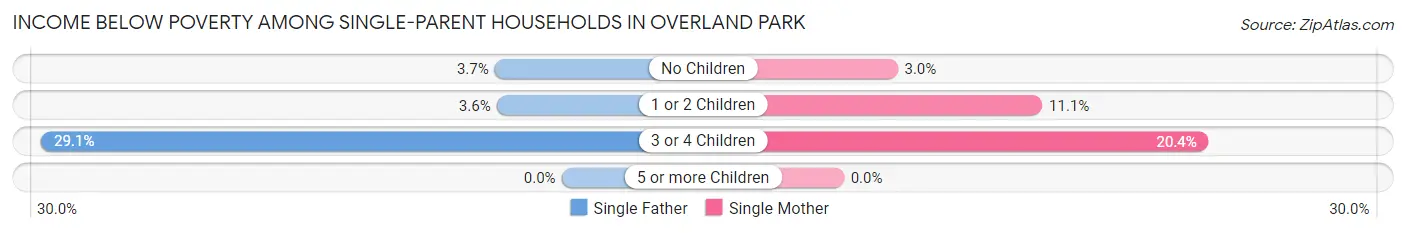
| Children | Single Father | Single Mother |
| No Children | 37 (3.7%) | 67 (3.0%) |
| 1 or 2 Children | 51 (3.6%) | 382 (11.1%) |
| 3 or 4 Children | 73 (29.1%) | 114 (20.4%) |
| 5 or more Children | 0 (0.0%) | 0 (0.0%) |
| Total | 161 (6.1%) | 563 (9.0%) |
Income Below Poverty Among Married-Couple vs Single-Parent Households in Overland Park
The poverty data for Overland Park shows that 485 of the married-couple family households (1.2%) and 724 of the single-parent households (8.2%) are living below the poverty level. Within the married-couple family households, those with 3 or 4 children have the highest poverty rate, with 103 households (3.1%) falling below the poverty line. Among the single-parent households, those with 3 or 4 children have the highest poverty rate, with 187 household (23.1%) living below poverty.
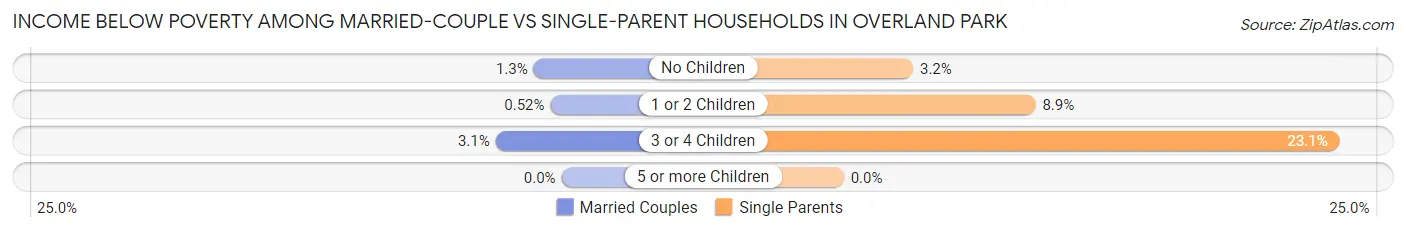
| Children | Married-Couple Families | Single-Parent Households |
| No Children | 305 (1.3%) | 104 (3.2%) |
| 1 or 2 Children | 77 (0.5%) | 433 (8.9%) |
| 3 or 4 Children | 103 (3.1%) | 187 (23.1%) |
| 5 or more Children | 0 (0.0%) | 0 (0.0%) |
| Total | 485 (1.2%) | 724 (8.2%) |
Race in Overland Park
The most populous races in Overland Park are White / Caucasian (155,228 | 78.9%), Asian (17,774 | 9.0%), and Hispanic or Latino (13,784 | 7.0%).
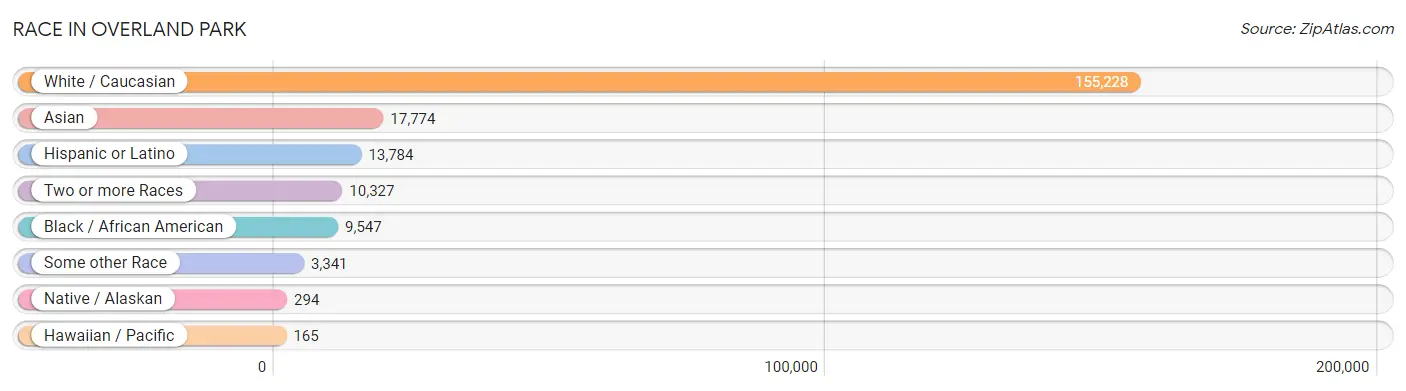
| Race | # Population | % Population |
| Asian | 17,774 | 9.0% |
| Black / African American | 9,547 | 4.9% |
| Hawaiian / Pacific | 165 | 0.1% |
| Hispanic or Latino | 13,784 | 7.0% |
| Native / Alaskan | 294 | 0.2% |
| White / Caucasian | 155,228 | 78.9% |
| Two or more Races | 10,327 | 5.2% |
| Some other Race | 3,341 | 1.7% |
| Total | 196,676 | 100.0% |
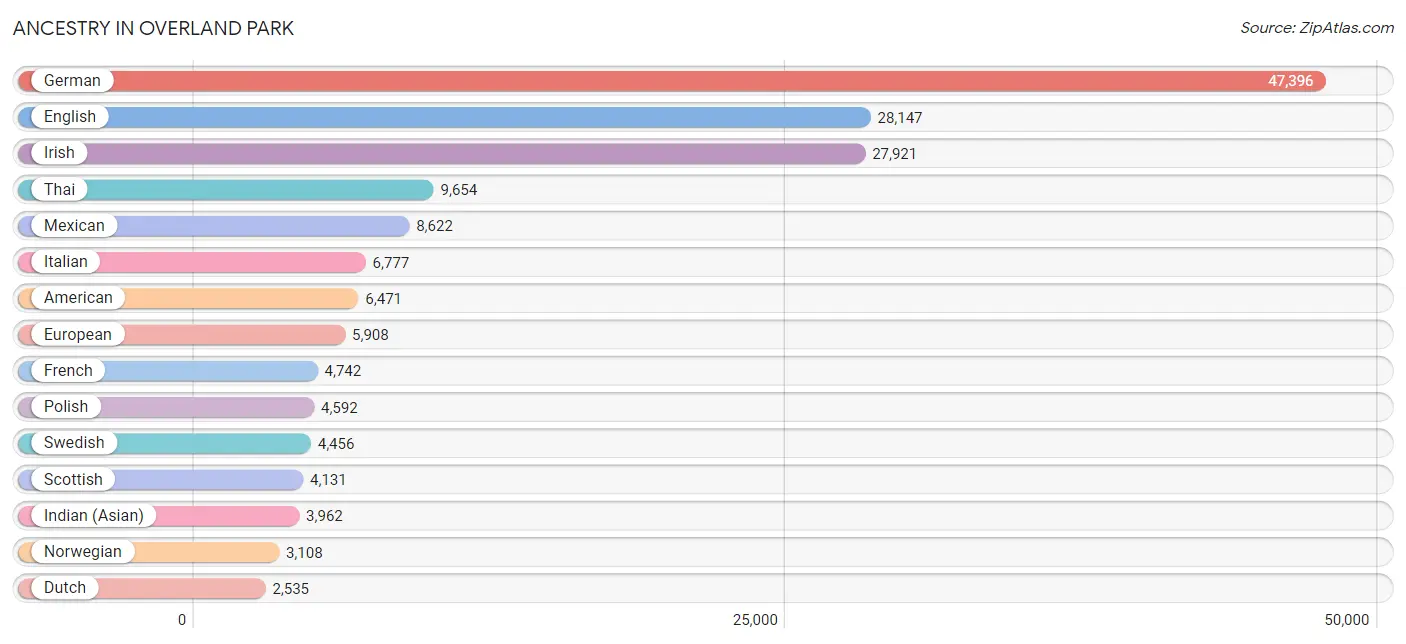
Ancestry in Overland Park
The most populous ancestries reported in Overland Park are German (47,396 | 24.1%), English (28,147 | 14.3%), Irish (27,921 | 14.2%), Thai (9,654 | 4.9%), and Mexican (8,622 | 4.4%), together accounting for 61.9% of all Overland Park residents.
| Ancestry | # Population | % Population |
| Afghan | 198 | 0.1% |
| African | 612 | 0.3% |
| Albanian | 60 | 0.0% |
| Alsatian | 7 | 0.0% |
| American | 6,471 | 3.3% |
| Arab | 1,350 | 0.7% |
| Argentinean | 114 | 0.1% |
| Armenian | 83 | 0.0% |
| Australian | 44 | 0.0% |
| Austrian | 605 | 0.3% |
| Bangladeshi | 31 | 0.0% |
| Belgian | 338 | 0.2% |
| Bhutanese | 700 | 0.4% |
| Blackfeet | 235 | 0.1% |
| Brazilian | 209 | 0.1% |
| British | 1,724 | 0.9% |
| Bulgarian | 25 | 0.0% |
| Burmese | 1,404 | 0.7% |
| Cajun | 53 | 0.0% |
| Canadian | 268 | 0.1% |
| Celtic | 122 | 0.1% |
| Central American | 1,604 | 0.8% |
| Central American Indian | 30 | 0.0% |
| Cherokee | 574 | 0.3% |
| Chickasaw | 25 | 0.0% |
| Chilean | 6 | 0.0% |
| Chippewa | 138 | 0.1% |
| Choctaw | 39 | 0.0% |
| Colombian | 409 | 0.2% |
| Comanche | 70 | 0.0% |
| Creek | 68 | 0.0% |
| Croatian | 687 | 0.4% |
| Cuban | 293 | 0.2% |
| Czech | 1,329 | 0.7% |
| Czechoslovakian | 176 | 0.1% |
| Danish | 1,458 | 0.7% |
| Delaware | 42 | 0.0% |
| Dominican | 186 | 0.1% |
| Dutch | 2,535 | 1.3% |
| Eastern European | 663 | 0.3% |
| Ecuadorian | 148 | 0.1% |
| Egyptian | 126 | 0.1% |
| English | 28,147 | 14.3% |
| Ethiopian | 126 | 0.1% |
| European | 5,908 | 3.0% |
| Fijian | 7 | 0.0% |
| Filipino | 296 | 0.2% |
| Finnish | 213 | 0.1% |
| French | 4,742 | 2.4% |
| French Canadian | 513 | 0.3% |
| German | 47,396 | 24.1% |
| German Russian | 88 | 0.0% |
| Greek | 393 | 0.2% |
| Guamanian / Chamorro | 132 | 0.1% |
| Guatemalan | 907 | 0.5% |
| Haitian | 127 | 0.1% |
| Honduran | 238 | 0.1% |
| Hungarian | 358 | 0.2% |
| Icelander | 38 | 0.0% |
| Indian (Asian) | 3,962 | 2.0% |
| Indonesian | 153 | 0.1% |
| Iranian | 560 | 0.3% |
| Iraqi | 86 | 0.0% |
| Irish | 27,921 | 14.2% |
| Israeli | 77 | 0.0% |
| Italian | 6,777 | 3.5% |
| Jamaican | 125 | 0.1% |
| Japanese | 45 | 0.0% |
| Jordanian | 453 | 0.2% |
| Kenyan | 589 | 0.3% |
| Kiowa | 11 | 0.0% |
| Korean | 1,037 | 0.5% |
| Laotian | 101 | 0.1% |
| Lebanese | 221 | 0.1% |
| Liberian | 3 | 0.0% |
| Lithuanian | 327 | 0.2% |
| Luxembourger | 54 | 0.0% |
| Malaysian | 71 | 0.0% |
| Mexican | 8,622 | 4.4% |
| Mexican American Indian | 24 | 0.0% |
| Mongolian | 94 | 0.1% |
| Native Hawaiian | 82 | 0.0% |
| Navajo | 28 | 0.0% |
| Nigerian | 77 | 0.0% |
| Northern European | 435 | 0.2% |
| Norwegian | 3,108 | 1.6% |
| Okinawan | 36 | 0.0% |
| Pakistani | 247 | 0.1% |
| Palestinian | 170 | 0.1% |
| Panamanian | 9 | 0.0% |
| Paraguayan | 20 | 0.0% |
| Pennsylvania German | 44 | 0.0% |
| Peruvian | 359 | 0.2% |
| Polish | 4,592 | 2.3% |
| Portuguese | 182 | 0.1% |
| Potawatomi | 54 | 0.0% |
| Pueblo | 7 | 0.0% |
| Puerto Rican | 486 | 0.3% |
| Romanian | 114 | 0.1% |
| Russian | 2,111 | 1.1% |
| Salvadoran | 450 | 0.2% |
| Samoan | 9 | 0.0% |
| Scandinavian | 803 | 0.4% |
| Scotch-Irish | 2,064 | 1.1% |
| Scottish | 4,131 | 2.1% |
| Seminole | 41 | 0.0% |
| Serbian | 70 | 0.0% |
| Sioux | 118 | 0.1% |
| Slavic | 42 | 0.0% |
| Slovak | 228 | 0.1% |
| Slovene | 102 | 0.1% |
| Somali | 67 | 0.0% |
| South African | 61 | 0.0% |
| South American | 1,301 | 0.7% |
| Spaniard | 634 | 0.3% |
| Spanish | 227 | 0.1% |
| Sri Lankan | 1,013 | 0.5% |
| Subsaharan African | 1,943 | 1.0% |
| Sudanese | 35 | 0.0% |
| Swedish | 4,456 | 2.3% |
| Swiss | 1,175 | 0.6% |
| Syrian | 51 | 0.0% |
| Thai | 9,654 | 4.9% |
| Trinidadian and Tobagonian | 13 | 0.0% |
| Turkish | 131 | 0.1% |
| Ugandan | 116 | 0.1% |
| Ukrainian | 636 | 0.3% |
| Venezuelan | 169 | 0.1% |
| Vietnamese | 138 | 0.1% |
| Welsh | 1,911 | 1.0% |
| West Indian | 27 | 0.0% |
| Yugoslavian | 1 | 0.0% | View All 132 Rows |
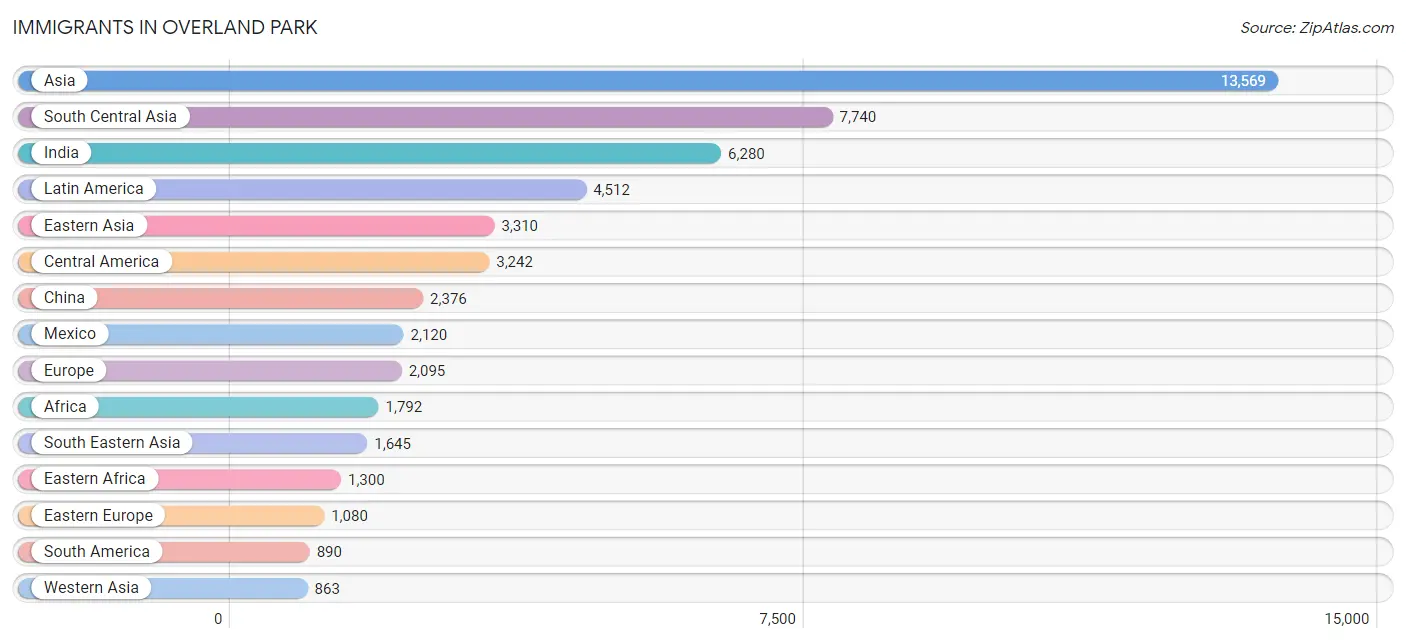
Immigrants in Overland Park
The most numerous immigrant groups reported in Overland Park came from Asia (13,569 | 6.9%), South Central Asia (7,740 | 3.9%), India (6,280 | 3.2%), Latin America (4,512 | 2.3%), and Eastern Asia (3,310 | 1.7%), together accounting for 18.0% of all Overland Park residents.
| Immigration Origin | # Population | % Population |
| Afghanistan | 157 | 0.1% |
| Africa | 1,792 | 0.9% |
| Albania | 50 | 0.0% |
| Argentina | 49 | 0.0% |
| Asia | 13,569 | 6.9% |
| Australia | 52 | 0.0% |
| Austria | 7 | 0.0% |
| Bahamas | 19 | 0.0% |
| Bangladesh | 441 | 0.2% |
| Belarus | 38 | 0.0% |
| Bosnia and Herzegovina | 9 | 0.0% |
| Brazil | 185 | 0.1% |
| Bulgaria | 15 | 0.0% |
| Cambodia | 22 | 0.0% |
| Cameroon | 52 | 0.0% |
| Canada | 344 | 0.2% |
| Caribbean | 380 | 0.2% |
| Central America | 3,242 | 1.7% |
| China | 2,376 | 1.2% |
| Colombia | 225 | 0.1% |
| Croatia | 18 | 0.0% |
| Cuba | 21 | 0.0% |
| Czechoslovakia | 22 | 0.0% |
| Denmark | 8 | 0.0% |
| Dominican Republic | 151 | 0.1% |
| Eastern Africa | 1,300 | 0.7% |
| Eastern Asia | 3,310 | 1.7% |
| Eastern Europe | 1,080 | 0.5% |
| Ecuador | 127 | 0.1% |
| Egypt | 126 | 0.1% |
| El Salvador | 279 | 0.1% |
| England | 250 | 0.1% |
| Ethiopia | 112 | 0.1% |
| Europe | 2,095 | 1.1% |
| Fiji | 12 | 0.0% |
| France | 68 | 0.0% |
| Germany | 297 | 0.2% |
| Guatemala | 730 | 0.4% |
| Guyana | 19 | 0.0% |
| Haiti | 51 | 0.0% |
| Honduras | 104 | 0.1% |
| Hong Kong | 182 | 0.1% |
| Hungary | 35 | 0.0% |
| India | 6,280 | 3.2% |
| Indonesia | 90 | 0.1% |
| Iran | 399 | 0.2% |
| Iraq | 82 | 0.0% |
| Ireland | 56 | 0.0% |
| Israel | 86 | 0.0% |
| Italy | 59 | 0.0% |
| Jamaica | 104 | 0.1% |
| Japan | 169 | 0.1% |
| Jordan | 338 | 0.2% |
| Kenya | 742 | 0.4% |
| Korea | 765 | 0.4% |
| Kuwait | 62 | 0.0% |
| Laos | 27 | 0.0% |
| Latin America | 4,512 | 2.3% |
| Lebanon | 27 | 0.0% |
| Malaysia | 64 | 0.0% |
| Mexico | 2,120 | 1.1% |
| Middle Africa | 72 | 0.0% |
| Moldova | 188 | 0.1% |
| Nepal | 48 | 0.0% |
| Netherlands | 42 | 0.0% |
| Nigeria | 92 | 0.1% |
| Northern Africa | 169 | 0.1% |
| Northern Europe | 461 | 0.2% |
| Oceania | 129 | 0.1% |
| Pakistan | 333 | 0.2% |
| Panama | 9 | 0.0% |
| Peru | 96 | 0.1% |
| Philippines | 541 | 0.3% |
| Poland | 64 | 0.0% |
| Romania | 46 | 0.0% |
| Russia | 319 | 0.2% |
| Saudi Arabia | 62 | 0.0% |
| Scotland | 7 | 0.0% |
| Singapore | 58 | 0.0% |
| Somalia | 17 | 0.0% |
| South Africa | 113 | 0.1% |
| South America | 890 | 0.4% |
| South Central Asia | 7,740 | 3.9% |
| South Eastern Asia | 1,645 | 0.8% |
| Southern Europe | 105 | 0.1% |
| Spain | 46 | 0.0% |
| Sri Lanka | 65 | 0.0% |
| Sudan | 35 | 0.0% |
| Switzerland | 35 | 0.0% |
| Syria | 42 | 0.0% |
| Taiwan | 385 | 0.2% |
| Thailand | 124 | 0.1% |
| Turkey | 49 | 0.0% |
| Uganda | 116 | 0.1% |
| Ukraine | 226 | 0.1% |
| Uzbekistan | 5 | 0.0% |
| Venezuela | 169 | 0.1% |
| Vietnam | 617 | 0.3% |
| Western Africa | 127 | 0.1% |
| Western Asia | 863 | 0.4% |
| Western Europe | 449 | 0.2% |
| Yemen | 24 | 0.0% |
| Zimbabwe | 31 | 0.0% | View All 103 Rows |
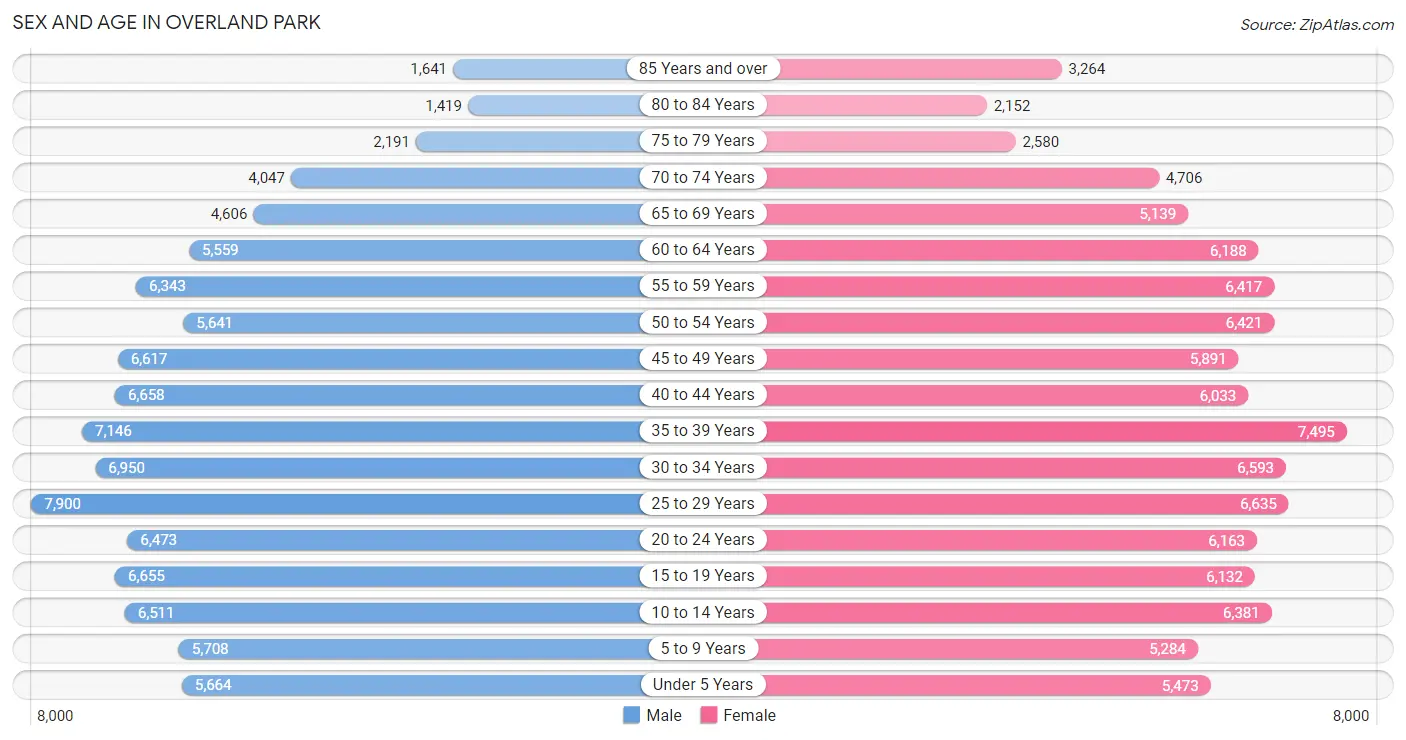
Sex and Age in Overland Park
Sex and Age in Overland Park
The most populous age groups in Overland Park are 25 to 29 Years (7,900 | 8.1%) for men and 35 to 39 Years (7,495 | 7.6%) for women.
| Age Bracket | Male | Female |
| Under 5 Years | 5,664 (5.8%) | 5,473 (5.5%) |
| 5 to 9 Years | 5,708 (5.8%) | 5,284 (5.3%) |
| 10 to 14 Years | 6,511 (6.7%) | 6,381 (6.5%) |
| 15 to 19 Years | 6,655 (6.8%) | 6,132 (6.2%) |
| 20 to 24 Years | 6,473 (6.6%) | 6,163 (6.2%) |
| 25 to 29 Years | 7,900 (8.1%) | 6,635 (6.7%) |
| 30 to 34 Years | 6,950 (7.1%) | 6,593 (6.7%) |
| 35 to 39 Years | 7,146 (7.3%) | 7,495 (7.6%) |
| 40 to 44 Years | 6,658 (6.8%) | 6,033 (6.1%) |
| 45 to 49 Years | 6,617 (6.8%) | 5,891 (5.9%) |
| 50 to 54 Years | 5,641 (5.8%) | 6,421 (6.5%) |
| 55 to 59 Years | 6,343 (6.5%) | 6,417 (6.5%) |
| 60 to 64 Years | 5,559 (5.7%) | 6,188 (6.2%) |
| 65 to 69 Years | 4,606 (4.7%) | 5,139 (5.2%) |
| 70 to 74 Years | 4,047 (4.1%) | 4,706 (4.8%) |
| 75 to 79 Years | 2,191 (2.2%) | 2,580 (2.6%) |
| 80 to 84 Years | 1,419 (1.5%) | 2,152 (2.2%) |
| 85 Years and over | 1,641 (1.7%) | 3,264 (3.3%) |
| Total | 97,729 (100.0%) | 98,947 (100.0%) |
Families and Households in Overland Park
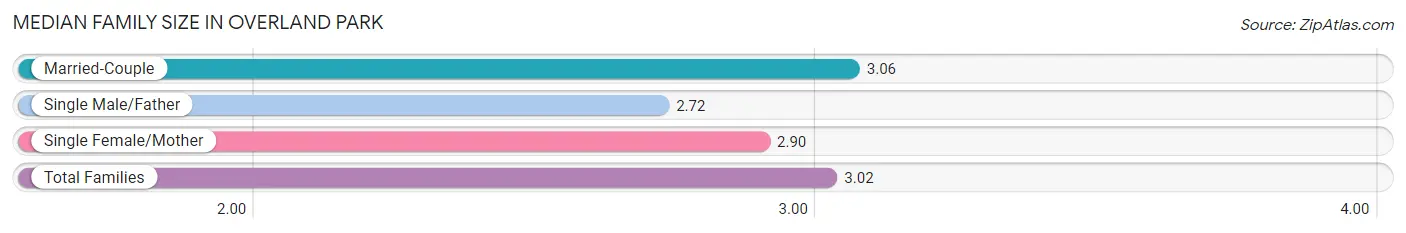
Median Family Size in Overland Park
The median family size in Overland Park is 3.02 persons per family, with married-couple families (41,792 | 82.5%) accounting for the largest median family size of 3.06 persons per family. On the other hand, single male/father families (2,643 | 5.2%) represent the smallest median family size with 2.72 persons per family.
| Family Type | # Families | Family Size |
| Married-Couple | 41,792 (82.5%) | 3.06 |
| Single Male/Father | 2,643 (5.2%) | 2.72 |
| Single Female/Mother | 6,237 (12.3%) | 2.90 |
| Total Families | 50,672 (100.0%) | 3.02 |
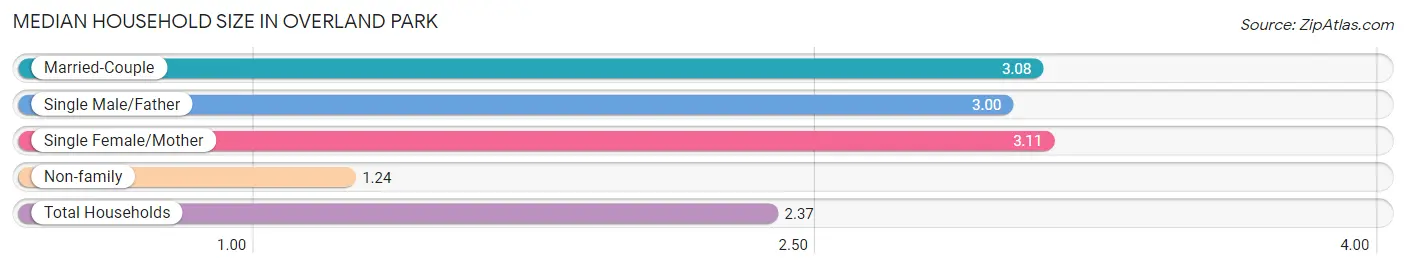
Median Household Size in Overland Park
The median household size in Overland Park is 2.37 persons per household, with single female/mother households (6,237 | 7.6%) accounting for the largest median household size of 3.11 persons per household. non-family households (31,539 | 38.4%) represent the smallest median household size with 1.24 persons per household.
| Household Type | # Households | Household Size |
| Married-Couple | 41,792 (50.8%) | 3.08 |
| Single Male/Father | 2,643 (3.2%) | 3.00 |
| Single Female/Mother | 6,237 (7.6%) | 3.11 |
| Non-family | 31,539 (38.4%) | 1.24 |
| Total Households | 82,211 (100.0%) | 2.37 |
Household Size by Marriage Status in Overland Park
Out of a total of 82,211 households in Overland Park, 50,672 (61.6%) are family households, while 31,539 (38.4%) are nonfamily households. The most numerous type of family households are 2-person households, comprising 23,450, and the most common type of nonfamily households are 1-person households, comprising 25,684.
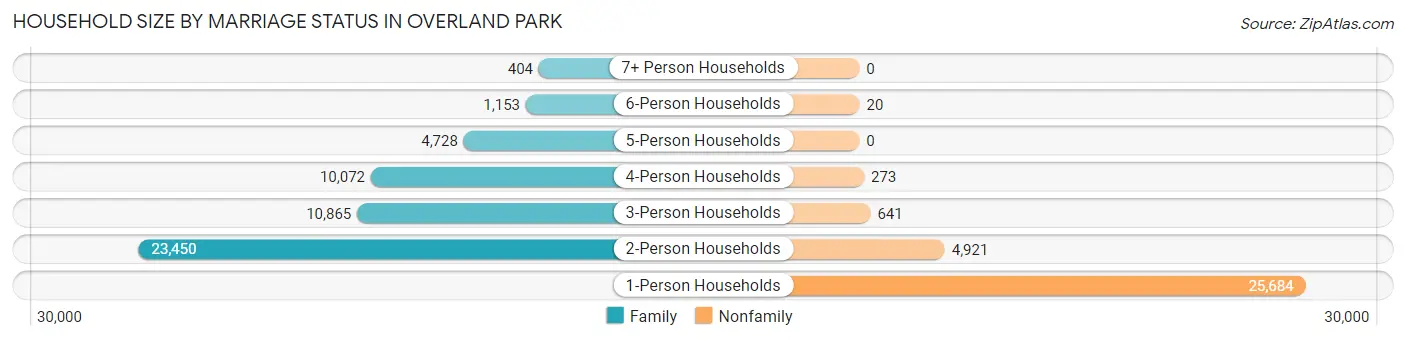
| Household Size | Family Households | Nonfamily Households |
| 1-Person Households | - | 25,684 (31.2%) |
| 2-Person Households | 23,450 (28.5%) | 4,921 (6.0%) |
| 3-Person Households | 10,865 (13.2%) | 641 (0.8%) |
| 4-Person Households | 10,072 (12.2%) | 273 (0.3%) |
| 5-Person Households | 4,728 (5.8%) | 0 (0.0%) |
| 6-Person Households | 1,153 (1.4%) | 20 (0.0%) |
| 7+ Person Households | 404 (0.5%) | 0 (0.0%) |
| Total | 50,672 (61.6%) | 31,539 (38.4%) |
Female Fertility in Overland Park
Fertility by Age in Overland Park
Average fertility rate in Overland Park is 49.0 births per 1,000 women. Women in the age bracket of 20 to 34 years have the highest fertility rate with 68.0 births per 1,000 women. Women in the age bracket of 20 to 34 years acount for 58.0% of all women with births.
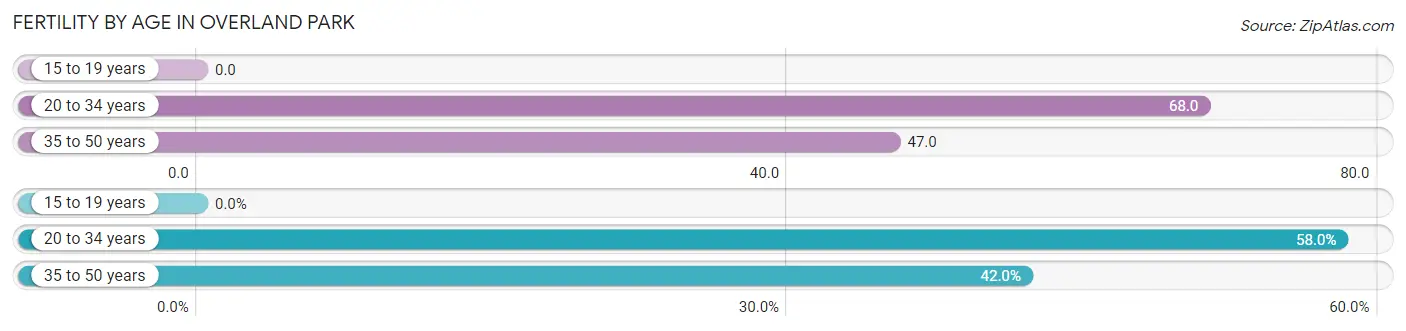
| Age Bracket | Women with Births | Births / 1,000 Women |
| 15 to 19 years | 0 (0.0%) | 0.0 |
| 20 to 34 years | 1,322 (58.0%) | 68.0 |
| 35 to 50 years | 956 (42.0%) | 47.0 |
| Total | 2,278 (100.0%) | 49.0 |
Fertility by Age by Marriage Status in Overland Park
82.1% of women with births (2,278) in Overland Park are married. The highest percentage of unmarried women with births falls into 35 to 50 years age bracket with 29.6% of them unmarried at the time of birth, while the lowest percentage of unmarried women with births belong to 20 to 34 years age bracket with 9.4% of them unmarried.
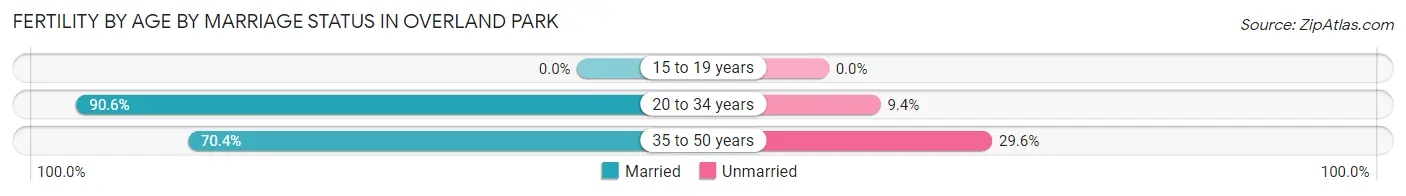
| Age Bracket | Married | Unmarried |
| 15 to 19 years | 0 (0.0%) | 0 (0.0%) |
| 20 to 34 years | 1,198 (90.6%) | 124 (9.4%) |
| 35 to 50 years | 673 (70.4%) | 283 (29.6%) |
| Total | 1,870 (82.1%) | 408 (17.9%) |
Fertility by Education in Overland Park
Average fertility rate in Overland Park is 49.0 births per 1,000 women. Women with the education attainment of graduate degree have the highest fertility rate of 85.0 births per 1,000 women, while women with the education attainment of less than high school have the lowest fertility at 15.0 births per 1,000 women. Women with the education attainment of bachelor's degree represent 39.7% of all women with births.
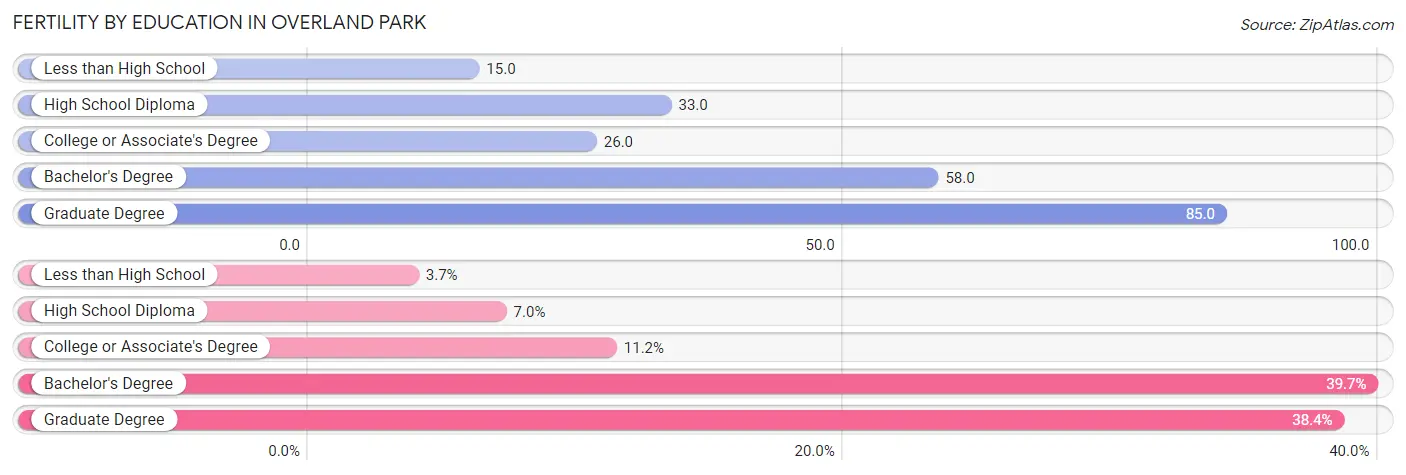
| Educational Attainment | Women with Births | Births / 1,000 Women |
| Less than High School | 85 (3.7%) | 15.0 |
| High School Diploma | 160 (7.0%) | 33.0 |
| College or Associate's Degree | 254 (11.2%) | 26.0 |
| Bachelor's Degree | 904 (39.7%) | 58.0 |
| Graduate Degree | 875 (38.4%) | 85.0 |
| Total | 2,278 (100.0%) | 49.0 |
Fertility by Education by Marriage Status in Overland Park
17.9% of women with births in Overland Park are unmarried. Women with the educational attainment of graduate degree are most likely to be married with 85.3% of them married at childbirth, while women with the educational attainment of less than high school are least likely to be married with 52.9% of them unmarried at childbirth.
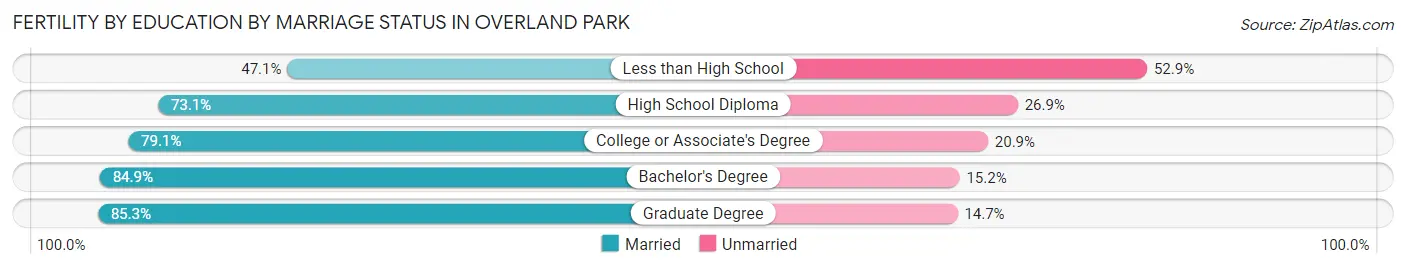
| Educational Attainment | Married | Unmarried |
| Less than High School | 40 (47.1%) | 45 (52.9%) |
| High School Diploma | 117 (73.1%) | 43 (26.9%) |
| College or Associate's Degree | 201 (79.1%) | 53 (20.9%) |
| Bachelor's Degree | 767 (84.9%) | 137 (15.1%) |
| Graduate Degree | 746 (85.3%) | 129 (14.7%) |
| Total | 1,870 (82.1%) | 408 (17.9%) |
Employment Characteristics in Overland Park
Employment by Class of Employer in Overland Park
Among the 108,128 employed individuals in Overland Park, private company employees (76,961 | 71.2%), not-for-profit organizations (9,317 | 8.6%), and local government employees (6,023 | 5.6%) make up the most common classes of employment.
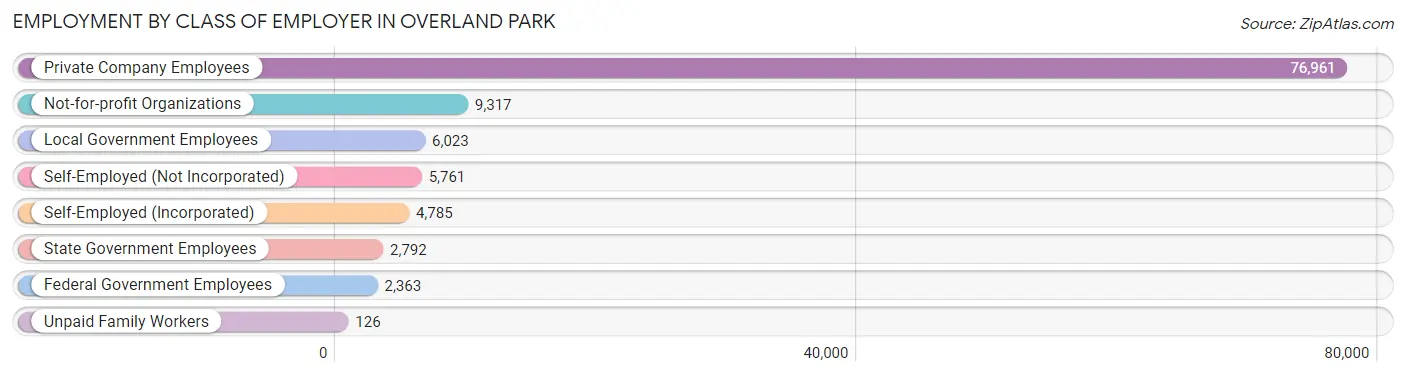
| Employer Class | # Employees | % Employees |
| Private Company Employees | 76,961 | 71.2% |
| Self-Employed (Incorporated) | 4,785 | 4.4% |
| Self-Employed (Not Incorporated) | 5,761 | 5.3% |
| Not-for-profit Organizations | 9,317 | 8.6% |
| Local Government Employees | 6,023 | 5.6% |
| State Government Employees | 2,792 | 2.6% |
| Federal Government Employees | 2,363 | 2.2% |
| Unpaid Family Workers | 126 | 0.1% |
| Total | 108,128 | 100.0% |
Employment Status by Age in Overland Park
According to the labor force statistics for Overland Park, out of the total population over 16 years of age (159,160), 71.8% or 114,277 individuals are in the labor force, with 3.2% or 3,657 of them unemployed. The age group with the highest labor force participation rate is 25 to 29 years, with 92.1% or 13,387 individuals in the labor force. Within the labor force, the 16 to 19 years age range has the highest percentage of unemployed individuals, with 12.7% or 694 of them being unemployed.
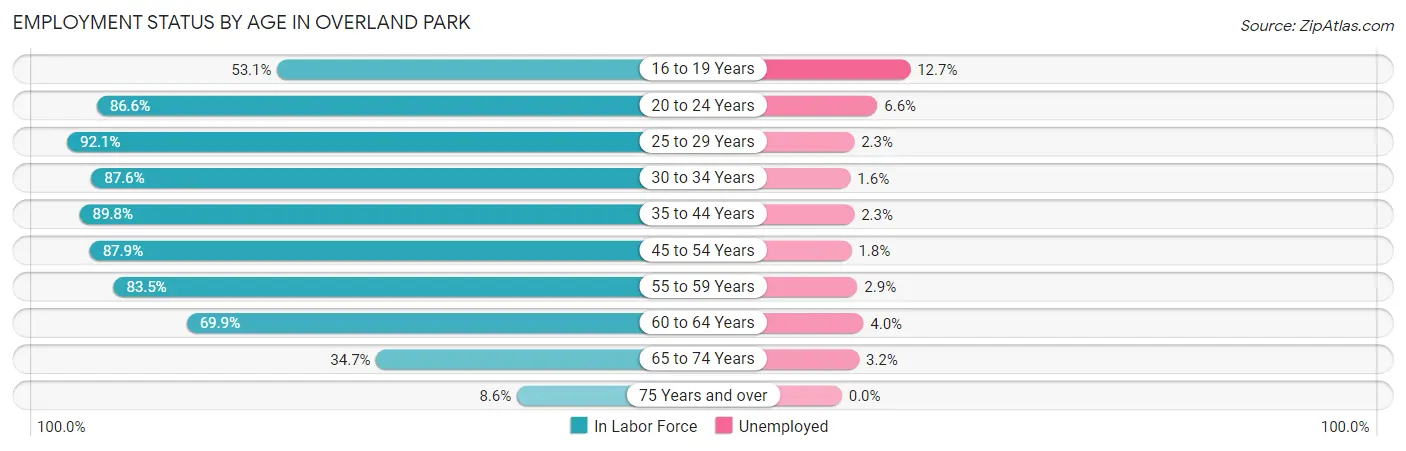
| Age Bracket | In Labor Force | Unemployed |
| 16 to 19 Years | 5,465 (53.1%) | 694 (12.7%) |
| 20 to 24 Years | 10,943 (86.6%) | 722 (6.6%) |
| 25 to 29 Years | 13,387 (92.1%) | 308 (2.3%) |
| 30 to 34 Years | 11,864 (87.6%) | 190 (1.6%) |
| 35 to 44 Years | 24,544 (89.8%) | 565 (2.3%) |
| 45 to 54 Years | 21,597 (87.9%) | 389 (1.8%) |
| 55 to 59 Years | 10,655 (83.5%) | 309 (2.9%) |
| 60 to 64 Years | 8,211 (69.9%) | 328 (4.0%) |
| 65 to 74 Years | 6,419 (34.7%) | 205 (3.2%) |
| 75 Years and over | 1,139 (8.6%) | 0 (0.0%) |
| Total | 114,277 (71.8%) | 3,657 (3.2%) |
Employment Status by Educational Attainment in Overland Park
According to labor force statistics for Overland Park, 86.4% of individuals (90,277) out of the total population between 25 and 64 years of age (104,487) are in the labor force, with 2.3% or 2,076 of them being unemployed. The group with the highest labor force participation rate are those with the educational attainment of bachelor's degree or higher, with 88.9% or 60,942 individuals in the labor force. Within the labor force, individuals with less than high school education have the highest percentage of unemployment, with 6.3% or 125 of them being unemployed.
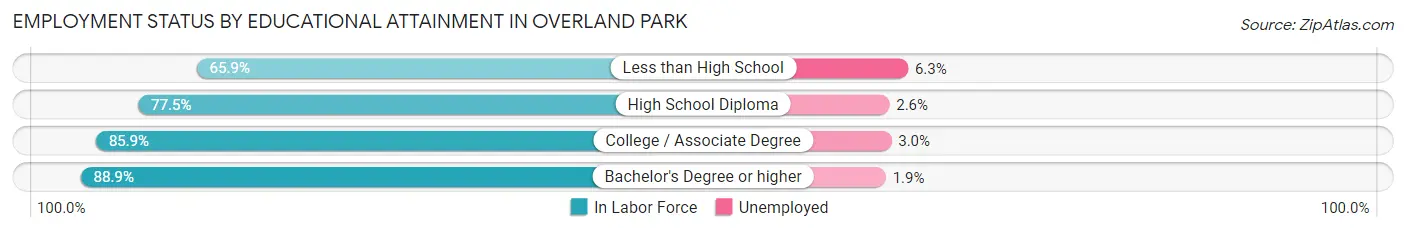
| Educational Attainment | In Labor Force | Unemployed |
| Less than High School | 1,982 (65.9%) | 190 (6.3%) |
| High School Diploma | 8,342 (77.5%) | 280 (2.6%) |
| College / Associate Degree | 19,039 (85.9%) | 665 (3.0%) |
| Bachelor's Degree or higher | 60,942 (88.9%) | 1,302 (1.9%) |
| Total | 90,277 (86.4%) | 2,403 (2.3%) |
Employment Occupations by Sex in Overland Park
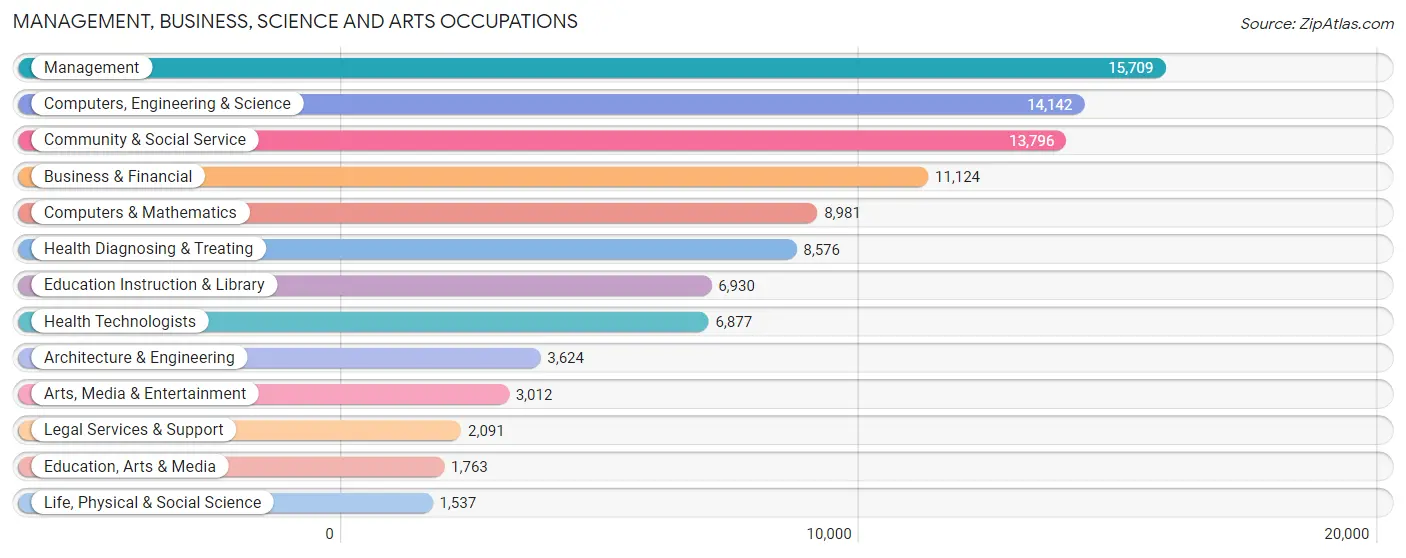
Management, Business, Science and Arts Occupations
The most common Management, Business, Science and Arts occupations in Overland Park are Management (15,709 | 14.2%), Computers, Engineering & Science (14,142 | 12.8%), Community & Social Service (13,796 | 12.5%), Business & Financial (11,124 | 10.1%), and Computers & Mathematics (8,981 | 8.1%).
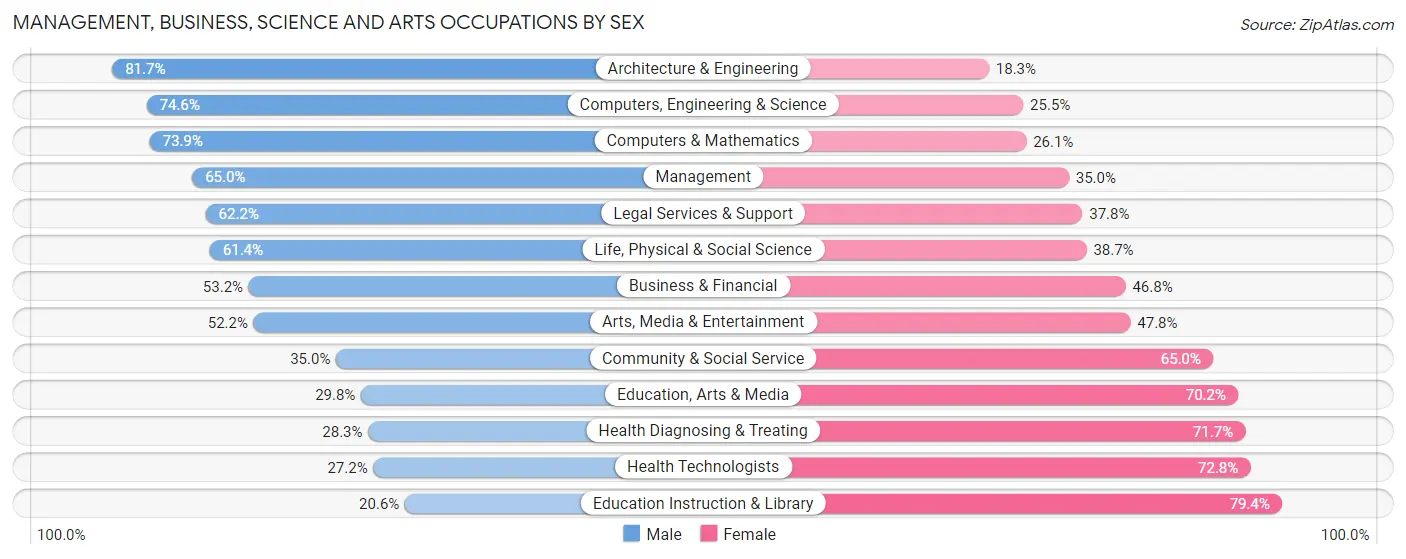
Management, Business, Science and Arts Occupations by Sex
Within the Management, Business, Science and Arts occupations in Overland Park, the most male-oriented occupations are Architecture & Engineering (81.7%), Computers, Engineering & Science (74.6%), and Computers & Mathematics (73.9%), while the most female-oriented occupations are Education Instruction & Library (79.4%), Health Technologists (72.8%), and Health Diagnosing & Treating (71.7%).
| Occupation | Male | Female |
| Management | 10,215 (65.0%) | 5,494 (35.0%) |
| Business & Financial | 5,919 (53.2%) | 5,205 (46.8%) |
| Computers, Engineering & Science | 10,543 (74.6%) | 3,599 (25.5%) |
| Computers & Mathematics | 6,639 (73.9%) | 2,342 (26.1%) |
| Architecture & Engineering | 2,961 (81.7%) | 663 (18.3%) |
| Life, Physical & Social Science | 943 (61.4%) | 594 (38.7%) |
| Community & Social Service | 4,827 (35.0%) | 8,969 (65.0%) |
| Education, Arts & Media | 525 (29.8%) | 1,238 (70.2%) |
| Legal Services & Support | 1,301 (62.2%) | 790 (37.8%) |
| Education Instruction & Library | 1,429 (20.6%) | 5,501 (79.4%) |
| Arts, Media & Entertainment | 1,572 (52.2%) | 1,440 (47.8%) |
| Health Diagnosing & Treating | 2,426 (28.3%) | 6,150 (71.7%) |
| Health Technologists | 1,872 (27.2%) | 5,005 (72.8%) |
| Total (Category) | 33,930 (53.6%) | 29,417 (46.4%) |
| Total (Overall) | 59,507 (53.9%) | 50,843 (46.1%) |
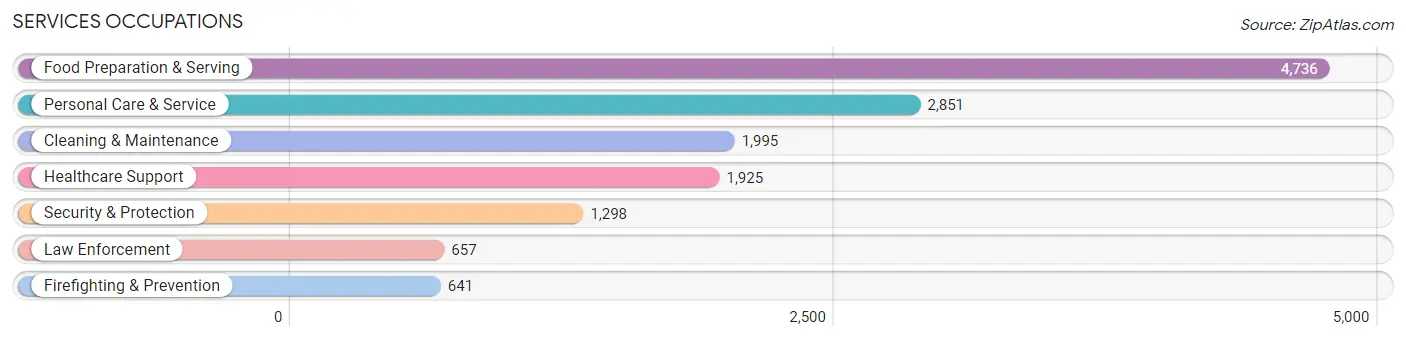
Services Occupations
The most common Services occupations in Overland Park are Food Preparation & Serving (4,736 | 4.3%), Personal Care & Service (2,851 | 2.6%), Cleaning & Maintenance (1,995 | 1.8%), Healthcare Support (1,925 | 1.7%), and Security & Protection (1,298 | 1.2%).
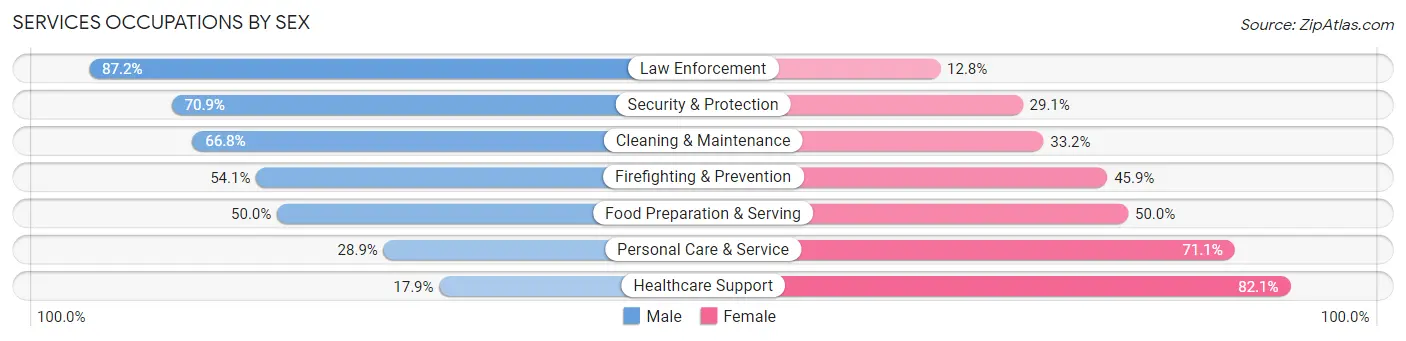
Services Occupations by Sex
Within the Services occupations in Overland Park, the most male-oriented occupations are Law Enforcement (87.2%), Security & Protection (70.9%), and Cleaning & Maintenance (66.8%), while the most female-oriented occupations are Healthcare Support (82.1%), Personal Care & Service (71.1%), and Food Preparation & Serving (50.0%).
| Occupation | Male | Female |
| Healthcare Support | 344 (17.9%) | 1,581 (82.1%) |
| Security & Protection | 920 (70.9%) | 378 (29.1%) |
| Firefighting & Prevention | 347 (54.1%) | 294 (45.9%) |
| Law Enforcement | 573 (87.2%) | 84 (12.8%) |
| Food Preparation & Serving | 2,368 (50.0%) | 2,368 (50.0%) |
| Cleaning & Maintenance | 1,332 (66.8%) | 663 (33.2%) |
| Personal Care & Service | 824 (28.9%) | 2,027 (71.1%) |
| Total (Category) | 5,788 (45.2%) | 7,017 (54.8%) |
| Total (Overall) | 59,507 (53.9%) | 50,843 (46.1%) |
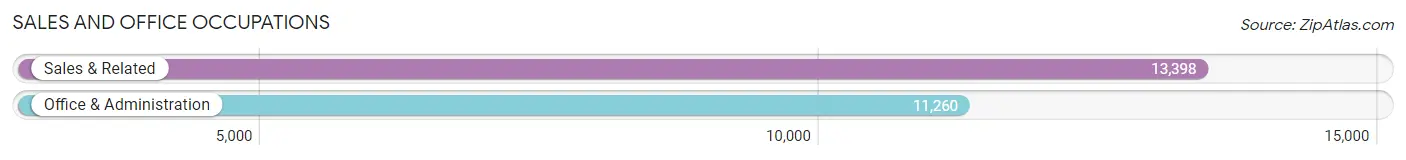
Sales and Office Occupations
The most common Sales and Office occupations in Overland Park are Sales & Related (13,398 | 12.1%), and Office & Administration (11,260 | 10.2%).
Sales and Office Occupations by Sex
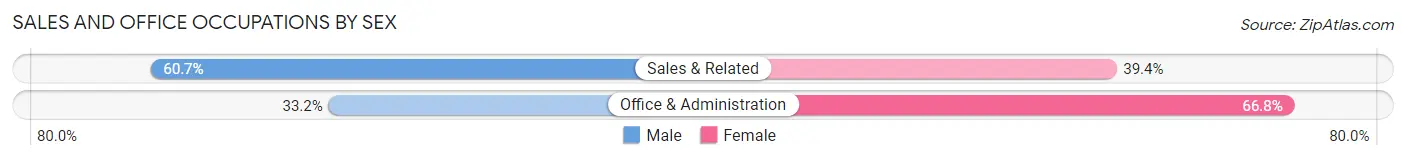
| Occupation | Male | Female |
| Sales & Related | 8,126 (60.7%) | 5,272 (39.4%) |
| Office & Administration | 3,743 (33.2%) | 7,517 (66.8%) |
| Total (Category) | 11,869 (48.1%) | 12,789 (51.9%) |
| Total (Overall) | 59,507 (53.9%) | 50,843 (46.1%) |
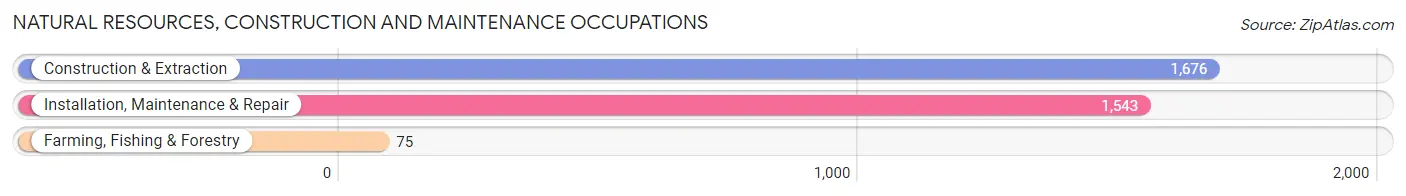
Natural Resources, Construction and Maintenance Occupations
The most common Natural Resources, Construction and Maintenance occupations in Overland Park are Construction & Extraction (1,676 | 1.5%), Installation, Maintenance & Repair (1,543 | 1.4%), and Farming, Fishing & Forestry (75 | 0.1%).
Natural Resources, Construction and Maintenance Occupations by Sex
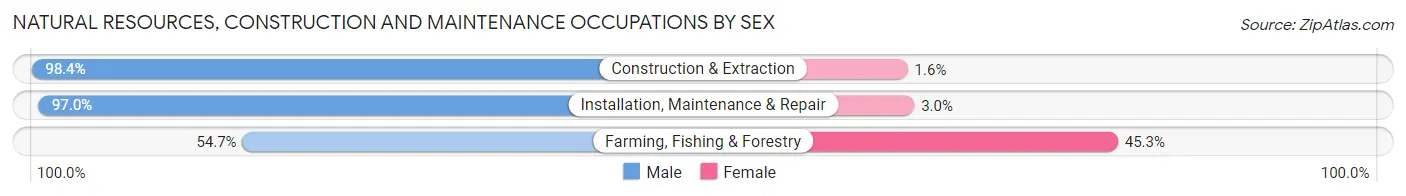
| Occupation | Male | Female |
| Farming, Fishing & Forestry | 41 (54.7%) | 34 (45.3%) |
| Construction & Extraction | 1,649 (98.4%) | 27 (1.6%) |
| Installation, Maintenance & Repair | 1,497 (97.0%) | 46 (3.0%) |
| Total (Category) | 3,187 (96.8%) | 107 (3.3%) |
| Total (Overall) | 59,507 (53.9%) | 50,843 (46.1%) |
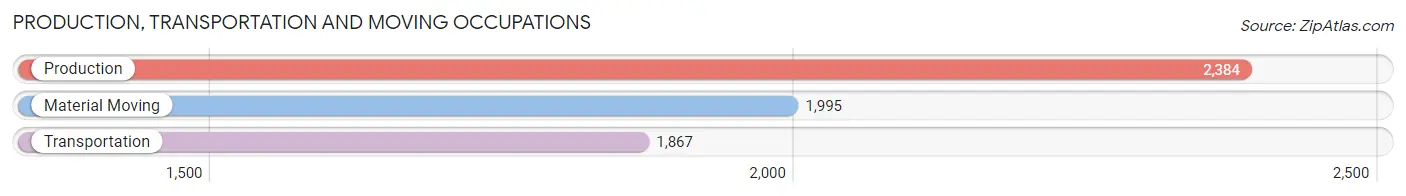
Production, Transportation and Moving Occupations
The most common Production, Transportation and Moving occupations in Overland Park are Production (2,384 | 2.2%), Material Moving (1,995 | 1.8%), and Transportation (1,867 | 1.7%).
Production, Transportation and Moving Occupations by Sex
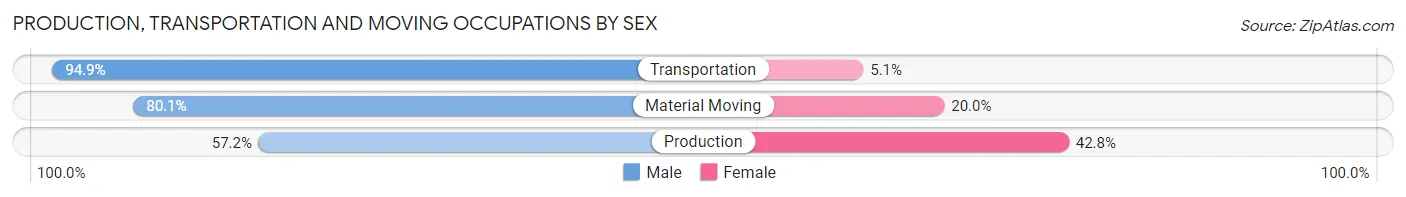
| Occupation | Male | Female |
| Production | 1,364 (57.2%) | 1,020 (42.8%) |
| Transportation | 1,772 (94.9%) | 95 (5.1%) |
| Material Moving | 1,597 (80.0%) | 398 (20.0%) |
| Total (Category) | 4,733 (75.8%) | 1,513 (24.2%) |
| Total (Overall) | 59,507 (53.9%) | 50,843 (46.1%) |
Employment Industries by Sex in Overland Park
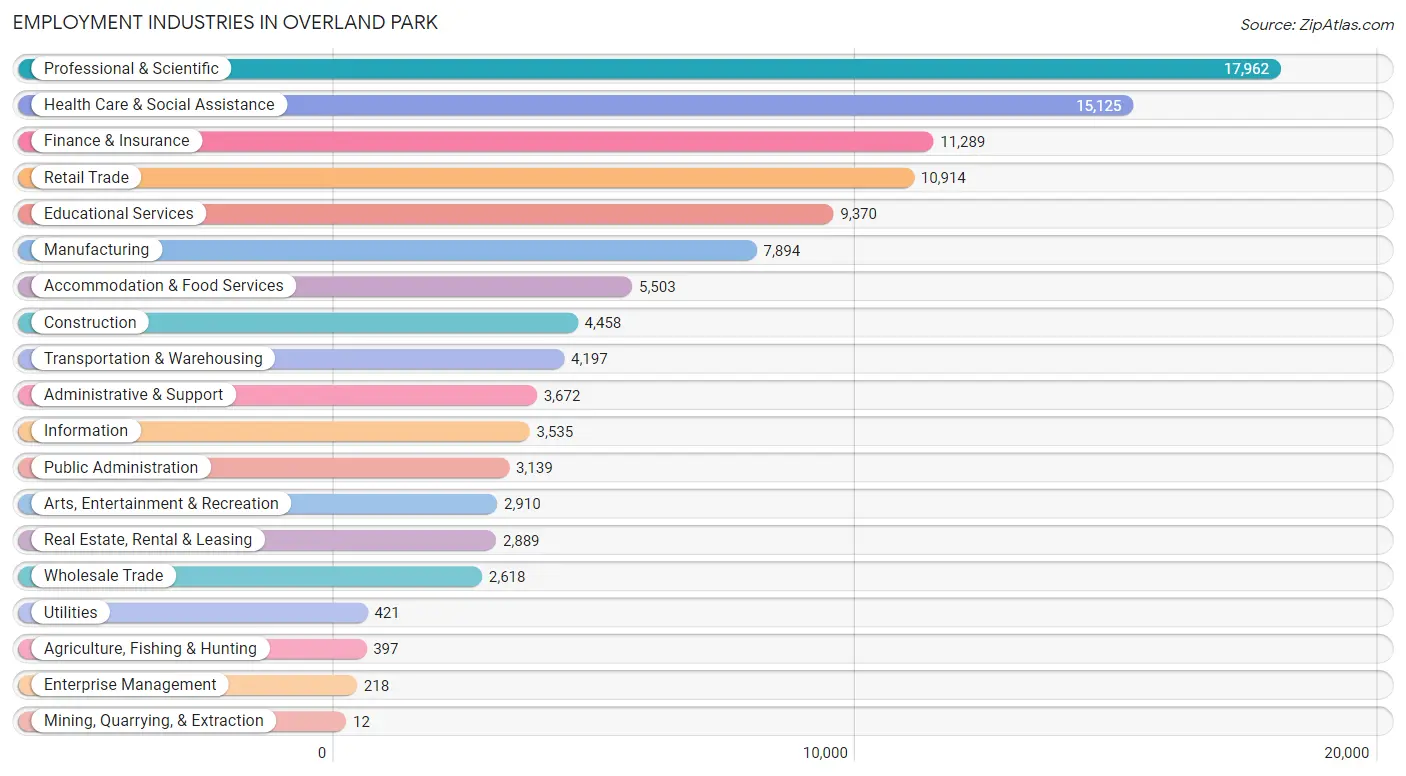
Employment Industries in Overland Park
The major employment industries in Overland Park include Professional & Scientific (17,962 | 16.3%), Health Care & Social Assistance (15,125 | 13.7%), Finance & Insurance (11,289 | 10.2%), Retail Trade (10,914 | 9.9%), and Educational Services (9,370 | 8.5%).
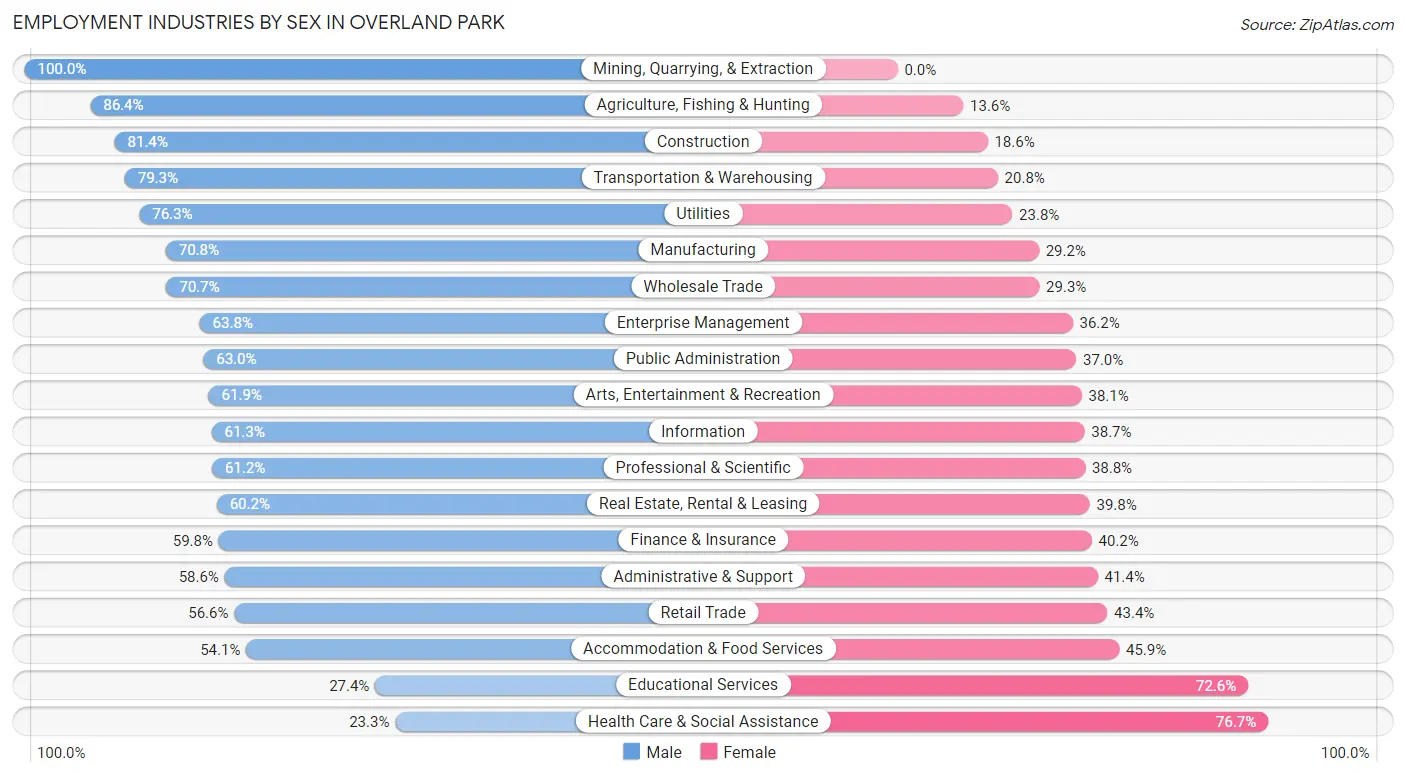
Employment Industries by Sex in Overland Park
The Overland Park industries that see more men than women are Mining, Quarrying, & Extraction (100.0%), Agriculture, Fishing & Hunting (86.4%), and Construction (81.4%), whereas the industries that tend to have a higher number of women are Health Care & Social Assistance (76.7%), Educational Services (72.6%), and Accommodation & Food Services (45.9%).
| Industry | Male | Female |
| Agriculture, Fishing & Hunting | 343 (86.4%) | 54 (13.6%) |
| Mining, Quarrying, & Extraction | 12 (100.0%) | 0 (0.0%) |
| Construction | 3,627 (81.4%) | 831 (18.6%) |
| Manufacturing | 5,586 (70.8%) | 2,308 (29.2%) |
| Wholesale Trade | 1,850 (70.7%) | 768 (29.3%) |
| Retail Trade | 6,176 (56.6%) | 4,738 (43.4%) |
| Transportation & Warehousing | 3,326 (79.2%) | 871 (20.7%) |
| Utilities | 321 (76.2%) | 100 (23.7%) |
| Information | 2,167 (61.3%) | 1,368 (38.7%) |
| Finance & Insurance | 6,751 (59.8%) | 4,538 (40.2%) |
| Real Estate, Rental & Leasing | 1,740 (60.2%) | 1,149 (39.8%) |
| Professional & Scientific | 10,991 (61.2%) | 6,971 (38.8%) |
| Enterprise Management | 139 (63.8%) | 79 (36.2%) |
| Administrative & Support | 2,151 (58.6%) | 1,521 (41.4%) |
| Educational Services | 2,570 (27.4%) | 6,800 (72.6%) |
| Health Care & Social Assistance | 3,521 (23.3%) | 11,604 (76.7%) |
| Arts, Entertainment & Recreation | 1,801 (61.9%) | 1,109 (38.1%) |
| Accommodation & Food Services | 2,978 (54.1%) | 2,525 (45.9%) |
| Public Administration | 1,978 (63.0%) | 1,161 (37.0%) |
| Total | 59,507 (53.9%) | 50,843 (46.1%) |
Education in Overland Park
School Enrollment in Overland Park
The most common levels of schooling among the 47,934 students in Overland Park are high school (11,246 | 23.5%), middle school (10,442 | 21.8%), and elementary school (8,672 | 18.1%).
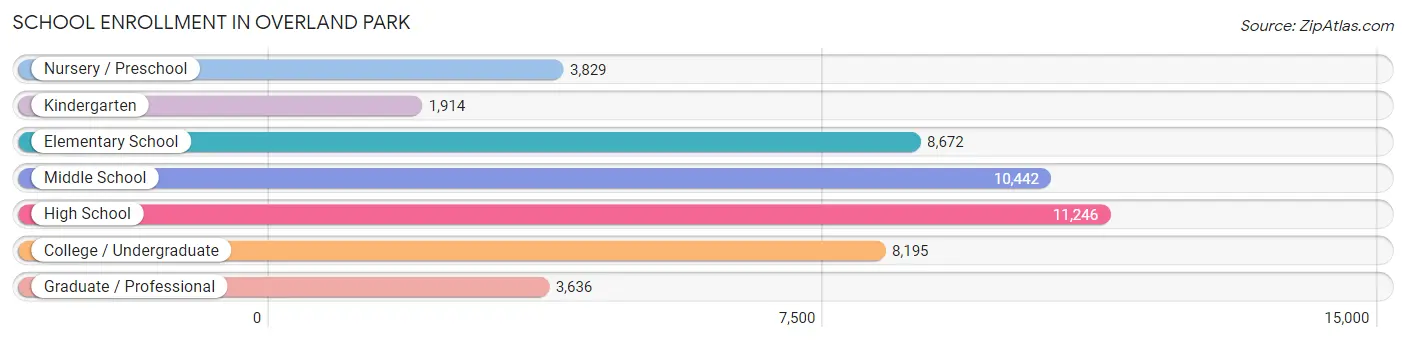
| School Level | # Students | % Students |
| Nursery / Preschool | 3,829 | 8.0% |
| Kindergarten | 1,914 | 4.0% |
| Elementary School | 8,672 | 18.1% |
| Middle School | 10,442 | 21.8% |
| High School | 11,246 | 23.5% |
| College / Undergraduate | 8,195 | 17.1% |
| Graduate / Professional | 3,636 | 7.6% |
| Total | 47,934 | 100.0% |
School Enrollment by Age by Funding Source in Overland Park
Out of a total of 47,934 students who are enrolled in schools in Overland Park, 8,388 (17.5%) attend a private institution, while the remaining 39,546 (82.5%) are enrolled in public schools. The age group of 3 to 4 year olds has the highest likelihood of being enrolled in private schools, with 1,516 (56.1% in the age bracket) enrolled. Conversely, the age group of 15 to 17 year olds has the lowest likelihood of being enrolled in a private school, with 7,473 (91.7% in the age bracket) attending a public institution.
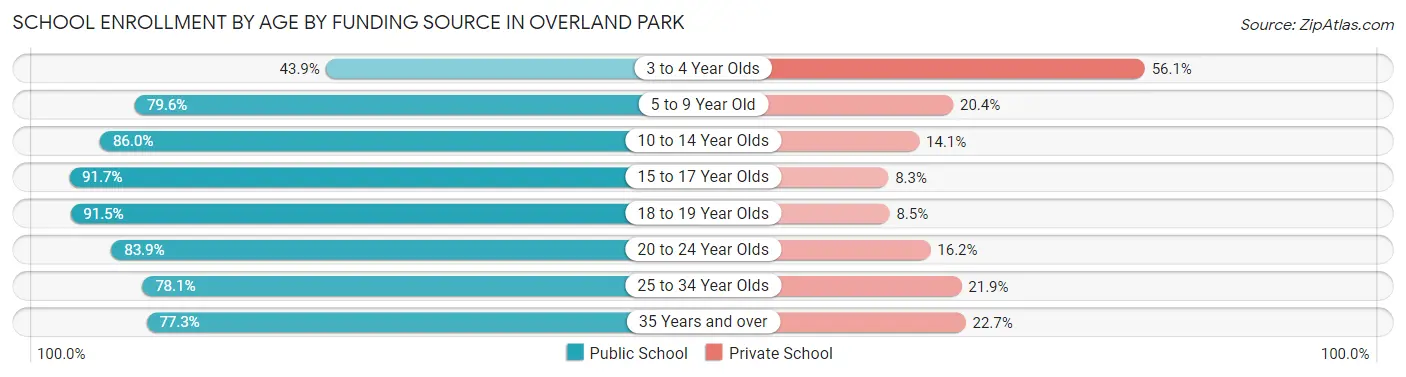
| Age Bracket | Public School | Private School |
| 3 to 4 Year Olds | 1,188 (43.9%) | 1,516 (56.1%) |
| 5 to 9 Year Old | 8,340 (79.6%) | 2,133 (20.4%) |
| 10 to 14 Year Olds | 10,952 (86.0%) | 1,791 (14.1%) |
| 15 to 17 Year Olds | 7,473 (91.7%) | 676 (8.3%) |
| 18 to 19 Year Olds | 3,592 (91.5%) | 335 (8.5%) |
| 20 to 24 Year Olds | 3,708 (83.9%) | 714 (16.2%) |
| 25 to 34 Year Olds | 2,102 (78.1%) | 590 (21.9%) |
| 35 Years and over | 2,183 (77.3%) | 641 (22.7%) |
| Total | 39,546 (82.5%) | 8,388 (17.5%) |
Educational Attainment by Field of Study in Overland Park
Business (23,108 | 24.8%), science & technology (9,711 | 10.4%), education (9,352 | 10.0%), engineering (8,147 | 8.7%), and social sciences (6,185 | 6.6%) are the most common fields of study among 93,225 individuals in Overland Park who have obtained a bachelor's degree or higher.
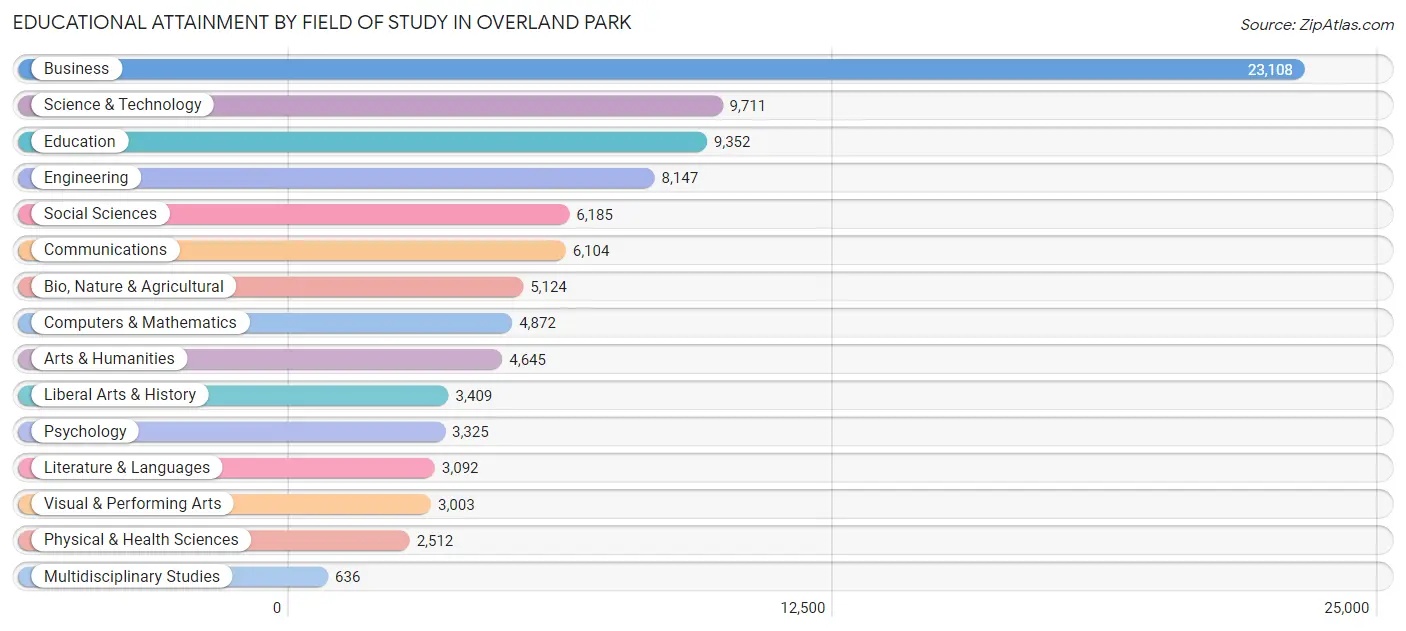
| Field of Study | # Graduates | % Graduates |
| Computers & Mathematics | 4,872 | 5.2% |
| Bio, Nature & Agricultural | 5,124 | 5.5% |
| Physical & Health Sciences | 2,512 | 2.7% |
| Psychology | 3,325 | 3.6% |
| Social Sciences | 6,185 | 6.6% |
| Engineering | 8,147 | 8.7% |
| Multidisciplinary Studies | 636 | 0.7% |
| Science & Technology | 9,711 | 10.4% |
| Business | 23,108 | 24.8% |
| Education | 9,352 | 10.0% |
| Literature & Languages | 3,092 | 3.3% |
| Liberal Arts & History | 3,409 | 3.7% |
| Visual & Performing Arts | 3,003 | 3.2% |
| Communications | 6,104 | 6.6% |
| Arts & Humanities | 4,645 | 5.0% |
| Total | 93,225 | 100.0% |
Transportation & Commute in Overland Park
Vehicle Availability by Sex in Overland Park
The most prevalent vehicle ownership categories in Overland Park are males with 2 vehicles (28,611, accounting for 48.9%) and females with 2 vehicles (22,733, making up 57.8%).
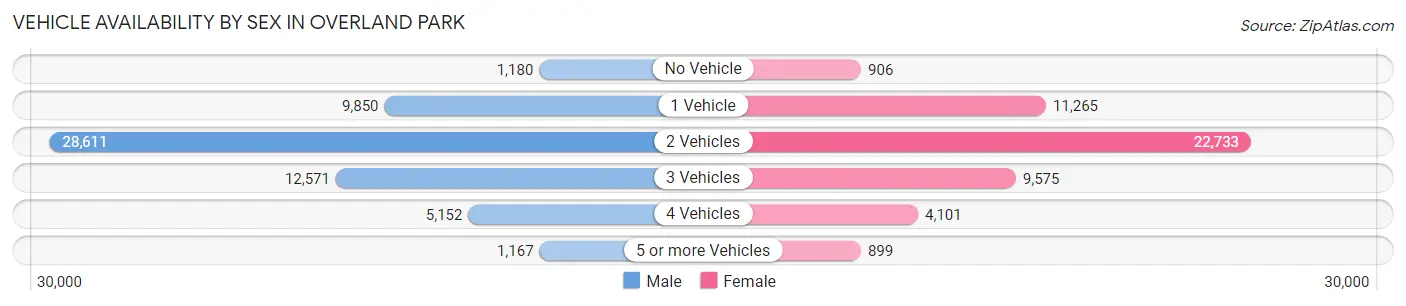
| Vehicles Available | Male | Female |
| No Vehicle | 1,180 (2.0%) | 906 (1.8%) |
| 1 Vehicle | 9,850 (16.8%) | 11,265 (22.8%) |
| 2 Vehicles | 28,611 (48.9%) | 22,733 (45.9%) |
| 3 Vehicles | 12,571 (21.5%) | 9,575 (19.4%) |
| 4 Vehicles | 5,152 (8.8%) | 4,101 (8.3%) |
| 5 or more Vehicles | 1,167 (2.0%) | 899 (1.8%) |
| Total | 58,531 (100.0%) | 49,479 (100.0%) |
Commute Time in Overland Park
The most frequently occuring commute durations in Overland Park are 15 to 19 minutes (19,524 commuters, 22.4%), 20 to 24 minutes (17,314 commuters, 19.9%), and 10 to 14 minutes (14,401 commuters, 16.5%).
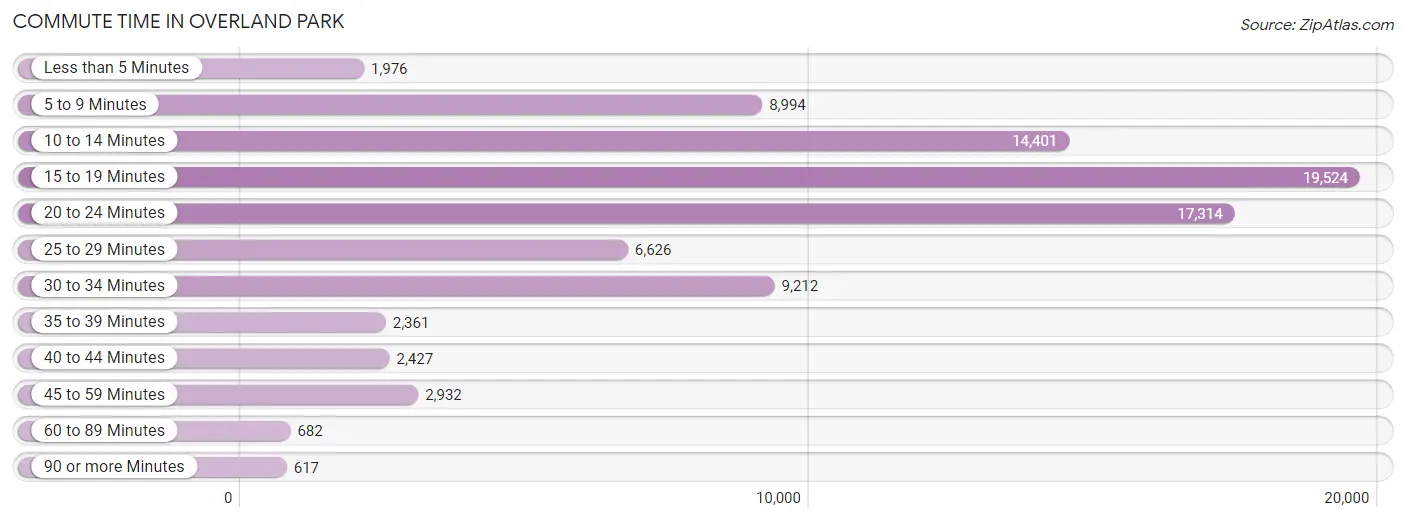
| Commute Time | # Commuters | % Commuters |
| Less than 5 Minutes | 1,976 | 2.3% |
| 5 to 9 Minutes | 8,994 | 10.3% |
| 10 to 14 Minutes | 14,401 | 16.5% |
| 15 to 19 Minutes | 19,524 | 22.4% |
| 20 to 24 Minutes | 17,314 | 19.9% |
| 25 to 29 Minutes | 6,626 | 7.6% |
| 30 to 34 Minutes | 9,212 | 10.6% |
| 35 to 39 Minutes | 2,361 | 2.7% |
| 40 to 44 Minutes | 2,427 | 2.8% |
| 45 to 59 Minutes | 2,932 | 3.4% |
| 60 to 89 Minutes | 682 | 0.8% |
| 90 or more Minutes | 617 | 0.7% |
Commute Time by Sex in Overland Park
The most common commute times in Overland Park are 15 to 19 minutes (10,450 commuters, 22.1%) for males and 15 to 19 minutes (9,074 commuters, 22.8%) for females.
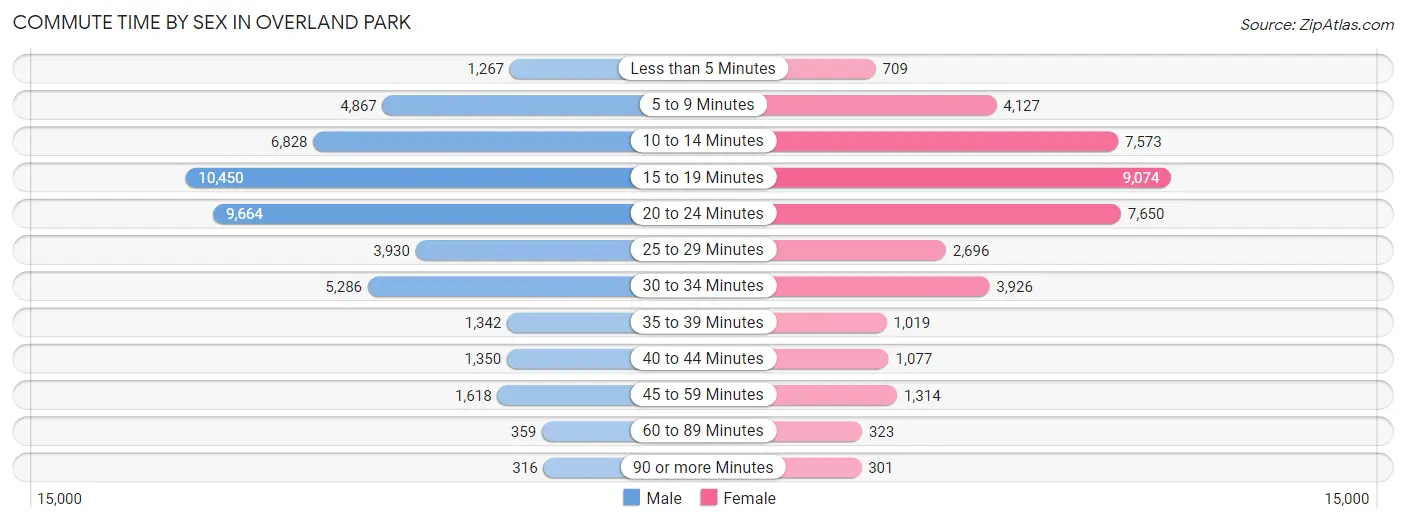
| Commute Time | Male | Female |
| Less than 5 Minutes | 1,267 (2.7%) | 709 (1.8%) |
| 5 to 9 Minutes | 4,867 (10.3%) | 4,127 (10.4%) |
| 10 to 14 Minutes | 6,828 (14.4%) | 7,573 (19.0%) |
| 15 to 19 Minutes | 10,450 (22.1%) | 9,074 (22.8%) |
| 20 to 24 Minutes | 9,664 (20.4%) | 7,650 (19.2%) |
| 25 to 29 Minutes | 3,930 (8.3%) | 2,696 (6.8%) |
| 30 to 34 Minutes | 5,286 (11.2%) | 3,926 (9.9%) |
| 35 to 39 Minutes | 1,342 (2.8%) | 1,019 (2.6%) |
| 40 to 44 Minutes | 1,350 (2.9%) | 1,077 (2.7%) |
| 45 to 59 Minutes | 1,618 (3.4%) | 1,314 (3.3%) |
| 60 to 89 Minutes | 359 (0.8%) | 323 (0.8%) |
| 90 or more Minutes | 316 (0.7%) | 301 (0.8%) |
Time of Departure to Work by Sex in Overland Park
The most frequent times of departure to work in Overland Park are 7:00 AM to 7:29 AM (7,984, 16.9%) for males and 7:30 AM to 7:59 AM (7,691, 19.3%) for females.
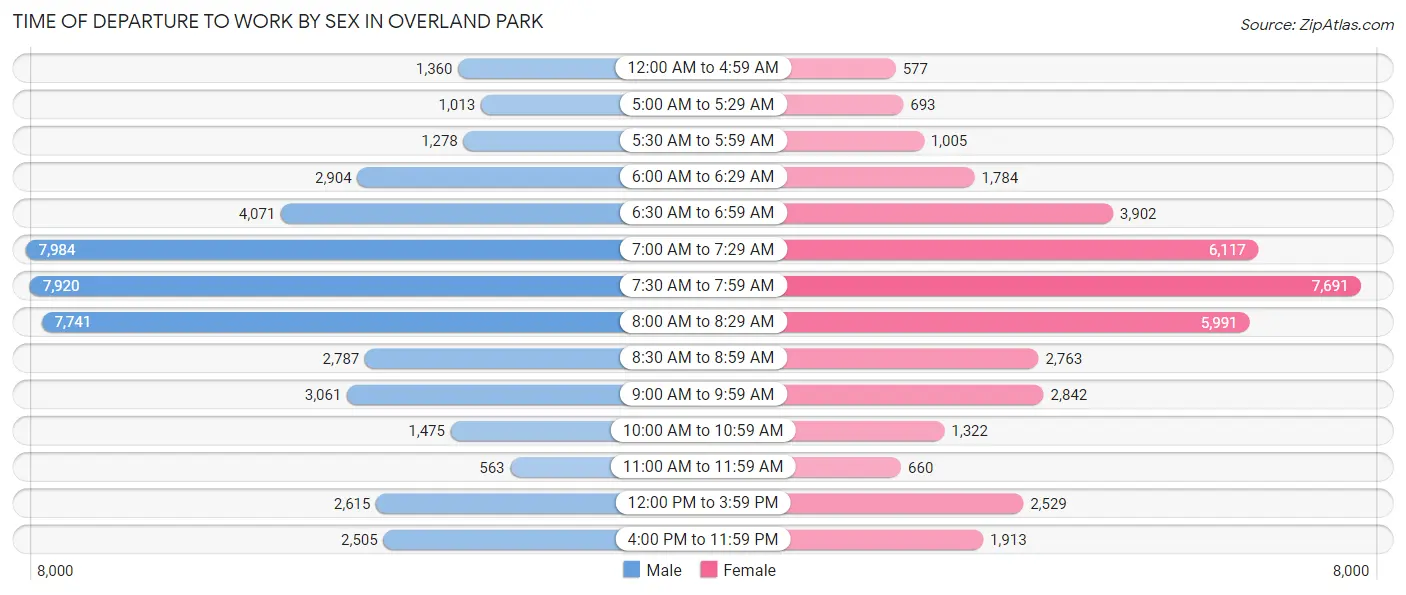
| Time of Departure | Male | Female |
| 12:00 AM to 4:59 AM | 1,360 (2.9%) | 577 (1.5%) |
| 5:00 AM to 5:29 AM | 1,013 (2.1%) | 693 (1.7%) |
| 5:30 AM to 5:59 AM | 1,278 (2.7%) | 1,005 (2.5%) |
| 6:00 AM to 6:29 AM | 2,904 (6.1%) | 1,784 (4.5%) |
| 6:30 AM to 6:59 AM | 4,071 (8.6%) | 3,902 (9.8%) |
| 7:00 AM to 7:29 AM | 7,984 (16.9%) | 6,117 (15.4%) |
| 7:30 AM to 7:59 AM | 7,920 (16.8%) | 7,691 (19.3%) |
| 8:00 AM to 8:29 AM | 7,741 (16.4%) | 5,991 (15.1%) |
| 8:30 AM to 8:59 AM | 2,787 (5.9%) | 2,763 (6.9%) |
| 9:00 AM to 9:59 AM | 3,061 (6.5%) | 2,842 (7.1%) |
| 10:00 AM to 10:59 AM | 1,475 (3.1%) | 1,322 (3.3%) |
| 11:00 AM to 11:59 AM | 563 (1.2%) | 660 (1.7%) |
| 12:00 PM to 3:59 PM | 2,615 (5.5%) | 2,529 (6.4%) |
| 4:00 PM to 11:59 PM | 2,505 (5.3%) | 1,913 (4.8%) |
| Total | 47,277 (100.0%) | 39,789 (100.0%) |
Housing Occupancy in Overland Park
Occupancy by Ownership in Overland Park
Of the total 82,211 dwellings in Overland Park, owner-occupied units account for 51,264 (62.4%), while renter-occupied units make up 30,947 (37.6%).
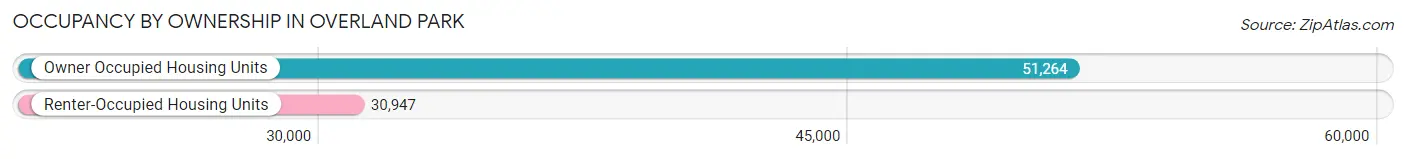
| Occupancy | # Housing Units | % Housing Units |
| Owner Occupied Housing Units | 51,264 | 62.4% |
| Renter-Occupied Housing Units | 30,947 | 37.6% |
| Total Occupied Housing Units | 82,211 | 100.0% |
Occupancy by Household Size in Overland Park
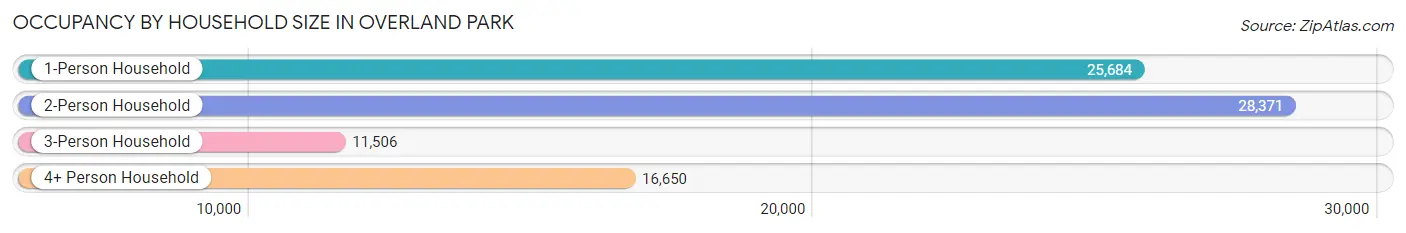
| Household Size | # Housing Units | % Housing Units |
| 1-Person Household | 25,684 | 31.2% |
| 2-Person Household | 28,371 | 34.5% |
| 3-Person Household | 11,506 | 14.0% |
| 4+ Person Household | 16,650 | 20.3% |
| Total Housing Units | 82,211 | 100.0% |
Occupancy by Ownership by Household Size in Overland Park
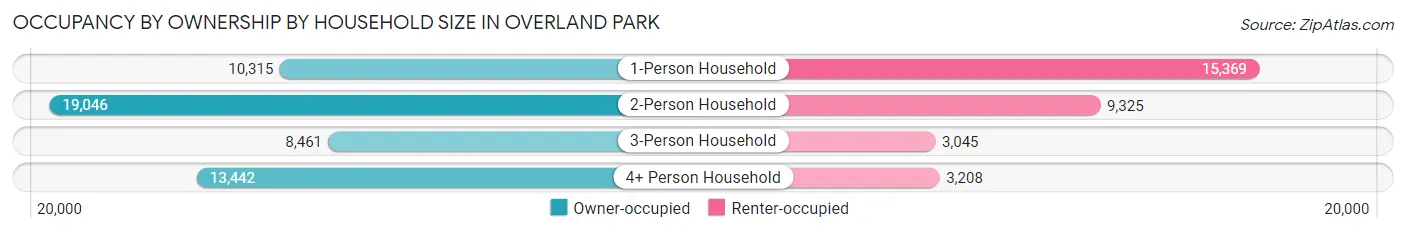
| Household Size | Owner-occupied | Renter-occupied |
| 1-Person Household | 10,315 (40.2%) | 15,369 (59.8%) |
| 2-Person Household | 19,046 (67.1%) | 9,325 (32.9%) |
| 3-Person Household | 8,461 (73.5%) | 3,045 (26.5%) |
| 4+ Person Household | 13,442 (80.7%) | 3,208 (19.3%) |
| Total Housing Units | 51,264 (62.4%) | 30,947 (37.6%) |
Occupancy by Educational Attainment in Overland Park
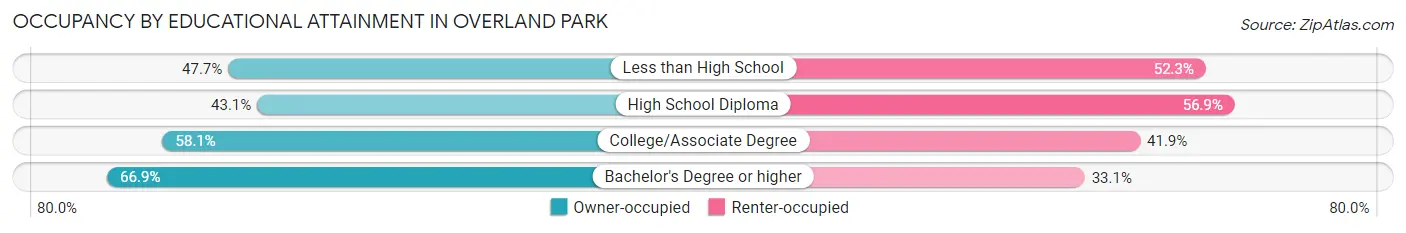
| Household Size | Owner-occupied | Renter-occupied |
| Less than High School | 794 (47.7%) | 870 (52.3%) |
| High School Diploma | 3,087 (43.1%) | 4,072 (56.9%) |
| College/Associate Degree | 11,448 (58.1%) | 8,241 (41.9%) |
| Bachelor's Degree or higher | 35,935 (66.9%) | 17,764 (33.1%) |
Occupancy by Age of Householder in Overland Park
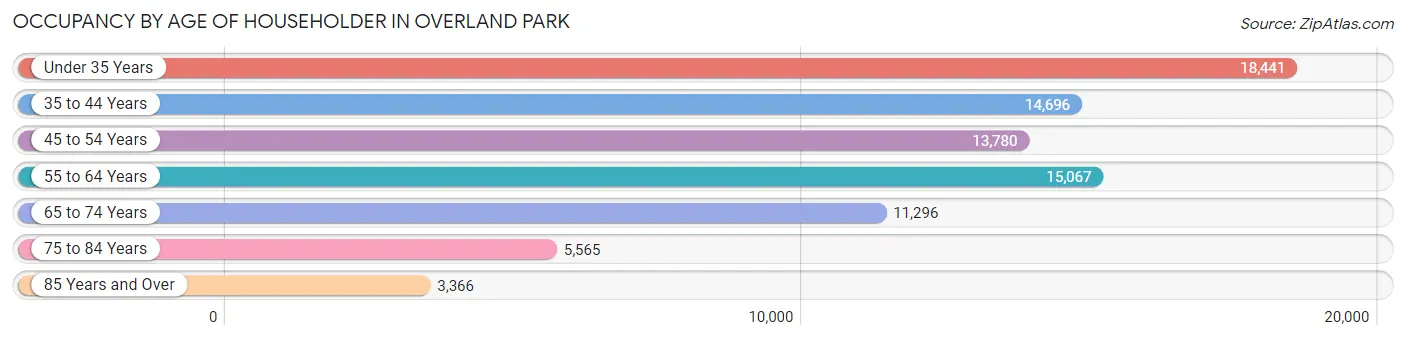
| Age Bracket | # Households | % Households |
| Under 35 Years | 18,441 | 22.4% |
| 35 to 44 Years | 14,696 | 17.9% |
| 45 to 54 Years | 13,780 | 16.8% |
| 55 to 64 Years | 15,067 | 18.3% |
| 65 to 74 Years | 11,296 | 13.7% |
| 75 to 84 Years | 5,565 | 6.8% |
| 85 Years and Over | 3,366 | 4.1% |
| Total | 82,211 | 100.0% |
Housing Finances in Overland Park
Median Income by Occupancy in Overland Park
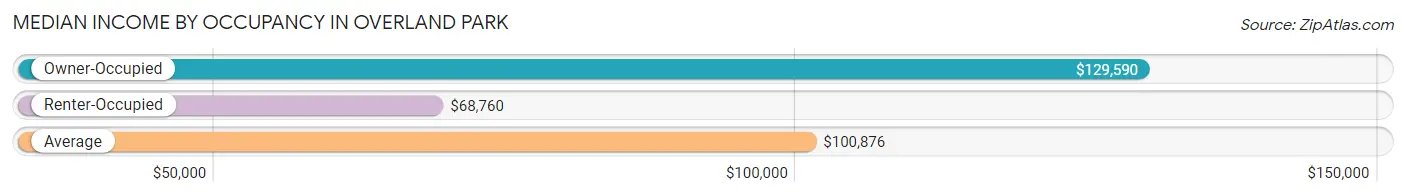
| Occupancy Type | # Households | Median Income |
| Owner-Occupied | 51,264 (62.4%) | $129,590 |
| Renter-Occupied | 30,947 (37.6%) | $68,760 |
| Average | 82,211 (100.0%) | $100,876 |
Occupancy by Householder Income Bracket in Overland Park
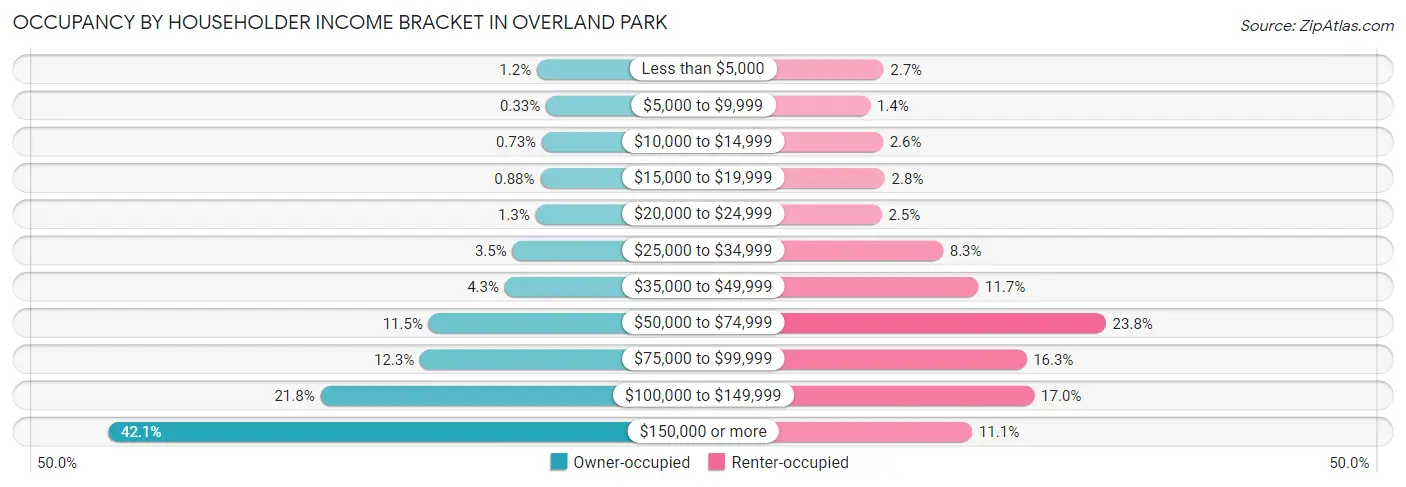
| Income Bracket | Owner-occupied | Renter-occupied |
| Less than $5,000 | 615 (1.2%) | 819 (2.6%) |
| $5,000 to $9,999 | 169 (0.3%) | 423 (1.4%) |
| $10,000 to $14,999 | 374 (0.7%) | 803 (2.6%) |
| $15,000 to $19,999 | 450 (0.9%) | 857 (2.8%) |
| $20,000 to $24,999 | 685 (1.3%) | 764 (2.5%) |
| $25,000 to $34,999 | 1,808 (3.5%) | 2,572 (8.3%) |
| $35,000 to $49,999 | 2,191 (4.3%) | 3,612 (11.7%) |
| $50,000 to $74,999 | 5,901 (11.5%) | 7,371 (23.8%) |
| $75,000 to $99,999 | 6,327 (12.3%) | 5,029 (16.3%) |
| $100,000 to $149,999 | 11,188 (21.8%) | 5,265 (17.0%) |
| $150,000 or more | 21,556 (42.0%) | 3,432 (11.1%) |
| Total | 51,264 (100.0%) | 30,947 (100.0%) |
Monthly Housing Cost Tiers in Overland Park
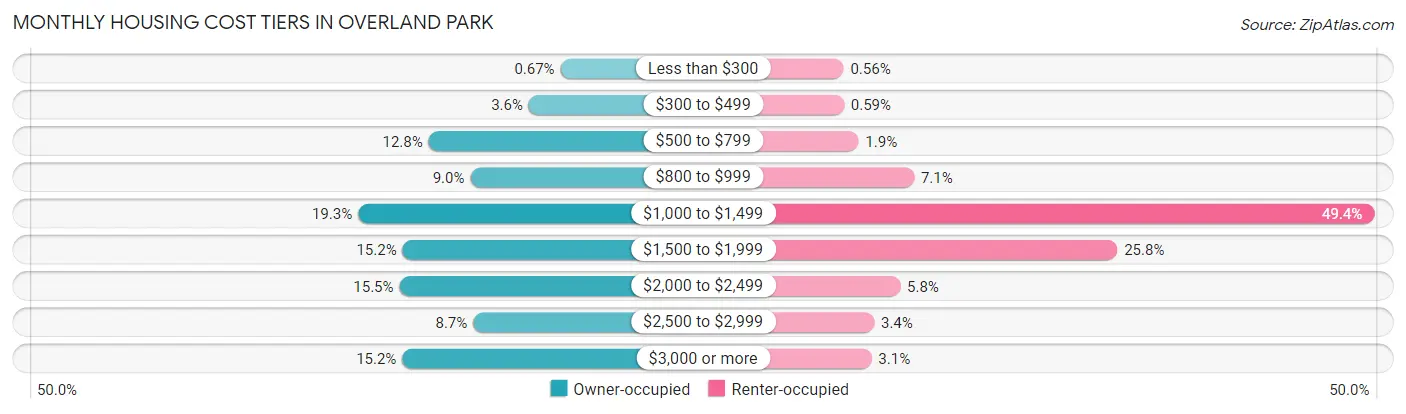
| Monthly Cost | Owner-occupied | Renter-occupied |
| Less than $300 | 344 (0.7%) | 172 (0.6%) |
| $300 to $499 | 1,834 (3.6%) | 184 (0.6%) |
| $500 to $799 | 6,565 (12.8%) | 598 (1.9%) |
| $800 to $999 | 4,596 (9.0%) | 2,183 (7.0%) |
| $1,000 to $1,499 | 9,900 (19.3%) | 15,292 (49.4%) |
| $1,500 to $1,999 | 7,799 (15.2%) | 7,973 (25.8%) |
| $2,000 to $2,499 | 7,948 (15.5%) | 1,786 (5.8%) |
| $2,500 to $2,999 | 4,465 (8.7%) | 1,043 (3.4%) |
| $3,000 or more | 7,813 (15.2%) | 968 (3.1%) |
| Total | 51,264 (100.0%) | 30,947 (100.0%) |
Physical Housing Characteristics in Overland Park
Housing Structures in Overland Park
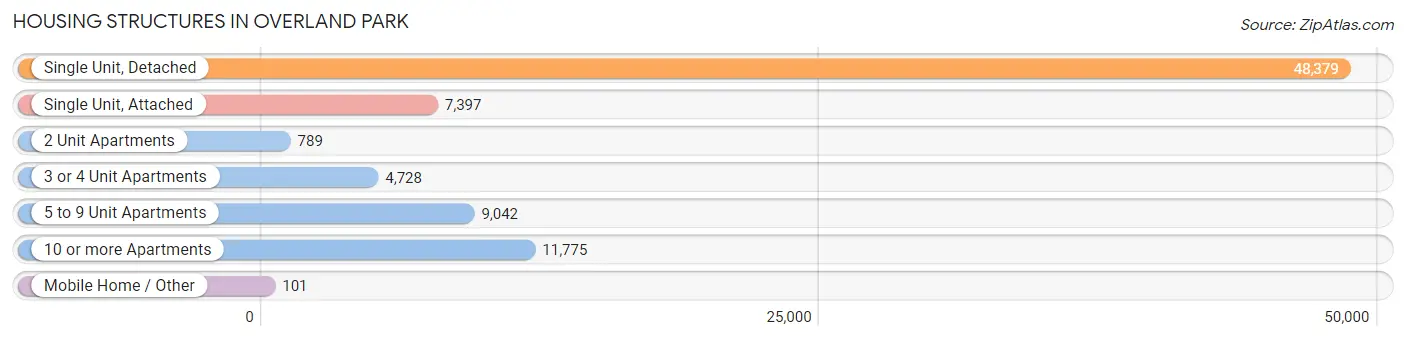
| Structure Type | # Housing Units | % Housing Units |
| Single Unit, Detached | 48,379 | 58.9% |
| Single Unit, Attached | 7,397 | 9.0% |
| 2 Unit Apartments | 789 | 1.0% |
| 3 or 4 Unit Apartments | 4,728 | 5.8% |
| 5 to 9 Unit Apartments | 9,042 | 11.0% |
| 10 or more Apartments | 11,775 | 14.3% |
| Mobile Home / Other | 101 | 0.1% |
| Total | 82,211 | 100.0% |
Housing Structures by Occupancy in Overland Park
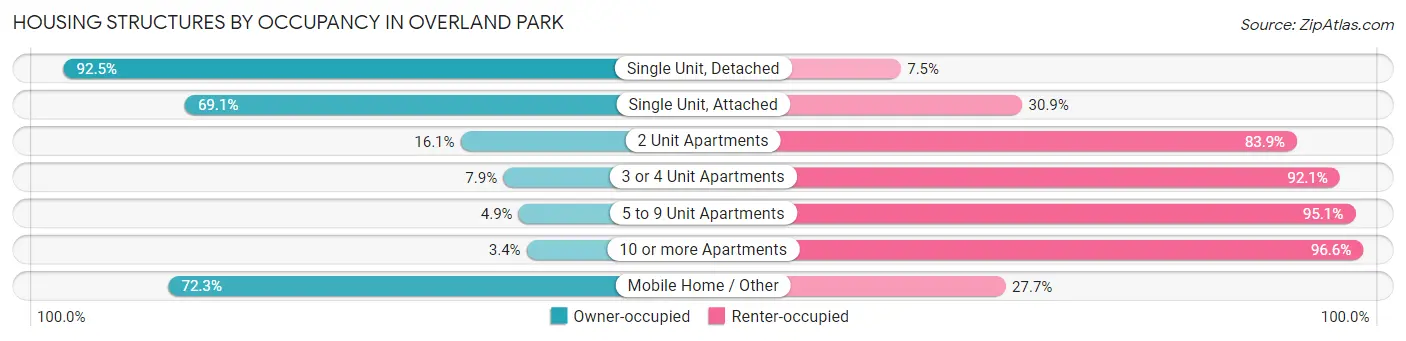
| Structure Type | Owner-occupied | Renter-occupied |
| Single Unit, Detached | 44,737 (92.5%) | 3,642 (7.5%) |
| Single Unit, Attached | 5,112 (69.1%) | 2,285 (30.9%) |
| 2 Unit Apartments | 127 (16.1%) | 662 (83.9%) |
| 3 or 4 Unit Apartments | 373 (7.9%) | 4,355 (92.1%) |
| 5 to 9 Unit Apartments | 445 (4.9%) | 8,597 (95.1%) |
| 10 or more Apartments | 397 (3.4%) | 11,378 (96.6%) |
| Mobile Home / Other | 73 (72.3%) | 28 (27.7%) |
| Total | 51,264 (62.4%) | 30,947 (37.6%) |
Housing Structures by Number of Rooms in Overland Park
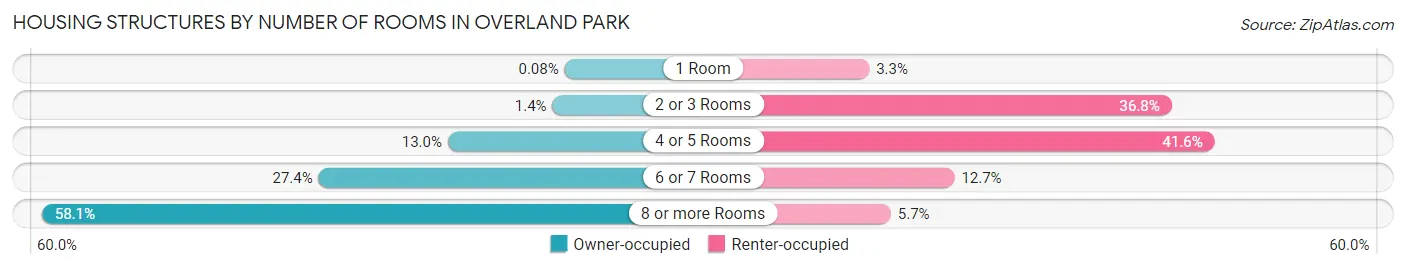
| Number of Rooms | Owner-occupied | Renter-occupied |
| 1 Room | 42 (0.1%) | 1,006 (3.3%) |
| 2 or 3 Rooms | 727 (1.4%) | 11,391 (36.8%) |
| 4 or 5 Rooms | 6,679 (13.0%) | 12,868 (41.6%) |
| 6 or 7 Rooms | 14,038 (27.4%) | 3,932 (12.7%) |
| 8 or more Rooms | 29,778 (58.1%) | 1,750 (5.7%) |
| Total | 51,264 (100.0%) | 30,947 (100.0%) |
Housing Structure by Heating Type in Overland Park
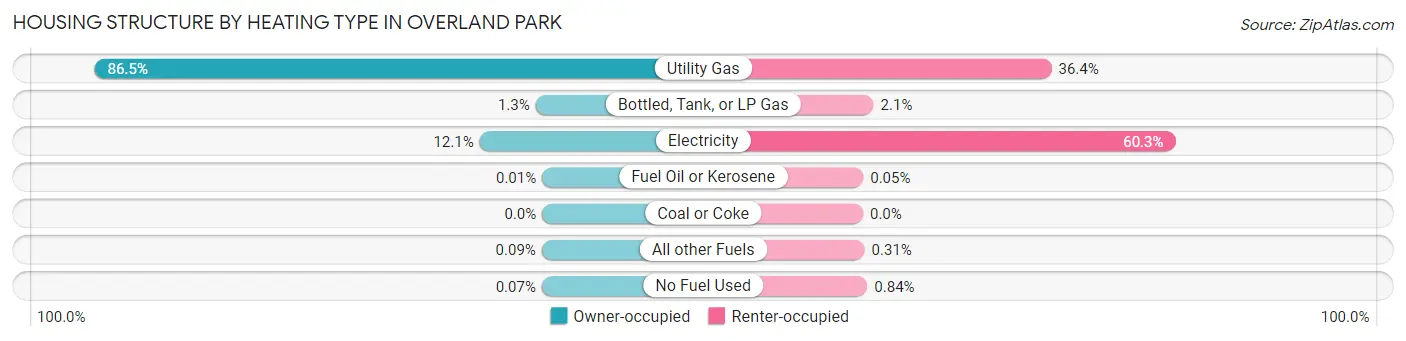
| Heating Type | Owner-occupied | Renter-occupied |
| Utility Gas | 44,328 (86.5%) | 11,271 (36.4%) |
| Bottled, Tank, or LP Gas | 650 (1.3%) | 634 (2.1%) |
| Electricity | 6,202 (12.1%) | 18,670 (60.3%) |
| Fuel Oil or Kerosene | 3 (0.0%) | 17 (0.1%) |
| Coal or Coke | 0 (0.0%) | 0 (0.0%) |
| All other Fuels | 44 (0.1%) | 96 (0.3%) |
| No Fuel Used | 37 (0.1%) | 259 (0.8%) |
| Total | 51,264 (100.0%) | 30,947 (100.0%) |
Household Vehicle Usage in Overland Park
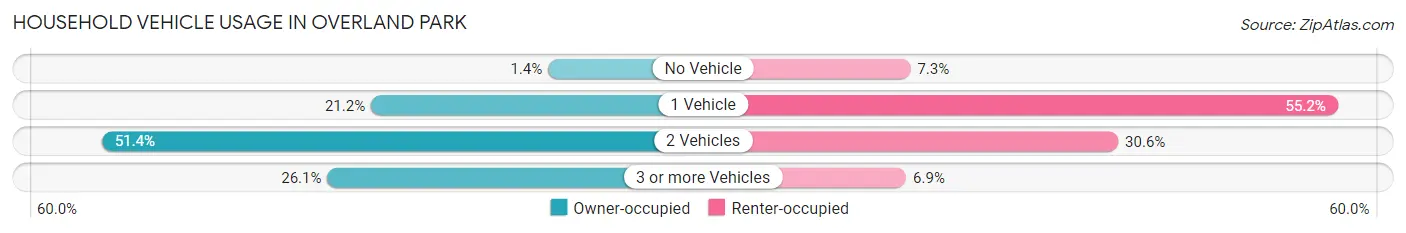
| Vehicles per Household | Owner-occupied | Renter-occupied |
| No Vehicle | 696 (1.4%) | 2,271 (7.3%) |
| 1 Vehicle | 10,867 (21.2%) | 17,081 (55.2%) |
| 2 Vehicles | 26,327 (51.4%) | 9,472 (30.6%) |
| 3 or more Vehicles | 13,374 (26.1%) | 2,123 (6.9%) |
| Total | 51,264 (100.0%) | 30,947 (100.0%) |
Real Estate & Mortgages in Overland Park
Real Estate and Mortgage Overview in Overland Park
| Characteristic | Without Mortgage | With Mortgage |
| Housing Units | 16,673 | 34,591 |
| Median Property Value | $346,400 | $368,700 |
| Median Household Income | $99,625 | $16,600 |
| Monthly Housing Costs | $798 | $7,709 |
| Real Estate Taxes | $3,862 | $375 |
Property Value by Mortgage Status in Overland Park
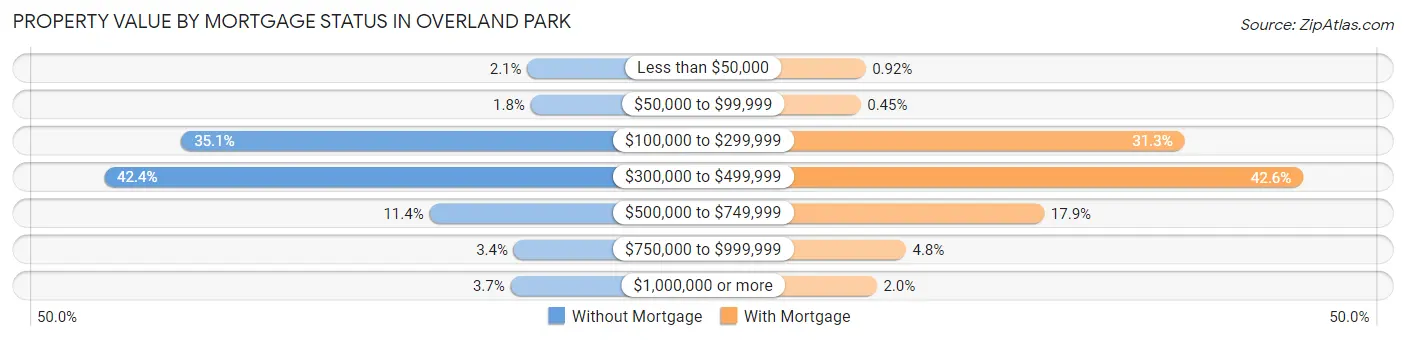
| Property Value | Without Mortgage | With Mortgage |
| Less than $50,000 | 353 (2.1%) | 318 (0.9%) |
| $50,000 to $99,999 | 300 (1.8%) | 154 (0.4%) |
| $100,000 to $299,999 | 5,849 (35.1%) | 10,838 (31.3%) |
| $300,000 to $499,999 | 7,075 (42.4%) | 14,744 (42.6%) |
| $500,000 to $749,999 | 1,907 (11.4%) | 6,205 (17.9%) |
| $750,000 to $999,999 | 569 (3.4%) | 1,645 (4.8%) |
| $1,000,000 or more | 620 (3.7%) | 687 (2.0%) |
| Total | 16,673 (100.0%) | 34,591 (100.0%) |
Household Income by Mortgage Status in Overland Park
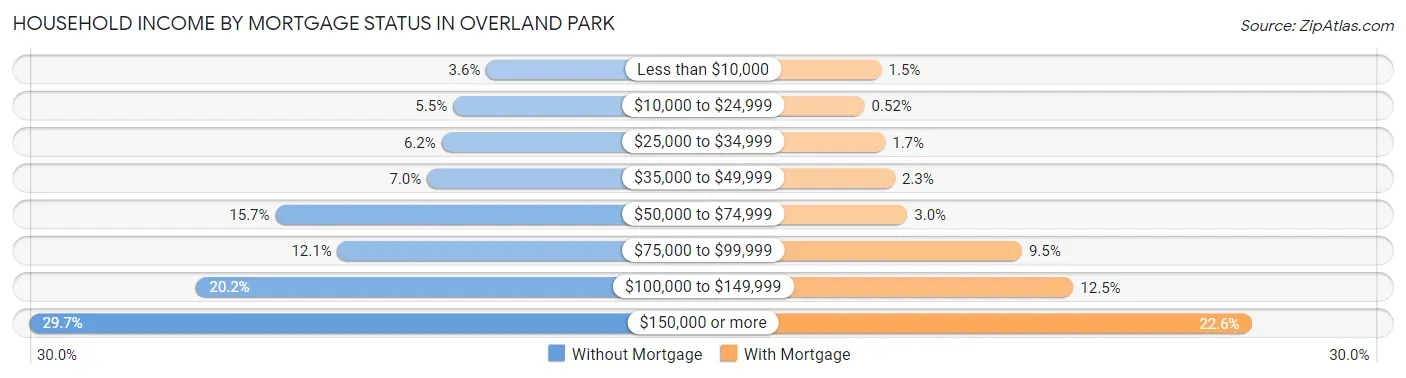
| Household Income | Without Mortgage | With Mortgage |
| Less than $10,000 | 604 (3.6%) | 515 (1.5%) |
| $10,000 to $24,999 | 921 (5.5%) | 180 (0.5%) |
| $25,000 to $34,999 | 1,028 (6.2%) | 588 (1.7%) |
| $35,000 to $49,999 | 1,167 (7.0%) | 780 (2.2%) |
| $50,000 to $74,999 | 2,612 (15.7%) | 1,024 (3.0%) |
| $75,000 to $99,999 | 2,021 (12.1%) | 3,289 (9.5%) |
| $100,000 to $149,999 | 3,364 (20.2%) | 4,306 (12.4%) |
| $150,000 or more | 4,956 (29.7%) | 7,824 (22.6%) |
| Total | 16,673 (100.0%) | 34,591 (100.0%) |
Property Value to Household Income Ratio in Overland Park
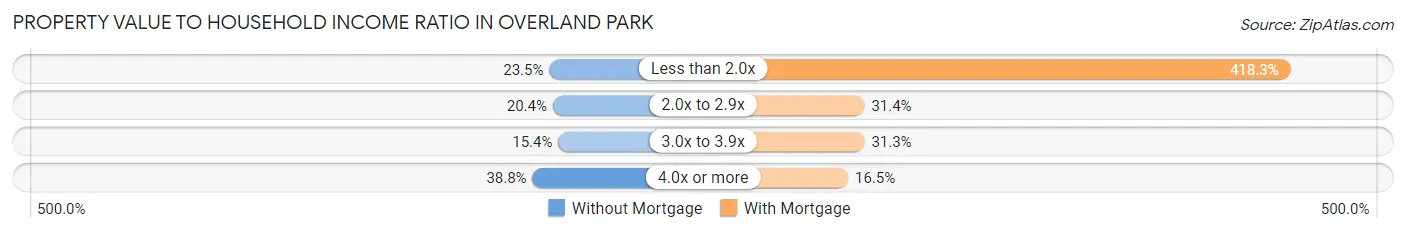
| Value-to-Income Ratio | Without Mortgage | With Mortgage |
| Less than 2.0x | 3,923 (23.5%) | 144,701 (418.3%) |
| 2.0x to 2.9x | 3,394 (20.4%) | 10,847 (31.4%) |
| 3.0x to 3.9x | 2,569 (15.4%) | 10,841 (31.3%) |
| 4.0x or more | 6,474 (38.8%) | 5,721 (16.5%) |
| Total | 16,673 (100.0%) | 34,591 (100.0%) |
Real Estate Taxes by Mortgage Status in Overland Park
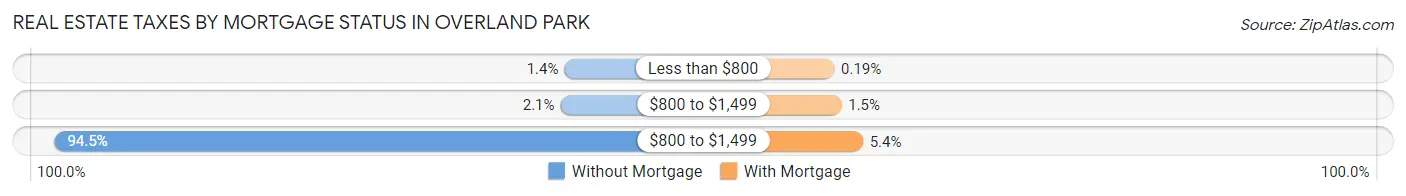
| Property Taxes | Without Mortgage | With Mortgage |
| Less than $800 | 239 (1.4%) | 67 (0.2%) |
| $800 to $1,499 | 356 (2.1%) | 520 (1.5%) |
| $800 to $1,499 | 15,763 (94.5%) | 1,874 (5.4%) |
| Total | 16,673 (100.0%) | 34,591 (100.0%) |
Health & Disability in Overland Park
Health Insurance Coverage by Age in Overland Park
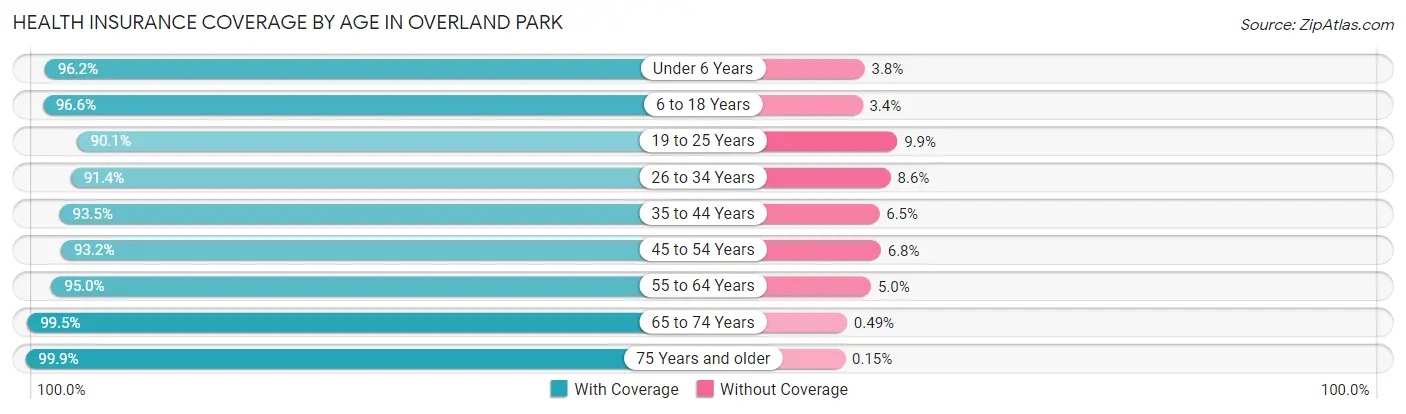
| Age Bracket | With Coverage | Without Coverage |
| Under 6 Years | 12,822 (96.2%) | 504 (3.8%) |
| 6 to 18 Years | 31,797 (96.6%) | 1,116 (3.4%) |
| 19 to 25 Years | 15,200 (90.1%) | 1,667 (9.9%) |
| 26 to 34 Years | 23,144 (91.4%) | 2,186 (8.6%) |
| 35 to 44 Years | 25,354 (93.5%) | 1,768 (6.5%) |
| 45 to 54 Years | 22,869 (93.2%) | 1,668 (6.8%) |
| 55 to 64 Years | 23,201 (95.0%) | 1,217 (5.0%) |
| 65 to 74 Years | 18,167 (99.5%) | 89 (0.5%) |
| 75 Years and older | 12,593 (99.9%) | 19 (0.2%) |
| Total | 185,147 (94.8%) | 10,234 (5.2%) |
Health Insurance Coverage by Citizenship Status in Overland Park
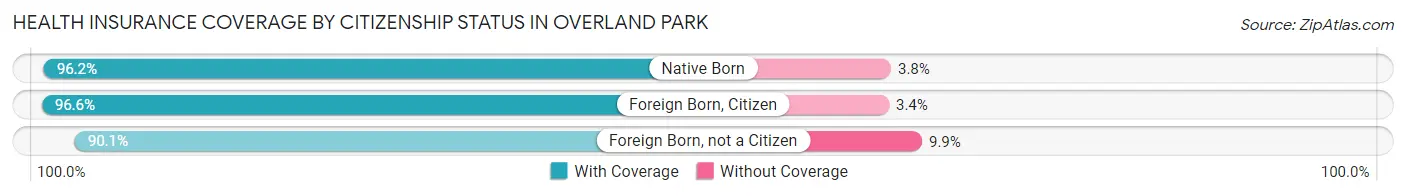
| Citizenship Status | With Coverage | Without Coverage |
| Native Born | 12,822 (96.2%) | 504 (3.8%) |
| Foreign Born, Citizen | 31,797 (96.6%) | 1,116 (3.4%) |
| Foreign Born, not a Citizen | 15,200 (90.1%) | 1,667 (9.9%) |
Health Insurance Coverage by Household Income in Overland Park
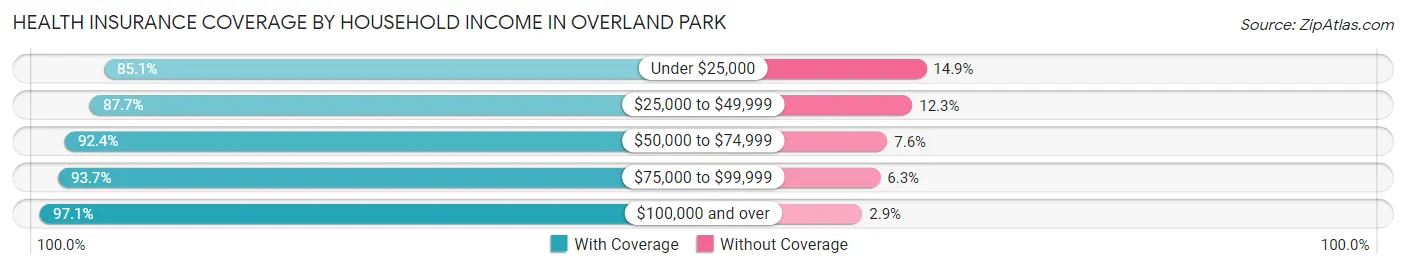
| Household Income | With Coverage | Without Coverage |
| Under $25,000 | 6,989 (85.1%) | 1,225 (14.9%) |
| $25,000 to $49,999 | 13,955 (87.7%) | 1,954 (12.3%) |
| $50,000 to $74,999 | 22,316 (92.4%) | 1,835 (7.6%) |
| $75,000 to $99,999 | 23,666 (93.7%) | 1,588 (6.3%) |
| $100,000 and over | 117,949 (97.1%) | 3,551 (2.9%) |
Public vs Private Health Insurance Coverage by Age in Overland Park
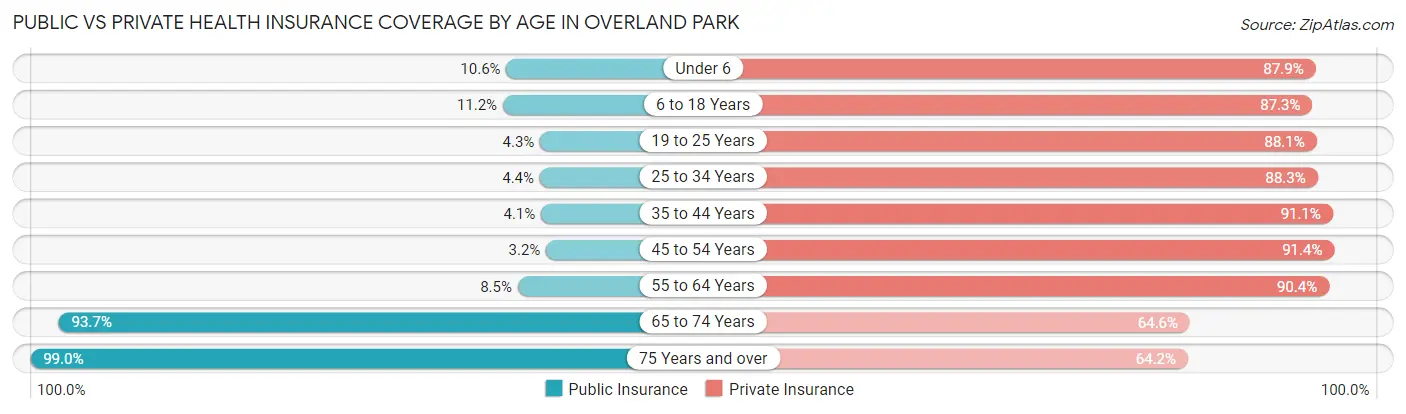
| Age Bracket | Public Insurance | Private Insurance |
| Under 6 | 1,408 (10.6%) | 11,718 (87.9%) |
| 6 to 18 Years | 3,689 (11.2%) | 28,744 (87.3%) |
| 19 to 25 Years | 725 (4.3%) | 14,862 (88.1%) |
| 25 to 34 Years | 1,104 (4.4%) | 22,366 (88.3%) |
| 35 to 44 Years | 1,119 (4.1%) | 24,711 (91.1%) |
| 45 to 54 Years | 782 (3.2%) | 22,428 (91.4%) |
| 55 to 64 Years | 2,064 (8.5%) | 22,083 (90.4%) |
| 65 to 74 Years | 17,105 (93.7%) | 11,794 (64.6%) |
| 75 Years and over | 12,479 (99.0%) | 8,101 (64.2%) |
| Total | 40,475 (20.7%) | 166,807 (85.4%) |
Disability Status by Sex by Age in Overland Park
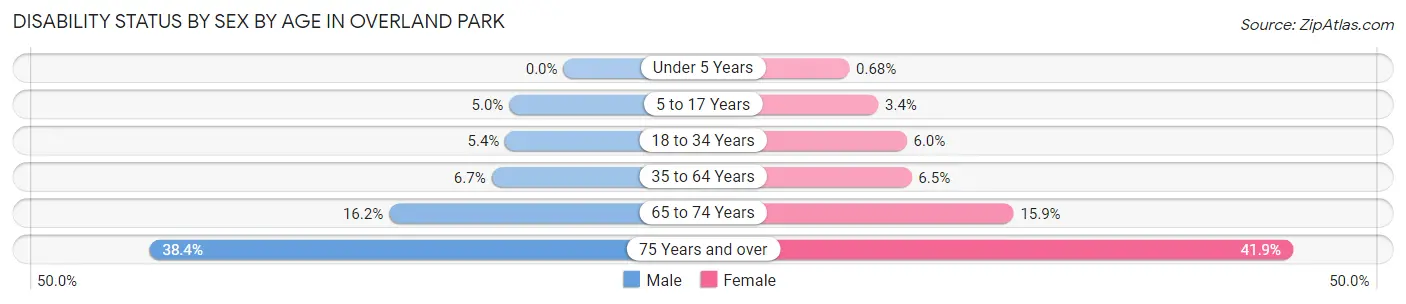
| Age Bracket | Male | Female |
| Under 5 Years | 0 (0.0%) | 37 (0.7%) |
| 5 to 17 Years | 826 (5.0%) | 531 (3.4%) |
| 18 to 34 Years | 1,280 (5.4%) | 1,287 (6.0%) |
| 35 to 64 Years | 2,516 (6.7%) | 2,479 (6.5%) |
| 65 to 74 Years | 1,378 (16.2%) | 1,551 (15.9%) |
| 75 Years and over | 1,959 (38.4%) | 3,144 (41.9%) |
Disability Class by Sex by Age in Overland Park
Disability Class: Hearing Difficulty
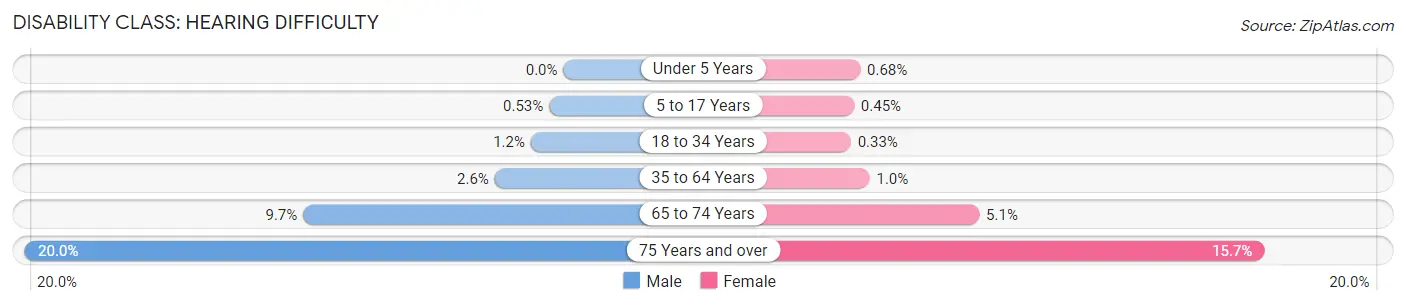
| Age Bracket | Male | Female |
| Under 5 Years | 0 (0.0%) | 37 (0.7%) |
| 5 to 17 Years | 87 (0.5%) | 71 (0.4%) |
| 18 to 34 Years | 287 (1.2%) | 70 (0.3%) |
| 35 to 64 Years | 962 (2.5%) | 394 (1.0%) |
| 65 to 74 Years | 823 (9.7%) | 497 (5.1%) |
| 75 Years and over | 1,019 (20.0%) | 1,178 (15.7%) |
Disability Class: Vision Difficulty
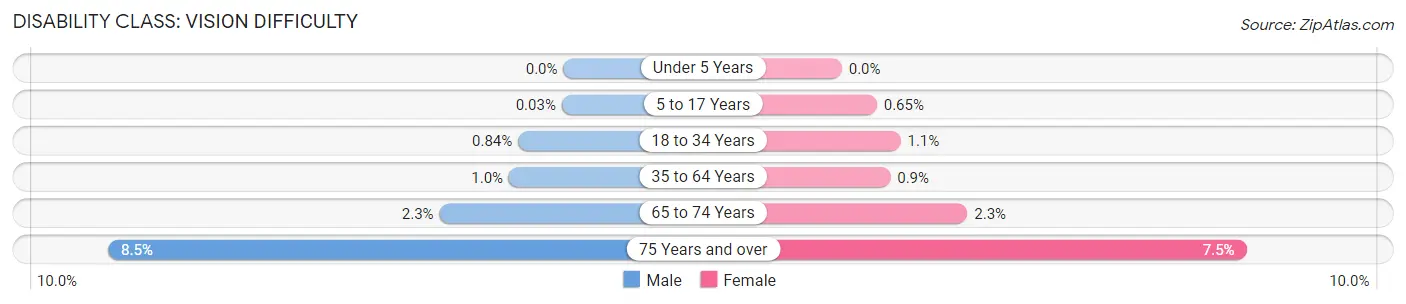
| Age Bracket | Male | Female |
| Under 5 Years | 0 (0.0%) | 0 (0.0%) |
| 5 to 17 Years | 5 (0.0%) | 103 (0.6%) |
| 18 to 34 Years | 200 (0.8%) | 234 (1.1%) |
| 35 to 64 Years | 379 (1.0%) | 344 (0.9%) |
| 65 to 74 Years | 196 (2.3%) | 227 (2.3%) |
| 75 Years and over | 431 (8.5%) | 564 (7.5%) |
Disability Class: Cognitive Difficulty
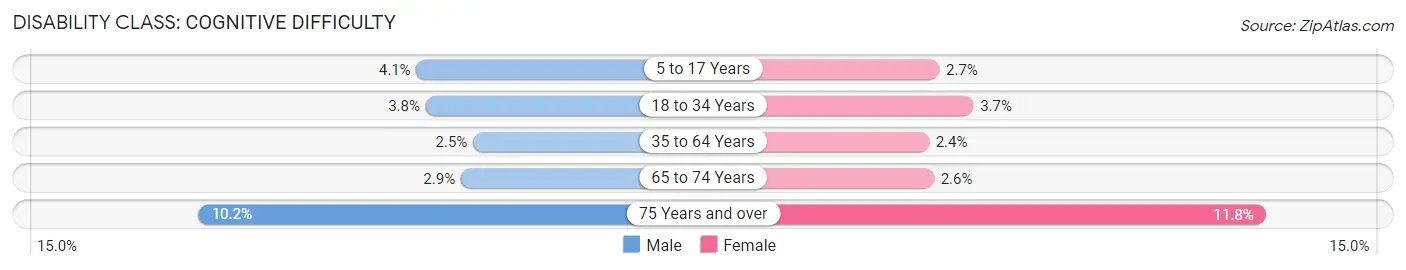
| Age Bracket | Male | Female |
| 5 to 17 Years | 671 (4.1%) | 427 (2.7%) |
| 18 to 34 Years | 907 (3.8%) | 784 (3.7%) |
| 35 to 64 Years | 947 (2.5%) | 929 (2.4%) |
| 65 to 74 Years | 243 (2.9%) | 249 (2.6%) |
| 75 Years and over | 518 (10.2%) | 886 (11.8%) |
Disability Class: Ambulatory Difficulty
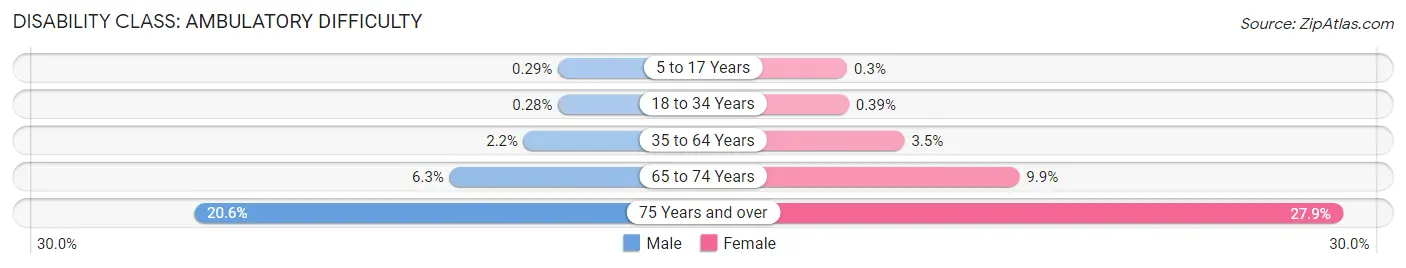
| Age Bracket | Male | Female |
| 5 to 17 Years | 47 (0.3%) | 47 (0.3%) |
| 18 to 34 Years | 66 (0.3%) | 83 (0.4%) |
| 35 to 64 Years | 830 (2.2%) | 1,338 (3.5%) |
| 65 to 74 Years | 539 (6.3%) | 963 (9.9%) |
| 75 Years and over | 1,049 (20.6%) | 2,094 (27.9%) |
Disability Class: Self-Care Difficulty
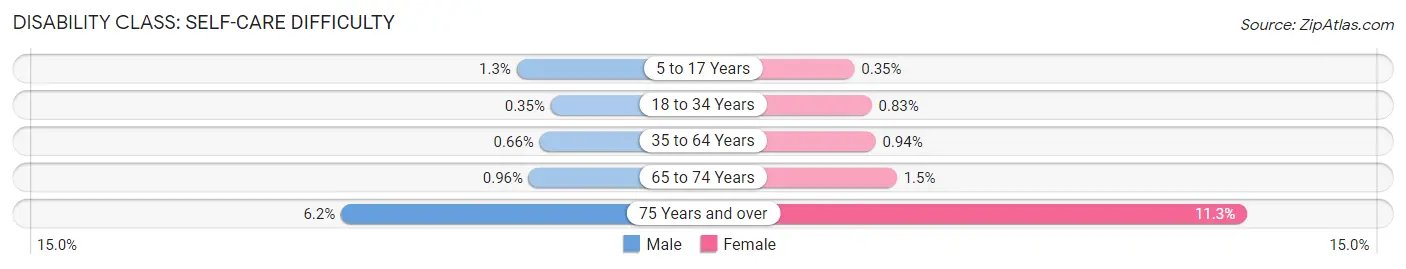
| Age Bracket | Male | Female |
| 5 to 17 Years | 213 (1.3%) | 55 (0.4%) |
| 18 to 34 Years | 82 (0.4%) | 177 (0.8%) |
| 35 to 64 Years | 250 (0.7%) | 359 (0.9%) |
| 65 to 74 Years | 82 (1.0%) | 149 (1.5%) |
| 75 Years and over | 316 (6.2%) | 847 (11.3%) |
Technology Access in Overland Park
Computing Device Access in Overland Park
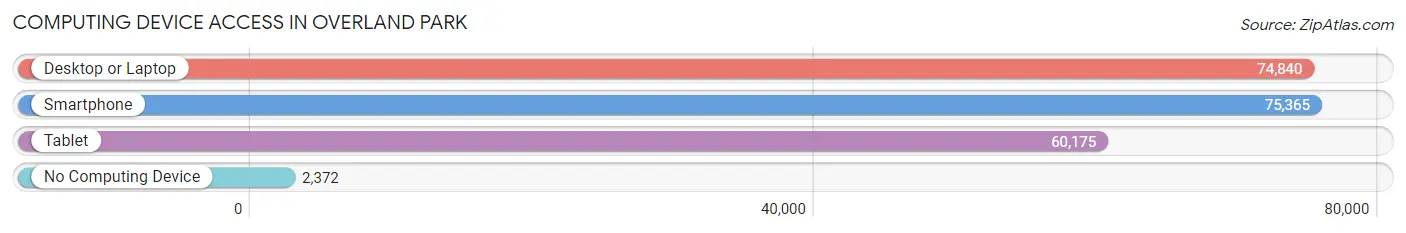
| Device Type | # Households | % Households |
| Desktop or Laptop | 74,840 | 91.0% |
| Smartphone | 75,365 | 91.7% |
| Tablet | 60,175 | 73.2% |
| No Computing Device | 2,372 | 2.9% |
| Total | 82,211 | 100.0% |
Internet Access in Overland Park
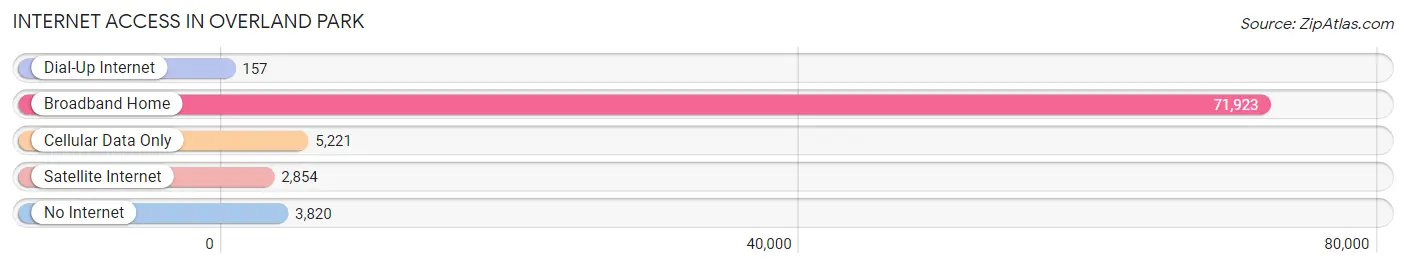
| Internet Type | # Households | % Households |
| Dial-Up Internet | 157 | 0.2% |
| Broadband Home | 71,923 | 87.5% |
| Cellular Data Only | 5,221 | 6.4% |
| Satellite Internet | 2,854 | 3.5% |
| No Internet | 3,820 | 4.6% |
| Total | 82,211 | 100.0% |
Overland Park Summary
Overland Park, Kansas is a city located in Johnson County, Kansas, United States. It is the second most populous city in the state, with a population of over 191,000 as of the 2010 census. The city is part of the Kansas City metropolitan area, and is located approximately 15 miles southwest of downtown Kansas City, Missouri.
History
Overland Park was founded in 1905 by William B. Strang Jr., who named the city after his hometown of Overland Park, Kansas. The city was incorporated in 1960, and has since grown to become the second largest city in the state.
Geography
Overland Park is located in Johnson County, Kansas, at the intersection of Interstate 435 and US Highway 69. The city covers an area of approximately 75 square miles, and is bordered by the cities of Olathe, Lenexa, and Leawood. The city is situated on the edge of the Great Plains, and is characterized by rolling hills and wooded areas.
Climate
Overland Park has a humid continental climate, with hot, humid summers and cold, dry winters. The average annual temperature is around 54°F, with an average high of around 87°F in the summer and an average low of around 21°F in the winter. The city receives an average of around 37 inches of precipitation per year, with most of it falling in the spring and summer months.
Economy
Overland Park is home to a diverse economy, with a variety of industries represented. The city is home to several large corporations, including Sprint, Black & Veatch, and YRC Worldwide. The city is also home to a number of smaller businesses, including restaurants, retail stores, and professional services.
Demographics
As of the 2010 census, Overland Park had a population of 191,278. The racial makeup of the city was 79.2% White, 8.2% African American, 0.4% Native American, 6.3% Asian, 0.1% Pacific Islander, 2.7% from other races, and 2.3% from two or more races. Hispanic or Latino of any race were 6.7% of the population.
The median income for a household in the city was $68,824, and the median income for a family was $81,856. The per capita income for the city was $35,945. About 4.2% of families and 6.2% of the population were below the poverty line, including 8.2% of those under age 18 and 4.2% of those age 65 or over.
Overland Park is a diverse and vibrant city, with a strong economy and a variety of cultural and recreational activities. The city is home to a number of parks, museums, and other attractions, making it an ideal place to live and work.
Common Questions
What is Per Capita Income in Overland Park?
Per Capita income in Overland Park is $57,411.
What is the Median Family Income in Overland Park?
Median Family Income in Overland Park is $131,868.
What is the Median Household income in Overland Park?
Median Household Income in Overland Park is $100,876.
What is Income or Wage Gap in Overland Park?
Income or Wage Gap in Overland Park is 29.9%.
Women in Overland Park earn 70.1 cents for every dollar earned by a man.
What is Family Income Deficit in Overland Park?
Family Income Deficit in Overland Park is $10,185.
Families that are below poverty line in Overland Park earn $10,185 less on average than the poverty threshold level.
What is Inequality or Gini Index in Overland Park?
Inequality or Gini Index in Overland Park is 0.44.
What is the Total Population of Overland Park?
Total Population of Overland Park is 196,676.
What is the Total Male Population of Overland Park?
Total Male Population of Overland Park is 97,729.
What is the Total Female Population of Overland Park?
Total Female Population of Overland Park is 98,947.
What is the Ratio of Males per 100 Females in Overland Park?
There are 98.77 Males per 100 Females in Overland Park.
What is the Ratio of Females per 100 Males in Overland Park?
There are 101.25 Females per 100 Males in Overland Park.
What is the Median Population Age in Overland Park?
Median Population Age in Overland Park is 38.4 Years.
What is the Average Family Size in Overland Park
Average Family Size in Overland Park is 3.0 People.
What is the Average Household Size in Overland Park
Average Household Size in Overland Park is 2.4 People.
How Large is the Labor Force in Overland Park?
There are 114,277 People in the Labor Forcein in Overland Park.
What is the Percentage of People in the Labor Force in Overland Park?
71.8% of People are in the Labor Force in Overland Park.
What is the Unemployment Rate in Overland Park?
Unemployment Rate in Overland Park is 3.2%.