Salina, KS Map & Demographics
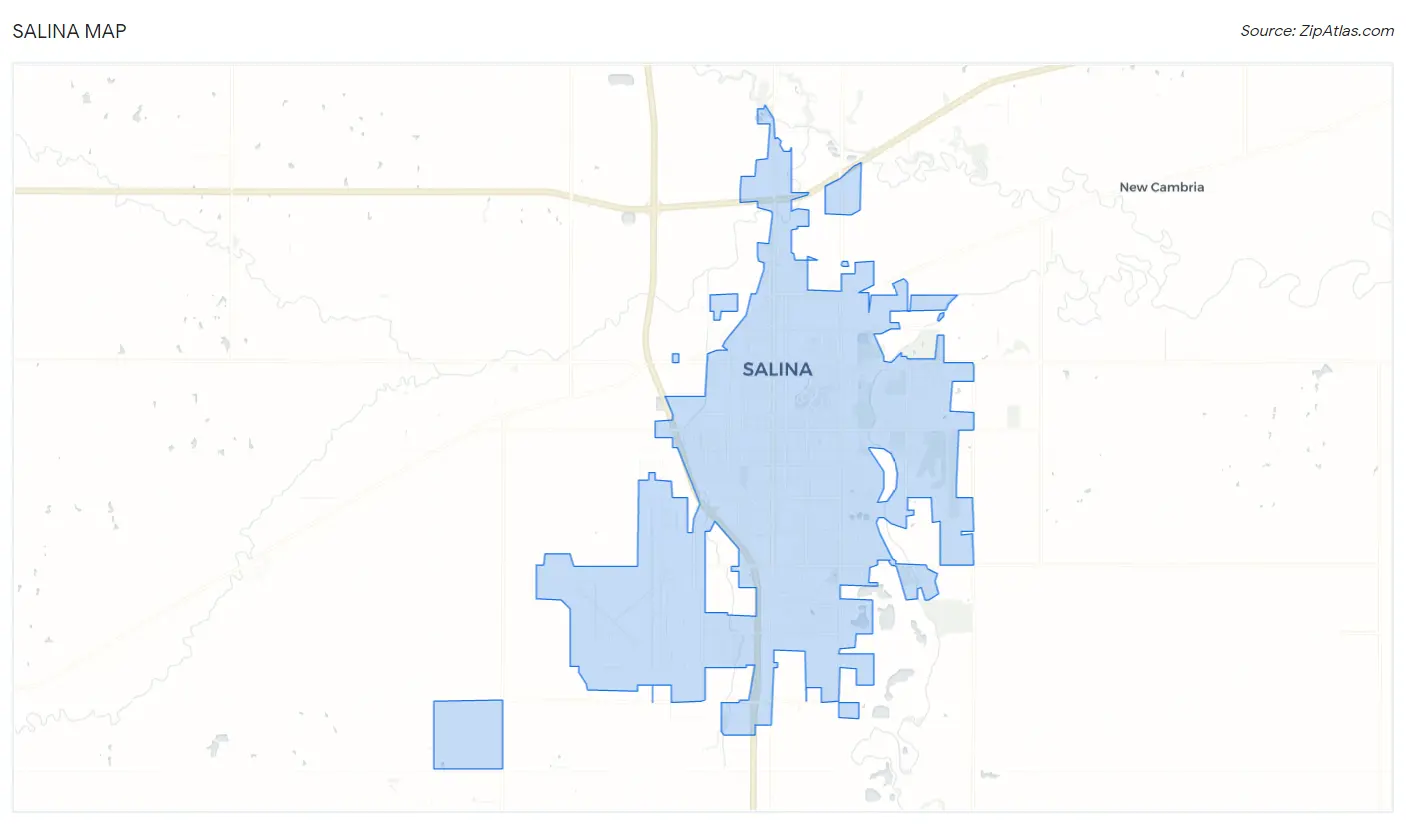
Salina Map
Salina Overview
$31,477
PER CAPITA INCOME
$77,385
AVG FAMILY INCOME
$56,945
AVG HOUSEHOLD INCOME
22.4%
WAGE / INCOME GAP [ % ]
77.6¢/ $1
WAGE / INCOME GAP [ $ ]
$10,052
FAMILY INCOME DEFICIT
0.44
INEQUALITY / GINI INDEX
46,734
TOTAL POPULATION
23,090
MALE POPULATION
23,644
FEMALE POPULATION
97.66
MALES / 100 FEMALES
102.40
FEMALES / 100 MALES
39.0
MEDIAN AGE
3.1
AVG FAMILY SIZE
2.3
AVG HOUSEHOLD SIZE
24,755
LABOR FORCE [ PEOPLE ]
66.3%
PERCENT IN LABOR FORCE
4.0%
UNEMPLOYMENT RATE
Salina Zip Codes
Salina Area Codes
Income in Salina
Income Overview in Salina
Per Capita Income in Salina is $31,477, while median incomes of families and households are $77,385 and $56,945 respectively.
| Characteristic | Number | Measure |
| Per Capita Income | 46,734 | $31,477 |
| Median Family Income | 11,011 | $77,385 |
| Mean Family Income | 11,011 | $95,522 |
| Median Household Income | 19,442 | $56,945 |
| Mean Household Income | 19,442 | $72,918 |
| Income Deficit | 11,011 | $10,052 |
| Wage / Income Gap (%) | 46,734 | 22.42% |
| Wage / Income Gap ($) | 46,734 | 77.58¢ per $1 |
| Gini / Inequality Index | 46,734 | 0.44 |
Earnings by Sex in Salina
Average Earnings in Salina are $34,000, $38,582 for men and $29,933 for women, a difference of 22.4%.
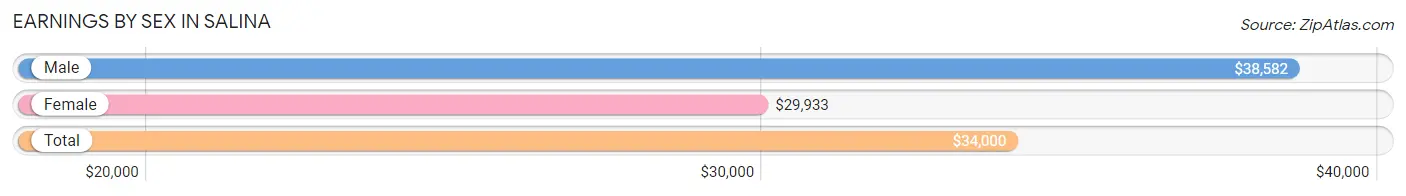
| Sex | Number | Average Earnings |
| Male | 13,478 (51.8%) | $38,582 |
| Female | 12,531 (48.2%) | $29,933 |
| Total | 26,009 (100.0%) | $34,000 |
Earnings by Sex by Income Bracket in Salina
The most common earnings brackets in Salina are $75,000 to $99,999 for men (1,449 | 10.7%) and $25,000 to $29,999 for women (1,287 | 10.3%).
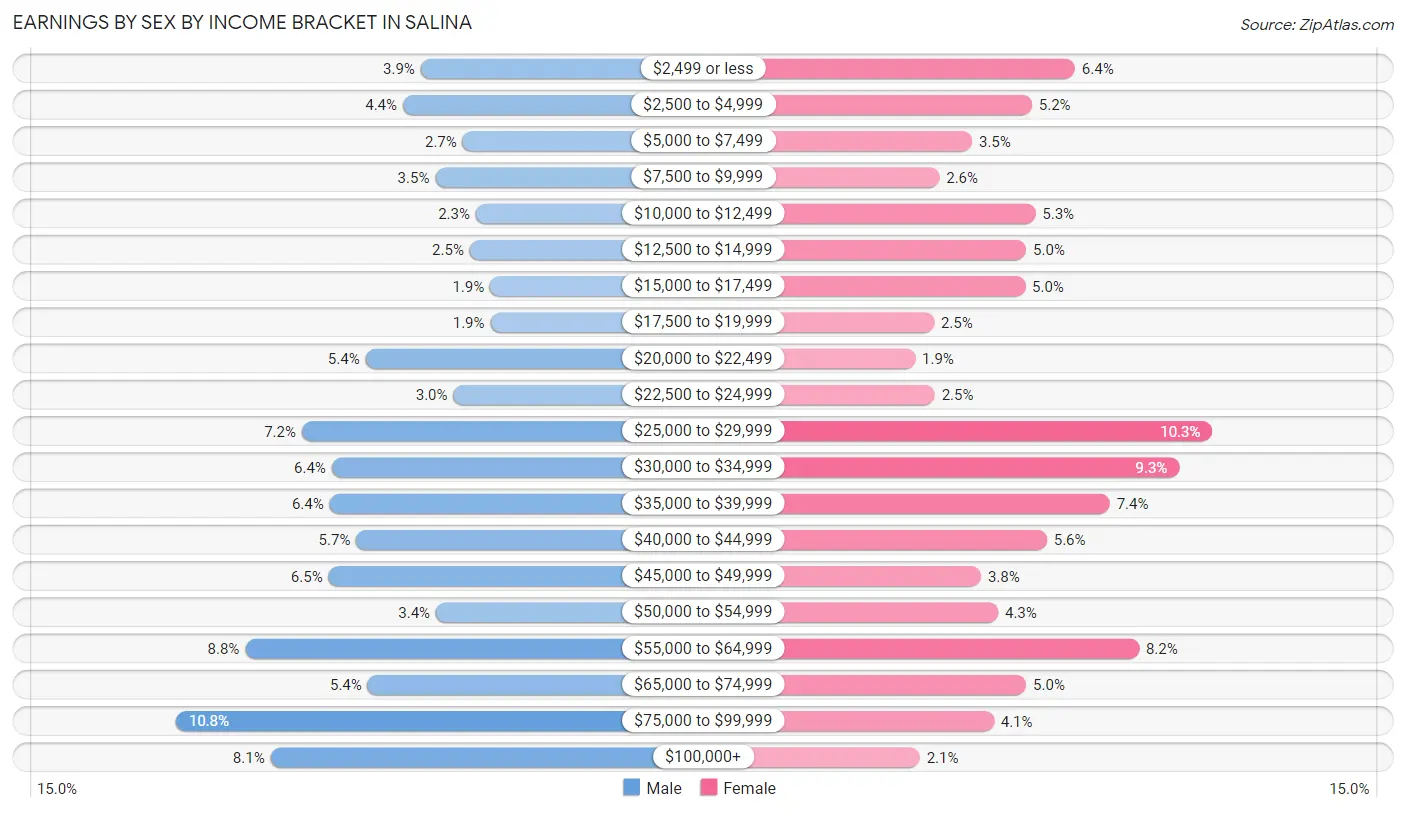
| Income | Male | Female |
| $2,499 or less | 521 (3.9%) | 803 (6.4%) |
| $2,500 to $4,999 | 589 (4.4%) | 651 (5.2%) |
| $5,000 to $7,499 | 363 (2.7%) | 441 (3.5%) |
| $7,500 to $9,999 | 467 (3.5%) | 326 (2.6%) |
| $10,000 to $12,499 | 313 (2.3%) | 664 (5.3%) |
| $12,500 to $14,999 | 336 (2.5%) | 632 (5.0%) |
| $15,000 to $17,499 | 259 (1.9%) | 628 (5.0%) |
| $17,500 to $19,999 | 257 (1.9%) | 307 (2.5%) |
| $20,000 to $22,499 | 730 (5.4%) | 241 (1.9%) |
| $22,500 to $24,999 | 397 (2.9%) | 310 (2.5%) |
| $25,000 to $29,999 | 972 (7.2%) | 1,287 (10.3%) |
| $30,000 to $34,999 | 859 (6.4%) | 1,171 (9.3%) |
| $35,000 to $39,999 | 866 (6.4%) | 926 (7.4%) |
| $40,000 to $44,999 | 765 (5.7%) | 704 (5.6%) |
| $45,000 to $49,999 | 871 (6.5%) | 472 (3.8%) |
| $50,000 to $54,999 | 464 (3.4%) | 533 (4.3%) |
| $55,000 to $64,999 | 1,186 (8.8%) | 1,029 (8.2%) |
| $65,000 to $74,999 | 723 (5.4%) | 632 (5.0%) |
| $75,000 to $99,999 | 1,449 (10.7%) | 517 (4.1%) |
| $100,000+ | 1,091 (8.1%) | 257 (2.1%) |
| Total | 13,478 (100.0%) | 12,531 (100.0%) |
Earnings by Sex by Educational Attainment in Salina
Average earnings in Salina are $45,527 for men and $34,198 for women, a difference of 24.9%. Men with an educational attainment of bachelor's degree enjoy the highest average annual earnings of $68,684, while those with less than high school education earn the least with $35,664. Women with an educational attainment of graduate degree earn the most with the average annual earnings of $57,982, while those with less than high school education have the smallest earnings of $25,852.
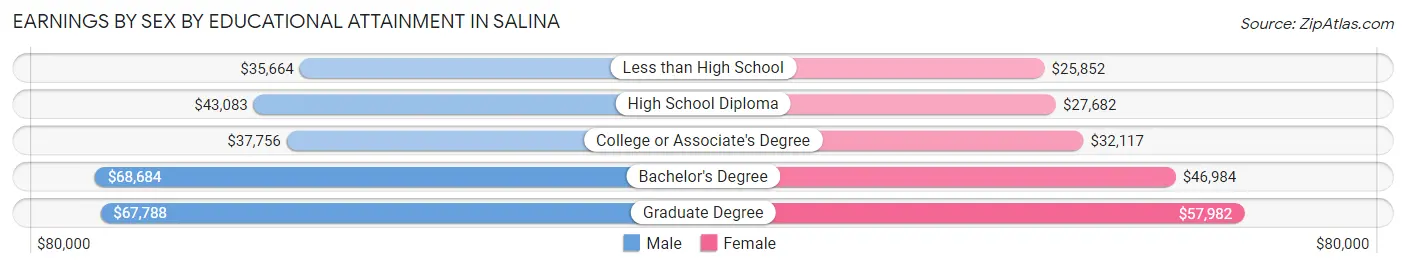
| Educational Attainment | Male Income | Female Income |
| Less than High School | $35,664 | $25,852 |
| High School Diploma | $43,083 | $27,682 |
| College or Associate's Degree | $37,756 | $32,117 |
| Bachelor's Degree | $68,684 | $46,984 |
| Graduate Degree | $67,788 | $57,982 |
| Total | $45,527 | $34,198 |
Family Income in Salina
Family Income Brackets in Salina
According to the Salina family income data, there are 2,786 families falling into the $50,000 to $74,999 income range, which is the most common income bracket and makes up 25.3% of all families. Conversely, the less than $10,000 income bracket is the least frequent group with only 187 families (1.7%) belonging to this category.
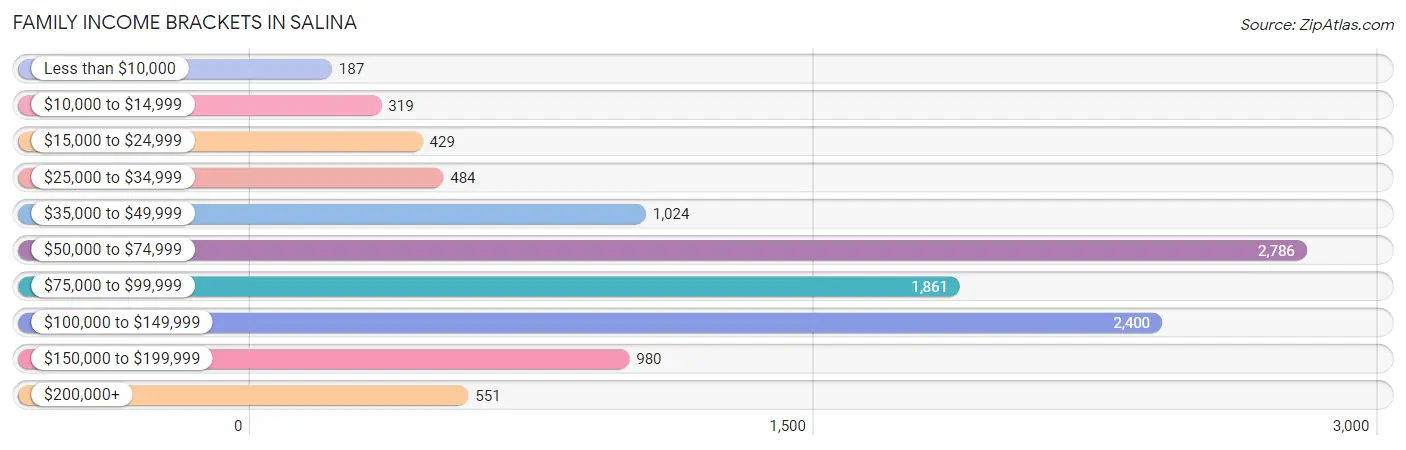
| Income Bracket | # Families | % Families |
| Less than $10,000 | 187 | 1.7% |
| $10,000 to $14,999 | 319 | 2.9% |
| $15,000 to $24,999 | 429 | 3.9% |
| $25,000 to $34,999 | 484 | 4.4% |
| $35,000 to $49,999 | 1,024 | 9.3% |
| $50,000 to $74,999 | 2,786 | 25.3% |
| $75,000 to $99,999 | 1,861 | 16.9% |
| $100,000 to $149,999 | 2,400 | 21.8% |
| $150,000 to $199,999 | 980 | 8.9% |
| $200,000+ | 551 | 5.0% |
Family Income by Famaliy Size in Salina
5-person families (764 | 6.9%) account for the highest median family income in Salina with $84,773 per family, while 2-person families (5,462 | 49.6%) have the highest median income of $38,594 per family member.
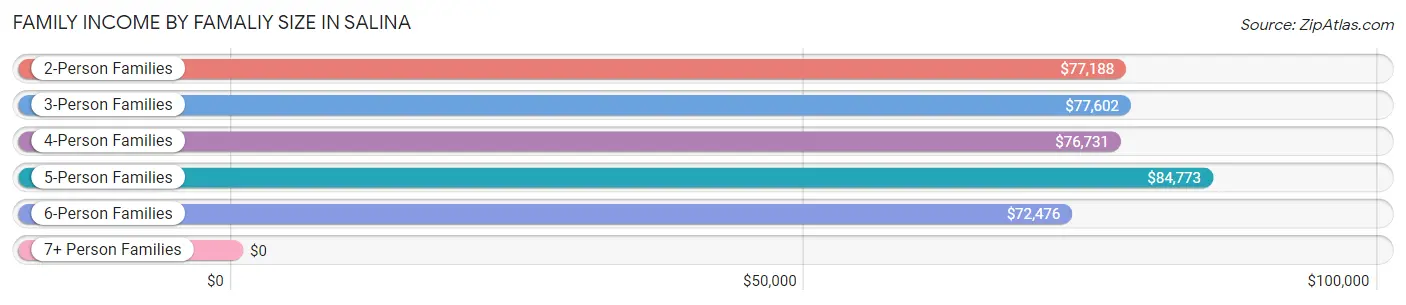
| Income Bracket | # Families | Median Income |
| 2-Person Families | 5,462 (49.6%) | $77,188 |
| 3-Person Families | 2,407 (21.9%) | $77,602 |
| 4-Person Families | 2,004 (18.2%) | $76,731 |
| 5-Person Families | 764 (6.9%) | $84,773 |
| 6-Person Families | 307 (2.8%) | $72,476 |
| 7+ Person Families | 67 (0.6%) | $0 |
| Total | 11,011 (100.0%) | $77,385 |
Family Income by Number of Earners in Salina
The median family income in Salina is $77,385, with families comprising 3+ earners (947) having the highest median family income of $113,192, while families with 1 earner (3,337) have the lowest median family income of $54,898, accounting for 8.6% and 30.3% of families, respectively.
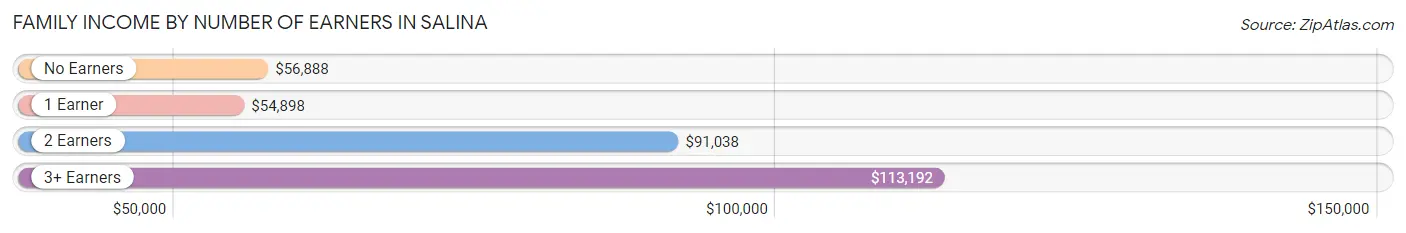
| Number of Earners | # Families | Median Income |
| No Earners | 1,311 (11.9%) | $56,888 |
| 1 Earner | 3,337 (30.3%) | $54,898 |
| 2 Earners | 5,416 (49.2%) | $91,038 |
| 3+ Earners | 947 (8.6%) | $113,192 |
| Total | 11,011 (100.0%) | $77,385 |
Household Income in Salina
Household Income Brackets in Salina
With 4,044 households falling in the category, the $50,000 to $74,999 income range is the most frequent in Salina, accounting for 20.8% of all households. In contrast, only 622 households (3.2%) fall into the $200,000+ income bracket, making it the least populous group.
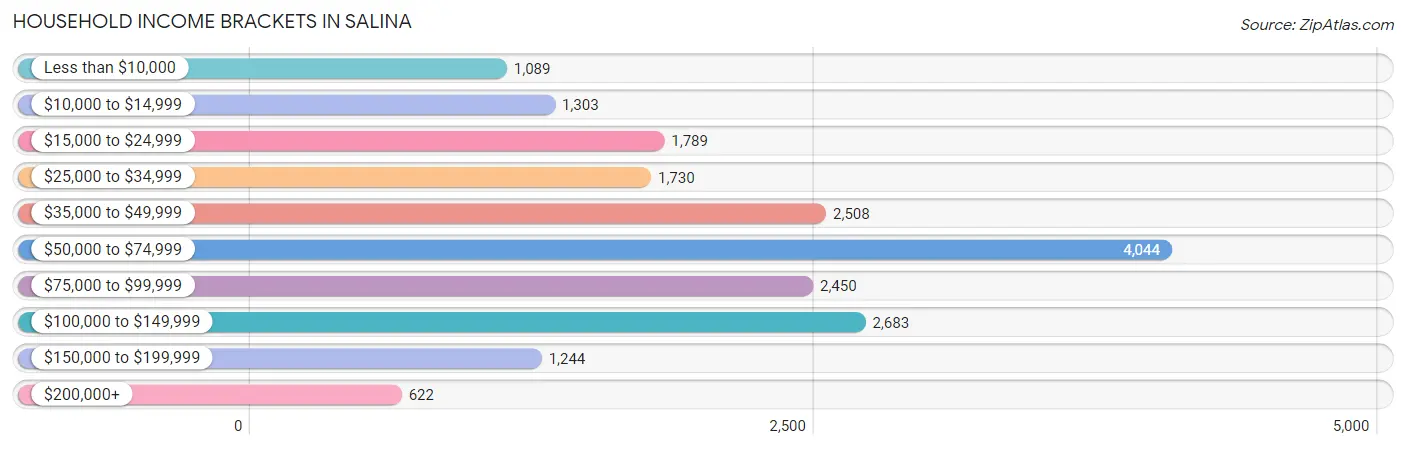
| Income Bracket | # Households | % Households |
| Less than $10,000 | 1,089 | 5.6% |
| $10,000 to $14,999 | 1,303 | 6.7% |
| $15,000 to $24,999 | 1,789 | 9.2% |
| $25,000 to $34,999 | 1,730 | 8.9% |
| $35,000 to $49,999 | 2,508 | 12.9% |
| $50,000 to $74,999 | 4,044 | 20.8% |
| $75,000 to $99,999 | 2,450 | 12.6% |
| $100,000 to $149,999 | 2,683 | 13.8% |
| $150,000 to $199,999 | 1,244 | 6.4% |
| $200,000+ | 622 | 3.2% |
Household Income by Householder Age in Salina
The median household income in Salina is $56,945, with the highest median household income of $64,907 found in the 45 to 64 years age bracket for the primary householder. A total of 6,960 households (35.8%) fall into this category. Meanwhile, the 15 to 24 years age bracket for the primary householder has the lowest median household income of $29,562, with 1,289 households (6.6%) in this group.
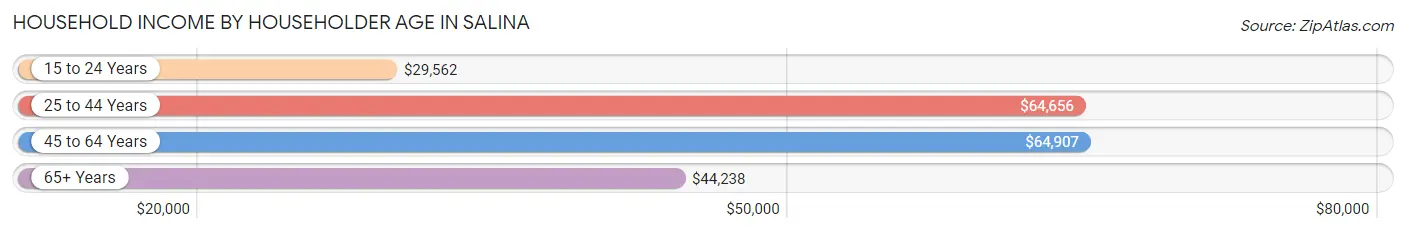
| Income Bracket | # Households | Median Income |
| 15 to 24 Years | 1,289 (6.6%) | $29,562 |
| 25 to 44 Years | 6,086 (31.3%) | $64,656 |
| 45 to 64 Years | 6,960 (35.8%) | $64,907 |
| 65+ Years | 5,107 (26.3%) | $44,238 |
| Total | 19,442 (100.0%) | $56,945 |
Poverty in Salina
Income Below Poverty by Sex and Age in Salina
With 11.2% poverty level for males and 14.1% for females among the residents of Salina, 5 year old males and 18 to 24 year old females are the most vulnerable to poverty, with 121 males (40.2%) and 461 females (24.8%) in their respective age groups living below the poverty level.
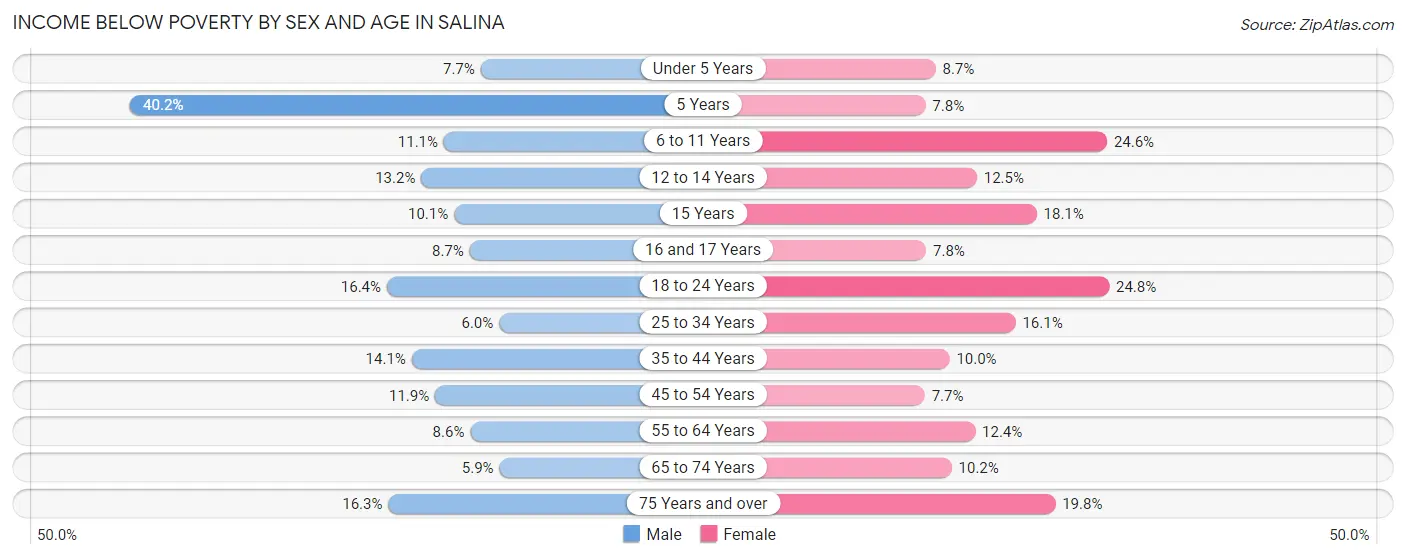
| Age Bracket | Male | Female |
| Under 5 Years | 115 (7.7%) | 101 (8.7%) |
| 5 Years | 121 (40.2%) | 19 (7.8%) |
| 6 to 11 Years | 228 (11.1%) | 440 (24.6%) |
| 12 to 14 Years | 74 (13.2%) | 124 (12.5%) |
| 15 Years | 37 (10.1%) | 49 (18.1%) |
| 16 and 17 Years | 42 (8.7%) | 52 (7.8%) |
| 18 to 24 Years | 351 (16.4%) | 461 (24.8%) |
| 25 to 34 Years | 163 (6.0%) | 444 (16.1%) |
| 35 to 44 Years | 431 (14.1%) | 278 (10.0%) |
| 45 to 54 Years | 308 (11.9%) | 213 (7.7%) |
| 55 to 64 Years | 257 (8.6%) | 381 (12.4%) |
| 65 to 74 Years | 122 (5.9%) | 241 (10.2%) |
| 75 Years and over | 236 (16.3%) | 447 (19.8%) |
| Total | 2,485 (11.2%) | 3,250 (14.1%) |
Income Above Poverty by Sex and Age in Salina
According to the poverty statistics in Salina, males aged 65 to 74 years and females aged 45 to 54 years are the age groups that are most secure financially, with 94.1% of males and 92.3% of females in these age groups living above the poverty line.
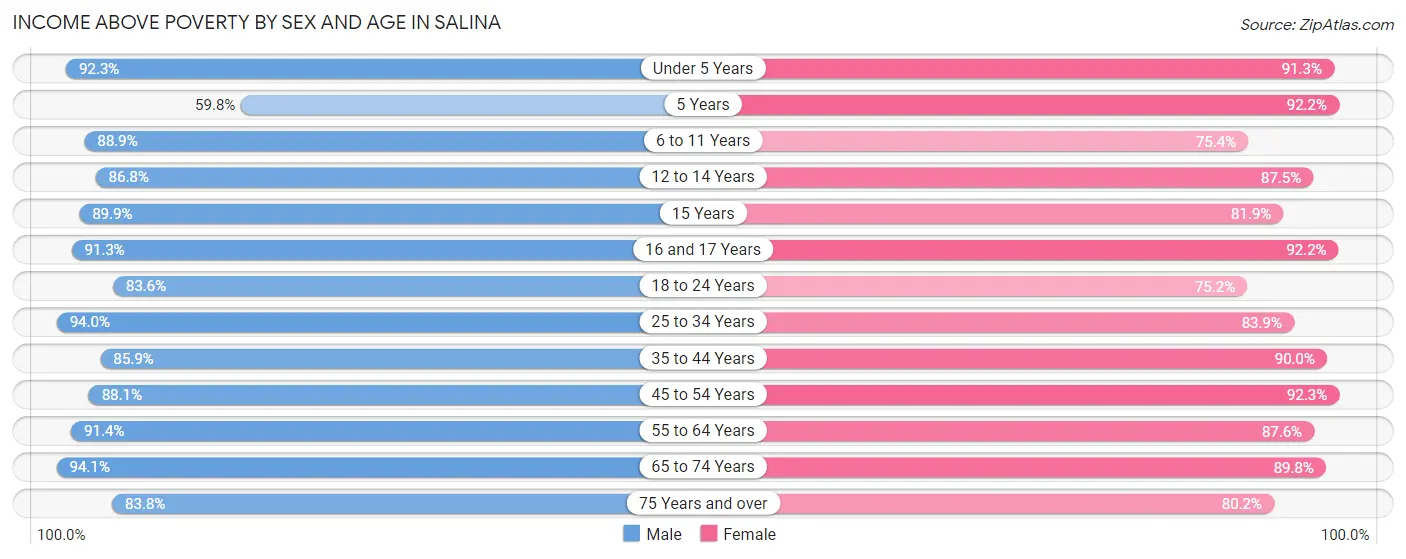
| Age Bracket | Male | Female |
| Under 5 Years | 1,383 (92.3%) | 1,060 (91.3%) |
| 5 Years | 180 (59.8%) | 226 (92.2%) |
| 6 to 11 Years | 1,827 (88.9%) | 1,348 (75.4%) |
| 12 to 14 Years | 487 (86.8%) | 866 (87.5%) |
| 15 Years | 328 (89.9%) | 222 (81.9%) |
| 16 and 17 Years | 441 (91.3%) | 613 (92.2%) |
| 18 to 24 Years | 1,792 (83.6%) | 1,398 (75.2%) |
| 25 to 34 Years | 2,574 (94.0%) | 2,310 (83.9%) |
| 35 to 44 Years | 2,630 (85.9%) | 2,505 (90.0%) |
| 45 to 54 Years | 2,278 (88.1%) | 2,554 (92.3%) |
| 55 to 64 Years | 2,716 (91.4%) | 2,699 (87.6%) |
| 65 to 74 Years | 1,937 (94.1%) | 2,125 (89.8%) |
| 75 Years and over | 1,216 (83.8%) | 1,810 (80.2%) |
| Total | 19,789 (88.8%) | 19,736 (85.9%) |
Income Below Poverty Among Married-Couple Families in Salina
The poverty statistics for married-couple families in Salina show that 3.6% or 289 of the total 8,034 families live below the poverty line. Families with 3 or 4 children have the highest poverty rate of 5.4%, comprising of 30 families. On the other hand, families with 5 or more children have the lowest poverty rate of 0.0%, which includes 0 families.
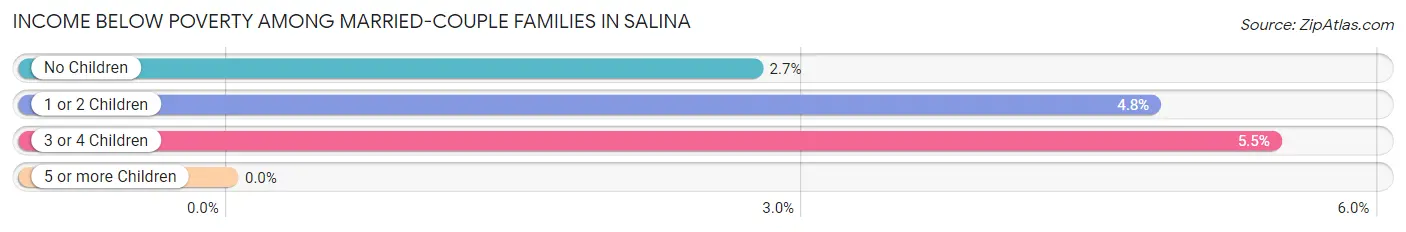
| Children | Above Poverty | Below Poverty |
| No Children | 4,721 (97.3%) | 133 (2.7%) |
| 1 or 2 Children | 2,486 (95.2%) | 126 (4.8%) |
| 3 or 4 Children | 520 (94.6%) | 30 (5.4%) |
| 5 or more Children | 18 (100.0%) | 0 (0.0%) |
| Total | 7,745 (96.4%) | 289 (3.6%) |
Income Below Poverty Among Single-Parent Households in Salina
According to the poverty data in Salina, 10.0% or 87 single-father households and 25.9% or 547 single-mother households are living below the poverty line. Among single-father households, those with 3 or 4 children have the highest poverty rate, with 39 households (41.0%) experiencing poverty. Likewise, among single-mother households, those with 3 or 4 children have the highest poverty rate, with 204 households (70.8%) falling below the poverty line.
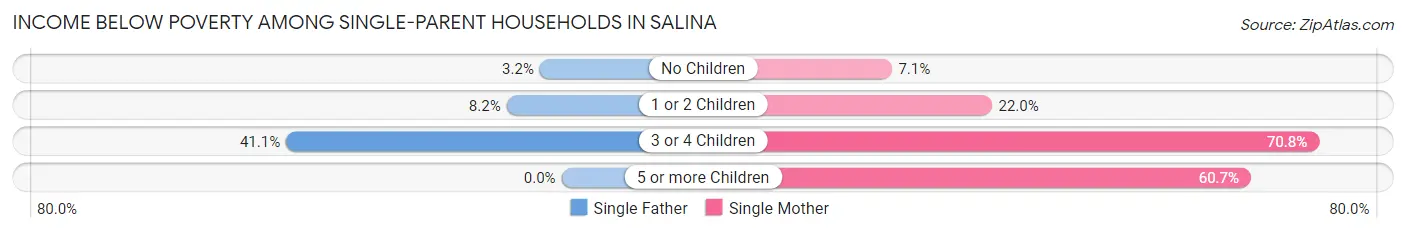
| Children | Single Father | Single Mother |
| No Children | 10 (3.2%) | 39 (7.1%) |
| 1 or 2 Children | 38 (8.2%) | 267 (22.0%) |
| 3 or 4 Children | 39 (41.0%) | 204 (70.8%) |
| 5 or more Children | 0 (0.0%) | 37 (60.7%) |
| Total | 87 (10.0%) | 547 (25.9%) |
Income Below Poverty Among Married-Couple vs Single-Parent Households in Salina
The poverty data for Salina shows that 289 of the married-couple family households (3.6%) and 634 of the single-parent households (21.3%) are living below the poverty level. Within the married-couple family households, those with 3 or 4 children have the highest poverty rate, with 30 households (5.4%) falling below the poverty line. Among the single-parent households, those with 3 or 4 children have the highest poverty rate, with 243 household (63.4%) living below poverty.
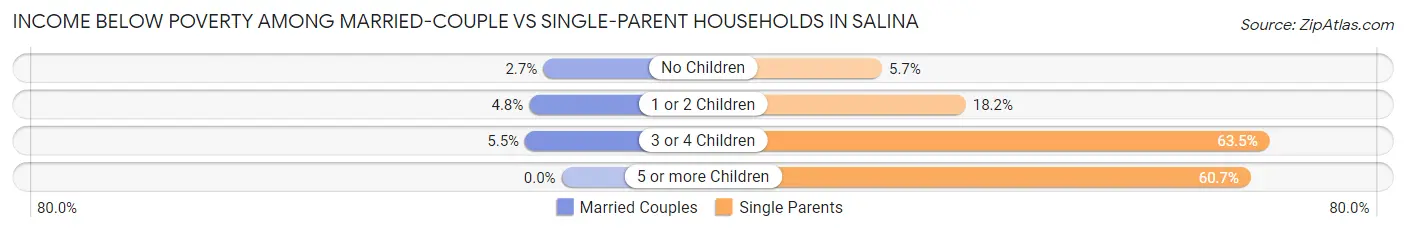
| Children | Married-Couple Families | Single-Parent Households |
| No Children | 133 (2.7%) | 49 (5.7%) |
| 1 or 2 Children | 126 (4.8%) | 305 (18.2%) |
| 3 or 4 Children | 30 (5.4%) | 243 (63.4%) |
| 5 or more Children | 0 (0.0%) | 37 (60.7%) |
| Total | 289 (3.6%) | 634 (21.3%) |
Race in Salina
The most populous races in Salina are White / Caucasian (40,473 | 86.6%), Hispanic or Latino (5,834 | 12.5%), and Two or more Races (2,896 | 6.2%).
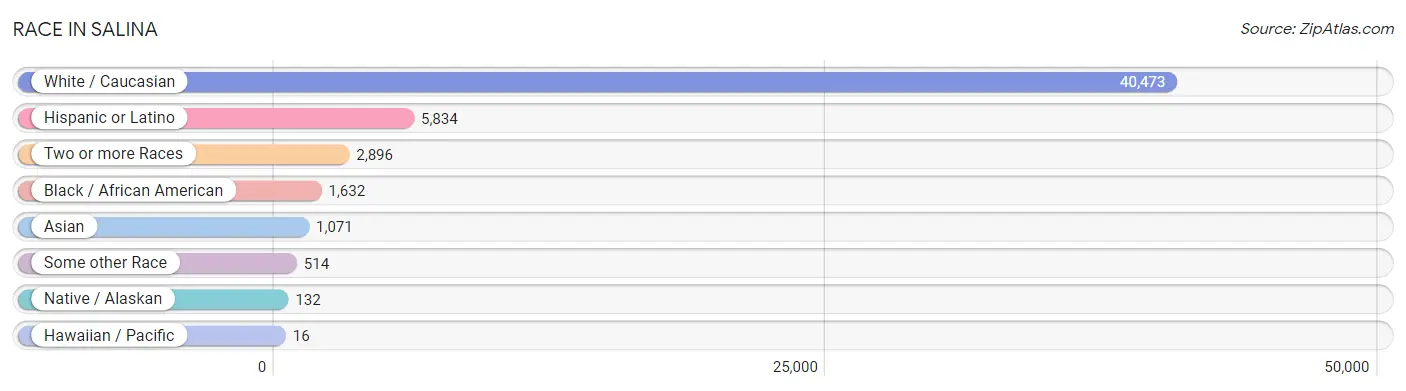
| Race | # Population | % Population |
| Asian | 1,071 | 2.3% |
| Black / African American | 1,632 | 3.5% |
| Hawaiian / Pacific | 16 | 0.0% |
| Hispanic or Latino | 5,834 | 12.5% |
| Native / Alaskan | 132 | 0.3% |
| White / Caucasian | 40,473 | 86.6% |
| Two or more Races | 2,896 | 6.2% |
| Some other Race | 514 | 1.1% |
| Total | 46,734 | 100.0% |
Ancestry in Salina
The most populous ancestries reported in Salina are German (12,234 | 26.2%), Irish (5,266 | 11.3%), English (4,548 | 9.7%), Mexican (4,341 | 9.3%), and American (3,653 | 7.8%), together accounting for 64.3% of all Salina residents.
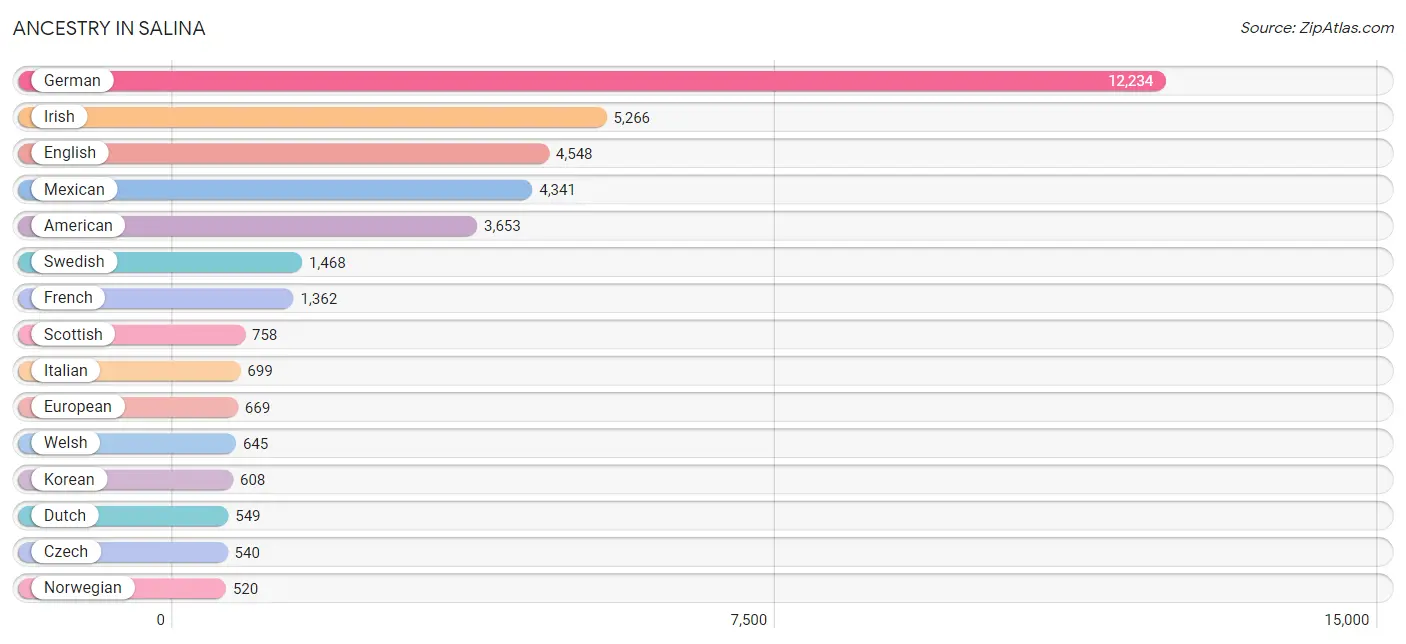
| Ancestry | # Population | % Population |
| African | 118 | 0.3% |
| American | 3,653 | 7.8% |
| Arab | 27 | 0.1% |
| Argentinean | 21 | 0.0% |
| Armenian | 7 | 0.0% |
| Australian | 17 | 0.0% |
| Austrian | 101 | 0.2% |
| Belgian | 32 | 0.1% |
| Bhutanese | 201 | 0.4% |
| Brazilian | 31 | 0.1% |
| British | 222 | 0.5% |
| Bulgarian | 75 | 0.2% |
| Burmese | 275 | 0.6% |
| Canadian | 26 | 0.1% |
| Central American | 174 | 0.4% |
| Central American Indian | 24 | 0.1% |
| Cherokee | 43 | 0.1% |
| Choctaw | 7 | 0.0% |
| Colombian | 138 | 0.3% |
| Comanche | 6 | 0.0% |
| Cuban | 178 | 0.4% |
| Czech | 540 | 1.2% |
| Czechoslovakian | 192 | 0.4% |
| Danish | 377 | 0.8% |
| Dutch | 549 | 1.2% |
| Dutch West Indian | 26 | 0.1% |
| Eastern European | 33 | 0.1% |
| English | 4,548 | 9.7% |
| Ethiopian | 16 | 0.0% |
| European | 669 | 1.4% |
| French | 1,362 | 2.9% |
| French American Indian | 14 | 0.0% |
| French Canadian | 294 | 0.6% |
| German | 12,234 | 26.2% |
| German Russian | 53 | 0.1% |
| Greek | 27 | 0.1% |
| Guamanian / Chamorro | 5 | 0.0% |
| Guatemalan | 161 | 0.3% |
| Indian (Asian) | 100 | 0.2% |
| Indonesian | 28 | 0.1% |
| Iranian | 33 | 0.1% |
| Irish | 5,266 | 11.3% |
| Italian | 699 | 1.5% |
| Jamaican | 28 | 0.1% |
| Japanese | 130 | 0.3% |
| Kenyan | 256 | 0.5% |
| Korean | 608 | 1.3% |
| Laotian | 15 | 0.0% |
| Lithuanian | 16 | 0.0% |
| Luxembourger | 12 | 0.0% |
| Malaysian | 97 | 0.2% |
| Mexican | 4,341 | 9.3% |
| Mexican American Indian | 155 | 0.3% |
| Native Hawaiian | 27 | 0.1% |
| Navajo | 6 | 0.0% |
| Northern European | 116 | 0.3% |
| Norwegian | 520 | 1.1% |
| Ottawa | 9 | 0.0% |
| Pakistani | 200 | 0.4% |
| Pennsylvania German | 75 | 0.2% |
| Peruvian | 86 | 0.2% |
| Polish | 434 | 0.9% |
| Potawatomi | 30 | 0.1% |
| Puerto Rican | 501 | 1.1% |
| Romanian | 36 | 0.1% |
| Russian | 276 | 0.6% |
| Salvadoran | 13 | 0.0% |
| Samoan | 14 | 0.0% |
| Scandinavian | 205 | 0.4% |
| Scotch-Irish | 232 | 0.5% |
| Scottish | 758 | 1.6% |
| Seminole | 8 | 0.0% |
| Sioux | 33 | 0.1% |
| Slovak | 20 | 0.0% |
| South African | 36 | 0.1% |
| South American | 298 | 0.6% |
| Spaniard | 197 | 0.4% |
| Spanish | 10 | 0.0% |
| Sri Lankan | 105 | 0.2% |
| Subsaharan African | 426 | 0.9% |
| Swedish | 1,468 | 3.1% |
| Swiss | 111 | 0.2% |
| Thai | 23 | 0.1% |
| Tongan | 3 | 0.0% |
| Turkish | 51 | 0.1% |
| Ukrainian | 62 | 0.1% |
| Venezuelan | 53 | 0.1% |
| Welsh | 645 | 1.4% | View All 88 Rows |
Immigrants in Salina
The most numerous immigrant groups reported in Salina came from Latin America (1,107 | 2.4%), Central America (909 | 1.9%), Mexico (777 | 1.7%), Asia (721 | 1.5%), and Eastern Asia (352 | 0.7%), together accounting for 8.3% of all Salina residents.
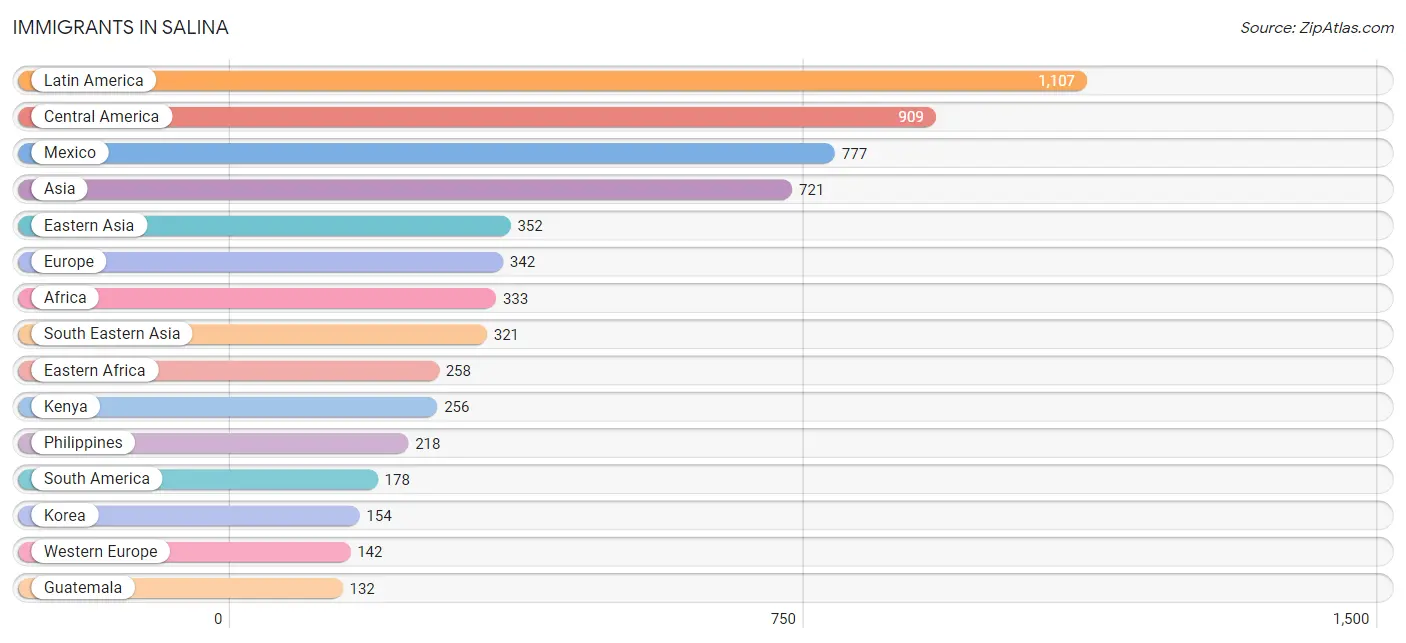
| Immigration Origin | # Population | % Population |
| Africa | 333 | 0.7% |
| Argentina | 21 | 0.0% |
| Asia | 721 | 1.5% |
| Brazil | 31 | 0.1% |
| Bulgaria | 19 | 0.0% |
| Canada | 34 | 0.1% |
| Caribbean | 20 | 0.0% |
| Central America | 909 | 1.9% |
| China | 85 | 0.2% |
| Colombia | 9 | 0.0% |
| Eastern Africa | 258 | 0.5% |
| Eastern Asia | 352 | 0.7% |
| Eastern Europe | 90 | 0.2% |
| England | 23 | 0.1% |
| Ethiopia | 2 | 0.0% |
| Europe | 342 | 0.7% |
| France | 89 | 0.2% |
| Germany | 53 | 0.1% |
| Guatemala | 132 | 0.3% |
| Jamaica | 20 | 0.0% |
| Japan | 113 | 0.2% |
| Kenya | 256 | 0.5% |
| Korea | 154 | 0.3% |
| Laos | 47 | 0.1% |
| Latin America | 1,107 | 2.4% |
| Latvia | 28 | 0.1% |
| Mexico | 777 | 1.7% |
| Nepal | 18 | 0.0% |
| Northern Europe | 110 | 0.2% |
| Peru | 86 | 0.2% |
| Philippines | 218 | 0.5% |
| Poland | 14 | 0.0% |
| Romania | 12 | 0.0% |
| Russia | 9 | 0.0% |
| Saudi Arabia | 15 | 0.0% |
| South Africa | 36 | 0.1% |
| South America | 178 | 0.4% |
| South Central Asia | 33 | 0.1% |
| South Eastern Asia | 321 | 0.7% |
| Sri Lanka | 15 | 0.0% |
| Taiwan | 24 | 0.1% |
| Thailand | 16 | 0.0% |
| Ukraine | 8 | 0.0% |
| Venezuela | 31 | 0.1% |
| Vietnam | 40 | 0.1% |
| Western Asia | 15 | 0.0% |
| Western Europe | 142 | 0.3% | View All 47 Rows |
Sex and Age in Salina
Sex and Age in Salina
The most populous age groups in Salina are 20 to 24 Years (1,799 | 7.8%) for men and 10 to 14 Years (1,817 | 7.7%) for women.
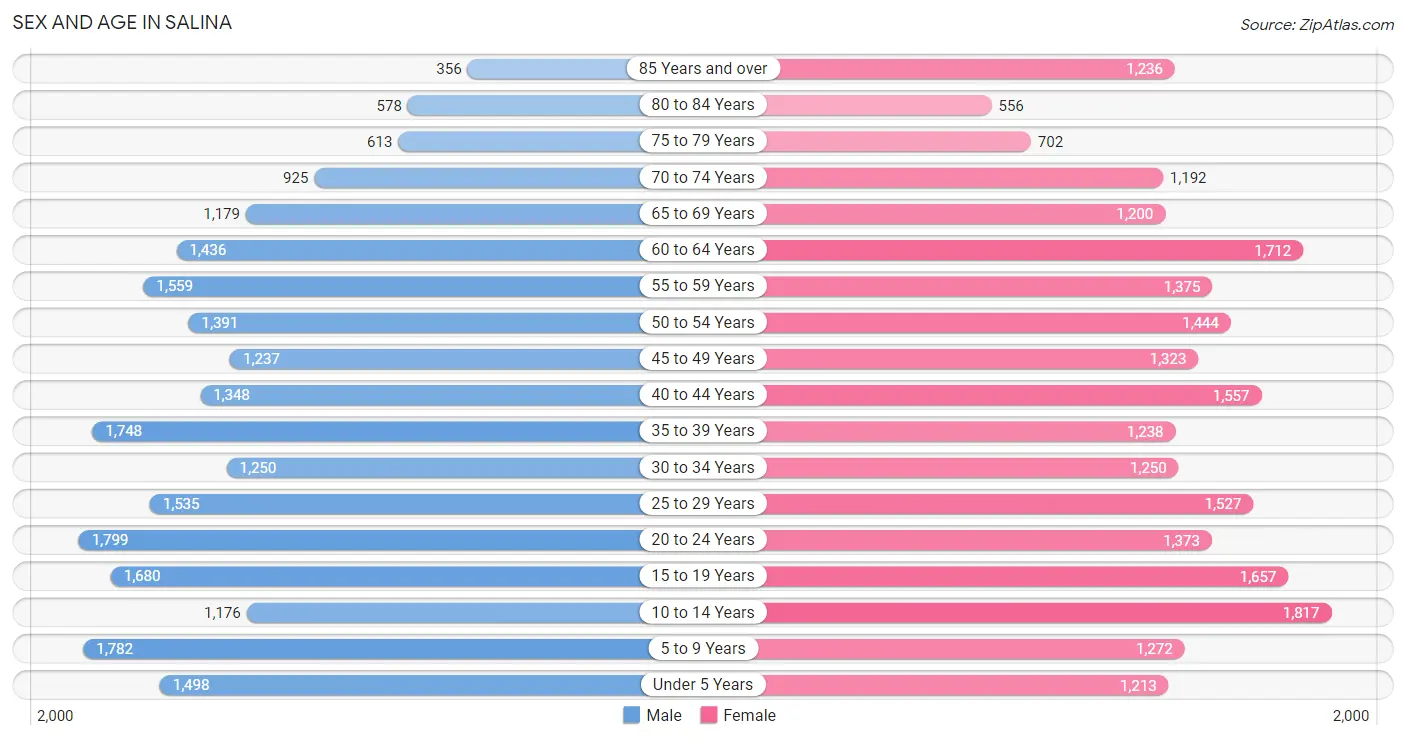
| Age Bracket | Male | Female |
| Under 5 Years | 1,498 (6.5%) | 1,213 (5.1%) |
| 5 to 9 Years | 1,782 (7.7%) | 1,272 (5.4%) |
| 10 to 14 Years | 1,176 (5.1%) | 1,817 (7.7%) |
| 15 to 19 Years | 1,680 (7.3%) | 1,657 (7.0%) |
| 20 to 24 Years | 1,799 (7.8%) | 1,373 (5.8%) |
| 25 to 29 Years | 1,535 (6.7%) | 1,527 (6.5%) |
| 30 to 34 Years | 1,250 (5.4%) | 1,250 (5.3%) |
| 35 to 39 Years | 1,748 (7.6%) | 1,238 (5.2%) |
| 40 to 44 Years | 1,348 (5.8%) | 1,557 (6.6%) |
| 45 to 49 Years | 1,237 (5.4%) | 1,323 (5.6%) |
| 50 to 54 Years | 1,391 (6.0%) | 1,444 (6.1%) |
| 55 to 59 Years | 1,559 (6.8%) | 1,375 (5.8%) |
| 60 to 64 Years | 1,436 (6.2%) | 1,712 (7.2%) |
| 65 to 69 Years | 1,179 (5.1%) | 1,200 (5.1%) |
| 70 to 74 Years | 925 (4.0%) | 1,192 (5.0%) |
| 75 to 79 Years | 613 (2.6%) | 702 (3.0%) |
| 80 to 84 Years | 578 (2.5%) | 556 (2.4%) |
| 85 Years and over | 356 (1.5%) | 1,236 (5.2%) |
| Total | 23,090 (100.0%) | 23,644 (100.0%) |
Families and Households in Salina
Median Family Size in Salina
The median family size in Salina is 3.13 persons per family, with single male/father families (868 | 7.9%) accounting for the largest median family size of 3.2 persons per family. On the other hand, single female/mother families (2,109 | 19.2%) represent the smallest median family size with 3.11 persons per family.
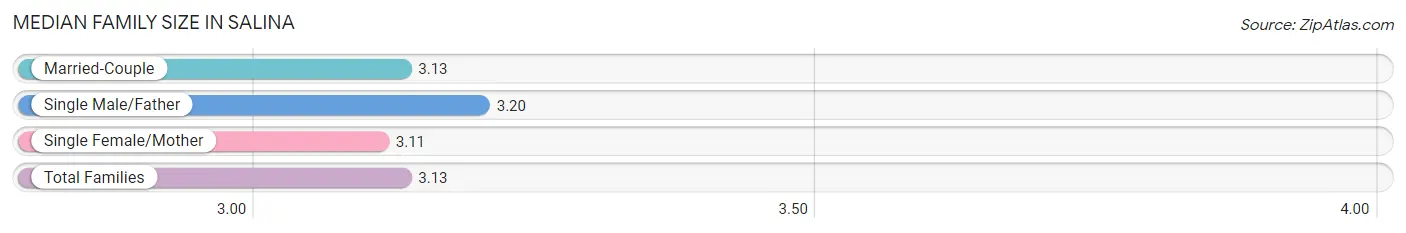
| Family Type | # Families | Family Size |
| Married-Couple | 8,034 (73.0%) | 3.13 |
| Single Male/Father | 868 (7.9%) | 3.20 |
| Single Female/Mother | 2,109 (19.2%) | 3.11 |
| Total Families | 11,011 (100.0%) | 3.13 |
Median Household Size in Salina
The median household size in Salina is 2.32 persons per household, with single male/father households (868 | 4.5%) accounting for the largest median household size of 3.49 persons per household. non-family households (8,431 | 43.4%) represent the smallest median household size with 1.17 persons per household.
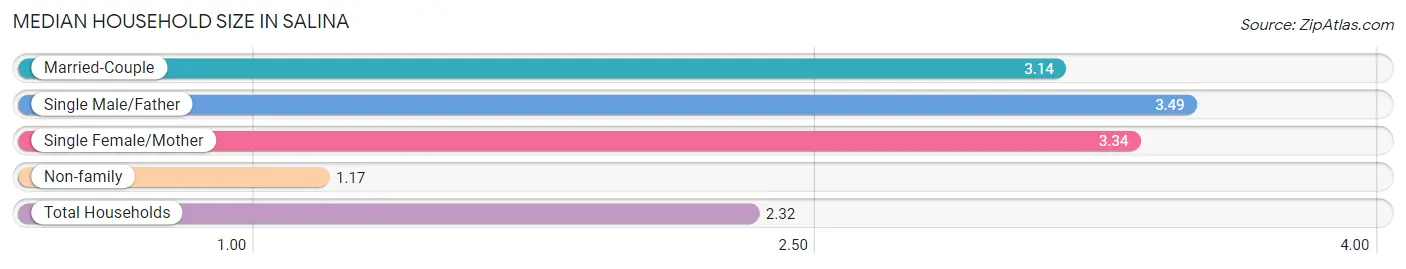
| Household Type | # Households | Household Size |
| Married-Couple | 8,034 (41.3%) | 3.14 |
| Single Male/Father | 868 (4.5%) | 3.49 |
| Single Female/Mother | 2,109 (10.8%) | 3.34 |
| Non-family | 8,431 (43.4%) | 1.17 |
| Total Households | 19,442 (100.0%) | 2.32 |
Household Size by Marriage Status in Salina
Out of a total of 19,442 households in Salina, 11,011 (56.6%) are family households, while 8,431 (43.4%) are nonfamily households. The most numerous type of family households are 2-person households, comprising 5,151, and the most common type of nonfamily households are 1-person households, comprising 7,445.
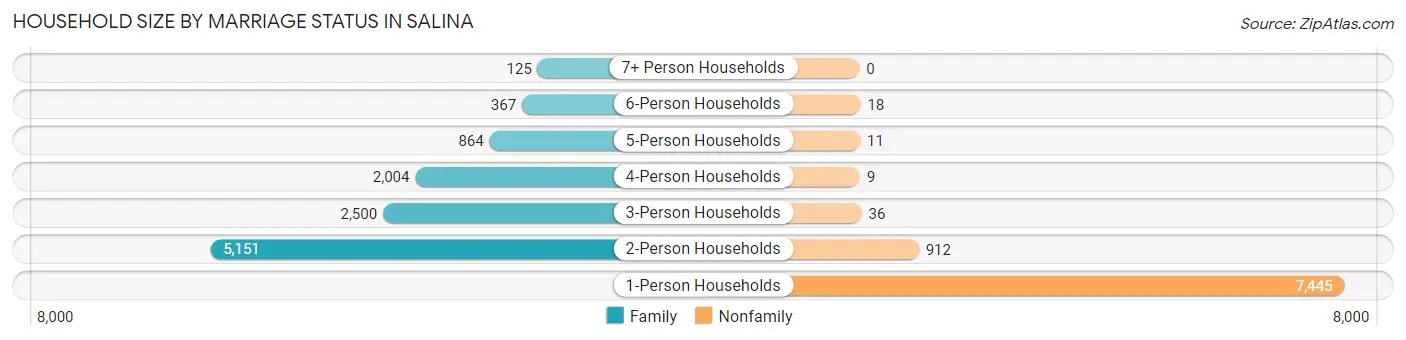
| Household Size | Family Households | Nonfamily Households |
| 1-Person Households | - | 7,445 (38.3%) |
| 2-Person Households | 5,151 (26.5%) | 912 (4.7%) |
| 3-Person Households | 2,500 (12.9%) | 36 (0.2%) |
| 4-Person Households | 2,004 (10.3%) | 9 (0.1%) |
| 5-Person Households | 864 (4.4%) | 11 (0.1%) |
| 6-Person Households | 367 (1.9%) | 18 (0.1%) |
| 7+ Person Households | 125 (0.6%) | 0 (0.0%) |
| Total | 11,011 (56.6%) | 8,431 (43.4%) |
Female Fertility in Salina
Fertility by Age in Salina
Average fertility rate in Salina is 70.0 births per 1,000 women. Women in the age bracket of 20 to 34 years have the highest fertility rate with 128.0 births per 1,000 women. Women in the age bracket of 20 to 34 years acount for 74.3% of all women with births.

| Age Bracket | Women with Births | Births / 1,000 Women |
| 15 to 19 years | 28 (3.9%) | 17.0 |
| 20 to 34 years | 530 (74.3%) | 128.0 |
| 35 to 50 years | 155 (21.7%) | 36.0 |
| Total | 713 (100.0%) | 70.0 |
Fertility by Age by Marriage Status in Salina
59.0% of women with births (713) in Salina are married. The highest percentage of unmarried women with births falls into 20 to 34 years age bracket with 54.1% of them unmarried at the time of birth, while the lowest percentage of unmarried women with births belong to 35 to 50 years age bracket with 0.0% of them unmarried.
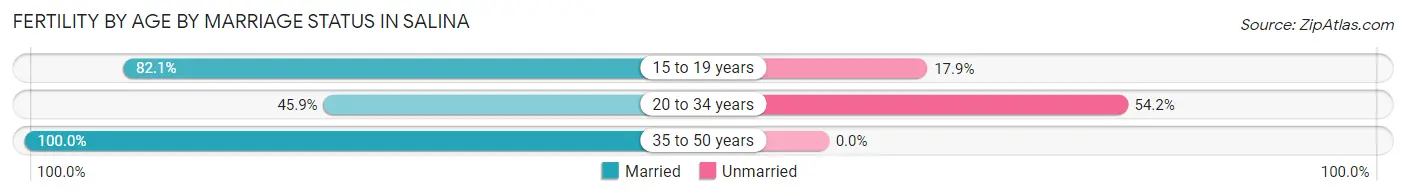
| Age Bracket | Married | Unmarried |
| 15 to 19 years | 23 (82.1%) | 5 (17.9%) |
| 20 to 34 years | 243 (45.9%) | 287 (54.1%) |
| 35 to 50 years | 155 (100.0%) | 0 (0.0%) |
| Total | 421 (59.1%) | 292 (40.9%) |
Fertility by Education in Salina
Average fertility rate in Salina is 70.0 births per 1,000 women. Women with the education attainment of graduate degree have the highest fertility rate of 170.0 births per 1,000 women, while women with the education attainment of less than high school have the lowest fertility at 17.0 births per 1,000 women. Women with the education attainment of high school diploma represent 37.7% of all women with births.
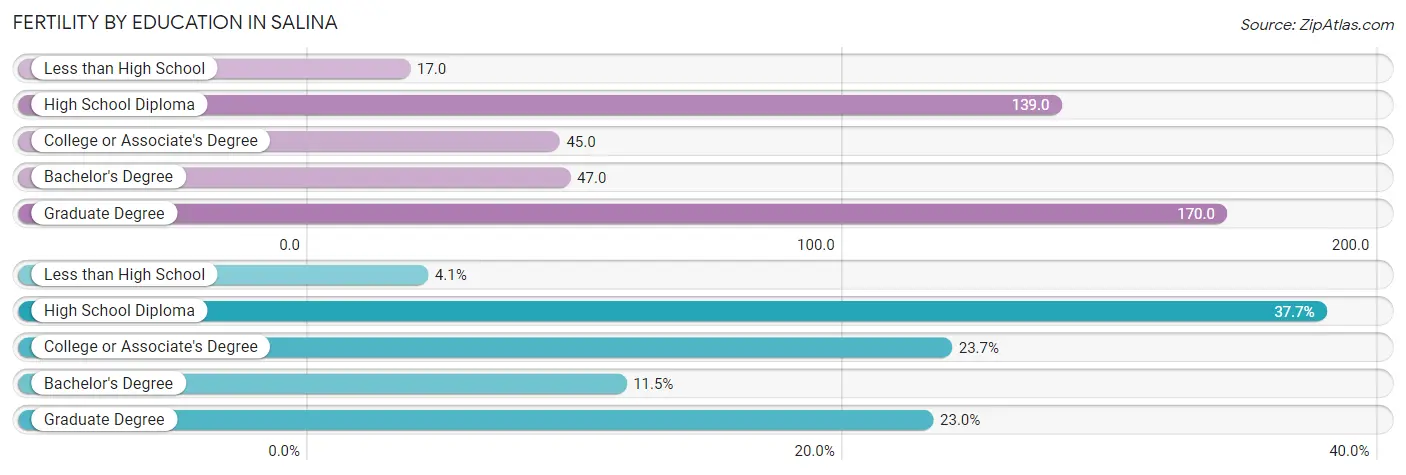
| Educational Attainment | Women with Births | Births / 1,000 Women |
| Less than High School | 29 (4.1%) | 17.0 |
| High School Diploma | 269 (37.7%) | 139.0 |
| College or Associate's Degree | 169 (23.7%) | 45.0 |
| Bachelor's Degree | 82 (11.5%) | 47.0 |
| Graduate Degree | 164 (23.0%) | 170.0 |
| Total | 713 (100.0%) | 70.0 |
Fertility by Education by Marriage Status in Salina
40.9% of women with births in Salina are unmarried. Women with the educational attainment of graduate degree are most likely to be married with 100.0% of them married at childbirth, while women with the educational attainment of less than high school are least likely to be married with 100.0% of them unmarried at childbirth.
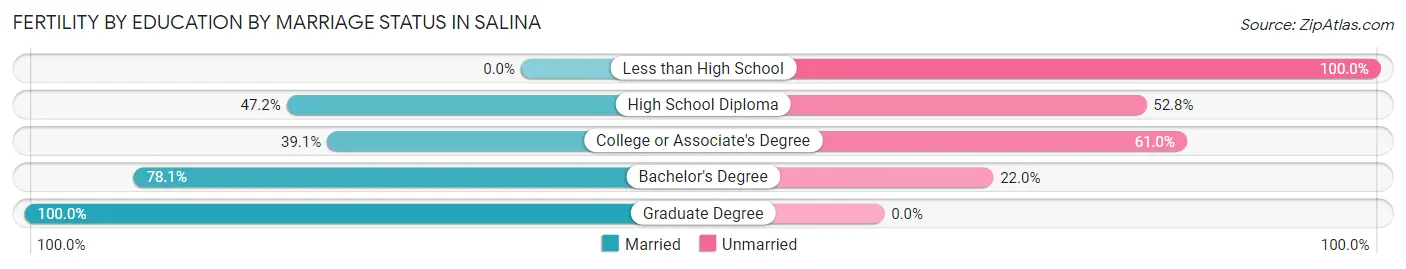
| Educational Attainment | Married | Unmarried |
| Less than High School | 0 (0.0%) | 29 (100.0%) |
| High School Diploma | 127 (47.2%) | 142 (52.8%) |
| College or Associate's Degree | 66 (39.1%) | 103 (61.0%) |
| Bachelor's Degree | 64 (78.0%) | 18 (22.0%) |
| Graduate Degree | 164 (100.0%) | 0 (0.0%) |
| Total | 421 (59.1%) | 292 (40.9%) |
Employment Characteristics in Salina
Employment by Class of Employer in Salina
Among the 22,947 employed individuals in Salina, private company employees (15,208 | 66.3%), not-for-profit organizations (2,329 | 10.2%), and local government employees (1,919 | 8.4%) make up the most common classes of employment.
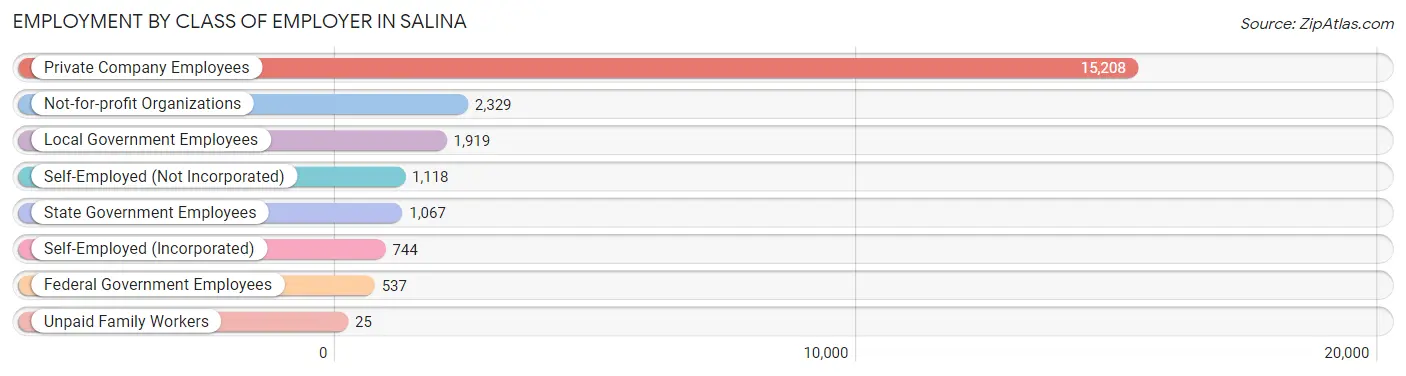
| Employer Class | # Employees | % Employees |
| Private Company Employees | 15,208 | 66.3% |
| Self-Employed (Incorporated) | 744 | 3.2% |
| Self-Employed (Not Incorporated) | 1,118 | 4.9% |
| Not-for-profit Organizations | 2,329 | 10.2% |
| Local Government Employees | 1,919 | 8.4% |
| State Government Employees | 1,067 | 4.6% |
| Federal Government Employees | 537 | 2.3% |
| Unpaid Family Workers | 25 | 0.1% |
| Total | 22,947 | 100.0% |
Employment Status by Age in Salina
According to the labor force statistics for Salina, out of the total population over 16 years of age (37,338), 66.3% or 24,755 individuals are in the labor force, with 4.0% or 990 of them unemployed. The age group with the highest labor force participation rate is 30 to 34 years, with 91.4% or 2,285 individuals in the labor force. Within the labor force, the 16 to 19 years age range has the highest percentage of unemployed individuals, with 13.3% or 187 of them being unemployed.

| Age Bracket | In Labor Force | Unemployed |
| 16 to 19 Years | 1,409 (52.2%) | 187 (13.3%) |
| 20 to 24 Years | 2,671 (84.2%) | 256 (9.6%) |
| 25 to 29 Years | 2,710 (88.5%) | 27 (1.0%) |
| 30 to 34 Years | 2,285 (91.4%) | 174 (7.6%) |
| 35 to 44 Years | 4,931 (83.7%) | 113 (2.3%) |
| 45 to 54 Years | 4,408 (81.7%) | 71 (1.6%) |
| 55 to 59 Years | 2,400 (81.8%) | 14 (0.6%) |
| 60 to 64 Years | 2,392 (76.0%) | 141 (5.9%) |
| 65 to 74 Years | 1,403 (31.2%) | 0 (0.0%) |
| 75 Years and over | 150 (3.7%) | 0 (0.0%) |
| Total | 24,755 (66.3%) | 990 (4.0%) |
Employment Status by Educational Attainment in Salina
According to labor force statistics for Salina, 83.4% of individuals (19,124) out of the total population between 25 and 64 years of age (22,930) are in the labor force, with 2.8% or 535 of them being unemployed. The group with the highest labor force participation rate are those with the educational attainment of college / associate degree, with 85.9% or 7,156 individuals in the labor force. Within the labor force, individuals with less than high school education have the highest percentage of unemployment, with 12.8% or 149 of them being unemployed.
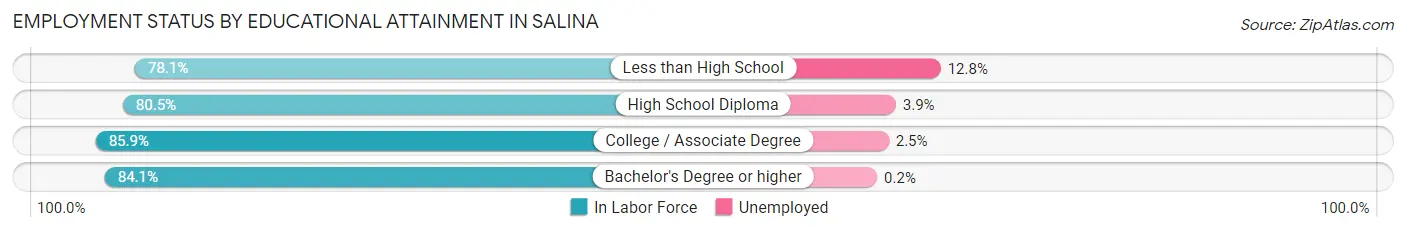
| Educational Attainment | In Labor Force | Unemployed |
| Less than High School | 1,164 (78.1%) | 191 (12.8%) |
| High School Diploma | 4,960 (80.5%) | 240 (3.9%) |
| College / Associate Degree | 7,156 (85.9%) | 208 (2.5%) |
| Bachelor's Degree or higher | 5,842 (84.1%) | 14 (0.2%) |
| Total | 19,124 (83.4%) | 642 (2.8%) |
Employment Occupations by Sex in Salina
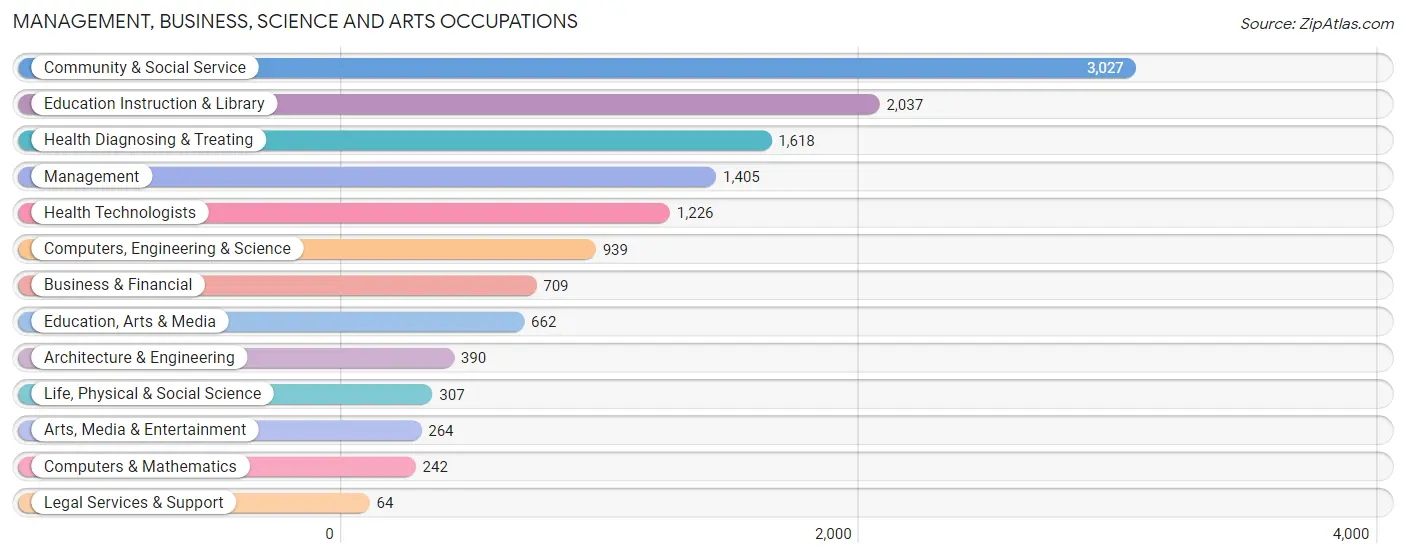
Management, Business, Science and Arts Occupations
The most common Management, Business, Science and Arts occupations in Salina are Community & Social Service (3,027 | 12.7%), Education Instruction & Library (2,037 | 8.6%), Health Diagnosing & Treating (1,618 | 6.8%), Management (1,405 | 5.9%), and Health Technologists (1,226 | 5.2%).
Management, Business, Science and Arts Occupations by Sex
Within the Management, Business, Science and Arts occupations in Salina, the most male-oriented occupations are Architecture & Engineering (100.0%), Computers, Engineering & Science (67.0%), and Arts, Media & Entertainment (66.3%), while the most female-oriented occupations are Health Diagnosing & Treating (74.5%), Health Technologists (74.1%), and Education Instruction & Library (73.2%).
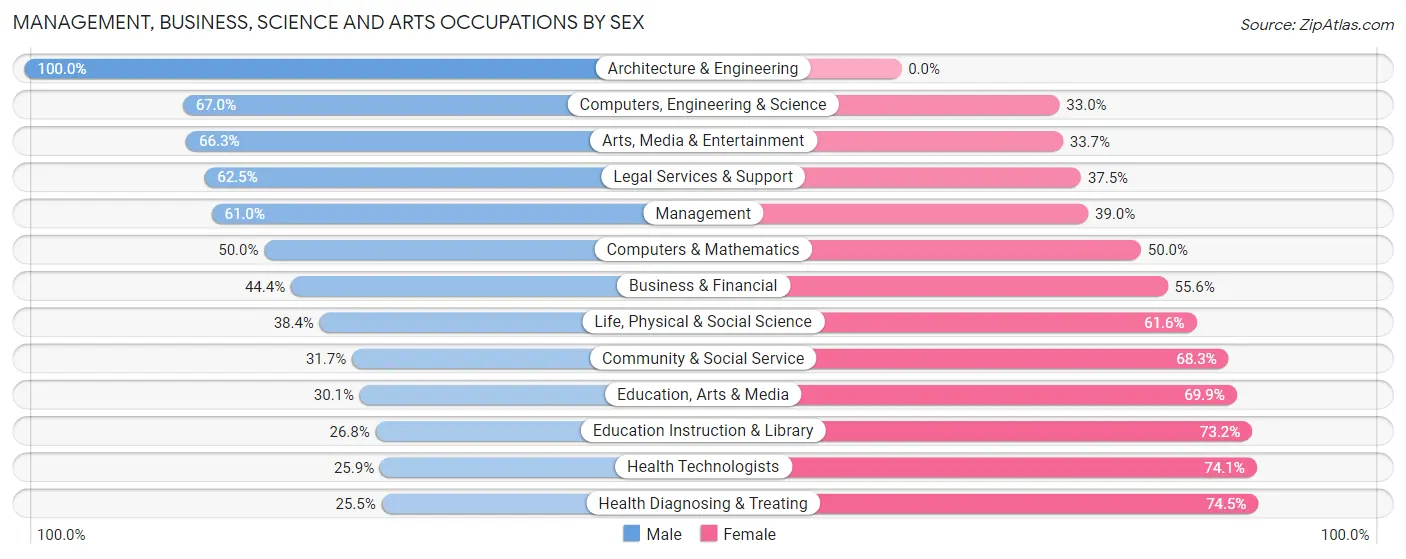
| Occupation | Male | Female |
| Management | 857 (61.0%) | 548 (39.0%) |
| Business & Financial | 315 (44.4%) | 394 (55.6%) |
| Computers, Engineering & Science | 629 (67.0%) | 310 (33.0%) |
| Computers & Mathematics | 121 (50.0%) | 121 (50.0%) |
| Architecture & Engineering | 390 (100.0%) | 0 (0.0%) |
| Life, Physical & Social Science | 118 (38.4%) | 189 (61.6%) |
| Community & Social Service | 960 (31.7%) | 2,067 (68.3%) |
| Education, Arts & Media | 199 (30.1%) | 463 (69.9%) |
| Legal Services & Support | 40 (62.5%) | 24 (37.5%) |
| Education Instruction & Library | 546 (26.8%) | 1,491 (73.2%) |
| Arts, Media & Entertainment | 175 (66.3%) | 89 (33.7%) |
| Health Diagnosing & Treating | 413 (25.5%) | 1,205 (74.5%) |
| Health Technologists | 317 (25.9%) | 909 (74.1%) |
| Total (Category) | 3,174 (41.2%) | 4,524 (58.8%) |
| Total (Overall) | 12,026 (50.6%) | 11,735 (49.4%) |
Services Occupations
The most common Services occupations in Salina are Food Preparation & Serving (1,951 | 8.2%), Cleaning & Maintenance (878 | 3.7%), Healthcare Support (810 | 3.4%), Personal Care & Service (736 | 3.1%), and Security & Protection (367 | 1.5%).
Services Occupations by Sex
Within the Services occupations in Salina, the most male-oriented occupations are Law Enforcement (92.2%), Security & Protection (91.0%), and Firefighting & Prevention (90.3%), while the most female-oriented occupations are Healthcare Support (95.9%), Personal Care & Service (89.7%), and Food Preparation & Serving (50.4%).
| Occupation | Male | Female |
| Healthcare Support | 33 (4.1%) | 777 (95.9%) |
| Security & Protection | 334 (91.0%) | 33 (9.0%) |
| Firefighting & Prevention | 215 (90.3%) | 23 (9.7%) |
| Law Enforcement | 119 (92.2%) | 10 (7.7%) |
| Food Preparation & Serving | 967 (49.6%) | 984 (50.4%) |
| Cleaning & Maintenance | 600 (68.3%) | 278 (31.7%) |
| Personal Care & Service | 76 (10.3%) | 660 (89.7%) |
| Total (Category) | 2,010 (42.4%) | 2,732 (57.6%) |
| Total (Overall) | 12,026 (50.6%) | 11,735 (49.4%) |
Sales and Office Occupations
The most common Sales and Office occupations in Salina are Office & Administration (2,867 | 12.1%), and Sales & Related (2,427 | 10.2%).
Sales and Office Occupations by Sex
| Occupation | Male | Female |
| Sales & Related | 1,228 (50.6%) | 1,199 (49.4%) |
| Office & Administration | 510 (17.8%) | 2,357 (82.2%) |
| Total (Category) | 1,738 (32.8%) | 3,556 (67.2%) |
| Total (Overall) | 12,026 (50.6%) | 11,735 (49.4%) |
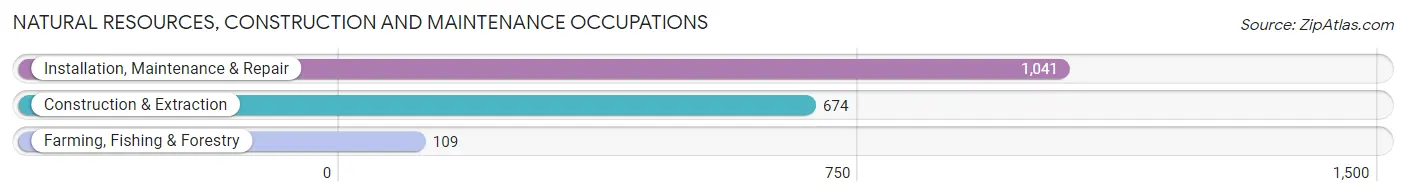
Natural Resources, Construction and Maintenance Occupations
The most common Natural Resources, Construction and Maintenance occupations in Salina are Installation, Maintenance & Repair (1,041 | 4.4%), Construction & Extraction (674 | 2.8%), and Farming, Fishing & Forestry (109 | 0.5%).
Natural Resources, Construction and Maintenance Occupations by Sex
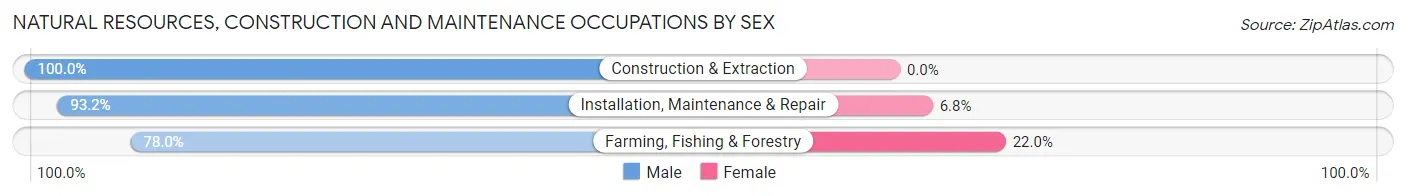
| Occupation | Male | Female |
| Farming, Fishing & Forestry | 85 (78.0%) | 24 (22.0%) |
| Construction & Extraction | 674 (100.0%) | 0 (0.0%) |
| Installation, Maintenance & Repair | 970 (93.2%) | 71 (6.8%) |
| Total (Category) | 1,729 (94.8%) | 95 (5.2%) |
| Total (Overall) | 12,026 (50.6%) | 11,735 (49.4%) |
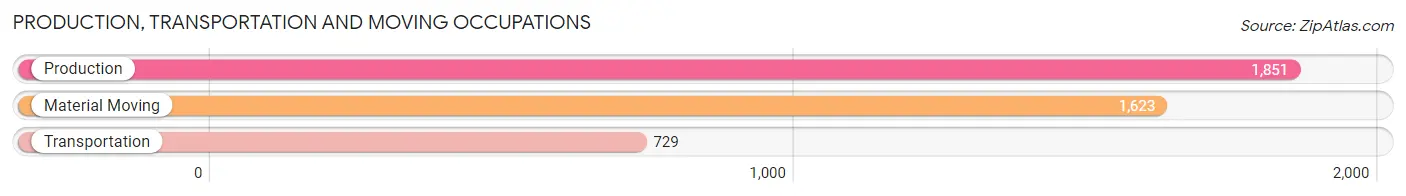
Production, Transportation and Moving Occupations
The most common Production, Transportation and Moving occupations in Salina are Production (1,851 | 7.8%), Material Moving (1,623 | 6.8%), and Transportation (729 | 3.1%).
Production, Transportation and Moving Occupations by Sex
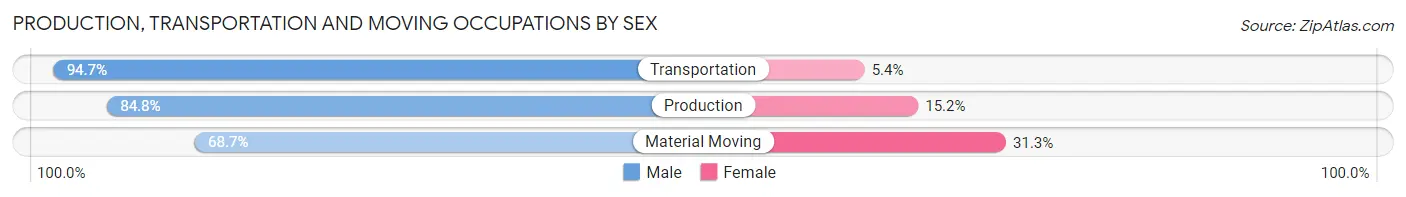
| Occupation | Male | Female |
| Production | 1,570 (84.8%) | 281 (15.2%) |
| Transportation | 690 (94.7%) | 39 (5.3%) |
| Material Moving | 1,115 (68.7%) | 508 (31.3%) |
| Total (Category) | 3,375 (80.3%) | 828 (19.7%) |
| Total (Overall) | 12,026 (50.6%) | 11,735 (49.4%) |
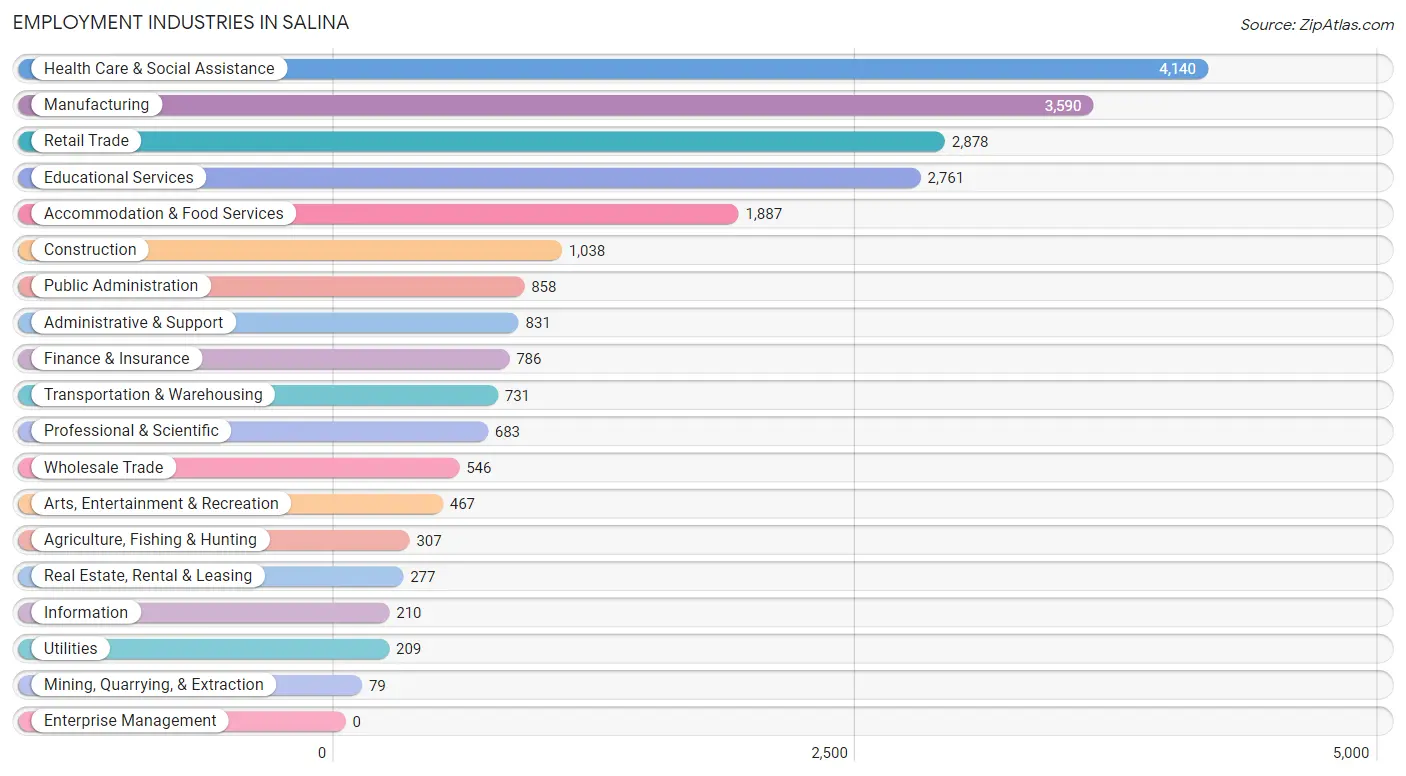
Employment Industries by Sex in Salina
Employment Industries in Salina
The major employment industries in Salina include Health Care & Social Assistance (4,140 | 17.4%), Manufacturing (3,590 | 15.1%), Retail Trade (2,878 | 12.1%), Educational Services (2,761 | 11.6%), and Accommodation & Food Services (1,887 | 7.9%).
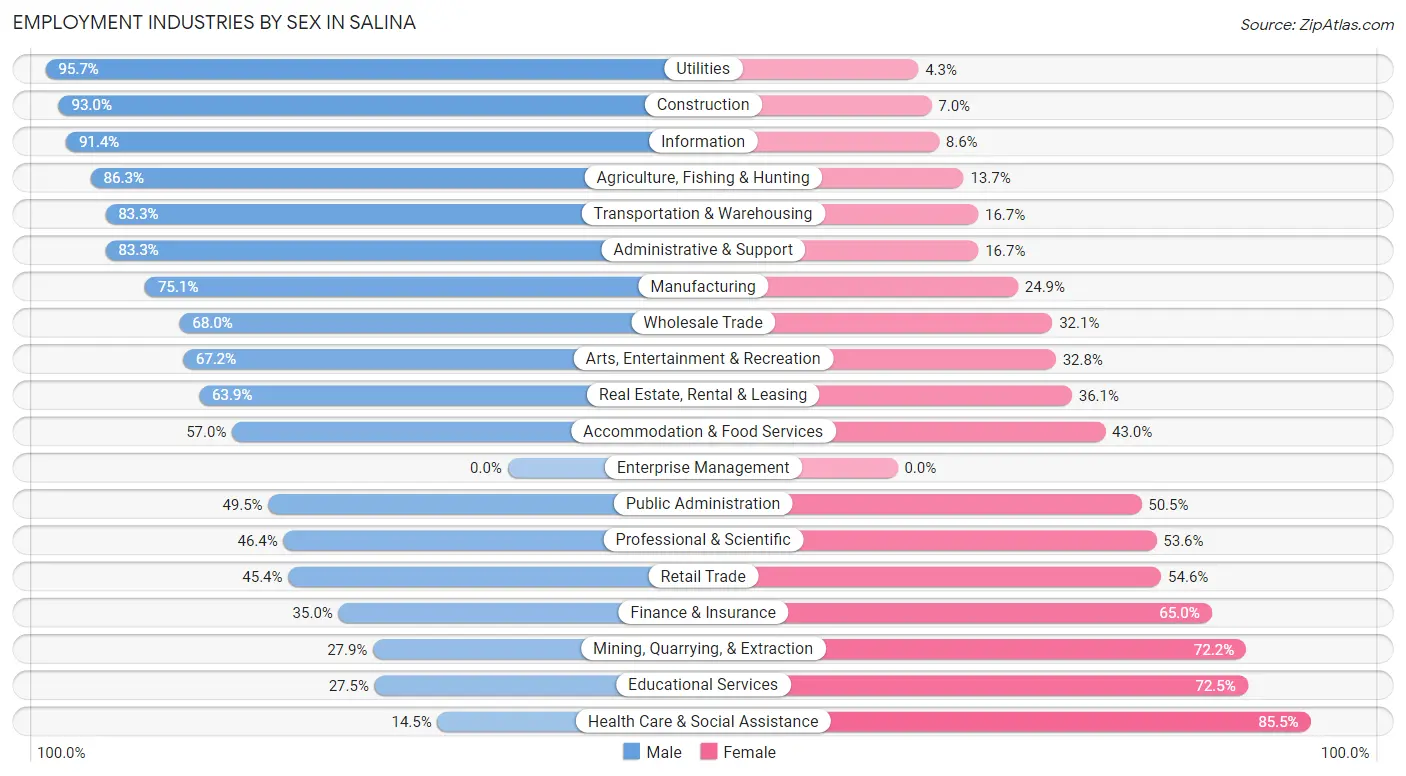
Employment Industries by Sex in Salina
The Salina industries that see more men than women are Utilities (95.7%), Construction (93.0%), and Information (91.4%), whereas the industries that tend to have a higher number of women are Health Care & Social Assistance (85.5%), Educational Services (72.5%), and Mining, Quarrying, & Extraction (72.2%).
| Industry | Male | Female |
| Agriculture, Fishing & Hunting | 265 (86.3%) | 42 (13.7%) |
| Mining, Quarrying, & Extraction | 22 (27.9%) | 57 (72.2%) |
| Construction | 965 (93.0%) | 73 (7.0%) |
| Manufacturing | 2,695 (75.1%) | 895 (24.9%) |
| Wholesale Trade | 371 (67.9%) | 175 (32.1%) |
| Retail Trade | 1,307 (45.4%) | 1,571 (54.6%) |
| Transportation & Warehousing | 609 (83.3%) | 122 (16.7%) |
| Utilities | 200 (95.7%) | 9 (4.3%) |
| Information | 192 (91.4%) | 18 (8.6%) |
| Finance & Insurance | 275 (35.0%) | 511 (65.0%) |
| Real Estate, Rental & Leasing | 177 (63.9%) | 100 (36.1%) |
| Professional & Scientific | 317 (46.4%) | 366 (53.6%) |
| Enterprise Management | 0 (0.0%) | 0 (0.0%) |
| Administrative & Support | 692 (83.3%) | 139 (16.7%) |
| Educational Services | 760 (27.5%) | 2,001 (72.5%) |
| Health Care & Social Assistance | 601 (14.5%) | 3,539 (85.5%) |
| Arts, Entertainment & Recreation | 314 (67.2%) | 153 (32.8%) |
| Accommodation & Food Services | 1,076 (57.0%) | 811 (43.0%) |
| Public Administration | 425 (49.5%) | 433 (50.5%) |
| Total | 12,026 (50.6%) | 11,735 (49.4%) |
Education in Salina
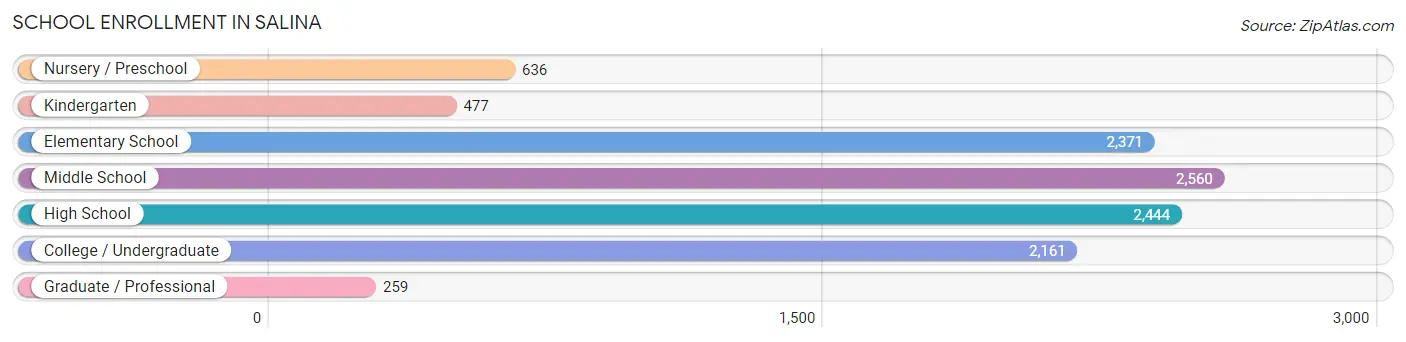
School Enrollment in Salina
The most common levels of schooling among the 10,908 students in Salina are middle school (2,560 | 23.5%), high school (2,444 | 22.4%), and elementary school (2,371 | 21.7%).
| School Level | # Students | % Students |
| Nursery / Preschool | 636 | 5.8% |
| Kindergarten | 477 | 4.4% |
| Elementary School | 2,371 | 21.7% |
| Middle School | 2,560 | 23.5% |
| High School | 2,444 | 22.4% |
| College / Undergraduate | 2,161 | 19.8% |
| Graduate / Professional | 259 | 2.4% |
| Total | 10,908 | 100.0% |
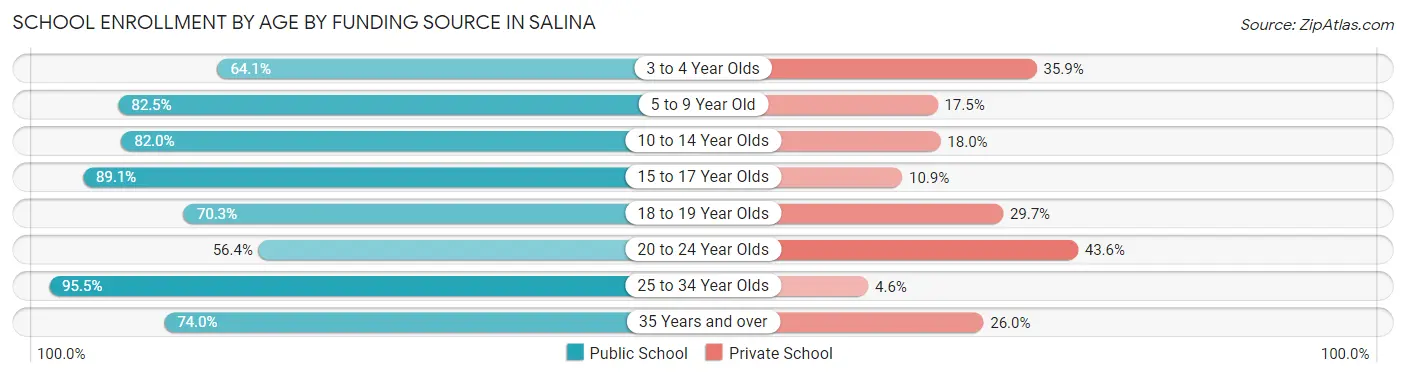
School Enrollment by Age by Funding Source in Salina
Out of a total of 10,908 students who are enrolled in schools in Salina, 2,258 (20.7%) attend a private institution, while the remaining 8,650 (79.3%) are enrolled in public schools. The age group of 20 to 24 year olds has the highest likelihood of being enrolled in private schools, with 447 (43.6% in the age bracket) enrolled. Conversely, the age group of 25 to 34 year olds has the lowest likelihood of being enrolled in a private school, with 399 (95.5% in the age bracket) attending a public institution.
| Age Bracket | Public School | Private School |
| 3 to 4 Year Olds | 296 (64.1%) | 166 (35.9%) |
| 5 to 9 Year Old | 2,306 (82.5%) | 488 (17.5%) |
| 10 to 14 Year Olds | 2,421 (82.0%) | 532 (18.0%) |
| 15 to 17 Year Olds | 1,616 (89.1%) | 197 (10.9%) |
| 18 to 19 Year Olds | 685 (70.3%) | 289 (29.7%) |
| 20 to 24 Year Olds | 578 (56.4%) | 447 (43.6%) |
| 25 to 34 Year Olds | 399 (95.5%) | 19 (4.5%) |
| 35 Years and over | 347 (74.0%) | 122 (26.0%) |
| Total | 8,650 (79.3%) | 2,258 (20.7%) |
Educational Attainment by Field of Study in Salina
Business (1,694 | 17.7%), education (1,521 | 15.9%), science & technology (1,231 | 12.8%), arts & humanities (896 | 9.3%), and psychology (752 | 7.8%) are the most common fields of study among 9,595 individuals in Salina who have obtained a bachelor's degree or higher.
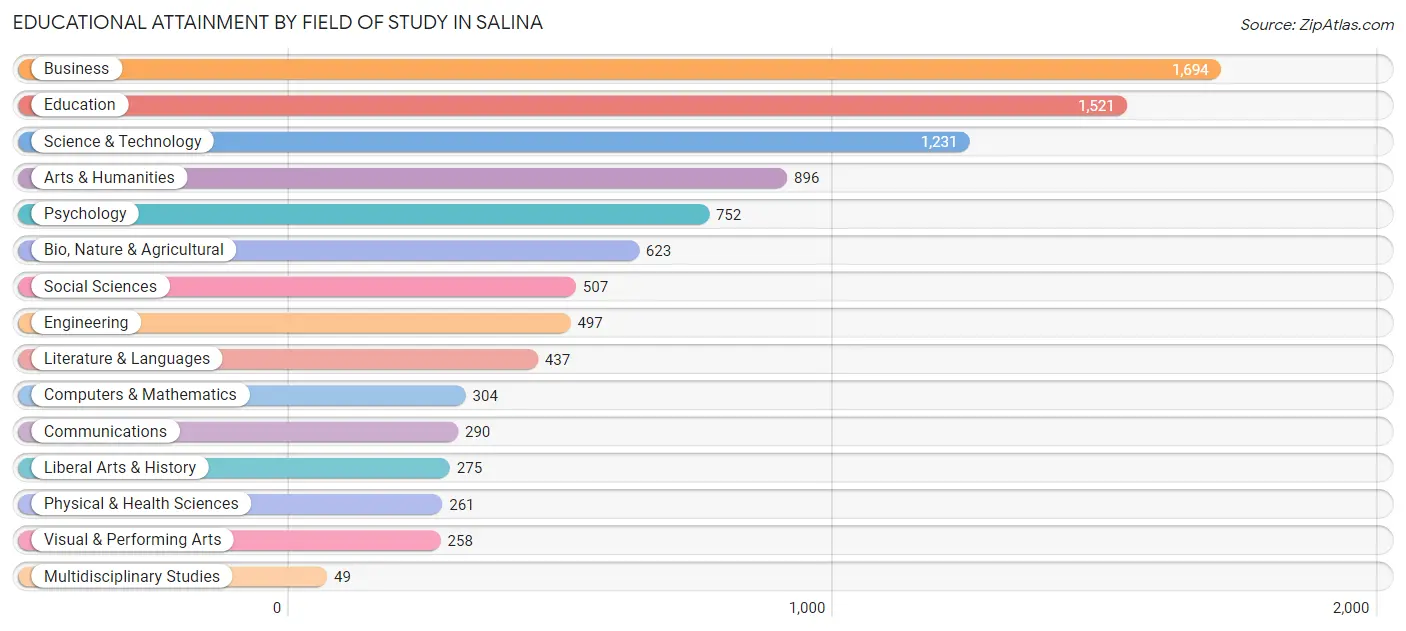
| Field of Study | # Graduates | % Graduates |
| Computers & Mathematics | 304 | 3.2% |
| Bio, Nature & Agricultural | 623 | 6.5% |
| Physical & Health Sciences | 261 | 2.7% |
| Psychology | 752 | 7.8% |
| Social Sciences | 507 | 5.3% |
| Engineering | 497 | 5.2% |
| Multidisciplinary Studies | 49 | 0.5% |
| Science & Technology | 1,231 | 12.8% |
| Business | 1,694 | 17.7% |
| Education | 1,521 | 15.9% |
| Literature & Languages | 437 | 4.5% |
| Liberal Arts & History | 275 | 2.9% |
| Visual & Performing Arts | 258 | 2.7% |
| Communications | 290 | 3.0% |
| Arts & Humanities | 896 | 9.3% |
| Total | 9,595 | 100.0% |
Transportation & Commute in Salina
Vehicle Availability by Sex in Salina
The most prevalent vehicle ownership categories in Salina are males with 2 vehicles (4,570, accounting for 39.7%) and females with 2 vehicles (4,471, making up 40.9%).
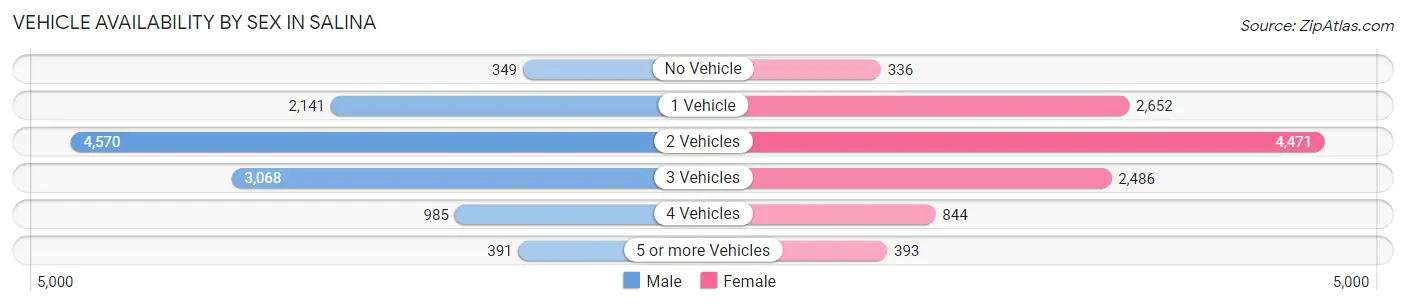
| Vehicles Available | Male | Female |
| No Vehicle | 349 (3.0%) | 336 (3.0%) |
| 1 Vehicle | 2,141 (18.6%) | 2,652 (23.7%) |
| 2 Vehicles | 4,570 (39.7%) | 4,471 (40.0%) |
| 3 Vehicles | 3,068 (26.7%) | 2,486 (22.2%) |
| 4 Vehicles | 985 (8.6%) | 844 (7.5%) |
| 5 or more Vehicles | 391 (3.4%) | 393 (3.5%) |
| Total | 11,504 (100.0%) | 11,182 (100.0%) |
Commute Time in Salina
The most frequently occuring commute durations in Salina are 10 to 14 minutes (7,119 commuters, 32.8%), 5 to 9 minutes (5,527 commuters, 25.5%), and 15 to 19 minutes (4,083 commuters, 18.8%).
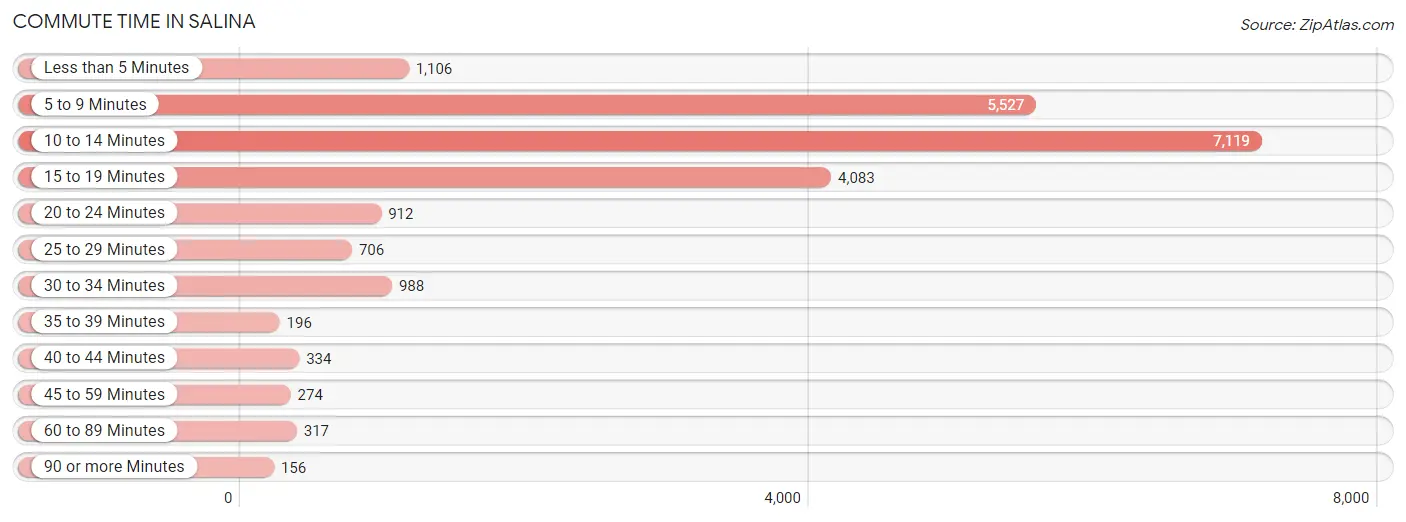
| Commute Time | # Commuters | % Commuters |
| Less than 5 Minutes | 1,106 | 5.1% |
| 5 to 9 Minutes | 5,527 | 25.5% |
| 10 to 14 Minutes | 7,119 | 32.8% |
| 15 to 19 Minutes | 4,083 | 18.8% |
| 20 to 24 Minutes | 912 | 4.2% |
| 25 to 29 Minutes | 706 | 3.3% |
| 30 to 34 Minutes | 988 | 4.5% |
| 35 to 39 Minutes | 196 | 0.9% |
| 40 to 44 Minutes | 334 | 1.5% |
| 45 to 59 Minutes | 274 | 1.3% |
| 60 to 89 Minutes | 317 | 1.5% |
| 90 or more Minutes | 156 | 0.7% |
Commute Time by Sex in Salina
The most common commute times in Salina are 10 to 14 minutes (3,665 commuters, 32.1%) for males and 10 to 14 minutes (3,454 commuters, 33.5%) for females.
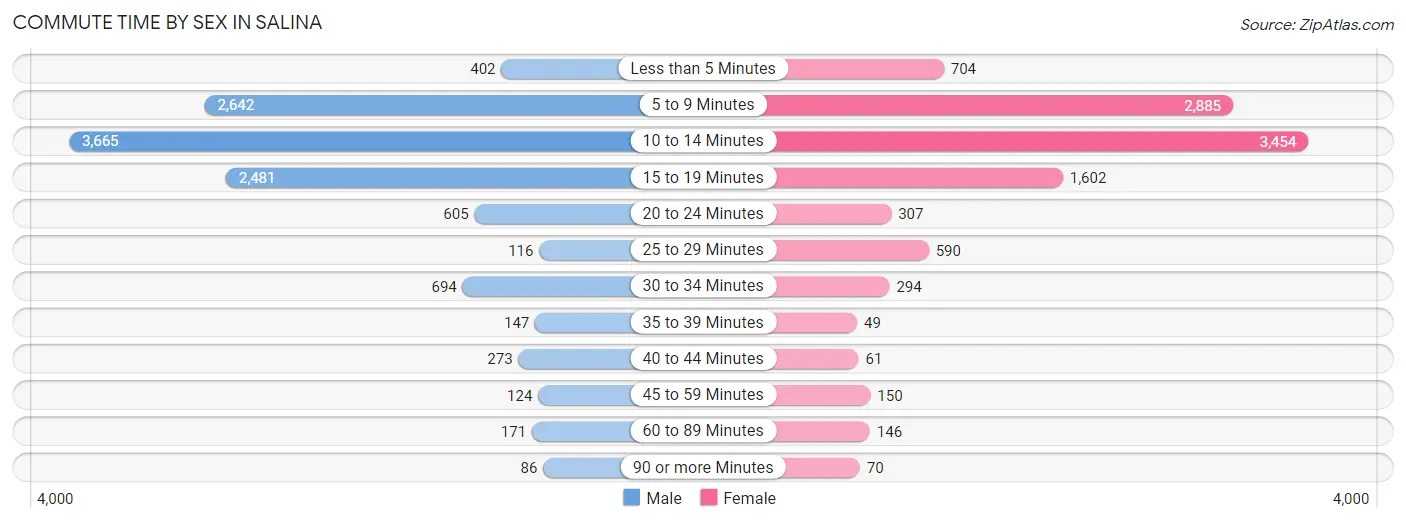
| Commute Time | Male | Female |
| Less than 5 Minutes | 402 (3.5%) | 704 (6.8%) |
| 5 to 9 Minutes | 2,642 (23.2%) | 2,885 (28.0%) |
| 10 to 14 Minutes | 3,665 (32.1%) | 3,454 (33.5%) |
| 15 to 19 Minutes | 2,481 (21.7%) | 1,602 (15.5%) |
| 20 to 24 Minutes | 605 (5.3%) | 307 (3.0%) |
| 25 to 29 Minutes | 116 (1.0%) | 590 (5.7%) |
| 30 to 34 Minutes | 694 (6.1%) | 294 (2.9%) |
| 35 to 39 Minutes | 147 (1.3%) | 49 (0.5%) |
| 40 to 44 Minutes | 273 (2.4%) | 61 (0.6%) |
| 45 to 59 Minutes | 124 (1.1%) | 150 (1.5%) |
| 60 to 89 Minutes | 171 (1.5%) | 146 (1.4%) |
| 90 or more Minutes | 86 (0.7%) | 70 (0.7%) |
Time of Departure to Work by Sex in Salina
The most frequent times of departure to work in Salina are 7:30 AM to 7:59 AM (2,498, 21.9%) for males and 7:30 AM to 7:59 AM (2,489, 24.1%) for females.
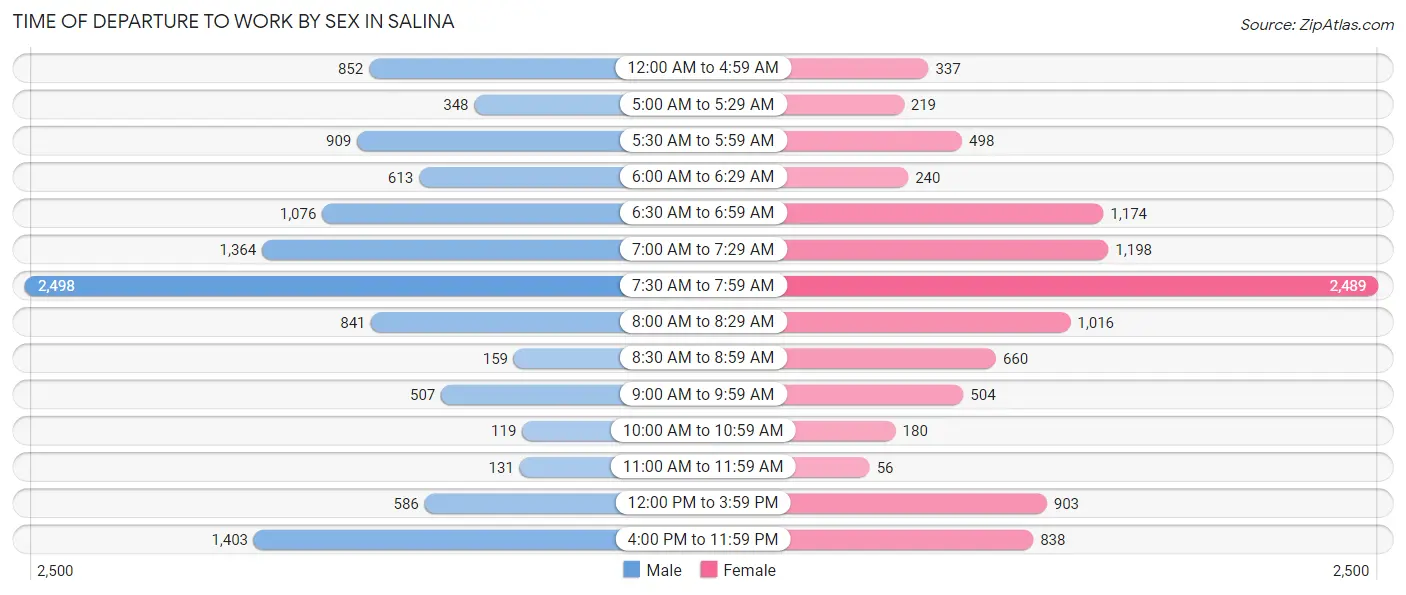
| Time of Departure | Male | Female |
| 12:00 AM to 4:59 AM | 852 (7.5%) | 337 (3.3%) |
| 5:00 AM to 5:29 AM | 348 (3.0%) | 219 (2.1%) |
| 5:30 AM to 5:59 AM | 909 (8.0%) | 498 (4.8%) |
| 6:00 AM to 6:29 AM | 613 (5.4%) | 240 (2.3%) |
| 6:30 AM to 6:59 AM | 1,076 (9.4%) | 1,174 (11.4%) |
| 7:00 AM to 7:29 AM | 1,364 (12.0%) | 1,198 (11.6%) |
| 7:30 AM to 7:59 AM | 2,498 (21.9%) | 2,489 (24.1%) |
| 8:00 AM to 8:29 AM | 841 (7.4%) | 1,016 (9.9%) |
| 8:30 AM to 8:59 AM | 159 (1.4%) | 660 (6.4%) |
| 9:00 AM to 9:59 AM | 507 (4.4%) | 504 (4.9%) |
| 10:00 AM to 10:59 AM | 119 (1.0%) | 180 (1.8%) |
| 11:00 AM to 11:59 AM | 131 (1.1%) | 56 (0.5%) |
| 12:00 PM to 3:59 PM | 586 (5.1%) | 903 (8.8%) |
| 4:00 PM to 11:59 PM | 1,403 (12.3%) | 838 (8.1%) |
| Total | 11,406 (100.0%) | 10,312 (100.0%) |
Housing Occupancy in Salina
Occupancy by Ownership in Salina
Of the total 19,442 dwellings in Salina, owner-occupied units account for 12,515 (64.4%), while renter-occupied units make up 6,927 (35.6%).
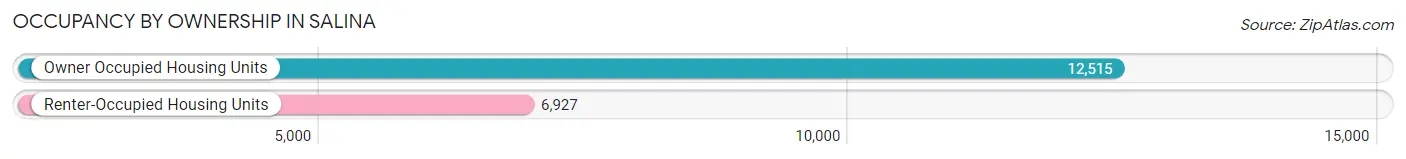
| Occupancy | # Housing Units | % Housing Units |
| Owner Occupied Housing Units | 12,515 | 64.4% |
| Renter-Occupied Housing Units | 6,927 | 35.6% |
| Total Occupied Housing Units | 19,442 | 100.0% |
Occupancy by Household Size in Salina
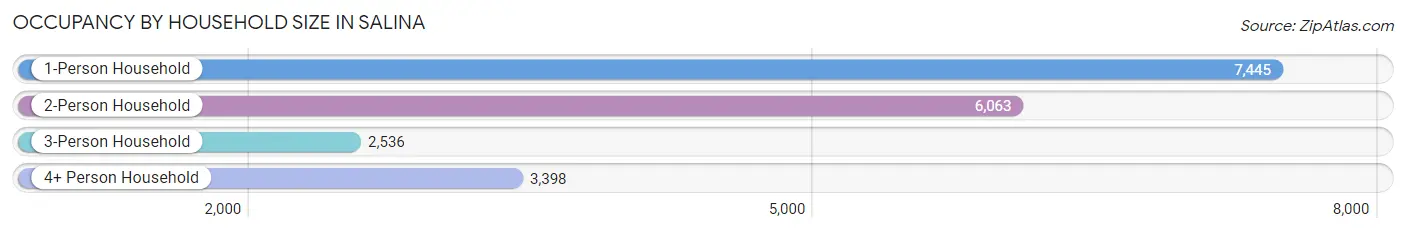
| Household Size | # Housing Units | % Housing Units |
| 1-Person Household | 7,445 | 38.3% |
| 2-Person Household | 6,063 | 31.2% |
| 3-Person Household | 2,536 | 13.0% |
| 4+ Person Household | 3,398 | 17.5% |
| Total Housing Units | 19,442 | 100.0% |
Occupancy by Ownership by Household Size in Salina
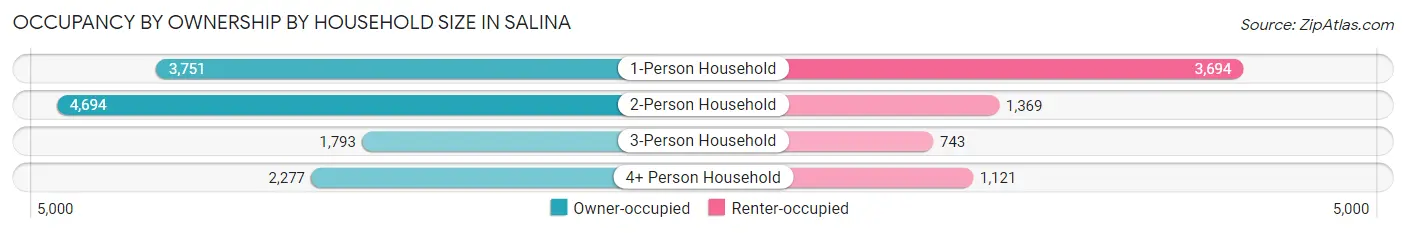
| Household Size | Owner-occupied | Renter-occupied |
| 1-Person Household | 3,751 (50.4%) | 3,694 (49.6%) |
| 2-Person Household | 4,694 (77.4%) | 1,369 (22.6%) |
| 3-Person Household | 1,793 (70.7%) | 743 (29.3%) |
| 4+ Person Household | 2,277 (67.0%) | 1,121 (33.0%) |
| Total Housing Units | 12,515 (64.4%) | 6,927 (35.6%) |
Occupancy by Educational Attainment in Salina
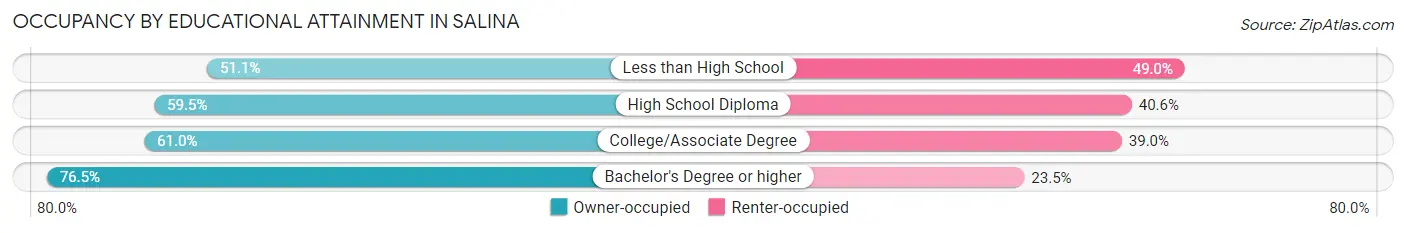
| Household Size | Owner-occupied | Renter-occupied |
| Less than High School | 558 (51.0%) | 535 (48.9%) |
| High School Diploma | 3,133 (59.5%) | 2,137 (40.6%) |
| College/Associate Degree | 4,660 (61.0%) | 2,975 (39.0%) |
| Bachelor's Degree or higher | 4,164 (76.5%) | 1,280 (23.5%) |
Occupancy by Age of Householder in Salina
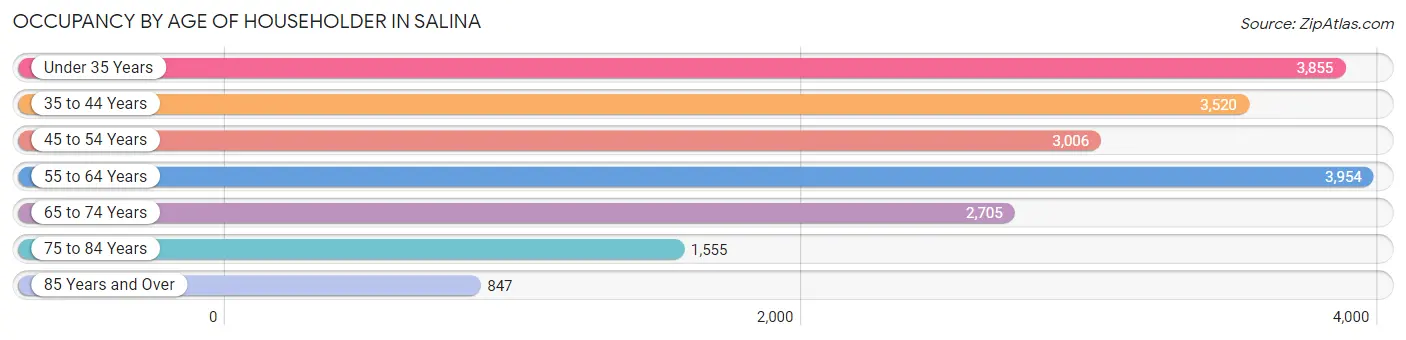
| Age Bracket | # Households | % Households |
| Under 35 Years | 3,855 | 19.8% |
| 35 to 44 Years | 3,520 | 18.1% |
| 45 to 54 Years | 3,006 | 15.5% |
| 55 to 64 Years | 3,954 | 20.3% |
| 65 to 74 Years | 2,705 | 13.9% |
| 75 to 84 Years | 1,555 | 8.0% |
| 85 Years and Over | 847 | 4.4% |
| Total | 19,442 | 100.0% |
Housing Finances in Salina
Median Income by Occupancy in Salina
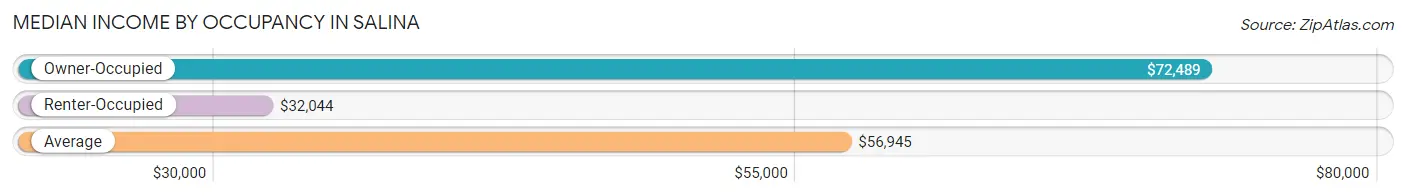
| Occupancy Type | # Households | Median Income |
| Owner-Occupied | 12,515 (64.4%) | $72,489 |
| Renter-Occupied | 6,927 (35.6%) | $32,044 |
| Average | 19,442 (100.0%) | $56,945 |
Occupancy by Householder Income Bracket in Salina
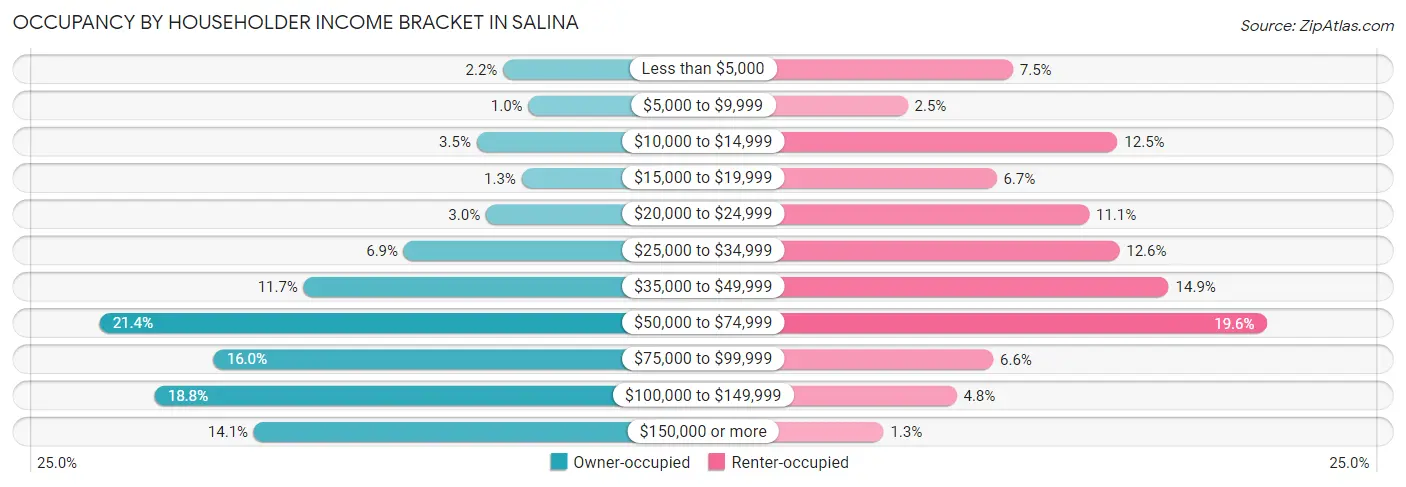
| Income Bracket | Owner-occupied | Renter-occupied |
| Less than $5,000 | 277 (2.2%) | 519 (7.5%) |
| $5,000 to $9,999 | 127 (1.0%) | 172 (2.5%) |
| $10,000 to $14,999 | 434 (3.5%) | 864 (12.5%) |
| $15,000 to $19,999 | 166 (1.3%) | 465 (6.7%) |
| $20,000 to $24,999 | 379 (3.0%) | 770 (11.1%) |
| $25,000 to $34,999 | 869 (6.9%) | 870 (12.6%) |
| $35,000 to $49,999 | 1,466 (11.7%) | 1,033 (14.9%) |
| $50,000 to $74,999 | 2,681 (21.4%) | 1,355 (19.6%) |
| $75,000 to $99,999 | 2,001 (16.0%) | 454 (6.6%) |
| $100,000 to $149,999 | 2,353 (18.8%) | 333 (4.8%) |
| $150,000 or more | 1,762 (14.1%) | 92 (1.3%) |
| Total | 12,515 (100.0%) | 6,927 (100.0%) |
Monthly Housing Cost Tiers in Salina
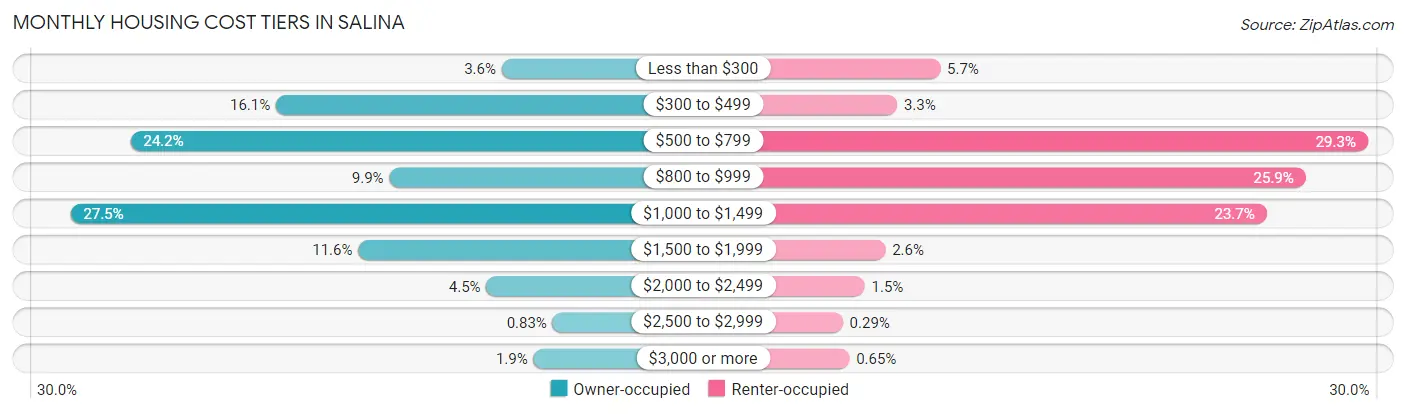
| Monthly Cost | Owner-occupied | Renter-occupied |
| Less than $300 | 455 (3.6%) | 393 (5.7%) |
| $300 to $499 | 2,016 (16.1%) | 228 (3.3%) |
| $500 to $799 | 3,023 (24.2%) | 2,029 (29.3%) |
| $800 to $999 | 1,233 (9.9%) | 1,791 (25.9%) |
| $1,000 to $1,499 | 3,438 (27.5%) | 1,642 (23.7%) |
| $1,500 to $1,999 | 1,448 (11.6%) | 183 (2.6%) |
| $2,000 to $2,499 | 562 (4.5%) | 104 (1.5%) |
| $2,500 to $2,999 | 104 (0.8%) | 20 (0.3%) |
| $3,000 or more | 236 (1.9%) | 45 (0.6%) |
| Total | 12,515 (100.0%) | 6,927 (100.0%) |
Physical Housing Characteristics in Salina
Housing Structures in Salina
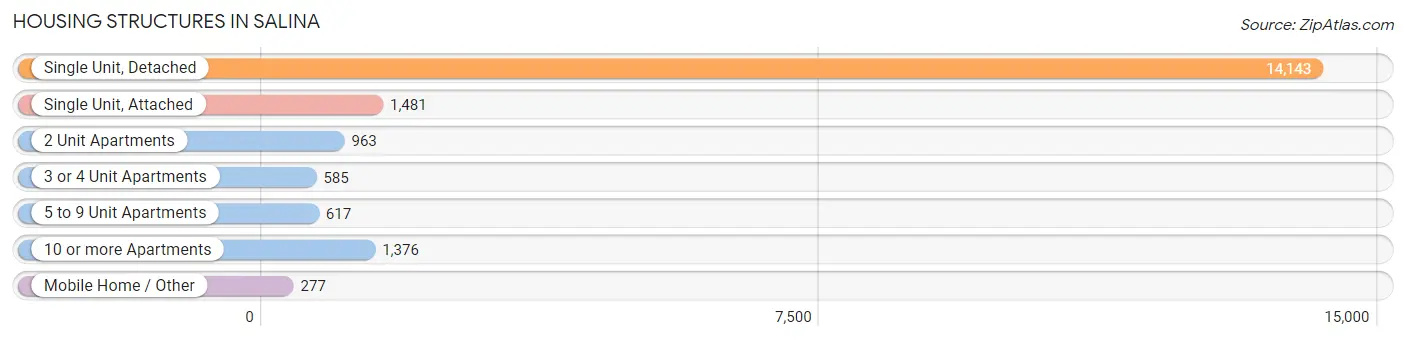
| Structure Type | # Housing Units | % Housing Units |
| Single Unit, Detached | 14,143 | 72.7% |
| Single Unit, Attached | 1,481 | 7.6% |
| 2 Unit Apartments | 963 | 5.0% |
| 3 or 4 Unit Apartments | 585 | 3.0% |
| 5 to 9 Unit Apartments | 617 | 3.2% |
| 10 or more Apartments | 1,376 | 7.1% |
| Mobile Home / Other | 277 | 1.4% |
| Total | 19,442 | 100.0% |
Housing Structures by Occupancy in Salina
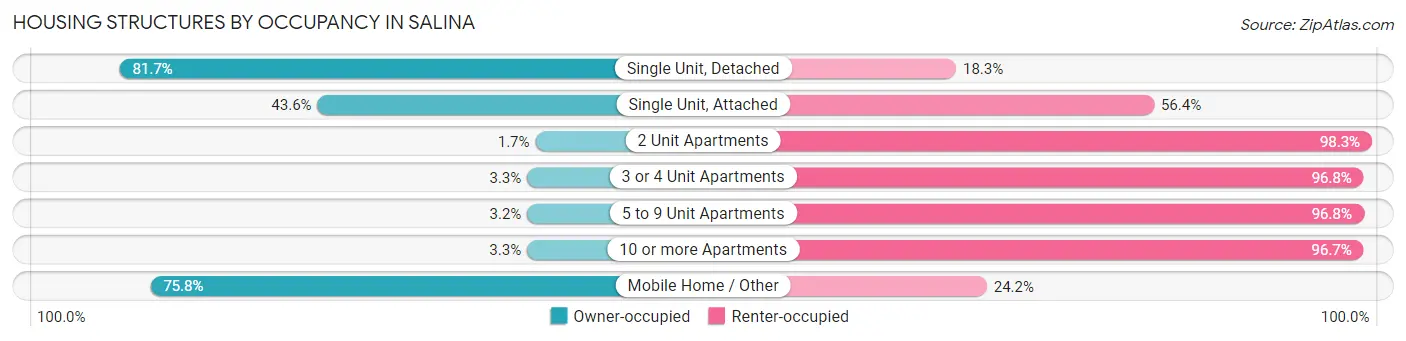
| Structure Type | Owner-occupied | Renter-occupied |
| Single Unit, Detached | 11,559 (81.7%) | 2,584 (18.3%) |
| Single Unit, Attached | 646 (43.6%) | 835 (56.4%) |
| 2 Unit Apartments | 16 (1.7%) | 947 (98.3%) |
| 3 or 4 Unit Apartments | 19 (3.3%) | 566 (96.8%) |
| 5 to 9 Unit Apartments | 20 (3.2%) | 597 (96.8%) |
| 10 or more Apartments | 45 (3.3%) | 1,331 (96.7%) |
| Mobile Home / Other | 210 (75.8%) | 67 (24.2%) |
| Total | 12,515 (64.4%) | 6,927 (35.6%) |
Housing Structures by Number of Rooms in Salina
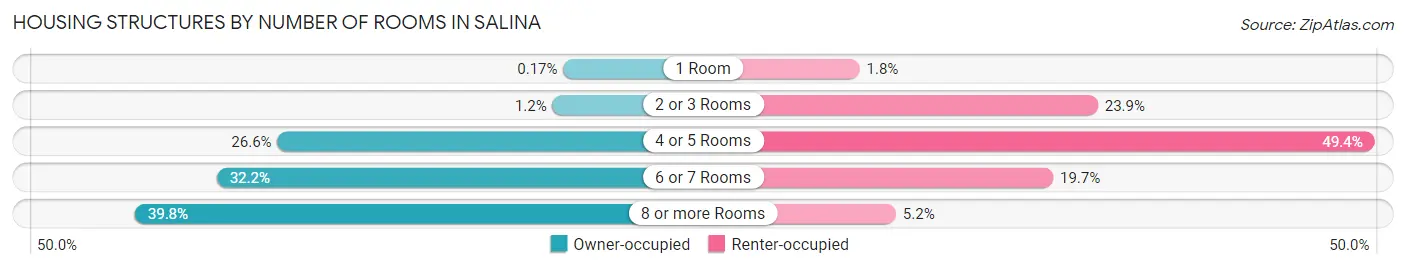
| Number of Rooms | Owner-occupied | Renter-occupied |
| 1 Room | 21 (0.2%) | 126 (1.8%) |
| 2 or 3 Rooms | 147 (1.2%) | 1,652 (23.8%) |
| 4 or 5 Rooms | 3,332 (26.6%) | 3,425 (49.4%) |
| 6 or 7 Rooms | 4,034 (32.2%) | 1,365 (19.7%) |
| 8 or more Rooms | 4,981 (39.8%) | 359 (5.2%) |
| Total | 12,515 (100.0%) | 6,927 (100.0%) |
Housing Structure by Heating Type in Salina
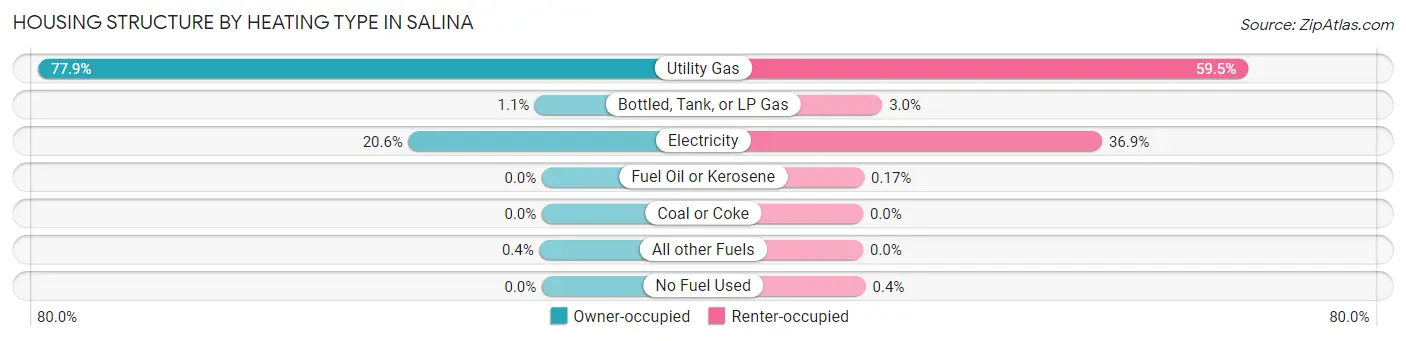
| Heating Type | Owner-occupied | Renter-occupied |
| Utility Gas | 9,750 (77.9%) | 4,122 (59.5%) |
| Bottled, Tank, or LP Gas | 134 (1.1%) | 206 (3.0%) |
| Electricity | 2,581 (20.6%) | 2,559 (36.9%) |
| Fuel Oil or Kerosene | 0 (0.0%) | 12 (0.2%) |
| Coal or Coke | 0 (0.0%) | 0 (0.0%) |
| All other Fuels | 50 (0.4%) | 0 (0.0%) |
| No Fuel Used | 0 (0.0%) | 28 (0.4%) |
| Total | 12,515 (100.0%) | 6,927 (100.0%) |
Household Vehicle Usage in Salina
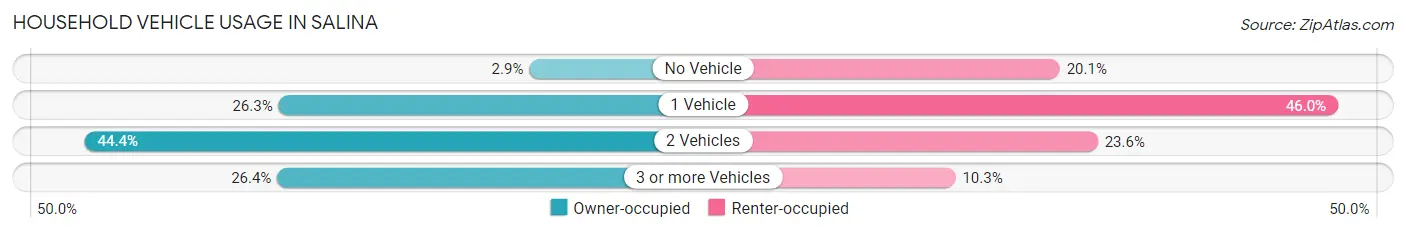
| Vehicles per Household | Owner-occupied | Renter-occupied |
| No Vehicle | 362 (2.9%) | 1,389 (20.1%) |
| 1 Vehicle | 3,291 (26.3%) | 3,188 (46.0%) |
| 2 Vehicles | 5,556 (44.4%) | 1,635 (23.6%) |
| 3 or more Vehicles | 3,306 (26.4%) | 715 (10.3%) |
| Total | 12,515 (100.0%) | 6,927 (100.0%) |
Real Estate & Mortgages in Salina
Real Estate and Mortgage Overview in Salina
| Characteristic | Without Mortgage | With Mortgage |
| Housing Units | 5,392 | 7,123 |
| Median Property Value | $150,800 | $157,900 |
| Median Household Income | $57,660 | $1,175 |
| Monthly Housing Costs | $538 | $236 |
| Real Estate Taxes | $2,094 | $296 |
Property Value by Mortgage Status in Salina
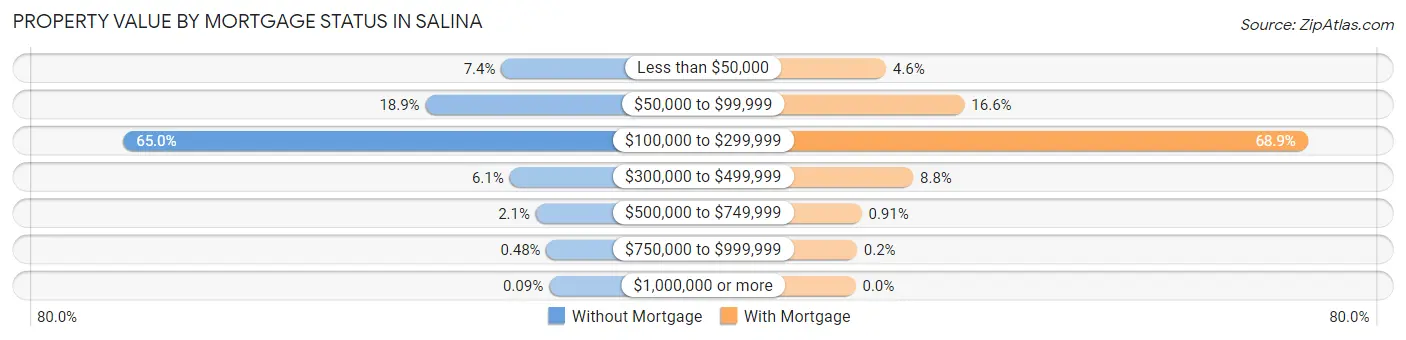
| Property Value | Without Mortgage | With Mortgage |
| Less than $50,000 | 397 (7.4%) | 330 (4.6%) |
| $50,000 to $99,999 | 1,020 (18.9%) | 1,182 (16.6%) |
| $100,000 to $299,999 | 3,502 (64.9%) | 4,907 (68.9%) |
| $300,000 to $499,999 | 329 (6.1%) | 625 (8.8%) |
| $500,000 to $749,999 | 113 (2.1%) | 65 (0.9%) |
| $750,000 to $999,999 | 26 (0.5%) | 14 (0.2%) |
| $1,000,000 or more | 5 (0.1%) | 0 (0.0%) |
| Total | 5,392 (100.0%) | 7,123 (100.0%) |
Household Income by Mortgage Status in Salina
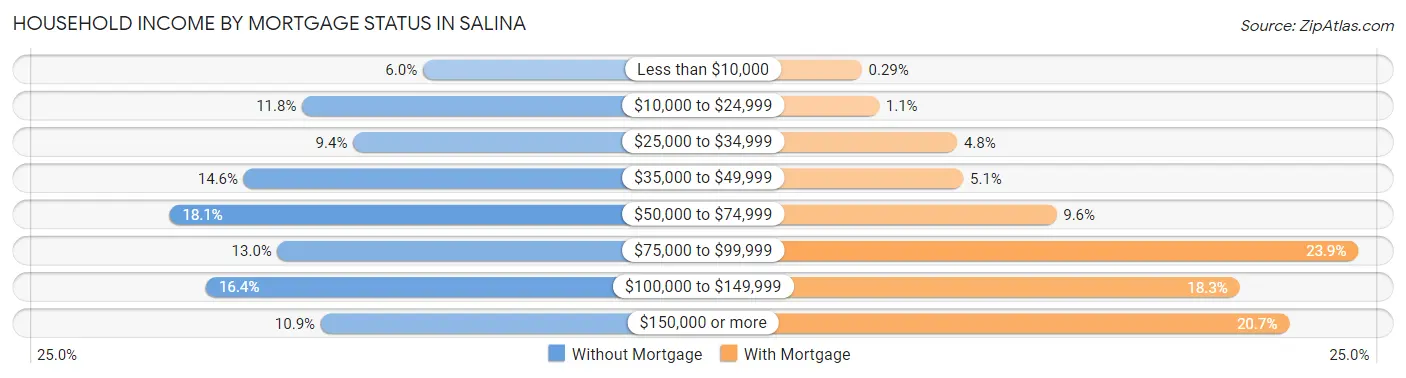
| Household Income | Without Mortgage | With Mortgage |
| Less than $10,000 | 325 (6.0%) | 21 (0.3%) |
| $10,000 to $24,999 | 635 (11.8%) | 79 (1.1%) |
| $25,000 to $34,999 | 504 (9.3%) | 344 (4.8%) |
| $35,000 to $49,999 | 785 (14.6%) | 365 (5.1%) |
| $50,000 to $74,999 | 976 (18.1%) | 681 (9.6%) |
| $75,000 to $99,999 | 698 (13.0%) | 1,705 (23.9%) |
| $100,000 to $149,999 | 882 (16.4%) | 1,303 (18.3%) |
| $150,000 or more | 587 (10.9%) | 1,471 (20.6%) |
| Total | 5,392 (100.0%) | 7,123 (100.0%) |
Property Value to Household Income Ratio in Salina
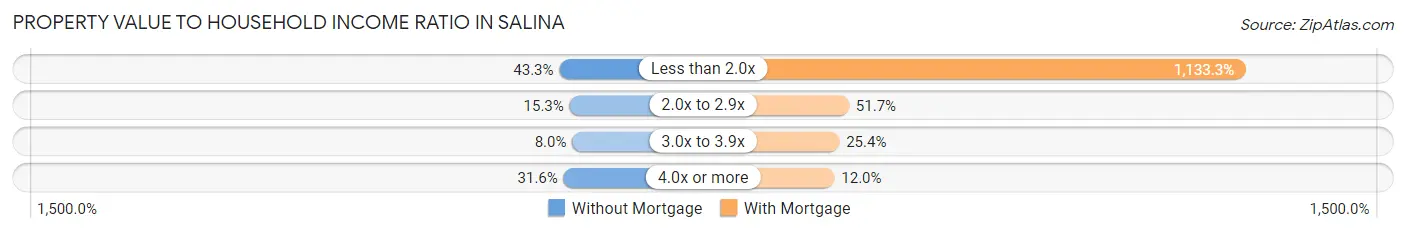
| Value-to-Income Ratio | Without Mortgage | With Mortgage |
| Less than 2.0x | 2,335 (43.3%) | 80,723 (1,133.3%) |
| 2.0x to 2.9x | 823 (15.3%) | 3,682 (51.7%) |
| 3.0x to 3.9x | 429 (8.0%) | 1,808 (25.4%) |
| 4.0x or more | 1,703 (31.6%) | 857 (12.0%) |
| Total | 5,392 (100.0%) | 7,123 (100.0%) |
Real Estate Taxes by Mortgage Status in Salina
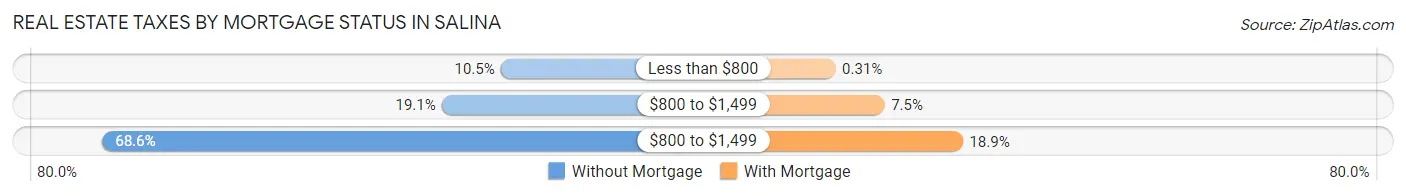
| Property Taxes | Without Mortgage | With Mortgage |
| Less than $800 | 564 (10.5%) | 22 (0.3%) |
| $800 to $1,499 | 1,028 (19.1%) | 533 (7.5%) |
| $800 to $1,499 | 3,701 (68.6%) | 1,347 (18.9%) |
| Total | 5,392 (100.0%) | 7,123 (100.0%) |
Health & Disability in Salina
Health Insurance Coverage by Age in Salina
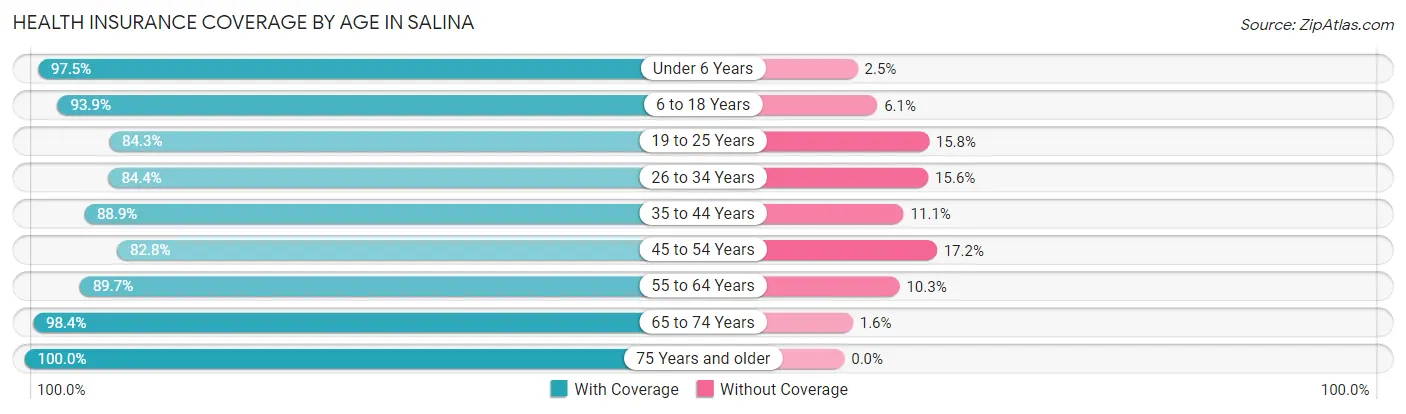
| Age Bracket | With Coverage | Without Coverage |
| Under 6 Years | 3,184 (97.5%) | 81 (2.5%) |
| 6 to 18 Years | 7,634 (93.9%) | 499 (6.1%) |
| 19 to 25 Years | 3,691 (84.3%) | 690 (15.8%) |
| 26 to 34 Years | 4,159 (84.4%) | 771 (15.6%) |
| 35 to 44 Years | 5,197 (88.9%) | 647 (11.1%) |
| 45 to 54 Years | 4,430 (82.8%) | 923 (17.2%) |
| 55 to 64 Years | 5,430 (89.7%) | 623 (10.3%) |
| 65 to 74 Years | 4,355 (98.4%) | 70 (1.6%) |
| 75 Years and older | 3,709 (100.0%) | 0 (0.0%) |
| Total | 41,789 (90.7%) | 4,304 (9.3%) |
Health Insurance Coverage by Citizenship Status in Salina
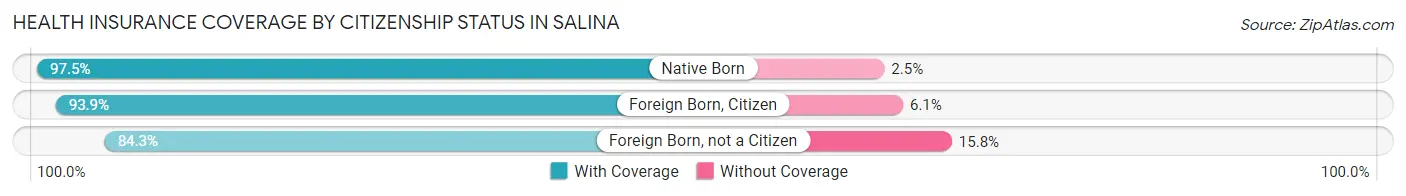
| Citizenship Status | With Coverage | Without Coverage |
| Native Born | 3,184 (97.5%) | 81 (2.5%) |
| Foreign Born, Citizen | 7,634 (93.9%) | 499 (6.1%) |
| Foreign Born, not a Citizen | 3,691 (84.3%) | 690 (15.8%) |
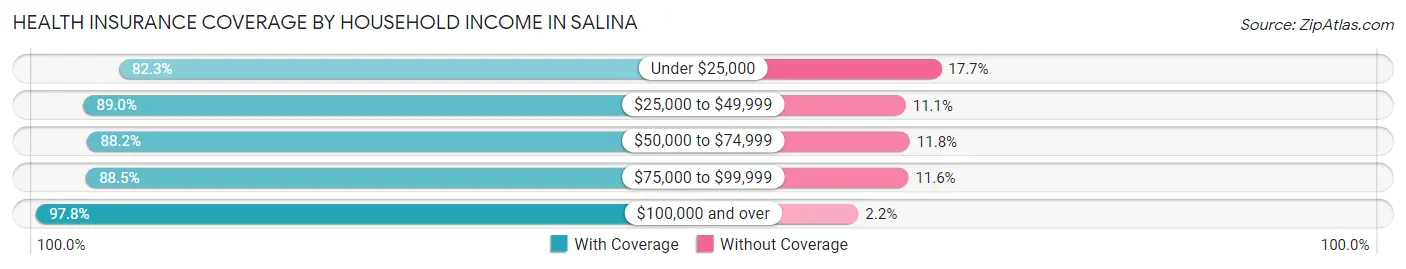
Health Insurance Coverage by Household Income in Salina
| Household Income | With Coverage | Without Coverage |
| Under $25,000 | 4,726 (82.3%) | 1,018 (17.7%) |
| $25,000 to $49,999 | 6,656 (88.9%) | 827 (11.1%) |
| $50,000 to $74,999 | 9,699 (88.2%) | 1,300 (11.8%) |
| $75,000 to $99,999 | 5,431 (88.4%) | 709 (11.6%) |
| $100,000 and over | 14,466 (97.8%) | 322 (2.2%) |
Public vs Private Health Insurance Coverage by Age in Salina
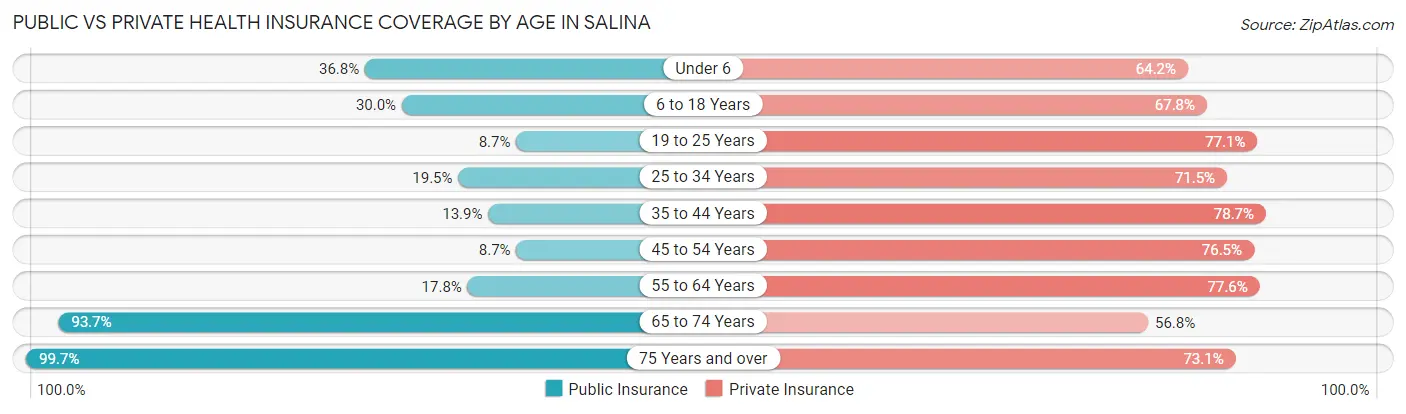
| Age Bracket | Public Insurance | Private Insurance |
| Under 6 | 1,202 (36.8%) | 2,097 (64.2%) |
| 6 to 18 Years | 2,437 (30.0%) | 5,510 (67.7%) |
| 19 to 25 Years | 383 (8.7%) | 3,378 (77.1%) |
| 25 to 34 Years | 961 (19.5%) | 3,524 (71.5%) |
| 35 to 44 Years | 814 (13.9%) | 4,600 (78.7%) |
| 45 to 54 Years | 466 (8.7%) | 4,094 (76.5%) |
| 55 to 64 Years | 1,075 (17.8%) | 4,694 (77.5%) |
| 65 to 74 Years | 4,148 (93.7%) | 2,515 (56.8%) |
| 75 Years and over | 3,699 (99.7%) | 2,710 (73.1%) |
| Total | 15,185 (32.9%) | 33,122 (71.9%) |
Disability Status by Sex by Age in Salina
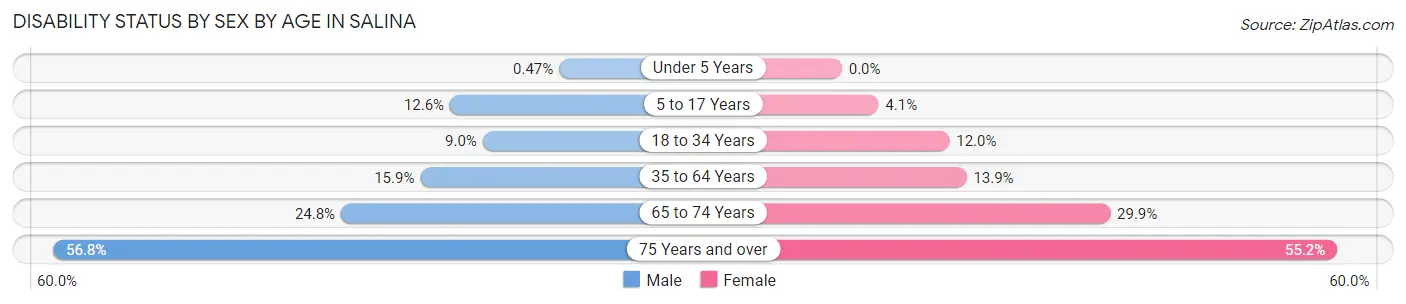
| Age Bracket | Male | Female |
| Under 5 Years | 7 (0.5%) | 0 (0.0%) |
| 5 to 17 Years | 483 (12.6%) | 164 (4.1%) |
| 18 to 34 Years | 476 (9.0%) | 581 (12.0%) |
| 35 to 64 Years | 1,374 (15.9%) | 1,198 (13.9%) |
| 65 to 74 Years | 510 (24.8%) | 707 (29.9%) |
| 75 Years and over | 825 (56.8%) | 1,245 (55.2%) |
Disability Class by Sex by Age in Salina
Disability Class: Hearing Difficulty
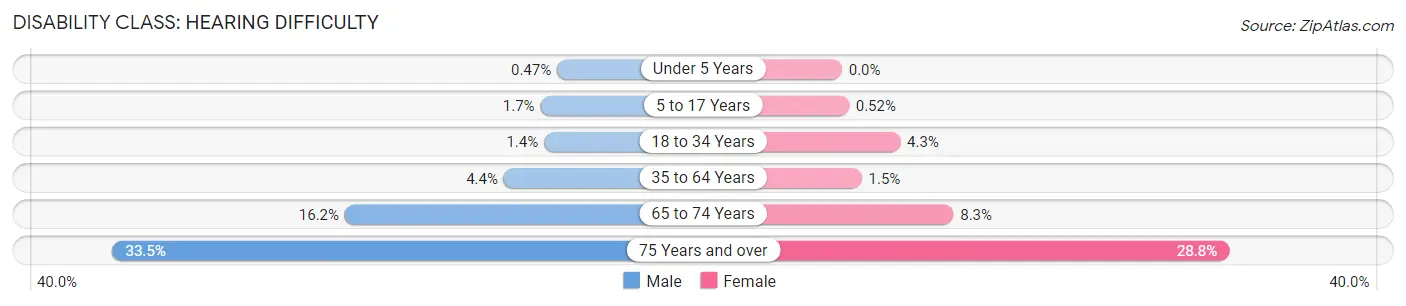
| Age Bracket | Male | Female |
| Under 5 Years | 7 (0.5%) | 0 (0.0%) |
| 5 to 17 Years | 65 (1.7%) | 21 (0.5%) |
| 18 to 34 Years | 76 (1.4%) | 210 (4.3%) |
| 35 to 64 Years | 381 (4.4%) | 127 (1.5%) |
| 65 to 74 Years | 334 (16.2%) | 196 (8.3%) |
| 75 Years and over | 486 (33.5%) | 649 (28.7%) |
Disability Class: Vision Difficulty
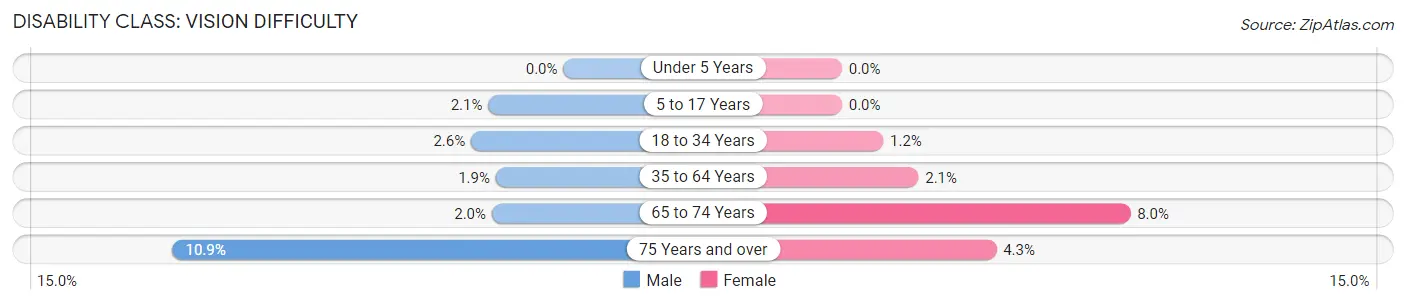
| Age Bracket | Male | Female |
| Under 5 Years | 0 (0.0%) | 0 (0.0%) |
| 5 to 17 Years | 80 (2.1%) | 0 (0.0%) |
| 18 to 34 Years | 136 (2.6%) | 56 (1.1%) |
| 35 to 64 Years | 162 (1.9%) | 184 (2.1%) |
| 65 to 74 Years | 41 (2.0%) | 190 (8.0%) |
| 75 Years and over | 158 (10.9%) | 97 (4.3%) |
Disability Class: Cognitive Difficulty
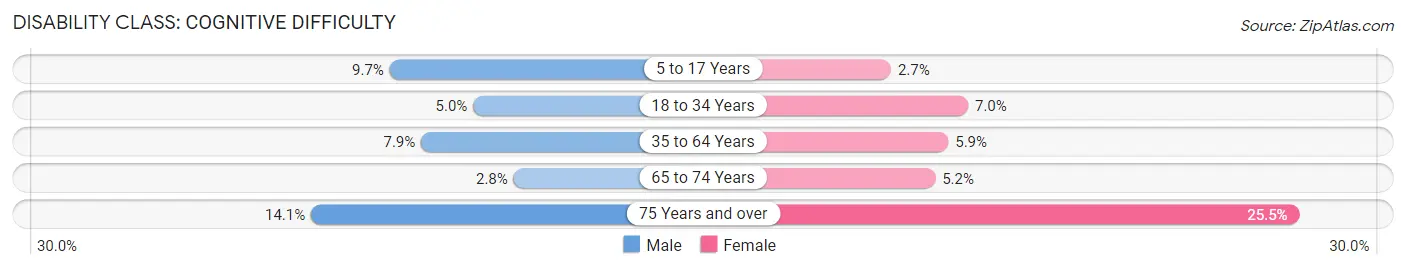
| Age Bracket | Male | Female |
| 5 to 17 Years | 370 (9.7%) | 110 (2.7%) |
| 18 to 34 Years | 266 (5.0%) | 341 (7.0%) |
| 35 to 64 Years | 683 (7.9%) | 512 (5.9%) |
| 65 to 74 Years | 57 (2.8%) | 123 (5.2%) |
| 75 Years and over | 204 (14.1%) | 575 (25.5%) |
Disability Class: Ambulatory Difficulty
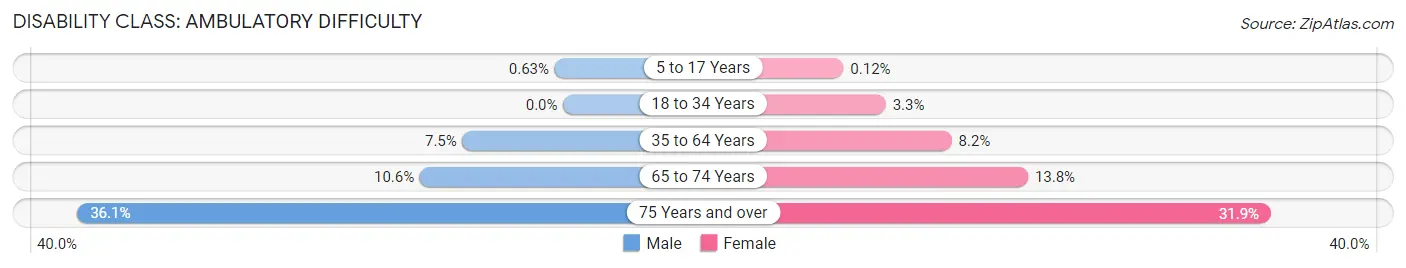
| Age Bracket | Male | Female |
| 5 to 17 Years | 24 (0.6%) | 5 (0.1%) |
| 18 to 34 Years | 0 (0.0%) | 158 (3.3%) |
| 35 to 64 Years | 645 (7.5%) | 703 (8.2%) |
| 65 to 74 Years | 219 (10.6%) | 327 (13.8%) |
| 75 Years and over | 524 (36.1%) | 719 (31.9%) |
Disability Class: Self-Care Difficulty
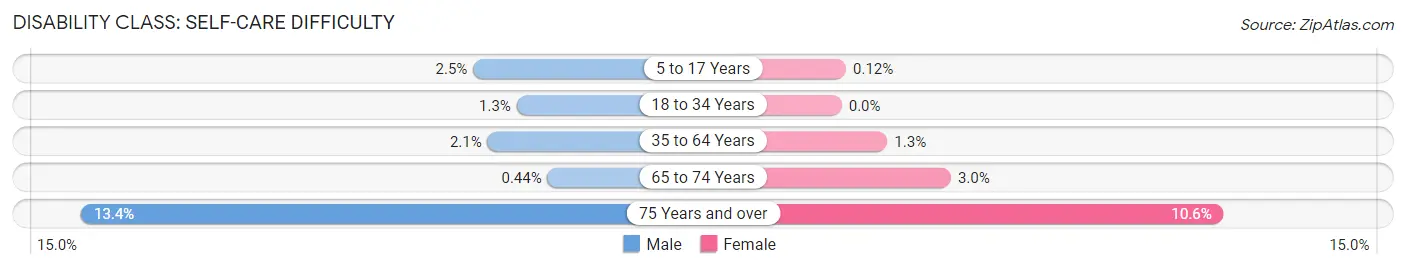
| Age Bracket | Male | Female |
| 5 to 17 Years | 96 (2.5%) | 5 (0.1%) |
| 18 to 34 Years | 69 (1.3%) | 0 (0.0%) |
| 35 to 64 Years | 182 (2.1%) | 110 (1.3%) |
| 65 to 74 Years | 9 (0.4%) | 72 (3.0%) |
| 75 Years and over | 195 (13.4%) | 240 (10.6%) |
Technology Access in Salina
Computing Device Access in Salina
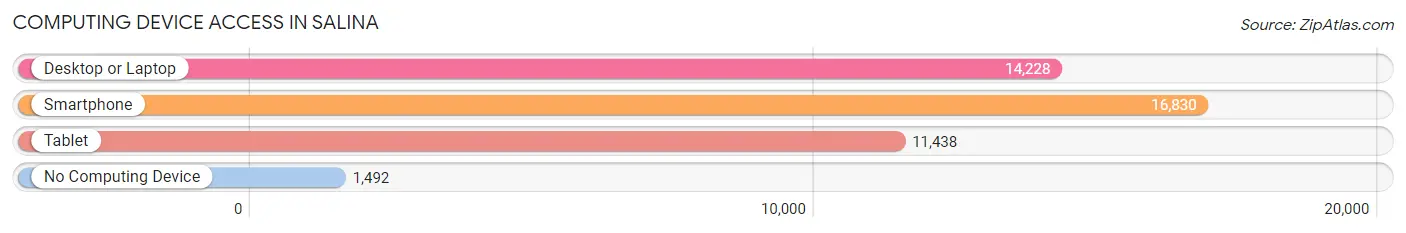
| Device Type | # Households | % Households |
| Desktop or Laptop | 14,228 | 73.2% |
| Smartphone | 16,830 | 86.6% |
| Tablet | 11,438 | 58.8% |
| No Computing Device | 1,492 | 7.7% |
| Total | 19,442 | 100.0% |
Internet Access in Salina
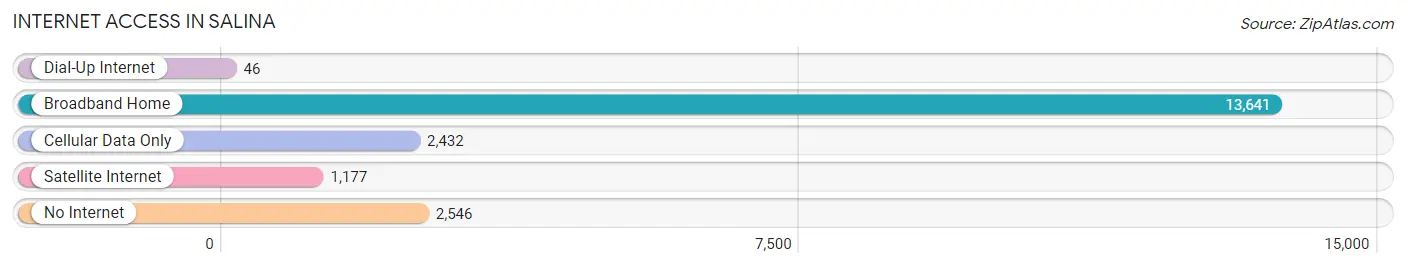
| Internet Type | # Households | % Households |
| Dial-Up Internet | 46 | 0.2% |
| Broadband Home | 13,641 | 70.2% |
| Cellular Data Only | 2,432 | 12.5% |
| Satellite Internet | 1,177 | 6.0% |
| No Internet | 2,546 | 13.1% |
| Total | 19,442 | 100.0% |
Salina Summary
Salina, Kansas is a city located in the north-central part of the state, in Saline County. It is the county seat and the largest city in the county, with a population of 47,707 as of the 2010 census. The city is located along Interstate 70, about halfway between Kansas City and Denver.
History
The area that is now Salina was first settled in 1858, when the first settlers arrived from Ohio. The city was officially founded in 1858, and was named after the Saline River, which runs through the city. The city was incorporated in 1859, and the first post office was established in 1860.
In the late 19th century, Salina was a major stop on the Atchison, Topeka and Santa Fe Railway, and the city grew rapidly. By the early 20th century, Salina had become an important regional center for commerce and industry. The city was also home to several large manufacturing plants, including a flour mill, a sugar refinery, and a canning factory.
Geography
Salina is located in north-central Kansas, in Saline County. It is situated along Interstate 70, about halfway between Kansas City and Denver. The city is located at the intersection of the Saline River and Smoky Hill River, and is surrounded by rolling hills and prairies. The city has a total area of 24.3 square miles, of which 24.2 square miles is land and 0.1 square miles is water.
Economy
Salina is an important regional center for commerce and industry. The city is home to several large manufacturing plants, including a flour mill, a sugar refinery, and a canning factory. The city is also home to several large employers, including Schwan's Food Company, Salina Regional Health Center, and Salina Regional Airport.
The city is also home to several educational institutions, including Kansas Wesleyan University, Salina Area Technical College, and the Salina School District.
Demographics
As of the 2010 census, Salina had a population of 47,707. The racial makeup of the city was 87.2% White, 5.7% African American, 0.7% Native American, 1.3% Asian, 0.1% Pacific Islander, 2.3% from other races, and 2.7% from two or more races. Hispanic or Latino of any race were 6.2% of the population.
The median income for a household in the city was $41,945, and the median income for a family was $51,945. The per capita income for the city was $21,845. About 11.2% of families and 14.3% of the population were below the poverty line, including 19.2% of those under age 18 and 8.2% of those age 65 or over.
Common Questions
What is Per Capita Income in Salina?
Per Capita income in Salina is $31,477.
What is the Median Family Income in Salina?
Median Family Income in Salina is $77,385.
What is the Median Household income in Salina?
Median Household Income in Salina is $56,945.
What is Income or Wage Gap in Salina?
Income or Wage Gap in Salina is 22.4%.
Women in Salina earn 77.6 cents for every dollar earned by a man.
What is Family Income Deficit in Salina?
Family Income Deficit in Salina is $10,052.
Families that are below poverty line in Salina earn $10,052 less on average than the poverty threshold level.
What is Inequality or Gini Index in Salina?
Inequality or Gini Index in Salina is 0.44.
What is the Total Population of Salina?
Total Population of Salina is 46,734.
What is the Total Male Population of Salina?
Total Male Population of Salina is 23,090.
What is the Total Female Population of Salina?
Total Female Population of Salina is 23,644.
What is the Ratio of Males per 100 Females in Salina?
There are 97.66 Males per 100 Females in Salina.
What is the Ratio of Females per 100 Males in Salina?
There are 102.40 Females per 100 Males in Salina.
What is the Median Population Age in Salina?
Median Population Age in Salina is 39.0 Years.
What is the Average Family Size in Salina
Average Family Size in Salina is 3.1 People.
What is the Average Household Size in Salina
Average Household Size in Salina is 2.3 People.
How Large is the Labor Force in Salina?
There are 24,755 People in the Labor Forcein in Salina.
What is the Percentage of People in the Labor Force in Salina?
66.3% of People are in the Labor Force in Salina.
What is the Unemployment Rate in Salina?
Unemployment Rate in Salina is 4.0%.