Wylie, TX Map & Demographics
Wylie Map
Wylie Overview
$40,625
PER CAPITA INCOME
$121,473
AVG FAMILY INCOME
$109,465
AVG HOUSEHOLD INCOME
27.9%
WAGE / INCOME GAP [ % ]
72.1¢/ $1
WAGE / INCOME GAP [ $ ]
$12,532
FAMILY INCOME DEFICIT
0.35
INEQUALITY / GINI INDEX
57,063
TOTAL POPULATION
27,455
MALE POPULATION
29,608
FEMALE POPULATION
92.73
MALES / 100 FEMALES
107.84
FEMALES / 100 MALES
34.8
MEDIAN AGE
3.5
AVG FAMILY SIZE
3.1
AVG HOUSEHOLD SIZE
32,731
LABOR FORCE [ PEOPLE ]
74.7%
PERCENT IN LABOR FORCE
3.5%
UNEMPLOYMENT RATE
Wylie Zip Codes
Income in Wylie
Income Overview in Wylie
Per Capita Income in Wylie is $40,625, while median incomes of families and households are $121,473 and $109,465 respectively.
| Characteristic | Number | Measure |
| Per Capita Income | 57,063 | $40,625 |
| Median Family Income | 14,546 | $121,473 |
| Mean Family Income | 14,546 | $132,814 |
| Median Household Income | 18,217 | $109,465 |
| Mean Household Income | 18,217 | $123,855 |
| Income Deficit | 14,546 | $12,532 |
| Wage / Income Gap (%) | 57,063 | 27.93% |
| Wage / Income Gap ($) | 57,063 | 72.07¢ per $1 |
| Gini / Inequality Index | 57,063 | 0.35 |
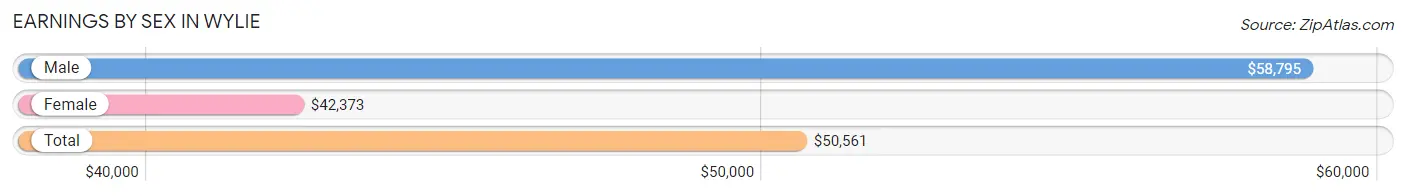
Earnings by Sex in Wylie
Average Earnings in Wylie are $50,561, $58,795 for men and $42,373 for women, a difference of 27.9%.
| Sex | Number | Average Earnings |
| Male | 17,889 (53.2%) | $58,795 |
| Female | 15,755 (46.8%) | $42,373 |
| Total | 33,644 (100.0%) | $50,561 |
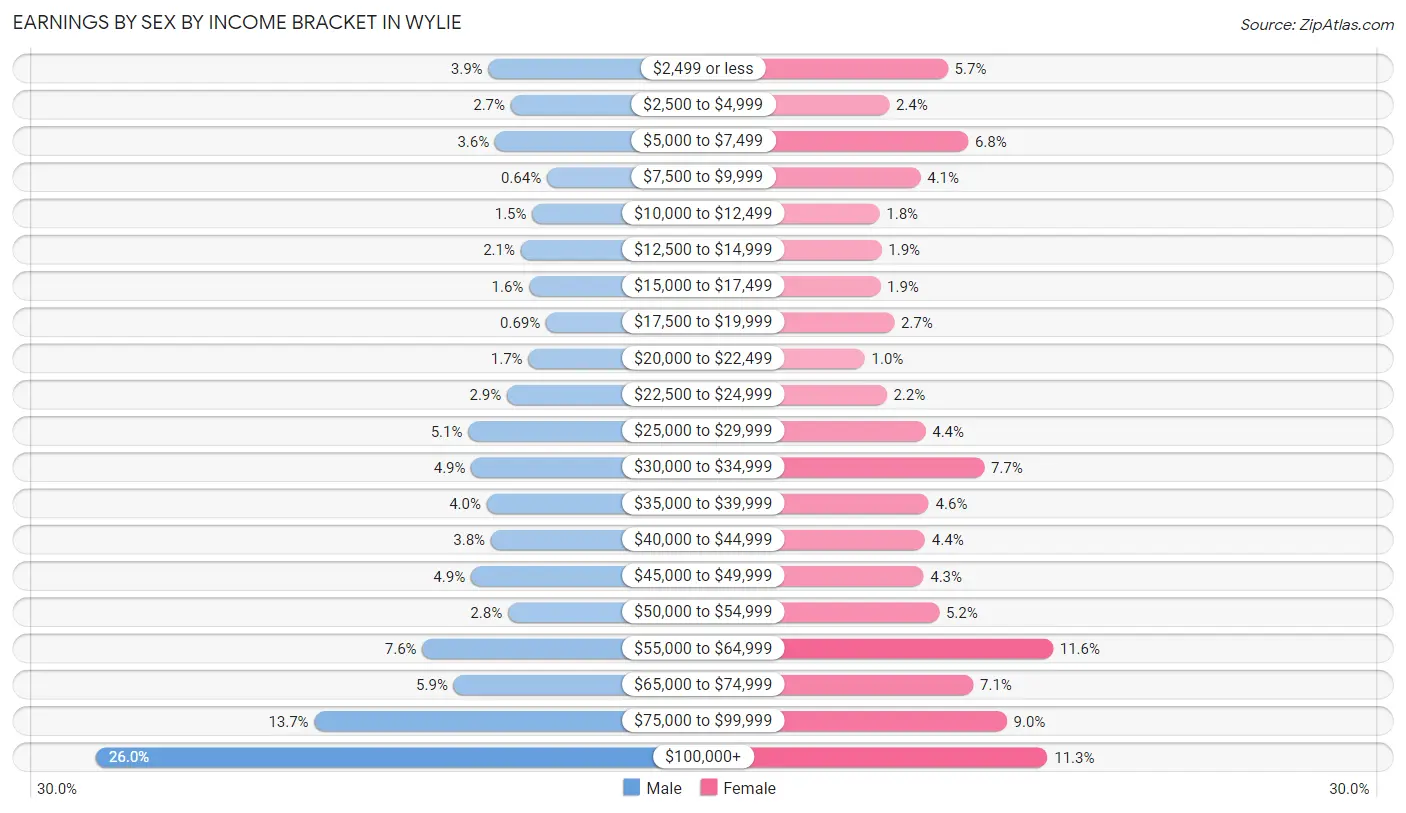
Earnings by Sex by Income Bracket in Wylie
The most common earnings brackets in Wylie are $100,000+ for men (4,649 | 26.0%) and $55,000 to $64,999 for women (1,824 | 11.6%).
| Income | Male | Female |
| $2,499 or less | 703 (3.9%) | 894 (5.7%) |
| $2,500 to $4,999 | 478 (2.7%) | 374 (2.4%) |
| $5,000 to $7,499 | 637 (3.6%) | 1,073 (6.8%) |
| $7,500 to $9,999 | 115 (0.6%) | 651 (4.1%) |
| $10,000 to $12,499 | 261 (1.5%) | 288 (1.8%) |
| $12,500 to $14,999 | 378 (2.1%) | 305 (1.9%) |
| $15,000 to $17,499 | 294 (1.6%) | 294 (1.9%) |
| $17,500 to $19,999 | 123 (0.7%) | 418 (2.6%) |
| $20,000 to $22,499 | 300 (1.7%) | 158 (1.0%) |
| $22,500 to $24,999 | 516 (2.9%) | 351 (2.2%) |
| $25,000 to $29,999 | 906 (5.1%) | 695 (4.4%) |
| $30,000 to $34,999 | 874 (4.9%) | 1,214 (7.7%) |
| $35,000 to $39,999 | 720 (4.0%) | 724 (4.6%) |
| $40,000 to $44,999 | 678 (3.8%) | 691 (4.4%) |
| $45,000 to $49,999 | 879 (4.9%) | 677 (4.3%) |
| $50,000 to $54,999 | 506 (2.8%) | 816 (5.2%) |
| $55,000 to $64,999 | 1,367 (7.6%) | 1,824 (11.6%) |
| $65,000 to $74,999 | 1,052 (5.9%) | 1,118 (7.1%) |
| $75,000 to $99,999 | 2,453 (13.7%) | 1,415 (9.0%) |
| $100,000+ | 4,649 (26.0%) | 1,775 (11.3%) |
| Total | 17,889 (100.0%) | 15,755 (100.0%) |
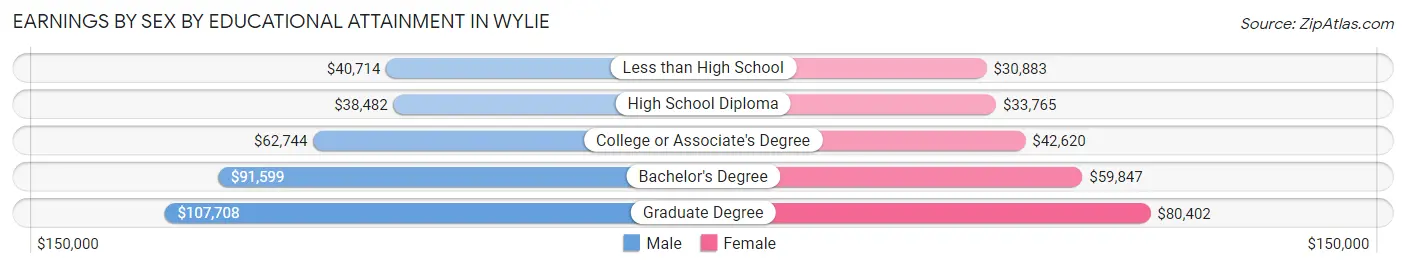
Earnings by Sex by Educational Attainment in Wylie
Average earnings in Wylie are $67,641 for men and $52,389 for women, a difference of 22.6%. Men with an educational attainment of graduate degree enjoy the highest average annual earnings of $107,708, while those with high school diploma education earn the least with $38,482. Women with an educational attainment of graduate degree earn the most with the average annual earnings of $80,402, while those with less than high school education have the smallest earnings of $30,883.
| Educational Attainment | Male Income | Female Income |
| Less than High School | $40,714 | $30,883 |
| High School Diploma | $38,482 | $33,765 |
| College or Associate's Degree | $62,744 | $42,620 |
| Bachelor's Degree | $91,599 | $59,847 |
| Graduate Degree | $107,708 | $80,402 |
| Total | $67,641 | $52,389 |
Family Income in Wylie
Family Income Brackets in Wylie
According to the Wylie family income data, there are 3,753 families falling into the $100,000 to $149,999 income range, which is the most common income bracket and makes up 25.8% of all families. Conversely, the $10,000 to $14,999 income bracket is the least frequent group with only 44 families (0.3%) belonging to this category.
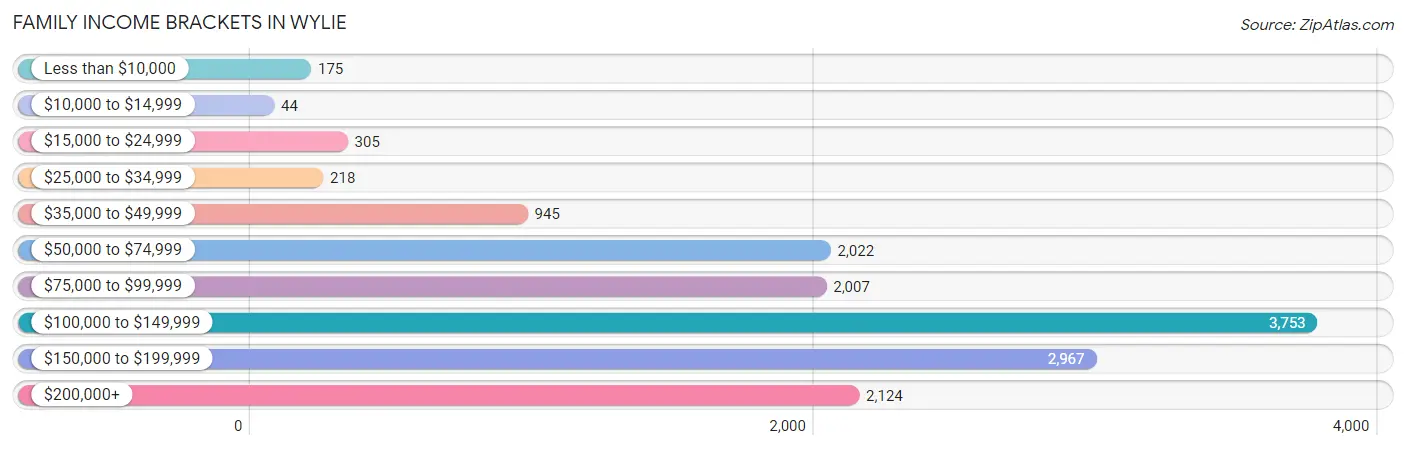
| Income Bracket | # Families | % Families |
| Less than $10,000 | 175 | 1.2% |
| $10,000 to $14,999 | 44 | 0.3% |
| $15,000 to $24,999 | 305 | 2.1% |
| $25,000 to $34,999 | 218 | 1.5% |
| $35,000 to $49,999 | 945 | 6.5% |
| $50,000 to $74,999 | 2,022 | 13.9% |
| $75,000 to $99,999 | 2,007 | 13.8% |
| $100,000 to $149,999 | 3,753 | 25.8% |
| $150,000 to $199,999 | 2,967 | 20.4% |
| $200,000+ | 2,124 | 14.6% |
Family Income by Famaliy Size in Wylie
7+ person families (174 | 1.2%) account for the highest median family income in Wylie with $158,750 per family, while 2-person families (4,049 | 27.8%) have the highest median income of $49,559 per family member.
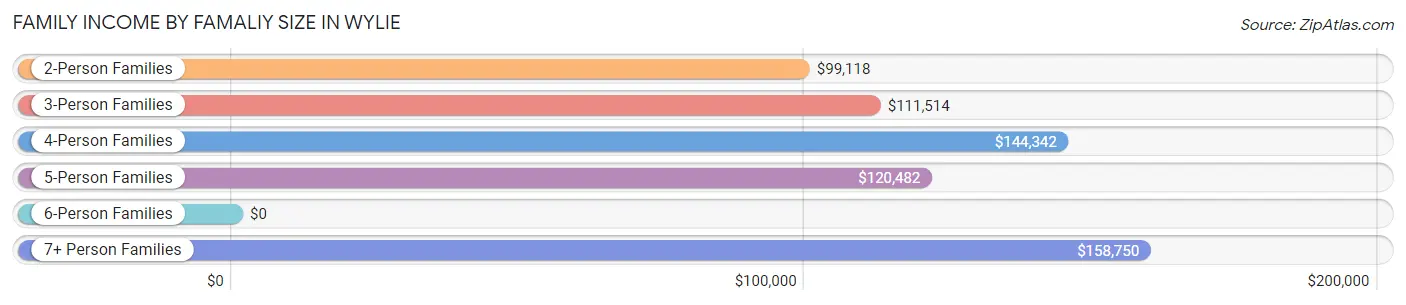
| Income Bracket | # Families | Median Income |
| 2-Person Families | 4,049 (27.8%) | $99,118 |
| 3-Person Families | 3,644 (25.1%) | $111,514 |
| 4-Person Families | 4,356 (29.9%) | $144,342 |
| 5-Person Families | 1,747 (12.0%) | $120,482 |
| 6-Person Families | 576 (4.0%) | $0 |
| 7+ Person Families | 174 (1.2%) | $158,750 |
| Total | 14,546 (100.0%) | $121,473 |
Family Income by Number of Earners in Wylie
The median family income in Wylie is $121,473, with families comprising 3+ earners (2,801) having the highest median family income of $152,686, while families with no earners (606) have the lowest median family income of $62,014, accounting for 19.3% and 4.2% of families, respectively.
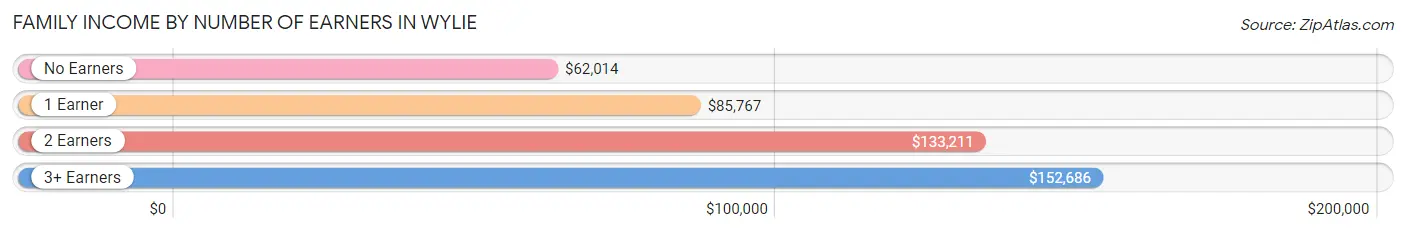
| Number of Earners | # Families | Median Income |
| No Earners | 606 (4.2%) | $62,014 |
| 1 Earner | 4,131 (28.4%) | $85,767 |
| 2 Earners | 7,008 (48.2%) | $133,211 |
| 3+ Earners | 2,801 (19.3%) | $152,686 |
| Total | 14,546 (100.0%) | $121,473 |
Household Income in Wylie
Household Income Brackets in Wylie
With 4,190 households falling in the category, the $100,000 to $149,999 income range is the most frequent in Wylie, accounting for 23.0% of all households. In contrast, only 36 households (0.2%) fall into the $10,000 to $14,999 income bracket, making it the least populous group.
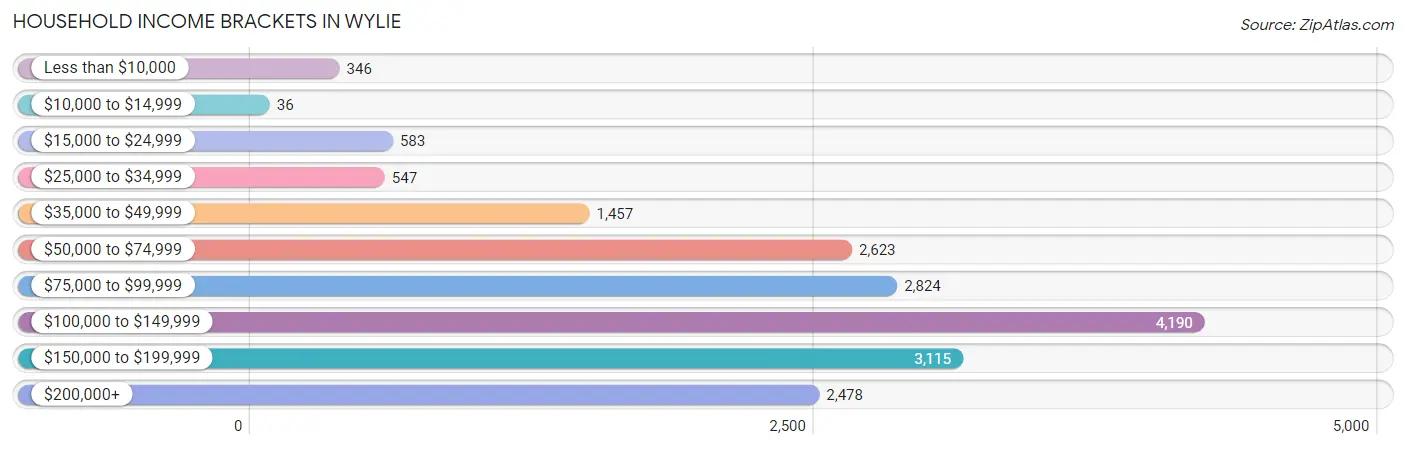
| Income Bracket | # Households | % Households |
| Less than $10,000 | 346 | 1.9% |
| $10,000 to $14,999 | 36 | 0.2% |
| $15,000 to $24,999 | 583 | 3.2% |
| $25,000 to $34,999 | 547 | 3.0% |
| $35,000 to $49,999 | 1,457 | 8.0% |
| $50,000 to $74,999 | 2,623 | 14.4% |
| $75,000 to $99,999 | 2,824 | 15.5% |
| $100,000 to $149,999 | 4,190 | 23.0% |
| $150,000 to $199,999 | 3,115 | 17.1% |
| $200,000+ | 2,478 | 13.6% |
Household Income by Householder Age in Wylie
The median household income in Wylie is $109,465, with the highest median household income of $123,084 found in the 45 to 64 years age bracket for the primary householder. A total of 8,255 households (45.3%) fall into this category. Meanwhile, the 65+ years age bracket for the primary householder has the lowest median household income of $63,580, with 2,349 households (12.9%) in this group.
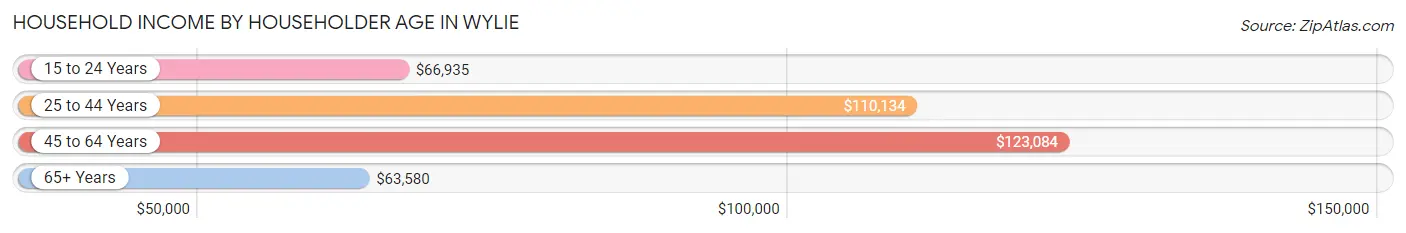
| Income Bracket | # Households | Median Income |
| 15 to 24 Years | 191 (1.1%) | $66,935 |
| 25 to 44 Years | 7,422 (40.7%) | $110,134 |
| 45 to 64 Years | 8,255 (45.3%) | $123,084 |
| 65+ Years | 2,349 (12.9%) | $63,580 |
| Total | 18,217 (100.0%) | $109,465 |
Poverty in Wylie
Income Below Poverty by Sex and Age in Wylie
With 6.3% poverty level for males and 5.2% for females among the residents of Wylie, 5 year old males and 15 year old females are the most vulnerable to poverty, with 52 males (13.3%) and 38 females (14.0%) in their respective age groups living below the poverty level.
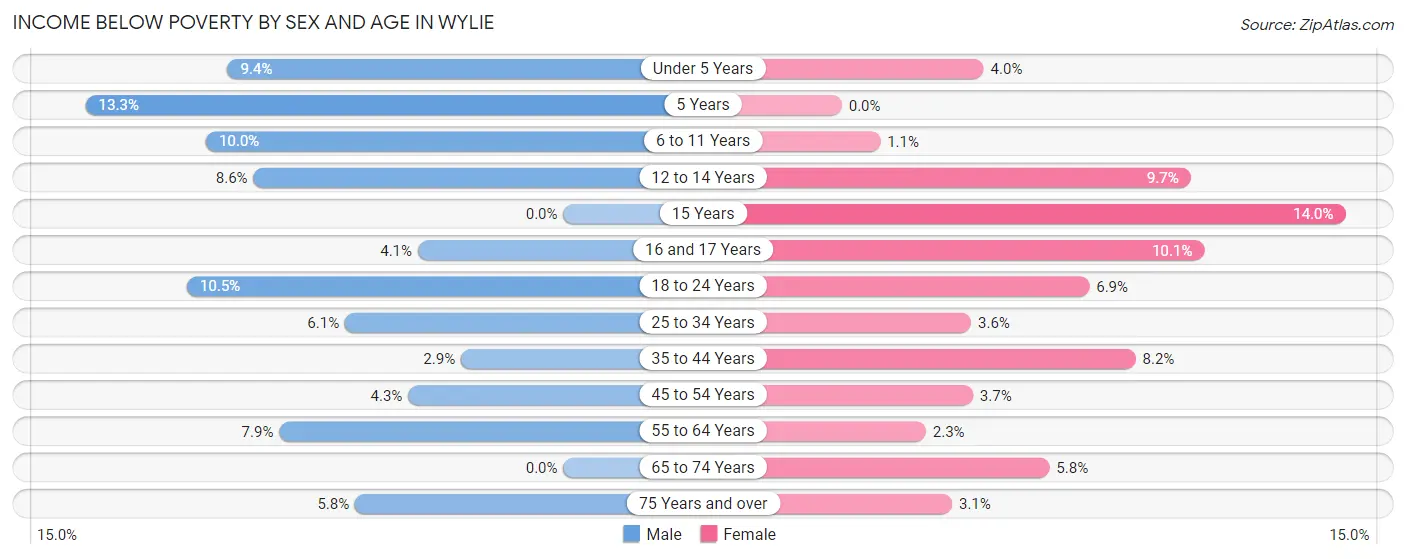
| Age Bracket | Male | Female |
| Under 5 Years | 184 (9.3%) | 83 (4.0%) |
| 5 Years | 52 (13.3%) | 0 (0.0%) |
| 6 to 11 Years | 254 (10.0%) | 27 (1.1%) |
| 12 to 14 Years | 86 (8.6%) | 143 (9.7%) |
| 15 Years | 0 (0.0%) | 38 (14.0%) |
| 16 and 17 Years | 31 (4.1%) | 119 (10.1%) |
| 18 to 24 Years | 322 (10.5%) | 218 (6.9%) |
| 25 to 34 Years | 230 (6.1%) | 129 (3.6%) |
| 35 to 44 Years | 118 (2.9%) | 423 (8.2%) |
| 45 to 54 Years | 215 (4.3%) | 151 (3.6%) |
| 55 to 64 Years | 206 (7.9%) | 57 (2.3%) |
| 65 to 74 Years | 0 (0.0%) | 113 (5.8%) |
| 75 Years and over | 38 (5.8%) | 30 (3.1%) |
| Total | 1,736 (6.3%) | 1,531 (5.2%) |
Income Above Poverty by Sex and Age in Wylie
According to the poverty statistics in Wylie, males aged 15 years and females aged 5 years are the age groups that are most secure financially, with 100.0% of males and 100.0% of females in these age groups living above the poverty line.
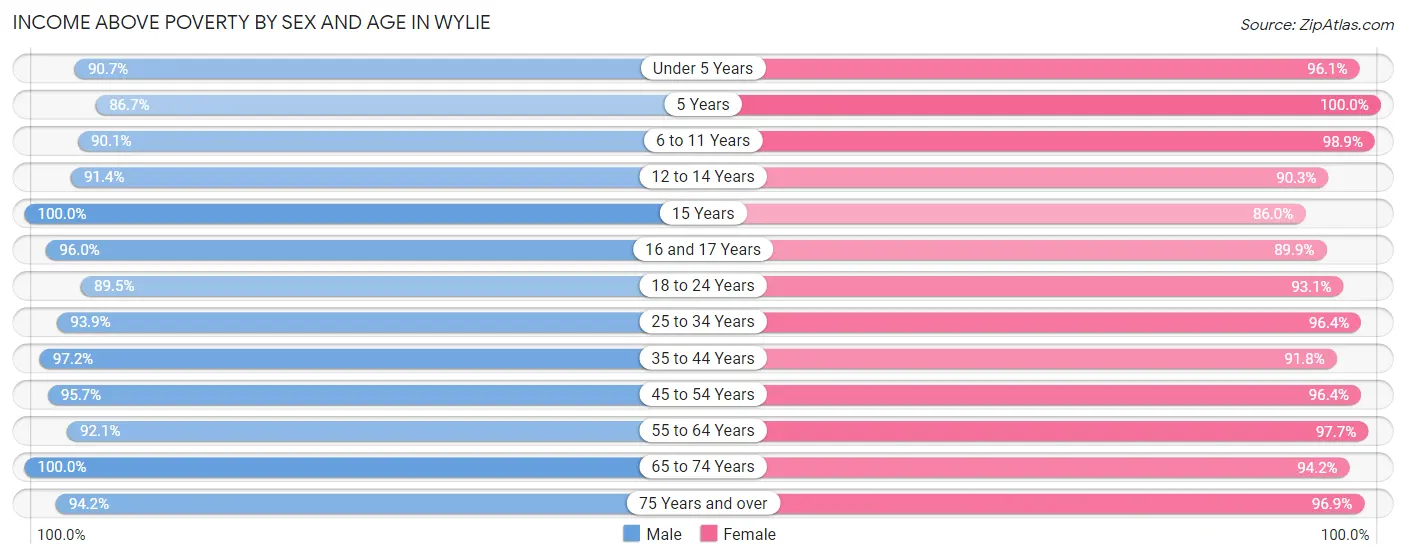
| Age Bracket | Male | Female |
| Under 5 Years | 1,784 (90.6%) | 2,020 (96.1%) |
| 5 Years | 339 (86.7%) | 489 (100.0%) |
| 6 to 11 Years | 2,300 (90.0%) | 2,499 (98.9%) |
| 12 to 14 Years | 910 (91.4%) | 1,329 (90.3%) |
| 15 Years | 418 (100.0%) | 233 (86.0%) |
| 16 and 17 Years | 735 (96.0%) | 1,060 (89.9%) |
| 18 to 24 Years | 2,750 (89.5%) | 2,947 (93.1%) |
| 25 to 34 Years | 3,555 (93.9%) | 3,457 (96.4%) |
| 35 to 44 Years | 4,024 (97.2%) | 4,750 (91.8%) |
| 45 to 54 Years | 4,762 (95.7%) | 3,990 (96.4%) |
| 55 to 64 Years | 2,399 (92.1%) | 2,375 (97.7%) |
| 65 to 74 Years | 1,060 (100.0%) | 1,843 (94.2%) |
| 75 Years and over | 617 (94.2%) | 948 (96.9%) |
| Total | 25,653 (93.7%) | 27,940 (94.8%) |
Income Below Poverty Among Married-Couple Families in Wylie
The poverty statistics for married-couple families in Wylie show that 3.7% or 426 of the total 11,349 families live below the poverty line. Families with 5 or more children have the highest poverty rate of 67.3%, comprising of 37 families. On the other hand, families with no children have the lowest poverty rate of 0.7%, which includes 30 families.
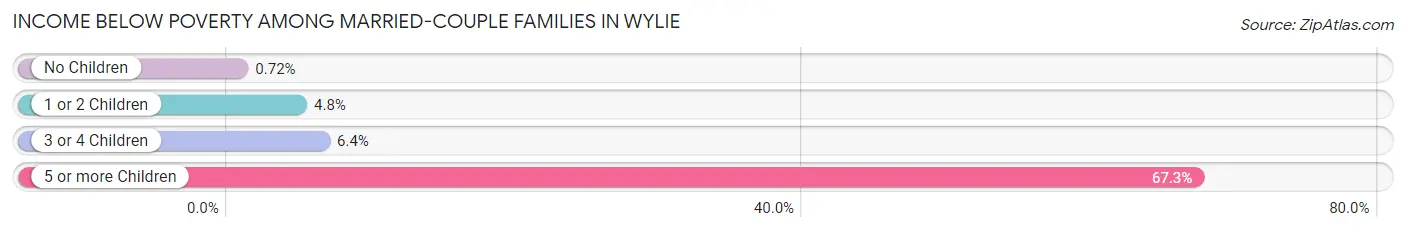
| Children | Above Poverty | Below Poverty |
| No Children | 4,110 (99.3%) | 30 (0.7%) |
| 1 or 2 Children | 5,933 (95.2%) | 300 (4.8%) |
| 3 or 4 Children | 862 (93.6%) | 59 (6.4%) |
| 5 or more Children | 18 (32.7%) | 37 (67.3%) |
| Total | 10,923 (96.3%) | 426 (3.7%) |
Income Below Poverty Among Single-Parent Households in Wylie
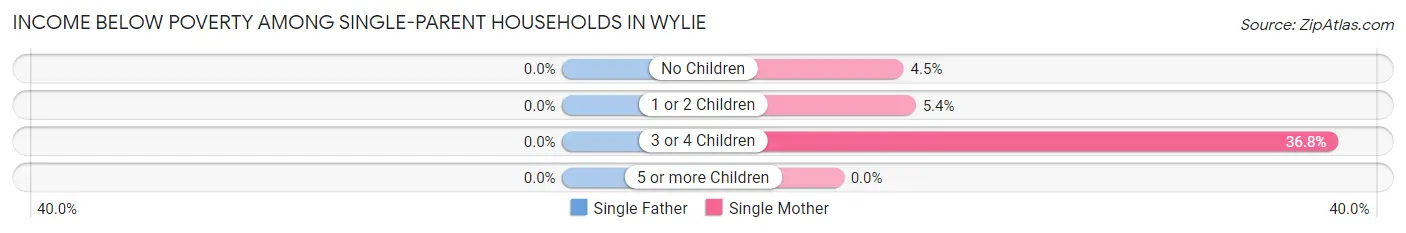
| Children | Single Father | Single Mother |
| No Children | 0 (0.0%) | 34 (4.5%) |
| 1 or 2 Children | 0 (0.0%) | 86 (5.4%) |
| 3 or 4 Children | 0 (0.0%) | 35 (36.8%) |
| 5 or more Children | 0 (0.0%) | 0 (0.0%) |
| Total | 0 (0.0%) | 155 (6.3%) |
Income Below Poverty Among Married-Couple vs Single-Parent Households in Wylie
The poverty data for Wylie shows that 426 of the married-couple family households (3.7%) and 155 of the single-parent households (4.9%) are living below the poverty level. Within the married-couple family households, those with 5 or more children have the highest poverty rate, with 37 households (67.3%) falling below the poverty line. Among the single-parent households, those with 3 or 4 children have the highest poverty rate, with 35 household (19.6%) living below poverty.
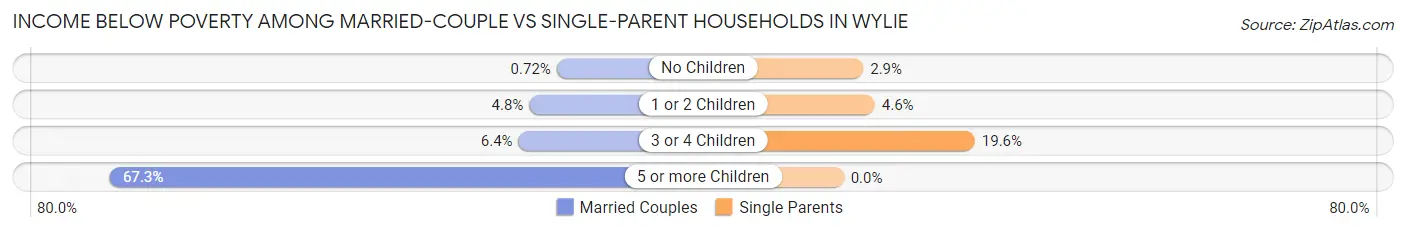
| Children | Married-Couple Families | Single-Parent Households |
| No Children | 30 (0.7%) | 34 (2.9%) |
| 1 or 2 Children | 300 (4.8%) | 86 (4.6%) |
| 3 or 4 Children | 59 (6.4%) | 35 (19.6%) |
| 5 or more Children | 37 (67.3%) | 0 (0.0%) |
| Total | 426 (3.7%) | 155 (4.9%) |
Race in Wylie
The most populous races in Wylie are White / Caucasian (35,019 | 61.4%), Hispanic or Latino (10,261 | 18.0%), and Black / African American (7,559 | 13.3%).
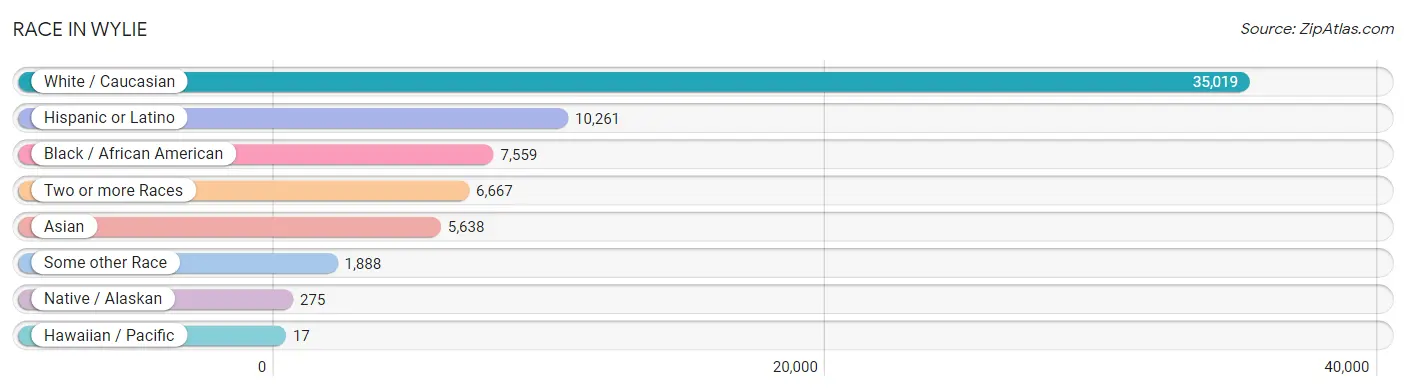
| Race | # Population | % Population |
| Asian | 5,638 | 9.9% |
| Black / African American | 7,559 | 13.3% |
| Hawaiian / Pacific | 17 | 0.0% |
| Hispanic or Latino | 10,261 | 18.0% |
| Native / Alaskan | 275 | 0.5% |
| White / Caucasian | 35,019 | 61.4% |
| Two or more Races | 6,667 | 11.7% |
| Some other Race | 1,888 | 3.3% |
| Total | 57,063 | 100.0% |
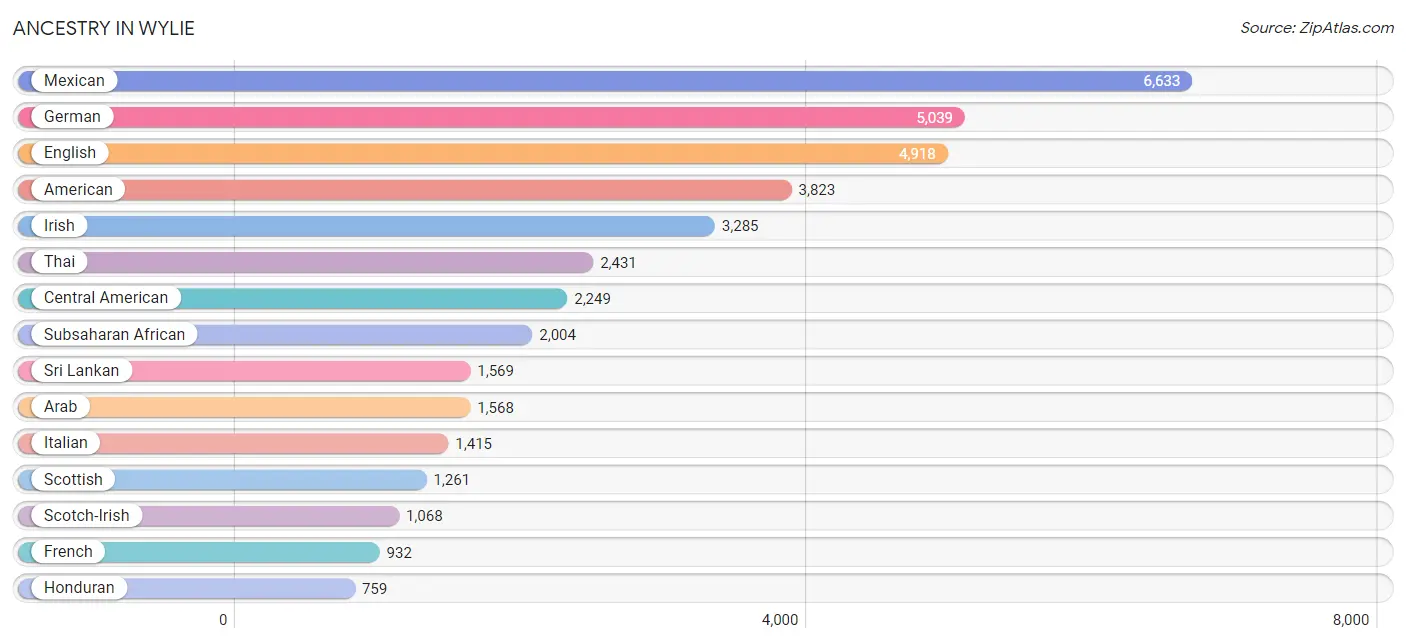
Ancestry in Wylie
The most populous ancestries reported in Wylie are Mexican (6,633 | 11.6%), German (5,039 | 8.8%), English (4,918 | 8.6%), American (3,823 | 6.7%), and Irish (3,285 | 5.8%), together accounting for 41.5% of all Wylie residents.
| Ancestry | # Population | % Population |
| African | 492 | 0.9% |
| Albanian | 41 | 0.1% |
| American | 3,823 | 6.7% |
| Apache | 26 | 0.1% |
| Arab | 1,568 | 2.8% |
| Argentinean | 31 | 0.1% |
| Armenian | 13 | 0.0% |
| Austrian | 61 | 0.1% |
| Bhutanese | 97 | 0.2% |
| Blackfeet | 7 | 0.0% |
| Brazilian | 46 | 0.1% |
| British | 270 | 0.5% |
| Burmese | 67 | 0.1% |
| Cajun | 11 | 0.0% |
| Canadian | 60 | 0.1% |
| Central American | 2,249 | 3.9% |
| Central American Indian | 286 | 0.5% |
| Cherokee | 324 | 0.6% |
| Chippewa | 11 | 0.0% |
| Choctaw | 118 | 0.2% |
| Colombian | 134 | 0.2% |
| Costa Rican | 339 | 0.6% |
| Croatian | 26 | 0.1% |
| Cuban | 131 | 0.2% |
| Czech | 248 | 0.4% |
| Czechoslovakian | 54 | 0.1% |
| Danish | 116 | 0.2% |
| Dutch | 525 | 0.9% |
| Dutch West Indian | 28 | 0.1% |
| Eastern European | 7 | 0.0% |
| Ecuadorian | 101 | 0.2% |
| Egyptian | 166 | 0.3% |
| English | 4,918 | 8.6% |
| Ethiopian | 630 | 1.1% |
| European | 605 | 1.1% |
| Filipino | 92 | 0.2% |
| Finnish | 125 | 0.2% |
| French | 932 | 1.6% |
| French American Indian | 13 | 0.0% |
| French Canadian | 180 | 0.3% |
| German | 5,039 | 8.8% |
| Ghanaian | 57 | 0.1% |
| Greek | 44 | 0.1% |
| Guatemalan | 324 | 0.6% |
| Guyanese | 15 | 0.0% |
| Honduran | 759 | 1.3% |
| Hungarian | 139 | 0.2% |
| Indian (Asian) | 380 | 0.7% |
| Indonesian | 48 | 0.1% |
| Iranian | 131 | 0.2% |
| Iraqi | 253 | 0.4% |
| Irish | 3,285 | 5.8% |
| Israeli | 24 | 0.0% |
| Italian | 1,415 | 2.5% |
| Japanese | 154 | 0.3% |
| Jordanian | 14 | 0.0% |
| Kenyan | 251 | 0.4% |
| Kiowa | 57 | 0.1% |
| Korean | 719 | 1.3% |
| Laotian | 27 | 0.1% |
| Lebanese | 185 | 0.3% |
| Lithuanian | 25 | 0.0% |
| Macedonian | 118 | 0.2% |
| Malaysian | 136 | 0.2% |
| Mexican | 6,633 | 11.6% |
| Mexican American Indian | 215 | 0.4% |
| Moroccan | 24 | 0.0% |
| Native Hawaiian | 55 | 0.1% |
| Nicaraguan | 136 | 0.2% |
| Nigerian | 418 | 0.7% |
| Northern European | 32 | 0.1% |
| Norwegian | 295 | 0.5% |
| Pakistani | 12 | 0.0% |
| Palestinian | 181 | 0.3% |
| Polish | 624 | 1.1% |
| Puerto Rican | 321 | 0.6% |
| Romanian | 29 | 0.1% |
| Russian | 251 | 0.4% |
| Salvadoran | 691 | 1.2% |
| Scandinavian | 96 | 0.2% |
| Scotch-Irish | 1,068 | 1.9% |
| Scottish | 1,261 | 2.2% |
| Slovak | 34 | 0.1% |
| Slovene | 44 | 0.1% |
| South American | 340 | 0.6% |
| Spaniard | 212 | 0.4% |
| Spanish | 42 | 0.1% |
| Sri Lankan | 1,569 | 2.8% |
| Subsaharan African | 2,004 | 3.5% |
| Swedish | 213 | 0.4% |
| Swiss | 60 | 0.1% |
| Thai | 2,431 | 4.3% |
| Trinidadian and Tobagonian | 20 | 0.0% |
| Turkish | 94 | 0.2% |
| Ukrainian | 47 | 0.1% |
| Venezuelan | 74 | 0.1% |
| Vietnamese | 17 | 0.0% |
| Welsh | 332 | 0.6% |
| Zimbabwean | 52 | 0.1% | View All 99 Rows |
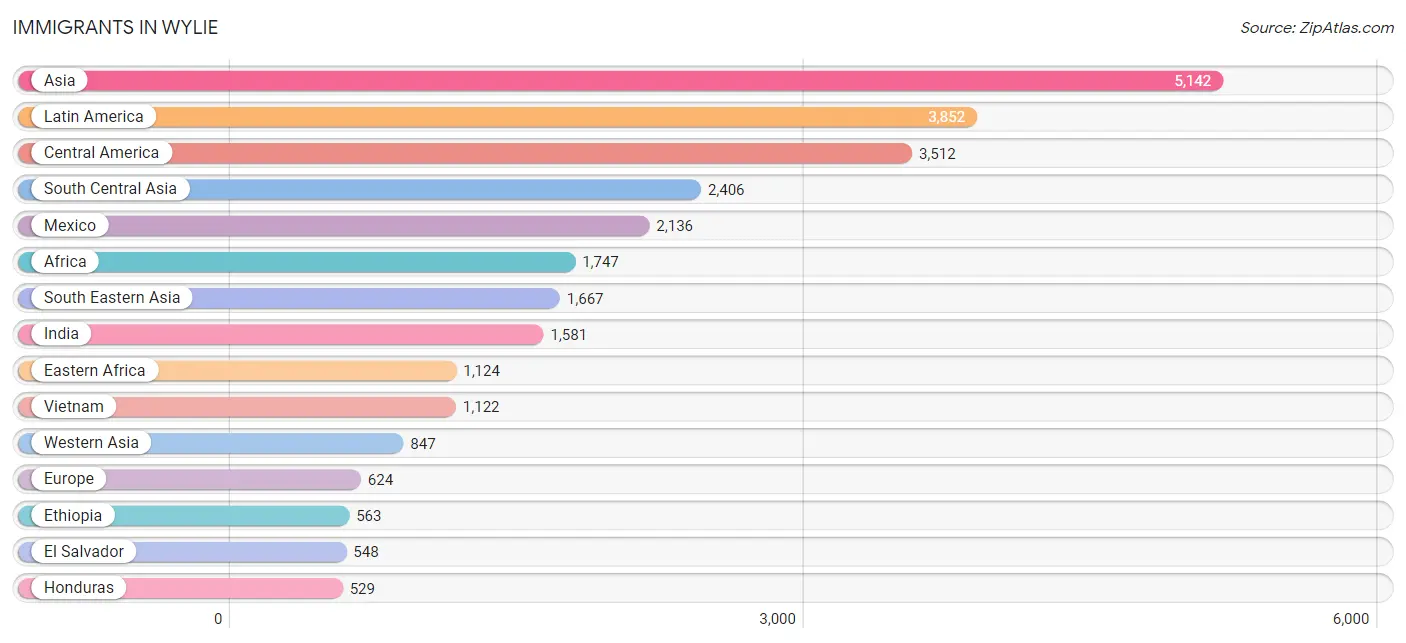
Immigrants in Wylie
The most numerous immigrant groups reported in Wylie came from Asia (5,142 | 9.0%), Latin America (3,852 | 6.8%), Central America (3,512 | 6.1%), South Central Asia (2,406 | 4.2%), and Mexico (2,136 | 3.7%), together accounting for 29.9% of all Wylie residents.
| Immigration Origin | # Population | % Population |
| Africa | 1,747 | 3.1% |
| Albania | 23 | 0.0% |
| Armenia | 56 | 0.1% |
| Asia | 5,142 | 9.0% |
| Bangladesh | 17 | 0.0% |
| Belize | 68 | 0.1% |
| Brazil | 46 | 0.1% |
| Cambodia | 64 | 0.1% |
| Cameroon | 69 | 0.1% |
| Canada | 253 | 0.4% |
| Caribbean | 81 | 0.1% |
| Central America | 3,512 | 6.1% |
| China | 131 | 0.2% |
| Colombia | 144 | 0.3% |
| Costa Rica | 14 | 0.0% |
| Cuba | 52 | 0.1% |
| Eastern Africa | 1,124 | 2.0% |
| Eastern Asia | 210 | 0.4% |
| Eastern Europe | 357 | 0.6% |
| Ecuador | 23 | 0.0% |
| Egypt | 212 | 0.4% |
| El Salvador | 548 | 1.0% |
| England | 13 | 0.0% |
| Eritrea | 41 | 0.1% |
| Ethiopia | 563 | 1.0% |
| Europe | 624 | 1.1% |
| France | 35 | 0.1% |
| Germany | 33 | 0.1% |
| Ghana | 77 | 0.1% |
| Guatemala | 158 | 0.3% |
| Guyana | 15 | 0.0% |
| Haiti | 29 | 0.1% |
| Honduras | 529 | 0.9% |
| India | 1,581 | 2.8% |
| Indonesia | 27 | 0.1% |
| Iran | 156 | 0.3% |
| Iraq | 416 | 0.7% |
| Japan | 12 | 0.0% |
| Jordan | 44 | 0.1% |
| Kazakhstan | 23 | 0.0% |
| Kenya | 420 | 0.7% |
| Korea | 67 | 0.1% |
| Kuwait | 54 | 0.1% |
| Laos | 29 | 0.1% |
| Latin America | 3,852 | 6.8% |
| Lebanon | 139 | 0.2% |
| Mexico | 2,136 | 3.7% |
| Middle Africa | 69 | 0.1% |
| Morocco | 58 | 0.1% |
| Nepal | 218 | 0.4% |
| Netherlands | 133 | 0.2% |
| Nicaragua | 59 | 0.1% |
| Nigeria | 192 | 0.3% |
| North Macedonia | 168 | 0.3% |
| Northern Africa | 285 | 0.5% |
| Northern Europe | 66 | 0.1% |
| Norway | 12 | 0.0% |
| Pakistan | 364 | 0.6% |
| Philippines | 367 | 0.6% |
| Russia | 54 | 0.1% |
| Saudi Arabia | 32 | 0.1% |
| Scotland | 15 | 0.0% |
| South America | 259 | 0.4% |
| South Central Asia | 2,406 | 4.2% |
| South Eastern Asia | 1,667 | 2.9% |
| Sudan | 15 | 0.0% |
| Taiwan | 56 | 0.1% |
| Thailand | 29 | 0.1% |
| Turkey | 47 | 0.1% |
| Ukraine | 68 | 0.1% |
| Venezuela | 31 | 0.1% |
| Vietnam | 1,122 | 2.0% |
| Western Africa | 269 | 0.5% |
| Western Asia | 847 | 1.5% |
| Western Europe | 201 | 0.4% |
| Zimbabwe | 100 | 0.2% | View All 76 Rows |
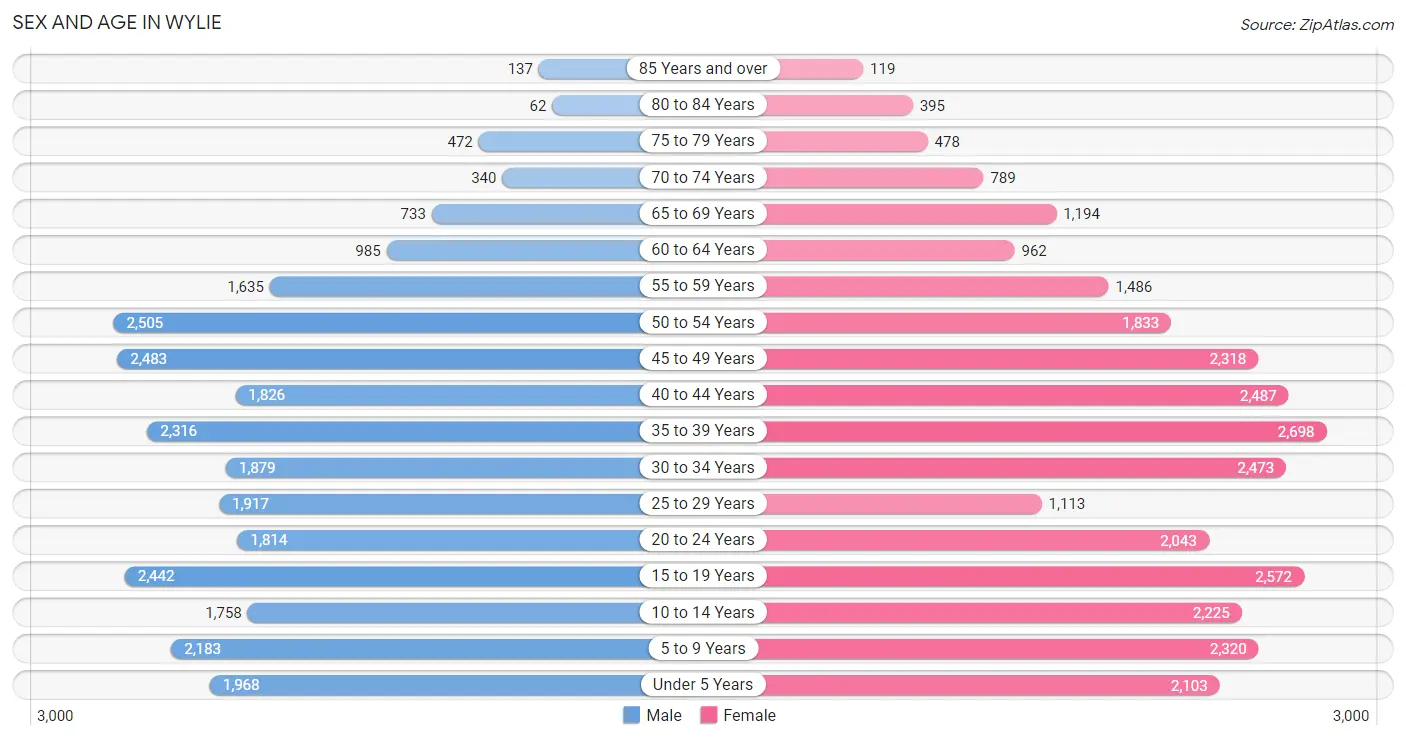
Sex and Age in Wylie
Sex and Age in Wylie
The most populous age groups in Wylie are 50 to 54 Years (2,505 | 9.1%) for men and 35 to 39 Years (2,698 | 9.1%) for women.
| Age Bracket | Male | Female |
| Under 5 Years | 1,968 (7.2%) | 2,103 (7.1%) |
| 5 to 9 Years | 2,183 (8.0%) | 2,320 (7.8%) |
| 10 to 14 Years | 1,758 (6.4%) | 2,225 (7.5%) |
| 15 to 19 Years | 2,442 (8.9%) | 2,572 (8.7%) |
| 20 to 24 Years | 1,814 (6.6%) | 2,043 (6.9%) |
| 25 to 29 Years | 1,917 (7.0%) | 1,113 (3.8%) |
| 30 to 34 Years | 1,879 (6.8%) | 2,473 (8.4%) |
| 35 to 39 Years | 2,316 (8.4%) | 2,698 (9.1%) |
| 40 to 44 Years | 1,826 (6.7%) | 2,487 (8.4%) |
| 45 to 49 Years | 2,483 (9.0%) | 2,318 (7.8%) |
| 50 to 54 Years | 2,505 (9.1%) | 1,833 (6.2%) |
| 55 to 59 Years | 1,635 (6.0%) | 1,486 (5.0%) |
| 60 to 64 Years | 985 (3.6%) | 962 (3.3%) |
| 65 to 69 Years | 733 (2.7%) | 1,194 (4.0%) |
| 70 to 74 Years | 340 (1.2%) | 789 (2.7%) |
| 75 to 79 Years | 472 (1.7%) | 478 (1.6%) |
| 80 to 84 Years | 62 (0.2%) | 395 (1.3%) |
| 85 Years and over | 137 (0.5%) | 119 (0.4%) |
| Total | 27,455 (100.0%) | 29,608 (100.0%) |
Families and Households in Wylie
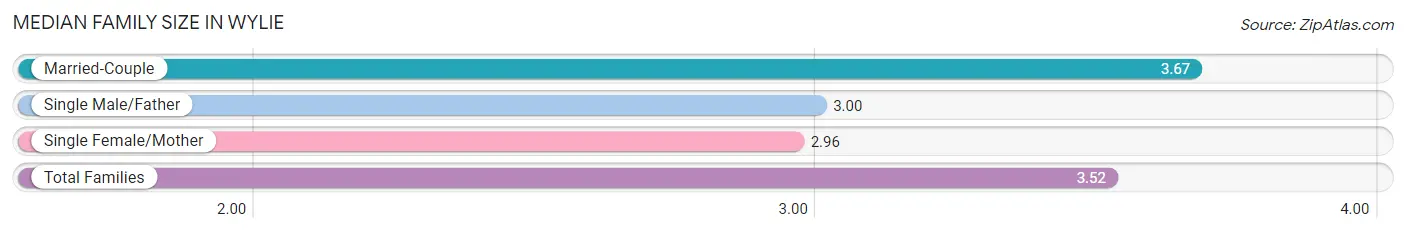
Median Family Size in Wylie
The median family size in Wylie is 3.52 persons per family, with married-couple families (11,349 | 78.0%) accounting for the largest median family size of 3.67 persons per family. On the other hand, single female/mother families (2,457 | 16.9%) represent the smallest median family size with 2.96 persons per family.
| Family Type | # Families | Family Size |
| Married-Couple | 11,349 (78.0%) | 3.67 |
| Single Male/Father | 740 (5.1%) | 3.00 |
| Single Female/Mother | 2,457 (16.9%) | 2.96 |
| Total Families | 14,546 (100.0%) | 3.52 |
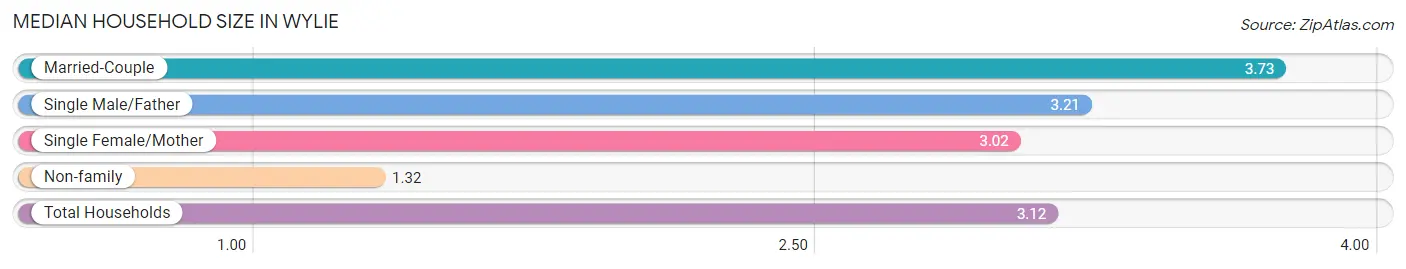
Median Household Size in Wylie
The median household size in Wylie is 3.12 persons per household, with married-couple households (11,349 | 62.3%) accounting for the largest median household size of 3.73 persons per household. non-family households (3,671 | 20.2%) represent the smallest median household size with 1.32 persons per household.
| Household Type | # Households | Household Size |
| Married-Couple | 11,349 (62.3%) | 3.73 |
| Single Male/Father | 740 (4.1%) | 3.21 |
| Single Female/Mother | 2,457 (13.5%) | 3.02 |
| Non-family | 3,671 (20.2%) | 1.32 |
| Total Households | 18,217 (100.0%) | 3.12 |
Household Size by Marriage Status in Wylie
Out of a total of 18,217 households in Wylie, 14,546 (79.8%) are family households, while 3,671 (20.2%) are nonfamily households. The most numerous type of family households are 4-person households, comprising 4,278, and the most common type of nonfamily households are 1-person households, comprising 2,597.
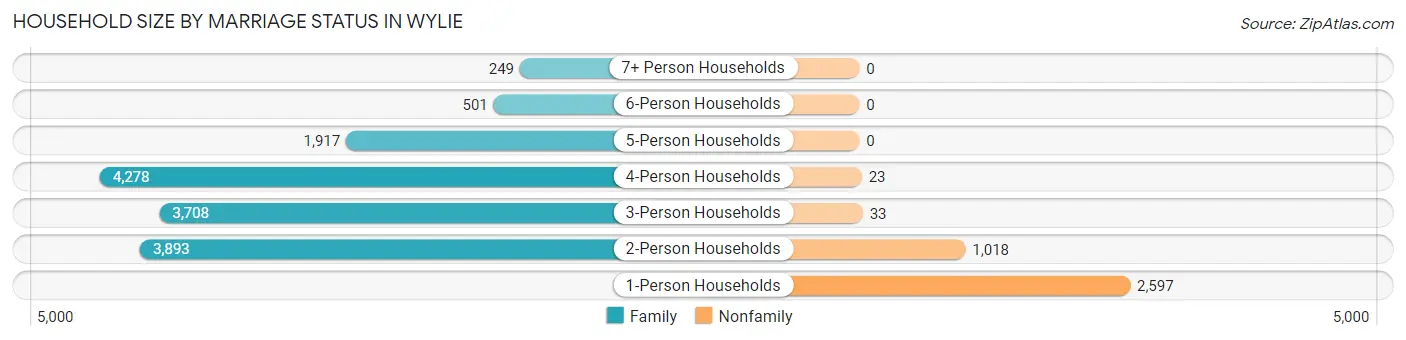
| Household Size | Family Households | Nonfamily Households |
| 1-Person Households | - | 2,597 (14.3%) |
| 2-Person Households | 3,893 (21.4%) | 1,018 (5.6%) |
| 3-Person Households | 3,708 (20.3%) | 33 (0.2%) |
| 4-Person Households | 4,278 (23.5%) | 23 (0.1%) |
| 5-Person Households | 1,917 (10.5%) | 0 (0.0%) |
| 6-Person Households | 501 (2.8%) | 0 (0.0%) |
| 7+ Person Households | 249 (1.4%) | 0 (0.0%) |
| Total | 14,546 (79.8%) | 3,671 (20.2%) |
Female Fertility in Wylie
Fertility by Age in Wylie
Average fertility rate in Wylie is 40.0 births per 1,000 women. Women in the age bracket of 20 to 34 years have the highest fertility rate with 63.0 births per 1,000 women. Women in the age bracket of 20 to 34 years acount for 55.7% of all women with births.
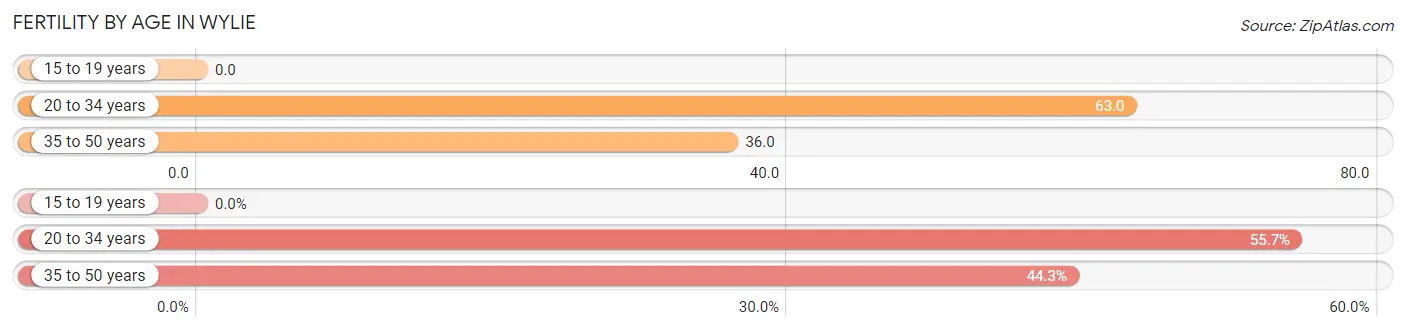
| Age Bracket | Women with Births | Births / 1,000 Women |
| 15 to 19 years | 0 (0.0%) | 0.0 |
| 20 to 34 years | 353 (55.7%) | 63.0 |
| 35 to 50 years | 281 (44.3%) | 36.0 |
| Total | 634 (100.0%) | 40.0 |
Fertility by Age by Marriage Status in Wylie
93.4% of women with births (634) in Wylie are married. The highest percentage of unmarried women with births falls into 20 to 34 years age bracket with 11.9% of them unmarried at the time of birth, while the lowest percentage of unmarried women with births belong to 35 to 50 years age bracket with 0.0% of them unmarried.
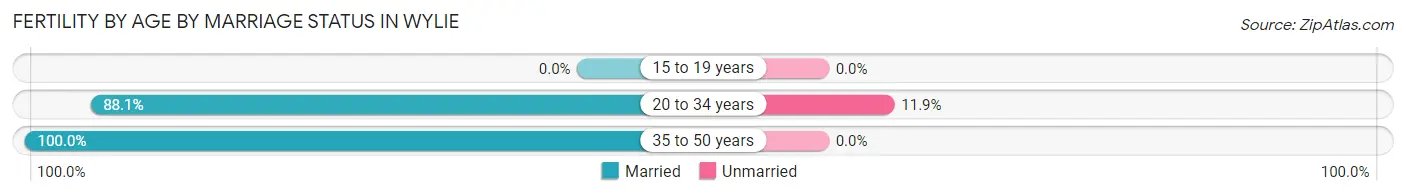
| Age Bracket | Married | Unmarried |
| 15 to 19 years | 0 (0.0%) | 0 (0.0%) |
| 20 to 34 years | 311 (88.1%) | 42 (11.9%) |
| 35 to 50 years | 281 (100.0%) | 0 (0.0%) |
| Total | 592 (93.4%) | 42 (6.6%) |
Fertility by Education in Wylie
Average fertility rate in Wylie is 40.0 births per 1,000 women. Women with the education attainment of graduate degree have the highest fertility rate of 79.0 births per 1,000 women, while women with the education attainment of less than high school have the lowest fertility at 12.0 births per 1,000 women. Women with the education attainment of bachelor's degree represent 41.0% of all women with births.
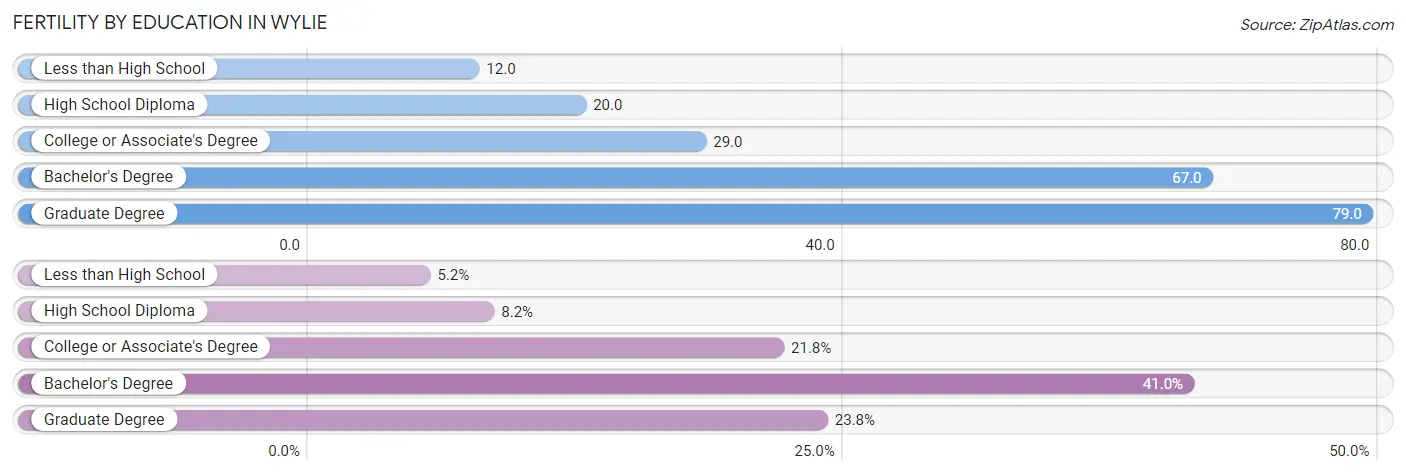
| Educational Attainment | Women with Births | Births / 1,000 Women |
| Less than High School | 33 (5.2%) | 12.0 |
| High School Diploma | 52 (8.2%) | 20.0 |
| College or Associate's Degree | 138 (21.8%) | 29.0 |
| Bachelor's Degree | 260 (41.0%) | 67.0 |
| Graduate Degree | 151 (23.8%) | 79.0 |
| Total | 634 (100.0%) | 40.0 |
Fertility by Education by Marriage Status in Wylie
6.6% of women with births in Wylie are unmarried. Women with the educational attainment of less than high school are most likely to be married with 100.0% of them married at childbirth, while women with the educational attainment of college or associate's degree are least likely to be married with 28.3% of them unmarried at childbirth.
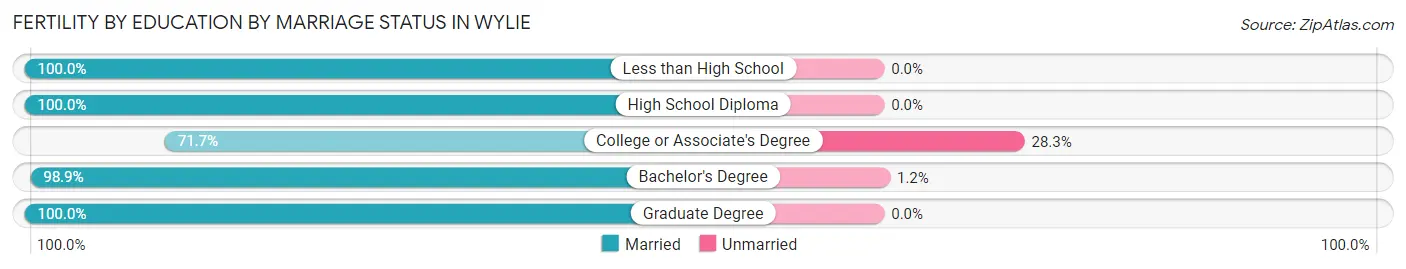
| Educational Attainment | Married | Unmarried |
| Less than High School | 33 (100.0%) | 0 (0.0%) |
| High School Diploma | 52 (100.0%) | 0 (0.0%) |
| College or Associate's Degree | 99 (71.7%) | 39 (28.3%) |
| Bachelor's Degree | 257 (98.9%) | 3 (1.1%) |
| Graduate Degree | 151 (100.0%) | 0 (0.0%) |
| Total | 592 (93.4%) | 42 (6.6%) |
Employment Characteristics in Wylie
Employment by Class of Employer in Wylie
Among the 31,221 employed individuals in Wylie, private company employees (23,464 | 75.1%), local government employees (2,653 | 8.5%), and not-for-profit organizations (1,872 | 6.0%) make up the most common classes of employment.
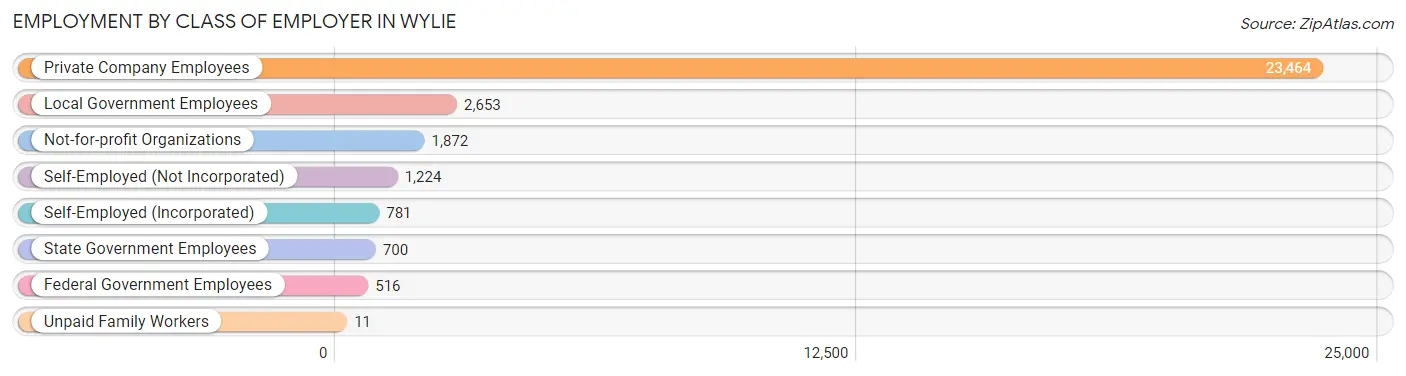
| Employer Class | # Employees | % Employees |
| Private Company Employees | 23,464 | 75.1% |
| Self-Employed (Incorporated) | 781 | 2.5% |
| Self-Employed (Not Incorporated) | 1,224 | 3.9% |
| Not-for-profit Organizations | 1,872 | 6.0% |
| Local Government Employees | 2,653 | 8.5% |
| State Government Employees | 700 | 2.2% |
| Federal Government Employees | 516 | 1.7% |
| Unpaid Family Workers | 11 | 0.0% |
| Total | 31,221 | 100.0% |
Employment Status by Age in Wylie
According to the labor force statistics for Wylie, out of the total population over 16 years of age (43,817), 74.7% or 32,731 individuals are in the labor force, with 3.5% or 1,146 of them unemployed. The age group with the highest labor force participation rate is 45 to 54 years, with 89.1% or 8,143 individuals in the labor force. Within the labor force, the 20 to 24 years age range has the highest percentage of unemployed individuals, with 15.1% or 503 of them being unemployed.
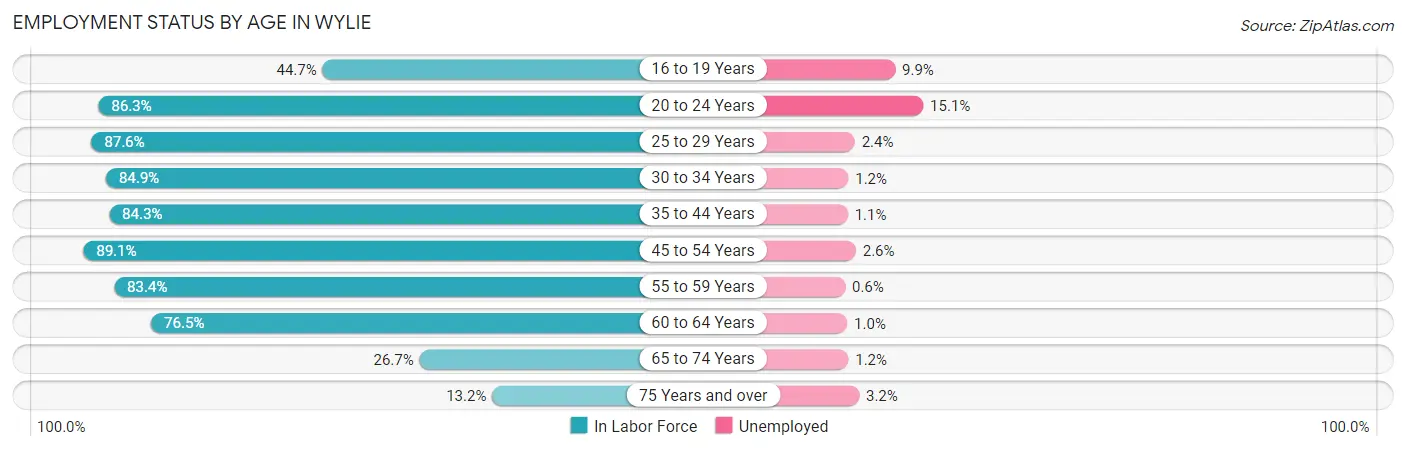
| Age Bracket | In Labor Force | Unemployed |
| 16 to 19 Years | 1,933 (44.7%) | 191 (9.9%) |
| 20 to 24 Years | 3,329 (86.3%) | 503 (15.1%) |
| 25 to 29 Years | 2,654 (87.6%) | 64 (2.4%) |
| 30 to 34 Years | 3,695 (84.9%) | 44 (1.2%) |
| 35 to 44 Years | 7,863 (84.3%) | 86 (1.1%) |
| 45 to 54 Years | 8,143 (89.1%) | 212 (2.6%) |
| 55 to 59 Years | 2,603 (83.4%) | 16 (0.6%) |
| 60 to 64 Years | 1,489 (76.5%) | 15 (1.0%) |
| 65 to 74 Years | 816 (26.7%) | 10 (1.2%) |
| 75 Years and over | 220 (13.2%) | 7 (3.2%) |
| Total | 32,731 (74.7%) | 1,146 (3.5%) |
Employment Status by Educational Attainment in Wylie
According to labor force statistics for Wylie, 85.6% of individuals (26,464) out of the total population between 25 and 64 years of age (30,916) are in the labor force, with 1.7% or 450 of them being unemployed. The group with the highest labor force participation rate are those with the educational attainment of bachelor's degree or higher, with 88.8% or 11,762 individuals in the labor force. Within the labor force, individuals with less than high school education have the highest percentage of unemployment, with 4.8% or 75 of them being unemployed.
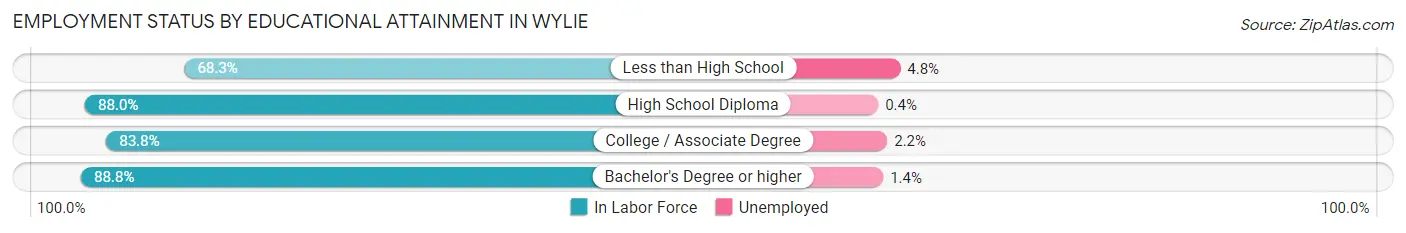
| Educational Attainment | In Labor Force | Unemployed |
| Less than High School | 1,567 (68.3%) | 110 (4.8%) |
| High School Diploma | 4,820 (88.0%) | 22 (0.4%) |
| College / Associate Degree | 8,295 (83.8%) | 218 (2.2%) |
| Bachelor's Degree or higher | 11,762 (88.8%) | 185 (1.4%) |
| Total | 26,464 (85.6%) | 526 (1.7%) |
Employment Occupations by Sex in Wylie
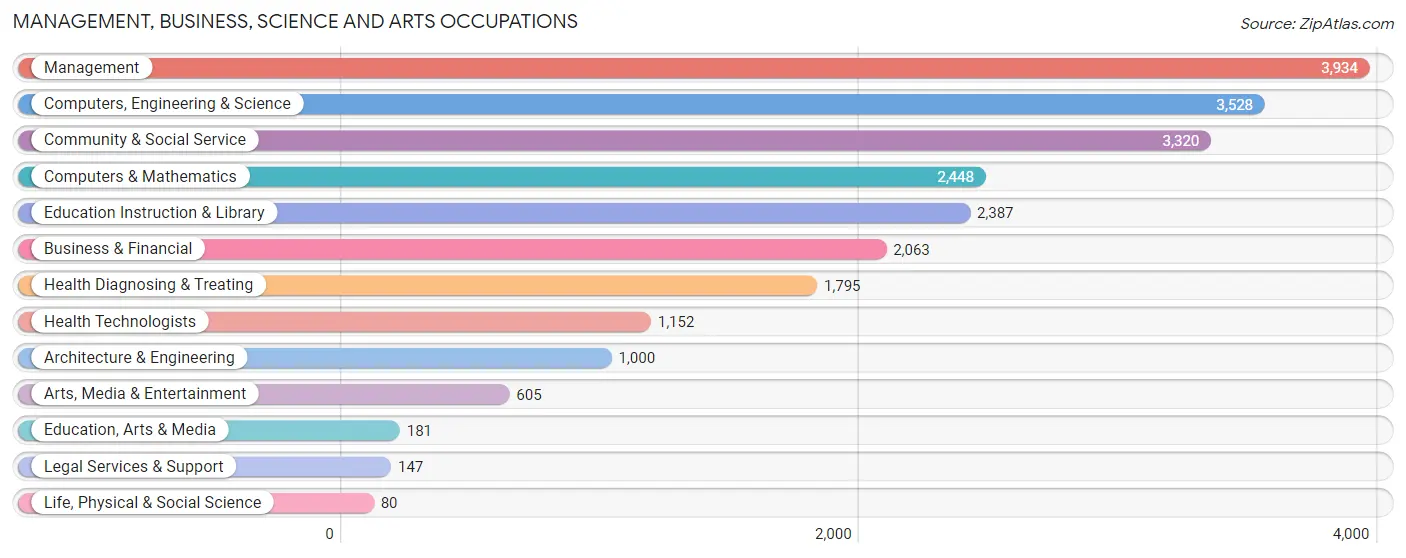
Management, Business, Science and Arts Occupations
The most common Management, Business, Science and Arts occupations in Wylie are Management (3,934 | 12.4%), Computers, Engineering & Science (3,528 | 11.2%), Community & Social Service (3,320 | 10.5%), Computers & Mathematics (2,448 | 7.7%), and Education Instruction & Library (2,387 | 7.5%).
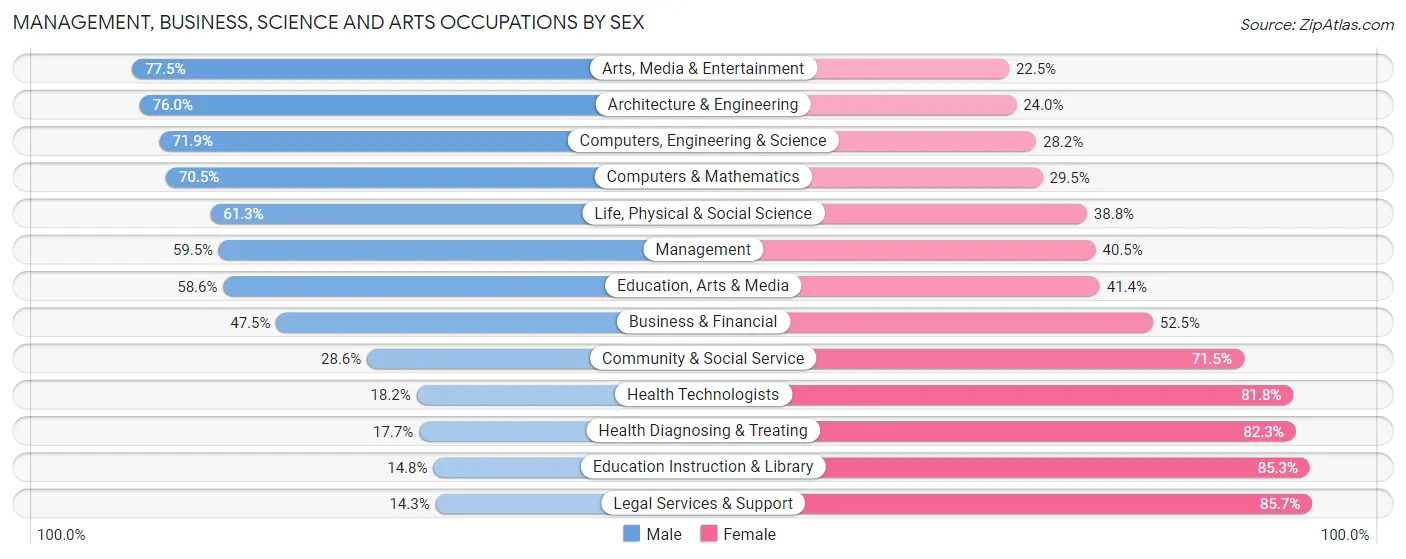
Management, Business, Science and Arts Occupations by Sex
Within the Management, Business, Science and Arts occupations in Wylie, the most male-oriented occupations are Arts, Media & Entertainment (77.5%), Architecture & Engineering (76.0%), and Computers, Engineering & Science (71.9%), while the most female-oriented occupations are Legal Services & Support (85.7%), Education Instruction & Library (85.3%), and Health Diagnosing & Treating (82.3%).
| Occupation | Male | Female |
| Management | 2,339 (59.5%) | 1,595 (40.5%) |
| Business & Financial | 980 (47.5%) | 1,083 (52.5%) |
| Computers, Engineering & Science | 2,535 (71.9%) | 993 (28.1%) |
| Computers & Mathematics | 1,726 (70.5%) | 722 (29.5%) |
| Architecture & Engineering | 760 (76.0%) | 240 (24.0%) |
| Life, Physical & Social Science | 49 (61.3%) | 31 (38.8%) |
| Community & Social Service | 948 (28.5%) | 2,372 (71.5%) |
| Education, Arts & Media | 106 (58.6%) | 75 (41.4%) |
| Legal Services & Support | 21 (14.3%) | 126 (85.7%) |
| Education Instruction & Library | 352 (14.7%) | 2,035 (85.3%) |
| Arts, Media & Entertainment | 469 (77.5%) | 136 (22.5%) |
| Health Diagnosing & Treating | 318 (17.7%) | 1,477 (82.3%) |
| Health Technologists | 210 (18.2%) | 942 (81.8%) |
| Total (Category) | 7,120 (48.6%) | 7,520 (51.4%) |
| Total (Overall) | 17,149 (54.3%) | 14,452 (45.7%) |
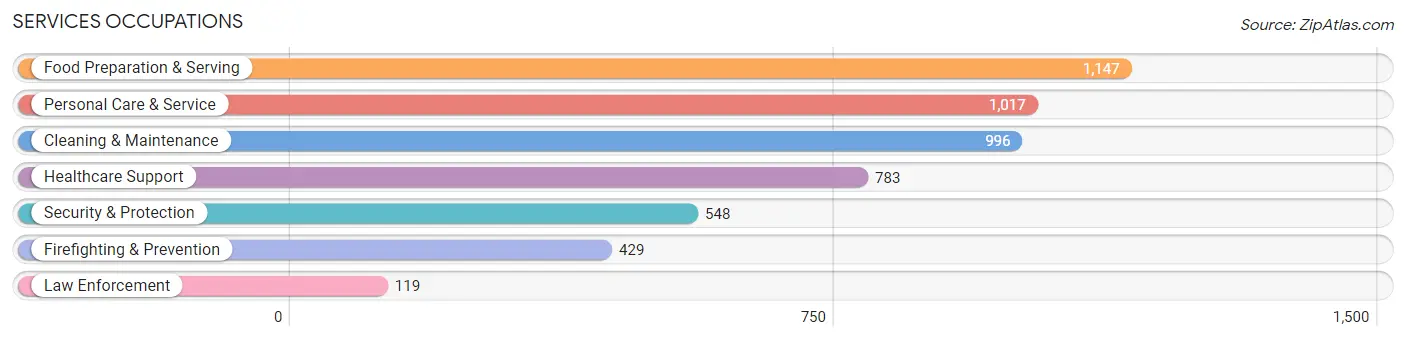
Services Occupations
The most common Services occupations in Wylie are Food Preparation & Serving (1,147 | 3.6%), Personal Care & Service (1,017 | 3.2%), Cleaning & Maintenance (996 | 3.2%), Healthcare Support (783 | 2.5%), and Security & Protection (548 | 1.7%).
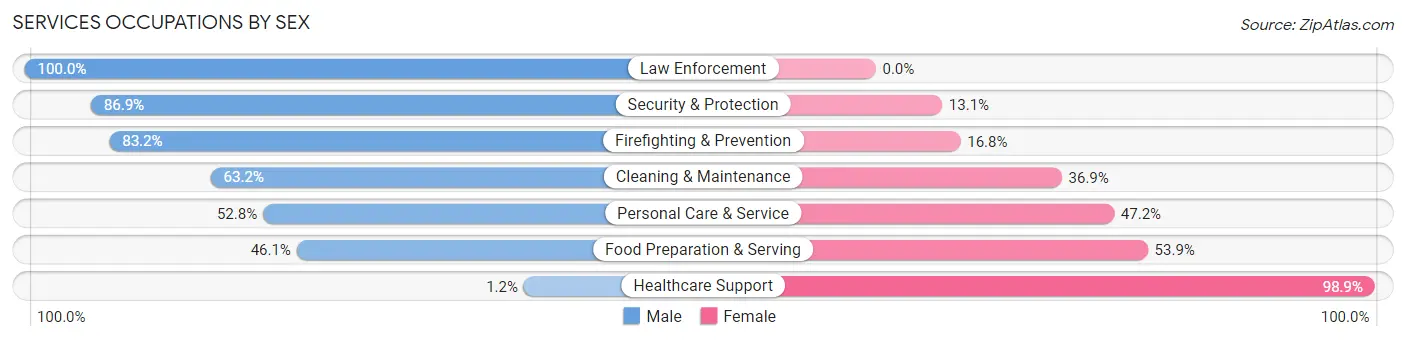
Services Occupations by Sex
Within the Services occupations in Wylie, the most male-oriented occupations are Law Enforcement (100.0%), Security & Protection (86.9%), and Firefighting & Prevention (83.2%), while the most female-oriented occupations are Healthcare Support (98.9%), Food Preparation & Serving (53.9%), and Personal Care & Service (47.2%).
| Occupation | Male | Female |
| Healthcare Support | 9 (1.1%) | 774 (98.9%) |
| Security & Protection | 476 (86.9%) | 72 (13.1%) |
| Firefighting & Prevention | 357 (83.2%) | 72 (16.8%) |
| Law Enforcement | 119 (100.0%) | 0 (0.0%) |
| Food Preparation & Serving | 529 (46.1%) | 618 (53.9%) |
| Cleaning & Maintenance | 629 (63.1%) | 367 (36.8%) |
| Personal Care & Service | 537 (52.8%) | 480 (47.2%) |
| Total (Category) | 2,180 (48.5%) | 2,311 (51.5%) |
| Total (Overall) | 17,149 (54.3%) | 14,452 (45.7%) |
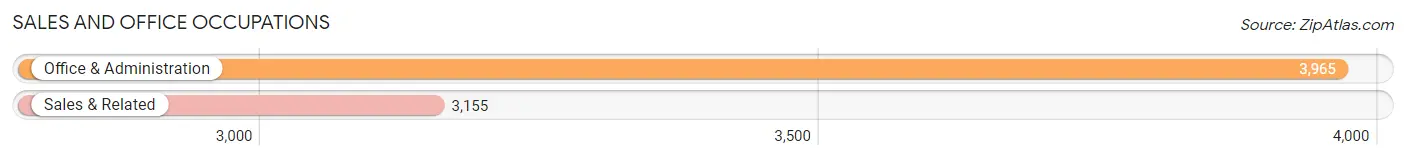
Sales and Office Occupations
The most common Sales and Office occupations in Wylie are Office & Administration (3,965 | 12.6%), and Sales & Related (3,155 | 10.0%).
Sales and Office Occupations by Sex
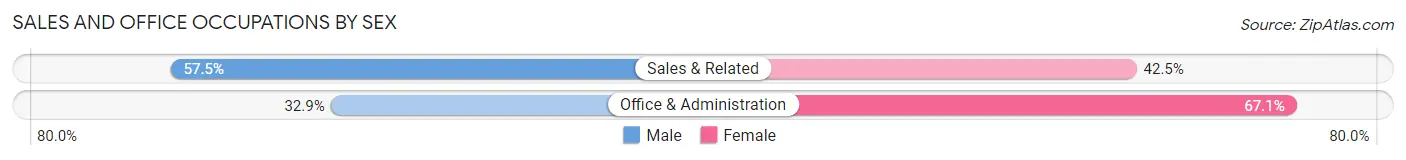
| Occupation | Male | Female |
| Sales & Related | 1,815 (57.5%) | 1,340 (42.5%) |
| Office & Administration | 1,306 (32.9%) | 2,659 (67.1%) |
| Total (Category) | 3,121 (43.8%) | 3,999 (56.2%) |
| Total (Overall) | 17,149 (54.3%) | 14,452 (45.7%) |
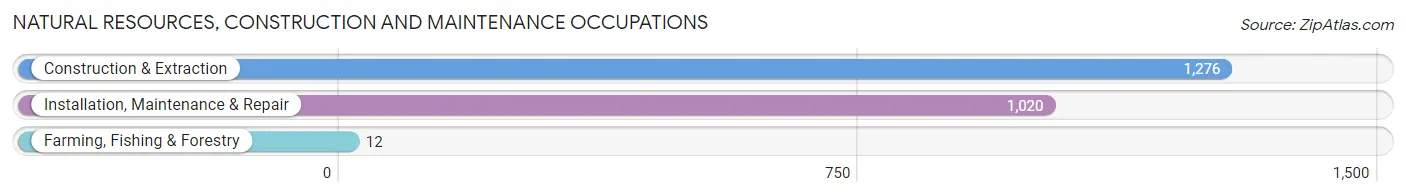
Natural Resources, Construction and Maintenance Occupations
The most common Natural Resources, Construction and Maintenance occupations in Wylie are Construction & Extraction (1,276 | 4.0%), Installation, Maintenance & Repair (1,020 | 3.2%), and Farming, Fishing & Forestry (12 | 0.0%).
Natural Resources, Construction and Maintenance Occupations by Sex
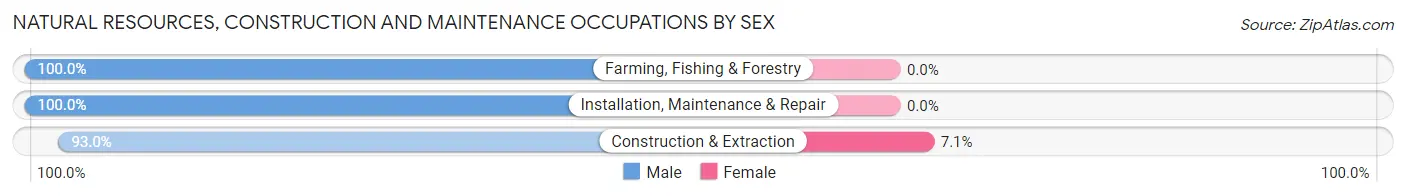
| Occupation | Male | Female |
| Farming, Fishing & Forestry | 12 (100.0%) | 0 (0.0%) |
| Construction & Extraction | 1,186 (92.9%) | 90 (7.0%) |
| Installation, Maintenance & Repair | 1,020 (100.0%) | 0 (0.0%) |
| Total (Category) | 2,218 (96.1%) | 90 (3.9%) |
| Total (Overall) | 17,149 (54.3%) | 14,452 (45.7%) |
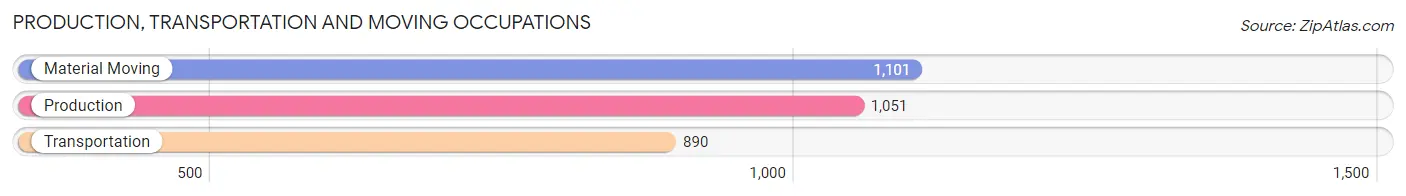
Production, Transportation and Moving Occupations
The most common Production, Transportation and Moving occupations in Wylie are Material Moving (1,101 | 3.5%), Production (1,051 | 3.3%), and Transportation (890 | 2.8%).
Production, Transportation and Moving Occupations by Sex
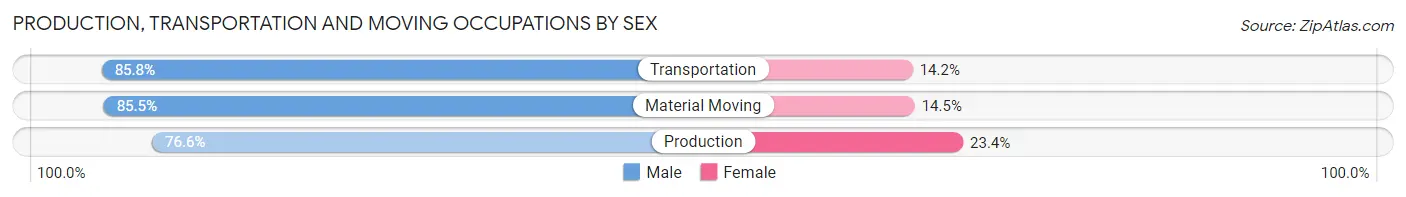
| Occupation | Male | Female |
| Production | 805 (76.6%) | 246 (23.4%) |
| Transportation | 764 (85.8%) | 126 (14.2%) |
| Material Moving | 941 (85.5%) | 160 (14.5%) |
| Total (Category) | 2,510 (82.5%) | 532 (17.5%) |
| Total (Overall) | 17,149 (54.3%) | 14,452 (45.7%) |
Employment Industries by Sex in Wylie
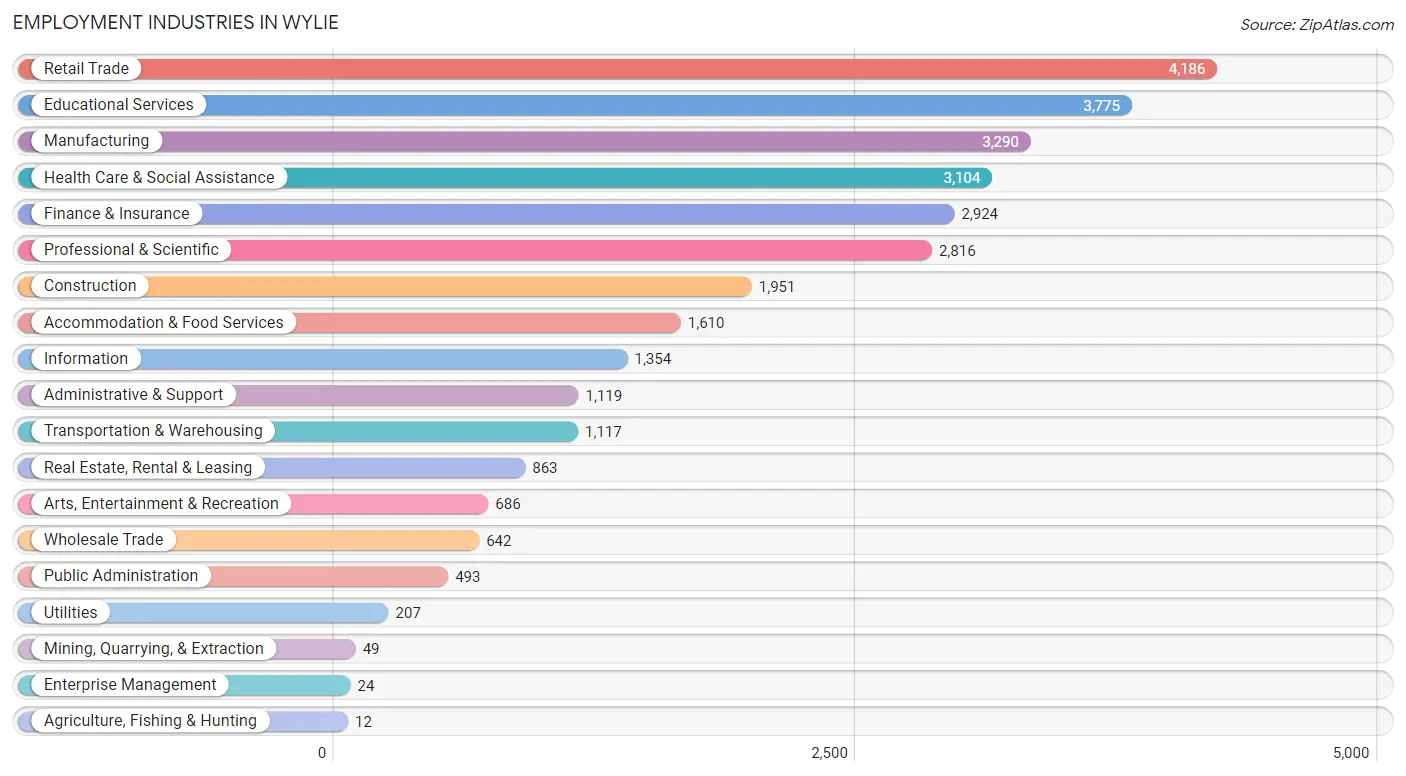
Employment Industries in Wylie
The major employment industries in Wylie include Retail Trade (4,186 | 13.3%), Educational Services (3,775 | 11.9%), Manufacturing (3,290 | 10.4%), Health Care & Social Assistance (3,104 | 9.8%), and Finance & Insurance (2,924 | 9.2%).
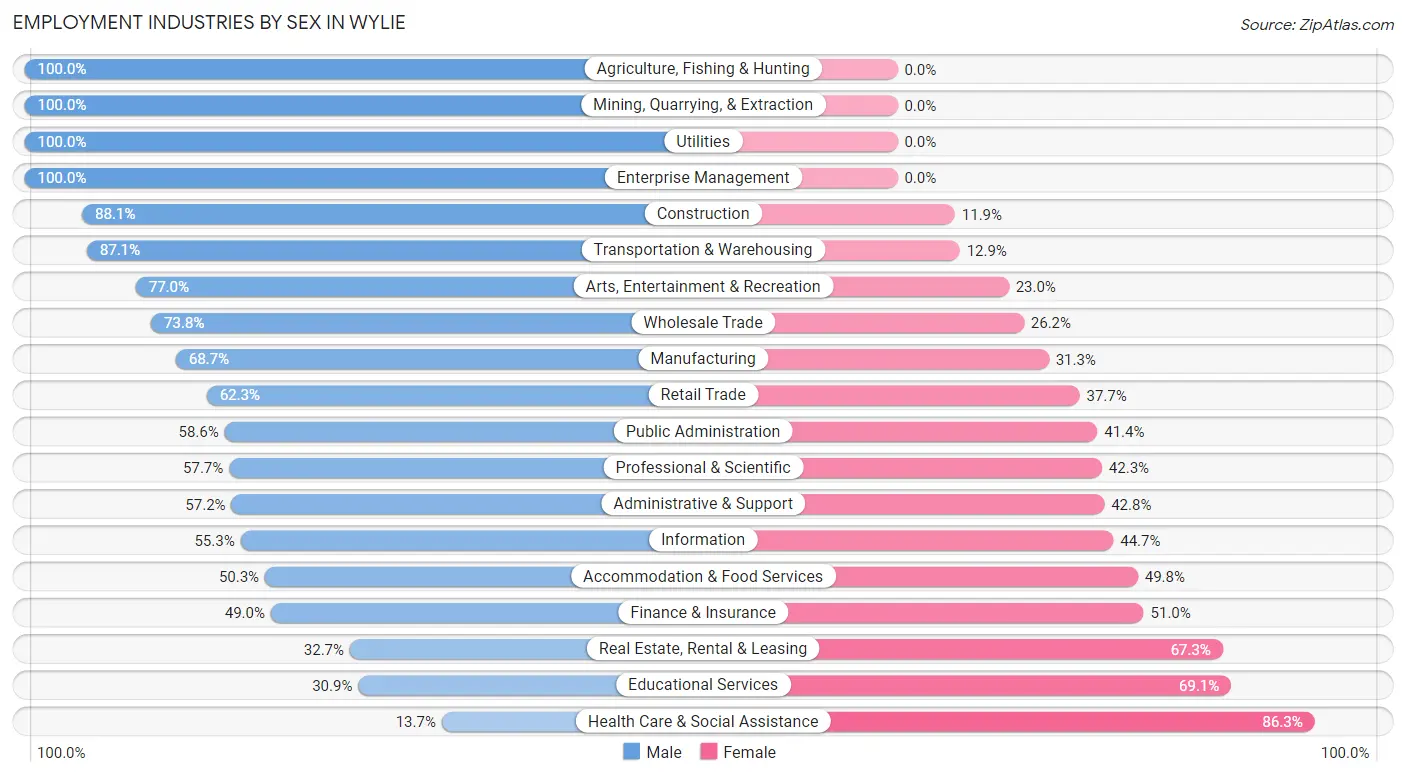
Employment Industries by Sex in Wylie
The Wylie industries that see more men than women are Agriculture, Fishing & Hunting (100.0%), Mining, Quarrying, & Extraction (100.0%), and Utilities (100.0%), whereas the industries that tend to have a higher number of women are Health Care & Social Assistance (86.3%), Educational Services (69.1%), and Real Estate, Rental & Leasing (67.3%).
| Industry | Male | Female |
| Agriculture, Fishing & Hunting | 12 (100.0%) | 0 (0.0%) |
| Mining, Quarrying, & Extraction | 49 (100.0%) | 0 (0.0%) |
| Construction | 1,719 (88.1%) | 232 (11.9%) |
| Manufacturing | 2,260 (68.7%) | 1,030 (31.3%) |
| Wholesale Trade | 474 (73.8%) | 168 (26.2%) |
| Retail Trade | 2,608 (62.3%) | 1,578 (37.7%) |
| Transportation & Warehousing | 973 (87.1%) | 144 (12.9%) |
| Utilities | 207 (100.0%) | 0 (0.0%) |
| Information | 749 (55.3%) | 605 (44.7%) |
| Finance & Insurance | 1,434 (49.0%) | 1,490 (51.0%) |
| Real Estate, Rental & Leasing | 282 (32.7%) | 581 (67.3%) |
| Professional & Scientific | 1,624 (57.7%) | 1,192 (42.3%) |
| Enterprise Management | 24 (100.0%) | 0 (0.0%) |
| Administrative & Support | 640 (57.2%) | 479 (42.8%) |
| Educational Services | 1,168 (30.9%) | 2,607 (69.1%) |
| Health Care & Social Assistance | 424 (13.7%) | 2,680 (86.3%) |
| Arts, Entertainment & Recreation | 528 (77.0%) | 158 (23.0%) |
| Accommodation & Food Services | 809 (50.2%) | 801 (49.7%) |
| Public Administration | 289 (58.6%) | 204 (41.4%) |
| Total | 17,149 (54.3%) | 14,452 (45.7%) |
Education in Wylie
School Enrollment in Wylie
The most common levels of schooling among the 16,579 students in Wylie are college / undergraduate (3,854 | 23.3%), high school (3,511 | 21.2%), and middle school (3,203 | 19.3%).
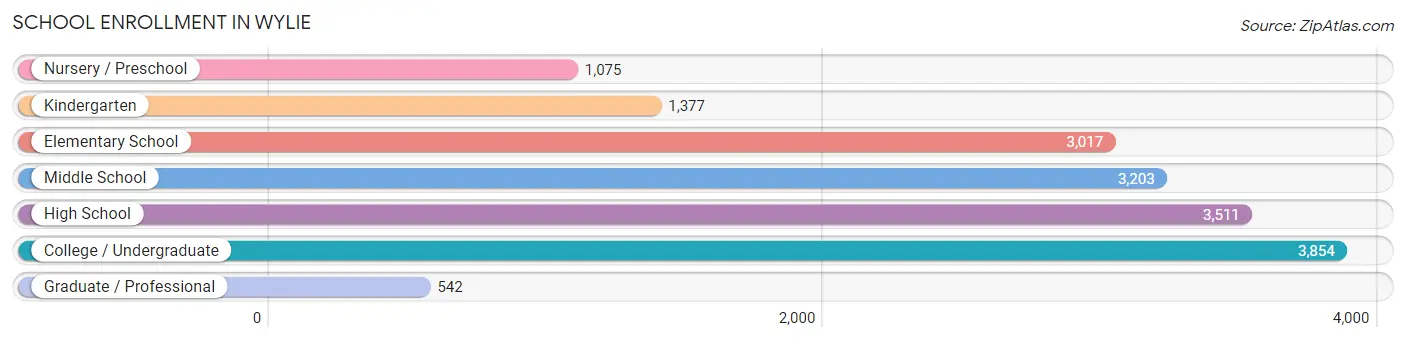
| School Level | # Students | % Students |
| Nursery / Preschool | 1,075 | 6.5% |
| Kindergarten | 1,377 | 8.3% |
| Elementary School | 3,017 | 18.2% |
| Middle School | 3,203 | 19.3% |
| High School | 3,511 | 21.2% |
| College / Undergraduate | 3,854 | 23.3% |
| Graduate / Professional | 542 | 3.3% |
| Total | 16,579 | 100.0% |
School Enrollment by Age by Funding Source in Wylie
Out of a total of 16,579 students who are enrolled in schools in Wylie, 2,371 (14.3%) attend a private institution, while the remaining 14,208 (85.7%) are enrolled in public schools. The age group of 3 to 4 year olds has the highest likelihood of being enrolled in private schools, with 530 (54.3% in the age bracket) enrolled. Conversely, the age group of 15 to 17 year olds has the lowest likelihood of being enrolled in a private school, with 2,454 (94.3% in the age bracket) attending a public institution.
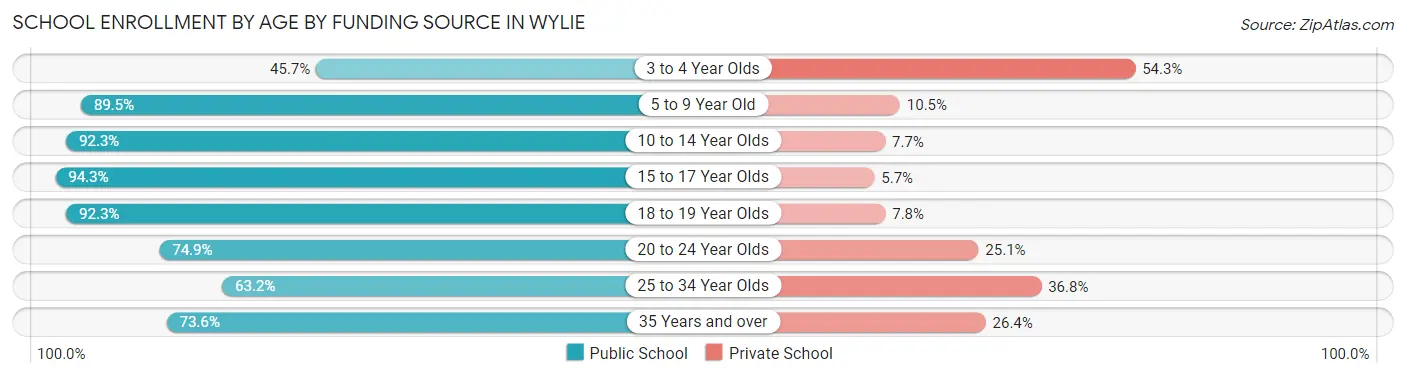
| Age Bracket | Public School | Private School |
| 3 to 4 Year Olds | 446 (45.7%) | 530 (54.3%) |
| 5 to 9 Year Old | 3,841 (89.5%) | 449 (10.5%) |
| 10 to 14 Year Olds | 3,542 (92.3%) | 296 (7.7%) |
| 15 to 17 Year Olds | 2,454 (94.3%) | 149 (5.7%) |
| 18 to 19 Year Olds | 1,880 (92.2%) | 158 (7.7%) |
| 20 to 24 Year Olds | 1,176 (74.9%) | 394 (25.1%) |
| 25 to 34 Year Olds | 328 (63.2%) | 191 (36.8%) |
| 35 Years and over | 548 (73.6%) | 197 (26.4%) |
| Total | 14,208 (85.7%) | 2,371 (14.3%) |
Educational Attainment by Field of Study in Wylie
Business (3,564 | 23.0%), computers & mathematics (1,549 | 10.0%), science & technology (1,530 | 9.9%), education (1,495 | 9.7%), and engineering (1,366 | 8.8%) are the most common fields of study among 15,474 individuals in Wylie who have obtained a bachelor's degree or higher.
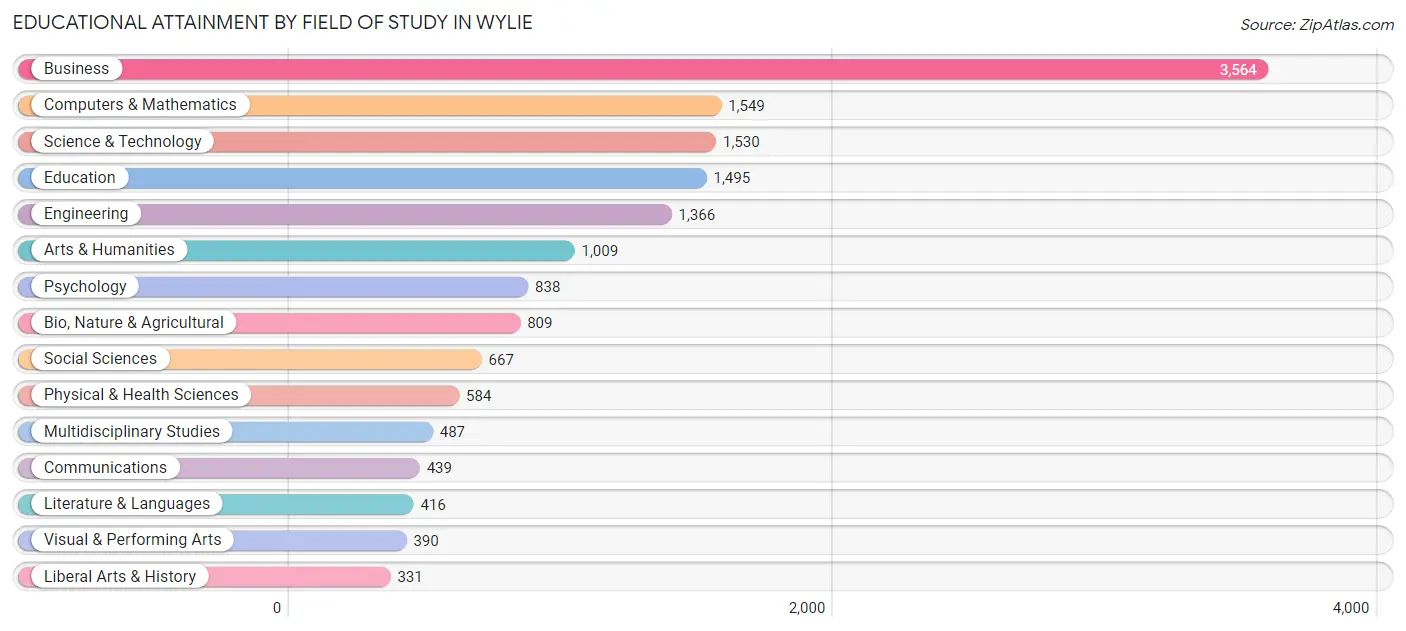
| Field of Study | # Graduates | % Graduates |
| Computers & Mathematics | 1,549 | 10.0% |
| Bio, Nature & Agricultural | 809 | 5.2% |
| Physical & Health Sciences | 584 | 3.8% |
| Psychology | 838 | 5.4% |
| Social Sciences | 667 | 4.3% |
| Engineering | 1,366 | 8.8% |
| Multidisciplinary Studies | 487 | 3.2% |
| Science & Technology | 1,530 | 9.9% |
| Business | 3,564 | 23.0% |
| Education | 1,495 | 9.7% |
| Literature & Languages | 416 | 2.7% |
| Liberal Arts & History | 331 | 2.1% |
| Visual & Performing Arts | 390 | 2.5% |
| Communications | 439 | 2.8% |
| Arts & Humanities | 1,009 | 6.5% |
| Total | 15,474 | 100.0% |
Transportation & Commute in Wylie
Vehicle Availability by Sex in Wylie
The most prevalent vehicle ownership categories in Wylie are males with 2 vehicles (8,666, accounting for 51.0%) and females with 2 vehicles (6,420, making up 61.0%).
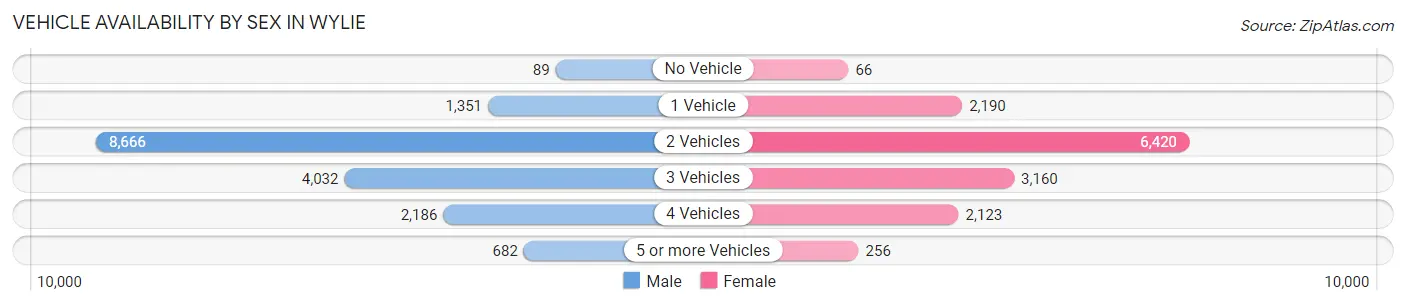
| Vehicles Available | Male | Female |
| No Vehicle | 89 (0.5%) | 66 (0.5%) |
| 1 Vehicle | 1,351 (7.9%) | 2,190 (15.4%) |
| 2 Vehicles | 8,666 (51.0%) | 6,420 (45.2%) |
| 3 Vehicles | 4,032 (23.7%) | 3,160 (22.2%) |
| 4 Vehicles | 2,186 (12.9%) | 2,123 (14.9%) |
| 5 or more Vehicles | 682 (4.0%) | 256 (1.8%) |
| Total | 17,006 (100.0%) | 14,215 (100.0%) |
Commute Time in Wylie
The most frequently occuring commute durations in Wylie are 45 to 59 minutes (5,013 commuters, 19.0%), 30 to 34 minutes (4,455 commuters, 16.9%), and 10 to 14 minutes (2,590 commuters, 9.8%).
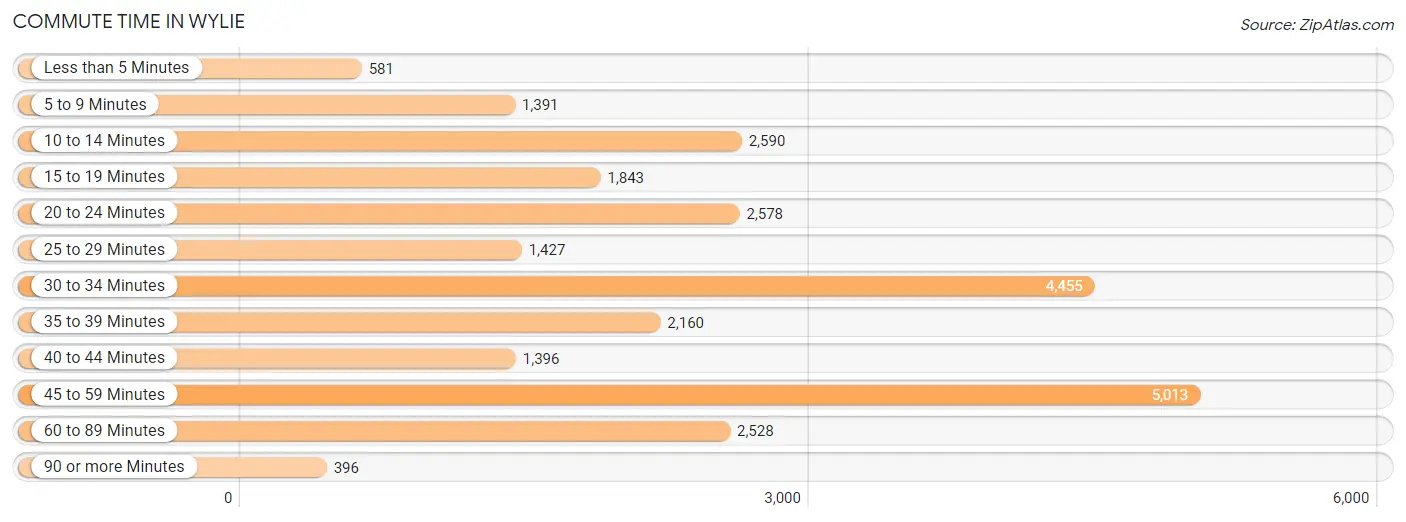
| Commute Time | # Commuters | % Commuters |
| Less than 5 Minutes | 581 | 2.2% |
| 5 to 9 Minutes | 1,391 | 5.3% |
| 10 to 14 Minutes | 2,590 | 9.8% |
| 15 to 19 Minutes | 1,843 | 7.0% |
| 20 to 24 Minutes | 2,578 | 9.8% |
| 25 to 29 Minutes | 1,427 | 5.4% |
| 30 to 34 Minutes | 4,455 | 16.9% |
| 35 to 39 Minutes | 2,160 | 8.2% |
| 40 to 44 Minutes | 1,396 | 5.3% |
| 45 to 59 Minutes | 5,013 | 19.0% |
| 60 to 89 Minutes | 2,528 | 9.6% |
| 90 or more Minutes | 396 | 1.5% |
Commute Time by Sex in Wylie
The most common commute times in Wylie are 30 to 34 minutes (2,750 commuters, 18.3%) for males and 45 to 59 minutes (2,283 commuters, 20.1%) for females.
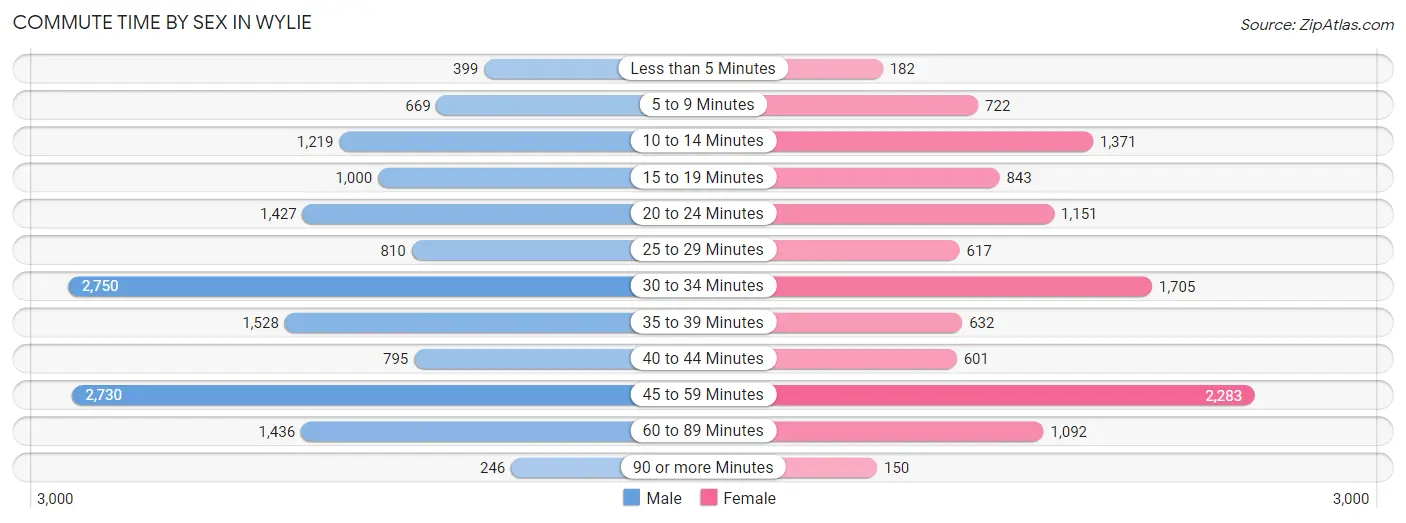
| Commute Time | Male | Female |
| Less than 5 Minutes | 399 (2.7%) | 182 (1.6%) |
| 5 to 9 Minutes | 669 (4.5%) | 722 (6.4%) |
| 10 to 14 Minutes | 1,219 (8.1%) | 1,371 (12.1%) |
| 15 to 19 Minutes | 1,000 (6.7%) | 843 (7.4%) |
| 20 to 24 Minutes | 1,427 (9.5%) | 1,151 (10.1%) |
| 25 to 29 Minutes | 810 (5.4%) | 617 (5.4%) |
| 30 to 34 Minutes | 2,750 (18.3%) | 1,705 (15.0%) |
| 35 to 39 Minutes | 1,528 (10.2%) | 632 (5.6%) |
| 40 to 44 Minutes | 795 (5.3%) | 601 (5.3%) |
| 45 to 59 Minutes | 2,730 (18.2%) | 2,283 (20.1%) |
| 60 to 89 Minutes | 1,436 (9.6%) | 1,092 (9.6%) |
| 90 or more Minutes | 246 (1.6%) | 150 (1.3%) |
Time of Departure to Work by Sex in Wylie
The most frequent times of departure to work in Wylie are 7:00 AM to 7:29 AM (2,745, 18.3%) for males and 7:00 AM to 7:29 AM (2,834, 25.0%) for females.
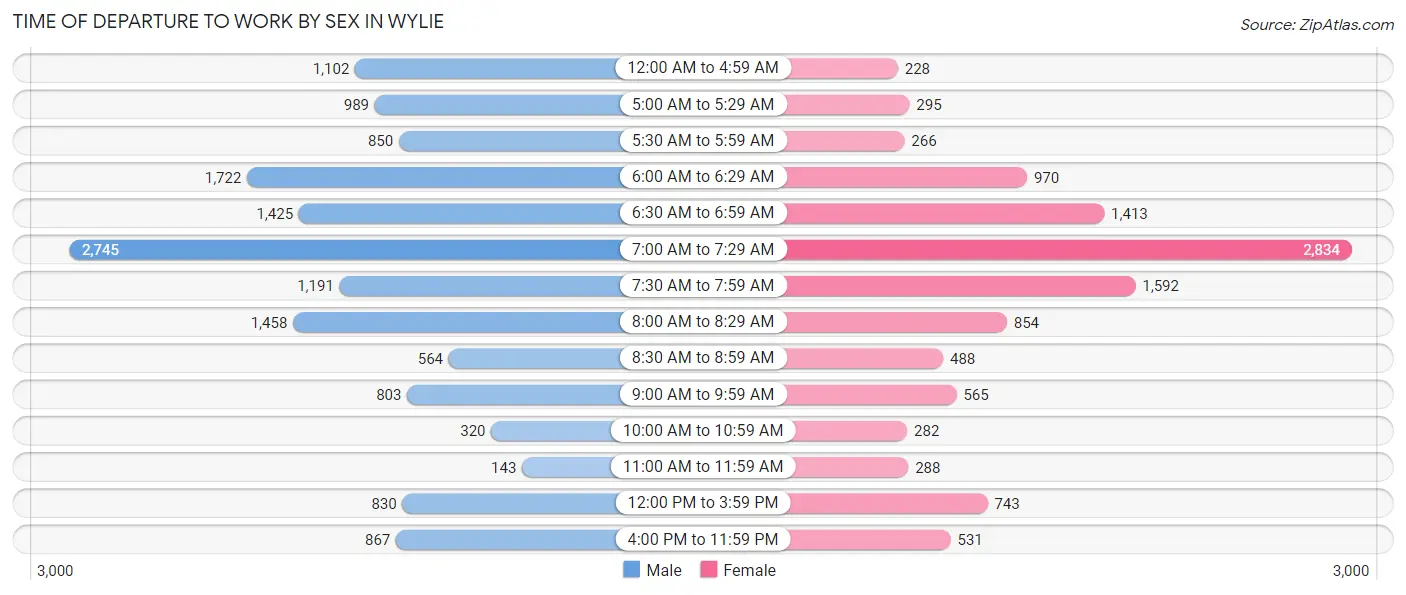
| Time of Departure | Male | Female |
| 12:00 AM to 4:59 AM | 1,102 (7.3%) | 228 (2.0%) |
| 5:00 AM to 5:29 AM | 989 (6.6%) | 295 (2.6%) |
| 5:30 AM to 5:59 AM | 850 (5.7%) | 266 (2.3%) |
| 6:00 AM to 6:29 AM | 1,722 (11.5%) | 970 (8.6%) |
| 6:30 AM to 6:59 AM | 1,425 (9.5%) | 1,413 (12.4%) |
| 7:00 AM to 7:29 AM | 2,745 (18.3%) | 2,834 (25.0%) |
| 7:30 AM to 7:59 AM | 1,191 (7.9%) | 1,592 (14.0%) |
| 8:00 AM to 8:29 AM | 1,458 (9.7%) | 854 (7.5%) |
| 8:30 AM to 8:59 AM | 564 (3.8%) | 488 (4.3%) |
| 9:00 AM to 9:59 AM | 803 (5.3%) | 565 (5.0%) |
| 10:00 AM to 10:59 AM | 320 (2.1%) | 282 (2.5%) |
| 11:00 AM to 11:59 AM | 143 (0.9%) | 288 (2.5%) |
| 12:00 PM to 3:59 PM | 830 (5.5%) | 743 (6.6%) |
| 4:00 PM to 11:59 PM | 867 (5.8%) | 531 (4.7%) |
| Total | 15,009 (100.0%) | 11,349 (100.0%) |
Housing Occupancy in Wylie
Occupancy by Ownership in Wylie
Of the total 18,217 dwellings in Wylie, owner-occupied units account for 13,966 (76.7%), while renter-occupied units make up 4,251 (23.3%).
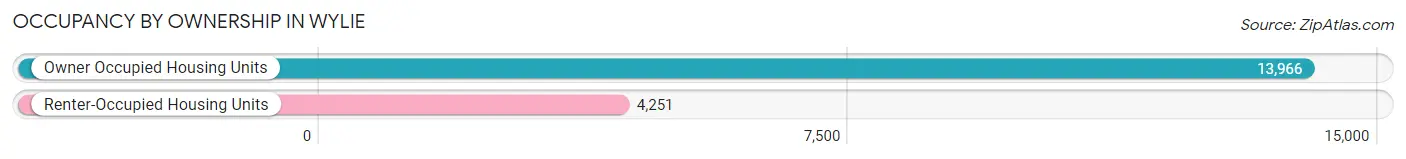
| Occupancy | # Housing Units | % Housing Units |
| Owner Occupied Housing Units | 13,966 | 76.7% |
| Renter-Occupied Housing Units | 4,251 | 23.3% |
| Total Occupied Housing Units | 18,217 | 100.0% |
Occupancy by Household Size in Wylie
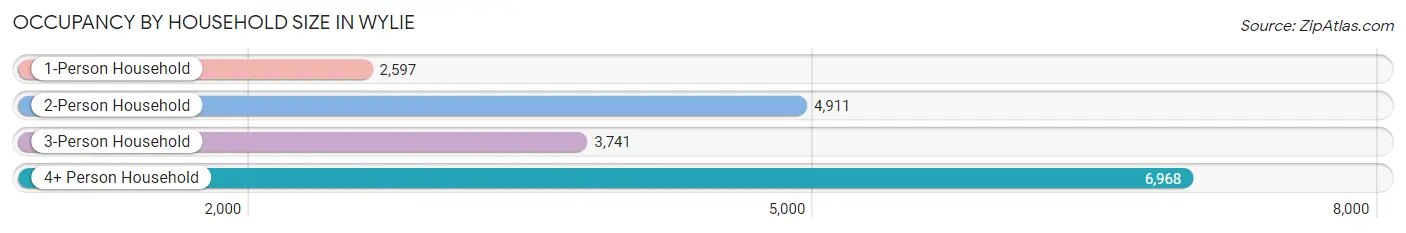
| Household Size | # Housing Units | % Housing Units |
| 1-Person Household | 2,597 | 14.3% |
| 2-Person Household | 4,911 | 27.0% |
| 3-Person Household | 3,741 | 20.5% |
| 4+ Person Household | 6,968 | 38.3% |
| Total Housing Units | 18,217 | 100.0% |
Occupancy by Ownership by Household Size in Wylie
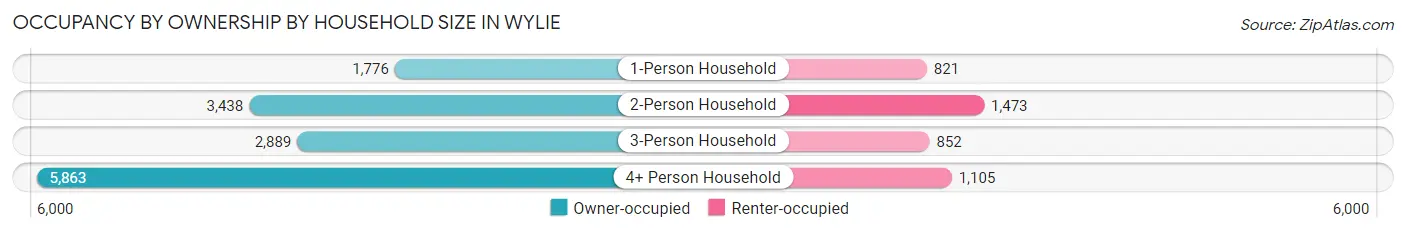
| Household Size | Owner-occupied | Renter-occupied |
| 1-Person Household | 1,776 (68.4%) | 821 (31.6%) |
| 2-Person Household | 3,438 (70.0%) | 1,473 (30.0%) |
| 3-Person Household | 2,889 (77.2%) | 852 (22.8%) |
| 4+ Person Household | 5,863 (84.1%) | 1,105 (15.9%) |
| Total Housing Units | 13,966 (76.7%) | 4,251 (23.3%) |
Occupancy by Educational Attainment in Wylie
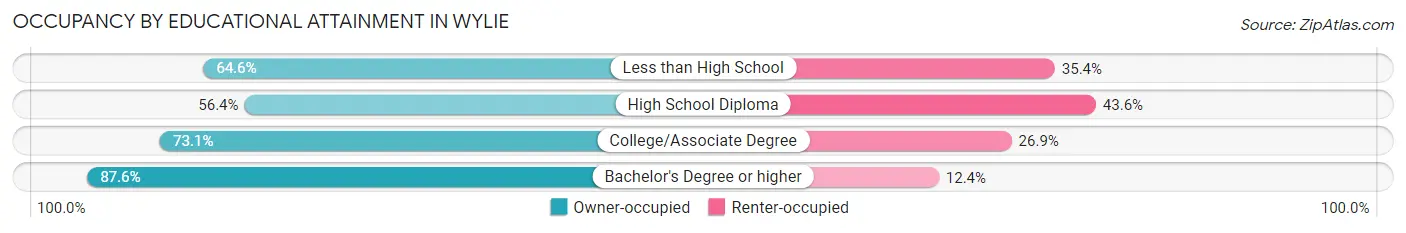
| Household Size | Owner-occupied | Renter-occupied |
| Less than High School | 740 (64.6%) | 406 (35.4%) |
| High School Diploma | 1,513 (56.4%) | 1,168 (43.6%) |
| College/Associate Degree | 4,503 (73.1%) | 1,654 (26.9%) |
| Bachelor's Degree or higher | 7,210 (87.6%) | 1,023 (12.4%) |
Occupancy by Age of Householder in Wylie
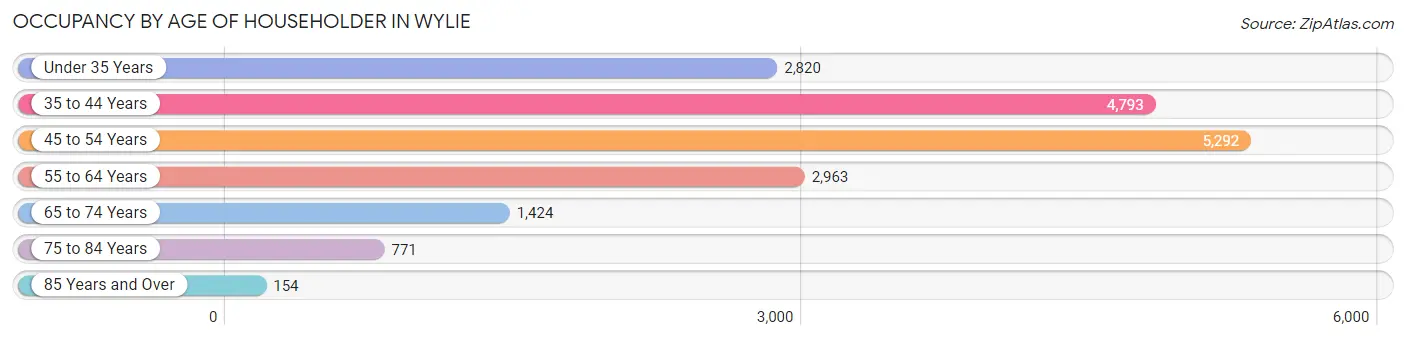
| Age Bracket | # Households | % Households |
| Under 35 Years | 2,820 | 15.5% |
| 35 to 44 Years | 4,793 | 26.3% |
| 45 to 54 Years | 5,292 | 29.0% |
| 55 to 64 Years | 2,963 | 16.3% |
| 65 to 74 Years | 1,424 | 7.8% |
| 75 to 84 Years | 771 | 4.2% |
| 85 Years and Over | 154 | 0.9% |
| Total | 18,217 | 100.0% |
Housing Finances in Wylie
Median Income by Occupancy in Wylie
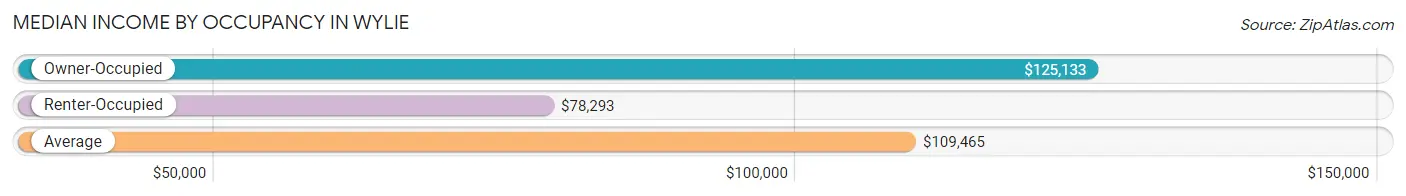
| Occupancy Type | # Households | Median Income |
| Owner-Occupied | 13,966 (76.7%) | $125,133 |
| Renter-Occupied | 4,251 (23.3%) | $78,293 |
| Average | 18,217 (100.0%) | $109,465 |
Occupancy by Householder Income Bracket in Wylie
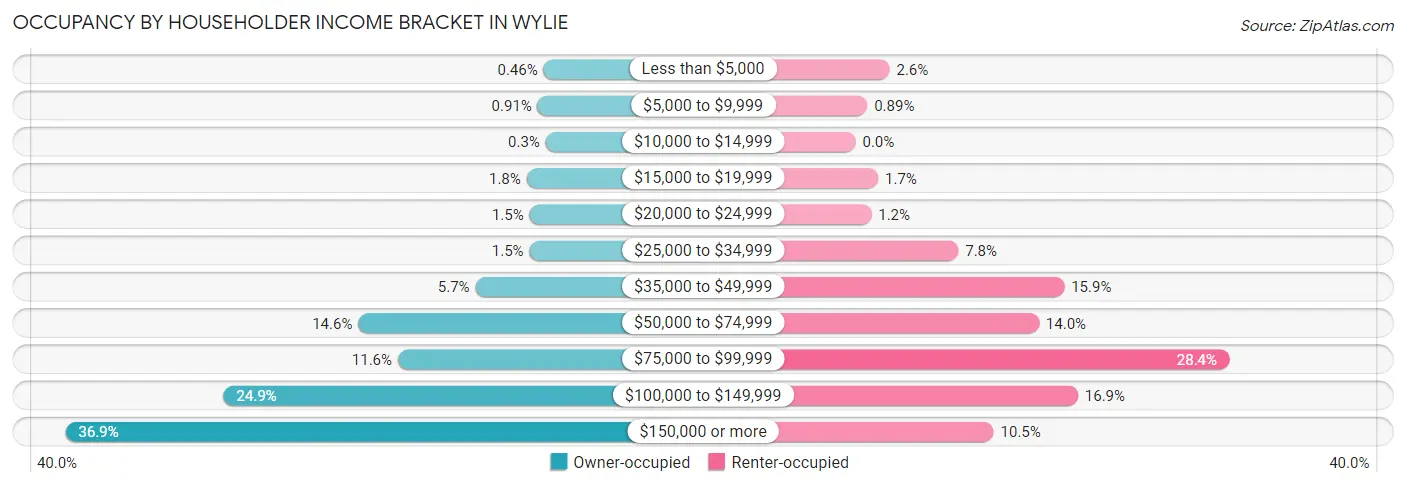
| Income Bracket | Owner-occupied | Renter-occupied |
| Less than $5,000 | 64 (0.5%) | 110 (2.6%) |
| $5,000 to $9,999 | 127 (0.9%) | 38 (0.9%) |
| $10,000 to $14,999 | 42 (0.3%) | 0 (0.0%) |
| $15,000 to $19,999 | 244 (1.8%) | 73 (1.7%) |
| $20,000 to $24,999 | 213 (1.5%) | 51 (1.2%) |
| $25,000 to $34,999 | 215 (1.5%) | 333 (7.8%) |
| $35,000 to $49,999 | 789 (5.7%) | 676 (15.9%) |
| $50,000 to $74,999 | 2,036 (14.6%) | 594 (14.0%) |
| $75,000 to $99,999 | 1,614 (11.6%) | 1,209 (28.4%) |
| $100,000 to $149,999 | 3,470 (24.8%) | 720 (16.9%) |
| $150,000 or more | 5,152 (36.9%) | 447 (10.5%) |
| Total | 13,966 (100.0%) | 4,251 (100.0%) |
Monthly Housing Cost Tiers in Wylie
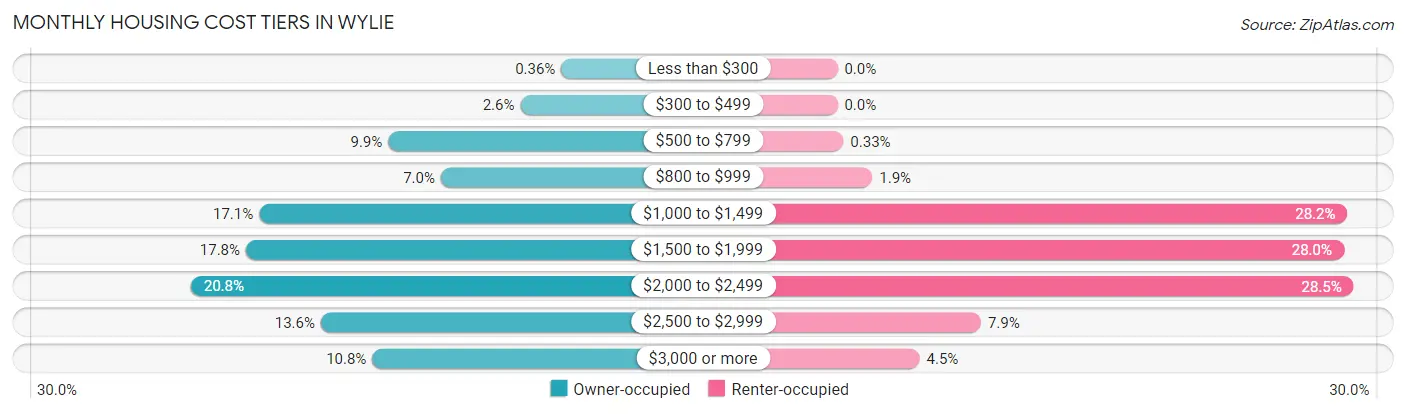
| Monthly Cost | Owner-occupied | Renter-occupied |
| Less than $300 | 50 (0.4%) | 0 (0.0%) |
| $300 to $499 | 366 (2.6%) | 0 (0.0%) |
| $500 to $799 | 1,385 (9.9%) | 14 (0.3%) |
| $800 to $999 | 979 (7.0%) | 82 (1.9%) |
| $1,000 to $1,499 | 2,381 (17.1%) | 1,197 (28.2%) |
| $1,500 to $1,999 | 2,483 (17.8%) | 1,189 (28.0%) |
| $2,000 to $2,499 | 2,908 (20.8%) | 1,212 (28.5%) |
| $2,500 to $2,999 | 1,905 (13.6%) | 337 (7.9%) |
| $3,000 or more | 1,509 (10.8%) | 193 (4.5%) |
| Total | 13,966 (100.0%) | 4,251 (100.0%) |
Physical Housing Characteristics in Wylie
Housing Structures in Wylie
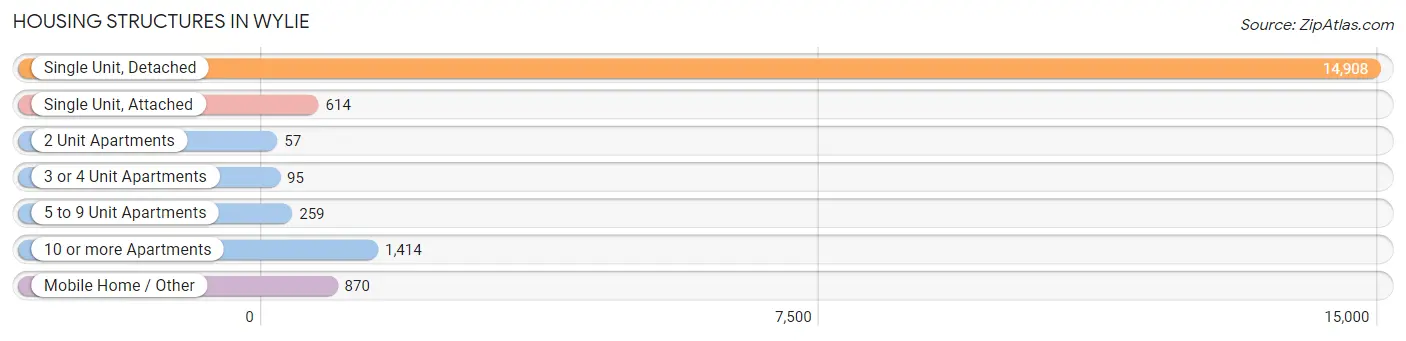
| Structure Type | # Housing Units | % Housing Units |
| Single Unit, Detached | 14,908 | 81.8% |
| Single Unit, Attached | 614 | 3.4% |
| 2 Unit Apartments | 57 | 0.3% |
| 3 or 4 Unit Apartments | 95 | 0.5% |
| 5 to 9 Unit Apartments | 259 | 1.4% |
| 10 or more Apartments | 1,414 | 7.8% |
| Mobile Home / Other | 870 | 4.8% |
| Total | 18,217 | 100.0% |
Housing Structures by Occupancy in Wylie
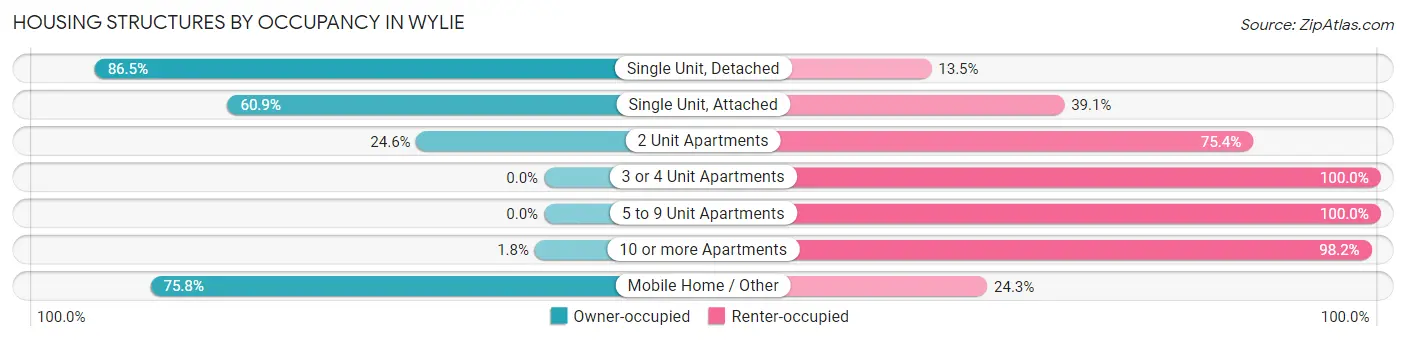
| Structure Type | Owner-occupied | Renter-occupied |
| Single Unit, Detached | 12,894 (86.5%) | 2,014 (13.5%) |
| Single Unit, Attached | 374 (60.9%) | 240 (39.1%) |
| 2 Unit Apartments | 14 (24.6%) | 43 (75.4%) |
| 3 or 4 Unit Apartments | 0 (0.0%) | 95 (100.0%) |
| 5 to 9 Unit Apartments | 0 (0.0%) | 259 (100.0%) |
| 10 or more Apartments | 25 (1.8%) | 1,389 (98.2%) |
| Mobile Home / Other | 659 (75.7%) | 211 (24.2%) |
| Total | 13,966 (76.7%) | 4,251 (23.3%) |
Housing Structures by Number of Rooms in Wylie
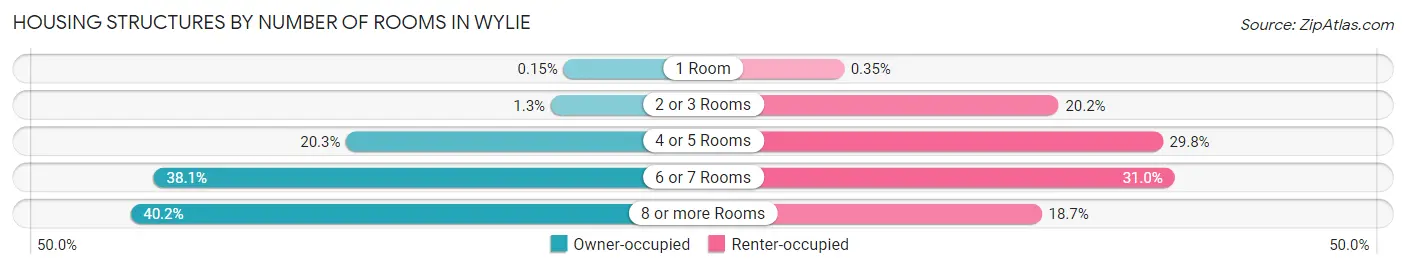
| Number of Rooms | Owner-occupied | Renter-occupied |
| 1 Room | 21 (0.2%) | 15 (0.4%) |
| 2 or 3 Rooms | 185 (1.3%) | 859 (20.2%) |
| 4 or 5 Rooms | 2,828 (20.3%) | 1,268 (29.8%) |
| 6 or 7 Rooms | 5,315 (38.1%) | 1,316 (31.0%) |
| 8 or more Rooms | 5,617 (40.2%) | 793 (18.6%) |
| Total | 13,966 (100.0%) | 4,251 (100.0%) |
Housing Structure by Heating Type in Wylie
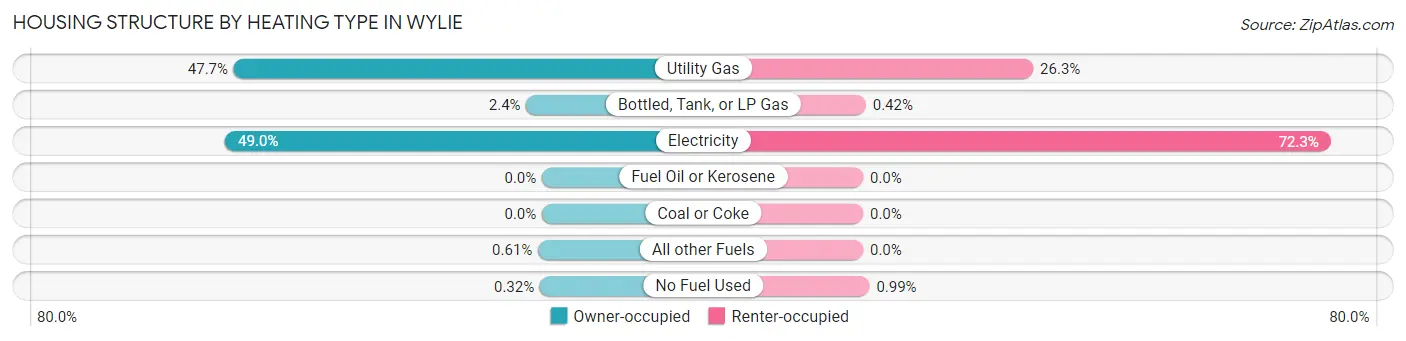
| Heating Type | Owner-occupied | Renter-occupied |
| Utility Gas | 6,655 (47.6%) | 1,118 (26.3%) |
| Bottled, Tank, or LP Gas | 338 (2.4%) | 18 (0.4%) |
| Electricity | 6,843 (49.0%) | 3,073 (72.3%) |
| Fuel Oil or Kerosene | 0 (0.0%) | 0 (0.0%) |
| Coal or Coke | 0 (0.0%) | 0 (0.0%) |
| All other Fuels | 85 (0.6%) | 0 (0.0%) |
| No Fuel Used | 45 (0.3%) | 42 (1.0%) |
| Total | 13,966 (100.0%) | 4,251 (100.0%) |
Household Vehicle Usage in Wylie
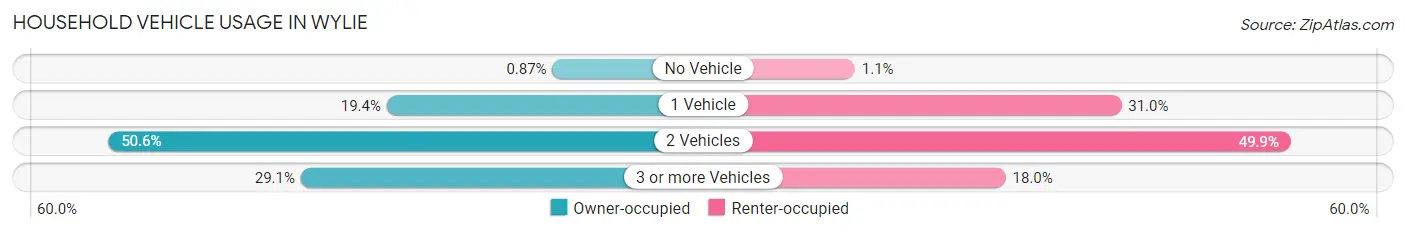
| Vehicles per Household | Owner-occupied | Renter-occupied |
| No Vehicle | 122 (0.9%) | 47 (1.1%) |
| 1 Vehicle | 2,714 (19.4%) | 1,316 (31.0%) |
| 2 Vehicles | 7,071 (50.6%) | 2,123 (49.9%) |
| 3 or more Vehicles | 4,059 (29.1%) | 765 (18.0%) |
| Total | 13,966 (100.0%) | 4,251 (100.0%) |
Real Estate & Mortgages in Wylie
Real Estate and Mortgage Overview in Wylie
| Characteristic | Without Mortgage | With Mortgage |
| Housing Units | 3,651 | 10,315 |
| Median Property Value | $291,700 | $326,900 |
| Median Household Income | $97,938 | $3,959 |
| Monthly Housing Costs | $924 | $1,509 |
| Real Estate Taxes | $5,674 | $330 |
Property Value by Mortgage Status in Wylie
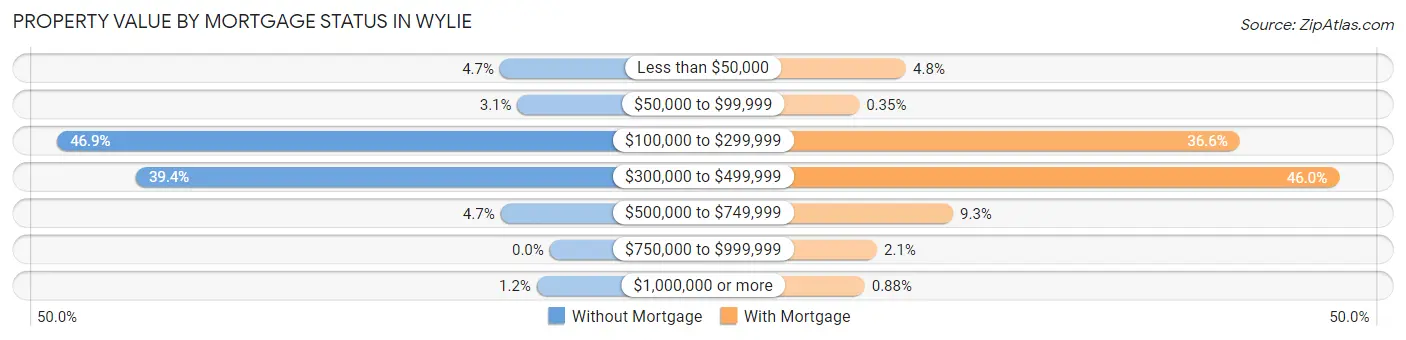
| Property Value | Without Mortgage | With Mortgage |
| Less than $50,000 | 173 (4.7%) | 497 (4.8%) |
| $50,000 to $99,999 | 112 (3.1%) | 36 (0.4%) |
| $100,000 to $299,999 | 1,712 (46.9%) | 3,773 (36.6%) |
| $300,000 to $499,999 | 1,438 (39.4%) | 4,749 (46.0%) |
| $500,000 to $749,999 | 171 (4.7%) | 958 (9.3%) |
| $750,000 to $999,999 | 0 (0.0%) | 211 (2.1%) |
| $1,000,000 or more | 45 (1.2%) | 91 (0.9%) |
| Total | 3,651 (100.0%) | 10,315 (100.0%) |
Household Income by Mortgage Status in Wylie
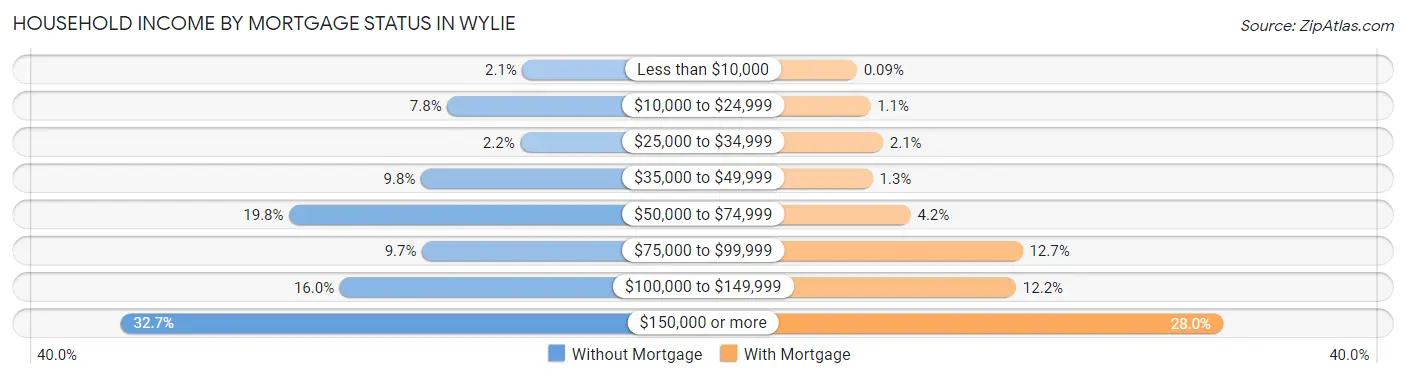
| Household Income | Without Mortgage | With Mortgage |
| Less than $10,000 | 75 (2.1%) | 9 (0.1%) |
| $10,000 to $24,999 | 284 (7.8%) | 116 (1.1%) |
| $25,000 to $34,999 | 81 (2.2%) | 215 (2.1%) |
| $35,000 to $49,999 | 357 (9.8%) | 134 (1.3%) |
| $50,000 to $74,999 | 724 (19.8%) | 432 (4.2%) |
| $75,000 to $99,999 | 354 (9.7%) | 1,312 (12.7%) |
| $100,000 to $149,999 | 583 (16.0%) | 1,260 (12.2%) |
| $150,000 or more | 1,193 (32.7%) | 2,887 (28.0%) |
| Total | 3,651 (100.0%) | 10,315 (100.0%) |
Property Value to Household Income Ratio in Wylie
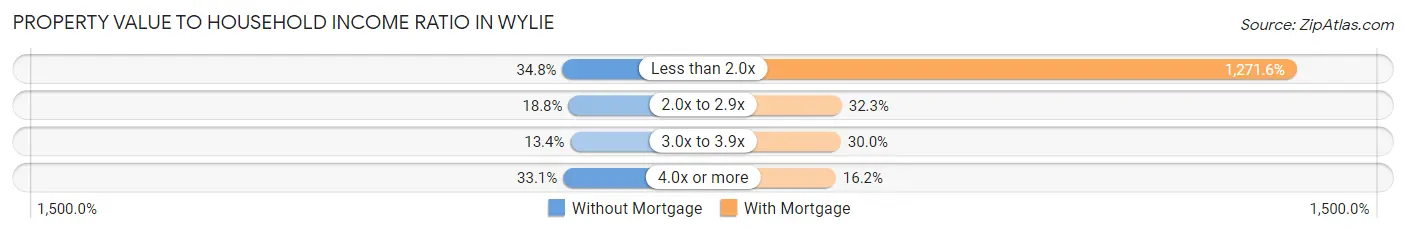
| Value-to-Income Ratio | Without Mortgage | With Mortgage |
| Less than 2.0x | 1,269 (34.8%) | 131,170 (1,271.6%) |
| 2.0x to 2.9x | 685 (18.8%) | 3,331 (32.3%) |
| 3.0x to 3.9x | 489 (13.4%) | 3,090 (30.0%) |
| 4.0x or more | 1,208 (33.1%) | 1,671 (16.2%) |
| Total | 3,651 (100.0%) | 10,315 (100.0%) |
Real Estate Taxes by Mortgage Status in Wylie
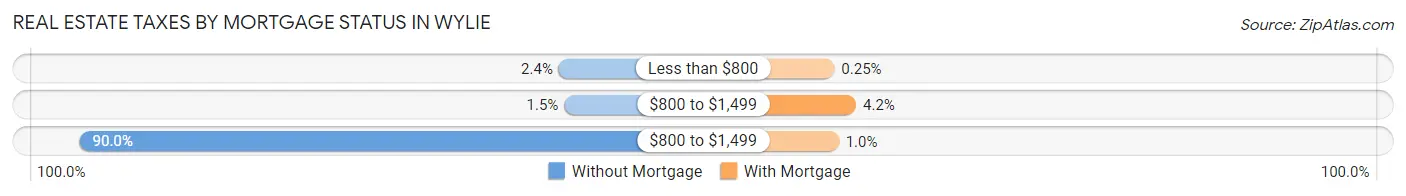
| Property Taxes | Without Mortgage | With Mortgage |
| Less than $800 | 89 (2.4%) | 26 (0.3%) |
| $800 to $1,499 | 53 (1.5%) | 434 (4.2%) |
| $800 to $1,499 | 3,284 (89.9%) | 106 (1.0%) |
| Total | 3,651 (100.0%) | 10,315 (100.0%) |
Health & Disability in Wylie
Health Insurance Coverage by Age in Wylie
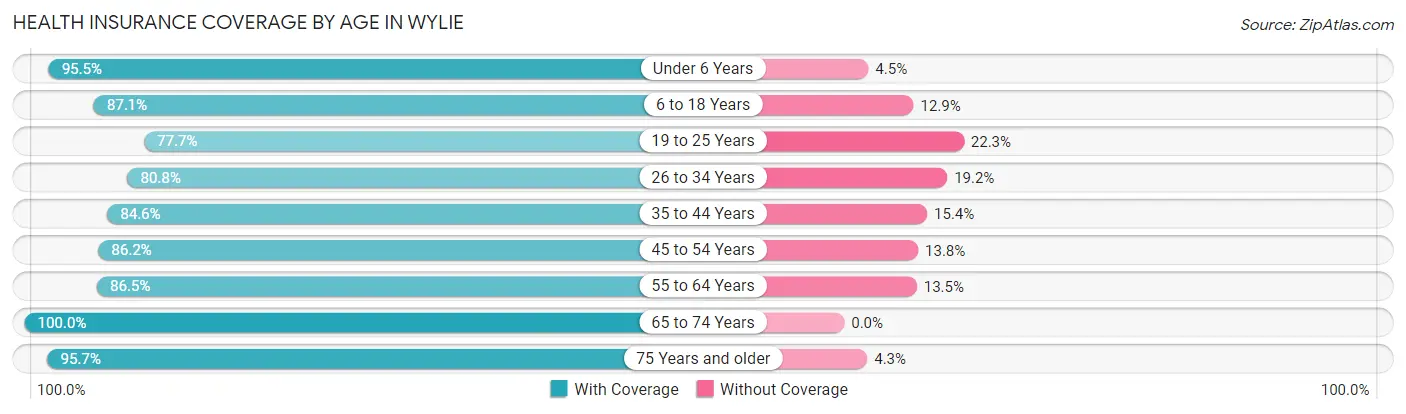
| Age Bracket | With Coverage | Without Coverage |
| Under 6 Years | 4,728 (95.5%) | 223 (4.5%) |
| 6 to 18 Years | 9,810 (87.1%) | 1,455 (12.9%) |
| 19 to 25 Years | 4,380 (77.7%) | 1,257 (22.3%) |
| 26 to 34 Years | 5,613 (80.8%) | 1,333 (19.2%) |
| 35 to 44 Years | 7,877 (84.6%) | 1,438 (15.4%) |
| 45 to 54 Years | 7,862 (86.2%) | 1,256 (13.8%) |
| 55 to 64 Years | 4,356 (86.5%) | 681 (13.5%) |
| 65 to 74 Years | 3,016 (100.0%) | 0 (0.0%) |
| 75 Years and older | 1,563 (95.7%) | 70 (4.3%) |
| Total | 49,205 (86.5%) | 7,713 (13.6%) |
Health Insurance Coverage by Citizenship Status in Wylie
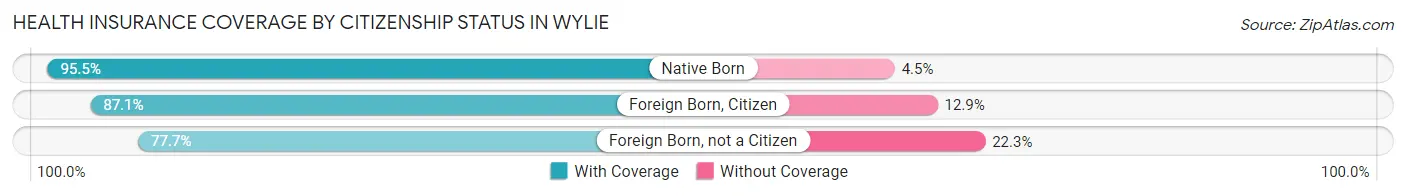
| Citizenship Status | With Coverage | Without Coverage |
| Native Born | 4,728 (95.5%) | 223 (4.5%) |
| Foreign Born, Citizen | 9,810 (87.1%) | 1,455 (12.9%) |
| Foreign Born, not a Citizen | 4,380 (77.7%) | 1,257 (22.3%) |
Health Insurance Coverage by Household Income in Wylie
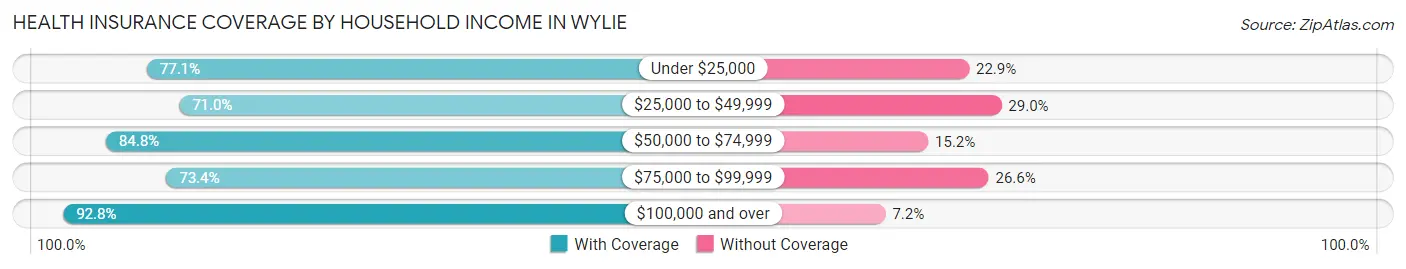
| Household Income | With Coverage | Without Coverage |
| Under $25,000 | 1,682 (77.1%) | 500 (22.9%) |
| $25,000 to $49,999 | 3,599 (71.0%) | 1,468 (29.0%) |
| $50,000 to $74,999 | 5,885 (84.8%) | 1,058 (15.2%) |
| $75,000 to $99,999 | 6,065 (73.4%) | 2,193 (26.6%) |
| $100,000 and over | 31,974 (92.8%) | 2,494 (7.2%) |
Public vs Private Health Insurance Coverage by Age in Wylie
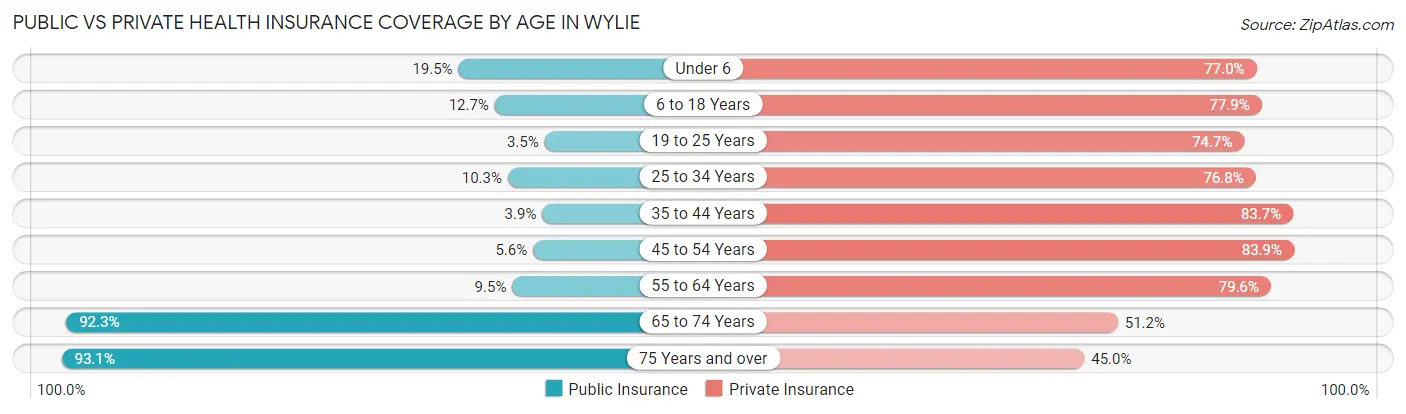
| Age Bracket | Public Insurance | Private Insurance |
| Under 6 | 964 (19.5%) | 3,810 (76.9%) |
| 6 to 18 Years | 1,435 (12.7%) | 8,775 (77.9%) |
| 19 to 25 Years | 197 (3.5%) | 4,210 (74.7%) |
| 25 to 34 Years | 716 (10.3%) | 5,333 (76.8%) |
| 35 to 44 Years | 365 (3.9%) | 7,800 (83.7%) |
| 45 to 54 Years | 512 (5.6%) | 7,650 (83.9%) |
| 55 to 64 Years | 478 (9.5%) | 4,011 (79.6%) |
| 65 to 74 Years | 2,783 (92.3%) | 1,545 (51.2%) |
| 75 Years and over | 1,521 (93.1%) | 735 (45.0%) |
| Total | 8,971 (15.8%) | 43,869 (77.1%) |
Disability Status by Sex by Age in Wylie
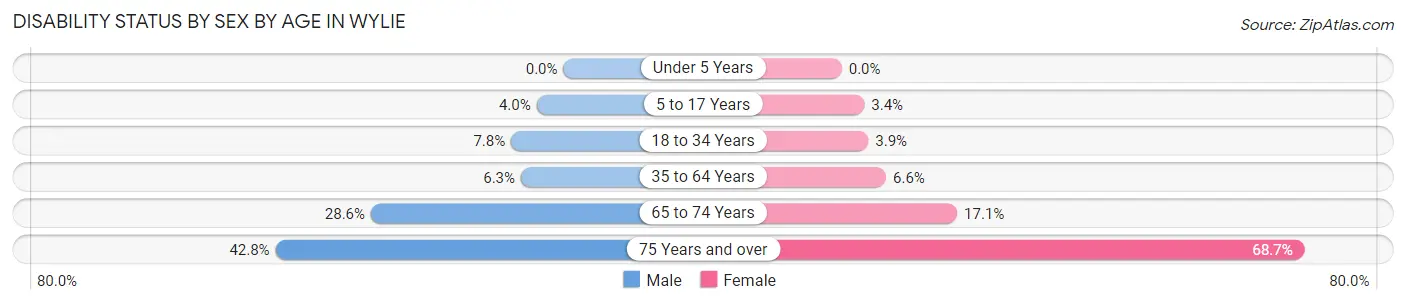
| Age Bracket | Male | Female |
| Under 5 Years | 0 (0.0%) | 0 (0.0%) |
| 5 to 17 Years | 204 (4.0%) | 201 (3.4%) |
| 18 to 34 Years | 533 (7.8%) | 266 (3.9%) |
| 35 to 64 Years | 740 (6.3%) | 773 (6.6%) |
| 65 to 74 Years | 303 (28.6%) | 335 (17.1%) |
| 75 Years and over | 280 (42.7%) | 672 (68.7%) |
Disability Class by Sex by Age in Wylie
Disability Class: Hearing Difficulty
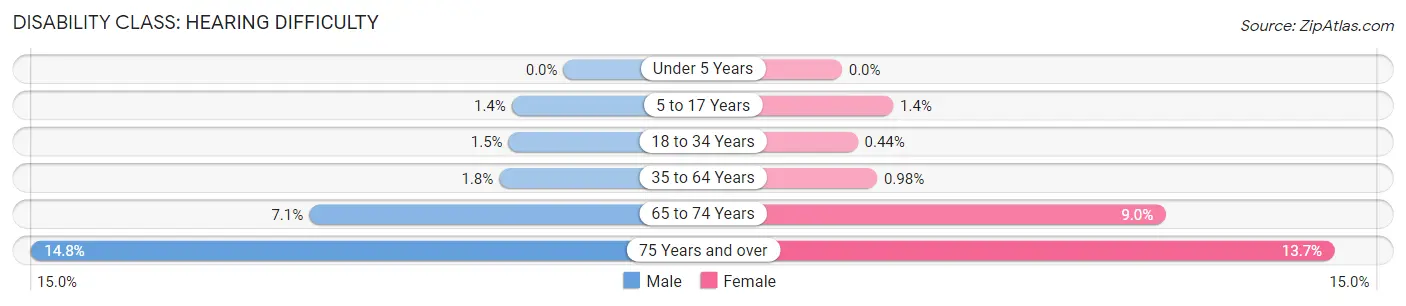
| Age Bracket | Male | Female |
| Under 5 Years | 0 (0.0%) | 0 (0.0%) |
| 5 to 17 Years | 74 (1.4%) | 86 (1.4%) |
| 18 to 34 Years | 105 (1.5%) | 30 (0.4%) |
| 35 to 64 Years | 210 (1.8%) | 115 (1.0%) |
| 65 to 74 Years | 75 (7.1%) | 176 (9.0%) |
| 75 Years and over | 97 (14.8%) | 134 (13.7%) |
Disability Class: Vision Difficulty
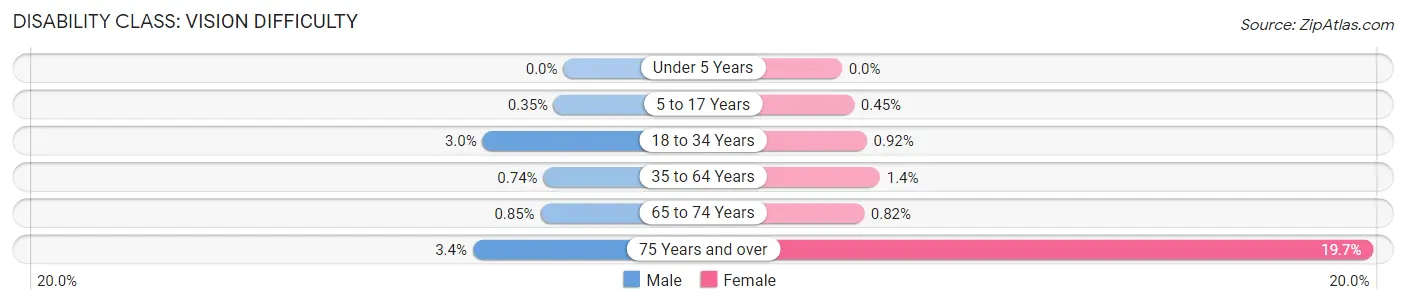
| Age Bracket | Male | Female |
| Under 5 Years | 0 (0.0%) | 0 (0.0%) |
| 5 to 17 Years | 18 (0.4%) | 27 (0.4%) |
| 18 to 34 Years | 206 (3.0%) | 62 (0.9%) |
| 35 to 64 Years | 87 (0.7%) | 166 (1.4%) |
| 65 to 74 Years | 9 (0.9%) | 16 (0.8%) |
| 75 Years and over | 22 (3.4%) | 193 (19.7%) |
Disability Class: Cognitive Difficulty
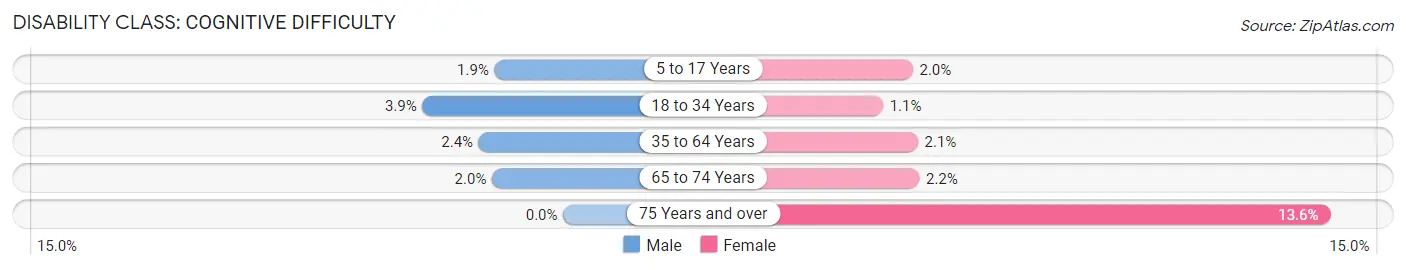
| Age Bracket | Male | Female |
| 5 to 17 Years | 98 (1.9%) | 118 (2.0%) |
| 18 to 34 Years | 269 (3.9%) | 77 (1.1%) |
| 35 to 64 Years | 276 (2.4%) | 248 (2.1%) |
| 65 to 74 Years | 21 (2.0%) | 42 (2.1%) |
| 75 Years and over | 0 (0.0%) | 133 (13.6%) |
Disability Class: Ambulatory Difficulty
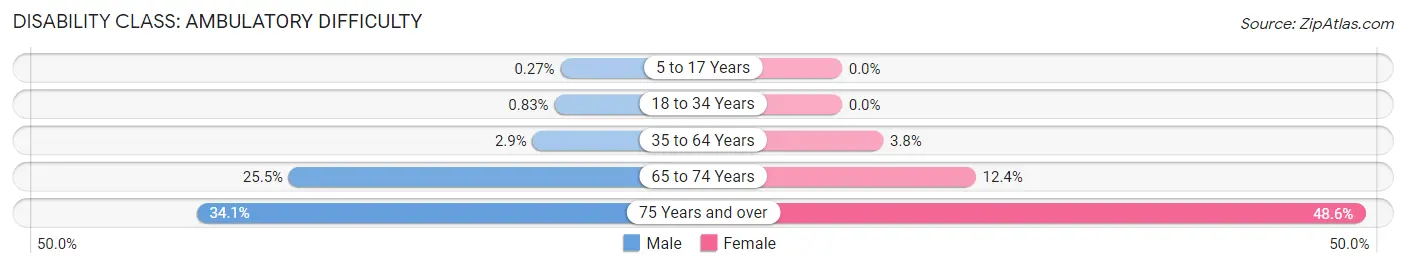
| Age Bracket | Male | Female |
| 5 to 17 Years | 14 (0.3%) | 0 (0.0%) |
| 18 to 34 Years | 57 (0.8%) | 0 (0.0%) |
| 35 to 64 Years | 335 (2.9%) | 450 (3.8%) |
| 65 to 74 Years | 270 (25.5%) | 243 (12.4%) |
| 75 Years and over | 223 (34.1%) | 475 (48.6%) |
Disability Class: Self-Care Difficulty
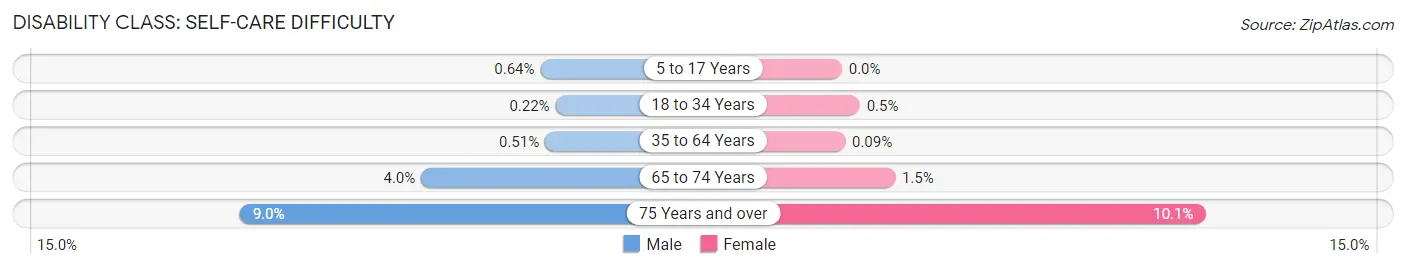
| Age Bracket | Male | Female |
| 5 to 17 Years | 33 (0.6%) | 0 (0.0%) |
| 18 to 34 Years | 15 (0.2%) | 34 (0.5%) |
| 35 to 64 Years | 60 (0.5%) | 10 (0.1%) |
| 65 to 74 Years | 42 (4.0%) | 29 (1.5%) |
| 75 Years and over | 59 (9.0%) | 99 (10.1%) |
Technology Access in Wylie
Computing Device Access in Wylie
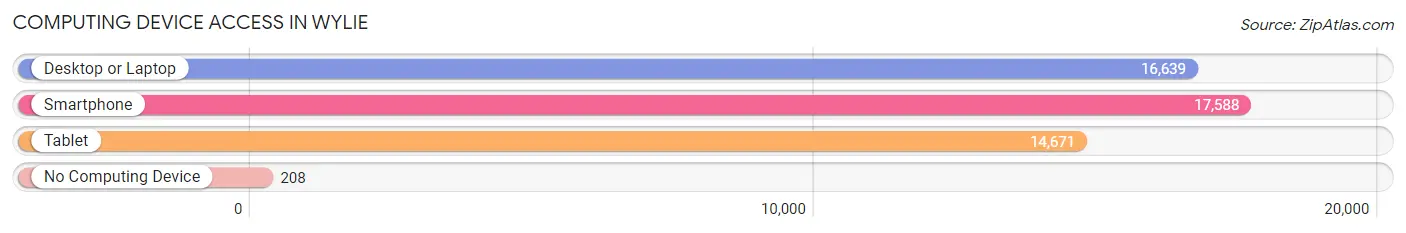
| Device Type | # Households | % Households |
| Desktop or Laptop | 16,639 | 91.3% |
| Smartphone | 17,588 | 96.6% |
| Tablet | 14,671 | 80.5% |
| No Computing Device | 208 | 1.1% |
| Total | 18,217 | 100.0% |
Internet Access in Wylie
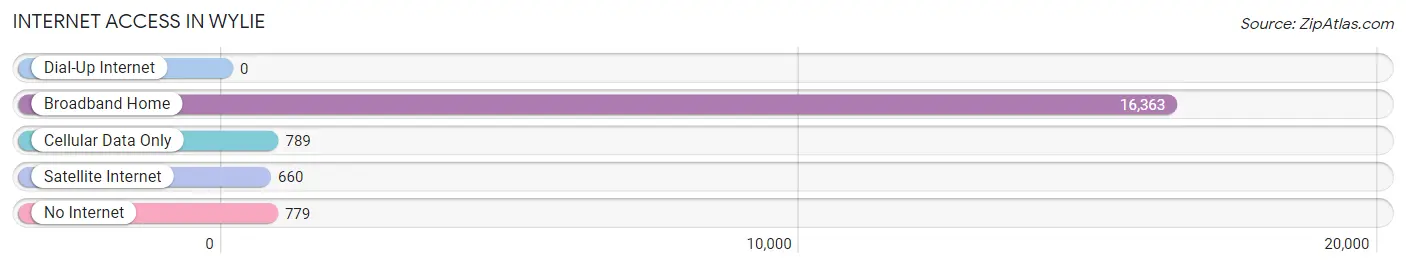
| Internet Type | # Households | % Households |
| Dial-Up Internet | 0 | 0.0% |
| Broadband Home | 16,363 | 89.8% |
| Cellular Data Only | 789 | 4.3% |
| Satellite Internet | 660 | 3.6% |
| No Internet | 779 | 4.3% |
| Total | 18,217 | 100.0% |
Wylie Summary
Wylie, Texas is a city located in Collin and Dallas counties in the state of Texas. It is a suburb of Dallas and is part of the Dallas-Fort Worth-Arlington metropolitan area. The city was founded in 1887 and is named after Colonel William A. Wylie, a veteran of the Texas Revolution. As of the 2010 census, the city had a population of 41,427.
History
The area that is now Wylie was first settled in the 1840s by a group of settlers from Kentucky. The settlement was originally known as Nickelville, named after the local creek. In 1887, the town was renamed Wylie after Colonel William A. Wylie, a veteran of the Texas Revolution. The town was officially incorporated in 1921.
In the early 1900s, Wylie was a small farming community. The town was home to several cotton gins and a few small businesses. In the 1950s, the town began to grow as the Dallas-Fort Worth area began to expand. The population of Wylie increased from 1,000 in 1950 to over 10,000 by the 1980s.
Geography
Wylie is located in Collin and Dallas counties in the state of Texas. It is situated about 25 miles northeast of Dallas and about 20 miles northwest of Plano. The city has a total area of 24.2 square miles, of which 24.1 square miles is land and 0.1 square miles is water.
The city is located in the Blackland Prairie region of Texas, which is characterized by flat terrain and fertile soil. The city is bisected by two major highways, State Highway 78 and State Highway 205.
Economy
The economy of Wylie is largely based on the service industry. The city is home to several large employers, including Walmart, Home Depot, and Lowe’s. The city is also home to several small businesses, including restaurants, retail stores, and professional services.
The city is also home to several industrial parks, which are home to a variety of manufacturing and distribution companies. The city is also home to several corporate headquarters, including those of the Dr Pepper Snapple Group and the American Heart Association.
Demographics
As of the 2010 census, the city had a population of 41,427. The racial makeup of the city was 75.3% White, 11.2% African American, 0.7% Native American, 4.2% Asian, 0.1% Pacific Islander, 5.7% from other races, and 2.9% from two or more races. Hispanic or Latino of any race were 16.3% of the population.
The median income for a household in the city was $63,945, and the median income for a family was $72,945. The per capita income for the city was $27,945. About 5.2% of families and 7.2% of the population were below the poverty line, including 8.3% of those under age 18 and 6.2% of those age 65 or over.
Common Questions
What is Per Capita Income in Wylie?
Per Capita income in Wylie is $40,625.
What is the Median Family Income in Wylie?
Median Family Income in Wylie is $121,473.
What is the Median Household income in Wylie?
Median Household Income in Wylie is $109,465.
What is Income or Wage Gap in Wylie?
Income or Wage Gap in Wylie is 27.9%.
Women in Wylie earn 72.1 cents for every dollar earned by a man.
What is Family Income Deficit in Wylie?
Family Income Deficit in Wylie is $12,532.
Families that are below poverty line in Wylie earn $12,532 less on average than the poverty threshold level.
What is Inequality or Gini Index in Wylie?
Inequality or Gini Index in Wylie is 0.35.
What is the Total Population of Wylie?
Total Population of Wylie is 57,063.
What is the Total Male Population of Wylie?
Total Male Population of Wylie is 27,455.
What is the Total Female Population of Wylie?
Total Female Population of Wylie is 29,608.
What is the Ratio of Males per 100 Females in Wylie?
There are 92.73 Males per 100 Females in Wylie.
What is the Ratio of Females per 100 Males in Wylie?
There are 107.84 Females per 100 Males in Wylie.
What is the Median Population Age in Wylie?
Median Population Age in Wylie is 34.8 Years.
What is the Average Family Size in Wylie
Average Family Size in Wylie is 3.5 People.
What is the Average Household Size in Wylie
Average Household Size in Wylie is 3.1 People.
How Large is the Labor Force in Wylie?
There are 32,731 People in the Labor Forcein in Wylie.
What is the Percentage of People in the Labor Force in Wylie?
74.7% of People are in the Labor Force in Wylie.
What is the Unemployment Rate in Wylie?
Unemployment Rate in Wylie is 3.5%.