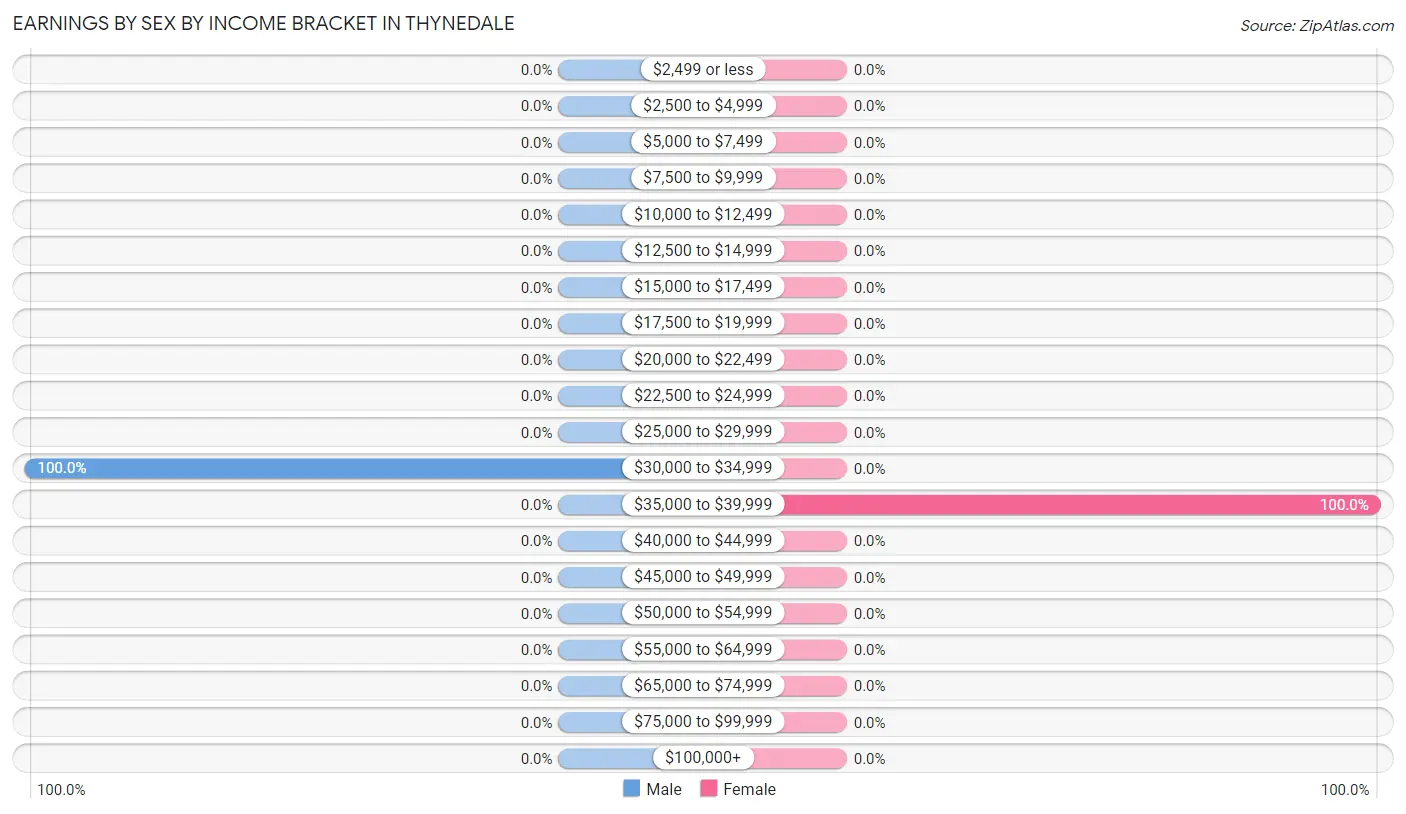
The most common earnings brackets in Thynedale are $30,000 to $34,999 for men (13 | 100.0%) and $35,000 to $39,999 for women (12 | 100.0%).
Income
Male
Female
$2,499 or less
0 (0.0%)
0 (0.0%)
$2,500 to $4,999
0 (0.0%)
0 (0.0%)
$5,000 to $7,499
0 (0.0%)
0 (0.0%)
$7,500 to $9,999
0 (0.0%)
0 (0.0%)
$10,000 to $12,499
0 (0.0%)
0 (0.0%)
$12,500 to $14,999
0 (0.0%)
0 (0.0%)
$15,000 to $17,499
0 (0.0%)
0 (0.0%)
$17,500 to $19,999
0 (0.0%)
0 (0.0%)
$20,000 to $22,499
0 (0.0%)
0 (0.0%)
$22,500 to $24,999
0 (0.0%)
0 (0.0%)
$25,000 to $29,999
0 (0.0%)
0 (0.0%)
$30,000 to $34,999
13 (100.0%)
0 (0.0%)
$35,000 to $39,999
0 (0.0%)
12 (100.0%)
$40,000 to $44,999
0 (0.0%)
0 (0.0%)
$45,000 to $49,999
0 (0.0%)
0 (0.0%)
$50,000 to $54,999
0 (0.0%)
0 (0.0%)
$55,000 to $64,999
0 (0.0%)
0 (0.0%)
$65,000 to $74,999
0 (0.0%)
0 (0.0%)
$75,000 to $99,999
0 (0.0%)
0 (0.0%)
$100,000+
0 (0.0%)
0 (0.0%)
Total
13 (100.0%)
12 (100.0%)
Earnings by Sex by Educational Attainment in Thynedale
Educational Attainment
Male Income
Female Income
Less than High School
-
-
High School Diploma
-
-
College or Associate's Degree
-
-
Bachelor's Degree
-
-
Graduate Degree
-
-
Total
-
-
Family Income in Thynedale
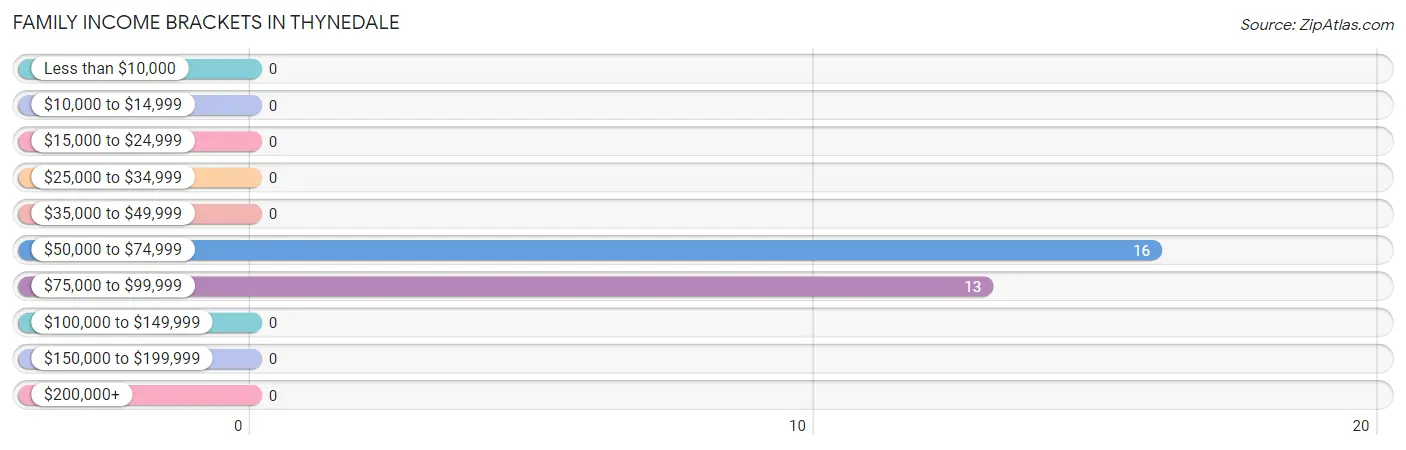
Family Income Brackets in Thynedale
According to the Thynedale family income data, there are 16 families falling into the $50,000 to $74,999 income range, which is the most common income bracket and makes up 55.2% of all families.
Income Bracket
# Families
% Families
Less than $10,000
0
0.0%
$10,000 to $14,999
0
0.0%
$15,000 to $24,999
0
0.0%
$25,000 to $34,999
0
0.0%
$35,000 to $49,999
0
0.0%
$50,000 to $74,999
16
55.2%
$75,000 to $99,999
13
44.8%
$100,000 to $149,999
0
0.0%
$150,000 to $199,999
0
0.0%
$200,000+
0
0.0%
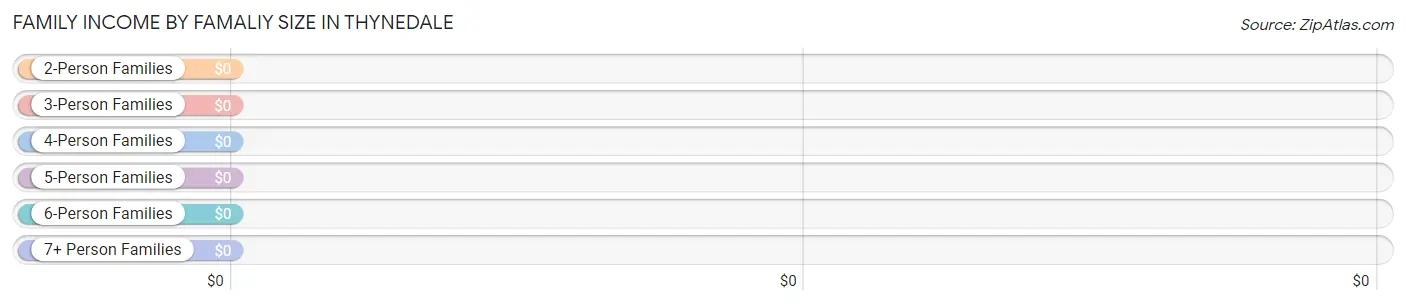
Family Income by Famaliy Size in Thynedale
Income Bracket
# Families
Median Income
2-Person Families
29 (100.0%)
$0
3-Person Families
0 (0.0%)
$0
4-Person Families
0 (0.0%)
$0
5-Person Families
0 (0.0%)
$0
6-Person Families
0 (0.0%)
$0
7+ Person Families
0 (0.0%)
$0
Total
29 (100.0%)
$0
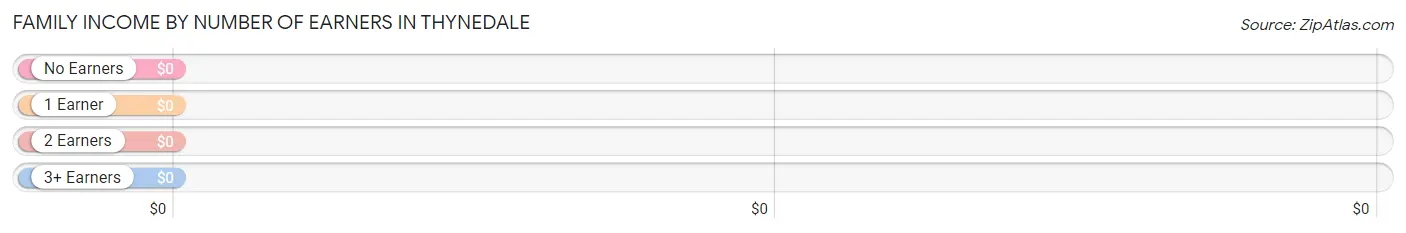
Family Income by Number of Earners in Thynedale
Number of Earners
# Families
Median Income
No Earners
16 (55.2%)
$0
1 Earner
0 (0.0%)
$0
2 Earners
13 (44.8%)
$0
3+ Earners
0 (0.0%)
$0
Total
29 (100.0%)
$0
Household Income in Thynedale
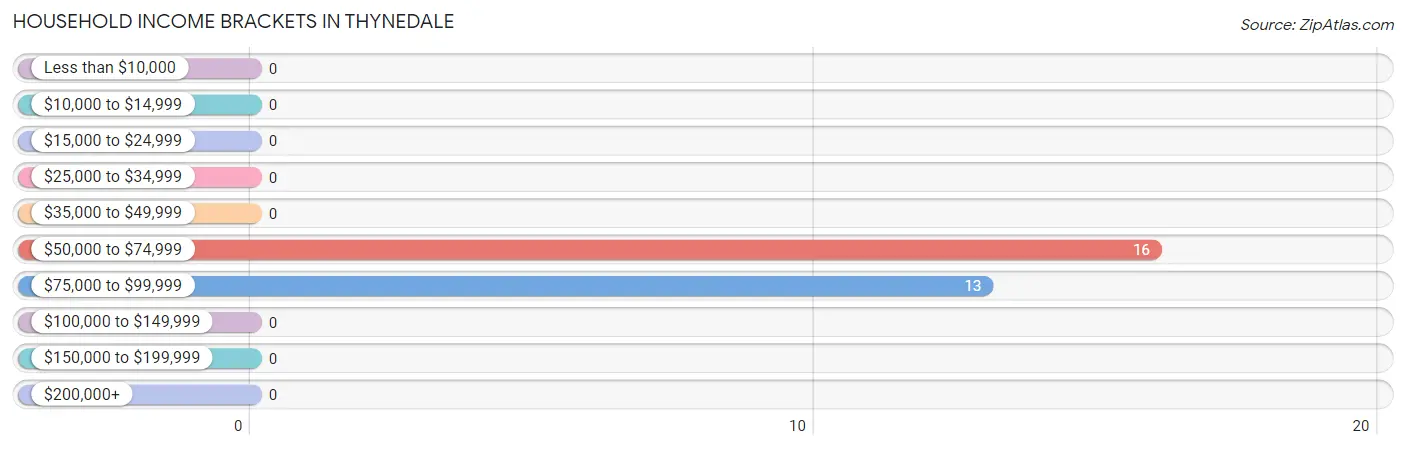
Household Income Brackets in Thynedale
With 16 households falling in the category, the $50,000 to $74,999 income range is the most frequent in Thynedale, accounting for 55.2% of all households.
Income Bracket
# Households
% Households
Less than $10,000
0
0.0%
$10,000 to $14,999
0
0.0%
$15,000 to $24,999
0
0.0%
$25,000 to $34,999
0
0.0%
$35,000 to $49,999
0
0.0%
$50,000 to $74,999
16
55.2%
$75,000 to $99,999
13
44.8%
$100,000 to $149,999
0
0.0%
$150,000 to $199,999
0
0.0%
$200,000+
0
0.0%
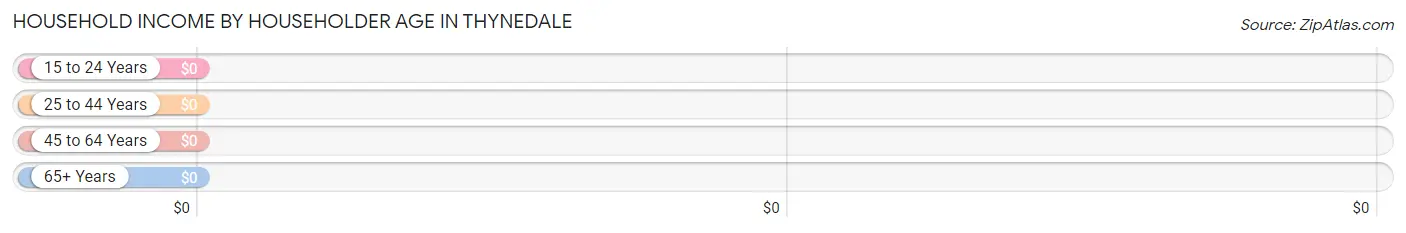
Household Income by Householder Age in Thynedale
Income Bracket
# Households
Median Income
15 to 24 Years
0 (0.0%)
$0
25 to 44 Years
0 (0.0%)
$0
45 to 64 Years
13 (44.8%)
$0
65+ Years
16 (55.2%)
$0
Total
29 (100.0%)
$0
Poverty in Thynedale
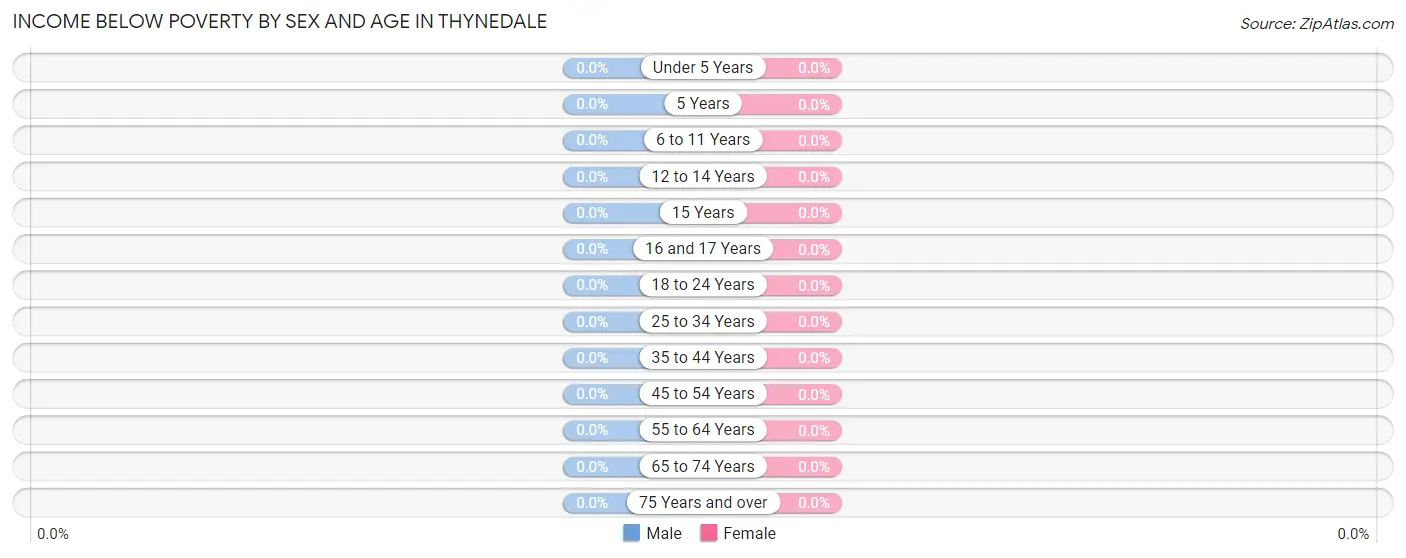
Income Below Poverty by Sex and Age in Thynedale
Age Bracket
Male
Female
Under 5 Years
0 (0.0%)
0 (0.0%)
5 Years
0 (0.0%)
0 (0.0%)
6 to 11 Years
0 (0.0%)
0 (0.0%)
12 to 14 Years
0 (0.0%)
0 (0.0%)
15 Years
0 (0.0%)
0 (0.0%)
16 and 17 Years
0 (0.0%)
0 (0.0%)
18 to 24 Years
0 (0.0%)
0 (0.0%)
25 to 34 Years
0 (0.0%)
0 (0.0%)
35 to 44 Years
0 (0.0%)
0 (0.0%)
45 to 54 Years
0 (0.0%)
0 (0.0%)
55 to 64 Years
0 (0.0%)
0 (0.0%)
65 to 74 Years
0 (0.0%)
0 (0.0%)
75 Years and over
0 (0.0%)
0 (0.0%)
Total
0 (0.0%)
0 (0.0%)
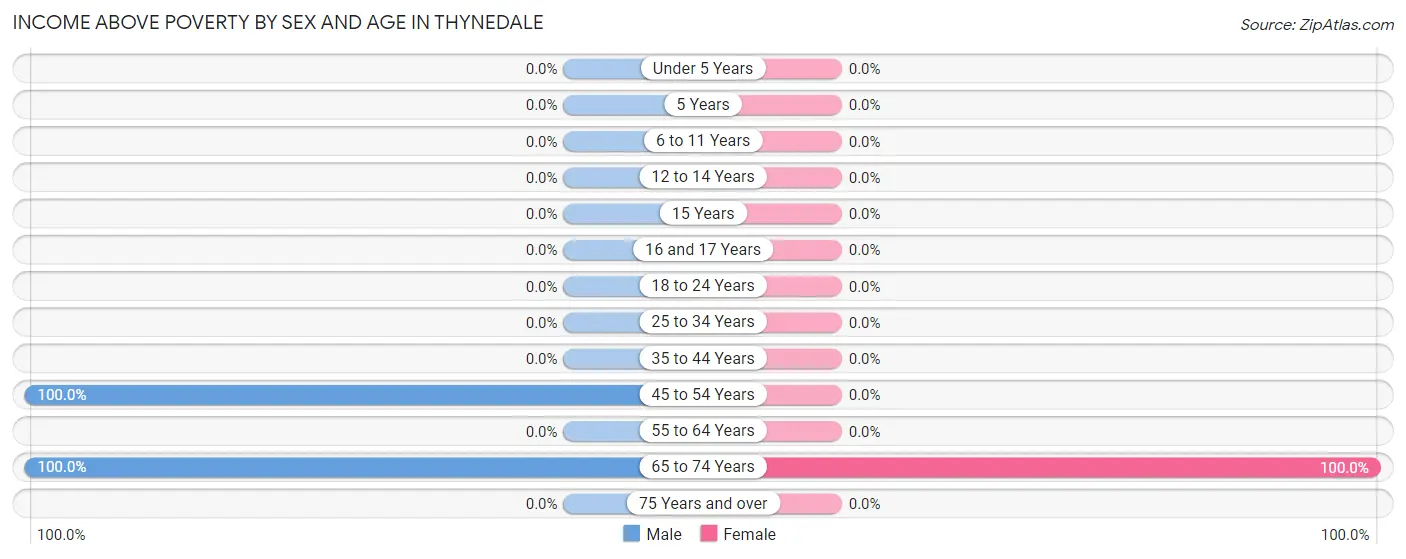
Income Above Poverty by Sex and Age in Thynedale
According to the poverty statistics in Thynedale, males aged 45 to 54 years and females aged 65 to 74 years are the age groups that are most secure financially, with 100.0% of males and 100.0% of females in these age groups living above the poverty line.
Age Bracket
Male
Female
Under 5 Years
0 (0.0%)
0 (0.0%)
5 Years
0 (0.0%)
0 (0.0%)
6 to 11 Years
0 (0.0%)
0 (0.0%)
12 to 14 Years
0 (0.0%)
0 (0.0%)
15 Years
0 (0.0%)
0 (0.0%)
16 and 17 Years
0 (0.0%)
0 (0.0%)
18 to 24 Years
0 (0.0%)
0 (0.0%)
25 to 34 Years
0 (0.0%)
0 (0.0%)
35 to 44 Years
0 (0.0%)
0 (0.0%)
45 to 54 Years
13 (100.0%)
0 (0.0%)
55 to 64 Years
0 (0.0%)
0 (0.0%)
65 to 74 Years
16 (100.0%)
24 (100.0%)
75 Years and over
0 (0.0%)
0 (0.0%)
Total
29 (100.0%)
24 (100.0%)
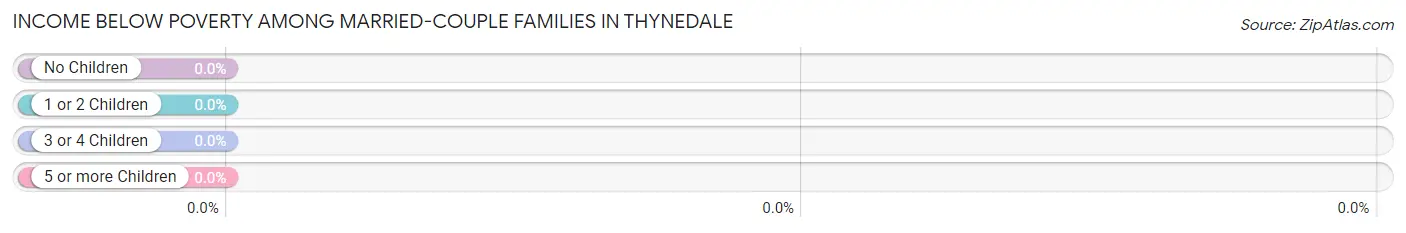
Income Below Poverty Among Married-Couple Families in Thynedale
Children
Above Poverty
Below Poverty
No Children
16 (100.0%)
0 (0.0%)
1 or 2 Children
0 (0.0%)
0 (0.0%)
3 or 4 Children
0 (0.0%)
0 (0.0%)
5 or more Children
0 (0.0%)
0 (0.0%)
Total
16 (100.0%)
0 (0.0%)
Income Below Poverty Among Single-Parent Households in Thynedale
Children
Single Father
Single Mother
No Children
0 (0.0%)
0 (0.0%)
1 or 2 Children
0 (0.0%)
0 (0.0%)
3 or 4 Children
0 (0.0%)
0 (0.0%)
5 or more Children
0 (0.0%)
0 (0.0%)
Total
0 (0.0%)
0 (0.0%)
Income Below Poverty Among Married-Couple vs Single-Parent Households in Thynedale
Children
Married-Couple Families
Single-Parent Households
No Children
0 (0.0%)
0 (0.0%)
1 or 2 Children
0 (0.0%)
0 (0.0%)
3 or 4 Children
0 (0.0%)
0 (0.0%)
5 or more Children
0 (0.0%)
0 (0.0%)
Total
0 (0.0%)
0 (0.0%)
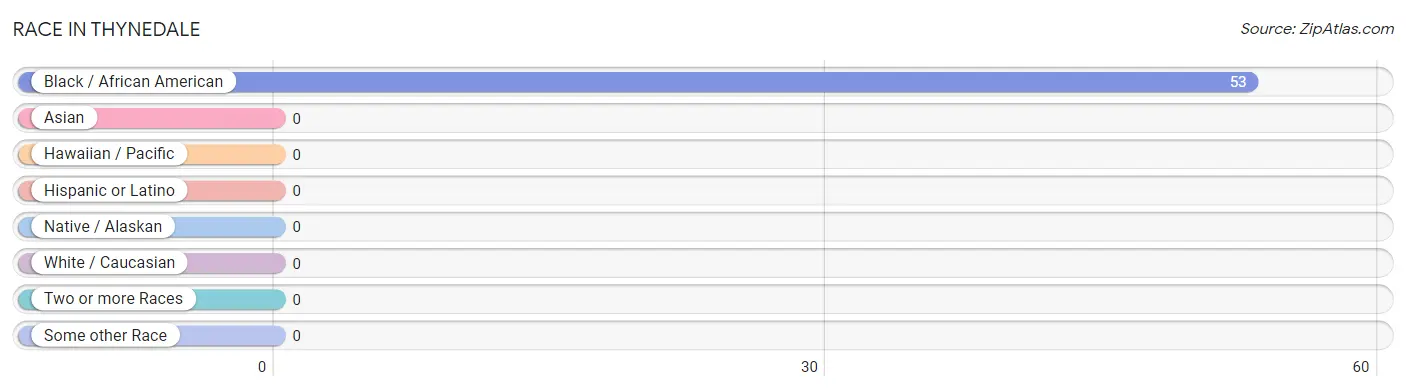
Race in Thynedale
The most populous races in Thynedale are , and Black / African American (53 | 100.0%).
Race
# Population
% Population
Asian
0
0.0%
Black / African American
53
100.0%
Hawaiian / Pacific
0
0.0%
Hispanic or Latino
0
0.0%
Native / Alaskan
0
0.0%
White / Caucasian
0
0.0%
Two or more Races
0
0.0%
Some other Race
0
0.0%
Total
53
100.0%
Ancestry in Thynedale
The most populous ancestries reported in Thynedale are , and American (28 | 52.8%), together accounting for 52.8% of all Thynedale residents.
Ancestry
# Population
% Population
American
28
52.8%
View All 1 Rows
Immigrants in Thynedale
Immigration Origin
# Population
% Population
View All 0 Rows
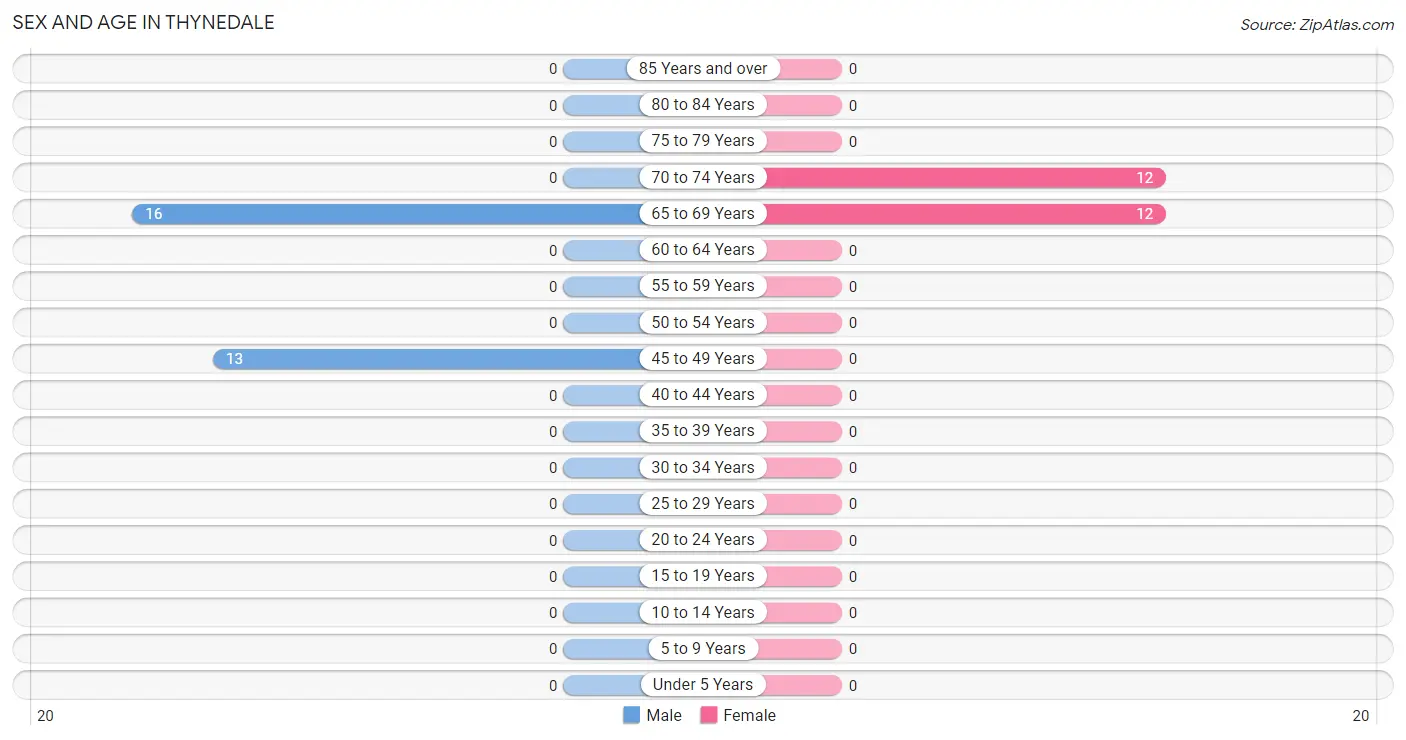
Sex and Age in Thynedale
Sex and Age in Thynedale
The most populous age groups in Thynedale are 65 to 69 Years (16 | 55.2%) for men and 65 to 69 Years (12 | 50.0%) for women.
Age Bracket
Male
Female
Under 5 Years
0 (0.0%)
0 (0.0%)
5 to 9 Years
0 (0.0%)
0 (0.0%)
10 to 14 Years
0 (0.0%)
0 (0.0%)
15 to 19 Years
0 (0.0%)
0 (0.0%)
20 to 24 Years
0 (0.0%)
0 (0.0%)
25 to 29 Years
0 (0.0%)
0 (0.0%)
30 to 34 Years
0 (0.0%)
0 (0.0%)
35 to 39 Years
0 (0.0%)
0 (0.0%)
40 to 44 Years
0 (0.0%)
0 (0.0%)
45 to 49 Years
13 (44.8%)
0 (0.0%)
50 to 54 Years
0 (0.0%)
0 (0.0%)
55 to 59 Years
0 (0.0%)
0 (0.0%)
60 to 64 Years
0 (0.0%)
0 (0.0%)
65 to 69 Years
16 (55.2%)
12 (50.0%)
70 to 74 Years
0 (0.0%)
12 (50.0%)
75 to 79 Years
0 (0.0%)
0 (0.0%)
80 to 84 Years
0 (0.0%)
0 (0.0%)
85 Years and over
0 (0.0%)
0 (0.0%)
Total
29 (100.0%)
24 (100.0%)
Families and Households in Thynedale
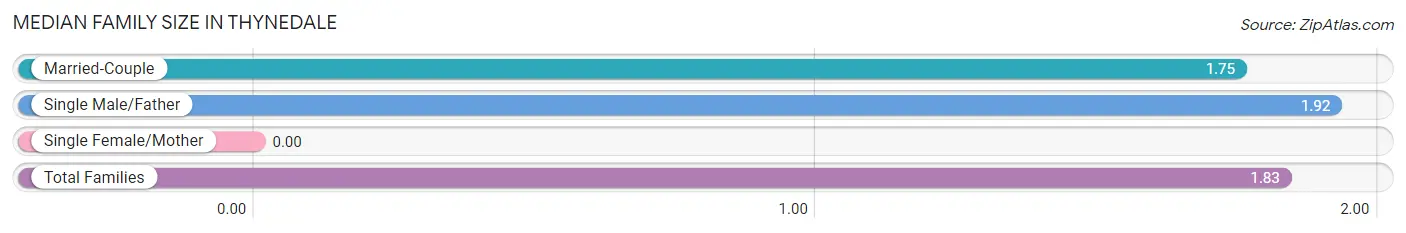
Median Family Size in Thynedale
Family Type
# Families
Family Size
Married-Couple
16 (55.2%)
1.75
Single Male/Father
13 (44.8%)
1.92
Single Female/Mother
0 (0.0%)
-
Total Families
29 (100.0%)
1.83
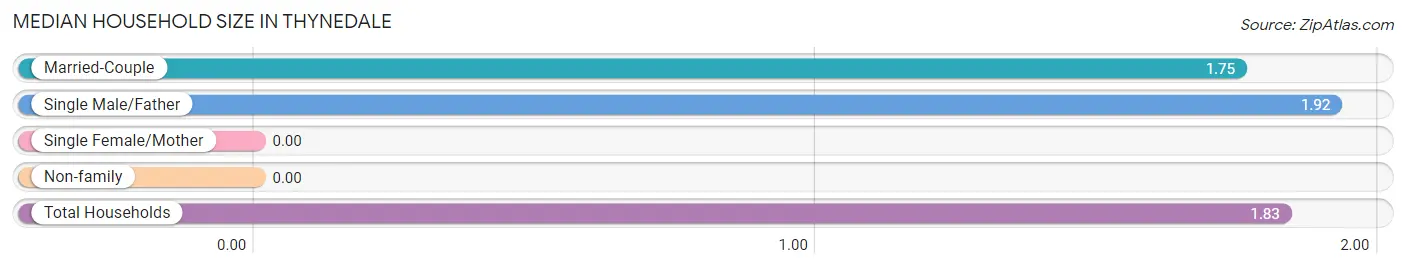
Median Household Size in Thynedale
Household Type
# Households
Household Size
Married-Couple
16 (55.2%)
1.75
Single Male/Father
13 (44.8%)
1.92
Single Female/Mother
0 (0.0%)
-
Non-family
0 (0.0%)
-
Total Households
29 (100.0%)
1.83
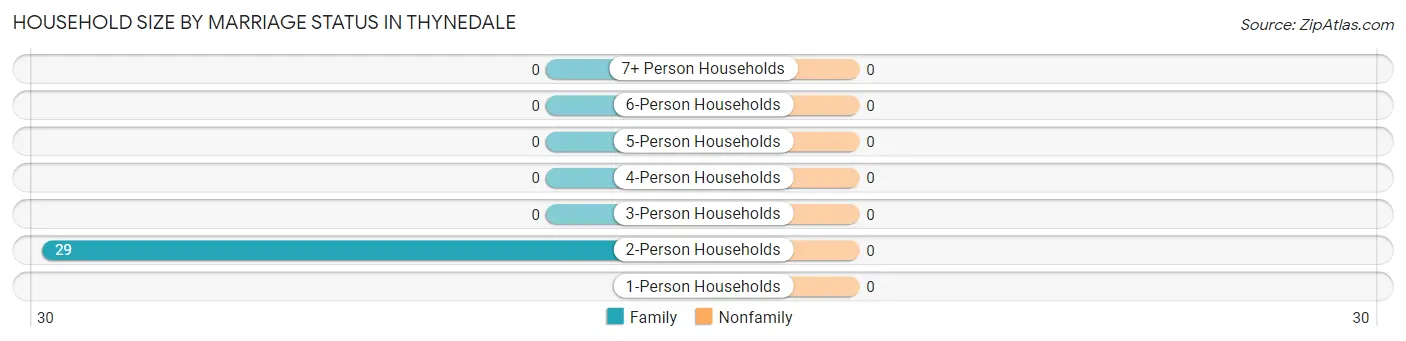
Household Size by Marriage Status in Thynedale
Household Size
Family Households
Nonfamily Households
1-Person Households
-
0 (0.0%)
2-Person Households
29 (100.0%)
0 (0.0%)
3-Person Households
0 (0.0%)
0 (0.0%)
4-Person Households
0 (0.0%)
0 (0.0%)
5-Person Households
0 (0.0%)
0 (0.0%)
6-Person Households
0 (0.0%)
0 (0.0%)
7+ Person Households
0 (0.0%)
0 (0.0%)
Total
29 (100.0%)
0 (0.0%)
Female Fertility in Thynedale
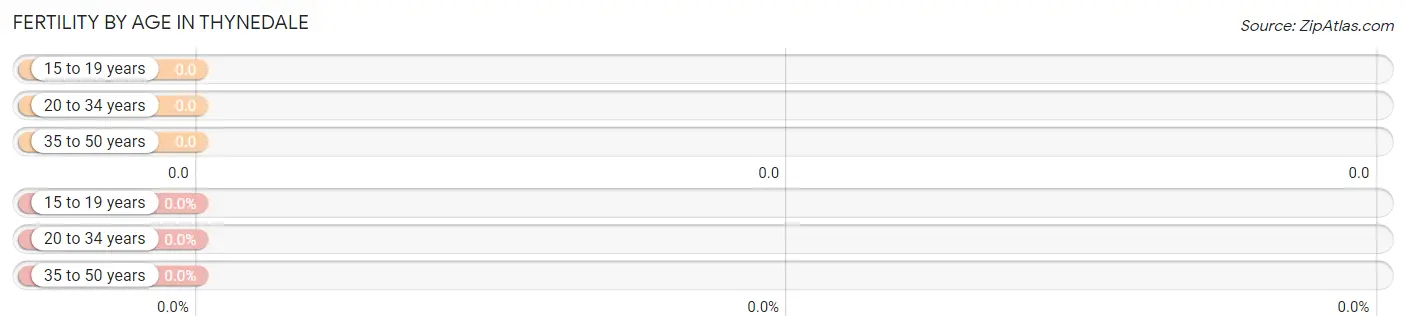
Fertility by Age in Thynedale
Age Bracket
Women with Births
Births / 1,000 Women
15 to 19 years
0 (0.0%)
0.0
20 to 34 years
0 (0.0%)
0.0
35 to 50 years
0 (0.0%)
0.0
Total
0 (0.0%)
0.0
Fertility by Age by Marriage Status in Thynedale
Age Bracket
Married
Unmarried
15 to 19 years
0 (0.0%)
0 (0.0%)
20 to 34 years
0 (0.0%)
0 (0.0%)
35 to 50 years
0 (0.0%)
0 (0.0%)
Total
0 (0.0%)
0 (0.0%)
Fertility by Education in Thynedale
Educational Attainment
Women with Births
Births / 1,000 Women
Less than High School
0 (0.0%)
0.0
High School Diploma
0 (0.0%)
0.0
College or Associate's Degree
0 (0.0%)
0.0
Bachelor's Degree
0 (0.0%)
0.0
Graduate Degree
0 (0.0%)
0.0
Total
0 (0.0%)
0.0
Fertility by Education by Marriage Status in Thynedale
Educational Attainment
Married
Unmarried
Less than High School
0 (0.0%)
0 (0.0%)
High School Diploma
0 (0.0%)
0 (0.0%)
College or Associate's Degree
0 (0.0%)
0 (0.0%)
Bachelor's Degree
0 (0.0%)
0 (0.0%)
Graduate Degree
0 (0.0%)
0 (0.0%)
Total
0 (0.0%)
0 (0.0%)
Employment Characteristics in Thynedale
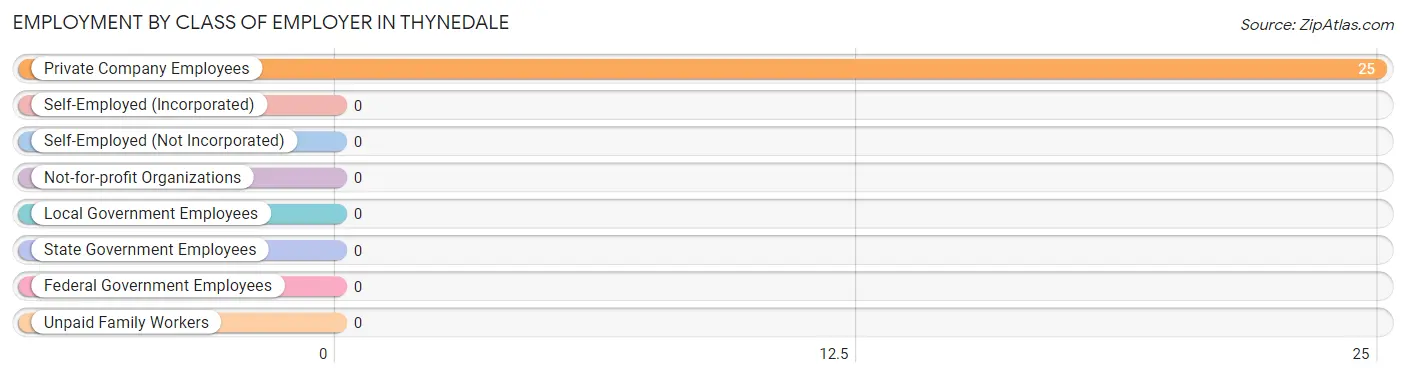
Employment by Class of Employer in Thynedale
Among the 25 employed individuals in Thynedale, , and private company employees (25 | 100.0%) make up the most common classes of employment.
Employer Class
# Employees
% Employees
Private Company Employees
25
100.0%
Self-Employed (Incorporated)
0
0.0%
Self-Employed (Not Incorporated)
0
0.0%
Not-for-profit Organizations
0
0.0%
Local Government Employees
0
0.0%
State Government Employees
0
0.0%
Federal Government Employees
0
0.0%
Unpaid Family Workers
0
0.0%
Total
25
100.0%
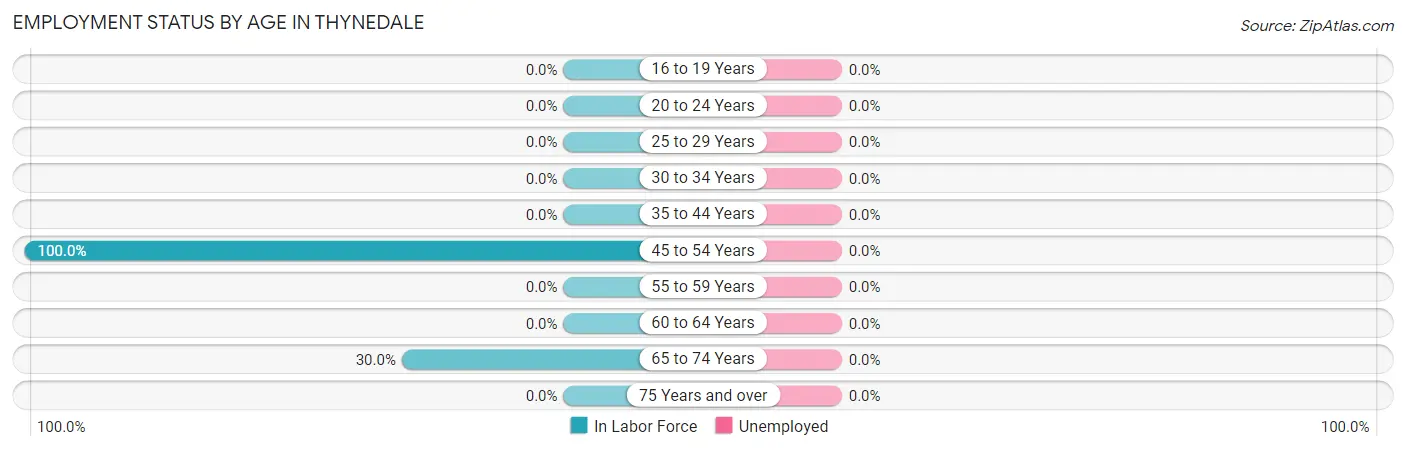
Employment Status by Age in Thynedale
Age Bracket
In Labor Force
Unemployed
16 to 19 Years
0 (0.0%)
0 (0.0%)
20 to 24 Years
0 (0.0%)
0 (0.0%)
25 to 29 Years
0 (0.0%)
0 (0.0%)
30 to 34 Years
0 (0.0%)
0 (0.0%)
35 to 44 Years
0 (0.0%)
0 (0.0%)
45 to 54 Years
13 (100.0%)
0 (0.0%)
55 to 59 Years
0 (0.0%)
0 (0.0%)
60 to 64 Years
0 (0.0%)
0 (0.0%)
65 to 74 Years
12 (30.0%)
0 (0.0%)
75 Years and over
0 (0.0%)
0 (0.0%)
Total
25 (47.2%)
0 (0.0%)
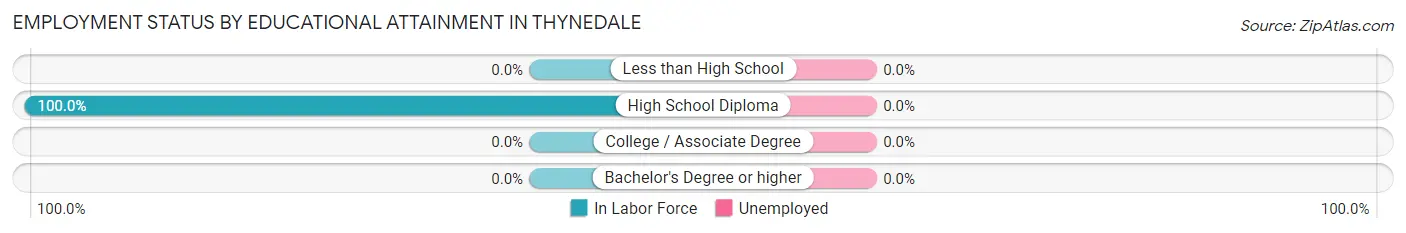
Employment Status by Educational Attainment in Thynedale
Educational Attainment
In Labor Force
Unemployed
Less than High School
0 (0.0%)
0 (0.0%)
High School Diploma
13 (100.0%)
0 (0.0%)
College / Associate Degree
0 (0.0%)
0 (0.0%)
Bachelor's Degree or higher
0 (0.0%)
0 (0.0%)
Total
13 (100.0%)
0 (0.0%)
Employment Occupations by Sex in Thynedale
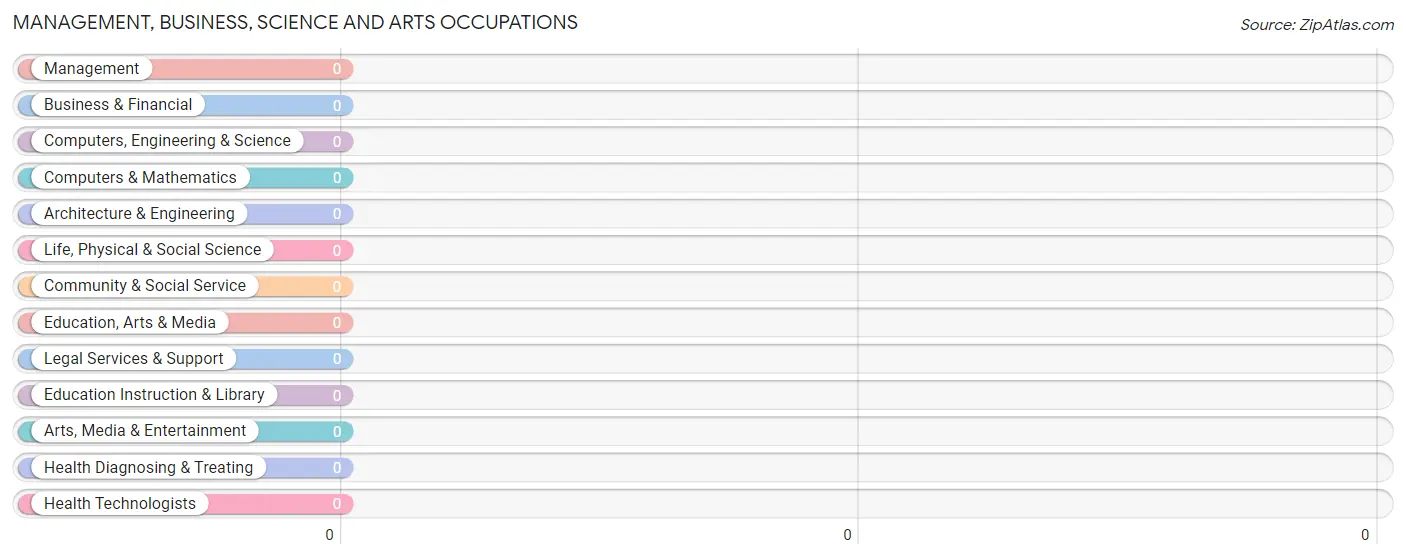
Management, Business, Science and Arts Occupations
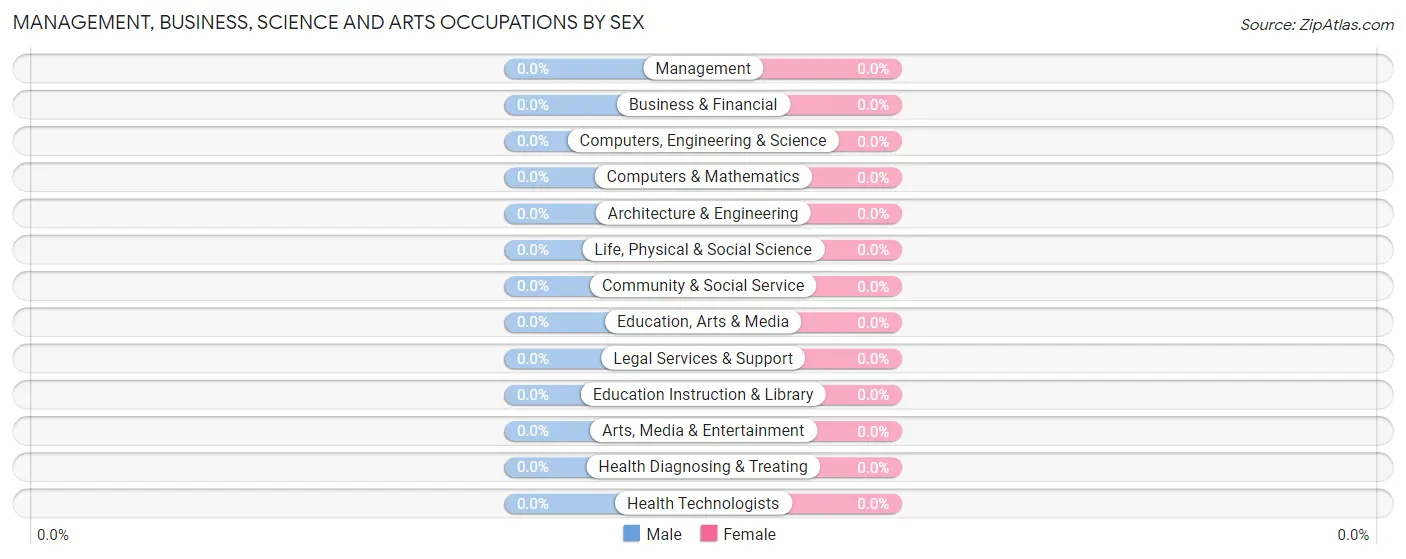
Management, Business, Science and Arts Occupations by Sex
Occupation
Male
Female
Management
0 (0.0%)
0 (0.0%)
Business & Financial
0 (0.0%)
0 (0.0%)
Computers, Engineering & Science
0 (0.0%)
0 (0.0%)
Computers & Mathematics
0 (0.0%)
0 (0.0%)
Architecture & Engineering
0 (0.0%)
0 (0.0%)
Life, Physical & Social Science
0 (0.0%)
0 (0.0%)
Community & Social Service
0 (0.0%)
0 (0.0%)
Education, Arts & Media
0 (0.0%)
0 (0.0%)
Legal Services & Support
0 (0.0%)
0 (0.0%)
Education Instruction & Library
0 (0.0%)
0 (0.0%)
Arts, Media & Entertainment
0 (0.0%)
0 (0.0%)
Health Diagnosing & Treating
0 (0.0%)
0 (0.0%)
Health Technologists
0 (0.0%)
0 (0.0%)
Total (Category)
0 (0.0%)
0 (0.0%)
Total (Overall)
13 (52.0%)
12 (48.0%)
Services Occupations
Services Occupations by Sex
Occupation
Male
Female
Healthcare Support
0 (0.0%)
0 (0.0%)
Security & Protection
0 (0.0%)
0 (0.0%)
Firefighting & Prevention
0 (0.0%)
0 (0.0%)
Law Enforcement
0 (0.0%)
0 (0.0%)
Food Preparation & Serving
0 (0.0%)
0 (0.0%)
Cleaning & Maintenance
0 (0.0%)
0 (0.0%)
Personal Care & Service
0 (0.0%)
0 (0.0%)
Total (Category)
0 (0.0%)
0 (0.0%)
Total (Overall)
13 (52.0%)
12 (48.0%)
Sales and Office Occupations
Sales and Office Occupations by Sex
Occupation
Male
Female
Sales & Related
0 (0.0%)
0 (0.0%)
Office & Administration
0 (0.0%)
0 (0.0%)
Total (Category)
0 (0.0%)
0 (0.0%)
Total (Overall)
13 (52.0%)
12 (48.0%)
Natural Resources, Construction and Maintenance Occupations
Natural Resources, Construction and Maintenance Occupations by Sex
Occupation
Male
Female
Farming, Fishing & Forestry
0 (0.0%)
0 (0.0%)
Construction & Extraction
0 (0.0%)
0 (0.0%)
Installation, Maintenance & Repair
0 (0.0%)
0 (0.0%)
Total (Category)
0 (0.0%)
0 (0.0%)
Total (Overall)
13 (52.0%)
12 (48.0%)
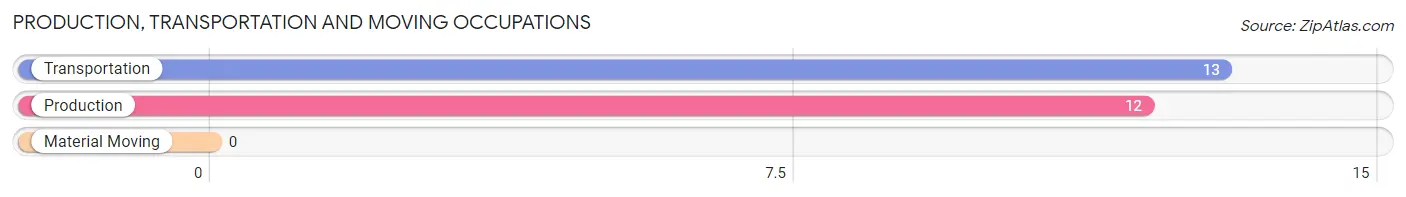
Production, Transportation and Moving Occupations
The most common Production, Transportation and Moving occupations in Thynedale are Transportation (13 | 52.0%), and Production (12 | 48.0%).
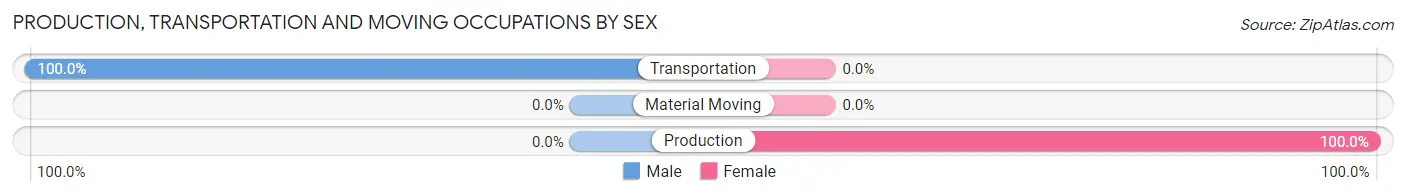
Production, Transportation and Moving Occupations by Sex
Occupation
Male
Female
Production
0 (0.0%)
12 (100.0%)
Transportation
13 (100.0%)
0 (0.0%)
Material Moving
0 (0.0%)
0 (0.0%)
Total (Category)
13 (52.0%)
12 (48.0%)
Total (Overall)
13 (52.0%)
12 (48.0%)
Employment Industries by Sex in Thynedale
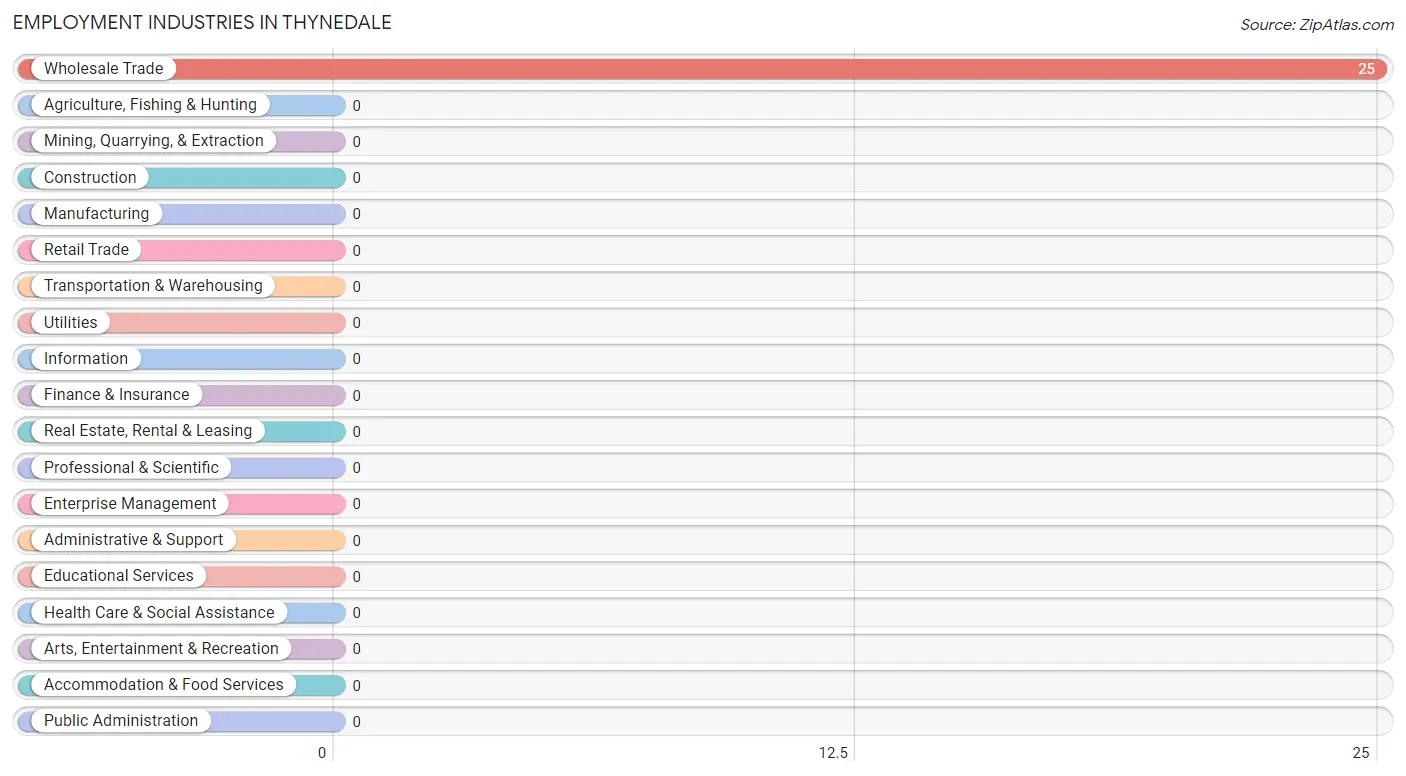
Employment Industries in Thynedale
The major employment industries in Thynedale include , and Wholesale Trade (25 | 100.0%).
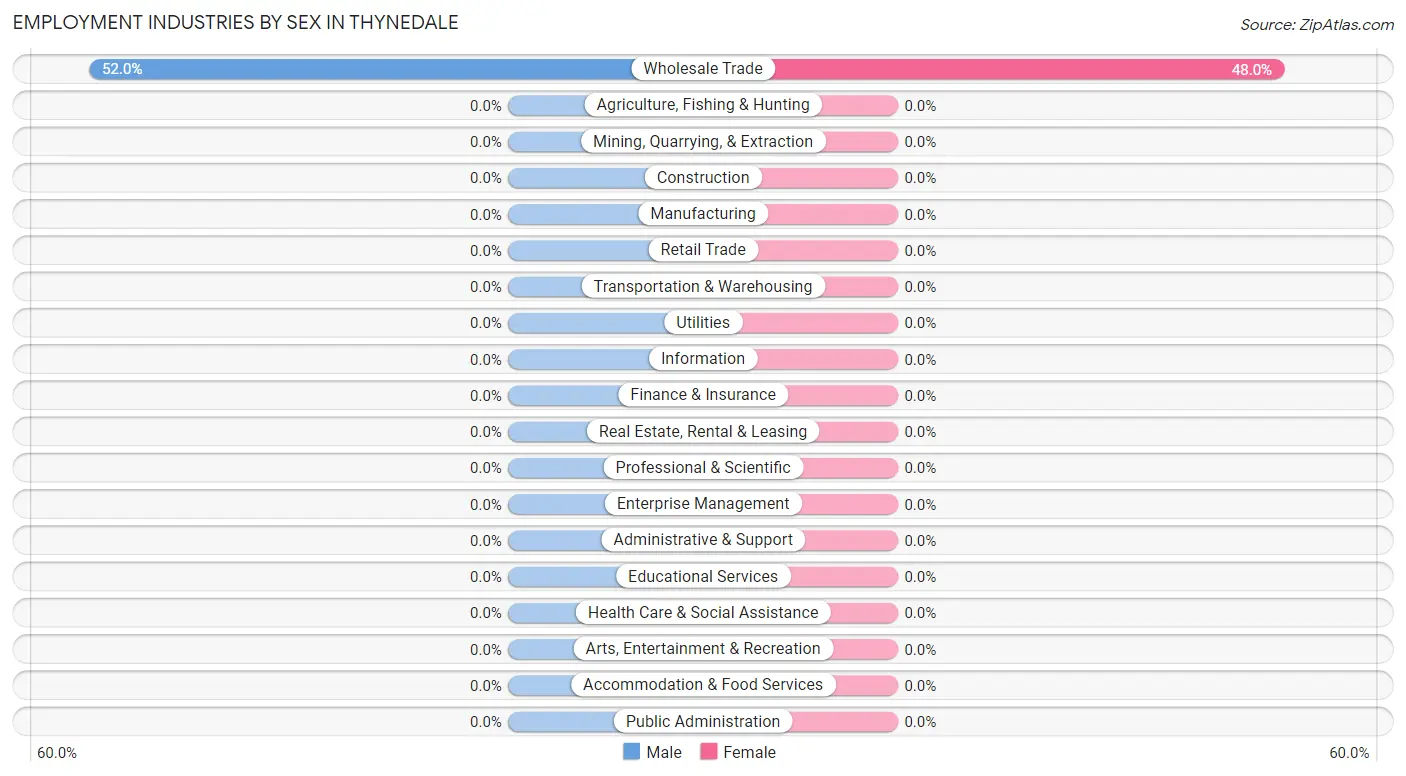
Employment Industries by Sex in Thynedale
Industry
Male
Female
Agriculture, Fishing & Hunting
0 (0.0%)
0 (0.0%)
Mining, Quarrying, & Extraction
0 (0.0%)
0 (0.0%)
Construction
0 (0.0%)
0 (0.0%)
Manufacturing
0 (0.0%)
0 (0.0%)
Wholesale Trade
13 (52.0%)
12 (48.0%)
Retail Trade
0 (0.0%)
0 (0.0%)
Transportation & Warehousing
0 (0.0%)
0 (0.0%)
Utilities
0 (0.0%)
0 (0.0%)
Information
0 (0.0%)
0 (0.0%)
Finance & Insurance
0 (0.0%)
0 (0.0%)
Real Estate, Rental & Leasing
0 (0.0%)
0 (0.0%)
Professional & Scientific
0 (0.0%)
0 (0.0%)
Enterprise Management
0 (0.0%)
0 (0.0%)
Administrative & Support
0 (0.0%)
0 (0.0%)
Educational Services
0 (0.0%)
0 (0.0%)
Health Care & Social Assistance
0 (0.0%)
0 (0.0%)
Arts, Entertainment & Recreation
0 (0.0%)
0 (0.0%)
Accommodation & Food Services
0 (0.0%)
0 (0.0%)
Public Administration
0 (0.0%)
0 (0.0%)
Total
13 (52.0%)
12 (48.0%)
Education in Thynedale
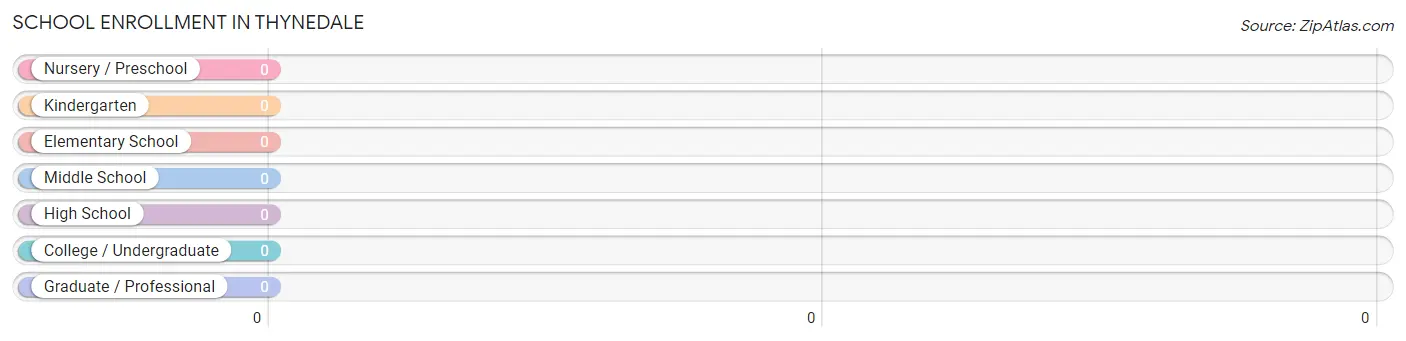
School Enrollment in Thynedale
School Level
# Students
% Students
Nursery / Preschool
0
0.0%
Kindergarten
0
0.0%
Elementary School
0
0.0%
Middle School
0
0.0%
High School
0
0.0%
College / Undergraduate
0
0.0%
Graduate / Professional
0
0.0%
Total
0
0.0%
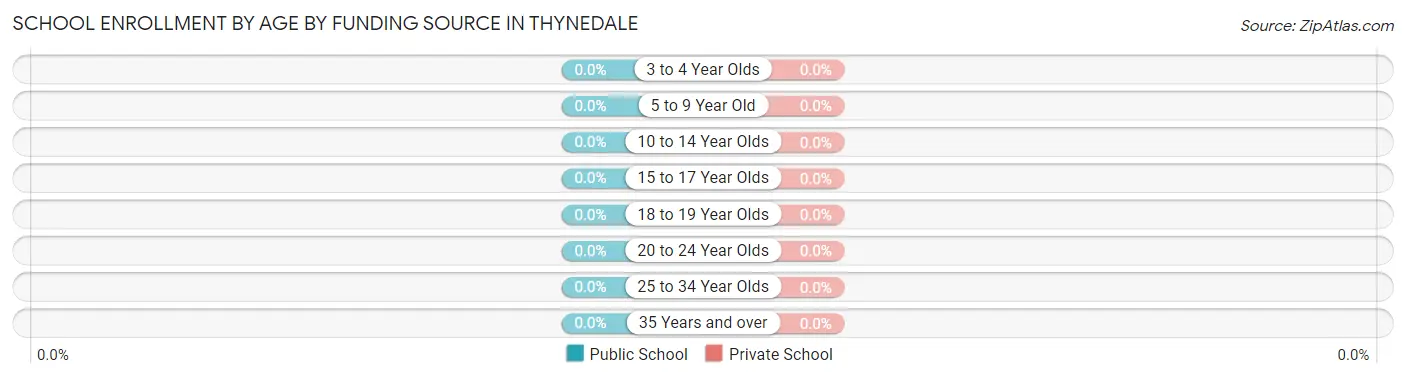
School Enrollment by Age by Funding Source in Thynedale
Age Bracket
Public School
Private School
3 to 4 Year Olds
0 (0.0%)
0 (0.0%)
5 to 9 Year Old
0 (0.0%)
0 (0.0%)
10 to 14 Year Olds
0 (0.0%)
0 (0.0%)
15 to 17 Year Olds
0 (0.0%)
0 (0.0%)
18 to 19 Year Olds
0 (0.0%)
0 (0.0%)
20 to 24 Year Olds
0 (0.0%)
0 (0.0%)
25 to 34 Year Olds
0 (0.0%)
0 (0.0%)
35 Years and over
0 (0.0%)
0 (0.0%)
Total
0 (0.0%)
0 (0.0%)
Educational Attainment by Field of Study in Thynedale
Field of Study
# Graduates
% Graduates
Computers & Mathematics
0
0.0%
Bio, Nature & Agricultural
0
0.0%
Physical & Health Sciences
0
0.0%
Psychology
0
0.0%
Social Sciences
0
0.0%
Engineering
0
0.0%
Multidisciplinary Studies
0
0.0%
Science & Technology
0
0.0%
Business
0
0.0%
Education
0
0.0%
Literature & Languages
0
0.0%
Liberal Arts & History
0
0.0%
Visual & Performing Arts
0
0.0%
Communications
0
0.0%
Arts & Humanities
0
0.0%
Total
0
0.0%
Transportation & Commute in Thynedale
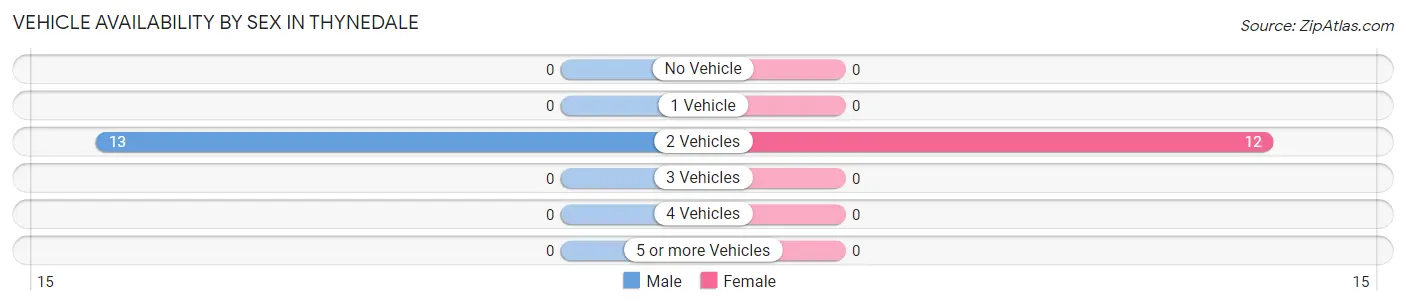
Vehicle Availability by Sex in Thynedale
The most prevalent vehicle ownership categories in Thynedale are males with 2 vehicles (13, accounting for 100.0%) and females with 2 vehicles (12, making up 108.3%).
Vehicles Available
Male
Female
No Vehicle
0 (0.0%)
0 (0.0%)
1 Vehicle
0 (0.0%)
0 (0.0%)
2 Vehicles
13 (100.0%)
12 (100.0%)
3 Vehicles
0 (0.0%)
0 (0.0%)
4 Vehicles
0 (0.0%)
0 (0.0%)
5 or more Vehicles
0 (0.0%)
0 (0.0%)
Total
13 (100.0%)
12 (100.0%)
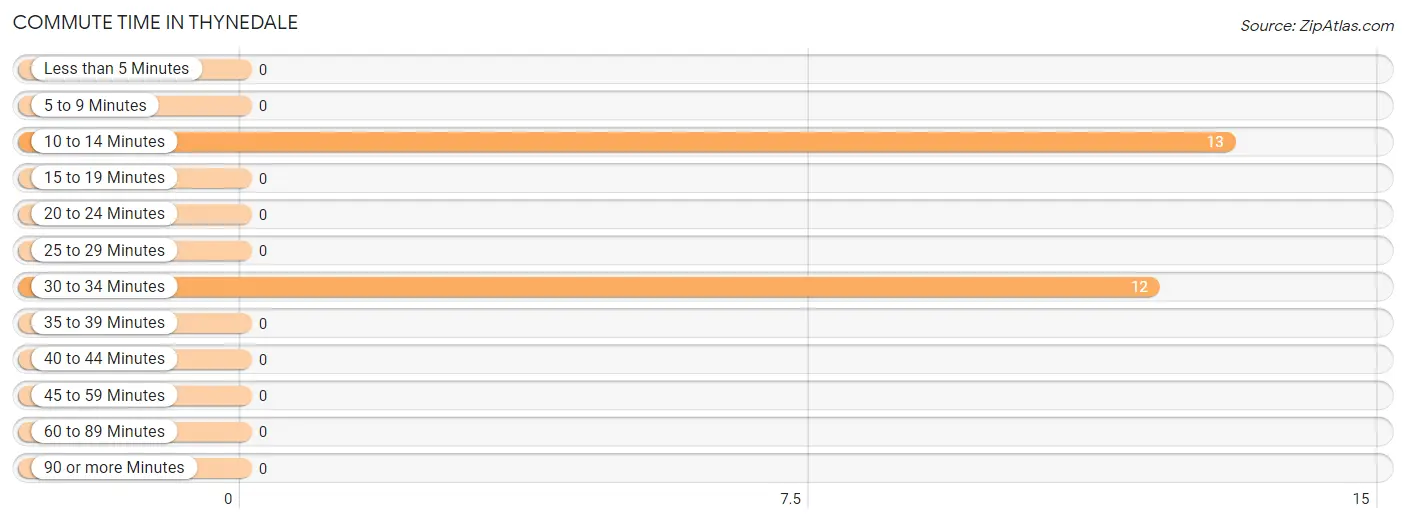
Commute Time in Thynedale
The most frequently occuring commute durations in Thynedale are 10 to 14 minutes (13 commuters, 52.0%), 30 to 34 minutes (12 commuters, 48.0%), and less than 5 minutes (0 commuters, 0.0%).
Commute Time
# Commuters
% Commuters
Less than 5 Minutes
0
0.0%
5 to 9 Minutes
0
0.0%
10 to 14 Minutes
13
52.0%
15 to 19 Minutes
0
0.0%
20 to 24 Minutes
0
0.0%
25 to 29 Minutes
0
0.0%
30 to 34 Minutes
12
48.0%
35 to 39 Minutes
0
0.0%
40 to 44 Minutes
0
0.0%
45 to 59 Minutes
0
0.0%
60 to 89 Minutes
0
0.0%
90 or more Minutes
0
0.0%
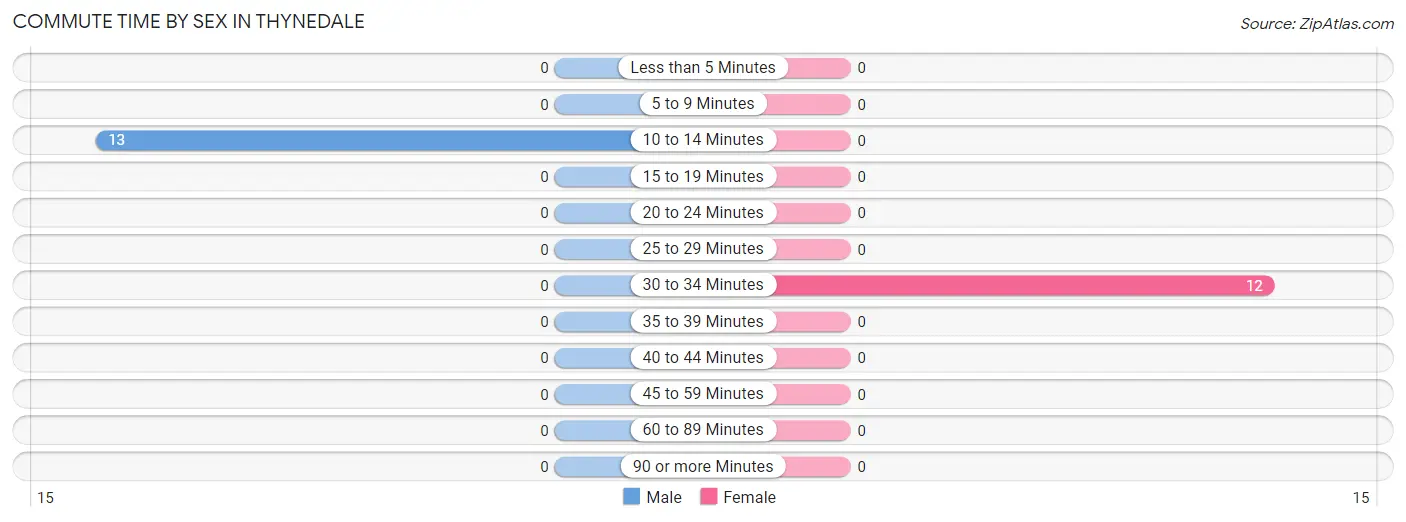
Commute Time by Sex in Thynedale
The most common commute times in Thynedale are 10 to 14 minutes (13 commuters, 100.0%) for males and 30 to 34 minutes (12 commuters, 100.0%) for females.
Commute Time
Male
Female
Less than 5 Minutes
0 (0.0%)
0 (0.0%)
5 to 9 Minutes
0 (0.0%)
0 (0.0%)
10 to 14 Minutes
13 (100.0%)
0 (0.0%)
15 to 19 Minutes
0 (0.0%)
0 (0.0%)
20 to 24 Minutes
0 (0.0%)
0 (0.0%)
25 to 29 Minutes
0 (0.0%)
0 (0.0%)
30 to 34 Minutes
0 (0.0%)
12 (100.0%)
35 to 39 Minutes
0 (0.0%)
0 (0.0%)
40 to 44 Minutes
0 (0.0%)
0 (0.0%)
45 to 59 Minutes
0 (0.0%)
0 (0.0%)
60 to 89 Minutes
0 (0.0%)
0 (0.0%)
90 or more Minutes
0 (0.0%)
0 (0.0%)
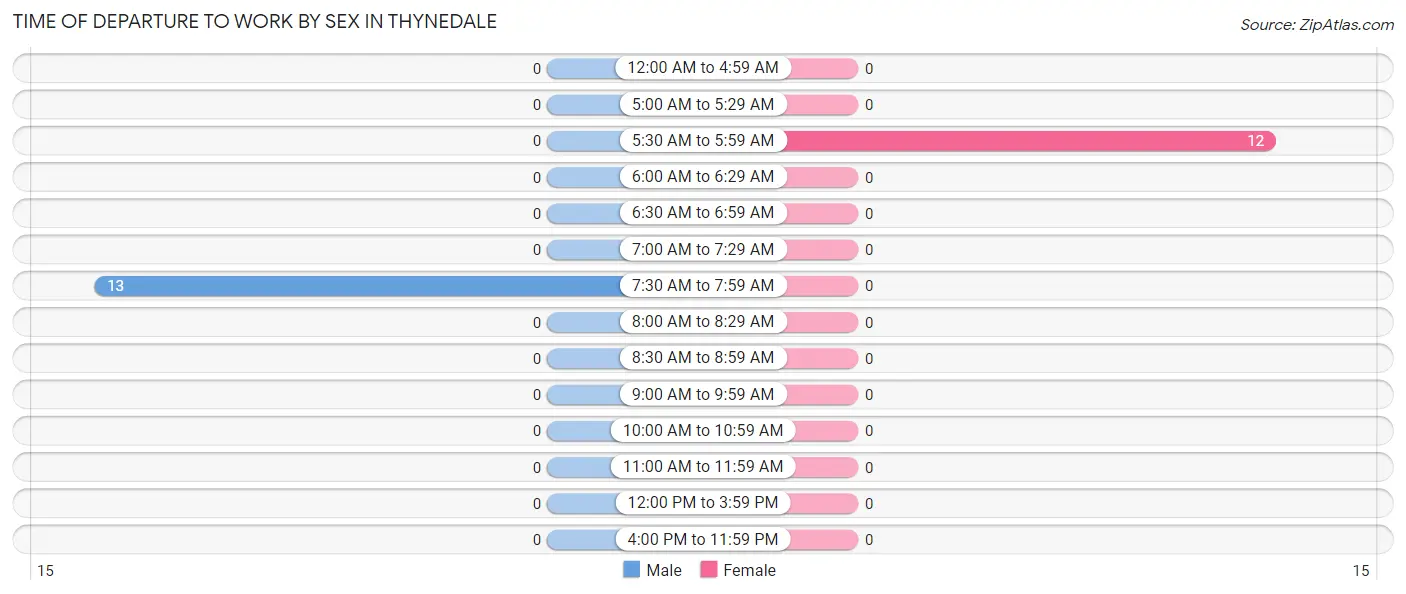
Time of Departure to Work by Sex in Thynedale
The most frequent times of departure to work in Thynedale are 7:30 AM to 7:59 AM (13, 100.0%) for males and 5:30 AM to 5:59 AM (12, 100.0%) for females.
Time of Departure
Male
Female
12:00 AM to 4:59 AM
0 (0.0%)
0 (0.0%)
5:00 AM to 5:29 AM
0 (0.0%)
0 (0.0%)
5:30 AM to 5:59 AM
0 (0.0%)
12 (100.0%)
6:00 AM to 6:29 AM
0 (0.0%)
0 (0.0%)
6:30 AM to 6:59 AM
0 (0.0%)
0 (0.0%)
7:00 AM to 7:29 AM
0 (0.0%)
0 (0.0%)
7:30 AM to 7:59 AM
13 (100.0%)
0 (0.0%)
8:00 AM to 8:29 AM
0 (0.0%)
0 (0.0%)
8:30 AM to 8:59 AM
0 (0.0%)
0 (0.0%)
9:00 AM to 9:59 AM
0 (0.0%)
0 (0.0%)
10:00 AM to 10:59 AM
0 (0.0%)
0 (0.0%)
11:00 AM to 11:59 AM
0 (0.0%)
0 (0.0%)
12:00 PM to 3:59 PM
0 (0.0%)
0 (0.0%)
4:00 PM to 11:59 PM
0 (0.0%)
0 (0.0%)
Total
13 (100.0%)
12 (100.0%)
Housing Occupancy in Thynedale
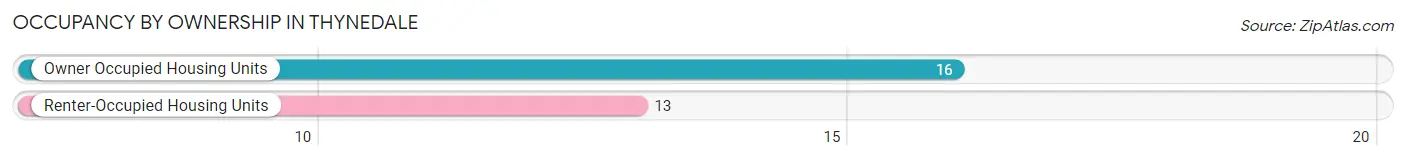
Occupancy by Ownership in Thynedale
Of the total 29 dwellings in Thynedale, owner-occupied units account for 16 (55.2%), while renter-occupied units make up 13 (44.8%).
Occupancy
# Housing Units
% Housing Units
Owner Occupied Housing Units
16
55.2%
Renter-Occupied Housing Units
13
44.8%
Total Occupied Housing Units
29
100.0%
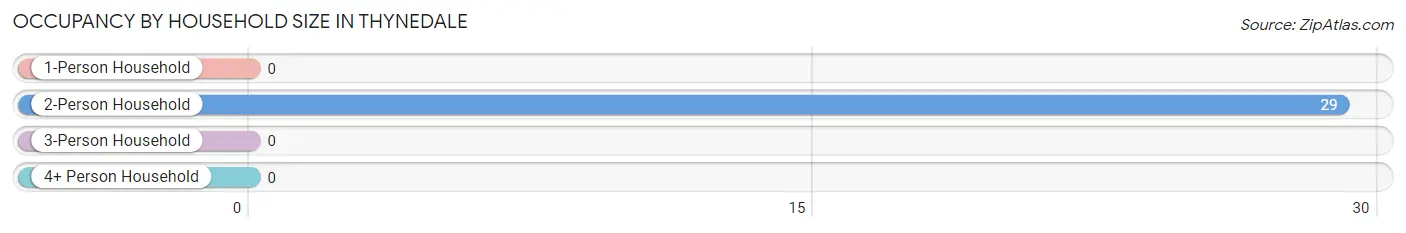
Occupancy by Household Size in Thynedale
Household Size
# Housing Units
% Housing Units
1-Person Household
0
0.0%
2-Person Household
29
100.0%
3-Person Household
0
0.0%
4+ Person Household
0
0.0%
Total Housing Units
29
100.0%
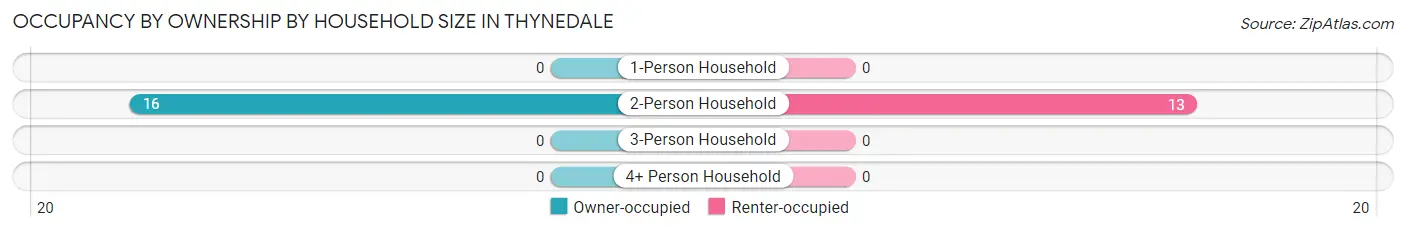
Occupancy by Ownership by Household Size in Thynedale
Household Size
Owner-occupied
Renter-occupied
1-Person Household
0 (0.0%)
0 (0.0%)
2-Person Household
16 (55.2%)
13 (44.8%)
3-Person Household
0 (0.0%)
0 (0.0%)
4+ Person Household
0 (0.0%)
0 (0.0%)
Total Housing Units
16 (55.2%)
13 (44.8%)
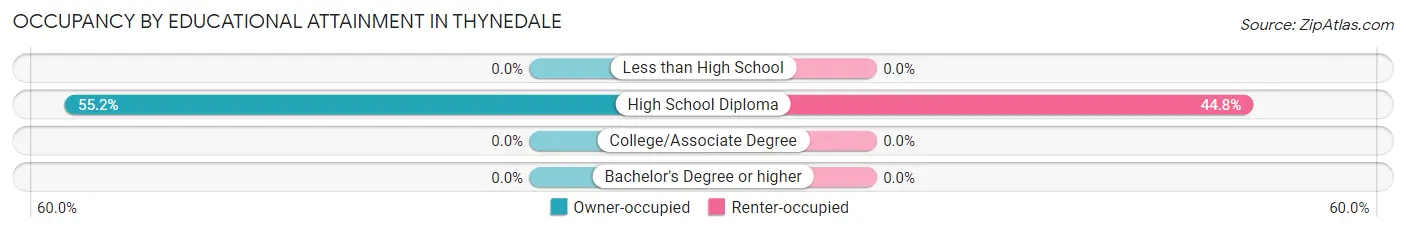
Occupancy by Educational Attainment in Thynedale
Household Size
Owner-occupied
Renter-occupied
Less than High School
0 (0.0%)
0 (0.0%)
High School Diploma
16 (55.2%)
13 (44.8%)
College/Associate Degree
0 (0.0%)
0 (0.0%)
Bachelor's Degree or higher
0 (0.0%)
0 (0.0%)
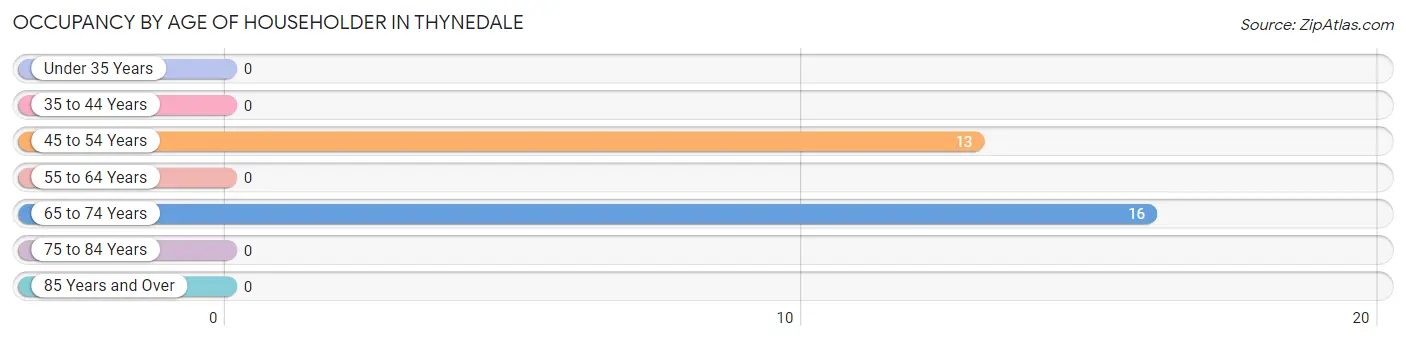
Occupancy by Age of Householder in Thynedale
Age Bracket
# Households
% Households
Under 35 Years
0
0.0%
35 to 44 Years
0
0.0%
45 to 54 Years
13
44.8%
55 to 64 Years
0
0.0%
65 to 74 Years
16
55.2%
75 to 84 Years
0
0.0%
85 Years and Over
0
0.0%
Total
29
100.0%
Housing Finances in Thynedale
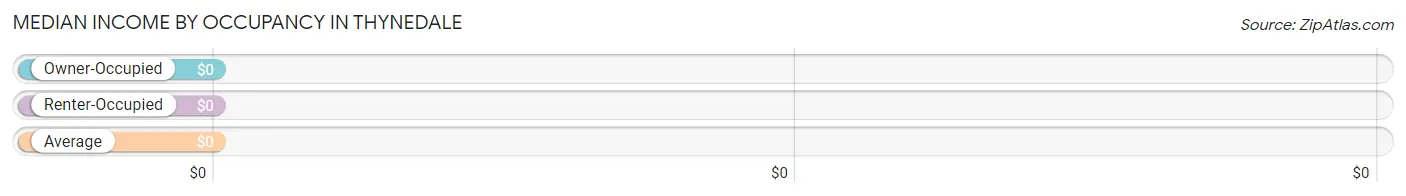
Median Income by Occupancy in Thynedale
Occupancy Type
# Households
Median Income
Owner-Occupied
16 (55.2%)
$0
Renter-Occupied
13 (44.8%)
$0
Average
29 (100.0%)
$0
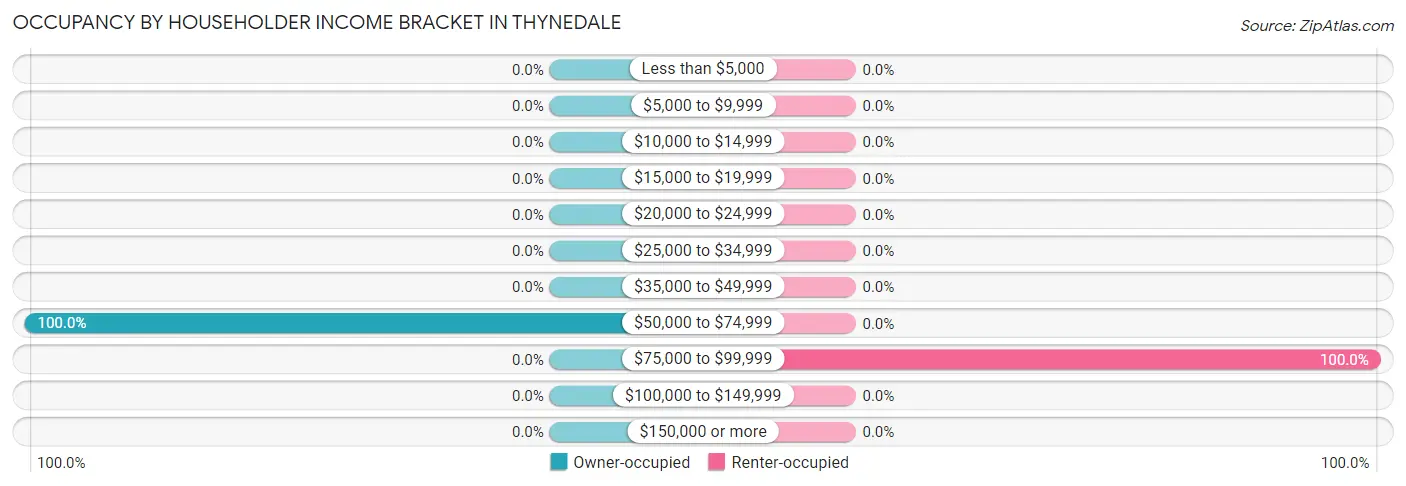
Occupancy by Householder Income Bracket in Thynedale
Income Bracket
Owner-occupied
Renter-occupied
Less than $5,000
0 (0.0%)
0 (0.0%)
$5,000 to $9,999
0 (0.0%)
0 (0.0%)
$10,000 to $14,999
0 (0.0%)
0 (0.0%)
$15,000 to $19,999
0 (0.0%)
0 (0.0%)
$20,000 to $24,999
0 (0.0%)
0 (0.0%)
$25,000 to $34,999
0 (0.0%)
0 (0.0%)
$35,000 to $49,999
0 (0.0%)
0 (0.0%)
$50,000 to $74,999
16 (100.0%)
0 (0.0%)
$75,000 to $99,999
0 (0.0%)
13 (100.0%)
$100,000 to $149,999
0 (0.0%)
0 (0.0%)
$150,000 or more
0 (0.0%)
0 (0.0%)
Total
16 (100.0%)
13 (100.0%)
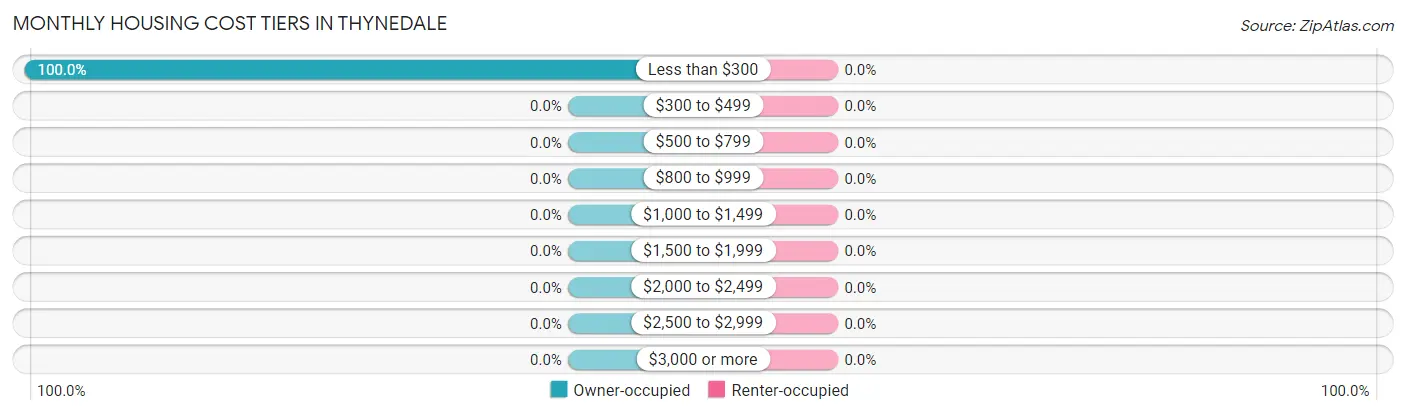
Monthly Housing Cost Tiers in Thynedale
Monthly Cost
Owner-occupied
Renter-occupied
Less than $300
16 (100.0%)
0 (0.0%)
$300 to $499
0 (0.0%)
0 (0.0%)
$500 to $799
0 (0.0%)
0 (0.0%)
$800 to $999
0 (0.0%)
0 (0.0%)
$1,000 to $1,499
0 (0.0%)
0 (0.0%)
$1,500 to $1,999
0 (0.0%)
0 (0.0%)
$2,000 to $2,499
0 (0.0%)
0 (0.0%)
$2,500 to $2,999
0 (0.0%)
0 (0.0%)
$3,000 or more
0 (0.0%)
0 (0.0%)
Total
16 (100.0%)
13 (100.0%)
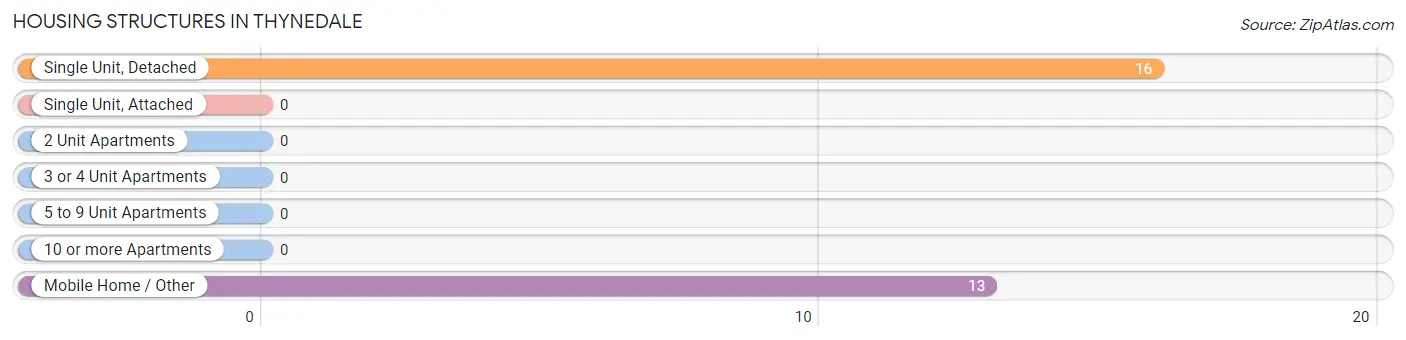
Physical Housing Characteristics in Thynedale
Housing Structures in Thynedale
Structure Type
# Housing Units
% Housing Units
Single Unit, Detached
16
55.2%
Single Unit, Attached
0
0.0%
2 Unit Apartments
0
0.0%
3 or 4 Unit Apartments
0
0.0%
5 to 9 Unit Apartments
0
0.0%
10 or more Apartments
0
0.0%
Mobile Home / Other
13
44.8%
Total
29
100.0%
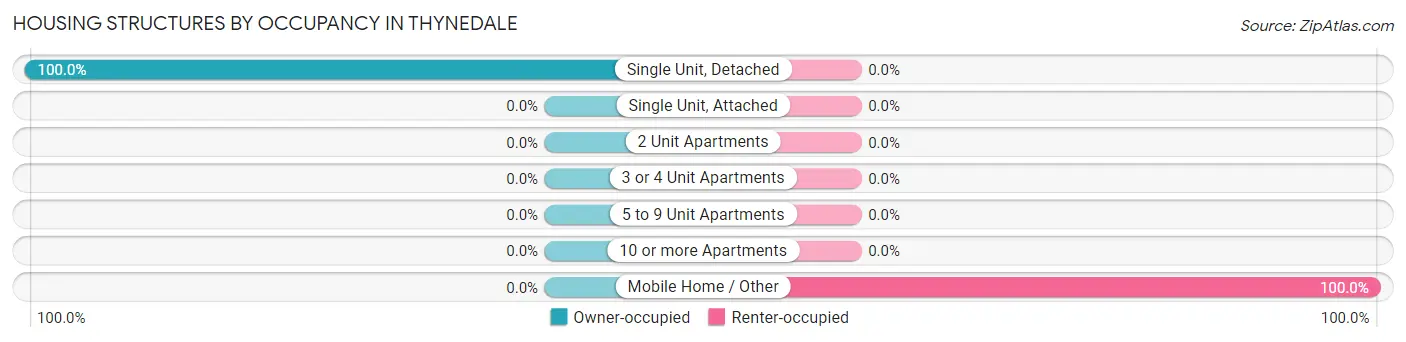
Housing Structures by Occupancy in Thynedale
Structure Type
Owner-occupied
Renter-occupied
Single Unit, Detached
16 (100.0%)
0 (0.0%)
Single Unit, Attached
0 (0.0%)
0 (0.0%)
2 Unit Apartments
0 (0.0%)
0 (0.0%)
3 or 4 Unit Apartments
0 (0.0%)
0 (0.0%)
5 to 9 Unit Apartments
0 (0.0%)
0 (0.0%)
10 or more Apartments
0 (0.0%)
0 (0.0%)
Mobile Home / Other
0 (0.0%)
13 (100.0%)
Total
16 (55.2%)
13 (44.8%)
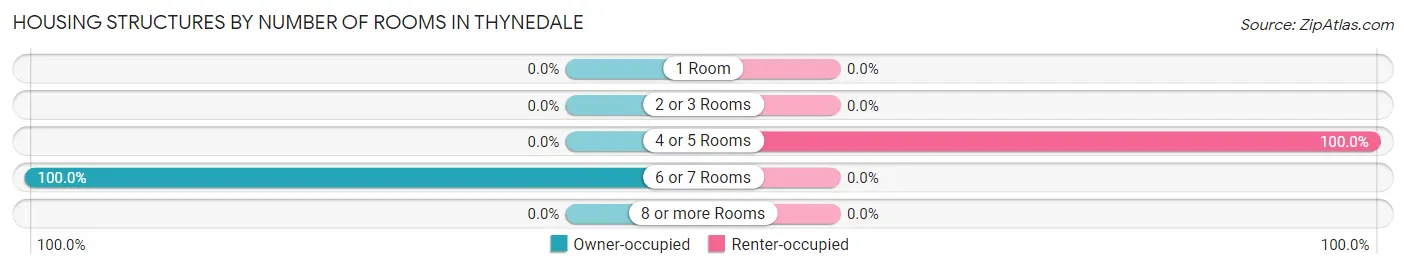
Housing Structures by Number of Rooms in Thynedale
Number of Rooms
Owner-occupied
Renter-occupied
1 Room
0 (0.0%)
0 (0.0%)
2 or 3 Rooms
0 (0.0%)
0 (0.0%)
4 or 5 Rooms
0 (0.0%)
13 (100.0%)
6 or 7 Rooms
16 (100.0%)
0 (0.0%)
8 or more Rooms
0 (0.0%)
0 (0.0%)
Total
16 (100.0%)
13 (100.0%)
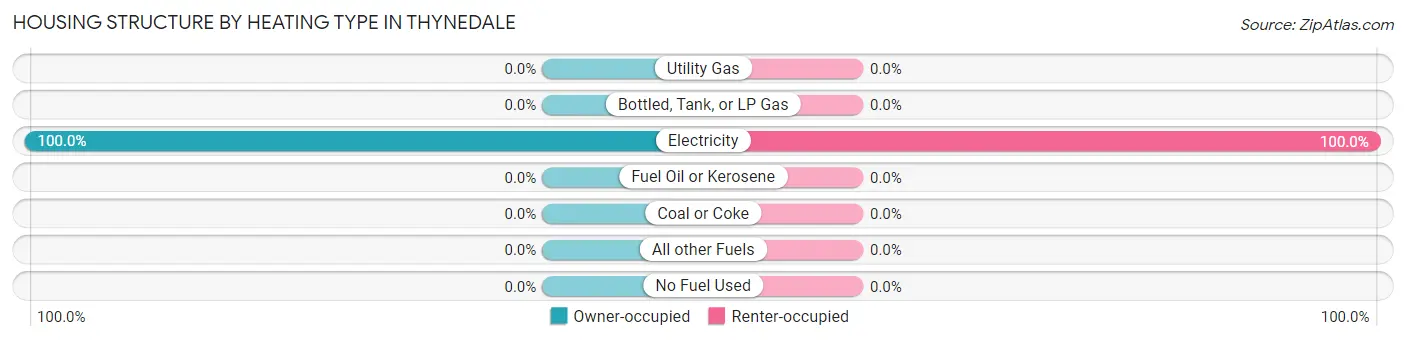
Housing Structure by Heating Type in Thynedale
Heating Type
Owner-occupied
Renter-occupied
Utility Gas
0 (0.0%)
0 (0.0%)
Bottled, Tank, or LP Gas
0 (0.0%)
0 (0.0%)
Electricity
16 (100.0%)
13 (100.0%)
Fuel Oil or Kerosene
0 (0.0%)
0 (0.0%)
Coal or Coke
0 (0.0%)
0 (0.0%)
All other Fuels
0 (0.0%)
0 (0.0%)
No Fuel Used
0 (0.0%)
0 (0.0%)
Total
16 (100.0%)
13 (100.0%)
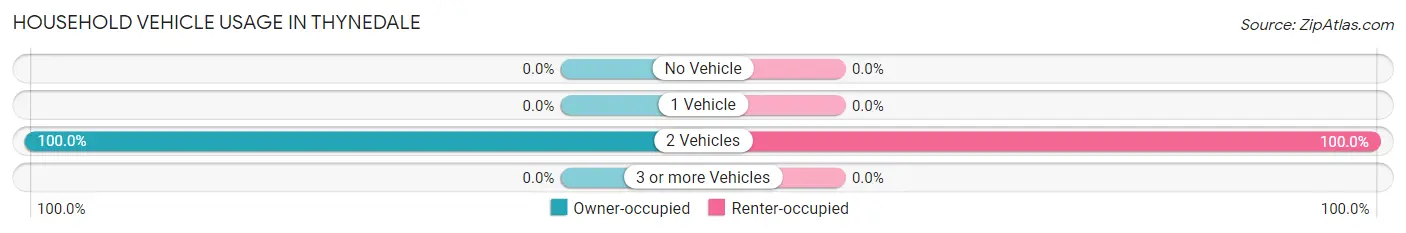
Household Vehicle Usage in Thynedale
Vehicles per Household
Owner-occupied
Renter-occupied
No Vehicle
0 (0.0%)
0 (0.0%)
1 Vehicle
0 (0.0%)
0 (0.0%)
2 Vehicles
16 (100.0%)
13 (100.0%)
3 or more Vehicles
0 (0.0%)
0 (0.0%)
Total
16 (100.0%)
13 (100.0%)
Real Estate & Mortgages in Thynedale
Real Estate and Mortgage Overview in Thynedale
Characteristic
Without Mortgage
With Mortgage
Housing Units
16
0
Median Property Value
-
-
Median Household Income
-
-
Monthly Housing Costs
-
-
Real Estate Taxes
-
-
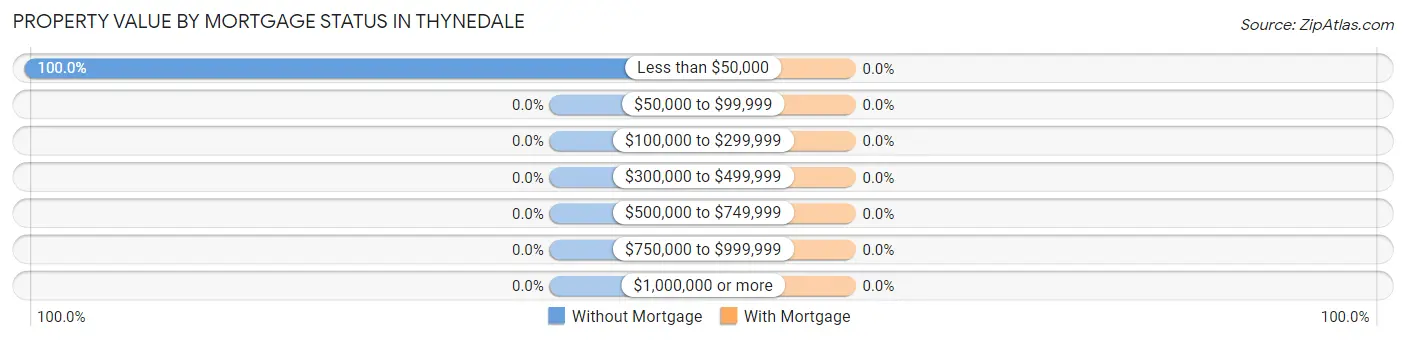
Property Value by Mortgage Status in Thynedale
Property Value
Without Mortgage
With Mortgage
Less than $50,000
16 (100.0%)
0 (0.0%)
$50,000 to $99,999
0 (0.0%)
0 (0.0%)
$100,000 to $299,999
0 (0.0%)
0 (0.0%)
$300,000 to $499,999
0 (0.0%)
0 (0.0%)
$500,000 to $749,999
0 (0.0%)
0 (0.0%)
$750,000 to $999,999
0 (0.0%)
0 (0.0%)
$1,000,000 or more
0 (0.0%)
0 (0.0%)
Total
16 (100.0%)
0 (0.0%)
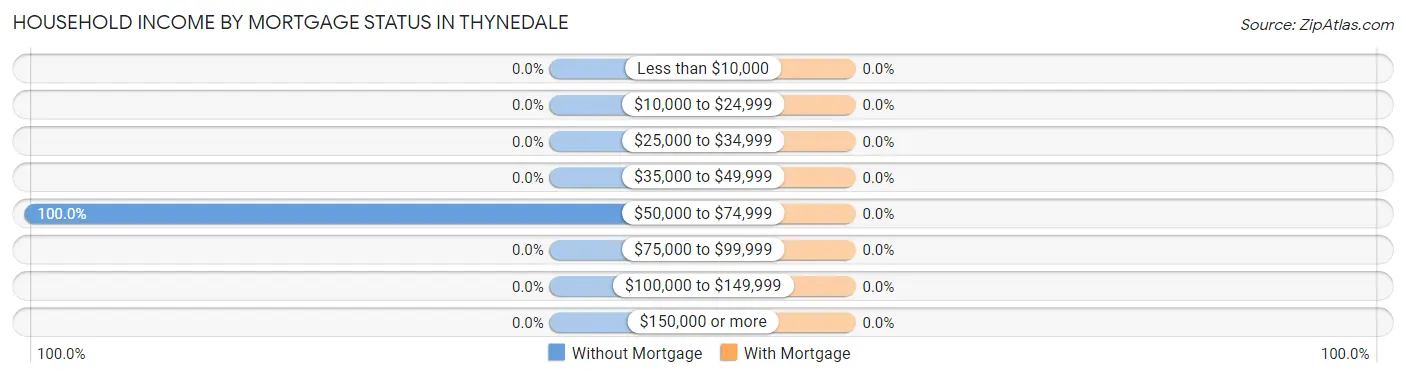
Household Income by Mortgage Status in Thynedale
Household Income
Without Mortgage
With Mortgage
Less than $10,000
0 (0.0%)
0 (0.0%)
$10,000 to $24,999
0 (0.0%)
0 (0.0%)
$25,000 to $34,999
0 (0.0%)
0 (0.0%)
$35,000 to $49,999
0 (0.0%)
0 (0.0%)
$50,000 to $74,999
16 (100.0%)
0 (0.0%)
$75,000 to $99,999
0 (0.0%)
0 (0.0%)
$100,000 to $149,999
0 (0.0%)
0 (0.0%)
$150,000 or more
0 (0.0%)
0 (0.0%)
Total
16 (100.0%)
0 (0.0%)
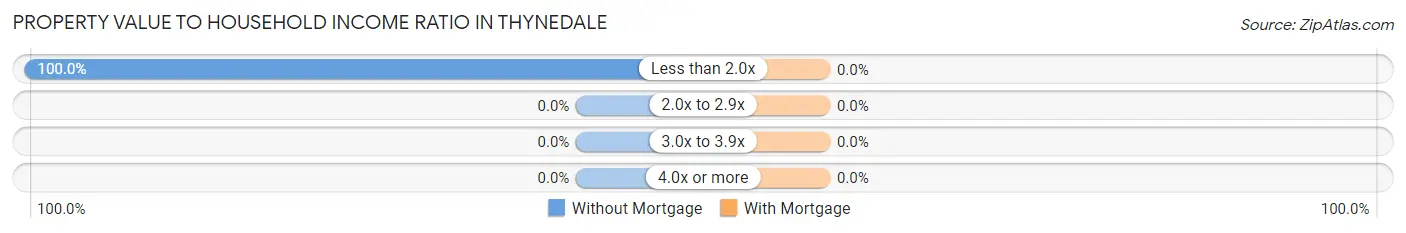
Property Value to Household Income Ratio in Thynedale
Value-to-Income Ratio
Without Mortgage
With Mortgage
Less than 2.0x
16 (100.0%)
0 (0.0%)
2.0x to 2.9x
0 (0.0%)
0 (0.0%)
3.0x to 3.9x
0 (0.0%)
0 (0.0%)
4.0x or more
0 (0.0%)
0 (0.0%)
Total
16 (100.0%)
0 (0.0%)
Real Estate Taxes by Mortgage Status in Thynedale
Property Taxes
Without Mortgage
With Mortgage
Less than $800
0 (0.0%)
0 (0.0%)
$800 to $1,499
0 (0.0%)
0 (0.0%)
$800 to $1,499
0 (0.0%)
0 (0.0%)
Total
16 (100.0%)
0 (0.0%)
Health & Disability in Thynedale
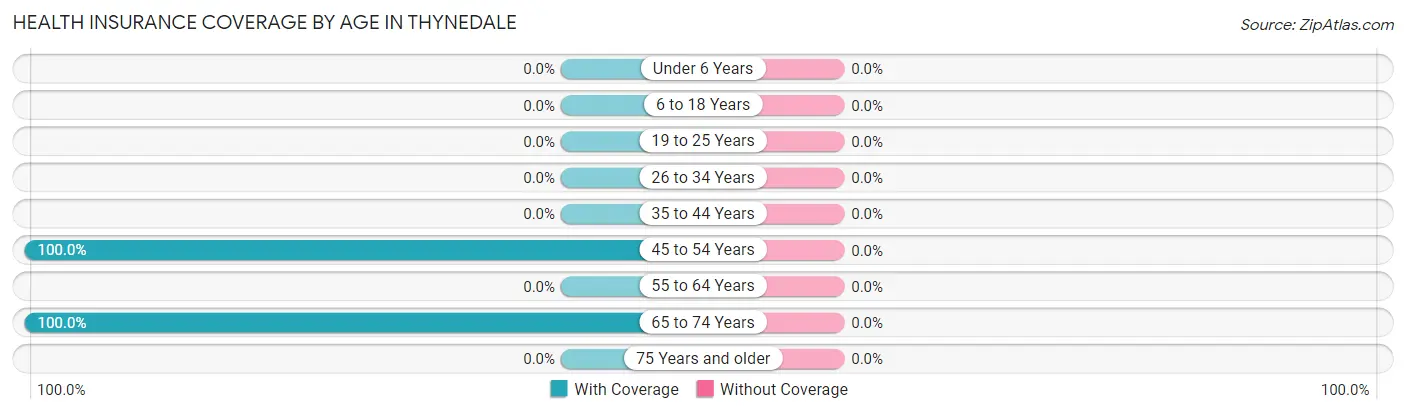
Health Insurance Coverage by Age in Thynedale
Age Bracket
With Coverage
Without Coverage
Under 6 Years
0 (0.0%)
0 (0.0%)
6 to 18 Years
0 (0.0%)
0 (0.0%)
19 to 25 Years
0 (0.0%)
0 (0.0%)
26 to 34 Years
0 (0.0%)
0 (0.0%)
35 to 44 Years
0 (0.0%)
0 (0.0%)
45 to 54 Years
13 (100.0%)
0 (0.0%)
55 to 64 Years
0 (0.0%)
0 (0.0%)
65 to 74 Years
40 (100.0%)
0 (0.0%)
75 Years and older
0 (0.0%)
0 (0.0%)
Total
53 (100.0%)
0 (0.0%)
Health Insurance Coverage by Citizenship Status in Thynedale
Citizenship Status
With Coverage
Without Coverage
Native Born
0 (0.0%)
0 (0.0%)
Foreign Born, Citizen
0 (0.0%)
0 (0.0%)
Foreign Born, not a Citizen
0 (0.0%)
0 (0.0%)
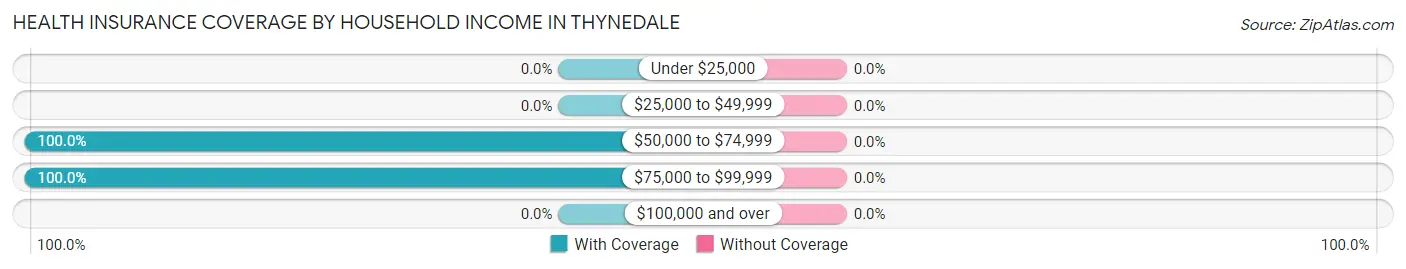
Health Insurance Coverage by Household Income in Thynedale
Household Income
With Coverage
Without Coverage
Under $25,000
0 (0.0%)
0 (0.0%)
$25,000 to $49,999
0 (0.0%)
0 (0.0%)
$50,000 to $74,999
28 (100.0%)
0 (0.0%)
$75,000 to $99,999
25 (100.0%)
0 (0.0%)
$100,000 and over
0 (0.0%)
0 (0.0%)
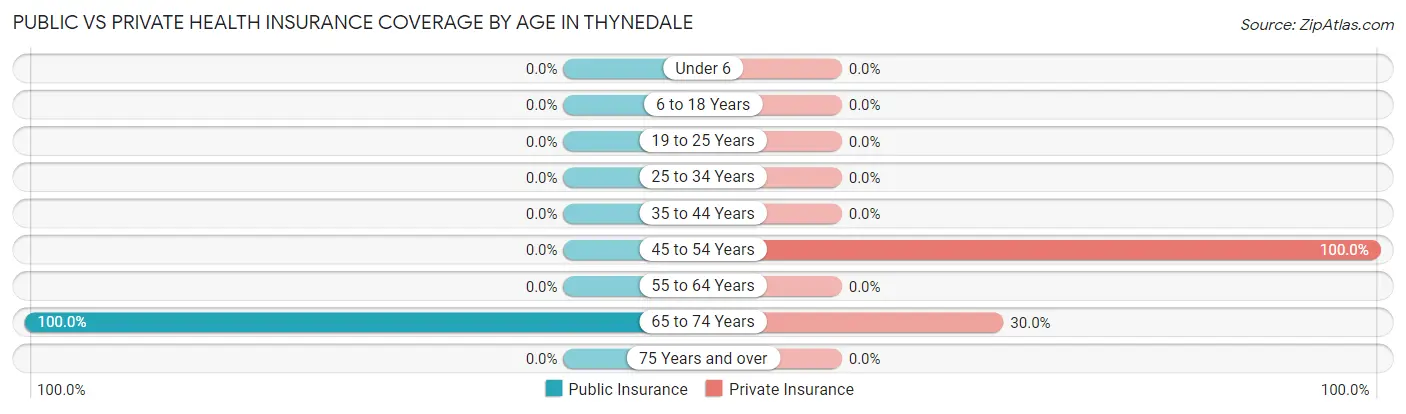
Public vs Private Health Insurance Coverage by Age in Thynedale
Age Bracket
Public Insurance
Private Insurance
Under 6
0 (0.0%)
0 (0.0%)
6 to 18 Years
0 (0.0%)
0 (0.0%)
19 to 25 Years
0 (0.0%)
0 (0.0%)
25 to 34 Years
0 (0.0%)
0 (0.0%)
35 to 44 Years
0 (0.0%)
0 (0.0%)
45 to 54 Years
0 (0.0%)
13 (100.0%)
55 to 64 Years
0 (0.0%)
0 (0.0%)
65 to 74 Years
40 (100.0%)
12 (30.0%)
75 Years and over
0 (0.0%)
0 (0.0%)
Total
40 (75.5%)
25 (47.2%)
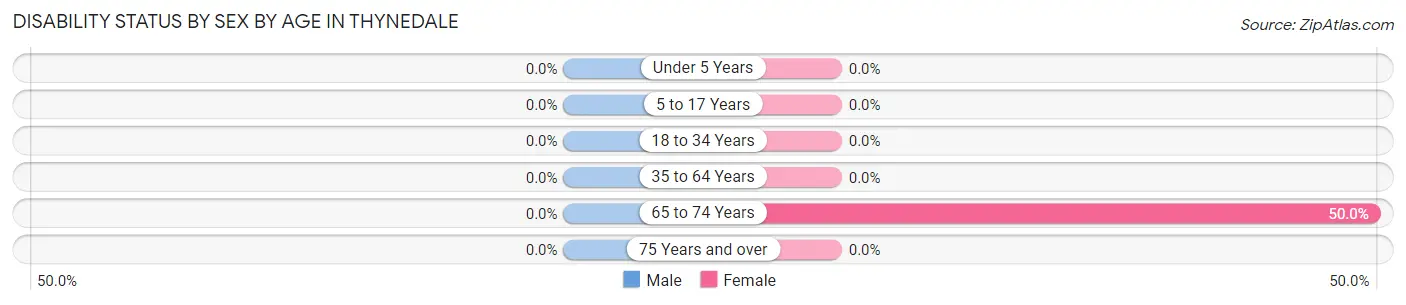
Disability Status by Sex by Age in Thynedale
Age Bracket
Male
Female
Under 5 Years
0 (0.0%)
0 (0.0%)
5 to 17 Years
0 (0.0%)
0 (0.0%)
18 to 34 Years
0 (0.0%)
0 (0.0%)
35 to 64 Years
0 (0.0%)
0 (0.0%)
65 to 74 Years
0 (0.0%)
12 (50.0%)
75 Years and over
0 (0.0%)
0 (0.0%)
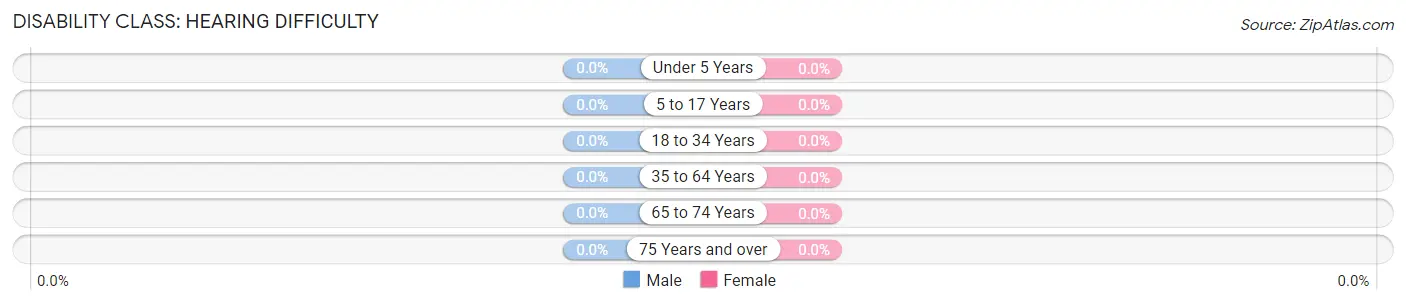
Disability Class by Sex by Age in Thynedale
Disability Class: Hearing Difficulty
Age Bracket
Male
Female
Under 5 Years
0 (0.0%)
0 (0.0%)
5 to 17 Years
0 (0.0%)
0 (0.0%)
18 to 34 Years
0 (0.0%)
0 (0.0%)
35 to 64 Years
0 (0.0%)
0 (0.0%)
65 to 74 Years
0 (0.0%)
0 (0.0%)
75 Years and over
0 (0.0%)
0 (0.0%)
Disability Class: Vision Difficulty
Age Bracket
Male
Female
Under 5 Years
0 (0.0%)
0 (0.0%)
5 to 17 Years
0 (0.0%)
0 (0.0%)
18 to 34 Years
0 (0.0%)
0 (0.0%)
35 to 64 Years
0 (0.0%)
0 (0.0%)
65 to 74 Years
0 (0.0%)
0 (0.0%)
75 Years and over
0 (0.0%)
0 (0.0%)
Disability Class: Cognitive Difficulty
Age Bracket
Male
Female
5 to 17 Years
0 (0.0%)
0 (0.0%)
18 to 34 Years
0 (0.0%)
0 (0.0%)
35 to 64 Years
0 (0.0%)
0 (0.0%)
65 to 74 Years
0 (0.0%)
0 (0.0%)
75 Years and over
0 (0.0%)
0 (0.0%)
Disability Class: Ambulatory Difficulty
Age Bracket
Male
Female
5 to 17 Years
0 (0.0%)
0 (0.0%)
18 to 34 Years
0 (0.0%)
0 (0.0%)
35 to 64 Years
0 (0.0%)
0 (0.0%)
65 to 74 Years
0 (0.0%)
12 (50.0%)
75 Years and over
0 (0.0%)
0 (0.0%)
Disability Class: Self-Care Difficulty
Age Bracket
Male
Female
5 to 17 Years
0 (0.0%)
0 (0.0%)
18 to 34 Years
0 (0.0%)
0 (0.0%)
35 to 64 Years
0 (0.0%)
0 (0.0%)
65 to 74 Years
0 (0.0%)
0 (0.0%)
75 Years and over
0 (0.0%)
0 (0.0%)
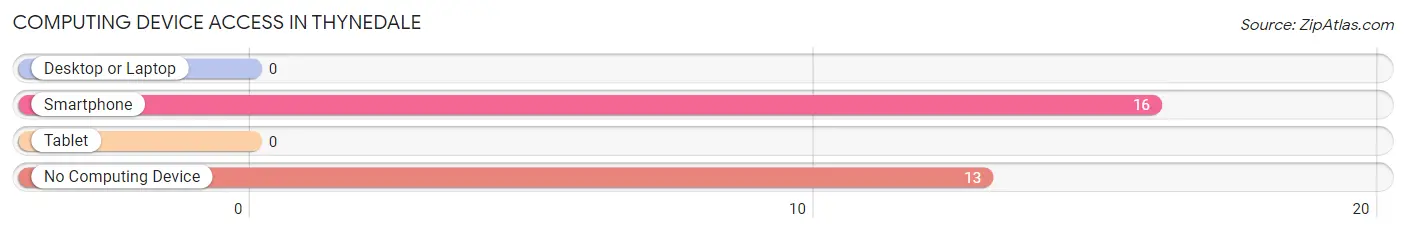
Technology Access in Thynedale
Computing Device Access in Thynedale
Device Type
# Households
% Households
Desktop or Laptop
0
0.0%
Smartphone
16
55.2%
Tablet
0
0.0%
No Computing Device
13
44.8%
Total
29
100.0%
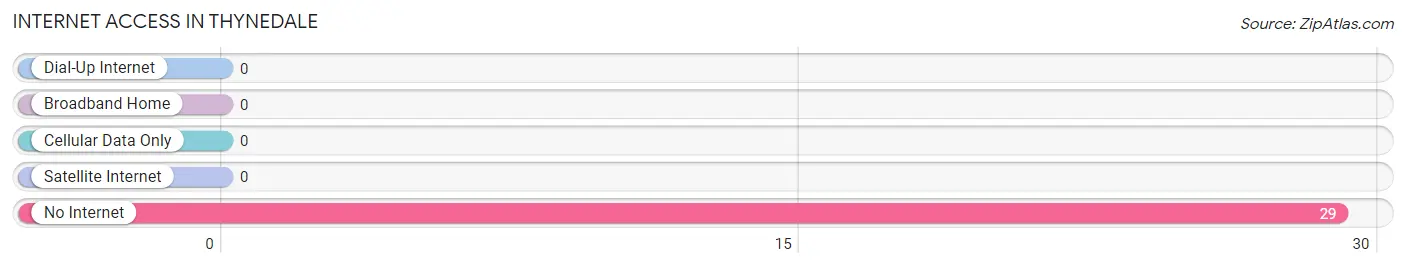
Internet Access in Thynedale
Internet Type
# Households
% Households
Dial-Up Internet
0
0.0%
Broadband Home
0
0.0%
Cellular Data Only
0
0.0%
Satellite Internet
0
0.0%
No Internet
29
100.0%
Total
29
100.0%
Thynedale Summary
Thynedale is a small town located in the state of Virginia, in the United States. It is situated in the foothills of the Blue Ridge Mountains, and is part of the Shenandoah Valley region. The town has a population of approximately 1,500 people, and is known for its rural charm and small-town atmosphere.
History
Thynedale was first settled in the late 1700s by a group of German immigrants. The town was originally known as “Thynedale”, which is derived from the German word “Thyn”, meaning “valley”. The town was officially incorporated in 1820, and has remained relatively unchanged since then.
Geography
Thynedale is located in the foothills of the Blue Ridge Mountains, and is part of the Shenandoah Valley region. The town is situated on the banks of the Shenandoah River, and is surrounded by rolling hills and lush forests. The town is located approximately 30 miles from the city of Harrisonburg, and is accessible via US Route 11.
Economy
The economy of Thynedale is largely based on agriculture and tourism. The town is home to several small farms, which produce a variety of crops, including corn, soybeans, and hay. The town is also home to several wineries, which produce a variety of wines. In addition, the town is home to several small businesses, including restaurants, shops, and galleries.
Demographics
As of the 2010 census, the population of Thynedale was 1,500 people. The town is predominantly white, with approximately 95% of the population identifying as Caucasian. The median household income is approximately $45,000, and the median age is 44 years old.
Conclusion
Thynedale is a small town located in the state of Virginia, in the United States. It is situated in the foothills of the Blue Ridge Mountains, and is part of the Shenandoah Valley region. The town has a population of approximately 1,500 people, and is known for its rural charm and small-town atmosphere. The economy of Thynedale is largely based on agriculture and tourism, and the town is predominantly white, with approximately 95% of the population identifying as Caucasian. Thynedale is a charming and picturesque town, and is a great place to visit or live.
Common Questions
What is Per Capita Income in Thynedale?
Per Capita income in Thynedale is $39,538.
What is Inequality or Gini Index in Thynedale?
Inequality or Gini Index in Thynedale is 0.05.
What is the Total Population of Thynedale?
Total Population of Thynedale is 53.
What is the Total Male Population of Thynedale?
Total Male Population of Thynedale is 29.
What is the Total Female Population of Thynedale?
Total Female Population of Thynedale is 24.
What is the Ratio of Males per 100 Females in Thynedale?
There are 120.83 Males per 100 Females in Thynedale.
What is the Ratio of Females per 100 Males in Thynedale?
There are 82.76 Females per 100 Males in Thynedale.
What is the Median Population Age in Thynedale?
Median Population Age in Thynedale is 68.1 Years.
What is the Average Family Size in Thynedale
Average Family Size in Thynedale is 1.8 People.
What is the Average Household Size in Thynedale
Average Household Size in Thynedale is 1.8 People.
How Large is the Labor Force in Thynedale?
There are 25 People in the Labor Forcein in Thynedale.
What is the Percentage of People in the Labor Force in Thynedale?
47.2% of People are in the Labor Force in Thynedale.
Report Title
Report Link
HTML Copy & Paste Link
Social Media
Copy and paste the folowing code into any webpage where you would like this interactive chart to display