Zip Codes with the Highest Percentage of Population Employed in Production in Roanoke, VA
RELATED REPORTS & OPTIONS
Production
Roanoke
Compare Zip Codes
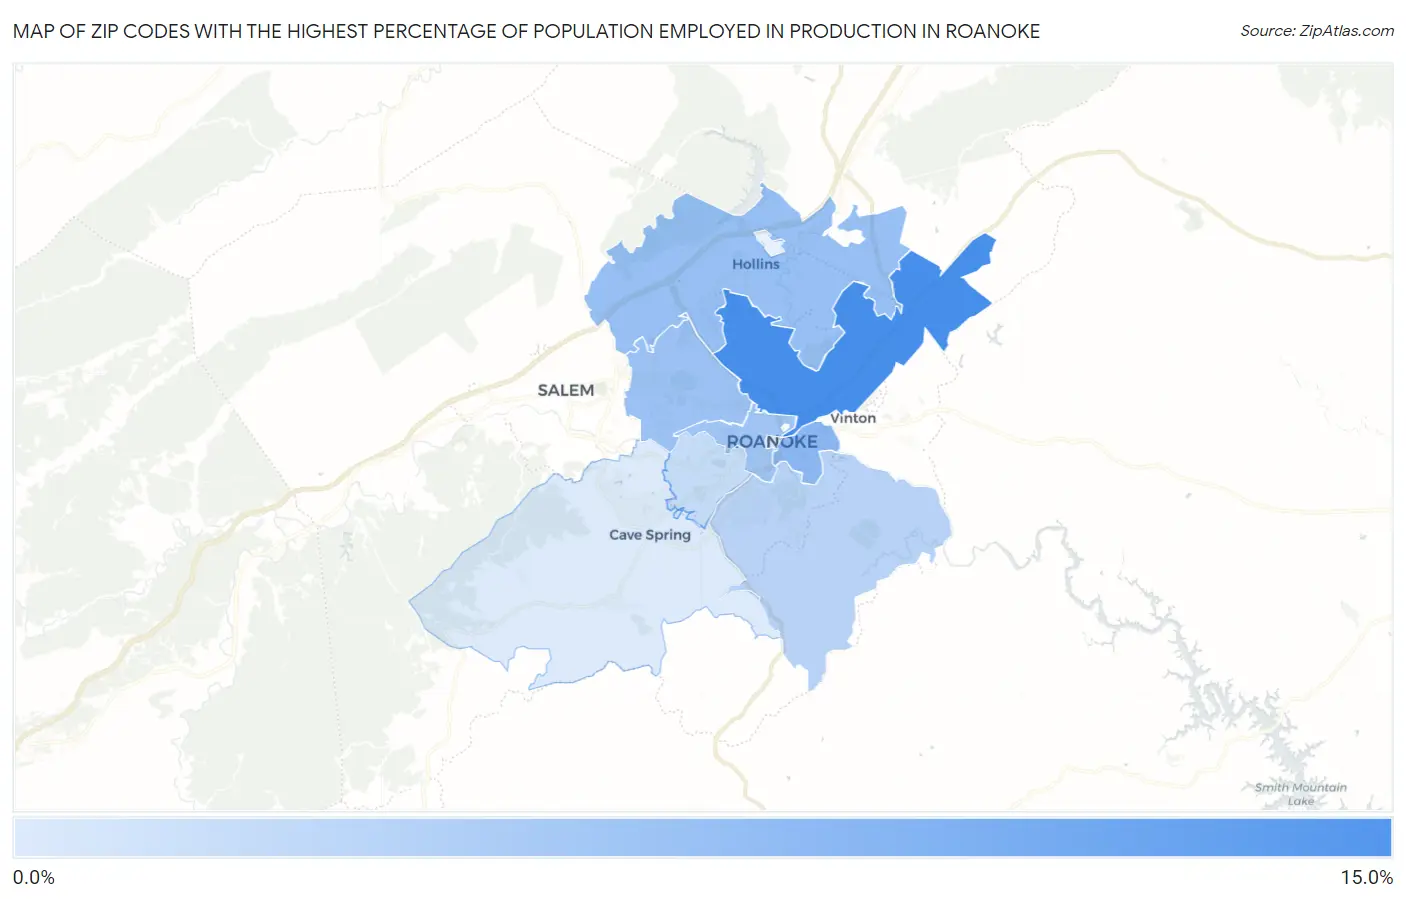
Map of Zip Codes with the Highest Percentage of Population Employed in Production in Roanoke
2.3%
11.5%
Zip Codes with the Highest Percentage of Population Employed in Production in Roanoke, VA
| Zip Code | % Employed | vs State | vs National | |
| 1. | 24012 | 11.5% | 4.1%(+7.43)#139 | 5.5%(+6.07)#5,935 |
| 2. | 24013 | 7.1% | 4.1%(+3.01)#275 | 5.5%(+1.66)#12,782 |
| 3. | 24019 | 6.4% | 4.1%(+2.33)#312 | 5.5%(+0.967)#14,234 |
| 4. | 24017 | 6.3% | 4.1%(+2.20)#316 | 5.5%(+0.842)#14,507 |
| 5. | 24016 | 5.8% | 4.1%(+1.71)#340 | 5.5%(+0.354)#15,643 |
| 6. | 24014 | 4.4% | 4.1%(+0.314)#424 | 5.5%(-1.04)#19,194 |
| 7. | 24015 | 3.7% | 4.1%(-0.442)#474 | 5.5%(-1.80)#21,237 |
| 8. | 24018 | 2.3% | 4.1%(-1.81)#585 | 5.5%(-3.16)#25,003 |
| 9. | 24011 | 2.3% | 4.1%(-1.85)#589 | 5.5%(-3.21)#25,126 |
1
Common Questions
What are the Top 5 Zip Codes with the Highest Percentage of Population Employed in Production in Roanoke, VA?
Top 5 Zip Codes with the Highest Percentage of Population Employed in Production in Roanoke, VA are:
What zip code has the Highest Percentage of Population Employed in Production in Roanoke, VA?
24012 has the Highest Percentage of Population Employed in Production in Roanoke, VA with 11.5%.
What is the Percentage of Population Employed in Production in Roanoke, VA?
Percentage of Population Employed in Production in Roanoke is 7.0%.
What is the Percentage of Population Employed in Production in Virginia?
Percentage of Population Employed in Production in Virginia is 4.1%.
What is the Percentage of Population Employed in Production in the United States?
Percentage of Population Employed in Production in the United States is 5.5%.