Baskerville, VA Map & Demographics
Baskerville Map
Baskerville Overview
$12,561
PER CAPITA INCOME
0.29
INEQUALITY / GINI INDEX
231
TOTAL POPULATION
174
MALE POPULATION
57
FEMALE POPULATION
305.26
MALES / 100 FEMALES
32.76
FEMALES / 100 MALES
20.6
MEDIAN AGE
3.3
AVG FAMILY SIZE
3.3
AVG HOUSEHOLD SIZE
45
LABOR FORCE [ PEOPLE ]
34.4%
PERCENT IN LABOR FORCE
Baskerville Zip Codes
Baskerville Area Codes
Income in Baskerville
Income Overview in Baskerville
| Characteristic | Number | Measure |
| Per Capita Income | 231 | $12,561 |
| Median Family Income | 61 | $0 |
| Mean Family Income | 61 | $37,034 |
| Median Household Income | 70 | $0 |
| Mean Household Income | 70 | $38,004 |
| Income Deficit | 61 | $0 |
| Wage / Income Gap (%) | 231 | 0.00% |
| Wage / Income Gap ($) | 231 | 100.00¢ per $1 |
| Gini / Inequality Index | 231 | 0.29 |
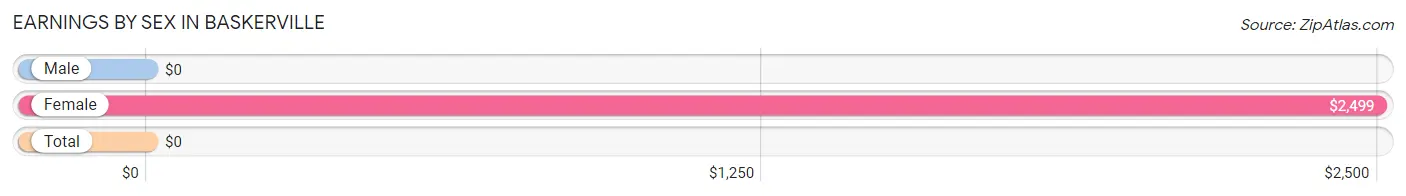
Earnings by Sex in Baskerville
| Sex | Number | Average Earnings |
| Male | 50 (58.1%) | $0 |
| Female | 36 (41.9%) | $2,499 |
| Total | 86 (100.0%) | $0 |
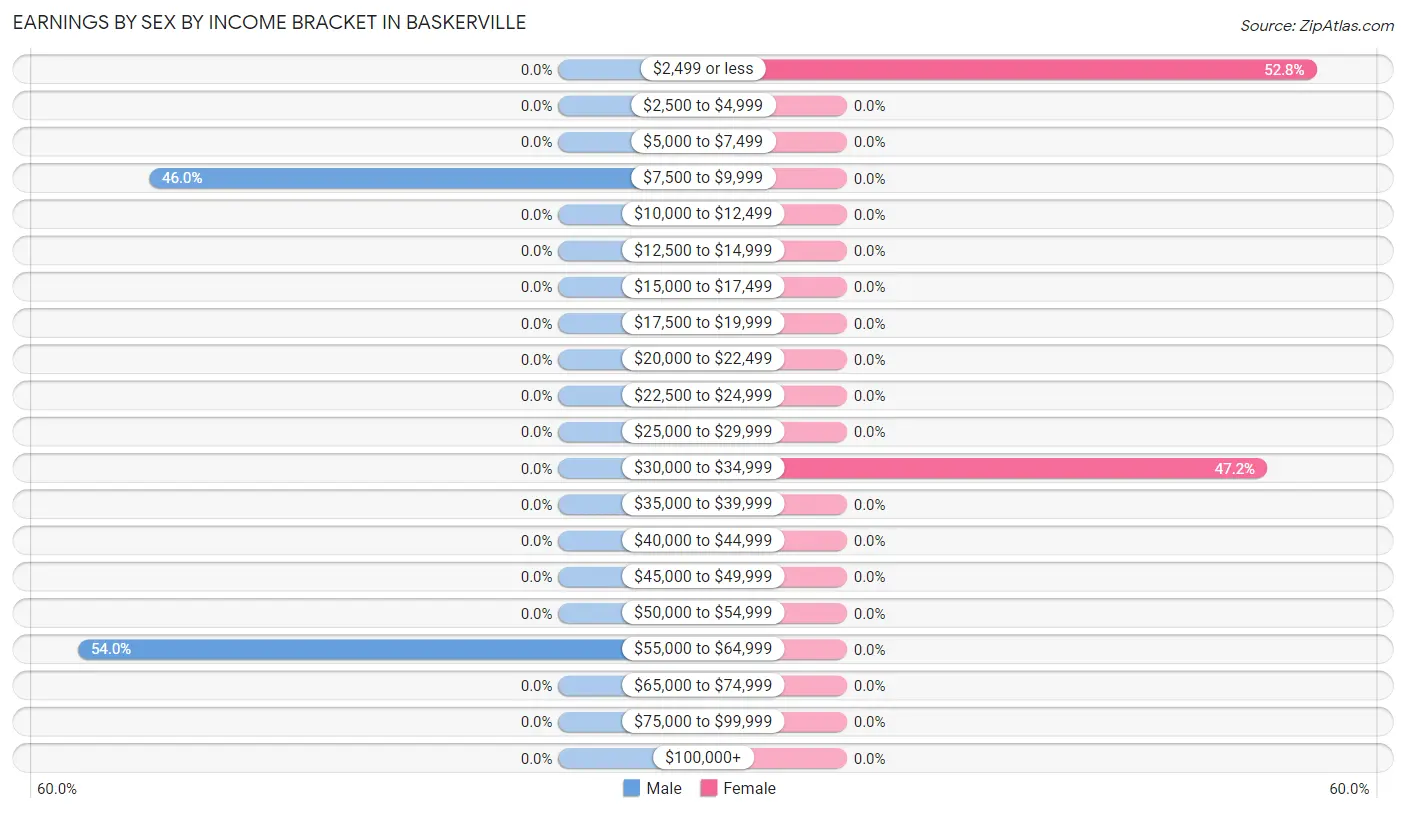
Earnings by Sex by Income Bracket in Baskerville
The most common earnings brackets in Baskerville are $55,000 to $64,999 for men (27 | 54.0%) and $2,499 or less for women (19 | 52.8%).
| Income | Male | Female |
| $2,499 or less | 0 (0.0%) | 19 (52.8%) |
| $2,500 to $4,999 | 0 (0.0%) | 0 (0.0%) |
| $5,000 to $7,499 | 0 (0.0%) | 0 (0.0%) |
| $7,500 to $9,999 | 23 (46.0%) | 0 (0.0%) |
| $10,000 to $12,499 | 0 (0.0%) | 0 (0.0%) |
| $12,500 to $14,999 | 0 (0.0%) | 0 (0.0%) |
| $15,000 to $17,499 | 0 (0.0%) | 0 (0.0%) |
| $17,500 to $19,999 | 0 (0.0%) | 0 (0.0%) |
| $20,000 to $22,499 | 0 (0.0%) | 0 (0.0%) |
| $22,500 to $24,999 | 0 (0.0%) | 0 (0.0%) |
| $25,000 to $29,999 | 0 (0.0%) | 0 (0.0%) |
| $30,000 to $34,999 | 0 (0.0%) | 17 (47.2%) |
| $35,000 to $39,999 | 0 (0.0%) | 0 (0.0%) |
| $40,000 to $44,999 | 0 (0.0%) | 0 (0.0%) |
| $45,000 to $49,999 | 0 (0.0%) | 0 (0.0%) |
| $50,000 to $54,999 | 0 (0.0%) | 0 (0.0%) |
| $55,000 to $64,999 | 27 (54.0%) | 0 (0.0%) |
| $65,000 to $74,999 | 0 (0.0%) | 0 (0.0%) |
| $75,000 to $99,999 | 0 (0.0%) | 0 (0.0%) |
| $100,000+ | 0 (0.0%) | 0 (0.0%) |
| Total | 50 (100.0%) | 36 (100.0%) |
Earnings by Sex by Educational Attainment in Baskerville
| Educational Attainment | Male Income | Female Income |
| Less than High School | - | - |
| High School Diploma | - | - |
| College or Associate's Degree | - | - |
| Bachelor's Degree | - | - |
| Graduate Degree | - | - |
| Total | - | - |
Family Income in Baskerville
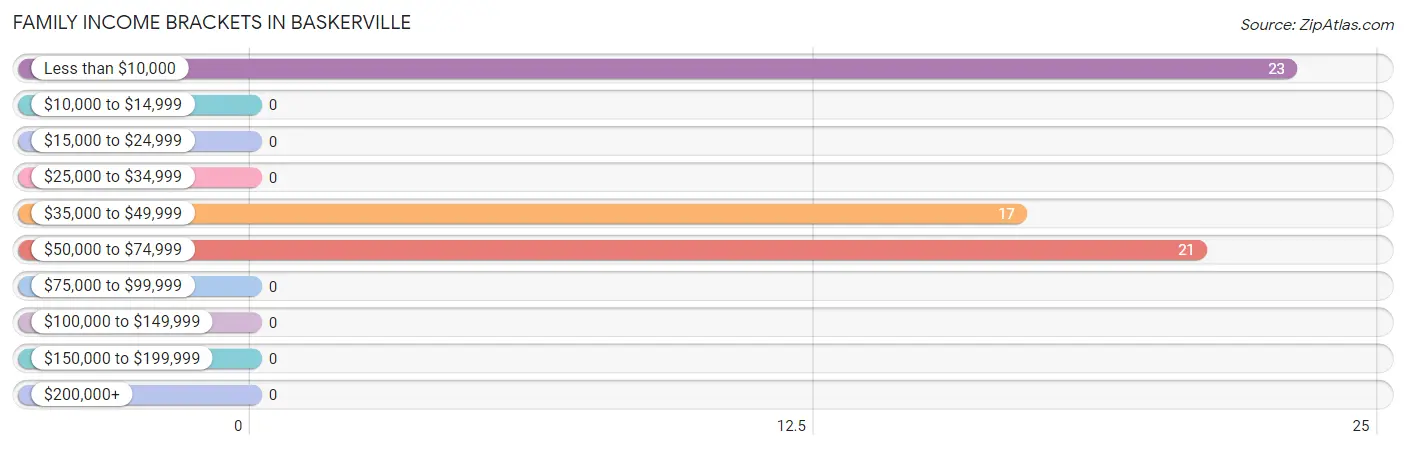
Family Income Brackets in Baskerville
According to the Baskerville family income data, there are 23 families falling into the less than $10,000 income range, which is the most common income bracket and makes up 37.7% of all families.
| Income Bracket | # Families | % Families |
| Less than $10,000 | 23 | 37.7% |
| $10,000 to $14,999 | 0 | 0.0% |
| $15,000 to $24,999 | 0 | 0.0% |
| $25,000 to $34,999 | 0 | 0.0% |
| $35,000 to $49,999 | 17 | 27.9% |
| $50,000 to $74,999 | 21 | 34.4% |
| $75,000 to $99,999 | 0 | 0.0% |
| $100,000 to $149,999 | 0 | 0.0% |
| $150,000 to $199,999 | 0 | 0.0% |
| $200,000+ | 0 | 0.0% |
Family Income by Famaliy Size in Baskerville
| Income Bracket | # Families | Median Income |
| 2-Person Families | 21 (34.4%) | $0 |
| 3-Person Families | 40 (65.6%) | $0 |
| 4-Person Families | 0 (0.0%) | $0 |
| 5-Person Families | 0 (0.0%) | $0 |
| 6-Person Families | 0 (0.0%) | $0 |
| 7+ Person Families | 0 (0.0%) | $0 |
| Total | 61 (100.0%) | $0 |
Family Income by Number of Earners in Baskerville
| Number of Earners | # Families | Median Income |
| No Earners | 0 (0.0%) | $0 |
| 1 Earner | 61 (100.0%) | $0 |
| 2 Earners | 0 (0.0%) | $0 |
| 3+ Earners | 0 (0.0%) | $0 |
| Total | 61 (100.0%) | $0 |
Household Income in Baskerville
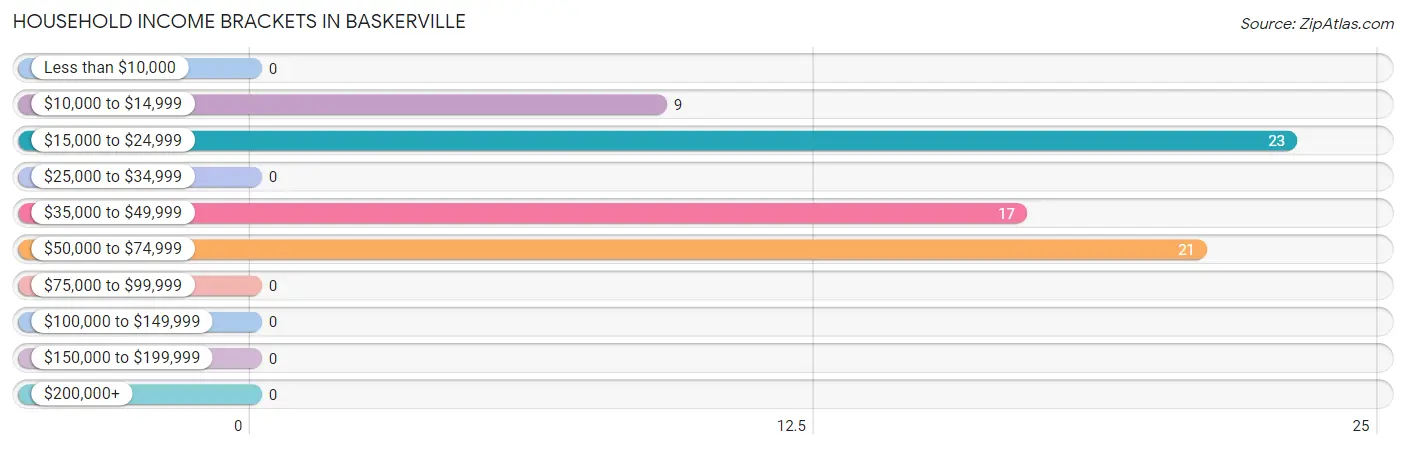
Household Income Brackets in Baskerville
With 23 households falling in the category, the $15,000 to $24,999 income range is the most frequent in Baskerville, accounting for 32.9% of all households.
| Income Bracket | # Households | % Households |
| Less than $10,000 | 0 | 0.0% |
| $10,000 to $14,999 | 9 | 12.9% |
| $15,000 to $24,999 | 23 | 32.9% |
| $25,000 to $34,999 | 0 | 0.0% |
| $35,000 to $49,999 | 17 | 24.3% |
| $50,000 to $74,999 | 21 | 30.0% |
| $75,000 to $99,999 | 0 | 0.0% |
| $100,000 to $149,999 | 0 | 0.0% |
| $150,000 to $199,999 | 0 | 0.0% |
| $200,000+ | 0 | 0.0% |
Household Income by Householder Age in Baskerville
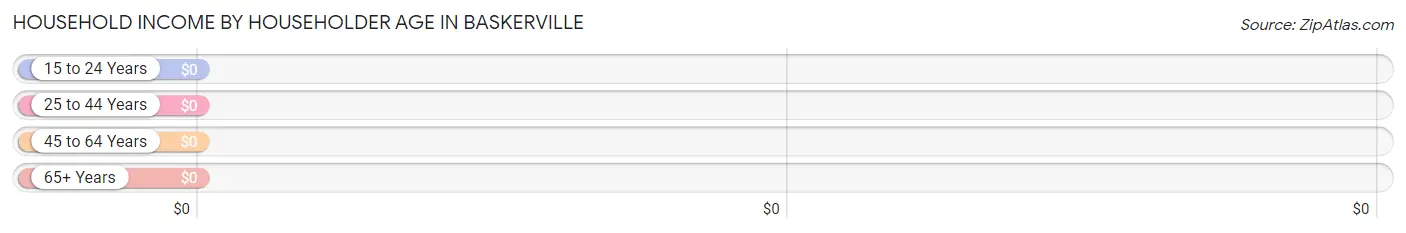
| Income Bracket | # Households | Median Income |
| 15 to 24 Years | 23 (32.9%) | $0 |
| 25 to 44 Years | 17 (24.3%) | $0 |
| 45 to 64 Years | 9 (12.9%) | $0 |
| 65+ Years | 21 (30.0%) | $0 |
| Total | 70 (100.0%) | $0 |
Poverty in Baskerville
Income Below Poverty by Sex and Age in Baskerville
With 69.5% poverty level for males and 33.3% for females among the residents of Baskerville, under 5 year old males and 18 to 24 year old females are the most vulnerable to poverty, with 87 males (100.0%) and 1 females (100.0%) in their respective age groups living below the poverty level.
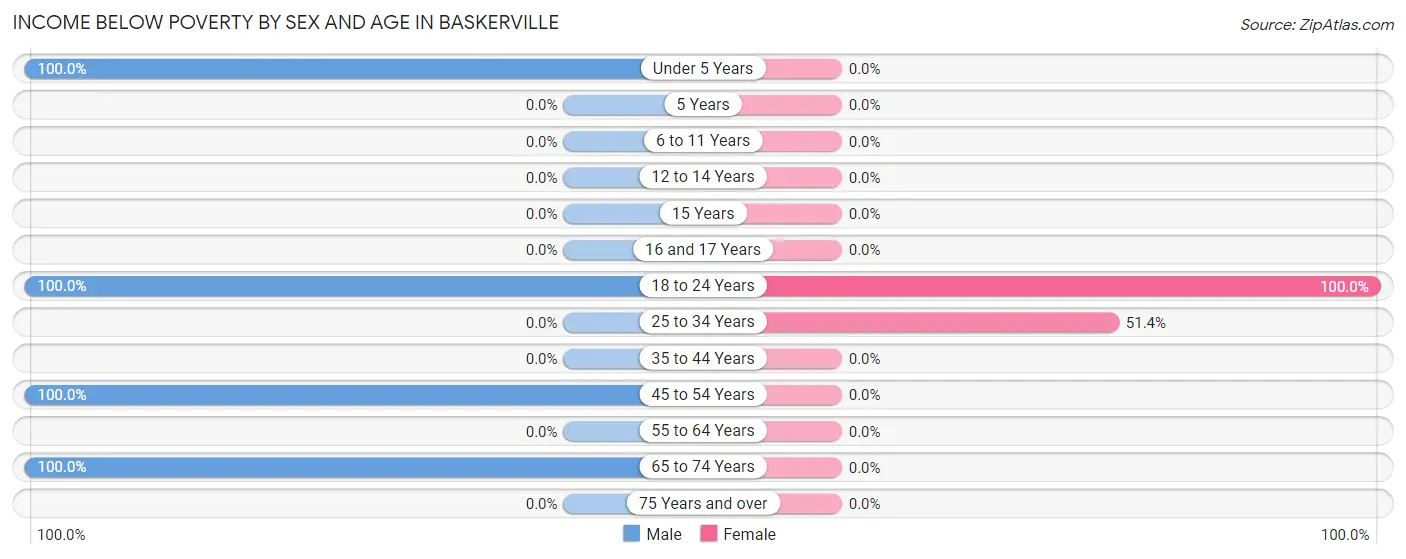
| Age Bracket | Male | Female |
| Under 5 Years | 87 (100.0%) | 0 (0.0%) |
| 5 Years | 0 (0.0%) | 0 (0.0%) |
| 6 to 11 Years | 0 (0.0%) | 0 (0.0%) |
| 12 to 14 Years | 0 (0.0%) | 0 (0.0%) |
| 15 Years | 0 (0.0%) | 0 (0.0%) |
| 16 and 17 Years | 0 (0.0%) | 0 (0.0%) |
| 18 to 24 Years | 24 (100.0%) | 1 (100.0%) |
| 25 to 34 Years | 0 (0.0%) | 18 (51.4%) |
| 35 to 44 Years | 0 (0.0%) | 0 (0.0%) |
| 45 to 54 Years | 9 (100.0%) | 0 (0.0%) |
| 55 to 64 Years | 0 (0.0%) | 0 (0.0%) |
| 65 to 74 Years | 1 (100.0%) | 0 (0.0%) |
| 75 Years and over | 0 (0.0%) | 0 (0.0%) |
| Total | 121 (69.5%) | 19 (33.3%) |
Income Above Poverty by Sex and Age in Baskerville
According to the poverty statistics in Baskerville, males aged 5 years and females aged 65 to 74 years are the age groups that are most secure financially, with 100.0% of males and 100.0% of females in these age groups living above the poverty line.
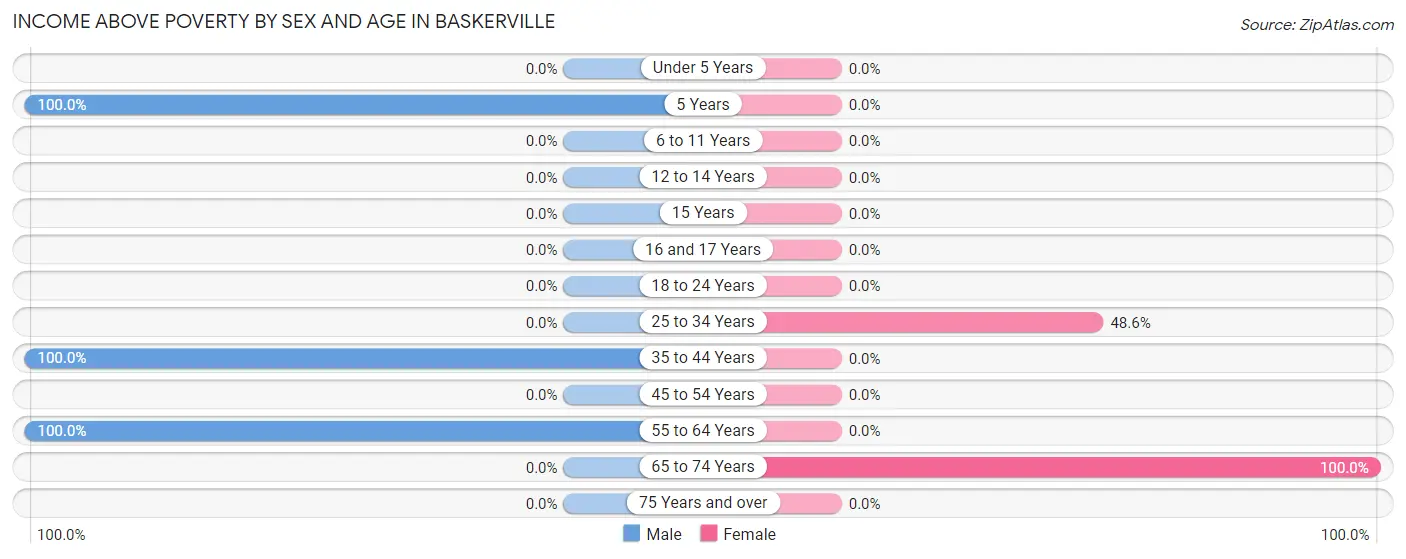
| Age Bracket | Male | Female |
| Under 5 Years | 0 (0.0%) | 0 (0.0%) |
| 5 Years | 13 (100.0%) | 0 (0.0%) |
| 6 to 11 Years | 0 (0.0%) | 0 (0.0%) |
| 12 to 14 Years | 0 (0.0%) | 0 (0.0%) |
| 15 Years | 0 (0.0%) | 0 (0.0%) |
| 16 and 17 Years | 0 (0.0%) | 0 (0.0%) |
| 18 to 24 Years | 0 (0.0%) | 0 (0.0%) |
| 25 to 34 Years | 0 (0.0%) | 17 (48.6%) |
| 35 to 44 Years | 13 (100.0%) | 0 (0.0%) |
| 45 to 54 Years | 0 (0.0%) | 0 (0.0%) |
| 55 to 64 Years | 27 (100.0%) | 0 (0.0%) |
| 65 to 74 Years | 0 (0.0%) | 21 (100.0%) |
| 75 Years and over | 0 (0.0%) | 0 (0.0%) |
| Total | 53 (30.5%) | 38 (66.7%) |
Income Below Poverty Among Married-Couple Families in Baskerville
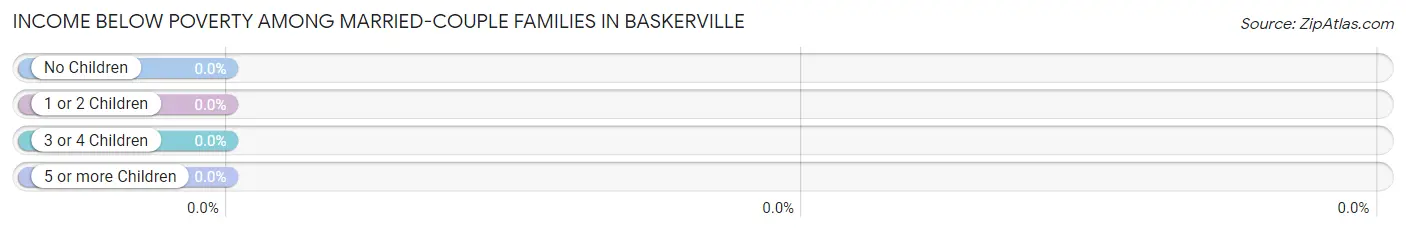
| Children | Above Poverty | Below Poverty |
| No Children | 21 (100.0%) | 0 (0.0%) |
| 1 or 2 Children | 17 (100.0%) | 0 (0.0%) |
| 3 or 4 Children | 0 (0.0%) | 0 (0.0%) |
| 5 or more Children | 0 (0.0%) | 0 (0.0%) |
| Total | 38 (100.0%) | 0 (0.0%) |
Income Below Poverty Among Single-Parent Households in Baskerville
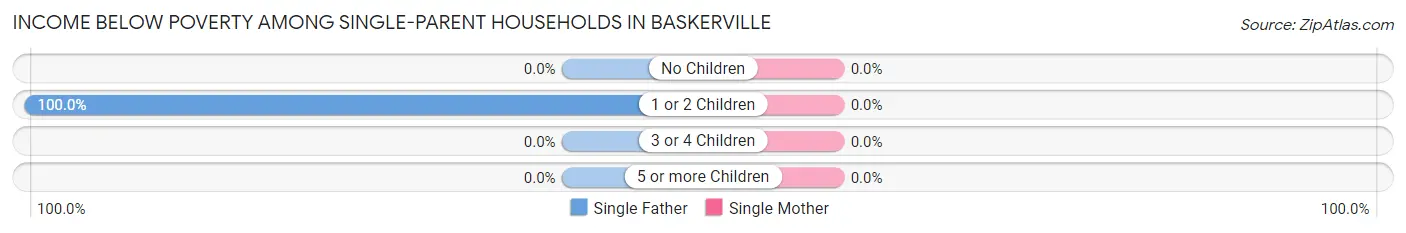
| Children | Single Father | Single Mother |
| No Children | 0 (0.0%) | 0 (0.0%) |
| 1 or 2 Children | 23 (100.0%) | 0 (0.0%) |
| 3 or 4 Children | 0 (0.0%) | 0 (0.0%) |
| 5 or more Children | 0 (0.0%) | 0 (0.0%) |
| Total | 23 (100.0%) | 0 (0.0%) |
Income Below Poverty Among Married-Couple vs Single-Parent Households in Baskerville
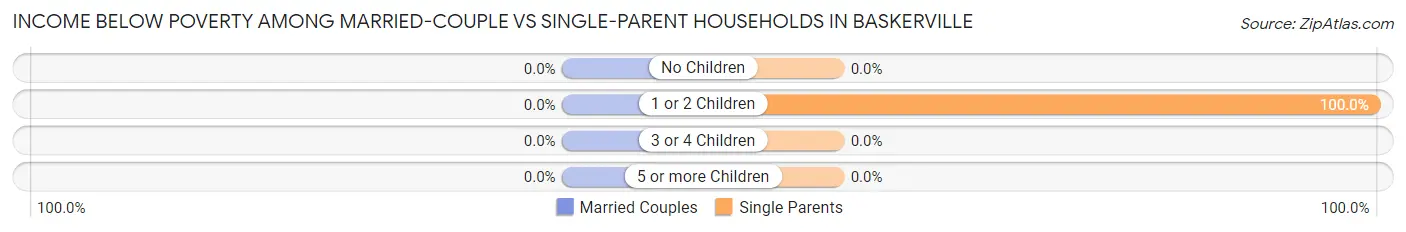
| Children | Married-Couple Families | Single-Parent Households |
| No Children | 0 (0.0%) | 0 (0.0%) |
| 1 or 2 Children | 0 (0.0%) | 23 (100.0%) |
| 3 or 4 Children | 0 (0.0%) | 0 (0.0%) |
| 5 or more Children | 0 (0.0%) | 0 (0.0%) |
| Total | 0 (0.0%) | 23 (100.0%) |
Race in Baskerville
The most populous races in Baskerville are Black / African American (131 | 56.7%), and White / Caucasian (100 | 43.3%).
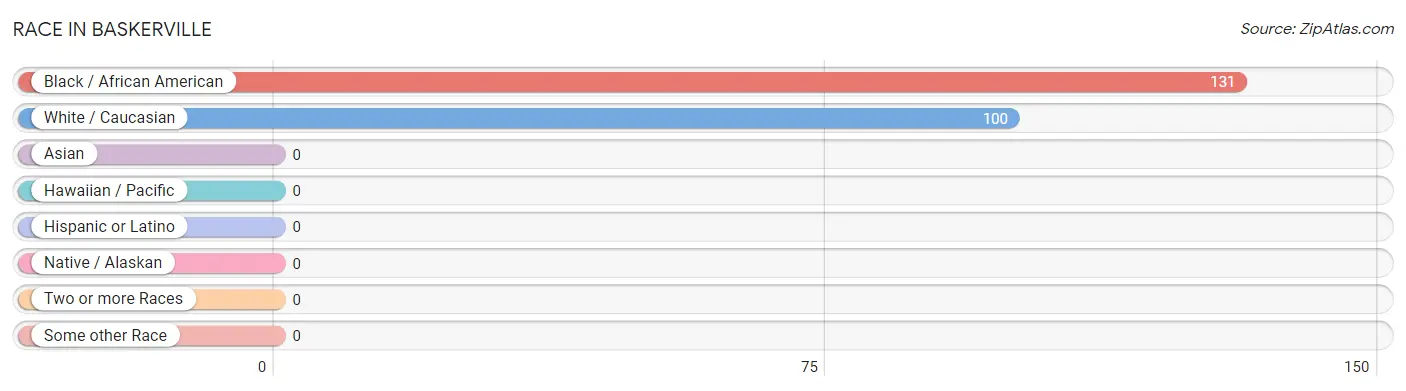
| Race | # Population | % Population |
| Asian | 0 | 0.0% |
| Black / African American | 131 | 56.7% |
| Hawaiian / Pacific | 0 | 0.0% |
| Hispanic or Latino | 0 | 0.0% |
| Native / Alaskan | 0 | 0.0% |
| White / Caucasian | 100 | 43.3% |
| Two or more Races | 0 | 0.0% |
| Some other Race | 0 | 0.0% |
| Total | 231 | 100.0% |
Ancestry in Baskerville
The most populous ancestries reported in Baskerville are African (128 | 55.4%), Subsaharan African (128 | 55.4%), French Canadian (48 | 20.8%), and English (21 | 9.1%), together accounting for 140.7% of all Baskerville residents.
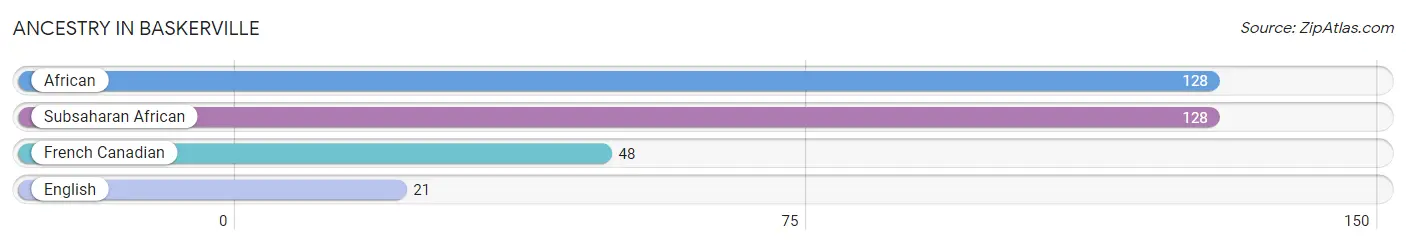
| Ancestry | # Population | % Population |
| African | 128 | 55.4% |
| English | 21 | 9.1% |
| French Canadian | 48 | 20.8% |
| Subsaharan African | 128 | 55.4% | View All 4 Rows |
Immigrants in Baskerville

| Immigration Origin | # Population | % Population | View All 0 Rows |
Sex and Age in Baskerville
Sex and Age in Baskerville
The most populous age groups in Baskerville are Under 5 Years (87 | 50.0%) for men and 30 to 34 Years (35 | 61.4%) for women.
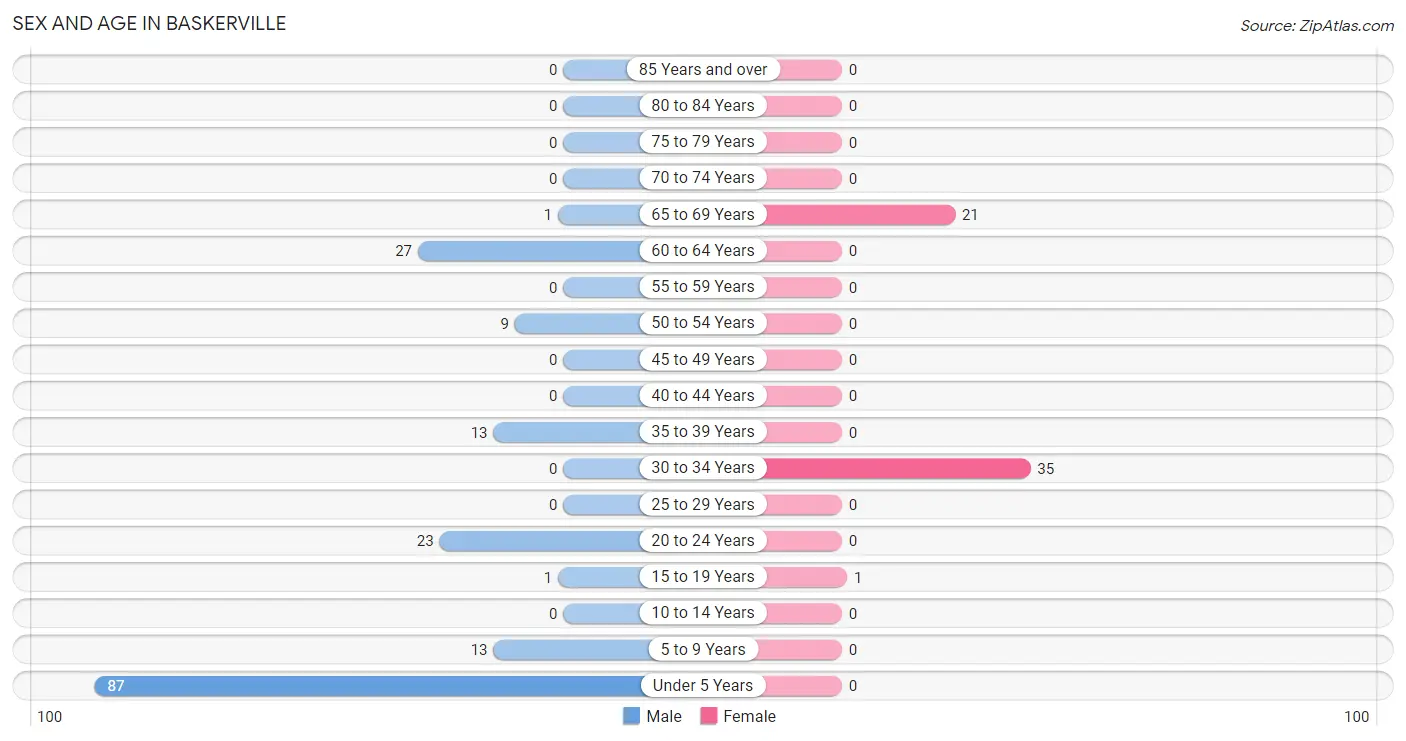
| Age Bracket | Male | Female |
| Under 5 Years | 87 (50.0%) | 0 (0.0%) |
| 5 to 9 Years | 13 (7.5%) | 0 (0.0%) |
| 10 to 14 Years | 0 (0.0%) | 0 (0.0%) |
| 15 to 19 Years | 1 (0.6%) | 1 (1.8%) |
| 20 to 24 Years | 23 (13.2%) | 0 (0.0%) |
| 25 to 29 Years | 0 (0.0%) | 0 (0.0%) |
| 30 to 34 Years | 0 (0.0%) | 35 (61.4%) |
| 35 to 39 Years | 13 (7.5%) | 0 (0.0%) |
| 40 to 44 Years | 0 (0.0%) | 0 (0.0%) |
| 45 to 49 Years | 0 (0.0%) | 0 (0.0%) |
| 50 to 54 Years | 9 (5.2%) | 0 (0.0%) |
| 55 to 59 Years | 0 (0.0%) | 0 (0.0%) |
| 60 to 64 Years | 27 (15.5%) | 0 (0.0%) |
| 65 to 69 Years | 1 (0.6%) | 21 (36.8%) |
| 70 to 74 Years | 0 (0.0%) | 0 (0.0%) |
| 75 to 79 Years | 0 (0.0%) | 0 (0.0%) |
| 80 to 84 Years | 0 (0.0%) | 0 (0.0%) |
| 85 Years and over | 0 (0.0%) | 0 (0.0%) |
| Total | 174 (100.0%) | 57 (100.0%) |
Families and Households in Baskerville
Median Family Size in Baskerville
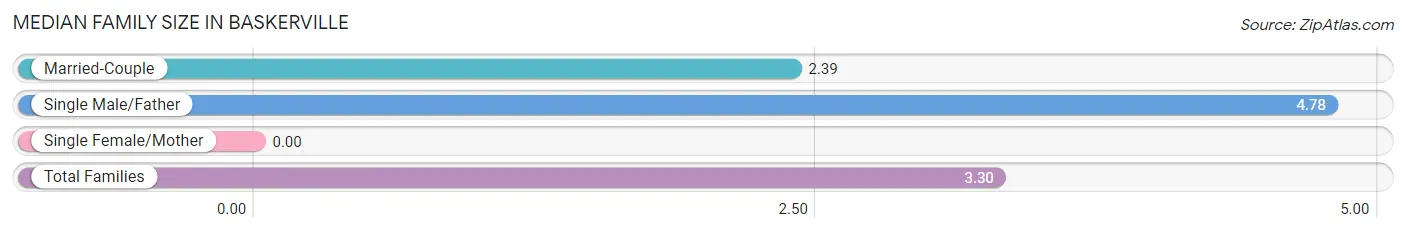
| Family Type | # Families | Family Size |
| Married-Couple | 38 (62.3%) | 2.39 |
| Single Male/Father | 23 (37.7%) | 4.78 |
| Single Female/Mother | 0 (0.0%) | - |
| Total Families | 61 (100.0%) | 3.30 |
Median Household Size in Baskerville
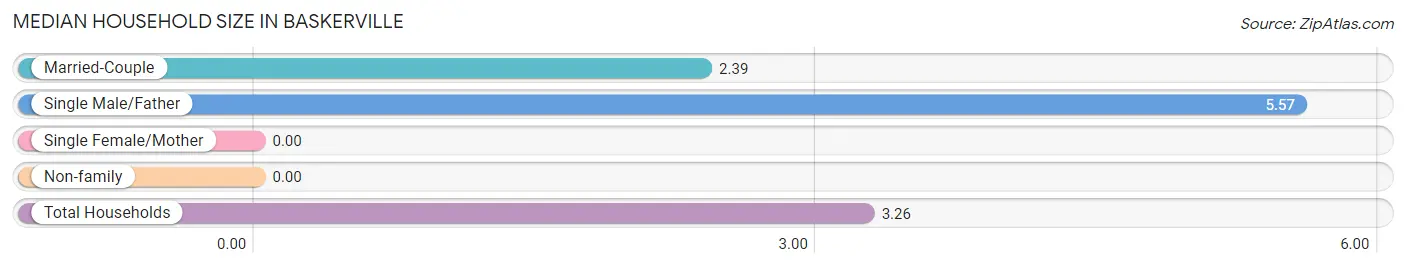
| Household Type | # Households | Household Size |
| Married-Couple | 38 (54.3%) | 2.39 |
| Single Male/Father | 23 (32.9%) | 5.57 |
| Single Female/Mother | 0 (0.0%) | - |
| Non-family | 9 (12.9%) | - |
| Total Households | 70 (100.0%) | 3.26 |
Household Size by Marriage Status in Baskerville
Out of a total of 70 households in Baskerville, 61 (87.1%) are family households, while 9 (12.9%) are nonfamily households. The most numerous type of family households are 4-person households, comprising 23, and the most common type of nonfamily households are 1-person households, comprising 9.
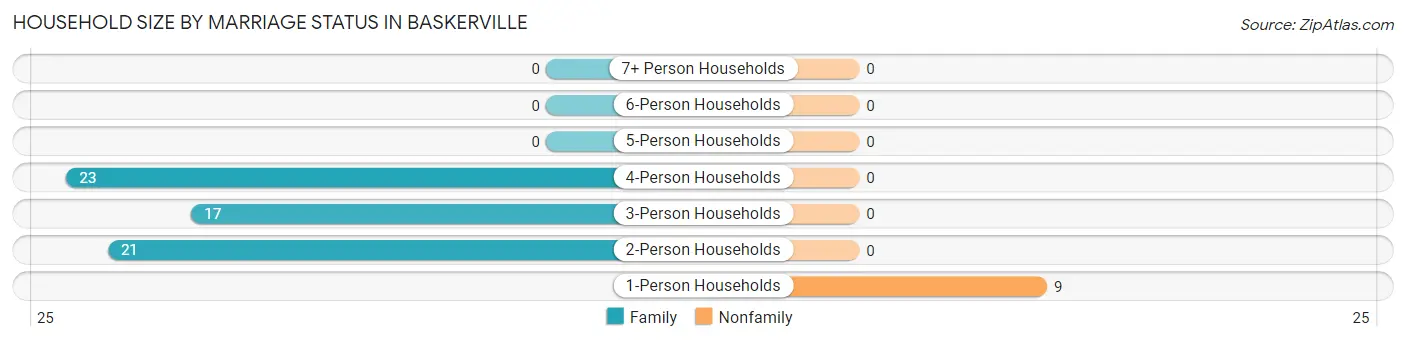
| Household Size | Family Households | Nonfamily Households |
| 1-Person Households | - | 9 (12.9%) |
| 2-Person Households | 21 (30.0%) | 0 (0.0%) |
| 3-Person Households | 17 (24.3%) | 0 (0.0%) |
| 4-Person Households | 23 (32.9%) | 0 (0.0%) |
| 5-Person Households | 0 (0.0%) | 0 (0.0%) |
| 6-Person Households | 0 (0.0%) | 0 (0.0%) |
| 7+ Person Households | 0 (0.0%) | 0 (0.0%) |
| Total | 61 (87.1%) | 9 (12.9%) |
Female Fertility in Baskerville
Fertility by Age in Baskerville
Average fertility rate in Baskerville is 528.0 births per 1,000 women. Women in the age bracket of 15 to 19 years have the highest fertility rate with 1,000.0 births per 1,000 women. Women in the age bracket of 20 to 34 years acount for 94.7% of all women with births.
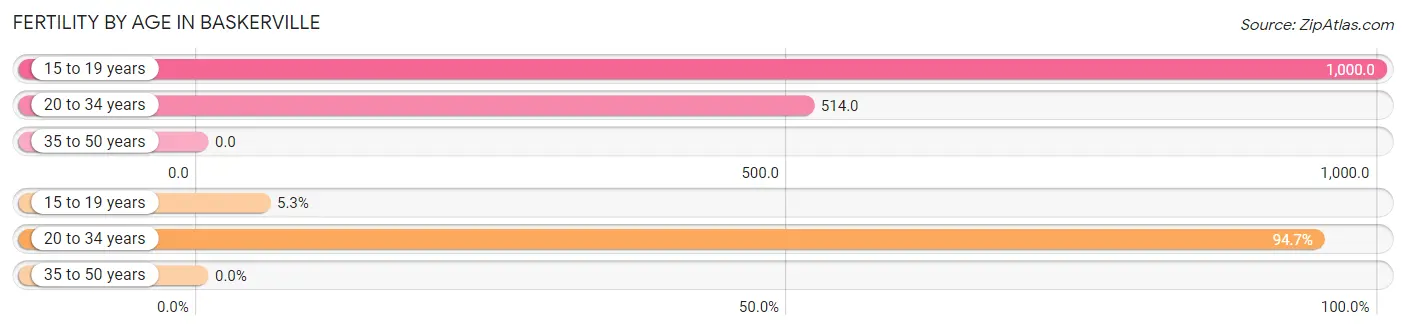
| Age Bracket | Women with Births | Births / 1,000 Women |
| 15 to 19 years | 1 (5.3%) | 1,000.0 |
| 20 to 34 years | 18 (94.7%) | 514.0 |
| 35 to 50 years | 0 (0.0%) | 0.0 |
| Total | 19 (100.0%) | 528.0 |
Fertility by Age by Marriage Status in Baskerville
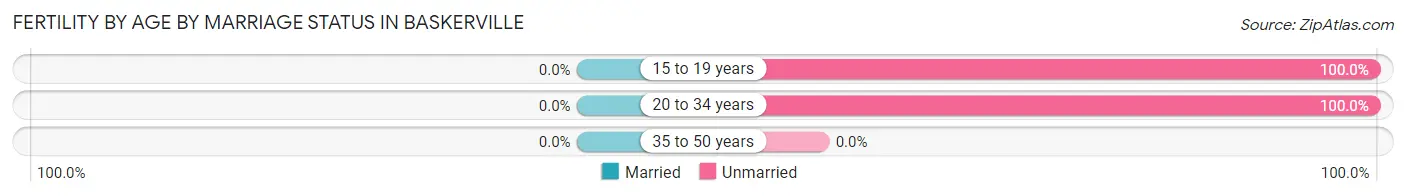
| Age Bracket | Married | Unmarried |
| 15 to 19 years | 0 (0.0%) | 1 (100.0%) |
| 20 to 34 years | 0 (0.0%) | 18 (100.0%) |
| 35 to 50 years | 0 (0.0%) | 0 (0.0%) |
| Total | 0 (0.0%) | 19 (100.0%) |
Fertility by Education in Baskerville
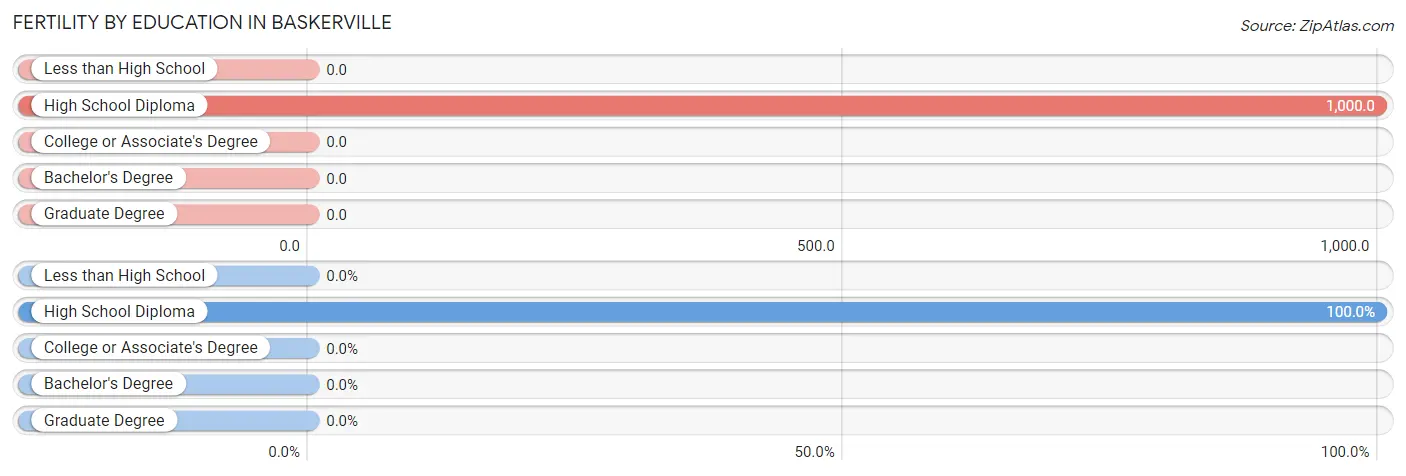
| Educational Attainment | Women with Births | Births / 1,000 Women |
| Less than High School | 0 (0.0%) | 0.0 |
| High School Diploma | 19 (100.0%) | 1,000.0 |
| College or Associate's Degree | 0 (0.0%) | 0.0 |
| Bachelor's Degree | 0 (0.0%) | 0.0 |
| Graduate Degree | 0 (0.0%) | 0.0 |
| Total | 19 (100.0%) | 528.0 |
Fertility by Education by Marriage Status in Baskerville
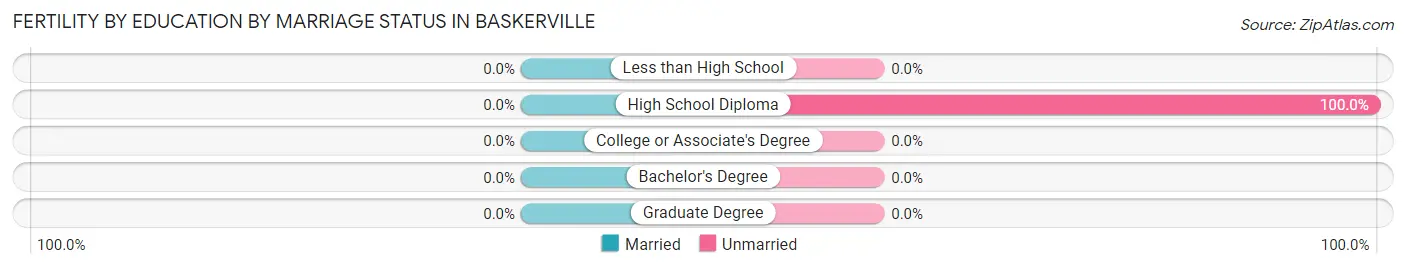
| Educational Attainment | Married | Unmarried |
| Less than High School | 0 (0.0%) | 0 (0.0%) |
| High School Diploma | 0 (0.0%) | 19 (100.0%) |
| College or Associate's Degree | 0 (0.0%) | 0 (0.0%) |
| Bachelor's Degree | 0 (0.0%) | 0 (0.0%) |
| Graduate Degree | 0 (0.0%) | 0 (0.0%) |
| Total | 0 (0.0%) | 19 (100.0%) |
Employment Characteristics in Baskerville
Employment by Class of Employer in Baskerville
Among the 45 employed individuals in Baskerville, , and private company employees (45 | 100.0%) make up the most common classes of employment.
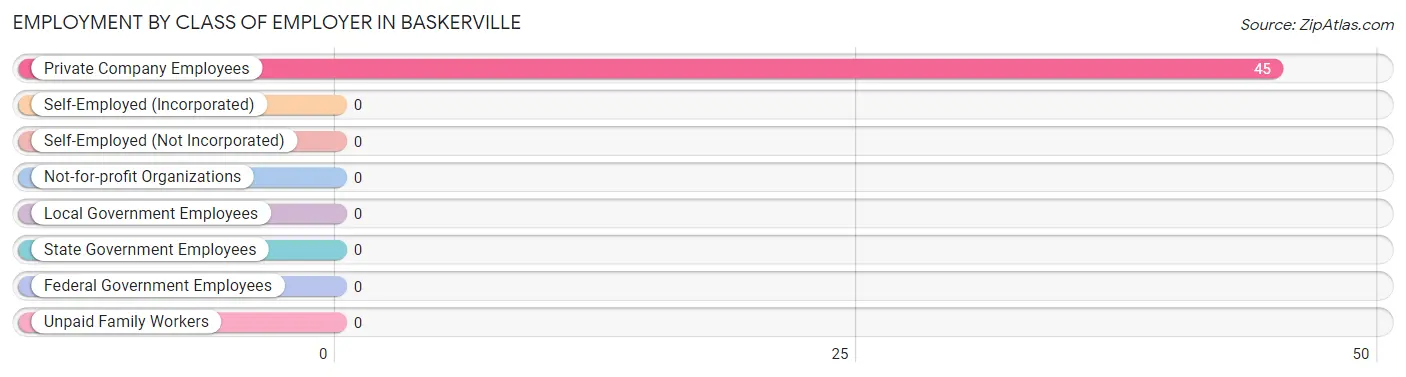
| Employer Class | # Employees | % Employees |
| Private Company Employees | 45 | 100.0% |
| Self-Employed (Incorporated) | 0 | 0.0% |
| Self-Employed (Not Incorporated) | 0 | 0.0% |
| Not-for-profit Organizations | 0 | 0.0% |
| Local Government Employees | 0 | 0.0% |
| State Government Employees | 0 | 0.0% |
| Federal Government Employees | 0 | 0.0% |
| Unpaid Family Workers | 0 | 0.0% |
| Total | 45 | 100.0% |
Employment Status by Age in Baskerville
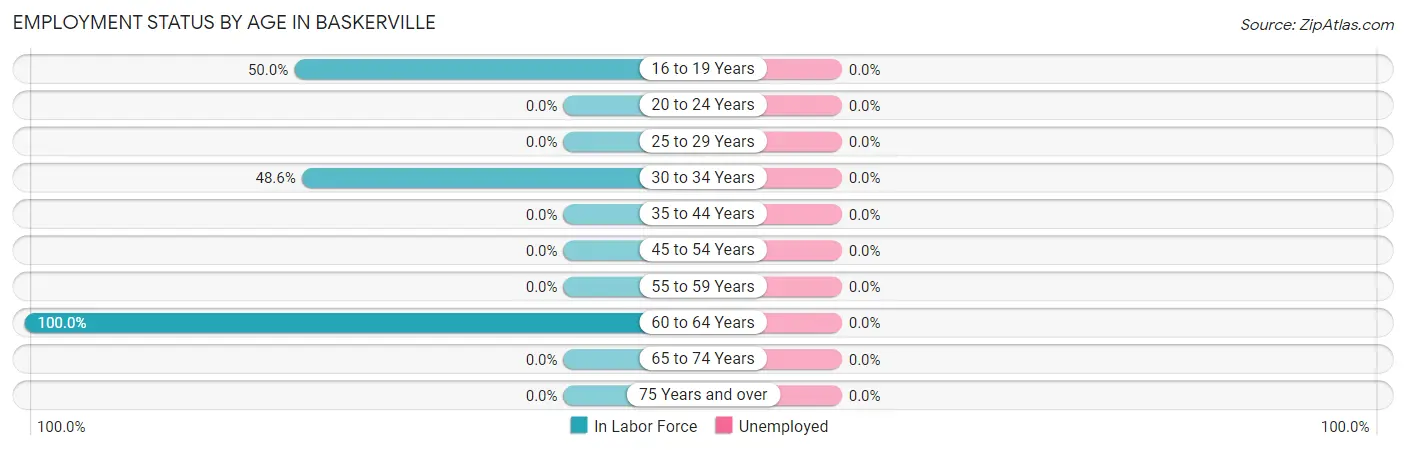
| Age Bracket | In Labor Force | Unemployed |
| 16 to 19 Years | 1 (50.0%) | 0 (0.0%) |
| 20 to 24 Years | 0 (0.0%) | 0 (0.0%) |
| 25 to 29 Years | 0 (0.0%) | 0 (0.0%) |
| 30 to 34 Years | 17 (48.6%) | 0 (0.0%) |
| 35 to 44 Years | 0 (0.0%) | 0 (0.0%) |
| 45 to 54 Years | 0 (0.0%) | 0 (0.0%) |
| 55 to 59 Years | 0 (0.0%) | 0 (0.0%) |
| 60 to 64 Years | 27 (100.0%) | 0 (0.0%) |
| 65 to 74 Years | 0 (0.0%) | 0 (0.0%) |
| 75 Years and over | 0 (0.0%) | 0 (0.0%) |
| Total | 45 (34.4%) | 0 (0.0%) |
Employment Status by Educational Attainment in Baskerville
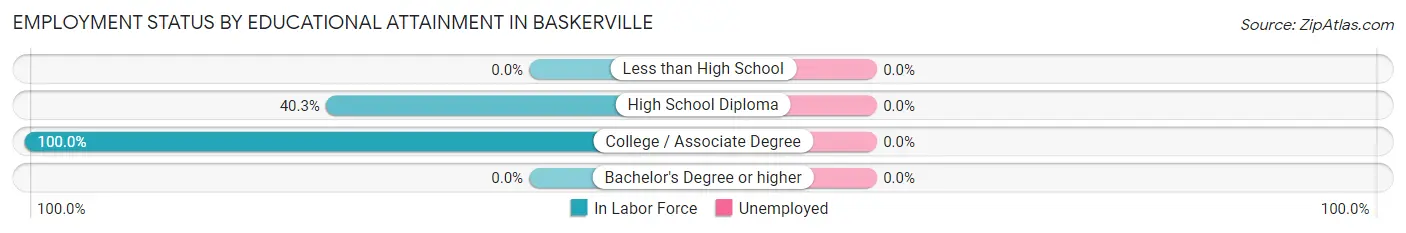
| Educational Attainment | In Labor Force | Unemployed |
| Less than High School | 0 (0.0%) | 0 (0.0%) |
| High School Diploma | 27 (40.3%) | 0 (0.0%) |
| College / Associate Degree | 17 (100.0%) | 0 (0.0%) |
| Bachelor's Degree or higher | 0 (0.0%) | 0 (0.0%) |
| Total | 44 (52.4%) | 0 (0.0%) |
Employment Occupations by Sex in Baskerville
Management, Business, Science and Arts Occupations
The most common Management, Business, Science and Arts occupations in Baskerville are , and Health Diagnosing & Treating (17 | 37.8%).
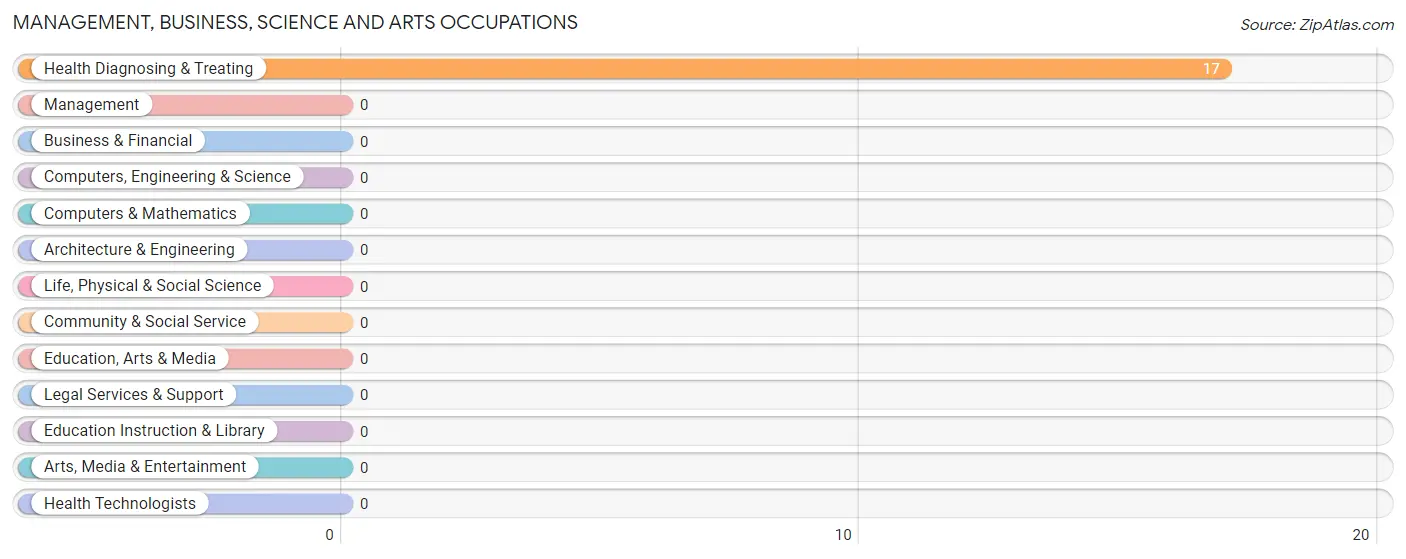
Management, Business, Science and Arts Occupations by Sex
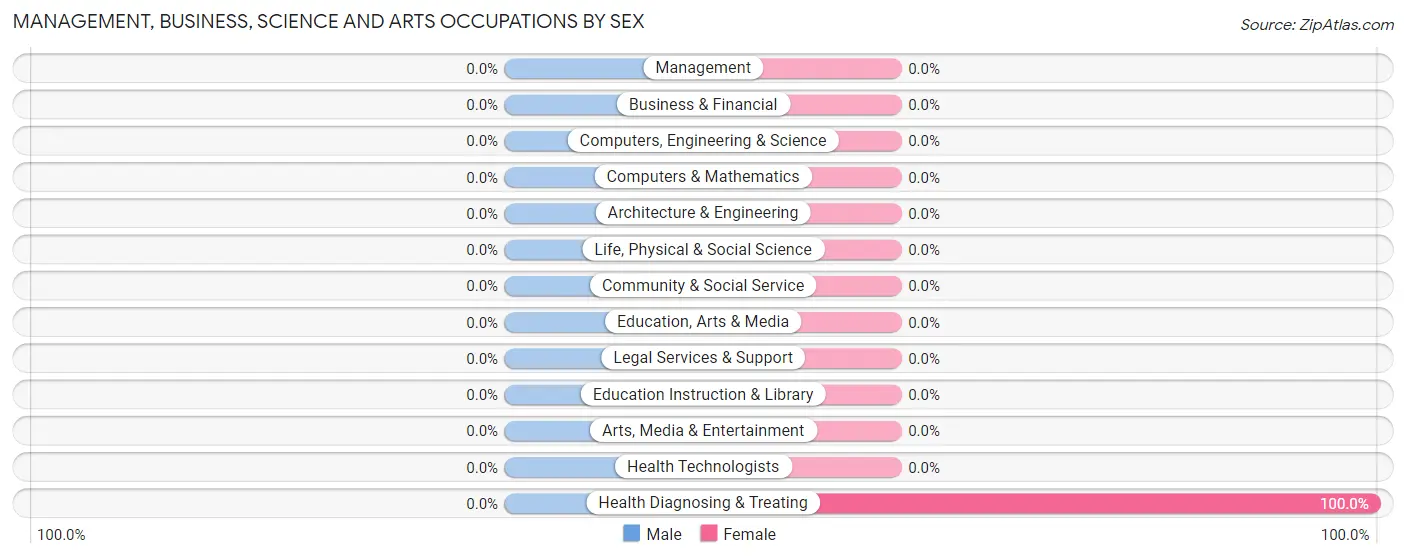
| Occupation | Male | Female |
| Management | 0 (0.0%) | 0 (0.0%) |
| Business & Financial | 0 (0.0%) | 0 (0.0%) |
| Computers, Engineering & Science | 0 (0.0%) | 0 (0.0%) |
| Computers & Mathematics | 0 (0.0%) | 0 (0.0%) |
| Architecture & Engineering | 0 (0.0%) | 0 (0.0%) |
| Life, Physical & Social Science | 0 (0.0%) | 0 (0.0%) |
| Community & Social Service | 0 (0.0%) | 0 (0.0%) |
| Education, Arts & Media | 0 (0.0%) | 0 (0.0%) |
| Legal Services & Support | 0 (0.0%) | 0 (0.0%) |
| Education Instruction & Library | 0 (0.0%) | 0 (0.0%) |
| Arts, Media & Entertainment | 0 (0.0%) | 0 (0.0%) |
| Health Diagnosing & Treating | 0 (0.0%) | 17 (100.0%) |
| Health Technologists | 0 (0.0%) | 0 (0.0%) |
| Total (Category) | 0 (0.0%) | 17 (100.0%) |
| Total (Overall) | 27 (60.0%) | 18 (40.0%) |
Services Occupations
Services Occupations by Sex
| Occupation | Male | Female |
| Healthcare Support | 0 (0.0%) | 0 (0.0%) |
| Security & Protection | 0 (0.0%) | 0 (0.0%) |
| Firefighting & Prevention | 0 (0.0%) | 0 (0.0%) |
| Law Enforcement | 0 (0.0%) | 0 (0.0%) |
| Food Preparation & Serving | 0 (0.0%) | 0 (0.0%) |
| Cleaning & Maintenance | 0 (0.0%) | 0 (0.0%) |
| Personal Care & Service | 0 (0.0%) | 0 (0.0%) |
| Total (Category) | 0 (0.0%) | 0 (0.0%) |
| Total (Overall) | 27 (60.0%) | 18 (40.0%) |
Sales and Office Occupations
The most common Sales and Office occupations in Baskerville are , and Sales & Related (1 | 2.2%).

Sales and Office Occupations by Sex

| Occupation | Male | Female |
| Sales & Related | 0 (0.0%) | 1 (100.0%) |
| Office & Administration | 0 (0.0%) | 0 (0.0%) |
| Total (Category) | 0 (0.0%) | 1 (100.0%) |
| Total (Overall) | 27 (60.0%) | 18 (40.0%) |
Natural Resources, Construction and Maintenance Occupations
Natural Resources, Construction and Maintenance Occupations by Sex
| Occupation | Male | Female |
| Farming, Fishing & Forestry | 0 (0.0%) | 0 (0.0%) |
| Construction & Extraction | 0 (0.0%) | 0 (0.0%) |
| Installation, Maintenance & Repair | 0 (0.0%) | 0 (0.0%) |
| Total (Category) | 0 (0.0%) | 0 (0.0%) |
| Total (Overall) | 27 (60.0%) | 18 (40.0%) |
Production, Transportation and Moving Occupations
The most common Production, Transportation and Moving occupations in Baskerville are , and Transportation (27 | 60.0%).
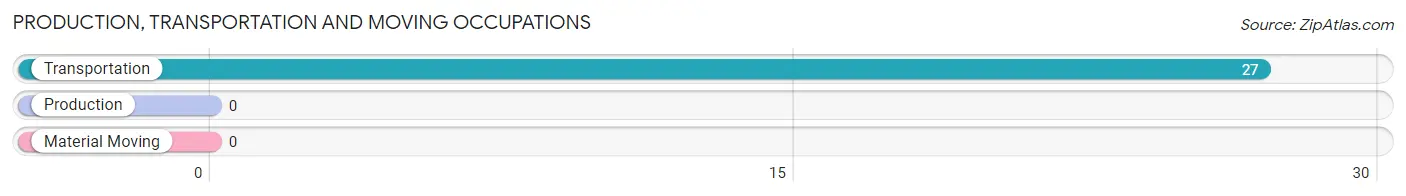
Production, Transportation and Moving Occupations by Sex
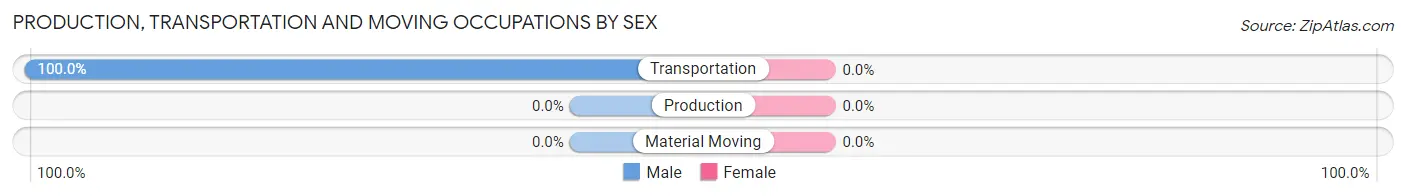
| Occupation | Male | Female |
| Production | 0 (0.0%) | 0 (0.0%) |
| Transportation | 27 (100.0%) | 0 (0.0%) |
| Material Moving | 0 (0.0%) | 0 (0.0%) |
| Total (Category) | 27 (100.0%) | 0 (0.0%) |
| Total (Overall) | 27 (60.0%) | 18 (40.0%) |
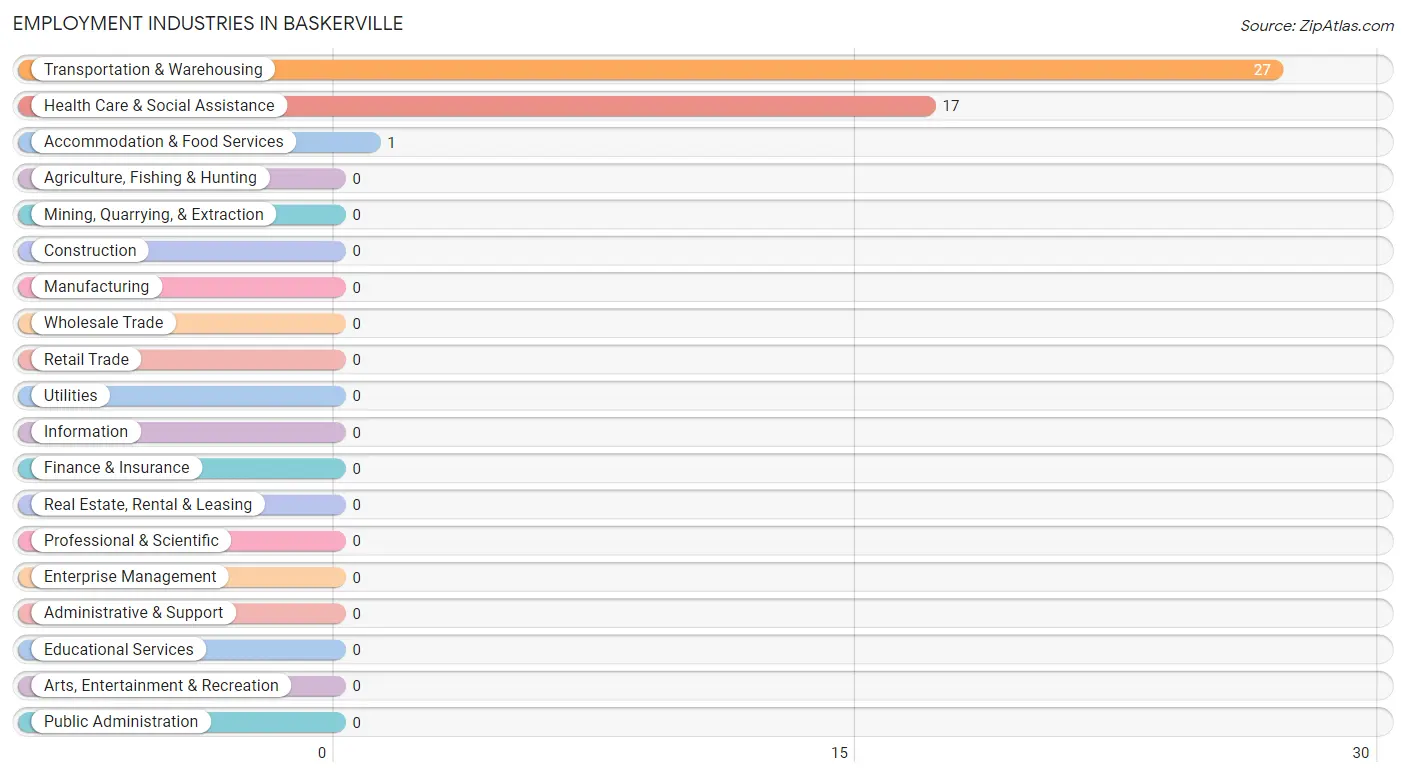
Employment Industries by Sex in Baskerville
Employment Industries in Baskerville
The major employment industries in Baskerville include Transportation & Warehousing (27 | 60.0%), Health Care & Social Assistance (17 | 37.8%), and Accommodation & Food Services (1 | 2.2%).
Employment Industries by Sex in Baskerville
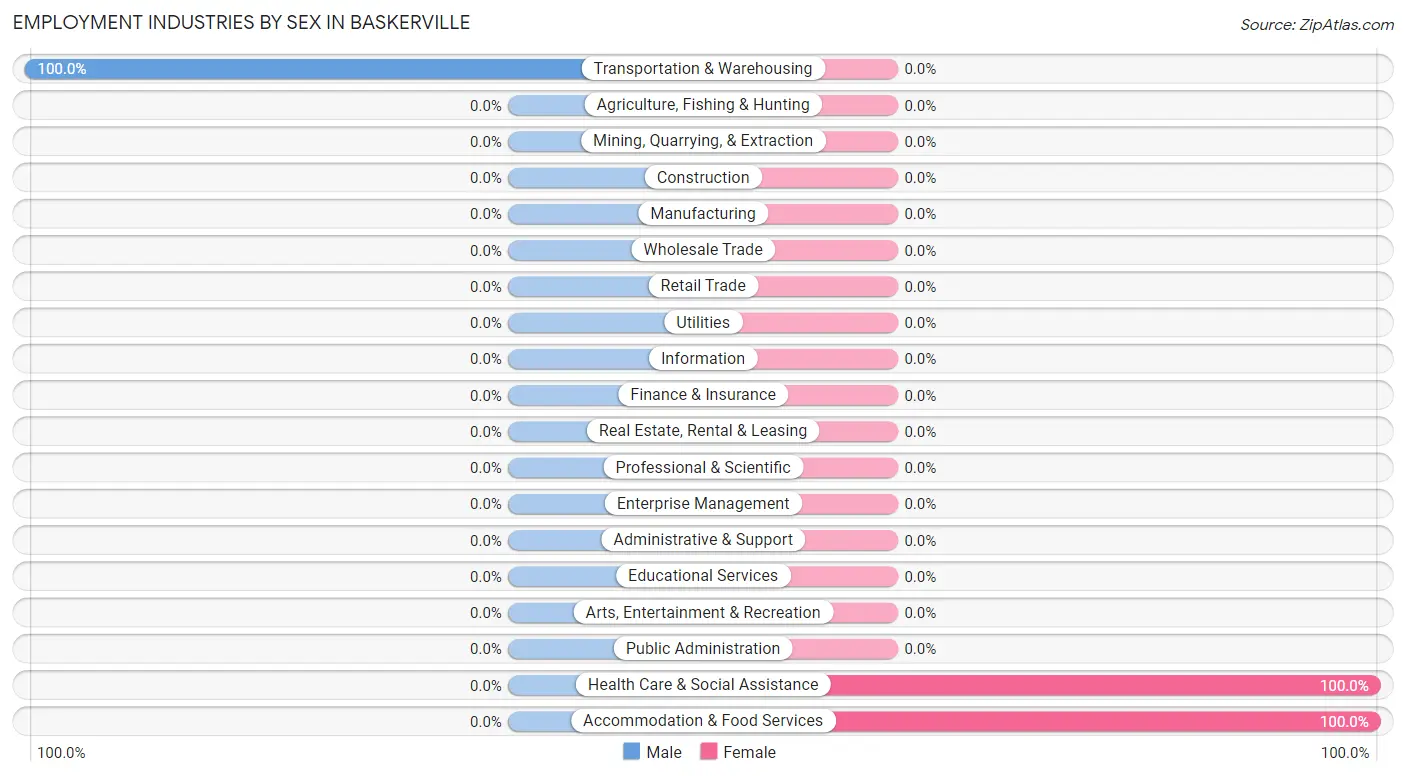
| Industry | Male | Female |
| Agriculture, Fishing & Hunting | 0 (0.0%) | 0 (0.0%) |
| Mining, Quarrying, & Extraction | 0 (0.0%) | 0 (0.0%) |
| Construction | 0 (0.0%) | 0 (0.0%) |
| Manufacturing | 0 (0.0%) | 0 (0.0%) |
| Wholesale Trade | 0 (0.0%) | 0 (0.0%) |
| Retail Trade | 0 (0.0%) | 0 (0.0%) |
| Transportation & Warehousing | 27 (100.0%) | 0 (0.0%) |
| Utilities | 0 (0.0%) | 0 (0.0%) |
| Information | 0 (0.0%) | 0 (0.0%) |
| Finance & Insurance | 0 (0.0%) | 0 (0.0%) |
| Real Estate, Rental & Leasing | 0 (0.0%) | 0 (0.0%) |
| Professional & Scientific | 0 (0.0%) | 0 (0.0%) |
| Enterprise Management | 0 (0.0%) | 0 (0.0%) |
| Administrative & Support | 0 (0.0%) | 0 (0.0%) |
| Educational Services | 0 (0.0%) | 0 (0.0%) |
| Health Care & Social Assistance | 0 (0.0%) | 17 (100.0%) |
| Arts, Entertainment & Recreation | 0 (0.0%) | 0 (0.0%) |
| Accommodation & Food Services | 0 (0.0%) | 1 (100.0%) |
| Public Administration | 0 (0.0%) | 0 (0.0%) |
| Total | 27 (60.0%) | 18 (40.0%) |
Education in Baskerville
School Enrollment in Baskerville
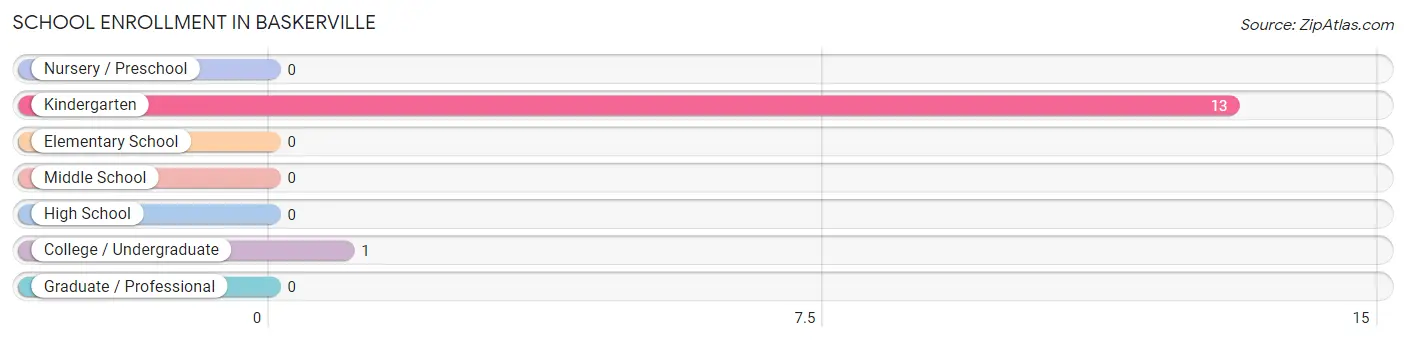
The most common levels of schooling among the 14 students in Baskerville are kindergarten (13 | 92.9%), and college / undergraduate (1 | 7.1%).
| School Level | # Students | % Students |
| Nursery / Preschool | 0 | 0.0% |
| Kindergarten | 13 | 92.9% |
| Elementary School | 0 | 0.0% |
| Middle School | 0 | 0.0% |
| High School | 0 | 0.0% |
| College / Undergraduate | 1 | 7.1% |
| Graduate / Professional | 0 | 0.0% |
| Total | 14 | 100.0% |
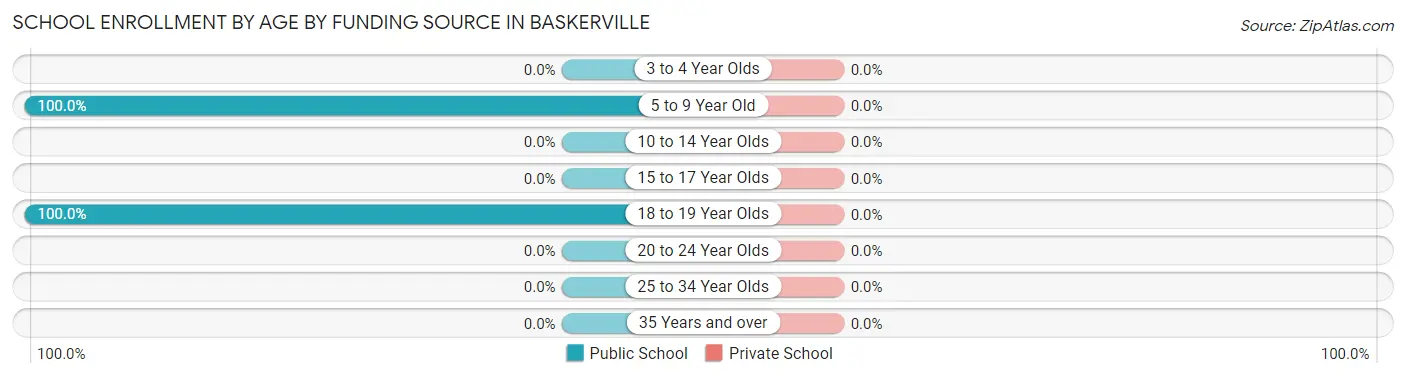
School Enrollment by Age by Funding Source in Baskerville
| Age Bracket | Public School | Private School |
| 3 to 4 Year Olds | 0 (0.0%) | 0 (0.0%) |
| 5 to 9 Year Old | 13 (100.0%) | 0 (0.0%) |
| 10 to 14 Year Olds | 0 (0.0%) | 0 (0.0%) |
| 15 to 17 Year Olds | 0 (0.0%) | 0 (0.0%) |
| 18 to 19 Year Olds | 1 (100.0%) | 0 (0.0%) |
| 20 to 24 Year Olds | 0 (0.0%) | 0 (0.0%) |
| 25 to 34 Year Olds | 0 (0.0%) | 0 (0.0%) |
| 35 Years and over | 0 (0.0%) | 0 (0.0%) |
| Total | 14 (100.0%) | 0 (0.0%) |
Educational Attainment by Field of Study in Baskerville
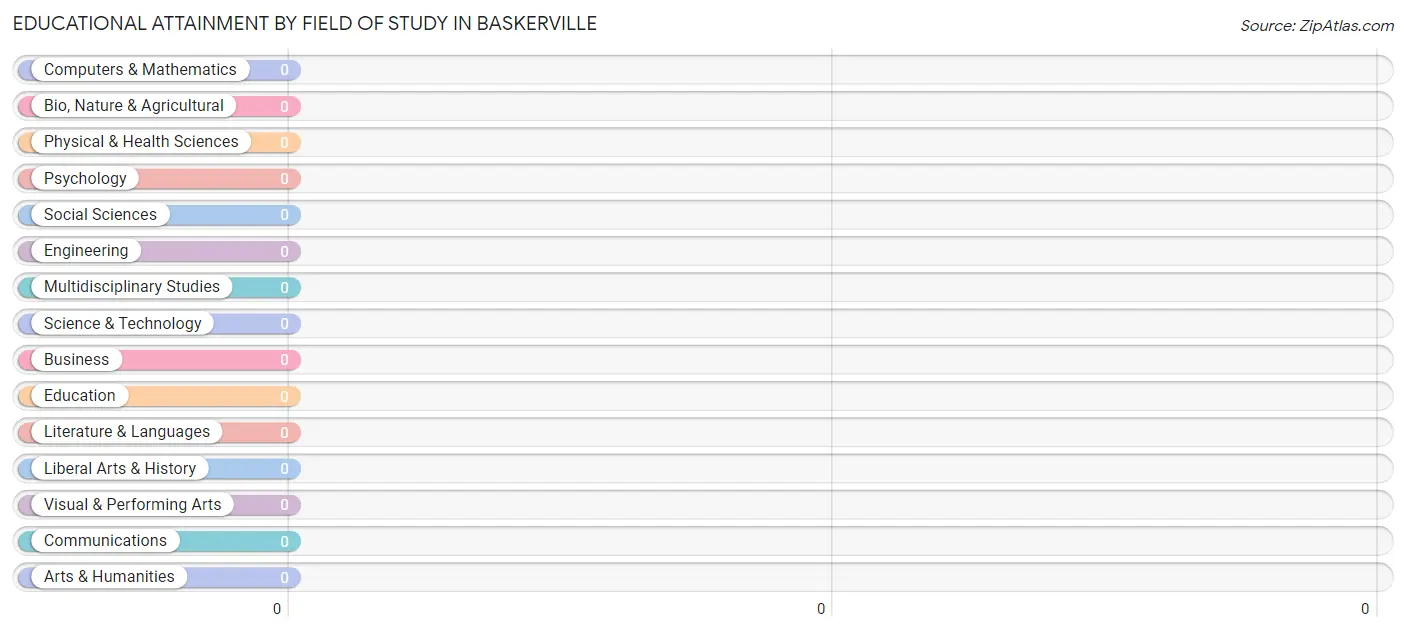
| Field of Study | # Graduates | % Graduates |
| Computers & Mathematics | 0 | 0.0% |
| Bio, Nature & Agricultural | 0 | 0.0% |
| Physical & Health Sciences | 0 | 0.0% |
| Psychology | 0 | 0.0% |
| Social Sciences | 0 | 0.0% |
| Engineering | 0 | 0.0% |
| Multidisciplinary Studies | 0 | 0.0% |
| Science & Technology | 0 | 0.0% |
| Business | 0 | 0.0% |
| Education | 0 | 0.0% |
| Literature & Languages | 0 | 0.0% |
| Liberal Arts & History | 0 | 0.0% |
| Visual & Performing Arts | 0 | 0.0% |
| Communications | 0 | 0.0% |
| Arts & Humanities | 0 | 0.0% |
| Total | 0 | 0.0% |
Transportation & Commute in Baskerville
Vehicle Availability by Sex in Baskerville
The most prevalent vehicle ownership categories in Baskerville are males with 1 vehicle (27, accounting for 100.0%) and females with 1 vehicle (17, making up 158.8%).
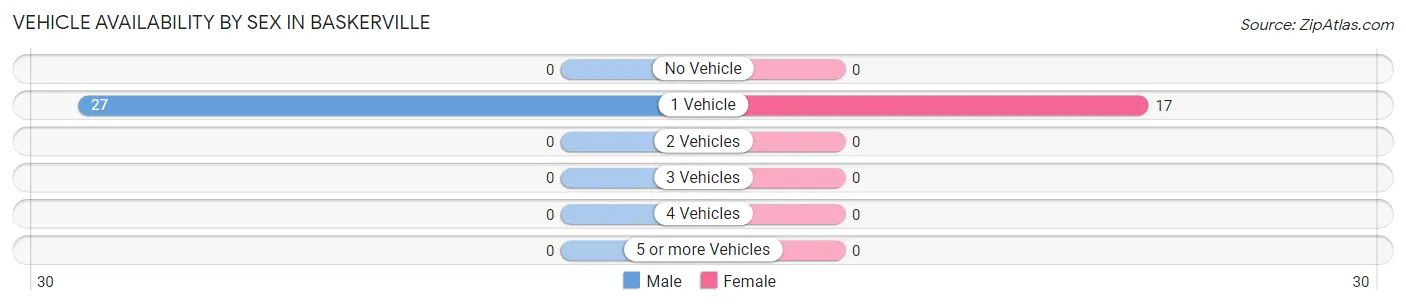
| Vehicles Available | Male | Female |
| No Vehicle | 0 (0.0%) | 0 (0.0%) |
| 1 Vehicle | 27 (100.0%) | 17 (100.0%) |
| 2 Vehicles | 0 (0.0%) | 0 (0.0%) |
| 3 Vehicles | 0 (0.0%) | 0 (0.0%) |
| 4 Vehicles | 0 (0.0%) | 0 (0.0%) |
| 5 or more Vehicles | 0 (0.0%) | 0 (0.0%) |
| Total | 27 (100.0%) | 17 (100.0%) |
Commute Time in Baskerville
The most frequently occuring commute durations in Baskerville are 90 or more minutes (27 commuters, 60.0%), 20 to 24 minutes (17 commuters, 37.8%), and 30 to 34 minutes (1 commuters, 2.2%).
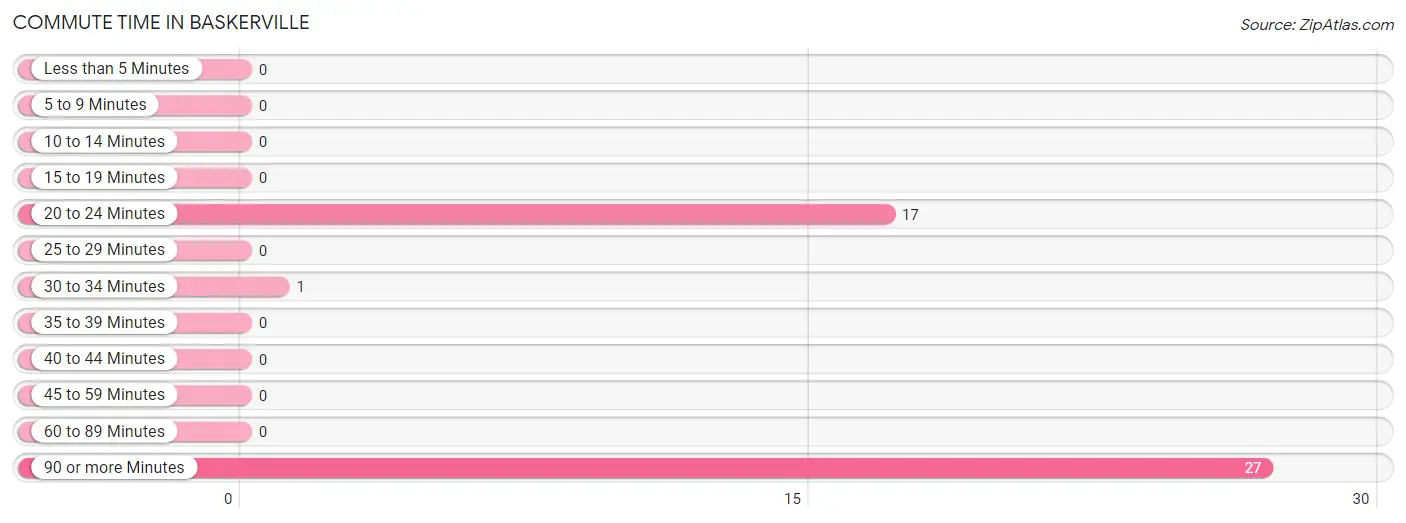
| Commute Time | # Commuters | % Commuters |
| Less than 5 Minutes | 0 | 0.0% |
| 5 to 9 Minutes | 0 | 0.0% |
| 10 to 14 Minutes | 0 | 0.0% |
| 15 to 19 Minutes | 0 | 0.0% |
| 20 to 24 Minutes | 17 | 37.8% |
| 25 to 29 Minutes | 0 | 0.0% |
| 30 to 34 Minutes | 1 | 2.2% |
| 35 to 39 Minutes | 0 | 0.0% |
| 40 to 44 Minutes | 0 | 0.0% |
| 45 to 59 Minutes | 0 | 0.0% |
| 60 to 89 Minutes | 0 | 0.0% |
| 90 or more Minutes | 27 | 60.0% |
Commute Time by Sex in Baskerville
The most common commute times in Baskerville are 90 or more minutes (27 commuters, 100.0%) for males and 20 to 24 minutes (17 commuters, 94.4%) for females.
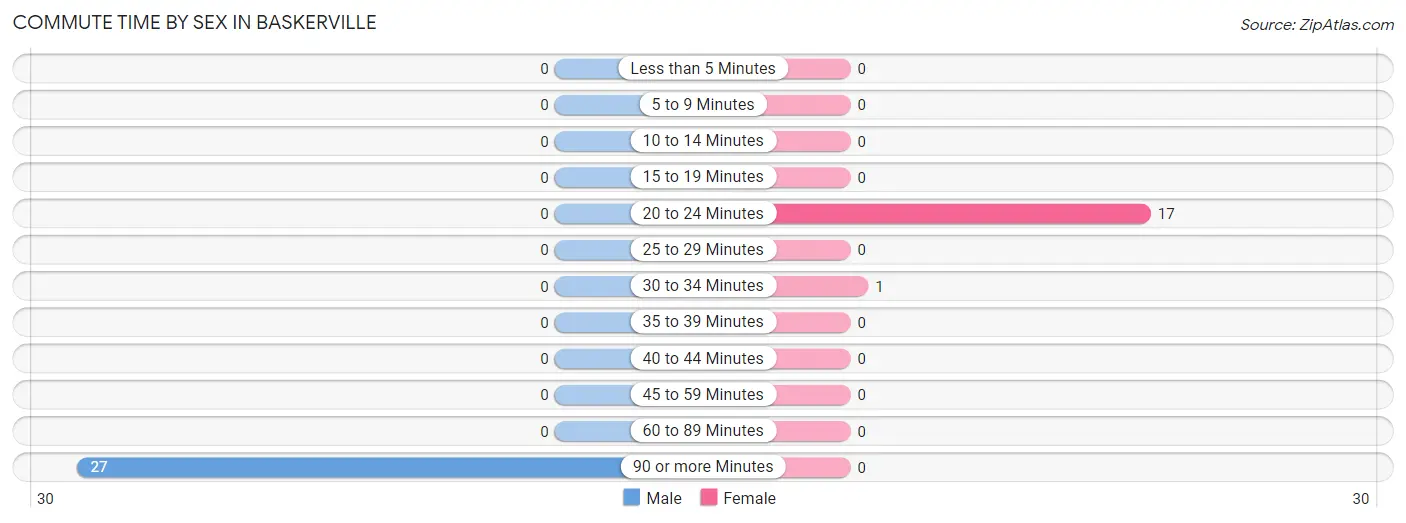
| Commute Time | Male | Female |
| Less than 5 Minutes | 0 (0.0%) | 0 (0.0%) |
| 5 to 9 Minutes | 0 (0.0%) | 0 (0.0%) |
| 10 to 14 Minutes | 0 (0.0%) | 0 (0.0%) |
| 15 to 19 Minutes | 0 (0.0%) | 0 (0.0%) |
| 20 to 24 Minutes | 0 (0.0%) | 17 (94.4%) |
| 25 to 29 Minutes | 0 (0.0%) | 0 (0.0%) |
| 30 to 34 Minutes | 0 (0.0%) | 1 (5.6%) |
| 35 to 39 Minutes | 0 (0.0%) | 0 (0.0%) |
| 40 to 44 Minutes | 0 (0.0%) | 0 (0.0%) |
| 45 to 59 Minutes | 0 (0.0%) | 0 (0.0%) |
| 60 to 89 Minutes | 0 (0.0%) | 0 (0.0%) |
| 90 or more Minutes | 27 (100.0%) | 0 (0.0%) |
Time of Departure to Work by Sex in Baskerville
The most frequent times of departure to work in Baskerville are 12:00 AM to 4:59 AM (27, 100.0%) for males and 4:00 PM to 11:59 PM (18, 100.0%) for females.
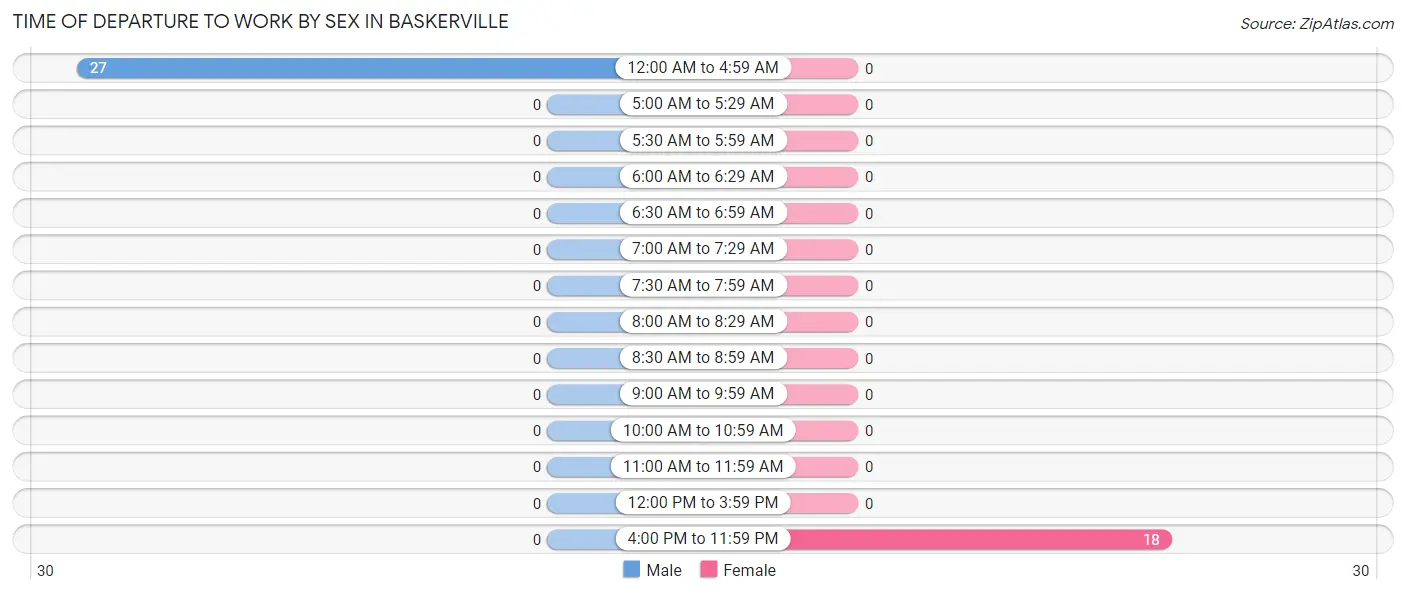
| Time of Departure | Male | Female |
| 12:00 AM to 4:59 AM | 27 (100.0%) | 0 (0.0%) |
| 5:00 AM to 5:29 AM | 0 (0.0%) | 0 (0.0%) |
| 5:30 AM to 5:59 AM | 0 (0.0%) | 0 (0.0%) |
| 6:00 AM to 6:29 AM | 0 (0.0%) | 0 (0.0%) |
| 6:30 AM to 6:59 AM | 0 (0.0%) | 0 (0.0%) |
| 7:00 AM to 7:29 AM | 0 (0.0%) | 0 (0.0%) |
| 7:30 AM to 7:59 AM | 0 (0.0%) | 0 (0.0%) |
| 8:00 AM to 8:29 AM | 0 (0.0%) | 0 (0.0%) |
| 8:30 AM to 8:59 AM | 0 (0.0%) | 0 (0.0%) |
| 9:00 AM to 9:59 AM | 0 (0.0%) | 0 (0.0%) |
| 10:00 AM to 10:59 AM | 0 (0.0%) | 0 (0.0%) |
| 11:00 AM to 11:59 AM | 0 (0.0%) | 0 (0.0%) |
| 12:00 PM to 3:59 PM | 0 (0.0%) | 0 (0.0%) |
| 4:00 PM to 11:59 PM | 0 (0.0%) | 18 (100.0%) |
| Total | 27 (100.0%) | 18 (100.0%) |
Housing Occupancy in Baskerville
Occupancy by Ownership in Baskerville
Of the total 70 dwellings in Baskerville, owner-occupied units account for 0 (0.0%), while renter-occupied units make up 70 (100.0%).
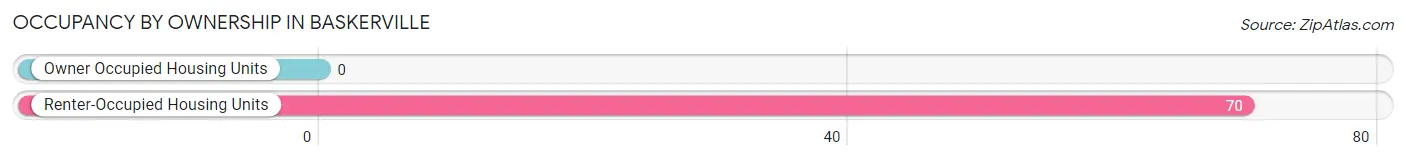
| Occupancy | # Housing Units | % Housing Units |
| Owner Occupied Housing Units | 0 | 0.0% |
| Renter-Occupied Housing Units | 70 | 100.0% |
| Total Occupied Housing Units | 70 | 100.0% |
Occupancy by Household Size in Baskerville
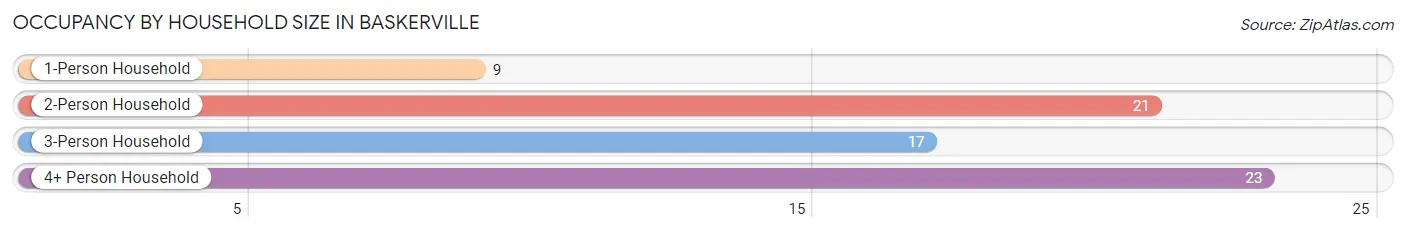
| Household Size | # Housing Units | % Housing Units |
| 1-Person Household | 9 | 12.9% |
| 2-Person Household | 21 | 30.0% |
| 3-Person Household | 17 | 24.3% |
| 4+ Person Household | 23 | 32.9% |
| Total Housing Units | 70 | 100.0% |
Occupancy by Ownership by Household Size in Baskerville
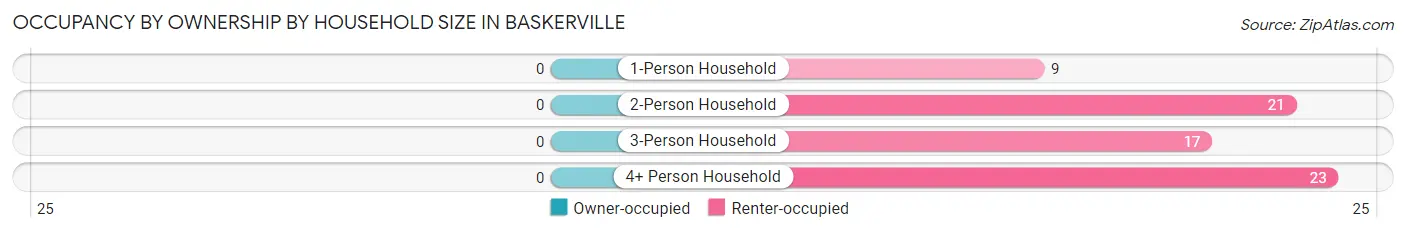
| Household Size | Owner-occupied | Renter-occupied |
| 1-Person Household | 0 (0.0%) | 9 (100.0%) |
| 2-Person Household | 0 (0.0%) | 21 (100.0%) |
| 3-Person Household | 0 (0.0%) | 17 (100.0%) |
| 4+ Person Household | 0 (0.0%) | 23 (100.0%) |
| Total Housing Units | 0 (0.0%) | 70 (100.0%) |
Occupancy by Educational Attainment in Baskerville
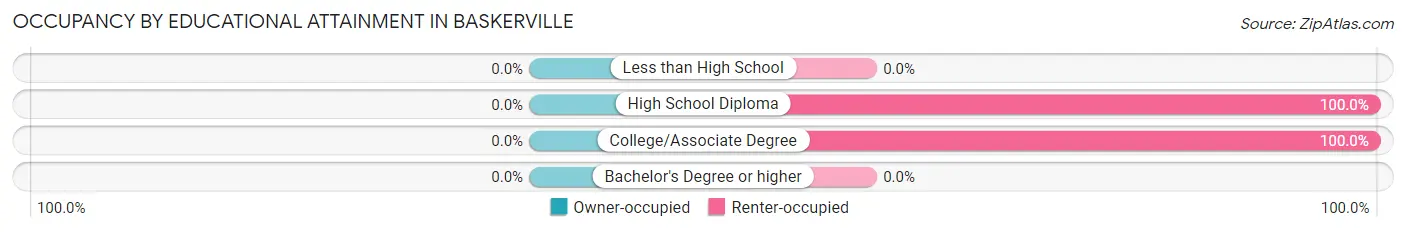
| Household Size | Owner-occupied | Renter-occupied |
| Less than High School | 0 (0.0%) | 0 (0.0%) |
| High School Diploma | 0 (0.0%) | 53 (100.0%) |
| College/Associate Degree | 0 (0.0%) | 17 (100.0%) |
| Bachelor's Degree or higher | 0 (0.0%) | 0 (0.0%) |
Occupancy by Age of Householder in Baskerville
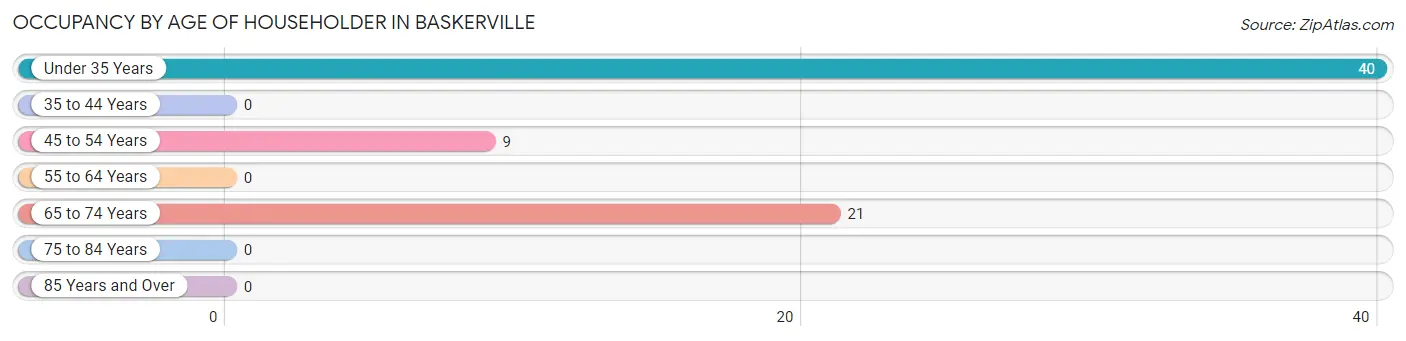
| Age Bracket | # Households | % Households |
| Under 35 Years | 40 | 57.1% |
| 35 to 44 Years | 0 | 0.0% |
| 45 to 54 Years | 9 | 12.9% |
| 55 to 64 Years | 0 | 0.0% |
| 65 to 74 Years | 21 | 30.0% |
| 75 to 84 Years | 0 | 0.0% |
| 85 Years and Over | 0 | 0.0% |
| Total | 70 | 100.0% |
Housing Finances in Baskerville
Median Income by Occupancy in Baskerville
| Occupancy Type | # Households | Median Income |
| Owner-Occupied | 0 (0.0%) | $0 |
| Renter-Occupied | 70 (100.0%) | $0 |
| Average | 70 (100.0%) | $0 |
Occupancy by Householder Income Bracket in Baskerville
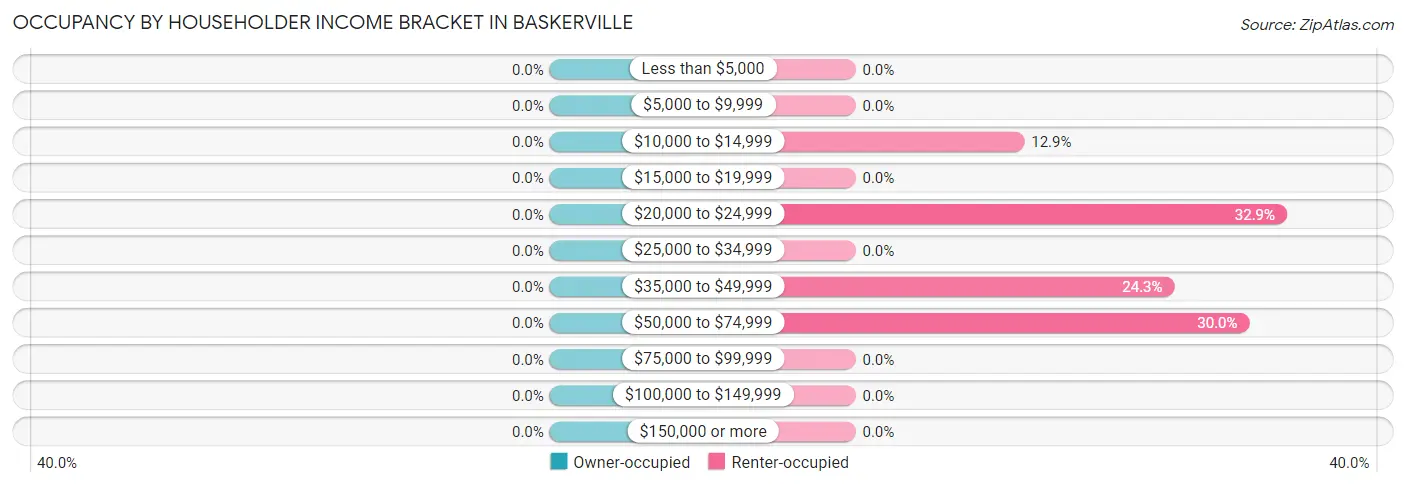
| Income Bracket | Owner-occupied | Renter-occupied |
| Less than $5,000 | 0 (0.0%) | 0 (0.0%) |
| $5,000 to $9,999 | 0 (0.0%) | 0 (0.0%) |
| $10,000 to $14,999 | 0 (0.0%) | 9 (12.9%) |
| $15,000 to $19,999 | 0 (0.0%) | 0 (0.0%) |
| $20,000 to $24,999 | 0 (0.0%) | 23 (32.9%) |
| $25,000 to $34,999 | 0 (0.0%) | 0 (0.0%) |
| $35,000 to $49,999 | 0 (0.0%) | 17 (24.3%) |
| $50,000 to $74,999 | 0 (0.0%) | 21 (30.0%) |
| $75,000 to $99,999 | 0 (0.0%) | 0 (0.0%) |
| $100,000 to $149,999 | 0 (0.0%) | 0 (0.0%) |
| $150,000 or more | 0 (0.0%) | 0 (0.0%) |
| Total | 0 (0.0%) | 70 (100.0%) |
Monthly Housing Cost Tiers in Baskerville
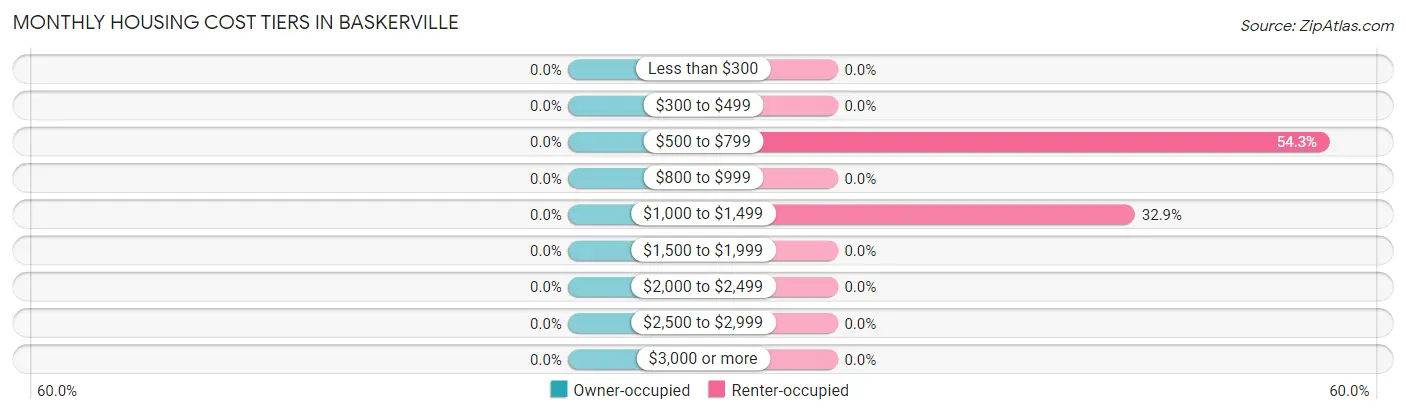
| Monthly Cost | Owner-occupied | Renter-occupied |
| Less than $300 | 0 (0.0%) | 0 (0.0%) |
| $300 to $499 | 0 (0.0%) | 0 (0.0%) |
| $500 to $799 | 0 (0.0%) | 38 (54.3%) |
| $800 to $999 | 0 (0.0%) | 0 (0.0%) |
| $1,000 to $1,499 | 0 (0.0%) | 23 (32.9%) |
| $1,500 to $1,999 | 0 (0.0%) | 0 (0.0%) |
| $2,000 to $2,499 | 0 (0.0%) | 0 (0.0%) |
| $2,500 to $2,999 | 0 (0.0%) | 0 (0.0%) |
| $3,000 or more | 0 (0.0%) | 0 (0.0%) |
| Total | 0 (0.0%) | 70 (100.0%) |
Physical Housing Characteristics in Baskerville
Housing Structures in Baskerville
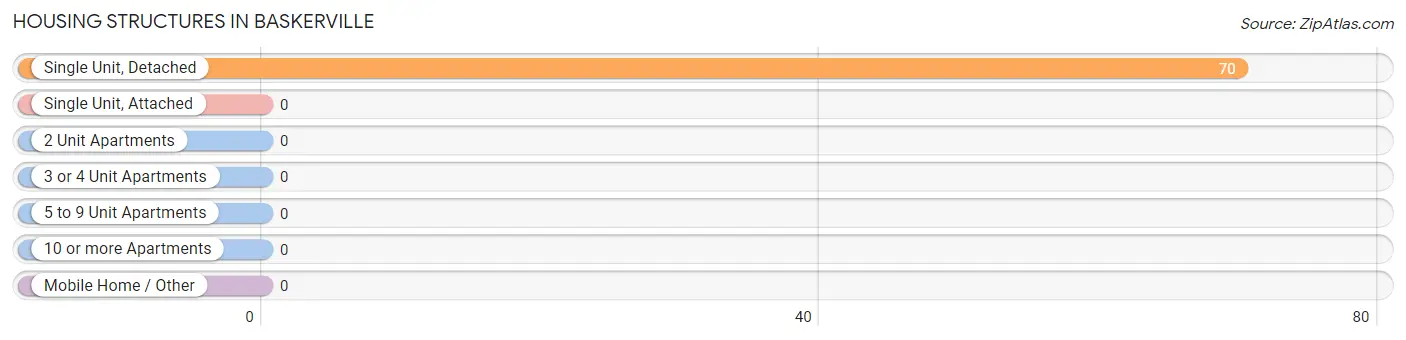
| Structure Type | # Housing Units | % Housing Units |
| Single Unit, Detached | 70 | 100.0% |
| Single Unit, Attached | 0 | 0.0% |
| 2 Unit Apartments | 0 | 0.0% |
| 3 or 4 Unit Apartments | 0 | 0.0% |
| 5 to 9 Unit Apartments | 0 | 0.0% |
| 10 or more Apartments | 0 | 0.0% |
| Mobile Home / Other | 0 | 0.0% |
| Total | 70 | 100.0% |
Housing Structures by Occupancy in Baskerville
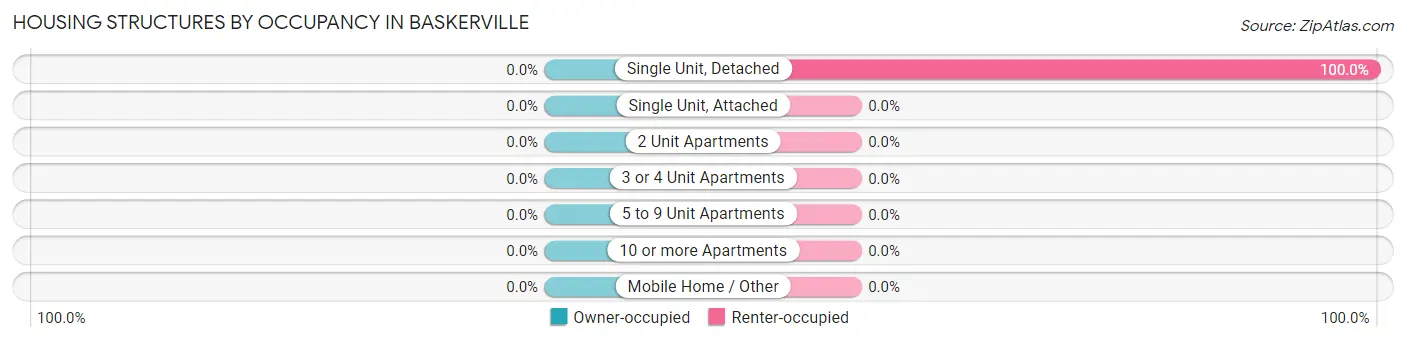
| Structure Type | Owner-occupied | Renter-occupied |
| Single Unit, Detached | 0 (0.0%) | 70 (100.0%) |
| Single Unit, Attached | 0 (0.0%) | 0 (0.0%) |
| 2 Unit Apartments | 0 (0.0%) | 0 (0.0%) |
| 3 or 4 Unit Apartments | 0 (0.0%) | 0 (0.0%) |
| 5 to 9 Unit Apartments | 0 (0.0%) | 0 (0.0%) |
| 10 or more Apartments | 0 (0.0%) | 0 (0.0%) |
| Mobile Home / Other | 0 (0.0%) | 0 (0.0%) |
| Total | 0 (0.0%) | 70 (100.0%) |
Housing Structures by Number of Rooms in Baskerville
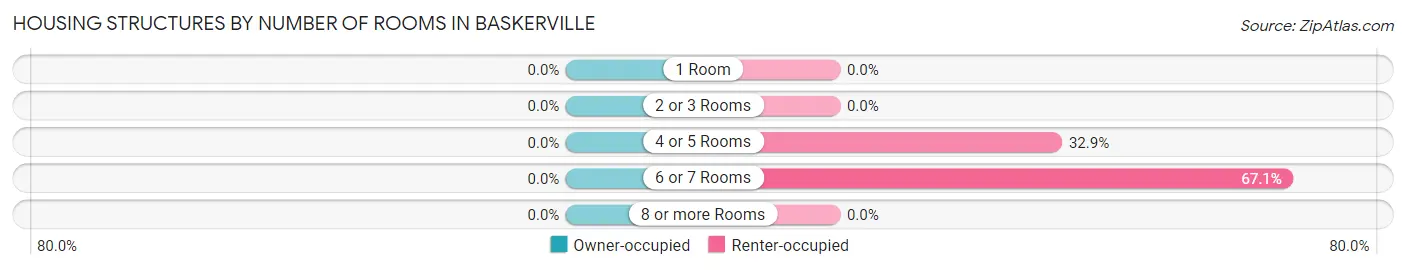
| Number of Rooms | Owner-occupied | Renter-occupied |
| 1 Room | 0 (0.0%) | 0 (0.0%) |
| 2 or 3 Rooms | 0 (0.0%) | 0 (0.0%) |
| 4 or 5 Rooms | 0 (0.0%) | 23 (32.9%) |
| 6 or 7 Rooms | 0 (0.0%) | 47 (67.1%) |
| 8 or more Rooms | 0 (0.0%) | 0 (0.0%) |
| Total | 0 (0.0%) | 70 (100.0%) |
Housing Structure by Heating Type in Baskerville
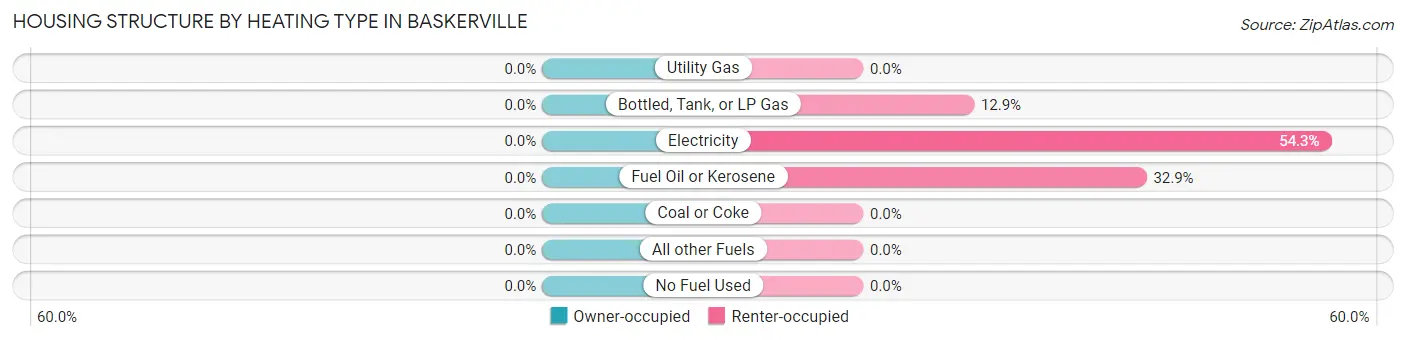
| Heating Type | Owner-occupied | Renter-occupied |
| Utility Gas | 0 (0.0%) | 0 (0.0%) |
| Bottled, Tank, or LP Gas | 0 (0.0%) | 9 (12.9%) |
| Electricity | 0 (0.0%) | 38 (54.3%) |
| Fuel Oil or Kerosene | 0 (0.0%) | 23 (32.9%) |
| Coal or Coke | 0 (0.0%) | 0 (0.0%) |
| All other Fuels | 0 (0.0%) | 0 (0.0%) |
| No Fuel Used | 0 (0.0%) | 0 (0.0%) |
| Total | 0 (0.0%) | 70 (100.0%) |
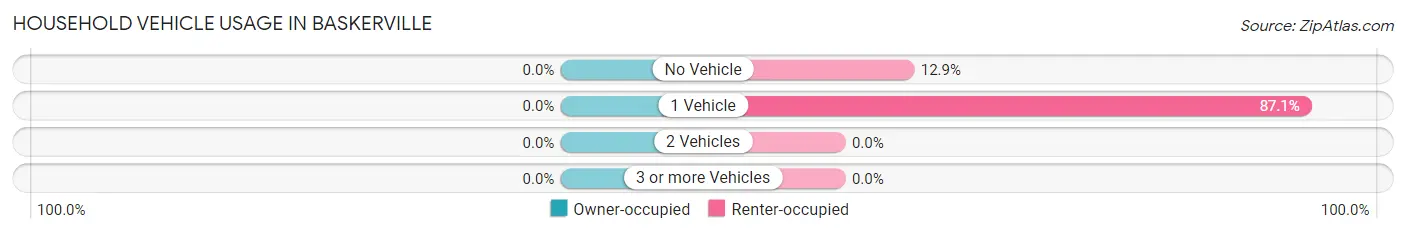
Household Vehicle Usage in Baskerville
| Vehicles per Household | Owner-occupied | Renter-occupied |
| No Vehicle | 0 (0.0%) | 9 (12.9%) |
| 1 Vehicle | 0 (0.0%) | 61 (87.1%) |
| 2 Vehicles | 0 (0.0%) | 0 (0.0%) |
| 3 or more Vehicles | 0 (0.0%) | 0 (0.0%) |
| Total | 0 (0.0%) | 70 (100.0%) |
Real Estate & Mortgages in Baskerville
Real Estate and Mortgage Overview in Baskerville
| Characteristic | Without Mortgage | With Mortgage |
| Housing Units | 0 | 0 |
| Median Property Value | - | - |
| Median Household Income | - | - |
| Monthly Housing Costs | - | - |
| Real Estate Taxes | - | - |
Property Value by Mortgage Status in Baskerville
| Property Value | Without Mortgage | With Mortgage |
| Less than $50,000 | 0 (0.0%) | 0 (0.0%) |
| $50,000 to $99,999 | 0 (0.0%) | 0 (0.0%) |
| $100,000 to $299,999 | 0 (0.0%) | 0 (0.0%) |
| $300,000 to $499,999 | 0 (0.0%) | 0 (0.0%) |
| $500,000 to $749,999 | 0 (0.0%) | 0 (0.0%) |
| $750,000 to $999,999 | 0 (0.0%) | 0 (0.0%) |
| $1,000,000 or more | 0 (0.0%) | 0 (0.0%) |
| Total | 0 (0.0%) | 0 (0.0%) |
Household Income by Mortgage Status in Baskerville
| Household Income | Without Mortgage | With Mortgage |
| Less than $10,000 | 0 (0.0%) | 0 (0.0%) |
| $10,000 to $24,999 | 0 (0.0%) | 0 (0.0%) |
| $25,000 to $34,999 | 0 (0.0%) | 0 (0.0%) |
| $35,000 to $49,999 | 0 (0.0%) | 0 (0.0%) |
| $50,000 to $74,999 | 0 (0.0%) | 0 (0.0%) |
| $75,000 to $99,999 | 0 (0.0%) | 0 (0.0%) |
| $100,000 to $149,999 | 0 (0.0%) | 0 (0.0%) |
| $150,000 or more | 0 (0.0%) | 0 (0.0%) |
| Total | 0 (0.0%) | 0 (0.0%) |
Property Value to Household Income Ratio in Baskerville
| Value-to-Income Ratio | Without Mortgage | With Mortgage |
| Less than 2.0x | 0 (0.0%) | 0 (0.0%) |
| 2.0x to 2.9x | 0 (0.0%) | 0 (0.0%) |
| 3.0x to 3.9x | 0 (0.0%) | 0 (0.0%) |
| 4.0x or more | 0 (0.0%) | 0 (0.0%) |
| Total | 0 (0.0%) | 0 (0.0%) |
Real Estate Taxes by Mortgage Status in Baskerville
| Property Taxes | Without Mortgage | With Mortgage |
| Less than $800 | 0 (0.0%) | 0 (0.0%) |
| $800 to $1,499 | 0 (0.0%) | 0 (0.0%) |
| $800 to $1,499 | 0 (0.0%) | 0 (0.0%) |
| Total | 0 (0.0%) | 0 (0.0%) |
Health & Disability in Baskerville
Health Insurance Coverage by Age in Baskerville
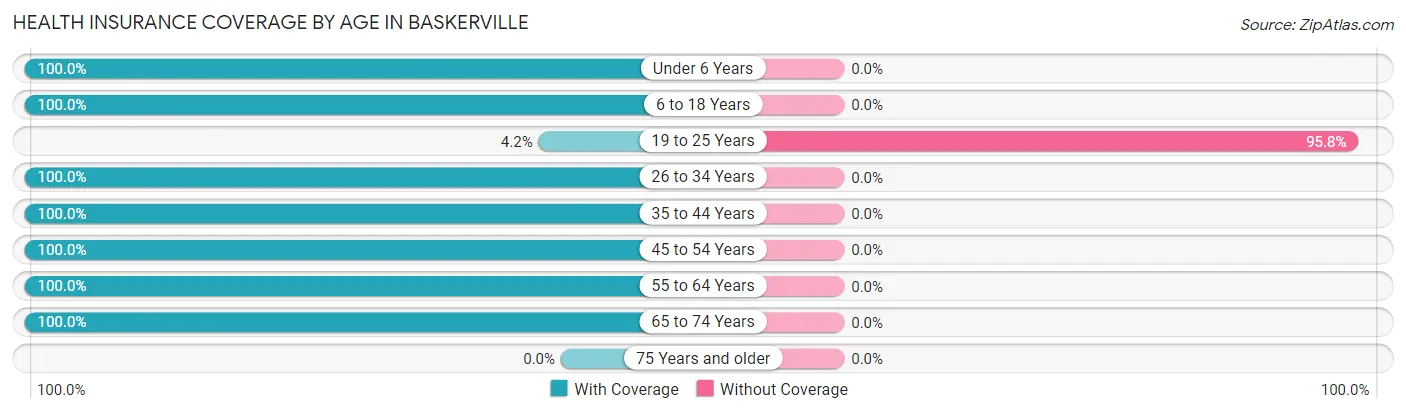
| Age Bracket | With Coverage | Without Coverage |
| Under 6 Years | 100 (100.0%) | 0 (0.0%) |
| 6 to 18 Years | 1 (100.0%) | 0 (0.0%) |
| 19 to 25 Years | 1 (4.2%) | 23 (95.8%) |
| 26 to 34 Years | 35 (100.0%) | 0 (0.0%) |
| 35 to 44 Years | 13 (100.0%) | 0 (0.0%) |
| 45 to 54 Years | 9 (100.0%) | 0 (0.0%) |
| 55 to 64 Years | 27 (100.0%) | 0 (0.0%) |
| 65 to 74 Years | 22 (100.0%) | 0 (0.0%) |
| 75 Years and older | 0 (0.0%) | 0 (0.0%) |
| Total | 208 (90.0%) | 23 (10.0%) |
Health Insurance Coverage by Citizenship Status in Baskerville
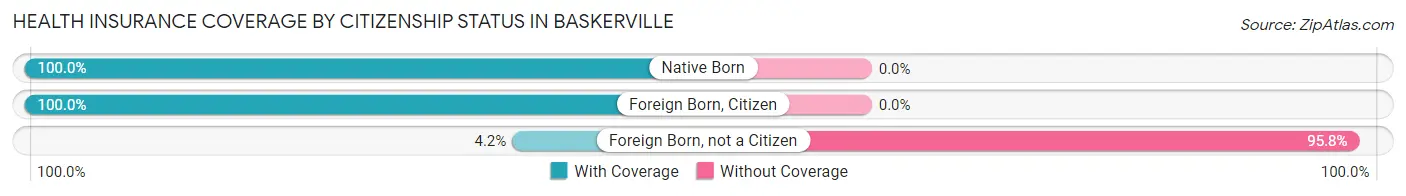
| Citizenship Status | With Coverage | Without Coverage |
| Native Born | 100 (100.0%) | 0 (0.0%) |
| Foreign Born, Citizen | 1 (100.0%) | 0 (0.0%) |
| Foreign Born, not a Citizen | 1 (4.2%) | 23 (95.8%) |
Health Insurance Coverage by Household Income in Baskerville
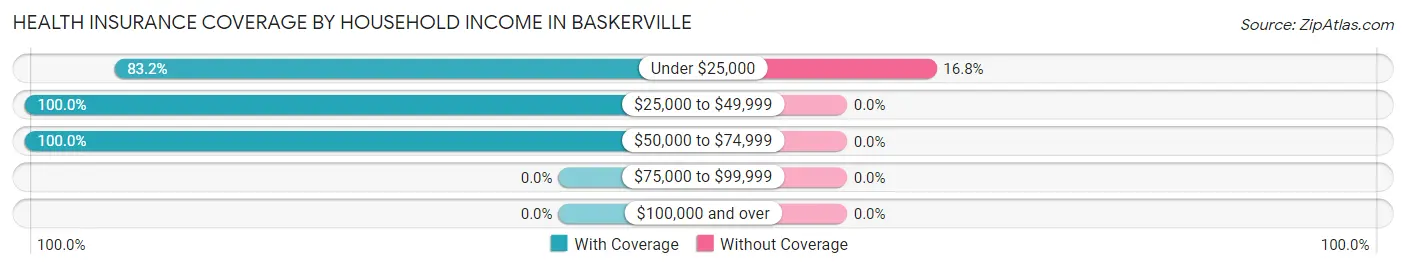
| Household Income | With Coverage | Without Coverage |
| Under $25,000 | 114 (83.2%) | 23 (16.8%) |
| $25,000 to $49,999 | 43 (100.0%) | 0 (0.0%) |
| $50,000 to $74,999 | 48 (100.0%) | 0 (0.0%) |
| $75,000 to $99,999 | 0 (0.0%) | 0 (0.0%) |
| $100,000 and over | 0 (0.0%) | 0 (0.0%) |
Public vs Private Health Insurance Coverage by Age in Baskerville
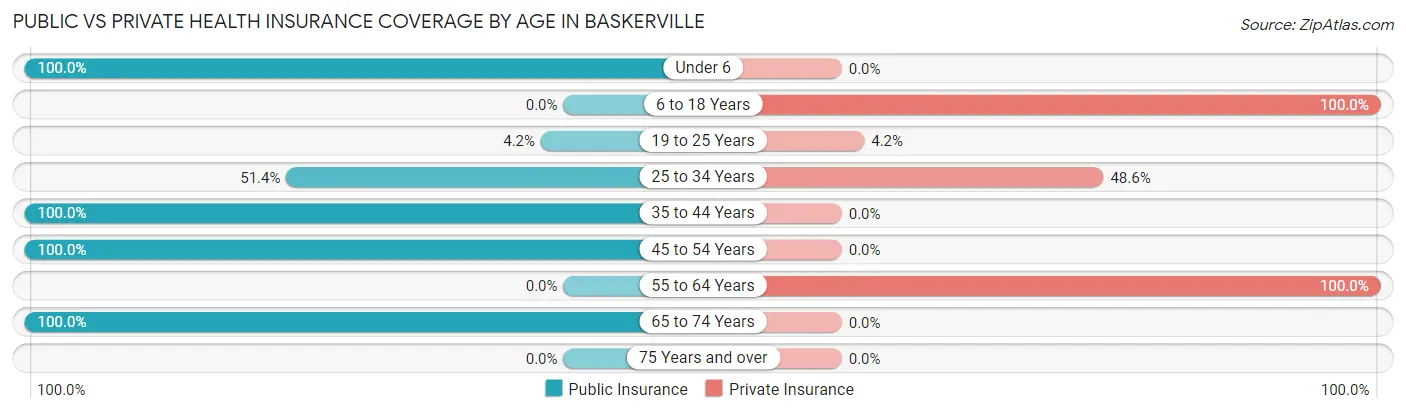
| Age Bracket | Public Insurance | Private Insurance |
| Under 6 | 100 (100.0%) | 0 (0.0%) |
| 6 to 18 Years | 0 (0.0%) | 1 (100.0%) |
| 19 to 25 Years | 1 (4.2%) | 1 (4.2%) |
| 25 to 34 Years | 18 (51.4%) | 17 (48.6%) |
| 35 to 44 Years | 13 (100.0%) | 0 (0.0%) |
| 45 to 54 Years | 9 (100.0%) | 0 (0.0%) |
| 55 to 64 Years | 0 (0.0%) | 27 (100.0%) |
| 65 to 74 Years | 22 (100.0%) | 0 (0.0%) |
| 75 Years and over | 0 (0.0%) | 0 (0.0%) |
| Total | 163 (70.6%) | 46 (19.9%) |
Disability Status by Sex by Age in Baskerville
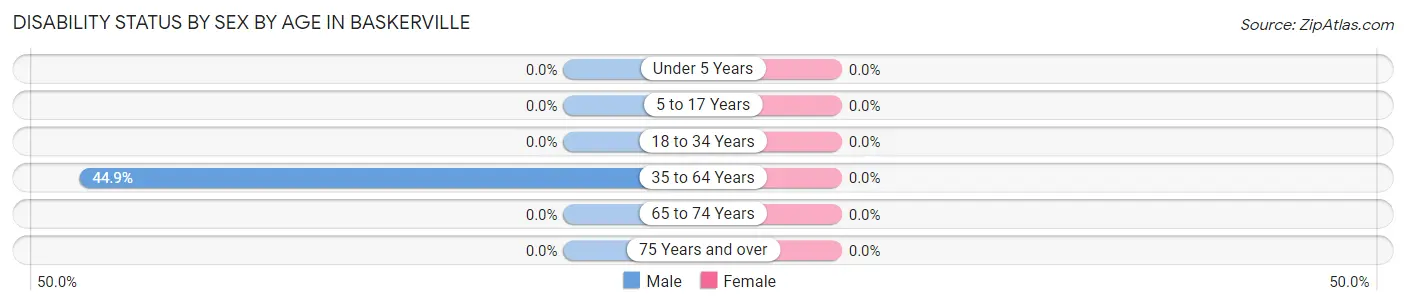
| Age Bracket | Male | Female |
| Under 5 Years | 0 (0.0%) | 0 (0.0%) |
| 5 to 17 Years | 0 (0.0%) | 0 (0.0%) |
| 18 to 34 Years | 0 (0.0%) | 0 (0.0%) |
| 35 to 64 Years | 22 (44.9%) | 0 (0.0%) |
| 65 to 74 Years | 0 (0.0%) | 0 (0.0%) |
| 75 Years and over | 0 (0.0%) | 0 (0.0%) |
Disability Class by Sex by Age in Baskerville
Disability Class: Hearing Difficulty
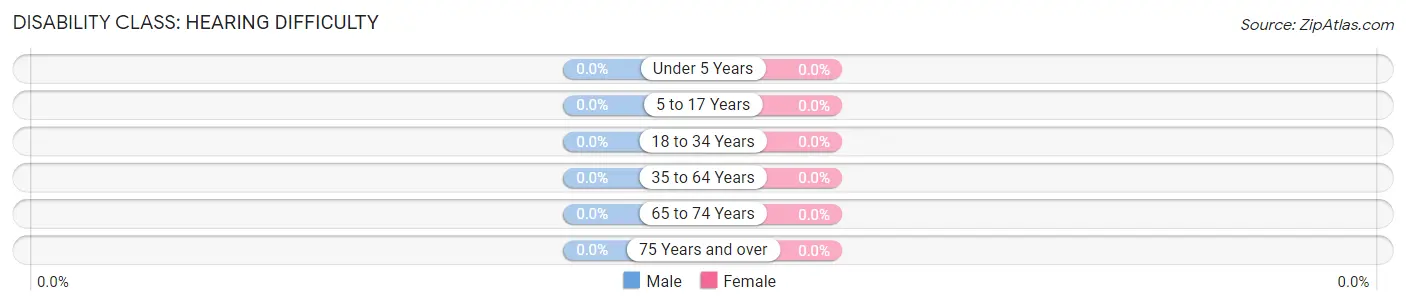
| Age Bracket | Male | Female |
| Under 5 Years | 0 (0.0%) | 0 (0.0%) |
| 5 to 17 Years | 0 (0.0%) | 0 (0.0%) |
| 18 to 34 Years | 0 (0.0%) | 0 (0.0%) |
| 35 to 64 Years | 0 (0.0%) | 0 (0.0%) |
| 65 to 74 Years | 0 (0.0%) | 0 (0.0%) |
| 75 Years and over | 0 (0.0%) | 0 (0.0%) |
Disability Class: Vision Difficulty
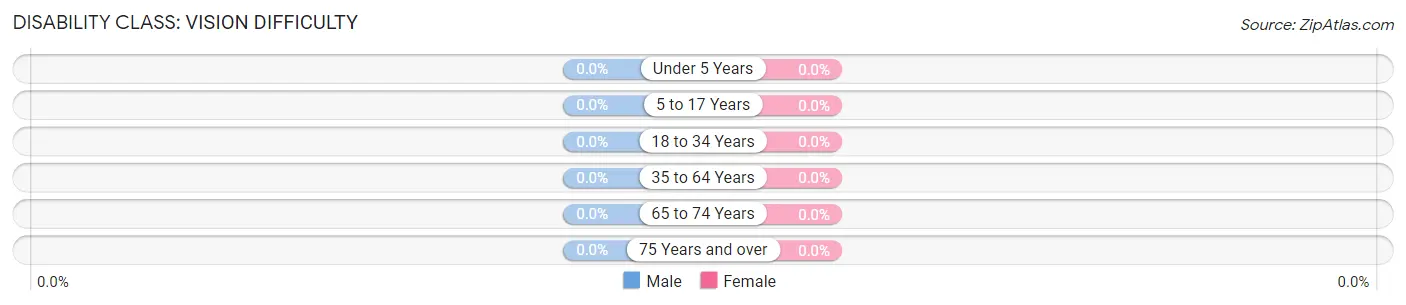
| Age Bracket | Male | Female |
| Under 5 Years | 0 (0.0%) | 0 (0.0%) |
| 5 to 17 Years | 0 (0.0%) | 0 (0.0%) |
| 18 to 34 Years | 0 (0.0%) | 0 (0.0%) |
| 35 to 64 Years | 0 (0.0%) | 0 (0.0%) |
| 65 to 74 Years | 0 (0.0%) | 0 (0.0%) |
| 75 Years and over | 0 (0.0%) | 0 (0.0%) |
Disability Class: Cognitive Difficulty
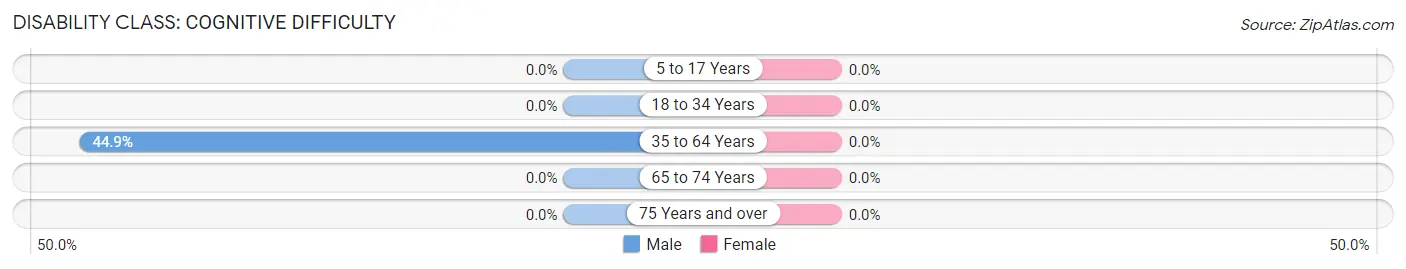
| Age Bracket | Male | Female |
| 5 to 17 Years | 0 (0.0%) | 0 (0.0%) |
| 18 to 34 Years | 0 (0.0%) | 0 (0.0%) |
| 35 to 64 Years | 22 (44.9%) | 0 (0.0%) |
| 65 to 74 Years | 0 (0.0%) | 0 (0.0%) |
| 75 Years and over | 0 (0.0%) | 0 (0.0%) |
Disability Class: Ambulatory Difficulty
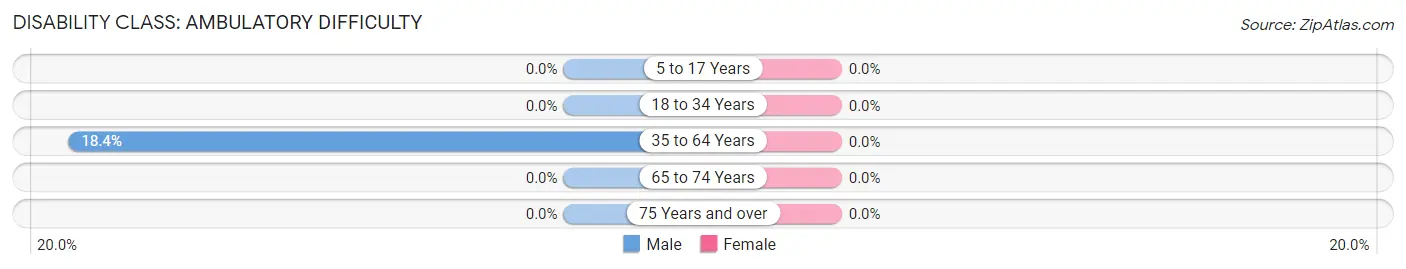
| Age Bracket | Male | Female |
| 5 to 17 Years | 0 (0.0%) | 0 (0.0%) |
| 18 to 34 Years | 0 (0.0%) | 0 (0.0%) |
| 35 to 64 Years | 9 (18.4%) | 0 (0.0%) |
| 65 to 74 Years | 0 (0.0%) | 0 (0.0%) |
| 75 Years and over | 0 (0.0%) | 0 (0.0%) |
Disability Class: Self-Care Difficulty
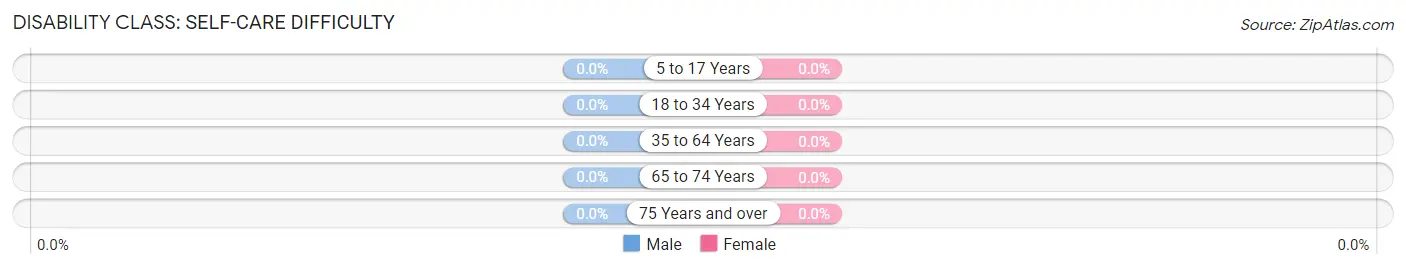
| Age Bracket | Male | Female |
| 5 to 17 Years | 0 (0.0%) | 0 (0.0%) |
| 18 to 34 Years | 0 (0.0%) | 0 (0.0%) |
| 35 to 64 Years | 0 (0.0%) | 0 (0.0%) |
| 65 to 74 Years | 0 (0.0%) | 0 (0.0%) |
| 75 Years and over | 0 (0.0%) | 0 (0.0%) |
Technology Access in Baskerville
Computing Device Access in Baskerville
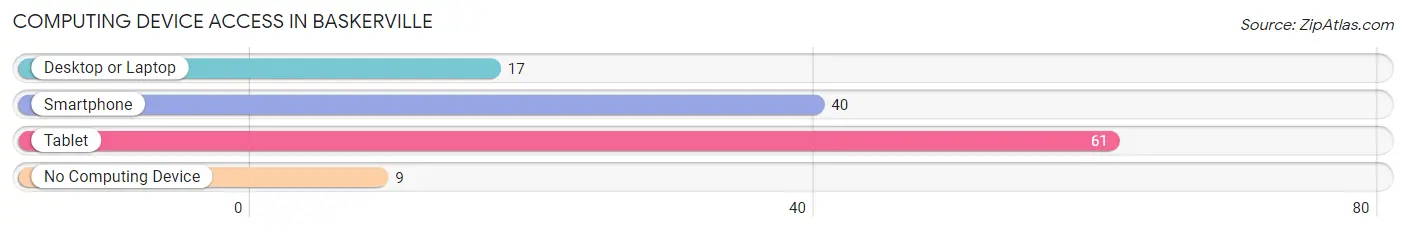
| Device Type | # Households | % Households |
| Desktop or Laptop | 17 | 24.3% |
| Smartphone | 40 | 57.1% |
| Tablet | 61 | 87.1% |
| No Computing Device | 9 | 12.9% |
| Total | 70 | 100.0% |
Internet Access in Baskerville
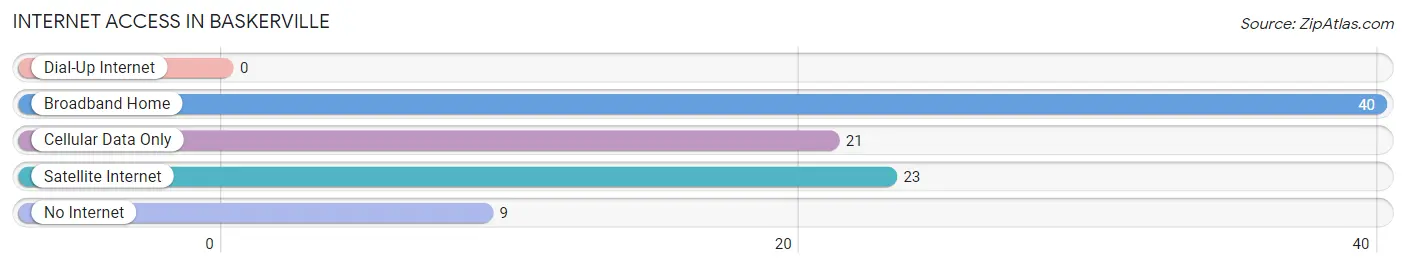
| Internet Type | # Households | % Households |
| Dial-Up Internet | 0 | 0.0% |
| Broadband Home | 40 | 57.1% |
| Cellular Data Only | 21 | 30.0% |
| Satellite Internet | 23 | 32.9% |
| No Internet | 9 | 12.9% |
| Total | 70 | 100.0% |
Baskerville Summary
Baskerville is an unincorporated community located in the northern part of Dinwiddie County, Virginia. It is situated along the Appomattox River, about 25 miles south of the city of Petersburg. The community is named after the Baskerville family, who were among the earliest settlers in the area.
History
The Baskerville family first settled in the area in the late 1700s. The family was originally from England and had come to the area to establish a plantation. The plantation was successful and the family prospered. The Baskervilles were also involved in the local government, serving as justices of the peace and members of the county court.
The community of Baskerville was established in the early 1800s. It was a small, rural community with a population of about 200 people. The main industry in the area was farming, and the Baskervilles were among the largest landowners in the area.
In the late 1800s, the Baskervilles began to diversify their business interests. They opened a general store, a sawmill, and a gristmill. They also opened a post office in 1891.
The Baskervilles continued to be involved in the local government and economy until the early 1900s. In the 1920s, the family sold off much of their land and the population of the community began to decline.
Geography
Baskerville is located in the northern part of Dinwiddie County, Virginia. It is situated along the Appomattox River, about 25 miles south of the city of Petersburg. The community is located in a rural area, with the nearest major city being Richmond, which is about 50 miles away.
The terrain in the area is mostly flat, with some rolling hills. The climate is temperate, with hot summers and mild winters. The average annual temperature is around 60 degrees Fahrenheit.
Economy
The economy of Baskerville is largely based on agriculture. The area is home to several farms, which produce a variety of crops, including corn, soybeans, wheat, and hay. The area also has several small businesses, including a general store, a sawmill, and a gristmill.
The community also has a post office, which provides mail service to the area. There is also a small airport located nearby, which provides air service to the area.
Demographics
As of the 2010 census, the population of Baskerville was 1,093. The racial makeup of the community was 94.3% White, 3.2% African American, 0.3% Native American, 0.2% Asian, 0.1% Pacific Islander, and 1.9% from other races. The median household income was $41,250, and the median family income was $50,000.
Conclusion
Baskerville is a small, rural community located in the northern part of Dinwiddie County, Virginia. It is situated along the Appomattox River, about 25 miles south of the city of Petersburg. The community was established in the early 1800s by the Baskerville family, who were among the earliest settlers in the area. The economy of Baskerville is largely based on agriculture, and the population of the community was 1,093 as of the 2010 census.
Common Questions
What is Per Capita Income in Baskerville?
Per Capita income in Baskerville is $12,561.
What is Inequality or Gini Index in Baskerville?
Inequality or Gini Index in Baskerville is 0.29.
What is the Total Population of Baskerville?
Total Population of Baskerville is 231.
What is the Total Male Population of Baskerville?
Total Male Population of Baskerville is 174.
What is the Total Female Population of Baskerville?
Total Female Population of Baskerville is 57.
What is the Ratio of Males per 100 Females in Baskerville?
There are 305.26 Males per 100 Females in Baskerville.
What is the Ratio of Females per 100 Males in Baskerville?
There are 32.76 Females per 100 Males in Baskerville.
What is the Median Population Age in Baskerville?
Median Population Age in Baskerville is 20.6 Years.
What is the Average Family Size in Baskerville
Average Family Size in Baskerville is 3.3 People.
What is the Average Household Size in Baskerville
Average Household Size in Baskerville is 3.3 People.
How Large is the Labor Force in Baskerville?
There are 45 People in the Labor Forcein in Baskerville.
What is the Percentage of People in the Labor Force in Baskerville?
34.4% of People are in the Labor Force in Baskerville.