Zip Codes with the Highest Percentage of Households Heated by Fuel Oil / Kerosene in Connecticut
RELATED REPORTS & OPTIONS
Fuel Oil Heating
Connecticut
Compare Zip Codes
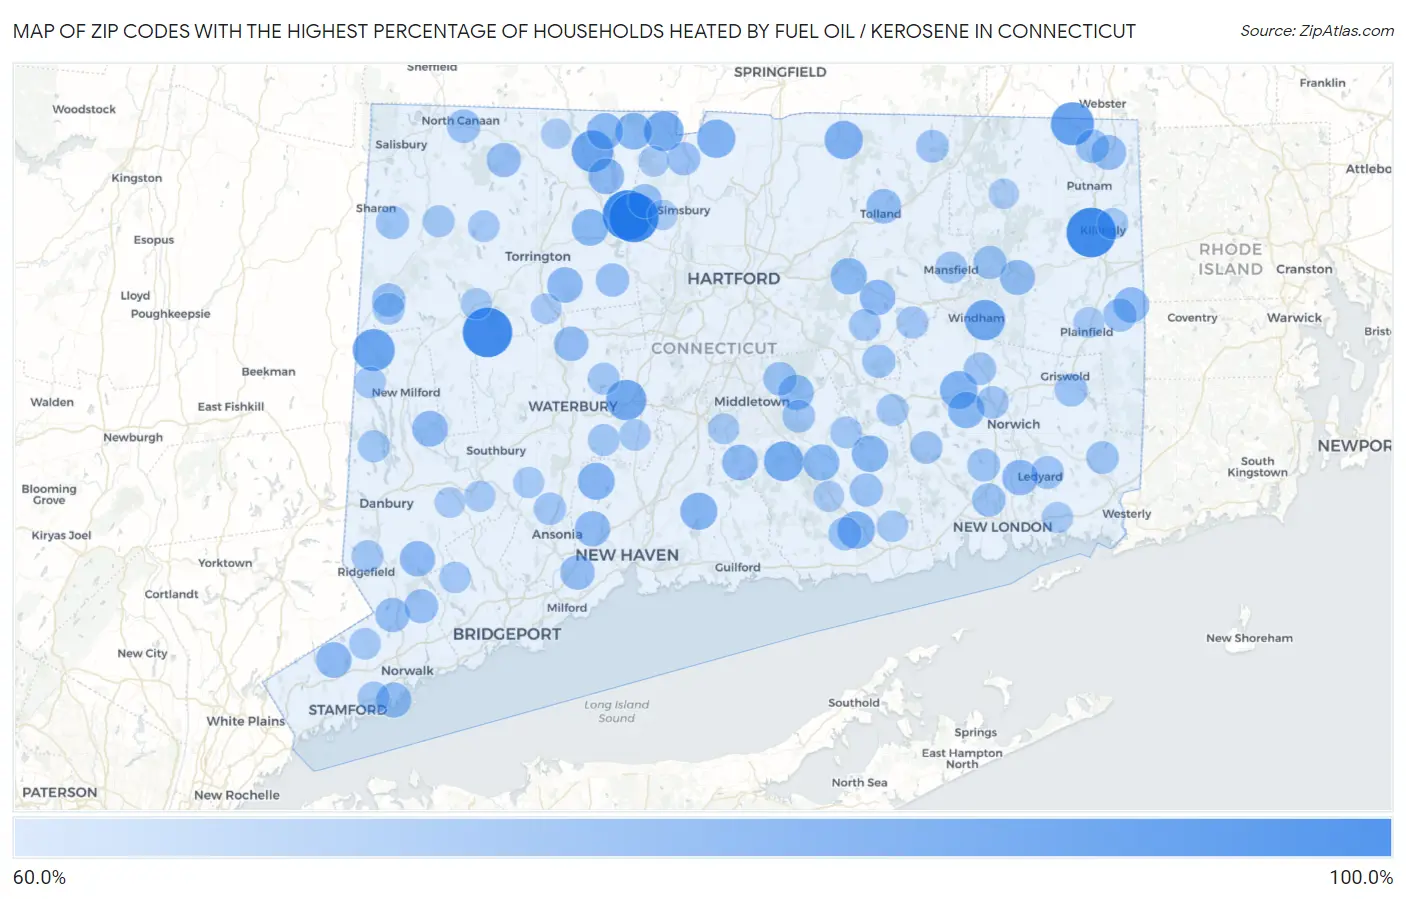
Map of Zip Codes with the Highest Percentage of Households Heated by Fuel Oil / Kerosene in Connecticut
60.0%
100.0%
Zip Codes with the Highest Percentage of Households Heated by Fuel Oil / Kerosene in Connecticut
| Zip Code | Fuel Oil Heating | vs State | vs National | |
| 1. | 06263 | 100.0% | 37.9%(+62.1)#1 | 4.2%(+95.8)#16 |
| 2. | 06022 | 100.0% | 37.9%(+62.1)#2 | 4.2%(+95.8)#46 |
| 3. | 06020 | 100.0% | 37.9%(+62.1)#3 | 4.2%(+95.8)#59 |
| 4. | 06758 | 100.0% | 37.9%(+62.1)#4 | 4.2%(+95.8)#77 |
| 5. | 06262 | 88.0% | 37.9%(+50.1)#5 | 4.2%(+83.8)#180 |
| 6. | 06755 | 85.8% | 37.9%(+47.9)#6 | 4.2%(+81.6)#200 |
| 7. | 06065 | 85.1% | 37.9%(+47.2)#7 | 4.2%(+80.9)#211 |
| 8. | 06444 | 82.8% | 37.9%(+44.9)#8 | 4.2%(+78.6)#227 |
| 9. | 06280 | 82.7% | 37.9%(+44.8)#9 | 4.2%(+78.5)#228 |
| 10. | 06441 | 81.5% | 37.9%(+43.6)#10 | 4.2%(+77.3)#243 |
| 11. | 06060 | 81.5% | 37.9%(+43.6)#11 | 4.2%(+77.3)#244 |
| 12. | 06071 | 78.9% | 37.9%(+41.0)#12 | 4.2%(+74.7)#278 |
| 13. | 06093 | 78.8% | 37.9%(+40.9)#13 | 4.2%(+74.6)#282 |
| 14. | 06336 | 77.8% | 37.9%(+39.9)#14 | 4.2%(+73.6)#303 |
| 15. | 06409 | 77.4% | 37.9%(+39.5)#15 | 4.2%(+73.2)#311 |
| 16. | 06472 | 76.8% | 37.9%(+38.9)#16 | 4.2%(+72.6)#319 |
| 17. | 06524 | 76.5% | 37.9%(+38.6)#17 | 4.2%(+72.3)#328 |
| 18. | 06027 | 75.9% | 37.9%(+38.0)#18 | 4.2%(+71.7)#340 |
| 19. | 06057 | 75.8% | 37.9%(+37.9)#19 | 4.2%(+71.6)#341 |
| 20. | 06423 | 75.7% | 37.9%(+37.8)#20 | 4.2%(+71.5)#345 |
| 21. | 06334 | 75.5% | 37.9%(+37.6)#21 | 4.2%(+71.3)#351 |
| 22. | 06043 | 75.4% | 37.9%(+37.5)#22 | 4.2%(+71.2)#354 |
| 23. | 06091 | 75.3% | 37.9%(+37.4)#23 | 4.2%(+71.1)#357 |
| 24. | 06438 | 75.0% | 37.9%(+37.1)#24 | 4.2%(+70.8)#363 |
| 25. | 06063 | 74.4% | 37.9%(+36.5)#25 | 4.2%(+70.2)#377 |
| 26. | 06752 | 74.3% | 37.9%(+36.4)#26 | 4.2%(+70.1)#378 |
| 27. | 06903 | 74.2% | 37.9%(+36.3)#27 | 4.2%(+70.0)#380 |
| 28. | 06422 | 74.2% | 37.9%(+36.3)#28 | 4.2%(+70.0)#381 |
| 29. | 06335 | 73.9% | 37.9%(+36.0)#29 | 4.2%(+69.7)#388 |
| 30. | 06791 | 73.9% | 37.9%(+36.0)#30 | 4.2%(+69.7)#389 |
| 31. | 06896 | 73.8% | 37.9%(+35.9)#31 | 4.2%(+69.6)#391 |
| 32. | 06232 | 73.8% | 37.9%(+35.9)#32 | 4.2%(+69.6)#392 |
| 33. | 06377 | 73.8% | 37.9%(+35.9)#33 | 4.2%(+69.6)#393 |
| 34. | 06525 | 73.6% | 37.9%(+35.7)#34 | 4.2%(+69.4)#395 |
| 35. | 06414 | 73.4% | 37.9%(+35.5)#35 | 4.2%(+69.2)#407 |
| 36. | 06853 | 73.2% | 37.9%(+35.3)#36 | 4.2%(+69.0)#415 |
| 37. | 06247 | 73.1% | 37.9%(+35.2)#37 | 4.2%(+68.9)#419 |
| 38. | 06277 | 72.4% | 37.9%(+34.5)#38 | 4.2%(+68.2)#437 |
| 39. | 06084 | 72.2% | 37.9%(+34.3)#39 | 4.2%(+68.0)#444 |
| 40. | 06782 | 72.1% | 37.9%(+34.2)#40 | 4.2%(+67.9)#445 |
| 41. | 06477 | 72.0% | 37.9%(+34.1)#41 | 4.2%(+67.8)#447 |
| 42. | 06897 | 71.7% | 37.9%(+33.8)#42 | 4.2%(+67.5)#455 |
| 43. | 06058 | 71.4% | 37.9%(+33.5)#43 | 4.2%(+67.2)#463 |
| 44. | 06059 | 71.4% | 37.9%(+33.5)#44 | 4.2%(+67.2)#465 |
| 45. | 06883 | 71.1% | 37.9%(+33.2)#45 | 4.2%(+66.9)#473 |
| 46. | 06024 | 70.4% | 37.9%(+32.5)#46 | 4.2%(+66.2)#502 |
| 47. | 06480 | 70.3% | 37.9%(+32.4)#47 | 4.2%(+66.1)#504 |
| 48. | 06255 | 70.2% | 37.9%(+32.3)#48 | 4.2%(+66.0)#512 |
| 49. | 06013 | 70.1% | 37.9%(+32.2)#49 | 4.2%(+65.9)#516 |
| 50. | 06235 | 70.0% | 37.9%(+32.1)#50 | 4.2%(+65.8)#522 |
| 51. | 06757 | 70.0% | 37.9%(+32.1)#51 | 4.2%(+65.8)#523 |
| 52. | 06354 | 69.9% | 37.9%(+32.0)#52 | 4.2%(+65.7)#528 |
| 53. | 06375 | 69.9% | 37.9%(+32.0)#53 | 4.2%(+65.7)#529 |
| 54. | 06035 | 69.8% | 37.9%(+31.9)#54 | 4.2%(+65.6)#534 |
| 55. | 06231 | 69.7% | 37.9%(+31.8)#55 | 4.2%(+65.5)#539 |
| 56. | 06442 | 69.7% | 37.9%(+31.8)#56 | 4.2%(+65.5)#541 |
| 57. | 06439 | 69.6% | 37.9%(+31.7)#57 | 4.2%(+65.4)#550 |
| 58. | 06069 | 69.5% | 37.9%(+31.6)#58 | 4.2%(+65.3)#552 |
| 59. | 06351 | 69.3% | 37.9%(+31.4)#59 | 4.2%(+65.1)#557 |
| 60. | 06339 | 69.3% | 37.9%(+31.4)#60 | 4.2%(+65.1)#558 |
| 61. | 06353 | 69.3% | 37.9%(+31.4)#61 | 4.2%(+65.1)#560 |
| 62. | 06076 | 68.9% | 37.9%(+31.0)#62 | 4.2%(+64.7)#571 |
| 63. | 06359 | 68.8% | 37.9%(+30.9)#63 | 4.2%(+64.6)#572 |
| 64. | 06254 | 68.6% | 37.9%(+30.7)#64 | 4.2%(+64.4)#583 |
| 65. | 06456 | 68.6% | 37.9%(+30.7)#65 | 4.2%(+64.4)#587 |
| 66. | 06389 | 68.5% | 37.9%(+30.6)#66 | 4.2%(+64.3)#592 |
| 67. | 06420 | 68.4% | 37.9%(+30.5)#67 | 4.2%(+64.2)#593 |
| 68. | 06483 | 68.2% | 37.9%(+30.3)#68 | 4.2%(+64.0)#601 |
| 69. | 06237 | 67.8% | 37.9%(+29.9)#69 | 4.2%(+63.6)#622 |
| 70. | 06877 | 67.7% | 37.9%(+29.8)#70 | 4.2%(+63.5)#626 |
| 71. | 06716 | 67.5% | 37.9%(+29.6)#71 | 4.2%(+63.3)#636 |
| 72. | 06812 | 67.5% | 37.9%(+29.6)#72 | 4.2%(+63.3)#637 |
| 73. | 06415 | 67.4% | 37.9%(+29.5)#73 | 4.2%(+63.2)#647 |
| 74. | 06250 | 67.4% | 37.9%(+29.5)#74 | 4.2%(+63.2)#648 |
| 75. | 06248 | 67.4% | 37.9%(+29.5)#75 | 4.2%(+63.2)#649 |
| 76. | 06820 | 67.3% | 37.9%(+29.4)#76 | 4.2%(+63.1)#656 |
| 77. | 06469 | 67.3% | 37.9%(+29.4)#77 | 4.2%(+63.1)#659 |
| 78. | 06785 | 67.3% | 37.9%(+29.4)#78 | 4.2%(+63.1)#661 |
| 79. | 06796 | 67.3% | 37.9%(+29.4)#79 | 4.2%(+63.1)#662 |
| 80. | 06712 | 67.2% | 37.9%(+29.3)#80 | 4.2%(+63.0)#664 |
| 81. | 06756 | 66.8% | 37.9%(+28.9)#81 | 4.2%(+62.6)#691 |
| 82. | 06840 | 66.7% | 37.9%(+28.8)#82 | 4.2%(+62.5)#693 |
| 83. | 06784 | 66.7% | 37.9%(+28.8)#83 | 4.2%(+62.5)#696 |
| 84. | 06410 | 66.6% | 37.9%(+28.7)#84 | 4.2%(+62.4)#702 |
| 85. | 06241 | 66.5% | 37.9%(+28.6)#85 | 4.2%(+62.3)#707 |
| 86. | 06750 | 66.5% | 37.9%(+28.6)#86 | 4.2%(+62.3)#709 |
| 87. | 06612 | 66.2% | 37.9%(+28.3)#87 | 4.2%(+62.0)#724 |
| 88. | 06371 | 66.1% | 37.9%(+28.2)#88 | 4.2%(+61.9)#728 |
| 89. | 06478 | 66.0% | 37.9%(+28.1)#89 | 4.2%(+61.8)#735 |
| 90. | 06355 | 65.8% | 37.9%(+27.9)#90 | 4.2%(+61.6)#748 |
| 91. | 06482 | 65.8% | 37.9%(+27.9)#91 | 4.2%(+61.6)#749 |
| 92. | 06374 | 65.6% | 37.9%(+27.7)#92 | 4.2%(+61.4)#757 |
| 93. | 06455 | 65.5% | 37.9%(+27.6)#93 | 4.2%(+61.3)#764 |
| 94. | 06412 | 65.4% | 37.9%(+27.5)#94 | 4.2%(+61.2)#767 |
| 95. | 06090 | 65.4% | 37.9%(+27.5)#95 | 4.2%(+61.2)#771 |
| 96. | 06778 | 65.2% | 37.9%(+27.3)#96 | 4.2%(+61.0)#780 |
| 97. | 06470 | 65.1% | 37.9%(+27.2)#97 | 4.2%(+60.9)#781 |
| 98. | 06242 | 64.6% | 37.9%(+26.7)#98 | 4.2%(+60.4)#811 |
| 99. | 06092 | 64.4% | 37.9%(+26.5)#99 | 4.2%(+60.2)#823 |
| 100. | 06021 | 64.4% | 37.9%(+26.5)#100 | 4.2%(+60.2)#824 |
Common Questions
What are the Top 10 Zip Codes with the Highest Percentage of Households Heated by Fuel Oil / Kerosene in Connecticut?
Top 10 Zip Codes with the Highest Percentage of Households Heated by Fuel Oil / Kerosene in Connecticut are:
What zip code has the Highest Percentage of Households Heated by Fuel Oil / Kerosene in Connecticut?
06263 has the Highest Percentage of Households Heated by Fuel Oil / Kerosene in Connecticut with 100.0%.
What is the Percentage of Households Heated by Fuel Oil / Kerosene in the State of Connecticut?
Percentage of Households Heated by Fuel Oil / Kerosene in Connecticut is 37.9%.
What is the Percentage of Households Heated by Fuel Oil / Kerosene in the United States?
Percentage of Households Heated by Fuel Oil / Kerosene in the United States is 4.2%.