Alta, WY Map & Demographics
Alta Map
Alta Overview
$68,826
PER CAPITA INCOME
$183,477
AVG FAMILY INCOME
$161,979
AVG HOUSEHOLD INCOME
0.22
INEQUALITY / GINI INDEX
581
TOTAL POPULATION
328
MALE POPULATION
253
FEMALE POPULATION
129.64
MALES / 100 FEMALES
77.13
FEMALES / 100 MALES
47.3
MEDIAN AGE
2.6
AVG FAMILY SIZE
2.3
AVG HOUSEHOLD SIZE
353
LABOR FORCE [ PEOPLE ]
66.0%
PERCENT IN LABOR FORCE
Alta Zip Codes
Alta Area Codes
Income in Alta
Income Overview in Alta
Per Capita Income in Alta is $68,826, while median incomes of families and households are $183,477 and $161,979 respectively.
| Characteristic | Number | Measure |
| Per Capita Income | 581 | $68,826 |
| Median Family Income | 143 | $183,477 |
| Mean Family Income | 143 | $186,750 |
| Median Household Income | 255 | $161,979 |
| Mean Household Income | 255 | $162,727 |
| Income Deficit | 143 | $0 |
| Wage / Income Gap (%) | 581 | 0.00% |
| Wage / Income Gap ($) | 581 | 100.00¢ per $1 |
| Gini / Inequality Index | 581 | 0.22 |
Earnings by Sex in Alta
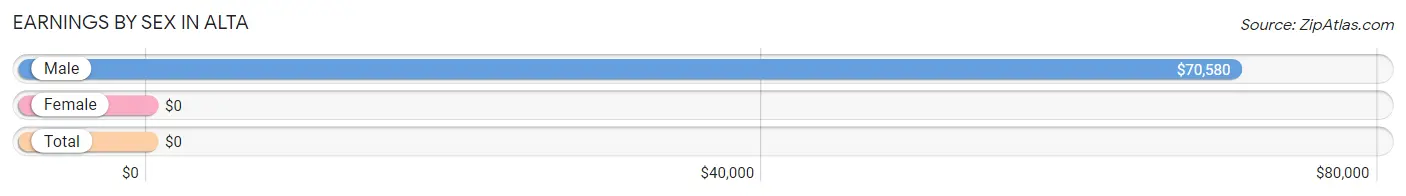
| Sex | Number | Average Earnings |
| Male | 273 (66.7%) | $70,580 |
| Female | 136 (33.3%) | $0 |
| Total | 409 (100.0%) | $0 |
Earnings by Sex by Income Bracket in Alta
The most common earnings brackets in Alta are $75,000 to $99,999 for men (75 | 27.5%) and $75,000 to $99,999 for women (47 | 34.6%).
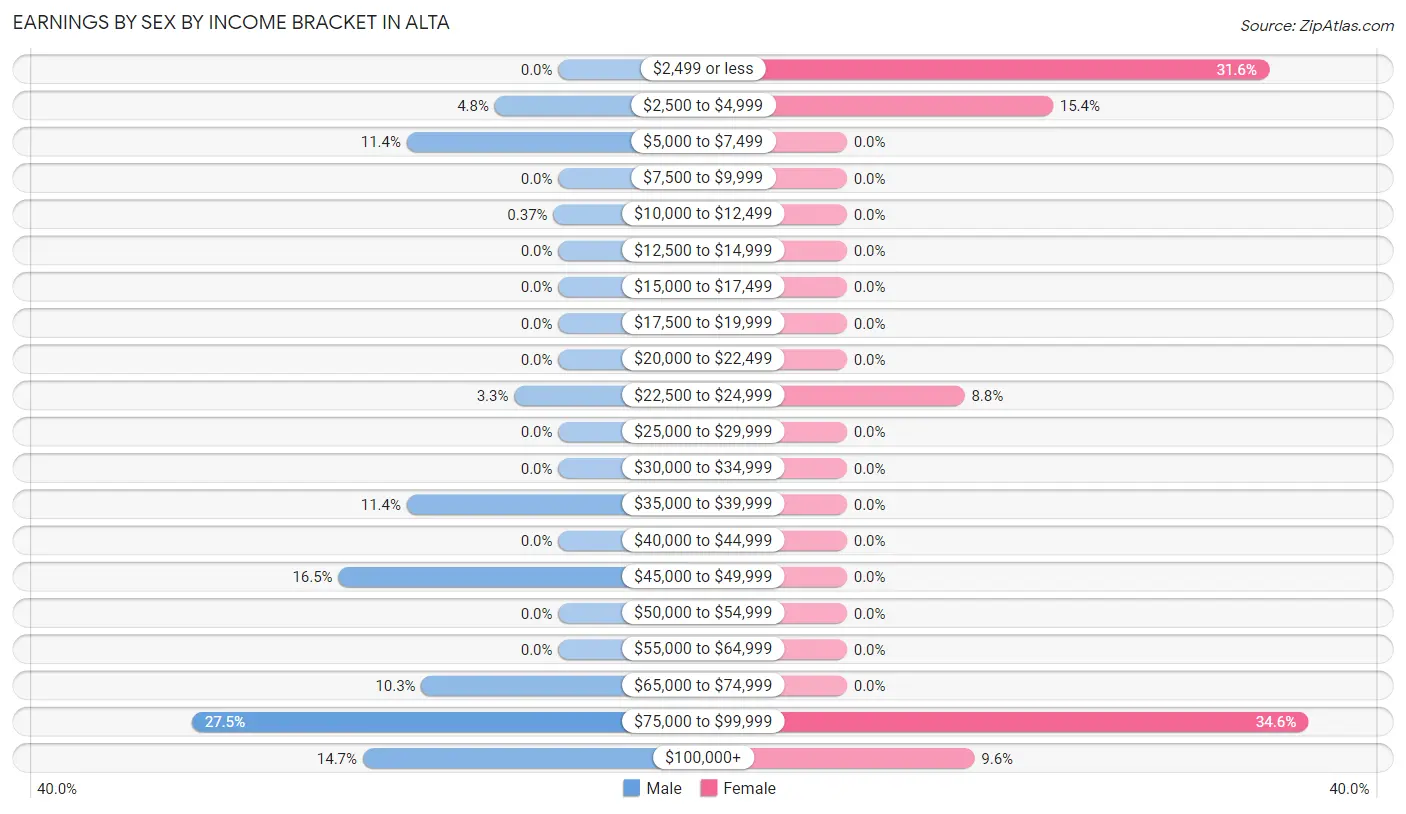
| Income | Male | Female |
| $2,499 or less | 0 (0.0%) | 43 (31.6%) |
| $2,500 to $4,999 | 13 (4.8%) | 21 (15.4%) |
| $5,000 to $7,499 | 31 (11.4%) | 0 (0.0%) |
| $7,500 to $9,999 | 0 (0.0%) | 0 (0.0%) |
| $10,000 to $12,499 | 1 (0.4%) | 0 (0.0%) |
| $12,500 to $14,999 | 0 (0.0%) | 0 (0.0%) |
| $15,000 to $17,499 | 0 (0.0%) | 0 (0.0%) |
| $17,500 to $19,999 | 0 (0.0%) | 0 (0.0%) |
| $20,000 to $22,499 | 0 (0.0%) | 0 (0.0%) |
| $22,500 to $24,999 | 9 (3.3%) | 12 (8.8%) |
| $25,000 to $29,999 | 0 (0.0%) | 0 (0.0%) |
| $30,000 to $34,999 | 0 (0.0%) | 0 (0.0%) |
| $35,000 to $39,999 | 31 (11.4%) | 0 (0.0%) |
| $40,000 to $44,999 | 0 (0.0%) | 0 (0.0%) |
| $45,000 to $49,999 | 45 (16.5%) | 0 (0.0%) |
| $50,000 to $54,999 | 0 (0.0%) | 0 (0.0%) |
| $55,000 to $64,999 | 0 (0.0%) | 0 (0.0%) |
| $65,000 to $74,999 | 28 (10.3%) | 0 (0.0%) |
| $75,000 to $99,999 | 75 (27.5%) | 47 (34.6%) |
| $100,000+ | 40 (14.6%) | 13 (9.6%) |
| Total | 273 (100.0%) | 136 (100.0%) |
Earnings by Sex by Educational Attainment in Alta
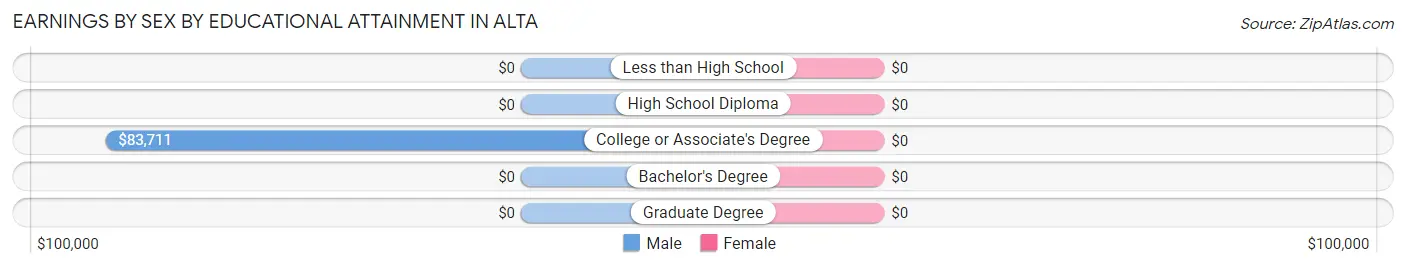
| Educational Attainment | Male Income | Female Income |
| Less than High School | - | - |
| High School Diploma | - | - |
| College or Associate's Degree | $83,711 | $0 |
| Bachelor's Degree | - | - |
| Graduate Degree | - | - |
| Total | $71,964 | $91,836 |
Family Income in Alta
Family Income Brackets in Alta
According to the Alta family income data, there are 105 families falling into the $150,000 to $199,999 income range, which is the most common income bracket and makes up 73.4% of all families.
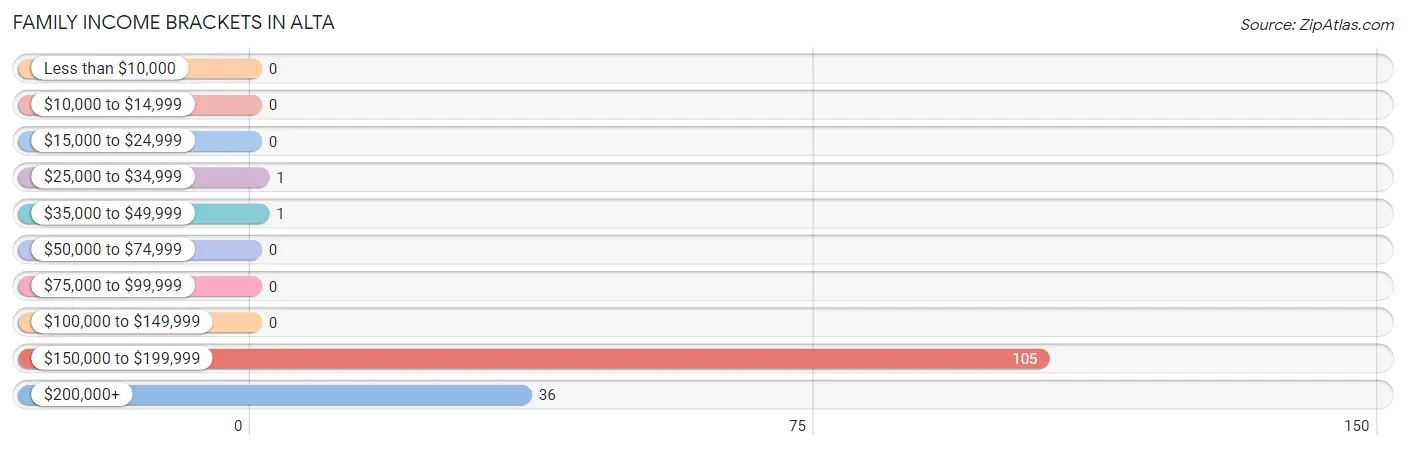
| Income Bracket | # Families | % Families |
| Less than $10,000 | 0 | 0.0% |
| $10,000 to $14,999 | 0 | 0.0% |
| $15,000 to $24,999 | 0 | 0.0% |
| $25,000 to $34,999 | 1 | 0.7% |
| $35,000 to $49,999 | 1 | 0.7% |
| $50,000 to $74,999 | 0 | 0.0% |
| $75,000 to $99,999 | 0 | 0.0% |
| $100,000 to $149,999 | 0 | 0.0% |
| $150,000 to $199,999 | 105 | 73.4% |
| $200,000+ | 36 | 25.2% |
Family Income by Famaliy Size in Alta
2-person families (59 | 41.3%) account for the highest median family income in Alta with $159,028 per family, while 2-person families (59 | 41.3%) have the highest median income of $79,514 per family member.
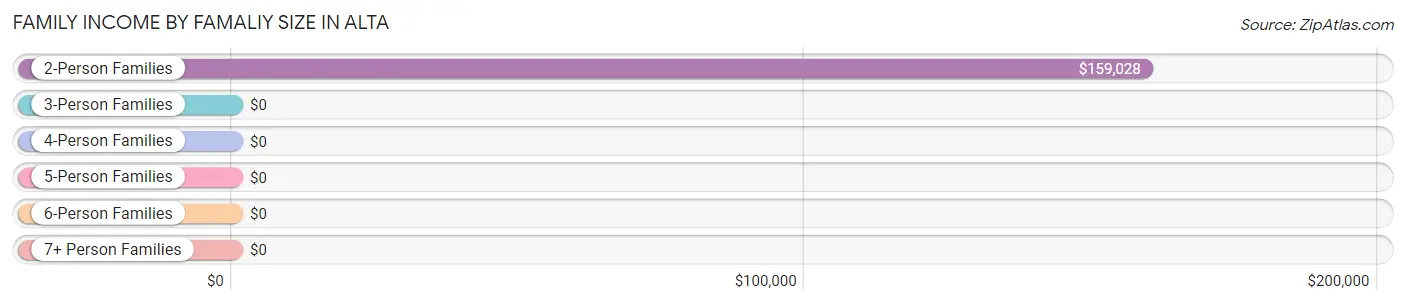
| Income Bracket | # Families | Median Income |
| 2-Person Families | 59 (41.3%) | $159,028 |
| 3-Person Families | 45 (31.5%) | $0 |
| 4-Person Families | 39 (27.3%) | $0 |
| 5-Person Families | 0 (0.0%) | $0 |
| 6-Person Families | 0 (0.0%) | $0 |
| 7+ Person Families | 0 (0.0%) | $0 |
| Total | 143 (100.0%) | $183,477 |
Family Income by Number of Earners in Alta
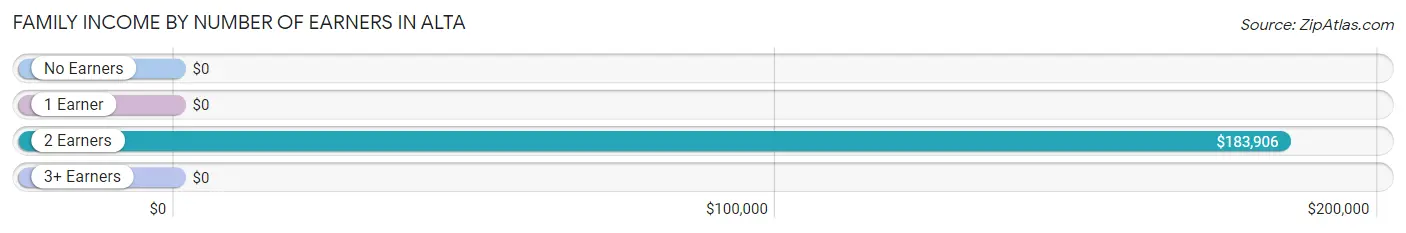
| Number of Earners | # Families | Median Income |
| No Earners | 1 (0.7%) | $0 |
| 1 Earner | 46 (32.2%) | $0 |
| 2 Earners | 60 (42.0%) | $183,906 |
| 3+ Earners | 36 (25.2%) | $0 |
| Total | 143 (100.0%) | $183,477 |
Household Income in Alta
Household Income Brackets in Alta
With 133 households falling in the category, the $150,000 to $199,999 income range is the most frequent in Alta, accounting for 52.2% of all households.
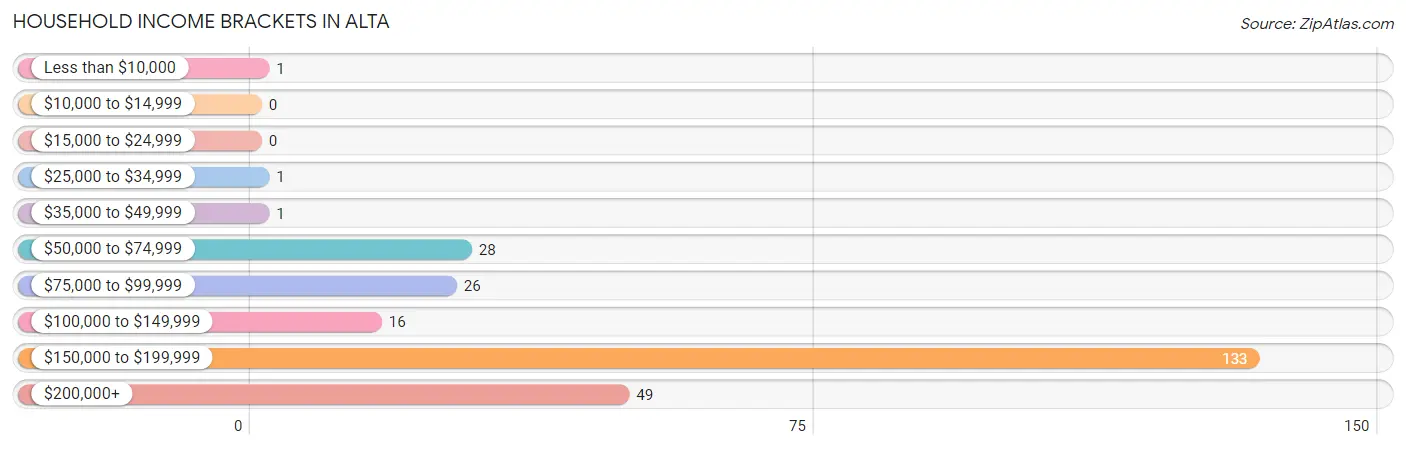
| Income Bracket | # Households | % Households |
| Less than $10,000 | 1 | 0.4% |
| $10,000 to $14,999 | 0 | 0.0% |
| $15,000 to $24,999 | 0 | 0.0% |
| $25,000 to $34,999 | 1 | 0.4% |
| $35,000 to $49,999 | 1 | 0.4% |
| $50,000 to $74,999 | 28 | 11.0% |
| $75,000 to $99,999 | 26 | 10.2% |
| $100,000 to $149,999 | 16 | 6.3% |
| $150,000 to $199,999 | 133 | 52.2% |
| $200,000+ | 49 | 19.2% |
Household Income by Householder Age in Alta
The median household income in Alta is $161,979, with the highest median household income of $186,641 found in the 45 to 64 years age bracket for the primary householder. A total of 109 households (42.7%) fall into this category.
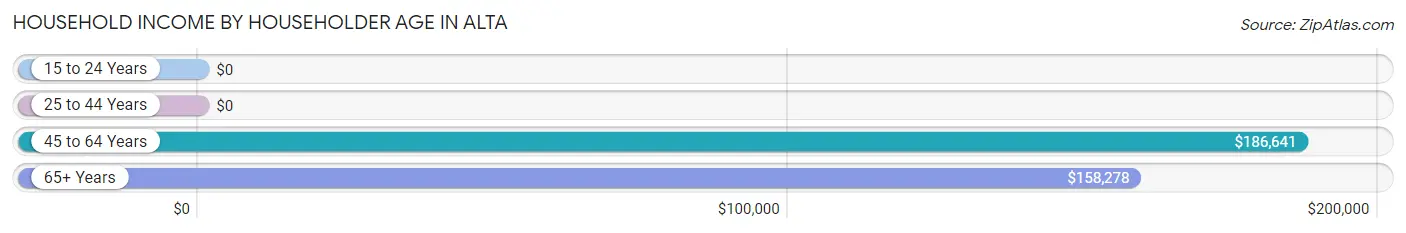
| Income Bracket | # Households | Median Income |
| 15 to 24 Years | 0 (0.0%) | $0 |
| 25 to 44 Years | 28 (11.0%) | $0 |
| 45 to 64 Years | 109 (42.7%) | $186,641 |
| 65+ Years | 118 (46.3%) | $158,278 |
| Total | 255 (100.0%) | $161,979 |
Poverty in Alta
Income Below Poverty by Sex and Age in Alta
With 9.5% poverty level for males and 0.4% for females among the residents of Alta, 18 to 24 year old males and 75 year old and over females are the most vulnerable to poverty, with 31 males (100.0%) and 1 females (6.2%) in their respective age groups living below the poverty level.
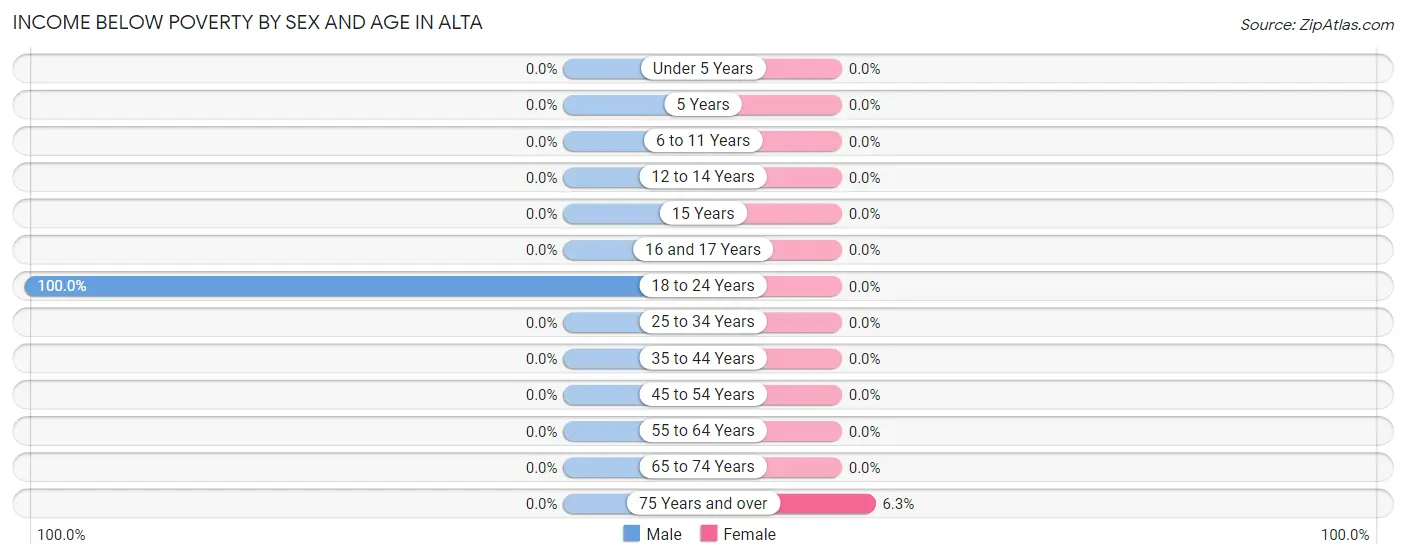
| Age Bracket | Male | Female |
| Under 5 Years | 0 (0.0%) | 0 (0.0%) |
| 5 Years | 0 (0.0%) | 0 (0.0%) |
| 6 to 11 Years | 0 (0.0%) | 0 (0.0%) |
| 12 to 14 Years | 0 (0.0%) | 0 (0.0%) |
| 15 Years | 0 (0.0%) | 0 (0.0%) |
| 16 and 17 Years | 0 (0.0%) | 0 (0.0%) |
| 18 to 24 Years | 31 (100.0%) | 0 (0.0%) |
| 25 to 34 Years | 0 (0.0%) | 0 (0.0%) |
| 35 to 44 Years | 0 (0.0%) | 0 (0.0%) |
| 45 to 54 Years | 0 (0.0%) | 0 (0.0%) |
| 55 to 64 Years | 0 (0.0%) | 0 (0.0%) |
| 65 to 74 Years | 0 (0.0%) | 0 (0.0%) |
| 75 Years and over | 0 (0.0%) | 1 (6.2%) |
| Total | 31 (9.5%) | 1 (0.4%) |
Income Above Poverty by Sex and Age in Alta
According to the poverty statistics in Alta, males aged 6 to 11 years and females aged 6 to 11 years are the age groups that are most secure financially, with 100.0% of males and 100.0% of females in these age groups living above the poverty line.
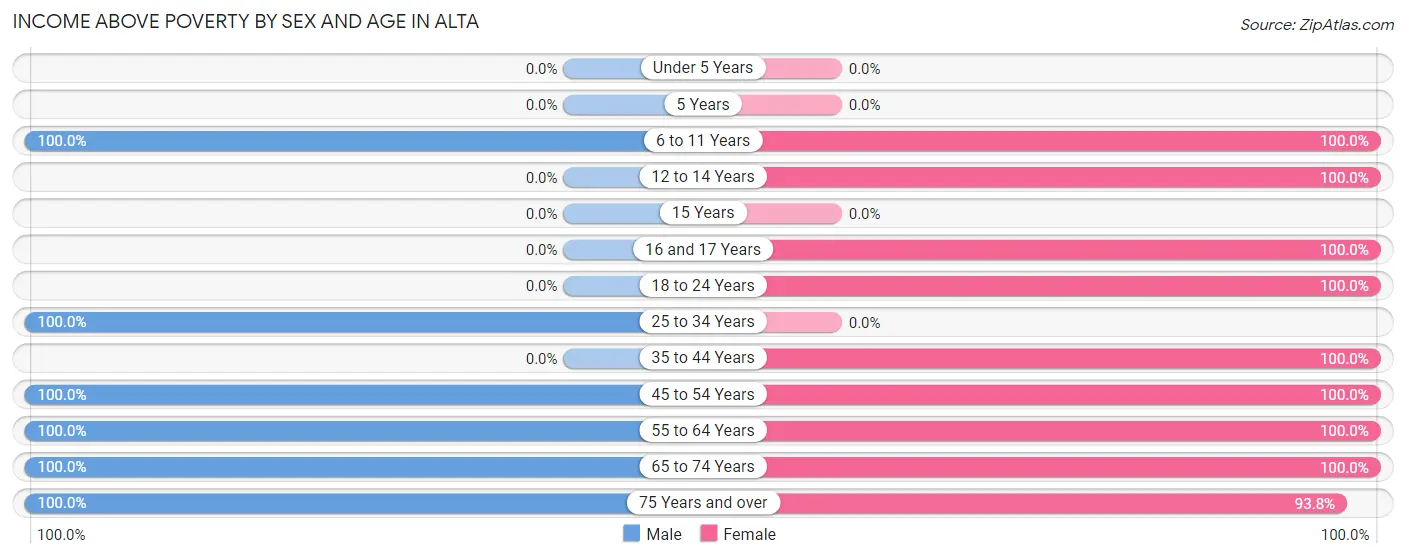
| Age Bracket | Male | Female |
| Under 5 Years | 0 (0.0%) | 0 (0.0%) |
| 5 Years | 0 (0.0%) | 0 (0.0%) |
| 6 to 11 Years | 10 (100.0%) | 14 (100.0%) |
| 12 to 14 Years | 0 (0.0%) | 22 (100.0%) |
| 15 Years | 0 (0.0%) | 0 (0.0%) |
| 16 and 17 Years | 0 (0.0%) | 42 (100.0%) |
| 18 to 24 Years | 0 (0.0%) | 21 (100.0%) |
| 25 to 34 Years | 91 (100.0%) | 0 (0.0%) |
| 35 to 44 Years | 0 (0.0%) | 15 (100.0%) |
| 45 to 54 Years | 52 (100.0%) | 45 (100.0%) |
| 55 to 64 Years | 36 (100.0%) | 37 (100.0%) |
| 65 to 74 Years | 65 (100.0%) | 41 (100.0%) |
| 75 Years and over | 43 (100.0%) | 15 (93.8%) |
| Total | 297 (90.5%) | 252 (99.6%) |
Income Below Poverty Among Married-Couple Families in Alta
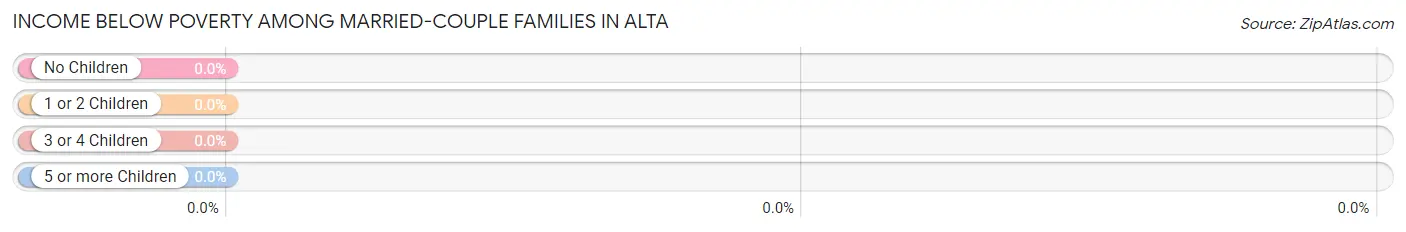
| Children | Above Poverty | Below Poverty |
| No Children | 59 (100.0%) | 0 (0.0%) |
| 1 or 2 Children | 84 (100.0%) | 0 (0.0%) |
| 3 or 4 Children | 0 (0.0%) | 0 (0.0%) |
| 5 or more Children | 0 (0.0%) | 0 (0.0%) |
| Total | 143 (100.0%) | 0 (0.0%) |
Income Below Poverty Among Single-Parent Households in Alta
| Children | Single Father | Single Mother |
| No Children | 0 (0.0%) | 0 (0.0%) |
| 1 or 2 Children | 0 (0.0%) | 0 (0.0%) |
| 3 or 4 Children | 0 (0.0%) | 0 (0.0%) |
| 5 or more Children | 0 (0.0%) | 0 (0.0%) |
| Total | 0 (0.0%) | 0 (0.0%) |
Income Below Poverty Among Married-Couple vs Single-Parent Households in Alta
| Children | Married-Couple Families | Single-Parent Households |
| No Children | 0 (0.0%) | 0 (0.0%) |
| 1 or 2 Children | 0 (0.0%) | 0 (0.0%) |
| 3 or 4 Children | 0 (0.0%) | 0 (0.0%) |
| 5 or more Children | 0 (0.0%) | 0 (0.0%) |
| Total | 0 (0.0%) | 0 (0.0%) |
Race in Alta
The most populous races in Alta are White / Caucasian (499 | 85.9%), Two or more Races (54 | 9.3%), and Black / African American (28 | 4.8%).
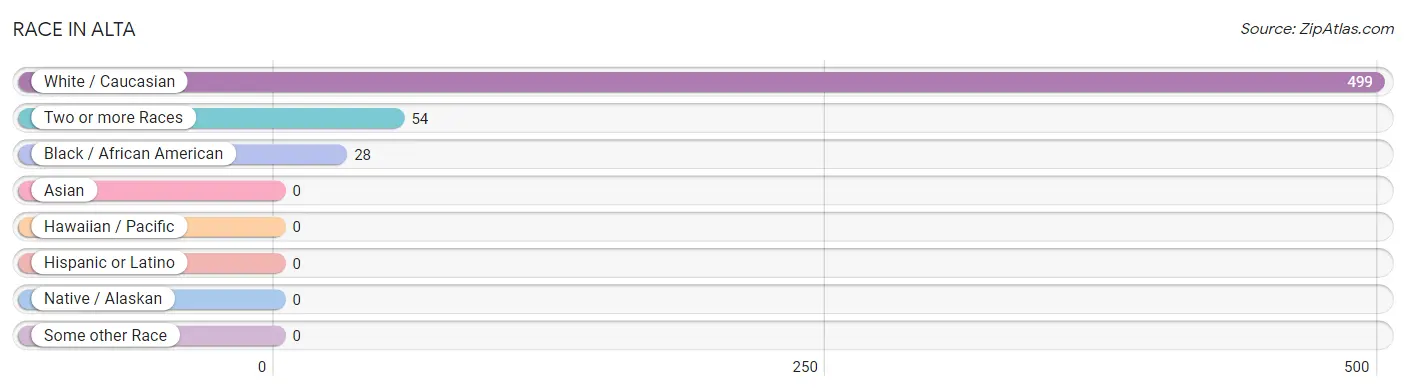
| Race | # Population | % Population |
| Asian | 0 | 0.0% |
| Black / African American | 28 | 4.8% |
| Hawaiian / Pacific | 0 | 0.0% |
| Hispanic or Latino | 0 | 0.0% |
| Native / Alaskan | 0 | 0.0% |
| White / Caucasian | 499 | 85.9% |
| Two or more Races | 54 | 9.3% |
| Some other Race | 0 | 0.0% |
| Total | 581 | 100.0% |
Ancestry in Alta
The most populous ancestries reported in Alta are English (123 | 21.2%), Ukrainian (122 | 21.0%), German (115 | 19.8%), French (64 | 11.0%), and Sri Lankan (54 | 9.3%), together accounting for 82.3% of all Alta residents.
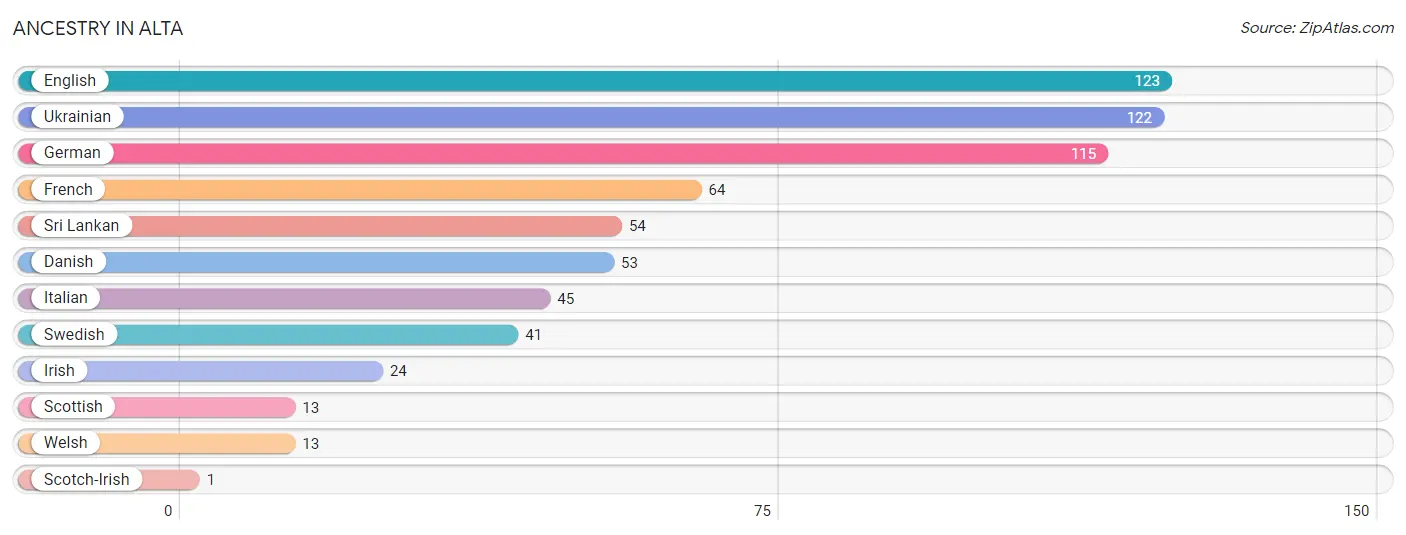
| Ancestry | # Population | % Population |
| Danish | 53 | 9.1% |
| English | 123 | 21.2% |
| French | 64 | 11.0% |
| German | 115 | 19.8% |
| Irish | 24 | 4.1% |
| Italian | 45 | 7.7% |
| Scotch-Irish | 1 | 0.2% |
| Scottish | 13 | 2.2% |
| Sri Lankan | 54 | 9.3% |
| Swedish | 41 | 7.1% |
| Ukrainian | 122 | 21.0% |
| Welsh | 13 | 2.2% | View All 12 Rows |
Immigrants in Alta
The most numerous immigrant groups reported in Alta came from , and Canada (1 | 0.2%), together accounting for 0.2% of all Alta residents.

| Immigration Origin | # Population | % Population |
| Canada | 1 | 0.2% | View All 1 Rows |
Sex and Age in Alta
Sex and Age in Alta
The most populous age groups in Alta are 30 to 34 Years (91 | 27.7%) for men and 15 to 19 Years (42 | 16.6%) for women.
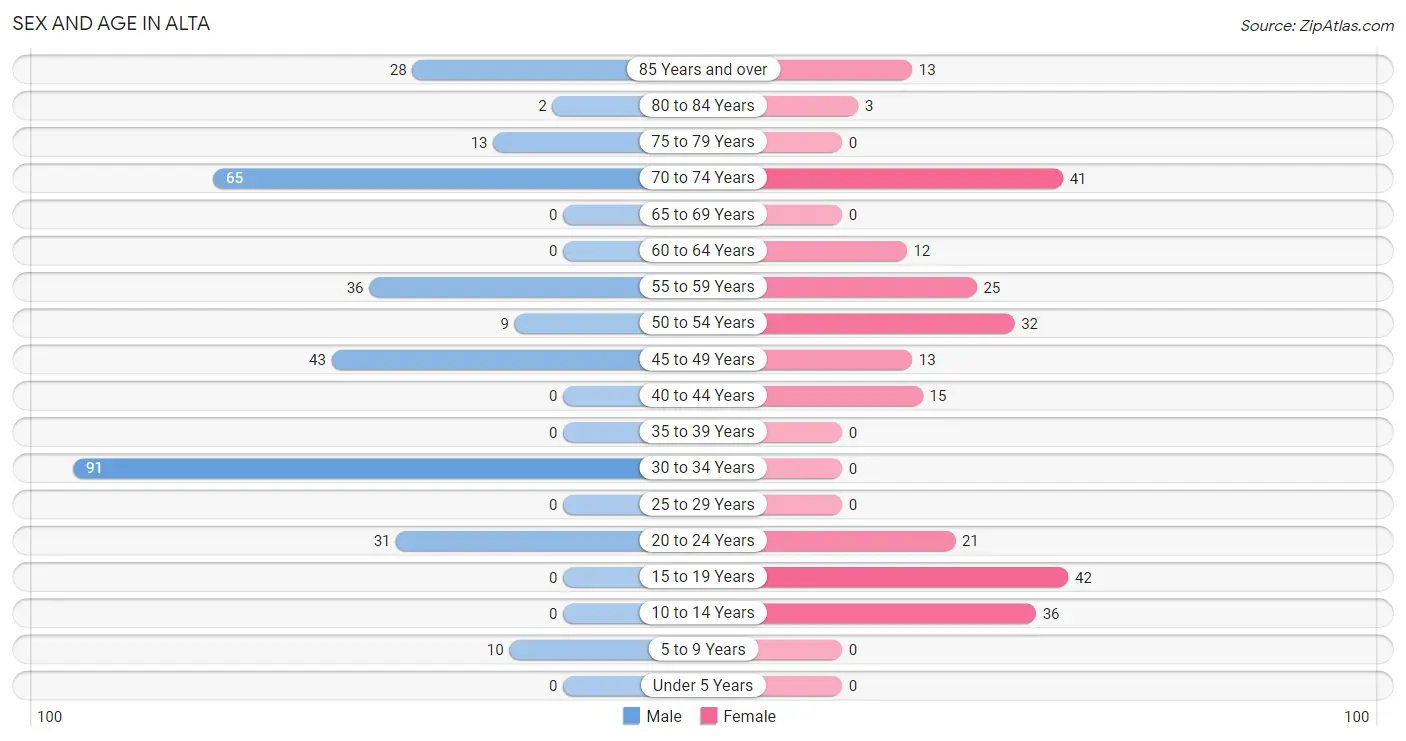
| Age Bracket | Male | Female |
| Under 5 Years | 0 (0.0%) | 0 (0.0%) |
| 5 to 9 Years | 10 (3.0%) | 0 (0.0%) |
| 10 to 14 Years | 0 (0.0%) | 36 (14.2%) |
| 15 to 19 Years | 0 (0.0%) | 42 (16.6%) |
| 20 to 24 Years | 31 (9.5%) | 21 (8.3%) |
| 25 to 29 Years | 0 (0.0%) | 0 (0.0%) |
| 30 to 34 Years | 91 (27.7%) | 0 (0.0%) |
| 35 to 39 Years | 0 (0.0%) | 0 (0.0%) |
| 40 to 44 Years | 0 (0.0%) | 15 (5.9%) |
| 45 to 49 Years | 43 (13.1%) | 13 (5.1%) |
| 50 to 54 Years | 9 (2.7%) | 32 (12.7%) |
| 55 to 59 Years | 36 (11.0%) | 25 (9.9%) |
| 60 to 64 Years | 0 (0.0%) | 12 (4.7%) |
| 65 to 69 Years | 0 (0.0%) | 0 (0.0%) |
| 70 to 74 Years | 65 (19.8%) | 41 (16.2%) |
| 75 to 79 Years | 13 (4.0%) | 0 (0.0%) |
| 80 to 84 Years | 2 (0.6%) | 3 (1.2%) |
| 85 Years and over | 28 (8.5%) | 13 (5.1%) |
| Total | 328 (100.0%) | 253 (100.0%) |
Families and Households in Alta
Median Family Size in Alta
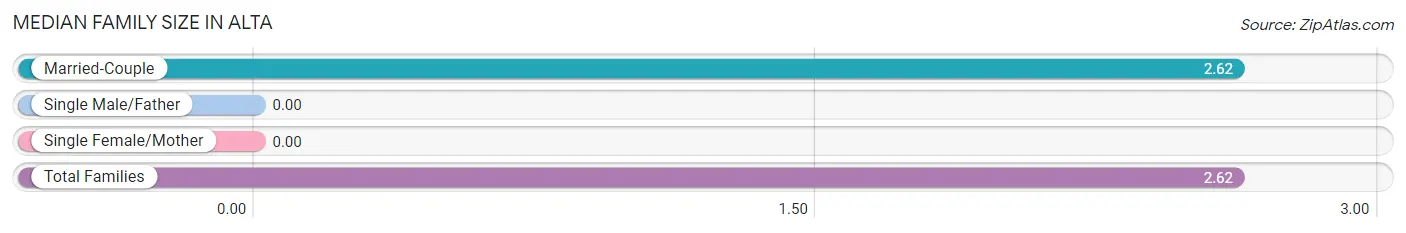
| Family Type | # Families | Family Size |
| Married-Couple | 143 (100.0%) | 2.62 |
| Single Male/Father | 0 (0.0%) | - |
| Single Female/Mother | 0 (0.0%) | - |
| Total Families | 143 (100.0%) | 2.62 |
Median Household Size in Alta
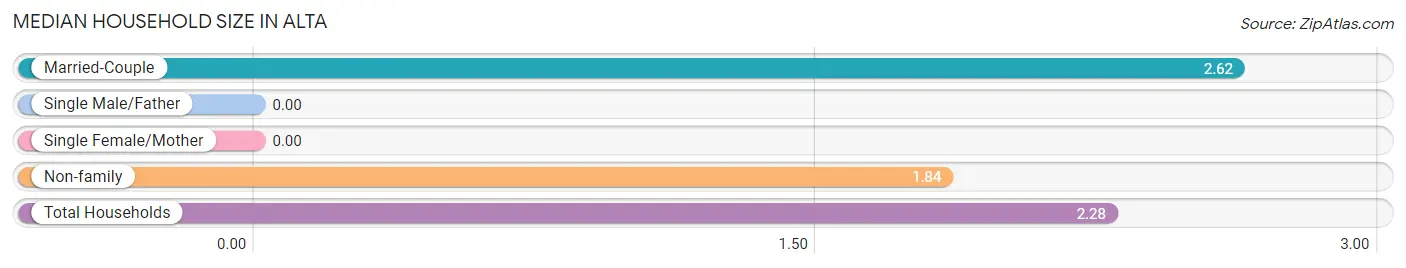
| Household Type | # Households | Household Size |
| Married-Couple | 143 (56.1%) | 2.62 |
| Single Male/Father | 0 (0.0%) | - |
| Single Female/Mother | 0 (0.0%) | - |
| Non-family | 112 (43.9%) | 1.84 |
| Total Households | 255 (100.0%) | 2.28 |
Household Size by Marriage Status in Alta
Out of a total of 255 households in Alta, 143 (56.1%) are family households, while 112 (43.9%) are nonfamily households. The most numerous type of family households are 2-person households, comprising 59, and the most common type of nonfamily households are 1-person households, comprising 84.
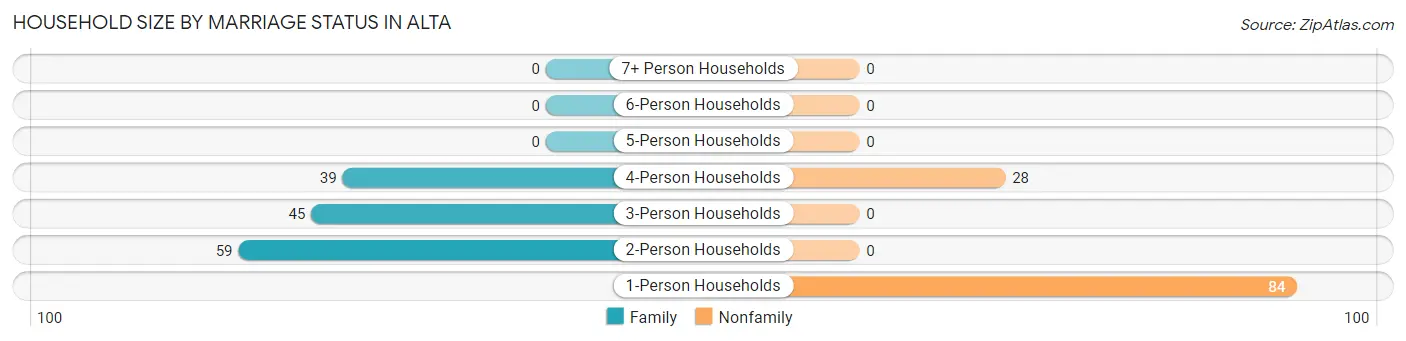
| Household Size | Family Households | Nonfamily Households |
| 1-Person Households | - | 84 (32.9%) |
| 2-Person Households | 59 (23.1%) | 0 (0.0%) |
| 3-Person Households | 45 (17.6%) | 0 (0.0%) |
| 4-Person Households | 39 (15.3%) | 28 (11.0%) |
| 5-Person Households | 0 (0.0%) | 0 (0.0%) |
| 6-Person Households | 0 (0.0%) | 0 (0.0%) |
| 7+ Person Households | 0 (0.0%) | 0 (0.0%) |
| Total | 143 (56.1%) | 112 (43.9%) |
Female Fertility in Alta
Fertility by Age in Alta
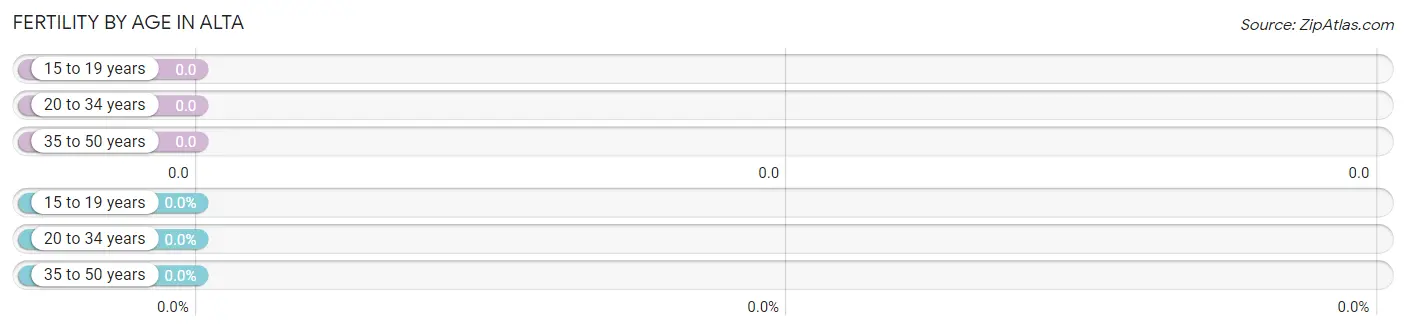
| Age Bracket | Women with Births | Births / 1,000 Women |
| 15 to 19 years | 0 (0.0%) | 0.0 |
| 20 to 34 years | 0 (0.0%) | 0.0 |
| 35 to 50 years | 0 (0.0%) | 0.0 |
| Total | 0 (0.0%) | 0.0 |
Fertility by Age by Marriage Status in Alta
| Age Bracket | Married | Unmarried |
| 15 to 19 years | 0 (0.0%) | 0 (0.0%) |
| 20 to 34 years | 0 (0.0%) | 0 (0.0%) |
| 35 to 50 years | 0 (0.0%) | 0 (0.0%) |
| Total | 0 (0.0%) | 0 (0.0%) |
Fertility by Education in Alta
| Educational Attainment | Women with Births | Births / 1,000 Women |
| Less than High School | 0 (0.0%) | 0.0 |
| High School Diploma | 0 (0.0%) | 0.0 |
| College or Associate's Degree | 0 (0.0%) | 0.0 |
| Bachelor's Degree | 0 (0.0%) | 0.0 |
| Graduate Degree | 0 (0.0%) | 0.0 |
| Total | 0 (0.0%) | 0.0 |
Fertility by Education by Marriage Status in Alta
| Educational Attainment | Married | Unmarried |
| Less than High School | 0 (0.0%) | 0 (0.0%) |
| High School Diploma | 0 (0.0%) | 0 (0.0%) |
| College or Associate's Degree | 0 (0.0%) | 0 (0.0%) |
| Bachelor's Degree | 0 (0.0%) | 0 (0.0%) |
| Graduate Degree | 0 (0.0%) | 0 (0.0%) |
| Total | 0 (0.0%) | 0 (0.0%) |
Employment Characteristics in Alta
Employment by Class of Employer in Alta
Among the 353 employed individuals in Alta, private company employees (196 | 55.5%), self-employed (incorporated) (76 | 21.5%), and federal government employees (59 | 16.7%) make up the most common classes of employment.
| Employer Class | # Employees | % Employees |
| Private Company Employees | 196 | 55.5% |
| Self-Employed (Incorporated) | 76 | 21.5% |
| Self-Employed (Not Incorporated) | 9 | 2.5% |
| Not-for-profit Organizations | 13 | 3.7% |
| Local Government Employees | 0 | 0.0% |
| State Government Employees | 0 | 0.0% |
| Federal Government Employees | 59 | 16.7% |
| Unpaid Family Workers | 0 | 0.0% |
| Total | 353 | 100.0% |
Employment Status by Age in Alta
| Age Bracket | In Labor Force | Unemployed |
| 16 to 19 Years | 0 (0.0%) | 0 (0.0%) |
| 20 to 24 Years | 52 (100.0%) | 0 (0.0%) |
| 25 to 29 Years | 0 (0.0%) | 0 (0.0%) |
| 30 to 34 Years | 91 (100.0%) | 0 (0.0%) |
| 35 to 44 Years | 15 (100.0%) | 0 (0.0%) |
| 45 to 54 Years | 97 (100.0%) | 0 (0.0%) |
| 55 to 59 Years | 36 (59.0%) | 0 (0.0%) |
| 60 to 64 Years | 12 (100.0%) | 0 (0.0%) |
| 65 to 74 Years | 49 (46.2%) | 0 (0.0%) |
| 75 Years and over | 1 (1.7%) | 0 (0.0%) |
| Total | 353 (66.0%) | 0 (0.0%) |
Employment Status by Educational Attainment in Alta
| Educational Attainment | In Labor Force | Unemployed |
| Less than High School | 0 (0.0%) | 0 (0.0%) |
| High School Diploma | 0 (0.0%) | 0 (0.0%) |
| College / Associate Degree | 123 (100.0%) | 0 (0.0%) |
| Bachelor's Degree or higher | 128 (83.7%) | 0 (0.0%) |
| Total | 251 (90.9%) | 0 (0.0%) |
Employment Occupations by Sex in Alta
Management, Business, Science and Arts Occupations
The most common Management, Business, Science and Arts occupations in Alta are Computers, Engineering & Science (63 | 17.8%), Management (53 | 15.0%), Computers & Mathematics (32 | 9.1%), Life, Physical & Social Science (31 | 8.8%), and Business & Financial (28 | 7.9%).
Management, Business, Science and Arts Occupations by Sex
Within the Management, Business, Science and Arts occupations in Alta, the most male-oriented occupations are Management (100.0%), Business & Financial (100.0%), and Life, Physical & Social Science (100.0%), while the most female-oriented occupations are Computers & Mathematics (100.0%), Health Diagnosing & Treating (100.0%), and Health Technologists (100.0%).
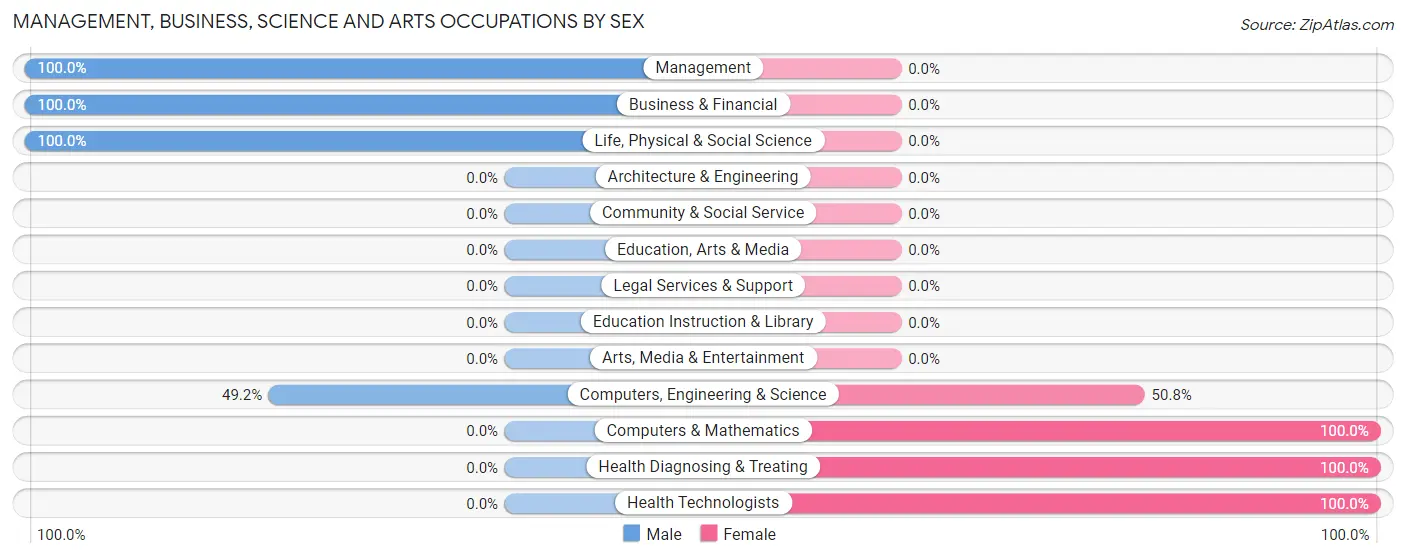
| Occupation | Male | Female |
| Management | 53 (100.0%) | 0 (0.0%) |
| Business & Financial | 28 (100.0%) | 0 (0.0%) |
| Computers, Engineering & Science | 31 (49.2%) | 32 (50.8%) |
| Computers & Mathematics | 0 (0.0%) | 32 (100.0%) |
| Architecture & Engineering | 0 (0.0%) | 0 (0.0%) |
| Life, Physical & Social Science | 31 (100.0%) | 0 (0.0%) |
| Community & Social Service | 0 (0.0%) | 0 (0.0%) |
| Education, Arts & Media | 0 (0.0%) | 0 (0.0%) |
| Legal Services & Support | 0 (0.0%) | 0 (0.0%) |
| Education Instruction & Library | 0 (0.0%) | 0 (0.0%) |
| Arts, Media & Entertainment | 0 (0.0%) | 0 (0.0%) |
| Health Diagnosing & Treating | 0 (0.0%) | 13 (100.0%) |
| Health Technologists | 0 (0.0%) | 13 (100.0%) |
| Total (Category) | 112 (71.3%) | 45 (28.7%) |
| Total (Overall) | 260 (73.7%) | 93 (26.4%) |
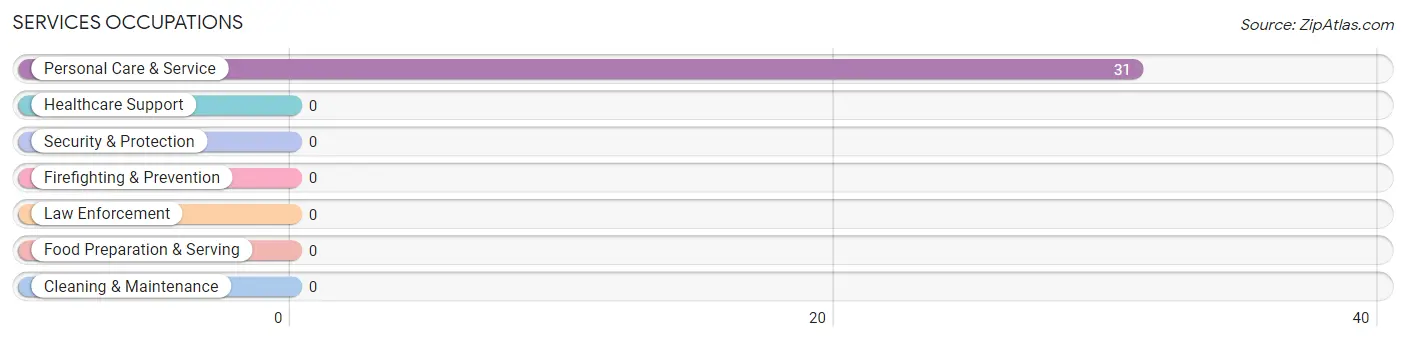
Services Occupations
The most common Services occupations in Alta are , and Personal Care & Service (31 | 8.8%).
Services Occupations by Sex
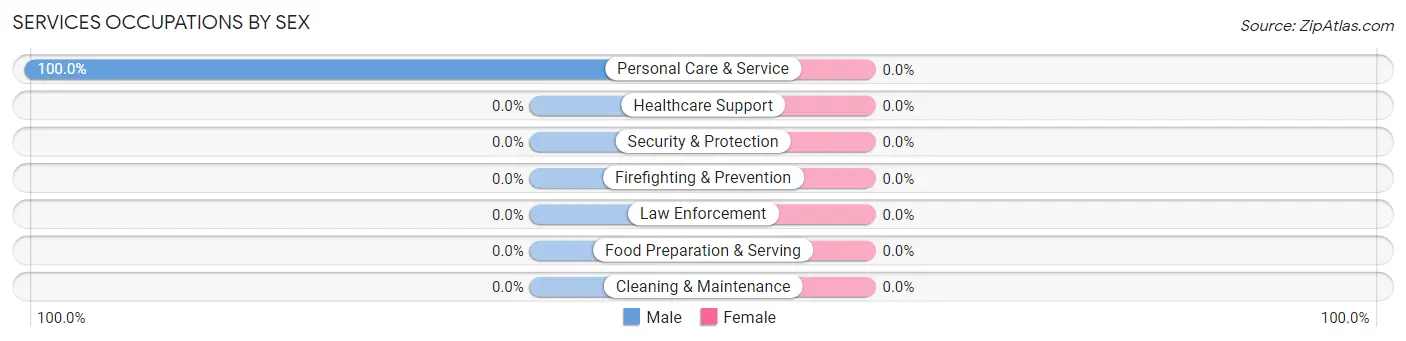
| Occupation | Male | Female |
| Healthcare Support | 0 (0.0%) | 0 (0.0%) |
| Security & Protection | 0 (0.0%) | 0 (0.0%) |
| Firefighting & Prevention | 0 (0.0%) | 0 (0.0%) |
| Law Enforcement | 0 (0.0%) | 0 (0.0%) |
| Food Preparation & Serving | 0 (0.0%) | 0 (0.0%) |
| Cleaning & Maintenance | 0 (0.0%) | 0 (0.0%) |
| Personal Care & Service | 31 (100.0%) | 0 (0.0%) |
| Total (Category) | 31 (100.0%) | 0 (0.0%) |
| Total (Overall) | 260 (73.7%) | 93 (26.4%) |
Sales and Office Occupations
The most common Sales and Office occupations in Alta are Sales & Related (90 | 25.5%), and Office & Administration (12 | 3.4%).
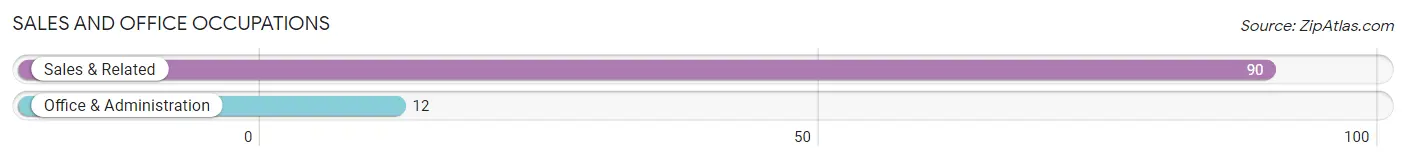
Sales and Office Occupations by Sex
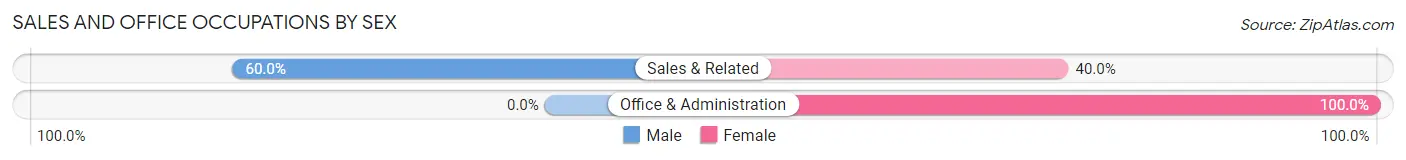
| Occupation | Male | Female |
| Sales & Related | 54 (60.0%) | 36 (40.0%) |
| Office & Administration | 0 (0.0%) | 12 (100.0%) |
| Total (Category) | 54 (52.9%) | 48 (47.1%) |
| Total (Overall) | 260 (73.7%) | 93 (26.4%) |
Natural Resources, Construction and Maintenance Occupations
The most common Natural Resources, Construction and Maintenance occupations in Alta are , and Construction & Extraction (32 | 9.1%).
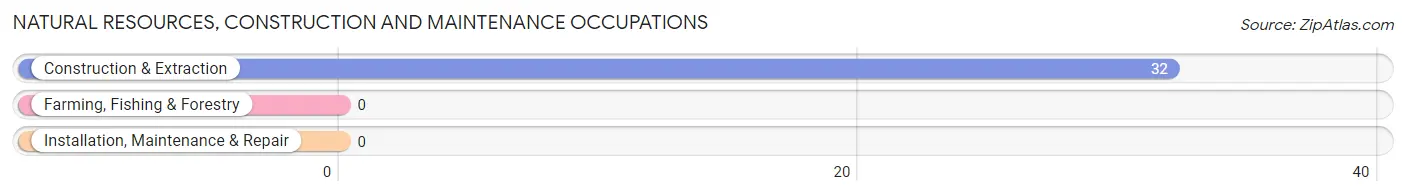
Natural Resources, Construction and Maintenance Occupations by Sex
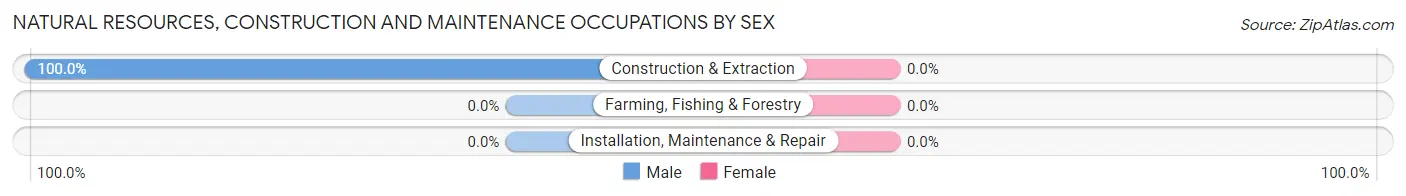
| Occupation | Male | Female |
| Farming, Fishing & Forestry | 0 (0.0%) | 0 (0.0%) |
| Construction & Extraction | 32 (100.0%) | 0 (0.0%) |
| Installation, Maintenance & Repair | 0 (0.0%) | 0 (0.0%) |
| Total (Category) | 32 (100.0%) | 0 (0.0%) |
| Total (Overall) | 260 (73.7%) | 93 (26.4%) |
Production, Transportation and Moving Occupations
The most common Production, Transportation and Moving occupations in Alta are , and Material Moving (31 | 8.8%).
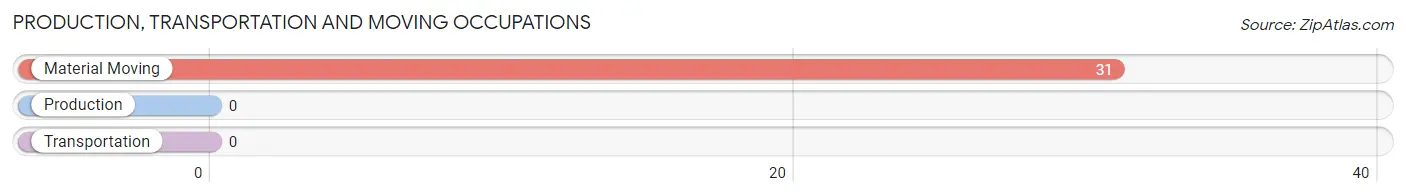
Production, Transportation and Moving Occupations by Sex
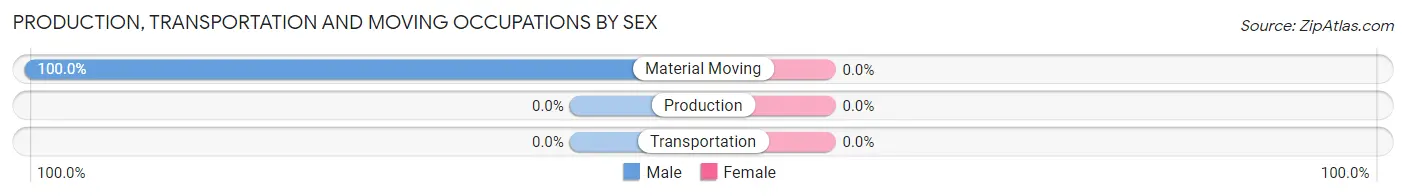
| Occupation | Male | Female |
| Production | 0 (0.0%) | 0 (0.0%) |
| Transportation | 0 (0.0%) | 0 (0.0%) |
| Material Moving | 31 (100.0%) | 0 (0.0%) |
| Total (Category) | 31 (100.0%) | 0 (0.0%) |
| Total (Overall) | 260 (73.7%) | 93 (26.4%) |
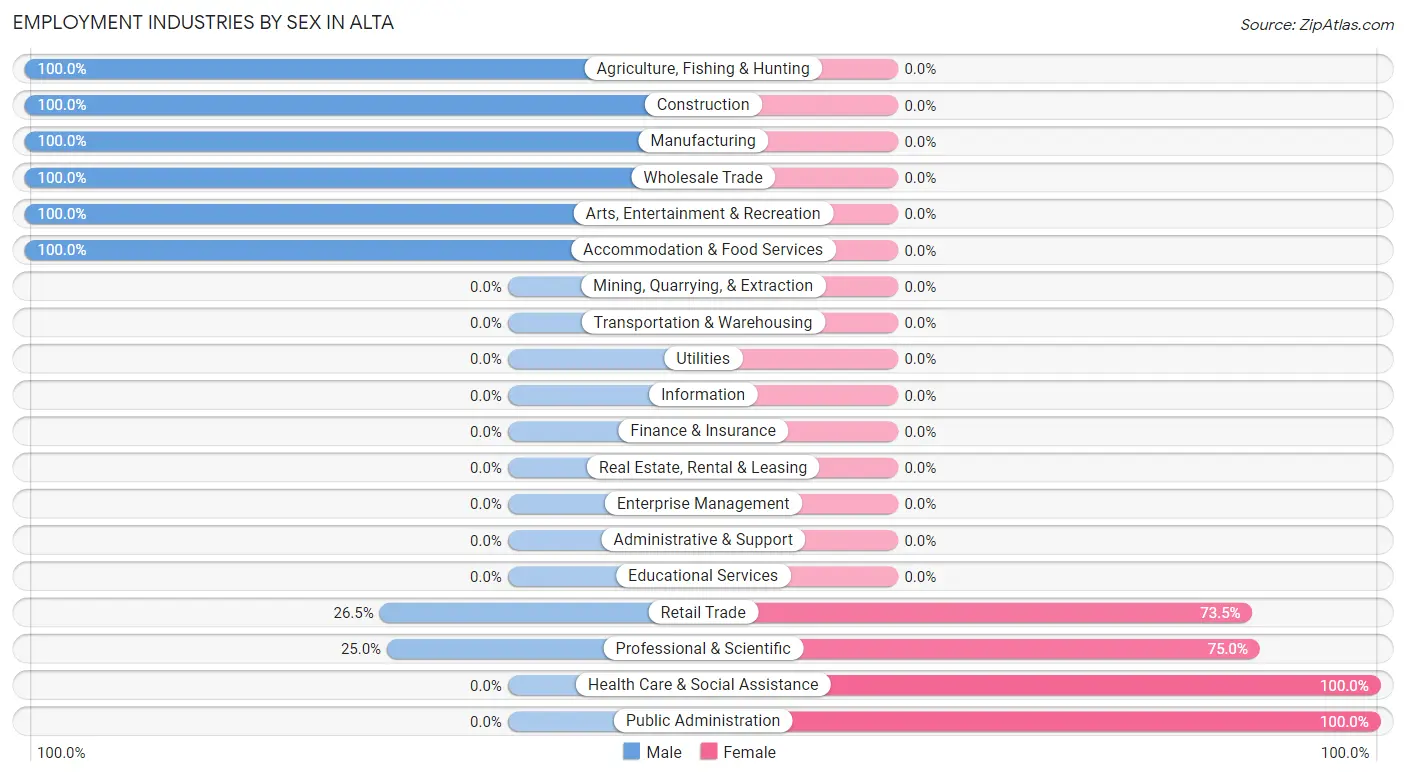
Employment Industries by Sex in Alta
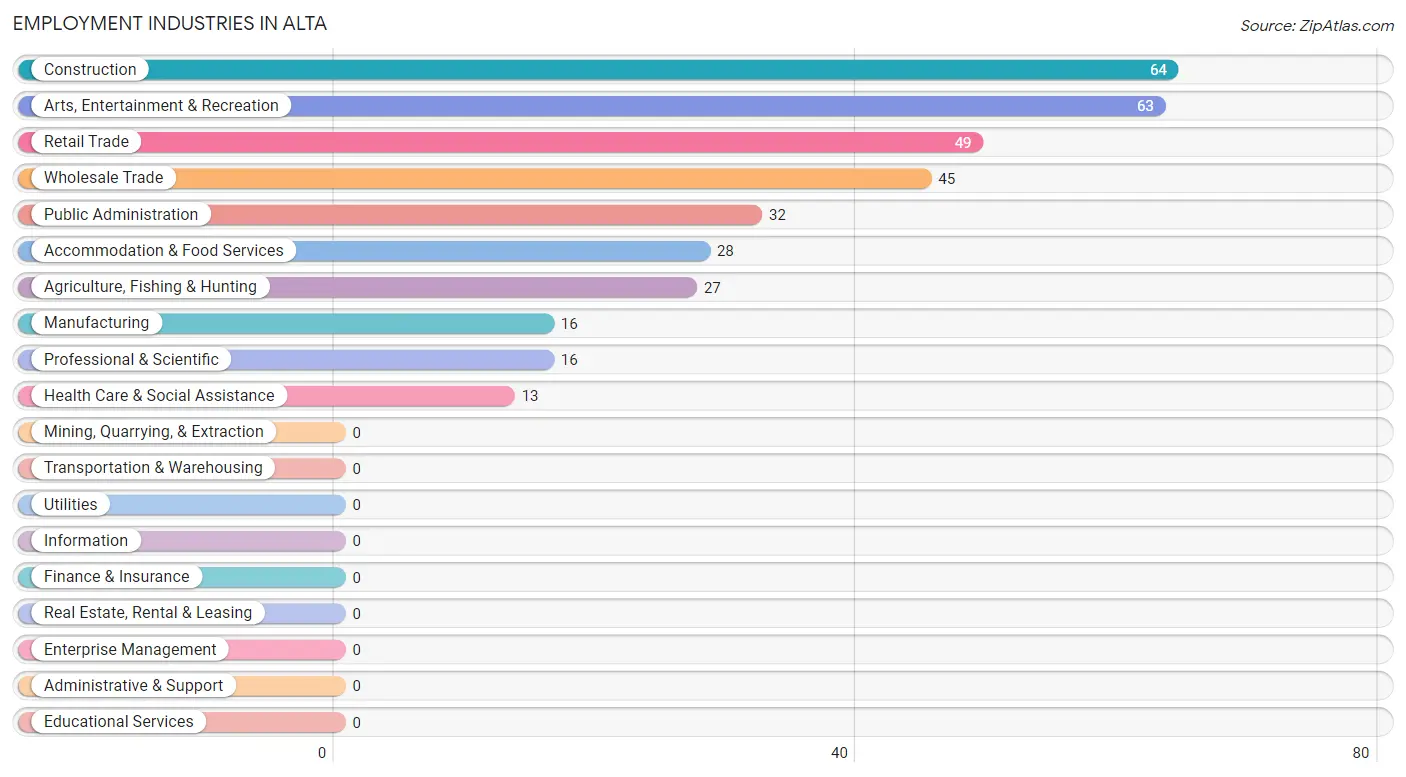
Employment Industries in Alta
The major employment industries in Alta include Construction (64 | 18.1%), Arts, Entertainment & Recreation (63 | 17.8%), Retail Trade (49 | 13.9%), Wholesale Trade (45 | 12.8%), and Public Administration (32 | 9.1%).
Employment Industries by Sex in Alta
The Alta industries that see more men than women are Agriculture, Fishing & Hunting (100.0%), Construction (100.0%), and Manufacturing (100.0%), whereas the industries that tend to have a higher number of women are Health Care & Social Assistance (100.0%), Public Administration (100.0%), and Professional & Scientific (75.0%).
| Industry | Male | Female |
| Agriculture, Fishing & Hunting | 27 (100.0%) | 0 (0.0%) |
| Mining, Quarrying, & Extraction | 0 (0.0%) | 0 (0.0%) |
| Construction | 64 (100.0%) | 0 (0.0%) |
| Manufacturing | 16 (100.0%) | 0 (0.0%) |
| Wholesale Trade | 45 (100.0%) | 0 (0.0%) |
| Retail Trade | 13 (26.5%) | 36 (73.5%) |
| Transportation & Warehousing | 0 (0.0%) | 0 (0.0%) |
| Utilities | 0 (0.0%) | 0 (0.0%) |
| Information | 0 (0.0%) | 0 (0.0%) |
| Finance & Insurance | 0 (0.0%) | 0 (0.0%) |
| Real Estate, Rental & Leasing | 0 (0.0%) | 0 (0.0%) |
| Professional & Scientific | 4 (25.0%) | 12 (75.0%) |
| Enterprise Management | 0 (0.0%) | 0 (0.0%) |
| Administrative & Support | 0 (0.0%) | 0 (0.0%) |
| Educational Services | 0 (0.0%) | 0 (0.0%) |
| Health Care & Social Assistance | 0 (0.0%) | 13 (100.0%) |
| Arts, Entertainment & Recreation | 63 (100.0%) | 0 (0.0%) |
| Accommodation & Food Services | 28 (100.0%) | 0 (0.0%) |
| Public Administration | 0 (0.0%) | 32 (100.0%) |
| Total | 260 (73.7%) | 93 (26.4%) |
Education in Alta
School Enrollment in Alta
The most common levels of schooling among the 135 students in Alta are college / undergraduate (47 | 34.8%), high school (42 | 31.1%), and middle school (36 | 26.7%).
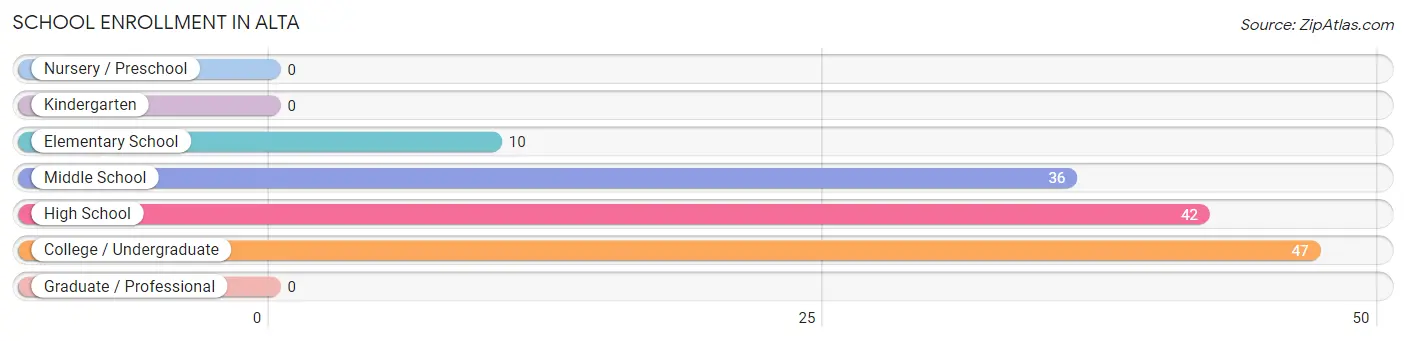
| School Level | # Students | % Students |
| Nursery / Preschool | 0 | 0.0% |
| Kindergarten | 0 | 0.0% |
| Elementary School | 10 | 7.4% |
| Middle School | 36 | 26.7% |
| High School | 42 | 31.1% |
| College / Undergraduate | 47 | 34.8% |
| Graduate / Professional | 0 | 0.0% |
| Total | 135 | 100.0% |
School Enrollment by Age by Funding Source in Alta
Out of a total of 135 students who are enrolled in schools in Alta, 31 (23.0%) attend a private institution, while the remaining 104 (77.0%) are enrolled in public schools. The age group of 15 to 17 year olds has the highest likelihood of being enrolled in private schools, with 31 (73.8% in the age bracket) enrolled. Conversely, the age group of 5 to 9 year old has the lowest likelihood of being enrolled in a private school, with 10 (100.0% in the age bracket) attending a public institution.
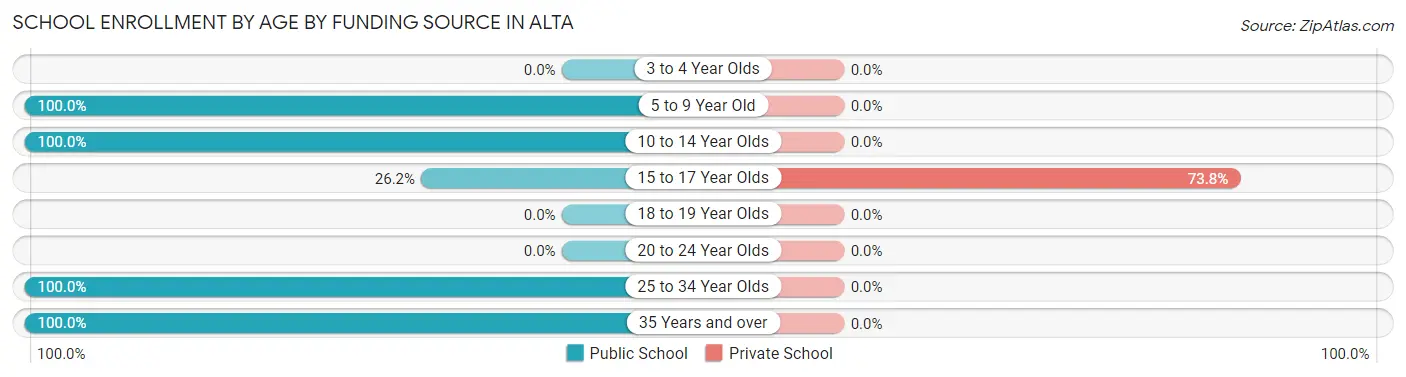
| Age Bracket | Public School | Private School |
| 3 to 4 Year Olds | 0 (0.0%) | 0 (0.0%) |
| 5 to 9 Year Old | 10 (100.0%) | 0 (0.0%) |
| 10 to 14 Year Olds | 36 (100.0%) | 0 (0.0%) |
| 15 to 17 Year Olds | 11 (26.2%) | 31 (73.8%) |
| 18 to 19 Year Olds | 0 (0.0%) | 0 (0.0%) |
| 20 to 24 Year Olds | 0 (0.0%) | 0 (0.0%) |
| 25 to 34 Year Olds | 32 (100.0%) | 0 (0.0%) |
| 35 Years and over | 15 (100.0%) | 0 (0.0%) |
| Total | 104 (77.0%) | 31 (23.0%) |
Educational Attainment by Field of Study in Alta
Social sciences (77 | 25.3%), communications (60 | 19.7%), bio, nature & agricultural (55 | 18.1%), liberal arts & history (38 | 12.5%), and computers & mathematics (27 | 8.9%) are the most common fields of study among 304 individuals in Alta who have obtained a bachelor's degree or higher.
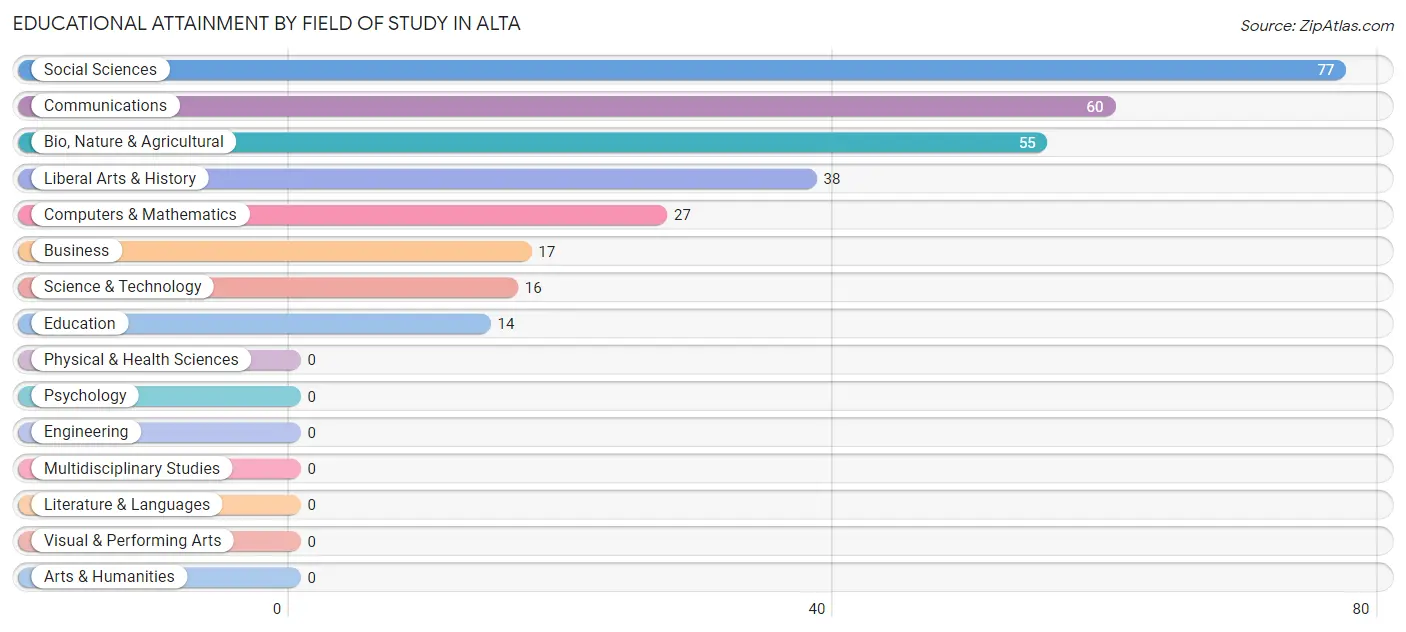
| Field of Study | # Graduates | % Graduates |
| Computers & Mathematics | 27 | 8.9% |
| Bio, Nature & Agricultural | 55 | 18.1% |
| Physical & Health Sciences | 0 | 0.0% |
| Psychology | 0 | 0.0% |
| Social Sciences | 77 | 25.3% |
| Engineering | 0 | 0.0% |
| Multidisciplinary Studies | 0 | 0.0% |
| Science & Technology | 16 | 5.3% |
| Business | 17 | 5.6% |
| Education | 14 | 4.6% |
| Literature & Languages | 0 | 0.0% |
| Liberal Arts & History | 38 | 12.5% |
| Visual & Performing Arts | 0 | 0.0% |
| Communications | 60 | 19.7% |
| Arts & Humanities | 0 | 0.0% |
| Total | 304 | 100.0% |
Transportation & Commute in Alta
Vehicle Availability by Sex in Alta
The most prevalent vehicle ownership categories in Alta are males with 3 vehicles (110, accounting for 42.3%) and females with 3 vehicles (15, making up 118.3%).
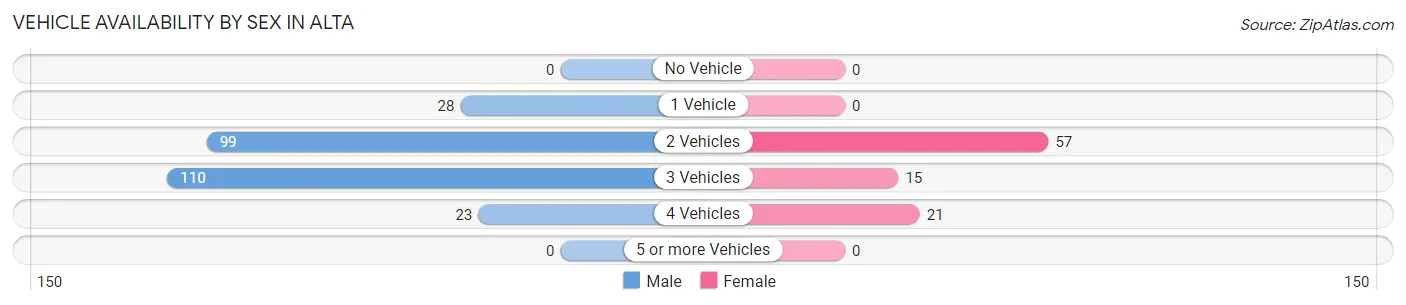
| Vehicles Available | Male | Female |
| No Vehicle | 0 (0.0%) | 0 (0.0%) |
| 1 Vehicle | 28 (10.8%) | 0 (0.0%) |
| 2 Vehicles | 99 (38.1%) | 57 (61.3%) |
| 3 Vehicles | 110 (42.3%) | 15 (16.1%) |
| 4 Vehicles | 23 (8.8%) | 21 (22.6%) |
| 5 or more Vehicles | 0 (0.0%) | 0 (0.0%) |
| Total | 260 (100.0%) | 93 (100.0%) |
Commute Time in Alta
The most frequently occuring commute durations in Alta are 45 to 59 minutes (63 commuters, 30.7%), 15 to 19 minutes (31 commuters, 15.1%), and 20 to 24 minutes (29 commuters, 14.1%).
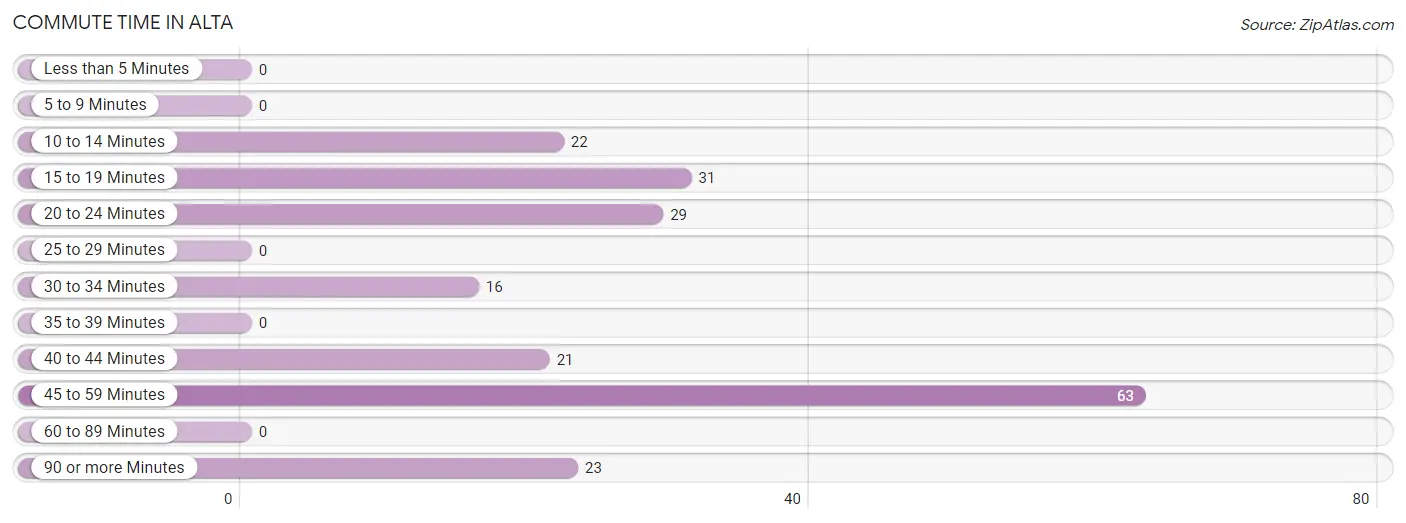
| Commute Time | # Commuters | % Commuters |
| Less than 5 Minutes | 0 | 0.0% |
| 5 to 9 Minutes | 0 | 0.0% |
| 10 to 14 Minutes | 22 | 10.7% |
| 15 to 19 Minutes | 31 | 15.1% |
| 20 to 24 Minutes | 29 | 14.1% |
| 25 to 29 Minutes | 0 | 0.0% |
| 30 to 34 Minutes | 16 | 7.8% |
| 35 to 39 Minutes | 0 | 0.0% |
| 40 to 44 Minutes | 21 | 10.2% |
| 45 to 59 Minutes | 63 | 30.7% |
| 60 to 89 Minutes | 0 | 0.0% |
| 90 or more Minutes | 23 | 11.2% |
Commute Time by Sex in Alta
The most common commute times in Alta are 45 to 59 minutes (63 commuters, 36.8%) for males and 40 to 44 minutes (21 commuters, 61.8%) for females.
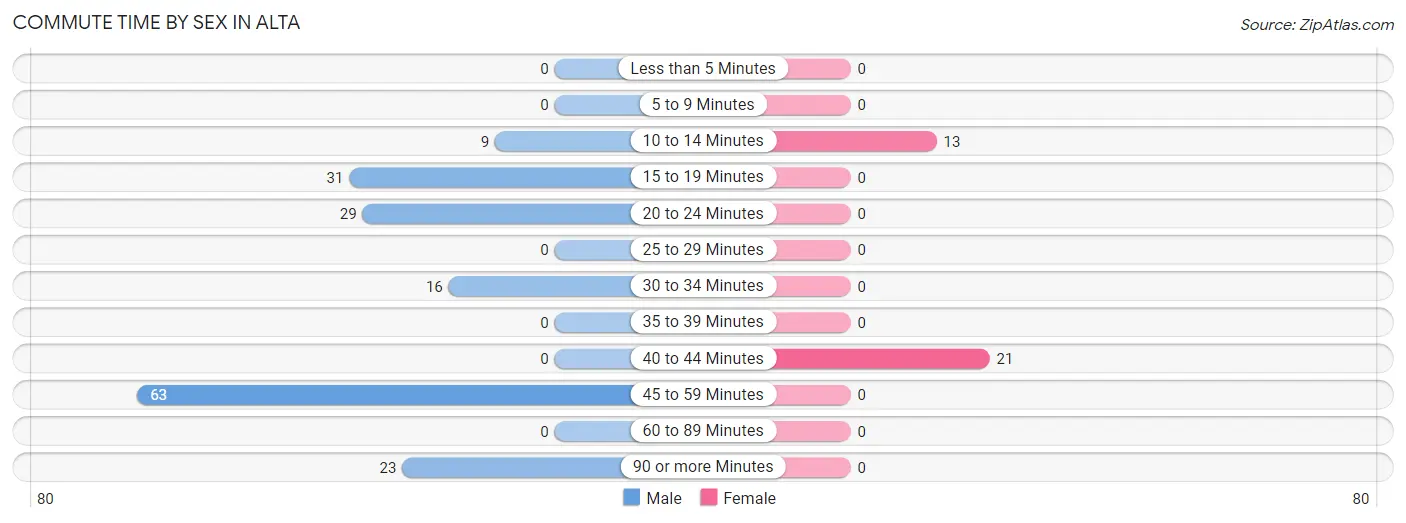
| Commute Time | Male | Female |
| Less than 5 Minutes | 0 (0.0%) | 0 (0.0%) |
| 5 to 9 Minutes | 0 (0.0%) | 0 (0.0%) |
| 10 to 14 Minutes | 9 (5.3%) | 13 (38.2%) |
| 15 to 19 Minutes | 31 (18.1%) | 0 (0.0%) |
| 20 to 24 Minutes | 29 (17.0%) | 0 (0.0%) |
| 25 to 29 Minutes | 0 (0.0%) | 0 (0.0%) |
| 30 to 34 Minutes | 16 (9.4%) | 0 (0.0%) |
| 35 to 39 Minutes | 0 (0.0%) | 0 (0.0%) |
| 40 to 44 Minutes | 0 (0.0%) | 21 (61.8%) |
| 45 to 59 Minutes | 63 (36.8%) | 0 (0.0%) |
| 60 to 89 Minutes | 0 (0.0%) | 0 (0.0%) |
| 90 or more Minutes | 23 (13.5%) | 0 (0.0%) |
Time of Departure to Work by Sex in Alta
The most frequent times of departure to work in Alta are 8:00 AM to 8:29 AM (62, 36.3%) for males and 12:00 PM to 3:59 PM (21, 61.8%) for females.
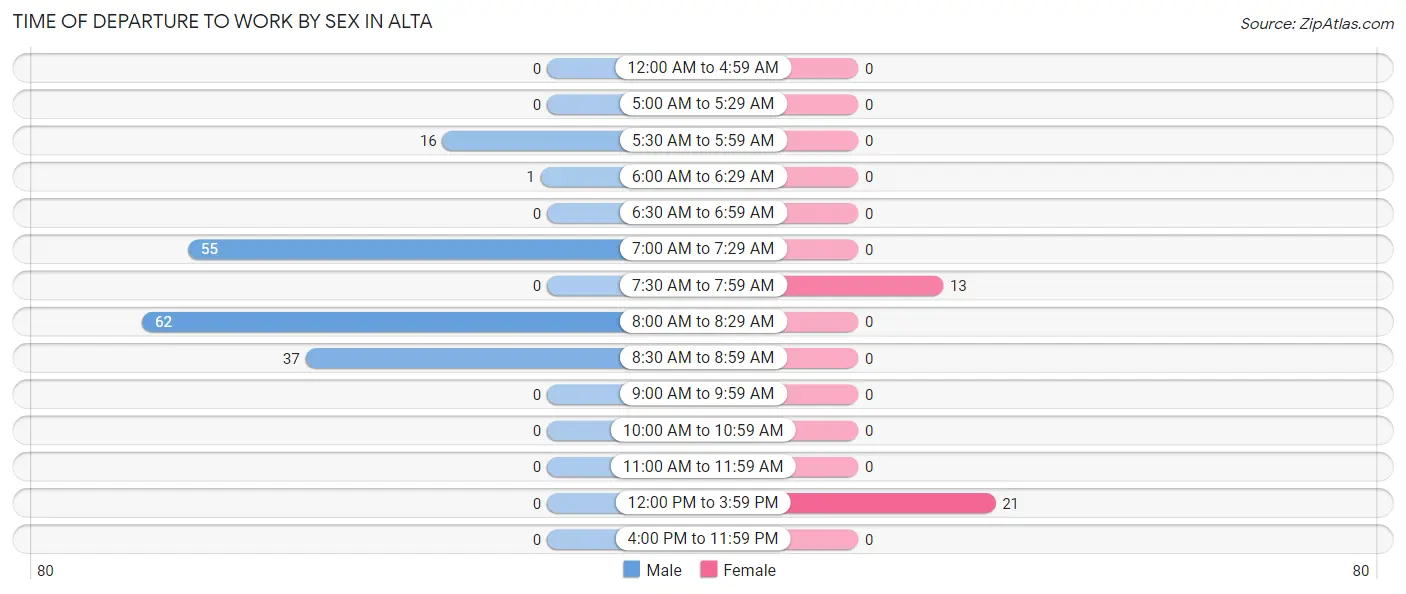
| Time of Departure | Male | Female |
| 12:00 AM to 4:59 AM | 0 (0.0%) | 0 (0.0%) |
| 5:00 AM to 5:29 AM | 0 (0.0%) | 0 (0.0%) |
| 5:30 AM to 5:59 AM | 16 (9.4%) | 0 (0.0%) |
| 6:00 AM to 6:29 AM | 1 (0.6%) | 0 (0.0%) |
| 6:30 AM to 6:59 AM | 0 (0.0%) | 0 (0.0%) |
| 7:00 AM to 7:29 AM | 55 (32.2%) | 0 (0.0%) |
| 7:30 AM to 7:59 AM | 0 (0.0%) | 13 (38.2%) |
| 8:00 AM to 8:29 AM | 62 (36.3%) | 0 (0.0%) |
| 8:30 AM to 8:59 AM | 37 (21.6%) | 0 (0.0%) |
| 9:00 AM to 9:59 AM | 0 (0.0%) | 0 (0.0%) |
| 10:00 AM to 10:59 AM | 0 (0.0%) | 0 (0.0%) |
| 11:00 AM to 11:59 AM | 0 (0.0%) | 0 (0.0%) |
| 12:00 PM to 3:59 PM | 0 (0.0%) | 21 (61.8%) |
| 4:00 PM to 11:59 PM | 0 (0.0%) | 0 (0.0%) |
| Total | 171 (100.0%) | 34 (100.0%) |
Housing Occupancy in Alta
Occupancy by Ownership in Alta
Of the total 255 dwellings in Alta, owner-occupied units account for 213 (83.5%), while renter-occupied units make up 42 (16.5%).
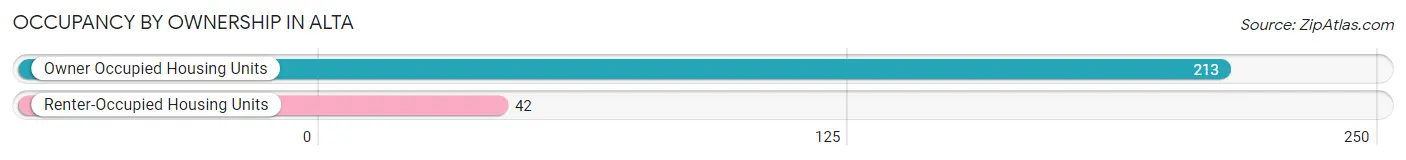
| Occupancy | # Housing Units | % Housing Units |
| Owner Occupied Housing Units | 213 | 83.5% |
| Renter-Occupied Housing Units | 42 | 16.5% |
| Total Occupied Housing Units | 255 | 100.0% |
Occupancy by Household Size in Alta
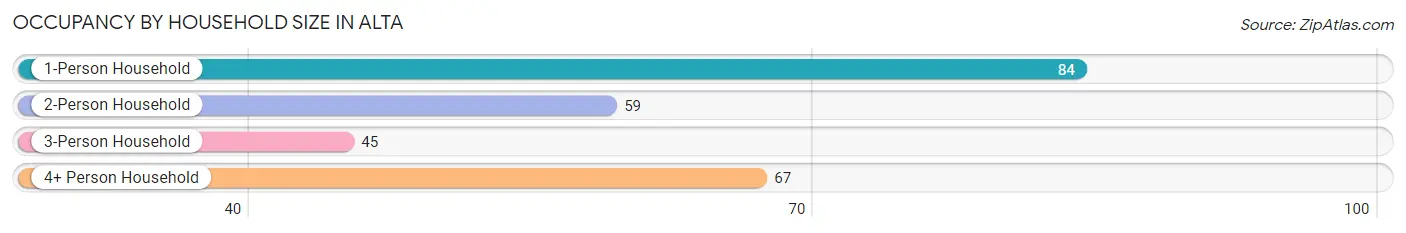
| Household Size | # Housing Units | % Housing Units |
| 1-Person Household | 84 | 32.9% |
| 2-Person Household | 59 | 23.1% |
| 3-Person Household | 45 | 17.6% |
| 4+ Person Household | 67 | 26.3% |
| Total Housing Units | 255 | 100.0% |
Occupancy by Ownership by Household Size in Alta
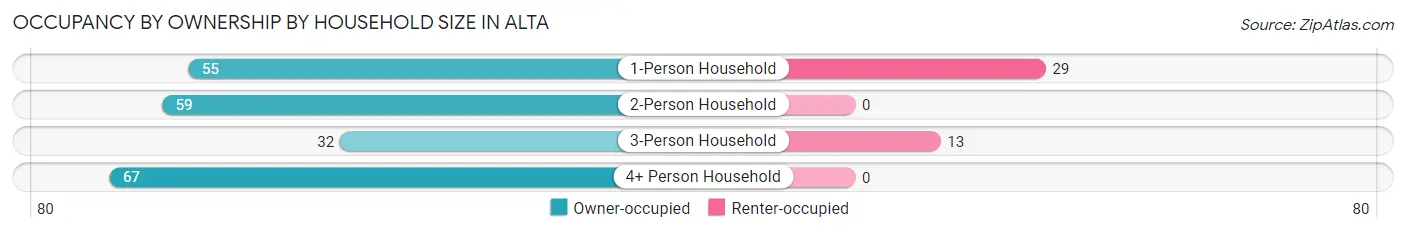
| Household Size | Owner-occupied | Renter-occupied |
| 1-Person Household | 55 (65.5%) | 29 (34.5%) |
| 2-Person Household | 59 (100.0%) | 0 (0.0%) |
| 3-Person Household | 32 (71.1%) | 13 (28.9%) |
| 4+ Person Household | 67 (100.0%) | 0 (0.0%) |
| Total Housing Units | 213 (83.5%) | 42 (16.5%) |
Occupancy by Educational Attainment in Alta
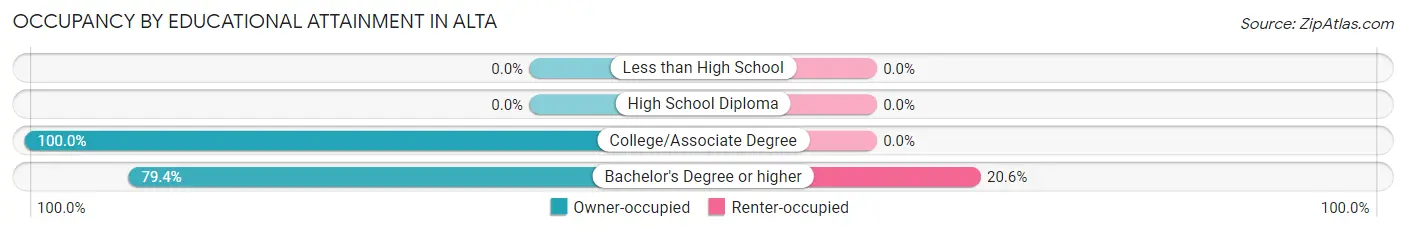
| Household Size | Owner-occupied | Renter-occupied |
| Less than High School | 0 (0.0%) | 0 (0.0%) |
| High School Diploma | 0 (0.0%) | 0 (0.0%) |
| College/Associate Degree | 51 (100.0%) | 0 (0.0%) |
| Bachelor's Degree or higher | 162 (79.4%) | 42 (20.6%) |
Occupancy by Age of Householder in Alta
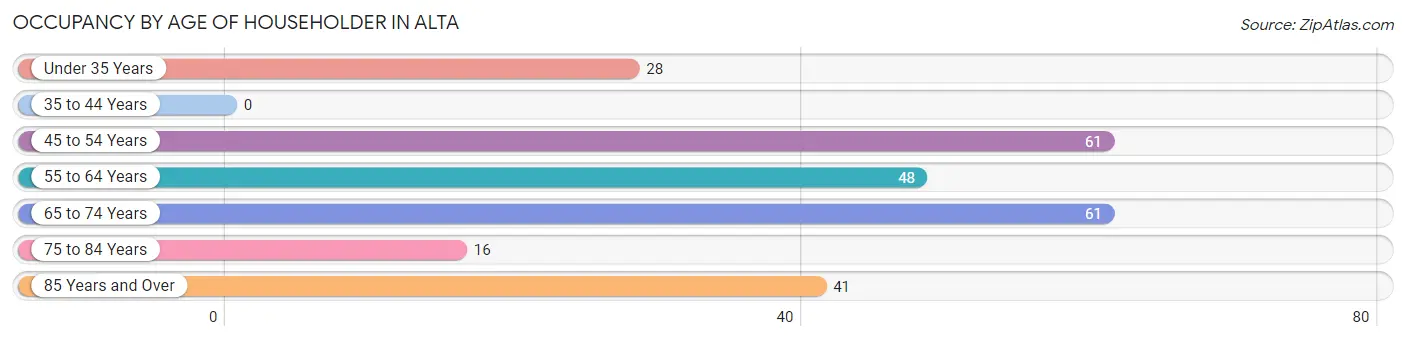
| Age Bracket | # Households | % Households |
| Under 35 Years | 28 | 11.0% |
| 35 to 44 Years | 0 | 0.0% |
| 45 to 54 Years | 61 | 23.9% |
| 55 to 64 Years | 48 | 18.8% |
| 65 to 74 Years | 61 | 23.9% |
| 75 to 84 Years | 16 | 6.3% |
| 85 Years and Over | 41 | 16.1% |
| Total | 255 | 100.0% |
Housing Finances in Alta
Median Income by Occupancy in Alta
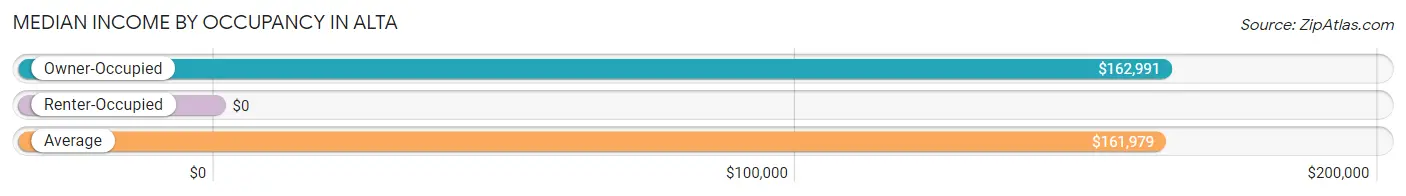
| Occupancy Type | # Households | Median Income |
| Owner-Occupied | 213 (83.5%) | $162,991 |
| Renter-Occupied | 42 (16.5%) | $0 |
| Average | 255 (100.0%) | $161,979 |
Occupancy by Householder Income Bracket in Alta
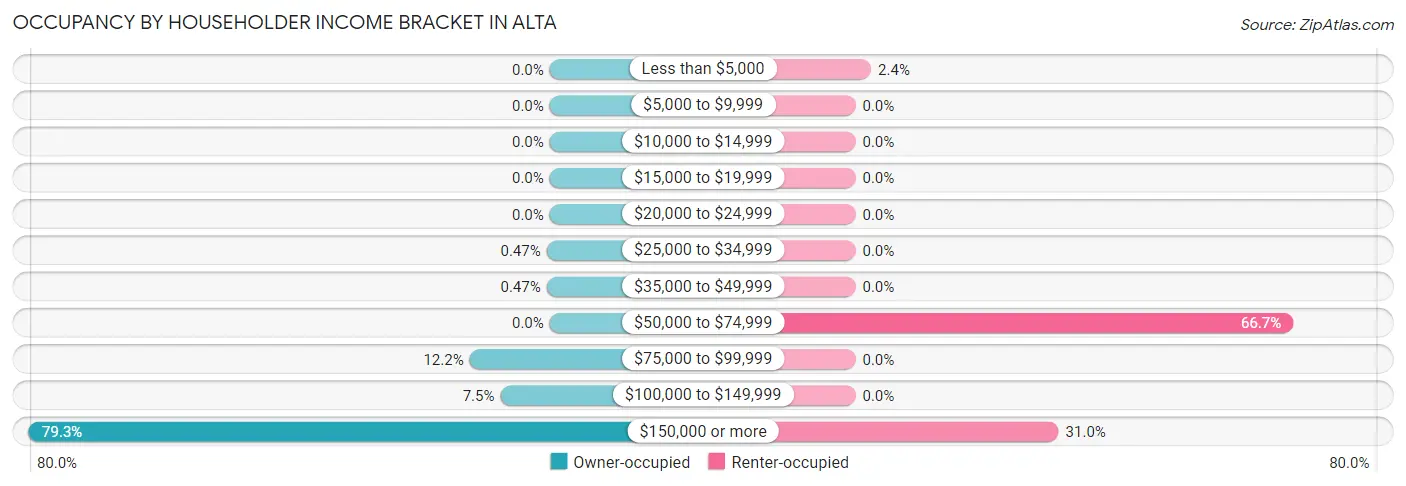
| Income Bracket | Owner-occupied | Renter-occupied |
| Less than $5,000 | 0 (0.0%) | 1 (2.4%) |
| $5,000 to $9,999 | 0 (0.0%) | 0 (0.0%) |
| $10,000 to $14,999 | 0 (0.0%) | 0 (0.0%) |
| $15,000 to $19,999 | 0 (0.0%) | 0 (0.0%) |
| $20,000 to $24,999 | 0 (0.0%) | 0 (0.0%) |
| $25,000 to $34,999 | 1 (0.5%) | 0 (0.0%) |
| $35,000 to $49,999 | 1 (0.5%) | 0 (0.0%) |
| $50,000 to $74,999 | 0 (0.0%) | 28 (66.7%) |
| $75,000 to $99,999 | 26 (12.2%) | 0 (0.0%) |
| $100,000 to $149,999 | 16 (7.5%) | 0 (0.0%) |
| $150,000 or more | 169 (79.3%) | 13 (30.9%) |
| Total | 213 (100.0%) | 42 (100.0%) |
Monthly Housing Cost Tiers in Alta
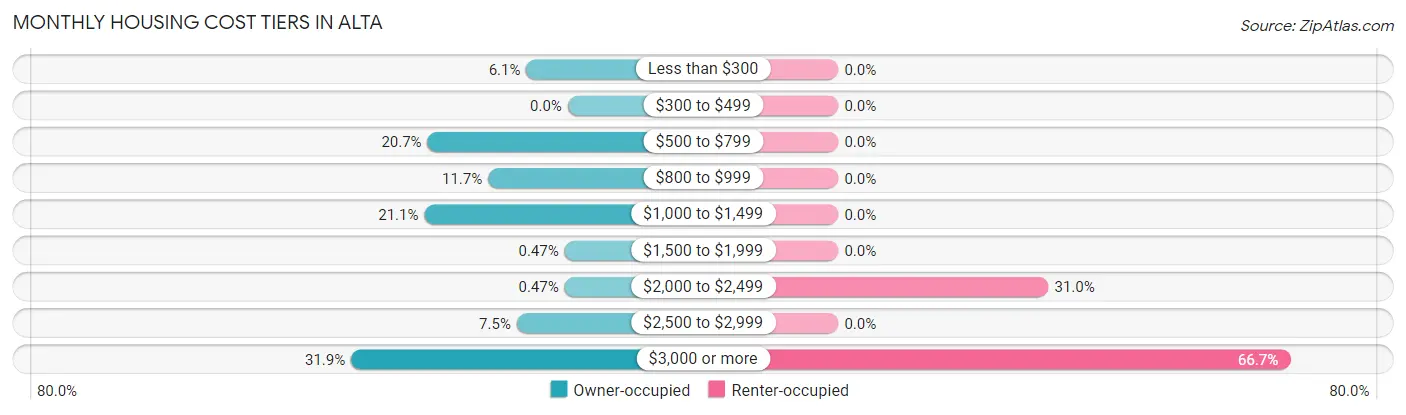
| Monthly Cost | Owner-occupied | Renter-occupied |
| Less than $300 | 13 (6.1%) | 0 (0.0%) |
| $300 to $499 | 0 (0.0%) | 0 (0.0%) |
| $500 to $799 | 44 (20.7%) | 0 (0.0%) |
| $800 to $999 | 25 (11.7%) | 0 (0.0%) |
| $1,000 to $1,499 | 45 (21.1%) | 0 (0.0%) |
| $1,500 to $1,999 | 1 (0.5%) | 0 (0.0%) |
| $2,000 to $2,499 | 1 (0.5%) | 13 (30.9%) |
| $2,500 to $2,999 | 16 (7.5%) | 0 (0.0%) |
| $3,000 or more | 68 (31.9%) | 28 (66.7%) |
| Total | 213 (100.0%) | 42 (100.0%) |
Physical Housing Characteristics in Alta
Housing Structures in Alta
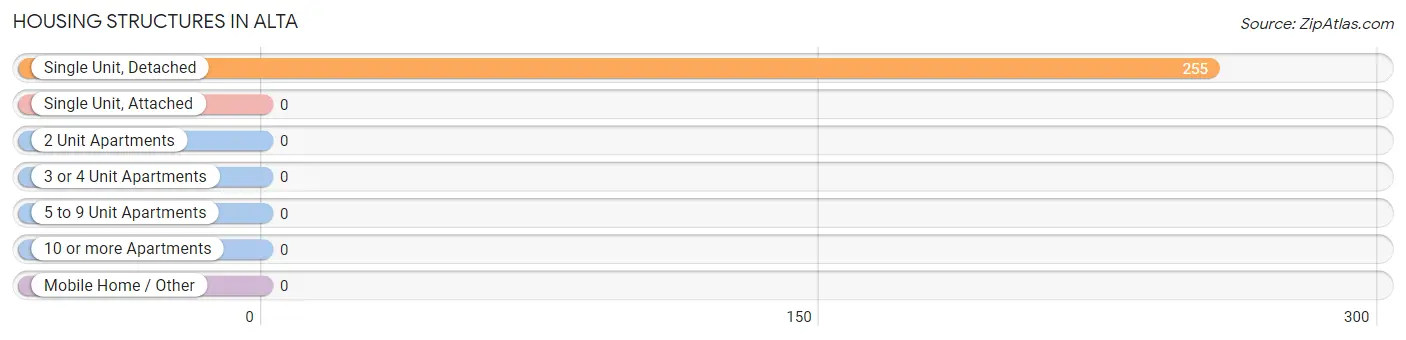
| Structure Type | # Housing Units | % Housing Units |
| Single Unit, Detached | 255 | 100.0% |
| Single Unit, Attached | 0 | 0.0% |
| 2 Unit Apartments | 0 | 0.0% |
| 3 or 4 Unit Apartments | 0 | 0.0% |
| 5 to 9 Unit Apartments | 0 | 0.0% |
| 10 or more Apartments | 0 | 0.0% |
| Mobile Home / Other | 0 | 0.0% |
| Total | 255 | 100.0% |
Housing Structures by Occupancy in Alta
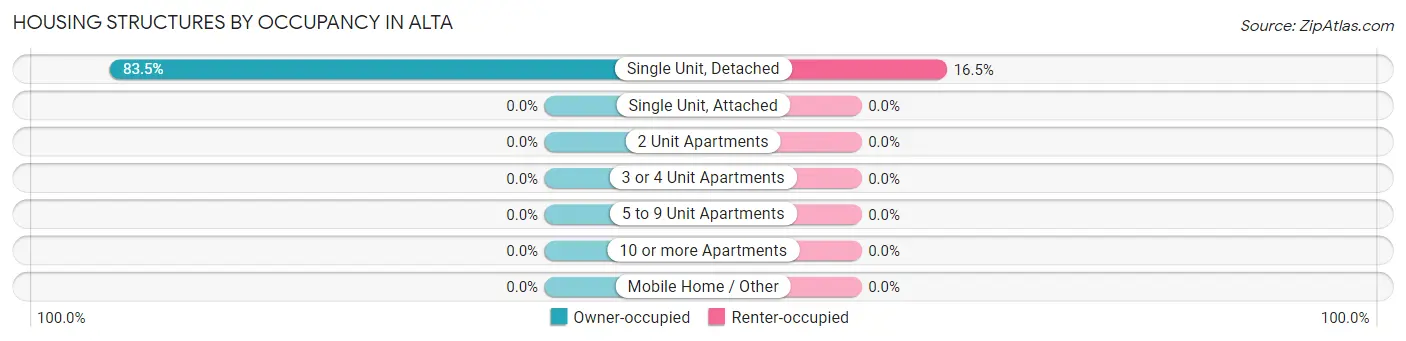
| Structure Type | Owner-occupied | Renter-occupied |
| Single Unit, Detached | 213 (83.5%) | 42 (16.5%) |
| Single Unit, Attached | 0 (0.0%) | 0 (0.0%) |
| 2 Unit Apartments | 0 (0.0%) | 0 (0.0%) |
| 3 or 4 Unit Apartments | 0 (0.0%) | 0 (0.0%) |
| 5 to 9 Unit Apartments | 0 (0.0%) | 0 (0.0%) |
| 10 or more Apartments | 0 (0.0%) | 0 (0.0%) |
| Mobile Home / Other | 0 (0.0%) | 0 (0.0%) |
| Total | 213 (83.5%) | 42 (16.5%) |
Housing Structures by Number of Rooms in Alta
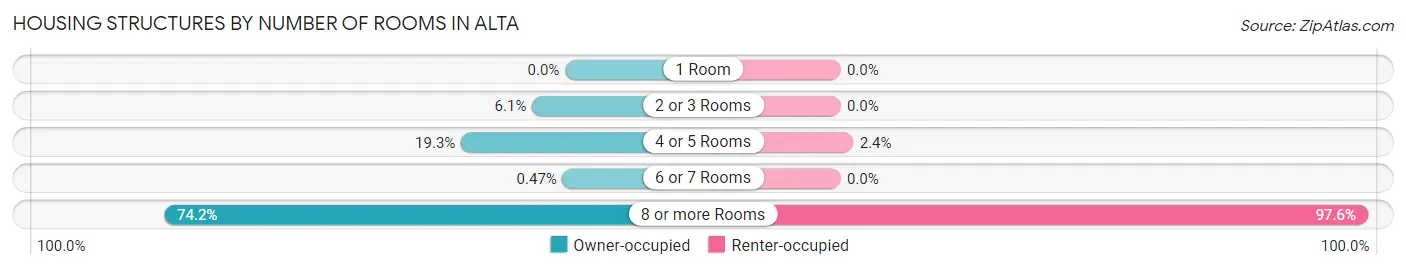
| Number of Rooms | Owner-occupied | Renter-occupied |
| 1 Room | 0 (0.0%) | 0 (0.0%) |
| 2 or 3 Rooms | 13 (6.1%) | 0 (0.0%) |
| 4 or 5 Rooms | 41 (19.3%) | 1 (2.4%) |
| 6 or 7 Rooms | 1 (0.5%) | 0 (0.0%) |
| 8 or more Rooms | 158 (74.2%) | 41 (97.6%) |
| Total | 213 (100.0%) | 42 (100.0%) |
Housing Structure by Heating Type in Alta
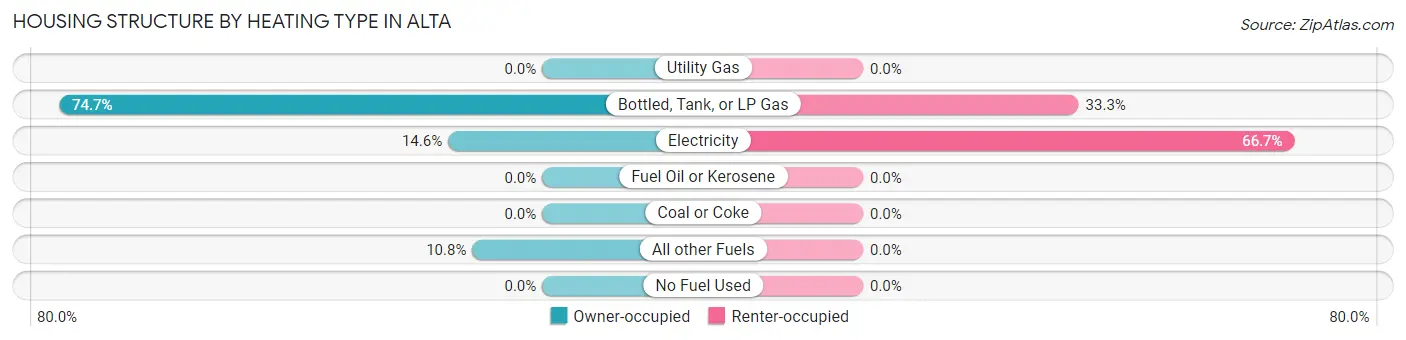
| Heating Type | Owner-occupied | Renter-occupied |
| Utility Gas | 0 (0.0%) | 0 (0.0%) |
| Bottled, Tank, or LP Gas | 159 (74.7%) | 14 (33.3%) |
| Electricity | 31 (14.5%) | 28 (66.7%) |
| Fuel Oil or Kerosene | 0 (0.0%) | 0 (0.0%) |
| Coal or Coke | 0 (0.0%) | 0 (0.0%) |
| All other Fuels | 23 (10.8%) | 0 (0.0%) |
| No Fuel Used | 0 (0.0%) | 0 (0.0%) |
| Total | 213 (100.0%) | 42 (100.0%) |
Household Vehicle Usage in Alta
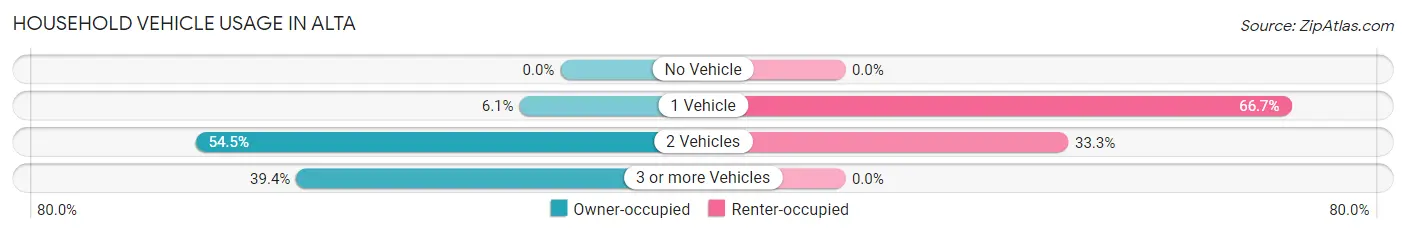
| Vehicles per Household | Owner-occupied | Renter-occupied |
| No Vehicle | 0 (0.0%) | 0 (0.0%) |
| 1 Vehicle | 13 (6.1%) | 28 (66.7%) |
| 2 Vehicles | 116 (54.5%) | 14 (33.3%) |
| 3 or more Vehicles | 84 (39.4%) | 0 (0.0%) |
| Total | 213 (100.0%) | 42 (100.0%) |
Real Estate & Mortgages in Alta
Real Estate and Mortgage Overview in Alta
| Characteristic | Without Mortgage | With Mortgage |
| Housing Units | 115 | 98 |
| Median Property Value | $2,000,001 | $1,069,900 |
| Median Household Income | $162,723 | $97 |
| Monthly Housing Costs | $804 | $68 |
| Real Estate Taxes | - | - |
Property Value by Mortgage Status in Alta
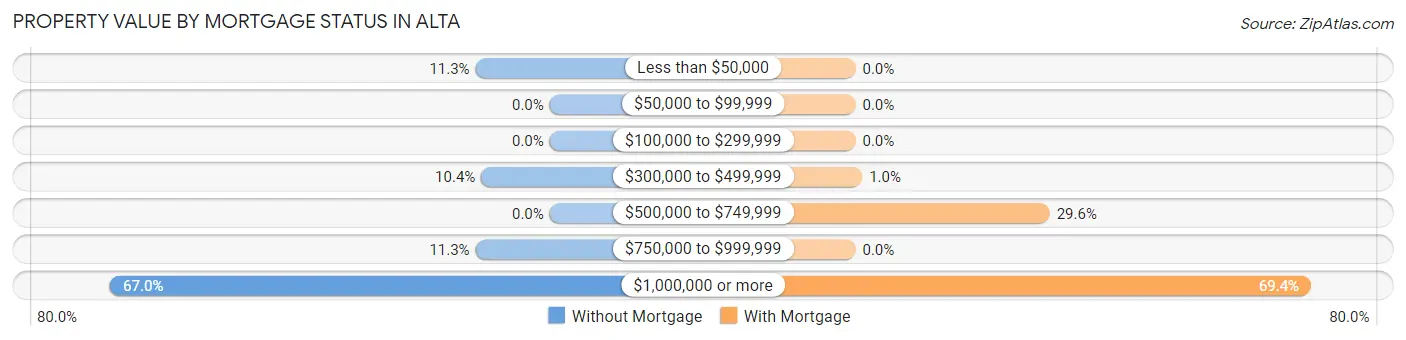
| Property Value | Without Mortgage | With Mortgage |
| Less than $50,000 | 13 (11.3%) | 0 (0.0%) |
| $50,000 to $99,999 | 0 (0.0%) | 0 (0.0%) |
| $100,000 to $299,999 | 0 (0.0%) | 0 (0.0%) |
| $300,000 to $499,999 | 12 (10.4%) | 1 (1.0%) |
| $500,000 to $749,999 | 0 (0.0%) | 29 (29.6%) |
| $750,000 to $999,999 | 13 (11.3%) | 0 (0.0%) |
| $1,000,000 or more | 77 (67.0%) | 68 (69.4%) |
| Total | 115 (100.0%) | 98 (100.0%) |
Household Income by Mortgage Status in Alta
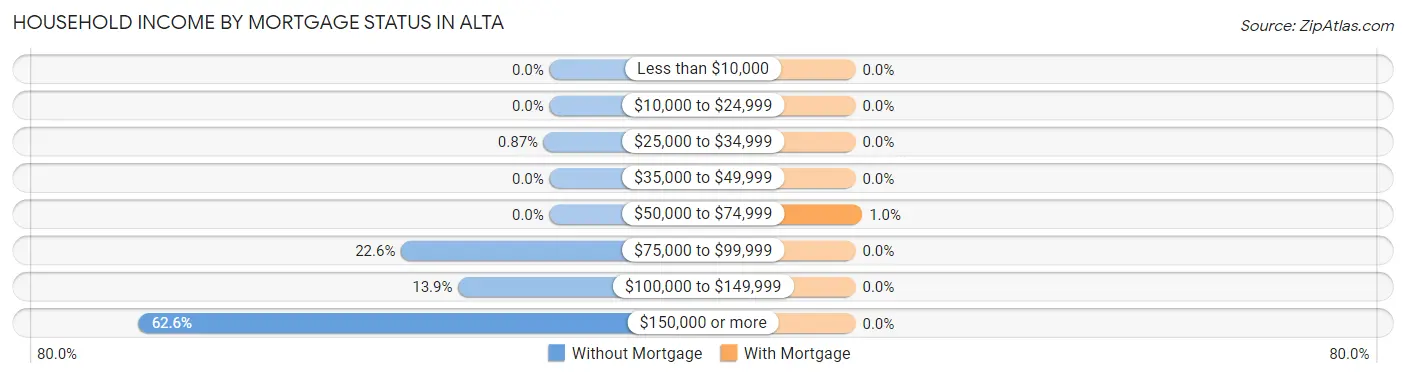
| Household Income | Without Mortgage | With Mortgage |
| Less than $10,000 | 0 (0.0%) | 0 (0.0%) |
| $10,000 to $24,999 | 0 (0.0%) | 0 (0.0%) |
| $25,000 to $34,999 | 1 (0.9%) | 0 (0.0%) |
| $35,000 to $49,999 | 0 (0.0%) | 0 (0.0%) |
| $50,000 to $74,999 | 0 (0.0%) | 1 (1.0%) |
| $75,000 to $99,999 | 26 (22.6%) | 0 (0.0%) |
| $100,000 to $149,999 | 16 (13.9%) | 0 (0.0%) |
| $150,000 or more | 72 (62.6%) | 0 (0.0%) |
| Total | 115 (100.0%) | 98 (100.0%) |
Property Value to Household Income Ratio in Alta
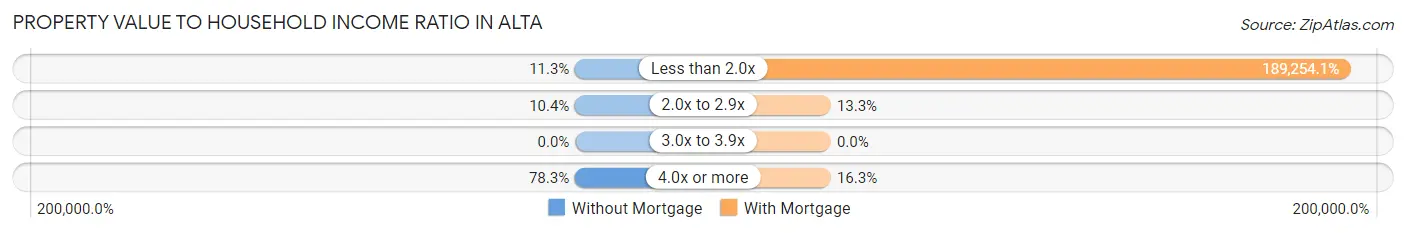
| Value-to-Income Ratio | Without Mortgage | With Mortgage |
| Less than 2.0x | 13 (11.3%) | 185,469 (189,254.1%) |
| 2.0x to 2.9x | 12 (10.4%) | 13 (13.3%) |
| 3.0x to 3.9x | 0 (0.0%) | 0 (0.0%) |
| 4.0x or more | 90 (78.3%) | 16 (16.3%) |
| Total | 115 (100.0%) | 98 (100.0%) |
Real Estate Taxes by Mortgage Status in Alta
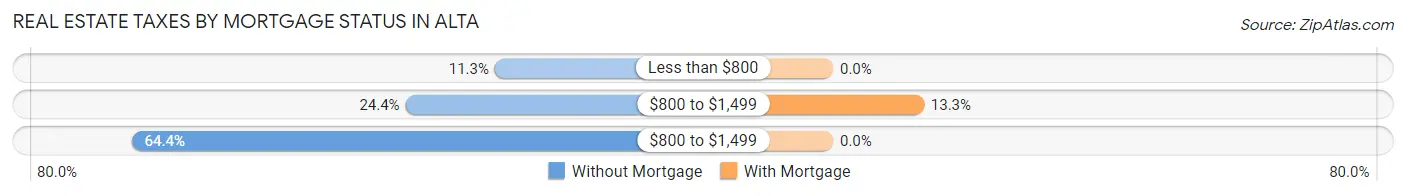
| Property Taxes | Without Mortgage | With Mortgage |
| Less than $800 | 13 (11.3%) | 0 (0.0%) |
| $800 to $1,499 | 28 (24.3%) | 13 (13.3%) |
| $800 to $1,499 | 74 (64.3%) | 0 (0.0%) |
| Total | 115 (100.0%) | 98 (100.0%) |
Health & Disability in Alta
Health Insurance Coverage by Age in Alta
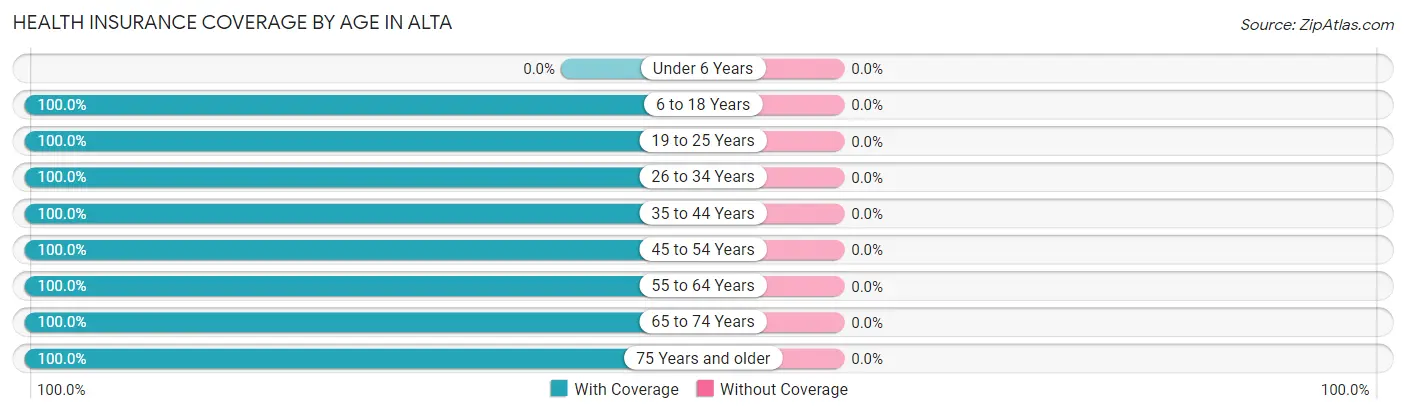
| Age Bracket | With Coverage | Without Coverage |
| Under 6 Years | 0 (0.0%) | 0 (0.0%) |
| 6 to 18 Years | 88 (100.0%) | 0 (0.0%) |
| 19 to 25 Years | 52 (100.0%) | 0 (0.0%) |
| 26 to 34 Years | 91 (100.0%) | 0 (0.0%) |
| 35 to 44 Years | 15 (100.0%) | 0 (0.0%) |
| 45 to 54 Years | 97 (100.0%) | 0 (0.0%) |
| 55 to 64 Years | 73 (100.0%) | 0 (0.0%) |
| 65 to 74 Years | 106 (100.0%) | 0 (0.0%) |
| 75 Years and older | 59 (100.0%) | 0 (0.0%) |
| Total | 581 (100.0%) | 0 (0.0%) |
Health Insurance Coverage by Citizenship Status in Alta

| Citizenship Status | With Coverage | Without Coverage |
| Native Born | 0 (0.0%) | 0 (0.0%) |
| Foreign Born, Citizen | 88 (100.0%) | 0 (0.0%) |
| Foreign Born, not a Citizen | 52 (100.0%) | 0 (0.0%) |
Health Insurance Coverage by Household Income in Alta
| Household Income | With Coverage | Without Coverage |
| Under $25,000 | 1 (100.0%) | 0 (0.0%) |
| $25,000 to $49,999 | 4 (100.0%) | 0 (0.0%) |
| $50,000 to $74,999 | 28 (100.0%) | 0 (0.0%) |
| $75,000 to $99,999 | 26 (100.0%) | 0 (0.0%) |
| $100,000 and over | 522 (100.0%) | 0 (0.0%) |
Public vs Private Health Insurance Coverage by Age in Alta
| Age Bracket | Public Insurance | Private Insurance |
| Under 6 | 0 (0.0%) | 0 (0.0%) |
| 6 to 18 Years | 0 (0.0%) | 88 (100.0%) |
| 19 to 25 Years | 0 (0.0%) | 52 (100.0%) |
| 25 to 34 Years | 32 (35.2%) | 91 (100.0%) |
| 35 to 44 Years | 0 (0.0%) | 15 (100.0%) |
| 45 to 54 Years | 0 (0.0%) | 97 (100.0%) |
| 55 to 64 Years | 0 (0.0%) | 73 (100.0%) |
| 65 to 74 Years | 106 (100.0%) | 45 (42.4%) |
| 75 Years and over | 59 (100.0%) | 30 (50.8%) |
| Total | 197 (33.9%) | 491 (84.5%) |
Disability Status by Sex by Age in Alta
| Age Bracket | Male | Female |
| Under 5 Years | 0 (0.0%) | 0 (0.0%) |
| 5 to 17 Years | 0 (0.0%) | 0 (0.0%) |
| 18 to 34 Years | 0 (0.0%) | 0 (0.0%) |
| 35 to 64 Years | 23 (26.1%) | 0 (0.0%) |
| 65 to 74 Years | 0 (0.0%) | 0 (0.0%) |
| 75 Years and over | 29 (67.4%) | 0 (0.0%) |
Disability Class by Sex by Age in Alta
Disability Class: Hearing Difficulty
| Age Bracket | Male | Female |
| Under 5 Years | 0 (0.0%) | 0 (0.0%) |
| 5 to 17 Years | 0 (0.0%) | 0 (0.0%) |
| 18 to 34 Years | 0 (0.0%) | 0 (0.0%) |
| 35 to 64 Years | 23 (26.1%) | 0 (0.0%) |
| 65 to 74 Years | 0 (0.0%) | 0 (0.0%) |
| 75 Years and over | 1 (2.3%) | 0 (0.0%) |
Disability Class: Vision Difficulty
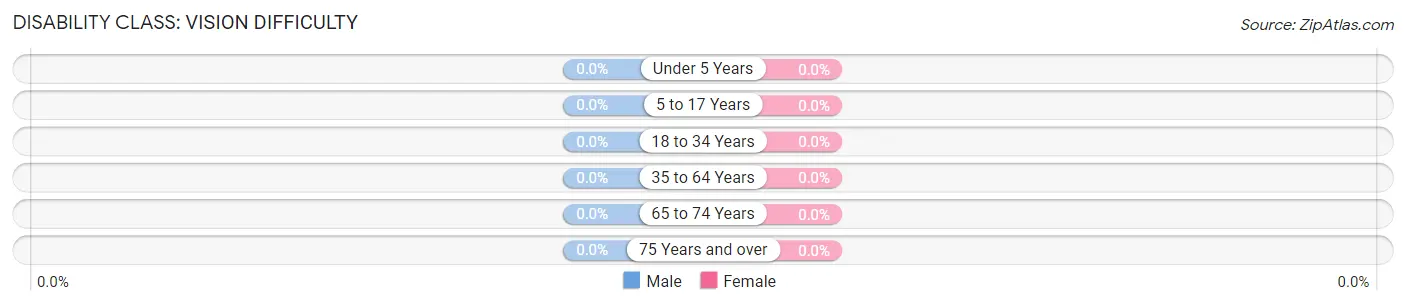
| Age Bracket | Male | Female |
| Under 5 Years | 0 (0.0%) | 0 (0.0%) |
| 5 to 17 Years | 0 (0.0%) | 0 (0.0%) |
| 18 to 34 Years | 0 (0.0%) | 0 (0.0%) |
| 35 to 64 Years | 0 (0.0%) | 0 (0.0%) |
| 65 to 74 Years | 0 (0.0%) | 0 (0.0%) |
| 75 Years and over | 0 (0.0%) | 0 (0.0%) |
Disability Class: Cognitive Difficulty
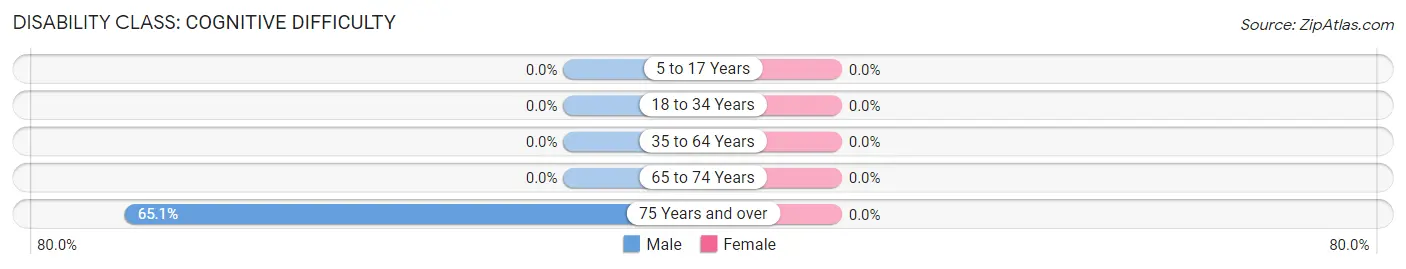
| Age Bracket | Male | Female |
| 5 to 17 Years | 0 (0.0%) | 0 (0.0%) |
| 18 to 34 Years | 0 (0.0%) | 0 (0.0%) |
| 35 to 64 Years | 0 (0.0%) | 0 (0.0%) |
| 65 to 74 Years | 0 (0.0%) | 0 (0.0%) |
| 75 Years and over | 28 (65.1%) | 0 (0.0%) |
Disability Class: Ambulatory Difficulty
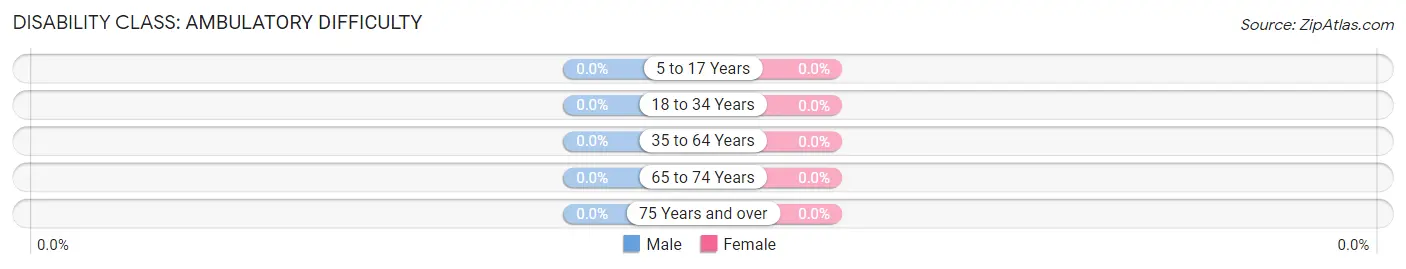
| Age Bracket | Male | Female |
| 5 to 17 Years | 0 (0.0%) | 0 (0.0%) |
| 18 to 34 Years | 0 (0.0%) | 0 (0.0%) |
| 35 to 64 Years | 0 (0.0%) | 0 (0.0%) |
| 65 to 74 Years | 0 (0.0%) | 0 (0.0%) |
| 75 Years and over | 0 (0.0%) | 0 (0.0%) |
Disability Class: Self-Care Difficulty
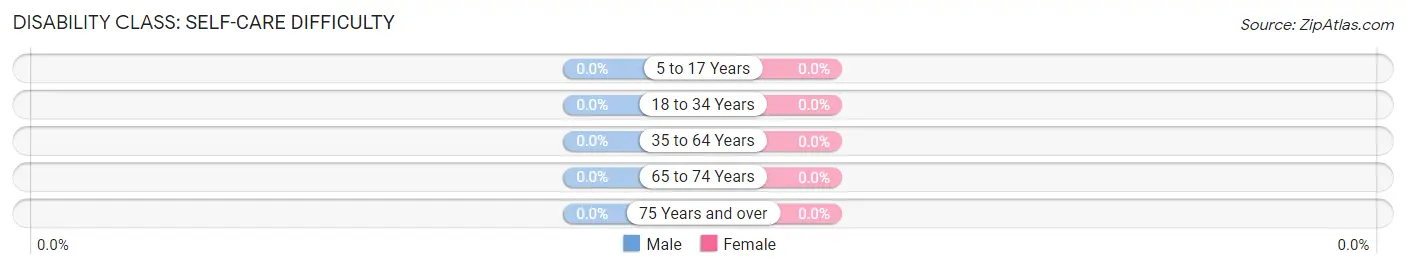
| Age Bracket | Male | Female |
| 5 to 17 Years | 0 (0.0%) | 0 (0.0%) |
| 18 to 34 Years | 0 (0.0%) | 0 (0.0%) |
| 35 to 64 Years | 0 (0.0%) | 0 (0.0%) |
| 65 to 74 Years | 0 (0.0%) | 0 (0.0%) |
| 75 Years and over | 0 (0.0%) | 0 (0.0%) |
Technology Access in Alta
Computing Device Access in Alta
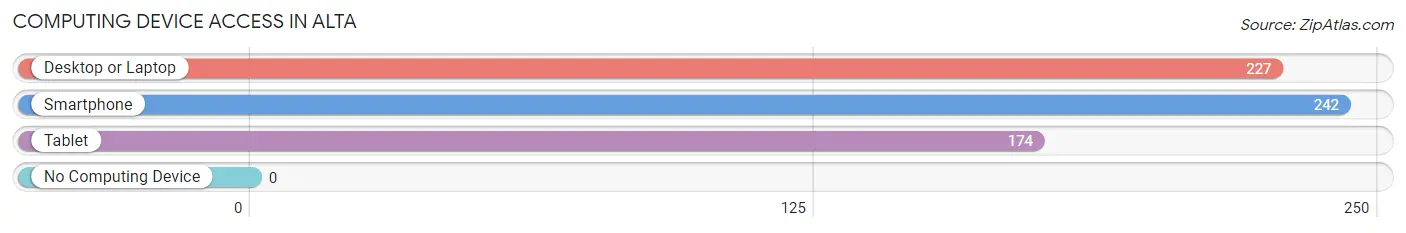
| Device Type | # Households | % Households |
| Desktop or Laptop | 227 | 89.0% |
| Smartphone | 242 | 94.9% |
| Tablet | 174 | 68.2% |
| No Computing Device | 0 | 0.0% |
| Total | 255 | 100.0% |
Internet Access in Alta
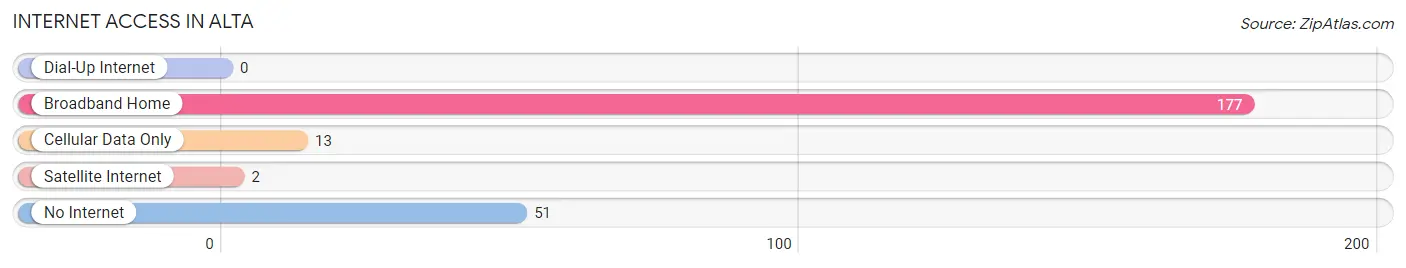
| Internet Type | # Households | % Households |
| Dial-Up Internet | 0 | 0.0% |
| Broadband Home | 177 | 69.4% |
| Cellular Data Only | 13 | 5.1% |
| Satellite Internet | 2 | 0.8% |
| No Internet | 51 | 20.0% |
| Total | 255 | 100.0% |
Alta Summary
Alta, Wyoming is a small town located in the western part of the state, in the foothills of the Rocky Mountains. It is situated in the Jackson Hole Valley, and is surrounded by the Bridger-Teton National Forest. The town has a population of approximately 200 people, and is a popular tourist destination due to its proximity to Grand Teton National Park and Yellowstone National Park.
History
Alta was first settled in the late 1800s by homesteaders who were drawn to the area by its abundant natural resources. The town was originally known as “Upper Teton”, and was later renamed “Alta” in honor of the nearby mountain range. The town was incorporated in 1909, and the first post office was established in 1910.
In the early 1900s, Alta was a thriving community, with a variety of businesses, including a hotel, a general store, a blacksmith shop, and a sawmill. The town was also home to a number of ranches, and was a popular destination for hunters and fishermen.
In the 1950s, the town began to decline as the local economy shifted away from ranching and logging. The population dwindled, and many of the businesses closed. In the 1970s, the town was revitalized by the influx of tourists who were drawn to the area by its proximity to Grand Teton National Park and Yellowstone National Park.
Geography
Alta is located in the western part of Wyoming, in the Jackson Hole Valley. The town is situated at an elevation of 6,400 feet, and is surrounded by the Bridger-Teton National Forest. The town is located approximately 25 miles south of Jackson, Wyoming, and is approximately 50 miles north of Yellowstone National Park.
The climate in Alta is semi-arid, with cold winters and mild summers. The average annual temperature is approximately 40 degrees Fahrenheit, and the average annual precipitation is approximately 15 inches.
Economy
The economy of Alta is largely based on tourism. The town is a popular destination for outdoor enthusiasts, and is home to a variety of lodging, dining, and shopping options. The town is also home to a number of ranches, and is a popular destination for hunters and fishermen.
Demographics
As of the 2010 census, the population of Alta was approximately 200 people. The racial makeup of the town was 97.5% White, 0.5% Native American, 0.5% Asian, and 1.5% from other races. The median household income was $45,000, and the median home value was $250,000.
Conclusion
Alta, Wyoming is a small town located in the western part of the state, in the foothills of the Rocky Mountains. It is situated in the Jackson Hole Valley, and is surrounded by the Bridger-Teton National Forest. The town has a population of approximately 200 people, and is a popular tourist destination due to its proximity to Grand Teton National Park and Yellowstone National Park. The economy of Alta is largely based on tourism, and the town is home to a variety of lodging, dining, and shopping options. The racial makeup of the town is predominantly White, with a small percentage of Native American and Asian residents. The median household income is approximately $45,000, and the median home value is approximately $250,000.
Common Questions
What is Per Capita Income in Alta?
Per Capita income in Alta is $68,826.
What is the Median Family Income in Alta?
Median Family Income in Alta is $183,477.
What is the Median Household income in Alta?
Median Household Income in Alta is $161,979.
What is Inequality or Gini Index in Alta?
Inequality or Gini Index in Alta is 0.22.
What is the Total Population of Alta?
Total Population of Alta is 581.
What is the Total Male Population of Alta?
Total Male Population of Alta is 328.
What is the Total Female Population of Alta?
Total Female Population of Alta is 253.
What is the Ratio of Males per 100 Females in Alta?
There are 129.64 Males per 100 Females in Alta.
What is the Ratio of Females per 100 Males in Alta?
There are 77.13 Females per 100 Males in Alta.
What is the Median Population Age in Alta?
Median Population Age in Alta is 47.3 Years.
What is the Average Family Size in Alta
Average Family Size in Alta is 2.6 People.
What is the Average Household Size in Alta
Average Household Size in Alta is 2.3 People.
How Large is the Labor Force in Alta?
There are 353 People in the Labor Forcein in Alta.
What is the Percentage of People in the Labor Force in Alta?
66.0% of People are in the Labor Force in Alta.